Gorakhpur Year - 2019-20 - Uttar Pradesh National Health ...
Upload
khangminh22Category
view
1download
0
GORAKHPUR CITY CLEAN
AIR ACTION PLAN
DECEMBER, 2020
UTTAR PRADESH POLLUTION CONTROL BOARD
TC-12V, VIBHUTI KHAND, GOMTI NAGAR, LUCKNOW,
UTTAR PRADESH 226010

CONTENTS
I. Introduction ..................................................................................................................................... 1
II. Goal ........................................................................................................................................................ 1
III. Target ................................................................................................................................................... 1
IV. time frame ......................................................................................................................................... 2
V. Objectives........................................................................................................................................... 2
VI. Overview of Gorakhpur city ................................................................................................... 2
VII. Status of Air quality & its trend in Gorakhpur............................................................ 3
VIII. Gaps in database augmentation........................................................................................... 7
A. Air Quality Monitoring Network .......................................................................................................... 7
B. Source Apportionment & Carrying Capacity Studies ...............................................................12
C. Gaps in data related to Monitoring of Air Pollution Sources................................................12
IX. Institutional strengthening ................................................................................................. 14
A. Public Awareness and Education ......................................................................................................14
B. Training and Capacity Building ..........................................................................................................15
C. Setting Up City level Knowledge/Monitoring Centre ..............................................................16
D. Monitoring Mechanism...........................................................................................................................16
a) At State Level: ..................................................................................................................................16
b) District and Commissioner Level- ......................................................................................17
c) The monitoring protocol shall be as below- ................................................................17
d) Schedule of Monitoring: ............................................................................................................17
X. Status Gaps and Strategies Of Air Pollution Mitigation Measures For
Various Sources ............................................................................................................................................. 18
A. Gorakhpur City Emission Inventory...........................................................................................18
a) Emission Estimation and Factors........................................................................................18
B. Cumulative Emission Inventory......................................................................................................19
C. Industrial Pollution...............................................................................................................................26
a) Industrial profile of Gorakhpur ...........................................................................................26

b) Industrial sectors in Gorakhpur ..........................................................................................29
c) Fuel usage in the sectors ..........................................................................................................31
d) Emission Estimation from industries in Gorakhpur...............................................32
e) Issues of Industrial pollution ................................................................................................37
f) Specific Issues of Industrial Pollution in Gorakhpur ..................................................40
g) Issue of air polluting industries in non-conforming areas .................................41
h) Strategies for Control of Air pollution due to industries .....................................41
D. Brick kilns ..............................................................................................................................................42
a) Emission Estimation for Brick Kilns .................................................................................45
b) Major issues of brick kilns in Gorakhpur.......................................................................46
c) Strategy to control air pollution from Brick kiln ......................................................46
E. Diesel Generator Sets (DG Sets) ....................................................................................................47
a) Emission Estimation for DG sets..........................................................................................48
b) Measures to control emission from DG sets.................................................................51
F. Hot-Mix Plant Emission Estimation ............................................................................................52
a) Emission Estimation for Hot mix plant ...........................................................................55
b) Measures to be taken for control and abatement of air pollution .................55
G. Emission Estimation from Domestic Sector ..........................................................................56
a) Observation ......................................................................................................................................57
H. Hotels and Banquet halls emission estimation (Kitchen emissions) ...............60
a) Observation ......................................................................................................................................61
I. Vehicular Pollution and traffic congestions ..........................................................................61
a) Major Traffic and Transportation problems in Gorakhpur ...............................62
b) Traffic Congestion points in Gorakhpur city ...............................................................67
c) Emission estimation for vehicular pollution ...............................................................69
d) Measures to improve traffic plan and control emission ......................................72
J. CONSTRUCTION AND ROAD DUST ...............................................................................................73
a) Road Dust ...........................................................................................................................................74
b) Emission Inventory of road Dust ............................................................................................79

c) Measures to control Road dust .............................................................................................86
d) Construction and Demolition Dust .........................................................................................87
e) Dust emission from Railway siding ........................................................................................89
K. Management of Solid Waste and garbage burning............................................................95
a) Municipal Solid Waste (MSW) Burning emission estimation ...................................95
b) Status and Gaps in MSW management................................................................................96
c) Proposed plan for Solid Waste Management ....................................................................98
d) Details of legacy waste dumping site ......................................................................................98
L. Greening & Afforestation................................................................................................................ 101
a) Green Infrastructures ................................................................................................................ 102
b) Types of GIs .................................................................................................................................... 103
c) Challenges ........................................................................................................................................ 103
d) Future Strategy.............................................................................................................................. 103
M. Agriculture residue burning .................................................................................................... 105
N. Identification and Pollution Mitigation in the Hotspots ............................................. 107
XI. Proposed Actions .....................................................................................................................111
XII. Cost Estimates ............................................................................................................................111
XIII. Mid Term Evaluation of the Action Plan ....................................................................112
XIV. ANNEXURE -I................................................................................................................................113
a) Proposed Locations & Budget for development of Parking space for Non
destined Vehicles -Annexure I(A) ................................................................................................. 176
(b) Proposed locations & Budget for development of Multi-layer Car parking in
Gorakhpur City -Annexure I(B) ...................................................................................................... 177
(c) Proposed budget for Installation of Fountain at various locations in
Gorakhpur City-Annexure I(C) ....................................................................................................... 178
XV. Annexure- II .................................................................................................................................179

List of Figures
Figure 1: Yearly trend of PM10 concentration (µg/m3) in Gorakhpur city .................................... 4
Figure 2 : Yearly trend of SO2 concentration (µg/m3) in Gorakhpur city ...................................... 4
Figure 3: Yearly trend of NOx concentration (µg/m3) in Gorakhpur city ...................................... 5
Figure 4: Regional Office, Gorakhpur, UPPCB ............................................................................................. 9
Figure 5: Manual Air Quality Monitoring Station at Jalkal Building (left), (b) GIDA (right),
in Gorakhpur city ....................................................................................................................................................10
Figure 6: Location Map of AAQMS ..................................................................................................................11
Figure 7: 3-tier monitoring system ................................................................................................................18
Figure 8: Emission Sources in Gorakhpur...................................................................................................19
Figure 9: Cumulative emission load for Gorakhpur ...............................................................................21
Figure 10: PM10 Emission Load of Different Sources in Gorakhpur ...............................................22
Figure 11: PM2.5 Emission Load of Different Sources in Gorakhpur...............................................23
Figure 12: SO2 Emission Load of Different Sources in Gorakhpur ..................................................24
Figure 13: NOx Emission Load of Different Sources in Gorakhpur ................................................25
Figure 14: Industrial Cluster of Gorakhpur city .......................................................................................27
Figure 15: GIS Industrial profile of Gorakhpur.........................................................................................28
Figure 16: Sectoral classification of industries in Gorakhpur ...........................................................29
Figure 17: Boiler at M/s Gallants Ispat Pvt. Ltd., AL-5, Sector-23, GIDA, Gorakhpur ............30
Figure 18: Electrostatic precipitator (ESP-APCS) control panel in M/s India Glycols Ltd., E-
1, Sector-13, GIDA, Gorakhpur .........................................................................................................................30
Figure 19: Fuel Type Industry ..........................................................................................................................32
Figure 20: Emission Load for Industries .....................................................................................................34
Figure 21: PM10 Emission from Industries ...............................................................................................35
Figure 22: PM2.5 Emission from Industries ..............................................................................................35
Figure 23: SO2 Emission from Industries ...................................................................................................36
Figure 24: NOx Emission from Industries...................................................................................................36
Figure 25: Boiler ash dumped by M/s Raina papers and M/s Gallant Ispat Ltd in
Gorakhpur ..................................................................................................................................................................41
Figure 26: GIS Map showing Brick kilns in the Gorakhpur city ........................................................43
Figure 27: GIS Map showing brick kilns in Gorakhpur district ........................................................44
Figure 28: Emission Load from Brick Kilns in Gorakhpur ..................................................................45
Figure 29: Emission Load Estimation for DG sets ...................................................................................48
Figure 30: PM10 Emission from DG sets .....................................................................................................49
Figure 31: PM2.5 Emission from DG sets ....................................................................................................49
Figure 32: SO2 Emission from DG sets ..........................................................................................................50
Figure 33: NOx Emission from DG sets.........................................................................................................50
Figure 34: DG sets at (a) Orion mall (left), (b) Riaz hospital (right) in Gorakhpur city ........51
Figure 35: Hot-Mix Plant of Gorakhpur District.......................................................................................54
Figure 36: Emission Load estimation for Hot-Mix Plant......................................................................55
Figure 37: Emission Estimation for Domestic source ...........................................................................57
Figure 38: PM10 Emission Load from Domestic Cooking in GDA (kg/day) ...............................58

Figure 39: PM2.5 Emission Load from Domestic Cooking in GDA (kg/day) ..............................58
Figure 40: SO2 Emission Load from Domestic Cooking in GDA (kg/day) ...................................59
Figure 41: NOx Emission Load from Cooking in GDA (kg/day) .......................................................59
Figure 42: Emission Load from Hotels .........................................................................................................60
Figure 43: Emission Load from Banquet Halls .........................................................................................61
Figure 44: Traffic congestion due to encroachment in Gorakhpur city........................................62
Figure 45: Traffic congestion at Gorakhpur city ......................................................................................63
Figure 46: Google Traffic map of Gorakhpur .............................................................................................66
Figure 47: Map showing major congestion points in the Gorakhpur city ...................................68
Figure 48: Emission estimated loads from Vehicular Exhausts (kg/day) ...................................69
Figure 49: PM10 Emission Load contribution of each vehicle type in Gorakhpur city.........70
Figure 50: PM2.5 Emission Load contribution of each vehicle type in Gorakhpur city........70
Figure 51: SO2 Emission Load contribution of each vehicle type in Gorakhpur city ............71
Figure 52: NOx Emission Load contribution of each vehicle type in Gorakhpur city ............71
-Figure 53: Location map of roads in Gorakhpur city ...........................................................................81
Figure 54: Emission load for road dust in Gorakhpur city(kg/day) ..............................................86
Figure 55: Emission Load from Construction and Demolition activities .....................................87
Figure 56: Dust emission at Railway siding, Gorakhpur......................................................................90
Figure 57: Construction Sites in Gorakhpur city .....................................................................................92
Figure 58: Construction site in Gorakhpur city ........................................................................................95
Figure 59: Emission Estimation for MSW Burning .................................................................................96
Figure 60: Municipal Solid waste dump site..............................................................................................98
Figure 61: GIS map showing the Location of MSW treatment & dumpsites ........................... 100
Figure 62: Solid Waste Dump Site(unauthorized) at Akla Bandh, Gorakhpur ....................... 101
Figure 63: Location map of hotspots in Gorakhpur city ................................................................... 110
Figure 64: Location of Kushmi Forest........................................................................................................ 183
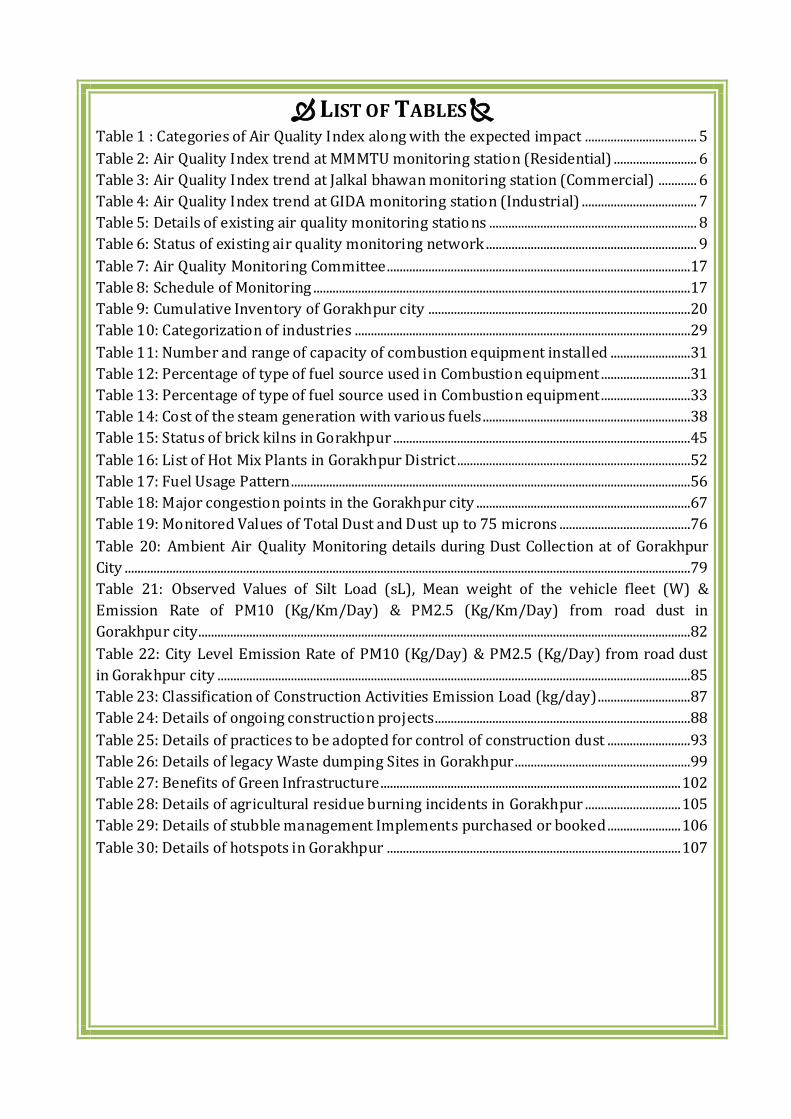
LIST OF TABLES Table 1 : Categories of Air Quality Index along with the expected impact ................................... 5
Table 2: Air Quality Index trend at MMMTU monitoring station (Residential) .......................... 6
Table 3: Air Quality Index trend at Jalkal bhawan monitoring station (Commercial) ............ 6
Table 4: Air Quality Index trend at GIDA monitoring station (Industrial) .................................... 7
Table 5: Details of existing air quality monitoring statio ns ................................................................. 8
Table 6: Status of existing air quality monitoring network .................................................................. 9
Table 7: Air Quality Monitoring Committee...............................................................................................17
Table 8: Schedule of Monitoring ......................................................................................................................17
Table 9: Cumulative Inventory of Gorakhpur city ..................................................................................20
Table 10: Categorization of industries .........................................................................................................29
Table 11: Number and range of capacity of combustion equipment installed .........................31
Table 12: Percentage of type of fuel source used in Combustion equipment ............................31
Table 13: Percentage of type of fuel source used in Combustion equipment............................33
Table 14: Cost of the steam generation with various fuels.................................................................38
Table 15: Status of brick kilns in Gorakhpur .............................................................................................45
Table 16: List of Hot Mix Plants in Gorakhpur District .........................................................................52
Table 17: Fuel Usage Pattern.............................................................................................................................56
Table 18: Major congestion points in the Gorakhpur city ...................................................................67
Table 19: Monitored Values of Total Dust and Dust up to 75 microns .........................................76
Table 20: Ambient Air Quality Monitoring details during Dust Collection at of Gorakhpur
City .................................................................................................................................................................................79
Table 21: Observed Values of Silt Load (sL), Mean weight of the vehicle fleet (W) &
Emission Rate of PM10 (Kg/Km/Day) & PM2.5 (Kg/Km/Day) from road dust in
Gorakhpur city..........................................................................................................................................................82
Table 22: City Level Emission Rate of PM10 (Kg/Day) & PM2.5 (Kg/Day) from road dust
in Gorakhpur city ....................................................................................................................................................85
Table 23: Classification of Construction Activities Emission Load (kg/day).............................87
Table 24: Details of ongoing construction projects................................................................................88
Table 25: Details of practices to be adopted for control of construction dust ..........................93
Table 26: Details of legacy Waste dumping Sites in Gorakhpur.......................................................99
Table 27: Benefits of Green Infrastructure.............................................................................................. 102
Table 28: Details of agricultural residue burning incidents in Gorakhpur .............................. 105
Table 29: Details of stubble management Implements purchased or booked....................... 106
Table 30: Details of hotspots in Gorakhpur ............................................................................................ 107

1 | P a g e
I. INTRODUCTION
A vast country and an emerging economy like India, faces enormous challenges with its
burgeoning population and widespread poverty, in meeting its various other significant
commitments associated with poverty, and eradication of hunger under the SDGs. India
has been going through a phase of accelerated industrial activities for the past three
decades. The associated growth in terms of industrialization and urbanization has led to a
manifold increase in pollution issues, more specifically air pollution issues. In recent
years, medium and small towns and cities have also witnessed an increase in pollution,
thus getting fast reflected in the non-attainment cities of India. Air pollution has
increasingly become a serious concern, predominantly because of its health impacts. The
reported perplexing statistics in various international reports, correlating air pollution
with health impacts without the use of indigenous dose-response functions, further
complicates the issue by possibly creating an ambiguous public perception.
With the recent focus on pollution in tier II cities, the MoEF&CC and CPCB has identified
the non-attainment cities mostly in Indo-Gangetic Plains based on ambient air quality
data for the period 2011 – 2015 and WHO report 2014/2018. However, many of tier II
cities in India, including state capital, have similar problems of outdoor air pollution.
Gorakhpur has been identified as a NAC in the month Nov, 2020 with the objective to
evolve an action plan having action points with specific timelines based upon scientific
inputs time-bound actions and its effective implementation in order to bring down the
pollution levels.
II. GOAL
The goal of the Action Plan is to meet the prescribed annual average ambient air quality
standards at all locations in Gorakhpur City within a stipulated timeframe (long-term).
III. TARGET
The global experiences clearly highlight the fact that internationally, the actions had been
city specific rather than country oriented and, accordingly, the statistics indicates 35%–
40% PM2.5 reduction in five years for cities, such as Beijing and Seoul, whereas cities, such
as Santiago and Mexico City have shown 73% and 61% reduction in 22 to 25 years with
regard to PM2.5 and PM10 concentrations, respectively. Recently, a new Lancet study by
Peking University School of Public Health on the impact of China’s ‘Air
Pollution Prevention and Control Action Plan (2013–2017) has found that an annual
average concentration of PM2.5 decreased by 33.3% and PM10 levels reduced by 27.8% in
the 74 key cities in China where the plan was implemented in the last five years.
Sulphur dioxide reduced by 54.1% and CO by 28.2% in five years, but no
significant improvements were seen in NO2 or O3 concentrations. TERI and ARAI report
dated August, 2018, analyzed various interventions and estimated their possible impacts

2 | P a g e
over PM2.5 and PM10 concentrations in Delhi and NCR. An alternative scenario has been
developed considering the interventions which can provide maximum air quality benefits.
Taking into account the available international experiences and national studies, the
tentative national level target of 20%–30% reduction of PM2.5 and PM10 concentration by
2024 is proposed under the NCAP. This is keeping 2017 as the base year for the
comparison of concentration. Recent rise in development activities of the city resulted in
the rise of particulate matter (PM) and consequently listed Gorakhpur city in non-
attainment cities list. The targets for Gorakhpur City are kept similar to the targets
envisaged under NCAP as described above with a modified timeline by 2025 as
interventions will be starting in 2020. The yearly targets will be decided so that the
emphasis in first two years will be largely upon taking up the actions for the institutional
strengthening and development of infrastructure in consultation with CPCB & MoEF&CC.
IV. TIME FRAME
Considering 2020-21 as base year, this action plan is prepared for a term of next five
years (mid-term action plan) to begin which is further extendable up to 20-25 years in
long-term after mid-term review of the outcomes.
V. OBJECTIVES
1. To ensure stringent implementation of mitigation measures for prevention,
control and abatement of air pollution
2. To carry out scientific studies for apportionment of sources of air pollution,
identification of gaps, identification of the hot spots and prioritization of actions
for increasing the effectiveness of mitigations
3. To augment and evolve effective and proficient ambient air quality monitoring
network across the city for ensuring a comprehensive and reliable database.
4. To augment public awareness and capacity-building measures encompassing data
dissemination and public outreach programmes for inclusive public participation
and for ensuring trained manpower and infrastructure on air pollution.
5. To evaluate the impact of mitigation measures periodically in order to ensure the
effectiveness and realignment of the mitigation strategies
VI. OVERVIEW OF GORAKHPUR CITY
Gorakhpur lies in a terai (low land region) of Himalaya and Indo-Gangetic plains.
Covering an area of 3483.8 sq. km Gorakhpur district stretches between Latitude 26°13′N
and 27°29′N and Longitude 83°05′E and 83°56′E. River Rapti flows through Gorakhpur
supplying it with rich alluvium plain. At present, it is one of the fast-accelerating cities in
sense of population and economic growth in the Middle Ganga plain. The average altitude

3 | P a g e
of the city from the mean sea level is about 102 m (302 feet). Being located in the Middle
Ganga Plain, the average annual rainfall of Gorakhpur city is 1118.37 mm
Gorakhpur city is also the headquarters of Gorakhpur Division. Gorakhpur division
comprises four districts, Gorakhpur, Deoria, Mahrajganj, and Kushinagar. Gorakhpur was
a part of the famous kingdom of Koshal, one of sixteen Mahajanpadas in 6th Century B.C.
Gorakhpur also became an important center of activity during the first war of
independence.
Being headquarter of north-eastern railway, Gorakhpur is well connected to the rail
network of the country. The city is also well connected by road and air transport network
from other areas of the country.
The terracotta work of Gorakhpur is a centuries-old traditional art form that got a
geographical indication (GI) tag in April 2020. The natural red color of terracotta does not
fade for years which gives it a peculiarity.
Gorakhpur is also the Head Quarter of the Indian Air Force and is known for Cobra
Squadron.
VII. STATUS OF AIR QUALITY & ITS TREND IN GORAKHPUR
The non-attainment status of a city is implicative of a consistently high level of air
pollutants above the national ambient air quality standards. Exponential growth in
construction and demolition activities, increase in the number of vehicles, roadside
encroachments, and expansion of industries in Gorakhpur city resulted in poor regional
air quality problems characterized by inhalable particulate matter (PM10) and fine
particles (PM2.5). Long-term exposure to particulate matter gives rise to chronic lung and
heart disease in humans. High pollutant level in the air also deteriorates the ecological
and aesthetic balance of the city. This action plan is developed to control the pollutant
level and improve air quality in Gorakhpur.

4 | P a g e
Figure 1: Yearly trend of PM10 concentration (µg/m3) in Gorakhpur city
Figure 2 : Yearly trend of SO2 concentration (µg/m3) in Gorakhpur city
5 | P a g e
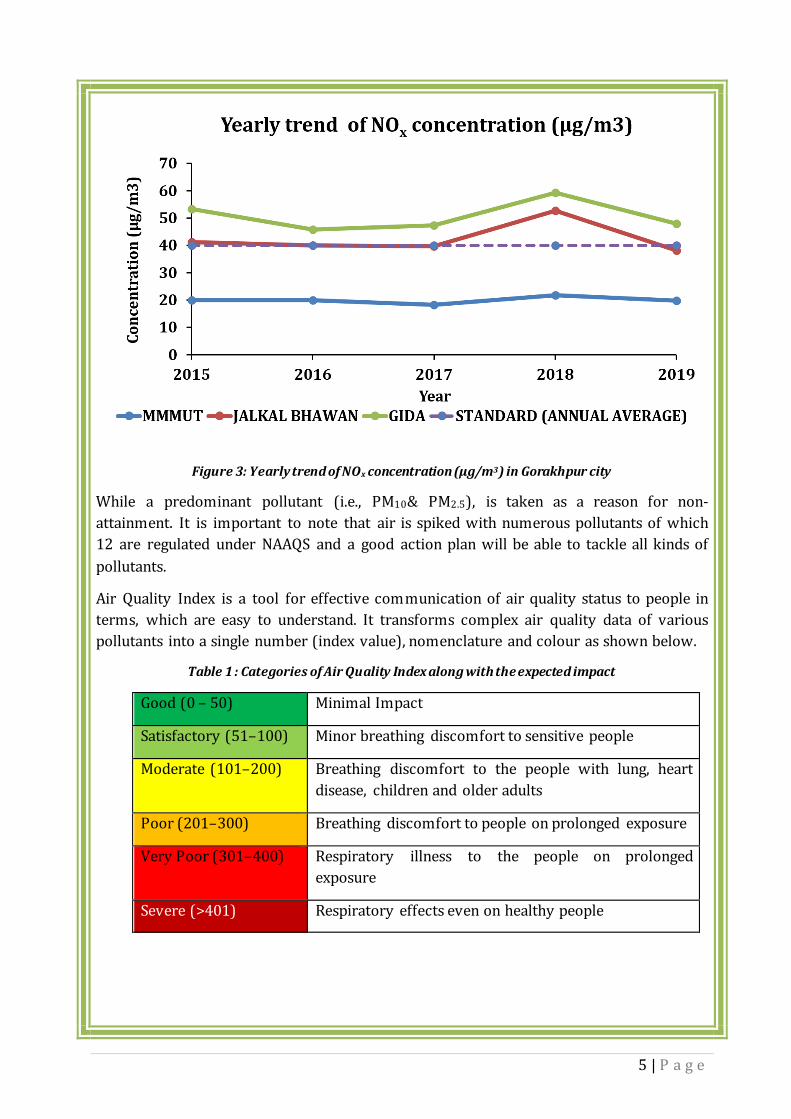
Figure 3: Yearly trend of NOx concentration (µg/m3) in Gorakhpur city
While a predominant pollutant (i.e., PM10& PM2.5), is taken as a reason for non-
attainment. It is important to note that air is spiked with numerous pollutants of which
12 are regulated under NAAQS and a good action plan will be able to tackle all kinds of
pollutants.
Air Quality Index is a tool for effective communication of air quality status to people in
terms, which are easy to understand. It transforms complex air quality data of various
pollutants into a single number (index value), nomenclature and colour as shown below.
Table 1 : Categories of Air Quality Index along with the expected impact
Good (0 – 50) Minimal Impact
Satisfactory (51–100) Minor breathing discomfort to sensitive people
Moderate (101–200) Breathing discomfort to the people with lung, heart
disease, children and older adults
Poor (201–300) Breathing discomfort to people on prolonged exposure
Very Poor (301–400) Respiratory illness to the people on prolonged
exposure
Severe (>401) Respiratory effects even on healthy people

6 | P a g e
Air Quality Index for the last 5 years has been calculated for the three manual monitoring
stations based on three parameters PM10, SO2, and NO2. While it is imperative to note that
the AQI of Gorakhpur city has changed from a moderate category to poor since the
winters of 2018. The main causes of this decline in the air quality of Gorakhpur are recent
escalation in construction and industrial pursuit accompanied by poor or no control
measures. Also increase in the number of vehicles, traffic congestion due to inadequate
road width and increase in roadside encroachments hampering the free flow of traffic,
increase in the influx of non-destined traffic has increased the PM10, SO2 & NO2 levels. The
spike in the SO2 & NO2 levels in 2018 may be attributed to local factors also. COVID-19
pandemic and the subsequent lockdown have some positive impact on the environment
across the world. Similarly, the AQI of Gorakhpur also improved. There is 77%, 80%, and
78% decline in AQI of residential, commercial, and industrial areas respectively in the
month of April 2020 with respect to the previous year due to pandemic-lockdown. AQI in
the residential area of Gorakhpur is in the satisfactory category till October 2020. AQI in a
commercial and residential area is moderate in the post-lockdown period.
Without effective measures, the AQI is set to move into the poor category and hence an
effective clean air action plan addressing all the major air pollution-related issues is
essential.
Table 2: Air Quality Index trend at MMMTU monitoring station (Residential)
Jan Feb Mar Apr May June July Aug Sept Oct Nov Dec
2015 63.0 121.0 63.0 114.0 109.0 99.0 62.0 104.0 97.0 90.0 94.0 106.0
2016 112.0 118.0 122.0 118.0 118.0 122.0 55.0 56.0 62.0 67.0 67.0 108.0
2017 109.0 112.0 107.0 108.0 107.0 108.0 90.0 55.0 68.0 78.0 92.0 112.0
2018 117.0 117.0 118.0 117.0 117.0 116.0 104.0 89.0 110.0 115.0 177.0 243.0
2019 273.0 246.0 249.0 240.0 225.0 152.0 135.0 135.0 133.0 145.0 161.0 163.0
2020 146.0 145.0 249.0 55.0 55.0 55.0 60.0 73.0 82.0 92.00
Table 3: Air Quality Index trend at Jalkal bhawan monitoring station (Commercial)
Jan Feb Mar Apr May June July Aug Sept Oct Nov Dec
2015 125.0 195.0 125.0 179.0 174.0 166.0 118.0 167.0 152.0 146.0 150.0 162.0
2016 166.0 178.0 183.0 180.0 183.0 184.0 87.0 97.0 107.0 110.0 111.0 172.0
2017 176.0 175.0 175.0 178.0 178.0 179.0 155.0 73.0 92.0 111.0 207.0 175.0
2018 177.0 181.0 180.0 179.0 178.0 179.0 172.0 167.0 179.0 185.0 270.0 366.0
2019 392.0 280.0 285.0 280.0 280.0 249.0 214.0 227.0 224.0 235.0 267.0 277.0
2020 234.0 231.0 285.0 55.0 78.0 90.0 104.0 109.0 122.0 138.00

7 | P a g e
Table 4: Air Quality Index trend at GIDA monitoring station (Industrial)
Jan Feb Mar Apr May June July Aug Sept Oct Nov Dec
2015 146.0 191.0 146.0 202.0 195.0 182.0 145.0 186.0 162.0 159.0 163.0 184.0
2016 189.0 192.0 190.0 196.0 195.0 194.0 115.0 119.0 122.0 123.0 121.0 185.0
2017 186.0 186.0 185.0 187.0 188.0 187.0 168.0 106.0 113.0 123.0 217.0 187.0
2018 192.0 193.0 194.0 191.0 191.0 188.0 182.0 174.0 187.0 265.0 356.0 402.0
2019 409.0 289.0 296.0 293.0 302.0 275.0 239.0 272.0 271.0 291.0 344.0 358.0
2020 282.0 193.0 296.0 65.0 121.0 145.0 160.0 106.0 115.0 125.0
VIII. GAPS IN DATABASE AUGMENTATION
A. Air Quality Monitoring Network In view of the Hon’ble NGT order regarding the air quality monitoring stations, the
proposed action plan has recommended a plan for further strengthening of the
monitoring grid. The NGT has directed that the scope of monitoring should be expanded
to include all twelve notified parameters as per Notification NoB-29016/20/90/PCI-L
dated 18 November 2009 of CPCB. It is further said that continuous Ambient Air Quality
Monitoring Stations (AAQMS) should be preferred to manual monitoring stations. And, all
such ambient air quality monitoring stations shall be connected to the central server of
CPCB for reporting analysis of results in a form of Air Quality Bulletin for the general
public at regular intervals at least on weekly basis and ambient air quality on continuous
e-portal. MoEF&CC will provide requisite funds for the purpose.
A robust air quality monitoring network (AQMN) is one of the main ways to surveil air
pollution. One of the purposes of a systematic monitoring network is to document the
consequences of air pollution control measures. AQMN provide detailed information to
citizens about what they are breathing, identify hotspots, and help assess immediate
solutions.
The air quality of Gorakhpur city is monitored by 3 manual monitoring stations which are
operated by Madan Mohan Malaviya University of Technology (MMMUT), Gorakhpur.
There are monitoring stations in residential, commercial, and industrial areas.

8 | P a g e
Table 5: Details of existing air quality monitoring stations
S.No. Name of the station Latitude Longitude Category
of station
Type of
Station
Parameters
Monitored
1 Station Code-728, M.M.M.
University of Technology,
Gorakhpur
26˚43'53.1" 83˚25'57.5" Residential Manual PM₁₀, SO₂,
NO₂
2 Station Code-729, India Glycol
LTD., GIDA, Gorakhpur
26˚44'52.8" 83˚13'28.1" Industrial Manual PM₁₀, SO₂,
NO₂
3 Station Code-730, Jal Kal Building,
Golghar, Gorakhpur
26˚45'2.2" 83˚22'12.3" Commercial Manual PM₁₀, SO₂,
NO₂

9 | P a g e
Figure 4: Regional Office, Gorakhpur, UPPCB
The status of existing air quality monitoring stations along with the gaps in the
monitoring network is provided in the table below.
Table 6: Status of existing air quality monitoring network
Category of
station
Manual monitoring station CAAQMS
Minimum no.
of stations
required
Existing
no. of
stations
Gap Minimum
no. of
stations
required
Existing
no. of
station
Gap
Background 1 0 1 0 0 0
Residential 1 1 0 1 0 1
Commercial 1 1 0 1 0 1
Traffic
dominant
0 0 0 1 0 1
Industrial 0 1 0 0 0 0
Total 3 3 1 3 0 3
The state further plans to expand the monitoring network as per the CPCB guidelines
based on the city’s population so that it can contribute to developing a robust nationwide
ambient air quality monitoring network.
REGIONAL OFFICE
26°44'29.84"N 83°25'6.35"E 83˚22'12.3"E

10 | P a g e
At present, the process for procurement of one CAAQMS is underway and 1 CAAQMS will
be procured and installed by February 2021. Up-gradation of existing 03 manual
monitoring stations as per the directions of Hon’ble NGT is also being initiated and at the
first stage monitoring for PM 2.5 shall be started at the earliest. The funding
arrangements for the installation of 02 CAAQMSs and 01 Background Monitoring Station
are also being explored and it will be initiated soon.
Figure 5: Manual Air Quality Monitoring Station at Jalkal Building (left), (b) GIDA (right), in
Gorakhpur city
JALKAL BUILDING
26˚45'2.2"N 83˚22'12.3"E
INDIA GLYCOL Ltd., GIDA
26˚44'52.8"N 83˚13'28.1"E

11 | P a g e
Figure 6: Location Map of AAQMS

12 | P a g e
B. Source Apportionment & Carrying Capacity Studies It is necessary to understand the contribution of different sources of pollution to the
ambient air quality for the planning of source-specific focused interventions for meeting
the targets of improvement in the air quality in a time-bound manner. The
Comprehensive Source Apportionment Study (CSAS) for Gorakhpur City is not available
which is identified as a gap in the database augmentation.
The comprehensive source apportionment & carrying capacity studies will be
conducted in due course of time through organizations of repute having ample
experience in carrying out such studies and the action points will be prioritized and
reviewed on the apportionment of various sources in the City.
However, to start with, UPPCB has made emission estimation from various sources with
an objective of initiation of the implementation of the Action Plan based on the
secondary data available.
C. Gaps in data related to Monitoring of Air Pollution Sources Governments, multilateral organizations, and the private sector are increasingly
motivated to take action as a result of a growing understanding of the negative health
and environmental impacts associated with high levels of air pollution. Unfortunately,
there is a critical lack of air quality data in most Non-Attainment Cities (NACs). The
implementing agencies can take action without making substantial investments in air
measurement systems. However, any robust air quality management system should
include a measurement component to address city-specific air pollution reduction
objectives and document trends over time. A quality data of the monitoring of various
pollution sources with well-defined periodicity is a must for preparation of an Action
Plan and also to monitor the impact of various actions for improvement of air quality in
the city. This is also very important for decision-makers at various stages in the air
quality management process.
A successful, sustainable monitoring strategy requires equipment and critical human
and institutional systems to sustain equipment and ensure that data quality remains
high and that any data collected can be analyzed and communicated to decision-makers
in support of desired objectives.
Ambient air quality monitoring is being done by UPPCB through manual monitoring
stations operated by outsourced Technical Institutions. Presently, the regional office of
Gorakhpur is not having state of art air quality analysis lab, and also the equipment
which is needed for air quality monitoring of point and line sources are not available.
The human resource and their capacity for data collection, analysis, and data
interpretation are also not available. The stack monitoring of the industries is limited to
the analysis reports of accredited labs made available by the industries which have
issues of reliability of sample and their analysis also. This plan envisages the
establishment of an Air Quality Monitoring Lab along with the staff & researchers for
periodic monitoring of point and line sources of air pollution in the city along with data

13 | P a g e
analysis/interpretation. The issue of management of air pollution in developing
countries and countries with economies in transition is hampered by a lack of expertise,
technology, and adequate related information. Regarding developing countries and
countries with transition-economy as India, technological and expertise limitations are
considered as major hindrances in achieving our obligations under various
international conventions and in meeting the national commitments concerning
prevention, control, and abatement of pollution; and protection of the environment.
Accordingly, technology transfer and information sharing are the way forward for any
collaboration on the environment. Technology transfer does not just relate to
equipment or ‘hardware’, but also total systems and their component, including know-
how, goods and services, equipment, and organizational and managerial procedures.
Accordingly, multilateral and bilateral cooperation on air pollution, including related
demonstration/pilot projects, including a prototype development for the best available
technologies and best environmental practices for pollution prevention, minimization,
and mitigation strategies and for the control and abatement of pollution, specifically air
pollution, are needed. The experience from around the world demonstrates that
abatement of air pollution can only be done through a multipronged strategy involving
interventions on various aspects at various levels including Institutional, Policy, and
Technical.
Broadly the best practices can be divided into two categories: Those of overall air
quality management and the others that target some specific source sectors. UPPCB has
also adopted some of these best practices for the betterment of air quality.
One such practice that is being implemented across the state by UPPCB is the self-
disclosure audit sheet by the infrastructure projects which are one of the main sources
of dust generation.
In addition to this, the state has adopted a unique technique called Miyawaki’s method
for urban afforestation and increasing the overall green cover by planting native plant
species in a very short period and thus mitigating the air pollution in long run.
UPPCB has already entered into a tripartite agreement with the Ministry of
Environment Forests & Climate Change (MoEF&CC) and Indian Institute of Technology
Kanpur for getting technical assistance on various aspects related to air quality
management in 15 non-attainment cities identified under the National Clean Air
Programme. The same agreement may be extended for the city of Gorakhpur as well. In
addition to this, UPPCB intends to take a decentralized approach through which local
research and educational institutions, which are well accustomed to the local
conditions, can be engaged as knowledge partners.
This plan envisages International scientific and technical cooperation in the area of air
pollution that will be established as per national priorities and socio-economic
development strategies and goals. Modalities of such cooperation may include joint
research and technology development, field studies, pilot-scale plants, and field

14 | P a g e
demonstration projects with the active involvement of local academia, local research
institutions, and industries on either side.
IX. INSTITUTIONAL STRENGTHENING
To execute the city action plan in the best possible manner, it is necessary that
institutional strengthening is done at the local level.
A. Public Awareness and Education Awareness and education initiatives towards prevention, control, and mitigation of air
pollution combined with specific information sharing on health advisories and dealing
with air pollution exigency is an essential component, which provides communities with
the knowledge and tools to take action and help improve their local air quality. Problem
areas can easily be identified and monitored using citizen science methods, empowering
communities, and reducing the risks of exposure to air pollution. Studies show that
simple measures such as walking just a few yards away from the curbsides of a busy
road could reduce exposure by 30%. Idling your car engine uses more fuel and is worse
for your engine than restarting. The most important initial step is awareness. Engaging
children at an early age is the best way to ensure we build a foundation to ensure clean
air for future generations. With air quality now ingrained in public health frameworks
and local authority jurisdiction, an ever-increasing number of industries are required to
take action and all institutions have a responsibility to reduce their air quality footprint.
The public can become more involved in reducing local air pollution impacts in their
communities. Extensive awareness and outreach programs for various stakeholder
groups need to be taken up for the non-attainment cities. Building public awareness will
be vital in supporting the implementation of the City Action Plan. This will be achieved
through national portals, media engagement, civil society involvement, curricula reform,
and recognition/ awards, etc.
City-specific awareness programs targeting key stakeholders need to be formulated and
taken up for implementation. This could include (1) Awareness generation in public for
the prevention of adverse effects of air pollution. (2) Sensitization of the media for the
right interpretation of international reports and data as well as for disseminating
information on measures being taken by the government for the abatement of air
pollution to be undertaken.
Information Education & Communication activities shall be undertaken for the
dissemination of air pollution-related information for the awareness of the general
public through various social media platforms of departments engaged in the city action
plan (e.g., UPPCB, Gorakhpur Nagar Nigam, Gorakhpur Development Authority, etc.). It
is also planned to engage educational institutions (schools, colleges, etc.) through
workshops, seminars, competitions, etc.

15 | P a g e
Besides the above, UPPCB will take up Clean Air Hackathons with the objective of
involving various stakeholders and students for crowdsourcing of ideas/technologies
for control of air pollution. This kind of activity-based awareness program will not only
generate awareness but also provide innovative ideas/concepts to mitigate air
pollution. The Hackathons will be online and will provide sufficient time for the
participants to develop ideas and find their application.
B. Training and Capacity Building One of the major issues, which is a hurdle for effective implementation of air pollution
management plans have been observed to be a lack of capacity on air quality issues due
to limited manpower and infrastructure in the UPPCB and ULBs, lack of formal training
for various associated stakeholders, a limited number of trained individuals in air
quality management, limited publications designed to provide information on local air
quality issues, limited collaboration between government, universities, and other
research institutions, lack of a forum for sharing of published local research work on air
quality, etc. One of the key issues in the implementation of an action plan is the lack of
capacity of in-house capability and adequately trained manpower. If this is not set right,
all other improvements in infrastructure and processes, etc. would not yield expected
results. Key areas to focus on are:
a) ULB – waste management, plantation schemes, maintenance of roads, dust
suppression measure, development of green infrastructure, etc.
b) UPPCB – Internal training on the handling of machinery and equipment for
sampling and analysis
c) Industries – best practices for boiler and furnace operation, retrofitting of DG
sets, up-gradation of machinery with cleaner technologies, usage of clean fuel
d) Construction projects: control measure for fugitive dust, segregation, handling,
and disposal of C&D waste.
An orientation workshop was carried out by UPPCB in collaboration with its knowledge
network partner, IIT Kanpur, with an objective of mutual sharing of the best practices
and relevant knowledge with the other states in the country and also with the
International Organizations namely UNEP, World Bank and Global NGOs under National
Clean Air Programme on 14-15 Oct 2019. Besides this, UPPCB has also organized the
training and capacity building workshops of the officers of the implementation
departments/agencies for implementation of GRAP and various measures for control of
air pollution.
Through this action plan, it is envisaged that extensive capacity-building programs for
manpower and infrastructure augmentation in the UPPCB & other line
departments/agencies will be formulated and intensive training, comprising national
and international best practices and technological options, of all the associated
stakeholders will be organized in the plan period. It is also envisaged that online
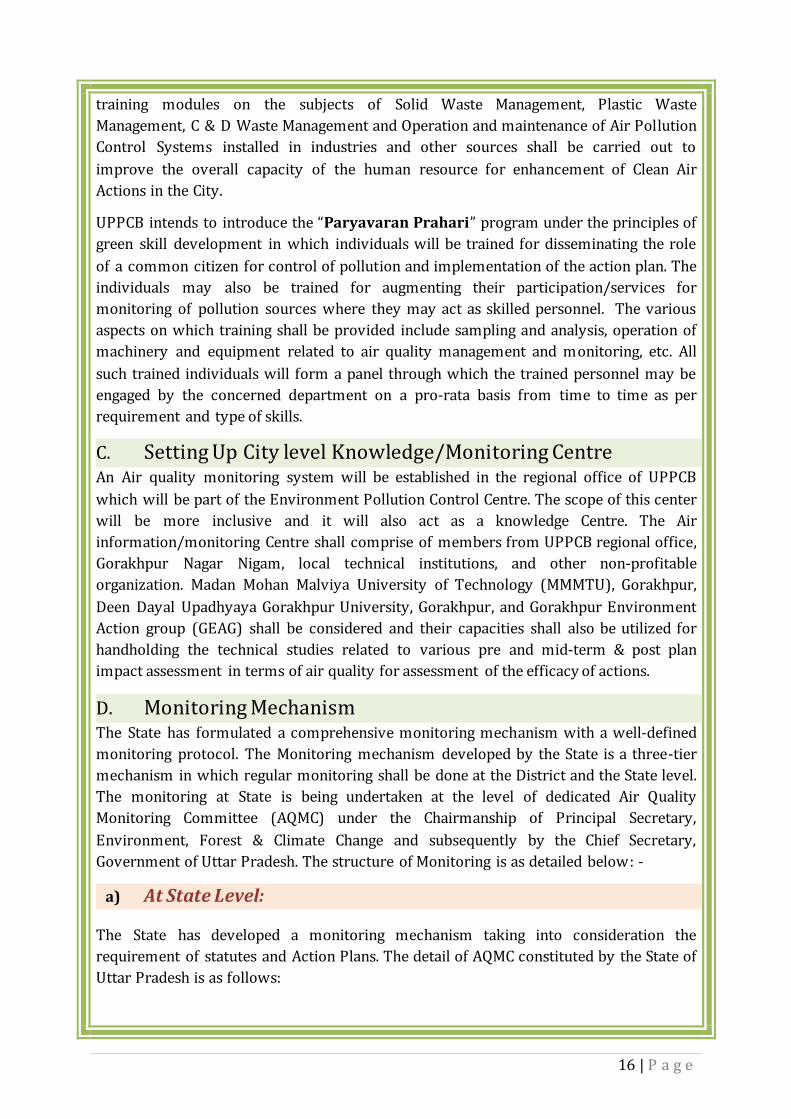
16 | P a g e
training modules on the subjects of Solid Waste Management, Plastic Waste
Management, C & D Waste Management and Operation and maintenance of Air Pollution
Control Systems installed in industries and other sources shall be carried out to
improve the overall capacity of the human resource for enhancement of Clean Air
Actions in the City.
UPPCB intends to introduce the “Paryavaran Prahari” program under the principles of
green skill development in which individuals will be trained for disseminating the role
of a common citizen for control of pollution and implementation of the action plan. The
individuals may also be trained for augmenting their participation/services for
monitoring of pollution sources where they may act as skilled personnel. The various
aspects on which training shall be provided include sampling and analysis, operation of
machinery and equipment related to air quality management and monitoring, etc. All
such trained individuals will form a panel through which the trained personnel may be
engaged by the concerned department on a pro-rata basis from time to time as per
requirement and type of skills.
C. Setting Up City level Knowledge/Monitoring Centre An Air quality monitoring system will be established in the regional office of UPPCB
which will be part of the Environment Pollution Control Centre. The scope of this center
will be more inclusive and it will also act as a knowledge Centre. The Air
information/monitoring Centre shall comprise of members from UPPCB regional office,
Gorakhpur Nagar Nigam, local technical institutions, and other non-profitable
organization. Madan Mohan Malviya University of Technology (MMMTU), Gorakhpur,
Deen Dayal Upadhyaya Gorakhpur University, Gorakhpur, and Gorakhpur Environment
Action group (GEAG) shall be considered and their capacities shall also be utilized for
handholding the technical studies related to various pre and mid-term & post plan
impact assessment in terms of air quality for assessment of the efficacy of actions.
D. Monitoring Mechanism The State has formulated a comprehensive monitoring mechanism with a well-defined
monitoring protocol. The Monitoring mechanism developed by the State is a three-tier
mechanism in which regular monitoring shall be done at the District and the State level.
The monitoring at State is being undertaken at the level of dedicated Air Quality
Monitoring Committee (AQMC) under the Chairmanship of Principal Secretary,
Environment, Forest & Climate Change and subsequently by the Chief Secretary,
Government of Uttar Pradesh. The structure of Monitoring is as detailed below: -
a) At State Level:
The State has developed a monitoring mechanism taking into consideration the
requirement of statutes and Action Plans. The detail of AQMC constituted by the State of
Uttar Pradesh is as follows:

17 | P a g e
Table 7: Air Quality Monitoring Committee
S.No. Name of
Committee
Chairperson Work area
1. Air Quality
Monitoring
Committee
Additional Chief
Secretary/ Principal
Secretary Environment,
Forest & Climate Change
Effective Air Pollution
Control in the State
and maintenance of
Ambient Air Quality
b) District and Commissioner Level-
A District Level Committee under the Chairmanship of respective District Magistrates
has been constituted by O.M. No. 13/2019/NGT-257/55-Parya-2-2019-44(Writ)/2016
dated 14-06-2019 for monthly monitoring of all the Environmental issues and
compliance of Environmental Laws including implementation of GRAP and City Action
Plan. The District Level Committee has 28 Officers of all the concerned District Level
Departments. District Forest Officer is the convener of the Committee.
c) The monitoring protocol shall be as below-
The State has developed a dedicated-UP Environment Compliance Portal www.upecp.in
for monitoring of various issues related to environmental compliances. The purpose of
the portal is to have mechanisms for focused dialogue and facilitate smooth
coordination on issues related to air pollution. The access to the portal is given to Chief
Secretary, State Level Monitoring Committees, and the District Level Committee. Portal
has been provided with a dedicated Template for Online Filing of the Compliance Status
to be reviewed at State Level by the State Level Committees. The issues requiring State
Level intervention shall be flagged before the Chief Secretary, Uttar Pradesh.
d) Schedule of Monitoring:
The monitoring is to be done as per the following schedule-
Table 8: Schedule of Monitoring
Level of Monitoring Schedule of Monitoring
District Level Committee under District Magistrates
1st week of every month
District Level Committee under Commissioner
2nd week of every month
State Level Committees 3rd week of every month
Chief Secretary Level 4th week of every month

18 | P a g e
In addition to the above, the District Environment Committee of Gorakhpur shall
be monitoring all the updates regarding the city action plan as a part of the State
3-tier monitoring system.
Figure 7: 3-tier monitoring system
X. STATUS GAPS AND STRATEGIES OF AIR POLLUTION
MITIGATION MEASURES FOR VARIOUS SOURCES
A. Gorakhpur City Emission Inventory
An emission inventory is the reckoning of all air pollution emissions and associated data
from sources within a specified geographical area and over a specific interval of time.
The development of the EI database is very crucial for air quality management. It helps
in planning air quality goals and tracking the progress of control initiatives towards
pollution mitigation. Besides, the result from EIs can be used to study other sectors
related to human health, economic loss from air pollution, etc.
a) Emission Estimation and Factors
An emissions factor is a representative value that attempts to relate the quantity of a
pollutant released to the atmosphere with an activity associated with the release of that
pollutant. These factors are usually expressed as the mass of pollutant per unit mass of
raw material, volume, distance traveled, or duration of the activity (e.g., grams of
particulate emitted per kilogram of coal burnt). Such factors facilitate the estimation of
emissions from various sources of air pollution. In most cases, these factors are simply
averaging of all available data of acceptable quality and are generally assumed to be
representative of long-term averages for all facilities in the source category.

19 | P a g e
The general equation for emissions estimation is:
E = A*EF*(1-ER/100) (1)
where:
E = Emissions rate;
A = Activity rate;
EF = Emission factor, and
ER = Overall emission reduction efficiency, %
This emission inventory is based on available indicative data which faces a lot of data
gaps. This is a first-time emission inventory is developed for Gorakhpur. It is prepared
in-house at UPPCB according to the bottom-up approach with aim of starting planned
efforts for control of air pollution and is subjected to further improvement with aid of
reputed institutes. In constructing this emission inventory total fuel use, total
population, total activity data, etc. are used as indicators of emission. In the action plan
period, a comprehensive source apportionment study and dispersion modeling will be
done.
The figure below depicts the various sources identified for calculating the emission load,
which are primarily classified into a point, area, and line sources.
Emission load of the based on the secondary data available and information available
with UPPCB. The detail of the emission load for all the sources has been cumulated and
is discussed as follows: -
B. Cumulative Emission Inventory The overall baseline emission inventory for all the sources is presented in Table-9 and
Figure-9. The pollutant wise contribution is shown in Figures-10, 11, 12, and 13.
Figure 8: Emission Sources in Gorakhpur

20 | P a g e
Table 9: Cumulative Inventory of Gorakhpur city
S.No. Source Emission
PM10 (kg/day)
Emission PM2.5
(kg/day)
Emission SO2
(kg/day)
Emission NOx
(kg/day)
Emission CO
(kg/day)
1 Brick Kilns 2757.71 303.84 2965.15 2559.57 237.48
2 Industry 3984.11 2390.46 5955.49 5142.13 42975.66
3 Construction 26585.87 10634.35 0.00 0.00 0.00
4 DG Sets 71.86 64.68 70.10 1062.93 229.53
5 Domestic 1507.21 1083.90 175.61 489.22 8878.12
6 Hotels (Cooking) 7.18 3.80 4.65 28.64 155.05
7 Banquet Hall (Cooking) 2.27 1.46 1.19 1.06 2.84
8 Hot-Mix plants 1184.00 1065.60 32.56 44.40 148.00
9 MSW 42.10 16.84 2.63 157.89 221.04
10 Vehicular Exhaust 164.45 148.01 0.44 1889.61 3722.89
11 Road Dust 33070.00 8490.00 0.00 0.00 0.00
Total Emission (kg/day) 69376.77 24202.94 9207.82 11375.44 56570.61
Total Emission (tonne/day) 69.38 24.20 9.21 11.38 56.57

21 | P a g e
Figure 9: Cumulative emission load for Gorakhpur
The total emission load for PM10 is estimated to be 69376.77 kg/day. The top
contributors to PM10 emissions are Road Dust (48%), Construction (38%), Industries
(6%), Brick Kiln (4%) and hot mix plant (2%) based on annual emissions. Seasonal and
daily emissions could be highly variable. The estimated emission suggests that road
dust contributes majorly in particulate matter emission in ambient air of Gorakhpur
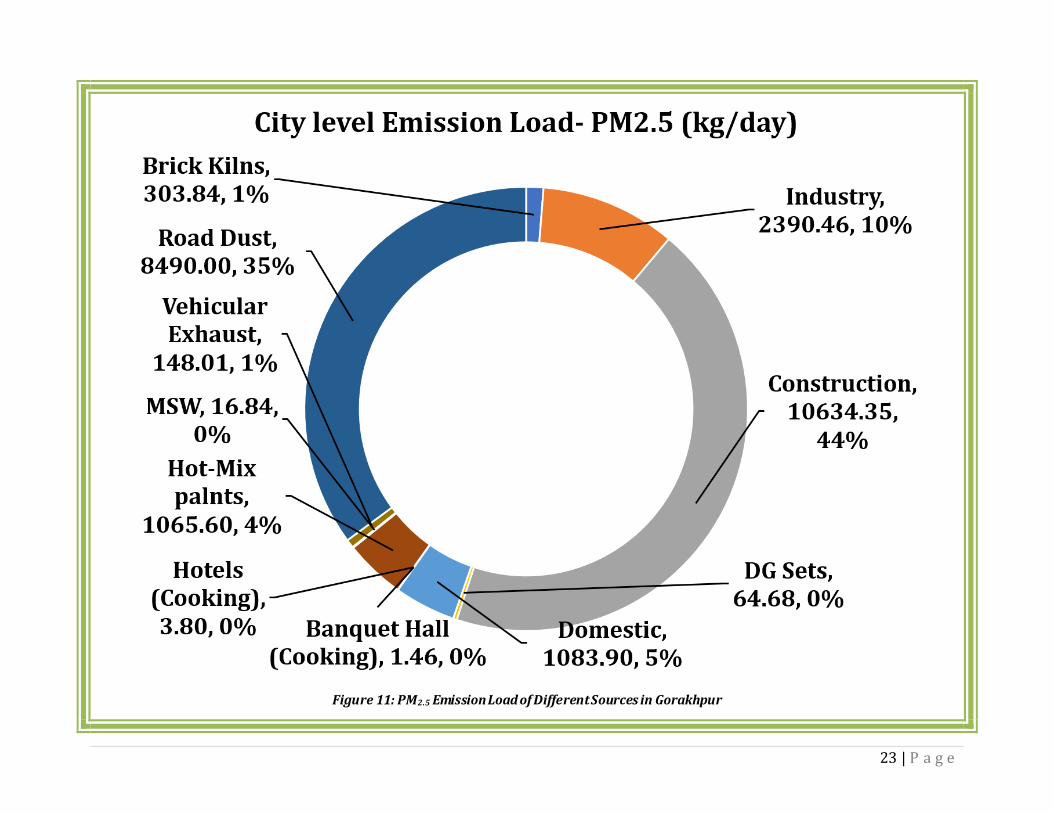
city. PM2.5 emission load in the city is estimated to be 24202.94 kg/day. The top
contributors to PM2.5 emissions are Construction and Road Dust with 44% and 35%
share respectively, of each in total PM2.5 emission. Industry (10%) is second major
contributor. Seasonal and daily emissions could be highly variable. SO2 emission load is
estimated to be 9207.82 kg/day. Industry accounts for 77% percent of the total
emission. Brick Kilns contributes to 21%. NOx emissions load is estimated to be
11375.44 kg/day. Nearly 54% of emissions are attributed to Industries followed by
Brick Kilns (26%). NOx apart from being a pollutant itself is an important component in
the formation of secondary particles (nitrates) and ozone.
Estimated Carbon Monoxide (CO) emission is about 56570.61 kg/day. Nearly 76%
emission of CO is from Industrial sector, followed by Domestic cooking emission
(15.7%). The high emission load of CO is due to the large use of petroleum product and
biomass-based fuel. Incomplete combustion is also a cause for high CO emission.

22 | P a g e
Figure 10: PM10 Emission Load of Different Sources in Gorakhpur
23 | P a g e
Figure 11: PM2.5 Emission Load of Different Sources in Gorakhpur

24 | P a g e
Figure 12: SO2 Emission Load of Different Sources in Gorakhpur

25 | P a g e
Figure 13: NOx Emission Load of Different Sources in Gorakhpur

26 | P a g e
C. Industrial Pollution Industries are a major stationary source of air pollution emitting PM10.
a) Industrial profile of Gorakhpur
Air pollution due to anthropogenic sources is a matter of concern in the whole world.
The urban areas may be viewed as dense sources of enormous anthropogenic emissions
of pollutants which can alter the atmospheric composition, chemistry, and life cycles in
its downwind regimes, extending over several hundred kilometers. Moreover, a
worldwide epidemiological study on the effect of air pollution has revealed that gaseous
pollutants and particulate matter have enough potential to cause severe health effects
like respiratory, cardiovascular diseases, and cardiopulmonary mortality. The
modernization and Industrialization of developing countries have led to the increased
use of fossil fuels and their derivatives.
A city that has stood in all its cultural glory over time, Gorakhpur has a variety of
industries that provide the livelihood of its residents. Its industries have been growing
as well as evolving, and much of the city’s cultural relevance can be seen in the types of
industries that define this city.
Types of Industries in Gorakhpur can be largely split up into Food products, Cotton
textiles, Beverages, Tobacco and Tobacco products, Wool, silk and synthetic fiber
textiles, Terracotta products, Jute, hemp and mesta textiles, Hosiery and garments,
Leather products, Wood products, Paper Products, and printing, Chemical and chemical
products, Transport equipment and parts, Rubber and plastic products, Metal products,
Non-metallic mineral products, Basic metal industries, Machinery, and parts, excepts
electrical, Electrical machinery and apparatus, Repairing and servicing industries, etc.
Gorakhpur has many small-scale industries such as wheat flour, oils, biscuits, flour, dal,
tobacco, furniture, soap, bricks, metalware, and sports goods. Since 1956, the
production of goods and further investment in small scale industries in this region has
gone up. Most of the small-scale industries are agriculture-based or chemical-based,
further on diversifying into other manufacturing units. There are very few medium and
large-scale industries in the City.
27 | P a g e
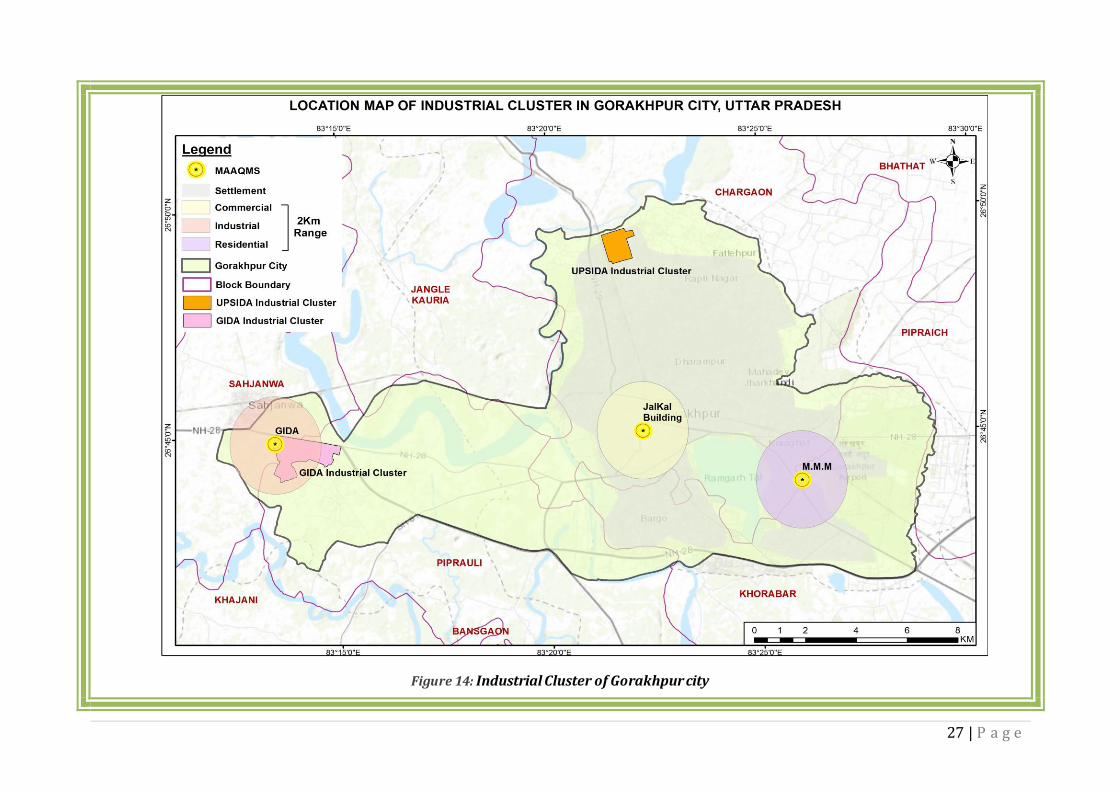
Figure 14: Industrial Cluster of Gorakhpur city

28 | P a g e
Figure 15: GIS Industrial profile of Gorakhpur

29 | P a g e
b) Industrial sectors in Gorakhpur
Gorakhpur is a hub for a variety of industries. All these industries in Gorakhpur have
been classified into sectors details of which are tabulated below and their percent
contribution is depicted in the pie-chart:
Table 10: Categorization of industries
S.No Industrial sector Number of Industries
1. Chemical 8
2. Aluminum 7
3. Fertilizer 3
4. Plastic 51
5. Paper 18
6. Wood 9
7. Iron Steel 8
8. Food Processing 44
9. Others 104
Total 252
Figure 16: Sectoral classification of industries in Gorakhpur

30 | P a g e
Figure 17: Boiler at M/s Gallants Ispat Pvt. Ltd., AL-5, Sector-23, GIDA, Gorakhpur
Figure 18: Electrostatic precipitator (ESP-APCS) control panel in M/s India Glycols Ltd., E-1, Sector-13, GIDA, Gorakhpur
M/s INDIA GLYCOLS Ltd.
26° 44' 52.8'' N 83° 13' 30'' E
M/s GALLANT ISPAT Pvt. Ltd.
26° 45' 33.64''N 83° 12' 02.50''E E

31 | P a g e
c) Fuel usage in the sectors
i. Number and range of capacity of combustion equipment installed in the industries
Table 11: Number and range of capacity of combustion equipment installed
Sno Capacity range No.
A Boiler 30
<10 TPH 24
10 to 100 TPH 5
>100 TPH 1
B Thermo pack 7
Up to 10 lakh kcal/h 2
10-20 lakh kcal/h 5
C Furnace (Oil furnace, Pit furnace, etc.) 19
ii. Fuel usage in Gorakhpur industries Diesel, used oil and Rice husk is the prominent fuel being used in the industrial
processes. Types of fuel used by the various combustion equipment, as per their
capacity is given as follows:
Table 12: Percentage of type of fuel source used in Combustion equipment
S.No. Fuel Type Consumption
(kg/day)
% Consumption
1. Rice Husk 616800 46.88
2. Processed Biomass 49050 3.73
3. Coal 159800 12.15
4. Diesel 1940 0.15
5. Slop 455000 34.58
6. LPG 700 0.05
7. Wood 32000 2.43
*Source- UPPCB – Regional Office, Gorakhpur

32 | P a g e
Figure 19: Fuel Type Industry
d) Emission Estimation from industries in Gorakhpur
The information on the number of industrial facilities and their activity data were
collected from UPPCB-Regional office, Gorakhpur. There are approximately 49
industries throughout the Gorakhpur district that are air polluting in nature and require
consent to operate from the state pollution control board to run the industry, have been
considered for the study. The emissions of various pollutants such as SO2, NOx, PM10,
PM2.5, and CO were estimated from the activity data from each fuel type and then were
summed. The emission factors given by CPCB (2011) were used to calculate the
emission load given as follows in Table-13, and is represented graphically in Figure-
20:
33 | P a g e
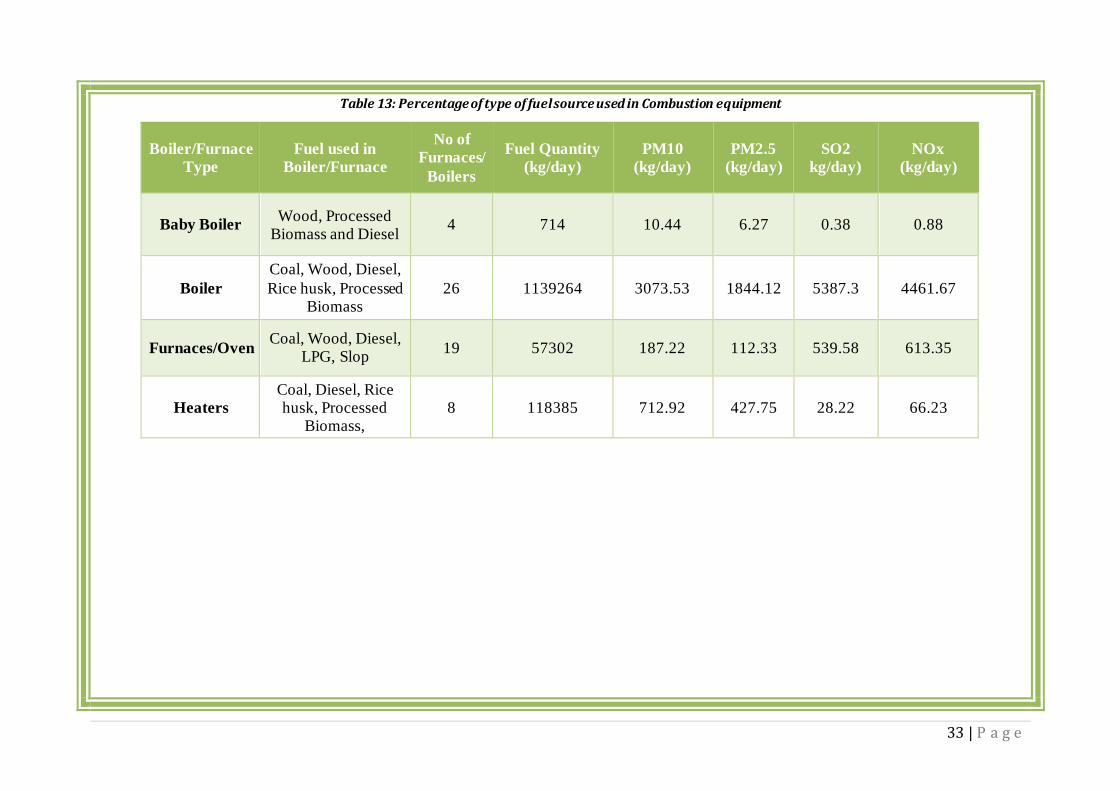
Table 13: Percentage of type of fuel source used in Combustion equipment
Boiler/Furnace
Type
Fuel used in
Boiler/Furnace
No of
Furnaces/
Boilers
Fuel Quantity
(kg/day)
PM10
(kg/day)
PM2.5
(kg/day)
SO2
kg/day)
NOx
(kg/day)
Baby Boiler Wood, Processed
Biomass and Diesel 4 714 10.44 6.27 0.38 0.88
Boiler
Coal, Wood, Diesel,
Rice husk, Processed Biomass
26 1139264 3073.53 1844.12 5387.3 4461.67
Furnaces/Oven Coal, Wood, Diesel,
LPG, Slop 19 57302 187.22 112.33 539.58 613.35
Heaters
Coal, Diesel, Rice husk, Processed
Biomass, 8 118385 712.92 427.75 28.22 66.23

34 | P a g e
Figure 20: Emission Load for Industries
i. Observations From the above estimation, the order of pollutant emission from industries in
Gorakhpur is found as follows: SO2>NOx> PM10> PM2.5. The emission load for SO2 and
NOx is observed to be the highest. It is inferred that high emission is due to heavy usage
of low-quality coal, rice husk and slop usage. Higher pollutant emission is result of inept
or no air pollution control devices. Improper management of rice husk ash also annex
the particulate emission. Emission loads from different sources for various pollutants
are as follows: -

35 | P a g e
Figure 21: PM10 Emission from Industries
Figure 22: PM2.5 Emission from Industries

36 | P a g e
Figure 23: SO2 Emission from Industries
Figure 24: NOx Emission from Industries
It is evident from Fig. 21, 22, 23, and 24 that boilers are the prime contributors of
particulate matter (PM), SO2 and NOx emission in industrial emission load.

37 | P a g e
e) Issues of Industrial pollution
i. Poor quality of inventory data - Although UPPCB had attempted an inventory of
industries, it was often incomplete and at times inaccurate. Many industries either
did not have data on fuel consumption or a very accurate inventory of the pollution
sources and their capacities, thus making the evaluation of pollution load a bit
challenging. It is recommended for all the regulators to prepare a complete,
updated, and accurate inventory of the industries which will further assist in
identifying the areas or sectors of concern from the perspective of environmental
pollution.
ii. Inadequate data on small scale sectors - There is little to no data on small scale
industries or other unorganized sectors in most of the areas. These sectors are
significant contributors to the overall pollution loading in industrial areas.
Gorakhpur Regional Office did not have a detailed inventory and there was no
database on illegal small-scale units operating in their areas.
iii. Lack of clear fuel policy –A clear fuel policy is required which mentions which
fuels are banned and which clean fuels are recommended for industries to use now
and in the future. Fuels that can be used in the long run by industries need to be
made clear. Especially with the cost dynamics between coal and PNG, a lot of
industries are looking at agro-waste as a potential fuel that they are willing to use
but are unsure if this will be allowed in the future. The regulators should also
mention proper timelines for the implementation of such a policy to fast-track the
change in fuel use and subsequently reduce the pollution load.
iv. Lack of manpower and capacity in UPPCB- It was observed that the UPPCB lack
manpower and the available manpower are highly over-utilized. The periodic
inspection and monitoring of the industries (specifically small-scale industries) by
the regulatory bodies to check and ensure compliance could not be conducted since
the concerned officer is involved in various administrative assignments. There is an
urgent requirement for UPPCB to develop the capacity of its existing officials and
increase the manpower. It is also important to shift to technologies and systems
which need the least monitoring and ensure maximum compliance to reduce the
unrealistic workload on officials of the board.
v. Restructuring of CTOs to include relevant information on fuel, equipment, etc.
– Reliable industrial equipment and fuel consumption data is not available in many
industries; the required data is extracted from the CTO of industries. The basic
requirement to estimate and analyze the pollution load is the detail of combustion
equipment/pollution source of the industries and the type of fuel used in the
industry. It is observed that there is no standard pro forma for CTO and the
information is either not mentioned or partially available in the document.
Regulators should standardize the CTO format to include all the important
information (related to industries’ production capacity, fuels consumed,
combustion equipment installed and its capacity, and air pollution control devices
installed) in a structured manner.

38 | P a g e
vi. Economic costs for switch over to natural gas – It is observed that many
industrial areas have access to natural gas as proper infrastructure is available, but
the cost of shifting from conventional fuel to piped natural gas doesn’t go well with
the industries resulting in their unwillingness to switch over to PNG. The non-
coverage of PNG under Goods and Services Tax (GST) and the application of Value
Added Tax (VAT) on it makes it even more expensive compared to other fuels. The
cost dynamics of different fuels with respect to the generation of per kg of steam is
shown in the table below. (rate of natural gas has been considered as Rs 35 per
SCM). Table 14: Cost of the steam generation with various fuels
Fuel Price of steam
(Rs/kg)
Coal 1.6-1.7
Furnace Oil 1.8-1.9
Natural Gas 2.2-2.3
Light Diesel Oil (LDO)/High-Speed Diesel
(HSD)
3.9–4.1
*Source: Nestle Inc., 2019
v. No data is available on the number of operational hours of industries and
their DG sets - Information related to operating hours of industries and the DG sets
installed is not available with UPPCB. DG consumes a significant quantity of diesel
in the industrial areas and contributes to the loading pattern. Therefore, there is a
need to make a complete inventory of DG sets along with the number of operating
hours for each of them.
vi. Poor road infrastructure, which adds substantially to fugitive dust emissions -
In Gorakhpur Industrial Development Authority Industrial Area, it is observed that
the condition of the roads is very poor and traffic chicken-necks are resulting in
traffic congestion of heavy vehicles. Moreover, GIDA Industrial Area does not have a
proper drainage system which results in waterlogging. As an effect, the condition of
the road deteriorates and a lot of road dust is generated out of drying of silt. The
agencies responsible for the development of industrial areas should develop a
robust system for the maintenance and development of infrastructure in industrial
areas. Industrial areas have poor road conditions with the movement of heavy
vehicles on them which led to the high amount of PM10 fugitive emissions in the
area.
vii. Improper industrial waste management and open burning of industrial waste
One of the most important aspects of industrial area development is the
management of industrial waste which is generated in that area. It has been
observed in most of the industrial areas that waste disposal is not proper. GIDA
Industrial Area has many rice mills in which a lot of solid wastes including rice husk
ash (RHA) is generated. Rice Husk Ash (RHA) is a great environmental threat

39 | P a g e
causing damage to the air, land, and the surrounding area in which it is dumped.
Rice husk removal during rice refining, creates disposal problems due to less
commercial interest. Also, the handling and transportation of RHA are problematic
due to their low density. Also, many industrial units produce a lot of ash which is
dumped in the nearby areas that are causing degradation of land and air pollution
in the GIDA Project Area. RHA is also a potential environmental problem causing
damage to the air, land, and the surrounding areas in which it is dumped. No
management strategy has been adopted till now for the solid wastes in the area.
viii. Issues with land-use planning concerning communities living in close
vicinity of industrial areas - It has been observed in the industrial areas that
residential colonies/areas are in close vicinity of the industries, making people
prone to different diseases due to air pollution. There seems to be an issue in urban
planning in the area since the industries came into existence first and people
started to settle in these areas slowly and gradually. The labor force of industries is
provided by such colonies at the cost of the health of their residents. It is
recommending that all the industrial area development agencies and urban
planning departments should properly coordinate to clearly demarcate industrial
and residential areas, and come up with remedial measures or buffer zones to
prevent the residential population from the effects of air pollution from industries.
Proper land-use planning should be done for upcoming industrial areas or the
expansion of the existing ones. Meteorology of the area should necessarily be
considered while planning.
ix. Good practices by industrial associations - In many of the industrial areas,
industrial associations are doing a good job in maintaining the infrastructure in the
industrial area, following good environmental management practices, and also
working towards the development of the area in association with the administrative
bodies. It is recommended that industrial associations should be identified and
considered as major stakeholders in the air pollution action plans being prepared
by the concerned departments including UPPCB. They can play a very significant
role in improving air quality.
x. Requirement of technology-based standard for small scale industries - Norms
for small scale industries should be technology-based rather than concentration
based, since existing concentration-based norms are impossible to monitor,
especially given the current capacity of UPPCB.
xi. Centralized steam generation units for industrial sectors - Most of the small-
scale industries have installed individual low-capacity boilers for the purpose of
steam generation. The opportunity to install a centralized steam generation system
should be explored specially in GIDA Industrial Area. This will help in improving the
efficiency of the system and indirectly reduce fuel consumption in the industrial
areas. It would also make it much easier to monitor a few centralized steam
generation units rather than a large number of baby boilers located in small
industries.

40 | P a g e
xii. The high levels of PM10 & PM2.5 in GIDA- The high level of PM10 and
particularly sharp rise after 2017 may be attributed to poor road conditions, road
dust & construction dust in GIDA Industrial Area.
xiii. High level of SO2 and NOx in the Industries of Gorakhpur: Emission
Inventory shows that SO2 and NOx emission is very high in industrial emission.
Genesis of such high emission is due to heavy usage of low-grade coal, diesel and
bio-based fuel. An increase in NO2 may be attributed to local sources which are LPG
Bottling Plants and some waste oil burning units. There have been instances of
burning plastic in industrial boilers also.
xiv. Inept quality and quantity of APCD: In our study, it is found that only 25
Industries are equipped with proper APCDs. Some MSMEs don’t have effective Air
Pollution Control Devices particularly the plywood industries. It is also a major
cause of pollutant release in ambient air without treatment.
f) Specific Issues of Industrial Pollution in Gorakhpur
i. Hindustan Urvarak & Rasayan Limited (HURL) fertilizer plant in the northern part
of Gorakhpur city is operational and further construction project is in progress.
This red category industry is located within the city limits and is a potential air
polluting industry like production of fertilizer results in the emission of particulate
matter and toxic gaseous. The major sources of pollutant emission are Prilling
towers, which manufacture urea prills or pellets, ammonia and urea plants, acid
plant. Therefore, to avoid any future challenges to air pollution downwind to the
city, stringent check on environmental compliances and air pollution control
guidelines at the plant. Regular and efficient APCD must be installed and
continuously monitored.
ii. Spent iron particles emission from Gallant Ispaat Industry is also troublesome for
people living nearby.
iii. Plywood Industries in Gorakhpur also burn rubber and polythene which results in
high emission of NOx and other toxic gases.

41 | P a g e
Figure 25: Boiler ash dumped by M/s Raina papers and M/s Gallant Ispat Ltd in Gorakhpur
g) Issue of air polluting industries in non-conforming areas
Gorakhpur has been the hub for various kinds of MSME industries especially wheat
flour, oils, biscuits, flour, dal, tobacco, furniture, soap, bricks, metalware, and sports
goods etc. Some of the industries operating in residential areas also contribute the
pollution load in the ambient air. The mapping of such industries operating in non-
conforming areas has never being attempted and is a bit difficult exercise also as
coordination of ULB, Electricity Department along with Administration and Police is
required for this exercise. Such units operating in nonconforming areas do not comply
with the requirement for industrial setup as per standards set by CPCB and UPPCB.
Such units shall have to be mapped & as a long-term intervention may be shifted as per
the norms to the conforming areas with the handholding by the Government. However,
shifting of industries is a complicated affair, therefore it is better to first do the mapping
and finding out the ways that how the air pollution issues due to these units may be
quantified and addressed as an immediate measure.
h) Strategies for Control of Air pollution due to industries
Based on the various issues related to pollution due to industries in Gorakhpur as
discussed above, the following strategy is proposed-
i. Adoption of best environmental practices in GIDA Sahjanwa Area ii. Upgradation of Roads & Drainage System in GIDA for control of dust and congestion
of heavy vehicles iii. Ensuring strict compliance with air pollution control standards iv. UP gradation of inadequate Air pollution Control Devices installed in Plywood and
other small-scale units v. UP gradation of APCS in Gallant Ispat Limited, GIDA, Gorakhpur
Vill. KASROL, MAGHAR, NH 28
26° 45' 31'' N, 83° 9' 28'' E

42 | P a g e
vi. Centralized steam supply in GIDA vii. Control of NO2 emissions from bottling plants and oil-burning units in GIDA
Sahjanwa viii. A complete ban on the reuse of spent oil and high sulphur diesel. ix. Biofuel complex which is under development in Dhuriyapar can provide alternative
cleaner fuel that can be used in the industrial sector x. Proper waste management in an industrial area will help in ceasing waste burning.
xi. Laying of Infrastructure for supply of clean fuel (PNG) to the industries in GIDA.
D. Brick kilns The brick sector is a resource-intensive and highly air polluting sector. It is a largely
unorganized labor-intensive sector. India is the second-largest brick producer globally
with an estimated production of 250 billion bricks a year. Bricks can be of many types
and the most popular type is fired clay brick. Clay fired bricks are produced in small
enterprises mostly located in peri-urban and rural areas.
There are 228 brick kilns in the Gorakhpur district, out of which 163 brick kilns have
CTO air compliance. In Gorakhpur city boundary, there are 15 brick kilns. District’s
geographical locus in the Terai region provides it abundant clay-soil which is an
essential raw material for brick manufacturing results in such a high number of brick
kilns in the region.
Green bricks are fired at approximately 1000O C temperature for high strength and
durability. Brick firing is an energy-intensive process. Coal, wood, and many agricultural
wastes such as mustard stalk, rice husk, etc. are used as fuels for firing bricks. There is
heavy dependence on coal for firing which results in high particulate matter emissions,
CO2, and black carbon.
Fixed Chimney bull trench kiln (FCBTK) is the most used firing technology in Gorakhpur
district which accounts for approximately 80% of total kilns present in the district.
There is a trend of adopting cleaner firing technology like zigzag Kiln but the number of
such kilns is very less.
Brick kilns provide mass employment to the local people of Gorakhpur and the nearby
region.
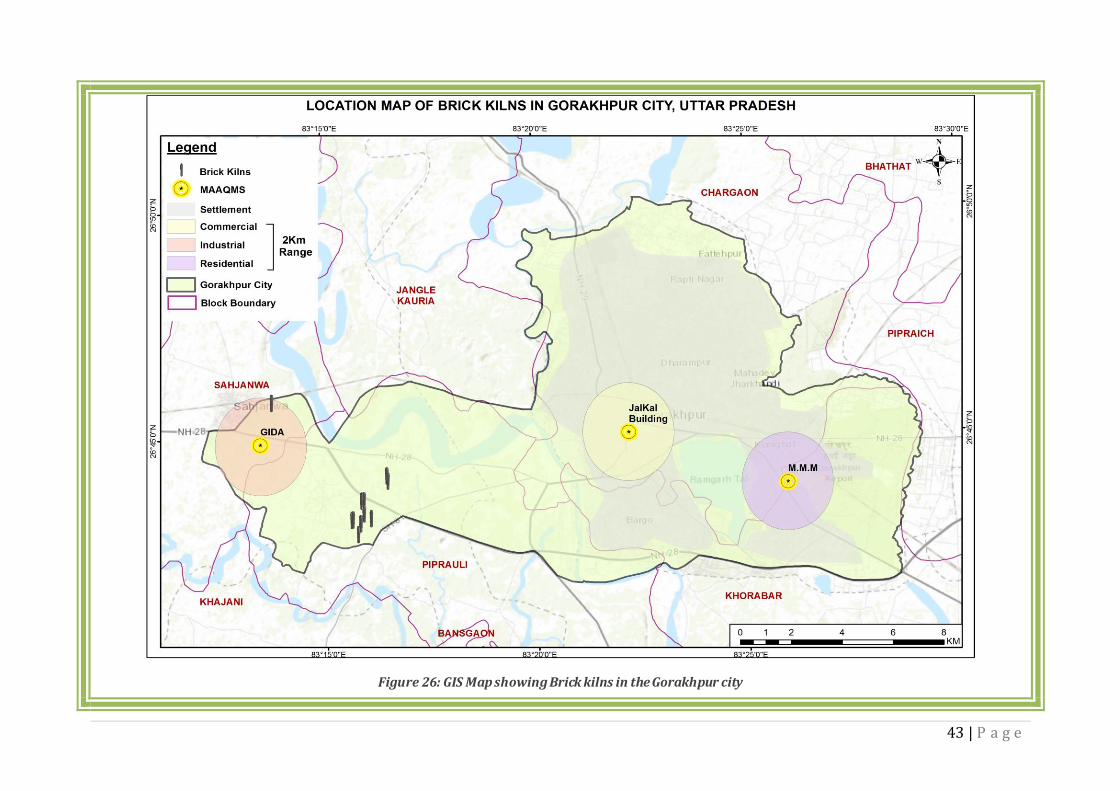
43 | P a g e
Figure 26: GIS Map showing Brick kilns in the Gorakhpur city

44 | P a g e
Figure 27: GIS Map showing brick kilns in Gorakhpur district

45 | P a g e
Table 15: Status of brick kilns in Gorakhpur
1 No. Of brick kilns 228
2 Capacity 19952 Bricks/day (for 228 kilns)
3 Fuel used Coal
4 Quantity of fuel used 909.8 MT/day (for 228 bricks)
5 Converted to zig-zag 78
6 Consent status Granted-163, Not Applied-65
a) Emission Estimation for Brick Kilns
For the emission estimation calculation, Brick kilns within the city periphery and in the
Northwest downwind direction of Gorakhpur district are taken into consideration. The
graphical representation in Fig 28 schematically shows the pollutant emission from
considered Brick kilns in Gorakhpur district:
Figure 28: Emission Load from Brick Kilns in Gorakhpur

46 | P a g e
i. Observations The order of pollutant emission is observed as NOx > PM10 >SO2 >PM2.5 which shows
that Brick Kilns are the potential contributor of pollutants in Gorakhpur city. Nitrogen
oxide (NOx) emissions in brick making mainly originate from the oxidation of nitrogen
in the atmosphere by burning (high temperature) which depends mainly on chemical
reactions and not much on direct emissions. Higher PM10 and SO2 level is a result of
incomplete combustion of fuel, use of Sulphur rich coal and biomass. The quantum of
the dust evolved from non-chimney sources in the brick kiln area is very high. These
runaway clouds of dust at the site contribute to the low visibility conditions in and
around the brick kilns. The releases of toxic substances from the brick kilns are
adversely affecting soil, plants, animals, and people in their surroundings being the
most severe for brick workers.
b) Major issues of brick kilns in Gorakhpur
i. Conversion of FCBTK to Zigzag: Out of 228 brick kilns in Gorakhpur district,
only 78 brick kilns have been converted into Zigzag.
ii. Low-quality Coal: Use of low-quality coal generates more ash content, SO2
emission.
iii. Use of agricultural waste and hazardous waste as an alternate-The simple
reason behind the use of agricultural waste is its easy availability and lower
price. Apart from this, many other hazardous wastes such as carbon from tyre
pyrolysis plants, rubber waste, shredded plastics, etc., were seen being used at
few kiln sites.
iv. Fugitive emission at kiln sites - The sources of fugitive emissions are Coal
Crushing Unit, openly stored fuel, loading and unloading of bricks, dust on the
road within the premises of the kiln, rubbish stored at the kiln, and the area
where green bricks are prepared.
c) Strategy to control air pollution from Brick kiln
Based on the survey findings and analysis, the following strategy is proposed to ensure
that the kilns are constructed with a proper design that improves operational practices
and minimizes emissions.
i. Seminar and Training - District level seminars and exposure visits to Zig-Zag
kilns for brick entrepreneurs to acquaint them with the new technology. Also,
regular training programs and courses on cleaner kiln technology and their
viability will be designed and organized for kiln entrepreneurs, workers, and
technicians at institutes such as ITI, etc. Training program for the concerned
people is an essential requirement for reducing the environmental footprint of
brick kilns. In this regard, UPPCB is preparing an online training program.

47 | P a g e
ii. Capacity building of regulators - Setting up of an expert committee at the
state/district level to monitor the conversion of the kilns. SPCBs to work jointly
with other government departments and local NGOs to stop the usage of
hazardous fuels. Enforcing the construction of platform and approach ladder to
reach porthole at the chimney, to facilitate stack emission monitoring. Ensuring
covered fuel storage, water sprinkling facility concretized haul road, and use of
PPEs.
iii. Advanced cleaner Production Technology: Zig zag kilns produce more class 1
bricks at lesser coal consumption and pollutant emission than FCBTK.
Retrofitting of existing FCBTK to Zigzag kiln structure is a win-win approach for
brick entrepreneurs and the environment. There is a need to study the scope and
techno-economic aspects for implementing energy-efficient technologies like
Tunnel Kiln, Hoffman Kilns, etc.
iv. Shift toward Resource-efficient Bricks (REBs): Production of perforated and
hollow burnt clay brick synergize in saving clay and fuel, reducing manpower
requirements, and production cost. There is a need for establishing the
demand/market for resource-efficient products.
v. Control of Fugitive emission: Pavement of approach road and the road around
the brick kiln, crushing of coal in enclosed equipment/ area, covering ash layer in
the preheating zone with plastic sheet/tirpal, etc can help in controlling fugitive
emission
vi. Use of Solar energy: Machines like pug mill, crushing roller, extruder, etc can be
operated on solar energy.
vii. Improving operational practice: Adoption of single man fuel feeding process,
double-wall wicket gate closing mechanism & use of insulated feed hole cover.
viii. Use of Air pollution control device Devices: APCDs can help in controlling
stack emission of brick kilns. The particulate removal efficiency of different
designs of Gravity Settling Chamber (GSC) generally ranged from 20-63%.
E. Diesel Generator Sets (DG Sets) The DG sets are used as a backup, approximately 450 commercial DG sets are installed
in sectors such as Industries, Hotels, Banquet halls, Hospitals, and Residential
apartments in Gorakhpur city. The majority of the electricity generator sets operate on
diesel. It is assumed that DG sets operate for one hour per day (primary survey finding).
The minimum capacity corresponding to the production of the industry and stack height
has been worked out and assumed as the capacity of the DG while estimating emissions.
The unit of the activity data is KWh power generation.

48 | P a g e
a) Emission Estimation for DG sets
The calculation is based on Eq (1), where ER, overall efficiency reduction was taken as
zero. The CPCB (2011) emission factors were used for emission estimation. The total
emissions from DG sets are shown in Figure 29, as follows:
Figure 29: Emission Load Estimation for DG sets
i. Observations The emission for NOx was observed to be highest from DG set sources. It is due to the
use of Diesel as the only source of fuel. The percentage emission of various pollutants
from various sectors i.e., Industrial DG sets, Hospital DGs, Apartments DG sets, hotels,
and banquet hall DG sets is given in figures 30, 31, 32, and 33.

49 | P a g e
Figure 30: PM10 Emission from DG sets
Figure 31: PM2.5 Emission from DG sets

50 | P a g e
Figure 32: SO2 Emission from DG sets
Figure 33: NOx Emission from DG sets

51 | P a g e
From the above doughnut charts, it can be concluded that major emission through DG
sets is from industrial sources which further increases the contribution of Industries as
major point source pollutants.
b) Measures to control emission from DG sets
i. Central Pollution Control Board (CPCB), has been regulating emissions from
diesel generators at the manufacturing stage (through product certification)
since 2005.
ii. Besides manufacturing reforms, better operational and management practices
are essential to maintain the performance of DG sets. Inadequate operational and
management practices like Poorly maintained fuel injection pump, Faulty nozzle,
blocked fuel filters, improper cooling water circuit, loading below optimal,
reduction in the air-fuel ratio(higher air intake temperature) due to poor cross
ventilation, etc. should be timely addressed and resolved to control high fuel
consumption and pollutant emission.
iii. Installation of a retrofitted emission control system in DG sets will also help in reducing emission load.
Figure 34: DG sets at (a) Orion mall (left), (b) Riaz hospital (right) in Gorakhpur city
ORION MALL
26°44'59.02"N 83°24'2.77"E
RIAZ HOSPITAL
26° 44' 55'' N 83° 23' 41'' E

52 | P a g e
F. Hot-Mix Plant Emission Estimation Hot mix asphalt is used primarily as paving material and consists of a mixture of
aggregate and liquid asphalt cement, which are heated and mixed in measured
quantities.
Hot mix asphalt plants have two major categories of emissions: ducted sources (those
vented to the atmosphere through some type of stack, vent, or pipe), and fugitive
sources (emitted directly from the source to the ambient air). The major sources of air
pollution in the hot-mix asphalt are (i) drier, and (ii) bitumen heating tanks. To get a
proper heating effect to the aggregate in the drier, a draft is created by providing an
induced draft (ID) fan. This operation emits particulate matter (PM) and a variety of
gaseous pollutants.
Other emission sources found at HMA plants include storage silos which temporarily
hold the HMA; truck load-out operations, liquid asphalt storage tanks; hot oil heaters,
and yard emissions, which consist of fugitive emissions from the HMA in truck beds.
Fugitive emissions are also generated from vehicular traffic on paved and unpaved
roads, aggregate storage and handling operation.
Intending to minimize the plant’s impact on ambient air quality, air pollution control
equipment, and practices must be in place for the point as well as non-point sources of
air pollution. The operation of an asphalt plant causes the emission of many different
pollutants. The most common pollutant emitted from hot mix asphalt plants is
particulate matter (PM10).
The total Hot- Mix Plant unit present in the Gorakhpur district is 10, given in the Table-
16, out of which only 7 are operational. Among these hot mix units, V/Y Khand, PWD,
Gorakhpur is operational within the bound city, while others are located in the exterior
frontier of Gorakhpur city. Data for Activity rate calculation has been collected from
UPPCB and emission factors have been obtained from CPCB (2011) have been used to
estimate the emissions from Hot- Mix Plant.
Table 16: List of Hot Mix Plants in Gorakhpur District
S.No Location & Adress of Hot
Mix
Capacity Unit Production Capacity Kg/day
Operational/Non-
Operational
1 V/Y Khand, PWD, Khorabaar, Gorakhpur
50 ton/hr 200000 Operational
2 M/S C.T Construction Badhagarh
45 ton/hr 180000 Operational
3 M/s Shakuntala Singh Near Badhagarh
45 ton/hr 180000 Operational

53 | P a g e
Jaralhi Road
4 M/s Umesh Sahi Mahabir Chapra
45 ton/hr 180000 Non-Operational
5 M/s V.S. Enterprises Near Badhagarh Jaralhi Road
45 ton/hr 180000 Operational
6 M/s Chatrashakti Infra Construction Bargadhi (Near Bhathat)
2.65 ton/batch 106000 Operational
7 M/s Ravindra Kumar Singh Kadjaha (Gorakhpur- Deoria Road)
25 ton/hr 100000 Non-Operational
8 M/s Ambey Traders Devipur, Moti Ram Adda, Gorakhpur
45 ton/hr 180000 Operational
9 M/s Harshit Enterprises Kadjaha (Gorakhpur- Deoria Road)
50 ton/hr 200000 Operational
10 M/s Ajay Associate Kutahwa, Inar, Gorakhpur
45 ton/hr 180000 Non-Operational

54 | P a g e
Figure 35: Hot-Mix Plant of Gorakhpur District

55 | P a g e
a) Emission Estimation for Hot mix plant
For emission load calculation hot mix plants within the Gorakhpur city bounds and in
range of 2 km from the city boundary are considered. The total emissions from Hot- mix
Plant is shown in Figure-36, as follows:
Figure 36: Emission Load estimation for Hot-Mix Plant
i. Observations PM10 and PM2.5 are the peak pollutant observed from Hot-mix Plant. This is due to the
emission of Particulate matter during the handling, loading and unloading process along
with emissions from the stack attached to the power sources.
b) Measures to be taken for control and abatement of air pollution
i. MoEF & CC’s notification dated 25.01.2018 has laid down dust abatement measures during construction and demolition activities, the same should be applicable for transportation, handling, and transfer of raw materials in a hot mix plant. The SOP should also be adhered to with regard to the construction of paved roads and sprinkling.
ii. The conveyance channel for feeding into the drier and bitumen tank should be closed to minimize fugitive emissions.
iii. A combination of dry scrubbing system/filters and wet scrubbing system should be installed for drier and flue gases from bitumen heating process respectively.
iv. The closed silo should be used for the addition of dust at the Wet Mix Plant to avoid fugitive emission of particulate matter.

56 | P a g e
v. Stack of at least 6 meters height should be installed. The stack should have a porthole and monitoring platform as per Emission Regulatory Guidelines (Part III) of the Central Pollution Control Board.
vi. Earlier, Furnace oil was a prominent fuel in Hot mix plants, however, after being banned by the Hon’ble Supreme Court most of the plants have switched to LDO. In order to minimize the impact, new plants should be permitted only on LPG kits, these are already being used in hot mix plants in UP-NCR cities.
vii. Preferably, a PTZ camera should be installed for purpose of remote monitoring of operations and visible emissions from the hot mix plant.
viii. Metalled road should be constructed inside the premises to avoid fugitive emission
ix. Hot mix plants should install separate energy meters for pollution control systems. x. Adequate green buffer should be maintained around the hot mix plants.
G. Emission Estimation from Domestic Sector After obtaining the total population of the city (Gorakhpur Municipal Corporation) as
per the AMRUT report and Census 2011, the emission density for the city is calculated
for different pollutants (PM10, PM2.5, SO2, NOx, and CO). Emission factors provided by
CPCB (2011) and AP-42 (USEPA, 2000) were used for each fuel type.
For emission calculation of different pollutants, emission per capita for the total
population was calculated, as activity data was available based on per capita. The fuel
usage pattern of the households for the study area (GDA) is presented in Table-17.
Table 17: Fuel Usage Pattern
Fuel Type Percent used
Firewood 9.90%
Crop Residue 1.50%
Coal/Charcoal 0.10%
Kerosene 1.70%
Cow Dung 15.80%
LPG 71%
Total 100.00%
The overall emission from domestic sources is presented in Figure-37.

57 | P a g e
Figure 37: Emission Estimation for Domestic source
a) Observation
The LPG penetration in Gorakhpur City is 71% (PPAC Primary survey on household
cooking fuel usage and willingness to convert to LPG report, 2016). PM10 emission is
observed to be the highest. This is due to the high activity rate and emission of fuel
sources such as Cow dung and firewood. This could be better understood through
emission contribution from different fuel types to different pollutants as shown in
Figures 38, 39, 40, and 41.
Gorakhpur has 110 notified and 56 not notified slums with 58237 households. They
mostly used cow dung, firewood, and coal for cooking.
More LPG penetration will help in removing the dependency on cow dung and firewood
which consequently aid in reducing pollutant emission in ambient air.

58 | P a g e
Figure 38: PM10 Emission Load from Domestic Cooking in GDA (kg/day)
Figure 39: PM2.5 Emission Load from Domestic Cooking in GDA (kg/day)

59 | P a g e
Figure 40: SO2 Emission Load from Domestic Cooking in GDA (kg/day)
Figure 41: NOx Emission Load from Cooking in GDA (kg/day)

60 | P a g e
H. Hotels and Banquet halls emission estimation (Kitchen
emissions) The primary survey was conducted by UPPCB- Regional office, Gorakhpur team to
identify the hotels and banquet halls. During the field survey, it was observed that
hotels, banquet halls, etc. use coal as fuel in tandoors. The average consumption of coal
in tandoor based on the survey was 22 kg/day. The total number of Hotel and Banquet
halls enterprise was approximately 95. The common fuel other than in tandoor is LPG.
The fuel consumption for each fuel type was estimated. In most of the cases, it was
found that there were no control devices installed at these activities. The emissions of
various parameters such as SO2, NOx, PM10, PM2.5, and CO were estimated from the
activity data from each fuel type and then were summed up in each grid cell. The
emission factors given by CPCB (2011) were used. The overall emission from the
kitchens of Hotels and Banquet halls is shown in Figure-42 and 43 respectively.
Figure 42: Emission Load from Hotels

61 | P a g e
Figure 43: Emission Load from Banquet Halls
a) Observation
The PM10 emission from cooking in Hotels and Banquets is 7.18 kg/day and 2.27kg/day
respectively.
I. Vehicular Pollution and traffic congestions
Vehicular pollution is another major issue in the city of Gorakhpur and being an old city,
the road infrastructure of the city is not optimal for the hassle-free flow of traffic and
needs strengthening. Rising vehicle count and traffic congestion severely contributed in
air pollution. Because of narrow roads as well as the increasing encroachment on the
roads created complicated traffic problems. The problem is more acute in the
Dharmshala crossing because the pukka portion is less wide on this crossing. Shahpur
crossing has the maximum carriageway. Thus, the traffic load in the city is increasing
swiftly. The width of the roads has not increased since they were constructed. At
present, national highway 28 has the highest transport pressure mainly due to
unplanned expansion of the city and urban activities along either side of the road. Apart
from these thousands of loaded trucks arrive daily in Gorakhpur from Lucknow,
Kanpur, Varanasi, Allahabad, and various parts of the U.P, Bihar, and West Bengal.

62 | P a g e
a) Major Traffic and Transportation problems in Gorakhpur
The following problems have been observed and identified by city residents, daily
commuters, and people frequently visit this city to pursue business and other affairs.
i. General Problems Related to Traffic and Transport facilities ▪ Capacity Constraint: Most of the roads have Capacity Constraint: the width or road
especially in inner built-up areas, inner cordon roads, and even at some points the
regional and outer cordon roads have lesser width/related infrastructure in context
to the traffic volume they have to bear.
▪ Inadequate Road hierarchy: Road hierarchy is not as per the acceptable level, so
the traffic movement is not smooth, the primary corridors, secondary corridors do
not follow the norms.
▪ Encroachments: Most of the roads in the area are encroached by permanent or
temporary encroachments, leading to diminution of road width and capacity. At
most of the places the hoardings, shop displays, advertising panels are placed in
ROW even on the Mettlled areas. The roads have also encroached the chajja
projections, ramps, and other civil features constructed in the row.
Figure 44: Traffic congestion due to encroachment in Gorakhpur city
▪ Mixed Traffic: Most of the roads in the city are subjected to mixed kind of traffic,
the slow, very slow, fast-moving traffic move on the same roads /traffic corridors,
due to which the average speed of city is lowered down.
▪ Traffic management: The city has very weak traffic management; the traffic is
regulated by traffic police, which is mostly untrained/not properly trained in traffic
affairs, which fails in regulating traffic.
TRANSPORT NAGAR
26°44'3.00"N 83°21'33.00"E

63 | P a g e
▪ Absence of Traffic Management Plan: No comprehensive Traffic Management
Plan is prepared for the city; the only methodology adopted is the traffic plan by
police which is done in a non-technical way.
▪ Poor road quality: The quality of roads in the inner cordon, middle cordon, and
outer cordon, as well as regional roads, is of poor quality in terms of surfacing,
gradients.
▪ Weak Traffic infrastructure: The entire infrastructure is weak to cater to the
magnitude of traffic
▪ Slow average traffic speed: The average speed of traffic in the city is very low
leading to the deterioration of efficiency of the city.
▪ Inadequate Pedestrian facilities: The Pedestrian facilities on all most all the roads
of different levels are inadequate, promoting less pedestrian but more traffic
movement
▪ Limited provision for bicycles: In the entire city provision required infrastructure
to promote cycle movement in the city is very limited
▪ The problem of informal marketing on the roadside: Hawkers, roadside
vendors, informal squatting of vegetable /grocery item vendors is a serious
problem in the city, affecting road efficiency.
Figure 45: Traffic congestion at Gorakhpur city
ii. Problems Related to Parking Issues ▪ A large number of markets, commercial and other activity centers on various roads in
Gorakhpur are suffering from inadequate parking facilities. On most of these
stretches, the root cause of the congestion on the street is caused due to on-street
parking.
RUSTAMPUR
26°44'5.00"N 83°22'7.00"E

64 | P a g e
▪ Problems of Parking, unorganized and unauthorized parking area located at
following points in the city: Golghar Chauraha, Mohaddipur, Bargadwan Chauraha,
Khajanchi Chauraha, Paidleganj-GIDA Road, Gorakhdham Mandir Road, Kudaghat,
Medical College Road, Nausad Chauk, Nanda Nagar, Dharmashala Kachehari Road,
etc.
iii. Problems Related Intersections, Round About & Junctions The detailed traffic and transportation surveys were got conducted by the
authorities and concluded that some of the intersections and crossings had several
problems leading to huge clogging of traffic and slowing down of average speed
▪ Ghantaghar Chauraha: This intersection having improper road Geometry is located
in an old commercial and residential area of Hind Bazar is one of the busiest areas in
the city leading to huge traffic at peak hours, temporary and permanent
encroachments, the problem of a huge member of roadside vendors, parking of
rikshaw, and private vehicles leading to an inefficient intersection
▪ Narmal Chauraha: This intersection is situated near Narmal School has continuous
traffic congestion due to a private taxi stand
▪ Lal Diggi Chauraha: This intersection is located in the commercial area which has a
Wholesale Commercial Centre around it, leading to an inefficient intersection.
▪ Hasiganj Chauraha: This intersection is surrounded by old commercial
establishments and so has heavy traffic. Improper road Geometry, temporary and
permanent encroachments, roadside vendors, improper parking of rickshaws,
tempos, busses, and private vehicles amplify the problem of an inefficient
intersection.
▪ Vishvidhyalaya Dakshini Chauraha: This intersection is located in NH 28 where
private buses are parked and have huge traffic.
▪ Mohaddipur Chauraha: This intersection is on NH 28, Asuran Railway Colony Road
& University Road where the internal traffic of the city meets the external traffic.
Heavy traffic in this intersection leads to traffic congestion.
▪ Malgodam Chauraha: This intersection is located near a weighbridge which
becomes the prime reason for congestion.
▪ Dharmashala Chouraha: This intersection is having huge traffic besides this it is
having improper road Geometry, there are several temporary and permanent
encroachments, the problem of roadside vendors, parking of rickshaws, private
vehicles leads to the inefficient intersection.
▪ Golghar & Indira Chauraha: This intersection is surrounded by the City’s biggest
commercial establishments so is having huge mixed kind of traffic, besides this, it has
improper road hierarchy of roads network, temporary and permanent
encroachments, roadside vendors, unauthorized and unplanned parking leads to
heavy traffic congestion and slow traffic movement
▪ Vijay Chauraha: This intersection is located at the junction of Golghar, Cinema Bazar
Aryanagar Marg, and Bank Road. It also has four Cinema Halls, big Commercial

65 | P a g e
Centers, and Banks. The road/ Carriageway width is less with inefficient Geometry,
so is having huge mixed kind of traffic often leading to traffic congestions.
▪ Bank Road Chauraha: This intersection is located at the junction of the busiest
roads of the city namely Bank Road and Bakshipur Road which is always congested
owing to the economic activities of the City.
▪ Gandhi Chauraha: This intersection is surrounded by offices of Nagar Nigam,
Gorakhpur Development Authority, Townhall and Court, etc besides it is located in
the main Commercial Area of the City. The Petrol Pump near this intersection also
adds to traffic congestion.
▪ Maya Bazar Chauraha: This is the intersection of Kotwali Road, Town Hall Road,
Reti Road, Hospital Road has two hospitals near it. This is also one of the busiest
intersections that often face the problem of traffic congestions.
▪ Tarang Humayupur Railway Crossing Chauraha: This intersection has the traffic
going towards Farenda-Nautanawa and Siddharthnagar besides the local traffic going
across the railway line. This intersection is congested during the daytime which
aggravates when the level crossing is closed for the passing of the train.
▪ Transport Nagar Chauraha: This intersection is located on NH 28 near Mandi. This
is always busy due to vehicles commuting to Lucknow-Varanasi, Gorakhpur City, and
Mandi.

66 | P a g e
Figure 46: Google Traffic map of Gorakhpur

67 | P a g e
b) Traffic Congestion points in Gorakhpur city
The following table shows the major Traffic Congestion points in Gorakhpur city:
Table 18: Major congestion points in the Gorakhpur city
S. No. Area Latitude Longitude
1 Rustampur Chauraha 26°44'5.18"N 83°22'6.86"E
2 Fal mandi chauraha 26°44'4.00"N 83°21'49.00"E
3 Maheva Mandi 26°43'58.00"N 83°21'49.00"E
4 Transport Nagar 26°44'3.00"N 83°21'33.00"E
5 Kacheri Chauraha 26°44'58.73"N 83°22'11.84"E
6 Shastri Chowk 26°44'50.47"N 83°22'8.61"E
7 Betihata Chowk 26°44'35.95"N 83°22'7.63"E
8 Civil Lines 26°44'49.48"N 83°22'23.28"E
9 Golghar Chauraha 26°45'16.40"N 83°22'19.19"E
10 University Chowk 26°45'9.41"N 83°22'51.72"E
11 Mohaddipur Chowk 26°44'58.84"N 83°23'51.51"E
12 Chandra Bose Chowk 26°44'40.23"N 83°23'7.53"E
13 Gorakhpur Bypass 26°44'48.23"N 83°15'2.96"E
14 Asuran Chowk 26°46'3.96"N 83°22'46.21"E
15 Bargadwa Chauraha 26°48'14.58"N 83°21'9.05"E
16 Khajanchi Chauraha 26°47'46.87"N 83°23'19.85"E

68 | P a g e
Figure 47: Map showing major congestion points in the Gorakhpur city

69 | P a g e
c) Emission estimation for vehicular pollution
Road lengths for major and minor roads were calculated. The information on traffic flow
from traffic counts was translated into the vehicles on the roads. The number of
registered vehicles from 2005 to 2020 was taken into account for the study according to
data provided by RTO, Gorakhpur. The emissions from each vehicle category for each
grid is estimated and summed up. The emissions from railway locomotives are not
taken into considerations, as the emissions are negligible in comparison with the
vehicles and other sources. ARAI (2011) and CPCB (2011) emission factors were used to
calculate the emissions. The emission from vehicles is shown in Figure-48 Emission
contribution of each vehicle type in the city of Gorakhpur is presented in Figures-49,
50, 51, and 52.
Figure 48: Emission estimated loads from Vehicular Exhausts (kg/day)

70 | P a g e
Figure 49: PM10 Emission Load contribution of each vehicle type in Gorakhpur city
Figure 50: PM2.5 Emission Load contribution of each vehicle type in Gorakhpur city

71 | P a g e
Figure 51: SO2 Emission Load contribution of each vehicle type in Gorakhpur city
Figure 52: NOx Emission Load contribution of each vehicle type in Gorakhpur city

72 | P a g e
i. Observations NOx emission is very high in total vehicular emission of Gorakhpur city. Heavy-duty
vehicles (HDVs)are major contributors to NOx emissions. LCVs, 2 wheelers, and HDVs
are the top three contributors to PM10 and PM2.5 whereas SO2 release is mostly from 2-
wheelers.
d) Measures to improve traffic plan and control emission
i. Proposals of Gorakhpur Master Plan 2021 Road Pattern and Typology in Gorakhpur Master Plan 2021 a total of 2.07% of land i.e.,
117 hectares of land was earmarked for Transportation Land Use. The major
recommendations of Gorakhpur Master Plan 2021 regarding roads are-
▪ 100-meter-wide outer ring road
▪ Widening of all regional roads, and Fly Overs
▪ Development and enhancement of Main Intersections
▪ Establishment of Truck Stands on all external roads
▪ Development of new transport nagar
▪ Development of Inter-State Bus Terminal
▪ Development of Parking Spaces
▪ Development of Comprehensive Traffic Management Plan
▪ 45-meter-wide bypasses on Haward Bund (from Sonauli Road to NH-28)
and Malauni bund (from NH-28 Lucknow Road to Deoria Bypass Road)
▪ 30-meter-wide bypass from NH-28 Kasaya Road to Gorakhpur Pipraich
Road and Gorakhpur Maharajganj Road
▪ Development of bus stands near proposed bypass on Gorakhpur Pipraich
Road.
ii. Future Strategy A good quality Comprehensive Mobility Plan needs to be updated and implemented
with clearly defined timelines.
▪ Mobility Corridor Plan
– Missing Links
– Road capacity augmentation
▪ Public transport plan
– Mass Transit
– Fleet augmentation
– Infrastructure
– Relocation of Inter-city bus terminals
▪ Non-motorized transport plan
– Footpath
– Grade separated pedestrian crossing
– Dedicated Cycle track
▪ Freight management plan
▪ Parking management plan

73 | P a g e
▪ Nallah corridor plan
▪ Short term traffic improvement measures
iii. Fuel improvement Use of alternative fuel cleaner than gasoline and diesel in vehicles like CNG, LPG,
electricity, ethanol-blended fuel, etc. will immensely aid in pollutant control emitted
from vehicles.
iv. Vehicle Fitness Regular checks on vehicle fitness and write-off of old unfit vehicles will reduce the
pollutant emission in ambient air.
J. CONSTRUCTION AND ROAD DUST Road dust and dust arising from construction and demolition (C&D) are the major
contributors to the pollution in Indian cities. According to the CSE report, India recycles
just 1% of its construction and demolition (C&D) waste.
The construction upswing across Gorakhpur city is a boon for city development but the
air quality monitoring data reveal that it has deteriorated the air quality of the city.
The potential control options are sweeping and watering of roads, better construction,
and maintenance, growing plants, grass, etc., to prevent re-suspension of dust. City-
specific plans need to evaluate the options of mechanical sweeping, greening, and
landscaping of the major arterial roads, identification of major-impact roads, including
national highways, etc. Spraying of water twice per day (before peak hours of traffic) is
very effective in reducing air-borne dust load. Grassing of open spaces with native
grasses also prevent dust pollution and clean air. The mechanical sweepers were
introduced in the State as manual sweeping by brooms blow more dust particles in air
than it cleans off the ground. The State has now more than 25 mechanical sweepers,
which keeps the road free of dust. At present, the dust collected is mostly taken to the
landfill sites and dumped. When the wind blows, these particles return to the city
rendering the entire sweeping process ineffective. Even a light wind is able to raise a
dust storm if the dumped dust is not dampened with water or have a green cover over
it. There is no proper mechanism or standard operating procedure (SOP) on how to
dump the dust collected so that they do not return to the city after disposal. The
government has notified Construction & Demolition (C&D) Waste Management Rules,
2016, which had been an initiative towards effectively tackling the issues of pollution
and waste management. The basis of these rules is to recover, recycle, and reuse the
waste generated through C&D. Segregating C&D and depositing it to the collection
centers for processing is now be the responsibility of every waste generator. Local
bodies are to utilize 10%–20% material from C&D waste in municipal and government
contracts. It was noted that there was no regulation prescribing preventive measures to
be taken for the management of dust, including road dust and C&D dust that arises
during construction. Taking note of the increasing air pollution and to keep dust
material under control in towns and cities, the MoEF&CC has issued a Dust Mitigation

74 | P a g e
notification in January 2018 under EPA, 1986; making mandatory dust mitigation
measures in infrastructural projects and demolition activities in the country. This would
help to keep the dust under control to reduce air pollution in metros and cities. The
notified rules inserted 11-point measures in the existing act, thereby empowering the
ministry to issue notices against local authorities and state agencies for non-
implementation of those actions.
a) Road Dust
Road Dust has been acknowledged as an important source of urban Air Pollution. Traffic
related non-exhaust particulate sources and road dust are an increasingly important
source of PM10 and PM2.5 Air Pollution. Except from being emitted directly to the air,
non-exhaust particles deposit and accumulate together with dust from other sources on
road surface to form road dust. The particles deposited on the road surface originate
from direct emission from vehicles tail pipe, particles emitted by tyre and break wear
process and particles that settle on the road from both nearby and distance sources.
Dust deposition or in the vicinity of the roads may be re-entrained, or re-suspended into
air through vehicle induced turbulence and shearing stress of tires, increase air
pollution. The amount of this dust that is generated and then re-settles on the road
surface depends on various factors including traffic speed, vehicle weight, local road
conditions and rainfall. The strength and direction of the wind is a highly influential
factor on its transportation. This action is present on both paved and unpaved roads.
The coarser fraction has local road safety, agricultural and environmental impacts on
travelers and on residents near unpaved roads. It is highly likely that impacts of long-
term exposure to dust experienced by children and adults living close to and travelling
regularly along unpaved roads will be additive to the high concentration levels from
exposure to other sources of particulates (biomass fuels) that cause the 1.5 – 2.0 million
premature deaths amongst mostly women and children in developing countries.
To quantifying deposition of total dust and dust particle up to 75 microns on the roads,
Regional Office, U.P. Pollution Control Board, Gorakhpur has carried out monitoring
of total dust load and dust particles up to 75 microns (Aerodynamic particles size) on
certain selected roads of Gorakhpur city.
i. Monitoring Locations Roads selected for dust monitoring are as follows:
▪ Gorakhpur-Lucknow road, near Dana-Pani Restaurant GIDA, Gorakhpur.
▪ Kali mandir Shashtri chowk road, near Jal-kal building, Golghar, Gorakhpur.
▪ Gorakhpur-Maharajganj road, near Khajanchi chauraha, Gorakhpur.
▪ Gorakhpur-Sonauli road, near Bargadwa chauraha, Gorakhnath, Gorakhpur.
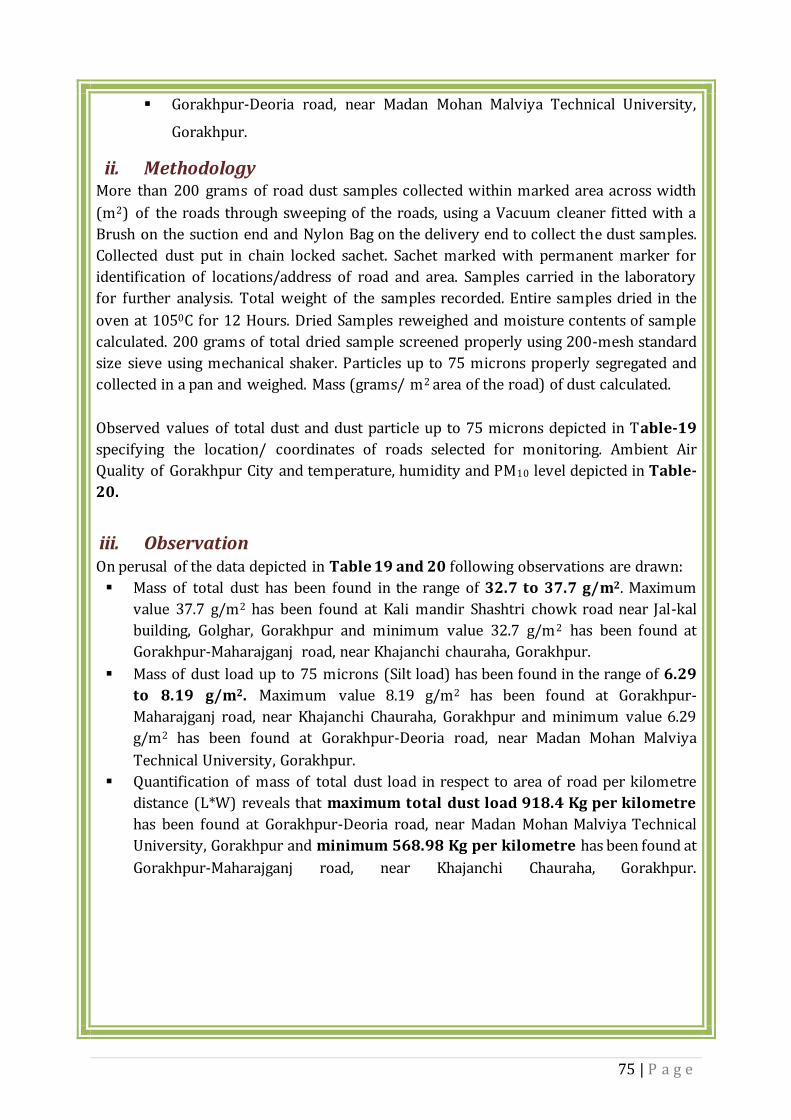
75 | P a g e
▪ Gorakhpur-Deoria road, near Madan Mohan Malviya Technical University,
Gorakhpur.
ii. Methodology More than 200 grams of road dust samples collected within marked area across width
(m2) of the roads through sweeping of the roads, using a Vacuum cleaner fitted with a
Brush on the suction end and Nylon Bag on the delivery end to collect the dust samples.
Collected dust put in chain locked sachet. Sachet marked with permanent marker for
identification of locations/address of road and area. Samples carried in the laboratory
for further analysis. Total weight of the samples recorded. Entire samples dried in the
oven at 1050C for 12 Hours. Dried Samples reweighed and moisture contents of sample
calculated. 200 grams of total dried sample screened properly using 200-mesh standard
size sieve using mechanical shaker. Particles up to 75 microns properly segregated and
collected in a pan and weighed. Mass (grams/ m2 area of the road) of dust calculated.
Observed values of total dust and dust particle up to 75 microns depicted in Table-19
specifying the location/ coordinates of roads selected for monitoring. Ambient Air
Quality of Gorakhpur City and temperature, humidity and PM10 level depicted in Table-
20.
iii. Observation On perusal of the data depicted in Table 19 and 20 following observations are drawn:
▪ Mass of total dust has been found in the range of 32.7 to 37.7 g/m2. Maximum
value 37.7 g/m2 has been found at Kali mandir Shashtri chowk road near Jal-kal
building, Golghar, Gorakhpur and minimum value 32.7 g/m2 has been found at
Gorakhpur-Maharajganj road, near Khajanchi chauraha, Gorakhpur.
▪ Mass of dust load up to 75 microns (Silt load) has been found in the range of 6.29
to 8.19 g/m2. Maximum value 8.19 g/m2 has been found at Gorakhpur-
Maharajganj road, near Khajanchi Chauraha, Gorakhpur and minimum value 6.29
g/m2 has been found at Gorakhpur-Deoria road, near Madan Mohan Malviya
Technical University, Gorakhpur.
▪ Quantification of mass of total dust load in respect to area of road per kilometre
distance (L*W) reveals that maximum total dust load 918.4 Kg per kilometre
has been found at Gorakhpur-Deoria road, near Madan Mohan Malviya Technical
University, Gorakhpur and minimum 568.98 Kg per kilometre has been found at
Gorakhpur-Maharajganj road, near Khajanchi Chauraha, Gorakhpur.

76 | P a g e
Table 19: Monitored Values of Total Dust and Dust up to 75 microns
S.No. Location with
Geo-Coordinates Location Photographs
Total Dust
(grams/m2)
Dust upto
75 microns
(grams/m2)
Average
Width
(m)
Total
Dust
(kg/km)
Dust up to
75 microns
(kg/km)
1 Gorakhpur-
Lucknow road
Near Dana Pani
Restaurant
GIDA,
Gorakhpur.
Lat.-26.75118
Long.-83.22507
34.5 7.438 18 621 133.8
2 Kali Mandir
Shashtri Chowk
Road Near Jalkal
Building Golghar
Gorakhpur.
Lat.-26.750850
Long.-83.370339
37.7 6.335 20 754 126.7
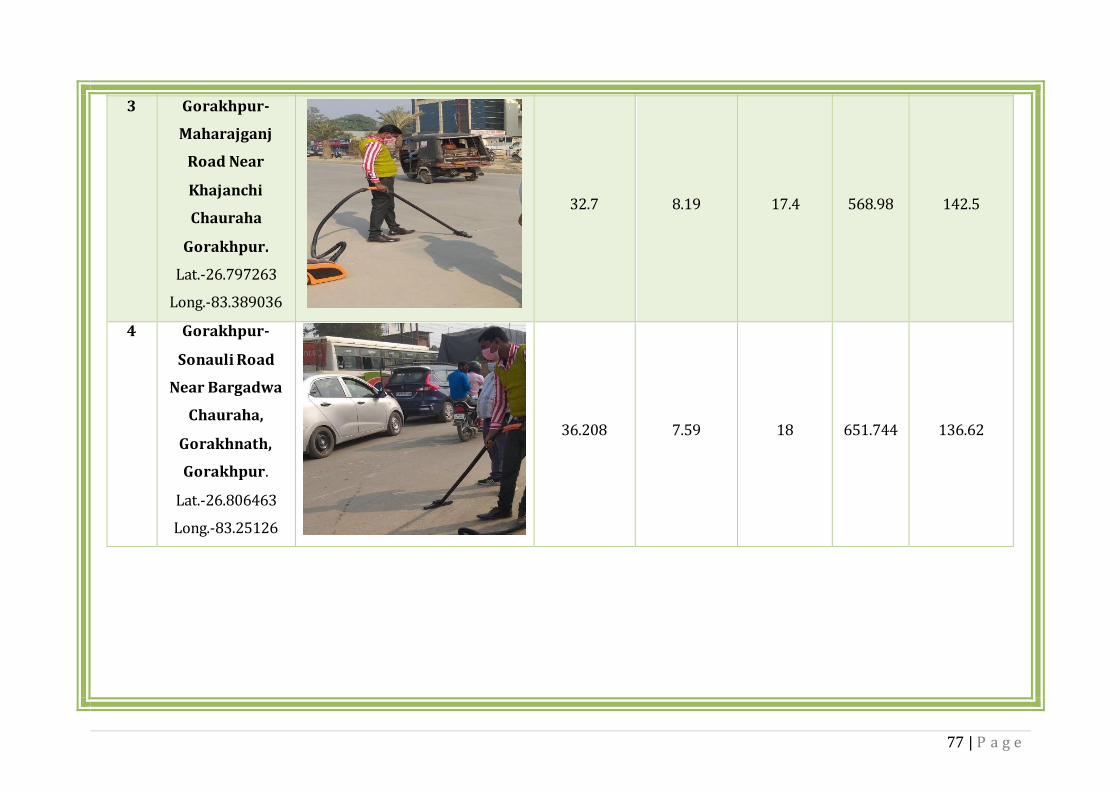
77 | P a g e
3 Gorakhpur-
Maharajganj
Road Near
Khajanchi
Chauraha
Gorakhpur.
Lat.-26.797263
Long.-83.389036
32.7 8.19 17.4 568.98 142.5
4 Gorakhpur-
Sonauli Road
Near Bargadwa
Chauraha,
Gorakhnath,
Gorakhpur.
Lat.-26.806463
Long.-83.25126
36.208 7.59 18 651.744 136.62

78 | P a g e
5 Gorakhpur-
Deoria Road
Near Madan
Mohan Malviya
Technical
University,
Gorakhpur.
Lat.-26.72987
Long.-83.43112
32.8 6.29 28 918.4 176.12

79 | P a g e
Table 20: Ambient Air Quality Monitoring details during Dust Collection at of Gorakhpur City
Source- Manual Monitoring
b) Emission Inventory of road Dust
Dust emissions from paved and unpaved roads have been found that these vary with the
‘silt loading’ present on the road surface and average weight of vehicles travelling on the
road. The term silt loading (sL) refers to the mass of the silt-size material (equal to or
less than 75 μm in physical diameter) per unit area of the travel surface. The quantity of
dust emissions from movement of vehicles on a paved or unpaved road can be
estimated using the following empirical expression:
Where-
E: Particulate Emission Factor (same units as “k”)
sL: silt load (g/m2)
W: Mean Weight of the Vehicle fleet (Tons)
k: Constant (function of particle size) in g VKT-1 (Vehicle kilometer Travel) (e.g., k
= 0.62 for PM10 and k=0.15 for PM2.5).
S.
N
o
Date Location
Temperature
(0C)
Relative
humidity
%
Wind
Direction
Value of
PM10
(µg/m3)
1. 23.11.2020
MMM
University of
Technology,
Gorakhpur
16-28 32-58 West to
East 110.56
2. 23.11.2020
Indian Glycol
Limited,
GIDA,
Gorakhpur
17-30 30-60 West to
East 319.26
3. 26.11.2020
Jal-kal
Bhavan,
Golghar,
Gorakhpur
19-33 30-62 West to
East 203.38

80 | P a g e
The silt loads (sL) samples from major 05 roads were collected (Table-19). Then mean
weight of the vehicle fleet (W) was estimated by giving the weightage to the percentage
of vehicles of all types with their weight. Then emission rate (g VKT-1) was calculated
based on above Equation. VKT for each road was calculated by considering the tonnage
of each road. Then finally the emission loads from these roads were calculated.
A digital map showing the national & state highways, major roads are attached (Fig 53).
The municipal boundary length of the major roads, national & state highways of the city
are as follows:
Road Type Municipal Length of Road
(Km)
National & State Highway 45
Major Roads 123
In this case study following assumptions is taken in calculations for emission inventory
of PM10 & PM2.5 from road dust-
▪ As the monitoring road locations (Gorakhpur-Lucknow road, near Dana-Pani
Restaurant GIDA, Gorakhpur, Gorakhpur-Maharajganj road, near Khajanchi
chauraha, Gorakhpur, Gorakhpur-Sonauli road, near Bargadwa chauraha,
Gorakhnath, Gorakhpur & Gorakhpur-Deoria road, near Madan Mohan Malviya
Technical University, Gorakhpur) are connected with state/National highways so
the vehicle fleet pattern is taken same for them. Total length of said 04 roads are
taken as 45 Km with in the city.
▪ Road Location (Kali mandir Shashtri chowk road, near Jal-kal building, Golghar,
Gorakhpur) is internal road of Gorakhpur city so total length of said road is taken
as 123 Km with in the city.
▪ Average emission rate of PM10 & PM2.5 from road dust in Kg/Km/Day by 05
monitored road are taken for calculation of city level emission rate (Ton/Day).

81 | P a g e
-Figure 53: Location map of roads in Gorakhpur city

82 | P a g e
Table 21: Observed Values of Silt Load (sL), Mean weight of the vehicle fleet (W) & Emission Rate of PM10 (Kg/Km/Day) & PM2.5 (Kg/Km/Day) from road dust in Gorakhpur city
S.
No
.
Location with
Geo-
Coordinates
Location Photographs
Silt Load
sL
(gm/m2)
Mean
Weight of
the Vehicle
fleet (W)
(Ton)
Emissio
n Factor
for PM10
(gm/VK
T)
Total
Emission
of PM10
(kg/Km/
day)
Emission
Factor for
PM2.5
(gm/VKT
)
Total
Emission
of PM2.5
(kg/Km/d
ay)
1 Gorakhpur-
Lucknow road
near Dana-
Pani
Restaurant
GIDA,
Gorakhpur.
Lat.-26.75118
Long.-
83.22507
• 7.43 • 3.99 • 15.82 • 484.77 • 3.82 • 117.28

83 | P a g e
2 Kali Mandir
Shashtri
Chowk road
near Jal-kal
Building
Golghar
Gorakhpur.
Lat.-
26.750850
Long.-
83.370339
• 6.33 • 0.89 • 2.98 • 88.97 • 0.72 • 25.52
3 Gorakhpur-
Maharajganj
road near
Khajanchi
Chauraha
Gorakhpur.
Lat.-
26.797263
Long.-
83.389036
• 8.19 • 3.99 • 17.27 • 529.18 • 4.17 • 128.02

84 | P a g e
4 Gorakhpur-
Sonauli Road
Near
Bargadwa
Chauraha,
Gorakhnath,
Gorakhpur.
Lat.-
26.806463
Long.-
83.25126
• 7.59 • 3.99 • 16.11 • 493.78 • 3.89 • 119.46
5 Gorakhpur-
Deoria road
near Madan
Mohan
Malviya
Technical
University,
Gorakhpur.
Lat.-26.72987
Long.-
83.43112
• 6.29 • 3.99 • 13.58 • 416.18 • 3.28 • 100.69

85 | P a g e
Table 22: City Level Emission Rate of PM10 (Kg/Day) & PM2.5 (Kg/Day) from road dust in Gorakhpur city
Road Type Municipal
Length of
Road
(Km)
Average
PM10
(Kg/Km/Day)
Average
PM2.5
(Kg/Km/Day)
Emission
Rate
PM10
(Ton/Day)
Emission
Rate
PM2.5
(Ton/Day)
National & State
Highway
46 480.98 116.36 22.12 5.35
Major Roads 123 88.97 25.52 10.94 3.14
City Level Emission Rate 33.07 8.49

86 | P a g e
Figure 54: Emission load for road dust in Gorakhpur city(kg/day)
c) Measures to control Road dust
The strategy for control of road dust include-
i. Edge to edge paving/greening, Road shoulder (unpaved part) should be covered
with interlocking tiles or grass.
ii. Water sprinkling on unpaved roads
iii. Making the roads pothole free
iv. Roads should be regularly cleaned using mechanical sweeping machines and
collected dust should be dumped at proper place, so that it could not deposit
again on the roads
v. Night washing of the paved roads using treated sewage from STPs.
vi. Regular monitoring of the dust load on the road and its effective removal
vii. Ensuring that the building material is fully covered while transporting
viii. Wheel washing
ix. Ensuring no C & D Waste stored on the road side
x. Evolve SOP for addressing the specific issue of disposal of collected dust from
mechanical sweeping, taking into consideration all the above cited factors.
xi. Stringent implementation of C&D Rules, 2016, and Dust Mitigation notification,
2018, of Government of India.
xii. Whenever, road washing is not possible, dense sprinkling through treated
sewage mixed with dust suppressant should be done regularly.

87 | P a g e
xiii. Continuous operation of fountains at main roads crossing and parks should be
done regularly.
xiv. Anti-smog guns should be installed at main hot spot areas.
d) Construction and Demolition Dust
The emission factors given by AP-42 (USEPA, 2000) were used for estimating the
construction and demolition emissions. The major construction activities include
buildings (including residential housing and apartments) and flyover development. The
areas under construction activities were calculated based on data from UPPCB- regional
office, Gorakhpur, and Google Earth. Total emissions from construction and demolition
activities are presented in Table-23 and Figure-55.
Table 23: Classification of Construction Activities Emission Load (kg/day)
S.No Particulars PM10 PM2.5
1 Building Construction 18895.93 7558.37
2 Flyover/Road Construction 7689.94 3075.98
Total 26585.87 10634.35
Figure 55: Emission Load from Construction and Demolition activities

88 | P a g e
The details are listed in the table below and depicted in the map below:
Table 24: Details of ongoing construction projects
S No Construction site Latitude Longitude Type of
construction
1 LIG Building Part A 26°49'11.86"N 83°23'5.06"E Residential
Project
2 LIG Building Part B 26°49'12.09"N 83°23'8.69"E Residential
Project
3 LIG Building Part C 26°49'9.75"N 83°23'12.74"E Residential
Project
4 Lake View Vistar
Building 26°43'39.36"N 83°23'24.00"E
Residential
Project
5 Multiplex parking 26°45'7.92"N 83°22'12.00"E Parking
6 Mahadev
Jharkhandi 26°44'47.00"N 83°24'52.00"E
Residential
Project
7 AIIMS Gorakhpur 26°44'47.00"N 83°25'14.00"E Hospital
8 Near Nauka Vihar 26°43'24.00"N 83°23'48.00"E Residential
Project
9 Gorakhpur Zoo 26°42'45.00"N 83°24'26.00"E Recreational
construction
10
Gorakhpur-
Maharajganj-
Nichlol (11 Km
strech)
26°46'4.77"N 83°22'47.03"E Flyover
Construction 26°49'3.57"N 83°24'2.90"E
11
Gorakhpur-
Maharajganj-
Nichlol (08 Km
strech)
26°49'25.70"N 83°24'30.46"E Flyover
Construction 26°53'49.09"N 83°29'15.04"E
12
Sonauli Nautanva-
Gorakhpur- Deoria-
Balia Road
26°41'42.00"N 83°28'53.87"E Flyover
Construction 26°38'31.49"N 83°35'21.73"E
13 Nagar Nigam Sadan Bhawan
26.44'51'' N 83.22'5''E Building Work
14 Pond beautification
in jharna Tola 26.75'84''N 83.41'41''E
Pond
Beautification
15
Chatth Mata mandir
Pond beautification
in Mahuisudharpur
26.72'86''N 83.36'99''E Pond
Beautification
16 Pond beautification
in Gadariya 26.78'55''N 83.38'33''E
Pond
Beautification

89 | P a g e
tola/Khatik tola in
Basaratpur
17
Pond beautification
in Chilmapur in
Rustampur
26.43'39''N 83.22'21''E Pond
Beautification
The locations of the construction sites as shown in the map reveal valuable information
that all the construction sites are in close vicinity of the monitoring stations. The status
of the adoption of dust control measures in the construction sites of Gorakhpur is very
poor. This explains the sharp increase in the PM10 levels in the monitoring data from
2017 onwards as most of the construction projects started from 2019 onwards. The
control of construction dust shall be a major challenge and will have to be taken as one
of the high priority actions in this Action Plan.
e) Dust emission from Railway siding
Railway siding in Gorakhpur is identified as high dust generating spot. The major causes
of air pollution in this area near are siding, garbage fires, vehicular pollution, wind-
blown dust through unpaved roads and over burdens traffic congestion in the area.
The height of material stack within storage areas must be kept below the height of the
boundary wall. Three tire plantations all along the boundary wall and other available
space at Railway Siding will be effective as dust barriers.
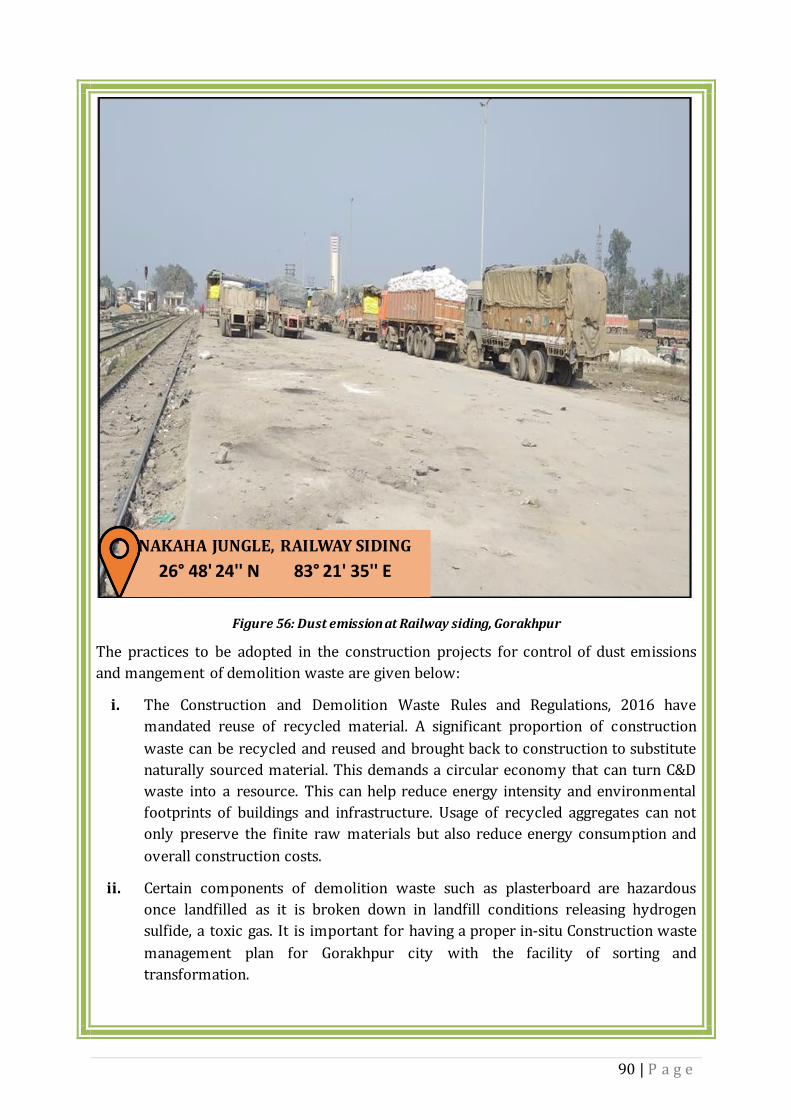
90 | P a g e
Figure 56: Dust emission at Railway siding, Gorakhpur
The practices to be adopted in the construction projects for control of dust emissions
and mangement of demolition waste are given below:
i. The Construction and Demolition Waste Rules and Regulations, 2016 have
mandated reuse of recycled material. A significant proportion of construction
waste can be recycled and reused and brought back to construction to substitute
naturally sourced material. This demands a circular economy that can turn C&D
waste into a resource. This can help reduce energy intensity and environmental
footprints of buildings and infrastructure. Usage of recycled aggregates can not
only preserve the finite raw materials but also reduce energy consumption and
overall construction costs.
ii. Certain components of demolition waste such as plasterboard are hazardous
once landfilled as it is broken down in landfill conditions releasing hydrogen
sulfide, a toxic gas. It is important for having a proper in-situ Construction waste
management plan for Gorakhpur city with the facility of sorting and
transformation.
NAKAHA JUNGLE, RAILWAY SIDING
26° 48' 24'' N 83° 21' 35'' E

91 | P a g e
iii. All areas for storing C&D wastes/construction material to be demarcated and
preferably barricaded particularly those materials that have the potential to be
dust borne.
iv. Use of demolition waste as a raw material in the brick-making as a substitute for
fertile soil.
v. Fine material, such as sand, dust, etc. can be used as cover material over the
sanitary landfill.
vi. Wet suppression is the most convenient method for controlling construction
dust at the site.
vii. Speed of transportation vehicle at the construction site must be minimized to
avoid fugitive emission.

92 | P a g e
Figure 57: Construction Sites in Gorakhpur city

93 | P a g e
The practices to be adopted in the construction projects for control of dust emissions
are given in the table below- Table 25: Details of practices to be adopted for control of construction dust
Field Practices to Reduce Emissions
Treated Water
Application
Applying treated water to mitigate dust generation on the
construction site. (Water can be applied by a variety of
methods, for instance, Anti-Smog Guns, trucks, water pulls,
water cannons, hoses, fire hydrants, sprinklers, etc.)
Dust
Suppressants
Use of dust suppressants: (i) liquid polymer emulsions (ii)
agglomerating chemicals (e.g., lignosulfonates,
polyacrylamides); (iii) cementitious products (e.g., lime-
based products, calcium sulphate); (iv) petroleum-based
products (e.g., petroleum emulsions); and (v) chloride salts
(e.g., calcium chloride and magnesium chloride).
Design Designing the layout of the construction site to minimize
fugitive dust generation potential, including access roads,
entrances and exits, storage piles, vehicle staging areas, and
other potential sources of dust emissions.
Use of pre-fabricated materials and modular construction
units.
Minimize distances traveled for delivery of materials
Site Preparation Utilize wind fencing around the site
Use of scaffolding sheets/nets for dust control
Stabilize completed earthworks with
stone/soil/geotextiles/Vegetation/compacting
Reduce certain activities during windy conditions
Storage Piles Utilize enclosures/coverings for storage piles e.g. tarpaulins,
plastic, agrished nets, or other material
Utilize wind fences/screens for storage piles
Storage pile activity (Loading & unloading) should be
conducted downwind
Properly shape storage piles so that they do
not have steep sides or faces. Besides, sharp
changes of shape in the final storage pile should be
avoided.
Properly schedule the delivery of landscaping materials to
minimize the storage time on site
Vehicles and
Equipment
PUC Certificate for vehicles used for transport of materials
Covering of building material during transportation

94 | P a g e
Ensuring adequate stack height and acoustic enclosures for
DG Sets
Material
Handling &
Transfer Systems
Remove material from truck underbodies and tires prior to
leaving the site as well as implement techniques to
periodically remove mud/dirt track out/carryout from paved
streets at the access point(s).
Prevent PM emissions from spills
Capture fugitive dust emissions
Ensuring proper collection, Segregation and disposal of C& D
Waste and maintenance of log book for disposal
Minimize material drop height at the transfer point and
ensure enclosure around transfer point
Road Surfaces Surface improvements to unpaved road surfaces
Proper maintenance of unpaved roads
Fabrication Applying water spray in conjunction with cutting, grinding &
drilling
Apply wet process for Sand and grit blasting and façade
cleaning
Ensure Mixing processes in enclosures
Dust suppression/collection equipment should be
attached when using sanding and cutting machinery.
In addition, vacuum cleaning should be used
whenever possible.
Monitoring Installation of display board in Construction site mentioning
the Details of statutory environmental clearance, Name,
address, contact no. & email of Site In charge and owner
Installation of PTZ Camera with open access to UPPCB
Whether internal daily Monitoring Protocols Developed
Daily Monitoring Spreadsheet and status of Monitoring
UPPCB has developed an online system of Self Declaration of Dust Control Audit
dustapp.upecp.in for construction projects through which every construction project
has to self-declare online status of dust mitigation measures in the project. The
objective is to guide the project proponents and their site in charges, the relevant dust
control measures to be taken up on one side and enthuse in them the system of self-
auditing. This declaration will also be periodical so that the shortcomings in the dust
mitigation measures may be addressed and declared by the projects. Besides this,
UPPCB has also issued directions under the provisions of Air Act for installation of Pan
Tilt Zoom Cameras in the construction projects and providing its open access to UPPCB
so that 24x7 virtual monitoring may be done from the UPPCB end.

95 | P a g e
Figure 58: Construction site in Gorakhpur city
K. Management of Solid Waste and garbage burning
a) Municipal Solid Waste (MSW) Burning emission estimation
Open burning activities are broadly classified into refuse and biomass burning. The
refuse or municipal solid waste (MSW) burning depends on solid waste generation and
the extent of disposal and infrastructure for collection. The contribution of MSW
burning may surprise many persons. It is a myth that MSW is not burned in Gorakhpur.
This emission is expected to be large in the regions of economically lower strata of the
society which do not have proper infrastructure for the collection and disposal of MSW.
The emission factors given by CPCB (2011) and AP-42 (USEPA, 2000) were used for
estimating the emission from MSW burning using the same procedure of emission
density in city w.r.t total population. There is one unauthorized dumping area in Akla
Bandh, Near Rajghat, and Gorakhpur. The emissions from MSW burning are presented
in Figure-58.
MAHADEV JHARKHANDI 26°44'47"N 83°24'52"E

96 | P a g e
Figure 59: Emission Estimation for MSW Burning
b) Status and Gaps in MSW management
Gorakhpur, a low-lying and bowl-shaped city of Eastern Uttar Pradesh, is rich in cultural
heritage and historical importance. At present, the municipal corporation Gorakhpur
(MCG) has no solid waste management system in place. The whole solid waste
generated is being disposed of either along the roads or are being used as landfilling
material. It was found that daily on an average per capita solid waste generation from
the residential area of the city is about 0.6 kg. The total quantity of waste generation in
Gorakhpur is about 402TPD out of which only 350 TPD is being addressed. Household
and commercial waste comprises the maximum percentage of solid waste generated.
According to a study conducted on MSW in Gorakhpur, only 44.73% of total solid waste
is of biodegradable nature. The recyclable waste (polyethylene, plastic, paper cartoon)
which account 13.97% of total waste are often segregated manually by rag pickers. It is
very necessary to know the future amount of solid waste generation because of
technological development which is required to handle these wastes in an efficient
manner.
The waste collected from one area is generally dumped in another, especially the low-
lying water logging prone areas. The poorly maintained older landfill sites are silently
contaminating the groundwater due to leachate production, but there is not much
awareness about this. A lot of the waste is left piled up by the roadside to fall back into
the drains. Ninety percent of the city's drains are not covered. Most of these drains are

97 | P a g e
along the roads. Doorstep collection is done in only in 10 out of the 206 colonies of the
city, but the collection is not very regular. There are municipal solid waste collection
points (Kura Garh) in 40 locations. The major markets and commercial establishments
too contribute their share to this chaos of solid waste mismanagement.
According to the GMC, the city's 15 main commercial markets contribute about 30
tonnes per day of solid waste. Then there are the mixed zones comprising commercial
(shops and markets) residential areas. Some 530 of them are used as small and medium
vegetable, fruit and fish markets in the residential area. The Mahewa market is one of
the biggest markets for vegetable, fruits and fish. The total waste generated by these
markets is estimated to be about 10 tonnes per day. In the markets too, the system of
primary collection proves ineffective as wastes are dumped by the generators on the
streets/ roads. Water bodies in an around the city are under increasing threat due to the
lack of a regular dumping ground. Garbage is dumped near the Chilua Tal, Maheva,
Domingarh and many other low-lying areas. Refuse is thrown on the roadside in many
of these places, sometimes set aflame or dumped into the fields. The Chilua Tal, a fresh
water lake that ultimately drains into the Rohin river, is getting affected because of this.
The Rohin too is getting affected. Solid wastes are also dumped into the area aside the
Rapti river.
In Gorakhpur city both centralized and decentralized solid waste management are being
practiced. The centralized waste management waste is not collected in efficient manner
which results in overflowing garbage bins at the public collection site. One of the
obvious advantages of a decentralized system is the improved aesthetic and hygiene
condition in the locality. For cities like Gorakhpur, decentralized solid waste
management will be more useful. Directly proportional to population increase, the solid
waste problem has become one of the prime concerns for the city Government. The
efficient collection of waste reduces the overflowing and sanitary conditions. In this
regard a more efficient utilization of scientific invention for sustainable handling of the
waste is required.

98 | P a g e
Figure 60: Municipal Solid waste dump site
c) Proposed plan for Solid Waste Management
Solid waste management facility of 240 TPD capacity is proposed to be installed and
commissioned by December 2020. In addition, Material Recovery facility is also
proposed by December 2020.
d) Details of legacy waste dumping site
Due to huge gap in the generation and treatment of MSW, the problem of legacy
waste is very serious in Gorakhpur City. This necessitates the strict vigil in on
burning of MSW by the Nagar Nigam and UPPCB as a short-term measure. The
Municipal Corporation must take up the establishment of MSW Treatment facility
on war footings. As per future plan, the remediation of legacy waste shall be completed
within 02 years.
NEAR MAHESHRA TAL
26049’26” N 83021’3” E

99 | P a g e
Table 26: Details of legacy Waste dumping Sites in Gorakhpur
S.No
.
District Name of
Dumping site
Legacy/ Current
Estimated quantity of
MSW (TPD)
Name of ULB/ Pancha
yat
Disposal Plan
(Yes/ No)
1 Gorakhpur
Mahesara
Jungle Hakim
No. 1, Gorakhpur
Legacy 231340
Nagar Nigam, Gorakh
pur
No
2 Gorakhpur
Akala Bandh,
Nausad, right
bank of
riverRapti, Gorakhpur
Legacy 150000
Nagar Nigam, Gorakh
pur
No

100 | P a g e
Figure 61: GIS map showing the Location of MSW treatment & dumpsites

101 | P a g e
Figure 62: Solid Waste Dump Site(unauthorized) at Akla Bandh, Gorakhpur
L. Greening & Afforestation Population growth, climate change, resource depletion, pollution, and urbanization are
all major global challenges facing humankind and nowhere more than in our cities. The
quality of our urban environments is particularly at risk and vulnerable. As we move
towards a more sustainable future cities must adapt to and address these contemporary
challenges.
The role of green infrastructure in addressing the challenges of the 21st century cannot
be underestimated. It is a natural, service providing infrastructure that is often more
cost-effective, more resilient, and capable of meeting social, environmental, and
economic objectives than ‘grey’ infrastructure.
The growth of future cities depends upon how well we can plan for the ‘unplanned’. The
generic theme evolving is that as cities expand, the ‘informal’ sector grows faster than
the ‘formal’ sector. This means that our plans will need paradigmatic change to deal
with the heterogeneous housing and mobility needs of growing city populations. We
will have to plan spaces for activities that cannot always be well-defined and predicted.
It is better to plan for what is inevitable than to turn a blind eye to the future.
AKLA BANDH, GORAKHPUR
26°43'43.43"N 83°20'38.18"E

102 | P a g e
In many cases a substantial transformation of city environments will be required to
create effective Green Infrastructure and achieve a better balance between green and
grey. However, by recognizing nature as an opportunity for an effective solution and by
realizing that Green Infrastructure can be integrated and linked into existing and future
built developments in an attractive way, the potential is there to create more livable
cities with reducing impact of air population in particular on the people living in the
Cities.
Urban particulate air pollution is a serious health issue. Green Infrastructure including
trees within cities can remove fine particles from the atmosphere and consequently
improve air quality and human health. Tree effects on PM2.5 concentrations and human
health have been modeled and it has been found that the total amount of PM2.5
removed annually by trees varied from 4.7 tonnes to 64.5 tonnes, with annual values
varying from $1.1 million in Syracuse to $60.1 million. Most of these values were from
the effects of reducing human mortality.
a) Green Infrastructures
“Green infrastructure” is defined as open spaces, natural areas, urban woodland and
parks; green streets, squares and public realm; sustainable drainage systems and
healthy waterways, cycle ways and pedestrian routes within our city environments; and
smaller scale green roofs, walls and facades. It has got following benefits-
Table 27: Benefits of Green Infrastructure
Environmental
Benefits
Economic Benefits Social Benefits
Improved Visual Amenity
Increased Property Prices Encouraging Physical Activity
Enhanced Urban Microclimate
Increased Land Values Improving Childhood Development
Improved Air Quality
Faster Property Sales Improved Mental Health
Reduced Flood Risk Encouraging Inward Investment
Faster Hospital Recovery Rates
Better Water Quality
Reduced Energy Costs via Microclimate Regulation
Improved Mental Health
Improved Biodiversity
Improved Chances of Gaining Planning Permission
Improved Workplace Productivity
Reduced Ambient Noise
Improved Tourist and Recreation Facilities
Increasing Social Cohesion
Reducing Atmospheric CO2
Lower Healthcare Costs Reduction in Crime

103 | P a g e
b) Types of GIs
The following types of Green Infrastructures have been developed in the Cities
across the world under different initiatives. However, this list is not exhaustive-
i. Miyawaki Forests
ii. Urban Forests
iii. Bio-diversity Parks & Wetlands
iv. Green Belts
v. Green Pavements
vi. Vertical Gardens & rooftop green houses
vii. Rooftop Greens
viii. Multi-layered and integrated green infrastructure
ix. Green Walls
x. Sustainable drainage system to clean by nature the Road run off
xi. Water roofs to attenuate storm water flows — by storing water temporarily on a
flat roof.
xii. A pocket park: green space is valuable at all scales in the urban environment.
c) Challenges
The challenges for development of green infrastructure in particular reference to
the Non-Attainment Cities of Uttar Pradesh include-
i. Absence of baseline and mapping of spaces available for retrofitting the City with
nature
ii. Limited availability of space
iii. Know-how for development of Green Infrastructure & their SOPs
iv. Suitability of type of GI for a particular City and space available
v. Suitability of GIs on the basis of maximising the impact on air pollution and
particulate matter
vi. Interventions for future city planning without infringing the development of the
City
vii. Low-cost approach for development of suitable high impact GIs in consonance with
the 7R principle
d) Future Strategy
i. Planned retrofitting of the City and development of green
Infrastructures UPPCB intends to institute a study for developing a plan for development of Green
Infrastructures in Non-Attainment Cities of Gorakhpur along with the
environmental & economic suitability and also providing with the Standard

104 | P a g e
Operating Procedures for all type’s suitable GIs in a cost-effective manner for
overall improvement of City Environment with particular reference to the reduction
in air pollution & particulate matter. The proposed study includes preparation of a
plan for development of GIs in 17 NACs of Uttar Pradesh including Gorakhpur under
the following detailed scope-
▪ Reconnaissance Survey of all 17 NACs (Lucknow, Kanpur, Agra, Prayagraj, Varanasi,
Jhansi, Khurja, Gajraula, Ghaziabad, Noida, Anpara, Bareilly, Moradabad, Meerut,
Raibareilly, Firozabad & Gorakhpur) of Uttar Pradesh for the initial assessment of
the types of space available for retrofitting the City with green Infrastructure
▪ Identification of Types of workable GIs for 17 NACs of Uttar Pradesh
▪ Suitability analysis of GIs with reference to Cost and reduction in pollution and
specifically the reduction of air pollution in NACs on the basis of wind-rose
diagrams
▪ Identification of ways and means of using the wastes for development and
maintenance of GIs in order to reduce cost on the lines of 7R principle
▪ Preparation of SOPs for development of suitable GIs
▪ Preparation of GIS map of NACs to identify the spaces available for development of
suitable GIs
▪ Development of an action plan for retrofitting the NACs with the GIs and
suggestions for future planning for development of GIs after stakeholders
consultation
▪ Publication of a bilingual field guide for the use of the ground level functionaries of
the Government Department/Agencies to facilitate them the work of development
of suitable GIs in cost effective and time bound manner.
ii. Taking up Afforestation on the basis of wind-rose study The windrose for the four seasons have been plotted which indicate that the
predominant wind direction is blowing from West North West, North-West, West,
East North East,East and East South East direction. The wind pattern is very helpful
in siting the locations preferable for plantation so that they may act as barriers to
air pollution in the non prominent wind direction. The detailed area identification
for plantation/development of Miyawaki Forests on the basis of wind rose pattern
is enclosed as Annexure No.- II

105 | P a g e
Fig: Yearly Windrose Pattern
M. Agriculture residue burning
Stubble burning creates a corollary in the form of emissions with implications for
climate change, biodiversity, and human health in the affected region, disruptions in
economic activity (traffic accidents and transportation delays). Apart from air quality
lapse agriculture residue burning also cause losses in soil nutrients, soil organic matter,
soil production and productivity, biodiversity, and water quality. The key factor
responsible for stubble burning is the short time window available between rice
harvesting and sowing of wheat in the rice-wheat cropping cycle.
The table below lists the number of burning incidents in Gorakhpur district during the
months of October and November in the last 5 years. There is a significant decline in
agricultural residue burning in 2019. In 2020, there is a slight increase in the burning
incident.
Table 28: Details of agricultural residue burning incidents in Gorakhpur
Sources Time Duration No. of Crop Burning Cases in
Gorakhpur
Paddy Crop
Residue
Burning
01-10-2016 TO 30-11-2016 67
01-10-2017 TO 30-11-2017 115
01-10-2018 TO 30-11-2018 142
01-10-2019 TO 30-11-2019 20
01-10-2020 TO 30-11-2020 61
Various measures have been taken at both the state and district level to stop
agricultural residue burning. These measures include:
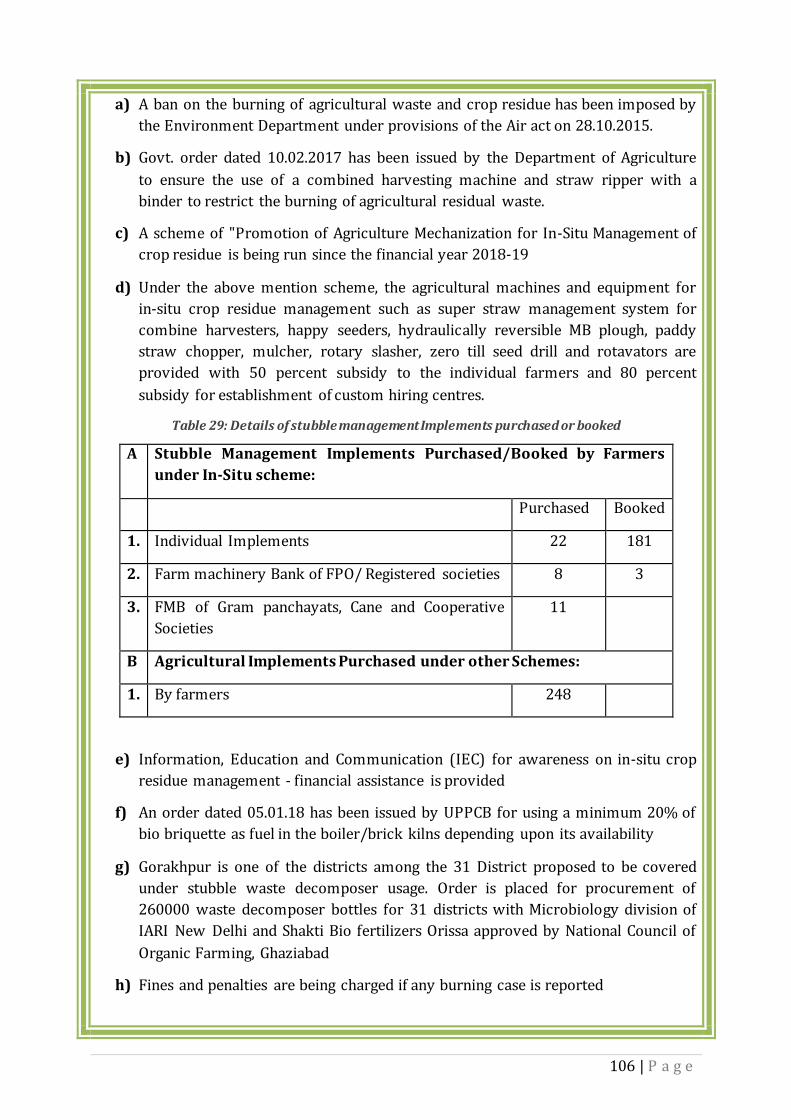
106 | P a g e
a) A ban on the burning of agricultural waste and crop residue has been imposed by
the Environment Department under provisions of the Air act on 28.10.2015.
b) Govt. order dated 10.02.2017 has been issued by the Department of Agriculture
to ensure the use of a combined harvesting machine and straw ripper with a
binder to restrict the burning of agricultural residual waste.
c) A scheme of "Promotion of Agriculture Mechanization for In-Situ Management of
crop residue is being run since the financial year 2018-19
d) Under the above mention scheme, the agricultural machines and equipment for
in-situ crop residue management such as super straw management system for
combine harvesters, happy seeders, hydraulically reversible MB plough, paddy
straw chopper, mulcher, rotary slasher, zero till seed drill and rotavators are
provided with 50 percent subsidy to the individual farmers and 80 percent
subsidy for establishment of custom hiring centres.
Table 29: Details of stubble management Implements purchased or booked
A Stubble Management Implements Purchased/Booked by Farmers
under In-Situ scheme:
Purchased Booked
1. Individual Implements 22 181
2. Farm machinery Bank of FPO/ Registered societies 8 3
3. FMB of Gram panchayats, Cane and Cooperative
Societies
11
B Agricultural Implements Purchased under other Schemes:
1. By farmers 248
e) Information, Education and Communication (IEC) for awareness on in-situ crop
residue management - financial assistance is provided
f) An order dated 05.01.18 has been issued by UPPCB for using a minimum 20% of
bio briquette as fuel in the boiler/brick kilns depending upon its availability
g) Gorakhpur is one of the districts among the 31 District proposed to be covered
under stubble waste decomposer usage. Order is placed for procurement of
260000 waste decomposer bottles for 31 districts with Microbiology division of
IARI New Delhi and Shakti Bio fertilizers Orissa approved by National Council of
Organic Farming, Ghaziabad
h) Fines and penalties are being charged if any burning case is reported

107 | P a g e
i) Under ex-situ management of crop residue, the paddy crop residue is being
supplied to the cow shelters of the district.
j) Under ex-situ management of crop residue, Uttar Pradesh Govt in collaboration
with Indian Oil Corporation (IOC) has sanctioned 01 second generation(2G)
ethanol in Gorakhpur with 1600 TPD Bio-mass consumption capacity at defunct
Dhuriapar Co-operative Sugar Mill. The technology and the plant, projected is
capable of converting any biomass feedstock like wheat straw, rice straw,
bagasse, cotton stalk, bamboo, etc. to alcohol
k) This 2G ethanol project will help in controlling stubble burning incidents and
reducing vehicular emission by mixing ethanol in petroleum products.
l) One compressed biogas (CBG) plant of 40MT/ day capacity is under progress in
Dhuriapur bio fuel complex which will process paddy straw to produce CBG for
sale to motor vehicles in the same way as CNG.
All these efforts have resulted in decrease of burning incidents and strict
implementation of all the measures will ensure complete stoppage of agricultural
residue burning in the coming years.
N. Identification and Pollution Mitigation in the Hotspots Air pollution hotspots in a region need to be identified for better environmental
management. In this study identification of pollution, hotspots are considered within a 2
km radius area of a manual air quality monitoring station in Gorakhpur city. This focus
on hotspot action is consistent with the global trend in which governments not only aim
to reduce ambient air pollution but also protect vulnerable communities from
extremely harmful local exposure; and strengthen health protection for all. There are 18
pollution hotspots in Gorakhpur city under different cause agents. Following Hotspots
have been identified in Gorakhpur City-
Table 30: Details of hotspots in Gorakhpur
Source Name of the Hotspot Location
Latitude Longitude
Road Dust/ Unpaved Roads
Gorakhnath-Dharmshala Road, Gorakhpur
26° 45' 47.016'' N 77°38'30.5"E
Industrial
Gorakhpur-Lucknow Road, Near Dana Pani Restaurant, GIDA, Gorakhpur
26° 45' 4.248'' N 83°13' 30.252'' E
Vehicular/ Traffic Congestion
Gorakhpur-Kasia Road, Near Mohaddipur Chowk, Gorakhpur
26° 44' 59.1468'' N 83° 23' 51.4752'' E
Kali Mandir-Shashtri Chowk Road, Near Jal Kal
26° 45' 3.06'' N 83° 22' 13.2204'' E
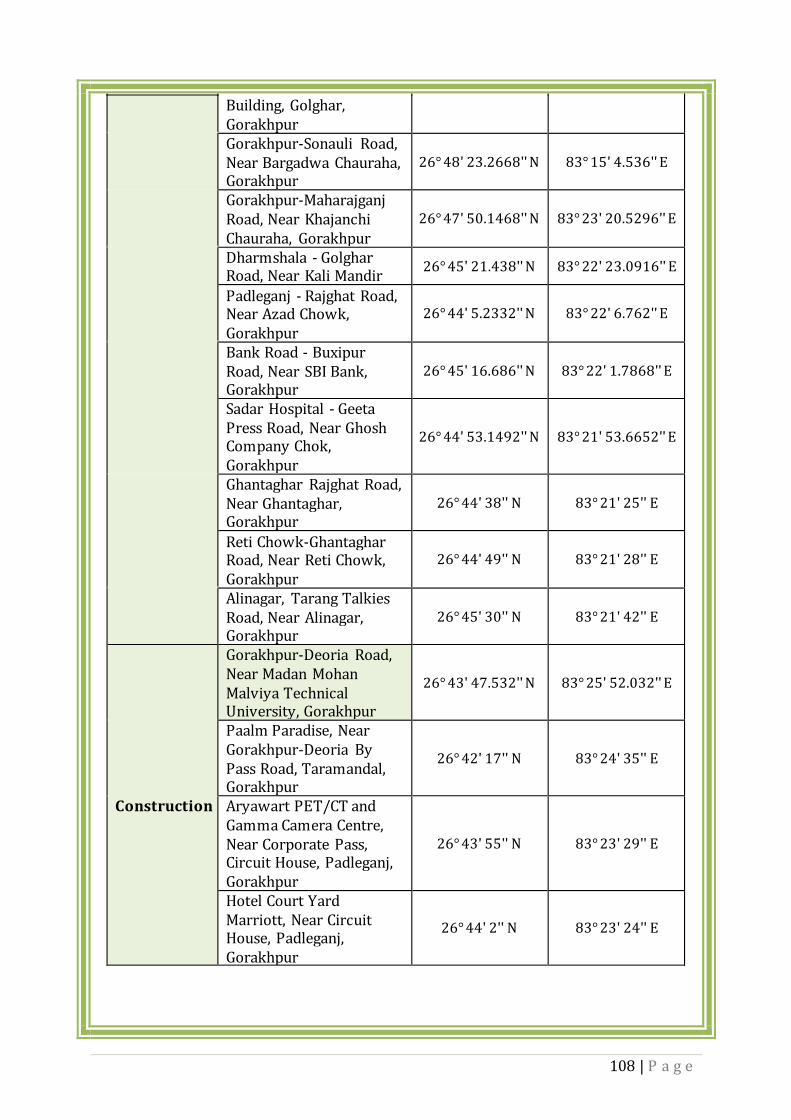
108 | P a g e
Building, Golghar, Gorakhpur Gorakhpur-Sonauli Road, Near Bargadwa Chauraha, Gorakhpur
26° 48' 23.2668'' N 83° 15' 4.536'' E
Gorakhpur-Maharajganj Road, Near Khajanchi Chauraha, Gorakhpur
26° 47' 50.1468'' N 83° 23' 20.5296'' E
Dharmshala - Golghar Road, Near Kali Mandir
26° 45' 21.438'' N 83° 22' 23.0916'' E
Padleganj - Rajghat Road, Near Azad Chowk, Gorakhpur
26° 44' 5.2332'' N 83° 22' 6.762'' E
Bank Road - Buxipur Road, Near SBI Bank, Gorakhpur
26° 45' 16.686'' N 83° 22' 1.7868'' E
Sadar Hospital - Geeta Press Road, Near Ghosh Company Chok, Gorakhpur
26° 44' 53.1492'' N 83° 21' 53.6652'' E
Ghantaghar Rajghat Road, Near Ghantaghar, Gorakhpur
26° 44' 38'' N 83° 21' 25'' E
Reti Chowk-Ghantaghar Road, Near Reti Chowk, Gorakhpur
26° 44' 49'' N 83° 21' 28'' E
Alinagar, Tarang Talkies Road, Near Alinagar, Gorakhpur
26° 45' 30'' N 83° 21' 42'' E
Construction
Gorakhpur-Deoria Road, Near Madan Mohan Malviya Technical University, Gorakhpur
26° 43' 47.532'' N 83° 25' 52.032'' E
Paalm Paradise, Near Gorakhpur-Deoria By Pass Road, Taramandal, Gorakhpur
26° 42' 17'' N 83° 24' 35'' E
Aryawart PET/CT and Gamma Camera Centre, Near Corporate Pass, Circuit House, Padleganj, Gorakhpur
26° 43' 55'' N 83° 23' 29'' E
Hotel Court Yard Marriott, Near Circuit House, Padleganj, Gorakhpur
26° 44' 2'' N 83° 23' 24'' E

109 | P a g e
Garbage Dumping/ Burning
Akla Bandh, Near Rajghat, Gorakhpur
26° 43' 43.428'' N 83° 20' 38.184'' E
The hotspot action plans are expected to identify local pollution from non-compliant
stack emissions, fugitive emissions, open burning of industrial waste, and municipal
solid waste and dust generators for stronger local action. This will include penalty and
deterrence. The pollution hotspot action plans will also provide for night patrolling and
responsive action based on complaints. These hotspots have been identified by the
Central Pollution Control Board (CPCB) and the UPPCB. The assessment of hotspots is
currently generic and does not have any legal definition.

110 | P a g e
Figure 63: Location map of hotspots in Gorakhpur city

111 | P a g e
XI. PROPOSED ACTIONS
Short term &Long-term Action Plan along with the clearly defined timelines, cost
estimates, Budget provisions and the responsible department/agencies is enclosed as
Annexure No-I
XII. COST ESTIMATES
(All Figures in Rs. Lakhs)
S.N
o.
Interventions Total
Fund
required
Funds
Allocat
ed
Funds
released
Funds
Utilized
Additio
nal
Funds
Requir
ed
1. Capacity building,
monitoring network
and source
apportionment 884.306 245.56 234.56 34.56 638.44
2. Public outreach 30 - - - 30
3. Road dust activities 428410.5
8
298488.
5 - 360.4
129922
.08
4. Construction
activities 500 - - - 500
5. Vehicles 23658.3 4321.7 2329.07 1600
19336.
6
6. Industries 90 - - - 90
7. Waste and biomass-
dumping and
burning 9396.7 - - - 9396.7
Total 462969.
9
3,03,05
5.79
2,563.63 1,994.9
6
15991
4.11

112 | P a g e
XIII. MID TERM EVALUATION OF THE ACTION PLAN
The Action Plan shall be evaluated after the completion of comprehensive Source
Apportionment Study and the Carrying Capacity Study is done in order to-
a) Review the impact of various actions based upon the monitoring of various
pollution sources and their impact upon the ambient air quality
b) Prioritizing the action points on the basis of findings of the abovementioned
studies

113 | P a g e
XIV. ANNEXURE -I
Summary
Basic Information
Name of Non-Attainment City Gorakhpur
Sate/ Union Territory Uttar Pradesh
Name of Nodal Officer at PCB/ PCC Rakesh Kumar Tyagi, Chief
Environmental Officer
Email Id [email protected]
Contact Number 7839891707
Action Point
Code
Sector Total Number of Actions
CB CAPACITY BUILDING, MONITORING NETWORK AND SOURCE
APPORTIONMENT
PO PUBLIC OUTREACH
RD/ C&D ROAD DUST AND CONTRUCTION & DEMOLITION
VE VEHICLES
IP INDUSTRIES
BB/DF WASTE AND BIOMASS- DUMPING AND BURNING
AQ AIR QUALITY DATA

114 | P a g e
CAPACITY BUILDING, MONITORING NETWORK AND SOURCE APPORTIONMENT A
ctio
n P
oin
t C
od
e
Act
ion
Po
int
De
pa
rtm
en
t/ A
ge
ncy
Fie
ld t
yp
e
To
tal
Ta
rge
t
Ta
rge
t D
ate
(T
ime
lin
e)
*An
nu
al
Ta
rge
t
**A
tta
chm
en
t N
o.
Att
ach
me
nt
Co
nte
nts
To
tal
Fu
nd
re
qu
ire
d
(Rs.
La
kh
)
To
tal
Fu
nd
s A
llo
cate
d
(Rs.
La
kh
)
Fu
nd
s re
lea
sed
(R
s.
La
kh
)
Fu
nd
s U
tili
zed
(R
s.
La
kh
)
Ad
dit
ion
al
Fu
nd
s R
eq
uir
ed
(R
s. L
ak
h)
So
urc
e o
f F
un
din
g
CB1 Installation& Commissioning of Monitoring Stations
CB1.1 CAAQMS UPPCB Number of CAAQMS
03 CAAQMS
01 (Feb.21) 02 (Dec. 21)
01 CAAQMS
Yes List of locations of CAAQMS
600.0(With purchase, installation and 05 years of O & M)
200 200 00 400 (With purchase, installation and 05 years of O & M)
15 FC/ MoEF&CC/ CPCB
CB1.2 Manual Stations: Upgradation & Establishment of background station
UPPCB Number of Manual Stations
03 Manual Station’s up gradation for PM2.5 & establishment of 01 background station
Dec. 2021
NA Yes List of locations of Installed Manual Stations
39.556 14.556 (for O&M per year) for 03 stations As per CPCB guidelines under NAMP Capex: 20 Lakh for upgradation & 5 lakhs for installation of background Total Capex: 25 Lakh
10.56 (for O&M per year) for 03 existing stations without upgradation
10.56 10.56 39.556 CPCB/UPPCB/NCAP
CB3 Assessment of sources
UPPCB
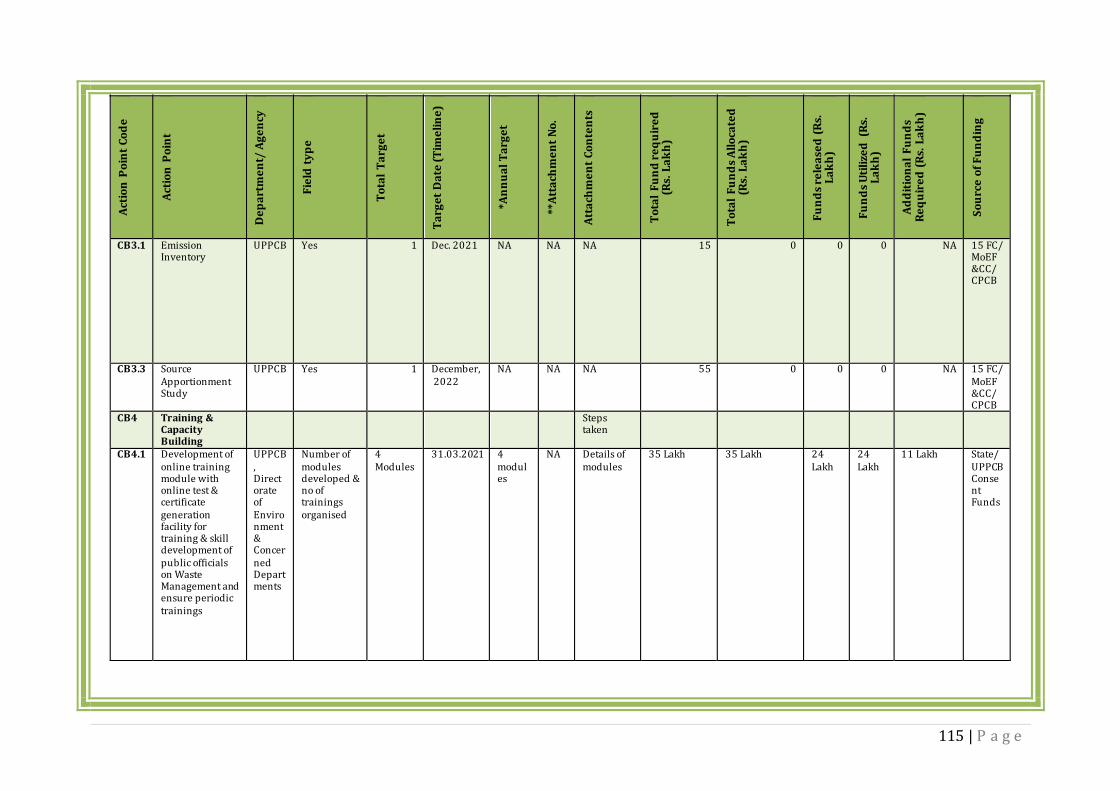
115 | P a g e
Act
ion
Po
int
Co
de
Act
ion
Po
int
De
pa
rtm
en
t/ A
ge
ncy
Fie
ld t
yp
e
To
tal
Ta
rge
t
Ta
rge
t D
ate
(T
ime
lin
e)
*An
nu
al
Ta
rge
t
**A
tta
chm
en
t N
o.
Att
ach
me
nt
Co
nte
nts
To
tal
Fu
nd
re
qu
ire
d
(Rs.
La
kh
)
To
tal
Fu
nd
s A
llo
cate
d
(Rs.
La
kh
)
Fu
nd
s re
lea
sed
(R
s.
La
kh
)
Fu
nd
s U
tili
zed
(R
s.
La
kh
)
Ad
dit
ion
al
Fu
nd
s R
eq
uir
ed
(R
s. L
ak
h)
So
urc
e o
f F
un
din
g
CB3.1 Emission Inventory
UPPCB Yes 1 Dec. 2021 NA NA NA 15 0 0 0 NA 15 FC/ MoEF&CC/ CPCB
CB3.3 Source Apportionment Study
UPPCB Yes 1 December, 2022
NA NA NA 55 0 0 0 NA 15 FC/ MoEF&CC/ CPCB
CB4 Training & Capacity Building
Steps taken
CB4.1 Development of online training module with online test & certificate generation facility for training & skill development of public officials on Waste Management and ensure periodic trainings
UPPCB, Directorate of Environment & Concerned Departments
Number of modules developed & no of trainings organised
4 Modules
31.03.2021 4 modules
NA Details of modules
35 Lakh 35 Lakh 24 Lakh
24 Lakh
11 Lakh State/ UPPCB Consent Funds

116 | P a g e
Act
ion
Po
int
Co
de
Act
ion
Po
int
De
pa
rtm
en
t/ A
ge
ncy
Fie
ld t
yp
e
To
tal
Ta
rge
t
Ta
rge
t D
ate
(T
ime
lin
e)
*An
nu
al
Ta
rge
t
**A
tta
chm
en
t N
o.
Att
ach
me
nt
Co
nte
nts
To
tal
Fu
nd
re
qu
ire
d
(Rs.
La
kh
)
To
tal
Fu
nd
s A
llo
cate
d
(Rs.
La
kh
)
Fu
nd
s re
lea
sed
(R
s.
La
kh
)
Fu
nd
s U
tili
zed
(R
s.
La
kh
)
Ad
dit
ion
al
Fu
nd
s R
eq
uir
ed
(R
s. L
ak
h)
So
urc
e o
f F
un
din
g
CB4.2 Infrastructure development (Laboratory/ AQM Cell)
UPPCB Yes AQM Cell in Regional Office
June, 2021 NA NA NA Capex 20.0 Opex 5.0/Year
0 0 0 NA 15 FC/ MoEF&CC/ CPCB
CB4.3 Enforcement Units
UPPCB/Nagar Nigam/Development Authority
Yes 3 Dec-20 _ NA Details of Enforcement Units along with the facilities provided
24.75 lakh (@ 8.25 lakhs per unit including vehicles and 01 Staff)
0 0 0 NA 15 FC
CB4.4 Development of online training module with online test & certificate generation facility for skill development for improving operation of Air Pollution Control Systems installed at sources, operation of brick kilns, Cane Kohus etc. and ensure periodic trainings
UPPCB, Directorate of Environment & Concerned Departments
Number of modules developed & no of trainings organised
3 31.03.2021 _ NA NA 30 Lakh _ _ NA NA State/ UPPCB Consent Funds/CSR

117 | P a g e
Act
ion
Po
int
Co
de
Act
ion
Po
int
De
pa
rtm
en
t/ A
ge
ncy
Fie
ld t
yp
e
To
tal
Ta
rge
t
Ta
rge
t D
ate
(T
ime
lin
e)
*An
nu
al
Ta
rge
t
**A
tta
chm
en
t N
o.
Att
ach
me
nt
Co
nte
nts
To
tal
Fu
nd
re
qu
ire
d
(Rs.
La
kh
)
To
tal
Fu
nd
s A
llo
cate
d
(Rs.
La
kh
)
Fu
nd
s re
lea
sed
(R
s.
La
kh
)
Fu
nd
s U
tili
zed
(R
s.
La
kh
)
Ad
dit
ion
al
Fu
nd
s R
eq
uir
ed
(R
s. L
ak
h)
So
urc
e o
f F
un
din
g
CB4.5 Conduct study on development of Green Infrastructures in the City for Identification of suitable green infrastructures for control of air pollution and earmarking the places on GIS platform along with a publication of a field guide of SOPs
UPPCB Yes 1 31.03.2022 Award of Study by UPPCB
Yes Details of ToR and progress
10 Lakhs _ NA NA NA State/ UPPCB Consent Funds/CSR
CB5 Emergency Response System
State Disaster Management Authority/UPPCB
Yes GRAP (Graded Response Action Plan) implemented
31.06.2021 Issuance of
GO for implementation of GRAP
NA Copy of GRAP & GO
NA NA NA NA NA NA
CB6 Carrying Capacity
CB6.1 Assessment of Carrying Capacity of NAC
UPPCB Yes 1 March-23 NA NA NA 50.0 0 0 0 NA 15 FC/ MoEF&CC/ CPCB

118 | P a g e
Act
ion
Po
int
Co
de
Act
ion
Po
int
De
pa
rtm
en
t/ A
ge
ncy
Fie
ld t
yp
e
To
tal
Ta
rge
t
Ta
rge
t D
ate
(T
ime
lin
e)
*An
nu
al
Ta
rge
t
**A
tta
chm
en
t N
o.
Att
ach
me
nt
Co
nte
nts
To
tal
Fu
nd
re
qu
ire
d
(Rs.
La
kh
)
To
tal
Fu
nd
s A
llo
cate
d
(Rs.
La
kh
)
Fu
nd
s re
lea
sed
(R
s.
La
kh
)
Fu
nd
s U
tili
zed
(R
s.
La
kh
)
Ad
dit
ion
al
Fu
nd
s R
eq
uir
ed
(R
s. L
ak
h)
So
urc
e o
f F
un
din
g
CB6.2 Revision of Master Plan on the basis of Carrying Capacity of NAC
Gorakhpur Development Authority
Yes NA Dec 23 NA NA NA NA NA NA NA NA Gorakhpur Development Authority Funds
*In case timeline extends to more than one year the annual targets must be fixed.
**Mention specific numeric identity to the attachment. Example- Attachment-1

119 | P a g e
PUBLIC OUTREACH A
ctio
n P
oin
t
Co
de
Act
ion
Po
int
De
pa
rtm
en
t/
Ag
en
cy
Fie
ld t
yp
e
To
tal
Ta
rge
t
Ta
rge
t D
ate
(Tim
eli
ne
)
*An
nu
al
Ta
rge
t
**A
tta
chm
en
t N
o.
Att
ach
me
nt
Co
nte
nts
To
tal
Fu
nd
req
uir
ed
(R
s. L
ak
h)
To
tal
Fu
nd
s
All
oca
ted
(R
s. L
ak
h)
Fu
nd
s
rele
ase
d (
Rs.
L
ak
h)
Fu
nd
s
Uti
lize
d (
Rs.
La
kh
)
Ad
dit
ion
al
Fu
nd
s
Re
qu
ire
d
(Rs.
La
kh
)
So
urc
e o
f
Fu
nd
ing
PO1 Public Outreach
PO1.1 Daily Air Quality
Public Information
Dissemination
System
UPPCB/
CPCB
Yes SAMEER
App of
CPCB is
functiona
l
Achieved NA NA NA NA NA NA NA NA NA
PO1.3 Issue public
advisory for
prevention and
control of air
polltuion by
newspaper
publication and
radio jingles
UPPCB Number Continuo
us
Activity
as and
when
needed
NA NA Yes Number and
detail of public
advisories
issued
10.0/Y
ear
- NA NA NA 15 FC/
MoEF&CC/
CPCB
PO1.4 Deeper public
engagement and
consultation
(Hackathons/Wor
kshops/
Programmes in
schools/ colleges)
UPPCB/
DIOS/
University/
Colleges
Number Continuo
us
Activity
NA NA Yes Number &
details of
public
awareness
events held
10.0/Y
ear
- NA NA NA 15 FC/
MoEF&CC/
CPCB
PO1.6 Develop & online
awareness/orient
ation module with
online test &
certificate
generation facility
for Common
Citizen in order to
ensure their
participation
UPPCB/Dir
ectorate of
Environme
nt
Yes 1 31.03.20
21
NA No Number of
Citizens
trained/oriente
d
10.00
Lakhs
- Nil NA NA 15 FC/
MoEF&CC/
CPCB
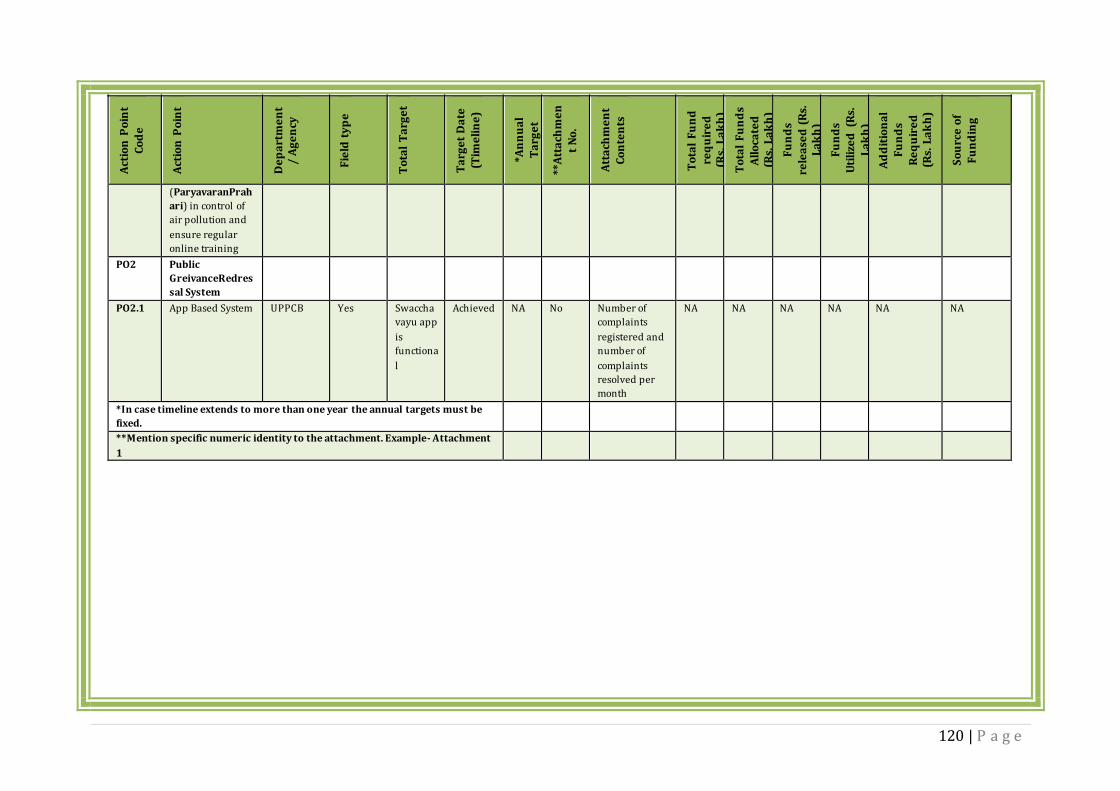
120 | P a g e
Act
ion
Po
int
Co
de
Act
ion
Po
int
De
pa
rtm
en
t/
Ag
en
cy
Fie
ld t
yp
e
To
tal
Ta
rge
t
Ta
rge
t D
ate
(Tim
eli
ne
)
*An
nu
al
Ta
rge
t
**A
tta
chm
en
t N
o.
Att
ach
me
nt
Co
nte
nts
To
tal
Fu
nd
req
uir
ed
(R
s. L
ak
h)
To
tal
Fu
nd
s
All
oca
ted
(R
s. L
ak
h)
Fu
nd
s
rele
ase
d (
Rs.
L
ak
h)
Fu
nd
s
Uti
lize
d (
Rs.
La
kh
)
Ad
dit
ion
al
Fu
nd
s
Re
qu
ire
d
(Rs.
La
kh
)
So
urc
e o
f
Fu
nd
ing
(ParyavaranPrah
ari) in control of
air pollution and
ensure regular
online training
PO2 Public
GreivanceRedres
sal System
PO2.1 App Based System UPPCB Yes Swaccha
vayu app
is
functiona
l
Achieved NA No Number of
complaints
registered and
number of
complaints
resolved per
month
NA NA NA NA NA NA
*In case timeline extends to more than one year the annual targets must be
fixed.
**Mention specific numeric identity to the attachment. Example- Attachment
1

121 | P a g e
ROAD DUST AND CONTRUCTION & DEMOLITION A
ctio
n P
oin
t
Co
de
Act
ion
Po
int
De
pa
rtm
en
t/
Ag
en
cy
Fie
ld t
yp
e
To
tal
Ta
rge
t
Ta
rge
t D
ate
(Tim
eli
ne
)
*An
nu
al
Ta
rge
t
**A
tta
chm
en
t
No
.
Att
ach
me
nt
Co
nte
nts
To
tal
Fu
nd
re
qu
ire
d (
Rs.
L
ak
h)
To
tal
Fu
nd
s A
llo
cate
d (
Rs.
L
ak
h)
Fu
nd
s re
lea
sed
(R
s.
La
kh
)
Fu
nd
s U
tili
zed
(R
s.
La
kh
)
Ad
dit
ion
al
Fu
nd
s R
eq
uir
ed
(R
s.
La
kh
) S
ou
rce
of
Fu
nd
ing
RD1 Road dust
RD1.1 Immediate lifting
of solid waste
generated from
desilting and
cleaning of
municipal drains
for its disposal
Nagar
Nigam/Developme
nt Authority
No. 19 large
drains
Regular
activity
NA Yes List of Drains NA NA NA NA NA Nagar
Nigam/
Developme
nt
Authority
Fund
RD1.2 Maintain potholes
free roads
Nagar Nigam/
Development
Authority
No. 02 Roads
needs patch
repair
31.03.2021 NA Yes (i) Infront of
Buddha vihar part
A, B & C parallel to
deoria by pass
length 2.45 km.
(ii) west corner of
champa devi park
to residence of VC
GDA length
0.48km.
11.78
3.10
- NA NA NA Developme
nt
Authority
Fund
RD1.3 Regular night
cleaning of street
surfaces and
spraying of water
to suppress dust.
Nagar
Nigam/Developme
nt Authority
No. For All
Major Roads
Purchase of
06 Water
Sprinklers
along with O
& M cost for
4 years @
50 L/Street
Sprinkler
31.03.2025 To be
Purch
ased
and
made
operat
ional
by
31.03.
2022
NA NA 300 - NA NA NA Nagar
Nigam/
Developme
nt
Authority
Fund

122 | P a g e
Act
ion
Po
int
Co
de
Act
ion
Po
int
De
pa
rtm
en
t/
Ag
en
cy
Fie
ld t
yp
e
To
tal
Ta
rge
t
Ta
rge
t D
ate
(Tim
eli
ne
)
*An
nu
al
Ta
rge
t
**A
tta
chm
en
t
No
.
Att
ach
me
nt
Co
nte
nts
To
tal
Fu
nd
re
qu
ire
d (
Rs.
L
ak
h)
To
tal
Fu
nd
s A
llo
cate
d (
Rs.
L
ak
h)
Fu
nd
s re
lea
sed
(R
s.
La
kh
)
Fu
nd
s U
tili
zed
(R
s.
La
kh
)
Ad
dit
ion
al
Fu
nd
s R
eq
uir
ed
(R
s.
La
kh
) S
ou
rce
of
Fu
nd
ing
RD1.4 Black-topping of
unpaved road
Nagar
Nigam/Developme
nt Authority
km 44.50 31.12.2021 NA NA Seven Roads in
Rapti Nagar Vikas
Sheme.
2690.0 - NA NA NA 15th
Fiinance
commissio
n/ Nagar
Nigam
Nidhi. GDA
Funds
RD1.6 To take
appropriate
action to remove
road dust/silt
regularly by using
mechanical
sweepers
Nagar
Nigam/Developme
nt Authority
No. For All
Major Roads
Purchase of
06
Mechanical
Street
Sweepers
along with O
& M cost for
4 years @
2.5
Cr/Street
Sweepers
31.03.2025 To be
Purch
ased
and
made
operat
ional
by
31.03.
2022
NA NA 1500 - NA NA NA Nagar
Nigam/De
velopment
Authority
Funds &
NCAP
Funds
RD1.7 End-to-end
paving of the road
Nagar
Nigam/Developme
nt Authority
Km 15 Regular
activity
NA NA NA 540.00 - NA NA NA Nagar
Nigam/De
velopment
Authority
Funds

123 | P a g e
Act
ion
Po
int
Co
de
Act
ion
Po
int
De
pa
rtm
en
t/
Ag
en
cy
Fie
ld t
yp
e
To
tal
Ta
rge
t
Ta
rge
t D
ate
(Tim
eli
ne
)
*An
nu
al
Ta
rge
t
**A
tta
chm
en
t
No
.
Att
ach
me
nt
Co
nte
nts
To
tal
Fu
nd
re
qu
ire
d (
Rs.
L
ak
h)
To
tal
Fu
nd
s A
llo
cate
d (
Rs.
L
ak
h)
Fu
nd
s re
lea
sed
(R
s.
La
kh
)
Fu
nd
s U
tili
zed
(R
s.
La
kh
)
Ad
dit
ion
al
Fu
nd
s R
eq
uir
ed
(R
s.
La
kh
) S
ou
rce
of
Fu
nd
ing
RD1.9 Introduce water
fountain at major
traffic
intersection
Nagar
Nigam/Developme
nt Authority
No. 10 major
traffic
intersection
s
31.03.2025 NA NA Major Traffic
Intersection
Points-
1. Ghantaghar
2. Townhall
3. University
Student Union
Building
4. University
North
5. University
South
6. Mohaddipur
7. Malgodam
8. Asuran
9. Golghar
10. Transport
Nagar
Details
attached as
Annexure I(A)
202.00
- NA NA NA Nagar
Nigam
Funds

124 | P a g e
Act
ion
Po
int
Co
de
Act
ion
Po
int
De
pa
rtm
en
t/
Ag
en
cy
Fie
ld t
yp
e
To
tal
Ta
rge
t
Ta
rge
t D
ate
(Tim
eli
ne
)
*An
nu
al
Ta
rge
t
**A
tta
chm
en
t
No
.
Att
ach
me
nt
Co
nte
nts
To
tal
Fu
nd
re
qu
ire
d (
Rs.
L
ak
h)
To
tal
Fu
nd
s A
llo
cate
d (
Rs.
L
ak
h)
Fu
nd
s re
lea
sed
(R
s.
La
kh
)
Fu
nd
s U
tili
zed
(R
s.
La
kh
)
Ad
dit
ion
al
Fu
nd
s R
eq
uir
ed
(R
s.
La
kh
) S
ou
rce
of
Fu
nd
ing
RD1.11 Improvement of
infrastructure for
decongestion of
road.
Nagar
Nigam/Developme
nt Authority
2 NA 31.12.2023 NA NA 1. Construction of
4 lane
Gorakhpur
Byepass 17.66
km
2. Four laning
widening and
strengthening
of NH-29E
from km
81.420 to
99.00 sonauli -
gorakhpur
road (j)
3. 4-lanning of
varanasi
Gorakhpur
section of NH-
29 from 148.00
208.300 km
[package-iv]
4. Smart Street
Project
5. ITMS project
86,600
28,800
2,98,200
4900.0
4400.0
NA
288.53
2,98,20
0
NA
NA
NA
-
-
NA
NA
NA
83.53
276.8
7
NA
NA
NA
NA
NA
NA
NA
PWD/NHA
I Funds
State safe
& Smart
City
RD1.13 Implement truck
loading
guidelines; use of
appropriate
enclosures for
haul trucks;
gravel paving for
all haul routes.
Nagar Nigam,
Development
Authority,
Construction
Agencies
Yes Regular
Activity
NA NA NA Guidelines will be
included in terms
and conditions of
the contract
bonds.
Not
required
NA NA NA NA -
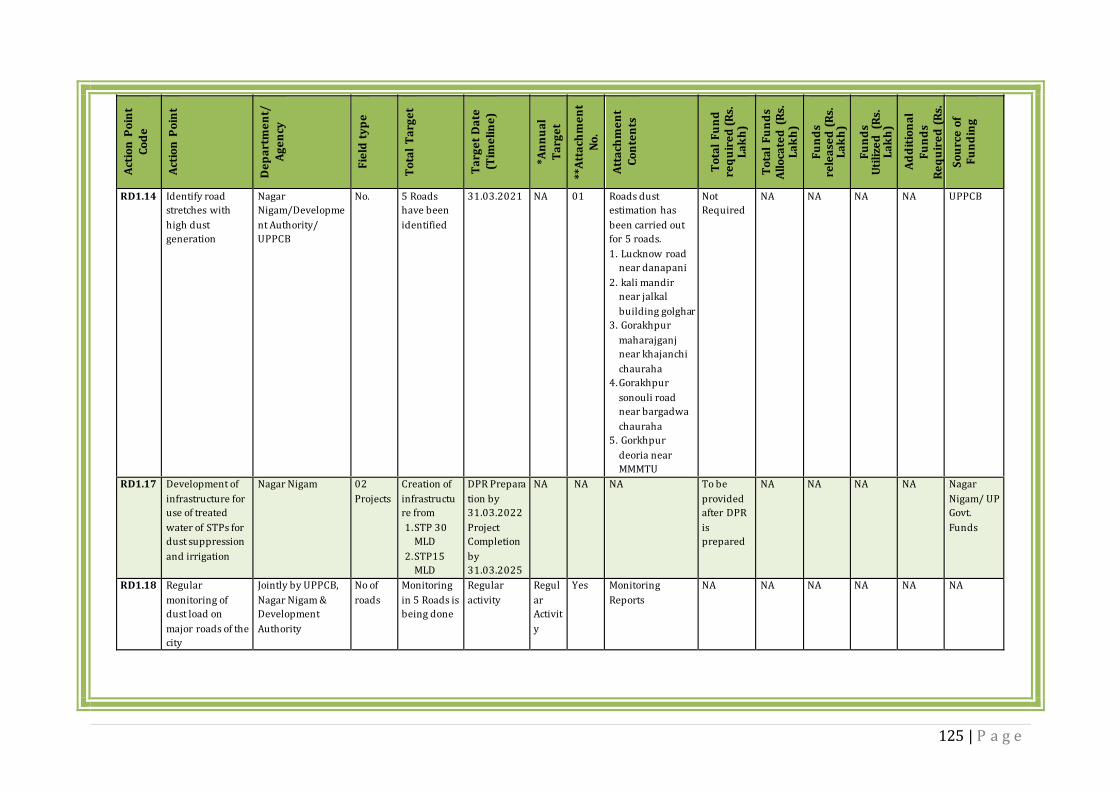
125 | P a g e
Act
ion
Po
int
Co
de
Act
ion
Po
int
De
pa
rtm
en
t/
Ag
en
cy
Fie
ld t
yp
e
To
tal
Ta
rge
t
Ta
rge
t D
ate
(Tim
eli
ne
)
*An
nu
al
Ta
rge
t
**A
tta
chm
en
t
No
.
Att
ach
me
nt
Co
nte
nts
To
tal
Fu
nd
re
qu
ire
d (
Rs.
L
ak
h)
To
tal
Fu
nd
s A
llo
cate
d (
Rs.
L
ak
h)
Fu
nd
s re
lea
sed
(R
s.
La
kh
)
Fu
nd
s U
tili
zed
(R
s.
La
kh
)
Ad
dit
ion
al
Fu
nd
s R
eq
uir
ed
(R
s.
La
kh
) S
ou
rce
of
Fu
nd
ing
RD1.14 Identify road
stretches with
high dust
generation
Nagar
Nigam/Developme
nt Authority/
UPPCB
No. 5 Roads
have been
identified
31.03.2021 NA 01 Roads dust
estimation has
been carried out
for 5 roads.
1. Lucknow road
near danapani
2. kali mandir
near jalkal
building golghar
3. Gorakhpur
maharajganj
near khajanchi
chauraha
4. Gorakhpur
sonouli road
near bargadwa
chauraha
5. Gorkhpur
deoria near
MMMTU
Not
Required
NA NA NA NA UPPCB
RD1.17 Development of
infrastructure for
use of treated
water of STPs for
dust suppression
and irrigation
Nagar Nigam 02
Projects
Creation of
infrastructu
re from
1. STP 30
MLD
2. STP15
MLD
DPR Prepara
tion by
31.03.2022
Project
Completion
by
31.03.2025
NA NA NA To be
provided
after DPR
is
prepared
NA NA NA NA Nagar
Nigam/ UP
Govt.
Funds
RD1.18 Regular
monitoring of
dust load on
major roads of the
city
Jointly by UPPCB,
Nagar Nigam &
Development
Authority
No of
roads
Monitoring
in 5 Roads is
being done
Regular
activity
Regul
ar
Activit
y
Yes Monitoring
Reports
NA NA NA NA NA NA

126 | P a g e
Act
ion
Po
int
Co
de
Act
ion
Po
int
De
pa
rtm
en
t/
Ag
en
cy
Fie
ld t
yp
e
To
tal
Ta
rge
t
Ta
rge
t D
ate
(Tim
eli
ne
)
*An
nu
al
Ta
rge
t
**A
tta
chm
en
t
No
.
Att
ach
me
nt
Co
nte
nts
To
tal
Fu
nd
re
qu
ire
d (
Rs.
L
ak
h)
To
tal
Fu
nd
s A
llo
cate
d (
Rs.
L
ak
h)
Fu
nd
s re
lea
sed
(R
s.
La
kh
)
Fu
nd
s U
tili
zed
(R
s.
La
kh
)
Ad
dit
ion
al
Fu
nd
s R
eq
uir
ed
(R
s.
La
kh
) S
ou
rce
of
Fu
nd
ing
RD1.19 Preparation and
implementation
of Road dust
hotspot action
plan
Nagar
Nigam/Developme
nt Authority
No of
plans
05 hotspots
identified
31.03.2020 NA Yes Progress of
implementation
Not
Required
NA NA NA NA NA
RD2 Creation of
green cover
RD2.2 Creation of green
buffers along the
traffic corridors
and their
maintenance
Forest
Department/Hortic
ulture/Nagar
Nigam &
Development
Authorities
ha 1. 8.50km
(2077
plants)
roads
side
plantatio
n in steel
Tree
Gaurds
2. 2.85 ha
block
plantatio
n (3420
plants)
3. Beautifica
tion of
Bandha
at
Gorakhpu
r
Lucknow
Road
4. 7000
Tree
31.03.2021
31.03.2022
NA NA 8.50km road side
plantation in steel
Tree Gaurds.
2.85 ha block
plantation in
barbed wire
fencing
In 500-meter
length,
landscaping &
Beautification of
Bandha at
Gorakhpur
Lucknow Road,
Nausad
7000 tree guard
required for road
side plantation.
65.38 lacs
28.32 Lacs
100.0
Lacs
70.0
lacs
-
-
-
-
NA NA NA Developme
nt
Authority
Fund
15th
Fiinance
commissio
n/ Nagar
Nigam
Nidhi

127 | P a g e
Act
ion
Po
int
Co
de
Act
ion
Po
int
De
pa
rtm
en
t/
Ag
en
cy
Fie
ld t
yp
e
To
tal
Ta
rge
t
Ta
rge
t D
ate
(Tim
eli
ne
)
*An
nu
al
Ta
rge
t
**A
tta
chm
en
t
No
.
Att
ach
me
nt
Co
nte
nts
To
tal
Fu
nd
re
qu
ire
d (
Rs.
L
ak
h)
To
tal
Fu
nd
s A
llo
cate
d (
Rs.
L
ak
h)
Fu
nd
s re
lea
sed
(R
s.
La
kh
)
Fu
nd
s U
tili
zed
(R
s.
La
kh
)
Ad
dit
ion
al
Fu
nd
s R
eq
uir
ed
(R
s.
La
kh
) S
ou
rce
of
Fu
nd
ing
guards
RD2.3 Necessary
changes in
byelaws-
Greening of open
areas, gardens,
community
places, schools
and housing
societies
Nagar Nigam &
Development
Authorities
Yes NA Achieved Achie
ved
NA Maps are
sanctioned as per
provision of
master plan and
building byelaws.
20% of total area
will be green area
where trees will
be planted @125
tree/ha. (Building
bylaws 3.1.2.2 (xi)
(ka)
Not
Required
NA NA NA NA Nagar
Nigam &
Developme
nt
Authorities
RD2.4 Urban Greening
with green
infrastructures
(vertical garden,
green pavements,
pocket parks, City
Forest, Miyawaki
forest &
grasscrete tiles
etc.)
Nagar Nigam,
Development
Authorities &
UPPCB
No of
green
infrastr
uctures
develop
ed
As per
approved
maps and
CTE/CTO/E
C Conditions
Regular
Activity
NA Yes Details of Green
Infrastructures
developed
Not
Required
NA NA NA NA To be done
by Project
Proponent
s &
individuals

128 | P a g e
Act
ion
Po
int
Co
de
Act
ion
Po
int
De
pa
rtm
en
t/
Ag
en
cy
Fie
ld t
yp
e
To
tal
Ta
rge
t
Ta
rge
t D
ate
(Tim
eli
ne
)
*An
nu
al
Ta
rge
t
**A
tta
chm
en
t
No
.
Att
ach
me
nt
Co
nte
nts
To
tal
Fu
nd
re
qu
ire
d (
Rs.
L
ak
h)
To
tal
Fu
nd
s A
llo
cate
d (
Rs.
L
ak
h)
Fu
nd
s re
lea
sed
(R
s.
La
kh
)
Fu
nd
s U
tili
zed
(R
s.
La
kh
)
Ad
dit
ion
al
Fu
nd
s R
eq
uir
ed
(R
s.
La
kh
) S
ou
rce
of
Fu
nd
ing
RD2.5 Builders should
leave minimum
15% area for
green belt in
residential
colonies to be
made mandatory.
Nagar Nigam &
Development
Authorities
Yes As per the
conditions
of approved
maps
Regular
Activity
NA Yes Provision has
been made in
(building byelaws
2.2.1 (kha)(i)
Minimum 15 %
area will be
reserved for park
and open area
(residential
layout)
Not
Required
NA NA NA NA Funding by
Project
Proponent
RD2.7 Provision for
maintaining at
least 10% tree
cover area in the
city in master
plan.
Development
Authority
Yes/No Revision in
the Master
Plan 2021
31.03.2022 NA NA Open areas are
provided in
master plan as per
URDPF Guidelines.
10.45% of total
urbanisable area
in Gorakhpur
Action Plan 2021.
In addition to this,
15% land for
park/green spaces
are reserved in
residential layout
plan and 10% in
non-residential
layout plans as per
building byelaws.
Not
Required
NA NA NA NA -

129 | P a g e
Act
ion
Po
int
Co
de
Act
ion
Po
int
De
pa
rtm
en
t/
Ag
en
cy
Fie
ld t
yp
e
To
tal
Ta
rge
t
Ta
rge
t D
ate
(Tim
eli
ne
)
*An
nu
al
Ta
rge
t
**A
tta
chm
en
t
No
.
Att
ach
me
nt
Co
nte
nts
To
tal
Fu
nd
re
qu
ire
d (
Rs.
L
ak
h)
To
tal
Fu
nd
s A
llo
cate
d (
Rs.
L
ak
h)
Fu
nd
s re
lea
sed
(R
s.
La
kh
)
Fu
nd
s U
tili
zed
(R
s.
La
kh
)
Ad
dit
ion
al
Fu
nd
s R
eq
uir
ed
(R
s.
La
kh
) S
ou
rce
of
Fu
nd
ing
C&D1 Construction Activities
C&D
1.1
Ensure
transportation of
construction
materials in
covered vehicles
Nagar
Nigam/Developme
nt
Authority/Constru
ction
Agencies/UPPCB
No of
defaults
and
action
taken
Regular
activity
NA NA 01 Guidelines will be
included in terms
and conditions of
the contract
bonds.
Not
Required
NA NA NA NA -
C&D
1.2
Strict
enforcement of
CPCB guidelines
for construction
(use of green
screens, side
covering of
digging sites, etc.)
Nagar
Nigam/Developme
nt
Authority/Constru
ction
Agencies/UPPCB
No of
defaults
and
action
taken
Regular
activity
NA NA 01 Guidelines will be
included in terms
and conditions of
the contract
bonds.
Not
Required
NA NA NA NA -

130 | P a g e
Act
ion
Po
int
Co
de
Act
ion
Po
int
De
pa
rtm
en
t/
Ag
en
cy
Fie
ld t
yp
e
To
tal
Ta
rge
t
Ta
rge
t D
ate
(Tim
eli
ne
)
*An
nu
al
Ta
rge
t
**A
tta
chm
en
t
No
.
Att
ach
me
nt
Co
nte
nts
To
tal
Fu
nd
re
qu
ire
d (
Rs.
L
ak
h)
To
tal
Fu
nd
s A
llo
cate
d (
Rs.
L
ak
h)
Fu
nd
s re
lea
sed
(R
s.
La
kh
)
Fu
nd
s U
tili
zed
(R
s.
La
kh
)
Ad
dit
ion
al
Fu
nd
s R
eq
uir
ed
(R
s.
La
kh
) S
ou
rce
of
Fu
nd
ing
C&D
1.3
Restriction on
storage of
construction
materials along
the road.
Nagar
Nigam/Developme
nt
Authority/Constru
ction Agencies
No of
defaults
and
action
taken
Regular
activity
NA NA 01 Will be complied
by the concerned
departments. GDA
takes stacking
charges (Malba
Shulk) to sanction
maps of plot area
<2000 sqm. This
stacking charges
are utilized by
Nagar Nigam
Gorakhpur for
cleaning and
maintenance of
roads. For plot
area >2000 sqm,
no stacking
charges is realized
the PP has to stack
their construction
material within
their plots.
Not
Required
NA NA NA NA
C&D
1.4
Covering of
construction site.
Nagar
Nigam/Developme
nt
Authority/Constru
ction
Agencies/UPPCB
No.of
constru
ction
sites
17
Constructio
n Projects
identified
Regular
activity
NA Yes NA Not
required
NA NA NA NA To be done
by PP
C&D
1.5
To create
separate
space/zone to
handle solid
Nagar Nigam No. 01 No of
C&D waste
Managemen
t Facility
31.12.2022 NA Yes Identification of
land will be done
by 31.03.2021
500.00 NA NA NA 500 SBM/15th
Finance
commissio
n/ Nagar

131 | P a g e
Act
ion
Po
int
Co
de
Act
ion
Po
int
De
pa
rtm
en
t/
Ag
en
cy
Fie
ld t
yp
e
To
tal
Ta
rge
t
Ta
rge
t D
ate
(Tim
eli
ne
)
*An
nu
al
Ta
rge
t
**A
tta
chm
en
t
No
.
Att
ach
me
nt
Co
nte
nts
To
tal
Fu
nd
re
qu
ire
d (
Rs.
L
ak
h)
To
tal
Fu
nd
s A
llo
cate
d (
Rs.
L
ak
h)
Fu
nd
s re
lea
sed
(R
s.
La
kh
)
Fu
nd
s U
tili
zed
(R
s.
La
kh
)
Ad
dit
ion
al
Fu
nd
s R
eq
uir
ed
(R
s.
La
kh
) S
ou
rce
of
Fu
nd
ing
waste, C&D waste
and other waste
in the city
will be
established.
Nigam
Nidhi.
C&D
1.6
To mandate
facility of
tar/brick/gravel
lined road inside
the construction
site for movement
of vehicles
carrying
construction
material
Nagar
Nigam/Developme
nt
Authority/Constru
ction
Agencies/UPPCB
No.of
constru
ction
sites
17
Constructio
n Projects
identified
Regular
activity
NA Yes NA Not
required
NA NA NA NA To be done
by PP
C&D
1.7
Promotion of the
use of
prefabricated
blocks for
building
construction
Nagar
Nigam/Developme
nt
Authority/Constru
ction
Agencies/UPPCB
Yes To impose
suitable
conditions
in the
tenders for
use of
prefab
building
blocks along
with
amendment
s in SoRs
Regular
Activity
NA NA NA Not
required
NA NA NA NA To be done
by PP
C&D
1.8
Enforcement of
Construction and
Demolition Waste
Rules
Nagar
Nigam/Developme
nt
Authority/Constru
ction
Agencies/UPPCB
No of
defaulte
rs found
and ATR
against
defaulte
rs
Regular
activity
NA NA 01 Guidelines will be
included in terms
and conditions of
the contract
bonds.
Not
Required
NA NA NA NA To be done
by PP

132 | P a g e
Act
ion
Po
int
Co
de
Act
ion
Po
int
De
pa
rtm
en
t/
Ag
en
cy
Fie
ld t
yp
e
To
tal
Ta
rge
t
Ta
rge
t D
ate
(Tim
eli
ne
)
*An
nu
al
Ta
rge
t
**A
tta
chm
en
t
No
.
Att
ach
me
nt
Co
nte
nts
To
tal
Fu
nd
re
qu
ire
d (
Rs.
L
ak
h)
To
tal
Fu
nd
s A
llo
cate
d (
Rs.
L
ak
h)
Fu
nd
s re
lea
sed
(R
s.
La
kh
)
Fu
nd
s U
tili
zed
(R
s.
La
kh
)
Ad
dit
ion
al
Fu
nd
s R
eq
uir
ed
(R
s.
La
kh
) S
ou
rce
of
Fu
nd
ing
C&D
1.9
Control measures
for fugitive
emissions from
material
handling-
conveying and
screening
operations
Nagar
Nigam/Developme
nt
Authority/Constru
ction
Agencies/UPPCB
No of
defaulte
rs found
and ATR
against
defaulte
rs
Regular
activity
NA NA 01 Guidelines will be
included in terms
and conditions of
the contract
bonds.
Not
Required
NA NA NA NA To be done
by PP
C&D
1.10
Develop and
implement dust
control measures
for all types of
construction
activities --
buildings and
infrastructure.
Nagar
Nigam/Developme
nt
Authority/Constru
ction
Agencies/UPPCB
No of
defaulte
rs found
and ATR
against
defaulte
rs
Regular
activity
NA NA 01 Guidelines will be
included in terms
and conditions of
the contract
bonds.
Not
Required
NA NA NA NA To be done
by PP
C&D
1.11
Enforce
restrictions on
construction
activities within
urban air shed
zones during high
pollution period
Nagar
Nigam/Developme
nt
Authority/Constru
ction
Agencies/UPPCB
Yes/No Implementa
tion of GRAP
31.03.2021 NA NA Construction
activity will be
restricted within
urban air shed
zones during high
pollution period
vide order from
the District
Administration.
Not
Required
NA NA NA NA -
C&D
1.12
Frame and
implement policy
for segregation of
construction and
demolition waste
and provide a
network of
decentralized
Nagar
Nigam/Developme
nt
Authority/Constru
ction Agencies
No. of
decentr
alised
units
Establishme
nt of
adequate
number of
collection
centres and
processing
facility
31.03.2022 NA Yes Details of
collection centres
and the quantity
of segregated
waste collected
and processed
To be
provided
after DPR
is
prepared
NA NA NA NA State/ULD
/NCAP
funding

133 | P a g e
Act
ion
Po
int
Co
de
Act
ion
Po
int
De
pa
rtm
en
t/
Ag
en
cy
Fie
ld t
yp
e
To
tal
Ta
rge
t
Ta
rge
t D
ate
(Tim
eli
ne
)
*An
nu
al
Ta
rge
t
**A
tta
chm
en
t
No
.
Att
ach
me
nt
Co
nte
nts
To
tal
Fu
nd
re
qu
ire
d (
Rs.
L
ak
h)
To
tal
Fu
nd
s A
llo
cate
d (
Rs.
L
ak
h)
Fu
nd
s re
lea
sed
(R
s.
La
kh
)
Fu
nd
s U
tili
zed
(R
s.
La
kh
)
Ad
dit
ion
al
Fu
nd
s R
eq
uir
ed
(R
s.
La
kh
) S
ou
rce
of
Fu
nd
ing
C&D waste
segregation and
collection sites
across the city.
C&D
1.13
Promote recycling
of construction
and demolition
waste.
Nagar
Nigam/Developme
nt
Authority/Constru
ction Agencies
No All ongoing
sites
Regular
Activity
NA 01 Use of recycled
bricks will be
continued.
Not
required
NA NA NA NA To be done
by PP
C&D
1.14
Mandatory
installation of PTZ
Cameras in
Construction Sites
with open access
to UPPCB
Nagar
Nigam/Developme
nt
Authority/Constru
ction Agencies
No. of
PTZ
cameras
NA 15.10.2020 NA NA As per the latest
UPPCB direction,
all construction
sites shall have
PTZ cameras
installed
Not
Required
NA NA NA NA NA
C&D
1.15
Develop, ensure &
monitor periodic
online Self
Declaration of
Dust Control
Audit by the
Project
Proponents/ Site
in Charges on the
portal
http://dustapp.up
ecp.in/ developed
by UPPCB
UPPCB No of
Self
Declarat
ions
made
All
Constructio
n Projects
Regular
activity
NA Yes NA Not
Required
NA NA NA NA The Dust
app
already
establishe
d from
UPPCB
Consent
Funds

134 | P a g e
Act
ion
Po
int
Co
de
Act
ion
Po
int
De
pa
rtm
en
t/
Ag
en
cy
Fie
ld t
yp
e
To
tal
Ta
rge
t
Ta
rge
t D
ate
(Tim
eli
ne
)
*An
nu
al
Ta
rge
t
**A
tta
chm
en
t
No
.
Att
ach
me
nt
Co
nte
nts
To
tal
Fu
nd
re
qu
ire
d (
Rs.
L
ak
h)
To
tal
Fu
nd
s A
llo
cate
d (
Rs.
L
ak
h)
Fu
nd
s re
lea
sed
(R
s.
La
kh
)
Fu
nd
s U
tili
zed
(R
s.
La
kh
)
Ad
dit
ion
al
Fu
nd
s R
eq
uir
ed
(R
s.
La
kh
) S
ou
rce
of
Fu
nd
ing
C&D
1.16
Appropriate
combination of
dry scrubber
system/filters and
wet scrubbing
system should be
installed for drier
and flue gases to
control fugitive
and flue gas
emission.
UPPCB/ Hot mix
plant Agencies
No All
operational
Hot Mix
Plants
Regular
activity
NA Yes List of Hot Mix
Plants and APCS
installed
Not
required
NA NA NA NA To be done
by unit
owner
C&D
1.17
Mandatory
installation of PTZ
Cameras in Hot
mix & ready-mix
plants with open
access to UPPCB
for remote
monitoring.
UPPCB /Hot mix
plant Agencies
No. Regular
Activity
NA NA 01 No of hot mix
plants having PTZ
camera installed
and accessed by
UPPCB Control
room
Not
required
NA NA NA NA To be done
by the unit
owner
C&D
1.18
New Hot mix
plants should be
permitted only on
LPG fuel.
Promotion of fuel
conversion to LPG
in existing Plants
UPPCB /Hot mix
plants Agencies
Nos. Regular
Activity
NA NA 01 List of Hot Mix
Plants using LPG
Not
required
NA NA NA NA To be done
by the unit
owner
*In case timeline extends to more than one year the annual targets must be fixed.
**Mention specific numeric identity to the attachment. Example- Attachment-1

135 | P a g e
VEHICLES
Act
ion
Po
int
Co
de
Act
ion
Po
int
De
pa
rtm
en
t/
Ag
en
cy
Fie
ld t
yp
e
To
tal
Ta
rge
t
Ta
rge
t D
ate
(T
ime
lin
e)
*An
nu
al
Ta
rge
t
**A
tta
chm
en
t N
o.
Att
ach
me
nt
Co
nte
nts
To
tal
Fu
nd
re
qu
ire
d (
Rs.
L
ak
h)
To
tal
Fu
nd
s A
llo
cate
d (
Rs.
L
ak
h)
Fu
nd
s re
lea
sed
(R
s. L
ak
h)
Fu
nd
s U
tili
zed
(R
s. L
ak
h)
Ad
dit
ion
al
Fu
nd
s R
eq
uir
ed
(R
s.
La
kh
)
So
urc
e o
f F
un
din
g
VE1 Improve and strengthen PUC programme
VE1.1 Number of
online PUC
centres in the
city
Transport
Department
Number 44 Target
Achieve
d
NA 01 List of PUC
centres
attached
Not
Required
NA NA NA NA Trans
port
Dept
Fundi
ng
VE1.2 Regular
checking of
Vehicular
emission and
issue of
Pollution
under Control
Certificate
(PUC)
Transport
Department/
Traffic Police
Number 2500/Month Regular
Activity
NA NA Vehicles are
being checked
by traffic
police on
regular basis
at 43
important
crossings all
over the city.
Not
Required
NA NA NA NA Trans
port
Dept
Fundi
ng/Tr
affic
Dept
Fundi
ng
VE1.3 Auditing and
reform of
Pollution
Under Control
(PUC)
certification
Transport
Department
Number 44/Quarter Regular
Activity
NA NA All the PUC
centres are
regularly
checked by
technical
officers &
monitoring is
being done
regularly.
Not
Required
NA NA NA NA Trans
port
Dept
Fundi
ng
VE1.4 linking of PUC
centres with
remote server
and eliminate
manual
intervention in
PUC testing.
Transport
Department
Number 44 Achieve
d
NA NA List of centres. Not
Required
NA NA NA NA Trans
port
Dept
Fundi
ng

136 | P a g e
Act
ion
Po
int
Co
de
Act
ion
Po
int
De
pa
rtm
en
t/
Ag
en
cy
Fie
ld t
yp
e
To
tal
Ta
rge
t
Ta
rge
t D
ate
(T
ime
lin
e)
*An
nu
al
Ta
rge
t
**A
tta
chm
en
t N
o.
Att
ach
me
nt
Co
nte
nts
To
tal
Fu
nd
re
qu
ire
d (
Rs.
L
ak
h)
To
tal
Fu
nd
s A
llo
cate
d (
Rs.
L
ak
h)
Fu
nd
s re
lea
sed
(R
s. L
ak
h)
Fu
nd
s U
tili
zed
(R
s. L
ak
h)
Ad
dit
ion
al
Fu
nd
s R
eq
uir
ed
(R
s.
La
kh
)
So
urc
e o
f F
un
din
g
VE1.5 Integrate on-
board
diagnostic
(OBD) system
fitted in new
vehicles with
vehicle
inspection
Vehicle
manufacturing
companies/
MoRTH
NA NA NA NA NA NA Not
Required
NA NA NA NA NA
VE1.6 Link PUC
certificates
with annual
vehicle
insurance
Transport
Department
Yes/No Issuance of
Notification
Achieve
d
NA 01 Notification
copy
Not
Required
NA NA NA NA Trans
port
Dept
Fundi
ng
VE2 Vehicle
labelling or
sticker
programme
Transport
Department
Yes/No Fixing of
coloured
stickers
having name
of the
registering
authority,
vehicle’s
registration
number,
laser
branded
permanent
identification
number and
date of
vehicle’s first
registration
Regular
Activity NA NA Details of
steps for
implementati
on
Not
Required
NA NA NA NA Trans
port
Dept
Fundi
ng

137 | P a g e
Act
ion
Po
int
Co
de
Act
ion
Po
int
De
pa
rtm
en
t/
Ag
en
cy
Fie
ld t
yp
e
To
tal
Ta
rge
t
Ta
rge
t D
ate
(T
ime
lin
e)
*An
nu
al
Ta
rge
t
**A
tta
chm
en
t N
o.
Att
ach
me
nt
Co
nte
nts
To
tal
Fu
nd
re
qu
ire
d (
Rs.
L
ak
h)
To
tal
Fu
nd
s A
llo
cate
d (
Rs.
L
ak
h)
Fu
nd
s re
lea
sed
(R
s. L
ak
h)
Fu
nd
s U
tili
zed
(R
s. L
ak
h)
Ad
dit
ion
al
Fu
nd
s R
eq
uir
ed
(R
s.
La
kh
)
So
urc
e o
f F
un
din
g
VE3 Freight transport
VE3.1 Use of off-peak
passenger
travel times to
move freight
and restrict the
entry of heavy
vehicles into
cities during
the day to
continue
Transport
Department/
Traffic Police
Yes/No No entry of
heavy
vehicles is
scheduled
for 7:00 AM
to 10:00 PM.
During this
period heavy
vehicles are
restricted at
City entry
point
Sahjanwa,
Nandanagar
and
Bargadwa.
Regular
Activity
NA 01 Details of
action against
the violating
freight
vehicles
Not
Required
NA NA NA NA Trans
port
Dept
Fundi
ng
VE3.2 Provide truck
rest
areas/parks
along national
and state
highways to
prevent entry
of trucks into
cities during
peak hours.
Transport
Department/
Nagar Nigam &
Development
Authorities
05 Proposed
parking for
non-destined
vehicle at
city
boundaries
during day
time.
NA NA NA 2 rest points
constructed
by NHAI in
Gorakhpur
city at NH-
21(NEW
Name- NH-
27), 05 other
locations have
also been
identified by
GDA and will
2898.6 - NA NA 2898.6 SBM/1
5th
Financ
e
commi
ssion

138 | P a g e
Act
ion
Po
int
Co
de
Act
ion
Po
int
De
pa
rtm
en
t/
Ag
en
cy
Fie
ld t
yp
e
To
tal
Ta
rge
t
Ta
rge
t D
ate
(T
ime
lin
e)
*An
nu
al
Ta
rge
t
**A
tta
chm
en
t N
o.
Att
ach
me
nt
Co
nte
nts
To
tal
Fu
nd
re
qu
ire
d (
Rs.
L
ak
h)
To
tal
Fu
nd
s A
llo
cate
d (
Rs.
L
ak
h)
Fu
nd
s re
lea
sed
(R
s. L
ak
h)
Fu
nd
s U
tili
zed
(R
s. L
ak
h)
Ad
dit
ion
al
Fu
nd
s R
eq
uir
ed
(R
s.
La
kh
)
So
urc
e o
f F
un
din
g
be developed
jointly by
NHAI/PWD
and GDA.
Details
attached as
Annexure
I(B).
VE3.4 Check
overloading:
Use weigh-in-
motion bridges
/ machines
(WIM) and
Weigh bridges
at entry points
to the city to
check the
payload of
commercial
vehicles. As per
the CMVR, a
penalty of 10
times the
applicable rate
for overloaded
vehicles is
applicable.
Transport
Department/
NHAI/ Road
Construction
Agencies
1 Achieved NA NA 01 131 overloded
vehicles
passed
through
Tendua toll
plaza during
January 2020
to December
2020. 10
times penalty
was
receovered
from 4
vehicles under
Central
motorvehicles
rules,1989.
Not
Required
NA NA NA NA NA

139 | P a g e
Act
ion
Po
int
Co
de
Act
ion
Po
int
De
pa
rtm
en
t/
Ag
en
cy
Fie
ld t
yp
e
To
tal
Ta
rge
t
Ta
rge
t D
ate
(T
ime
lin
e)
*An
nu
al
Ta
rge
t
**A
tta
chm
en
t N
o.
Att
ach
me
nt
Co
nte
nts
To
tal
Fu
nd
re
qu
ire
d (
Rs.
L
ak
h)
To
tal
Fu
nd
s A
llo
cate
d (
Rs.
L
ak
h)
Fu
nd
s re
lea
sed
(R
s. L
ak
h)
Fu
nd
s U
tili
zed
(R
s. L
ak
h)
Ad
dit
ion
al
Fu
nd
s R
eq
uir
ed
(R
s.
La
kh
)
So
urc
e o
f F
un
din
g
VE3.5 Define routes,
permits, fares,
vehicle design
and safety
standards, and
vehicle
technology
standards for
para-transit
vehicles.
Transport
Department/
Traffic Police
NH and
SH
NA Achieve
d
NA NA NA Not
Required
NA NA NA NA Trans
port
Dept
Fundi
ng
VE4 Clean fuel and fuel Quality
VE4.4 Use of
Bioethanol in
the city/urban
transport
system/waste
to energy.
Transport
Department/N
agar Nigam
NA NA NA NA NA NA Not
Required
NA NA NA NA NA
VE5 Parking Management
VE 5.1 Prevent
parking of
vehicles in the
non-
designated
areas
Traffic Police/
Nagar Nigam
Number Action Taken against the unauthorized parking
Regular Activity
NA 1 Action Taken Report
Not required
NA NA NA NA NA

140 | P a g e
Act
ion
Po
int
Co
de
Act
ion
Po
int
De
pa
rtm
en
t/
Ag
en
cy
Fie
ld t
yp
e
To
tal
Ta
rge
t
Ta
rge
t D
ate
(T
ime
lin
e)
*An
nu
al
Ta
rge
t
**A
tta
chm
en
t N
o.
Att
ach
me
nt
Co
nte
nts
To
tal
Fu
nd
re
qu
ire
d (
Rs.
L
ak
h)
To
tal
Fu
nd
s A
llo
cate
d (
Rs.
L
ak
h)
Fu
nd
s re
lea
sed
(R
s. L
ak
h)
Fu
nd
s U
tili
zed
(R
s. L
ak
h)
Ad
dit
ion
al
Fu
nd
s R
eq
uir
ed
(R
s.
La
kh
)
So
urc
e o
f F
un
din
g
VE 5.2 Multi-Layer
Parking
Nagar Nigam/
Development
Authorities
05 Multi-Layer parking proposed
30.06.2024
NA 1 01 No/4200 sqm (for 383 Cars Parking) is Under progress. 5 other multilayer parking locations viz. Near City Mall, Vijay Chauraha, Medical College, Bargadwa police Chowki and Betiyahata Chowk. have been identified in the city limits. Details Attached as Annexure I (C).
4321.70 16338.00
4321.70 -
2329.07 NA
1600.00 NA
2721.70 NA
State/Development Authority fund
VE6 Strengthening of Public Transportation

141 | P a g e
Act
ion
Po
int
Co
de
Act
ion
Po
int
De
pa
rtm
en
t/
Ag
en
cy
Fie
ld t
yp
e
To
tal
Ta
rge
t
Ta
rge
t D
ate
(T
ime
lin
e)
*An
nu
al
Ta
rge
t
**A
tta
chm
en
t N
o.
Att
ach
me
nt
Co
nte
nts
To
tal
Fu
nd
re
qu
ire
d (
Rs.
L
ak
h)
To
tal
Fu
nd
s A
llo
cate
d (
Rs.
L
ak
h)
Fu
nd
s re
lea
sed
(R
s. L
ak
h)
Fu
nd
s U
tili
zed
(R
s. L
ak
h)
Ad
dit
ion
al
Fu
nd
s R
eq
uir
ed
(R
s.
La
kh
)
So
urc
e o
f F
un
din
g
VE6.1 Regulate the
taxi industry
Transport
Department
Through
trade
certificat
e and
permit
for
issuing
such
typical
vehicles.
NA NA NA Yes Details on the
steps
Not
Required
NA NA NA NA Trans
port
Dept
Fundi
ng

142 | P a g e
Act
ion
Po
int
Co
de
Act
ion
Po
int
De
pa
rtm
en
t/
Ag
en
cy
Fie
ld t
yp
e
To
tal
Ta
rge
t
Ta
rge
t D
ate
(T
ime
lin
e)
*An
nu
al
Ta
rge
t
**A
tta
chm
en
t N
o.
Att
ach
me
nt
Co
nte
nts
To
tal
Fu
nd
re
qu
ire
d (
Rs.
L
ak
h)
To
tal
Fu
nd
s A
llo
cate
d (
Rs.
L
ak
h)
Fu
nd
s re
lea
sed
(R
s. L
ak
h)
Fu
nd
s U
tili
zed
(R
s. L
ak
h)
Ad
dit
ion
al
Fu
nd
s R
eq
uir
ed
(R
s.
La
kh
)
So
urc
e o
f F
un
din
g
VE6.7 Steps for
promoting
battery
operated
vehicles like E-
rickshaw/E-
Cart
Transport
Department/
Nagar Nigam &
Development
Authorities
NA NA NA NA NA Battery
operated E
rickshaws has
been
exempted
from
registration.
Registation
banned on
Diesel driven
auto rickshaw
in Gorakhpur
city. Only
CNG/PNG/Pet
rol driven
autorickshaw
has been
permitted.
Tender has
been invited
for operation
of 27 electric
buses.
Number of
CNG/LPG/pet
rol driven
autorickshaws
has been
restricted up
to 3125 only.
Not
Required
NA NA NA NA MNN
Fundi
ng

143 | P a g e
Act
ion
Po
int
Co
de
Act
ion
Po
int
De
pa
rtm
en
t/
Ag
en
cy
Fie
ld t
yp
e
To
tal
Ta
rge
t
Ta
rge
t D
ate
(T
ime
lin
e)
*An
nu
al
Ta
rge
t
**A
tta
chm
en
t N
o.
Att
ach
me
nt
Co
nte
nts
To
tal
Fu
nd
re
qu
ire
d (
Rs.
L
ak
h)
To
tal
Fu
nd
s A
llo
cate
d (
Rs.
L
ak
h)
Fu
nd
s re
lea
sed
(R
s. L
ak
h)
Fu
nd
s U
tili
zed
(R
s. L
ak
h)
Ad
dit
ion
al
Fu
nd
s R
eq
uir
ed
(R
s.
La
kh
)
So
urc
e o
f F
un
din
g
VE8 Launch Public
awareness
campaign for
air pollution
control,
vehicle
maintenance,
minimizing
use of
personal
vehicle, lane
discipline, etc.
transport
Department/
Traffic Police
No. of
program
mes
pertainin
g to
pollution
control
are
organise
d during
road
safety
weeks.
....... Regular
Activity
....... 01 Details of
Awareness
programmes
in different
crossings,
schools, and
other public
places are
regularly
conducted
from time to
time.
100 NA NA NA 10 Trans
port
Dept
Fundi
ng
VE9 Periodic
calibration
test of
vehicles
emission
monitoring
instruments
Transport
Department
Yes NA NA NA NA Online testing
of PUC has
been started
from
September
2019.
Transport
Commissioner
has order for
the
installation of
PUC centres at
every vehicle
dealer in their
workshop
Vide order
dated 20
November
2020.
Calibration of
PUC machines
Not
Required
NA NA NA NA NA

144 | P a g e
Act
ion
Po
int
Co
de
Act
ion
Po
int
De
pa
rtm
en
t/
Ag
en
cy
Fie
ld t
yp
e
To
tal
Ta
rge
t
Ta
rge
t D
ate
(T
ime
lin
e)
*An
nu
al
Ta
rge
t
**A
tta
chm
en
t N
o.
Att
ach
me
nt
Co
nte
nts
To
tal
Fu
nd
re
qu
ire
d (
Rs.
L
ak
h)
To
tal
Fu
nd
s A
llo
cate
d (
Rs.
L
ak
h)
Fu
nd
s re
lea
sed
(R
s. L
ak
h)
Fu
nd
s U
tili
zed
(R
s. L
ak
h)
Ad
dit
ion
al
Fu
nd
s R
eq
uir
ed
(R
s.
La
kh
)
So
urc
e o
f F
un
din
g
is done once
in a year.
VE10 To check the
calibration of
emission
monitoring
equipments,
housed in
Emission
Testing
Centers
(ETCs) once in
6 months to
know the
status of
equipments
Transport
Department
Yes NA NA NA Yes Details on the
test
conducted
Not
Required
NA NA NA NA NA
VE11 Phase out old
vehicles and
vehicle
scrappage
policy
transport
Department
Decided
by
STA/RT
A
NA NA NA NA NA Not
Required
NA NA NA NA Trans
port
Dept
Fundi
ng

145 | P a g e
Act
ion
Po
int
Co
de
Act
ion
Po
int
De
pa
rtm
en
t/
Ag
en
cy
Fie
ld t
yp
e
To
tal
Ta
rge
t
Ta
rge
t D
ate
(T
ime
lin
e)
*An
nu
al
Ta
rge
t
**A
tta
chm
en
t N
o.
Att
ach
me
nt
Co
nte
nts
To
tal
Fu
nd
re
qu
ire
d (
Rs.
L
ak
h)
To
tal
Fu
nd
s A
llo
cate
d (
Rs.
L
ak
h)
Fu
nd
s re
lea
sed
(R
s. L
ak
h)
Fu
nd
s U
tili
zed
(R
s. L
ak
h)
Ad
dit
ion
al
Fu
nd
s R
eq
uir
ed
(R
s.
La
kh
)
So
urc
e o
f F
un
din
g
VE11.1 Inspection
/maintenance
to all BSII & BS
III
Transport
Department
Under
process
NA NA NA NA Inspection of
commercial
Vehicles is
done by RI
(Tech) in
office as per
norms for
private
vehicles. It is
the
responsibility
of vehicle
owner
Not
Required
NA NA NA NA Trans
port
Dept
Fundi
ng
VE11.2 Restriction on
plying and
phasing out of
15 years old
commercial
diesel driven
vehicles.
Transport
Department
Yes NA NA NA NA Action will be
taken after
receiving the
directions
from the Head
office.
Not
Required
NA NA NA NA Trans
port
Dept
Fundi
ng
VE11.3 Enforcement of
law against
visibly
polluting
vehicles:
remove them
Transport
Department
757
vehicles
in year
2020-21
NA NA NA NA Details on the
drives
conducted
Not
Required
NA NA NA NA Trans
port
Dept
Fundi
ng

146 | P a g e
Act
ion
Po
int
Co
de
Act
ion
Po
int
De
pa
rtm
en
t/
Ag
en
cy
Fie
ld t
yp
e
To
tal
Ta
rge
t
Ta
rge
t D
ate
(T
ime
lin
e)
*An
nu
al
Ta
rge
t
**A
tta
chm
en
t N
o.
Att
ach
me
nt
Co
nte
nts
To
tal
Fu
nd
re
qu
ire
d (
Rs.
L
ak
h)
To
tal
Fu
nd
s A
llo
cate
d (
Rs.
L
ak
h)
Fu
nd
s re
lea
sed
(R
s. L
ak
h)
Fu
nd
s U
tili
zed
(R
s. L
ak
h)
Ad
dit
ion
al
Fu
nd
s R
eq
uir
ed
(R
s.
La
kh
)
So
urc
e o
f F
un
din
g
from road,
impose
penalty, and
launch
extensive
awareness
drive against
polluting
vehicles.
VE11.5 To increase
fine on vehicle
owners (not
drivers) where
the visible
smoke is
emitted and
noticed.
Transport
Department
Yes/No Rs. 10000/-
(fine has
been
increased up
to 10 times)
Achieve
d
NA 01 As per the
Motor Vehicle
Act,1989 and
amendments
from time to
time.
Not
Required
NA NA NA NA

147 | P a g e
Act
ion
Po
int
Co
de
Act
ion
Po
int
De
pa
rtm
en
t/
Ag
en
cy
Fie
ld t
yp
e
To
tal
Ta
rge
t
Ta
rge
t D
ate
(T
ime
lin
e)
*An
nu
al
Ta
rge
t
**A
tta
chm
en
t N
o.
Att
ach
me
nt
Co
nte
nts
To
tal
Fu
nd
re
qu
ire
d (
Rs.
L
ak
h)
To
tal
Fu
nd
s A
llo
cate
d (
Rs.
L
ak
h)
Fu
nd
s re
lea
sed
(R
s. L
ak
h)
Fu
nd
s U
tili
zed
(R
s. L
ak
h)
Ad
dit
ion
al
Fu
nd
s R
eq
uir
ed
(R
s.
La
kh
)
So
urc
e o
f F
un
din
g
VE11.7 The restriction
on use of two
stroke vehicles
in phased
manner (2-
Stroke, 3-
stroke)
Tranport
Department
Yes/No Such types of
vehicles are
eliminated.
Achieve
d
NA NA As per NGT
order, use of
diesel vehicle
older than 10
years and
petrol vehicle
more than 15
years old is
restricted.
Registration
certificate of
Non-
Transport
Vehicle falling
in this
category has
been
suspended.
Currently
there is no
provision for
restricting use
of vehicle on
the basis of
engine stroke
type
Not
Required
NA NA NA NA Trans
port
Dept
Fundi
ng
*In case timeline extends to more than one year the annual targets must be fixed.
**Mention specific numeric identity to the attachment. Example- Attachment-1

148 | P a g e
INDUSTRIES A
ctio
n P
oin
t C
od
e
Act
ion
Po
int
De
pa
rtm
en
t/
Ag
en
cy
Fie
ld t
yp
e
To
tal
Ta
rge
t
Ta
rge
t D
ate
(T
ime
lin
e)
*An
nu
al
Ta
rge
t
**A
tta
chm
en
t N
o.
Att
ach
me
nt
Co
nte
nts
To
tal
Fu
nd
re
qu
ire
d (
Rs.
L
ak
h)
To
tal
Fu
nd
s A
llo
cate
d (
Rs.
L
ak
h)
Fu
nd
s re
lea
sed
(R
s.
La
kh
)
Fu
nd
s U
tili
zed
(R
s.
La
kh
)
Ad
dit
ion
al
Fu
nd
s R
eq
uir
ed
(R
s.
La
kh
)
So
urc
e o
f F
un
din
g
IP1 Industrial air pollution control
IP1.1 To intensify
monitoring of
industries to
reduce of
emission by the
industries.
UPPCB No. 49 31.12.2021 49 Yes Total Air
polluting
industries in
Gorakhpur are
49 and their
monitoring is
being done
time to time by
this office.
Not
Requir
ed
NA NA NA NA NA
IP1.2 Action against
non-complying
industrial units
UPPCB No. 05 ongoing ongoin
g
Yes Inspections of
industries are
being done on
regular basis
and find the
defaulter of the
industries
action is taken
under section
31A of air
pollution
(Prevention
and control)
act 1981 as
amended by
UPPCB
Not
Requir
ed
NA NA NA NA NA
IP1.3 Shifting/Closing
of Polluting
Industries from
non-conforming
Department
of
Infrastructur
e &
No. 0 31.03.2024 0 Yes A team shall be
constituted by
DM along with
concerned
Not
Requir
ed
NA NA NA NA NA

149 | P a g e
Act
ion
Po
int
Co
de
Act
ion
Po
int
De
pa
rtm
en
t/
Ag
en
cy
Fie
ld t
yp
e
To
tal
Ta
rge
t
Ta
rge
t D
ate
(T
ime
lin
e)
*An
nu
al
Ta
rge
t
**A
tta
chm
en
t N
o.
Att
ach
me
nt
Co
nte
nts
To
tal
Fu
nd
re
qu
ire
d (
Rs.
L
ak
h)
To
tal
Fu
nd
s A
llo
cate
d (
Rs.
L
ak
h)
Fu
nd
s re
lea
sed
(R
s.
La
kh
)
Fu
nd
s U
tili
zed
(R
s.
La
kh
)
Ad
dit
ion
al
Fu
nd
s R
eq
uir
ed
(R
s.
La
kh
)
So
urc
e o
f F
un
din
g
to conforming
area
Industrial
Developmen
t/UPPCB/Dis
trict
Administrati
on
departments
and ensure the
shifting of
polluting
industries
from non-
confirming to
confirming
area up to
31.03.2024
IP1.5 Auditing for Air
pollution
measures and
Online reporting
systems in the
industrial
sectors namely
Slaughter
houses, Sugar
industries,
Textile
industries,
Distilleries, Steel
plant, Pulp &
paper industries
UPPCB No. 49 49 Yes There are 49
Air polluting
industries in
Gorakhpur. All
49 industries
are installed
with air
pollution
control System
for controlling
air pollution
such as ESP,
Wet scrubber,
Multicyclone
dust collector,
bag filters etc.
Continuous
Emission
monitoring
system which
connects to
CPCB or
UPPCB server
also installed
in only 06
Not
Requir
ed
NA NA NA NA NA

150 | P a g e
Act
ion
Po
int
Co
de
Act
ion
Po
int
De
pa
rtm
en
t/
Ag
en
cy
Fie
ld t
yp
e
To
tal
Ta
rge
t
Ta
rge
t D
ate
(T
ime
lin
e)
*An
nu
al
Ta
rge
t
**A
tta
chm
en
t N
o.
Att
ach
me
nt
Co
nte
nts
To
tal
Fu
nd
re
qu
ire
d (
Rs.
L
ak
h)
To
tal
Fu
nd
s A
llo
cate
d (
Rs.
L
ak
h)
Fu
nd
s re
lea
sed
(R
s.
La
kh
)
Fu
nd
s U
tili
zed
(R
s.
La
kh
)
Ad
dit
ion
al
Fu
nd
s R
eq
uir
ed
(R
s.
La
kh
)
So
urc
e o
f F
un
din
g
units.
IP1.10 Ensuring
installation/Up-
gradation and
operation of air
pollution control
devices in
industries
UPPCB No. 24 31.03.2021
Yes During the
emission
inventory
survey total 49
air polluting
industries
have been
identified. Out
of these only
25 industries
have APCS
installed. The
remaining 24
industries
having
sufficient stack
height.
Additional
APCS not
required.
Not
Requir
ed
NA NA NA NA NA

151 | P a g e
Act
ion
Po
int
Co
de
Act
ion
Po
int
De
pa
rtm
en
t/
Ag
en
cy
Fie
ld t
yp
e
To
tal
Ta
rge
t
Ta
rge
t D
ate
(T
ime
lin
e)
*An
nu
al
Ta
rge
t
**A
tta
chm
en
t N
o.
Att
ach
me
nt
Co
nte
nts
To
tal
Fu
nd
re
qu
ire
d (
Rs.
L
ak
h)
To
tal
Fu
nd
s A
llo
cate
d (
Rs.
L
ak
h)
Fu
nd
s re
lea
sed
(R
s.
La
kh
)
Fu
nd
s U
tili
zed
(R
s.
La
kh
)
Ad
dit
ion
al
Fu
nd
s R
eq
uir
ed
(R
s.
La
kh
)
So
urc
e o
f F
un
din
g
IP1.11 Action/closure
against
defaulting/unau
thorized
industrial units.
UPPCB No. NA Regular
activity
NA Yes This is a
regular activity
to identify the
defaulting
units and
action is taken
time to time by
the regional
office,
Gorakhpur.
Action is taken
against 05
defaulter unit
under section
31A of air
pollution
(Prevention
and control)
act 1981 as
amended by
UPPCB
Not
Requir
ed
NA NA NA NA NA
IP1.12 Ensuring
emission
standards in
industries
UPPCB No. 49 ongoing 49 Yes The Air
polluting
industries
situated in
Gorakhpur
already
installed/up-
graded with air
pollution
control
Not
Requir
ed
NA NA NA NA NA

152 | P a g e
Act
ion
Po
int
Co
de
Act
ion
Po
int
De
pa
rtm
en
t/
Ag
en
cy
Fie
ld t
yp
e
To
tal
Ta
rge
t
Ta
rge
t D
ate
(T
ime
lin
e)
*An
nu
al
Ta
rge
t
**A
tta
chm
en
t N
o.
Att
ach
me
nt
Co
nte
nts
To
tal
Fu
nd
re
qu
ire
d (
Rs.
L
ak
h)
To
tal
Fu
nd
s A
llo
cate
d (
Rs.
L
ak
h)
Fu
nd
s re
lea
sed
(R
s.
La
kh
)
Fu
nd
s U
tili
zed
(R
s.
La
kh
)
Ad
dit
ion
al
Fu
nd
s R
eq
uir
ed
(R
s.
La
kh
)
So
urc
e o
f F
un
din
g
devices. All
these air
polluting
industries are
monitored by
UPPCB time to
time
IP1.14 Measures taken
for location
specific
Emission
reduction.
UPPCB No. 49 Regular
activity
49 Yes Details of
locations
considered
Not
Requir
ed
NA NA NA NA NA
IP1.26 Bank guarantee
should be taken
for the
compliance of
conditions
imposed in
CTO/CTE for
control of
Environmental
Pollution from
industries.
UPPCB Yes NA Regular
activity
NA NA Bank
guarantee shall
be taken for
the compliance
of conditions
imposed in
CTO/CTE for
control of
Environmental
pollution from
industries
Not
Requir
ed
NA NA NA NA NA

153 | P a g e
Act
ion
Po
int
Co
de
Act
ion
Po
int
De
pa
rtm
en
t/
Ag
en
cy
Fie
ld t
yp
e
To
tal
Ta
rge
t
Ta
rge
t D
ate
(T
ime
lin
e)
*An
nu
al
Ta
rge
t
**A
tta
chm
en
t N
o.
Att
ach
me
nt
Co
nte
nts
To
tal
Fu
nd
re
qu
ire
d (
Rs.
L
ak
h)
To
tal
Fu
nd
s A
llo
cate
d (
Rs.
L
ak
h)
Fu
nd
s re
lea
sed
(R
s.
La
kh
)
Fu
nd
s U
tili
zed
(R
s.
La
kh
)
Ad
dit
ion
al
Fu
nd
s R
eq
uir
ed
(R
s.
La
kh
)
So
urc
e o
f F
un
din
g
IP1.28 Implementation
of SOx and NOx
standards
notified by
MOEF&CC
UPPCB Yes NA Achieved NA Yes SOx and NOx
standards for
industries
notified by
MoEF& CC
notification
GSR 96(E)
dated
29.01.2018 has
been
implemented.
Not
Requir
ed
NA NA NA NA NA
IP1.29 Prepare and
implement local
area action plan
for pollution
hotspots and
strict
enforcement of
air pollution
control
measures in all
District
Administrati
on/ Nagar
Nigam/UPPC
B/GDA/NHA
I/PWD/DIC
Yes NA NA NA Yes Implementatio
n for pollution
hotspots, a
inspection
team will be
constituted by
DM Gorakhpur
to have a
surveillance on
industries and
Not
Requir
ed
NA NA NA NA NA

154 | P a g e
Act
ion
Po
int
Co
de
Act
ion
Po
int
De
pa
rtm
en
t/
Ag
en
cy
Fie
ld t
yp
e
To
tal
Ta
rge
t
Ta
rge
t D
ate
(T
ime
lin
e)
*An
nu
al
Ta
rge
t
**A
tta
chm
en
t N
o.
Att
ach
me
nt
Co
nte
nts
To
tal
Fu
nd
re
qu
ire
d (
Rs.
L
ak
h)
To
tal
Fu
nd
s A
llo
cate
d (
Rs.
L
ak
h)
Fu
nd
s re
lea
sed
(R
s.
La
kh
)
Fu
nd
s U
tili
zed
(R
s.
La
kh
)
Ad
dit
ion
al
Fu
nd
s R
eq
uir
ed
(R
s.
La
kh
)
So
urc
e o
f F
un
din
g
industries,
including those
located in
unauthorized
areas.
a team along
with
concerned
depts for those
industries
which located
in
unauthorized
area shall be
constituted as
soon as
possible.
IP1.30 Assess the
number of
industrial units
that are non-
compliant and
prepare
unit/plant wise
action plan for
time bound
compliance or
be shut down.
UPPCB Yes/
No
Regular
activity
NA NA Yes Details on the
action
undertaken
Not
Requir
ed
IP1.32 Industrial units
to install water
spraying system
of internal roads
and washing of
tyres of vehicles
UPPCB Yes Installatio
n of Water
spraying
system.
31.03.2021 NA Yes NA Not
Requir
ed
NIL NIL NIL NI
L
Indust
rial
units

155 | P a g e
Act
ion
Po
int
Co
de
Act
ion
Po
int
De
pa
rtm
en
t/
Ag
en
cy
Fie
ld t
yp
e
To
tal
Ta
rge
t
Ta
rge
t D
ate
(T
ime
lin
e)
*An
nu
al
Ta
rge
t
**A
tta
chm
en
t N
o.
Att
ach
me
nt
Co
nte
nts
To
tal
Fu
nd
re
qu
ire
d (
Rs.
L
ak
h)
To
tal
Fu
nd
s A
llo
cate
d (
Rs.
L
ak
h)
Fu
nd
s re
lea
sed
(R
s.
La
kh
)
Fu
nd
s U
tili
zed
(R
s.
La
kh
)
Ad
dit
ion
al
Fu
nd
s R
eq
uir
ed
(R
s.
La
kh
)
So
urc
e o
f F
un
din
g
IP1.33 Monitoring of
Cane Kolhus for
compliance of
CPCB guidelines.
UPPCB Yes NA 31.05.2022 NA NA Monitoring of
cane kolhus for
compliance of
CPCB
guidelines
shall be done
up to
31.05.2022
Not
Requir
ed
NA NA NA NA NA
IP1.34 Support to Cane
Kolhus for
installation of
appropriate Air
Pollution
Control System
UPPCB/
Cane
Department
Yes NA NA NA NA To support
cane kolhus for
installation of
appropriate
Air Pollution
Control System
as per CPCB
guidelines, a
workshop shall
be organized
with the help
of cane dept
and initiate the
installation of
APCS
Not
Requir
ed
NA NA NA NA NA
IP1.35 To conduct
feasibility study
to phase out
small boilers in
Industrial
Clusters in GIDA
by centralized
steam supply
system
UPSIDA,
GDA, DIC
Yes 31.12.2021 NA Yes TOR of the
proposed
study
10
Lakhs
_ NA NA NA Own
Resour
ces of
Firms
IP3 OCEMS in Industries

156 | P a g e
Act
ion
Po
int
Co
de
Act
ion
Po
int
De
pa
rtm
en
t/
Ag
en
cy
Fie
ld t
yp
e
To
tal
Ta
rge
t
Ta
rge
t D
ate
(T
ime
lin
e)
*An
nu
al
Ta
rge
t
**A
tta
chm
en
t N
o.
Att
ach
me
nt
Co
nte
nts
To
tal
Fu
nd
re
qu
ire
d (
Rs.
L
ak
h)
To
tal
Fu
nd
s A
llo
cate
d (
Rs.
L
ak
h)
Fu
nd
s re
lea
sed
(R
s.
La
kh
)
Fu
nd
s U
tili
zed
(R
s.
La
kh
)
Ad
dit
ion
al
Fu
nd
s R
eq
uir
ed
(R
s.
La
kh
)
So
urc
e o
f F
un
din
g
IP3.1 There should
be provision
to use CEMS
data as legal
evidence and
a policy be
framed in
consultation
with Central
Pollution
Control
Board.
CPCB/UPPCB Yes NA 31.12.2021 NA Yes Yes Not
Requir
ed
NA NA NA NA NA
IP3.5 Monitoring of
industrial
emission
including
real time
online
monitoring
through
OCEMS
(Online
Continuous
Emission
Monitoring
System) and
live camera
feed and to
take action
against non-
complying
industrial
units
UPPCB No. Achieved Continuous
process
NA yes OCEMS
installed by 06
polluting
industries.
Not
Requir
ed
NA NA NA NA NA
IP4 Clean fuel in industries

157 | P a g e
Act
ion
Po
int
Co
de
Act
ion
Po
int
De
pa
rtm
en
t/
Ag
en
cy
Fie
ld t
yp
e
To
tal
Ta
rge
t
Ta
rge
t D
ate
(T
ime
lin
e)
*An
nu
al
Ta
rge
t
**A
tta
chm
en
t N
o.
Att
ach
me
nt
Co
nte
nts
To
tal
Fu
nd
re
qu
ire
d (
Rs.
L
ak
h)
To
tal
Fu
nd
s A
llo
cate
d (
Rs.
L
ak
h)
Fu
nd
s re
lea
sed
(R
s.
La
kh
)
Fu
nd
s U
tili
zed
(R
s.
La
kh
)
Ad
dit
ion
al
Fu
nd
s R
eq
uir
ed
(R
s.
La
kh
)
So
urc
e o
f F
un
din
g
IP4.1 Introduction and
shifting towards
cleaner fuels in
industries where
PNG supply is
available
Department
of
Infrastructur
e and
Industrial
Development
/UPSIDA/GG
IL
No. 49 06 months
after the
availability
of PNG/CNG
NA NO Direction has
been issued to
UPSEIDA to
ensure
availability of
cleaner fuel in
Industrial area
GIDA by
Department of
Infrastructure
and Industrial
Development
Not
Requir
ed
NA NA NA NA NA
IP4.2 Conversion to
CNG/PNG from
wood / coal and
other agro and
fossil fuels.
Department
of
Infrastructur
e and
Industrial
Development
/UPSIDA/GG
IL
No. 49 06 months
after the
availability
of PNG/CNG
NA NO Direction has
been issued to
UPSEIDA to
ensure
availability of
cleaner fuel in
Industrial area
GIDA by
Department of
Infrastructure
and Industrial
Development.
Not
Requir
ed
NA NA NA NA NA
IP4.4 Establish a
protocol for
using cleaner
fuels &
technology in
industries
Department
of
Environment
, Forest &
Climate
Change U.P.
& UPPCB
Yes NA NA NA Yes Yes Not
Requir
ed

158 | P a g e
Act
ion
Po
int
Co
de
Act
ion
Po
int
De
pa
rtm
en
t/
Ag
en
cy
Fie
ld t
yp
e
To
tal
Ta
rge
t
Ta
rge
t D
ate
(T
ime
lin
e)
*An
nu
al
Ta
rge
t
**A
tta
chm
en
t N
o.
Att
ach
me
nt
Co
nte
nts
To
tal
Fu
nd
re
qu
ire
d (
Rs.
L
ak
h)
To
tal
Fu
nd
s A
llo
cate
d (
Rs.
L
ak
h)
Fu
nd
s re
lea
sed
(R
s.
La
kh
)
Fu
nd
s U
tili
zed
(R
s.
La
kh
)
Ad
dit
ion
al
Fu
nd
s R
eq
uir
ed
(R
s.
La
kh
)
So
urc
e o
f F
un
din
g
IP4.5 Restriction on
using un-
authorised fuels
in industries
such as rubber,
polythene, cotton
bags, etc. and
other dirty fuels.
UPSIDA/DIC
/UPPCB
Yes NA Achieved NA Yes Already
restricted on
using
unauthorised
fuels in
industries and
actions are
being taken on
defaulters as
per norms.
Not
Requir
ed
NA NA NA N
A
UPPC
B
Fund
IP4.8 Preparation and
implementation
of Industrial
hotspot action
plan
UPPCB,
UPSIDA & DI
Yes 3 31.06.2021 NA Yes Progress of
implementatio
n
Not
Requir
ed
NA NA NA NA NA
IP5 Control of air
pollution from
Brick kilns
IP5.1 Adapting new
technologies for
Brick kilns
UPPCB No. 228 Timeline for
Zig-Zag
technology is
not given by
CPCB in
other than
NCR cities.
228 yes 228 brick kilns
are situated in
Gorakhpur. 78
brick kilns are
already
converted to
Zig Zag.
Not
Requir
ed
NA NA NA NA UPPCB
Fund
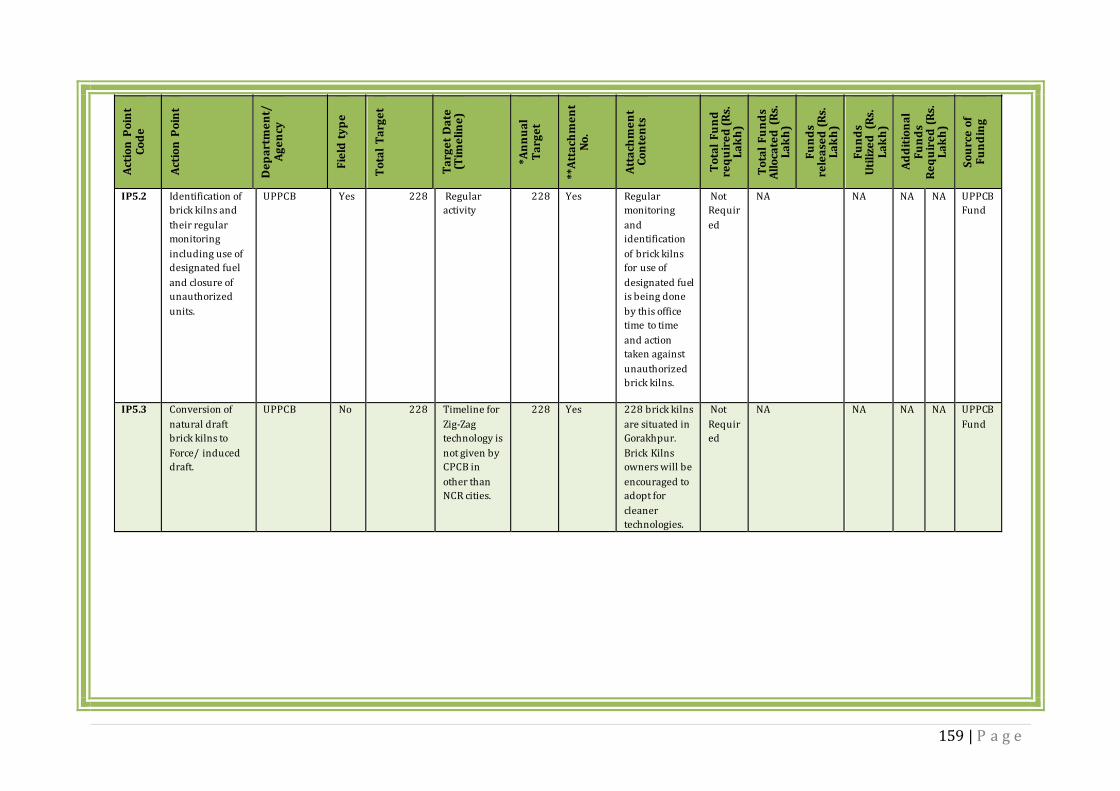
159 | P a g e
Act
ion
Po
int
Co
de
Act
ion
Po
int
De
pa
rtm
en
t/
Ag
en
cy
Fie
ld t
yp
e
To
tal
Ta
rge
t
Ta
rge
t D
ate
(T
ime
lin
e)
*An
nu
al
Ta
rge
t
**A
tta
chm
en
t N
o.
Att
ach
me
nt
Co
nte
nts
To
tal
Fu
nd
re
qu
ire
d (
Rs.
L
ak
h)
To
tal
Fu
nd
s A
llo
cate
d (
Rs.
L
ak
h)
Fu
nd
s re
lea
sed
(R
s.
La
kh
)
Fu
nd
s U
tili
zed
(R
s.
La
kh
)
Ad
dit
ion
al
Fu
nd
s R
eq
uir
ed
(R
s.
La
kh
)
So
urc
e o
f F
un
din
g
IP5.2 Identification of
brick kilns and
their regular
monitoring
including use of
designated fuel
and closure of
unauthorized
units.
UPPCB Yes 228 Regular
activity
228 Yes Regular
monitoring
and
identification
of brick kilns
for use of
designated fuel
is being done
by this office
time to time
and action
taken against
unauthorized
brick kilns.
Not
Requir
ed
NA NA NA NA UPPCB
Fund
IP5.3 Conversion of
natural draft
brick kilns to
Force/ induced
draft.
UPPCB No 228 Timeline for
Zig-Zag
technology is
not given by
CPCB in
other than
NCR cities.
228 Yes 228 brick kilns
are situated in
Gorakhpur.
Brick Kilns
owners will be
encouraged to
adopt for
cleaner
technologies.
Not
Requir
ed
NA NA NA NA UPPCB
Fund

160 | P a g e
Act
ion
Po
int
Co
de
Act
ion
Po
int
De
pa
rtm
en
t/
Ag
en
cy
Fie
ld t
yp
e
To
tal
Ta
rge
t
Ta
rge
t D
ate
(T
ime
lin
e)
*An
nu
al
Ta
rge
t
**A
tta
chm
en
t N
o.
Att
ach
me
nt
Co
nte
nts
To
tal
Fu
nd
re
qu
ire
d (
Rs.
L
ak
h)
To
tal
Fu
nd
s A
llo
cate
d (
Rs.
L
ak
h)
Fu
nd
s re
lea
sed
(R
s.
La
kh
)
Fu
nd
s U
tili
zed
(R
s.
La
kh
)
Ad
dit
ion
al
Fu
nd
s R
eq
uir
ed
(R
s.
La
kh
)
So
urc
e o
f F
un
din
g
IP5.4 Closure of
unauthorized
units by seeking
the possibility for
shifting of kilns
outside
corporation
limits. This
should be
replaced as
"Closure of brick
kilns not
conforming the
siting guidelines
of UP Govt." as
shifting is not
possible
UPPCB Nil Nil Nil Nil Nil If this type of
situation is
identified then
immediate
action shall be
initiated.
Not
Requir
ed
NA NA NA NA
IP5.5 Prescribe design
specifications for
improved kilns
and ensure
compliance
checking to know
that conversion
has actually
taken place.
UPPCB Yes 228 Timeline for
Zig-Zag
technology is
not given by
CPCB in
other than
NCR cities.
Yes All the officers
have been
instructed to
ensure
compliance for
checking to
know that
brick klins
actually
converted into
prescribed
design or not.
In case of
defaulting
action shall be
taken.
Not
Requir
ed
NA NA NA NA UPPCB
Fund

161 | P a g e
Act
ion
Po
int
Co
de
Act
ion
Po
int
De
pa
rtm
en
t/
Ag
en
cy
Fie
ld t
yp
e
To
tal
Ta
rge
t
Ta
rge
t D
ate
(T
ime
lin
e)
*An
nu
al
Ta
rge
t
**A
tta
chm
en
t N
o.
Att
ach
me
nt
Co
nte
nts
To
tal
Fu
nd
re
qu
ire
d (
Rs.
L
ak
h)
To
tal
Fu
nd
s A
llo
cate
d (
Rs.
L
ak
h)
Fu
nd
s re
lea
sed
(R
s.
La
kh
)
Fu
nd
s U
tili
zed
(R
s.
La
kh
)
Ad
dit
ion
al
Fu
nd
s R
eq
uir
ed
(R
s.
La
kh
)
So
urc
e o
f F
un
din
g
IP5.6 To identify the
clusters of brick
kilns including
upwind &
downwind
monitoring
locations for
ambient air
quality
monitoring.
UPPCB No. NA April. 2021 NA NA Piprauli and
Jungle Kaudia,
in upwind
direction and
Sardaar nagar,
in downwind
direction has
been identified
as major
clusters of
Brick kilns.
Not
Requir
ed
NA NA NA NA
IP5.7 To impose
cluster pollution
responsibility
conditions in the
Consent to
Operate of brick
kilns in the
clusters after due
consultation with
brick kilns
operators
UPPCB No. NA Dec.2021 NA NA Copy of
Direction
Not
Requir
ed
NA NA NA NA NA
IP11 Control of air
pollution from
generator sets
IP11.1 Allow only DG
sets meeting
emission and
design of
chimney/
exhaust, acoustic
enclosures
UPPCB/
Nagar
Nigam/Elect
rical Safety
Department
Yes Regular
activity
NA NA Yes Yes and
industries are
equiped with
DG sets having
accoustic
enclosure and
appropriate
Not
Requir
ed
NA NA NA NA Indust
ry
resour
ces

162 | P a g e
Act
ion
Po
int
Co
de
Act
ion
Po
int
De
pa
rtm
en
t/
Ag
en
cy
Fie
ld t
yp
e
To
tal
Ta
rge
t
Ta
rge
t D
ate
(T
ime
lin
e)
*An
nu
al
Ta
rge
t
**A
tta
chm
en
t N
o.
Att
ach
me
nt
Co
nte
nts
To
tal
Fu
nd
re
qu
ire
d (
Rs.
L
ak
h)
To
tal
Fu
nd
s A
llo
cate
d (
Rs.
L
ak
h)
Fu
nd
s re
lea
sed
(R
s.
La
kh
)
Fu
nd
s U
tili
zed
(R
s.
La
kh
)
Ad
dit
ion
al
Fu
nd
s R
eq
uir
ed
(R
s.
La
kh
)
So
urc
e o
f F
un
din
g
standards to
operate
height of
chimneys.
IP11.2 Curtail use of DG
Sets in social
events by
providing
temporary
electric
connections and
uninterrupted
power supply
U.P. Power
Corporation
Ltd.
Yes NA NA NA Yes UPPCL should
ensuring
availability of
24 hrs power
supply to the
consumers. It
is further to
add that on
occasion of any
social event in
Gorakhpur
town
temporary
connection are
released on
demand of
organisers.
Not
Requir
ed
NA NA NA NA PVVN
L
Fundi
ng/
owner
fundin
g
IP12 Control of air
pollution from
waste
incineration

163 | P a g e
Act
ion
Po
int
Co
de
Act
ion
Po
int
De
pa
rtm
en
t/
Ag
en
cy
Fie
ld t
yp
e
To
tal
Ta
rge
t
Ta
rge
t D
ate
(T
ime
lin
e)
*An
nu
al
Ta
rge
t
**A
tta
chm
en
t N
o.
Att
ach
me
nt
Co
nte
nts
To
tal
Fu
nd
re
qu
ire
d (
Rs.
L
ak
h)
To
tal
Fu
nd
s A
llo
cate
d (
Rs.
L
ak
h)
Fu
nd
s re
lea
sed
(R
s.
La
kh
)
Fu
nd
s U
tili
zed
(R
s.
La
kh
)
Ad
dit
ion
al
Fu
nd
s R
eq
uir
ed
(R
s.
La
kh
)
So
urc
e o
f F
un
din
g
IP12.2 Implement CEMS
for incinerators
and provide data
on emissions on
an open platform
Nagar
Nigam/UPPC
B/CPCB
No. 0 NA NA NA No incinerator
is situated in
Gorakhpur and
provide the
data of
emission to
CPCB or
UPPCB and on
an open
platform.
Not
Requir
ed
NA NA NA NA
NA
IP13 Renewable
Energy
IP13.2 Identify and
target
commercial and
industrial
establishments
for installation of
roof top solar
system
Non-
Conventional
Energy
Development
Agency
(NEDA)
MW 2 MW 31-03-2025 0.4
MW
No No Not
Requir
ed
NA NA NA NA Depart
mental
fundin
g
IP13.4 Organise
consumer
outreach
programme for
roof top solar
programme
Non-
Conventional
Energy
Development
Agency
(NEDA)
YES 40 NO.
SEMINAR/
MEETING
TO BE
ORGANISE
D along
with
Lectures
31-03-2025 8 NO No Details on the
action
undertaken
80
Lacs
- NA NA 80
La
cs
World
bank
Source
s.

164 | P a g e
Act
ion
Po
int
Co
de
Act
ion
Po
int
De
pa
rtm
en
t/
Ag
en
cy
Fie
ld t
yp
e
To
tal
Ta
rge
t
Ta
rge
t D
ate
(T
ime
lin
e)
*An
nu
al
Ta
rge
t
**A
tta
chm
en
t N
o.
Att
ach
me
nt
Co
nte
nts
To
tal
Fu
nd
re
qu
ire
d (
Rs.
L
ak
h)
To
tal
Fu
nd
s A
llo
cate
d (
Rs.
L
ak
h)
Fu
nd
s re
lea
sed
(R
s.
La
kh
)
Fu
nd
s U
tili
zed
(R
s.
La
kh
)
Ad
dit
ion
al
Fu
nd
s R
eq
uir
ed
(R
s.
La
kh
)
So
urc
e o
f F
un
din
g
and
Literature,
&
refreshmen
t to all
related
targeted
groups/con
sumers.
IP14 Accelerate the
technological
transformation
of enterprises
and improve
their
technological
innovation
capabilities
NA NA NA NA NA NA NA Not
Requir
ed
NA NA NA NA NA

165 | P a g e
Act
ion
Po
int
Co
de
Act
ion
Po
int
De
pa
rtm
en
t/
Ag
en
cy
Fie
ld t
yp
e
To
tal
Ta
rge
t
Ta
rge
t D
ate
(T
ime
lin
e)
*An
nu
al
Ta
rge
t
**A
tta
chm
en
t N
o.
Att
ach
me
nt
Co
nte
nts
To
tal
Fu
nd
re
qu
ire
d (
Rs.
L
ak
h)
To
tal
Fu
nd
s A
llo
cate
d (
Rs.
L
ak
h)
Fu
nd
s re
lea
sed
(R
s.
La
kh
)
Fu
nd
s U
tili
zed
(R
s.
La
kh
)
Ad
dit
ion
al
Fu
nd
s R
eq
uir
ed
(R
s.
La
kh
)
So
urc
e o
f F
un
din
g
IP14.1 Establishment of
Knowledge
Centre for
promotion of
technological
transformation
for
desulfurization,
denitrification,
efficient dust
removal, volatile
organic
compound
control, diesel
engine (vehicle)
emission
purification,
environmental
monitoring, and
new energy
vehicles, smart
grids, etc.
UPSIDA, DIC,
Industrial
Associations,
Transport
Department
Yes Establishm
ent of
Knowledge
Centre with
the help of
Educational
Institute/C
onsultancy
Firms
31-12-2021 NA NA MMTU/DDU
Gorakhpur
University/GIZ
Not
Requir
ed
NA NA NA NA Industr
ial &
infrastr
ucture
depart
ment
IP14.2 Conduct clean
production
audits on key
industries such
as Paper & Pulp,
Sugar, Dying
&Distillery
sector, Slaughter
UPPCB/UPSI
DA/DIC/Indi
vidual
Industries
Yes 31.03.2022 NA NA NA Clean
production
audits on key
industries such
as Paper &
Pulp, Sugar,
Dying
&Distillery
Not
Requir
ed
NA NA NA NA individ
ual
industr
iesd
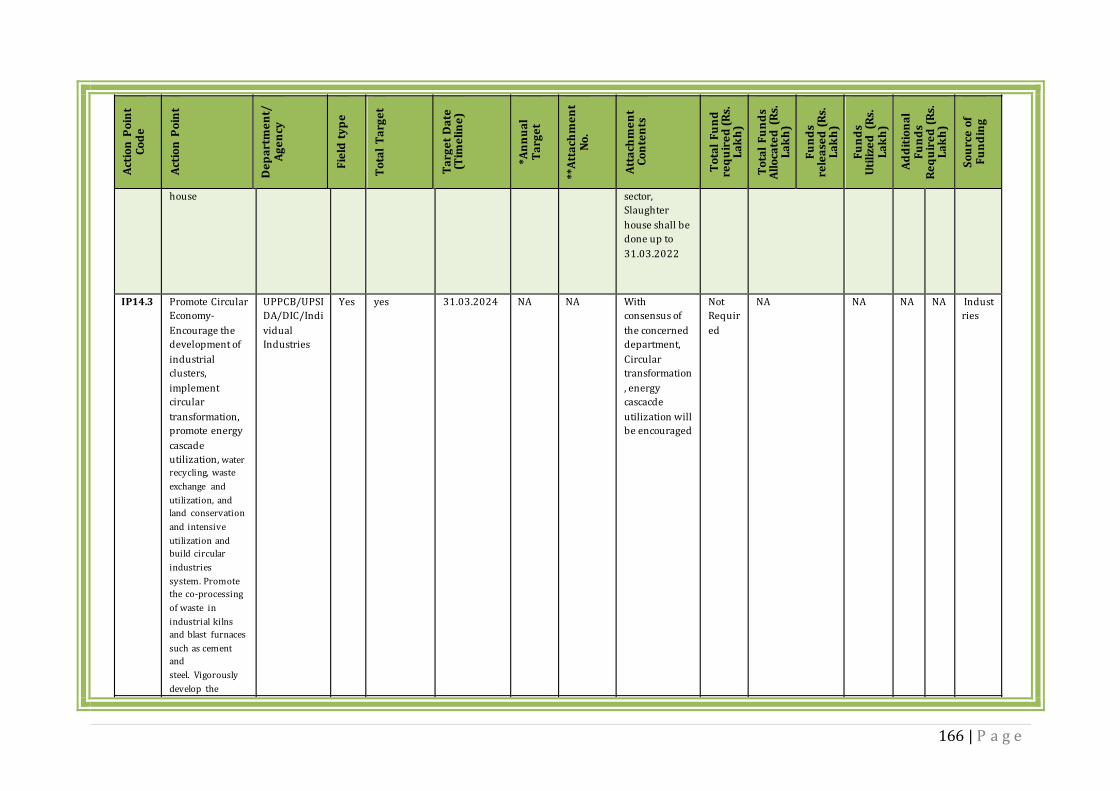
166 | P a g e
Act
ion
Po
int
Co
de
Act
ion
Po
int
De
pa
rtm
en
t/
Ag
en
cy
Fie
ld t
yp
e
To
tal
Ta
rge
t
Ta
rge
t D
ate
(T
ime
lin
e)
*An
nu
al
Ta
rge
t
**A
tta
chm
en
t N
o.
Att
ach
me
nt
Co
nte
nts
To
tal
Fu
nd
re
qu
ire
d (
Rs.
L
ak
h)
To
tal
Fu
nd
s A
llo
cate
d (
Rs.
L
ak
h)
Fu
nd
s re
lea
sed
(R
s.
La
kh
)
Fu
nd
s U
tili
zed
(R
s.
La
kh
)
Ad
dit
ion
al
Fu
nd
s R
eq
uir
ed
(R
s.
La
kh
)
So
urc
e o
f F
un
din
g
house sector,
Slaughter
house shall be
done up to
31.03.2022
IP14.3 Promote Circular
Economy-
Encourage the
development of
industrial
clusters,
implement
circular
transformation,
promote energy
cascade
utilization, water
recycling, waste
exchange and
utilization, and
land conservation
and intensive
utilization and
build circular
industries
system. Promote
the co-processing
of waste in
industrial kilns
and blast furnaces
such as cement
and
steel. Vigorously
develop the
UPPCB/UPSI
DA/DIC/Indi
vidual
Industries
Yes yes 31.03.2024 NA NA With
consensus of
the concerned
department,
Circular
transformation
, energy
cascacde
utilization will
be encouraged
Not
Requir
ed
NA NA NA NA Indust
ries

167 | P a g e
Act
ion
Po
int
Co
de
Act
ion
Po
int
De
pa
rtm
en
t/
Ag
en
cy
Fie
ld t
yp
e
To
tal
Ta
rge
t
Ta
rge
t D
ate
(T
ime
lin
e)
*An
nu
al
Ta
rge
t
**A
tta
chm
en
t N
o.
Att
ach
me
nt
Co
nte
nts
To
tal
Fu
nd
re
qu
ire
d (
Rs.
L
ak
h)
To
tal
Fu
nd
s A
llo
cate
d (
Rs.
L
ak
h)
Fu
nd
s re
lea
sed
(R
s.
La
kh
)
Fu
nd
s U
tili
zed
(R
s.
La
kh
)
Ad
dit
ion
al
Fu
nd
s R
eq
uir
ed
(R
s.
La
kh
)
So
urc
e o
f F
un
din
g
remanufacturing
of mechanical and
electrical products
and promote the
development of
the resource
recycling industry.
IP14.4 Vigorously
cultivate energy
conservation and
environmental
protection
industries
UPPCB/UPSI
DA/DIC/Indi
vidual
Industries
Yes yes 31.03.2024 NA NA Yes Not
Requir
ed
NA NA NA NA NA
*In case timeline extends to more than one year the annual targets must be fixed.
**Mention specific numeric identity to the attachment. Example- Attachment-
1

168 | P a g e
WASTE AND BIOMASS- DUMPING AND BURNING A
ctio
n P
oin
t
Co
de
Act
ion
Po
int
De
pa
rtm
en
t/
Ag
en
cy
Fie
ld t
yp
e
To
tal
Ta
rge
t
Ta
rge
t D
ate
(T
ime
lin
e)
*An
nu
al
Ta
rge
t
**A
tta
chm
en
t
No
.
Att
ach
me
nt
Co
nte
nts
To
tal
Fu
nd
re
qu
ire
d (
Rs.
L
ak
h)
To
tal
Fu
nd
s A
llo
cate
d (
Rs.
L
ak
h)
Fu
nd
s re
lea
sed
(R
s.
La
kh
)
Fu
nd
s U
tili
zed
(R
s.
La
kh
)
Ad
dit
ion
al
Fu
nd
s R
eq
uir
ed
(R
s.
La
kh
) S
ou
rce
of
Fu
nd
ing
BB1 Biomass
Burning
BB1.1 Regular check
and control of
burning of
municipal solid
wastes
Nagar
Nigam/Dev
elopment
Authority/
UPPCB
No. Immediate
detection
and strict
action
against
cases of
burning of
MSW
Regular activity NA O1 ATR against the
cases of illegal
burning of MSW
Not
Require
d
NA NA NA NA NA
BB1.2 Defaulters for
open burning to
be imposed
fines
Nagar
Nigam/Dev
elopment
Authority/
UPPCB
Amount
of Fine
Rs. Lacs
Immediate
detection
and
imposition
and
realization
of fine
against
cases of
burning of
MSW
Regular activity NA O1 Incident wise details
of the fine imposed &
realized
Not
Require
d
NA NA NA NA NA

169 | P a g e
Act
ion
Po
int
Co
de
Act
ion
Po
int
De
pa
rtm
en
t/
Ag
en
cy
Fie
ld t
yp
e
To
tal
Ta
rge
t
Ta
rge
t D
ate
(T
ime
lin
e)
*An
nu
al
Ta
rge
t
**A
tta
chm
en
t
No
.
Att
ach
me
nt
Co
nte
nts
To
tal
Fu
nd
re
qu
ire
d (
Rs.
L
ak
h)
To
tal
Fu
nd
s A
llo
cate
d (
Rs.
L
ak
h)
Fu
nd
s re
lea
sed
(R
s.
La
kh
)
Fu
nd
s U
tili
zed
(R
s.
La
kh
)
Ad
dit
ion
al
Fu
nd
s R
eq
uir
ed
(R
s.
La
kh
) S
ou
rce
of
Fu
nd
ing
BB1.3 Identify Garbage
burning
locations
Nagar
Nigam/Dev
elopment
Authority
Number Geo tagging
of garbage
burning
locations
Regular activity NA 01 List along with
latitude & longitude
of Garbage burning
locations
Not
Require
d
NA NA NA NA NA
BB1.4 Prohibition/co
mplete ban on
garbage
burning.
Nagar
Nigam/Dev
elopment
Authority
Yes Make
suitable
provisions
in the
bylaws to
prohibit
garbage
burning
Achieved NA NA Burning of Solid
Waste is banned as
per the provisions of
Rule 4(2) of Solid
Waste Management
Rules 2016. The
garbage burning ban
has been
incorporated in the
MSW Management
and Cleanliness
bylaws of ULBs
Not
Require
d
NA NA NA NA
BB1.5 Launch
extensive drive
against open
burning of bio-
mass, crop
residue,
garbage, leaves,
etc.
Nagar
Nigam/Agr
iculture
Departmen
t/District
Administra
tion
No. Immediate
detection
and strict
action
against
cases of
burning of
MSW, Crop
residue,
biomass etc.
Regular activity NA O1 ATR against the
cases of illegal
burning of MSW,
Crop residue,
biomass etc.
Not
Require
d
NA NA NA NA NA
BB1.6 Construction of
advanced waste
management
Site.
Nagar
Nigam
Yes Establishme
nt of MSW
Managemen
t Facility
31.03.2022 Finalizatio
n of DPR &
land
acquisitio
01 NA 2500.00 - NA NA NA State/
SBM/15th
Finance
commissi

170 | P a g e
Act
ion
Po
int
Co
de
Act
ion
Po
int
De
pa
rtm
en
t/
Ag
en
cy
Fie
ld t
yp
e
To
tal
Ta
rge
t
Ta
rge
t D
ate
(T
ime
lin
e)
*An
nu
al
Ta
rge
t
**A
tta
chm
en
t
No
.
Att
ach
me
nt
Co
nte
nts
To
tal
Fu
nd
re
qu
ire
d (
Rs.
L
ak
h)
To
tal
Fu
nd
s A
llo
cate
d (
Rs.
L
ak
h)
Fu
nd
s re
lea
sed
(R
s.
La
kh
)
Fu
nd
s U
tili
zed
(R
s.
La
kh
)
Ad
dit
ion
al
Fu
nd
s R
eq
uir
ed
(R
s.
La
kh
) S
ou
rce
of
Fu
nd
ing
n by
31.03.202
1
on/
Nagar
Nigam
Nidhi.
BB1.7 Regular
collection and
control of
municipal solid
wastes.
Nagar
Nigam/Dev
elopment
Authority
Yes 70 wards Regular activity NA NA 1-Safai karmchari
(out sourcing)-
2901.00
2- Diesel/Petrol-
797.66
3- Repairing of
vehicle- 80.57
4-Store goods-
135.58
4- Miscellaneous-
281.55
4200.00 - NA NA NA State/
SBM/15th
Finance
commissi
on/
Nagar
Nigam
Nidhi.
BB1.8 Providing
Organic Waste
Compost
machines,
decentralization
of processing of
Waste, dry
waste collection
centres.
Nagar
Nigam/Dev
elopment
Authority
No. All bulk
waste
generators
31.03.2022 Identificat
ion of bulk
waste
generators
to be done
by
31.03.202
1
01 List of bulk waste
generators doing
decentralized waste
management
Not
required
NA NA NA NA To be
done by
Bulk
waste
generato
rs
BB1.9 Awareness for
controlling of
burning of
agricultural
waste and crop
residues.
Nagar
Nigam/Agr
iculture
Departmen
t/District
Administra
tion
No. Regular
Activity NA NA 01 Details of the
awareness drives
including dates and
images
30 - NA NA NA State/UL
B Funds

171 | P a g e
Act
ion
Po
int
Co
de
Act
ion
Po
int
De
pa
rtm
en
t/
Ag
en
cy
Fie
ld t
yp
e
To
tal
Ta
rge
t
Ta
rge
t D
ate
(T
ime
lin
e)
*An
nu
al
Ta
rge
t
**A
tta
chm
en
t
No
.
Att
ach
me
nt
Co
nte
nts
To
tal
Fu
nd
re
qu
ire
d (
Rs.
L
ak
h)
To
tal
Fu
nd
s A
llo
cate
d (
Rs.
L
ak
h)
Fu
nd
s re
lea
sed
(R
s.
La
kh
)
Fu
nd
s U
tili
zed
(R
s.
La
kh
)
Ad
dit
ion
al
Fu
nd
s R
eq
uir
ed
(R
s.
La
kh
) S
ou
rce
of
Fu
nd
ing
BB
1.10
No plot should
be left open
more than 02
years and
planting of trees
must be
mandatory on
vacant plots.
Nagar
Nigam/GD
A/Forest
Departmen
t
1.Provisi
ons be
made in
the
byelaws
2.Numb
er
1.Provisions
be made in
the byelaws
Regular
Activity
31.03.2022 NA 02 No unallotted plot in
GDA
Not
required
NA NA NA NA To be
done by
plot
owner
BB
1.12
Mapping of
legacy waste
and waste
dumping sites in
the city
Nagar
Nigam/Dev
elopment
Authority/
UPPCB
No. 1. Akala
Bandh- 1.5
lakh MT
2. Mashera
Jungle
Hakim no.1-
2.31 lakh
MT
Achieved NA NA NA Not
required
NA NA NA NA -
BB
1.13
Bioremediation
/ bio-mining of
legacy waste
Nagar
Nigam/Dev
elopment
Authority
MT of
legacy
waste
1. Akala
Bandh- 1.5
lakh MT
2. Mashera
Jungle
Hakim no.1-
2.31 lakh
MT
31.03.2023 NA NA NA 1906.7 - NA NA NA ULD/Stat
e
Funding
BB
1.14
Development
and
implementation
of integrated
door to door
waste collection
system with GPS
mounted waste
collection
vehicles and
mobile App to
Nagar
Nigam/Dev
elopment
Authority
wards 70 Regular activity NA NA NA 250.00 - NA NA NA State/
SBM/15th
Finance
commissi
on/
Nagar
Nigam
Nidhi.

172 | P a g e
Act
ion
Po
int
Co
de
Act
ion
Po
int
De
pa
rtm
en
t/
Ag
en
cy
Fie
ld t
yp
e
To
tal
Ta
rge
t
Ta
rge
t D
ate
(T
ime
lin
e)
*An
nu
al
Ta
rge
t
**A
tta
chm
en
t
No
.
Att
ach
me
nt
Co
nte
nts
To
tal
Fu
nd
re
qu
ire
d (
Rs.
L
ak
h)
To
tal
Fu
nd
s A
llo
cate
d (
Rs.
L
ak
h)
Fu
nd
s re
lea
sed
(R
s.
La
kh
)
Fu
nd
s U
tili
zed
(R
s.
La
kh
)
Ad
dit
ion
al
Fu
nd
s R
eq
uir
ed
(R
s.
La
kh
) S
ou
rce
of
Fu
nd
ing
facilitate the
households
BB
1.15
EPR compliance
for plastic waste
Nagar
Nigam &
UPPCB
No. of
units/
quantity
02MT/DAY 31.03.2022 NA NA NA Not
Require
d
NA NA NA NA To be
done by
brand
owners
BB
1.16
Preparation and
implementation
of Waste
Burning hotspot
action plan
Nagar
Nigam/Dev
elopment
Authority
Yes 02 31.06.2021 NA NA NA Not
required
NA NA NA NA NA
BB2 Ensure
segregation of
waste at source
Nagar
Nigam
No. of
wards
70 31.03.2022 NA NA NA Not
Require
d
NA NA NA NA NA

173 | P a g e
Act
ion
Po
int
Co
de
Act
ion
Po
int
De
pa
rtm
en
t/
Ag
en
cy
Fie
ld t
yp
e
To
tal
Ta
rge
t
Ta
rge
t D
ate
(T
ime
lin
e)
*An
nu
al
Ta
rge
t
**A
tta
chm
en
t
No
.
Att
ach
me
nt
Co
nte
nts
To
tal
Fu
nd
re
qu
ire
d (
Rs.
L
ak
h)
To
tal
Fu
nd
s A
llo
cate
d (
Rs.
L
ak
h)
Fu
nd
s re
lea
sed
(R
s.
La
kh
)
Fu
nd
s U
tili
zed
(R
s.
La
kh
)
Ad
dit
ion
al
Fu
nd
s R
eq
uir
ed
(R
s.
La
kh
) S
ou
rce
of
Fu
nd
ing
BB3 Proper
collection of
Horticulture
waste and its
disposal
following
composting-cum
gardening
approach
Horticultur
e
Departmen
t/Nagar
Nigam/GD
A
No All parks
and Green
areas in the
city
Regular Activity NA NA NA Not
required
NA NA NA NA NA
BB4 Recycling plants
for dry waste.
Nagar
Nigam
No. of
plants
1 31.03.2022 NA 01 Recycling plant for
dry waste will be
established along
with MSW plant.
500.00 - NA NA NA State/
SBM/15th
Finance
commissi
on/
Nagar
Nigam
Nidhi.
BB
10.2
Adopt roadmap
for zero landfill
policy to
promote
decentralized
waste
segregation,
reuse and
recycling
Nagar
Nigam/GD
A
Text Implementat
ion of plan
for
decentralize
d waste
segregation,
reuse and
recycling for
zero landfill
31.03.2022 NA NA NA Not
Require
d
NA NA NA NA NA
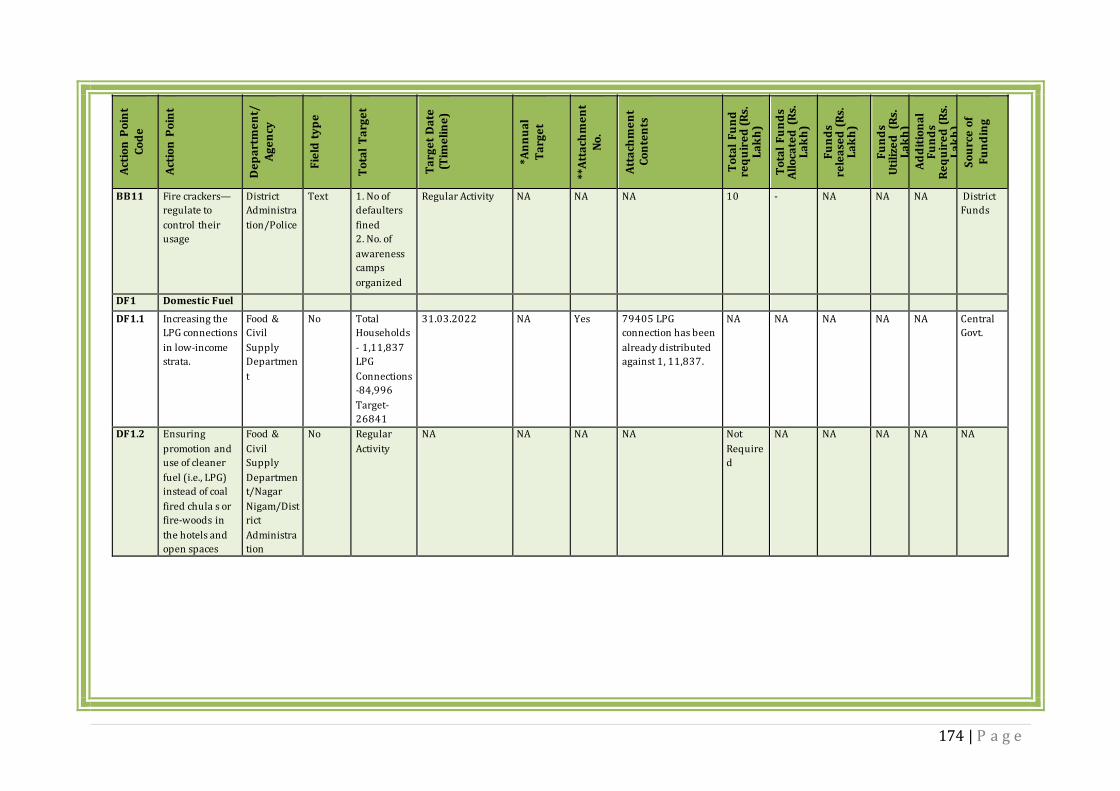
174 | P a g e
Act
ion
Po
int
Co
de
Act
ion
Po
int
De
pa
rtm
en
t/
Ag
en
cy
Fie
ld t
yp
e
To
tal
Ta
rge
t
Ta
rge
t D
ate
(T
ime
lin
e)
*An
nu
al
Ta
rge
t
**A
tta
chm
en
t
No
.
Att
ach
me
nt
Co
nte
nts
To
tal
Fu
nd
re
qu
ire
d (
Rs.
L
ak
h)
To
tal
Fu
nd
s A
llo
cate
d (
Rs.
L
ak
h)
Fu
nd
s re
lea
sed
(R
s.
La
kh
)
Fu
nd
s U
tili
zed
(R
s.
La
kh
)
Ad
dit
ion
al
Fu
nd
s R
eq
uir
ed
(R
s.
La
kh
) S
ou
rce
of
Fu
nd
ing
BB11 Fire crackers—
regulate to
control their
usage
District
Administra
tion/Police
Text 1. No of
defaulters
fined
2. No. of
awareness
camps
organized
Regular Activity NA NA NA 10 - NA NA NA District
Funds
DF1 Domestic Fuel
DF1.1 Increasing the
LPG connections
in low-income
strata.
Food &
Civil
Supply
Departmen
t
No Total
Households
- 1,11,837
LPG
Connections
-84,996
Target-
26841
31.03.2022 NA Yes 79405 LPG
connection has been
already distributed
against 1, 11,837.
NA NA NA NA NA Central
Govt.
DF1.2 Ensuring
promotion and
use of cleaner
fuel (i.e., LPG)
instead of coal
fired chula s or
fire-woods in
the hotels and
open spaces
Food &
Civil
Supply
Departmen
t/Nagar
Nigam/Dist
rict
Administra
tion
No Regular
Activity
NA NA NA NA Not
Require
d
NA NA NA NA NA

175 | P a g e
AIR QUALITY DATA
Action Code Action Point Field type Attachment Attachment Contents
AQ1.1 Monthly averages for PM2.5 (In µg/m3) Number (12) No AQ1.2 Monthly averages for PM10 (In µg/m3) Number (12) No
AQ1.3 Monthly averages for SO2 (In µg/m3) Number (12) No AQ1.4 Monthly averages for NO2 (In µg/m3) Number (12) No AQ1.5 Annual averages for PM2.5 (In µg/m3) Number (1) Yes Discussed under heading “Status
of Air Quality and its trend in
Gorakhpur City” AQ1.6 Annual averages for PM10 (In µg/m3) Number (1) Yes Discussed under heading “Status
of Air Quality and its trend in
Gorakhpur City” AQ1.7 Annual averages for SO2 (In µg/m3) Number (1) Yes Discussed under heading “Status
of Air Quality and its trend in
Gorakhpur City”
AQ1.8 Annual averages for NO2 (In µg/m3) Number (1) Yes Discussed under heading “Status
of Air Quality and its trend in
Gorakhpur City” AQ1.9 Monthly Meteorological Data Yes Windrose diagram attached on Page
184

176 | P a g e
a) Proposed Locations & Budget for development of Parking space for Non destined Vehicles -Annexure I(A)

177 | P a g e
(b) Proposed locations & Budget for development of Multi-layer Car parking in Gorakhpur City -Annexure I(B)
S. No.
Location of Proposed Parking Capacity of Parking
Estimated Cost (Rs in Lac)
1 Multilevel Parking near City Mall 350 4300.00
2 Multilevel Parking near Vijay Chauraha in front of United Cinema.
280 3440.00
3 Multilevel Parking near Medical College.
300 3685.00
4 Multilevel Parking near Bargadwa Police Chauki.
250 3070.00
5 Multilevel Parking near Betiyahata Chauk
150 1843.00

178 | P a g e
(c) Proposed budget for Installation of Fountain at various locations in Gorakhpur City-Annexure I(C)
S.No. Location of Fountain Fountain Present (Yes/No)
Cost of construction (If Fountain is not available) (Rs in Lac)
1 Ghantaghar No 12.00
2 Townhall kachahri chauraha No 15.00
3 University Student Union
Building
No 10.00
4 University North No 15.00
5 University South No 15.00
6 Mohaddipur Chauraha No 30.00
7 Malgodam Tiraha No 25.00
8 Asuran Chauk No 40.00
9 Golghar Chauraha No 10.00
10 Transport Nagar Chauraha No 30.00

179 | P a g e
ANNEXURE NO.-II
XV. ANNEXURE- II
Plantation Scheme
based on wind pattern of
Gorakhpur city by Miyawaki Method
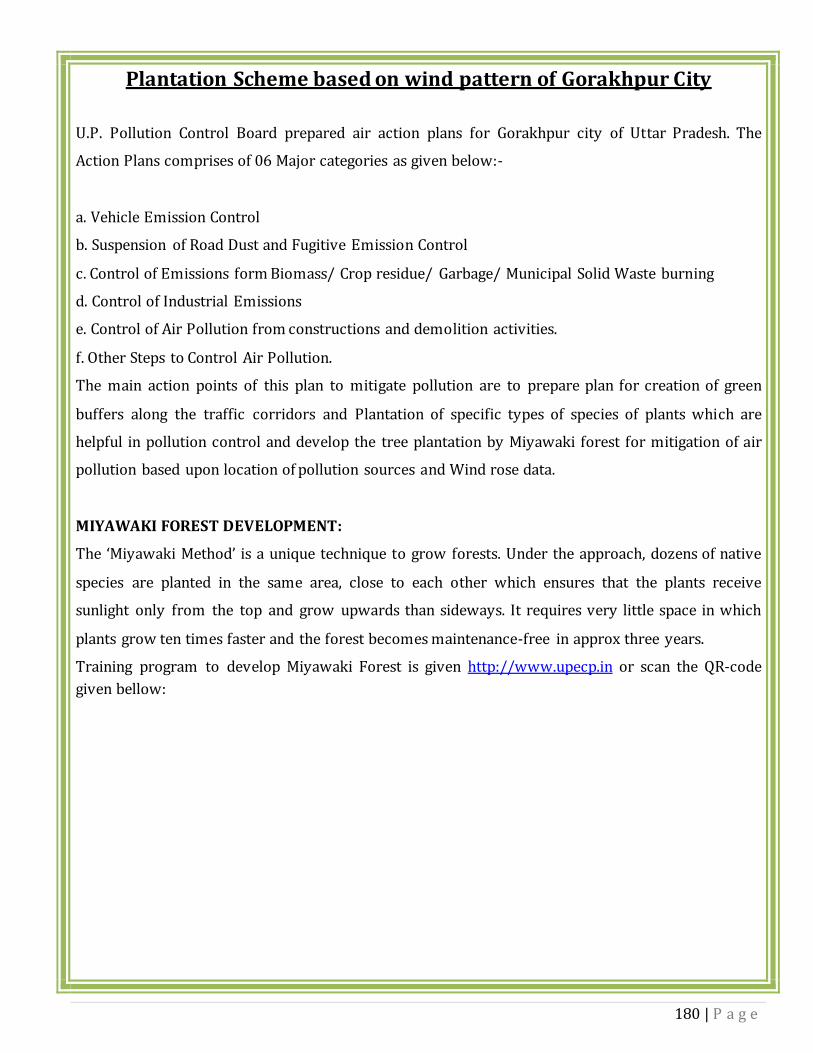
180 | P a g e
Plantation Scheme based on wind pattern of Gorakhpur City
U.P. Pollution Control Board prepared air action plans for Gorakhpur city of Uttar Pradesh. The
Action Plans comprises of 06 Major categories as given below:-
a. Vehicle Emission Control
b. Suspension of Road Dust and Fugitive Emission Control
c. Control of Emissions form Biomass/ Crop residue/ Garbage/ Municipal Solid Waste burning
d. Control of Industrial Emissions
e. Control of Air Pollution from constructions and demolition activities.
f. Other Steps to Control Air Pollution.
The main action points of this plan to mitigate pollution are to prepare plan for creation of green
buffers along the traffic corridors and Plantation of specific types of species of plants which are
helpful in pollution control and develop the tree plantation by Miyawaki forest for mitigation of air
pollution based upon location of pollution sources and Wind rose data.
MIYAWAKI FOREST DEVELOPMENT:
The ‘Miyawaki Method’ is a unique technique to grow forests. Under the approach, dozens of native
species are planted in the same area, close to each other which ensures that the plants receive
sunlight only from the top and grow upwards than sideways. It requires very little space in which
plants grow ten times faster and the forest becomes maintenance-free in approx three years.
Training program to develop Miyawaki Forest is given http://www.upecp.in or scan the QR-code
given bellow:

181 | P a g e
CLIMATE OF THE CITY:
Being on the North- Eastern part of Uttar Pradesh, Gorakhpur city situated in the subtropical
continental part of the Saryu Par Plain. The climate is sub-humid to humid and is influenced to some
extent by the proximity of the north and the existence of Terai swamps.
The cold season from around the end of November to February is followed by the summer, from
March to around middle of June. The period of mid June to September constitutes the south west
monsoon season October and November form the post monsoon season. On an average there has
been a rainfall of 1393.1 mm. In district normally maximum and minimum temperature varies
between 44.10° C to 5°C respectively. The monsoon and the post monsoon seasons the relative
humidity are high ranging between 70% and 85%.
SOIL PROFILE:
Gorakhpur district lies between 26°15' and 27°06' North latitude and 83°06' and 83°45' East
longitude in Ghaghra- Gandak Doad which is a part of vast Gangetic Plain. It is situated on the banks
of the Rapti River. According to soil profile of the district are mainly transported i.e. alluvial soil,
comprising sand, silt and clay in varying proportions and rich in humus. The alluvial soil of the
districts is subdivided into older alluvial soil and younger alluvial soil. The older alluvial soil
occupies high land and younger alluvial soils are restricted to marginal tract of Rapti and Ghaghra
rivers and both are fertile.

182 | P a g e
Alluvial Plain
1. Deep, loamy soils and slightly eroded.
2. Deep, loamy soils and slightly eroded associated with silty soils.
3. Deep, fine soils moderately saline and sodicity associated with loamy soils, slightly eroded.
4. Deep, loamy soils, moderate salinity and sodicity associated with loamy soils with moderate
salinity and strong sodicity.
5. Deep, silty soils associated with loamy soils slightly eroded.
Older Alluvial Plain
1. Deep, loamy soils and slightly eroded associated with stratified loamy soils slightly
eroded.
EXISTING FOREST COVER:
There is a net increase of 0.0 sq.km has been observed in the State compared to the previous
assessment which can be attributed to plantation and conservation. Forest outside Green wash areas
have seen a considerable increase. The latest Forest Survey of India (FSI) state of the forest report
shows that the overall forest cover of Gorakhpur district has increased — from 2.38% in 2019 to
2017.
According to the FSI report, all trees with canopy density of over 10%, having an extent of more than
one hectare and falling on forest, private, community or institutional land, are reflected in the
assessment report. Barring the change in geographical areas, the so-called “increase” in forest cover
has raised concerns among environmentalists as the forest department sets itself a high plantation
target each year and claims a 80% to 90% survival rate of saplings. According to 2019 assessment
the forest area of Gorakhpur and its nearby district are given below:
District
Name
Geographical
Area (sq.km)
2019 Assessment (sq.km) %GA Change
wrt
2017
Scrub
V.
Dense
Forest
M.
Dense
Forest
Open
Forest
Total
Gorakhpur 3,321 28.00 23.00 28.00 79.00 2.38 0.0 0.0
(Source- The State of Forest Report, 2019, Forest Survey of India)

183 | P a g e
SENSITIVE AREAS OF THE CITY:
Kushmi Forest:
Forests have a considerable influence on the economy and development of the district, though they
are far less extensive than was formerly the case. Kushmi forest is a dense forest-covered with Sal
trees. The forest is situated at a distance of 9.0 Kms from Gorakhpur Railway station and is just
beside the Air force Station There is a religious-picnic spot named Budhia Mai in the thick green
forest. The chief produce of the forest is sal (shorea robusta) in the shape of both timber and fuel
besides fodder and other forest produce. They reduce soil erosion and thereby increase fertility of
the soil. The forest assets like Banyan, Bhalk, Bamboo, Shisham, Neem and Mango trees are found in
the district. Cutting and felling of trees has taken place in the district and retrieved land is being
used for agriculture purposes. The wood so obtained from the trees is used for fuel purposes.
Figure 64: Location of Kushmi Forest

184 | P a g e
WINDFLOW PATTERN- WINDROSE:
The windrose for the four seasons have been plotted which indicate that the predominant wind
direction is blowing from West North West, North-West, West, East North East, East and East South
East direction. The wind pattern is very helpful in siting the locations preferable for plantation so
that they may act as barriers to air pollution in the downwind direction.
Figure 3: Yearly Wind rose Pattern of Gorakhpur City

185 | P a g e
Figure 4: LULC for Gorakhpur
Description of Land use/Land cover distribution of Gorakhpur
Ca
te
go
ry
Agriculture Barren/uncultivabl
e/wastelands
Built up Forest Wetlands/water
bodies
Cro
p
La
nd
C
urr
en
t
Sh
ifti
ng
Cu
ltiv
ati
on
F
all
ow
Pla
nta
tio
n
Gu
llie
d/
Ra
vin
ou
s
lan
d
Sa
lt
aff
ect
ed
lan
d
Sa
nd
y
Are
a
Scr
ub
lan
d
Min
ing
Urb
an
Ru
ral
De
cid
uo
u
s Fo
rest
Pla
nta
tio
n
Inla
nd
we
tla
nd
s
Riv
er/
Str
ea
ms/
Ca
na
ls
Wa
ter
bo
die
s Ar
ea
(in
sq.
km
)
260
2.0
9
0.0 44
.2
4
38.
28
0.09 2.56 1
.
4
9
18
.8
0
14.
12
12
6.8
2
197
.47
75
.6
1
0.4
6
77.6
5
107.2
0
17.1
2
(Source-https://bhuvan-app1.nrsc.gov.in/2dresources/thematic/LULC502/MAP/UP.pdf)
186 | P a g e
As per the district wise distribution of Land use/Land cover of Uttar Pradesh data(2015-2016)
available in Bhuvan- Indian Geo Platform of ISRO, for Gorakhpur there is 26.02.09 sq. km land as
crop land out of total geographical area of the district and 44.24 sq.km land is Fallow Land and 38.28
sq.km is already under Plantation, which should be maintained. There is also 18.80 sq.km land left as
Scrub land which comes under wasteland category. There is Forest land also available in the district
as forest plantation which is 0.46 sq.km and deciduous which is 78.61 sq.km out of total
geographical area. Therefore, Barren/uncultivable/waste land available in the upwind and
downwind directions of the wind shall be identified for developing green belt to curb the rising level
of air pollutants in the city.
TREE PLANTATION STRATEGY:
Objectives of Tree Plantation Strategy
✓ Climatic amelioration
✓ Check in air & noise pollution
✓ Check in soil erosion and reduce water logging
✓ Moderating the effect of wind and incoming radiation
✓ Aesthetics, shade and ornamentation.
Actions which can be taken in account to curb the emission of dust and other particulate
matter in the district:
▪ Proposal for speeding up the process of developing green belt around the Construction sites
of townships and Buildings being constructed towards prominent downwind direction of
wind as they have already obtained EC from SEAC/SEIAA and to also produce the 6-monthly
Compliance report.
▪ Development of green belt around the existing brick kiln sites and other air polluting sources
located within the city.
▪ Development of green belt around the outskirts of existing park, Parking areas, Market areas
etc.
▪ Proposal for developing wind break between residential and industrial area.
▪ Other places which found suitable for proposing plantation- Near GIDA industrial area, along
the Gorakhpur- Sonauli Road, along the Railway Tracks and bus stations or other places of
the District.
▪ Plantation of Trees on the flood plain zone to check the soil erosion at the time of floods and
enhance the riparian vegetation along with the small ponds and marshy areas found for their
187 | P a g e
restoration of rejuvenation. List of marshy areas to be rejuvenated by turning them into
green spaces is given in this report.
▪ Unauthorized dump sites to be cleared of the wastes and then after restoring the quality of
soil and making it fit for plantation should be turned green. List is attached here in this report
▪ Abandoned brick kiln sites should be turned green after getting clearance of its ownership
and permission from the owner.
▪ To identify the proposed developments plan for the city like URBAN AND RURAL PLANNING
DEPARTMENT, UTTAR PRADESH has developed Master Plan- 2001-2021 for Gorakhpur City
which is given below. This Master plan will help in identifying the available places for
proposing plantation scheme as to avoid any contradiction in both the schemes.

188 | P a g e
Figure 5: Master Plan for Gorakhpur City
Slum and squatter settlements in Gorakhpur are growing at alarming rates due to increased
infrastructure development. The general composition of majority of slums comprises of scheduled
tribes, scheduled caste, and other backward classes, forming the weaker section of the society. From
habitation point of view, slums located in the low lying areas, along open drains/nallah, tank beds
and hazardous/toxic sites are susceptible to inundation, and other forms of disasters.
Gorakhpur-being one of the most significant industrial cities of the state. It has slum population of
49,268 which is 7.32% of total population of the Gorakhpur city population that accounts for 6,

189 | P a g e
73,446. From amenities view, slums do not have access drinking water sources and households lack
connectivity to storm water drainage system and with no underground sewer system, even not a
proper facility of cooking requirements hence they rely on biomass/coal burning to cook their food
which should be replaced with the supply of LPG.
City Population Slum Population % of slum population to city population
673446 49268 7.32%
(Source: Census 2011, RAY Primary Survey, 2011)

190 | P a g e
Figure 6: Proposed Plantation on Potential sites located on the outskirts and within the Gorakhpur District

191 | P a g e
Figure 7: Proposed Plantation on Potential sites located on the outskirts and within the Gorakhpur City

192 | P a g e
Following sites have been identified on the basis prominent upwind and
downwind wind flow pattern on which plantation is proposed to curb the rising level of
PM10 in Gorakhpur. In addition to these sites, following the direction prominent wind
flow pattern, sites will be identified within the city between the habitation to create
small oxygen pockets which will also help in lowering the rising level of pollutants being
emitted from the major congestion points of the city.
Sites identified for proposing Plantation towards Upwind and Downwind
directions
Prominent Wind Direction
West North West, North-West, West, East North East, East and East South
East
SNo. Identified Site Latitude Longitude Area (In
Hectares)
1. Near NooruddinChak 26°49'8.80"N 83°20'48.26"E 5.26
2. Near NooruddinChak 26°48'59.16"N 83°20'48.05"E
3. Near NooruddinChak 26°48'51.28"N 83°20'37.15"E
4. Near NooruddinChak 26°48'37.39"N 83°21'10.95"E 0.91
5. Near NooruddinChak 26°48'43.76"N 83°20'55.23"E
6. Near Vikas Nagar 26°48'30.83"N 83°21'27.75"E 1.23
7. Near Vikas Nagar 26°48'41.27"N 83°21'17.91"E
8. Near Bargadwa 26°48'30.80"N 83°20'56.59"E 6.17
9. Near Vistar Colony 26°48'12.21"N 83°21'21.66"E 0.62
10. Near Vistar Colony 26°48'6.10"N 83°21'25.24"E
11. Rajendra Nagar 26°47'27.65"N 83°21'8.92"E 1.23
12. Rajendra Nagar 26°47'10.82"N 83°21'19.94"E
13. Rajendra Nagar 26°47'24.07"N 83°20'50.66"E
14. Rajendra Nagar 26°46'48.64"N 83°21'25.77"E

193 | P a g e
15. Rajendra Nagar 26°46'43.45"N 83°20'55.23"E
16. Near SardaKunj 26°47'20.35"N 83°21'59.74"E 0.91
17. Near SardaKunj 26°47'17.33"N 83°22'14.32"E
18. Near SinchaiVibhag Colony 26°47'11.05"N 83°21'43.98"E 0.30
19. Near Fertilizer Colony 26°48'30.10"N 83°22'24.65"E 6.17
20. Near Surajkund Colony 26°46'10.60"N 83°20'33.05"E 1.53
21. Near adityanagar 26°46'0.63"N 83°21'29.24"E 0.62
22. Near Ramjanki Nagar 26°47'10.54"N 83°22'41.12"E 1.23
23. Near Lajpat Nagar 26°46'9.45"N 83°21'51.29"E 0.91
24. B Colony Shahpur 26°46'42.76"N 83°23'4.34"E 0.62
25. Siva Puram 26°46'51.90"N 83°23'16.89"E 1.23
26. Near Narayan Colony 26°48'14.32"N 83°24'15.63"E 0.91
27. Near Narayan Colony 26°48'10.79"N 83°24'25.34"E
28. Bank Colony 26°47'0.12"N 83°24'35.35"E 0.30
29. Gayatripuram Nakaha No-1 26°47'55.00"N 83°22'18.16"E 3.09
30. Milinium City Kareem Nagar 26°48'17.48"N 83°22'56.71"E 6.17
31. Rapti Nagar Fattepur 26°47'41.31"N 83°23'08.25"E 1.23
Total Area 40.64
Non- Prominent Wind Direction
(North North West to North East Section and West South West to South East
Section )
SNo. Identified Site Latitudes Longitudes Area (In
Hectares)
1. Near Basharatpur 26°45'24.76"N 83°22'16.27"E 3.09
2. Near Paidleganj 26°44'42.32"N 83°22'59.37"E 3.09
Total Area 6.18

194 | P a g e
As per the locations identified towards the prominent wind directions given above in
the table, total area proposed for plantation and maintenance of the vegetation in
prominent wind direction is approximately 40.64 ha similarly towards non prominent
wind directions is approximately 6.18 ha which comes upto the total of 46.82 ha.
Proposing Plantation around GIDA
Above given is the list of abandoned GIDA sites which could be considered for
plantation as this city has high demands of other activities these pockets of place should
be considered for creating oxygen pockets.
S No. Industrial Area Latitudes Longitudes
Area
(acres)
1. Near GIDA 26°44'49.60"N 83°15'10.72"E 2.47
2. Near GIDA 26°44'37.73"N 83°15'18.23"E 17.24
3. Near GIDA 26°44'53.47"N 83°14'28.39"E 0.62
4. Near GIDA 26°44'35.60"N 83°13'59.13"E 0.62
5. Near GIDA 26°44'17.83"N 83°13'54.23"E 0.62
6. Near GIDA 26° 44.561'N 83° 15.051'E 0.62
7. Near GIDA 26° 45.012'N 83° 13.649'E 2.47
8. Near GIDA 26° 45.363'N 83° 13.471'E 2.47
Total 27.13
As plants are universal sink for air pollutants, they trap the carbon dioxide and store it
within them as reserve food material. Plants being the initial acceptors of air pollutants
act as a scavenger to the pollutants. Leaves provide surface area for impingement,
absorption and adsorption of air pollutants as well settlement for dust particles in the
atmosphere equally. Few plants are sensitive to certain air pollutants while others are
tolerant. The plants sensitive to pollutants act as pollution indicators while the plants
tolerant to pollutants act as sink. While selecting the species for pollution control the
following are the important characteristics that should be considered. Plants should be
evergreen, large leaved, rough bark, indigenous, ecologically compatible, low water
requirement, minimum care, high absorption of pollutants, resistant pollutants, agro-
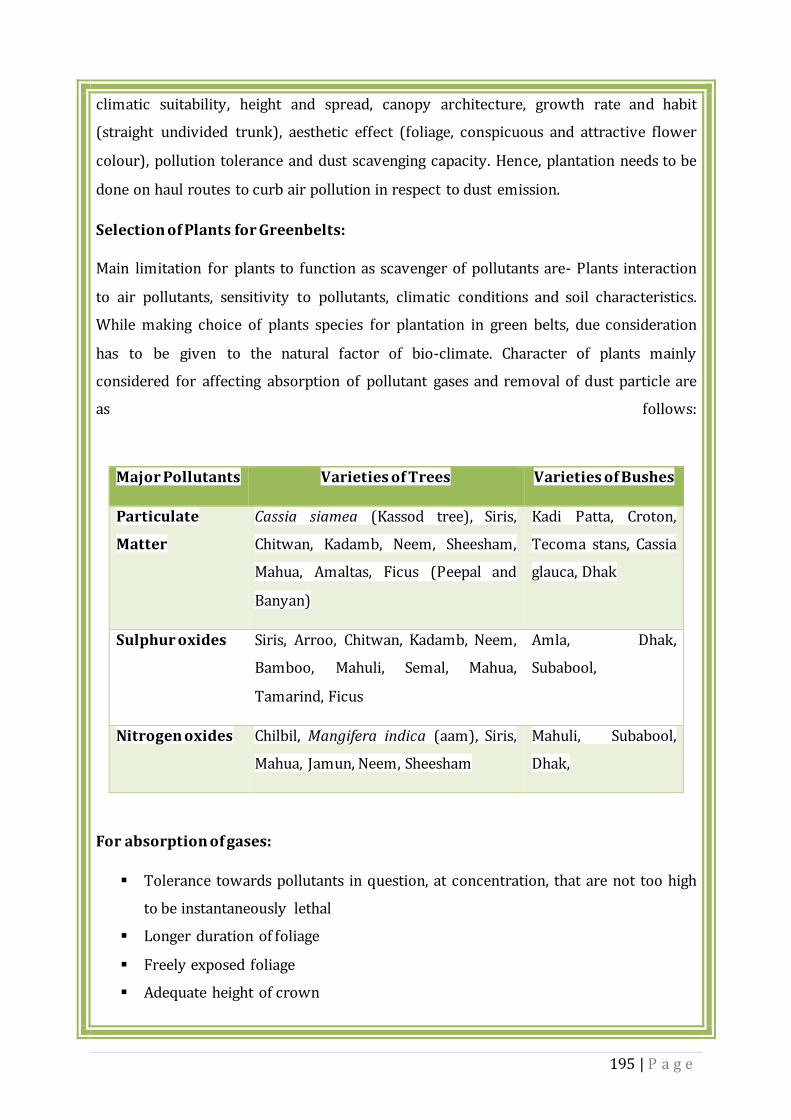
195 | P a g e
climatic suitability, height and spread, canopy architecture, growth rate and habit
(straight undivided trunk), aesthetic effect (foliage, conspicuous and attractive flower
colour), pollution tolerance and dust scavenging capacity. Hence, plantation needs to be
done on haul routes to curb air pollution in respect to dust emission.
Selection of Plants for Greenbelts:
Main limitation for plants to function as scavenger of pollutants are- Plants interaction
to air pollutants, sensitivity to pollutants, climatic conditions and soil characteristics.
While making choice of plants species for plantation in green belts, due consideration
has to be given to the natural factor of bio-climate. Character of plants mainly
considered for affecting absorption of pollutant gases and removal of dust particle are
as follows:
Major Pollutants Varieties of Trees Varieties of Bushes
Particulate
Matter
Cassia siamea (Kassod tree), Siris,
Chitwan, Kadamb, Neem, Sheesham,
Mahua, Amaltas, Ficus (Peepal and
Banyan)
Kadi Patta, Croton,
Tecoma stans, Cassia
glauca, Dhak
Sulphur oxides Siris, Arroo, Chitwan, Kadamb, Neem,
Bamboo, Mahuli, Semal, Mahua,
Tamarind, Ficus
Amla, Dhak,
Subabool,
Nitrogen oxides Chilbil, Mangifera indica (aam), Siris,
Mahua, Jamun, Neem, Sheesham
Mahuli, Subabool,
Dhak,
For absorption of gases:
▪ Tolerance towards pollutants in question, at concentration, that are not too high
to be instantaneously lethal
▪ Longer duration of foliage
▪ Freely exposed foliage
▪ Adequate height of crown
196 | P a g e
▪ Openness of foliage in canopy
▪ Big leaves (long and broad laminar surface)
▪ Large number of stomatal apertures
For Removal of Suspended Particular matter:
▪ Height and spread of crown.
▪ Leaves supported on firm petiole
▪ Abundance of surface on bark and foliage
▪ Roughness of bark
▪ Abundance of axillaries hairs
▪ Hairs or scales on laminar surface
▪ Protected Stomata
Selection of Plants for Greenbelts:
The main limitation for plants to function as scavenger of pollutants are, plant’s
interaction to air pollutants, sensitivity to pollutants, climatic conditions and soil
characteristics. While making choice of plants species for plantation in green belts, due
consideration has to be given to the natural factor of bio-climate. Character of plants
mainly considered for affecting absorption of pollutant gases and removal of dust
particle are as follows.
a. Plantation pattern:
➢ The first row along the highways will be of small to medium size ornamental
trees
➢ Subsequent rows depending on the availability of width will comprise of
ornamental and/or shade bearing species of medium height more than those in
the first row.
➢ In rural sections the last row shall always be shade bearing tall trees.
➢ Plantation shall be done in a staggered (zigzag) manner.

197 | P a g e
(Option 1) Two-row Plantation
(Option 2) Three-row Plantation
Plantation pattern
Specification I row II row III row
Spacing between
plant to plant
10 ft 10 ft 20 ft
Canopy Shape &
Size
Cylindrical/oblong
with small CSA
Round/oblong
with medium
CSA
Spreading with
medium CSA
Spacing between
rows
- 15 ft 15 ft
Size of the pits 60 X 60 X 60 cm 60 X 60 X 60 cm 60 X 60 X 60 cm
Height of the
plant
1.5 m to 2 m More than 2m More than 3m
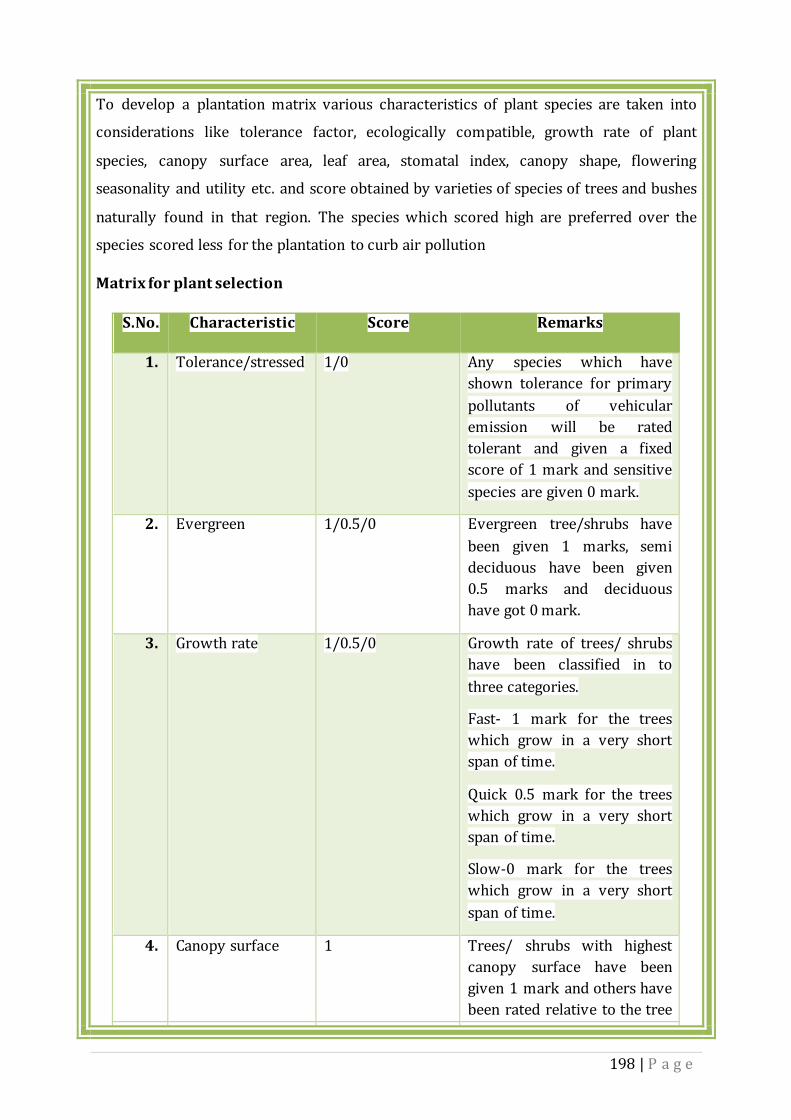
198 | P a g e
To develop a plantation matrix various characteristics of plant species are taken into
considerations like tolerance factor, ecologically compatible, growth rate of plant
species, canopy surface area, leaf area, stomatal index, canopy shape, flowering
seasonality and utility etc. and score obtained by varieties of species of trees and bushes
naturally found in that region. The species which scored high are preferred over the
species scored less for the plantation to curb air pollution
Matrix for plant selection
S.No. Characteristic Score Remarks
1. Tolerance/stressed 1/0 Any species which have
shown tolerance for primary
pollutants of vehicular
emission will be rated
tolerant and given a fixed
score of 1 mark and sensitive
species are given 0 mark.
2. Evergreen 1/0.5/0 Evergreen tree/shrubs have
been given 1 marks, semi
deciduous have been given
0.5 marks and deciduous
have got 0 mark.
3. Growth rate 1/0.5/0 Growth rate of trees/ shrubs
have been classified in to
three categories.
Fast- 1 mark for the trees
which grow in a very short
span of time.
Quick 0.5 mark for the trees
which grow in a very short
span of time.
Slow-0 mark for the trees
which grow in a very short
span of time.
4. Canopy surface 1 Trees/ shrubs with highest
canopy surface have been
given 1 mark and others have
been rated relative to the tree
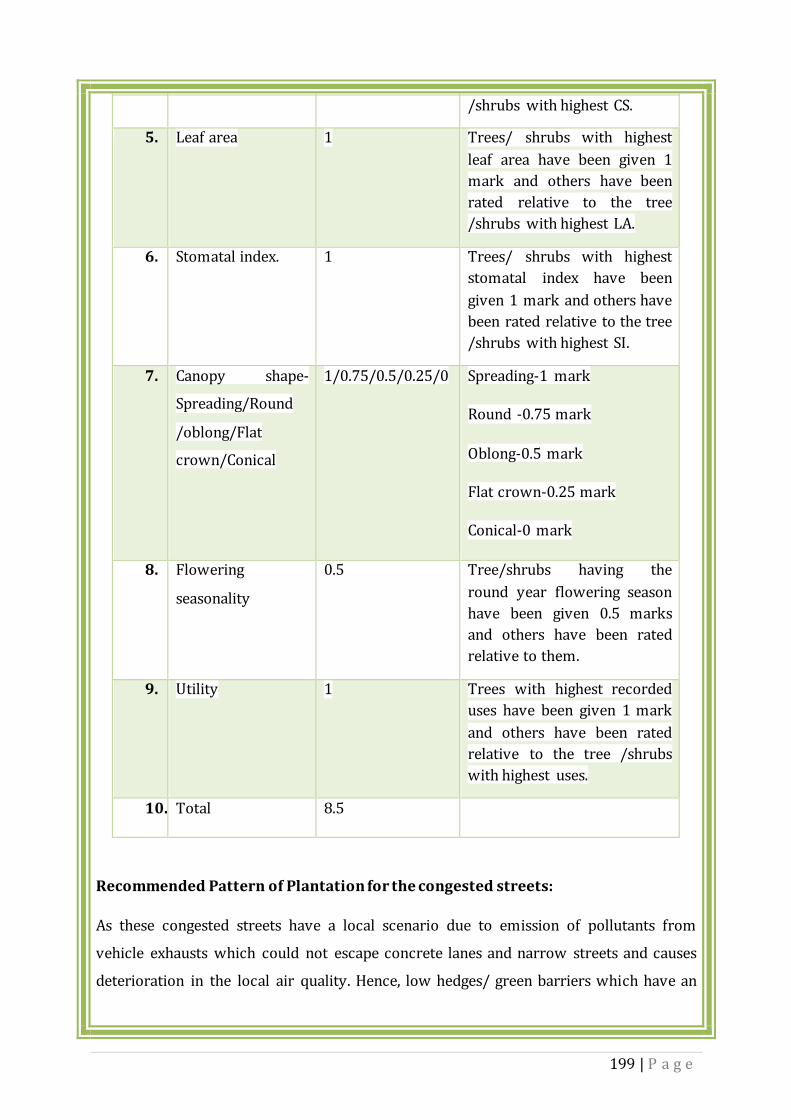
199 | P a g e
/shrubs with highest CS.
5. Leaf area 1 Trees/ shrubs with highest
leaf area have been given 1
mark and others have been
rated relative to the tree
/shrubs with highest LA.
6. Stomatal index. 1 Trees/ shrubs with highest
stomatal index have been
given 1 mark and others have
been rated relative to the tree
/shrubs with highest SI.
7. Canopy shape-
Spreading/Round
/oblong/Flat
crown/Conical
1/0.75/0.5/0.25/0 Spreading-1 mark
Round -0.75 mark
Oblong-0.5 mark
Flat crown-0.25 mark
Conical-0 mark
8. Flowering
seasonality
0.5 Tree/shrubs having the
round year flowering season
have been given 0.5 marks
and others have been rated
relative to them.
9. Utility 1 Trees with highest recorded
uses have been given 1 mark
and others have been rated
relative to the tree /shrubs
with highest uses.
10. Total 8.5
Recommended Pattern of Plantation for the congested streets:
As these congested streets have a local scenario due to emission of pollutants from
vehicle exhausts which could not escape concrete lanes and narrow streets and causes
deterioration in the local air quality. Hence, low hedges/ green barriers which have an

200 | P a g e
impermeable core are recommended between the traffic lanes and the footpath along
with the isolated trees every here and there.
Recommended Plantation Species for Gorakhpur City:
List of Tree Species for Plantation
S.
No.
Common
Name
Botanical Name S.
No.
Common
Name
Botanical
Name
1. Siris Albizia lebbeck 19. Subabul Leucaena
leucocephala
2. Amaltas Cassia fistula 20. Eucalyptus Eucalyptus
globulus
3. Ber Ziziphus
mauritiana
21. Desi Babool Acacia
nilotica
4. Neem Azadirachta
indica
22. Mango Mangifera
indica
5. Pepal Ficus religiosa 23. Casuarina Casuarina
equisetifolia
6. Guava Psidium guajava 24. Jamun Syzygium
cumini
7. Amla Phyllanthus
emblica
25. Sheesham Dalbergia
sissoo
8. Tamarind Tamarindus
indica
26. Pakad Ficus virens
9. Sahajan Moringa oleifera 27. Chitwan Alstonia
scholaris
10. Gulmohar Delonix regia 28. Gular Ficus
racemosa
11. Sagwan Tectona grandis 29. Bottlebrushes Callistemon

201 | P a g e
12. Shahtoot Morus 30. Mahua Madhuca
longifolia
13. Kanji Millettia pinnata 31. Kadam Neolamarckia
cadamba
14. Bakayan Melia azedarach 32. Bahera Terminalia
bellirica
15. Jungle jalebi Pithecellobium
dulce
33. Amla Phyllanthus
emblica
16. Banyan Ficus
benghalensis
34. Jamun Syzygium
cumini
17. Ashoka Saraca asoca 35. Semal Bombax
Ceiba
18. Arjun Terminalia
arjuna
List of Shrub Species for Plantation
S.
No.
Common
Name
Botanical
Name
S.
No.
Common
Name
Botanical
Name
1. Bougainvillea Bougainvillea
glabra
6. Molshree Mimusops
elengi
2. Madar Calotropis
gigantea
7. Chandni Tabernaemont
ana divaricate
3. Chakotra Citrus maxima 8. Harshringar Nyctanthes
arbortristis
4. Kaner Cascabela
thevetia
9. Kunth Tecoma stans
5. Gudhal Hibiscus 10. Nimbu Citrus limon

202 | P a g e
Plants experience physiological changes before getting damaged when the leaves are
exposed to air pollutants. The tolerant species are preferred over the sensitive species
for plantation. To analyze the species, various variables are used like Air Pollution
Tolerance Index (APTI) which is based on biochemical parameters, Anticipated
Performance Index (API) which is based on biological and socio-economic aspect of a
plant. The carbon trapping and dust accumulating potential also varies from species to
species.
APTI score of different trees and their efficacy in Pollution control.
S.No. Botanical
Name
Family Common
Name
APTI Effective
in
Control
1. Cassia siamea Caesalpiniodeae Kassod tree 10.41 Dust
2. Albizia lebbeck Fabaceae Siris tree 15.9 Air
pollution
3. Alstonia
scholaris
Apocynaceae Chitwan tree
(Blackboard
tree)
6.6 Dust
4. Neolamarckia
cadamba
Rubiaceae Kadamb tree
(Burflower
tree)
15.5 Dust
5. Azadirachta
indica
Meliaceae Neem tree 18.73 Dust, air
pollution
and
Noise
pollution
6. Dalbergia
sissoo
Papilionaceae Sheesham 16.59 Air
pollution
Noise
pollution
7. Madhuca
indica
Sapotaceae Mahua 22.57 Air
pollution
8. Mangifera
indica
Anacardiaceae Mango 20.80 Air
pollution

203 | P a g e
9. Bougainvillea
spectabilis
Nyctaginaceae Booganbel 20.32 Air
pollution
10. Nerium
indicum
Apocynaceae Kaner 18.94 Air
pollution
11. Ficus
benghalensis
Moraceae Banyan 15.92 Air
pollution,
noise
pollution
12. Ficus religiosa Moraceae Peepal 12.41 Air
pollution,
noise
pollution
Significance of Plantation in city:
According to the UN World Health Organization (WHO), about 90% of the global
population living in cities in 2014 was exposed to particulate matter that exceeded the
WHO air quality guidelines. The UN agency estimates that outdoor air pollution caused
three million premature deaths in 2012, with the vast majority occurring in low- to
middle-income nations.
The WHO Health Statistics 2016 says air pollution is "caused by inefficient energy
production, distribution and use, especially in the industrial, transportation and
building sectors, and by poor waste management". It adds that transport systems based
primarily on individual motorized transport can lead to further deterioration in air
quality. As everyone within an urban area breathes the same air, the pollution does not
discriminate - both rich and poor are exposed to the dangers. But, it adds, people living
near the source or busy roads are more exposed and more affected. The WHO says that
the air quality in many cities is not monitored, making it difficult to get an accurate
understanding of the global impact of air pollution. However, planting trees in an urban
setting is not without potential pitfalls. One is regarding the flow of air in heavily
polluted streets, particularly ones with large volumes of traffic. Thick canopies can limit
the circulation of air, trapping the poor quality of air at low levels, where people breathe
but if plantation done in a manner that instead of restricting the air flow it will facilitate

204 | P a g e
the movement of air and also reduce the concentration of pollutants, that should be
encouraged.
Trees help by removing (sequestering) CO2 from the atmosphere during photosynthesis
to form carbohydrates that are used in plant structure/function and return oxygen back
into the atmosphere as a byproduct. Roughly half of the greenhouse effect is caused by
CO2. Therefore, trees act as carbon sinks, alleviating the greenhouse effect. On average,
one acre of new forest can sequester about 2.5 tons of carbon annually. Young trees
absorb CO2 at a rate of 5.9kg per tree each year. Trees reach their most productive stage
of carbon storage at about 10 years at which point they are estimated to absorb 21.8kg
of CO2 per year.
Trees also reduce the greenhouse effect by shading houses and office buildings. This
reduces the need for air conditioning by up to 30 percent which in turn reduces the
amount of fossil fuels burned to produce electricity. The combination of CO2 removal
from the atmosphere, carbon storage in wood and the cooling effect makes trees
extremely efficient tools in fighting the greenhouse effect. Planting trees remains one of
the most cost-effective means of drawing excess CO2 from the atmosphere. Especially,
the urban vegetation plays a multitude of different roles in the urban environment as
they provide shade, absorb and store carbon dioxide, mitigate the urban heat island
effect, affect noise hindrance, enrich the urban biodiversity etc. in addition, trees and
urban vegetation play a great role in enhancing the aesthetical and emotional value.

205 | P a g e
References:
1) Slum Free City Plan of Action – Gorakhpur by Regional Centre for Urban and
Environmental Studies.
2) Government of India, Ministry of Earth Sciences, India Meteorological
Department, Meteorological Centre, Lucknow
3) The State of Forest Report, 2019, Forest Survey of India
4) Bhuvan-app1.nrsc.gov.in/2dresources/thematic/LULC502/MAP/UP.pdf
5) Agriculture Contingency Plan for District: Gorakhpur
6) http://creams.iari.res.in/cms2/index.php/bulletin-2020
7) Gorakhpur Master Plan 2021
8) Assessment report: Primary survey on household cooking fuel usage and
willingness to convert to LPG, June 2016
Copyright © 2022 FDOKUMEN