Clean Air Action Plans for Non-Attainment Cities of Andhra ...
86
1 Clean Air Action Plans for Non-Attainment Cities of Andhra Pradesh Anumita Roychowdhury Centre for Science and Environment Air Quality Management: Building Strategies for Clean Air, Joint initiative of State Pollution Control Board, Government of Andhra Pradesh, and Centre for Science and Environment Vijayawada, June 11, 2019
-
Upload
khangminh22 -
Category
Documents
-
view
1 -
download
0
Transcript of Clean Air Action Plans for Non-Attainment Cities of Andhra ...

1
Clean Air Action Plans for Non-Attainment
Cities of Andhra Pradesh
Anumita Roychowdhury
Centre for Science and Environment
Air Quality Management: Building Strategies
for Clean Air,
Joint initiative of State Pollution Control
Board, Government of Andhra Pradesh, and
Centre for Science and Environment
Vijayawada, June 11, 2019

2
City-wise and cross sectoral
action plan
Non-attainment cities:
--Vijayawada
-- Visakhapatnam
-- Guntur
-- Kurnool
-- Nellore
Sectoral plans
-- Air quality management and monitoring strategies
-- Industry and mining areas
-- Power plants
-- Vehicle and transportation strategies
-- Waste burning
-- Construction activities
-- Diesel Generator Sets
-- Solid fuel burning
-- Road dust
-- Greening

3
What is this plan all about?
1. Source-wise and city-wise Comprehensive Plan to meet air pollution reduction targets
(National Clean Air Programme has set a generic target of 35% reduction; Need city and sector
specific targets based on the current baseline)
• Base plan common for all cities. Additional special measures for individual cities
• Strategies with detailed indicators instead of listing only broad action items
• Integrated existing action plans, aligned ongoing measures in different sectors, and
added improved measures for a comprehensive framework. This leverages available
resources and maximises benefits
• Provides scope of replication and expansion of emerging good practices like the Smart
City initiatives of Bhubaneswar; industrial pollution control efforts etc
• Addresses issues of big and small cities differently
• Timeline for action; agencies responsible
• Institutional arrangement for implementation
• Compliance and monitoring strategies
• Need robust data; Assessment of pollution sources and health risk
• Need equitous, affordable, and innovative solutions
• Combine local air quality control with regional air quality planning to reduce of trans-boundary
effect
2. Graded Response Action Plan linked to daily air quality for emergency response

4
Monitoring stations
-- Vijayawada = 8 manual, 1 real-time
-- Visakhapatnam = 10 manual, 2 real-time
-- Guntur = 2 manual
-- Nellore =1 manual
-- Kurnool = 1 manual
The annual trend assessment based on data available on
CPCB Envis air quality database
Manual monitoring underestimates pollution; not amenable
for daily action and public information
Current status of air quality
monitoring
5
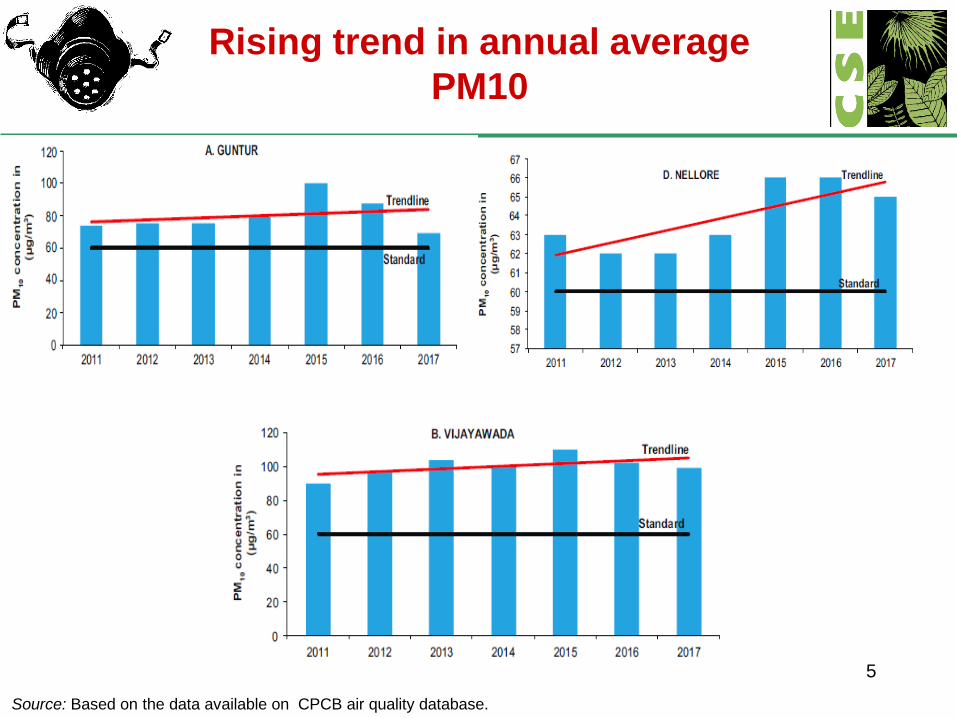
Rising trend in annual average
PM10
Source: Based on the data available on CPCB air quality database.

6
Stable trend in annual average PM10
Source: Based on the data available on CPCB envis air quality database

Source2015, Norwegian Institute for Air Research, International Institute for Applied Systems Analysis, IITM
Regional Challenge
Daily PM2.5 mean
Source: Sagnik Dey 2016, Indian Institute of
Technology Delhi,
Annual PM2.5 mean

PROBABLE
SO2
HOTSPOT?
???
SOURCE: SO2 madd forecasts from windy.com available at https://www.windy.com/-Show-add-more-layers/overlays?so2sm,16.046,81.885,6 as
accessed on 10th June 2019.
Aerial raids

9
•Monitoring network design (By population distribution and land-use
(industry, residential, traffic intersections, sensitive areas etc).
•Leapfrog to real-time monitoring.
•Quality control and assurance for credible data
•Data reporting and pubic information system
•Pollution forecasting
•Realtime Continuous monitoring of stack emissions
•Pollution source assessment strategy
•Emissions inventory and Source apportionment &Modeling tools
•Exposure assessment
•Potential of sensor based monitoring
•Remote sensing monitoring
Strengthening air quality monitoring
and assessment strategy

10
Adopt official criteria to decide the number
of Air quality monitoring stations in each
city
• Proposed expansion of monitoring network
Note: This table lists the minimum number of monitoring stations required.
*Existing number of monitors includes combination of manual and real time monitoring. More than 80 per cent of the stations in
Andhra Pradesh are manual and do not provide daily air quality information. Replace manual monitors with automatic monitors
• Need real time monitors for real time action; manual monitors underestimate problem
Source: Project reports on solid waste management prepared by respective urban local bodie sand
Guidelines for Ambient Air Quality Monitoring, CPCB, 2003.

11
Set air pollution reduction
targets
Based on past three years annual average baseline
• Reduction targets decide the level of stringency and the scale of action
needed
• Example: Delhi needs to reduce PM2.5 levels by 74% to meet the PM2.5 standards
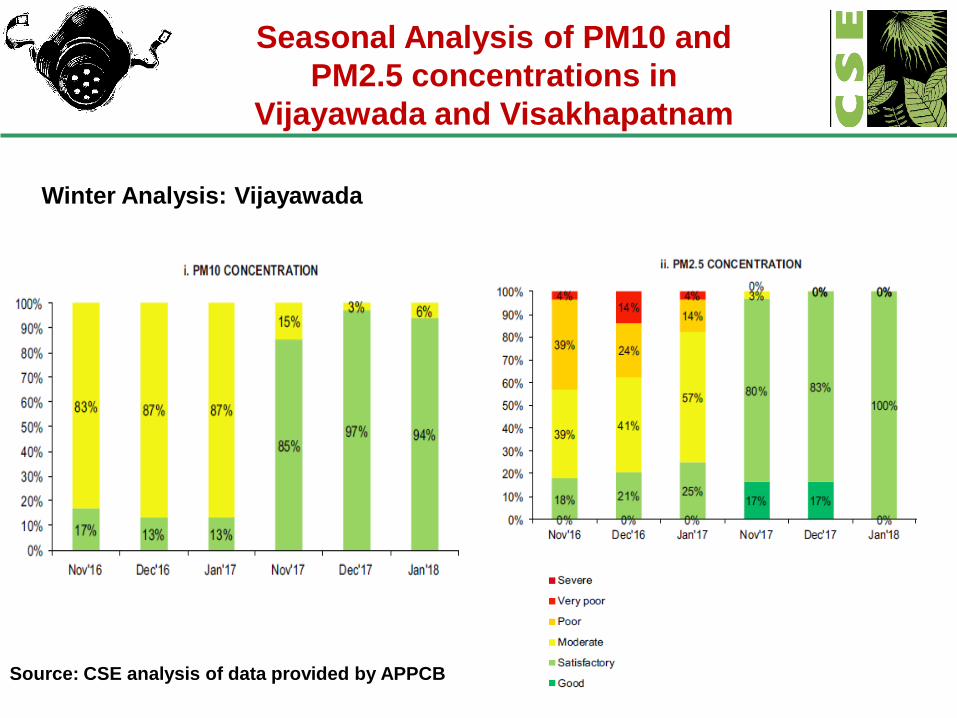
Seasonal Analysis of PM10 and
PM2.5 concentrations in
Vijayawada and Visakhapatnam
Winter Analysis: Vijayawada
Source: CSE analysis of data provided by APPCB

13
Seasonal Analysis of PM10 and
PM2.5 concentrations in
Vijayawada and Visakhapatnam
Winter Analysis: Visakhapatnam
Source: CSE analysis of data provided by APPCB
14
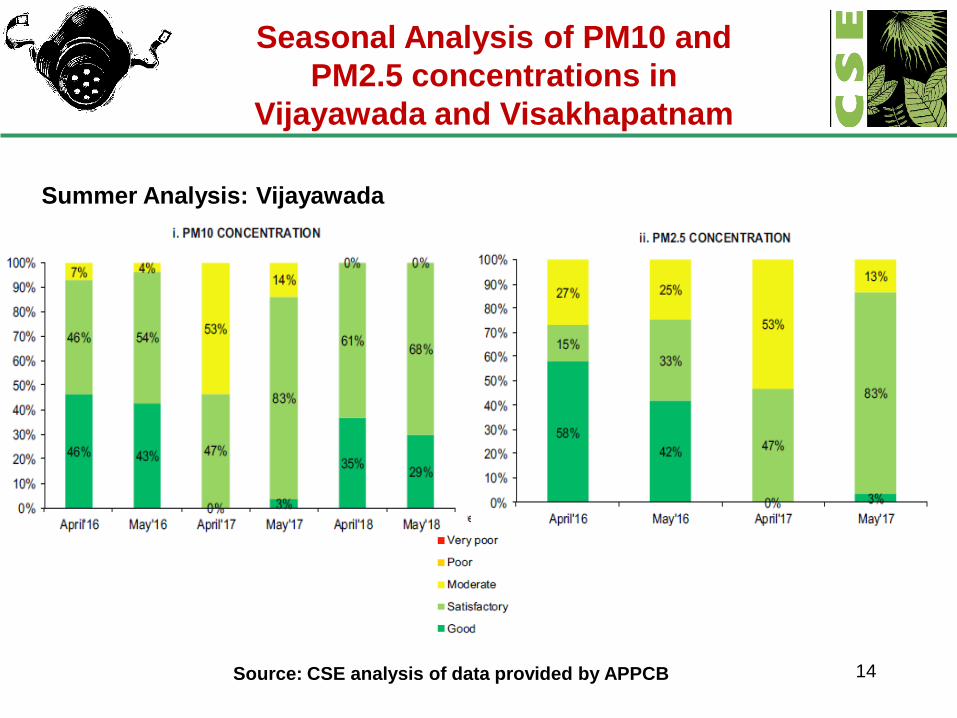
Seasonal Analysis of PM10 and
PM2.5 concentrations in
Vijayawada and Visakhapatnam
Summer Analysis: Vijayawada
Source: CSE analysis of data provided by APPCB

15
Seasonal Analysis of PM10 and
PM2.5 concentrations in
Vijayawada and Visakhapatnam
Summer Analysis: Visakhapatnam
Source: CSE analysis of data provided by APPCB
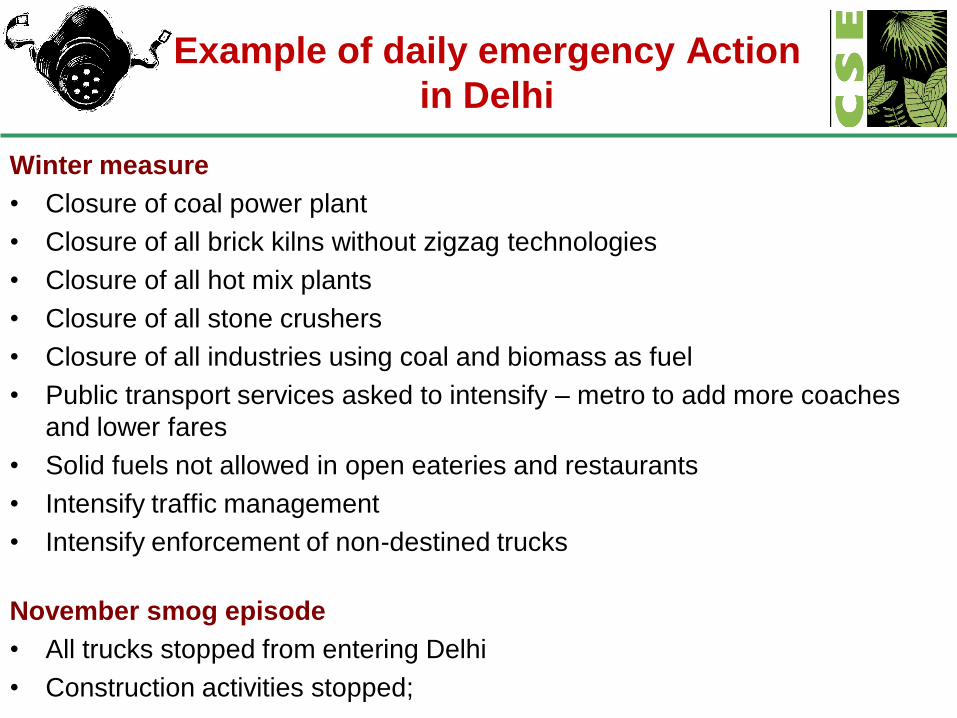
Example of daily emergency Action
in Delhi
Winter measure
• Closure of coal power plant
• Closure of all brick kilns without zigzag technologies
• Closure of all hot mix plants
• Closure of all stone crushers
• Closure of all industries using coal and biomass as fuel
• Public transport services asked to intensify – metro to add more coaches
and lower fares
• Solid fuels not allowed in open eateries and restaurants
• Intensify traffic management
• Intensify enforcement of non-destined trucks
November smog episode
• All trucks stopped from entering Delhi
• Construction activities stopped;
17
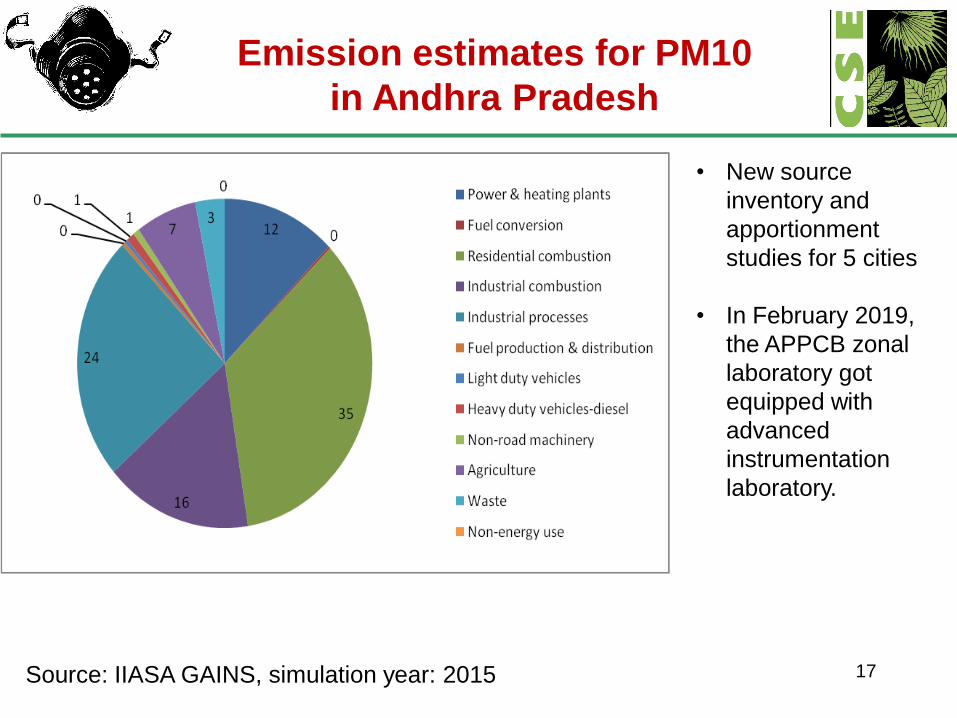
Emission estimates for PM10
in Andhra Pradesh
Source: IIASA GAINS, simulation year: 2015
• New source
inventory and
apportionment
studies for 5 cities
• In February 2019,
the APPCB zonal
laboratory got
equipped with
advanced
instrumentation
laboratory.

Health Risk in Andhra Pradesh
18
• In 2017, the first ever state-level disease burden estimates released by IHME, ICMR
and PHFI showed that air pollution ranked as the fourth-highest risk factor in
2016 and was responsible for premature deaths in Andhra Pradesh.
• A 2018 Lancet report estimated that in 2017, the number of deaths attributed to
air pollution in Andhra Pradesh are 45,525.
• The number of deaths due to household air pollution (19,345) and number of deaths
due to ambient air pollution (23,280) in Andhra Pradesh.
• In the disease profile of the state, ischemic heart disease and lower respiratory
infections have been identified as the leading cause of productive life year’s

High Health Risk in Andhra Pradesh (per 100,000 population)
19
What do we do?
Industries and power plants
20

Industries
and power
plants
21

22
Profile of industries in different districts
of Andhra Pradesh
Source: Andhra Pradesh state economic development board, district industrial profiles

23
Baseline policy action on industrial
pollution control
Visakhapatnam Action Plan as part of critically polluted
areas specified by CPCB:
• APPCB has prepared Action Plan for Visakhapatnam
bowl Area in 2010 with subsequent progress reports in
2012 and 2016.
• Comprehensive industrial siting guidelines

Action on dirty industrial fuels
Petcoke and furnace oil: --
– SC order -October 24, 2017: Ban on pet coke and furnace oil as
fuels in Delhi, UP, Haryana, Rajasthan – Exemption to cement,
calcium Carbide, Lime kilns, Graphite Electrode
– SC order November 17, 2017: Requests all States of India to take
measures to ban Furnace Oil and Petroleum Coke usage.
– DGFT Notification 24.8.2018 – Ban import of petcoke; Also
MOEFCC to restrain its domestic use to be WTO compliant
– SC order - December 31, 2017: SOx and NOx standards for 34
groups of industry
Approved Fuels: Delhi Government - Notification of Approved fuels
list inDelhi: Coal, biomass and high sulphur fuels banned (selective use
of charcoal)
SC order to all states in NCR to prepare approved fuel list
25
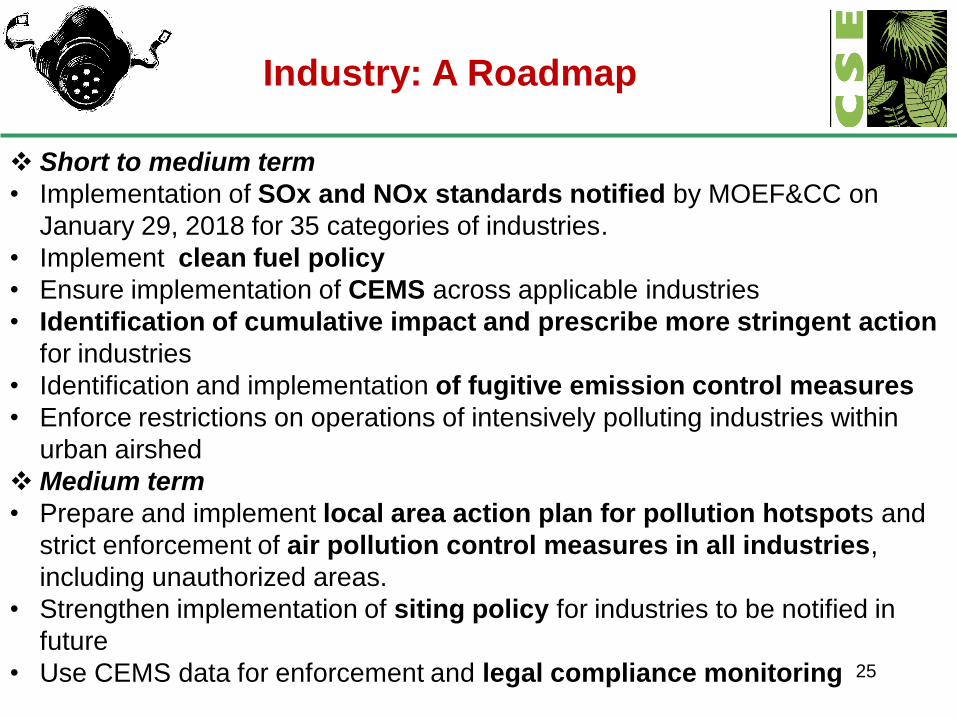
Industry: A Roadmap
Short to medium term
• Implementation of SOx and NOx standards notified by MOEF&CC on
January 29, 2018 for 35 categories of industries.
• Implement clean fuel policy
• Ensure implementation of CEMS across applicable industries
• Identification of cumulative impact and prescribe more stringent action
for industries
• Identification and implementation of fugitive emission control measures
• Enforce restrictions on operations of intensively polluting industries within
urban airshed
Medium term
• Prepare and implement local area action plan for pollution hotspots and
strict enforcement of air pollution control measures in all industries,
including unauthorized areas.
• Strengthen implementation of siting policy for industries to be notified in
future
• Use CEMS data for enforcement and legal compliance monitoring

26
Power Generation
Baseline policy action
• The state has eight thermal power plants. As of
December of 2018, the total power generation capacity of
Andhra Pradesh stands at 17,657 MW, of which 11,626 MW
is coal based, 4,880 is gas-based and 1,150 is hydel.
• As per Andhra Pradesh’s solar policy, the state targets
generation of 5000 MW in next 5 years.
• The state’s wind policy targets generation of 4,000 MW
wind based power in next 5 years.
Leverage clean power

Power Plant
Thermal Power Standard –
Implementation of new thermal power plant standards by an early
date
– Supreme Court Order 2018 – Prioritise high density areas - 400 persons per sq km
– 57 central government units to meet SOx and PM standards by December 2021
– NOx standards by December 2022
– Need roadmap of state and private power plants;
– Ministry of Power to assess use of Merit Order Dispatch to accelerate the process
• Need phase out plan for very old plants
• Chart plant-wise roadmap for cleaner emissions and Incentivize
them (Merit dispatch order)
• Potential of gas based power plants
• Strategies for fly ash pond – bricks, plantation etc

28
Brick kilns: A Roadmap
• Enforce restrictions on operations of brick kilns within urban
airshed zones during high pollution periods
Implement 2017 order of CPCB on brick kilns to:
• provide consent, failing which brick kilns to be shut;
• Meet prescribed norm and siting guideline with immediate effect,
• Provide status on conversion of natural draft to induced draft
• Strictly enforce siting guidelines,
• Ensure the area around brick kilns is paved,
• Ensure fine dust does not accumulate around brick kilns.
• Move from natural draft to induced draft kilns (zigzag
• Prescribe design specifications and ensure compliance
checking
• Need promotional campaign replace traditional bricks with
hollow and perforated bricks, flyash bricks, concrete blocks with
recycled waste, etc

29
Vehicular Emissions and Mobility
Management
(I) Reduce emissions from new vehicles
30 30
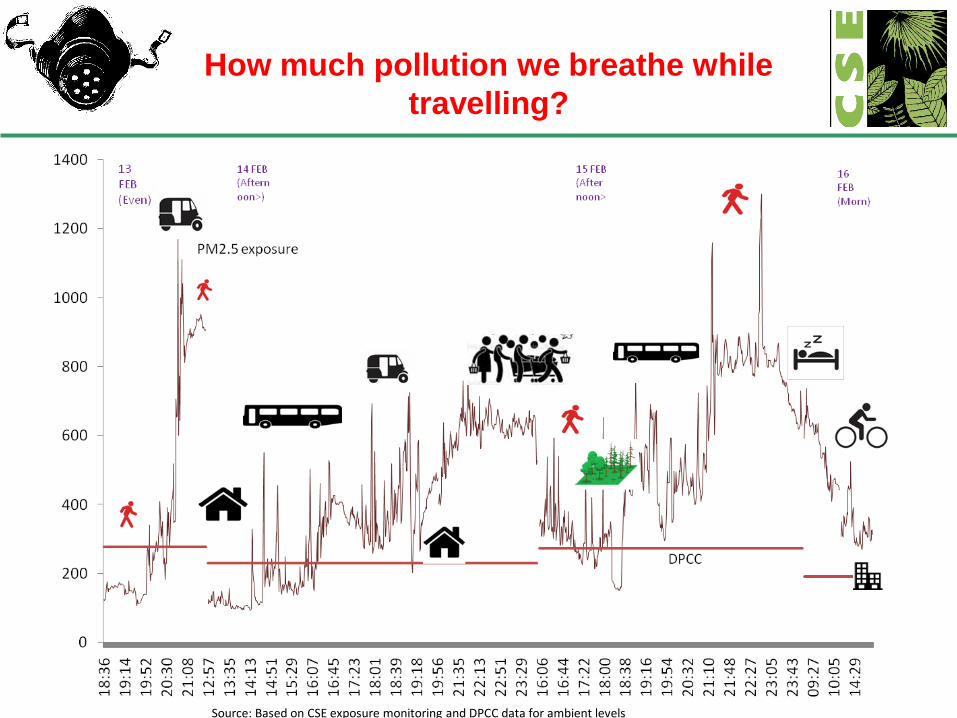
How much pollution we breathe while
travelling?
Source: Based on CSE exposure monitoring and DPCC data for ambient levels

31
Annual registration of vehicles of Andhra
Pradesh from 2001–12
Source: Road Transport Yearbook, 2017.
• The total vehicles
registered in
Andhra Pradesh
grew at an annual
rate of
approximately 19
per cent per
annum between
2001 and 2012

32
Trend in motorization in Vijayawada
and Visakhapatnam
Source: Road Transport Yearbook, 2017
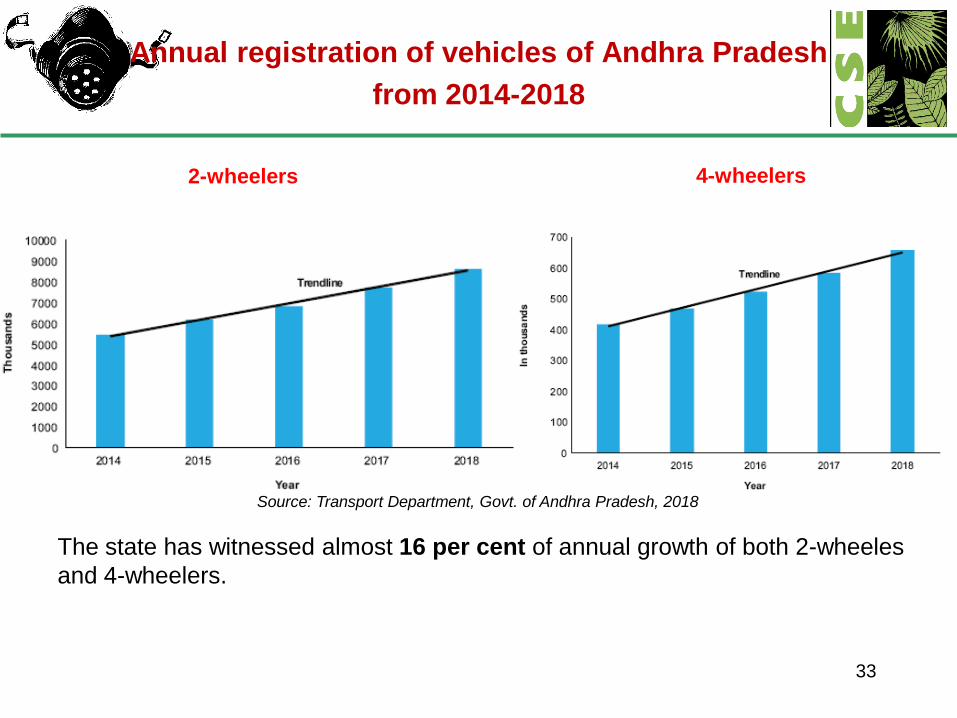
Annual registration of vehicles of Andhra Pradesh
from 2014-2018
33
2-wheelers 4-wheelers
Source: Transport Department, Govt. of Andhra Pradesh, 2018
The state has witnessed almost 16 per cent of annual growth of both 2-wheeles
and 4-wheelers.

34
• Fuel-wise breakup of fleet shows that in all the non-attainment cities except
Visakhapatnam the number of diesel 4-wheelers is higher than petrol 4-
wheelers.
Diesel-the preferred choice?
0
10000
20000
30000
40000
50000
60000
70000
80000
GUNTUR KRISHNA KURNOOL NELLORE VISHAKAPATNAM
Axi
s Ti
tle
Petrol Diesel
Source: Based on data from Andhra Pradesh Transport Department

Reducing tailpipe emissions
Vehicle technology and fuel quality
• Leapfrog to clean emissions standards (BSVI)
• Introduce clean fuels (CNG)
• Zero emissions mandate for electric mobility
• Ensure vehicles remain low emitting through out their
useful life on road; lower real world emissions
• Ensure rapid fleet renewal
• Need scrappage and end of life policy

Need BSVI preparedness

37
Age-wise distribution of diesel auto-
rickshaws registered in the five cities
0
2000
4000
6000
8000
10000
12000
14000
16000
>5 years 5-10 years 11-15 years 15-20 years 20-25 years <25 years
RTA GUNTUR RTA VIJAYAWADA RTA KURNOOL RTA NELLORE RTA VISHAKAPATNAM
Source: Based on data from Andhra Pradesh Transport Department
• Under BSIV, diesel
auto is legally
allowed to emit 1.7
times higher
particulate matter,
and 1.3 times higher
NOx+HC than a
BSIV diesel car.
• This gap will widen
under BSVI
regulations.
• Even after meeting
BSVI standards, a
diesel three-wheeler
will emit close to 6
times higher
particulate matter
and two times more
nitrogen oxide than
BSVI diesel car.

38
Natural gas vehicle programme
Baseline policy action
Bhagyanagar Gas Ltd. is responsible for provision of CNG to
the urban agglomerations of Vijayawada and Kakinada.
There are 8 CNG fueling facilities around Vijayawada
As of November, 2018, there are 11,236 CNG auto-rickshaws
plying on the streets of Vijayawada and 8,200 CNG 4-wheelers
in the district.
Natural gas programme can reduce emissions significantly

39
Electric Mobility Policy, 2018
Complete reimbursement of road tax and registration fees, on sale of electric vehicles until
2024.
Target of 10 lakh electric vehicles on road by 2024; To stop registration of petrol and diesel
vehicles by 2024 in Amravati. All government vehicles to be electric by 2024.
Aims to convert the entire fleet of Andhra Pradesh State Road Transport Corporation
(APSRTC) into electric vehicles.
Deployment of 1500 e-buses in 3 cities of Andhra Pradesh; To purchase over 7,500 e-three-
wheelers for garbage collection by 2019. As of 7th June, 2019, 106 electric vehicles sold – 50%
are 2- wheelers.
To collaborate with Kia Motor India for ‘Partnership for Future Eco Mobility’
Multiple agreements with EESL to get more EVs deployed
New EV policy to attract investment of Rs 30000 Crore; State grant of Rs 500 Crore for EV R&D
To set up 1 lakh slow and fast EV charging stations by 2024.
Electric mobility
Baseline policy action

Electric mobility: A Roadmap
• Need State Level Electric Mobility Policy and Zero
Emissions Mandate to chart the roadmap for all five cities
• Prioritise electric mobility for public transport, para transit
(autos and taxis), feeder service and delivery fleet
• Charging infrastructure; affordable strategies for batteries
– 50 charging station will be erected in the first phase among which 33
charging stations have already been built in Krishna, East Godavari and
West Godavari districts.
• Scale up and replicate initiative in other non-attainment cities

41
Addressing on-road emissions Andhra Pradesh’s ageing vehicular
Fleet: 4-wheelers (diesel)
0
5000
10000
15000
20000
25000
30000
35000
>5 years 5-10 years 11-15 years 15-20 years 20-25 years < 25 years
GUNTUR KRISHNA KURNOOL NELLORE VISHAKAPATNAM
Source: Based on data from Andhra Pradesh Transport Department
• Transport department seeking Whatsapp messages visibly polluting vehicles
on road

Andhra Pradesh’s ageing vehicular
Fleet: 2-wheelers
42
0
100
200
300
400
500
600
700
800
900
1000
>5 years 5-10 years 11-15 years 15-20 years 20-25 years <25 years
GUNTUR KRISHNA KURNOOL NELLORE VISHAKAPATNAM
Source: Based on data from Andhra Pradesh Transport Department
Most of the 2-wheelers fleet in 5 non-attainment cities of Andhra Pradesh are more than 25
years old and specifically Guntur has the highest number of aging vehicles.

43
PUC reforms: A Roadmap
i. National level
Link PUC certificates with annual vehicle insurance to ensure 100
per cent compliance. (MORTH is assessin this)
ii. State level
Auditing of Pollution under Control (PUC) certification centres
Upgradation of in-use emissions testing for diesel vehicles
Enforcement of law against visibly polluting vehicles
Implement an on-board diagnostic system fitted in new vehicles
for vehicle inspection (MORTH Notification). Check MIL light and
if OBD is working
Set up centralised testing centres for both emissions and fitness
tests
Vujaywada can pilot remote sensing emissions monitoring of on-
road vehicles

44
Baseline action on trucks
In Bhubaneswar the trucks are allowed to
ply from 8pm to 8 am and in coal mining
areas from 6pm to 6 am.
Lessons from Delhi
Environment compensation charge
on truck entry
Created dedicated fund
RFID system – installed at 13
locations for automatic and eletronic
payment and improved monitoring
Weigh in motion bridge to check
overloading
Entry restriction on more than 10
year old trucks
Eastern and Western Peripheral
Expressways to bypass truck traffic
NH71A
NH71
SH20
Panipat
Sonipat
Rewari
Jhajjar
Rohtak
Trucks

45
Reduce tailpipe emissions: A
Roadmap
Short- to medium-term priority action
• Emission and fuel quality for new vehicles Ensure on-schedule implementation
of BS VI fuel and emission standards on April 1, 2020.
Medium-term priority action
• Vapour recovery at Refueling Stations
• Alternative clean fuel policy for vehicles
Short-term priority action
• Gaseous fuel programme: Expand CNG, LNG, LPG programme across all six
cities
Short- to medium-term action
• Electric vehicle programme: Need zero emissions mandate for targeted
vehicle segment-wise phase in of electric vehicles— two-wheelers, three-
wheelers/para transit, buses and large delivery fleet.
• Bio fuel policy
• Need favorable tax measures to promote clean fuels and zero emissions
vehicles

46
Link with mobility management
Cars occupy
more road
space, carry
fewer people,
pollute more,
guzzle more
fuel.
They edge out
public transport
users,
pedestrians,
bicycles, cycle
rickshaws ..

District-wise modal share
Source: Census of India, 2011
Most of the non-attainment cities, the primary mode of travel is (walking and cycling. Andhra
Pradesh should capitalise on this inherent advantage of higher preference for NMT.
27 25
33 29
38
12 24
23
16
22 23
20
20
20
18
4
2
2
2
2
7
7
9
10
9 24 19
9
18
9
2 2 2 4 1 1 0 0 0 0 1 1 1 1 1
0
10
20
30
40
50
60
70
80
90
100
Visakhapatnam Krishna (Vijayawada) Guntur Nellore Kurnool
On foot Bicycle 2-wheeler Car 3-wheeler Bus Train Water transport Other

Baseline policy action on public
transport
• City bus operation in
Vijayawada and
Visakhapatnam- Among 5 non-
attainment cities only these two
big cities have formal bus service
• BRT system in Vijayawada and
Vishakhapatnam
Vijayawada Bus shelter

49
Public transport and multi-modal
integration: A Roadmap
Introduce reliable and accessible city bus system of appropriate fleet
size and desirable bus type
Need GPS enabled public information system (PIS)
ETVMs for fare collection and Passenger Information Systems
Develop passenger information system
Implement electric bus programme
With multi-system plans in plans (bus, BRT, Metro) prepare for multi-
modal integration – physical integration, and fare integration

50
Roadmap for smaller cities
Reorganise intermediate public transport (IPT) – autos,
shuttle, taxis
Link electric vehicle programme with IPT
Bus system for longer trunk routes
High street density with well designed pavements and
cycling facilities and adequte protection for the pedestrians
and cyclists for safe access
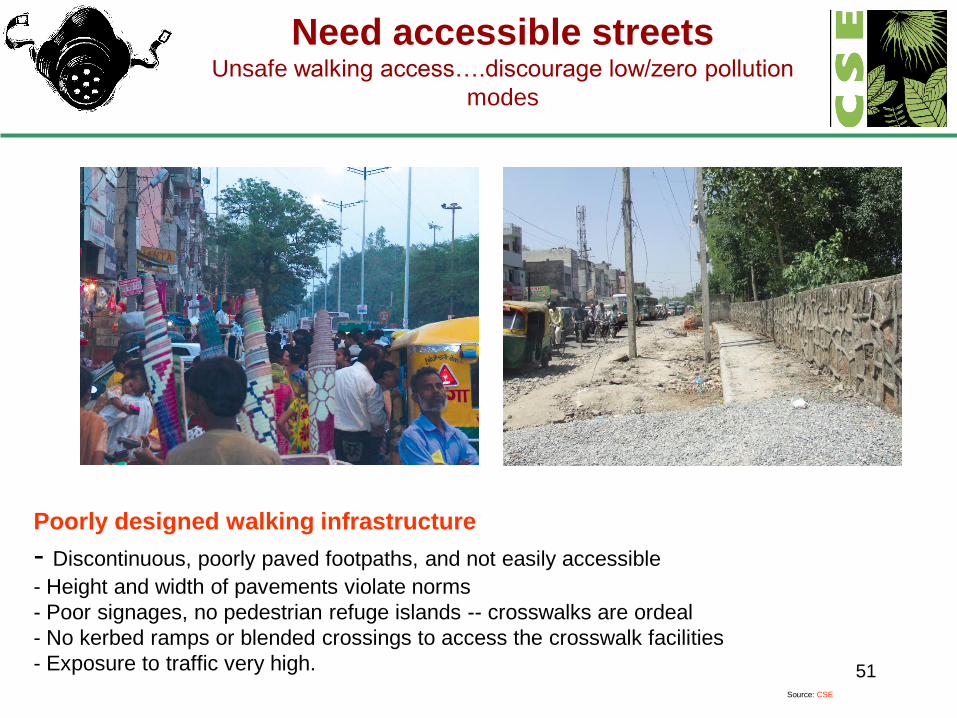
51
Need accessible streets Unsafe walking access….discourage low/zero pollution
modes
Poorly designed walking infrastructure
- Discontinuous, poorly paved footpaths, and not easily accessible
- Height and width of pavements violate norms
- Poor signages, no pedestrian refuge islands -- crosswalks are ordeal
- No kerbed ramps or blended crossings to access the crosswalk facilities
- Exposure to traffic very high.
Source: CSE
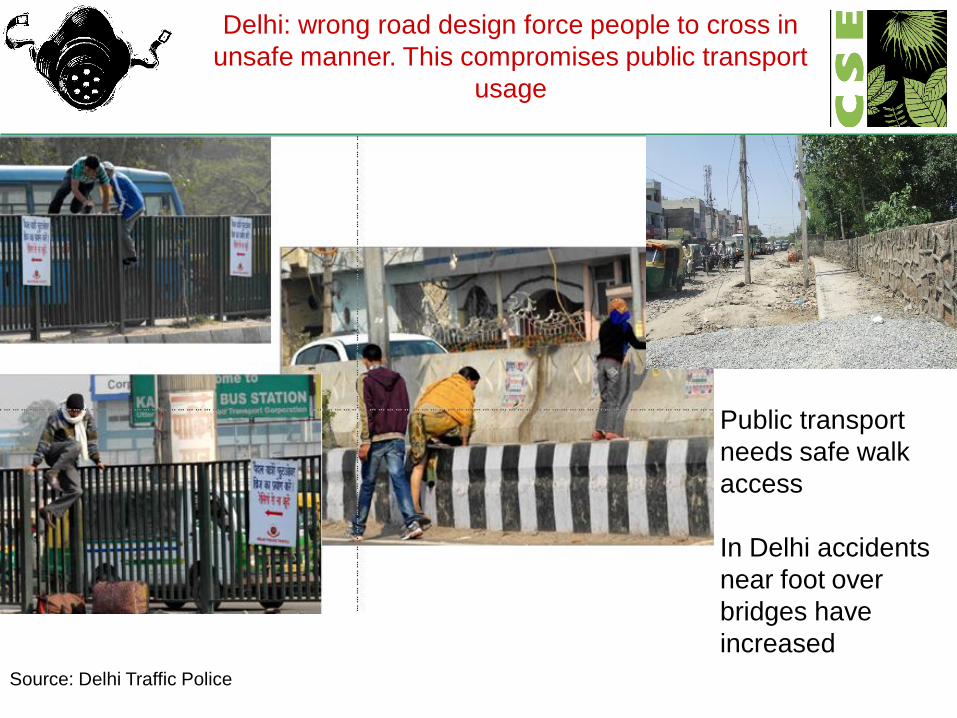
Source: Delhi Traffic Police
Delhi: wrong road design force people to cross in
unsafe manner. This compromises public transport
usage
Public transport
needs safe walk
access
In Delhi accidents
near foot over
bridges have
increased
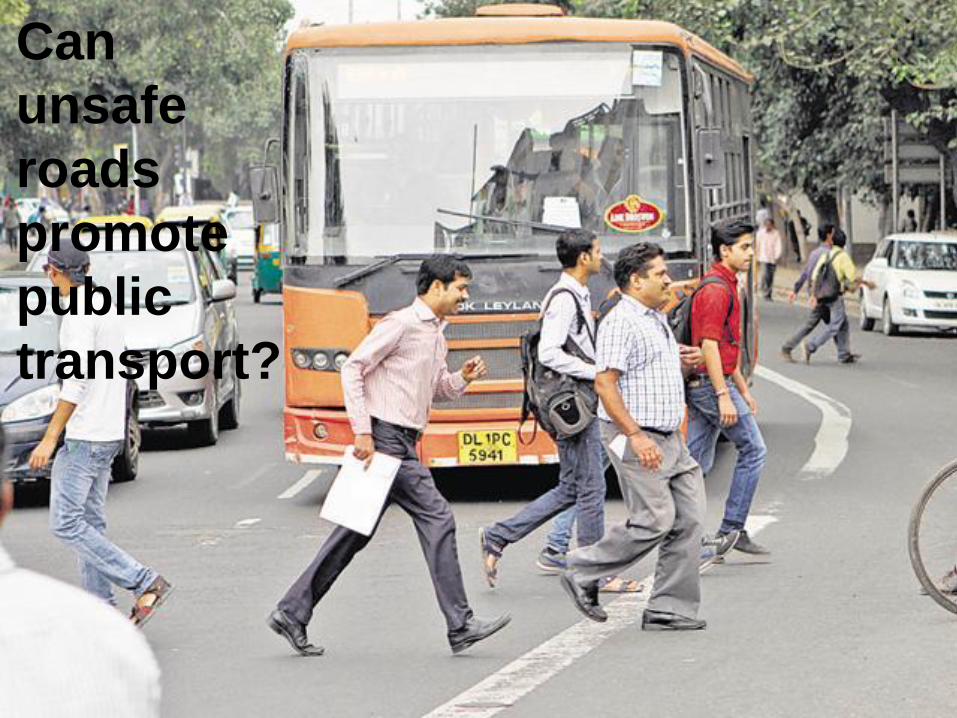
Can
unsafe
roads
promote
public
transport?

54
Footpaths in Vijayawada being
encroached by shops lining the roads

55
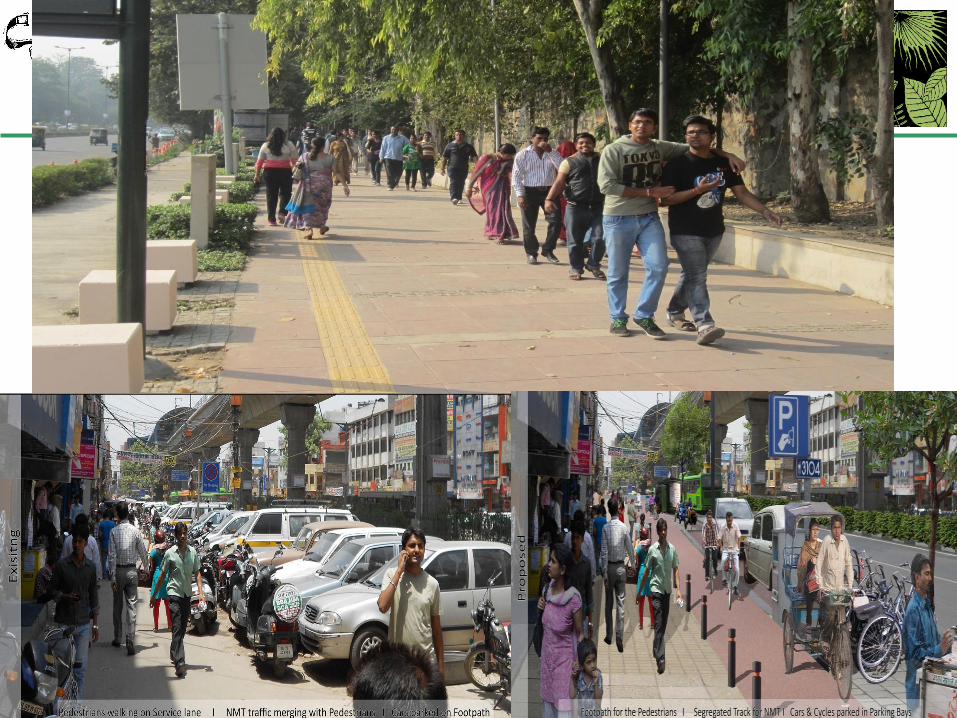
Street design norms can make streets safe and
accessible
Connaught Place
• Implement street design
guidelines
Source: CSE

57
Non-motorised transport and last
mile connectivity: A Roadmap
Implement zonal plan for developing NMT network
Compact city development
City Master Plan to promote compact urban form to
contain urban sprawl, and reduce distances and
emissions. Promote planned mixed use development

58 58
Car centric road design locks in
enormous pollution
Engineering changes once made cannot be reversed
easily… It permanently decides our travel choices

Is this paradigm sustainable?
Super blocks, opaque boundary walls, no street activity,
limited access....
Source: CSE

National Habitat Standard Mission of the Ministry of Urban
Development
Guidelines for compact mixed land use
-- 95% of residences should have daily needs retail, parks, primary schools and recreational
areas accessible within 400m walking distance.
-- 95% residences should have access to employment and public and institutional services
by public transport or bicycle or walk or combination of two or more.
-- At least 85% of all streets to have mixed use development.
-- Need small block size with high density permeable streets etc
Build compact city
UTTIPEC guidelines

61
Is this sustainable?
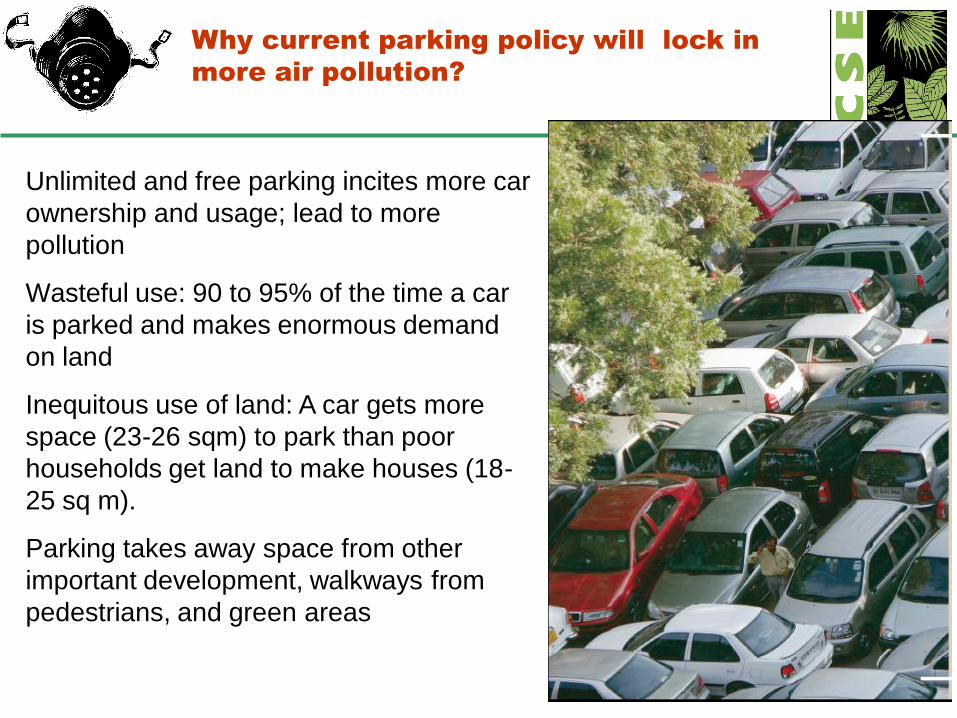
Why current parking policy will lock in
more air pollution?
Unlimited and free parking incites more car
ownership and usage; lead to more
pollution
Wasteful use: 90 to 95% of the time a car
is parked and makes enormous demand
on land
Inequitous use of land: A car gets more
space (23-26 sqm) to park than poor
households get land to make houses (18-
25 sq m).
Parking takes away space from other
important development, walkways from
pedestrians, and green areas

Parking demand in non-attainment
cities
Enormous pressure on public land: Free and
unregulated parking stimulates more demand for
parking
Parking policy, 2013: Focused on -- Operational
standards/ guidelines to encourage private initiative and
Government initiatives in creation of adequate parking
spaces through appropriate incentives and enforcement
systems.
Not focused on demand management
64
Parking and clean air
It is still not clear to many how parking management and restraints can
reduce air pollution and give public health benefits
Boston froze their parking requirements at a level that is only 10 per cent
higher than the 1973 level to meet the Federal clean air standards.
New York: very high parking fees and limited parking supply have lowered
car ownership far below the average rates in other US cities.
Amsterdam -parking fees expanded to meet EU directives regarding NO2
and PM10 emissions. Car plate numbers are registered with emissions
information. Trucks are allowed to unload for a maximum of 15 minutes
in spots where they are not allowed to park
Zurich considers total NO2 emissions when determining the amount of
parking to be allowed.

Global parking pricing levers
Japan
Proof of parking regulations and ban on night parking on streets:
Vehicle owner procures a “garage certificate” from the Police
department for vehicle registration. This is re-issued in case of change
of ownership or address .
Singapore and Hong Kong have stringent approaches towards
restraining car ownership and usage.
Hong Kong has been more effective in restraining car ownership –
about 60 cars per 1000 people vs 110 cars per 1000 people in
Singapore. Singapore has three times more private car kilometres of
travel per person than Hong Kong.
This is explained by the Hong Kong’s more expensive parking.

66
Walking and cycling policies cannot
work without Parking Policy: Lesson
from Bhubaneswar

67

11.06.2019
No meters Meters Prices quadrupled
Grosvenor square, London
Source: TRL in ITDP (2011): Europe‘s Parking U-Turn
Effectively priced parking can
make a difference

Need parking area
management plan
• Area level plan prepared by any local body to demarcate:
• Legal On-street, off-street and multi-level parking facilities.
• Vending zones; Multi-modal integration facilities,
• Green open spaces along with the allied traffic,
• Pedestrian / NMT circulation plans; Signage plans
• Pricing strategy – variable parking pricing
• No parking in green areas, near intersection, near bus stands etc
• Penalise illegal parking
• Promote shared, priced and public parking
• Parking revenue for local area development
• IT based parking area management and reform of contractual
agreement

Area Sources
• Waste/Biomass Burning
• Construction Dust and Construction and Demolition Waste
• Domestic Emissions/Use of solid fuels
• Diesel Generator Sets
• Road Dust
• Crop burning
• Green areas
70

Waste generation in non-
attainment cities

Some burning visuals from Kurnool…
72
Gargeyapuram landfill site
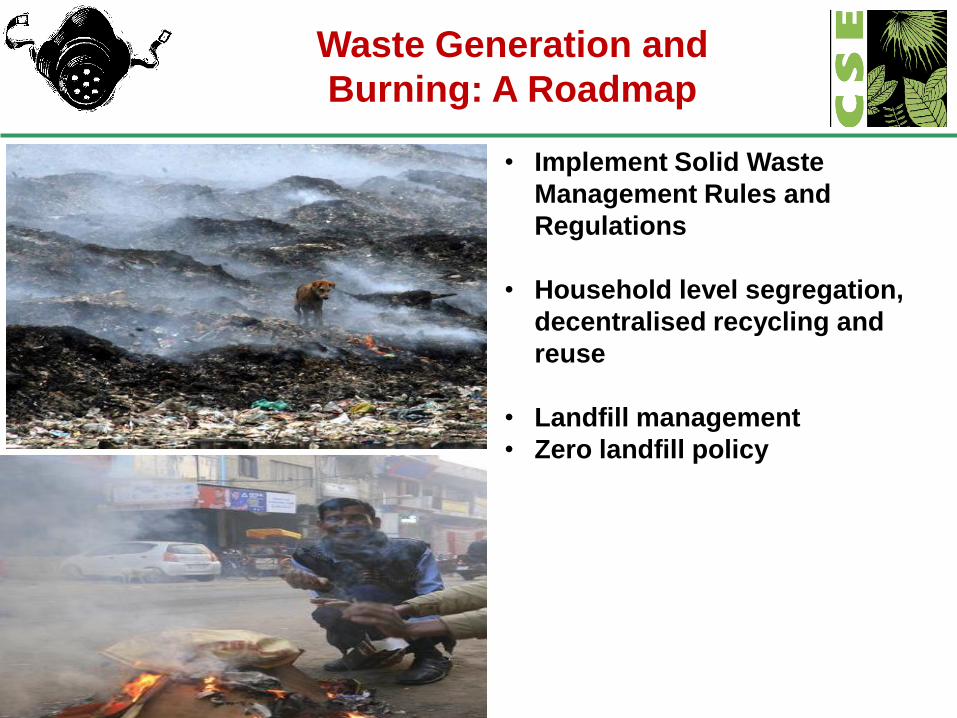
Waste Generation and
Burning: A Roadmap
• Implement Solid Waste
Management Rules and
Regulations
• Household level segregation,
decentralised recycling and
reuse
• Landfill management
• Zero landfill policy

Municipal Solid Waste Management:
Baseline Action
74
Andhra Pradesh is investing in cluster based Waste to Energy
(WTE) treatment plants.
In 2019 there will be WTE plants catering to the urban
agglomerations of Vijayawada, Visakhapatnam and Guntur.
Another WTE plan is being proposed to scientifically manage the
waste being generated In Tirupati.
Plan Waste to Energy Plants – Only if needed - This requires:
• Strict implementation of emission norms,
• State of the art technology
• Provide emission data to State Pollution Control Boards
(CEMS).
• Ensure robust collection system that focuses on collection of
segregated waste.
• Develop a siting policy for WTE plants.

75
Open burning : A Roadmap
• Enforce complete ban on garbage burning. Needs monitoring
• Stringent action against open burning of biomass / leaves / tyres etc.
• Ensure proper collection of horticulture waste (biomass) and
composting-cum-gardening approach and infrastructure
• Implement provisions of Solid Waste Management Rules 2016 to
implement penal provisions to spot fine on waste burning. Strictly ban
open burning of hazardous industrial waste
• Use satellite based monitoring as well as mobile spot check squads for
enforcement
• Proper management of landfill sites to prevent spontaneous fire
• Adopt roadmap for zero landfill policy to promote decentralized waste
segregation, reuse and recycling

Construction and Demolition Waste
Baseline policy action
Construction and demolition waste (C&D)
-- Guidelines on environmental management of construction and demolition
(C&D) wastes 2017
Greater Visakhapatnam Municipal Corporation (GVMC) generated close to 80
tonnes of C&D waste per day. Vijayawada and Guntur generate 110 and 80 TPD
of C&D waste respectively.
-- State government accorded permission to Swachha Andhra Corporation to float
80 TPD capacity recycling plant near Kapuluppada. The state has also set up
waste processing units at Kanaka Durga Varadhi and Eluru canal near
Sitaramaraju Bridge.
-- C&D charges have been fixed for construction: For a structure > 80 sq m
area Rs. 50/- per month; Rs. 100/- charged for 120 sq. metre. Beyond 120 sq.
metre, Rs. 200/- ; Stacking of construction/ demolition debris Rs. 1500/- per
tractor trip Rs. 3000/- per truck trip.

77
Construction and Demolition Waste: A
Roadmap
Short-term action • Ensure dust pollution from construction.
• Undertake control measures for fugitive emissions from material
handling, conveying and screening operations Needs enforcement.
• Enforce restrictions on construction activities within urban airshed
zones during high pollution period
Medium- to long-term action
• Provide network of decentralized C&D waste segregation and
collection sites across the city.
• For material handling, construction and demolition, it should be
obligatory on part of the developers to provide evidence of debris on-
site recycling and/or disposal at designated sites.
• Promote recycling of construction and demolition waste. Implement
provision of Central regulations for construction and demolition waste
management rules 2016. Set-up facilities for recycling of C&D waste

78
Cooking fuels and open eateries:
A Roadmap
• A targeted programme to be implemented
for 100% coverage of households by
distribution of LPG/PNG
• Promote and give access to LPG and
electricity in low-income neighbourhoods, as
well as roadside eateries/dhabas/ restaurants
etc.
• Mandate and link commercial license to
clean fuels.
• Restrict use of coal in hotels and
restaurants, link with licensing policy;
• Incentivize move to LPG, piped natural gas
for residential and commercial use
• 2011 census: Usage of firewood in districts of
Nellore and Kurnool was very high back in 2011.

79
Generator sets
Short-term priority action
• Ensure that only those DG sets that meet the standards in terms of emission or
design of chimneys/ exhaust and acoustic enclosures, also verify and check
whether design specifications are followed or not thereafter the genset to be
allowed to operate.
• Use of DG sets should be regulated according to GRAP
• Curtail use of DG sets in social events by providing temporary electric
connections
Medium- to long-term action
• Alternate power systems should be promoted in cell towers, and use of DG
sets discouraged
• Leverage roof top solar programme to reduce dependence on DG sets
• Ensure access to quality electricity supply
Need reliable access to electricity

80
Open fires and Crop Fires
Satellite Image— 1st April to 31st April, 2018
Source: NASA MODIS and VIIRS data, as accessed on 12 December
Cumulative fires mapped—
or the entire month of March
2018 (peak fires)

Open fires
81
Cumulative fires mapped—1
November–31st November 2018
Cumulative fires mapped—
1st -20th December
Source: NASA MODIS and VIIRS data, as accessed on 12 December

Crop burning: A Roadmap
Provide farmers with alternatives and educate them on
stubble burning
In field solution
Mulch and mix with soil; Can reduce fertiliser cost for
farmers
Ex-situ solution
Promote biomass-based power plants
Production of biofuels and fertilizers
Biomass pellets and other uses
R&D and crop diversification
Uniform decentralized mechanism for the collection,
storage and commercial sale of crop residue

83
Road dust
Short-term priority action
• Sprinkling of recycled water (without compromising other uses); introduce
water fountains at major traffic intersections, wherever feasible
• Phase-in mechanical/vacuum-based street sweeping wherever feasible;
introduce wet/mechanized vacuum sweeping of roads
Medium- to long-term actions
• Implement truck loading guidelines; use of appropriate enclosures for haul
trucks; gravel paving for all haul routes.
• Maintain pot hole-free roads for free flow of traffic to reduce emissions and
dust.
• Increase green cover in the region. Undertake greening of open areas,
gardens, community places, schools and housing societies.
• Enforcement of air pollution control in concrete batching
• Adopt street design guidelines for paving of roads and footpaths (hard and
soft paving) with vegetative barriers.

84
Need institutional coordination between departments for cross-sector action –
vehicles and transport; industry and power plants; waste management; construction;
domestic sources etc
List action with time line and attribute it to the ministry/department responsible
for implementation
Harmonise action across departments; Set up inter-departmental task force to
monitor implementation
Take stock periodically to further refine and upgrade the plan.
Adopt strong legal framework for implementation and compliance
Capacity audit and improvement of implementing agencies
Need impact monitoring
Notify Graded Response Action Plan and Comprehensive Action Plan under
Environment Protection Act
Set up institutional process for clean air
action

85
NCAP funding for air quality monitoring and some support
for studies and plans
Align CAP principles and guidelines with the budget of all
line departments – leverage existing line funding
Mobilise resources based on polluter pay principles to
create dedicated funds – Eg from Delhi – Environment
Compensation Charge on trucks and big diesel cars and SUVs;
Air Ambience cess on each litre of diesel etc. Sector specific
funds
Bilateral and multilateral funding
Reform based funding
Fiscal strategies

Thank You
86