TOWARDS A CLEAN-AIR ACTION PLAN - Centre for Science ...
48
Centre for Science and Environment TOWARDS A CLEAN-AIR ACTION PLAN Lessons from Delhi
-
Upload
khangminh22 -
Category
Documents
-
view
0 -
download
0
Transcript of TOWARDS A CLEAN-AIR ACTION PLAN - Centre for Science ...
1
Centre for Science and Environment
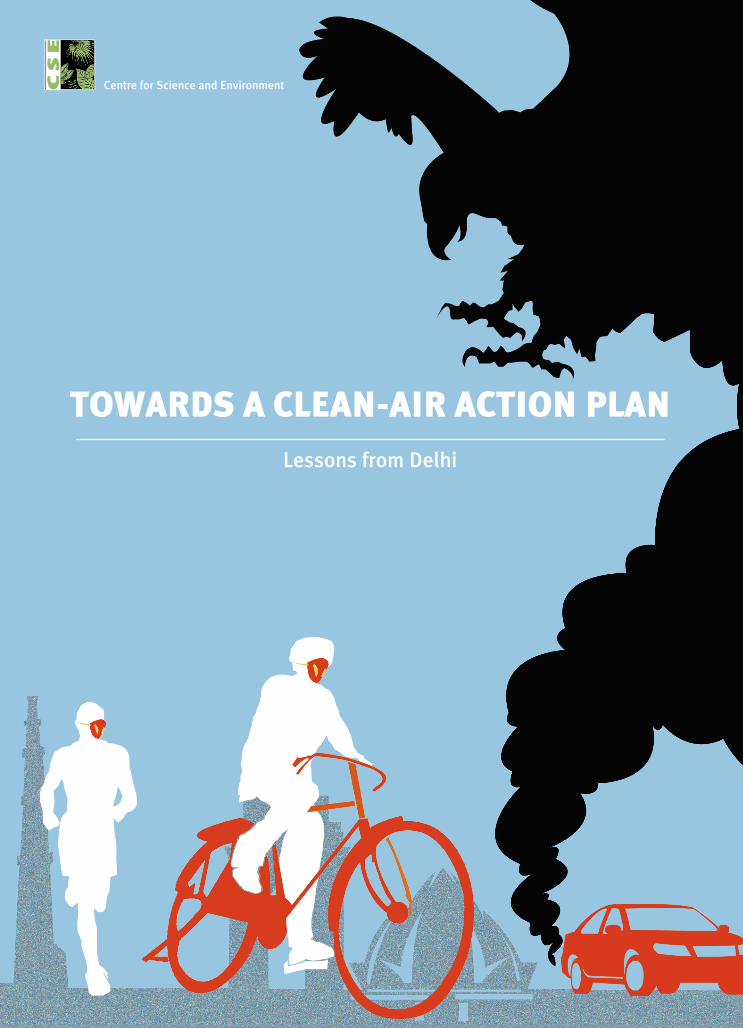
TOWARDS A CLEAN-AIR ACTION PLANLessons from Delhi

2
1
Centre for Science and Environment
TOWARDS A CLEAN AIR ACTION PLANLessons from Delhi

Authors: Sunita Narain, Anumita Roychowdhury
Contributors: Vivek Chattopadhyaya, Usman Nasim, Polash Mukherjee, Shambhavi Shukla, Anisha Raman, Nivit Kumar Yadav, Soundaram Ramanathan
Editor: Souparno Banerjee
Cover design: Ajit Bajaj
Layout: Kirpal Singh
Production: Rakesh Shrivastava and Gundhar Das
© 2016 Centre for Science and Environment
This publication is not for sale. Material from this publication can be used, but with acknowledgement.
Published byCentre for Science and Environment41, Tughlakabad Institutional Area, New Delhi 110 062
Phones: 91-11-40616000
Fax: 91-11-29955879
E-mail: [email protected]
Website: www.cseindia.org
We are grateful to Shakti Sustainable Energy Foundation for its support. The Foundation works to strengthen the energy security of India by aiding the design and implementation of policies that support energy efficiency, renewable energy and the adoption of sustainable urban transport solutions. The views expressed and analysis presented in this document do not necessarily represent those of the Foundation and it accepts no liability for the content of this document, or for the consequences of any actions taken on the basis of the information provided.
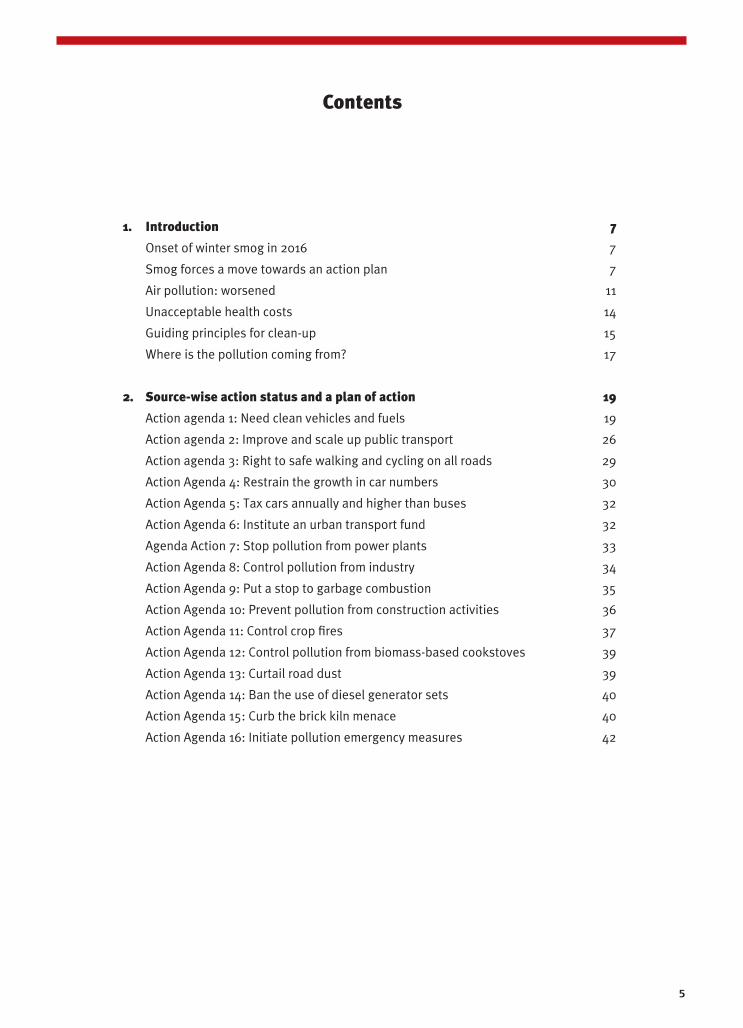
5
1. Introduction 7
Onsetofwintersmogin2016 7
Smogforcesamovetowardsanactionplan 7
Airpollution:worsened 11
Unacceptablehealthcosts 14
Guidingprinciplesforclean-up 15
Whereisthepollutioncomingfrom? 17
2. Source-wise action status and a plan of action 19
Actionagenda1:Needcleanvehiclesandfuels 19
Actionagenda2:Improveandscaleuppublictransport 26
Actionagenda3:Righttosafewalkingandcyclingonallroads 29
ActionAgenda4:Restrainthegrowthincarnumbers 30
ActionAgenda5:Taxcarsannuallyandhigherthanbuses 32
ActionAgenda6:Instituteanurbantransportfund 32
AgendaAction7:Stoppollutionfrompowerplants 33
ActionAgenda8:Controlpollutionfromindustry 34
ActionAgenda9:Putastoptogarbagecombustion 35
ActionAgenda10:Preventpollutionfromconstructionactivities 36
ActionAgenda11:Controlcropfires 37
ActionAgenda12:Controlpollutionfrombiomass-basedcookstoves 39
ActionAgenda13:Curtailroaddust 39
ActionAgenda14:Bantheuseofdieselgeneratorsets 40
ActionAgenda15:Curbthebrickkilnmenace 40
ActionAgenda16:Initiatepollutionemergencymeasures 42
Contents

6

7
1. INTRODUCTION
Onset of winter smog in 2016
In 2016, Delhi experienced one of its worst Diwali smog episodes in many years. Several factors converged to create the dirty haze that enveloped the capital region with the onset of winter. Scientists had predicted a near-total lack of wind and a severe spike in pollution levels on Diwali day – and they were proved right. Even before the Diwali smog could thin out, the weather turned hostile once again. Lower level anticyclone—a weather phenomenon which prevents the dispersal of smog—developed around Delhi on November 2. There was virtually no wind in the vertical column. As a result, the smog thickened and worsened. According to the India Meteorological Department (IMD), this was the worst smog episode with very poor visibility in the last 17 years.
During this period, the levels of PM2.5 increased by 1.4 times on November 5, 2016 from the levels witnessed on Diwali day (see Graph 1: Massive pollution build-up during Diwali). It was 14 times the standard—a situation which was both alarming and dangerous for human health. In fact, the level of pollution was higher than what was recorded during the infamous London smog incident of 1952, and certainly higher than what has ever been seen in Delhi.
The key contributors to this smog in Delhi and its vicinity were vehicles; unchecked construction and road dust; garbage burning; burning of paddy residues by farmers in Punjab, Haryana etc; near-still weather conditions without wind; the onset of winter; and of course, the Diwali firecrackers.
Smog forces a move towards an action plan
Delhi is not a stranger to high pollution levels in winter. Evidence indicates it is getting worse every year. During the winter months of 2014-15, the average
106
211
273 291
328 325
407 377
531
391 368
706
0
100
200
300
400
500
600
700
800
25-Oct-16 26-Oct-16 27-Oct-16 28-Oct-16 29-Oct-16 30-Oct-16 31-Oct-16 01-Nov-16 02-Nov-16 03-Nov-16 04-Nov-16 05-Nov-16
24-h
ou
rly
PM2.
5 co
nce
ntr
atio
n in
mic
rog
ram
me
per
cu
m
24-hourly PM2.5 concentration in microgramme per cum
PM2.5 Standard 60 microgramme per cum
Graph 1: Massive pollution build-up during Diwali smog episode (daily average PM2.5 levels, October 25-November 5, 2016)
Source: CSE’s analysis of DPCC data

8
TOWARDS A CLEAN-AIR ACTION PLAN: LESSONS FROM DELHI
8
number of days with severe levels of pollution, according to the air quality index, was about 33.9 per cent. During the winter of 2015-16, this had shot up to 67.7 per cent (see Graph 2: Trends in winter pollution).
These conditions demand emergency measures—short-term and immediate—which can drastically reduce pollution levels during peak smog episodes. The winter of 2015-16 became a catalyst—in October, the Supreme Court stepped in with a series of directives for targeted action and impact. Among its priorities were curbs on toxic diesel emissions from trucks, cars and taxis; waste burning; construction activities; and power plants.
The impact of these interventions is clearly visible in the winter pollution trends of 2015-16. In this period, the pollution peak declined consistently in response to the action taken. This was in contrast with the previous winter (of 2014-15), when the trend is erratic and more influenced by weather conditions (see Graphs 3 and 4: Comparative pollution trends—2014-15 and 2015-16).
The reduction in truck traffic—following the imposition of environment compensation charge (ECC) on trucks—has also made a difference to night-time pollution levels in Delhi. But enforcement will be critical for this measure to have a continued impact. Besides this, much more will need to be done to control toxic air pollution in Delhi and its neighbouring areas.
Responding to the severe and prolonged smog episodes in 2016 and the public outcry following it, the Delhi government announced a slew of temporary emergency measures. It ordered schools to shut down, closed the coal-based power plant in Badarpur, and halted construction activities for 10 days. It begun vacuum cleaning the PWD roads every week, banned leaf burning and imposed fines on responsible officials. But there was a glaring omission in this range of measures—vehicles remained out of the ambit of the emergency scheme, even though it is common knowledge that they contribute hugely to
3.20% 3.20%
4.80%
38.70%
32.30%
33.90%
67.70%
0%
10%
20%
30%
40%
50%
60%
70%
80%
90%
100%
2014-15 2015-16
Good Satisfactory Moderately polluted Poor Very Poor Severe
Graph 2: Trends in winter pollution
Source: CSE’s analysis of DPCC air quality data

9
TOWARDS A CLEAN-AIR ACTION PLAN: LESSONS FROM DELHI
the toxic emissions. Needless to say, effectiveness of all this emergency action will depend entirely on stringent enforcement and zero tolerance.
The Lt Governor of Delhi has also created a high-powered body to monitor the emergency situation and the measures being implemented. To these, he has further added stringent action on old diesel vehicles and trucks entering Delhi.
9
Graph 3: Pollution trends (winter of 2015-16)—more certain and consistent in response to action
Graph 4: Pollution trends (winter of 2014-15)—more erratic trend influenced by variable weather
Odd Even
2015-16
October November December January February March
700
600
500
400
300
200
100
0
24h
ou
rly
PM2.
5 co
nce
ntr
atio
n i
n m
icro
gra
me
per
cu
m
Very poor
Severe
Safe standard
Gre
en t
ax i
ntr
od
uce
d
on
No
vem
ber
7,
2015
Gre
en t
ax d
ou
ble
d o
n
Dec
emb
er 1
6, 2
015
Ban
on
en
try
of
pre
-200
6 re
gis
tere
d
com
mer
cial
veh
icle
s to
D
elh
i o
n J
anu
ary
5, 2
016
The initiatives to manage air pollution levels in the Capital did manage to moderate PM2.5 levels. Rains in February and March reduced the levels
2014-15
October November December January February March
800
700
600
500
400
300
200
100
0
24h
ou
rly
PM2.
5 co
nce
ntr
atio
n i
n m
icro
gra
me
per
cu
m
Safe standard
Very poor
Severe
The episodes of low PM2.5 levels were largely around months that saw rains
Source: CSE based on real time monitoring data of Delhi Pollution Control Committee
10
TOWARDS A CLEAN-AIR ACTION PLAN: LESSONS FROM DELHI
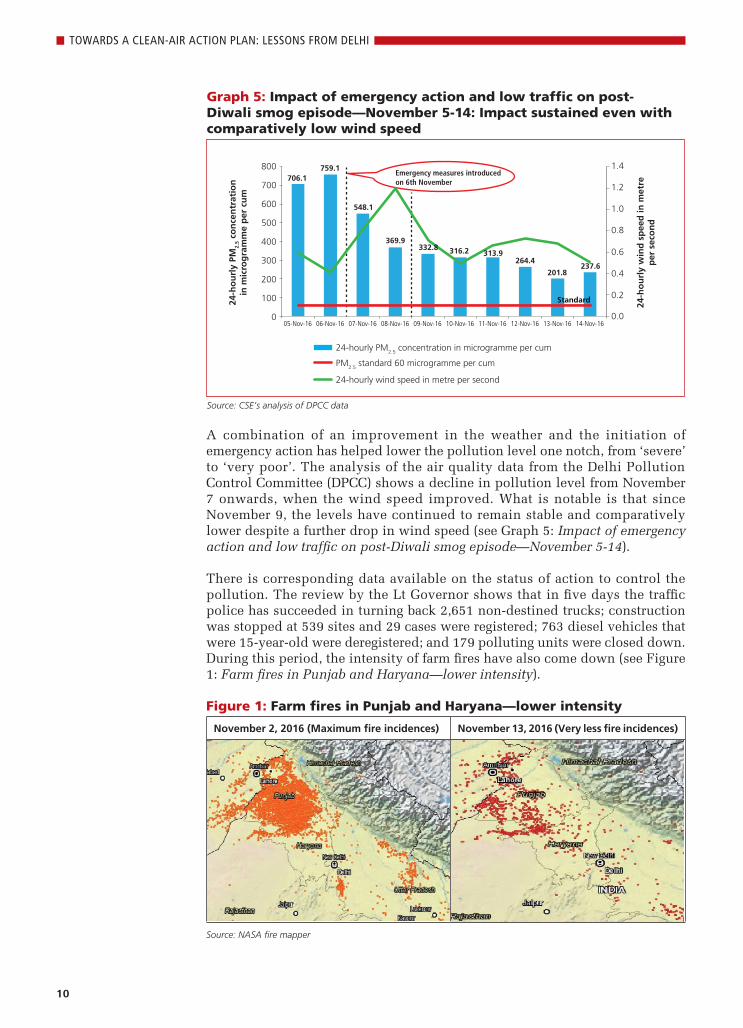
A combination of an improvement in the weather and the initiation of emergency action has helped lower the pollution level one notch, from ‘severe’ to ‘very poor’. The analysis of the air quality data from the Delhi Pollution Control Committee (DPCC) shows a decline in pollution level from November 7 onwards, when the wind speed improved. What is notable is that since November 9, the levels have continued to remain stable and comparatively lower despite a further drop in wind speed (see Graph 5: Impact of emergency action and low traffic on post-Diwali smog episode—November 5-14).
There is corresponding data available on the status of action to control the pollution. The review by the Lt Governor shows that in five days the traffic police has succeeded in turning back 2,651 non-destined trucks; construction was stopped at 539 sites and 29 cases were registered; 763 diesel vehicles that were 15-year-old were deregistered; and 179 polluting units were closed down. During this period, the intensity of farm fires have also come down (see Figure 1: Farm fires in Punjab and Haryana—lower intensity).
Figure 1: Farm fires in Punjab and Haryana—lower intensity
November 2, 2016 (Maximum fire incidences) November 13, 2016 (Very less fire incidences)
Source: NASA fire mapper
Graph 5: Impact of emergency action and low traffic on post-Diwali smog episode—November 5-14: Impact sustained even with comparatively low wind speed
Source: CSE’s analysis of DPCC data
24-h
ou
rly
PM2.
5 co
nce
ntr
atio
n
in m
icro
gra
mm
e p
er c
um
24-h
ou
rly
win
d s
pee
d in
met
re
per
sec
on
d
0
100
200
300
400
500
600
700
800 706.1
759.1
548.1
369.9316.2
264.4
201.8
1.4
1.2
1.0
0.8
0.6
0.4
0.2
0.0
Emergency measures introduced on 6th November
05-Nov-16 06-Nov-16 07-Nov-16 08-Nov-16 09-Nov-16 10-Nov-16 11-Nov-16 12-Nov-16 13-Nov-16 14-Nov-16
24-hourly PM2.5
concentration in microgramme per cum
PM2.5
standard 60 microgramme per cum
24-hourly wind speed in metre per second
332.8313.9
237.6
Standard

11
TOWARDS A CLEAN-AIR ACTION PLAN: LESSONS FROM DELHI
Air pollution: worsened
Delhi is fighting the pollution battle for over 20 years with mixed results; most of the air quality gains made from the earlier action have now been lost. After a short respite between 2002 and 2006, the levels of particulate matter have started to rise again.
There is double trouble—along with tiny particles, noxious gases are increasing, adding to the cocktail of poison. Levels of nitrogen dioxide and ozone are rising steadily. The air is also laced with toxins like benzene that are dangerous even at trace amounts.
0
20
40
60
80
100
120
140
160
180
2011 2012 2013 2014 2015
An
nu
al a
vera
ge
PM2.
5 co
nce
ntr
atio
n
in m
icro
gra
mm
e p
er c
um
Annual average PM2.5
in microgramme per cum Annual standard 40 microgramme per cum
Graph 7: Trends in PM2.5—2011 to 2015
Source: Delhi Pollution Control Committee
0
50
100
150
200
250
300
350
2000 2001 2002 2003 2004 2005 2006 2007 2008 2009 2010 2011 2012 2013 2014 2015
An
nu
al a
vera
ge
con
cen
trat
ion
of
PM10
in
mic
rog
ram
me
per
cu
m
Annual PM10
in microgramme per cum Annual average Standard 60 microgramme per cum
Graph 6: Trends in PM10—2002 to 2015
Source: Central Pollution Control Board and Economic Survey of Delhi 2014

12
TOWARDS A CLEAN-AIR ACTION PLAN: LESSONS FROM DELHI
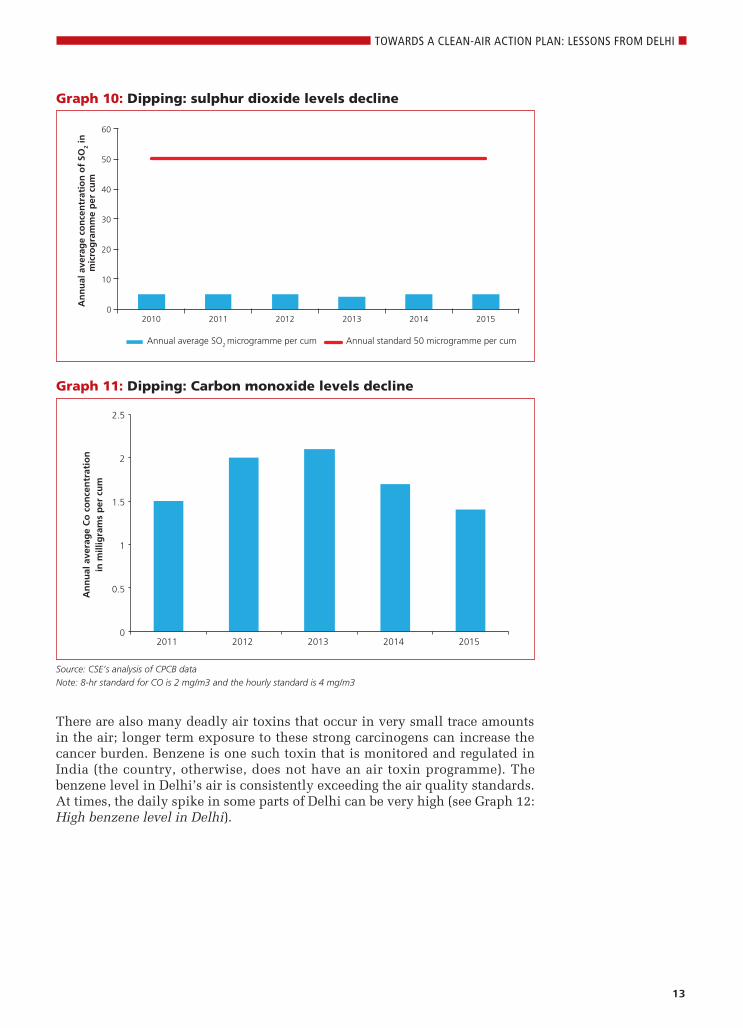
Levels of sulphur dioxide, largely associated with coal burning, and carbon monoxide, that comes mainly from petrol vehicles, have declined (see Graphs 10 and 11: Dipping—sulphur dioxide and carbon monoxide). While coal combustion has reduced in the city, the technology of petrol vehicles has improved substantially to control carbon monoxide emissions. This implies that the sources of particulate matter and nitrogen oxide will require priority attention as these are strongly correlated with the rising trend.
0
10
20
30
40
50
60
70
80
90
2000 2001 2002 2003 2004 2005 2006 2007 2008 2009 2010 2011 2012 2013 2014 2015
An
nu
al a
vera
ge
con
cen
trat
ion
of
NO
2 in
mic
rog
ram
me
per
cu
m
Annual average NO2 in microgramme per cum Annual standard 40 microgramme per cum
Graph 8: Trends in nitrogen dioxide—2002 to 2015
Source: Central Pollution Control Board, 2016, and Economic Survey of Delhi 2014
235
262
0
50
100
150
200
250
300
Apr
il 1
Apr
il 3
Apr
il 5
Apr
il 7
Apr
il 9
Apr
il 11
Apr
il 13
Apr
il 15
Apr
il 17
Apr
il 19
Apr
il 21
Apr
il 23
Apr
il 25
Apr
il 27
Apr
il 29
May
1
May
3
May
5
May
7
May
9
May
11
May
13
May
15
May
17
May
19
May
21
May
23
May
25
May
27
May
29
May
31
Ozo
ne
con
cen
trat
ion
(8
ho
url
y, µ
g/m
3 ) 2015 2016 Safe Standard
Graph 9: Summer ozone levels in Delhi
Source: CSE analysis of DPCC air quality data
13
TOWARDS A CLEAN-AIR ACTION PLAN: LESSONS FROM DELHI
There are also many deadly air toxins that occur in very small trace amounts in the air; longer term exposure to these strong carcinogens can increase the cancer burden. Benzene is one such toxin that is monitored and regulated in India (the country, otherwise, does not have an air toxin programme). The benzene level in Delhi’s air is consistently exceeding the air quality standards. At times, the daily spike in some parts of Delhi can be very high (see Graph 12: High benzene level in Delhi).
0
10
20
30
40
50
60
2010 2011 2012 2013 2014 2015
An
nu
al a
vera
ge
con
cen
trat
ion
of
SO2
in
mic
rog
ram
me
per
cu
m
Annual average SO2 microgramme per cum Annual standard 50 microgramme per cum
Graph 10: Dipping: sulphur dioxide levels decline
0
0.5
1
1.5
2
2.5
2011 2012 2013 2014 2015
An
nu
al a
vera
ge
Co
co
nce
ntr
atio
n
in m
illig
ram
s p
er c
um
Graph 11: Dipping: Carbon monoxide levels decline
Source: CSE’s analysis of CPCB data
Note: 8-hr standard for CO is 2 mg/m3 and the hourly standard is 4 mg/m3

14
TOWARDS A CLEAN-AIR ACTION PLAN: LESSONS FROM DELHI
Unacceptable health costs
Delhi is paying a very high price for its polluted air. Several global and national studies have already proven severe health risks from air pollution; a number of studies are also available in Delhi to provide local evidence. In 2012, the Central Pollution Control Board (CPCB) and the Chittaranjan National Cancer Institute, Kolkata, did a study on children in Delhi. The study, which covered 11,628 school-going children from 36 schools in Delhi, found that every third child in the city has reduced lung function. Delhi’s children have sputum that contains four times more iron-laden macrophages than those from cleaner environs, indicating an increased propensity to pulmonary haemorrhage. The levels of these biomarkers in children have been found to be higher in areas with high PM10 levels.
Many other studies in Delhi, including those from the All India Institute of Medical Sciences, the Vallabhbhai Patel Chest Institute and St Stephens Hospital, offer disturbing evidence. As per the Global Burden of Disease (GBD) report released 2013, air pollution is the fifth largest killer in India. The World Health Organization (WHO) has classified air pollution, including diesel emissions, as a class 1 carcinogen. A 2010 study of the Boston-based Health Effects Institute estimates that at least 3,000 premature deaths annually are due to air pollution-related diseases.
The World Allergy Organization Journal published a report in 2013 on the high respiratory disorder symptoms in students living in Chandni Chowk (66 per cent) in north Delhi, Mayapuri (59 per cent) in west Delhi and Sarojini Nagar (46 per cent) in south Delhi. Heavy traffic movement has been found to be the factor responsible for the relative difference between the localities. The World Allergy Organisation alerts that allergies will increase further as air pollution increases. According to the GBD estimates, maximum deaths occur due to heart failure and stroke followed by respiratory and lung diseases and cancer.
There is enough evidence in Delhi now that shows how emergency hospital admissions increase phenomenally during winter when pollution levels peak and several smog episodes occur.
Ben
zen
e in
mic
rog
ram
me
per
cu
m
0
2
4
6
8
10
12
14
16
2011 2012 2013 2014 2015
Annual average benzene microgramme per cum Annual standard 5 microgramme per cum
Graph 12: Benzene levels in Delhi (annual average)
Source: CSE’s analysis of CPCB data
15
TOWARDS A CLEAN-AIR ACTION PLAN: LESSONS FROM DELHI
Guiding principles for clean-up
Even though Delhi, like several other cities, is monitoring air quality there is no clear framework to meet the national ambient air quality standards. Sustained air quality gains can be made with sustained action. Delhi and other cities need a comprehensive source-wise action plan—mix of short, medium, long and emergency measures—to meet clean air targets in a time-bound manner. These need some key guiding principles:
l Meet clean air targets: So far, action in Delhi has been driven by the urgency for immediate relief. The time has now come to move towards a full-blown action plan and compliance process. 2015 had been a crossroads—this was the year when the Supreme Court of India intervened once again to address winter pollution. The Chief Justice’s bench, while giving directions, considered all the key polluters to chart a roadmap for action. The 2015 winter had also seen the beginning of framing of pollution emergency action in Delhi. In 2016, the winter pollution has once again galvanised the government and the Supreme Court to work towards a more compact plan and action. There is a learning curve in Delhi that other cities can take lessons from.
l Exposure vs ambient management: Another notable development in 2015 has been the lead taken by the Union Ministry of Health and Family Welfare to get more proactively involved with the air pollution issue. The ministry has set up a steering committee to recommend the way forward to address health impacts of air pollution. The recommendations of this committee have led to a paradigm shift in the manner in which air pollution control needs to be addressed for public health protection. The committee has asked for a shift from concentration management to exposure management to prioritise policies and actions. What matters is not just the absolute emissions but how much of the pollution is breathed in by individuals, which is captured in “intake fraction”; how close people are to the pollution source; what is everyone inhaling; and how much time they spend close to the pollution source.
Ambient concentration of pollution, which is monitored by the Union
Ministry of Environment, Forests and Climate Change, helps measure the change in pollution trends over time and space. But this does not always well represent human exposures that are heavily influenced by nearby sources (such as stoves, vehicles, and neighborhood trash burning) and less by general ambient concentrations. Thus, ambient concentration is not a good surrogate for total air pollution risk—it cannot indicate exposure and health outcomes. With new monitoring technologies, digital data management, remote sensing and modeling, it is possible to do exposure apportionment. Exposure mapping across micro-environments is needed.
This was evident when CSE carried out air quality monitoring to assess the level of exposure depending on the mode of travel, especially during winter. It was found that while ambient concentration was several times higher than the national ambient air quality standards, what people were exposed to while traveling was even higher than the ambient level (see Graph 13: How much pollution people are exposed to while travelling in Delhi). According to the US-based Health Effects Institute, people living within 500 meters from any roadside are most exposed to vehicular pollution. Over 55 per cent of Delhi’s population lives in that direct influence zone. Similarly,

16
TOWARDS A CLEAN-AIR ACTION PLAN: LESSONS FROM DELHI
exposure to household stoves or direct exposure to neighbourhood fires has widespread impacts.
Managing and lowering such high exposures has to be the priority focus of the pollution control efforts.
l Take a regional approach: Over time, science has made it clear that local
pollution cannot be solved without addressing the larger regional pollution. Satellite imagery shows how the entire north Indian belt stays smogged up during winter. Landlocked plains trap air and pollution from biomass chulhas, industries and power plants, traffic and open fires. Since October 2015, for the first time, mostly all directives from the Supreme Court have been give for the entire National Capital Region (that includes the neighbour states of Delhi). This has also helped bring the seasonal problem of farm fires within the pollution control umbrella.
l Address quantum vs toxicity: Yet another principle that has been established is the setting of priorities according to what is more toxic and dangerous. Studies are assessing differentiated health risks according to the source of particulates. A study by the Health Effects Institute, published recently in Environmental Health Perspectives, has found that particles from coal and diesel are more harmful than windblown dust, as they can lead to an increase in ischemic heart disease-related deaths. This is dangerous—the GBD for India attributes half of air pollution deaths in the country to heart disease.
15 February (after noon)
16 February (after noon)
14 February (after noon)
13 February (after noon)
Graph 13: How much pollution people are exposed to while travelling in Delhi
Source: Centre for Science and Environment, 2015

17
TOWARDS A CLEAN-AIR ACTION PLAN: LESSONS FROM DELHI
Where is the pollution coming from?
In 2015, a source inventory and source apportionment study was carried out by the Indian Institute of Technology (IIT), Kanpur under the aegis of the Delhi government. The study assessed 13 key pollution sources and their relative contribution to different pollutants. Road dust dominates the particulate inventory in the study, followed by vehicles, industry and power plant sources. In the case of nitrogen oxide inventory, industry leads with more than half the share followed by vehicles (see Graphs 14 and 15: Particulate apportionment in Delhi and Nitrogen oxide apportionment in Delhi).
This study, for the first time, put the spotlight on the problem of secondary particulates that are formed in the air from gases that come from combustion sources. This means the relative contribution of traffic, industry, power plants and open burning to particulate load becomes even bigger and needs stronger control.
Road dust 22165 (38%)
Vehicles 11623 (20%)
Domestic sources 6940 (12%)
Industries-point sources 6576 (11%)
Concrete batching 3594 (6%)
Hotels/restaurants 1758 (3%)
MSW burning 1771 (3%)
Industries-area source 1367 (2%)
Construction and demolition 1292 (2%)
Diesel gensets1248 (2%)
Cremation 312 (1%)
Medical incinerators 54 (0%)
Aircrafts 34 (0%)
Graph 14: Particulate apportionment in Delhi (kg/day)
Source: IIT Kanpur 2015
Industrial stack161838 (52%)
Vehicle 113443 (36%)
Hotels/Restaurants1105 (0%)
Domestic 7682 (3%)
Aircraft 5416 (2%)
Industries area 1893 (1%)
DG Set19604 (6%)
MSW burning 738 (0%) Cremation
96 (0%)
Medical incinerators 103 (0%)
Graph 15: Nitrogen oxide apportionment in Delhi (kg/day)
Source: IIT Kanpur Study, 2015
18
TOWARDS A CLEAN-AIR ACTION PLAN: LESSONS FROM DELHI
The study has also pointed to seasonal variations in the relative contributions to ambient pollution: winter experiences relatively higher contribution from combustion sources. During summer, the contribution of dust is higher.
The study has observed that vehicles are the most consistent and dominant source of pollution throughout the year, while most other sources are variable. In fact, the two most consistent sources for PM10 and PM2.5 in both the seasons are secondary particles and vehicles. The other sources, on an average, may contribute more (or less) but their contributions are variable from one day to another. Biomass and municipal solid waste burning are important sources, but they are variable. To get the average levels down, therefore, the focus must remain on consistent sources such as vehicles.
There is still no clear assessment of the contribution of pollution from sources outside Delhi. The seasonal incidents of farm fires in Punjab and Haryana have brought the matter of trans-boundary movement of pollution to the forefront, catalysing inter-state coordination. But this demands a regional action plan to address more dispersed pollution sources.
Spurred by the Court’s interventions and government action, Delhi is now moving in the direction of framing a more comprehensive plan for sustained gain. It is important to understand the status of action on each source and chart the way forward for each sector. This requires a stringent monitoring and accountability framework.

19
TOWARDS A CLEAN-AIR ACTION PLAN: LESSONS FROM DELHI
2. SOURCE-WISE ACTION STATUS AND A PLAN OF ACTION
ACTION AGENDA 1: Need clean vehicles and fuels
Make emissions standards uniform across the countryThe Union Ministry of Petroleum and Natural Gas has notified the introduction of Bharat Stage IV norms nation-wide from April 2017. This will stop the current practice of following two sets of emissions standards in the country. This is urgently needed to provide uniform health protection to all and to ensure that all segments of vehicles, especially highway vehicles like trucks and buses, graduate to improved emissions standards to minimise health impacts across transit roots.
It is necessary to ensure that from April 1, 2017 onwards only Bharat Stage IV-compliant vehicles are sold across the country. Transport departments across the states will have to take appropriate steps to ensure this.
Leapfrog emissions standards for new vehiclesThe most notable development of 2016 has been the notification by the Union Ministry of Road transport and Highways to leapfrog directly to Bharat Stage VI emissions standards in 2020 and skip Euro V altogether. These standards will lower emissions from the new vehicles by 60 to 89 per cent. Only at this level will petrol and diesel emissions begin to equalise and the norms become more stringent.
Bharat Stage VI also makes a paradigm shift to introduce real world emissions testing and compliance with conformity factor. This is expected to ensure that the vehicles do not emit more than they are designed to emit while in service.
The Bharat Stage VI norms crafted for two-wheelers are also more stringent. For the first time in India, particulate matter standards have been set for two-wheelers; hydrocarbon and nitrogen oxides will be regulated separately. These vehicles will also be equipped with on-board diagnostic systems that can help advance the maintenance regime.
The next challenge is to ensure that both automobile industry and the refineries remain on track to meet the timeline of the standards.
Control dieselisation of the car segmentWhen buses, taxis and autos are moving to compressed natural gas and trucks are paying an environment compensation charge to control diesel emissions, stringent measures are needed to control dieselisation of the car segment as well. According to the WHO, diesel particulates is a class I carcinogen for its strong links with lung cancer. Diesel-related pollution—tiny and toxic particles and nitrogen oxides—is increasing in Indian cities. Cheap diesel creates an incentive for more driving and for bigger cars leading to more fuel use, more toxic pollution per kilometre, more warming per litre of carbon-rich diesel burnt, and more warming due to its heat-absorbing black-carbon emissions. Diesel cars are the second largest users of diesel. The current standards allow diesel cars to emit more particulate matter and nitrogen oxides compared to petrol
20
TOWARDS A CLEAN-AIR ACTION PLAN: LESSONS FROM DELHI
cars. Total air toxics from a diesel car that are very harmful and carcinogenic are seven times higher than that from petrol cars.
l Equalise the fuel tax for diesel and petrol car users: The Environment Pollution (Prevention and Control) Control Authority (EPCA), in its report to the Supreme Court, has estimated that to recover the extra fuel tax that petrol car users pay over life-time use of the car, diesel car users should pay at least (on an average) 20 per cent of the ex-showroom price of the car as a one-time environment compensation charge. While the matter is pending in the Court, the Chief Justice’s Bench in the interim has imposed a 1 per cent cess on big diesel cars with 2,000 cc engines and above. This was done to lift the temporary ban on big diesel cars for misusing official policy of low tax diesel for farmers and freight. This cess is being collected by the Central Pollution Control Board and is expected to be used for pollution control measures. This policy must continue and ECC should be imposed and increased on all diesel cars.
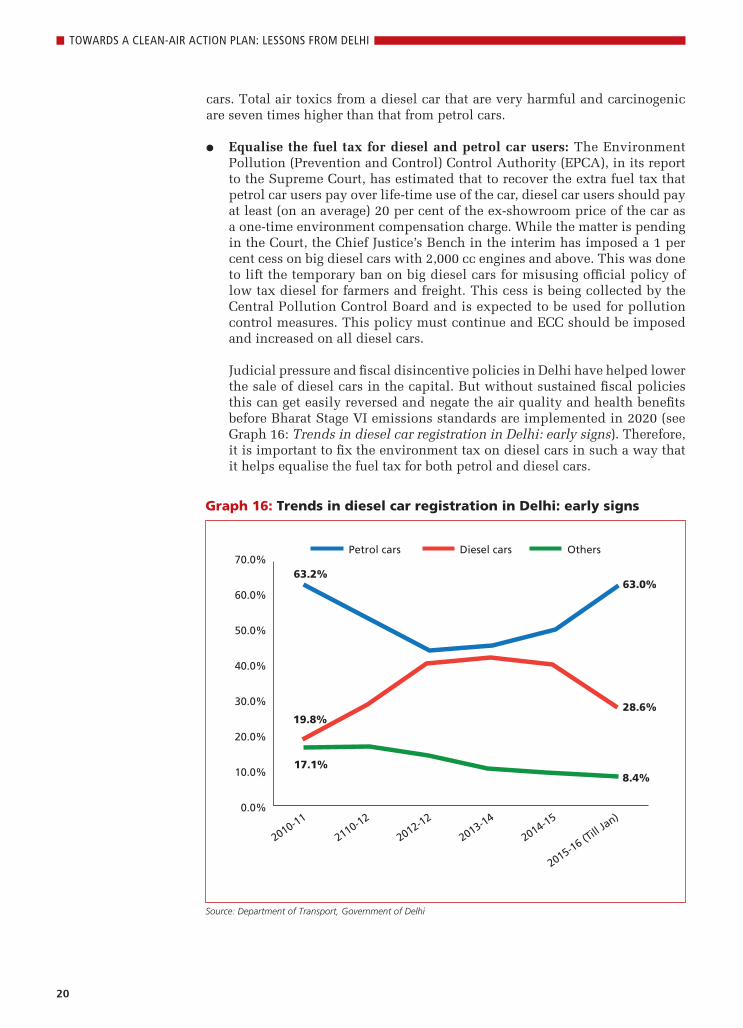
Judicial pressure and fiscal disincentive policies in Delhi have helped lower
the sale of diesel cars in the capital. But without sustained fiscal policies this can get easily reversed and negate the air quality and health benefits before Bharat Stage VI emissions standards are implemented in 2020 (see Graph 16: Trends in diesel car registration in Delhi: early signs). Therefore, it is important to fix the environment tax on diesel cars in such a way that it helps equalise the fuel tax for both petrol and diesel cars.
Petrol cars70.0%
60.0%
50.0%
40.0%
30.0%
20.0%
10.0%
0.0%
Diesel cars Others
63.0%63.2%
19.8%
17.1%
2010-11
2110-12
2012-12
2013-14
2014-15
2015-16 (Till
Jan)
8.4%
28.6%
Graph 16: Trends in diesel car registration in Delhi: early signs
Source: Department of Transport, Government of Delhi
21
TOWARDS A CLEAN-AIR ACTION PLAN: LESSONS FROM DELHI
Control truck emissions Estimates by CSE in 2015 suggest that the incoming light and heavy trucks spew close to 30 per cent of the total particulate load and 22 per cent of the total NOx load from the transport sector in Delhi. The estimates were part of a report prepared by the Environment Pollution (Prevention and Control) Authority on the Supreme Court’s order. The Court had, on October 9, 2015, imposed an environment compensation charge (ECC) on commercial goods vehicles entering Delhi from the 124 entry points. The Court asked that this revenue should be used for augmenting public transport and for improving the road infrastructure for pedestrians and cyclists.
Different amounts of ECC were levied on different types of trucks—Rs 700 and Rs 1,300 on light-duty trucks and trucks having two or more axles, respectively. Trucks carrying essential commodities like food and petroleum were exempted. Subsequently, more orders followed in December 2015 that also barred entry of pre-2006 trucks or of trucks that were more than 10 years old, into Delhi. The city’s entry points are expected to put in place systems to electronically connect the VAHAN vehicle database of the Ministry of Road Transport and Highways with toll collection; this, based on registration details, would be able to identify the pre-2006 vehicles and deny them entry.
Another follow-up survey by CSE in 2016 showed a decrease in truck traffic leading to reduction of as much as 30-35 per cent in PM and NOx levels in this vehicle category.
To address the concerns of malpractices related to manual collection the Supreme Court has directed that radio frequency identification (RFID) should be implemented for automatic collection of ECC. While passing through the entry gates, the ECC will be automatically transferred to government accounts. Delhi’s transport department and the Municipal Corporation of Delhi will share the funds created from ECC to implement RFID. The Supreme Court, on August 22, 2016, has asked the Delhi government to release Rs 120 crore from the ECC account to the South Delhi Municipal Corporation, which has been appointed as the executing agency for the installation of RFID.
About 13 key entry points have been identified where RFID installation will be done on a pilot basis. These entry points bring in as much as 80 per cent of the truck traffic. The Court has also asked the transport department to give Rs 93 lakh to RITES Ltd, a Government of India undertaking, to vet the RFID project for implementation.
RFID will also open up enormous possibility of tracking vehicle operations and performance. It can be broadened to include all vehicle segments and advance operational aspects of traffic and pollution control in future.
l Bypass non-destined trucks: Delhi has witnessed a prolonged battle against pollution from trucks and has evolved a more complex set of control mea-sures compared to other cities of India, with good results. Action on trucks started in 2005 when the Supreme Court, in response to a public interest petition on air pollution, directed creation of two peripheral expressways to divert transit traffic away from Delhi. The eastern and western peripheral expressways are within the jurisdiction of the neighbouring states of Uttar Pradesh and Haryana respectively. But lack of coordination, rigid invest-ments and lack of timely action has delayed these projects considerably.

22
TOWARDS A CLEAN-AIR ACTION PLAN: LESSONS FROM DELHI
l Expedite completion of the peripheral expressways: The Supreme Court has directed that trucks that do not have business inside the city need to be diverted to decongest and reduce pollution in the city. The Court had directed in 2005 the construction of the Western Peripheral Road, also known as Kundli-Manesar-Palwal Expressway, and the Eastern Peripheral Expressway. The Western Peripheral Road was to be executed by the Haryana government and the Eastern Peripheral Road by the National Highway Authority of India.
While there is some progress in the Western Peripheral Road that cuts across Haryana, not much has happened with regard to the Eastern Peripheral Expressway. The projects will have to be coordinated with the concerned state governments for their urgent completion.
l Control overloading of trucks: Overloaded trucks lead to high pollution. Stringent enforcement under the Motor Vehicles Act at inter-state borders is necessary to check overloading. Action may be taken to cancel permit/deload/send back vehicles on the spot. Spaces near the entry points to Delhi for weighing, off loading and turning vehicles around need to be identified. Weighing machines should be installed and impounding increased. Also, sealed trucks and containers for transport of goods should be introduced for effectively checking overloading. This may be included in the specifications of truck bodies. To address overloading, reference may be made to the Damage to Property Act (Central Act). The critical action point is to speed up implementation of RFID and weigh in motion bridges and diversion of trucks that are more than 10 years old.
Stop registration of diesel taxis under the All India Tourist Permit The Supreme Court has already given directives not to allow any diesel taxi to operate point-to-point in Delhi. All taxis should run on CNG. Appropriate steps should be taken to enforce this measure. There are serious concerns that while all local taxis have moved to CNG, the aggregators are still operating diesel taxis under the All India Tourist Permit (AITP).
Earlier, in compliance with the Delhi High Court’s observation regarding the running of diesel taxis in Delhi, the Delhi transport department had begun to impound the taxis of app-based provider Ola. However, they continued to operate within Delhi using the AITP loophole. But Section 88(9) of the Indian Motor Vehicles Act clearly states that all such cars can only be used for tourism purposes where CNG might not be available. Under no circumstances should they be used for point-to-point city service. Similar tactics are used by diesel goods carriers which operate in Delhi but register outside, or register a Euro III vehicle and avail the national permit. Diesel vehicles of Euro III emission norms are coming back in large numbers in the form of these taxis and trucks.
Over the past few years, taxi aggregator companies Ola and Uber have become a preferred source of public transport in India’s major urban areas. But these companies use diesel cars for point-to-point city taxi service. It has been found that there is a reluctance to install GPS in taxis also—which can immensely help to identify and locate a taxi or driver in case of safety-related concerns. The Delhi High Court has taken cognizance of these violations and in an interim order dated July 29, 2015, directed Ola cabs to operate only using CNG cars. The Delhi State Transport Authority (STA) has been mandated to implement this order. The STA has sent a notice to Uber as well to stop operations on this account. However, in complete defiance, both these companies have continued to operate their diesel fleet.

23
TOWARDS A CLEAN-AIR ACTION PLAN: LESSONS FROM DELHI
The Supreme Court’s directives dated May 10, 2016 has laid down conditions for operations of taxis in NCR. It has permitted city taxies having validly issued permits under Section 74 of the MV Act to operate within NCR not limited to NCT provided such permits are duly counter-signed by the competent authorities under Section 88(1) of the Act. Further, it has permitted registration of new city taxies in NCR only if the vehicles operate on dual fuel or petrol or CNG.
All new AITP permits are to be issued as AITP (N) category permits, and only on an undertaking from the person seeking an AITP permit to the effect that s/he shall not use the taxi for point-to-point service within the NCR. There has been strict compliance with the directives of the Court, which is showing up in the number of diesel taxis registered. Between May 10 and October 4, 2016, the registration of diesel AITP (N) taxies in the NCT of Delhi stood at 74. This was a sharp drop from the 11,065 diesel AITP registrations in 2015. There is a clear shift towards CNG/petrol taxies. Between May 10 and October 4, 2016 over 90 per cent of all taxies registered were on CNG, as compared to less than 45 per cent prior to the order.
The Court also directed that all existing AITP taxies operating in the NCR would be converted into AITP (O) category and will be allowed to operate until such time their existing permits expire. Such permits will not be renewed. It was also directed that the permission hereby granted would be subject to the AITP taxies complying with all government directives issued from time to time concerning security, safety and fare.
The EPCA has held several meetings on the issue since May 10, with the transport departments of Delhi, Haryana and Uttar Pradesh, the MoRTH and representatives of various stakeholders—registered taxi operators’ unions, tour operators and aggregators. In a meeting held on May 20, 2016, the MoRTH informed EPCA that it has set up a committee to examine all issues related to various permits under the MV Act, formulate a credible and acceptable plan of action, and draft the relevant taxi scheme.
The EPCA is monitoring these developments and will report back to the Court on necessary actions. It is also worrisome that while diesel autos are banned in Delhi, they plying with impunity in the NCR. This will have to be controlled and stopped.
Introduce a favourable taxation policy for clean fuels The CNG programme was introduced in Delhi to reduce particulate pollution, especially toxic diesel emissions. To expand and sustain the air quality gains of this programme, CNG would have to be made more affordable than diesel. To support this programme, the EPCA had recommended to the Supreme Court that a favourable taxation policy be adopted to keep CNG prices 30 per cent below the price of diesel. Moreover, the Supreme Court order of April 5, 2002 had also directed the Union of India to accord priority to the transportation sector while allocating natural gas.
In February 2014, the national government reduced CNG prices by Rs 15 per kg. This helped widen the differential once again to about 35 per cent. The price differential in December 2014 was 27 per cent. But prices are expected to be raised further. The current differential, after lowering of the CNG prices, will have to be maintained as a policy.

24
TOWARDS A CLEAN-AIR ACTION PLAN: LESSONS FROM DELHI
It was noted by the EPCA that the current utilisation of the available CNG compression capacity across the NCR was very low, at 32.6 per cent of the installed capacity. This requires policy measures to promote the use of cleaner fuels such as CNG for both personal and public transportation.
For CNG to succeed as an alternate fuel, rate rationalisation in neighboring states and increasing the supplying capacity of the stations is necessary. Positive incentives have to be provided to encourage the common man to switch to CNG, by creating monetary incentives supplemented with adequate infrastructure.
Introduce vehicle inspection programme for on-road vehiclesl Improve Pollution Under Control (PUC) certification programme and its
compliance: Delhi faces the challenge of reducing in-use emissions from a large fleet of on-road vehicles. Though PUC norms for Euro IV vehicles have been tightened, this should also be extended to Euro III and Euro II vehicles. The current PUC norms for these vehicles that dominate the fleet are very lax and cannot weed out high polluters.
PUC testing for petrol vehicles has improved and now includes both hydrocarbon and carbon monoxide along with lambda testing—that indicates air-to-fuel ratio—to ensure proper functioning of catalytic converters. But the smoke density test for diesel cars is quite archaic and not effective for new-generation diesel vehicles. CSE had reviewed the average emissions performance of this PUC programme by analysing the smoke density results of commercial vehicles in Delhi. This showed a ridiculously low—only 6 per cent—failure rate. This looks incongruous when trucks cause serious visible pollution. Moreover, the smoke density norms of 65 HSU is very lenient for pre-Bharat Stage IV vehicles. In Singapore and Pakistan this norm is 40 HSU; in Indonesia, Thailand, Hong Kong and Malaysia it is 50 HSU for all genres of vehicles.
Delhi will have to deploy more advanced in-use monitoring strategies to
enable more advanced testing for new-generation vehicles. It will need to integrate on-board diagnostic systems for in-use inspection and introduce remote sensing technology for screening on-road vehicles, along with other measures.
The programme also needs quality control, credible and authentic tests and regular auditing of the emissions testing centers. In order to improve compliance with the programme, a PUC certificate should be made conditional to obtaining annual insurance for vehicles.
Road-worthiness tests for private vehicles are also needed. Currently, roadworthiness and safety inspections are carried out only in commercial vehicles. Globally, the trend is towards introducing road-worthiness tests, along with improved in-use emissions tests for personal vehicle inspection. Delhi’s transport department will have to assess the additional infrastructure requirements for such an upgrade. These tests will also have to be prescribed under the Central Motor Vehicles Act and Rules.
There are serious concerns over quality and credibility of PUC tests. In fact, a detailed audit that was carried out by the Central Pollution Control Board in 2013 in 76 PUC centres exposed serious anomalies: code of practice was not followed, calibration certificate for testing instruments was not available in several centres, laboratories were in poor condition, leak test

25
TOWARDS A CLEAN-AIR ACTION PLAN: LESSONS FROM DELHI
failures were common, and analysers were not functioning properly. This clearly brings out the ineffectiveness of the programme.
l Overhaul on-road emissions testing for newer vehicles: India has already introduced On Board Diagnostic Systems in post 2013 vehicles. But this has not been leveraged to improve vehicle inspection programme for improved emissions control systems. If a problem or malfunction is detected, the OBD II system illuminates a warning light on the vehicle instrument panel to alert the driver. This warning light will typically display the phrase “Check Engine” or “Service Engine Soon”, and will often include an engine symbol. The OBD system stores important information about any detected malfunction so that a repair technician can accurately find and fix the problem. It identifies emission-related components covered under warranty This eliminates unnecessary repairs; gives information about area of malfunction or a specific component; reduces cost of warranty repairs and ensures customer satisfaction; and allows early detection of malfunctions.
Regulate the age of commercial vehicles This is yet another approach that has been adopted. The Supreme Court has intervened to cap the age of commercial vehicles at 15 years. The National Green Tribunal has further proposed to reduce this age cap for diesel vehicles to 10 years. It may be noted that age caps are often the easier option in situations where overall administrative capacity to implement more refined strategies based on emissions levels and emissions zoning is very weak. Besides, claiming that PUC norms should be the benchmark to allow older and polluting vehicles to ply is a fallacy. The fact remains that very old genre of vehicles that emit three to five times higher than the current emissions standards would need to be weeded out.
However, implementation of this will have to be detailed out. This will require a proper scrapping arrangement and infrastructure, and safeguards against hazardous material during scrapping. Control evaporative losses of fuel Air-borne benzene comes from fuel vapourisation and evaporation and exhaust emissions from vehicles. It is estimated that 1,000 cubic metre of petrol vapour is equivalent to losing about a litre of petrol. Benzene and aromatic compounds occur naturally in petroleum and become more concentrated when petrol is refined to produce high octane gasoline. Benzene is a potent carcinogen and is blamed for leukemia.
India has taken steps to meet the international standards of 1 per cent benzene in petrol. In Bharat Stage IV petrol, currently available in major cities, the total aromatic content has been reduced to 35 per cent and olefins—unsaturated chemical compounds containing at least one carbon-to-carbon double bond and widely used in the petrochemical industry—content to 18 per cent. But given the level of air-borne benzene in cities and rising level of vehicular traffic there is need for further control. For example, the global best practice shows that benzene content—as in the US—is now 0.62 per cent and the aromatics 25 per cent in polluted areas.
All refulling stations should be retrofitted with vapour recovery system that traps the petrol vapour and puts it back in the tank. This is needed while dispensing fuel to vehicles as well as at the storage tanks.

26
TOWARDS A CLEAN-AIR ACTION PLAN: LESSONS FROM DELHI
Moreover, petrol can also evaporate from motor vehicle tanks. Already evaporative standards have been set for cars. But such standards are yet to be enforced for two-and three-wheelers. This has already been done in other countries like Thailand. In India, estimates of evaporative emissions from two-wheelers are not available in the public domain. Global assessments have shown that motorcycles equipped with carburettors—a device that blends air and fuel for an internal combustion engine—emit about 1.2-1.3 kg hydrocarbons per year per vehicle.
Other countries like the US and those in Europe have taken further steps to equip vehicles with on-board recovery of petrol vapour and transfer back into the tank. This is urgently needed in India as well to control evaporative losses from vehicles.
Europe has implemented Stage I Petrol Vapour Recovery to prevent emissions of volatile organic compounds during the storage of petrol at terminals and distribution to service stations. Terminals should have floating roofs and reflective coatings to reduce evaporative losses from storage tanks. In addition, when petrol is loaded onto tankers and transported to service stations, vapour is recovered and returned to the tanker or the terminal. Similar measures are deployed for underground tanks.
Stage II Petrol Vapour Recovery involves measures over and above the Stage I system: the provision of recovering petrol vapour displaced from the fuel tank of a motor vehicle during refuelling at a service station, and transferring that petrol vapour to an underground storage tank at the service station or back to the petrol dispenser for resale.
In the US, Stage II Vapour Recovery was first developed in California and mandated in 1973. The 1990 amendments to the US Clean Air Act mandated Vapour Recovery Stage II in areas that had not consistently met ozone standards across the US, for service stations with throughputs greater than 0.5 million litre of petrol a year. US rules designate a vapour-recovery efficiency of 95 per cent and require California Air Resources Board (CARB)-type approval of VR2 equipment.
Some oil companies have voluntarily started to implement vapour recovery systems. A few months ago, the CPCB has sent out notices to all oil companies to install these systems. But this requires a mandate and time-bound implementation.
ACTION AGENDA 2: Improve and scale up public transport
The Delhi Master Plan has set the target of achieving 80:20 modal share for public transport by 2020. This will require massive expansion of the bus and Metro systems and non-motorised transport. Modernisation and capacity upgradation of the public transport system, system upgradation and infrastructure improvement with universal accessibility provisions in the entire public transport service are urgently needed.
Improve bus transport Delhi has already suffered serious loss of bus ridership from 60 per cent in 2000 to 40 per cent in 2008, but it is still several times higher than the 14 per cent share of car trips. Buses provide the bulk of public transport service, and can penetrate deeper to flexibly connect neighbourhoods. Buses are the only affordable and inclusive means of mass transport.
27
TOWARDS A CLEAN-AIR ACTION PLAN: LESSONS FROM DELHI
l Augment the bus fleet: In 1998, the Supreme Court directed the augmentation of the CNG bus fleet to 10,000. Subsequently, the Delhi High Court ordered that Delhi should have 11,000 buses. But, only 6,251 (5,216 DTC and 1,035 cluster buses) are currently plying in the city. According to a joint report of the Ministry of Urban Development and the Asian Development Bank, there should be at least 60 buses per lakh of population. In the 2016 state budget, the Delhi government has planned for 3,000 buses: this is now expected to be augmented to 5,000 buses, which would include smaller buses. But there has been an inordinate delay in procurement. This needs to be expedited.
l Land for bus depots: Lack of adequate depot land and parking is holding up bus purchase in the city. The EPCA commissioned a study to look into the depot land requirements for buses in the city and the possibilities of improving infrastructure to optimise on this land. It has also reviewed if the land allotted by DDA to the transport department can be taken possession of and found that in all cases the land is in dispute or there is a difficulty of access into the land. The EPCA’s assessment is that the city requires between 132 to 330 acres of additional land to meet its target of 11,000 to 16,000 buses. It is also clear that current depot land will need to be optimised through multi-storey use so that this land requirement can be reduced.
All existing bus depots are to be optimally utilised by redeveloping them with two levels (lower and upper ground) bus parking with new revised Master Plan Development control norms. This would reduce about 50-60 per cent of land requirement demand.
l Improve the bus service: The government has phased out the more informal blue-line bus service and introduced the more organised corporate cluster scheme. Service indicators need improvement to augment system capacity to carry more passengers. Set a target to increase fleet utilisation to at least 90 per cent and average bus occupancy rate per day to 1,000/bus by increasing frequency.
l Bus route planning: While augmenting bus numbers, it is important to put systems in place for bus service augmentation for reliable and frequent trips and wide geographical coverage. Bus-routing and service-improvement plans are needed to increase coverage and frequency of quality bus services. The current bus route planning is primarily oriented towards captive bus users’ demand focusing largely on low and middle income settlement areas. Bus routes have either been discontinued or completely withdrawn in several areas due to low demand, non-revenue generation routes, difficult road condition/traffic congestion, manoeuvrability constraints etc.
The United Traffic and Transport Infrastructure (Planning and Engineering) Centre (UTTIPEC) has proposed bus planning to make it more attractive and comfortable. On all bus routes, bus stops should be accessible within 250-300 meter distance from each home of all colonies of the city. The bus routes should connect at least three major city locations, the central business district, railway stations, inter-state bus terminus, office complexes, adjacent Metro stations and major bus stops en route. Bus origin nodes should be identified on colony roads/open spaces in all residential colonies.

28
TOWARDS A CLEAN-AIR ACTION PLAN: LESSONS FROM DELHI
As the Delhi government has decided to buy smaller buses as well, for these bus movements and turning, roads of 18-meter width and above are preferable as bus routes. In such cases, it may not be possible to maintain the distance criteria for colonies with road width constraints.
To attract car/two-wheeler users, introduce a segregated bus service as
‘Express Service’, with ‘limited stops--only seating and special fare and monthly / daily passes or express bus card’.
l Passenger Information system: For efficient service, every bus should display names of major bus stops en route apart from origin and destination stops on the front, back and left side of the bus body for the benefit of its passengers. Bus stops should display a route chart with bus route numbers for the benefit of bus passengers. An IT-based upgraded information and ticketing system needs to be introduced for unified bus operations integrated with the Metro system. The GPS system to introduce IT-enabled public information system for all buses, including DTC buses, should be used. Currently, GPS is used in cluster buses to monitor bus trips but that is oriented more towards revenue generation than for providing efficient service to people. DTC has not yet developed its own GPS-based service monitoring system.
l Bus depot and bus system management: A complete ITS-enabled depot management to enhance efficient handling of bus operations with scheduling, fleet utilisation and monitoring processes is needed for the complete satisfaction of bus users. Capacity upgradation of the organisation in terms of humanpower quality and system improvement would be a prerequisite before adopting technology.
Need multi-modal integrationAll public transport systems will have to be integrated physically with detailed design and IT-enabled integrated ticketing and public information systems. All key Metro and bus stations will have to be designed with well-defined norms that will enable seamless and easy transfer of commuters from one system to the other, as well as link them with efficient last-mile connectivity—walk, cycle and autos. All para-transit should be organised and deployed efficiently to improve last-mile connectivity.
The UTTIPEC has drafted norms for multi-modal integration that requires bus stops, vendor zones, convenience shopping, cycle-rental stations, high-occupancy feeder stops/stands, public toilets, and pedestrian-only plazas within 100 m of Metro stations. Private car/taxi ‘drop-off’ locations have only been planned so far; validated car-parking facilities for Metro users (park and ride) are still to be provided. Integrated passenger-terminals will also be required. Multi-modal integration plans should be finalised and implemented in a time-bound manner.
Improve public transport connectivity in NCRThere is an explosion of traffic to and from NCR towns, with virtually no public transport to take off the pressure. In 2007, the EPCA had apprised the Supreme Court of the growing traffic between Delhi and its surrounding areas. The report had sought directions to reverse the slide of public mass transport in the NCR. The Supreme Court had taken cognizance of the insufficient public transport in the region.

29
TOWARDS A CLEAN-AIR ACTION PLAN: LESSONS FROM DELHI
A CSE survey has shown that the total number of cars that enter Delhi daily is equal to the total cars that are registered in the city annually. This has added to pollution and congestion in the city. But mass transportation—bus and rail—has not kept pace. The region desperately needs a inter-city public transport plan.
The EPCA and the government have already proposed seamless public transport for NCR and a reciprocal transportation agreement to eliminate barriers like tolls and taxes on public transport and para-transit across borders. The state governments in the NCR tax public transport vehicles coming in and out of their respective borders, while private vehicles can move freely. The Delhi Municipal Corporation taxes all public transport and commercial vehicles entering Delhi. Other governments charge when vehicles exit Delhi. This makes bus transport expensive for daily commuters in NCR. Ironically, while car owners protest against the imposition of toll tax on cars, there is no protest when entry taxes increase bus fares for public transport users.
The state governments of Delhi, Haryana, Uttar Pradesh and Rajasthan need to implement a time-bound action plan for augmenting seamless public transport services and taking necessary action to remove entry taxes on public transport buses across borders under a reciprocal agreement.
ACTION AGENDA 3: Right to safe walking and cycling on all roads
If walking and cycling is compromised, it will undermine public transport usage and last-mile connectivity. The right to clean and safe air/walk/cycle will have to be made non-negotiable. Walking and cycling are also means of zero-emission mobility that Delhi needs for cutting down on the killer pollution. Even today, over 39 per cent of daily commuters walk and cycle in Delhi (RITES survey of 2008: walk share is 35 per cent and cycle share is 4.4 per cent). Despite the odds, the absolute number of walk- and cycle-trips in Delhi is among the highest in the country. The right to safe walking and cycling has to be protected and scaled up. Road accident data from the Union Ministry of Road Transport Highways for 2012 shows that every hour, one person is either killed or injured in a road accident in Delhi.
Implement time-bound non-motorised network plan and policyThe Government of NCT, the Transport Department of Delhi, the PWD, the UTTIPEC-DDA and the traffic police should prepare a time-bound plan to implement an appropriate network of dedicated pedestrian and cycling lanes with a high degree of safety for pedestrians and cyclists. This should be based on equity of use and what road-users (including walkers, cyclists and users of public transport) need. All road projects should be subject to this plan.
Delhi has already adopted people-friendly street-design guidelines and revised the Indian Road Congress (IRC) guidelines to address the needs of pedestrians and cycling. The guidelines should be made mandatory for the approval of road network projects in Delhi. Parking areas and other facilities as specified in UTTIPEC-Street Design Guidelines should be provided.
Protect walkways and cycle tracks from encroachment; ensure safe crossingThe provision of Motor Vehicles Act 1988 that bars vehicles from being parked on pavements should be implemented. Traffic regulation and road construction in Delhi have to take care of cyclists and pedestrians including bus commuters. Provide adequate safe road crossings with traffic signals at appropriate places

30
TOWARDS A CLEAN-AIR ACTION PLAN: LESSONS FROM DELHI
like T-points, road junctions and major bus stands for cyclists, pedestrians and bus commuters. The 10 PWD roads that are to be redesigned should comply with UTTIPEC and IRC guidelines. The city needs a more comprehensive street network planning and implementation.
ACTION AGENDA 4: Restrain the growth in car numbers
All efforts to improve emission levels of vehicles and scale up public transport can be negated if strategies are not in place to control car numbers on the roads. An uncontrolled increase in the number of cars is not sustainable. Delhi has to work with a variety of measures to restrain the number of cars on roads. Several cities around the world—including London, Stockholm, Copenhagen, Amsterdam, Berlin, Singapore and Hong Kong—have implemented several restraint measures. These include parking restraints, congestion pricing and road pricing that make commuters pay for using roads and entering targeted areas on a daily basis, paying higher taxes on cars. Beijing, Guangzhou and Shanghai have capped car sales. In Beijing, after car sales exploded to reach an annual figure of 8,00,000 in 2010, the Chinese government clamped down to cap the number of cars sold at a level that is just 30 per cent of the actual sales in 2010.
As a part of first-generation car-restraint measures, Delhi will be well advised to adopt stringent parking policies as an immediate step that can be easily implemented within the existing administrative capacity, and an annual taxation on cars. Congestion charging and road pricing can be implemented only later as a second-generation step that will require more advanced IT-enabled technological intervention and institutional preparedness.
Parking policy as a restraint measureIn 2006, the Supreme Court had taken note of the EPCA report which recommended that a parking policy be implemented as a decongestion and car-restraint measure; the report sought necessary directions to concerned agencies to frame parking policies along these principles. This was also supported by the National Urban Transport Policy of 2006.
l Eliminate free parking and introduce effective parking charges: Eliminate free parking and introduce effectively high and variable parking charges in all public and commercial areas; introduce residential parking permits with fees; and remove one-time lifetime parking charges on cars. Car users pay nothing or a minuscule amount for using valuable public space to park their personal vehicles. International studies show that Delhi and other Indian cities have the lowest parking charges in the world. Developed cities like London, Oslo and Paris have daily charges ranging from US $40 (Rs 2,400) to US $89 (Rs 5,340) to manage demand—about 40-80 times higher than in Indian cities. Even some developing cities like Cape Town and Beijing have rates ranging from US $8 (Rs 480) to US $4 (Rs 240)—four to eight times higher than in Delhi.
Recently, parking charges were nominally increased for commercial areas
to Rs 20 per hour. But immediate intervention is needed to disallow free parking across Delhi and implement effective and variable parking rates in all commercial areas and public spaces, along with residential parking permits.

31
TOWARDS A CLEAN-AIR ACTION PLAN: LESSONS FROM DELHI
l Need strong enforcement of legal parking and deterrent for illegal parking: Parking chaos and congestion on roads can be controlled if, along with effective pricing, stringent measures are taken to enforce legal parking and impose high penalty for illegal parking. Demarcation of legal parking areas will be needed. But enforcement has been difficult because of a weak policy mandate. The government of NCT, Municipal Corporation of Delhi and the New Delhi Municipal Council need to demarcate legal parking areas and impose higher penalty for illegal parking to cut congestion from on-street parking. This will free up public spaces and walkways from parking. An urgent amendment is needed in Parliament to increase illegal parking fine to be a better deterrent. The policy also needs better equipment and methods for effective enforcement.
l Implement parking area-management plans: The Delhi Master Plan has been revised to provide for parking district management plans. Multi-level parking should not be implemented as stand-alone and isolated projects but as part of comprehensive area-management plans and that too, only if the plans require it. Delhi should identify parking area-management zones to comprehensively plan on-street and/or off-street parking, along with other street services, to organise parking better and reduce conflict between uses. Parking area-management needs strict enforcement strategies to help remove encroachments, utilise available road capacity better and help free up space. On-street and off-street parking (including multi-level) should be managed and enforced by a single agency.
l Parking for residential areas: New residential buildings and group housing should provide parking within the plot area or buildings as shared parking areas. Residential parking permits and payment for on-street parking in residential areas should be introduced. Also, on-street parking should not be permitted in narrow streets with two lanes. The building norms for parking in residential areas need to be strictly enforced and controlled through pricing and strict enforcement of on-street parking. Provision of temporary parking for schools may need to be enhanced based on the size, capacity, locality and type of schools that are largely surrounded by residential areas. Delhi should consider implementing a proof-of-parking scheme to reduce parking pressure; this scheme has already been implemented in cities in Rajasthan, Sikkim and Manipur. Implementing proof of parking can help reduce demand for cars and multiple ownership.
l Prohibit parking in green areas and neighbourhood parks: No green areas shall be converted and used for parking. Parking must not be provided under or above neighbourhood parks. The use of green areas or neighbourhood parks for parking can adversely impact environment and public health, especially of children. Increasingly, obesity and metabolic diseases among children are being reported from Indian cities. Following an intervention from the EPCA, the Master Plan of Delhi has been amended to prohibit parking in green areas and parks.
l Ban parking on footpaths under the provisions of the Motor Vehicles Act 1988
l Need management plan for parking spillover during special or social events

32
TOWARDS A CLEAN-AIR ACTION PLAN: LESSONS FROM DELHI
ACTION AGENDA 5: Tax cars annually and higher than buses
Rationalise road taxIt is ironic that buses that meet 40 per cent of travel requirement in the city, are taxed higher than cars. A car that costs around Rs 4-6 lakh pays a one-time lifetime road tax in the range of Rs 16,000-24,000, which works out to a mere Rs 1,000-1,600 per annum. But a bus carrying 50-60 passengers pays a tax in the range of Rs 15,915–18,715 every year. This adds to the cost of operating buses. For bus services to be successful, both capital and operational costs need to be kept affordable. Public policy needs to reduce the tax burden on public transport and offset the revenue loss by introducing higher taxes on personal vehicles.
The Delhi Metro, which is also a public transport system, enjoys a wide range of tax exemptions that include property tax, sales tax, capital gains tax, customs, excise, income tax etc. But buses pay property tax, octroi, excise, entry tax, VAT, central excise, customs duty, excise duty on consumption, excise and VAT on spare parts, motor vehicles tax, advertisement tax etc. The high tax burden increases both capital and operational costs and creates pressure for higher bus fares. Unaffordable bus fares erode ridership and push up two-wheeler use—the cost of running a two-wheeler is currently equal to a bus fare for 1 km of travel! The principle of giving a tax waiver to the Metro should be extended to buses as well.
Cars should pay road tax annuallyIf cars are made to pay an annual road tax that increases with the age of vehicles, it can have significant impact on car ownership and usage. Road tax is already collected by the city government; a system already exists for annual collection from commercial vehicles and this can be developed and IT-enabled to collect annual road tax from cars. Other concerned state governments of Haryana, Uttar Pradesh and Rajasthan in the NCR, may also take similar measures. Such a measure will also help clean up the vehicle database that is cumulative and does not reflect the real numbers on the road as these are not adjusted based on scrappage, retirement and transfers of vehicles from the city.
ACTION AGENDA 6: Institute an urban transport fund
Priority action for improvement of public transport, walking and cycling will be expensive. To ensure that worries over costs and rigid investments do not delay action, it is important that the government set up a dedicated urban transport fund. Thirty cities in India have taken the steps required. The recent move to impose ECC on trucks and big diesel cars and creating dedicated fund from this revenue has helped generate a substantial amount that can be used for pollution control. This will have to be carried forward for effective impacts.
Under the current model of investment, the private sector (cluster bus services) is expected to operate 40 per cent of the buses and the state-owned DTC about 60 per cent. Even for the private sector, the gap between earnings and costs has to be filled by the Delhi government. It has been estimated that a capital reimbursement of Rs 55 (for Cluster 1) and Rs 40 (for Clusters 2, 3, 4 and 5) per kilometre of operation will have to be given to the concessionaires. In Cluster 1 the operating revenue per kilometre is expected to be only Rs 20-25/km. The gap financing for all clusters can snowball to Rs 600-1,000 crore annually for the Delhi government. In addition, there is demand for infrastructure that the government will need to provide.

33
TOWARDS A CLEAN-AIR ACTION PLAN: LESSONS FROM DELHI
Buses have very few revenue sources. More than 85 per cent of the revenue comes from fare-box collection. But as the bus fares must stay within the affordable limit for the urban majority, it is not desirable for the cost of investments to be recouped mainly from the fare-box collection or increased fares. Also, an increase in bus fares can trigger an immediate exodus to personal vehicles, such as two-wheelers, that will become cheaper to run. Therefore a financial model that will help reduce the dependence of buses on fare-box collection, diversify revenue sources and help create a dedicated public transport fund is required. This must be supported by internal rationalisation as well as a fiscal model to reduce costs and to improve overall economic efficiency of bus operations.
Other cities are tapping a variety of revenue streams to ensure a steady annual flow of funds to take care of the costs of transport reforms. The Ministry of Urban Development has already indicated possible revenue streams that cities can tap to create an urban fund. Possible sources include advertisement revenues, parking revenues, additional cess on automotive fuels, additional registration fees on cars (especially diesel cars), and two-wheelers, fees for driving licenses and vehicle registration and congestion tax.
Based on this mandate, Delhi can also build its public transport fund. It can rationalise budgetary allocation to augment available funding for public transport; tap different revenue streams related to transport and transport-management methods, including parking, vehicle taxation, fuel taxes, advertisement revenue etc; and take up land-based commercial development in depots and terminals.
ACTION AGENDA 7: Stop pollution from power plants
According to the IIT-Kanpur report, coal-based power plants operating in Delhi (at that time, Badarpur and Rajghat) are major contributors to the pollution load in the city. These contribute 11 per cent of the PM 2.5 load and 52 per cent of the NOx load. During summers, windblown fly ash contributes 26 per cent of PM 2.5. There are also over 16 thermal power plants in the airshed of Delhi and NCR. These contribute to the particulate and NOx loading in the airshed, and they must also be phased out and replaced with cleaner natural gas-based plants.
Most of these plants use antiquated technology, low-grade coals with high sulphur content and follow outdated emission norms. There was no standard in place for SO2, NOx and mercury emissions for these power plants till December 2015. Though the new stringent norms now limit the concentration of particulate matters to 30 μg/m3 and that of SO2 and NOx to 100 μg/m3, these will be followed by power plants commissioned only after January 2017.
Close down the Badarpur Thermal Power PlantThis plant is the single largest source of NOx and fly ash in Delhi, says the IIT-Kanpur study. The fly ash pond of the 43-year-old plant, one of the oldest in the country, spans 600 hectares—larger than the area over which the plant has been built. It is surrounded by densely-populated residential areas. The plant should be closed down with immediate effect.
The EPCA review of the issue shows that Delhi already has state-of-the-art gas-based power plants. But these are under-utilised. These include the Pragati Power Corporation (PPCL) of the Delhi government. The Gas Authority of India
34
TOWARDS A CLEAN-AIR ACTION PLAN: LESSONS FROM DELHI
(GAIL) has also set up the Dadri-Bawana-Nangal pipeline in 2010 for gas supply to power plants in the region. Instead of utilising power from the cleaner plant, Delhi is buying power from old, inefficient and highly polluting coal-based plants of Badarpur and Dadri. A review of power generation capacity of coal and natural gas power plants shows that it is possible to switch to natural gas from coal-based power plants.
Badarpur supplies a relatively small share of Delhi’s power needs (7.9 per cent during April-October 2015), but it is important for some parts of south Delhi. The plant, working at only 44 per cent PLF (plant load factor) and even assuming that it is meeting all the stipulated pollution norms, accounts for anywhere between 80-90 per cent of the PM, SOx and NOx from the power sector in Delhi.
The only problem with a full closure of the Badarpur plant is the lack of connectivity to provide power to key areas of south Delhi--but this problem occurs during the peak months when demand increases to over 3,500 MW and the existing lines cannot take the additional load. In May 2013, the Central Electricity Authority (CEA) had planned to commission the 400-kV Tughlakabad power station to connect Okhla with the peripheral network and to end the dependency on the Badarpur plant. But this has not been done yet. It is important to urgently commission additional lines required to provide power in peak summer months. Besides closing down the coal-based Badarpur and Dadri power plants, pooling of all gas (domestic and RLNG) resources can help operate the Bawana power plant at full capacity.
ACTION AGENDA 8: Control pollution from industry
During the late 90s, the worst air polluting industries of Delhi were shifted to adjoining areas of Ghaziabad, Noida, Faridabad and Baghpat. But pollution from these still blows into the city. Anand Vihar at the border, for instance, records very high pollution levels. Many heavy engineering, oil processing and waste management industrial units in the Ghaziabad and Sahibabad area are contributing to this trend.
The major industries in the Delhi-NCR region include aluminium alloy, wire, induction arc furnace, textiles and dyeing units, brick-kilns, stone crushers, waste-to-energy facilities, electroplating, automobile components and plastic manufacturing units.
Delhi is reported to have 1,30,000 industrial units, of which only 25,000-30,000 are located in the planned industrial areas or comprise permissible household industries. Many of these polluting industries are either located in unauthorised or residential or village areas, and are very difficult to track down.
The Supreme Court has already passed an order in 2000 to check and close down non-conforming industrial units from residential areas. More than 800 units were identified and closure notices sent to them. However, the efforts have not had much success. As per the Master Plan of Delhi (MPD) 2021, all polluting industries need to be shifted out of the city by 2021. In 2011, the MCD was supposed to close down around 22,000 industrial units operating from residential and non-conforming areas in the city. It is still uncertain if they were closed down.

35
TOWARDS A CLEAN-AIR ACTION PLAN: LESSONS FROM DELHI
Besides pollution from city-based units, there is also the cumulative pollution load due to industrial units in adjoining states—Haryana, Punjab and Uttar Pradesh. The CPCB has identified five critically polluted areas in Delhi NCR: Najafgarh drain basin, Panipat, Faridabad, Ghaziabad and Noida. Though furnace oil (FO) is banned, these industries continue to use it and other bottom-of-the-barrel fuels that have extremely high sulphur levels. FO is used in a variety of industries as an energy source. It is also used in generator sets—particularly large industrial energy generators. The consumption of FO is around 5,000 kilolitre (KL) per day; if diesel is added, the value goes up to more than 6,000 KL per day.
These industries also use coal as an energy source. More than 74,000 tonne per day of coal is used in different industries around Delhi, bulk of it by thermal power plants. Pet coke, which has a high concentration of sulphur, is also used: consumption hovers around 1,000 tonne per day.
A joint effort by different concerned official authorities will be required to tackle the problem of industrial pollution in Delhi-NCR.
ACTION AGENDA 9: Put a stop to garbage combustion
Large scale fires plague Delhi’s three landfill sites—Bhalswa, Okhla and Ghazipur—round the year. These are ‘processing sites’ for the entire waste of Delhi, which amounts to about 10,000 tonne a day. The unsegregated waste, which includes liquids, organics and food waste decomposes, releasing the highly combustible global warming gas, methane. During winters, the city also has to face the more dispersed and numerous fires lit by the homeless, pavement dwellers and security guards for warmth and light. These fires cumulatively add to the toxics in the air. A 2015 study by IIT-Kanpur says that burning of municipal solid waste contributes to 3 per cent of all particulates in the city. The figure in the winter months is 5 per cent.
Even though there is a legal ban on open burning, it is not easy to enforce it. In 2016, the EPCA had called upon the civic authorities to ensure that burning of horticulture waste in parks does not occur, and instead compost pits are used to dispose of dead leaves and branches. But there has been poor enforcement. Individual residents and resident welfare associations (RWS) have a key role to play. Municipalities can earmark areas where composting pits can be created, which the RWAs can manage to prevent local open fires. Also, RWAs must ensure that arrangements are made for security guards to protect themselves against the cold. Private citizens can help by segregating garbage and selling garbage that can be recycled and stop fires in neighbourhoods.
The government is supposed to formulate emergency plans to deal with fires at landfill sites, but these plans rarely exist. Bulldozing and dumping of concrete waste is being lately employed to douse the fires. The EPCA has also discussed the serious problem of fires in the landfill dumps in Ghazipur and Bhalswa with municipal officials, and the possibility of setting up methane recovery units.
Public outreach with accountability appRecently, the EPCA, along with the municipal corporations and the concerned departments of the state governments of Delhi, Haryana and Uttar Pradesh has prepared a mobile accountability app, ‘Hawa Badlo’, to improve transparency

36
TOWARDS A CLEAN-AIR ACTION PLAN: LESSONS FROM DELHI
and to follow up on public complaints. The app has been made publicly available on the iOS and Android app markets. The app is currently focussed on pollution through garbage burning, construction activities, and maintenance of roads, but has the scope to include other pollution-linked violations. It can identify the agency and actions that have been taken to check pollution. The EPCA has also developed a guidance note for inspection of such sites, which will help improve enforcement.
ACTION AGENDA 10: Prevent pollution from construction activities
Delhi-NCR is experiencing prolific construction of buildings; to this is added the construction of roads and the Metro. This whips up enormous amounts of concrete dust. The Delhi Pollution Control Committee (DPCC) is responsible for ensuring that all construction projects meet the dust pollution norms as laid down by the CPCB. However, enforcement has been lax and must be made more stringent.
In 2016, the first ever notification on construction and demolition waste management was brought forth by the Union Ministry of Environment, Forests and Climate Change. So far, C&D waste had found a brief mention in Schedule III in the Municipal Solid Waste (Management and Handling) (MSWM) Rules, 2000. This was extremely inadequate. The new notification is, thus, a significant step forward. C&D waste is inert but bulky waste. It is either dumped in city landfills or in open spaces, water bodies and flood plains, choking up great chunks of urban land and waterbodies.
The new notification creates the legal framework for recycle and reuse of C&D waste in the construction industry. These can substitute material mined from nature and prevent damage to waterbodies, public spaces and green areas. The new rules are comprehensive and clearly define roles of all stakeholders: waste generator or developer, local authorities, center and state governments, pollution control boards, standard making agencies and recyclers.
Local bodies will have to utilise 10-20 per cent of material from C&D waste in municipal and government contracts for construction. All cities will have to set up facilities in a phased manner. All large generators of waste will have to pay charges for transportation, collection, processing and disposal. They will be responsible for segregating construction and demolition waste before disposal. All large waste generators would need environment management plans.
The big tasks would be implementation and appropriate resource (financial and humanpower) allocation to local authorities. This will also require scaling up of the capacity building and recycling infrastructure.
BIS code of practice and standards for products made from C&D wasteThe new standard--IS383:2016 Coarse and Fine Aggregate For Concrete— Specification (Third Revision)--has been published and notified by the Bureau of Indian Standards (BIS) in January 2016. Construction agencies can now use this rule to partially substitute natural sand and aggregate with recycled waste like C&D waste, steel slag, iron slag and copper slag. The amendment automatically allows the use of recycled C&D waste in all products made out of concrete, and reduces the need of subsequent amendments in other standards. To check unrestricted use of these options, the amendment spells out reasonable limitations in terms of the type or grade or application of such products.

37
TOWARDS A CLEAN-AIR ACTION PLAN: LESSONS FROM DELHI
The Indian Road Congress also needs to prepare standards and practices pertaining to products in road construction made from C&D waste.
The Delhi government has issued an advisory on the use of products made out of recycled waste by the Public Works Department (PWD). The advisory has asked for use of such products as a first choice in all construction work. All Delhi government agencies will be required to incorporate a clause in their tenders that mandates use of a minimum of 2 per cent recycled products from construction waste in all future contracts for building works and 10 per cent recycled products for road works. All Delhi government agencies will be required to incorporate a clause in their tenders to this effect. The government also expects urban local bodies to mandate 5 per cent use of such products for non-structural applications, while examining and approving building plans.
Incentives to waste generators for salvaging, processing and recycling in-situThis is an important intervention that would dovetail with tax and pricing measures in cities. Several countries across the world are utilising fiscal measures to promote in-situ recycling, safe disposal and reuse of C&D waste.
Recycling facilities will have to be created at safe distances from habitations with adequate buffer zones.
The Central Public Works Department (CPWD) has already started using bricks and pavers made from recycled C&D waste from its IEISL plant at Delhi. This is being used in the construction of the Supreme Court campus extension. This is a drastic change of heart for an agency which in 2014 had informed the Parliament that “C&D waste having no salvage value is disposed of at approved dumping sites as per municipal rules”. The National Buildings Construction Corporation Ltd (NBCC) has also recycled all the C&D waste it generated in the mega redevelopment of East Kidwai Nagar in Delhi.
Delhi has demonstrated the potential of collection and recycling of C&D waste at Burari. The products have been tested and found to be suitable for specific purposes. The state budget for 2016-17 has sanctioned three new C&D recycling plants.
ACTION AGENDA 11: Control crop fires
Burning of crop residues in Haryana, Punjab and the northern plains of Uttar Pradesh is seasonal and episodic and occurs during the harvest periods of October-November and April-May. Estimates show that they are responsible for 12-25 per cent of the particulate pollution in Delhi. The burning of crop residues has emerged as a source of air pollution only over the last 20 years and is considered to be a fallout of the Green Revolution of the 1970s and the 1980s when farmers shifted from traditional crops to water-intensive paddy. Mechanised harvesting of paddy leaves behind 6-15 cm tall stubble, which has no economic value for the farmer; it is not a suitable fodder either. It must be cleared to ready the field for the next crop—usually wheat. The farmer can either clear the field by employing manual labour, by using mechanised implements, or by simply setting fire to it.
In Punjab and Haryana, farmers burn 90-95 per cent of the 32 million tonne of paddy stubble generated (as per data submitted to the EPCA by the Punjab and Haryana administration). As per estimates, Punjab produces approximately 19-20 million tonne of paddy straw and about 20 million tonne

38
TOWARDS A CLEAN-AIR ACTION PLAN: LESSONS FROM DELHI
of wheat straw. About 85-90 per cent of the rice straw is burnt in the field, and increasingly, wheat straw is also being burnt during the rabi harvesting season.
In Haryana, the scale of paddy straw burning is smaller than in Punjab. Paddy straw production is estimated at 2 million tonne. Moreover, farmers have a very short window between summer and winter crops as they have delayed the sowing of the summer crop to reduce their dependence on groundwater and to use rainwater more effectively. There is also a shortage of labour to contend with.
To dissuade people from burning crop residues, the Punjab and Haryana governments have notified crop burning as an offence and launched campaigns to make farmers aware about the consequences. Governments are giving subsidy for machines that mix straw with soil while tilling soil and drilling seeds. The Delhi High Court, the National Green Tribunal and the Supreme Court are also looking into the matter, following public interest petitions. But the situation is unlikely to change unless viable alternatives for utilising the paddy straw are provided to farmers. One such alternative is promoting power plants that use straw as a raw material for electricity generation.
l Banning burning of crop residues: Crop residue burning was notified as an offence under the Air Act of 1981, the Code of Criminal Procedure, 1973 and various appropriate acts. In addition, a penalty is imposed on any offending farmer. Village and block-level administrative officials are being used for enforcement.
l Detection and prevention: A combination of remote sensing technology—use of satellite imagery—and a team comprising local officials (sub-divisional magistrates, tehsildars, block development officers, patwaris and village-level workers) is being used to detect and stop occurrences of crop residue burning in real-time.
l Establishment of a marketplace for crop residue burning: Efforts are being made to increase the avenues for alternate uses of paddy straw and other crop residues. For instance, paddy straw has a considerable calorific value, making it suitable for use as a fuel in biomass-based power plants. Similarly, it can be utilised for the preparation of bio-fuels, organic fertilisers and in paper and cardboard making industries. The strategy, broadly, is to assign a real economic and commercial value to the agricultural residue and making burning it an economic loss to the farmer.
l Outreach and public awareness campaigns: There are ongoing efforts to highlight the health effects of crop residue burning. It produces extremely high levels of toxic particulates, which affect the health of the people in the direct vicinity of the burning. In addition, efforts are also being made through kisan camps, trainings and workshops, apart from campaigns through various print media, televised shows and radio jingles, in informing farmers about the alternative usage of crop residues.
l Subsidy on agri-implements: The state governments, in collaboration with the Centre, have rolled out schemes for providing subsidy on mechanical implements that help tillage of soil, so that crop residues can be retained in the soil, adding to its fertility. However, the high cost of these implements means that in spite of subsidies, only a small number of farmers have access to them at the moment.

39
TOWARDS A CLEAN-AIR ACTION PLAN: LESSONS FROM DELHI
l Crop diversification: There are various ongoing, long-term efforts at diversification of cropping techniques. This is being attempted through cultivation of alternate crops (apart from rice/paddy and wheat) that produce less crop residue and have greater gap periods between cropping cycles.
The EPCA has held several meetings on the issue with the key stakeholders and administrators from Punjab, Haryana and Uttar Pradesh, the latest of which was held on June 24, 2016. The Authority has focussed on detection and prevention of crop residue burning (CRB) using remote sensing technology and spreading public awareness at the village level through the community. Along with the directives passed by NGT and the MoEFCC, EPCA has issued directions towards various measures to be taken by the state administration to prevent CRB, including highlighting alternatives usage for paddy straw and incentives/subsidy for machinery, which allows for paddy straw to be tilled back into the ground and not burnt.
The Supreme Court may consider the EPCA’s recommendation to allow usage of diesel cess (ECC collected from diesel vehicles above 2,000 cc) for providing subsidy to farmers for the upcoming kharif harvesting season based on discussions with state governments on what needs to be done to incentivise changes.
ACTION AGENDA 12: Control pollution from biomass-based cookstoves
The IIT-Kanpur study shows that domestic sources are responsible for 11 per cent of PM2.5 in Delhi—they are the third largest polluter in the city after road dust and vehicles. Even though the Delhi government has made Delhi kerosene-free and expanded the LPG coverage, a lot more will have to be done. The IIT-K study estimates that at least 10 per cent of Delhi is still using biomass-based cookstoves. About 90 per cent households have access to LPG. Kerosene use has fallen to 5 per cent of households. But migrants are not accounted for. The use of these stoves in the NCR is much more widespread. In fact, the earlier Global Burden of Disease had estimated that cookstoves are responsible for at least 25 per cent of the outdoor air pollution in India.
The government of India has initiated several schemes to expand the distribution of LPG to make clean fuel available to the poor and make LPG affordable and accessible for them. These schemes are designed to restructure subsidies for clean fuel to target the poor better. The government’s ‘Give It Up’ campaign states that households that earn more than Rs 10 lakh per annum should surrender their LPG subsidy. This will cover 1.5 crore households below poverty line in 2016-17 and another five crore in the next two years to achieve universal coverage of cooking gas. About 75 lakh households have given up LPG subsidies so far nationally.
The clean fuel fund that is being created from the ECC on trucks and diesel cars, should be used to eliminate biomass-based cookstoves in the NCR. Hotels, restaurants and open eateries are big culprits as well: use of coal must be stopped in them, and LPG or electricity use promoted.
ACTION AGENDA 13: Curtail road dust
The Supreme Court has directed the government of Delhi to take urgent steps to check road dust, including procurement of vacuum machines as suggested by the government itself. However, these steps have not been taken with the urgency required. Meanwhile, the Delhi government has started the process of

40
TOWARDS A CLEAN-AIR ACTION PLAN: LESSONS FROM DELHI
acquiring vacuum cleaning machines. As an emergency measure, it has started sprinkling water on roads and footpaths.
But this problem will require more structural solutions that include complete street development with proper paving, vegetative barriers, and control of traffic on unpaved roads. This should be carried out on a sustained basis across street networks.
ACTION AGENDA 14: Ban the use of diesel generator sets
Diesel generator sets are sources of high exposure. About 6-8 per cent of all diesel is consumed for power generation in the country. This includes grid-connected diesel-based power plants of more than 10 MW, captive plants and diesel generator sets.
Emissions standards have been fixed for these sets. Revised emissions standards are equivalent to Euro Stage IIIA for all size classes in Europe until 2010. Europe has further tightened the standards since then for all size classes. But the average energy efficiency levels of these sets fall short of the global benchmark, with the percentage difference being about 7-8 per cent. The Bureau of Energy Efficiency has proposed to set energy efficiency standards and labelling for generator sets.
The real solution will come only from reliable access to electricity; by addressing the gap between power generation and supply; and by interface with the rooftop solar programme. Enforcement mechanism and energy audits of buildings are also needed to improve operations and maintenance of buildings, and to reduce the dependence on these sets.
However, use of these sets should be especially controlled for social events during the winter months as an emergency measure. In fact, the use of generator sets has been banned by the Delhi government as an emergency measure until January 31, 2017.
ACTION AGENDA 15: Curb the brick kiln menace
The brick industry is one of the five largest industrial consumers of coal, and there are serious environmental concerns associated with the production of fired clay bricks. The Supreme Court, in an order in 1996, had directed that all kilns operating in Delhi should close. As a result, the brick kilns moves to areas bordering Delhi such as Ghaziabad, Noida, Bhagpat and Meerut. There are currently around 2,080 brick kilns in Delhi-NCR—with about 700 in the three districts of Ghaziabad, Gautam Budh Nagar and Hapur. Kiln capacity has increased by four-eight times. On an average, now, a brick kiln produces 25,000-40,000 bricks a day. With the increase in number of kilns and their capacity, what has also increased is emissions of particulate matter, SOx and black carbon (see Table 1: Brick kiln statistics—NCR).
When a brick kiln starts, emissions spike. All kilns do not start simultaneously. This could be one of the reasons why east Delhi observes a spike in pollution on certain days of winter (see Table 2: Pollution load from brick kilns in Delhi-NCR).

41
TOWARDS A CLEAN-AIR ACTION PLAN: LESSONS FROM DELHI
Table 1: Brick kiln statistics—NCRNo of kilns
Jhajjar 390
Ghaziabad 350
Gautam Budha Nagar (Greater Noida and Noida) 230
Faridabad 270
Sonepat 250
Baghpat 590
Total 2080
Source: Based on telephonic conversation with Haryana and Uttar Pradesh State Pollution Control Board
Table 2: Pollution load from brick kilns in Delhi-NCR No. of
KilnsPM10
(tonnes)PM2.5
(tonnes)CO
(tonnes)CO2
(tonnes)SOX
(tonnes)BC
(tonnes)
Noida 105 725 535.5 10080 66150 236.25 20.475
Gr Noida 125 863 637.5 12000 78750 281.25 24.375
Ghaziabad 350 2415 1785 33600 220500 787.5 68.25
Meerut 528 3643 2692.8 50688 332640 1188 102.96
Bhagpat 590 4071 3009 56640 371700 1327.5 115.05
Jhajjhar 390 2691 1989 37440 245700 877.5 76.05
Faridabad 270 1863 1377 25920 170100 607.5 52.65
Sonepat 250 1725 1275 24000 157500 562.5 48.75
Total 2608 17996 13300.8 250368 1643040 5868 508.56
Source: Analysis done by Centre for Science and Environment on the basis of emission factor
A majority of the brick kilns in Delhi-NCR are of FCBTK type (Fixed Chimney Bull Trench Kiln), having chimneys/stacks emitting pollutants continuously during the manufacturing season from January to June every year. Many of them do not have gravity settling chambers which purify the effluent gas from the stacks. Even If the kiln owners have installed the chambers, they are either not working or are damaged.
There are options available for FCBTK to lower emissions. As options like VSBK, HHKs and tunnel kilns need initial investment, the most appropriate option therefore is the zigzag kiln. Zigzag kilns are better than FCBTKs when it comes to the amount of coal being consumed; they significantly reduce emissions of different types of pollutants arising due use of coal. A shift from FCBTK to zigzag has a number of other advantages as well: for instance, specific energy consumption is reduced by almost 20 per cent due to proper hot air circulation, the SPM and black carbon emissions are reduced drastically to about 75 per cent, and the number of good quality bricks goes up by around 25 per cent.
New emission standardsThe Union Ministry of Environment, Forests and Climate Change has proposed changes in the emissions standards. The new norms will be more stringent than the current ones, according to a draft notification released by the ministry in October. But a closer look at the draft indicates that the changes are unlikely to have much impact.
42
TOWARDS A CLEAN-AIR ACTION PLAN: LESSONS FROM DELHI
What would have worked is a law that encourages the industry to move from FCBTK—the most common type constituting 34 per cent of all kilns in the country—to kilns based on cleaner technologies, such as zigzag kilns or vertical shaft brick kilns (VSBK). These kilns help reduce coal consumption by as much as 20 per cent, and hence emissions are lower.
The Uttar Pradesh Pollution Control Board (UPPCB) has directed brick kiln owners of Ghaziabad, Gautam Buddh Nagar and Hapur to upgrade their tech-nology from natural draft brick kilns to induced draft brick kilns within 90 days. The UPPCB notice was issued in 2016 under Section 31(A) of the Air (Prevention and Control of Pollution) Act, 1981.
Restricted operations in winter, and other measuresMany brick entrepreneurs point out that running a brick kiln in winter season is not profitable, and this has an impact on the emission levels. Coal consumption--normally 12 tonne for a lakh of bricks—jumps to 14-15 tonne. The entrepreneurs have to shell out an extra Rs 10 lakh per month on coal, which results in an increase in emissions. There is always a possibility of rains in winter which can further deteriorate the quality of the bricks produced.
A roadmap needs to be developed with a proper vision which can convert the polluting kilns into a cleaner industry with the help of technology. The states of Uttar Pradesh and Haryana should implement the government’s fly ash notification, which calls for use of bricks made either entirely from fly ash or from fly ash mixed with clay.
ACTION AGENDA 16: Initiate pollution emergency measures
Across the world, governments take action based on the quality of air in their cities on a particular day. This allows for health advisories to the most vulnerable—those who are suffering from respiratory and cardiovascular ailments and asthma—so that they can reduce their exposure. Governments also take emergency action to reduce emissions on high-pollution days. This needs to be done in Delhi.
India’s National Air Quality Index (NAQI) developed by the CPCB was launched by the Union Ministry of Environment, Forests and Climate Change in October 2014. With reference to national air quality standards, NAQI has classified air pollution concentration as good, that is 50 per cent below the standards, and satisfactory, that meets the standards. The higher categories of moderately polluted, poor, very poor and severe are defined according to the degree of exceedance from the standards.
The NAQI also lists the health risks associated with different levels of concentration. For instance, a ‘severe’ classification means it may cause respiratory effects even on healthy people and serious health impacts on people with lung and heart diseases. The health impacts may be experienced even during light physical activity. In other words, this quality of air is severely bad for human health.
While NAQI has broad health advisories, it does not detail out what urgent measures need to be taken for people to avoid exposure and what needs to be done to improve levels, something that is done across the world. When pollution levels are severe, aside from other measures, people are advised not to do heavy outdoor exercises and to remain indoors as much as possible.

43
TOWARDS A CLEAN-AIR ACTION PLAN: LESSONS FROM DELHI
Delhi had first experimented with emergency action during the winter of 2015-16 by introducing a partial measure—the odd and even scheme—to keep at least 50 per cent of the cars off the road for a fortnight to bring down the peak levels. This had helped to moderate the peaking of pollution in Delhi. Public reaction to the scheme was mixed—it received public support but also provoked a backlash. The second scheme that was implemented during the summer received less support. The scheme was also weakened considerably with many exemptions and by keeping two-wheelers out of it.
As mentioned earlier, during the smog episode of November 2016, Delhi government once again came up with slew of emergency measures. In the November 8, 2016 hearing the Supreme Court directed the CPCB to come back with a compact plan for graded response according to the level of pollution as defined by the AQI. This is expected to create a systematic health emergency programme.
Scientists of the Department of Public Health Sciences, University of Miami, US have studied aerosol optical depth or how pollution in the air block sunlight by absorbing or by scattering light and prevent direct sunlight from reaching the ground. A value of 0.01 corresponds to an extremely clean atmosphere, and a value of 0.4 would correspond to a very hazy condition. An average aerosol optical depth for the US is 0.1 to 0.15. They have found that this improved in Delhi after the odd-even scheme was implemented. But in areas bordering the
Impact of the odd and even scheme
The impact of the odd-even scheme becomes more apparent when one looks at the crucial
factor of wind speed in dispersing pollutants from the city air. Despite the lower wind speed
through the programme period, the odd and even scheme was able to successfully arrest the
upward trend of air pollution.
24-h
ou
rly
PM2.
5 le
vel i
n m
icro
gra
mm
e p
er c
um
Ave
rag
e d
aily
win
d s
pee
d in
met
re p
er s
eco
nd
Lesser impact of low wind condition
Higher impact of high wind condition
498 (PM2.5) on 22.12.15
155 (PM2.5) on 15.1.16
ODD-EVEN
500
400
300
200
100
0
600
1.8
1.6
1.4
1.2
1
0.8
0.6
0.4
0.2
0
2
429(PM2.5) on 7.1.16
PM2.
5 le
vels
0.52(wind) on 7.1.16
16-D
ec
17-D
ec18
-Dec
- - -
19-D
ec20
-Dec
21-D
ec22
-Dec
23-D
ec24
-Dec
25-D
ec26
-Dec
27-D
ec28
-Dec
29-D
ec30
-Dec
31-D
ec01
-Jan
02-J
an03
-Jan
04-J
an05
-Jan
06-J
an07
-Jan
08-J
an09
-Jan
10-J
an11
-Jan
12-J
an13
-Jan
14-J
an15
-Jan
16-J
an17
-Jan
18-J
an
1.58 (wind) on 15.1.16
1.71 (wind) on 28.12.15
PM2.5
(24 hourly average)Safe tandard Wind speed (daily average)
Win
d sp
eed
0.56 (wind) on 22.12.15
273 (PM2.5) on 28.12.15
Graph 17: Odd and even days in Delhi show that even on days without wind pollution levels declined as opposed to pre-scheme days
Source: CSE’s analysis of CPCB data

44
TOWARDS A CLEAN-AIR ACTION PLAN: LESSONS FROM DELHI
capital and the surrounding NCR, there was no effect; instead, a 35 per cent worsening was witnessed.
The takeaway from this exercise points towards behavioral changes in transport utilisation. An increased public transport ridership was observed during the road rationing period. The road rationing had allowed for positive rate of efficiency in buses, autos and taxis. Metro ridership has also increased. Bus passengers increased by 8 per cent. In fact this would have been higher if two-wheelers were also brought within the ambit of the odd and even scheme. This was also possible because of more efficient utilisation of the bus fleet. The DTC fleet utilisation improved from 84 per cent in normal days to 95 per cent during the odd-even policy.
Figure2: Comparison in pre-and-during odd-even road rationing programme in Delhi NCR on AOR (Aerosol optical depth) levels
Source: Department of Public Health Sciences, University of Miami, US
35 lacs / day
8% increase in average ridership in DTC buses (excluding Sundays)
4% increase in average ridership in DIMTS buses (excluding Sundays)
Pre Odd-Even policy
Pre Odd-Even policy
DTC
DIM
TS
During Odd-Even policy
During Odd-Even policy
Daily average ridershipMillions
0 0.5 1 1.5 2 2.5 3 3.5 4
38 lacs / day
11 lacs / day
11.4 lacs / day
Graph 18: Increase in bus ridership during odd-even programme in Delhi
Source: Delhi Transport Corporation and Delhi Integrated Multimodal Transportation System

45
TOWARDS A CLEAN-AIR ACTION PLAN: LESSONS FROM DELHI
Both particulate and nitrogen oxide load from cars reduced substantially during the odd and even programme--by as much as 40 per cent. Higher share of pollution benefits have come from reduction in diesel cars as is also evident from the sale of diesel in the city. This indicates reduced exposure to toxic pollution from vehicles on roads and close to the road side. It is estimated by the US-based Health Effects Institute that the maximum impact of vehicular pollution is up to 500 meters from the road side: 55 per cent of Delhi’s population lives within that zone. This has serious public health implications. Studies by researchers of University of California, Berkeley have shown that in Delhi the pollution level on the road and close to road side are at least 1.5 times higher and peaks 15 times higher than the ambient concentration.
The gains of odd and even scheme were immediately lost after full traffic was back on the first Monday after the scheme came to a close. This was further aggravated by lower wind speed. On Monday, January 18, the PM2.5 levels shot up by 57 per cent within the day and once again rose to ‘severe’ category. With an average city wide concentration of 277 microgram per cubic metre, Delhi’s air quality was back in ‘severe’ category.
Particulate load Nitrogen oxide load
Diesel cars
Petrol cars
PM load tonnes per day pre
Odd and Even Scheme
PM load tonnes per day post
Odd and Even Scheme
Ton
nes
per
day
0.500.450.400.350.300.250.200.150.100.050.00
NOx load tonnes
per day pre Odd and Even
Scheme
NOx load tonnes
per day postOdd and Even
SchemeTo
nn
es p
er d
ay
8.007.006.005.004.003.002.001.000.00
Diesel cars
Petrol cars
Graph 19: Particulate and nitrogen oxide load reduction from cars during odd-even scheme
Source: CSE
Severe
Safe standard
217
155
130
176
277 281266
14-Jan- 15-Jan
24 hourly PM2.5 level
16-Jan 17-Jan 18-Jan 19-Jan 20-Jan 21-Jan
PM2.
5 le
vel i
n m
icro
gra
mm
e p
er c
um
300
250
200
150
100
50
0
Safe standard Severe
Graph 20: Rapid increase in PM2.5 levels post odd-even scheme
Source: CSE’s analysis of CPCB data

46
TOWARDS A CLEAN-AIR ACTION PLAN: LESSONS FROM DELHI
The second phase of odd and even in the month of April 2016 was not as effective due to partial implementation. Some of the gains were also lost towards the end of the fortnight when crop fire started in Punjab and Haryana. Several countries have implemented odd and even formula as an emergency action to reduce peak pollution levels. Many of those programmes are more stringent in terms of duration, penalty and minimal exemptions. There are evidences of impact on air quality in those global cities. With this programme several cities have reported a wide range of benefits including reduction in air quality, reduced congestion, improvement in public transport ridership etc.
Other countries take action based on the level of pollution
Several countries have framed pollution emergency measures that are implemented when
AQI indicates ‘severe’ pollution levels for consecutive days. Institutional mechanisms have
been put in place in which departments have been identified that would be responsible for
implementing these measures.
Emergency measures
Beijing: Pollution emergency measures on red-alert days
• Kindergartens, primary and middle schools close down.
• About 80 per cent of government-owned cars are taken off roads.
• Private cars are allowed on alternate days according to their number plates.
• Freight vehicles and those transporting material for construction sites are barred from
plying
• Polluting factories have to cut emissions or shut down when the orange warning signal
is issued
• Construction sites have to halt excavation and demolition operations
• Ban on barbeques and fireworks on heavily polluted days
Beijing has reported up to 36 per cent reduction in pollution with emergency action.
US cities: Rule 701 of air-pollution emergency contingency actions (for PM and
ozone):
• Industrial units reduce combined emissions by at least 20 per cent of normal weekday
operations
• Vehicles asked to reduce fleet-vehicle miles
• Ride-sharing and telecommuting promoted
• Liquid or solid fossil fuels cannot be burned in electric-power generating systems unless
a force majeure natural-gas curtailment is in effect
• All non-emergency driving recommended to be discontinued
Paris: red-alert day
• Vehicle entry into the city restricted
• Diesel cars inside the city not allowed on smoggy days
• Paris has reported up to 18 per cent reduction in its pollution levels.


Centre for Science and Environment41, Tughlakabad Institutional Area, New Delhi 110 062Phones: 91-11-40616000Fax: 91-11-29955879 E-mail: [email protected] Website: www.cseindia.org