
Classification of Partial Discharge Signals using Probabilistic Neural Network
7
2007 International Conference on Solid Dielectrics, Winchester, UK, July 8-13, 2007 Classification of Partial Discharge Signals using Probabilistic Neural Network Demetres Evagorou , Andreas Kyprianou 2, Paul L. Lewin 3, Andreas Stavrou 4, Venizelos Efthymiou 4 and George E. Georghiou 1 Department of Electrical and Computer Engineering, University of Cyprus 75 Kallipoleos Avenue, Nicosia, 1678, Cyprus 2Department of Mechanical and Manufacturing Engineering, University of Cyprus, 75 Kallipoleos Avenue, Nicosia, 1678, Cyprus 3 The Tony Davies High Voltage Laboratory, School of Electronics and Computer Science, University of Southampton, Southampton, SO17 1BJ, United Kingdom 4Electricity Authority of Cyprus, Nicosia, Cyprus * E-mail: demetres76gucy.ac.cy Abstract: Partial Discharge (PD) classification in power cables and high voltage equipment is essential in evaluating the severity of the damage in the insulation. In this paper, the Probabilistic Neural Network (PNN) method is used to classify the PDs. After the algorithm has been trained it uses the input vector, which contains the features that would be used for classification, to calculate the probability density function (pdf) of each class and together with the assignment of a cost for a misclassification the decision that minimizes the expected risk is taken. The maximum likelihood training is employed here. The success of this particular method for classification is asserted. This method has the advantage over Multilayer Neural Network that it gives rapid training speed, guaranteed convergence to a Bayes classifier if enough training examples are provided (i.e. it approaches Bayes optimality), incremental training which is fast (i.e. additionally provided training examples can be incorporated without difficulties) and robustness to noisy examples. The results obtained here (99.3°O, 84.3% and 85.5% for the corona, the floating in oil and the internal discharges respectively) are very encouraging for the use of PNN in PD classification. INTRODUCTION Achieving reliable and uninterrupted operation in today's transmission and distribution equipment is crucial. In a competitive environment, high voltage systems (HV) have to operate with less downtime and lower maintenance cost. A mechanism for the prediction of system ageing is partial discharge (PD) monitoring. This degradation stress mechanism is a precursor of insulation failure and is defined as an electric discharge that only partially bridges the insulation [1]. Although it does not indicate equipment failure in itself it is a revelation of a weak point in the system. Condition monitoring of HV equipment relies heavily on the detection of PDs. Past methods for PD testing involved the de-energisation of the equipment which is a costly operation both in terms of downtime and effort. Online condition monitoring provides the alternative solution which is gaining increasing popularity. Insulation failure can result from a number of different PD types 1-4244-0750-8/07/$20.00 ©2007 IEEE. and sources. Therefore being able to identify the type and source of the PD is of interest to the HV engineering community. An excellent overview of the different methods used can be found in [2]. Identification of different PD sources is by no means an easy task and can be considered as a two step process. The first step in any recognition problem is to consider the problem of what discriminatory features to select and how to extract these features from the patterns. Broadly speaking, there are three different categories of PD pulse data patterns; phase-resolved data, time resolved data and data having neither phase nor time information. In particular the phase resolved data quantify each of the PD pulses by their discharge magnitude (q), the corresponding phase angle or discharge epoch ((p) at which they occur and their number densities or discharge rates (n). Statistical methods are mainly used for phase-resolved data patterns [3]. Statistical analysis is used to calculate several statistical moments of a univariate distribution. Using a wideband PD detector and a fast enough data acquisition unit the pulse characteristics in the time domain can be acquired. Parameters such as the pulse rise time, pulse decay time, pulse width and the area enclosed under the q-t curve between the rise and the fall time have been used as feature extraction parameters [4-6]. Recently, several signal processing techniques have been applied for the extraction of feature parameters of PD. These include the Fourier, Wavelet, Haar and Walsh transforms the mostly used ones being the Fourier and the Wavelet transforms. A type of feature vector using the Fourier transform consisting of two components has been constructed in [7]. The feature extractor function is a mapping tool that provides a compact meaningful representation of the measured pulses. The second stage is that of a good classifier. There is quite a good number of classifiers available in the literature for pattern recognition [8]. The various approaches are based on decision, distance and likelihood functions artificial neural networks [9], trainable classifiers, fuzzy and neuro-fuzzy. A much 609
-
Upload
independent -
Category
Documents
-
view
6 -
download
0
Transcript of Classification of Partial Discharge Signals using Probabilistic Neural Network

2007 International Conference on Solid Dielectrics, Winchester, UK, July 8-13, 2007
Classification of Partial Discharge Signals using Probabilistic Neural Network
Demetres Evagorou , Andreas Kyprianou 2, Paul L. Lewin 3,Andreas Stavrou 4, Venizelos Efthymiou 4 and
George E. Georghiou 1Department of Electrical and Computer Engineering, University of Cyprus
75 Kallipoleos Avenue, Nicosia, 1678, Cyprus2Department of Mechanical and Manufacturing Engineering, University of Cyprus,
75 Kallipoleos Avenue, Nicosia, 1678, Cyprus3 The Tony Davies High Voltage Laboratory, School of Electronics and Computer Science,
University of Southampton, Southampton, SO17 1BJ, United Kingdom4Electricity Authority of Cyprus, Nicosia, Cyprus
* E-mail: demetres76gucy.ac.cy
Abstract: Partial Discharge (PD) classification inpower cables and high voltage equipment is essential inevaluating the severity of the damage in the insulation.In this paper, the Probabilistic Neural Network (PNN)method is used to classify the PDs. After the algorithmhas been trained it uses the input vector, which containsthe features that would be used for classification, tocalculate the probability density function (pdf) of eachclass and together with the assignment of a cost for amisclassification the decision that minimizes theexpected risk is taken. The maximum likelihood trainingis employed here. The success of this particular methodfor classification is asserted. This method has theadvantage over Multilayer Neural Network that it givesrapid training speed, guaranteed convergence to a Bayesclassifier if enough training examples are provided (i.e.it approaches Bayes optimality), incremental trainingwhich is fast (i.e. additionally provided trainingexamples can be incorporated without difficulties) androbustness to noisy examples. The results obtained here(99.3°O, 84.3% and 85.5% for the corona, the floating inoil and the internal discharges respectively) are veryencouraging for the use ofPNN in PD classification.
INTRODUCTIONAchieving reliable and uninterrupted operation intoday's transmission and distribution equipment iscrucial. In a competitive environment, high voltagesystems (HV) have to operate with less downtime andlower maintenance cost. A mechanism for the predictionof system ageing is partial discharge (PD) monitoring.This degradation stress mechanism is a precursor ofinsulation failure and is defined as an electric dischargethat only partially bridges the insulation [1]. Although itdoes not indicate equipment failure in itself it is arevelation of a weak point in the system. Conditionmonitoring of HV equipment relies heavily on thedetection of PDs. Past methods for PD testing involvedthe de-energisation of the equipment which is a costlyoperation both in terms of downtime and effort. Onlinecondition monitoring provides the alternative solutionwhich is gaining increasing popularity. Insulationfailure can result from a number of different PD types
1-4244-0750-8/07/$20.00 ©2007 IEEE.
and sources. Therefore being able to identify the typeand source of the PD is of interest to the HVengineering community. An excellent overview of thedifferent methods used can be found in [2].
Identification of different PD sources is by no meansan easy task and can be considered as a two stepprocess. The first step in any recognition problem is toconsider the problem of what discriminatory features toselect and how to extract these features from thepatterns. Broadly speaking, there are three differentcategories of PD pulse data patterns; phase-resolveddata, time resolved data and data having neither phasenor time information. In particular the phase resolveddata quantify each of the PD pulses by their dischargemagnitude (q), the corresponding phase angle ordischarge epoch ((p) at which they occur and theirnumber densities or discharge rates (n). Statisticalmethods are mainly used for phase-resolved datapatterns [3]. Statistical analysis is used to calculateseveral statistical moments of a univariate distribution.Using a wideband PD detector and a fast enough dataacquisition unit the pulse characteristics in the timedomain can be acquired. Parameters such as the pulserise time, pulse decay time, pulse width and the areaenclosed under the q-t curve between the rise and thefall time have been used as feature extractionparameters [4-6]. Recently, several signal processingtechniques have been applied for the extraction offeature parameters of PD. These include the Fourier,Wavelet, Haar and Walsh transforms the mostly usedones being the Fourier and the Wavelet transforms. Atype of feature vector using the Fourier transformconsisting of two components has been constructed in[7]. The feature extractor function is a mapping tool thatprovides a compact meaningful representation of themeasured pulses.
The second stage is that of a good classifier. There isquite a good number of classifiers available in theliterature for pattern recognition [8]. The variousapproaches are based on decision, distance andlikelihood functions artificial neural networks [9],trainable classifiers, fuzzy and neuro-fuzzy. A much
609
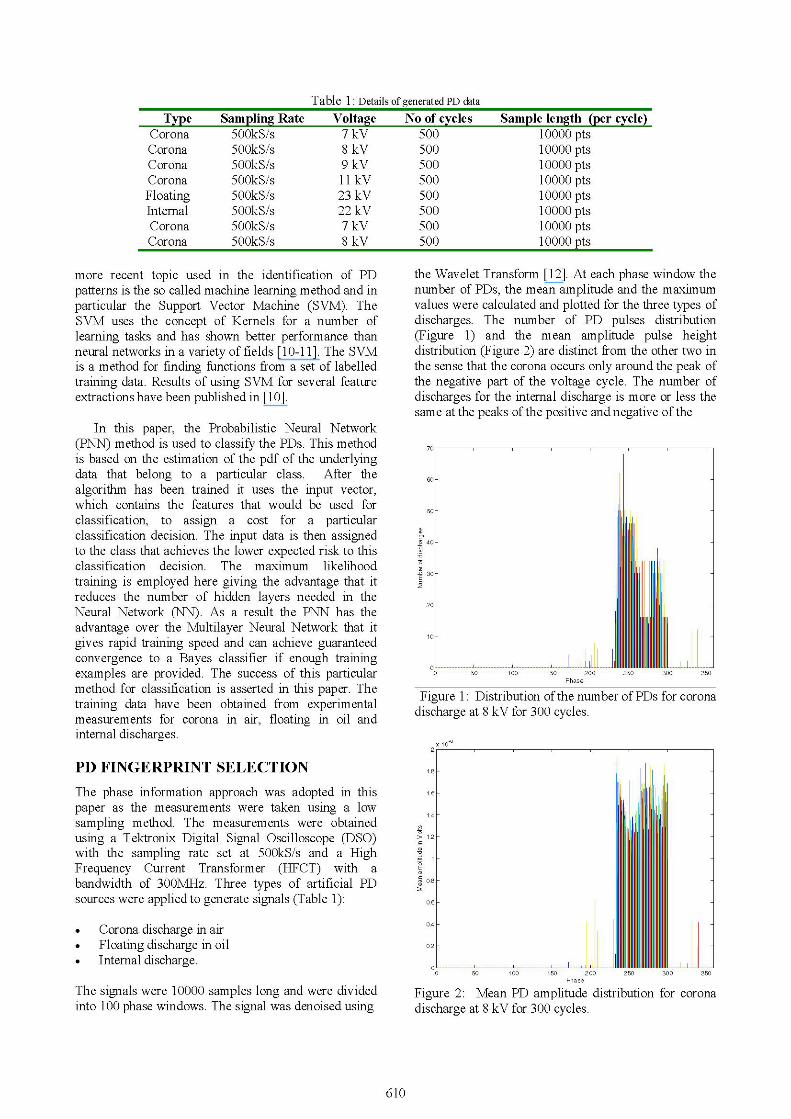
Table 1: Details of generated PD data
Sampling Rate500kS/s500kS/s500kS/s500kS/s500kS/s500kS/s500kS/s500kS/s
Voltage7 kV8 kV9 kV11 kV23 kV22 kV7 kV8 kV
No of cycles500500500500500500500500
Sample length (per cycle)10000 pts10000 pts10000 pts10000 pts10000 pts10000 pts10000 pts10000 pts
more recent topic used in the identification of PDpatterns is the so called machine learning method and inparticular the Support Vector Machine (SVM). TheSVM uses the concept of Kernels for a number oflearning tasks and has shown better performance thanneural networks in a variety of fields [10-11]. The SVMis a method for finding functions from a set of labelledtraining data. Results of using SVM for several featureextractions have been published in [10].
In this paper, the Probabilistic Neural Network(PNN) method is used to classify the PDs. This methodis based on the estimation of the pdf of the underlyingdata that belong to a particular class. After thealgorithm has been trained it uses the input vector,which contains the features that would be used forclassification, to assign a cost for a particularclassification decision. The input data is then assignedto the class that achieves the lower expected risk to thisclassification decision. The maximum likelihoodtraining is employed here giving the advantage that itreduces the number of hidden layers needed in theNeural Network (NN). As a result the PNN has theadvantage over the Multilayer Neural Network that itgives rapid training speed and can achieve guaranteedconvergence to a Bayes classifier if enough trainingexamples are provided. The success of this particularmethod for classification is asserted in this paper. Thetraining data have been obtained from experimentalmeasurements for corona in air, floating in oil andinternal discharges.
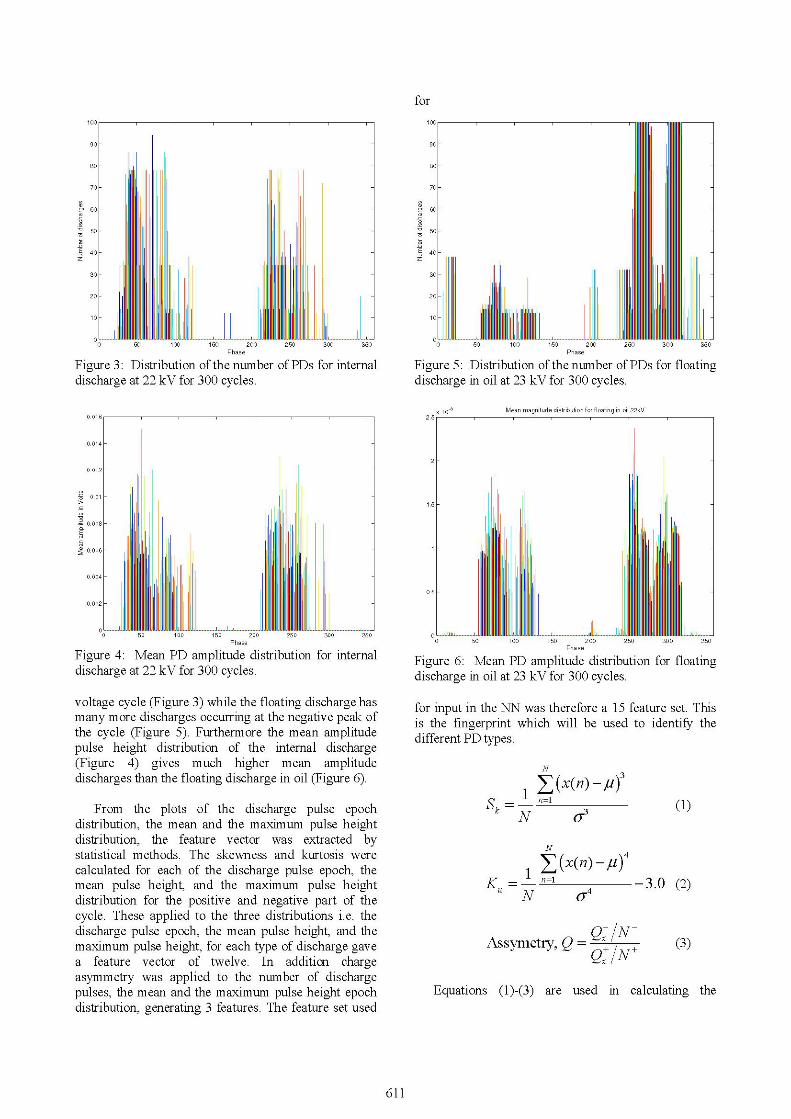
the Wavelet Transform [12]. At each phase window thenumber of PDs, the mean amplitude and the maximumvalues were calculated and plotted for the three types ofdischarges. The number of PD pulses distribution(Figure 1) and the mean amplitude pulse heightdistribution (Figure 2) are distinct from the other two inthe sense that the corona occurs only around the peak ofthe negative part of the voltage cycle. The number ofdischarges for the internal discharge is more or less thesame at the peaks of the positive and negative of the
70
60
50
2 40In
-oa)
30Ez
20
10
0 _o 50 100 150 200 250 300 350
Phase
Figure 1: Distribution ofthe number ofPDs for coronadischarge at 8 kV for 300 cycles.
x 10-,211-
PD FINGERPRINT SELECTIONThe phase information approach was adopted in thispaper as the measurements were taken using a lowsampling method. The measurements were obtainedusing a Tektronix Digital Signal Oscilloscope (DSO)with the sampling rate set at 5OOkS/s and a HighFrequency Current Transformer (HFCT) with a
bandwidth of 300MHz. Three types of artificial PDsources were applied to generate signals (Table 1):
Corona discharge in airFloating discharge in oilInternal discharge.
The signals were 10000 samples long and were dividedinto 100 phase windows. The signal was denoised using
1.6-
1.4-
> 1.2 -lE
0.8-
0.6-
0.4-
0.2-
0
0 50 100 150 200 250 300 350Phase
Figure 2: Mean PD amplitude distribution for corona
discharge at 8 kV for 300 cycles.
610
TypeCoronaCoronaCoronaCoronaFloatingInternalCoronaCorona
1.8
for100100F
90q 90
80 80
70
2 60
50m
40
30
70
2 60
50m
40
30
20 20
10 10
---_I_ IHI]DBSDDEf UtttlglHOUR LBRITh lJ_-----I- _- L-__ 1z2DED DD EDD _L XL__LA _ LI__ L___0 50 100 150 200 250 300 350
Phase
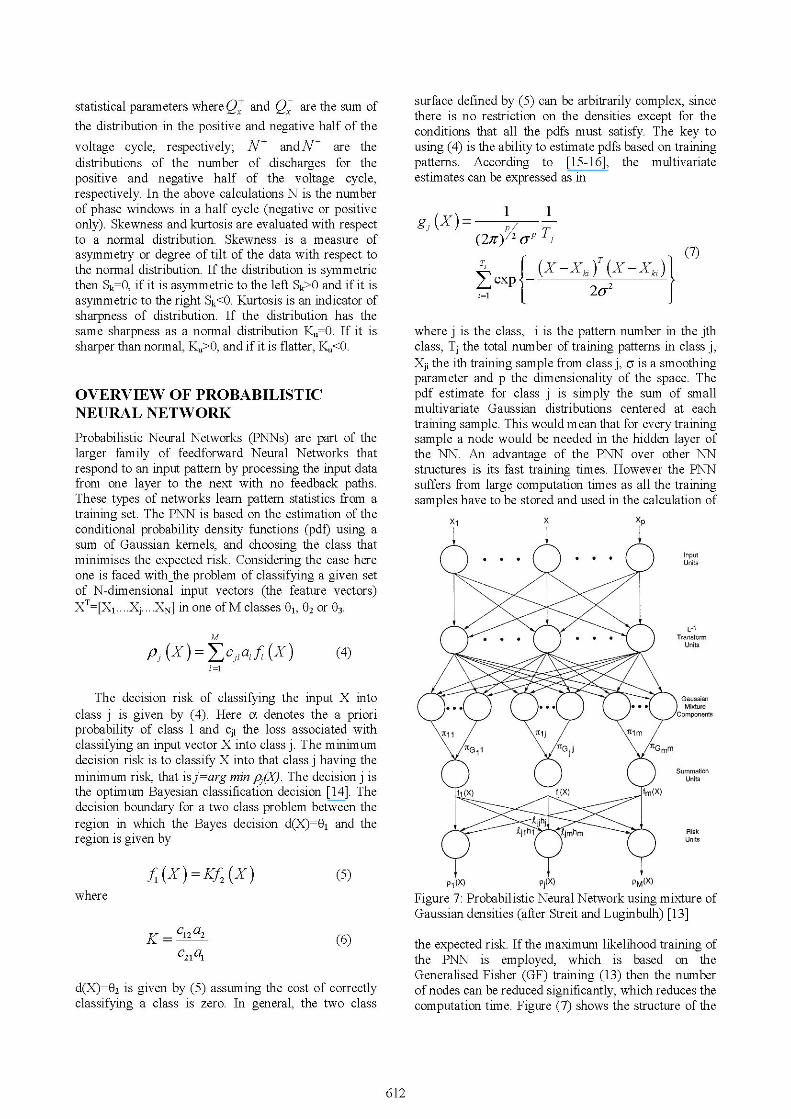
Figure 3: Distribution of the number ofPDs for internaldischarge at 22 kV for 300 cycles.
0.016 F
0 50 100 150 200 250 300 350Phase
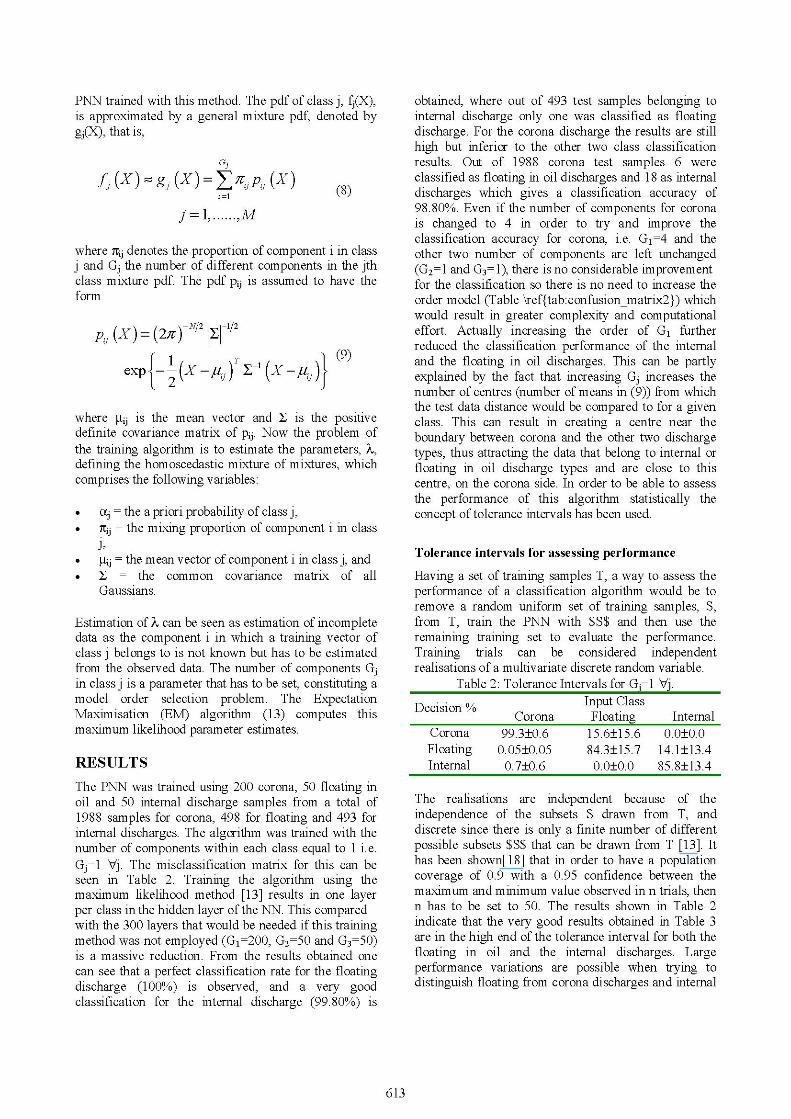
Figure 5: Distribution of the number ofPDs for floatingdischarge in oil at 23 kV for 300 cycles.
x 10-,2.5
Mean magnitude distribution for floating in oil 23kV
0.014 P
0.012 F
5 0.01
0.008E
E 0.006
0.004
0.002
0 50 100 150 200 250 300 350Phase
Figure 4: Mean PD amplitude distribution for internaldischarge at 22 kV for 300 cycles.
1.5
0.5
i- I U IIUj#1H IL M lI IoR U J----I----- --------i-11-1E 1 L u
0 50 100 150 200 250 300 350Phase
Figure 6: Mean PD amplitude distribution for floatingdischarge in oil at 23 kV for 300 cycles.
voltage cycle (Figure 3) while the floating discharge hasmany more discharges occurring at the negative peak ofthe cycle (Figure 5). Furthermore the mean amplitudepulse height distribution of the internal discharge(Figure 4) gives much higher mean amplitudedischarges than the floating discharge in oil (Figure 6).
From the plots of the discharge pulse epochdistribution, the mean and the maximum pulse heightdistribution, the feature vector was extracted bystatistical methods. The skewness and kurtosis werecalculated for each of the discharge pulse epoch, themean pulse height, and the maximum pulse heightdistribution for the positive and negative part of thecycle. These applied to the three distributions i.e. thedischarge pulse epoch, the mean pulse height, and themaximum pulse height, for each type of discharge gavea feature vector of twelve. In addition chargeasymmetry was applied to the number of dischargepulses, the mean and the maximum pulse height epochdistribution, generating 3 features. The feature set used
for input in the NN was therefore a 15 feature set. Thisis the fingerprint which will be used to identify thedifferent PD types.
N
I E (x(n) A)3S- =_ n=l (1)
N (1)
N
1 (x(n)_)Ku = n=l -3.0 (2)
Nssm ,Q= N4 (3)Assymetry, Q - Qx- N (3
Equations (1)-(3) are used in calculating the
611
01 X,
statistical parameters where Q and QX are the sum ofthe distribution in the positive and negative half of thevoltage cycle, respectively; N+ andN are thedistributions of the number of discharges for thepositive and negative half of the voltage cycle,respectively. In the above calculations N is the numberof phase windows in a half cycle (negative or positiveonly). Skewness and kurtosis are evaluated with respectto a normal distribution. Skewness is a measure ofasymmetry or degree of tilt of the data with respect tothe normal distribution. If the distribution is symmetricthen Sk=O, if it is asymmetric to the left Sk>O and if it isasymmetric to the right Sk<O. Kurtosis is an indicator ofsharpness of distribution. If the distribution has thesame sharpness as a normal distribution K1=O. If it issharper than normal, K9>O, and if it is flatter, K-1<O.
OVERVIEW OF PROBABILISTICNEURAL NETWORKProbabilistic Neural Networks (PNNs) are part of thelarger family of feedforward Neural Networks thatrespond to an input pattern by processing the input datafrom one layer to the next with no feedback paths.These types of networks learn pattern statistics from atraining set. The PNN is based on the estimation of theconditional probability density functions (pdf) using asum of Gaussian kernels, and choosing the class thatminimises the expected risk. Considering the case hereone is faced with the problem of classifying a given setof N-dimensional input vectors (the feature vectors)X =[X1....XXj ....XN] in one ofM classes 01, 02 or 03
M
p, (X) = cj a,f (X)/1=
surface defined by (5) can be arbitrarily complex, sincethere is no restriction on the densities except for theconditions that all the pdfs must satisfy. The key tousing (4) is the ability to estimate pdfs based on trainingpatterns. According to [15-16], the multivariateestimates can be expressed as in
/ 11\ 1 1
(2ff) (/23 1j
E (X-Xki)T(X-Xki)itl
} (7)
where j is the class, i is the pattern number in the jthclass, Tj the total number of training patterns in class j,Xj, the ith training sample from class j, a is a smoothingparameter and p the dimensionality of the space. Thepdf estimate for class j is simply the sum of smallmultivariate Gaussian distributions centered at eachtraining sample. This would mean that for every trainingsample a node would be needed in the hidden layer ofthe NN. An advantage of the PNN over other NNstructures is its fast training times. However the PNNsuffers from large computation times as all the trainingsamples have to be stored and used in the calculation of
X1 x Xp
(4)
The decision risk of classifying the input X intoclass j is given by (4). Here oc denotes the a prioriprobability of class 1 and cjl the loss associated withclassifying an input vector X into class j. The minimumdecision risk is to classify X into that class j having theminimum risk, that isj=arg min p(X). The decision j isthe optimum Bayesian classification decision [14]. Thedecision boundary for a two class problem between theregion in which the Bayes decision d(X)=0l and theregion is given by
f (X) = K2(X) (5)Pl (X) pj(X) PM(X
Figure 7: Probabilistic Neural Network using mixture ofGaussian densities (after Streit and Luginbulh) [13]
K=C-A (6)
d(X)=02 is given by (5) assuming the cost of correctlyclassifying a class is zero. In general, the two class
the expected risk. If the maximum likelihood training ofthe PNN is employed, which is based on theGeneralised Fisher (GF) training (13) then the numberofnodes can be reduced significantly, which reduces thecomputation time. Figure (7) shows the structure of the
612
where
PNN trained with this method. The pdf of class j, fj(X),is approximated by a general mixture pdf, denoted bygj(X), that is,
Gifj (X) = gj (X) = Yij,Pij (X)
i=l
j=1, .. ,M
where;n denotes the proportion of component i in classj and Gj the number of different components in the jthclass mixture pdf. The pdf Pij is assumed to have theform
Pij (X) = (2ff) |Y[exp {-
I
where gij is the mean vector and I is the positivedefinite covariance matrix of Pij. Now the problem ofthe training algorithm is to estimate the parameters, X,defining the homoscedastic mixture of mixtures, whichcomprises the following variables:
O=x the a priori probability of class j,* ntij the mixing proportion of component i in class
J,* itjj the mean vector of component i in class j, and
Z = the common covariance matrix of allGaussians.
Estimation of X can be seen as estimation of incompletedata as the component i in which a training vector ofclass j belongs to is not known but has to be estimatedfrom the observed data. The number of components Gjin class j is a parameter that has to be set, constituting amodel order selection problem. The ExpectationMaximisation (EM) algorithm (13) computes thismaximum likelihood parameter estimates.
RESULTSThe PNN was trained using 200 corona, 50 floating inoil and 50 internal discharge samples from a total of1988 samples for corona, 498 for floating and 493 forinternal discharges. The algorithm was trained with thenumber of components within each class equal to 1 i.e.Gj=1 Vj. The misclassification matrix for this can beseen in Table 2. Training the algorithm using themaximum likelihood method [13] results in one layerper class in the hidden layer of the NN. This comparedwith the 300 layers that would be needed if this trainingmethod was not employed (G1=200, G2=50 and G3=50)is a massive reduction. From the results obtained onecan see that a perfect classification rate for the floatingdischarge (100%) is observed, and a very goodclassification for the internal discharge (99.80%) is
(8)
obtained, where out of 493 test samples belonging tointernal discharge only one was classified as floatingdischarge. For the corona discharge the results are stillhigh but inferior to the other two class classificationresults. Out of 1988 corona test samples 6 wereclassified as floating in oil discharges and 18 as internaldischarges which gives a classification accuracy of98.80%. Even if the number of components for coronais changed to 4 in order to try and improve theclassification accuracy for corona, i.e. G1=4 and theother two number of components are left unchanged(G2= 1 and G3= 1), there is no considerable improvementfor the classification so there is no need to increase theorder model (Table \refftab:confusion matrix2}) whichwould result in greater complexity and computationaleffort. Actually increasing the order of G1 furtherreduced the classification performance of the internaland the floating in oil discharges. This can be partlyexplained by the fact that increasing Gj increases thenumber of centres (number of means in (9)) from whichthe test data distance would be compared to for a givenclass. This can result in creating a centre near theboundary between corona and the other two dischargetypes, thus attracting the data that belong to internal orfloating in oil discharge types and are close to thiscentre, on the corona side. In order to be able to assessthe performance of this algorithm statistically theconcept of tolerance intervals has been used.
Tolerance intervals for assessing performance
Having a set of training samples T, a way to assess theperformance of a classification algorithm would be toremove a random uniform set of training samples, S,from T, train the PNN with $S$ and then use theremaining training set to evaluate the performance.Training trials can be considered independentrealisations of a multivariate discrete random variable.
Table 2: Tolerance Intervals for G,1 Vj.Decision 0 Input Class
Corona Floating InternalCorona 99.3±0.6 15.6±15.6 0.0±0.0Floating 0.05±0.05 84.3±15.7 14.1±13.4Internal 0.7±0.6 0.0±0.0 85.8±13.4
The realisations are independent because of theindependence of the subsets S drawn from T, anddiscrete since there is only a finite number of differentpossible subsets $S$ that can be drawn from T [13]. Ithas been shown[18] that in order to have a populationcoverage of 0.9 with a 0.95 confidence between themaximum and minimum value observed in n trials, thenn has to be set to 50. The results shown in Table 2indicate that the very good results obtained in Table 3are in the high end of the tolerance interval for both thefloating in oil and the internal discharges. Largeperformance variations are possible when trying todistinguish floating from corona discharges and internal
613
T Y,-, x -pi(9)

Table 2: Misclassification matrix for 1 Vj.Input Class Sample Size
Decision Corona Floating Intenal Input Training98.800o 0.OOOo 0.200o 1988 200
(1964)
0.30o%
(6)
0.91%Internal (18)
(0) (1)
100.00% 0.00%
(498) (0)
0.00%O 99.80%(0) (492)
498
498
50
50
Table 3: Misclassification matrix for G1 =4, G2= 1 and G3 =1.Input Class
Decision Corona Floating98.80% 0.00%O
(1964)
0.450o
(9)
0.750o
(15)
(0)
Internal0.20%(1)
100.00% 0.00%
(498) (0)
Sample SizeInput Training
1988 200
498
0.00%O 99.80% 498
(0) (492)
50
50
from floating discharges. The data that belong to thefloating class have a large performance variation as faras misclassification as corona type is concerned. Thisinterval is 15.6±15.6. Also when classifying a test databelonging to the internal discharge type it has a
performance variation in misclassifying it as floating inoil discharge of 14.1+13.4, which is high. The resultsfor the performance variation of corona discharges are
very good indicating that this type of discharge can beclassified with low performance variations (99.3±0.6).A partial explanation for these large variations whendealing with test data of internal and floating in oildischarges can be drawn from the statistics ofdistributions used as feature vectors (Figuresl-6). Thestatistics of these distributions can in some cases be so
close that the feature vector used is not adequate todistinguish the two classes. Thus further improvementof the feature vector by including Fourier and Wavelettransforms data would most possibly improve theperformance of this PNN.
CONCLUSIONS
This paper has shown the ability of the PNN to classifybetween three different types of PDs, namely corona
discharge in air, floating discharge in oil, and internaldischarge. The PNN algorithm has the advantage thatcan be trained very fast but requires longer computationtime, as opposed to most NN algorithms that requireconsiderable training times. The reason behind this isthat a neuron is required in the hidden layer of the PNN
for every training sample. But by training the PNNusing the GF method these numbers of neurons can bereduced giving much quicker classification times. Theperformance of this algorithm has given promisingresults given a time statistical feature vector.
As future work the frequency (FFT) and time-frequency (Wavelets) decomposition coefficients mightbe used as additional feature vectors in the quest toimprove the performance of a classification algorithm.
ACKNOWLEDGMENTThe authors wish to acknowledge the financial supportof the Cyprus Research Promotion Foundation (grantnumber TEXNO/1104).
Also the contribution of Liwei Hao, from the TonyDavies High Voltage Lab, in obtaining the experimentaldata would like to be acknowledged.
REFERENCES
[1] IEC 602 70 Partial Discharge Measurements,International Electrotechnical Commission, 2000.
[2] N. Sahoo, M. Salama, and R. Bartnikas, "Trends inpartial discharge pattern classification: a survey,"Dielectrics and Electrical Insulation, IEEETransactions on, vol. 12, no. 2, pp. 248 - 264, april2005.
614
Corona
Floating
Corona
Floating
Internal
[3] E. Gulski, "Discharge pattern recognition in highvoltage equipment," Science, Measurement andTechnology, IEE Proceedings-, vol. 142, no. 1, pp.51 - 61, January 1995.
[4] A. Mazroua, M. Salama, and R. Bartnikas, "Pdpattern recognition with neural networks using themultilayer perceptron technique," Dielectrics andElectrical Insulation, IEEE Transactions on, vol.28, no. 6, pp. 1082 - 1089, December 2003.
[5] A. Mazroua, M. Salama, and R. Bartnikas,"Discrimination between pd pulse shapes usingdifferent neural network paradigms," Dielectricsand Electrical Insulation, IEEE Transactions on,vol. 1, no. 6, pp. 1119 - 1131, December 1994.
[6] M. Salama and R. Bartnikas, "Fuzzy logic appliedto pd pattern classification," Dielectrics andElectrical Insulation, IEEE Transactions on, vol. 7,no. 1, pp. 118 - 123, February2000.
[7] A. Cavallini, G. Montanari, F. Puletti, and A.Contin, "A new methodology for the identificationof pd in electrical apparatus: properties andapplications," Dielectrics and Electrical Insulation,IEEE Transactions on, vol. 12, no. 2, pp.203 - 215,April 2005.
[8] J. T. Tou and R. C. Gonzalez, Pattern RecognitionPrinciples, Addison-Wesley, 1974.
[9] Y. Tian, P. Lewin, A. E. Davies, S. J. Sutton, and S.G. Swingler, "Application of acoustic emissiontechniques and artificial neural networks to partialdischarge classification," in Electrical Insulation,2002. Conference Record of the 2002 IEEEInternational Symposium on, June 2002, pp. 119-123.
[11] B. Scholkopf and A. Smola, Learning with Kernels.Support Vector Machines, Regularization,Optimization and Beyond. MIT Press, 2002.
[12] D. Evagorou, A. Kyprianou, P. L. Lewin, A.Stavrou, V. Efthyniou, and G. E. Georgiou, "Aninvestigation into the parameters affecting thesuccess of the wavelet packets method fordenoising partial discharge signals," in Medpower2006,November 2006.
[13] R. L. Streit and T. E. Luginbuhl, "Maximumlikelihood training of probabilistic neuralnetworks," Neural Networks, IEEE Transactionson, vol. 5, pp. 764-783, September 1994.
[14] S. J. Press, Applied Multivariate Analysis, KreigerPublishing, 1982, ch. 13.
[15]E. Parzen, "On the estimation of a probabilitydensity function and mode," Annals ofMathematical Statistics, vol. 33, pp. 1065-1076,1962.
[16] T. Cacoullos, "Estimation of a multivariatedensity," Annals of Mathematical Statistics, vol.18,no. 2, pp. 179-189, 1966.
[17] A. P. Dempster, N. M. Laird, and D. B. Rubin,"Maximum likelihood from incomplete data via theEM algorithm," Annals of Mathematical Statistics,vol. 39, pp. 1-38, 1977.
[18] R. B. Murphy, "Non-parametric tolerance limits,"Annals ofMathematical Statistics, vol. 19, no. 4,pp.581-589, December 1948.
[10] L. Hao, P. Lewin, and S. Dodd, "Comparison ofsupport vector machine based partial dischargeidentification parameters," in Electrical Insulation,2006. Conference Record of the 2006 IEEEInternational Symposium on, June 2006, pp. 110 -
113.
615