On-line detection and measurement of partial discharge signals in a noisy environment
12
A. M. Gaouda et al.: On-Line Detection and Measurement of Partial Discharge Signals in a Noisy Environment 1070-9878/08/$25.00 © 2008 IEEE 1162 ABSTRACT In extracting partial discharge (PD) signals embedded in excessive noise, the need for an online and automated tool becomes a crucial necessity. One of the recent approaches that have gained some acceptance within the research arena is the Wavelet multi- resolution analysis (WMRA). However selecting an accurate mother wavelet, defining dynamic threshold values and identifying the resolution levels to be considered in the PD extraction from the noise are still challenging tasks. This paper proposes a novel wavelet-based technique for extracting PD signals embedded in high noise levels. The proposed technique enhances the WMRA by decomposing the noisy data into different resolution levels while sliding it into Kaiser's window. Only the maximum expansion coefficients at each resolution level are used in de-noising and measuring the extracted PD signal. A small set of coefficients is used in the monitoring process without assigning threshold values or performing signal reconstruction. The proposed monitoring technique has been applied to a laboratory data as well as to a simulated PD pulses embedded in a collected laboratory noise. Index Terms – Partial discharge, detection, noise, Wavelet analysis, Kaiser's window. 1. INTRODUCTION WHILE electrical apparatus and cables must conform to specified national and international partial discharge (PD) standards at the time of their manufacture, it is frequently found that insulation aging may manifest itself by partial discharge onset. The susceptibility of discharge induced degradation of insulating materials depends upon their chemical structure as well as upon the discharge intensity and its stability with time. For example, the presence of discharge in polymeric cables under in-service conditions cannot be tolerated, while a partial discharge intensity level below 500 pC in oil-filled transformers is considered to be tolerable. In contrast, mica based rotating machine insulation is known to exhibit considerable resistance to partial discharge over extended periods of time. To ensure life longevity of electrical insulating systems, it is desirable to monitor the partial discharge level in electrical equipment [1]. The aim of discharge monitoring in-service is to establish whether insulating systems develop partial discharges, locate the sites of activity and assess their seriousness and if necessary repair the faulted sites or alternatively remove the faulted equipment from service. In cables, discharge site location may be accomplished by means of time domain reflectometry techniques; however, a separate On-Line Detection and Measurement of Partial Discharge Signals in a Noisy Environment A. M. Gaouda Department of Electrical Engineering United Arab Emirates University, Al Ain, UAE Ayman El-Hag Department of Electrical Engineering American University of Sharjah, Sharjah, UAE T. K. Abdel-Galil King Fahd University of Petroleum and Minerals Dhahran, Saudi Arabia M. M. A. Salama and R. Bartnikas Department of Electrical and Computer Engineering University of Waterloo, Waterloo, Ontario, Canada Manuscript received on 29 June 2007, in final form 6 March 2008.
Transcript of On-line detection and measurement of partial discharge signals in a noisy environment

A. M. Gaouda et al.: On-Line Detection and Measurement of Partial Discharge Signals in a Noisy Environment
1070-9878/08/$25.00 © 2008 IEEE
1162
ABSTRACT In extracting partial discharge (PD) signals embedded in excessive noise, the need for an online and automated tool becomes a crucial necessity. One of the recent approaches that have gained some acceptance within the research arena is the Wavelet multi-resolution analysis (WMRA). However selecting an accurate mother wavelet, defining dynamic threshold values and identifying the resolution levels to be considered in the PD extraction from the noise are still challenging tasks. This paper proposes a novel wavelet-based technique for extracting PD signals embedded in high noise levels. The proposed technique enhances the WMRA by decomposing the noisy data into different resolution levels while sliding it into Kaiser's window. Only the maximum expansion coefficients at each resolution level are used in de-noising and measuring the extracted PD signal. A small set of coefficients is used in the monitoring process without assigning threshold values or performing signal reconstruction. The proposed monitoring technique has been applied to a laboratory data as well as to a simulated PD pulses embedded in a collected laboratory noise.
Index Terms – Partial discharge, detection, noise, Wavelet analysis, Kaiser's window.
1. INTRODUCTION
WHILE electrical apparatus and cables must conform to specified national and international partial discharge (PD) standards at the time of their manufacture, it is frequently found that insulation aging may manifest itself by partial discharge onset. The susceptibility of discharge induced degradation of insulating materials depends upon their chemical structure as well as upon the discharge intensity and its stability with time. For example, the presence of discharge in polymeric cables under in-service conditions cannot be tolerated, while a partial discharge intensity level below 500
pC in oil-filled transformers is considered to be tolerable. In contrast, mica based rotating machine insulation is known to exhibit considerable resistance to partial discharge over extended periods of time. To ensure life longevity of electrical insulating systems, it is desirable to monitor the partial discharge level in electrical equipment [1]. The aim of discharge monitoring in-service is to establish whether insulating systems develop partial discharges, locate the sites of activity and assess their seriousness and if necessary repair the faulted sites or alternatively remove the faulted equipment from service. In cables, discharge site location may be accomplished by means of time domain reflectometry techniques; however, a separate
On-Line Detection and Measurement of Partial Discharge Signals in a Noisy Environment
A. M. Gaouda Department of Electrical Engineering
United Arab Emirates University, Al Ain, UAE
Ayman El-Hag Department of Electrical Engineering
American University of Sharjah, Sharjah, UAE
T. K. Abdel-Galil King Fahd University of Petroleum and Minerals
Dhahran, Saudi Arabia
M. M. A. Salama and R. Bartnikas Department of Electrical and Computer Engineering University of Waterloo, Waterloo, Ontario, Canada
Manuscript received on 29 June 2007, in final form 6 March 2008.

IEEE Transactions on Dielectrics and Electrical Insulation Vol. 15, No. 4; August 2008 1163
power supply must be deployed thus requiring an interruption of service [2], [3]. On cable accessories or cables that are readily accessible, such as in substations, either capacitive or inductive sensing probes may be used [3, 4]. For on-line tests on rotating machines, capacitive couplers are normally utilized. These are placed in series with a detection resistor and the series combination is mounted across each phase of the stator [5]; alternatively, the resistor is sometimes replaced by an RCL-type detection impedance [6, 7]. In the latter case, the line and radiated noise is eliminated by means of a noise gathering procedure [6]. While in the former arrangement the signal to noise ratio is greatly improved by the use of delay lines in conjunction with a balanced PD measurement arrangement [8], there exists presently a relatively large PD pulse-height distribution data base, that has been compiled using the technique described in [8] that has proven to be useful in the evaluation of the aging processes in rotating machines in the presence of partial discharge. For monitoring the PD activity in transformers, it is common to employ a Rogowski coil as the detection element, since it may be conveniently slipped over HV bushings. However, Rogowski coils are extremely susceptible to external interference, which tends to predominate over the lower frequencies – typically over the AM band up to approximately 2 MHz. Consequently, PD measurements in the field are normally carried out at higher frequencies, usually up to approximately 30 MHz. [9, 10]. Normally, a spectrum analyzer, tuned to a frequency at which the signal to noise ratio is high, is employed. The measurement system cannot be accurately calibrated in pC and, hence, the PD pulse amplitudes are recorded in μV or mV. However, the inherent problem of the elevated susceptibility of the Rogowski coil to external interference may be dealt with in a more rigorous manner. It is the intent of the present paper to describe an effective wavelet based noise rejection technique that has been devised to suppress noise within the frequency range from 10 to 30 MHz. The foregoing effort represents an extension of the work in our laboratory in the area of signal processing with particular emphasis on wavelet techniques, which we have also applied on PD pattern classification and recognition in conjunction with neural networks, neuron-fuzzy logic on cavities and electrical trees as well as support vector machines (SVM) on the PD patterns associated with the movement of particles in oils [11-14]. In addition, we used pattern recognition techniques, such as inductive inference algorithm, hidden Markov models, fast match-based vector quantization to recognize the partial discharge patterns in dielectric cavities [15-18]. In our studies on PD pattern identification, we have selected to use the pulse shape parameters as the features or attributes because the PD pulse shape characteristics reflect the nature and peculiarities of the discharge mechanism within the
cavities. The rise time, magnitude and pulse width of the PD pulses are influenced by the availability of free electrons, which are usually provided by electron emission from shallow traps on the cavity walls since the ionizing effects of radiation within insulation structure are greatly reduced. A paucity of free electrons results in overvoltages across the cavities, leading to rapid rise time, large magnitude and reduced width PD pulses of the spark-type constricted channel discharge [19]. Whereas a copious supply of free electrons results in low overvoltages across the cavities producing slow rise time, low amplitude and wide width PD pulses of the pseudoglow type (expanded channel discharge). The magnitudes of the PD pulses are also influenced by the charge deposited on the inner walls of the cavities by the discharges [20, 21]. This causes the appearance of residual voltages –i.e., the voltage across the cavity is not reduced to zero at breakdown but to a finite value equal to the residual voltage, The PD pulse magnitude is proportional to the difference between the breakdown and residual voltages of the cavity.
This paper proposes a new wavelet-based technique for
detecting partial discharge phenomenon embedded in a noisy environment and efficiently measuring its magnitude. Data are processed through Kaiser's window, decomposed into different resolutions and only the maximum coefficients localized at each resolution are used to extract and measure the PD signal. No thresholding or reconstruction process is required. The extracted PD data-size is very small compared with the original signal. The proposed technique can be implemented on line and show accurate results when applied on laboratory and simulated data corrupted with high noise levels.
The paper is organized as follows. PD experimental setup
and PD data simulation are presented in Section 2. A brief introduction to wavelet de-noising techniques is discussed in Section 3. Wavelet multi-resolution analysis is introduced in Section 4. The proposed PD detection and measurement technique is presented in Section 5. Comparing the proposed technique with other on-line and off-line de-noising techniques is discussed in this section. The application on laboratory data and simulated data is presented in Section 6. Section 7 presents an assessment of the proposed technique followed by conclusions in section 8.
2. EXPERIMENTAL SETUP AND DATA SIMULATION Partial discharge (PD) signal was measured simultaneously
using three different methods as depicted in Figure 1. The high voltage source is a PD free, 100 kV transformer controlled by a variable transformer (variac). The tested specimen is made from epoxy resin with enclosed cylindrical cavity and is placed between parallel plane electrodes. The PD signal was captured simultaneously in three different ways. Inductively using Rogowski coil inserted around the ground conductor, as a voltage drop across a 100 Ω resistor inserted in the ground wire and capacitively using conventional PD detectors. The PD signals measured using the Rogowski coil and 100 Ω

A. M. Gaouda et al.: On-Line Detection and Measurement of Partial Discharge Signals in a Noisy Environment 1164
resistor are synchronized and recorded using a 500 MHz bandwidth digital oscilloscope. To insure PD signal capture is distortion-free a sampling rate of 2.0 Gsamples/s is selected.
A conventional narrow band PD detector is connected
across an RLC type detection impedance (ZL) placed in series with a discharge free coupling capacitor (Cc). The RLC detection impedance causes some oscillation to the PD pulse detected across the 100 Ω resistance. Calibration is conducted by injecting a known charge via a series capacitor (Cs) by means of a square wave generator, using a sufficiently wide pulse to prevent overlap between the simulated PD pulses at the front and trailing edges of the square pulse.
Figure 1. Experimental arrangement for simultaneous PD pulse measurement.
Additional to the laboratory data sets (24 data sets), a simulated data set are generated. The PD peak, its time location and the signal to noise ratio (SNR) of the simulated data are controlled for assessment of the proposed technique.
A simulated version of the PD signal is constructed using a
damped exponential signal (PD1), a delayed damped oscillatory signal (PD2) and a noise ( n ) according to the following mathematical relation:
PD= damped exponential + delayed damped oscillatory + noise (1) The damped exponential part of the PD signal is simulated as:
]e-e[APD tt1
βλ −−= (2)
The PD peak value, rise time, pulse width and decay time are controlled by A ( 015.0A = ), λ ( -61043×=λ ) and β ( -71044×=β ) parameters. The damped oscillatory part of the PD signal is simulated as:
⎪⎩
⎪⎨
⎧
+−= −
)tf2sin(01.0)tf2sin(75.0)tf2sin(5.0)tf2sin(75.0
ePD
43
2
1t
2
ππππ
δ
43
32
21
ttttttttt
<≤<≤<≤
(3)
The frequencies of oscillation in 2PD are selected using four frequencies 41 ftof (30 MHz, 20 MHz, 15 MHz and 10 MHz simultaneously) and its decaying time is controlled by δ parameter ( 6107 ×=δ ).
The noise content ( n ) added to the simulated PD signal contains a random noise and a real noise captured from laboratory data. The signal to noise ratio (SNR) is controlled by scaling the magnitude of the noise level added to PD simulated signal. The PD signal shown in Figure 2b is simulated using (1) over 450 ns and its PD peak and noise level is scaled to match the actual PD captured using the resistive voltage method.
Figure 2 shows a laboratory PD voltage signal captured
across the 100 ohm resistor where the applied voltage was 15.3 kV and the conventional PD detectors reading was 55-60 pC. Two simulated signals using (1) are shown in Figures 2b and 2c, where the SNR is 19.21 dB and -3.24 dB simultaneously.
0 100 200 300 400-0.02
0
0.02
0.04
0.06
0.08
0.1
0.12
0.14
0 100 200 300 400-0.02
0
0.02
0.04
0.06
0.08
0.1
0.12
0.14
0 100 200 300 400-0.1
-0.05
0
0.05
0.1
0.15
)a(
V
)(ns)(ns
V V
)(ns
)b( )c(
Simulated PD Signal
Actual PD Signal
Simulated PD Signal
Figure 2. a - Actual PD signal and b- simulated PD signal, SNR = 19.21dB and c - simulated PD signal, SNR = -3.24 dB
3. A BRIEF INTRODUCTION TO WAVELET-BASED PD DENOISING TECHNIQUES
Several de-noising methods based on frequency domain analysis, utilizing the fast Fourier transform (FFT) are used. However, the FFT algorithm is based on a deterministic data set and it does not provide information in time. Short time Fourier transform is also applied to achieve a high degree of localization in time and frequency domains. The time features of the signal are extracted by multiplying the original signal by another function (window function) which has zero magnitude outside the desired interval. The FFT of this portion of the signal then provides the frequency information. However the PD pulse is non-stationary and transient in nature. Its energy spreads over the whole band and merges with noise if extracted using continuous and periodic basis (sine and cosine) functions [23]. De-noising methods developed using the FFT are therefore limited in processing PD signals that are stochastic in nature [4].
Applications of wavelet analysis to PD monitoring have been reported in [22-30]. Some of these applications are implemented off-line and depend on visual inspection. On-line PD de-noising is also proposed however requires experience and prior knowledge of the noise model. For a given set of PD data in the presence of noise, most of the wavelet de-noising is performed through wavelet decomposition, thresholding of wavelet coefficients and wavelet reconstruction. This de-noising method can give good results if the noise and the PD

IEEE Transactions on Dielectrics and Electrical Insulation Vol. 15, No. 4; August 2008 1165
pulse are residing at different resolution levels (frequency bands). However, if both reside in the same resolution level and the signal to noise ratio is small, on-line de-noising becomes a difficult task. Selecting the best mother wavelet, defining the resolution level where the PD signal is residing and selecting sensitive and dynamic threshold values are the most challenging tasks in these applications.
In [22], a combination of wavelet multi-resolution analysis
and a notch filter are proposed to extract PD pulses embedded in a mixture of sinusoidal and white Gaussian noise. The wavelet-based de-noising is performed by decomposing the processed signal into several resolution levels and reconstructing it back ignoring the detail coefficients of the first three resolution levels. Daubechies 10 is selected as a mother wavelet in this application. The notch filter is used to remove the low frequency noise in the signal. However, the paper presents a direct application of WMRA and does not discuss the signal to noise ratio and whether the noise and PD pulses are residing in the same resolution level.
In [23, 26], mother wavelet and automated selection of dynamic threshold values are discussed. The optimal mother wavelet is selected based on the correlation between the mother wavelet and the theoretical PD pulse waveform. The paper concluded that low-order wavelets are the most appropriate for analyzing exponential PD pulses, whereas the higher order wavelets are the best candidate for the damped resonant PD pulse. However the PD pulse shape is determined by the insulation cavity shape, dimensions and its location along with the type of the external measuring circuit. Hence, off-line and trial and error is essential in completing the monitoring process. The paper proposed a procedure for automatic selection of a dynamic threshold value for each resolution level. More discussion of threshold selection will be presented in Section 5.2.
In [24], a robust WT threshold value selection algorithm is
proposed based on continuously modeling the noise characteristic while the applied voltage is slightly lower than the PD inception voltage (PDIV). Wavelet multi-resolution analysis is applied on the noise. The maximum coefficient detected at each resolution level is used as a threshold value for PD de-noising at that resolution. However, for the same applied voltage two data sets of noise will show different randomly spread samples with different magnitudes even though measurements are performed under the same working condition. Furthermore, the maximum wavelet detail coefficient, which proposed as threshold at certain resolution, is extracted in WMRA by convolution and decimation. Having many adjacent noise samples with large magnitudes will generate a detail coefficient (the proposed threshold) of a large magnitude and hence overestimate the threshold value.
In [25], an off-line de-noising technique is proposed where
the resolution containing the PD pulse is defined by visual inspection of the wavelet-based reconstructed signals at different resolutions. Which mother wavelet to be utilized still
presents a challenge? The authors utilized many Daubechies mother wavelets for extracting different PD pulses from noise. More discussion on the proposed technique will be presented in Section 5.2.
In [27], a radio frequency current transducer (RFCT) is used
for detecting a PD within a 132kV prefabricated cable joint containing a known defect. Only PD discharges above 90 pC were detectable. Daubechies 2 mother wavelet combined with a soft threshold is utilized in the multi-resolution analysis for de-noising and hence increased the PD detection sensitivity to 30 pC. A non-contacting method for PD detection is proposed in [28]. PD activity is detected by monitoring the wide-band electromagnetic wave emitted in gas insulated switchgear (GIS). As the PD magnitude increases the duration of the PD signal becomes longer and can be detected at a lower frequency band. Applying the Wavelet transform on the E-M wave emitted from PD buried under continuous FM radio wave can extract the PD event from the FM signal. In [29] wavelet packet transform, using Symlet 8 mother wavelet, is applied to extract features that can classify PD mixed with corona. The coefficients energy, their distribution pattern and symmetry are used as features for the neural net to classify PD from noise and corona. The energy of the coefficients is used to select the resolution levels to be considered in extracting PD signal from corona. In [30], the energy of the wavelet expansion coefficients is calculated for each resolution to define the main levels where the PD pulse is localized. De-noising is achieved by considering only the resolutions with high energy. However, in all these applications [27-30] de-noising was not a challenging task. These applications do not investigate the signal to noise ratio and weather the noise and PD pulses are residing in the same resolution level. Moreover, no procedure was presented for selecting the threshold values, if applicable, or the mother wavelet.
The main advantage of the proposed technique is its on-line ability to detect and measure PD signals embedded in noise without appointing threshold values or require signal reconstruction. Only the maximum coefficients extracted from different resolution levels are used to detect and measure PD pulses. The challenge of selecting a mother wavelet is resolved by processing the signal while data slides into Kaiser's window. The correlation between the mother wavelet and the signal under processing is increased and hence the magnitudes of the maximum coefficients. The bell shape of Kaiser's window strengthens the coefficients that represent the signal at the window's center and deteriorates the affect of adjacent samples. The data-size of the extracted PD signal is very small as compared with the raw data or those generated from WMRA reconstruction.
4. WAVELET MULTI-RESOLUTION ANALYSIS
Applying wavelet multi-resolution analysis, one can decompose a signal )t(f at different resolution levels and present it as a series of approximate )k(c j and detail
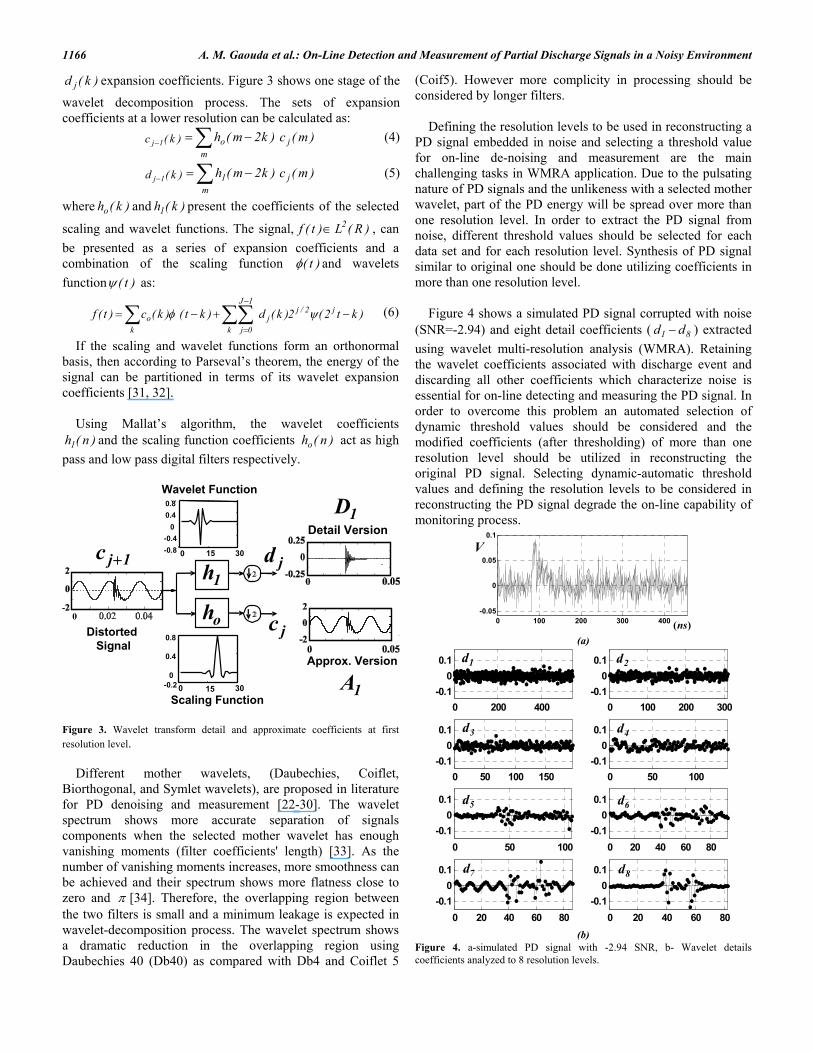
A. M. Gaouda et al.: On-Line Detection and Measurement of Partial Discharge Signals in a Noisy Environment 1166
)k(d j expansion coefficients. Figure 3 shows one stage of the
wavelet decomposition process. The sets of expansion coefficients at a lower resolution can be calculated as:
)k(c 1j− ∑ −=m
o )k2m(h )m(c j (4)
)k(d 1j− ∑ −=m
1 )k2m(h )m(c j (5)
where )k(ho and )k(h1 present the coefficients of the selected
scaling and wavelet functions. The signal, )R(L)t(f 2∈ , can be presented as a series of expansion coefficients and a combination of the scaling function )t(φ and wavelets function )t(ψ as:
∑∑∑ −+−=−
=k
j2/jj
1J
0jko )kt2(2)k(d)kt()k(c)t(f ψφ (6)
If the scaling and wavelet functions form an orthonormal basis, then according to Parseval’s theorem, the energy of the signal can be partitioned in terms of its wavelet expansion coefficients [31, 32].
Using Mallat’s algorithm, the wavelet coefficients
)n(h1 and the scaling function coefficients )n(ho act as high pass and low pass digital filters respectively.
Wavelet Function
Scaling Function
DistortedSignal
Detail Version
Approx. Version
0 15 30-0.8-0.4
00.40.8
0 15 30-0.20
0.4
0.8
jd
jc
1jc +1h
oh
1A
1D
Figure 3. Wavelet transform detail and approximate coefficients at first resolution level.
Different mother wavelets, (Daubechies, Coiflet,
Biorthogonal, and Symlet wavelets), are proposed in literature for PD denoising and measurement [22-30]. The wavelet spectrum shows more accurate separation of signals components when the selected mother wavelet has enough vanishing moments (filter coefficients' length) [33]. As the number of vanishing moments increases, more smoothness can be achieved and their spectrum shows more flatness close to zero and π [34]. Therefore, the overlapping region between the two filters is small and a minimum leakage is expected in wavelet-decomposition process. The wavelet spectrum shows a dramatic reduction in the overlapping region using Daubechies 40 (Db40) as compared with Db4 and Coiflet 5
(Coif5). However more complicity in processing should be considered by longer filters.
Defining the resolution levels to be used in reconstructing a
PD signal embedded in noise and selecting a threshold value for on-line de-noising and measurement are the main challenging tasks in WMRA application. Due to the pulsating nature of PD signals and the unlikeness with a selected mother wavelet, part of the PD energy will be spread over more than one resolution level. In order to extract the PD signal from noise, different threshold values should be selected for each data set and for each resolution level. Synthesis of PD signal similar to original one should be done utilizing coefficients in more than one resolution level.
Figure 4 shows a simulated PD signal corrupted with noise (SNR=-2.94) and eight detail coefficients ( 81 dd − ) extracted using wavelet multi-resolution analysis (WMRA). Retaining the wavelet coefficients associated with discharge event and discarding all other coefficients which characterize noise is essential for on-line detecting and measuring the PD signal. In order to overcome this problem an automated selection of dynamic threshold values should be considered and the modified coefficients (after thresholding) of more than one resolution level should be utilized in reconstructing the original PD signal. Selecting dynamic-automatic threshold values and defining the resolution levels to be considered in reconstructing the PD signal degrade the on-line capability of monitoring process.
)(ns
V
0 100 200 300 400-0.05
0
0.05
0.1
(a)
0 200 400-0.1
00.1
0 100 200 300-0.1
00.1
0 50 100 150-0.1
00.1
0 50 100-0.1
00.1
0 50 100-0.1
00.1
0 20 40 60 80-0.1
00.1
0 20 40 60 80-0.1
00.1
0 20 40 60 80-0.1
00.1
1d 2d
3d 4d
5d 6d
7d 8d
(b)
Figure 4. a-simulated PD signal with -2.94 SNR, b- Wavelet details coefficients analyzed to 8 resolution levels.

IEEE Transactions on Dielectrics and Electrical Insulation Vol. 15, No. 4; August 2008 1167
The paper proposes a new technique that overcomes the difficulties in on-line monitoring of PD signals. Only the maximum coefficients extracted at each resolution level while data sliding through Kaiser's window are considered. No threshold values or PD reconstruction are required. The technique shows efficient results in de-noising, detecting and measuring PD signals using a small set of coefficients localized in time.
5. THE PROPOSED PD DETECTION AND MEASUREMENT TECHNIQUE
PD signals consist of a linear combination of signals with different characteristics. The enhancement technique should provide expansion coefficients that clearly separate those signals. Features of interest that classify PD signal should be separated from noise.
The proposed PD de-noising and measurement technique
depends on generating a windowing version of the raw data to increase the similarity between the signal under process and the selected mother wavelet function. Kaiser’s window of length Nw is selected in the windowing process, which mathematically presented as:
1w,....,1,0nfor)),0((I
}]u/)un(1[{I]n[w
N
o
5.022o
−=
−−=
αββ
(7)
where )x(Io is the modified Bessel function, u is the midpoint of the window function and 100 <<α . The advantage of selecting Kaiser’s window comes from the ability to adjust the window shape by changingα parameter [33, 34].
Figure 5 shows a pictorial representation of the proposed technique. As data slide into Kaiser’s window its center is
changed at 4c1c wtow according to the sliding rate SN . Using Mallat’s algorithm, at each window center, the set of
expansion coefficients of the windowing version of the processed data at certain resolution level can be defined as:
)k(wd j ∑ −=m
1 )k2m(h )m(wc 1j+ (8)
Figure 5. PD signal slides into Kaiser’s processing window.
Monitoring on-line the maximum coefficient detected and localized at each resolution level ( sigj )wd(Max ) can be
utilized to extract and measure PD signals embedded in excessive noisy environment.
The proposed PD de-noising and measurement technique is summarized in the following two stages: Off-line stage: A pre-processing stage to define a reference resolution level and maximum coefficient of a reference signal at the reference resolution ( fRej )wd(Max ) which will be used in PD measurement. A windowing version of a per unit reference signal (a steady-state sine function) is generated. The frequency of the reference signal is selected as f=50 MHz and sampling rate (fsam) of 2.0 GHz. The reference signal slides into Kaiser’s window of a length ( Nw ) with a data-sliding rate of SN . The parameter α is selected equal to 10. Applying wavelet multi-resolution analysis will localize the windowing version of the reference signal at the center of 5th resolution which is selected as the reference resolution (34.375 to 68.75 MHz) in this application. The maximum coefficient of the reference signal at the reference resolution ( fRej )wd(Max ) is defined and will be used in the measurement process. On-line stage: The second stage is the On-line stage. The goal
of this stage is to detect PD signals embedded in noise and measure their magnitudes. This can be achieved by monitoring the maximum coefficient at each resolution level as data slide into Kaiser's window. The resolution level that has maximum magnitude of these coefficients is selected for localizing and measuring PD signal. These coefficients ( sigj )wd(Max ) are
localized in time at the center of Kaiser's window ( cw ) since extracted from a windowing version of PD data. The magnitude variation of any PD signal ( jMag ) is measured using the
following relation: )2/m(
fRej
sigjcj 2*
)wd(Max)wd(Max
)w(Mag = (9)
} 4847648476 Reso.freq.high
Reso.Ref.
Resofreq.low
....,32,1,,0,12,.....m −−= Where, fRej )wd(Max is the absolute value of the maximum
coefficient at the reference resolution and sigj )wd(Max is the
absolute value of the maximum coefficient localized at certain resolution level and at certain center of Kaiser's window ( cw ). The factor 2/m2 is used to compensate for a constant energy as the scale changes to decompose the signal at higher or lower frequency resolutions.
5.1 WHY KAISER'S AND NOT RECTANGULAR WINDOW
Utilizing Kaiser's window shows stable coefficients that
reflect accurately the non-stationary variation in a signal magnitude and localize these variations in time and frequency domains. Most of the coefficients become small in magnitude and only a small set of coefficients has large values. The

A. M. Gaouda et al.: On-Line Detection and Measurement of Partial Discharge Signals in a Noisy Environment 1168
signal's energy leaked to other resolution is dramatically reduced. These features are investigated by monitoring a pure signal slides into Kaiser's window and a rectangular window. The sampling frequency is selected as 2.0 kHz and the data processing window size is selected as 128 samples. Daubechies (Db40) mother wavelet is utilized in this comparison. Figure 6 comparing the results of monitoring the absolute value of the maximum coefficients ( Mag
Maxj |d| ) extracted using a rectangular
window and that using the Kaiser's window ( MagMaxj |wd| ). The
comparison is applied on a simulated variable magnitude 50Hz pure signal (Figure 6a) and corrupted with high noise levels (Figure 6b). The energy of the pure 50Hz component is clearly detected and localized as expected at 5th resolution. Utilizing Kaiser's window shows that the expansion coefficients at other resolutions become very small due to increasing similarity of the mother wavelet and the processed signal. Changing α parameter in Kaiser's window can affect the coefficients leaked to adjacent resolutions.
Applying directly WMRA (using rectangular window) the
detail coefficients ( MagMax5 |d| ) can detect some variation in the
signal magnitude; however they are not able to trace these variation accurately. In the other hand, the proposed technique (using Kaiser's window) shows a stable detail coefficients ( Mag
Max5 |wd| ) that can detect accurately these variations and hence reflect their magnitudes using equation (9) for either noisy or pure signal.
0 0.1 0.2 0.3 0.4 0.5
-10
0
10
0 0.1 0.2 0.3 0.4 0.50
50
100
0 0.1 0.2 0.3 0.4 0.50
20
40
60
)t(f
0 0.1 0.2 0.3 0.4 0.5-20
0
20
0 0.1 0.2 0.3 0.4 0.50
50
100
0 0.1 0.2 0.3 0.4 0.50
20
40
60
)t(f
MagMax|d| 5
MagMax|wd| 5
MagMax|d| 5
MagMax|wd| 5
)t(f
)a( )b(
)s(
)s(
)s(
)s(
)s(
)s(
Figure 6. The variation in the maximum coefficients at the 5th resolution of a signal using rectangular window and Kaiser's window, a- pure 50Hz and b- 50Hz signal impeded in noise. 5.2 COMPARING WITH OTHER DE-NOISING
TECHNIQUES
Different off-line and on-line wavelet-based techniques were proposed for PD detection and measurement in noisy environments, some of the prominent solutions are found in [22-30].
In one approach, an off-line wavelet-based technique was applied on simulated and laboratory data and some advantages were presented over utilizing conventional filters [25]. The processed signal is decomposed into ten resolution levels,
followed by signal reconstruction in time domain at each resolution level. De-noising is performed of visual inspection of the ten reconstructed time-domain signals and identifying those that represent the PD signal.
The authors assumed that each of these resolution levels correspond to a band of non-overlapping frequencies. However, the correlation between the selected mother wavelet and the PD is not perfect and consequently part of the PD energy will be leaked to other resolutions. Furthermore, an increase in the PD magnitude or width results in dissimilarity between the selected mother wavelet and the PD and therefore more energy will be leaked to adjacent resolutions. Selecting a suitable mother wavelet and defining the number of resolutions to be considered to reconstruct the PD signal will affect the estimated PD pulse magnitude and its shape, thus, using a single mother wavelet degrades the ability to monitor the PD development activities. The approach considers an off-line monitoring utilizing various Daubechies wavelets (Db30, Db7, Db12, Db16 and Db20) in different cases in which the de-noising process is based on visual inspection. The approach does not address a procedure for the selection of an appropriate mother wavelet that suits a particular case which implies that a trial-and-error process is the dominant one.
For an on-line PD detection and measurement, an automated
selection of a dynamic threshold value for each resolution level is the most difficult part. The threshold value must have the ability to discard coefficients related to noise and store the PD ones for signal reconstruction. The main advantage of the proposed technique is its on-line ability to detect and measure PD signals embedded in noise without using threshold values.
In [23, 26] an on-line technique for PD detection and measurement in a noisy environment is proposed. A dynamic threshold is used in de-noising and PD pulse extraction. The technique proposed in this paper is compared with the automated threshold technique proposed in [23, 26] (with some modification) where the modified threshold value is:
)nlog(2*65.0 jjj ∗= σλ (10)
where jλ is the threshold value at level j, jσ is the standard
deviation of the wavelet coefficients at level j and jn is the
number of wavelet coefficients at level j. The 0.65 rescaling factor, selected by trial and error, makes equation (10) well suited for de-noising PD signal. The direct application of threshold values proposed in [23, 26] results in large values that were unable to de-noise the PD signal under process.
Figure 7 shows the results of PD detection and measurement of the proposed technique. A simulated PD signal 21 PDPD + (Figure 7a) is embedded in high noise levels n (Figure 7b) to generate the processed signal (Figure 7c) as indicated in equation (1) where the SNR is -14.54 dB. Figure 7d shows the results of extracted PD signal as proposed in this paper. The estimated PD peak and its time location (Figure 7d) are very close to the actual PD simulated signal (Figure 7a).

IEEE Transactions on Dielectrics and Electrical Insulation Vol. 15, No. 4; August 2008 1169
Figure 8 sows the absolute value of the maximum coefficients ( sigj )wd(Max ) localized at eight resolution levels
as PD data slide into Kaiser's window. The x-axis, in nanoseconds, is representing different centers of Kaiser's window ( cw ) as data slide. The resolution level (7th resolution) that has maximum magnitude of these coefficients ( sig7 )wd(Max ) is selected for measuring PD signal. The
coefficients of the 7th resolution ( MagMax7 |wd| 7.81 MHz to 15.62
MHz) are used to measure the magnitude variation of PD signal using equation (5) and as shown in Figure 7d.
0 100 200 300 400
00.020.040.06
0 100 200 300 400-0.2
0
0.2
0 100 200 300 400
-0.2
0
0.2
0 100 200 300 4000
0.02
0.04
0.06
MagSimulated PD
Signal
)(ns
7Mag Extracted PD Signal
Mag
Mag
Mag
)a(
)b(
)c(
)d(
)(ns
)(ns
)(ns
Figure 7. a- simulated PD signal, b- high noise c- the processed signal and d- extracted PD signal
0 200 4000
0.2
0.4
0 200 4000
0.2
0.4
0 200 4000
0.2
0.4
0 200 4000
0.2
0.4
0 200 4000
0.2
0.4
0 200 4000
0.2
0.4
0 200 4000
0.2
0.4
0 200 4000
0.2
0.4
MagMax|wd| 5
MagMax|wd| 6
MagMax|wd| 7
MagMax|wd| 8
MagMax|wd| 1
MagMax|wd| 2
MagMax|wd| 3
MagMax|wd| 4
)(ns)ns( Figure 8. The absolute value of the maximum coefficient localized at eight resolution levels as data slid into Kaiser's window..
De-noising by a direct application of wavelet multi-resolution analysis and threshold values in equation (10) is applied on the same signal for comparison. Figure 9a shows
eight detail coefficients ( 81 dd − ) extracted using wavelet multi-resolution analysis of the PD signal (Figure 7c). The retaining wavelet coefficients associated with PD discharge event using soft thresholding as proposed by equation (10) is shown in Figure 9b.
Using modified detail coefficients after thresholding (Figure 9b), six reconstructed PD signals are generated as shown in Figure 10. The signals are synthesis using modified detail coefficients at the 7th, 7th & 8th, 6th up to 8th, 5th up to 8th, 4th up to 8th and finally the 1st up to 8th resolutions. These results show that the PD signal can be extracted from noise however; the thresholding technique is not adequate for on-line application and suffers from the following:
0 500-0.2
0
0.2
0 200-0.2
0
0.2
0 100-0.2
0
0.2
0 50 100-0.2
0
0.2
0 50 100-0.2
0
0.2
0 50-0.2
0
0.2
0 50-0.2
0
0.2
0 50-0.2
0
0.2
0 500-0.2
0
0.2
0 200-0.2
0
0.2
0 100-0.2
0
0.2
0 50 100-0.2
0
0.2
0 50 100-0.2
0
0.2
0 50-0.2
0
0.2
0 50-0.2
0
0.2
0 50-0.2
0
0.2
1d 2d
3d 4d
5d 6d
7d 8d
1d2d
3d4d
5d 6d
7d 8d
)b()a( Figure 9. a - detail coefficients d1-d8, b- modified detail coefficients after thresholding.
0 200 400-0.02
0
0.02
0 200 400
-0.010
0.010.020.03
0 200 400
-0.010
0.010.020.03
0 200 400-0.04-0.02
00.020.04
0 200 400
-0.05
0
0.05
0 200 400
-0.10
0.10.2
85 D:D
)(ns
7D 87 D:D
86 D:D
84 D:D 81 D:D
)(ns Figure 10. reconstructing PD signal using modified detail coefficients at different resolution levels. 1. Defining a dynamic threshold value. The modified value
used in equation (10) depends on trial and error and the actual proposed threshold shows no de-noising effect.
2. Off-line analysis is required to reconstruct the PD signal using certain resolutions and defining the best resolution to be considered in reconstruction. Using all the modified coefficients (after thresholding) will not generate a PD

A. M. Gaouda et al.: On-Line Detection and Measurement of Partial Discharge Signals in a Noisy Environment 1170
noise-free signal (high SNR) as shown in Figure 10 ( 81 D:D ).
3. Comparing the results of extracting PD signal using the proposed technique (Figure 7d) and the best PD reconstructed signal using soft thresholding (Figure 10,
85 D:D ) and the original simulated PD signal (Figure 7a) shows the accuracy of the technique in terms of the PD shape, PD peak magnitude and its time location.
6. THE APPLICATION AND RESULTS The proposed technique presented in this paper is evaluated
using laboratory and simulated data. In all data cases, a PD signal of 1000 points sampled at 2.0 GHz is processed through Kaiser’s window. The magnitude of PD is measured using the maximum coefficient detected and localized at each resolution level ( sigj )wd(Max ) as data slide into Kaiser's window and
presented in equation (5). To avoid replication, actual laboratory data will be presented in this section and the simulated data will be presented and discussed in Section 7.
The proposed technique is applied on two sets of laboratory data (24 PD signals) collected using resistive voltage and inductive coupling methods as the applied voltage varied between 13.0 kV to 16.0 kV. Figure 11 shows the result of applying the proposed technique on a laboratory PD voltage signal captured using inductive method. The x-axis presents the time in nanoseconds and the y-axis presents the PD signal in volt. In Figure 11a, the laboratory PD signal is captured at an applied voltage of 13.0 kV and the conventional PD detectors reading was 5-6 pC which is the smallest value that can be detected by conventional PD detectors. The PD signal is embedded in a noise and the SNR is low. Figure 11b shows the PD extracted from noise. Figure 11c shows a PD signal captured at an applied voltage of 16.0 kV and the conventional PD detectors reading was 70-75 pC. The SNR is high and the extracted signal by the proposed technique is shown in Figure 11d.
The monitoring process traces the magnitude variation at
different resolutions by using only one coefficient as data slide into Kaiser's window. The maximum coefficient is detected at the 7th resolution (7.81 MHz to 15.62 MHz) and the PD extracted magnitude is measured as proposed in equation (9). The size of Kaiser's window ( Nw ) is 128 samples with a sliding rate of 8 samples and the mother wavelet used in this application is Db 40. The size of extracted PD signal is 110 samples estimated at different centers of Kaiser's window ( cw ) as compared with the original signal of 1000 samples.
For the laboratory PD signal captured inductively at 13.0
kV (5-6 pC), Figure 12 shows the behavior of the maximum coefficients Mag
Maxj |wd| detected at eight resolutions and
localized in time as data slide into Kaiser's window. The maximum values are detected at the 7th resolution level ( Mag
Max7 |wd| ) and are used to extract the PD signal from noise and measure its magnitude as shown in Figure 11b.
0 100 200 300 400
-5
0
5
x 10-4
0 100 200 300 400
-5
0
5
x 10-4
0 100 200 300 400-2
0
2
4
x 10-3
0 100 200 300 400-2
0
2
4
x 10-3
)(ns)c( )d(
)(ns
)(ns)a( )b(
)(ns
V
V
V
V
Actual PD Signal
Estimated PD SignalAt 13.0kV Voltage
Actual PD SignalAt 16.0kV Voltage Estimated PD Signal
Figure 11. The actual and the extracted PD signal using the proposed technique, a- actual PD voltage signal at 13.0 kV, b- the extracted PD signal at 13.0 kV. c - actual PD voltage signal at 16.0 kV, d- the extracted PD signal at 16.0 kV.
0 200 4000
0.002
0.004
0 200 4000
0.002
0.004
0 200 4000
0.002
0.004
0 200 4000
0.002
0.004
0 200 4000
0.002
0.004
0 200 4000
0.002
0.004
0 200 4000
0.002
0.004
0 200 4000
0.002
0.004
MagMax|wd| 5
MagMax|wd| 6
MagMax|wd| 7
MagMax|wd| 8
MagMax|wd| 1
MagMax|wd| 2
MagMax|wd| 3
MagMax|wd| 4
)(ns)ns( Figure 12. Maximum coefficients detected at eight resolutions and localized in time as data slid into Kaiser's window for laboratory PD signal captured at 13.0kV.
The proposed technique is applied on two sets of laboratory
data (12 cases each) collected using resistive voltage and inductive coupling methods. A comparison of the proposed technique in measuring the magnitude of PD signals and defining their time locations is shown in Figure 13. The maximum value of the laboratory PD signals and their time locations are defined to be used in comparison with the estimated values. Figures 13a to 13d show the actual "*" maximum values of PD signals and their time locations and the estimated values "o" using the proposed technique for different laboratory cases. Monitoring PD peak location work as a second support for the estimated PD peak magnitude and not a noise peak. As the SNR decreases to very small values (less than -15 dB) the variation in PD peak location will be very large. This presents an indication of measuring another peak (due to high noise content) rather than the PD peak. The increasing trend (Figure 13a and b) in monitoring the

IEEE Transactions on Dielectrics and Electrical Insulation Vol. 15, No. 4; August 2008 1171
laboratory data comes from the gradually increasing magnitude of the applied voltage (13.0 kV to 16.0 kV) and the resulted values of the PD currents (from 5-6 pC to 70-75 pC).
7. ASSESSMENT OF THE PROPOSED TECHNIQUE
The proposed technique is further evaluated using simulated data as proposed in equation (1). It is applied on 15 sets of simulated data each of 24 PD signals using Db 40. The SNR is varied between -15dB and 10dB while the PD peak magnitude is randomly varied ( V06.0V05.0 −≈ ). The PD peak location is also varied within 25± sampling points of the simulated data.
0 5 100
0.1
0.2
0 5 100
2
4
6 x 10⁻³
0 5 108
10
12
0 5 108
10
12)(ns)(ns
V V
)a( )b(
)d()c(
cases
cases
cases
cases
Actual Peak*o Estimated Peak
Resistive Voltage Method
Actual Peak*o Estimated Peak
Inductive Coupling Method
Actual Peak Time*o Estimated Peak Time
Resistive Voltage Method
Actual Peak Time*o Estimated Peak Time
Inductive Coupling Method
Figure 13. The actual (*) and estimated (o) values for a- resistive voltage cases PD peak magnitude, b- inductive coupling cases PD peak magnitude, c- resistive voltage cases peak time location and d- inductive coupling cases peak time location.
Figure 14 shows two cases where a random noise ( n ) is added to the simulated signal ( 21 PDPD + ), such that the PD signal has a signal to noise ratio (SNR) of -6.8702 dB and -9.9317 dB. In both cases the proposed technique extracted the signals with features similar to the original (noise free) signal.
The signal to noise ratio (SNR) in dB of the processed PD signal is measured using the following relation:
[ ]∑
∑
=
=
−
= N
1i
2
N
1i
2
10
)i(Y)i(X
)i(Ylog*10)dB(SNR (11)
where, PD)i(X = is the simulated PD signal embedded in noise as indicated in equation (1), and 21 PDPD)i(Y += is the simulated PD noise-free signal (equation (2)).
The percentage error of the PD peak magnitude ( %PKΔ ) and PD peak time location ( %tΔ ) are used to assess the effectiveness of the proposed technique. The percentage variation in the PD peak is defined as:
100PK
PKPK%PK2
12 ×−
=Δ (12)
where, 1PK is the peak amplitude of the de-noised PD signal ( 7Mag ), and 2PK is the peak amplitude of the simulated reference pulse ( 21 PDPD + ). Positive values of %PKΔ indicate reduction in magnitude of the estimated PD signal as compared with the reference signal and negative values indicate an increase of the estimated peak.
The percentage variation in the PD peak time location is defined as:
100t
tt%t2PK
1PK2PK ×−
=Δ (13)
where, 1PKt is the peak amplitude time location of the de-noised PD signal ( 7Mag ) and 2PKt is the peak amplitude time location of the simulated reference pulse ( 21 PDPD + ). Negative values of %tΔ indicate delay in the estimated PD time location.
0 200 400-0.01
0
0.01
0.02
0.03
0.04
0.05
0 200 400-0.1
-0.05
0
0.05
0.1
0 200 400-0.1
-0.05
0
0.05
0.1
0 200 400-0.01
0
0.01
0.02
0.03
0.04
0.05
)(ns)(ns)(ns)(ns
21 PDPD + PDn
SNR = - 6.8702 dB
7Mag
)a(
ExtractedPD Signal
0 200 400-0.01
0
0.01
0.02
0.03
0.04
0.05
0.06
0.07
0 200 400
-0.1
-0.05
0
0.05
0.1
0.15
0 200 400
-0.1
-0.05
0
0.05
0.1
0.15
0 200 400-0.01
0
0.01
0.02
0.03
0.04
0.05
0.06
0.07
21 PDPD + PDn
SNR = - 9.9317 dB)b(
7Mag
ExtractedPD Signal
)(ns)(ns)(ns)(ns
Figure 14. Simulated PD signals and the extracted noise free signal at a – SNR of -6.8702 dB and b- SNR of -9.9317 dB .
Figure 15 shows the percentage error of the PD peak magnitude ( %PKΔ ) and the PD peak time location ( %tΔ ) as a result of applying the technique on the simulated data sets using Db 40. The x-axis represents the SNR varied between -15 dB and +10 dB. The percentage error in PD magnitude is concentrated on 22% for high values of SNR. As the SNR becomes less, %PKΔ varies between 0% and 40% (Figure 15a). The small values in %PKΔ at low SNR are results of the high noise that may increase the PK of the extracted signal, however this result will be either supported or undermined by monitoring %tΔ . The percentage error in the PD peak location is concentrated on -7%. The negative values are due to time delay in the estimated results. As the SNR becomes less, %tΔ varies between 0% and -25% (Figure 15b). At SNR less than -

A. M. Gaouda et al.: On-Line Detection and Measurement of Partial Discharge Signals in a Noisy Environment 1172
10dB, both %PKΔ and %tΔ should be used to assure the estimated results.
The proposed technique is applied using other compactly
supported mother wavelets. Daubechies 4 (Db4), Coiflets 5 (Coif5) and Biorthogonal 6.8 (Bior6.8) are used to extract the PD signals embedded in high noise. Applying wavelet multi-resolution analysis on the windowing version of the reference signal results in the maximum coefficient at the reference resolution ( fRej )wd(Max ) for each mother wavelet (3.1328,
3.5259 and 3.2443 simultaneously) that will be used in the PD measurement as indicated in equation (9).
-15 -10 -5 0 5 10-20
0
20
40
-15 -10 -5 0 5 10
-20
-10
0
)a(
)b(
)dB(SNR
)dB(SNR
%PKΔ
%tΔ
Figure 15. Percentage error using Db40 in a- PD peak magnitude, b- PD peak time location.
The percentage error in the PD peak magnitude ( %PKΔ ) and the PD peak time location ( %tΔ ) resulted from applying the proposed technique on the simulated data sets using Db4 (8 filter coefficients) is shown in Figure 16. The x-axis represents the SNR varied between -15 and +10 dB. Using Db4 the percentage error in the PD peak magnitude ( %PKΔ ) is centered on 58% and varied between 40% and 70% as SNR decreases to less than -15 dB. The percentage variation in the PD peak time location ( %tΔ ) is centered on +2% forward and varied between -5% and +5% as SNR decreases to less than -10 dB. The small variation in %tΔ comes from the short filter length of Db4.
-15 -10 -5 0 5 1040
50
60
70
-15 -10 -5 0 5 10-5
0
5
%PKΔ
%tΔ
4Db
4Db
)dB(SNR
)dB(SNR
Figure 16. Percentage error using Db4 in a- PD peak magnitude, b- PD peak time location. The percentage error in the PD peak magnitude ( %PKΔ ) and the PD peak time location ( %tΔ ) resulted from applying the
proposed using Coif5 (30 filter coefficients) is shown in Figure 17. The percentage %PKΔ is centered on 63% and varied between 50% and 70% as SNR decreases to less than -10 dB. The percentage variation in %tΔ is centered on -2.5% delay and varied between -7% and +5% as SNR decreases to less than -10 dB.
-15 -10 -5 0 5 10 15 2050
60
70
80
-15 -10 -5 0 5 10 15 20-10
-5
0
5
%PKΔ
%tΔ
5Coif
)dB(SNR
)dB(SNR
5Coif
Figure 17. Percentage error using Coif5 in a- PD peak magnitude, b- PD peak time location.
-15 -10 -5 0 5 10 15 2020
40
60
80
-15 -10 -5 0 5 10 15 20-20
-10
0
10
%PKΔ
%tΔ
8.6Bior
)dB(SNR
)dB(SNR
8.6Bior
Figure 18. Percentage error using Bior6.8 in a- PD peak magnitude, b- PD peak time location.
The percentage errors %PKΔ and %tΔ resulted from applying the proposed technique using Bior6.8 (18 filter coefficients) is shown in Figure 18. The %PKΔ is centered on 48% and varied between 25% and 65% as SNR decreases to less than -10 dB. The percentage variation in %tΔ is centered on - 3% delay and varied between -20% and +1% as SNR decreases to less than -10 dB.
This technique shows high potential for on-line on-site
monitoring and testing. Selecting Db 40 as a mother wavelet and using Kaiser's window while processing data gave good results in PD extraction and measurements. The data sliding rate is very important for monitoring PD shape development. A tradeoff between the selected sliding rate and accuracy of the estimated PD shape should be considered. As the sliding rate increases fast processing is achieved and more data can be processed on-line, however part of the PD shape features will be lost. In this application a data sliding rate of 128 samples slide into a data window of 1000 samples was considered and gave good results up to -10 db SNR.

IEEE Transactions on Dielectrics and Electrical Insulation Vol. 15, No. 4; August 2008 1173
8. CONCLUSION This paper proposed a wavelet-based technique for
monitoring PD signals embedded in high noise levels. Kaiser's window is used to increase the similarity between the processed signal and the selected mother wavelet. The technique is novel in the sense that only the maximum coefficients extracted at each resolution level are used to separate the PD signal from noise and measures its magnitude. Additionally, no thresholding or signal reconstruction using the thresholded coefficients is required. The extracted data-size of the PD signal is very small compared to the actual signal. The proposed technique has been applied to a simulated and laboratory data. The results show a potential tool can be utilized for on-line and on-site testing and monitoring applications.
REFERENCES [1] B. H. Ward, "A Survey of New Techniques in Insulation Monitoring of
Power Transformers", IEEE Electr. Insul. Mag., Vol. 17, No. 3, pp. 16-23, 2001.
[2] M.S. Mashikian, F. Palmieri, R. Bansal, and R.B. Northrop, “Location of partial discharges in shielded cables in the presence of high noise,” IEEE Trans. Electr. Insul., Vol. 27, pp. 437-439, 1992.
[3] R. Bartnikas and K.D. Srivastava, Power and Communication Cables, IEEE Press, J. Wiley and Sons, New York, 2003.
[4] R. Morin, R. Bartnikas, G. Lessard, “In-service location of partial discharge sites in polymeric distribution cables using capacitive and inductive probes”, IEEE Transmission and Distribution Conference, New Orleans, USA, pp. 120-127, 1999.
[5] M. Kurtz and J.F. Lyles, “Generator insulation diagnostic testing,” IEEE Transactions on Power Apparatus and Systems, Vol. 98, pp. 1596-1603, 1979.
[6] B. Fruth and D. Gross, “PD generation, transmission and acquisition”, Proc. IEE Sci. Meas. Tech., Vol. 142, pp. 22-28, 1995.
[7] P. Grunewald and J. Weidner, “Possibilities and experience with off- and on-line diagnosis of turbine generator stator winding insulations”, Proc, CIGRE, Paris, France, paper 11-206, 1994.
[8] M. Henriksen, G.C. Stone, and M. Kurtz, “Propagation of PD and noise pulses in turbine generators”, IEEE Trans. Energy Conversion, Vol. 1, pp. 161-166, 1986.
[9] J. Fuhr, M. Haessig, P. Boss, D. Tschudi and R.A. King, “Detection and location of internal defects in the insulation of power transformers”, IEEE Trans. Electr. Insul., Vol. 28, pp. 1057-1067, 1993.
[10] H. Haessig, R. Brumlich, J. Fuhr, and T. Aschwanden, “Assessment of insulation condition of large power transformer by on-site electrical diagnostic methods”, IEEE Intern. Sympos. Electr. Insul. (ISEI), Anaheim, USA, pp. 368-372, 2000.
[11] A.A. Mazroua, M.M.A. Salama and R. Bartnikas, “PD pattern recognition with neural networks using the multilayer perceptron technique”, IEEE Trans. Electr. Insul., Vol. 28, pp. 1082-1089, 1993.
[12] A.A. Mazroua, R. Bartnikas and M.M.A. Salama, “Neural network system using the multi-layer perceptron technique for the recognition of PD pulse shapes due to cavities and electrical trees”, IEEE Trans. Power Delivery, Vol. 10, pp. 92-96, 1995.
[13] M.M.A. Salama and R. Bartnikas, “Fuzzy logic applied to PD pattern classification,” IEEE Trans. Dielectr. Electr. Insul., Vol. 7, pp. 118-123, 2000.
[14] M.M.A. Salama and R. Bartnikas, “Determination of neural network topology for pulse pattern recognition”, IEEE Trans. Neural Networks, Vol. 13, pp. 446-556, 2002.
[15] T.K. Abdel-Galil, Y.G. Hegazy, M.M.A. Salama and R. Bartnikas, “Fast match-based vector quantization partial discharge pulse pattern recognition”, IEEE Trans. Instrumentation and Measurement, Vol. 54, pp. 3-9, 2005.
[16] T.K. Abdel-Galil, R.M. Sharkawy, M. M.A.Salama and R. Bartnikas, “Partial discharge pulse pattern recognition using an inductive inference algorithm”, IEEE Trans. Dielectr. Electr. Insul., Vol. 12, pp. 320-327, 2005.
[17] T.K. Abdel-Galil, Y.G. Hegazy, M.M.A. Salama and R. Bartnikas, “Partial discharge pulse pattern recognition using Hidden Markov Models”, IEEE Trans. Dielectr. Electr. Insul., Vol. 11, pp. 715-723, 2004.
[18] T.K. Abdel-Galil, R.M. Sharkawy, M.M.A. Salama and R. Bartnikas, “Partial discharge pattern classification using the fuzzy decision tree approach”, IEEE Trans. Instrumentation and Measurement, Vol. 54, pp. 2258-2263, 2006.
[19] R. Bartnikas and J.P. Novak, “Effect of overvoltage on the risetime and amplitude of PD pulses”, IEEE Trans. Dielectr. Electr. Insul., Vol. 2, pp. 557-566, 1995.
[20] I. Radu, R. Bartnikas and M.R. Wertheimer, “Frequency and voltage dependence of glow and pseudoglow discharges in helium under atmospheric pressure”, IEEE Trans. Plasma Science, Vol. 31, pp. 1363-1378, 2003.
[21] R. Bartnikas, I. Radu, and M.R. Wertheimer, “Dielectric electrode surface effect on atmospheric pseudoglow discharges in helium”, IEEE Trans. Plasma Sci. to be published.
[22] S. Sriram, S. Nitin, K. M. M. Prabhu and M. J. Bastiaans, "Signal Denoising Techniques for Partial Discharge Measurements", IEEE Trans. Dielectr. Electr. Insul. Vol. 12, pp. 1182-1191, 2005
[23] X. Ma, C. Zhou, and I.J. Kemp, "Automated Wavelet Selection and Thresholding for PD Detection", IEEE Electr. Insul. Mag., Vol. 18, No. 2, pp. 37-45, 2002.
[24] H. Zhang, T.R. Blackburn, B.T. Phung and D. Sen, "A Novel Wavelet Transform Technique for On-line Partial Discharge Measurements Part 1: WT De-noising Algorithm", IEEE Trans. Dielectr. Electr. Insul. Vol. 14, pp. 3-14, 2007.
[25] L. Satish and B. Nazneen, "Wavelet-based Denoising of Partial Discharge Signals Buried in Excessive Noise and Interference", IEEE Trans. Dielectr. Electr. Insul, Vol. 10, pp. 354 – 367, 2003.
[26] X. Ma, C. Zhou and I. J. Kemp, "Interpretation of Wavelet Analysis and its Application in Partial Discharge Detection", IEEE Trans. Dielectr. Electr. Insul. Vol. 9, pp. 446-457, 2002.
[27] Y. Tian, P. L. Lewin, A. E. Davies, S. G. Swing- ler, S. J. Sutton and G. M. Hathawav, " Companion of On-Line Partial Discharge Detection Methods for HV Cable Joints", IEEE Trans. Dielectr. Electr. Insul., Vol. 9, pp. 604-615, 2002.
[28] M. Kawada, A. Tungkanawanich, Z.-I. Kawasaki and K. Matsu-ura, "Detection of Wide-band E-M Signals Emitted from Partial Discharge Occurring in GIS", IEEE Trans. Power Delivery, Vol. 15, pp. 467-471, 2000.
[29] C. S. Chang, J. Jin, C. Chang, T. Hoshino, M. Hanai, and N. Kobayashi, "Separation of Corona Using Wavelet Packet Transform and Neural Network", IEEE Trans. Power Delivery, Vol. 20, pp. 1363-1369, 2005.
[30] X. Zhou, C. Zhou and I. J. Kemp, "An Improved Methodology for Application of Wavelet Transform to Partial Discharge Measurement Denoising", IEEE Trans. Dielectr. Electr. Insul. Vol. 12, pp. 586-594, 2005.
[31] V. Perrier, T. Philipovitch, and C. Basdevant, “Wavelet spectra compared to Fourier spectra,” J. Mathematical Phys., Vol. 36, pp. 1506-1519, 1995.
[32] C. S. Burrus, R. A. Gopinath and H. Guo, Introduction to Wavelets and Wavelet Transform, Prentice Hall, New Jersey, 1997.
[33] S. K. Mitra and J. F. Kaiser, Handbook for Digital Signal Processing, John Wiley & Sons, 1993.
[34] C. S. Burrus, J. H. McClellan, A.V. Oppenheim, T.W. Parks, R.W. Schafer and H.W. Schuessler, Computer-Based Exercises for Signal Processing using Matlab, Matlab Curriculum Series, Prentice hall, 1994.