Classification of EEG signals using relative wavelet energy and artificial neural networks
7
Classification of EEG Signals Using Relative Wavelet Energy and Artificial Neural Networks Ling Guo ∗ Department of Information Technologies and Communications University of A Coruña, A Coruña, 15071, Spain [email protected] Daniel Rivero Department of Information Technologies and Communications University of A Coruña, A Coruña, 15071, Spain [email protected] Jose A.Seoane Department of Information Technologies and Communications University of A Coruña, A Coruña, 15071, Spain [email protected] Alejandro Pazos Department of Information Technologies and Communications University of A Coruña, A Coruña, 15071, Spain [email protected] ABSTRACT Electroencephalographms (EEGs) are records of brain elec- trical activity. It is an indispensable tool for diagnosing neu- rological diseases, such as epilepsy. Wavelet transform (WT) is an effective tool for analysis of non-stationary signal, such as EEGs. Relative wavelet energy (RWE) provides informa- tion about the relative energy associated with different fre- quency bands present in EEG signals and their correspond- ing degree of importance. This paper deals with a novel method of analysis of EEG signals using relative wavelet energy, and classification using Artificial Neural Networks (ANNs). The obtained classification accuracy confirms that the proposed scheme has potential in classifying EEG sig- nals. Categories and Subject Descriptors I.5.2 [Pattern Recognition]: Design Methodology—clas- sifier design and evaluation, feature evaluation and selection, pattern analysis ; I.5.4 [Pattern Recognition]: Applica- tions—signal processing, waveform analysis ; I.5.1 [Pattern Recognition]: Models—neural nets ; I.2.6 [Artificial In- telligence]: Learning—knowledge acquisition ∗ Corresponding author. Department of Information Tech- nologies and Communications, Campus de Elvi˜ na, Uni- versity of A Coru˜ na, A Coru˜ na, 15071, Spain. Email: [email protected]; tel.: +34-981-167000 ext 1302; fax: +34-981- 167160. Permission to make digital or hard copies of all or part of this work for personal or classroom use is granted without fee provided that copies are not made or distributed for profit or commercial advantage and that copies bear this notice and the full citation on the first page. To copy otherwise, to republish, to post on servers or to redistribute to lists, requires prior specific permission and/or a fee. GEC’09, June 12–14, 2009, Shanghai, China. Copyright 2009 ACM 978-1-60558-326-6/09/06 ...$5.00. General Terms Performance Keywords EEG, Discrete wavelet transform (DWT), Relative wavelet energy (RWE), Artificial Neural Networks (ANNs) 1. INTRODUCTION The human brain is a complicated system, and exhibits rich spatiotemporal dynamics. Among amounts of tech- niques probing brain activity, electroencephalograhy (EEG) is one of the most important tools.It is especially useful in diagnosis of neurological diseases [8, 12]. Normally, tons of data are generated by EEG monitoring systems and visual analysis of those data are almost impossible. Computers have been used to solve this problem for a long time and thus, automatic systems to discern electroencephalographic changes have been under study for several years. Temporary electrical disturbance of the brain causes epilep- tic seizures. Sometimes seizures may go unnoticed, depend- ing on their presentation, and sometimes may be confused with other events, such as a stroke, which can also cause falls or migraines. Approximately one in every 100 persons will experience a seizure at some time in their life. Until now, the occurrence of an epileptic seizure is unpredictable and its course of action is little understood. More work is needed for better understanding of the mechanisms causing epilep- tic disorders. Analysis of the electroencephalograph (EEG) records provides valuable insight into this widespread brain disorder. The detection of epileptiform discharges occurring in the EEG is an important component in the diagnosis of epilepsy [14]. In this work, the EEG signals were analyzed with wavelet transform, and then, an ANN-based system was implemented to classify the EEG signals to one of the categories: nor- mal or epileptic. Considerable classification accuracy was achieved. To the knowledge of the authors, there is no other 177
Transcript of Classification of EEG signals using relative wavelet energy and artificial neural networks

Classification of EEG Signals Using Relative WaveletEnergy and Artificial Neural Networks
Ling Guo∗
Department of InformationTechnologies andCommunications
University of A Coruña, ACoruña, 15071, Spain
Daniel RiveroDepartment of Information
Technologies andCommunications
University of A Coruña, ACoruña, 15071, Spain
[email protected] A.Seoane
Department of InformationTechnologies andCommunications
University of A Coruña, ACoruña, 15071, [email protected]
Alejandro PazosDepartment of Information
Technologies andCommunications
University of A Coruña, ACoruña, 15071, [email protected]
ABSTRACTElectroencephalographms (EEGs) are records of brain elec-trical activity. It is an indispensable tool for diagnosing neu-rological diseases, such as epilepsy. Wavelet transform (WT)is an effective tool for analysis of non-stationary signal, suchas EEGs. Relative wavelet energy (RWE) provides informa-tion about the relative energy associated with different fre-quency bands present in EEG signals and their correspond-ing degree of importance. This paper deals with a novelmethod of analysis of EEG signals using relative waveletenergy, and classification using Artificial Neural Networks(ANNs). The obtained classification accuracy confirms thatthe proposed scheme has potential in classifying EEG sig-nals.
Categories and Subject DescriptorsI.5.2 [Pattern Recognition]: Design Methodology—clas-sifier design and evaluation, feature evaluation and selection,pattern analysis; I.5.4 [Pattern Recognition]: Applica-tions—signal processing, waveform analysis; I.5.1 [PatternRecognition]: Models—neural nets; I.2.6 [Artificial In-telligence]: Learning—knowledge acquisition
∗Corresponding author. Department of Information Tech-nologies and Communications, Campus de Elvina, Uni-versity of A Coruna, A Coruna, 15071, Spain. Email:[email protected]; tel.: +34-981-167000 ext 1302; fax: +34-981-167160.
Permission to make digital or hard copies of all or part of this work forpersonal or classroom use is granted without fee provided that copies arenot made or distributed for profit or commercial advantage and that copiesbear this notice and the full citation on the first page. To copy otherwise, torepublish, to post on servers or to redistribute to lists, requires prior specificpermission and/or a fee.GEC’09, June 12–14, 2009, Shanghai, China.Copyright 2009 ACM 978-1-60558-326-6/09/06 ...$5.00.
General TermsPerformance
KeywordsEEG, Discrete wavelet transform (DWT), Relative waveletenergy (RWE), Artificial Neural Networks (ANNs)
1. INTRODUCTIONThe human brain is a complicated system, and exhibits
rich spatiotemporal dynamics. Among amounts of tech-niques probing brain activity, electroencephalograhy (EEG)is one of the most important tools.It is especially useful indiagnosis of neurological diseases [8, 12]. Normally, tons ofdata are generated by EEG monitoring systems and visualanalysis of those data are almost impossible. Computershave been used to solve this problem for a long time andthus, automatic systems to discern electroencephalographicchanges have been under study for several years.
Temporary electrical disturbance of the brain causes epilep-tic seizures. Sometimes seizures may go unnoticed, depend-ing on their presentation, and sometimes may be confusedwith other events, such as a stroke, which can also cause fallsor migraines. Approximately one in every 100 persons willexperience a seizure at some time in their life. Until now,the occurrence of an epileptic seizure is unpredictable andits course of action is little understood. More work is neededfor better understanding of the mechanisms causing epilep-tic disorders. Analysis of the electroencephalograph (EEG)records provides valuable insight into this widespread braindisorder. The detection of epileptiform discharges occurringin the EEG is an important component in the diagnosis ofepilepsy [14].
In this work, the EEG signals were analyzed with wavelettransform, and then, an ANN-based system was implementedto classify the EEG signals to one of the categories: nor-mal or epileptic. Considerable classification accuracy wasachieved. To the knowledge of the authors, there is no other
177

work in the literature related to use relative wavelet energyas features to ANN for classification EEG signals.
2. DESCRIPTION OF THE PROBLEMIn this paper, the data detail described by Andrzejak et
al. [2]was used. The complete dataset consists of five sub-datasets (denoted as Z, O, N , F and S), each containing 100single-channel EEG segments of 23.6 s duration, with sam-pling rate of 173.6 Hz. These segments were selected and cutout from continuous multi-channel EEG recordings after vi-sual inspection for artifacts, e.g., due to muscle activity oreye movements. Sets Z and O consisted of segments takenfrom surface EEG recordings that were carried out on fivehealthy volunteers using a standardized electrode placementscheme. Volunteers were relaxed in an awake state with eyesopen (Z) and eyes closed (O), respectively. Sets N , F andS originated from an EEG archive of presurgical diagnosis.Segments in set F were recorded from within the epilepto-genic zone, and those in set N from the hippocampal forma-tion of the opposite hemisphere of the brain. While sets Nand F contained only activity measured during seizure freeintervals, set S only contained seizure activity. Here, seg-ments were selected from all recording sites exhibiting ictalactivity.
The purpose of this work is to do classification betweennormal and epileptic seizure activity. For that reason, seg-ments chosen for classification are segment Z (healthy vol-unteer with eyes open) and segment S (epileptic patient inseizure activity).
3. STATE OF THE ART
3.1 EEG signal classificationNumerous approaches derived from the theory of signal
analysis have been used to obtain representations and ex-tract the features of interest for classification purposes.Artificialneural networks (ANNs) have been widely applied to EEGsignals analysis. ANN-based detection systems have beenproposed by many researchers. A number of promising quan-titative features derived from the EEG, each with differenttheoretical bases, have demonstrated utility for EEG signalclassification. Some work showed that an ANN performsbetter, if the input and output data are processed to cap-ture the characteristic features of the signal [10]. They useda wavelet representation for automated detection of the EEGspikes.
Recently, ANNs that apply Bayesian methods are shownto be more robust compared with other techniques becausethey incorporate measures of confidence in their output forthe Levenberg-Marquardt (LM) procedure [21]. In addi-tion, standard MLP was improved by using finite impulseresponse filters (FIR) instead of static weights for a tempo-ral processing of data [7]. Other work [19] presented a time-frequency based method for detecting of epileptic seizure.
Other researches classified EEG signals with wavelet trans-form and a dynamic fuzzy neural network or dynamic waveletnetwork [15, 16]. The author decomposed the EEG signalswith wavelet transform and applied selected wavelet coef-ficients as inputs to a dynamic fuzzy neural network anddynamic wavelet network, but obtained low performanceson classification accuracy.
Except using ANNs as classifiers, other types of classifierswere also tried by some work, such as multiclass supportvector machines (SVMs) [6].The author applied the featuresextracted from wavelet coefficients and Lyapunov exponentsand did classification with multiclass support vector ma-chines. However, ANN is the most used tool to performEEG signals classification.
3.2 Artificial Neural NetworksAn ANN is an information-processing system that is based
on the simulation the human cognition process. ANNs con-sist of many computational neural units connected to eachother. In ANN, knowledge about the problem is distributedin neurons and connections weights of links between neu-rons. The neural network has to be trained to adjust theconnection weights and biases in order to produce the de-sired mapping.
ANNs are particularly useful for complex pattern recogni-tion and classification tasks. The capability of learning fromexamples, the ability to reproduce arbitrary non-linear func-tions of input, and the highly parallel and regular structureof ANNs make them especially suitable for pattern classifi-cation problems [3, 18]. ANNs are widely used in biomedicalfield for modeling, data analysis, and diagnostic classifica-tion.
The most commonly used training algorithm is the back-propagation (BP) algorithm [9] with gradient descent, whichis used in this work also.This algorithm is based on the ad-justment of the weights of the connections of the networkto minimize error. Error is calculated by comparing obtain-ing outputs with expected outputs of known inputs. Thiserror is then backward propagated until the first layer andthe weights are then adjusted. This process occurs over andover as the weights are continually wteaked. The set of datawhich enables the training is called ”training set”. Duringthe training of a network, the same set of data is processedmany times until reaching an acceptable error, or reachingthe maximum number of iterations.
4. WAVELET TRANSFORM (WT)
4.1 Introduction to Wavelet TransformWavelet Transform (WT) is an effective method of time-
frequency representation of a signal. The attractive featureof WT is that it provides accurate frequency informationat low frequencies and accurate time information at highfrequencies. This property is important in biomedical ap-plications, because most signals in this field always containhigh frequency components with short time duration andlow frequency components with long time duration. Ab-normalities in the EEG in serious psychiatric disorders aremany times too subtle to be detected using conventionaltechniques, such as Fourier transform (FT). WT is specificappropriate for analysis of non-stationary signals.It is wellsuited for locating transient events, which always occur dur-ing epileptic seizure. Wavelet’s feature extraction and repre-sentation properties can be used to analyze various transientevents in biological signals. The WT makes use of multires-olution signal analysis technique to decompose EEG signalsinto a number of frequency bands.Through wavelet decom-position, transient features are precisely captured and lo-calized in both time and frequency context. Because of itsextraordinary characteristics, WT has been commonly con-
178
sidered as one of the most powerful tools to EEG signalsanalysis.
The wavelet analysis relies on the introduction of an ap-propriate basis function and the characterization of signal isreflected through the distribution of amplitude in the basisfunction. If a proper orthogonal basis function is selected, ithas the advantage that a signal can be uniquely decomposedand the decomposition can be inverted [5, 20, 11].
The wavelet is a smooth and quickly vanishing oscillatingfunction with good localization in both frequency and time.A wavelet family Ψa,b is the set of elementary functions gen-erated by dilations and translations of a unique admissiblemother wavelet Ψ(t):
Ψa,b(t) = |a|− 12 Ψ(
t− b
a) (1)
where a, b ∈ �, a �= 0 are the scale and translation param-eters, respectively, and t is the time. As a increases, thewavelet becomes narrower. Thus, there is a unique analyticpattern and its replications at different scales and with vari-able time localization.
The continuous wavelet transform (CWT) of a signal S(t)is defined as the correlation between the S(t) with the familywavelet Ψa,b as follows:
Wa,b = |a|− 12
∫ ∞
−∞S(t)Ψ∗(
t− b
a)dt = 〈S,Ψa,b〉 (2)
For special selection of the mother wavelet function Ψ(t) andthe discrete set of parameters, aj = 2j and bj,k = 2jk , withj, k ∈ Z, the family
Ψj,k(t) = 2−j/2Ψ(2−jt− k) j, k ∈ Z (3)
constitutes an orthonormal basis of square integrable spaceL2(�).
The correlated decimated Discrete Wavelet Transform (DWT)provides a non-redundant representation of the signal and itsvalues constitute the coefficients in a wavelet series. Thesewavelet coefficients provide full information in a simple wayand a direct estimation of local energies at the differentscales. Moreover, the information can be organized in ahierarchical scheme of nested subspaces called multiresolu-tion analysis in L2(�). In multiresolution analysis, L2(�) isdecomposed into sum of the subspaces Wj , j from −∞ to∞ [1].
L2(�) = ···W−3⊕W−2⊕W−1⊕W0⊕W1⊕W2⊕W3⊕··· (4)
If the closed subspaces Vj are defined as
Vj = Wj+1 ⊕Wj+2 ⊕Wj+3 ⊕ · · · for all j ∈ Z (5)
where ⊕ represents direct sum, then the subspaces are amulti-resolution approximation of the square integrable spaceL2(�).The subspaces Wj are the orthogonal complementaryof the subspaces Vj :
Vj−1 = Vj ⊕Wj for allj ∈ Z (6)
Finally, the multiresolution decomposition of the originalsignal S(t) with DWT is obtained as shown on Eqn. (7):
S(t) =∞∑
k=−∞ckφ(t− k) +
∞∑j=−∞
∞∑k=−∞
dj,kΨ(2jt− k) (7)
where φ(·) is the scaling function, ψ(t) is a set of waveletfunction, dj,k are the wavelet coefficients, and Ck are the
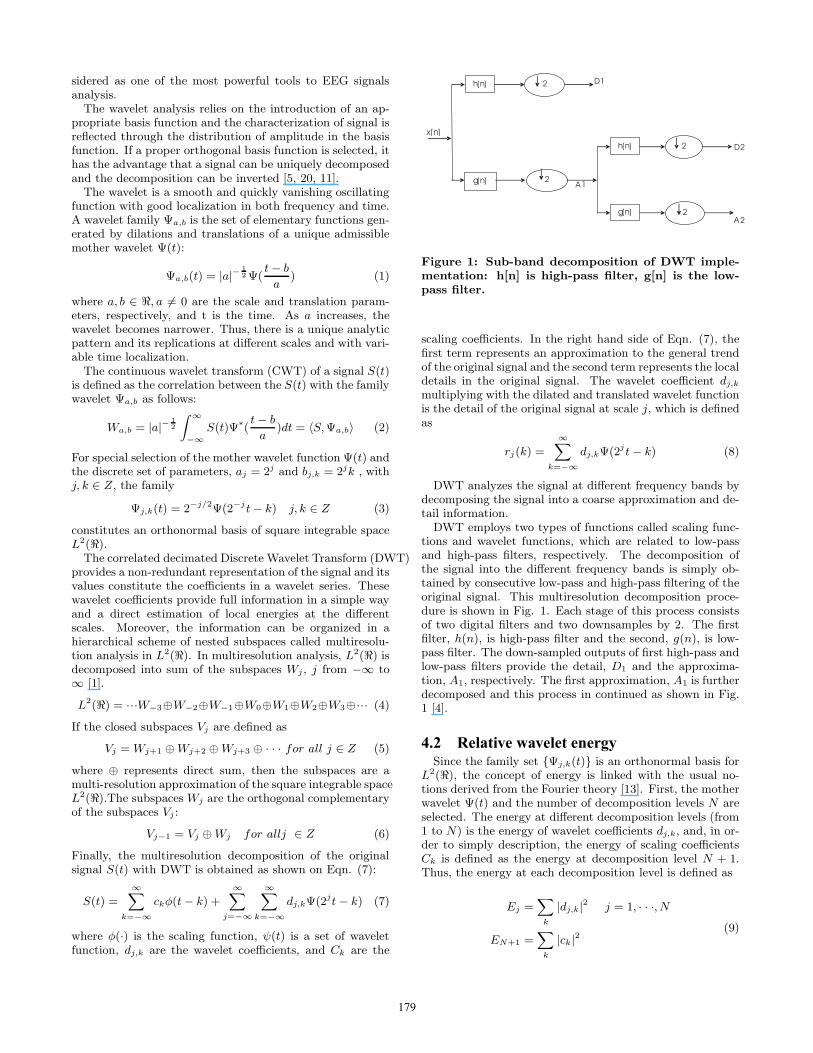
Figure 1: Sub-band decomposition of DWT imple-mentation: h[n] is high-pass filter, g[n] is the low-pass filter.
scaling coefficients. In the right hand side of Eqn. (7), thefirst term represents an approximation to the general trendof the original signal and the second term represents the localdetails in the original signal. The wavelet coefficient dj,k
multiplying with the dilated and translated wavelet functionis the detail of the original signal at scale j, which is definedas
rj(k) =
∞∑k=−∞
dj,kΨ(2jt− k) (8)
DWT analyzes the signal at different frequency bands bydecomposing the signal into a coarse approximation and de-tail information.
DWT employs two types of functions called scaling func-tions and wavelet functions, which are related to low-passand high-pass filters, respectively. The decomposition ofthe signal into the different frequency bands is simply ob-tained by consecutive low-pass and high-pass filtering of theoriginal signal. This multiresolution decomposition proce-dure is shown in Fig. 1. Each stage of this process consistsof two digital filters and two downsamples by 2. The firstfilter, h(n), is high-pass filter and the second, g(n), is low-pass filter. The down-sampled outputs of first high-pass andlow-pass filters provide the detail, D1 and the approxima-tion, A1, respectively. The first approximation, A1 is furtherdecomposed and this process in continued as shown in Fig.1 [4].
4.2 Relative wavelet energySince the family set {Ψj,k(t)} is an orthonormal basis for
L2(�), the concept of energy is linked with the usual no-tions derived from the Fourier theory [13]. First, the motherwavelet Ψ(t) and the number of decomposition levels N areselected. The energy at different decomposition levels (from1 to N) is the energy of wavelet coefficients dj,k, and, in or-der to simply description, the energy of scaling coefficientsCk is defined as the energy at decomposition level N + 1.Thus, the energy at each decomposition level is defined as
Ej =∑
k
|dj,k|2 j = 1, · · ·, N
EN+1 =∑
k
|ck|2(9)
179

0 5 10 15 20 25-100
0
100
EE
Gsig
na
l
0 5 10 15 20 25-500
0
500
A5
0 5 10 15 20 25-200
0
200
D5
0 5 10 15 20 25-200
0
200
D4
0 5 10 15 20 25-200
0
200
D3
0 5 10 15 20 25-50
0
50
D2
0 5 10 15 20 25-20
0
20
Time (second)
D1
Figure 2: Approximation and details of one exampleof a normal EEG signal.
Then, the total energy of the signal after wavelet decompo-sition is obtained by
Etotal =
N+1∑j=1
Ej (10)
Thus, the relative wavelet energy (RWE) is defined as,
ρj =Ej
Etotalj = 1, · · ·, N + 1 (11)
Clearly,∑
j ρj = 1 and the distribution {ρj} can be consid-ered as a time-scale density. This provides information tocharacterize signal energy distribution at different frequencybands.
5. METHOD DESCRIPTION
5.1 EEG signals analysis with discrete wavelettransform
The object of wavelet analysis is to decompose signals intoseveral frequency bands. Selection of appropriate waveletand the number of decomposition levels are very importantfor the analysis of signals using DWT. The number of decom-position levels is chosen based on the dominant frequencycomponents of the signal. The levels are chosen such thatthose parts of the signal that correlate well with the frequen-cies necessary for classification of the signal are retained inthe wavelet coefficients. Since the EEGs have little usefulinformation above frequency 30 Hz, in this work the numberof decomposition levels was chosen to be 5. Usually, testsare performed with different types of wavelets and the onewhich give maximum efficiency is selected for the particu-lar application. In this work, Daubechies wavelet of order 4(db4) is selected because its smoothing feature was suitablefor detecting changes of the EEG signals, as shown in otherworks [17].
Frequency bands corresponding to five decomposition lev-els for wavelet db4 with sampling frequency of 173.6 Hz ofEEG signals were listed in Table 1. The signals were decom-posed into details D1-D5 and one final approximation A5.In order to simplify, the final approximation A5 was defined
0 5 10 15 20 25-1000
0
1000
EE
Gsig
na
l
0 5 10 15 20 25-1000
0
1000
A5
0 5 10 15 20 25-1000
0
1000
D5
0 5 10 15 20 25-2000
0
2000
D4
0 5 10 15 20 25-1000
0
1000
D3
0 5 10 15 20 25-500
0
500
D2
0 5 10 15 20 25-500
0
500
Time (second)
D1
Figure 3: Approximation and details of one exampleof an epileptic EEG signal.
Table 1: Frequency Bands Corresponding to Differ-ent Decomposition Levels for Wavelet db4 with aSampling Frequency of 173.6 Hz
Decomposedsignals
Frequency bands(Hz)
Decompositionlevel
D1 43.4-86.8 1D2 21.7-43.4 2D3 10.8-21.7 3D4 5.4-10.8 4D5 2.7-5.4 5A5 0-2.7 6
as the decomposed signal in decomposition level 6. D1-D5and A5 represents signal in different frequency bands.
Fig.2 shows different decomposed signals (approximationA5 and details D1-D5) of a sample normal EEG signal. Fig.3shows different decomposed signals (approximation A5 anddetails D1-D5) of a sample epileptic EEG signal.
5.2 Features extraction based on relative waveletenergy
The extracted wavelet coefficients provide compact rep-resentation that shows the energy distribution of the EEGsignal in different frequency bands. In this work, accordingto the definition in section 5.1, energy E1, E2, · · ·, E6 can beobtained from the wavelet coefficients of the detailed signalD1-D5 and approximated signal A5. Thus, relative waveletenergy (RWE) ρ1, ρ2, · · ·, ρ6 can be calculated according toEqn. (11) for different frequency bands. Table 2 shows theaverage ρn (n is from 1 to 6) of the normal and epilepticEEG segments from the whole dataset. Since there is lit-tle energy in frequency band 21.7-43.4 Hz and 43.4-86.8 Hz(relative small value of ρ1 and ρ2 comparing with ρ3,ρ4, ρ5
and ρ6), focus was put on the frequency band from 0 to 21.7Hz. Table 2 shows that the value of ρ6 of the normal EEGsignal is higher than that of the epileptic signal, ρ4 and ρ5
of the epileptic EEG signal are somewhat higher than thoseof the normal signal.
After further analyzing the relationship among ρ3, ρ4, ρ5
and ρ6, it seems that the two EEG signal patterns can be
180

Table 2: Average of the Relative wavelet energy(RWE) of normal and epileptic EEG Signal at dif-ferent bands
RWE Normal EEGsignal
EpilepticEEG signal
Frequencyband (Hz)
ρ1 0.0061 0.0020 43.4-86.8ρ2 0.0534 0.0384 21.7-43.4ρ3 0.1671 0.1981 10.8-21.7ρ4 0.1659 0.3048 5.4-10.8ρ5 0.1059 0.2288 2.7-5.4ρ6 0.5017 0.2278 0-2.7
0 10 20 30 40 50 60 70 80 90 1000
0.2
0.4
0.6
0.8
1
Re
lati
ve
wa
ve
lete
ne
rgy
0 10 20 30 40 50 60 70 80 90 1000
0.2
0.4
0.6
0.8
1
Re
lati
ve
wa
ve
lete
ne
rgy
Figure 4: The distribution of the sum of some ρn forthe normal and epileptic EEG segments of the wholedataset: (a) is the distribution of ρ3 + ρ4 + ρ5 ; (b) isthe distribution of ρ6. ◦ and ∗, respectively, indicatenormal EEG signal and epileptic EEG signal.
identified by the sum of some ρn. Fig. 4 shows this re-sult.Part (a) in Fig.4 is the sum of ρ3 + ρ4 + ρ5 and mostepileptic EEG signals have a higher value than normal sig-nals. Fig.4(b) is value ρ6 and most epileptic EEG signalshave lower value than normal signals. Since ρ3 + ρ4 + ρ5
reflects the signal energy distribution in frequency band 2.7-21.7 Hz and ρ6 reflects the signal energy distribution in fre-quency band 0-2.7 Hz. Thus, it can be concluded that theepileptic EEG signal was dominated by frequency band 2.7-21.7 Hz, with a corresponding abrupt activity decrease infrequency band 0-2.7 Hz. Based on the above analysis, twonew features are defined: x1 is relative wavelet energy ofthe signal in middle frequency band (2.7-21.7 Hz) and x2 isrelative wavelet energy of the signal in low frequency band(0-2.7 Hz):
x1 = ρ3 + ρ4 + ρ5
x2 = ρ6(12)
Fig. 5 exhibits the EEG signals patterns based on the fea-tures x1 and x2.
6. RESULTSIn this work, two types of dataset were considered: one
is normal EEG signal (dataset Z) and the other is epileptic
0 0.1 0.2 0.3 0.4 0.5 0.6 0.7 0.8 0.9 10
0.1
0.2
0.3
0.4
0.5
0.6
0.7
0.8
0.9
1
x1
x2
Figure 5: EEG signals patterns based on features x1
and x2. ◦ and ∗, respectively, indicate normal EEGsignal and epileptic EEG signal.
EEG signal with seizure activity (dataset S). Each datasetcontains 100 segments of 4096 samples. Each segment wassplit into 8 sub-segments, and each sub-segment contains512 samples. Parameters x1 and x2 were calculated for eachsub-segments, and finally a feature vector which contained16 parameters for each segment was obtained. This featurevector was put as input of an artificial neural network.
The architecture of the feed-forward ANN used in thiswork is: 16 neurons for input layer, 10 neurons for hiddenlayer and one neuron for output layer. 100 segments ran-domly chosen from the whole 200 segments (100 segmentsZ and 100 segments S) were used for training the neuralnetwork. The remaining 100 segments were kept aside fortesting. The performance of this model can be determinedby the computation of sensitivity, specificity and classifica-tion accuracy. The sensitivity, specificity and classificationaccuracy are defined as [6]:
• Sensitivity: number of true positive decisions dividedby the number of actual positive cases;
• Specificity: number of true negative decisions dividedby the number of actual negative cases;
• Classification accuracy: number of correct decisionsdivided by the total number of cases.
Table 3: The Value of Statistical Parameters of theANN for EEG Signal Classification
Sensitivity (%) Specificity (%) Classificationaccuracy (%)
98.17 92.12 95.2
The values of the statistical parameters (sensitivity, speci-ficity and classification accuracy) are given in Table 3. Itshows that the sensitivity and specificity of these two typesof EEG segments are 98.17% and 92.12%, respectively. Highsensitivity represents that most epileptic EEG segments arecorrectly classified. The final classification accuracy is 95.2%with a standard deviation of 1.98. From the results obtained,
181

it seems that features derived from relative wavelet energyin different frequency bands are useful to classify normal andepileptic EEG signals.
Subasi [17] described a method for EEG signal classifi-cation based on wavelet transform and a mixture of expertmodel. In his work, two sets of the same EEG datasets—sets Z and S were used to train a multi-layer perceptronneural network (MLPNN) and a mixture of experts (ME)network. Mean of the absolute values of the coefficients, av-erage power of the wavelet coefficients, standard deviation ofthe coefficients and ratio of the absolute mean values of ad-jacent sub-bands were defined as the features to characterizeEEG signals in the literature [17]. The total classificationaccuracy rates got in that work was 93.2% and 94.5% respec-tively. Thus, the accuracy rate obtained in current work wasfound to be higher than the reported values [17].
7. CONCLUSIONSWavelet transform has been widely considered as a pow-
erful tool for non-stationary signal analysis, such as EEGsignals. The relative wavelet energy (RWE) provides infor-mation about the relative energy associated with differentfrequency bands of the EEG signals. In this paper, EEGsignals were first decomposed into different frequency bandswith discrete wavelet transform and then, based on the spe-cific energy distribution of normal and epileptic EEG sig-nals, two features representing relative wavelet energies inlow and middle frequency bands were extracted. Finally, athree-layer feed-forward ANN was used for classification. A95% classification accuracy was achieved, which positivelyproved this method successful. Therefore, it can be con-cluded that relative wavelet energy is a useful technique torepresent the characteristic of EEG signals, and it can behelpful to other biomedical signals analysis.
8. FUTURE WORKIn current work, focus was put on normal and epileptic
EEG signal classification. In the next stage of research, theresults from this preliminary study will be expanded to in-clude a more complete range of datasets. This will be morechallenging to testify our approach to solve more compli-cated EEG signal classification. Other attributes in termsof classification will be considered. These are interestingresearch questions needed to be addressed.
9. ACKNOWLEDGMENTSLing Guo was financially supported through a fellowship
of the Agencia Espanla de Cooperacion International (AECI)and the Spanish Ministry of Foreign Affairs.
10. REFERENCES[1] H. Adeli, Z. Zhou, and N. Dadmehr. Analysis of EEG
records in an epileptic patient using wavelet transform.Journal of Neuroscience Methods, 123(1):69–87, 2003.
[2] R. Andrzejak, K. Lehnertz, F. Mormann, C. Rieke,P. David, and C. Elger. Indications of nonlineardeterministic and finite-dimensional structures in timeseries of brain electrical activity: Dependence onrecording region and brain state. Physical Review E,64(6):61907, 2001.
[3] I. Basheer and M. Hajmeer. Artificial neural networks:fundamentals, computing, design, and application.Journal of Microbiological Methods, 43(1):3–31, 2000.
[4] D. Cvetkovic, E. Ubeyli, and I. Cosic. Wavelettransform feature extraction from human PPG, ECG,and EEG signal responses to ELF PEMF exposures:A pilot study. Digital Signal Processing,18(5):861–874, 2008.
[5] I. Daubechies. Ten lectures on wavelets: SIAM.Philadelphia, PA, 1992.
[6] I. Guler and E. Ubeyli. Multiclass Support VectorMachines for EEG-Signals Classification. InformationTechnology in Biomedicine, IEEE Transactions on,11(2):117–126, 2007.
[7] E. Haselsteiner and G. Pfurtscheller. Usingtime-dependent neural networks for EEGclassification. Rehabilitation Engineering, IEEETransactions on [see also IEEE Trans. on NeuralSystems and Rehabilitation], 8(4):457–463, 2000.
[8] N. Hazarika, J. Chen, A. Tsoi, and A. Sergejew.Classification of EEG signals using the wavelettransform. Signal Processing, 59(1):61–72, 1997.
[9] E. Johansson, F. Dowla, and D. Goodman.Backpropagation learning for multi-layer feed-forwardneural networks using the conjugate gradient method.International Journal of Neural Systems,2(4):291–301, 1992.
[10] T. Kalayci and O. Ozdamar. Wavelet preprocessingfor automated neural network detection of EEGspikes.Engineering in Medicine and Biology Magazine, IEEE,14(2):160–166, 1995.
[11] S. Mallat. A Wavelet Tour of Signal Processing.Academic Press, 1999.
[12] O. Rosso, A. Figliola, J. Creso, and E. Serrano.Analysis of wavelet-filtered tonic-clonicelectroencephalogram recordings. Medical andBiological Engineering and Computing, 42(4):516–523,2004.
[13] O. Rosso, M. Martin, A. Figliola, K. Keller, andA. Plastino. EEG analysis using wavelet-basedinformation tools. Journal of Neuroscience Methods,153(2):163–182, 2006.
[14] A. Subasi. Automatic recognition of alertness levelfrom EEG by using neural network and waveletcoefficients. Expert Systems With Applications,28(4):701–711, 2005.
[15] A. Subasi. Epileptic seizure detection using dynamicwavelet network. Expert Systems With Applications,29(2):343–355, 2005.
[16] A. Subasi. Automatic detection of epileptic seizureusing dynamic fuzzy neural networks. Expert SystemsWith Applications, 31(2):320–328, 2006.
[17] A. Subasi. EEG signal classification using waveletfeature extraction and a mixture of expert model.Expert Systems With Applications, 32(4):1084–1093,2007.
[18] M. Sun and R. Sclabassi. The forward EEG solutionscan be computed using artificial neural networks.Biomedical Engineering, IEEE Transactions on,47(8):1044–1050, 2000.
182
[19] A. Tzallas, M. Tsipouras, and D. Fotiadis. ATime-Frequency Based Method for the Detection ofEpileptic Seizures in EEG Recordings. In Proceedingsof the Twentieth IEEE International Symposium onComputer-Based Medical Systems, pages 135–140.IEEE Computer Society Washington, DC, USA, 2007.
[20] M. Unser and A. Aldroubi. A review of wavelets inbiomedical applications. Proceedings of the IEEE,84(4):626–638, 1996.
[21] A. Vuckovic, V. Radivojevic, A. Chen, andD. Popovic. Automatic recognition of alertness anddrowsiness from EEG by an artificial neural network.Medical Engineering and Physics, 24(5):349–360, 2002.
183