Choose the way you want to bank. - JD BIRLA INSTITUTE
360
-
Upload
khangminh22 -
Category
Documents
-
view
1 -
download
0
Transcript of Choose the way you want to bank. - JD BIRLA INSTITUTE


V,« ..'
Choose the way you want to bank.
MOBILE BANKING | NET BANKING
PHONE BANKING | ATMsBRANCH BANKING
UD Union Bankof India
Good people to bank with
Toll free no.: 1800222244 I www.unionbankofindia.co.in

28"' Biennial National Conference
Home Science Association of India, Kolkata Chapterimpact of Social Charge & Technological Advancements on Faculty & Community'
7ih (Q prti January, 2010
Chief Guest:
Hon'ble Shri Kapii Sibal,Minister for HRD, Govt. of India
Sponsored By:
EMTA GROUP OF COMPANIES
805. Central Plaza, 2/6, Sarat Bose Road
Kolkata - 700020
J. D. Birla Institute, Department of Home Science
11, Lower Rawdown Street, Kolkata - 700 020
West Bengal

CONTENTS
PROGRAMME SCHEDULE.
CONFERENCE ORGANIZING COMMITTEE
MESSAGES
LIST OF SPONSORS.
EMINENT PANEL OF JURY MEMBERS
SCIENTIST'S AWARD
Junior Scientist Award
1 Family ResourceManagement Category
2 Food & Nutrition Category
Mid-career Scientist's Award
1 Textiles & Clothing Category
2 Textiles & Clothing Category
Senior Scientist's Award
I Family Resource
Management Category
2 Family Resource
Management Category
ORAL & POSTER PRESENTATIONS
Extension Education & Communication - Oral
Micro Level Study of Ozone Centrifugal
Aerated Technology in Treating the Sewage WaterQuality Asse.ssment of Pearl Millet Grown
Under Three Different Production Sy.stems
Developing Herbal Finished Baby Nappy PadsStudies on Selective Chemical Treatment
of Jute, Cotton and Jute-Cotton Union Fabrics
Designing and Evaluating Portable VermicomposiDevices and Assessing the EfHciency of CompostPrepared Using Different MethodsThe Impact of Economic and Social PolicyDecisions on the Family in a Community Context
EEC/Oral/I
2 EEC/Oral /2
3 EEC/Oral/3
4 EEC/Oral /4
5 EEC/Oral /7
Ensuring the Survival of the Girl Child; An Analysis of Cash
Incentive Schemes in Haryana
Off Season Paddy straw Mushroom
Cultivation Under Low Cost Polyhouse
Connecting People. Empowering Communities - Mapping the
Impact of Community Radio Using the Most SigniricantChange (MSC) Technique
Role of MAVIM in Women Empowerment - A Case Study
The Role of NGOs in the Care of the Elderly
6 EEC/Oral /8Association of Personal-Localile Sources with Demographic
and Socio-Economic Variable of Vegetable Growers Women
Emrepreneurship Training Programmes For Women
An Appraisal of Uzhavarsandhai(Farmer's Market) in Tamil Nadu
Extension Education & Communication ■ Poster
EEC/Oral /9
EEC/Oral/1 1
Imparting Health Education to Irula TribalWomen in Coimbaiore District
Problems of Emrepreneurship Development
among Farm WomenDesigning and Developing InteractiveMultimedia as Trainer's Instructional Guide
An Analytical Study on (he Usage of Teaching LearningMaterials in the Selected Schools of Manipur Stale
Food Nutrition. Dietetics & Hospitality Management - Oral
1 FNf^HM/Oral/l An Epidcmiological Study of the Assessmentof the Dietary Pattern and NutritionalDeficiencies in Rural Areas of'Shimla District
2 l-'NDMM/ Dral/3 Quality Fvaluaiion of Moth Bean Based Extruded Products
1 KEC7Ptister/l
2 EEC/ Poster/2
3 EEC/ Poster/3
4 EEC/ Poster/6
06
08
II
23
24
31
Lakshmi Priya A
SuhaRuma
S. Amsamani
Deepali Singhcc
M R Thilakam
Vinya Madanc
35
Ruclii Gaur& Sarita
Anand
Laxmipriya Pradhan,
M.P Nayak & A.K Khuntia
Vidhu Kapur, Shwcta
Anand. Archana
Kumar & Mridula Scth
Shobha Y. Waghmarc &Sandhya M. Rotkar
Sandra Anandrajan &
Karuna Miraclyn Stephen
D K Sujan, SaritaIVipathi & Indira Bishnoe
D K Sujan & Sarita IVJpaliiiR Hcmarupaa &
Sathyavathymuihu
R S Philachon
Laxmipriya Pradhan.Pranati Das & Subhashree Salioo
Varlndar Randhawa &
Sumita Roy
Sisiliya K
Dewan Anjali
GItanjali Rattan &
Madhu Goya!

3 FNDHM/ Ora!/8
4 FNDHM/ Oral/10
5 FNDHM/Oral/11
6 FNDHM/ Oral/12
7 FNDHM/ Oral/14
8 FNDHM/ Oral/18
9 FNDHM/ Oral/24
10 FNDHM/ Oral/26
11 FNDHM/ Oral/28
A Study on the Nutritional Status of Athletes inthe Age Group of 17- 22 Years Undergoing
Training at Sports Authority of India. MumbaiStudy on Nutritional Status of Primar)' School
Children Covered by Mid-Day Meal Programmes
in Palghar and Wada Taliikas. Thane District
Impact of Nutrition Education in Obese AdolescentsEfllcacy of Dark Chocolate on Lipid Profile of Cardlo
Vascular Patients
Women Empowerment through Pleiirotiis Sajor-Cajii
Supplemented Biscuit EnterpriseImpact of an Intervention Based on Pearl Millet Uuho on
Hemoglobin Status of Adolescent GirlsEffect of Growth Perfomuince and Certain Blood/Biochemical
Constituent of Mice Raised on Different Levels of
Non-Conventional Dietary Protein
Development and Nutritional Analysis of Spirulina
Incorporated BiscuitsTrends in Breast Feeding Practices Among Missing Tribes ofJorhat District. Assam
Food Nutrition. Dietetics & Huspilulity Management - Poster
1 FNDHM/Poster/2 Dietary Practices and Knowledge System about Health Care.Hygiene. Morbidity Patterns And Superstition of Tribal
Children: A Ca.se Study of Koraput. OrissaNutritional Status and its Implications on Health:A Prevalence Study on BPO Workers of KolkataDietary Factors and Vulnerable Population for GallbladderDiseases
Value Added Ethnic Weaning Food of Madhya Pradesh - A
Systematic Approach to Attain Nutritional SecurityComparative Study of Food Pattern of Working Women amongDifferent Income GroupsQuality Evaluation of Spirulina Based 'Khakro'
Development of Value Added Products from Nutrieereals andthe Effect of Packaging and Storage on their Shelf Life
Maliarashtrian Snacks: Traditional Rice Delight
Enhancing Availability of Vegetables in Diet throughNutritional Kitchen Gardening: A Study on Tribal of MPAn Appraisal of Noon Meal Programme in Tamil Nadu
Inlluence of Changing Food Pattern on Childhood Obesity inthe Cities; Jodhpur and Kolkata
Inlluence oi Changing Food Pattern on Childhood Obesityin the Cities: Jodhpur and Kolkata
Family Resource Mnnageinciit - Oral
I FRM/Oral/1 Utilization of Abilities of Elders in the Changed
2 FNDHM/ Postcr/3
3 FNDHM/ Poster/.S
4 FNDHM/ Poster/6
5 FNDHM/ Pt)stcr/7
6 FNDHM/ Poster/10
7 FNDHM/ Poster/11
8 FNDHM/ Poster/12
9 FNDHM/ Poster/13
It) FNDHM/
11 FNDHM/
Poster/16
Poster/19
11 FNDHM/ Poster/19
2 FRM/ Oral /2
.1 FRM/ Oral /4
4 FRM/ Oral/6
FRM/ Oral/7
6 FRM/ Oral/9
7 FRM/Oral/It)
Social Context
Micro Level Study of Ozone Centrifugal AeratedTechnology in Treating the Sewage WaterCreating Awareness about Recycling of KitchenWaste
Level of Satisfaction Gained by the Homcinakersin Dual Established Families of Andlira Pradesh
Types of Electrical Home Appliances used by
Women and its Impact on Her Life Style withSpecial Reference to Middle Income Group inSangli CityQuality of Life of Older Adults through theFiyes of Ytniih
lnvt>lvenieni of Women in Financial Decision
Making Process of Rural Households, underDispur Assembly Constituency
S Abraham & P Machado
Nisha Bellarc. Veena
Yardi & Denny John
S Kavitha& R Parimalavalli
Vimla Dukwal &
Sudcsh Jood
Tanu Shrvc Singh &
Madhu GoyalMeenakshi Dutta Mazumdar
& Santana Kakoti
Vandita Siiarma & Vimla
Dunkwal
Daisy Kancng Baruah. Nilima
Neogi & Mridula S Barooah
Sunita Mishra
Ncha Rai Surana &
Indrani Biswas
Neclam Kuniari & A S Kare
Meera Vaidya. Alpana Singh &Varuna Singh
KumKiiin Kuniari & Arvind
Kumar Sharma
Vandita Sharma, Ruma Saha.
Mamta Singh & Vimla DukwalAnjali Dewan
B B Wasnik. A A Deshpande.
S V Gulhane
Neolu Vishwakarma. Ajay
Khare & Gayatri V Singh
S Prcmakumari
Raka Srivastava & Prachee
Baid
Raka Srivastava &
Praclicc Baid
Sandhya MadhukarR<)tkar& S Y Waghmare
Laksluni Priyti A &
Chitra Prakash
Asha .lyoti &
Somya L K
K V Padmavathl
Susmila S Diirgule &
Shrtiti S Joshi
S MItra & B Dasgupta
Santana Bordolol Kakati &.
Jiipilara Sarma

8 FRM/ Oral/I I
9 FRM/Ora)/12
10 FRM/ Oral/13
Empowermeni of Women on Consumer Prolcclion
Sericullural Technologies on Rural Women
with Reference to Economic Status and Health AspectsAcceptance of Accessories Made from
Reusable Materials
Family Resource Management - Poster
I FRM/Poster/1
2 FRM/ Poster/2
3 FRM/ Posier/3
4 FRM/ Posier/4
5 FRM/ Posler/5
6 FRM/ Poster/8
Reflections of Homemakcrs on Dual
Establishment through Swot AnalysisDesigning Colonial Theme Restaurant reilccting
the British Era of Kolkata
A Study on Usage of Mobile Phone amongst
College Students in Kolkata
Middle Income Group Families with Working
and Non-Working Wife & their Income &Expenditure Patterns- A Comparative Study
An Analysis of the Occurrence of CarpalTunnel Syndrome among Men and Women
Using Computers
Feasibility of Improved Sickle in DrudgeryReduction of Farm Women
S Prcma & A Venmathi
Shobha B & Shecia K
Mamatha B & Seema
Shinirmutt
K V PadmavaUii
Swta Mc.saria& Neerja
Jaiswal
Komal Siiarnia &
Phorum Shah
Ratna Bannerjee &
Ishita Biswas
Agrata Wahi& Nandita
Das
Manju Gupta, SudeshGandhi & Asha Rani
Human Development, Family Studies and Early Childhood Education & Development - Oral
1 HD/Ordl/2
2 HD/Oral/3
3 HD/Orai/4
4 HD/Oral/5
5 HD/Oral/6
6 HD/OraI/8
7 HD/OraI/9
8 HD/Oral/IO
9 HD/Oral/14
10 HD/Oral/I6
HD/OraI/18
12 HD/Oral/19
13 HD/Oral/2()
Assessment of Knowledge. Attitude and Practice of AnganwadiWorkers About Non-Formal Pre-School Education
A Study on Knowledge, Attitude and Practices RegardingGender Related Aspects among Rural PeopleAwareness of Never Married Adults (20-35 Years) RegardingMatrimonial Websites
Appraising Perceived Self-Efficacy and its Influence on
Specific Efficacy OutcomesFsychosocial Impacts of Changing Family Patterns on the
Elderly in Kolkata
Media Preferences among Urban Adolc.scenis of Jammu
Socio - Psychological and Economic Status of
Insiiiulionalized Elders
Academic Stress and School Environment: A Study ofAdolescents of Jammu, J and K
Efficacy of Modem Family Planning Methods in RuralCommunity of Jharkhand
Positive Therapy for Enhancement of Self-Esteem, Self-Efficacyand Management of Stress Among Women in Local Governance
in Coimbatore District
A Study on Significance of Traditional Toys for Pre SchoolChildren
Impact of SHGS (Sgsy) on Socio-Economic Status of WomenWeavers of Manipur
Changing Role of Father: A Study of Fathers' Participation inthe Care of their Mentally Retarded Children
Ha Jogl
D Vljayaranl & Dr. G Baradha
Mansi V Mehla &
Kamini. P RegeK Arockia Maralchelvl &
Hasna K T
Paromita Ghosh
Nccru Sharma &
Ruchira SapruN Prabhavathy Devi &PTamilarasi Murugesan
Neeru Sharma &
Ruchira Sapru
Asha Kumarl
M Shanmugavani,S Rajkakshmi. KC Lcclavathy
Usha Kothari &
Nasrecn Gazdar
Elangbam Jenlta Devi &
Sarita Anand
Kunjan 'IVivedi &
Pratibha Bohra
Human Development. Family Studies and Early Childhood Education & Development • Poster
HD/P<)ster/2
2 HD/Posier/S
3 MD/Poster/9
4 i-lD/Posier/K)
^ l-IU/P..ster/l I
b H1>/Fosler/l.^
Enhancing the Lives of Street Children through Life EnrichmentEducation (Lee)
A Study of Personality. Rigidity and Leadership Preference ofL'ndergraduate Commerce Studentsimpact of Social Change and Other Approaches for SelfDevelopment of Girls in Jharkhand StaleImpact of Mothers Education on Cognitive Ahilitiesof Pre- School Children
Education and f-hnploymeni as Related to Modernity:
A Study of Social Change In Women of Ha/.aribaghA Study of Achievement Motivation and Study Habits t)fBengali Medium and Finglish Medium Adolescent Girls
K Arockia Maruicheivi &
N Jayapiiorani
Krishnakuii Bhattacharyya &Pragjyoii BhowmikRcnu Bo.sc, Bhariiyan &
Kumkum Kumarl
Suman Bhanut &
Shubnam Ansari
Rcnu Bo.se
Punain Mchra & Arpita Saha

7 HD/Poster/14 Impaci of Technological Advancements on Family and
Community
Impact of the Use of Cell Phones on the Educational Interest.
Creative Thinking and Personal Values of Teenagers
Nutritional Status and Quality of Life of Rehabilitated Leprosy
Victims of Buria Town. Odisha
Braja Kishori MishraMatrimonial Website: Challenges and Solution Perceived by
Never married Adults Years)
Non-Formal Pre-School Education and its Impaci on
Development of Children Under ICDS Programme
Textiles Science, Design, Clothing & Fushion Studies - Oral
8 HD/Poster/I6
9 HD/Poster/17
10 HD/Poster/18
II HD/Postcr/19
1 TSDCFS/Oral/2
2 TSDCFS/Oral/.^
3 TSDCFS/Oral/4
4 TSDCFS/Oral/S
5 TSDCFS /Oral/7
6 TSDCFS/Oral/9
7 TSDCFS/Oral/12
8 TSDCFS/Oral/13
9 TSDCFS/Oral/14
10 TSDCFS/Oral/17
11 TSDCFS/Oral/18
12 TSDCFS/Oral/19
13 TSDCFS/Oral/21
14 TSDCFS/Oral/22
Textiles Science, Design,
1 TSDCFS/Postcr/l
2 TSDCFS/Posier/2
3 TSDCFS/Poster/3
4 TSDCFS/Postcr/4
5 TSDCFS/Poster/IO
6 TSDCFS/Poster/11
7 TSDCFS/Poster/12
8 TSDCF.S/Poster/13
9 TSDCFS/Poster/14
10 TSDCFS/Poster/15
11 TSDCI-S/Posier/16
Printing of Silk with Croton Leaves {Cocliiiiii varifgdiiiiii)
Sustainable Traditional Preparatory Processes- New Hopesfor Social. Ecological and Hygiene Concerns
Development of Spray Tank Cover for Farm WorkersSingh. Ncelam Pruthi & Neelam M Rose
Fragrance LingerieExtraction of Dye from Peepal (Ficiis reli^ioxo) Bark and
Leaves and its Application for Dyeing Cotton and Silk FabricsDesigning Middy Tops with Wearable Electronics
Enzymatic Singeing of Jute Cotton Fabrics AmsamaniEconomic Rehabilitation of Persons with Disabilities in the
Garment Sector- Current Scen.irio
Influence of Technological Advancement on Awareness of IndianRegional EmbroideryChemical and Structural Characteristics of Non-Mulberry Silk
Pupae of Anthfivea tixxoma Ww
Inlluencc of Education and Communication Media on the
Clothing Awareness and Purchasing Practices of Tribal GirlsImpact ol Handloom Weaving Training on Socio-EconomicStatus of Rural Women
Value Addition of Jainsem from Meghalaya with IndianEmbroideryFashion Awareness and Peer Pressure Among Adolescents
Ciotiiing & Fashion Studies • Poster
A Study on Buying Behaviour and Construction of Jeans for
Females According to Preference
Probing Entrepreneurial Qualities of Students in Professionaland Non-Professional Courses Studying Fashion and TextilesA Comparative Study of Non-Working and Working Wives onthe Role Played by Them in the Selection of their Husbands
ClothingDesigning of Utility Garments for Spastic Persons
Antimicrobial Finishes Using Medicinal HerbsTrial lor Utilization of Bio-Waste from the Non-Mulberry SilkIndustry (A.Assama Ww) of Assam
Application of Madhubani Designs for Apparels UsingScreen Printing TechniqueA Study on Purchasing Practices of Mothers Residing in DiffcrenlApartments with Special Reference to Pre-School Children's
Clothing
A Comparative Study of Handmade and CAD Created Textile
Motifs & Prevalence of CAD Software's in Textile ExportUnits of Jaipur
Studies on Repeated Dyeing of Silk with Red Sandalwood
Using Selective Mordants
Sari - A Rite of Passage
Anjali Pattanaik. S Wamunjali
Misra & Laxmipriya Dei
Jyuti Mankar
TillotUimn Khandapani &
Mansi V Mchtu &
Kamini P Rege
I la .Ingi
Rachna Singh. EktaGrover.
Nargis Falima & Sristi MauryaMunju Hundckar &
Ela Dedliiu
Priya Makkar, Saroj S Jeet
Forum T Shah & Pratima Goyal
Inderpul Ral. Sabra Ureshi &
Ms. Sandeepa Kumawat
S Jayapriya & S Amsamani
R Uma Maheswuri& S.
Munprcct Chahal, Seemn
Sekhri& Dr. Riiu Mathur
Anvita S Agurwal.
U K Vairagade& PS Lathkar
Maniata Goswaini Adhikari &
Manjoo Goswami Mishra
Smriti Kekha Sarkar.
Animesh Sil & Sangeeta Deo
Sniigccta Deo
Marsoki M Hck & Deepa Rathi
Sristi Maurya
Samita Gupta & Bindiya
Lalwani
Manushi Tcwari &
Shuilec Mehra
Smita Parekh
Siiwcta "nitcja. Anshu &
Archana Singh
V Krishnavcni & S Am.samani
Manjoo G. Mishra &
Mamta Goswami Adhikar
Ekta Grover & Shristi Maurya
Sliabnam Haznrika,
Dr. Rumi Saikia Borah &
Dr. Malaya Bora
Inderpal Rai & Aditi Mertia
Deepali Singhee &
Ipshiia Chateriee
Armaiti Shukia
ADVERTISFMKN'rS -305

I .fi'
Venue
08:30 am (o 9:45 am
10:00 am to 11:30 am
I0;00 am to 10:05 am
10:05 am lo 10:15 am
10:15 am Id 10:20 am
10:20 am id 10:25 am
10:25 am lo 10:45 am
] 0:45 am U) 1 1:15 am
11:15 am to 11:25 am
1 1:25 am lo 11:30 am
11:30 am to 12:00 am
12:00 am to 01:00 pm
12:00 am to 12:30 pm
12:30 am Id 01:00 pm
01:00 pm to 01:45 pm
01:45 pm to 03:25 pm
01:45 pm to 01:55 pm
01:55 pm to 02:25 pm
02:25 pm to 02:55 pm
02:55 pm to 03:25 pm
03:30 pm to 04:30 pm
03:30 pm to 04:00 pm/II./Wk ... /li.l/k04:00 pm to 04:30 pm
04:30 pm
05:00 pm
to 05:00 pm
to 06:00 pm
05:00 pm to 05:30 pm
05:30 pm to 06:00 pm
06:30 pm to 08:00 pm
08:00 pm to 09:00 pm
09:00 pm
Venue
08:30 am to 09:45 am
10:00 am lo 11:30 am
l'l:()()ain to 10:05 am
10:05 am to 10: lOam
PROGRAMME SCHEDULE;;
DAY ONE
J D Biria Institute, Satellite Campus
Breakfast & Registration
INA UGURAL SESSION
Welcoming of Guests
Welcome Address by Mrs. Sumangala Birla
Lighting of the Lamp by the Chief Guests
Address by Ms. Rita Bibra - Chief Admini.strator (introduce the Institute)Presidential Address by Dr. Vijayalakshmi Purushothaman - President. HSAI (introduces
the theme of the conference)
Speech by Chief Guest - Prof. Pradip Narayan Ghosh. Vice Chancellor. Jadavpur UnivcrsiiySpecial Address by Dr. Mrunalini PuarVote of Thanks by Dr. Deepali Singhee, Principal. JDBI
Tea Break
TECHNICALSESSION-I
Knowledge Creation vs Knowledge Application: Science vs Technology - SwamiAtmapriyanandaji, Vice Chancellor. Ramakrishna Mis.sion Vivekananda University. KolkataApplication of Science and Technology in Home Science • Prof. M. Varghcsc. FormerSenior Advisor to NAAC
Lunch Break
TECHNICAL SESSION-B
Chairperson: Dr. (Mrs.) ila Dedhia Associate Professor. Department of Textiles & FashionTechnology. College of Home Science Nirmala Niketan and immediate past president.Indian Chapter ARAHE
1. Globalisation & Health: The Indian Case • Prof. (Dr.) Mohan Rao. Professor. Center
for Social Medicine & Community Health. Jawaharlal Nehru University. New Delhi.
2. Value addition to Natural Fibres : A Sustainable Economic Activity for Upliftrnent ofRural Women - Dr. S Sreenivasan. Director. Central Institute for Re.search on Cotton
Technology (CIRCOT). Mumbai
3. New Media Technologies and Rural Communities: Challenges & Potential - Prof. (Dr.)T. T. Shreekumar. A.ssistant Professor at Communications & New Media Programme. NalionalUniversity of Singapore (NUS)
MID CAREER SCIENTIST'S AWARD
1. Dr. S. Amsamani. Avinashilingam University for Women. Coimbatore (Textile Category)2. Dr. Deepali Singhee. J D Birla In.stitute. Kolkata (Textile Category)High Tea
YOUNG SCIENTIST'S AWARD
1. Dr. A. Lakshmi Priya. JBAS College for Women. Chennai (Family Resource
Management Category)
2.Ruma Saha. College of Home Science. Rajasthan (Food & Nutrition Category)Colours ofIndia, Cultural Programme by Students of JDBI
Dinner
Leave for Hotel
DAY TWO
J D Birla Institute, Satellite Campus
Breakfa.st
SPECIAL SliSSiON WITH & RELEASE OF SOUVENIR BVSHRI. KAPILSIllAL
Guests requested to be sealed on the Dias
Greeting the Speciiil Guesl and other Guests with bouquets of (lowers after inlrocliicingthem

10:10 am to 10:15 am
10:15 am to 10:20 am
10:20 am to 10:45 am
10:45am to 10:50 am
10:50 am to 10:55 am
10:55 am to 11:00 am
11:00 am to 11:30 am
11:30 am
11:30 pm to 12:00 pm
12:00 pm to 01:00 pm
12:00pm to 12:30 pm
12:30 pm to 01:00 pm
01:00 pm to 01:45 pm
01:45
Venue
01:00 pm to 01:45 pm
02:00 pm to 04:30 pm
04:30 pm to 5:00 pm
05:00 pm to 06:00 pm
6:00 pm to 7:00 pm
07:00 pm to 08:00 pm
08:00 pm to 09:30 pm
09:30 pm
Venue
08:30 am to 09:45 am
10:00 am to 11:00 am
10;00amto 10:10am
10;10amto 10:40 am
10:40 am to 11:10am
11:10 am to 11:40 am
11:40 am to 12:30 am
12:30 am to 01:30 pm
01:30 pm to 02:30 pm
02:30 pm to 03:00 pm
03:00 pm to 03:30 pm
03:30 pm onwards
Welcome Address by Shri. S. K. Birla
Address by Prof. Vijayalakslimi Purushothamatt. President. Home Science Association of
India
Address by Sliri. Kapil Sibal - Chief Guest
Address by Prof. Subhash Chandra Bhatlacharya. Dean. Faculty Council of Science.
Jadavpur University
Release of Souvenir by Shri. Kapil Sibal
Vote of Thanks by Dr. Deepali Singhee. Principal. JDBl
Sponsor's Coffee
Press Meet with Shri. Kapil Sibal
Iba
SENIORSCIENTIST'S AWARD
1. Dr. M. R. Thilakam. Avina,shiiingam University for Women. Coimbalore (Family
Resource Management Category)
2 Dr. Vinya Madane (Family Resource Management Category)
Lunch Break
IVansrcr to Main Campus
J D Birla Institute, Main Campus
Judging of Research Posters
RESEARCH PAPER SESSION-PARALLEL SESSIONS
High Tea
General Body Meeting & Visit to ̂ RangamatiMela'-TheCraft's Bazaar
INTERACTIVE SESSIONS - PARALLELSESSIONS
Visit to Craft's Bazaar
Dinner on the College Terrace
Leave for Hotel
DAY THREE
J D Birla Institute, Main Campus
Breakfast
TECHNICALSESSION-in
Chairper.son: Dr. (Mrs.) Vijaya Khader. Retired Dean. Faculty of Home Science. Acharya N.G Ranga Agricultural University, Hyderabad
1. Emergence of Women's Rights through Social Changes & Technological
Advancements • Dr. Kumud Sharma, Chairperson. Centre of Women DevelopmentStudies. ICSSR. New Delhi
2. Diet, Nutrition & Health: Problems & Possibilities • Dr. M. S. Bamji. Ex- Director
Grade Scientist. National Institute of Nutrition. Hyderabad
Tba
Visit to Crafts Bazaar
Lunch
VALEDICTORY SESSION
Prize Distribution Ceremony, Prof. Siddharta Datta. Pro-Vice-Chancellor. JadavpurUniversity
Reading of the Results of the Interactive Sessions
Reading the Outcome of the Conference. Convenor of the Conference
Vote of Thanks by the Chairperson of the Conference
General Body Meeting
High Tea
Distribution of the Participation Certificates

CONFERENCE ORGANISING COIVMITTEE
Steering Committees & Sub-Committees
FACULTY MEMBERS
Chairperson
Convenor
Registration Committee
Press & Information Counters
Registration Counters for Four Zones
Spot Registration CounterHospitality CommitteeGuest House In-Charge
Resource Persons. Guests iS:
Jury Receiving CommitteeMedical
Enquiry at Station & AirportPaper Review Committee
Parallel Sessions (Oral Paper Presentations& Interactive Sessions)
Foods. Nutrition. Dietetics andHospitality Management
Textile Science. Design. Clothingand Fashion Studies
Human Development. Family Studies andEarly Childhood Education & Development
Family Resource ManagementExtension Education and Communication
Poster Presentations
Foods. Nutrition. Dietetics andHospitality Management
Textile Science. Design. Clothingand Fashion Studies
Human Development. Family Studies andEarly Childhood Education & Development
Family Resource ManagementExtension Education and Communication
PR & Publicity Committee
Food & Refreshment CommitteeDecoration & Crafts Bazaar Committee
Discipline CommitteeCultural Show Committee
Costumes
Make-up
Hair styles
Backstage & PropsMusic
Crafts Bazaar Committee.Selection of Craft Items
Stall in-charge
College Stall in-charge(lifts & Award Committee
Certificate Committee
PlKitography
Dr. Deepali Singhee. Principal. JDBl
Mrs, Lilii Manclia. Head, Dept of Home ScienceMrs. Komai Slianna
M.S. Saba Shaniim
M.S. Lsliiia Bi.swa.s. Mrs. Cranlliana Sengupui Ms. Ranila Ccingiily.Ms. Dipa Roy
Mr. Manoj Kirolia & Mrs. Radha Ravindran
Mrs. Sinila Parekli,
Ms. Indrani Bi.swa.s. Mrs. Keya Ghosh. Mrs. Airi Chakrabony <6 Mrs.
Rtikmini Banker
Mrs. Lila Mancha <& Ms. Shwela Tiileja
Mrs. Papri Gomes & ElizabelhMs. Punam Mehra & Mrs. Basudha Miikhophadhyay
Dr. Vipasha Chakraborly, Dr. Kri.shnakali Bhaiacharyya, Dr. BananiDe & Dr. Nandila Das
Ms. Shivarati Base
Ms. Mamishi Tewari
Ms. Sohini Kahali
Ms. Shweia Patney
Ms. Ishita Biswas
Mrs. Lila Mancha
Mrs. Saniita Gapia
Ms. Punam Mehra
Mrs. Komal Sharma
Dr. Banani De
Ms. Rachona Kejriwal & Ms. Sreelama DeMs. Shivarati Base
Mrs. Amita Dutta
Shweta Patney & Sudeshna Ray
Mrs. Sainiia Gupta & Mrs. A. S. ManjulakshmiDr. Deepali Singhee. Ms. Manushi Tewari. Ms. Shweta Tiiieja <5 Ms.Taniina Majumdar
Ms. Sreetama De <& M.s. Ruktnini Bunker
Dr. Nandila Das & M.s. Indrani Biswas
M.S. Punam Mehra
Dr. Banani De
Mrs. Amita Dutta & Dr. Nandila Das <6
Dr. Deepali Singhee & Mrs. Amita Dutta.Dr. Nandila Das {£ Ms. Mitali Majumdar
Mrs. Sohini (Kahali) Acharya <6 M.s.Sangeeta Naih
Mrs. Sinila Parekh & Mrs. Sujata Singhal
M.S. Manushi Tewari <6 Dr. Vipasha Chakrabony
M.S. Taniina Majumdar

Steering Committees & Sub-Committees
STUDENT MEMBERS
Hospitality Committee
Guest House In- Charge
Resourece Person. Guests,
Jury Receiving Committee
Enquiry at Station and Airport
Registration Committee
PR & Publicity Committee
Food and Refreshments Committee
Decoration Committee
Crafts Bazar Committee
Cultural Programme Committee
Gift and Award Committee
Certificate Committee
Pliotography Committee
Giijrat Samaj:
Sabiha Nazom. Dinal P. Jasai, Vriiicia Diigar. Disha Mooljee
Meera Mandir:
Kayenat Khan. Archana Chowdhury
Tishya Ghosh. Dainonjil Kaiir. Nikita Bansal. Saadgi
Chowdhury. Megha Jalan
Howrah:
Shikha Khandelwal. Sri.sh(i Jai.swal. Vidhi Mkishra, Raksha
Mussaddi
Sealdah :
Swati Bolosaria. Smriti Poddar
Monika Dhanuka. Kanchon Kapoor. Pooja Lath. Neha Golcha.
Nikita Sitrana
Shilpa Arora. Raksha Banka. Chitrci Jhunjhtiiiwala. Nikita
Suraiia. Anushree Mohta. Priya Singh
Sneha Gupta. Ainria Beriwal. Nisreen Lakdawala Soni
Khandelwal. Palak Daga
Saloni Agonval. Saniragi Saha Chowdhury. Aakansha Sharma
Kritika Poddar. Anantika Lohia. Varuni Goenka. Udita Agarwal.
Sneha Bajaj
Nikita Sanghai. Sneha Roulh. Ritika Shaw. Priyanka Hemdrom.
Richa Kirthania. Megha Mussadi. Swastika Bhattacharya.
Sharique Shaniini. Shweta Aganval. Saksshii Jain. Sachipriya
Ghuwalewala. Kashish Mahatani. Zaara Shahnawaz. Nikita
Dugar. Nandini Kejriwal. Roshni Seth. Indiva Mukherjee.
Shrabashi Dev. Anurupa Dev. Pushali Das. Paridhi Batwal.
Abhinanda Banerjee. Tanistha Pathak. Shruti Agarwal.
Bhumika Yagnik, Aniija Khetawat. Nupur Agarwal Aratrika
Bhagat. Shalini Chalterjee. Atiyaba Ahmed. Ritika Agarwal.
Krutika Desai. Eishani Kedia. Riipinder Kaur. Harveen Katir.
Ritika Covalm Preeti Sharda. Disha Pansari. Radhika Goenka.
Swechha Gupta. Mona Agarwal. Ankita Cinirawal. Priyanshi
Agarwal Var.sha Parakh. Chandni Jhawai: Shweta Sharma.
Riipsha Roy Chowdhury. Vruti Riipani, Pooja Goenka. Anshuma
Todi. Shradha Navetia. Sanjita Kundu. Apurva Adhikari.
Sudeshna Bhaumik. Mona Gandhi. Isha Jajjodia. Ruchi Jha.
Satarupa Ray. Shweta Singh. Shilpa Arora. Nikita Raijada.
Hemlata Jaiswal. Monica Nahata. Vidhi Agarwal. Neha
Bararia. Pragya Khattar Ankita Mondol. Shrishti Singh. Kritika
Agarwal Ruchita Bohra
Manisha Chaffer
Veena Ahhani. Ankita Chaanani
Harshita Banka

1

MESSAGE
•• '/Vo
•1# ?"
1•'"'Tt m ii;''"^
J, JD, BI»gLA INSTITUTE(Atfiliatefi to Jfrdiivpur Umvci'^ity]
DEPARTMENT OF HOME SCIENCE. COMMERCE S MANAGEMENT
'V-
As an interdisciplinary subject dealing with applied sciences. Home
Science touches different age spans and spheres of human life, which
in turn enables it to address the vital concerns related to the quality
of life. Rapid changes in technology have ultimately improved
the quality of life of individuals and families. It has subsequently
brought about changes in social organization and in general
populace. The concept of family, its promotion and strengths has
been and will be one of the greatest and unique contribution India
can make to the entire world. I am sure that the deliberations of
this conference would highlight the significant role of family and
community sciences in enhancing the quality of our lives and lead
to some concrete plan of action from the academics and activists
in the field of Home Science towards achieving this goal.
I am confident that the learned gathering at the conference would
bring before society all aspects of the subject, broaden its parameters
and offer new incentive to budding researchers to take-up further
studies in it. I am also happy to note that the host college is bringing
out a souvenir on the occasion and hope that the articles published
in the souvenir will disseminate information for the benefit of the
participants and society as well. 1 wish the conference a great success.
Mrs. Sumangala Birla
President, Governing Body.
J. D. Birla Institute
5O7O7l2476(7M0l,TeISfa*
II

MESSAGE
Professor Pradtp Narayan GhoshVICS-CHANCEU.OR
*jADAVPUR UNIVERSITYKOLKATA-700032. INDIA
OFFICE OH THE Vice-Chancei.lor : AUROBINDO BHAVAN ANNEXE
I am extremely pleased to learn that J. D. Biria Institute is going to
organize 28"' Biennial National Conference during January 7-9"',
2010 on the topic "Impact of Social change and Technological
Advancements on Family and Community".
It is very significant to conduct such conference in the present
academic and socio-economic scenario. Hope this will facilitate
the young generation to navigate themselves to the emerging
trends of social life through shared conversation with their
contemporaries.
I wish all success for the programme
Prof. Pradip Narayan Ghosh
Vice Chancellor, Jadavpur University
12

MESSAGE
Professor Siddhartha Datta
I'RO-VICE-CHANCELLOR
*JADAVPUR UNIVERSITYKOLKATA-700032, INDIA
SALT LAKE CAMPUS, BLOCK-LB. PLOT NO. 8. SECTOR-III. JADAVPUR UNIVERSITY KOLKATA-700098
It gives me Immense pleasure to know that J. D. Birla Institute is
organizing an all India conference on behalf of the Home Science
Association of India, The title; 'Impact of Social Changes and
technological Advancements on Family and Community Life' is
very apt in today's context where family is gradually losing its
identity. I hope deliberations on this issue would lead to significant
solutions and show ways to improve and strengthen family and
community life. I wish the organizers a resounding success.
Prof. Siddhartha Datta
Pro-Vice Chancellor. Jadavpur University
13

MESSAGE
Prof. SuBHASH Ch. Bhattacharya
DEAN
Facul'i Y OF Science
•JADAVPUR UNIVERSITYKOLKATA-700032, INDIA
It is a matter of great happiness that J.D Biria Institute is hosting
the 28'^ Biennial National Conference of the Home Science
Association of India. Kolkata Chapter on the
"Impact of Social Change and Technological Advancements on
Family and Community The topic is of great relevance in today's
society. Social and technological changes have varying effects on
the individual and community which need to be addressed for
building a healthy society.
I wish the conference all success.
Prof. Subhas Chandra Bhattacharyya
Dean, Faculty Council of Science.
Jadavpur University
14

MESSAGE
* •'V*.
■=?
>
1«5
(Attilisted Co Juduvpur Umvcrfiity)
DEPARTMENT OF HOME SCiENCE, COMMERCE S MANAGEMENT
:>{cl. :\,>:
The Home Science department of the J D Birla Institute is one ofthe most prestigious in the country. It gives us immense pleasureto host the 28'^ Biennial National Conference as the Kolkata
Chapter of the Home Science Association of India.
Through its theme 'Impact of Social change and TechnologicalAdvancements on Family and Community I am confident we willbe enlightened on the significance of the role of technology onfamily and community. In our country it is of particular importanceto grasp the far reaching impact of technology on nuclear familieswhich in turn has a domino effect on the community at large
creating a critical mass impacting social change.
It is with great enthusiasm that I look forward to this conferenceand wish the organizers a resounding success in their endeavor.
Ms. Rita Bibra
Chief Administrator. J D Birla Institute
. J. -j. ' 'IwgiTi»>fT7iT7nMa'iiU\ ttTnwtTrTn IfTlITlgioTii:*Iirii
15

MESSAGE
I am delighted to know that the 28 th Biennial National
Conference is being organized by J.D. Biria Insitute on behalf of
of the Kolkota Chapter of Home Science Association of India on
"Impact of Social Change and Technological Advancements on
Family and Community from 7-9 th January 2010.
Home Science being an applied discipline can contribute to the
improvement of quality of living of individuals and families which
ultimately results in the national development- the main aim of
Education especially Higher Education. 1 congratulate the
Association's efforts to update and change with the times to make
the discipline more relevant to the society, considering the socio
economic changes and technological advancements. In this
globalized world. Home science as an interdisciplinary field for
the benefit of families and communities at the micro and macro
level can gear the change and development in the desired
directions.
With best wishes for the Conference and the deliberations!
Dr. Marlamma Varghese,
Former Vice Chancellor. S.N.D.T University
& Senior Education Consultant, NAAC
16

MESSAGE
THE HOME SCIENCE ASSOCIATION OF INDIAIIKAD-QUAUTKRS OFTllEASSOCIATION : MRUNALINI-DEVI CIIARITIKS
INDl.iMAn MAIIAI. JAWAILAKLALNlillRU MAKCl lJARODA-309 001. aiUAR.AT. INDIA. TFl.: (l)2(.5}-213."US2.'21.~UM5
Dr. VIJAYALAKSHMI PURUSHOTHAMAN
PrDsidciit
Dean, Faculty of Communliy Education
Aviriasfilliagam University for Women
Coirnbaiore - Edl 0<t3
IiAobilC : 00'18G801575
"hone : Q422-2-133325
Dr. RAVIKALA KAMATH
linMicdiatc Past President
Dr. CHITRA PRAKASII
Vice President Soulti Region
Or. ELA DEOHIA
Vice President West Region
Or. QIJAYALAKSHMI DAS
Vice Prosidenl East Region
Dr. VINITA tJARULA
Vice President North Region
Dr. K.C. LEELAVATHY
Hon. General Secretary
Dr. ANJALI KARGLIA
Hon. Joint Secretary
Dr. M. AMIRTHAVENI
Hon. Treasurer
Dr. MIRUI4ALIHI DEVI PUAR
Chairperson Nominating Committee
It is my pleasure and privilege to extend mywarm and best wishes to all members of the
Home Science Association of India, as theyaremeeting together at the 28th BiennialConference of the Home Science Association of
India. The association has been in existence for
over 50 years. Home Science which wasessentially started to prepare girls for better
management of the household has to day become a thorough-bread professional subject and has developed Into many branchesand specializations. There are nutritionists among ourselves, thereare fashion designers and trend setters, there are dietitians, thereare extentlon and social welfare workers, human developmentscientists and resource management professionals. What a proudand great achievement!
Along with such great growth, our responsibilities have alsoincreased. Our syllabi should be upto date In all respects. Theteachers should be a well informed lot and inculcate the work culture
among the younger generations. We have to find rightful places ofemployment to our graduates and make Home Science, a fieldwhich is most sought after. Home Science graduates should be madethe most knowledgeable in their fields of specialization, so thatemployers look for these graduates. I am sure that the 28th BiennialConference will allocate some rime to analyze these aspects andpass not only resolutions but also see that action is taken forimplementation along the correct directions by representing thematter to the concerned government authorities.
The organizers of the Conference from the Kolkata chapter havebeen planning and working for the past six months for the successfulconduct of the conference and 1 have no doubt it is going torevitalize all the home scientists.
1 wish the organizers of the conference all the best and the membersattending the conference a useful time while they are here.
Wishing the best to all the concerned once again.
Dr. (Mrs.) Vijayalakshml PurushothamanPresident
Home Science Association of India
17

PRESIDENTIAL ADDRESS
Meetings the Challenges of Social Change and Technological Advancements
Dr. (Mrs.) Vtjayalakshmi Purushothaman
President. Home Science Association of India
Home science as a field of study was coined even before the start of the twentieth century by a group of women, mostof whom were scientifically educated and reform-oriented, who were interested in applying science and philosophy toimproving everyday life. The field's mission was to improve family wellbeing by enabling families to be successful in theirreciprocal relationships with the environments in which they function. With the industrial revolution and changing timessome family functions have today shifted to factories, hotels, bakeries, restaurants, nursing home.s, and schools, makingpolicy concerns relevant. As a result, the field expanded its work also, adding development, delivery, and evaluation ofconsumer goods and services, creating awareness among policy makers about concerns of the field, and attempting toshape social and even global change. Consequently, the field has provided many career options for both men and womenin governmental, non - governmental organizations, business houses and many other walks of life.
Home Science education has played an important role in strengthening the inner ability of our women by enhancingtheir level of education and by imparting financial independence. It has been a major pathway for women into publiceducation and for providing entry to a wide variety of careers for women in academia, business, public relation, governmentand health care. This development of women is essential not merely for the benefit of womenfolk but for the very survivalof the society, for the progress, peace and prosperity of the country.
Home Science has today become:
• an academic discipline to educate scholars, to conduct research and to reach out to the community witli ahelping hand by bringing out through bread professionals,
• an arena for meaningful living in households, families and communities for developing human growth potentialand meeting human necessities,
• a curriculum area that facilitates students to discover and further develop their own resources and capabilitiesto be used in their personal life, as well as professional careers and
• a societal arena to influence and develop policies to advocate for individuals, families and communities toachieve empowerment and wellbeing, to utilize transformative practices, and to facilitate sustainable future.
To be successful in these four dimensions of practice means that the profession is constantly evolving, and there willalways be new ways of performing the profession. This is an important characteristic of the profession, linking withthe twenty-first century requirement for all people to be 'expert novices', that is. good at learning new things, giventhat society is constantly and rapidly changing with new and emergent issues and challenges.
The thread or essential ingredient that all subjects, courses of study and professionals identifying as home scientistsmust exhibit has atleast three essential dimensions:
• A focus on fundamental needs and practical concerns of individuals and families in everyday life and theirimportance both at the individual and community levels, and also at societal and global levels so that wellbeingcan be enhanced in an ever changing and ever challenging environment
• The integration of knowledge, processes and practical skills from multiple disciplines synthesised throughinterdisciplinary and transdisciplinary inquiry and pertinent paradigms and
• Demonstrable capacity to take critical/ transformative/emancipatory action to enhance wellbeing and to advocatefor individuals, families and communities at all levels and sectors of society and en.suring the interplay of thesedimensions of Home Science is the basis upon which the profession can be sustained into the future. Becauseof these attributes. Home Science is distinctively positioned to collaborate with other professionals.
Home .science has an extremely important place in our educational system today. No other academic disciplineincorporates in its curriculum as many pertinent life skills that will help students succeed independent of their chosencareer paths. The most important aspect of home science education is that students not only learn about subject mattertbat has relevance to their present lives, but will constantly be of u.se as they continue to grow. One area of home sciencethat is considered to be among the most essential is the emphasis on personal development, decision making and intrapersonalskills. According to a study done in Japan, students' personal initiatives play an extremely large role in determining howthey'll react to their changing work situations. Those who lack the ability to make effective personal decisions are more atrisk for experiencing hardships in the instabilities found in the real world. It was also found in the study that students donot feel they have the proper means to learn the.se valuable life skills at home. Taking courses in home science allowsstudents to acquire the necessary decision making, social, and communication skills deemed critical for occupationalsuccess.
In addition to the development of valuable intraper.sonal skills, the home science curriculum also opens the doors tothe students to a wide variety of potential career paths with a proper understanding on how economic, .social, and cultural
18

factors personally affect them and their behaviors in consumerism. While other academic courses may cover theoreticalaspects of personal Finance, home science gives a more practical, everyday application of the subject matter. HomeScience as a field is firmly embedded in the agriculture and is extremely useful in enhancing the status of women andchildren. With growing concern for lifestyle, health and nutrition, the importance of nutrition which is part of home sciencehas become everybody's business. It is expected that very soon, home science courses would find a place as an importantcourse in all colleges and universities and not only for girls but also for boys. It is hard to find a single subject taught todaythat incorporates as many topics of interest as home science, helping students to become well informed and developedand professionally ready individuals.
The employment opportunities for home science graduates are growing in leaps and bounds. Thus, one can take upa job in the production industry, tourism industry, service industry or teaching jobs, technical jobs, or sales jobs. One canalso work independently in any field of home science.
With the rapid change in the national and international scenario, the curriculum has to be updated frequently. Withthe tremendous increase in the information technology, the world has shrunken to a global village. The multi nationalshave invaded our homes creating new career opportunities as well as competition.
In order to keep the subject at the top, the course should aim at capacity building of students to manage long andshort-term interventions within the reach of family and community, to meet and achieve the challenges in food andnutrition security, energy conservation, environment protection, product design, marketing, habitate designing, researchableissues in human development and family studies, scientific technological and management problems related to consumers,weavers, apparel and textile industry and reaching out to vulnerable groups in community and facilitating them to securerewarding jobs are all possible with the knowledge gained in this field. Along with all these, the courses should also helpthe students in developing entrepreneurial qualities and finally establishing their own enterprise.
The challenges are different for countries with different income levels, but there are commonalities. There is moremoney being spent on health than ever before and more knowledge to address global health challenges, including bettermedical technology. Along with this, other whereabouts of environment such as hygiene, sanitation, exercise and dietduring illness, in other words overall life style modification well at early stage by utilizing the health care provided by thegovernment and organic healthy foods from the green fields of our great farmers can surely pave way for better andhealthier world which would further completely reduce the double burden of disease. The above possibilities can becomea reality when Home Science and nutrition education is introduced in the curriculum of all the students invariable of theircore subjects and learning home science as a separate subject should receive priority in any formal or informal educationpolicy. Since, the philosophy of Home Science aims at utilization of modem science to improve home living, family life,sound scholarship for intellectual thinking, research to increase information on facts of life, use of all resources to makehome and family effective parts of the social fabric, emphasis on the control of material things to realize the higher spiritualblessings, it is possible for home scientists to make life more beautiful, gracious and worthwhile.
Human development specialists are required big numbers to provide professional counselling for better familyunderstanding and functions so that better human relationship which is very badly needed today is achieved. Textile andClothing specialists should be equipped develop suitable cost effective health promoting clothing for all age groups.Introduce medical textiles for clinical and biological purposes like Antimicrobial finish, mosquito repellent garments, heat& cold resistive garments and the like. The resource management professionals should be prepared to popularize cleaneco -friendly dwellings, promote income generation among men and women so that purchasing power is increased, teachpeople to utilize solar energy, biogas, wind thermal and wave energies, make people sensitive to environmental pollution,promote sanitation at all levels and the extension professionals to take care of the environmental and sanitation aspects ofrural population and life style modification of urban population to reduce the incidence of chronic diseases and promotionof safe drinking water for everyone.
The role of Home Science in developing women power and thereby achieving the goals of family life and protectinghealth of the family, community, nation and world at large cannot be compromised. Today's world demands flexibility andresponse to change for which many are not prepared. Home Science courses are designed to train women to meet thesevital changes with confidence. It promotes one's professional skills, develops insights into home and family living, andprepares one to enter a wide range of career options. Let all us remember that to be successful we need to have a detailedand indepth knowledge of our subject both in the theoretical and practical aspects and develop the work culture amongstudents which is badly needed.
Become a job - provider than a job seeker. Learn to take risks and responsibilities. Come out of your shell and enterinto this large world with confidence. Utilize the government funding facilities and training programme to your advantage.Make your subject the most sought after, let us all vow to promote home science education to achieve this great goal. I amsure that all of us will work towards achieving this great goal in this conference. 1 wish all the deligates useful andenjoyable time. While you all here.
Thank You
19

NORTH ZONE
In my view, Home Science is the most important and significant area of study to improvethe lot of women in our country. It empowers them to meet with varied challenges of their lifeand aspirations of their families. These women further extend their wisdom and expertise toimprove the status of communities they belong to - whether these are tribal, rural, periurban or
uroan.
The conference, held every two years provides a wonderful opportunity to exchangeideas, thrash out issues and provide direction to forgeahead in order to meet with the ultimate goal of NationalDevelopment.After 1966, once again, the venue has become the beautiful city of Kolkata. I vividly rememberour awesome fraternity on the dais and their intensely motivational talks. Both these, had indeed left permanent
impressions on my mind as a young home scientist. On occasions like this, our mentors ensure that the tender
buds of Home Science learn to carry the flag forward making India, a country as a force to reckon with.Home
Science, as a holistic stream of education needs to be saluted. This year this enormous task of organizing themuch awaited conference has been taken up by the J D Biria Institute, Kolkata.I wish the whole organizingteam best of luck and pray for the success of this conference. I am confident, it will show the path for a verybright future for all of us.
Dr. (Mrs.) Vinita Narula
Vice President, HSAI - North Zone
Vice Principal, Lady Irwin College, New Delhi
WEST ZONE
It is an honor to welcome you all to the 28'^ Biennial National HSAI Conference hosted
by Home Science Association of India, Kolkata Chapter in association with J. D. Birla Institute,Department of Home Science, Kolkata from January - 9"" 2009.The theme of theConference 'Impact of Social Change & Technological Advancements on Family andCommunity' is very appropriate and timely. The entire program is well thought of.
HSAI has always continued to support high quality work and strived for excellence within its members.I extend my congratulations and sincere gratitude to the Home Science Association of India, to the OrganizingCommittee of this conference. Home Science Association of India, Kolkata Chapter in association with J. D.
Birla Institute, Department of Home Science, Kolkata and all colleagues who have invested their time, mindand energy to ensure the success of this conference. My special congratulations to my dear student. Dr.Deepali Singhee, Principal of the college and Chairperson of this conference.I hope this conference will bemeaningful, insightful, and knowledgeable and create a platform to network amongst fellow home scientistsfrom various regions of the nation. I wish it has a lasting impact in the development of the Community and theNation.My best wishes to all of you. k p/
Dr. (MreiTEla M DedhiaVice President, HSAI - West Zone
Associate Professor, Textiles & Fashion Technology,Nirmala Niketan College of Home Science, Mumbai
20

SOUTH ZONE
The Biennial Conference of the Home Science Association of India provides a forum
for sharing of experiences of the various activities done by Home Scientists. This helps to
strengthen the association to formulate meaningful activities for the future and expose the role
of Home Science in inculcating quality culture in family and community. The Association
while continuing the tradition of Excellent Work enhances the quality of life in our country.
The Biennial Conference of the Home Science Association of India provides a forum
for sharing of experiences of the various activities done by Home Scientists. This helps to
strengthen the association to formulate meaningful activities for the future and expose the role of Home Science
in inculcating quality culture in family and community. The Association while continuing the tradition of Excellent
Work enhances the quality of life in our country. I am confident the resource persons would bring before the
society all aspects of the subjects, broaden its parameters and offer new incentives to the budding scientists to
take up further research.! am sure the conference will prove beneficial in fulfilling the objectives and the
articles published in the souvenir will disseminate information for the benefit of the participants and society as
well.I extend my gratitude to Dr. (Ms). Deepali Singhee, Principal, JDBI, for shouldering the responsibility to
conduct the conference at Kolkata. I thank the conveners and organizers for their great effort. My best wishes
and prayers for the success of the conference
Dr. (Mrs.) Chitra Prakash
Vice President, HSAI - South Zone
Reader, Department of Resource Management,
Avinashilingam University for Women,
Coimbatore, Tamil Nadu
EAST ZONE
I hope this 28"' Biennial National Conference will definitely be purposeful and give a
new direction to the issues with enlightened ideas and measures. I wish conference good luckand ground success.
Dr. (Mrs.) Bijaylakshmi Das
Vice President, HSAI - East Zone
21


SPONSORS
Emta Group of Companies
MAIN SPONSOR
SPONSORS - Cash Award
Young Scientist Award
Srijan Realities Pvt. Ltd. - Co-promoter of I-LEAD
Mid-Career Scientist Award
Usha Maheswari - Nikhar Parlour
Senior Scientist Award
I-LEAD: Institute of Leadership, Entrepreneurship & Development
Oral Presentations
Extension Education and Communication
Foods, Nutrition, Dietetics and Hospitality Management
Family Resource Management
Human Development, Family Studies and Early ChildhoodEducation & Development
Textile Science, Design, Clothing and Fashion Studies
Poster Presentation
HI-
Sree
TECH Systems
Drive Engineering Pvt. Ltd
Singh Mehandi Industries
Saha Enterprises
Family Resource Management & Extension Educationand Communication
Foods, Nutrition, Dietetics and Hospitality Management
Human Development. Family Studies and Early ChildhoodEducation & Development
Textile Science, Design, Clothing and Fashion Studies
priya Exports
Fort Group -The Fourth Dimension ofSpace
Prayag Group
SPS Steels Rolling Mills Ltd.
Aara - Anisha Designs
SPONSORS - TYophi^
Indian Silk House Agencies
Alumni Association of J D Birla Institute
SPONSORS - Leather Walets ,& Multipurpose Bags,for Aty^rde^ ,
Trips India
Sunny Creations
SPONSORS-Kind
Young Scientist Award, Mid-Career Scientist Award& Senior Scientist Award
Research - Oral & Poster Presentations
Young Scientist Award, Mid-Career Scientist Award &Senior Scientist Award
Research - Oral & Poster Presentations
1,;:
Books for Resource Persons & EC Members
Pens for all DelegatesTea Leaves
Biscuits
Amerst Water Bottles
Super Soft - The Finishing SchoolUNO and Rumpa NayakKama] Kumar Khandelwal
Priya Food Products LimitedSujata Biscuits
Swati Balasaria
Archana Choudhary
Pramod Goenka
Suresh Kumar Agarwal
23

Eminent Panel of Jury Members for Research Oral & Poster presentation atthe 28"" Biennial Conference of the Home Science Association of India,
Kolkata Chapter
*. . Textile Science, Design, Clothing and Fashion Studies
1. Prof. (Dr.) A. K. Samanta, Professor in Textile Chemsitry and Academic inOcharge, Institute of Jute
Technology, Kolkata
2. Dr. Gautam Basu, Senior Scientist, National Instituteof Research Jute and Allied Fibre Technology. Kolkata
3. Mrs. Nishi Surana, Senior Lecturer, Department of Consumer Sciences, University of Swaziland. Luyengo,Swaziland
Human Development, Family Studies and Early Childhood Education & Development
1. Dr. Kumudhavalli Sarangapani, Principal, S. P.N. Doshi Women's College, Mumba
2. Dr. Krishnakali Bhattacharya, Senior Lecturer, J. D. Birla Institute, Kolkata - 700020
3. Ms. Sarbani Goswami, Research Officer, Department of Women's Study, Jadavpur University, Kolkata
4. Dr. Saugata Basu, Reader, Department of Pshychology, Rajabazar Science College, Calcutta University
5. Dr. Sadhan Dasgupta, Reader, Department of Applied Psychology, Calcutta University, Kolkata
6. Dr. Paromita Ghosh, Reader, Department of Home Science, Calcutta University, Kolkata
7. Prof. Indrani Mukherjee, Department of Applied Psychology, Calcutta University, Kolkata
Foods, Nutrition, Dietetics and Hospitality Management
1. Dr. Vinita Narula, Vice Principal & Associate Professor in Food & Nutrition, Lady Irwin College of HomeScience, New Delhi
2. Prof. Lalitagauri, Professor, Department of Food Technology and Biochemical Engineering, JadavpurUniversity, Kolkata
3. Dr. A. K. Mukhopadadhyay, Scientist, National Institute of Cholera and Enteric Diseases, Kolkata
4. Ms. Babita Hazarika, Chief Dietician. Appolo Gleaneagles, Kolkata
1 rFamily Resource Mah^gemeht
1. Dr. Priya Dasgupta. Selection Grade Lecturer, Department of PGSR in Home Science, SNDT WomenUniversity, Mumbai
2. Nandini Chatterjee, Dean Social Science, Department of Home Science, Calcutta University
3. Dr. Soma Dasgupta, Ex-Lecturer, J. D. Birla Institute, Kolkata
4. Dr. Dalia Chakraborty. Professor, Department of Sociology, Jadavpur University, Kolkata
Extension Education and Communication
1. Dr. Tandra Mitra, Adult Education & Extension, Jadavpur University, Kolkata
2. Prof. Mita Banerjee. Professor, Department of Education, Calcutta University, Kolkata
3. Dr. Ratneswar Bhttacharya, Director. Centre for Adult Continuing Education and Extension. KalyaniUniversity
4. Ms, Jaya Basu Sarbadhikary. Visiting Faculty, J. D. Birla Institute, Kolkata
24

SWAMI ATMAPRIYANANDA
J
Before becoming a monk, SwamI Atmapriyananda completed his doctoral programme
leading to PhD degree from the Department of Theoretical Physics, University of Madras,
Chennai, in 1975. While at Chennai he was drawn to serious spiritual life of meditation and
service as a result of his close interaction with Ramakrishna Math, Chennai. Inspired by the
ideal of renunciation and service as taught by Sri Ramakrishna, Sri Sarada Devi, Swami
Vivekananda and the direct disciples of Sri Ramakrishna, he joined Ramakrishna Mission
Saradapitha as a Bralimacharin (spiritual trainee) in 1978. He was appointed the Principal of
Ramakrishna Mission Vidyamandira in 1992, a post he held till July 2005. The Institution, under his leadership,
was awarded an A+ grade by the National Accreditation and Assessment Council (NAAC).
In July 2004, Swami Atmapriyananda headed a committee whose efforts culminated in the Government
of India, through the Ministry of Human Resource Development, on the advice of University Grants Commission,
New Delhi, declaring Ramakrishna Mission Vivekananda Educational and Research Institute as a deemed-
to-be-University. The name of this Institute was subsequently changed to 'Ramakrishna Mission Vivekananda
University'. Swami Atmapriyananda was appointed the first Vice Chancellor of this University in 2005, a post
that he still holds today.
Swami Atmapriyanandaji would be talking on ̂ Knowledge Creation vs Knowledge Application: Science
vs Technology'.
PROF. (MRS.) MARIAMMA A. VARGHESE
A PhD from IOWA State University, USA and D.Litt from SNDT Women's University,
Mumbai, Dr. Mariamma Varghese has been the Vice-Chancellor of SNDT Women's University,Mumbai from 1996 to January 2001 and a Senior Educational Consultant with NAAC,Bangalore. In the capacity of the latter she has re-designed the Methodology for Re-accreditation
in order to make the assessment process focused and objective. She has been instrumental in
redesigning the CGPA system for Assessment and Accreditation and in developing a road map
for the XI Plan. Under her guidance the E-assessment instrument was developed in collaboration
with INFOSYS. She has assessed and accredited 25 institutions, both Universities and Colleges, in the country
and has been conducting Peer Team Training for the assessors.
She has been the Director of Education, CIL of Ministry of Human Resource Development (MHRD);Director, Education Management Services, Bangalore; Member of the Advisory Board for Jamnalal Bajaj
Foundation; Hon. Secretary of National Society for Clean Cities, Mumbai; Member of the Governing Board for
Children of the World; Director for the Urban Basic Services for the poor for Mumbai Municipal Corporation.
She has also been a reader with J D Birla Institute that is affiliated to the Jadavpur University of Kolkata.
She has been a recipient of Ford Foundation Fellowship for her Masters and PhD programmes.
She has been the President's nominee to the National Distance Education Council, to the Court of
Jawaharlal Nehru University and has served in the High level Committee on implication of Supreme Courtjudgment on Minority Institutions. She has been the Principal Investigator to several Community Development
oriented projects sponsored by International agencies like IRDC, WHO, UNICEF & UNESCO.
Dr. Varghese has guided several Master's, MPhil, and PhD thesis apail from a number of projects. She
has authored many books and journals articles. Among them are Women in India. Women Admini.strators in
Education, Resource Management, Ergonomics, and Ergonomic Evaluation of Women engaged in different
occupations and Applied Ergonomics.
Dr. Vaighese would be talking on "Application of Science and Technology in Home Science
25

PROF. (Dr.) MOHAN RAO
Dr. Mohan Rao is Professor at the Centre of Social Medicine and Community Health. Schoolof Social Sciences, Jawaharial Nehru University, New Delhi. As a medical doctor who hasspecialized in public health, he has written extensively on health and population policy and onthe history and politics of health and family planning. He is the author of From Population
Control to Reproductive Health: Malthusian Arithmetic (Sage, New Delhi, 2004) and has
edited Disinvesiing in Health: The World Bank's Health Prescriptions (Sage, New Delhi,1999) and The Unheard Scream: Reproductive Health and Women's Lives in India (Zubaan/Kali for Women,New Delhi, 2004). His new volume, co-edited with Sarah Sexton entitled Markets ami Malthus: Gender,Population and Health in Neoliberal Tunes (Sage, New Delhi) is forthcoming. He has been a member of theNational Population Commission and is actively involved with the Jan Swasthya Abhiyan.
Professor Shreenivasan would be talking on 'Globalisation & Health: The Indian Case'.
PROF. (Dr.) S. SHREENIVASAN
Dr. S. Sreenivasan is the Director of Central Institute for Research on Cotton Technology(CIRCOT), Mumbai. A PhD in Physics from University of Kerala, he has been a recipient ofvarious awards, medals and titles - V. Sivaramakrishna Iyer Memorial Gold Medal and V. S.Subramania Aiyar Gold Medal both from the University of Kerala. He has been the fellow ofthe Textile Association of India (FTA), Chartered Textile Technologist and Fellow of TheTextile Institute Manchester, UK. He has also received the Magnum Foundation Award forBest Fibre Technologist, 2003 from Magnum Foundation, Nagpur and Sardar Pate! Outstanding
ICAR Institution Award for the year 2004. He has been a Member, International Workshop Organizing /Steering Committees (IWOC) of International Cotton Genome Initiative (ICGI), 2004. He has been the recipientof the Rajrishi Tandon Rajbhasha Puraskar of ICAR 2005-06 and the Accomplishment Award at Advances inTextiles, Machinery, Non-wovens and Technical Textiles-2009 award jointly by Bannari Amman Institute ofTechnology; Coimbatore and Texas Tech. University, USA in 2009.
Dr. Shreenivasan has 35 years of research experience in Fibre Science and Technology. He has 5 patents to hiscredit and has published over 150 papers, published 4 books and about 110 bulletins. He has taught at Universityof Mumbai and Shivaji University, Kolhapur and has provided research guidance to M.Sc students studyingTextile and Clothing and students doing PhD in Physics.
Professor Shreenivasan would be talking on 'Value addition to Natural Fibres: A Sustainable EconomicActivity for Upliftment of Rural Women'. . V • ̂
PROF. (Dr.) T. T. SHREEKUMAR
Prof. Sreekumar is an assistant professor at the Communications andNew Media Program of the National University of Singapore (NUS). Prior to joining NUS, hetaught at the University level in India and Hong Kong. Prof. Sreekumar earned hisM.Phil, in Applied Economics from Jawaharial Nehru University, and has
a PhD in the Science, Technology & Society stream from Hong Kong Universityof Science and Technology.
His research interests include the Impact of the Internet in Developing Countries, with afocus on Community Informatics and the Digital Divide, ICTs and Innovation Systems in Asia, ICTs andCivil Society in South Asia, ICTs and Political Economy of Development, IT, Tourism and Development,Global Civil Society and New Social Movements. Dr Sreekumar has published numerous articles in reputedjournals such as Science, Technology and Society, Media Culture and Society and International Journal
26
if

of Technology and Management. He has contributed chapters in books by prestigious publishers such as
Sage, Orient Longman, Palgrave Macmillan, to name a few.
Dr Sreekumar has attented and presented a number of papers at National and International conferences in the
USA, Norway, Peru, UK, Italy, Phillipines, Vietnam, Indonesia and Thailand.
Professor Shreekumar would be talking on 'New Media Technologies and Rural Communities: Challenges
& Potential'.
Dr. MAHTAB S BAMJI
Dr. Mahtab Bamji got PhD in Biochemistry in 1961, from Bombay University while doing
research at the Indian Institute of Science in Bangalore. After three years of post doctoral
experience at the Tufts University Boston and John's Hopkins University Baltimore, USA she
joined the National Institute of Nutrition in Hyderabad in 1965, and retired from that Institute
as Director Grade Scientist in 1994. She has over 200 publications, has guided 10 students for
Ph.D. and edited a very popular Text Book of Human Nutrition 3"* edition of which is under
print. She was the contributing editor of Nutrition Reviews, USA for 15 years.
Dr. Bamji has developed biochemical tests for assessing B-vitamins status and used them for deriving nutrient
requirement of Indians. The Glutathione reductase test developed by her for assessing vitamin B, status is now
used internationally.
Dr. Bamji is the fellow of Indian National Science Academy, National Academy of Agricultural Sciences,
National Academy of Medical Sciences and Hon. Fellow of the AP Academy of Sciences. She has received
several national and international awards including National award for Woman Bio-scientist for the year 2000,
and Sir CV Raman medal of the Indian National Science Academy, 2005. Dr. Bamji has been a member ofmany policy making and advisory committees. She chaired the National Task Force for Women in Science,
under the Ministry of Science and Technology from2005-2009.
Since her retirement Dr. Bamji has been associated with an NGO. Dangoria Charitable Trust as INSA Honorary
Scientist, and working in the villages of Medak district near Narsapur. Her effort is to evolve strategies forimproving health, food, and nutrition and environment security through scientific and technological interventions
and with women's participation.
Dr. Bamji would be talking on 'Diet, Nutrition & Health: Problems & Possibilities'.
Dr. KUMUD SHARMA
Dr. Kumud Sharma is the former Director and currently the vice-chaiiperson at the Centre
for Women's Development Studies. She is a former President of Indian Association of Women's
Studies. A PhD in sociology, she has several books and research publications to her credit.Her main areas of interest are Sociology of Development: Women's Studies; Women and
Work; Women and Natural Resource Management; Women's Movement; Women in thePolitical Process; Women and Governance etc. She has also worked on issues related to
gender implications of macro economic policies and is currently working on issues related to
gender and poverty; gender & environment and women in local self government. She was a consultant with the
International Centre for Public Enterprises, Lublanja, Yugoslavia and was a visiting fellow at the Simone De
Beauvior Institute, Concordia University Canada. She has served on academic/advisory bodies of Jawaharlal
Nehru University; Indira Gandhi National Open University; National Institute of Public Cooperation and ChildDevelopment; Rajiv Gandhi Foundation's Task Force on Panchayati Raj.
27

Dr. Shanna would be talking on 'Emergence of Women's Rights through Social Changes & TechnologicalAdvancements
PROF. (Dr.) VUAYA KHADER
Prof. (Mrs.) Vijaya Khader, an M.Sc and PhD in Food and Nutrition has worked as Associate
Dean at College of Home Science, Bapatla, as the Principal of College of Home Science,
Hyderabad, as the Director, Center of Advanced Studies in the field of Foods and Nutrition,
and Dean Faculty of Home Science, Acharya N. G Ranga Agricultural University.
She has completed 20 independent ad hoc research projects financed by National and
International organizations. Dr. Khader fabricated and patented two equipments - Low Cost
Ice-cream Freezer and Multi-purpose Fresh Fish Vending and Display Table.
She is the recipient of State Best Teacher Award; Appreciation Certificate from ICAR; Women of the year
1998 & 2000 (American Biographical Institute); Bharata Mata Award 2001 (from Astrological Research Project,
Viswa Jyothl Prishad, Calcutta); Best Citizen of India 2002 (International Publication House). She received the
Fellow ofAssociation of Food Scientists and Technologists Award in 2004 at CFTRI, Mysore and the Outstanding
Woman Professional Award for the year 2007-2008, by Federation of Indian Chambers of Commerce and
Industry (FICCI).
Dr. Khader would chair Technical Session-Ill as an eminent Home Scientist.
Dr. ELADEDHIA
Dr. (Mrs.) Ela Manoj Dedhia, PhD in Textiles & Clothing and Post Graduate in Education
Management is an Associate Professor at the Department of Textiles & Fashion Technologyof College of Home Science Nirmala Niketan, affiliated to the University of Mumbai.
She has 27 years of teaching experience. She has contributed to framing of curriculum forundergraduate and post-graduate degree and diploma courses in the field of textiles and fashion.Dr. Dedhia has a wide research experience and has successfully guided several PhD and
M.Sc research scholars. She is a consultant for UNDP and UGC research projects on natural dyes and trainingof crafts-persons.
She has presented several research papers in National and International Conferences and has published severalpapers in national and international journals. She has also acquired a few patents and has been honored asFellow by the Textile Association of India.
She has been the vice-president (Western Region) of Home Science Association of India. She is currently thepresident of Home Science Association, Mumbai Chapter; Member of Board of Studies of University of Goa,Member of Advisory Board of School of Fashion Technology (SOFT) Pune, Member Advisory Committee forPost Graduate Courses of Dr. B. M. N. College of Home Science SNDT Women's University, among others.She is also the chairperson of Society of Dyers and Colourists, Mumbai Region and is the design advisor forKhadi Village Industries Commission Cell. She recently chaired the prestigious Biennial Congress of ARAHE.
Dr. Dedhia would chair Technical Session-II as an eminent Home Scientist.
28

SCIENTIST'S AWARD

1

JUNIOR SCIENTIST'S AWARD
Dr. Lakshmi Priya A is senior lecturer with the Department of Interior Design and Decor, JBASCollege for Women (Autonomous), SIET Trust, Teynampet, Chennai - 18
[email protected], (09994111344)
Paper Short Listed for the Award
MICRO LEVEL STUDY OF OZONE CENTRIFUGAL AERATED TECHNOLOGY IN
TREATING THE SEWAGE WATER
Fresh water resources are considered as vital life-giving and life supporting constituents. Resource
Management, a specialized course of study in Home Science, focuses water resource since it has been one of
the challenging priority areas of research gaining national significance. The investigator with keen interest in
attempting to study the pollutants affecting the major surface water reservoir, the Singanallur Lake the water
source and the effect of Ozone treatment in rejuvenating the water body, designed a research study entitled
'Micro Level Study of Ozone Centrifugal Aerated Technology in Treating Sewage Water" with the objective to
find out the nature and extent of pollutants present in the water and find out the efficiency of Ozone treatment
in treating sewage water. The water samples from the canal and nearby bore well were taken and analyzed.
The polluted water was subjected ozone treatment. The surface water and bore well water analysis reported
the presence of pollutants (TDS, TSS, BOD. COD, Nitrate, TPC and Nitrate) above the prescribed water
.standards. The ozone treatment significantly decreased the TDS, TSS. BOD and COD. The ozone treatment
further improved the quality of water by increased the DO level. By further increasing the percentage of ozone
and aeration time the values can be brought to nil. Ozone is the only environmentally friendly and completely
ecological way to produce a healthy chemical free environment in an economical and efficient way.
Saha Ruma is a senior research fellow with the Department of Food & Nutrition, College of HomeScience, Rajasthan [email protected]
Paper Short Listed for the Award
QUALITY ASSESSMENT OF PEARL MILLET GROWN UNDER THREE DIFFERENT
PRODUCTION SYSTEMS
The study was undertaken to evaluate the nutritional, physico-chemical characteristics and sensory
characteri.stics of pearl millet (RHB-121) grown under three production systems i.e. organic, organic intensive
(OI) and integrated nutrient management (INM). Pearl millet samples of each production systems were subjected
for analysis of proximate composition, vitamin C and mineral contents. The estimated values for moisture were
found to be 9.82 to 9.98 g/IOOg. Comparing the protein (12.96, 11.24 and 11.19 g/lOOg). fat (7.00.7.25 and 8.50
g/lOOg), fiber (1.56,1.31 and 1.25 g/IOOg), mineral (2.51. 2.01 and 2.11 g/lOOg) and energy (379,44. 383.09 and
389.66 Kcal/lOOg) contents with in three production systems, significant variation were noted at 5% level of
significance. While carbohydrate content was found to be 66.15. 68.22 and 67.10 g/lOOg in organic. OI and
INM samples respectively with non significant differences. The difference in the values of vitamin C was also
noted to be significant among organic (0.5 mg/lOOg). OI (0.2 mg/lOOg) and INM (0.1 mg/IOOg) samples.
Among three samples non significant variation was observed in iron (7.32-7.79 mg/lOOg) content whereas
significant difference was observed in calcium (40.66-42.42 mg/lOOg). phosphorus (238-376 mg/10()g) and zinc
( 2.56-2.85 mg/lOOg) content respectively. Non significant difference was observed in seed weight (7.46 to
8.47 g/IOOO seed) and seed volume (0.019 to 0.29 ml/seed). Organic sample significantly varied with respect toits water retention and swelling index values from OI and INM. The overall acceptability scores were found to
31

be 8.05. 7.90 and 7.80 for organic, 01 and INM respectively. Similarly khicluki developed by organic pearlmillet also .secured higher score for overall acceptability i.e. 8.08 as compared to other two samples (7.83-7.90). With an overview of the study it can be concluded that organic sample had better nutrient content,physico-chemical properties and higher sensory scores as compared to two other samples.
MID-CAREER SCIENTIST'S AWARD
Dr. S. Amsamani is currently a Reader at Department of Textiles and Clothing, Avinashilingam Universityfor Women, Coimbatore, Tamil Nadu. She has a teaching experience of 16 years (since 1991) at the
Institute. She has published several papers that are listed below apart form reading papers at various
national and international conferences.
Paper Short Listed for the Award
DEVELOPING HERBAL FINISHED BABY NAPPY PADS
Evolution is constant and human race is constantly trying to upgrade to better quality of life. One of the
outcomes of this "growth" is the need for healthier living through better hygiene. Health care textiles consist ofabsorbent disposable products, such as nappy pads, sanitary napkins, tampons, incontinence products, paniy
shields and wipes which are mostly single use items designed to receive, absorb and retain body fluids and solidwastages. Nappy pads are made up of different kinds of fibers such as cotton, rayon, wood pulp, cotton linters
and super absorbent viscose. Usually nappy pads utilise cellulose fluffs combined with super absorbent polymers
to create the absorbent core which acts as a storage structure in the product. These cellulosic materials used in
nappy pads are easily degraded by microorganisms which are present in the urine passed by the baby which willcreate adverse effects to the sensitive skin of babies resulting in nappy rashes on the genital area, the folds onthe thighs and the buttocks of the baby. As it is a commonly accepted principle, prevention is better than cure
and hence maintaining a better hygienic environment will obviate the need for curative measures. The populationexplosion and the environmental pollution in the recent years forced the researchers to find new health and
hygiene products for the well being of the mankind. Hence this search was carried out to design nappy pads
with natural herbal plant extracts to control microbial activity. The results have a .strong foundation for productionof antimicrobial finished nappy pads.
Dr. (Ms.) Deepali Singhee is currently the Principal of J D Birla Institute (affiliated to JadavpurUniversity, Kolkata) and Reader in textiles and Clothing. Dr. Singhee has 15 years of teaching to her
credit. She completed her PhD under Prof. Asis Kumar Samanta (Professor in Textile Chemistry, Institute
of Jute technology, Kolkata) and Prof Kumar Kanti Mahalnabis (Ex-Head, Department of Chemistry,
Jadavpur University). Apart from attending and participating in various national and international
conferences she has also published several papers in reputed national and international referred journals
[email protected], 09331040390
Paper Short Listed for the Award
STUDIES ON SELECTIVE CHEMICAL TREATMENT OF JUTE,
COTTON AND JUTE-COTTON UNION FABRICS
Jute, cotton and jute-cotton (75:25. w/w) union fabrics have been subjected to ambient (.3()"C) room
temperature bleaching under the combined oxidative action of H,0, and K,S,0^ under varying conditions of
32

ireatment, to optimize an energy efficient low temperature bleaching of the said fabrics. Acomparative assessment
of all important textile related properties, changes in surface appearance, chemical functionality and thermal
behaviour have been made for standardizing the optimum conditions of this said low temperature bleaching
method for all the three different fabrics.
Jute-cotton union fabric has been subjected, separately, to varying dosages of mixed enzyme (mixture ofcellulose, xylanase and pectina.se) with or without .selective pretreatments with NaOH. steam and H,0,. etc..under selective treatment conditions. Maximum enhancement in enzyme action is obtained by sequential scouringand H,0, bleaching pretreatment with the use of Stabilizer-AWNl. and in general the enzyme action is found tobe more pronounced in cotton direction than in the jute direction. Study of the scanning electron micrographs.
DSC thermographs and X-Ray crystallanity data gives an insight to this bio-chemical modification.
Jute and jute-cotton union fabrics treated with selective UV-absorbers (benztriazole and benzophenone)and antioxidants (metliyl-ehtly-ketone. lauryl thio-di-propionate and sodium azide) compounds were subjectedto photo-exposure under UV-light for different durations (0- 320 h) and the corresponding changes in thesurface appearance properties as well as retention of tensile strength have been assessed. 1-2^'r benztriazolewas applied on jute and jute-cotton union fabrics by two different techniques (pad-dry and exhaust process i.e.bleach-bath) under acidic or alkaline pH. respectively. Pad-dry technique renders better stabilization of whitenessbut is associated with higher loss in tensile strength than that obtained by bleach-bath technique. The possiblereactive interaction between benztriazole and jute has also been explored.
The efficacy of the above said newer process of bleaching jute fabric using 2% (benztriazole in H,0,bleach-bath referred here as the NUVA-Process, has been compared with that of the other known stabilizedbleaching of jute (Huetex and chemically dehairing cum bleaching i.e. CDB proce.ss). conventional hot H,0,bleaching process, sequential texturing and bleaching (STB process), etc. with respect to their bleachingperformance index and whiteness stabilization after photo-exposure under UV-light for .320 h. Selectiveconventional (dimethylol-dihydroxy-ethylene urea i.e. DMDHEU) and unconventional (aciylamide formaldehydei.e AMF-resin and thiourea formaldehyde i.e. TUF-resin) cross linking agents (resins) were also applied on jutetabric after the said bleaching process, and also prior to the same, to assess the relative performance of thisreverse order in the sequence of treatments. AMF-resin pretreatment followed by conventional H,0, bleachingor chemical dehairing and bleaching provides most advantageous property balance with less fibre damage andstrength loss and good degree of whitene.ss stability. Use of 2% acrylamide or 2% cationic softener in the resin-bath restricts the strength loss to a minimum; however. 2% benztriaole along with AMF-resin does not producedesired whiteness stabilization, rather it increases its strength loss. On the other hand, application of 2%benztriazole in the dye-bath during dyeing jute fabric with reactive dye is found to provide higher dye-uniformityand better light fastness rating than that obtained by sequentially dyeing and application of benztriazole by pad-dry technique.
SENIOR SCIENTIST'S AWARD
Dr.MRThilakamReader, Department of Resource Management with 29 years of under graduate and post graduateteaching experience. Guided four M.Phil research and has more than 40 publications in journals, conference/ seminar proceedings and Souvenirs
Paper Short Listed for the Award
designing and EVALUATING PORTABLE VERMICOMPOST DEVICES AND ASSESSINGTHE EFFICIENCY OF COMPOST PREPARED USING DIFFERENT METHODS
Most of the urban cities are facing problems of waste collection, treatments, and disposal due to increasingpopulation, rapid urbanization, industrialization and commercialization. Hence effective planning ol solid waste

recycling programme is a substantial challenge for current solid waste management system in India, due todepletion of land fill space and delay in construction of municipal incinerators. Compost is the most widelyapplicable process for handling diversified wastes especially garbage. Vermi composting a technique of usingearthworm for converting biodegradable solid waste into manure is considered to be the most ideal method for
individual houses since it is appropriate for treating smaller quantities of garbage. Two groups of trainees from
the rural and urban sectors had been deliberated the modusoperande of vermin composting with the help of awomen upliftiment cell using visual aids. Twenty per cent of rural homemakers and 40 per cent of urbanhomemakers had initiated to start the venture. Lack of space was the main reason given by the urban homemakers
for not adopting the technique. Hence portable VermiCompost device 1 was designed using deal wood, device'y was designed using bamboo reed. Both the devices were felt for operation and effective. There was nodifference in the number of days taken for composting (40-45 days) between both the devices. Cow dung +waste-i- EM-t- earthworm look a minimum of 52 days for composting followed by EM + waste which look 57days for composting. Assessing the efficiency of the compost prepared revealed that amaranthus treated withvermicastino showed a fa.ster growth followed by vermicompost and vermiwash. Biometric observation of theoermination of ladies finger seeds in the .selected composts also showed the .same trend. The nitrogen and phosphorouscontent of the prepared compost was found to be maximum in the compost prepared using cow dung. E.M..solution waste and earthworms. By utilizing earthworm's - the friend of farmers the intestine of the soil, we
manage the organic waste as a sustainable asset and improve the environment.can
Dn Vinya Madane
Paper Short Listed for the Awardthe impact of economic and social policy decisions
ON THE FAMILY IN A COMMUNITY CONTEXT.
In India economic reforms were started from 1991. With the acceptance of "New Economic Policy", weoet bounded firmly to the Globalization, imposing concrete foot print on social life with the help of technologyadvancement The effect can be seen with both positive and negative side. Positively thinking we got vast openmarket for industrial as well as for agricultural produce. This has produced gains in productive efficiency buthas also c»reatly strengthened the hand of the already powerful, including certain national and international elite,as well as creditor countries and international financial institutions, at the expense of poorer groups and countries.By getting the right value for production, circulated excess money have changed the mentality lor bettermentof education health care, tours and travels, accommodation status etc. To cope with these amenities, communitystarted using latest technology, like e-revolution. 'The Negative Effect' observed is man-inachinc relationshipwhich leads to urbanization. Again working .stre.ss resulted in addiction. Excess money pushed the youngster inpub culture Modification in the organization of work, changes in the work places also affected the family. Aspeople compete as economic actors, they are required to be flexible spent long hours on the jobs not compatiblewith family life. The technologies allow families to put old behaviors and relations into new contexts. Technologydoes not just play an economic role in defining families and communities, but also a metaphorical, symbolic one.

EXTENSION EDUCATION AND COMMUNICATION
(Oral & Poster Presentation)


EEC/Oral/1
Ensuring the Survival of the Girl Child: An Analysis of Cash Incentive Schemes in Haryana
Ruchi Gaur' & Sarita Anand-
1. Research Scholar, Dept. of Development Communication and Extension, Lady Irwin
College, University of Delhi (New Delhi)
[email protected]/ruchigaur [email protected] (09899062104)
2. Reader, Dept. of Development Communication and Extension, Lady Irwin college.
University of Delhi (New Delhi)
ABSTRACT
In India, the gender gaps can be identified through a disparity between males and females
on various demographic and sociographic indicators. According to 2001 census, the child
sex ratio, which is poweiful indicator of the status of girls, stood at 927 girls per WOO boys.It has further plunged with figures of less than 900 girls in states of Punjab, Haryana, Delhi.Himachal Pradesh and Gujarat. The status of girl child has lately become a focus of nationalconcern reflected through policies, programmes and schemes for the same with Haryana
being the first to take an initiative through incentive schemes. The study conducted in 2008evaluates Apni Beti Apna Dhan and Ladli - cash incentive schemes in Haryana and reveals
that though the schemes aim to improve knowledge and favorable attitude among thebeneficiaries, yet the utilization has not been to a great extend. The cash grant is perceivedas an incentive to be utilized for their dowry thereby adding a little to their status. The dataalso reveals that a significant role is played by the Anganwadi worker at the village level indissemination of information and in provision of assistance for the schemes. The effort
made by Haryana government is a step towards improving the status of the girl child; yet theschemes fail to benefit the middle and higher income group who equally practice femalefoeticide.
INTRODUCTION
The declining child sex ratio (F/M) has been one of the important concerns in India's demography in recenttimes. The 2001 Census of India shows an unusually high sex ratio (females per thousand males) for children in0-6 years of age in the country as a whole. Though there has been an increase in the overall sex ratio from 927in 1991 to 933 in 2001, which is a good news, the worrying news is that the sex ratio figures (number of femalesper thousand males) of children below seven years has fallen markedly from 945 in 1991 to 927 in 2001.However, the child sex ratios are the lowest ever in some of the affluent states of the country situated innorthern parts of India like Haryana, Punjab, Himachal Pradesh, Delhi, Gujarat. In India as a whole son preferenceis stronger in the North than it is in other parts of India. The sharp decrease in the 0-6 year's sex ratio in thenorthern states of India is commonly assumed to be the result of the rapid spread of the use of ultrasound andamniocentesis for sex determination, followed by sex selective induced abortions (Arnold et al., 2002). Factorslike practices of exorbitant dowry payments to get daughters married and the overwhelming fear of sexualexploitation and abuse in socio milieu serve as other prominent deterrents to die girl child's arrival in Indianhomes.
IM isn im un tmi
Fig 1: Child Sex Ratio, India (1961- 2001), Source - Census of India, 2001
37

Sex ratio in Haryana never reached the figure of 900 since 1901 census. Earlier it was due to infanticide andnow this decline points to sex selective abortions that has gained currency during the 1980s and more sharply inthe 1990s. As a result of sharp decline in the sex ratio, Haryana has begun experiencing a serious shortage ofmarriageable girls, although this is not matched by any increase in status of women. Sex determination tests andfemale foeticide are on rise as people inherit 'son syndrome'. The preference for the male child in our .socio-
cultural milieu is justified by the perception of female child as a liability and male child as an asset.
To stop the abuse of advanced scientific techniques for selective elimination of female foetuses through sex -determination, the government of India passed the PNDT Act in 1994. But the techno-docs and the parents
desirous of begetting only sons had subverted the act. The Pre-conception & Pre-natal Diagnostics Techniques
(Regulation and Prevention of Misuse) Amendment Act, 2002 received the assent of the President of India on
17-1-03, increasing the conviction for the culprit to 3-year imprisonment and a fine of Rs. 50000/-. In addition to
legal action and awareness campaigns, 'Apni Beti Apna Dhan' was launched in 1994 in Haryana to help inraising the overall status of the girl child and bring about a positive change in family and community attitudes. Acash grant of Rs 2500 was made in the name of the girl child (up to 3 per mother), which is invested, in afinancial instrument for education of girl child and to make her economic independent. This is paid to the girl
when she attains the age of 18 years and remains unmarried till then. Under the "Ladli" scheme implemented
by the Haryana government, an amount of Rs 5,000 every year for five years would be provided to parents onthe birth of a second daughter.
Government policies reflect that such schemes and programmes focusing on economic benefit being attachedto the birth of girl child have a potential to alter the sex ratio and gradually appeal to the mindset of masses,raising the overall status of girl child in Indian society which will ultimately lead to balancing the declining sexratio and thereby making the uncounted girls count. However, among researchers and activists there is aconstant debate on whether such programmes can really achieve such objectives. Therefore, there is a need to
analyze these schemes from people's (beneficiaries and non-beneficiaries) perspectives.
AIMS & OBJECTIVES
The study was undertaken with the following objectives:
1 To identify and analyze the programmes/schemes being implemented for restoring the balance of sexes inChild Sex Ratio (0-6 years).
2 To determine the knowledge level of the beneficiaries about the schemes.
3. To study the perception of beneficiaries about the usefulness and relevance of such programmes.
MATERIALS & METHODS
Locale • The figures of 2001 Census have reported that the Child Sex Ratio in the Haryana has plunged withless than 900 girls per 1000 boys in the age group of 0-6 years showing less tolerance to the girl child.According to Census 2001 Haryana has got the second lowest Child Sex Ratio i.e. 820 girls per 1000 boys.The situation has worsened since 1991; almost all districts in 2001 record a child sex ratio of less than 850
girls to 1000 boys with districts like Kurukshetra, Sonipat, Kaithal, Ambala and Rohtak are critical with lessthan 800 girls to 1000 boys. Kurukshetra, Jind and Gurgaon were selected as the locale of the study with anaim to study the district with lowest, average and highest child sex ratio - Kurukshetra with 770. Jind withchild sex ratio clo.se to the state average - 818 and Gurgaon with the state's highest child sex ratio of 863
girls to 1000 boys.
From the selected districts, two blocks were selected based on their geographical location i.e. one block in
which the district headquarter is situated and the other which is close to the national highway. Two villageswere selected randomly from each block.
38

Fig 2: Child Sex Ratio, Haryana 2001, Source - Census of India, 2001
• Tools and techniques: Checklist, interview schedules and focus group discussions were used in the
study.
RESULTS & DISCUSSIONS
• The schemes: The cash incentive scheme 'Apni Beti Apna Dhan' was introducedin Haryana State on 2"'' October 1994. It aimed to reduce demographic imbalance between sexes and delaythe age of marriage of girls to at least 18 years. The scheme provided Rs 500 to the mother for her nutritionand recoupment of health and Rs 2500 were invested in favour of girl child within 3 months of her birth forfive consecutive years in the post office. Those eligible were the girl children bora on or after 2-10-1994 infamilies living below poverty line. However, Ladli was introduced on 20"' August 2005. It aims at combating
the menace of female foeticide, restore the demographic sex ratio imbalance and to facilitate the birth ofmore girl children. The eligible parents must be residents of Haryana, or having Haryana domicile, whose2nd girl child is bom on or after 20th Aug, 2005 are eligible for this cash incentive irrespective of their caste,creed, religion, income and number of sons. The scheme provides Rs.5000/- on the birth of 2nd girl child perannum for 5 years. However, earlier the investment of Rs 5000 for five years was made in post officesavings scheme but since 2008 the investments are made in LIC scheme.
• Knowledge, perception and usefulness to the beneficiaries: All the ABAD and Ladli respondents
were aware of the scheme under which their daughters were eligible for the cash grant and AWW was themain source of information about the scheme. However, it was found that their knowledge level regardingthose eligible for getting the benefits under the scheme was quite low. In case of ABAD scheme, majorityof the respondents did not get the post delivery benefits on time and the reason they gave for this was thatthe application was submitted late. Most of the respondents (for both the scheme) had knowledge about theamount of money invested in the name of the girl child but they had no knowledge about the scheme in whichthe amount was invested. All the respondents agreed that the scheme will help in delaying the age of themarriage and that cash grant cannot empower the girl child as it will be utilized for her dowiy. Majority ofthe respondents still considered their female child as burden for which they gave the reason that they cannot
depend on girls in old age, girls have to be given dowry, their movement have to be watched as they may besubjected to sexual abuse, they have to go to others home so no benefit to the parents and they cannot go
out, work and support the parents throughout their life as sons do. Majority of the respondents suggestedthat some amount out of the total amount invested in the name of the girl child should be released so that it
can be utilized for their education, which according to majority of them was a must for their girl child.
39

CONCLUSION
The organization and implementation of the scheme aims to improve knowledge and favourable attitude amongthe implementers and beneficiaries, yet the utilization has not been to a great extend. Though the effort made byHaryana government is a step towards improving the status of the girl child, the schemes fail to benefit themiddle and higher income group who equally practice female foeticide. We need to look at the change inpeople's perspective. The questions raised are why they still want a male heir for their family and how canthese efforts succeed in stopping female foeticide in case of third daughter. The most important question beingwhy the parents are going for the third child in case of two daughters. If yes, then what are their a.spirations?The answer to these will determine the success of government's efforts.
RECOMMENDATIONS
• Since AWWs who play a major role in implementation of the schemes empathize with the families of girlchildren as they belong to the same socio-cultural setup, thus their mindset needs to be changed throughvarious sensitization workshops, seminars and lectures.
• Grassroots level functionaries i.e. the AWWs and helpers have low knowledge about the schemes whichcalls for a proper orientation programme at every level so that proper knowledge about the scheme.s ispercolated at the village level.
• Short term, realistic targets should be set at the district level and some incentives must be provided to thefunctionaries promoting the schemes.
• Since the beneficiaries are found to be illiterate and struggling with keeping of records therefore, assistanceshould be provided at the village level for filling of the forms and compiling of the documents required.
• Complaints must be registered for those eligible but are denied of the benefits because of various rea.sons.
• The schemes should be publicized on equal footing as the .pulse polio campaign and the media, the filmpersonalities; women of substance, civil society, policymakers, and govt. officials .should join together andmake this as mass campaign.
REFERENCES
1. Agnihoiri S B. Sex ratio patterns in Indian population - Afresh exploration. Sage Publications, 2000.2. Anand S. A comparative study of attitudes of people from Rajasthan. Delhi. Haryana. Punjab towards femalefoeticide & female
infanticide. Unpubli.shed Doctoral Research. Delhi University. 1999.3. Bagga C, Even educated are biased among girl child. Times of India, July 14. 2005.4. Bhasin K, Understanding gender. Women Unlimited, 2003.5. Bose A. Curbing femalefoeticide - Doctors, governments <6 civil society ensurefailure. Economic & Political Weekly, February
23. 2002.
6. Dreze J and Sen A K, India: economic development & social opportunity. Oxford University. 1995.1- Ismail S Razia. Perspectives on the girt child in India. Women's Coalition for Petice & Development. 2003.8. Kapur P. Girl child andfamily violence. Har-Anand Publications, 1993.9. Lingam L. Understanding women's health is.sues, Kali for Women. 1998.10. Mazumdar V. Amniocentesis •& sex selection, CWDS. 1994.
11. Miller D B, The endangered sex. Oxford University Press, 1997.12. Nanda B and Ahashi M. Human rights, gender <& environment. Allied Publishers Private Limited. 2006.
13. Nayyar U. The unborn daughters ofDelhi. The Women Press, 2006.
14. Ministry- Mapping the adverse sex ratio in India. Office of Registrar General. India. Ministry of Health & Family WelfareUNFPA. 2003.
15. Patel T. Missing girls in India. Economic and Political Weekly. February 28. 2004.16. Rustagi p. The deprived, discriminated & damned girl child - Story of declining sex ratios in India. Institute of
Human Development. New Delhi. 200617. Sandhu A S. Extension programme planning. Oxford and IBH Publishing Co. Pvt Ltd.. 2003.18. Sen A. Missing women- revisited. Trinity College, 200319. Sohoni N K. Status ofgirls in development strategies. Har-Anand Publications, Delhi. 1994.
40

EEaOnil/2
Off Season Paddy straw Mushroom Cultivation Under Low Cost Polyhouse
Laxmipriya Pradiian', M. P. Nayak- & A. K. Khuntia'
1. Subject Matter Specialist (Home Science), Krishi Vigyan Kendra, Orissa University
of Agriculture and Technology, Ranital Bhadrak (Orissa)
[email protected] (09438149929)
2. Programme Co-coordinator, KVK, Bhubanes%var (Orissa)
3. Technical Officer, AAS, Ranital, Bhadrak (Orissa)
ABSTRACT
Mushroom cultivation is considered to be a remunerative agro-based enterprise. The Agro-
climatic condition of Orissa is conducive for production of paddy straw mushroom during
March to end of October and Oyster mushroom during November to February. As such,
there is demand for paddy straw mushroom round the year, because of its better taste, short
production period, easy and simple cultivation method. Paddy straw mushroom has been in
the peak of both demand and supply in the market in most part of Orissa, but its production
is constrained due to low atmospheric temperature and humidity during winter months
(November to February). The present experimental study was undertaken in 3 villages namely
Gopalpur in Bonia block , Jamojodi in Tihidi block and Bandhantia in Dhamnagar block
of Bhadrak district of Orissa to study the "Performance of paddy straw mushroom (Volvarilla
volvaceae) in winter under low cost polyhouse" through Krishi Vigyan Kendra, Bhadrak.
Paddy straw mushroom was cultivated during the months of November to February under
low cost polyhouse of dimension of 20ftxl0ftx9ft in 3 villages with twenty beds during
each fortnight. Observation of temperature and humidity were taken through thermo-
hygrometer and productions were taken on a fortnight inten'al. It was found that, the average
production of paddy straw mushroom is 965gms per bed during winter under low cost
polyhouse as against 1.5 kg in the peak season.
INTRODUCTION
Paddy straw mushroom {Volvariella volvaceae) is one of the most tropical mushrooms suitable for cultivation
in summer and rainy season (March to October) when the atmospheric parameters like temperature and humidityvaries almost within 25-38®N and 80-85% respectively. The production of paddy straw mushroom is seriouslyaffected during winter months due to prevailing low temperature and humidity. Because of its better taste, shortproduction period, easy and simple cultivation method, paddy straw mushroom has been in the peak of bothdemand and supply in the market in most part of Orissa. Even though mushroom is in the traditional food habit
of the people of Bhadrak district, oyster mushroom has not gained that popularity because of its relatively poorcooking quality. This has become a major challenge for the mushroom producers both in marketing their produce
(oyster mushroom) as well as to meet a virtual demand of paddy straw mushroom during winter, but cultivationof this mushroom becomes difficult in winter season. So keeping this in view, Krishi Vigyan Kendra Bhadrak
has tried an innovative technology of production of paddy straw under low cost polyhouse in winter. KrishiVigyan Kendra Bhadrak, conducted an on - Farm Testing entitled "Performance of paddy straw mushroom
{Volvarilla volvaceae) in winter under low cost polyhouse" during the yeai' 2008 - 09.
Poly house is a framed structure covered with transparent material and large enough to grow crops under
partial or, fully controlled condition to get maximum productivity and quality produce.
High-tech polyhouse technology requires huge initial investment and production cost is also very high. The small
and medium farmers cannot afford the technology due to high capital investment. Hence, with UV stabilized
41

polythene, low cost locally available materials like bamboo, sand have been found quite effective in reducing thecost of the structure for off season crop production. Since the major objective of using polyhouse is to regulateatmospheric temperature & humidity. The same technology was thought to be useful for production of paddystraw mushroom.
AIMS & OBJECTIVES
1. To Produce Paddy straw mushroom with control condition of respective temperature & humidity in low costpolyhouse in winter (Off Season).
2. To meet the demand of the market.
MATERIALS & METHODS
Krishi Vigyan Kendra Bhadrak has taken an experimental study entitled "Off Season paddy straw mushroom
(Volvarilla volvaceae) production under low cost polyhouse" in Bhadrak district of Orissa. This technologytesting commenced from November 2008 and continued up to February 2009. Three numbers of trial were
taken in three villages namely, Gopalpur in Bont block and Jamojodi in Tihidi block Bandhantia of Dhamnagarblock in Bhadrak district. Low cost polyhouse frames made up of bamboo, G.I. wires, flooring with 6" sand bed,roofing with 200/j U. V. stabilized polythene with dimensions of 20ftxl0ftx9ft were erected. An adjusted ihermo-
hygrometer was fixed in this polyhouse to take observations on temperature and humidity inside the polyhouse.
Twenty paddy straw mushroom beds were laid inside the polyhouse in every fortnightly. The temperature andhumidity were recorded by thermo-hygrometer on a daily basis.
RESULTS & DISCUSSION
From the observation it was found that, the average production of paddy straw mushroom is 965gms per bed
during winter under low cost polyhouse as against 1.5 kg in the peak season. Higher temperature & humiditycould be maintained inside the polyhouse which facilitate the growth of fungus yielding on an average 965gm/
bed during the winter months under low cost polyhouse.
CONCLUSION
Even though the average production was almost 535gm less than the peak season production of paddy strawmushroom (the average production is 1.5 Kg per bed) during summer and rainy, but the net return is compensated
because of higher market price of paddy straw in winter (Rs.90 to Rs.llOper kg). The mushroom size was big& colour was same as in peak season cultivation.
RECOMMENDATIONS
The initial investment has been calculated to be Rs 4000/- in preparation the polyhouse of size 20' X 10'. This
size of poly house can accommodate 42 beds at a time. Such investment in poly house preparation can berecovered from two batches (84 beds) of production during a period of one month. During a production periodof four months, a farmer can earn a net return of Rs 21,840/- from this size of poly house. As there is a demand
for paddy straw mushroom through out the year in the state because of it's test and consumer preference, the
technology of producing paddy straw mushroom during winter months using poly house could bring a revolutionin mushroom production in the state.
referencesRoy D. Paddy-Straw tmishrooin in Polyhouse. Precision Farming (bulletin in oriya), OUAT. Bhubaneswur (2000). pp. 1-4.
2. ICAR NEWS. 2 (April-June) (200.5), pp. I -2.
42

EEaOnil/3
Connecting People, Empowering Communities - Mapping the Impact of Community Radio Usingthe Most Significant Change (MSC) Technique
Vidhu Kapur', Shweta Vij Anand^ Archana KumaP & Mridula Seth^
1. Executive-Research, Sambodhi Research and Communication Pvt. Ltd (New Delhi)
[email protected] (09971709277)
2. Faculty, Dept. of Development Communication and Extension, Lady Irwin College. Delhi
University (New Delhi)
shwetavij [email protected] (09250849493)
3. Associate Professor, Dept. of Development Communication and Extension, Lady lixvin College,
Delhi University (New Delhi)
[email protected] (09810894390)
4. Visiting Faculty, Dept. of Development Communication and Extension, Lady Irwin College,
Delhi University, Consultant UNICEF for MSc in BCC programme (New Delhi)
[email protected] (09811158447)
ABSTRACT
Community Radio (CR) is increasingly being seen as a tool to facilitate participatory
communication and empowering local communities for bottom up development. CR is
characterized by access, people's participation in production and decision-making and
non-profit listener-friendly economics. A tridy people's radio perceives listeners not only as
receivers and consumers, but also as active citizens and creative producers of media content.
HCR, located in Tehri Garhwal district of Uttarakliand, functioning since 2001, has provedexemplary in putting the tool of communication in the hands of the community for their
cultural sharing, dialogue, growth and development. This paper aims at representing some
insights into the structure, functioning and possible prospective effects of CR on the lives of
the people by analyzing Henvalvani Community Radio (HCR) as one of the case studies of
a CR. The study was conducted in two phases. In the first phase an ethnographic qualitativeapproach was followed to understand the structure of HCR, the dynamics of content formation
of HCR programmes and its transmission. The approach involved interviewing and conducting
focused group discussions with all the team members who have been directly involved inprogramme production process along with the listener groups. Following this, Most Significant
Change (MSC) technique 'was used as an innovative participatory tool for evaluating theimpact of HCR. The technique involves participants narrating their stories about what they
perceive to be 'significant change'. Different stakeholder groups engage in a process ofdiscussion and selection to identify those stories that are considered to be most illustrative
of significant change.
INTRODUCTION
Community Radio (CR) is increasingly being seen as a tool to facilitate participatory communication and
empowering local communities for bottom up development. CR is characterized by access, public participationin production and decision-making, and by a non-profit listener-friendly economics. Atruly people's radio perceiveslisteners not only as receivers and consumers, but also as active citizens and creative producers of media
content. This paper, through a case study approach aims at providing insights into the structure and functioningof Henvalvani Community Radio (HCR), one of the pioneering community radios in India and delineates itseffects on the lives of the people. HCR, functioning since 2001 is, located in Tehri Garhwal district ofUttarakhand.
On a shoestring budget, HCR volunteers have been designing, producing and narrowcasting programmes.
However, the organization has not been able to show the impact of its programmes. The Most Significant
Change (MSC) technique was used as an innovative participatory tool for evaluating the impact of HCR and
understanding people's perspective. MSC was first developed in 1996 by Rick Davies in an attempt to monitorthe process and outcomes of a programme run in Bangladesh by a non-govemmental organization.
43

AIMS & OBJECTIVES
The study was conducted with the following objective:
• To gain insights into the functioning of the Henvalvani Community radio.
• To delineate the issues that has been addressed by the CR programmes.
• To study people's participation' in the Henvalvani Community Radio.
• Map the impact of Henvalvani Community Radio using Most Significant Change (MSC) technique as aparticipatory tool.
MATERIALS & METHODS
The study was carried out in two phases. During the first phase an ethnographic approach was followed that
helped gain understanding of structure and functioning of HCR. For the purpose of understanding structure of
HCR and the dynamics of content formation and transmissions of programmes, semi-structured interview and
focused group discussion were conducted with team members of HCR and listener club members.
As apart of successive analysis, mapping of the impact of HCR programmes was done using the Most SignificantChange (MSC) technique. The broad steps in implementing the MSC technique include building interest in using
the MSC technique; Collection of significant change (SC) stories; Selection of the MSC stories; and Analysisof SC stories. HCR core team was oriented to the concept, methodology and scope of using the MSC technique.
Subsequently, core team members became the core trainers and trained other people in the use of MSC technique.Under the MSC technique domain of story is decided, a domain is defined as broad heading under which stories
are collected. The domain of story collection was identified as ̂ Impact on people because of their engagement
with HCR'. Selection of stories through a hierarchy makes the Most Significant Change (MSC) technique
unique and different from other PLA methods. The stories collected are analy.sed and filtered up throughdifferent levels of stakeholders typically found within an organisation or programme. Story collection and selection
was conducted separately for stories irom listener, peripheral and core group members. For the listener stories,a three level story selection structure was planned. First level selection was conducted at the local/primary leveli.e. within the village itself. Second level of selection took place at the organizational level where the Henvalvanimembers selected the MSC story. The first round for peripheral member stories and core group member stories
took place at the organizational level or within Henvalvani. Of the 57 SC stories collected, 40 were contributedby the listeners of HCR, 11 from peripheral members and 6 from the core team membersiThe significant change stories were analyzed for meta-monitoring and content analysis. Meta analysis provideda profile of the storytellers and the people participating in the selection of stories and content analysis frameworkfor analysis of significant change stories was developed with the core and peripheral members of HenvalvaniCR. The aspects that emerged in the story analysis framework developed included: i) participation of stakeholders;ii) nature of the medium; and iii) effects of participation.
RESULTS & DISCUSSIONS
The HCR initiative is purely a volunteer movement. Volunteers from the local community contributed their time,money and other resources for the sustenance of the initiative. The structure of the HCR initiative providedinsights about the engagement of different people with the HCR and helps in understanding its impact.
• Structure of HCR : Structure of the HCR comprised of groups of people who differ in their time and
orientations towards the CR initiative. People's participation in HCR was based on the level of engagementas shown in Figure! which also forms the structure of HCR. The basic groups or levels of engagementinclude: (a) Core Group members. The core team comprises of 11 members who are very actively engagedwith the initiative. The core team provides inputs at various levels of CR functioning ranging from various
aspects of programme production of CR program, decisions about the selection of the message, treatmentof the message, researching and obtaining feedback, meeting the community groups, to attending conferences.
44

debates for advocating pertinent issues, collecting funds and canvassing with the government and bilateral
and other agencies about the initiative.
(b) Peripheral members. The peripheral members are persons from the community who are included in a
host of activities of HCR. Their main task comprises of organizing listener club activities and reporting back
listeners view about the programmes aired and need and interest of the listeners.
Volunteers &
Peripheral
LIsteriers club
Listener
Fig 1: Structure of HCR
(c) HCR Listeners - Listeners are individual who engage in HCR most by listening to HCR programmes.
Depending upon the availability of the medium, listeners attuned to the HCR programmes. Thus depending
on the channel they use, HCR listeners can be further classified as (1) Listener club members and (2)
Listeners at large.
HCR programme production process: The basic essence of community radio lies in the active participation
of the community and is evidently reflected in every step of HCR programme production. Based on the needassessment, the HCR team takes consensus on picturising, analyzing, evaluating and prioritizing the various
issues and problems which were of local concern. Relevance of these issues is collectively evaluated and
prioritized along with the community groups before mainstreaming them into content of CR programmes.
Participation in this process is drawn from local people belonging to different backgrounds to formulate a
holistic understanding on any issue. Both listener clubs and subject matter specialists were involved in
selecting the content of the messages in HCR programmes. Many a times certain key messages of PSM
from government campaigns and schemes were included in HCR programmes. As a final step, core team
permeates the messages from different angels, comprehends and sorts them in sync with the national andinternational context.
V PSM' GOVI-RNMliNV PROtiRAMMHS
& C AMPAIC5NS
I <5< At. PRI >U I t-MS A ISSUhS
pmjieni \ '
7^KK'AI PHOUI.FMS A issnrs
PSM' tiDVliRNMKNl
PRO(jRAMMi:S & CAMPAKrNS
1
Figure 2: Dynamics of CR programme production
Transmission of HCR programmes : In the absence of favourable broadcasting policy, the group adopted
a combination of ways to transmit programmes ranging from broadcasting programmes on regional publicbroadcast channel, through Worldspace (Asia Dev 1304), narrowcasting the programmes, and now also
through cable casting. Figure 2 shows the transmission process of HCR.
45

CR proenimme
—t
Local TV. cable
fldu'ork
s: (Delbi) l'.quAl Acceis
AIR Najccnbad Melbuwuc, Australia
ListcRc clubs
tnchvpeIIICR xcceiver %cu)
1NVnrldspacc ̂ Utu>n
Listener club member'
local cvmmuRityicmbcr' ^ ^ / «•»
l.ocal c«>mmiinily
Listener ai large
Fig 3: IVansmission of HCR programmes
Mapping the Impact of HCR through the Most Signiflcant Change (MSC) Technique : Stories inthe MSC technique are based on experiences of the storytellers and represent empirical evidence capturingan otherwise unobtainable richness of events and the circumstances of the people involved in those events,their emotions and perspectives of reality. Of the 57 SC stories collected, 40 were contributed by the
listeners of HCR. 11 from peripheral members and 6 from the core team members.
Profile of Story Narrators : Engagement of people in HCR was not restricted to a particular age group;
people engaging in HCR cut across all the age groups in the community. Youth were found to be actively
involved in HCR as peripheral members and core members. Women were not only engaging in HCR in largenumbers also, their engagement was not limited as listeners but they involved themselves at all the level and
functioning of HCR. Profile of the storyteller reveal, of the stories collected most of the stories were bywomen of the community. The storytellers of SC stories ranged between the age group of 14years to
TOyears, nearly half of the stories were from young persons (47 percent) interestingly the listener storiesreceived had a good spread from all age groups. The storytellers were largely engaged in farming and allied
activities or were students. The Meta analysis of the profile of the storyteller was found to be similar to the
listener profile of HCR collected by survey methods. Thus the persons from whom the stories were collectedlargely represented the range of people engaging with HCR.
Participation : Participation is a process by which stakeholders' influence and share control overdevelopmentinitiatives and the decisions and resources that affects them. Community participation is a fundamental
characteristic of community radio. The stories revealed that the Henvalvani members differed in the nature
of association and engagement with the functioning of Henvalvani. Participation of people in HCR wasfound to take place in three different ways - i) Information sharing; ii) Collaboration; and iii) Empowerment.For most storywriters, HCR association was more than just as listeners - they were engaging through givingfeedback, sharing opinions, and participating in the process of programme production. Some even participatedin local level development activities. Longer association was seen with peripheral and core members. Older
members association became more intense with their greater participation in the activities of HCR.
Nature of the Medium : Another important aspect that emerged in the significant change stories wereaspects about CR programmes. Stories provided feedback about HCR programmes and the reasons fortheir popularity. In the SC stories, several factors about the medium emerged. These were clubbed underthe following broad categories; i) media appeal; ii) programme content; iii) IPC activities by HCR; and iv)
individual perceptions. Aspects about the nature of the medium was found to raise the interest of people inHCR, was a motivator for people to participate and influenced the level of people's association with HCR.
People listened to HCR programmes because they found CR medium appealing. HCR programmes wereappealing because not only were they in their local language but also provided them information about issues
46

that most concerned their lives. Hence HCR programmes were able to break the prevailing socio cultural
and literacy barriers, mainstream people and creating community. The specific characteristic of HCR like
proximity, credible and contextually relevant information, and use of local dialect has given HCR a flavour
and appeal different from the other channels of communication.
Significant Change stories reveal that participation with Henvalvani has given them recognition in the
community; people recognized them as members of Henvalvani and they felt their social status had been
enhanced. Stories reveal that networks and dialogue amongst and within community groups has led to the
development of important 'social skills' among individuals increasing community belongingness. HCR was
perceived to be intrinsically woven with the socio-cultural fabric of the community. Preference for HCR
programmes was expressed on account of locally relevant issues giving greater meaning to the information
provided. The effect of HCR was revealed at different levels - at an individual level, members gained
knowledge and critically reflected upon specific issues, developed contacts and networks to find new job
avenues and enhanced employability. At a collective level, it has led to the revival and preservation of local
culture, language and dialect, stimulated dialogue within the community and formation of groups and collectives
for addressing local issues.
CONCLUSION
HCR being rooted in local community based organizations, through its narrowcasting network, has created newmechanisms for information exchange. HCR is playing a complementary role, as community communications
addressing local issues; it is promoting information inclusion and facilitating horizontal and vertical communication
linkages in the communities, transcending the socio, economic and cultural barriers. It has significantly developed
into a responsive, equitable, local information resource network that reaches for out to communities in an
increasingly fluid environments of rural Uttarakhand; India. Henvalvani Community Radio has succeeded in
putting the tool of communication in the hands of the community for their cultural sharing, dialogue, growth anddevelopment. Ownership of the media has translated into ownership of issues and concern which has led toparticipation of local people in local governance and local decision making.
Key findings of the study
• The HCR initiative is purely a volunteer movement. Volunteers from the local community contributed their
time, money and other resources for the sustenance of the initiative.
• The basic essence of community radio lies in the active participation of the community and is evidentlyreflected in every step of HCR programme production. Participation in henvalvani was found to be anempowering one. Involvement of community in HCR was not limited as listeners but also by opinion sharingand producing programme
• The basic essence of community radio lies in the active participation of the community and is evidentlyreflected in every step of HCR programme production. Participation in henvalvani was found to be anempowering one. Involvement of community in HCR was not limited as listeners but also by opinionsharing and producing programme.
• Strong interpersonal links promoted by HCR, maintained through narrowcasting network of listener clubs,enabled members to dialogue and discuss issues raised through the programmes. By being rooted in communitybased organization through its narrowcasting network, HCR has led to new mechanism for informationexchange amongst different stakeholders.
• HCR was perceived to be intrinsically woven with the socio-cultural fabric of the community. Preferencefor HCR programmes was expressed on account of locally relevant issues giving greater meaning to theinformation provided.
• HCR due to its specific characteristic like proximity, credible and contextually relevant information, use oflocal dialect has given HCR a flavour and appeal different from the other channels of communication andhas made it a very popular channel locally.
47

• The effect of HCR was revealed at different levels - at an individual level, members gained knowledge andcritically reflected upon specific issues, developed contacts and networks to find new job avenues andenhanced employability. At a collective level, it has led to the revival and preservation of local culture,language and dialect, stimulated dialogue within the community and formation of groups and collectives foraddressing local issues.
RECOMMENDATIONS
Radio still remains a popular and affordable means of mass communication mainly because of its large coverage,mobility and low cost. With appropriate strategies Radio can be used as a potential means for bringing socialchange, particularly for the rural, sparsely populated areas of the country. Thus, there is an urgent need toexpand the scope of the community radio as a medium of communication for meeting the needs of the local
communities. The new broadcasting policy has brought into focus CR as a medium. The policy should be
implemented in full capacity and must provide an enabling environment for CR to grow and flourish. It is
estimated that India could have 4000 community radio stations. However technical support mechanisms need
to be worked out at the ground level. Already developed CR can help in this regard by providing technical
expertise and training to the upcoming CR initiatives.
Viability ofcommunity radio initiatives/stations needs to be determined through internal fund raising mechanisms.It needs to be analyzed that besides maintaining the level and extent of people's participation it is equallyimportant to achieve financial and technical sustainability. As a step forward government should provide thenecessary technical support and should remove the transmission cost for the community based CR. This willhelp CR initiatives achieve financial stability and will spur new CR initiatives. Thus with a great potential toexpand, these CR initiatives, to continue serving democratically, there has to be a balance that needs to bemaintained between increasing voluntary participation from the local communities along with maintaining theissue of their financial sustainability and continuity.
REFERENCES
1. Fraser C and Estrada S R, Community Radio Handbook, UNESCO, 2001.
2. Jallov B. Most Significant Change: A too! to document community radio Impact, Measuring change Planning and evaluation in
media and development cooperation, 3"" Symposium Forum Media and Development, CAMECO, 2007.
3. Kapur V, Kumar A and Seth M, Mapping the impact of Henvalvani community radio using the most significant change technique:A study in Chamba (Uttarakhand). Unpublished M.Sc Dissertation, Department of Development Communication & Extcn.sion,Lady Irwin College, University of Delhi, New Delhi, 2009.
4. Laswell H D, The process and effect ofmass communication. Unit of Illinois Press, 1951.
5. Melkote S and H Lislie, Communication for development in the third world. Sage, India 2001.
6. Mikkelsen B, Methods for development work and research: A new guide for practitioner. Sage, New Delhi, 2005
7. Rogers E M, 1995, The diffusion of innovation New York. The Free Press, 1995.
8. Ryyadu C S, Communication. Himalaya Publishing Hou.se, 2003
9. Servaes J, Approaches to development • Studies on communication for development, France, UNESCO. 2003
10. Singhal A and Rogers E M, India's communication Revolution from bullock carts to cyber marts. Sage, India, 2001.
11. UNDP. Communication for Empowerment: developing media strategies in support of vulnerable group.?. Pntctical Guidtince
Note New York, UNDP, 2006.
12. Vij S and Kumar A, Community radio initiative in Chamba. Uttranchal -An exploratory study. Unpublished M.Sc Dissertiition,
Development Communication & Extension, Lady Irwin College, University of Delhi, New Delhi, 2007.
13. Waiboard, Silvio. Family tree of theories, methodologies and strategies in development communication - convergences and
differences NY, The Rockefeller Foundation, 2001, pp. 105.
14. White A Shirley, Participatory communication for Social Change. Sage, India, 1999.
48

EEC/Oral/4
Role of MAVIM in Women Empowerment - A Case Study
Shobha Y. Waghmare ' & Sandhya M. Rotkar -
1. Senior Lecturer in Home Science, Dept. of Home Science, Smt. Dankunwar Mahila
Mahavidyalay, Jalna (Maharashtra)
[email protected] (09860184860)
2. HOD. Dept. of Home Science, JES College, Jalna (Maharashtra)
apk20032003 @yahoo.co.in (09730526848)
ABSTRACT
Empowerment is the process of enabling or authorizing an individual to think, behave take
action and central work in an autonomous way. Women's empowerment is the process bywhich the powerless gain greater control over the circumstances of their lives. It includes
both control over resources and over ideology. The present study undertaken to know
the role Mahila Arthik Vikas Mahamandal Limited (MAVIM) in empowerment of poor rural
women. The study was conducted in the three villages of Partur Taluka, Dist. Jalna. In the
study area 92 respondent from 20 SGH formed by MAVIM were selected randomly and
interviewed. Second Objective of the study was to study the income of the member afterJoining SHG. The study area covered only one year period (2007-08). It is found that MAVIMbecame successful in organizing rural poor women under the roof of SHG. It enforced theparticipation of all category women in strengthening SHG by institutionalizing for their
perpetual development. It is also found that MAVIM created confidence for economic self
reliance among economically backward. The income of the respondent has been increased
after Joining SHG. MAVIM turned out to be an effective agency for women's empowerment.
It is also successful in creating awareness among member of SHG in issues such as governmentprogrammes and schemes, bank transactions, health hygiene and family welfare. Women
from SHG matured and developed concept of "Me to We" They started participating in theactivities alike the celebration of independence day, participating in Gram Sabha meeting,cleaning roads. Income generating activities like goat rearing, poultry, flour mill, bangleselling which increased members saving and created asses in women's own names. ThusMAVIM plays very significant role in empowerment of rural poor women.
INTRODUCTION
Women who constitute nearly half of the population play a very significant role in the home and outside. Studiesfrom the all over the world show that women do not have equal status to that of men. This is because societyis "Gender Biased and Male Dominated". Thus women have no access to credit. Women have no ownership of
land, houses or any property in their name. An ancient India, women had a status of dignity. This was lost in themedieval period because of socio-political changes. Today their status is measured by means of indicator suchas sex ratio, literacy, and work participation. To raise the status of women, they must be socially, economicallyand politically empowered. Empowerment is a process of awareness and capacity building leading to greaterparticipation, greater decision making power and control of the transformative action. Zainab Rahman (2005)
writes, "Empowerment is not a commodity that can be handed over to women'. Power is an analytical categoiywhich denotes strength or control. It is something that has to develop from within. Empowerment comes towomen when they strive hard it.
Concept of MAVIM: Mahila Arthik Vikas Mahamandal Limited (MAVIM) is the prominent state level
organization works for the development and empowerment of women through forming Self Help Group (SHG)implementing women's developmental schemes sponsored by Central and State Government. MAVIM i.s
undertaken programme of Maharashtra Government, which is established on the occasion of International
49

Women's year in 1975. Which works with aim - To create social, flnancial and political justice for rural and
poor women through perpetual developmental process. MAVIM works as a co-coordinating organization at
state level between SHG, financial organization, voluntary organization and related departments of the government.
MAVIM works with the following objectives.
• Organizing women under the roof of SHG.
• Organizing skill based training and vocational training to motivate women to become "Entrepreneurs'
• Enforcing the participation of women's in education, property and power politics.
• Coordinating employ mental opportunities and marketing
Concept Of Self Help Group (SHG): SHG is a small voluntary association of poor people preferably from
the same socio-economic background. They come together for the purpose of solving their common problems
through SHG and mutual help. The lower limit of member in one SHG is ten and does not exceed twenty. The
formation of SHG is not ultimately a micro credit project but an empowering process. The concept aims at
empowering women and thus uplifting their families above the poverty line. It is a gradual process resulting
form interaction with group members through awareness and capacity building
AIMS & OBJECTIVES
Study is carried out with the following two objectives1. To know the role of MAVIM in socio-economic empowerment of women.
2. To study the income of the member after joining SHG
MATERIALS & METHODS
The present study has covered three villages (Singona, Amba and Osmanpur) from Partur taluka district Jalna.This study is complied with the help of primary data and secondary data. Covered for only one year (2007-08)period. The primary data were collected with the help of specially prepared interview schedule. The scheduleincluded the questions related to the general information about the SHG members, income, savings, and loan
schemes available to SHG member. Total 92 respondents were selected from 20 SHG (276 total members)
from three villages by simple random sampling method. The same size was 1/3 of the total members in the
selected SHG. This is purely a descriptive study. Therefore no complicated models and tools were used only
percentage and average were used for the analysis.
RESULTS & DISCUSSIONS
The first objective of present study is to know the role of MAVIM in empowerment of women. MAVIM
organized 12170 poor rural women under the roof of SHG (811) without organization of women process of
empowerment cannot takes place. (Table-1)
T^blc 1: SHG formed by MAVIM (in Jalna Dist)
Sr. No. Taluka No. of SHG formed
1. Jalna 143
2. Partur 231
3. Badnapur 42
4. Ambad 79
5. Ghansawangi 59
6. Jafrabad 12
7. Mantha 131
8. Bhokardan
Total 811
50

Ibble 2: Caste wise distribution of women in SHG formed by MAVIM
Sr. No. Particulars No. of women Percentage (%)
1. SC 5438 44.68
2. ST 214 1.75
3. OBC 1009 8.94
4. NT 1004 8.24
5. Minority 637 5.23
6. Open 3788 31.12
Total 12170 100%
While forming the SHG MAVIM covered poor rural women from all the categories (Table-2) result shows the
active participation of SC (44.68%) and open category (31.12%). Thus MAVIM enforce the participation of
women in strengthening SHG by institutionalizing for their perpetual development.
Table 3: Contribution of economical backward member under MAVIM
SI. No. Economic Status No. of women Percentage
1. BPL (Below poverty line) 4191 ' 34.43
2. PRA BPL (Participatory Rural Appraisal) 7942 65.25
3. APL (Above poverty line) 39 0.32
Total 12172 100%
To create confidence for economic self reliance MAVIM motivates (Table-3) economically backward rural
women. MAVIM broaden the economic spectrum for PRA BPL (65.25%) women.
The second objective of the present study is to study the income pattern of members after joining SHG. This
section deals the economic improvement of women through SHG formed by MAVIM.
In the study area totally 20 SHG (Table-4) are functioning with 276 members. From 276 members 92 respondents
were selected for the study.
Table 4: Membership in SHG
SI. No. Village No. of SHG Total Member
1. Amba 8 120
2. Singona 6 84
3. Usmanpur 6 72
Total 20 276
(Source - Primary data)
Age and socio-economic activities are interrelated. In the study area (Table-5) 30-40 and 40-50 age groups are
actively participated in SHG activities. Aged people (above 50) are also in SHG. Their guidance for solving
problem plays an important role for SHG.
Ibbie 5: Age groups of Members of SHG
Sr. No. Age group No. of respondent Percentage
1. Less than 30 15 16.30
2. 30-40 40 43.47
3. 40-50 28 30.43
4. Above 50 09 9.78
Total 92 100
51

Reasons for joining SHG: The prime aim of SHG is to promote saving and to credit for the productive and
consumption purpose. In this study maximum member 58.69% joined SHG (Table-6) for getting loan where as
21.73% respondent joined SHG for improving the saving. Few of the total respondent joined SHG to gain social
status.
Table 6: Reason for joining SHG
Sr. No. Reason No. of respondent Percentage
1. Forgetting loan 54 58.69
2. For promoting saving 20 21.73
3. For social status 12 13.04
4. For other reason 06 6.52
Total 92 100
(Source - Primary data)
Income level of the members: Figures in table-7 reveals that the income of the member has been increased
after joining the SHG. Therefore women member of groups are independent to meet their personal expenditure
and they contribute more to their house hold income. 25% housewives did not earn anything before joining SHG
but after a member of SHG they are also earning reasonably.
Table 7: Income level of the members
Sr. No. Monthly Before Joining SHG After joining SHG
income Rupee. No. of
respondent Percentage
No. of
respondent Percentage
1. Less than 1000 40 43.47 10 10.86
2. 1000-2000 22 23.91 70 76.08
3. 2000-3000 07 7.60 10 10.80
4. Non earning 23 25.00 92 100
Total 92 100 92 ICQ
(Source - Primary data)
CONCLUSION
The study was under taken role of MAVIM in women's empowerment through SHG. It is found that MAVIM
become successful in organizing rural poor women under the roof of in SHG. MAVIM enforced the participation
of all category women in strengthening SHG by Institutionalizing for their perpetual development. It is also
found that MAVIM created confidence for economic self reliance among economically backward women .The
income of the women has been increased after joining SHG.
There fore MAVIM turned out to be an effective agency for women's empowerment. The group concept has
enabled the rural poor women to develop saving hatred. The member of SHG has got awareness in issues such
as government programmers and schemes, bank transactions, health hygiene and family welfare. Women from
SHG matured and developed concept of "ME to WE "They started participating in various social activities: so
we may conclude that the MAVIM plays an important role in empowerment of rural poor women.
52 ̂

RECOMMENDATIONS
1. MAVIM should create the environment for healthy and positive attitude towards women entrepreneurship.
2. Arrange the entrepreneurial literacy programmes more frequently to create self confidence among SHG
women.
3. Identify problems faced by rural women and take measures to over come them.
4. Ensure provision of training, employment and income generation activities to make women economically
self-reliant.
REFERENCES
1. Rahman Z. Empowerment of Rural Indian Women. Study of Uttarakhand, Kalpanz Publication. Delhi. 2007.
2. Lalitha N. Grassroots Entrepreneurship Glimpses of Self-Help Groups. Dominant Publishers and distributors. New Delhi, 1st
edition. 2007.
3. MAVIM publication - yearly performance report, documenting success stories, SHG training module for self help group
4. Kharole M, Status ofIndian Women, Social welfare 52(4). ISSN 0037-8038, (July 2005), pp. 39.
5. Stephen A and Seilan A, SHGS and microfinance—Creating Linkages with Banks. Social welfare, 52 (4). ISSN 0037-8038, (July
2005), pp. 33.
6. RamchandranT and ScWan A, Socio-Econoinic Empowennent and Self-Help Groups, Social welfare, 52(6), ISSN 0037-8038, (Sept.
2005), pp. 3, 4.
7. Prasad R. Information Supportfor Empowerment of Women in India. Social welfare, 54(1). ISSN 0037-8038, (April 2007), pp. 26.
8. Vinayagamoorthy A, Women Empowerment through Self-Help Groups : A case Study in the North Tamiinadu, Social welfare.
54(1), ISSN 0037-8038, (April 2007), pp. 32,33.
53

EEaOral/7
The Role of NGOs in the Care of the Elderly
SandraAnandrajan' & Karuna Miraclyn Stephen^1. Lecturer (selection grade). Avinashlingam University for Women,
Coimbatore (Tamilnadu)
2. PhD Scholar. Dept. of Home Science Extension Education,
Avinashlingam University for Women, Coimbatore (Tamilnadu)
miraclyn_bJissfuJ ©yahoo.co.in (09789729507)
ABSTRACT
Aging is universal and multidimensional phenomenon. From ancient times aging has beendebated as one of the most important problem of our lives. However, the problem of old agehas gained importance due to the rapid demographic transition involving high fertility andmortality and consequent aging of population.
Society tends to think of the older persons as out-dated. We should instead tap the potentialand experience of the sensations and put them to good use. Their families, the Governmentand society at large should provide them employment opportunities, set up trusts to createsuch opportunities and establish a social security system where by the seniors becomefinancially independent.
The relevance of old age homes in India is increasing. Many factors have contributed to thealienation of the elders.
The contribution of voluntary agencies in the field of social welfare and social developmentis enormous. The voluntary organization today has a vast field of study. One of them istaking care of senior citizens by running old age homes. The study reveals that most of theold age homes are actively running in Coimbatore city for the welfare and care of theelderly.
The study was conducted in Non-government Organisations, which are engaged in the careof the elderly in Coimbatore city. Fifteen organisation, were drawn randomly for the study.These entire organisations were registered to run old age homes for senior citizens.
Hundred percent of the organisations maintained financial records. Social accountabilitywas ensured by the organisations because they were answerable to the funding sources andto the government.
Fourteen institutions provide residential care. Whereas only one offers day-care .service tothe elderly. Fourteen organisations have dormitory facility along with which five have doubleroom accommodation for old couples and five organisations with single room facility.
It was encouraging to note that all the organisations provide full medical care, for the stateof health among the elderly and severe morbid conditions require it.Majority of the elderly people were in the age group of 71-80 years.64 per cent of the elderly people in the old age home are in contact with their childrenwhereas. 36 per cent of them are not in contact with anyone 23 per cent of the elderlyreceive pension. Majority of the elderly came to this home on their own interest as they didnot want to be a burden on their families and they were not able to .substantiate the familyincome. Ninety two per cent of the old people were satisfied with food as they were able tosocialize well with the other members and staff. Since most of the organisation had set -timings for elders to eat. they could eat together and socialize well as they are of same agegroup and rest mo.st of the time.
Leisure time activities involve walking, gardening, reading, helping in daily task of thehomes, talking, watching television, listening to radio, singing, painting and performingtheir own personal hobby.
54

Basic amenities like food, clothing, toilet and bath, vocational training, health services,
recreations, are provided in all the Homes.
Case studies also revealed that most of them were happy in these homes and these homes
have been a boon for them.
INTRODUCTION
The population of the world is 'graying' at a faster pace than ever before. The number of persons 60 and above
in India was about 12 million in 1901 and 2001 it increased to 57 million. This changing demographic composition
will have serious social, political and economic implications and will pose newer challenges in responding to the
needs of the elderly, and in planning and developing programmes for their well being; systematic planning and
action are needed at the national and state levels particularly in the areas of health care, housing, income
maintenance, education and meaningful social activities. (Help Age India)
The least noticed of the destitute in India are the elderly. Millions of elderly in India are trapped in misery
through a combination of low income and poor health. The tradidonal support structure of the family is increasingly
unable to cope with the problem. In the world where joint family is breaking down, and children are unable to
take care of their parents, millions of elderly face destitution. The emerging demographic profile and socio
economic scenario of the country indicate that matters will worsen dramatically in the years to come.
Indian society was having traditional informal support system such as joint family, kin and community. The
primary responsibility of the joint family was to protect its dependent members, for instance, elderly, children,disabled by providing basic needs such as food, clothing, shelter, health and psychological support.
AIMS & OBJECTIVES
Since care of the elderly has become need of the hour, this study has been undertaken with the followingobjectives:
1. To examine the functioning of the Homes for the aged in catering to the needs of the elderly.
2. To find out the methods of providing care for the elderly.
3. To study the commitment of the NGOs in meeting the needs of the elderly.
4. To study the role of NGOs in protecting the rights of the elderly.
In India most of the NGO's have concentrated their work among the lower income group and disadvantagedand unprivileged sections of the society. It is only in the last few years when the demographers providedalarming statistics on the growth of the elderly population that a need was felt to work in this area as it wasalways assumed that the elderly were well taken care of and were safe in the custody of the well integratedjoint family system in India. Initial studies show that the elderly are taken care of by the family but the realityand recent enthnographic case studies also prove that the so called 'joint family' system in India is a myth and
the elderly though they live with their sons and his family are neglected and uncared for, by them. This scenarioled to the emergence and mushrooming of various NGO's working towards the concerns of the elderly.
The relevance of old age homes in India is increasing. Many factors have contributed to the alienation of theelders. Some of the reasons are mentioned below:
1. Migration of young couples from the rural areas to cities in search of better employment opportunities tofend for themselves.
2. Elders who have been in control of the household for a long time are unwilling to give up the responsibilityto their children.
3. Youngsters on their part are sometimes resentful of the attitude of their parents.
4. Many youngsters have moved to places far away from their native homes and in the recent past to manycountries abroad. So even if they want to they cannot accommodate their parents in their own homes.
55

5. Elders are sometimes too incapacitated or unwell to look after themselves or get medical care especially inan emergency.
All these have made the old age homes seem more relevant in the Indian context than even before.
The national policy on older persons was announced by the Government in 1999 in response to the fast changingpopulation dynamics. The policy aims at age integrated society and envisages an umbrella of measure including- support for financial security, health, care education, shelter, welfare and protection against abuse and
exploitation. The people in India are living longer. Increase in life expectancy on one hand and decrea.se in
mortality and fertility on the other has contributed to an increase in people of 60 and above. This has let to
provide social services and other benefits to senior citizens. This needs is further highlighted with the changingroles of family as well as with the increased pace of industrialization, urbanization, we.stemization which have
severely affected our value systems making the older persons position very vulnerable in family and communityat large. This was in this context that national policy of older persons was formulated in 1999, declared as theinternational year of older persons by the Government of India.
MATERIALS & METHODS
• Selection of the Sample: Sampling involves the selection of few items from a particular group to be
studied with a view to obtain relevant data, which helps in drawing conclusion regarding the entire group.
There were 22 NGOs located in Coimbatore City, working for the elderly. Only 15 NGOs extended theircooperation to contribute details for the research and all the 15 NGOs were included as the .sample for thesurvey. Out of fifteen organizations five organizations were formed under a trust, whereas ten were formedas society.
The addresses of the NGOs were obtained from the directory 'Help Age India' and the directory called'Sahaya - Voluntary Organization'.
Society A Society is formed when people come together to do something with come common purpo.se,which is legal and useful for others.IVust- A trust is created when a donor attaches a legal obligation to the ownership of certain property basedon his confidence placed in an accepted by the Donee or Trustee, for the benefit of another.Five inmates from each old age home were selected thus constituting 75 samples be sought. It is therefore,the data collected under this method is reliable dependable and also valid.
Interview schedule was prepared to collect information regarding general and social and psychologicalaspect of the selected sample.
The summary and conclusion of the study are based on Primary Data collected for the purpose of the study.However the help of the secondary data available in the form of organizational documents such as folders,journals, and brochures was taken. Further the observation made by the researcher during the course of herstudy has widely helped in drawing inference.
• Details about the NGOs working for the aged: The study was conducted in fifteen NGOs, which weredrawn randomly for the study.
1. All the organizations were registered to run old age homes for senior citizens.
2. Out of fifteen NGOs nine are serving for the past 10 years, three were serving for 20 years and otherthree homes were serving for more than 30 years.
3. All the organizations have adequate staff members to run the homes. The finance of the twelve homes isself-supportive and in the other three homes it is met by the trust. Besides this all these homes receivedonations as well.
4. All the organization conduct activities like feeding provide medical treatment, bathing and cleaning andgames. Ten organizations plan out their activities with the consultation committee, whereas in other 5organizations the head of the organization carries out the planning. All the organizations conduct good
56

monitoring and supervision. Thirteen NGOs follow a daily timetable, which enables the staff and supervisors
to monitor the elderly people.
5. Only one organization has linkage with the International Agency. Four organizations have linkages with
the local organizations, whereas the remaining 10 NGOs have no linkage witli other organization.
6. Staff meeting in 5 organizations was held on monthly basis, whereas in the other organizations, it was
held whenever it seemed necessary. Staff members were selected on the basis of service mindedness
towards the care of the elderly.
7. Fourteen institutions provide residential care. Whereas only one offers day-care service to the elderly.
Both male and female are accepted in these organizations except for two organizations which run
exclusively for elderly women. Five organizations take no payment for the facility provided for the aged.
Whereas other organizations charge for the stay of the elderly. The charges vary for single room, double
room or dormitory accommodation.
8. Thirteen organizations provide only vegetarian food whereas the other two provide with non-vegetarian
food as well. All the organizations provide full medical care for the elderly.
9. Two organizations identified problems in planning the programme. Eight organization faced problems in
implementation of programme. Five organizations faced financial problems and one organization explained
the conflict that often arises between the staff and the old people. All organizations had good rapport with
the community. All organization believed that their publicity is through the work they do.
Profile of the aged: Majority of the elderly people were in the age group of 71-80 years.
1. Twenty five percent of the group belonged to 61-70 years of age.
2. The rest of the elderly were 81 years and above.
3. Majority of the old people were females (64%).
4. Females are in excess over males in old age because of higher life expectancy at birth and recent trends
in mortality favoring males.
5. Eighty percent of the elderly people were literates, and twenty per cent were illiterates.
6. Eighty five per cent of the elderly were married. Seventy two per cent of the elderly have children while
rest of them have no children.
7. Fifty two percent of the elderly people were from Coimbatore. The rest of them were from neighboring
places like Erode, Salem. Seven percent of them had come from other states also.
Status of aged prior to admission in home:
1. Fifty two percent of the elderly lived with their children before they came to old age home.
2. Twenty three percent lived with their relatives. One percent of the elderly lived with friends and twenty
four percent lived alone.
3. Forty five percent of the elderly were employed and fifty five percent were not employed at all. Sixty
four percent of the elderly people are in contact with their children, where as thirty six percent have no
contact with any one.
4. Twenty three percent receive pension by which they maintain themselves, where as the others rely on
friends and relatives for their maintenance and support.
5. Twenty eight percent of elderly have savings where as seventy two percent have no savings at all.
57

• Leisure time activities: Elderly people follow a schedule to suit their age, which comprises of not muchwork and rest most of the time. Leisure time activities involve walking, gardening, reading, helping in dailytask of the homes, talking, watching television, listening to radio, singing, painting and performing their ownpersonal hobby.
• Reasons forjoining old age home: The family structure is becoming nuclear which is resulting in deprivationof care of the elderly at homes. Majority of the elders came to old age homes with their own interest, as theydid not want to be a burden on their children. Ninety one percent came on their own interest while friends
motivated 9 percent. The number of years of staying in homes of the elderly is from few months to fifteen
years.
• Facilities available in old age home:
1. Ninety four percent provided residential care whereas six percent provided day care center for theelderly. Basic amenities like food, clothing, toilet and bath, vocational training, health services, recreations,are provided in all the Homes.
2. Other activities conducted in homes are such as helping the elderly in bathing, cutting nails, combing hair,
feeding, helping the elderly to go to toilet at nights, helping in walking around and dressing.
3. Vehicle facility is provided in homes. Recreation like TV, Radio and Sports were also provided.
• Social and Psychological perspective:
1 Basic amenities like food, clothing, toilet and bath, vocational training, health services,recreations, are provided in all the Homes.
2 Thirty five percent of the old age homes were provided residential care for free of cost whereas fifty -five percent charged for the care they provided.
3 Sixty seven percent of the elderly go for an outing, which involve shopping, cinema, and religious discourse.Thirty three percent of the elderly preferred to stay inside and never wanted an outing.
4 Forty percent elderly purchased items for their personal use, where as sixty percent of the elder's did notfind it necessary to purchase. Fifty one percent of the elders have close friends outside their homes withwhom they are in contact, whereas forty nine percent have no contact with any one.
5 Seventy percent of the elderly miss their friends, twenty three percent miss their jobs and rest of themmiss their native homes and lost ones.
6 Prayer is carried out in all homes on voluntary basis. Ninety four percent were involved in prayerswhereas six percent did not prayer at ail.
7 Case studies also revealed that most of them were happy in these homes and these homes have been aboon for them
RESULTS & DISCUSSIONS
The results of the study on "The Role of NGOs in the care of elderly" is discussed under thefollowing heads:
1. Details about the NGOs working for the Elderly.
2. Activities of the Elderly.
3. Facilities Provided for the Elderly and
4. Social and Psychological Perspectives of the Elderly.
1. Details about the NGOs working for the aged : The study was conducted in fifteen NGOs. which were
drawn randomly for the study. All the organizations were registered to run old age homes for senior citizens.
58

Out of fifteen NGOs nine are serving for the past 10 years, three were serving for 20 years and other three
homes were serving for more than 30 years. All the organisation have adequate staff members to run the
homes.
The finance of the twelve homes is self-supportive and in the other three homes it is met by the trust.
Besides this all these homes receive donations as well.
All the organization conduct activities like feeding, provide medical treatment, bathing and cleaning and
games. Ten organizations plan out their activities with the consultation committee, whereas in other 5
organizations the head of the organization carries out the planning.
All the organizations conduct good monitoring and supervision. Thirteen NGOs follow a daily timetable,
which enables the staff and supervisors to monitor the elderly people.
Only one organization has linkage with the International Agency. Four organization have linkages with thelocal organizations, whereas the remaining 10 NGOs have no linkage with other organization.
Staff meeting in 5 organizations was held on monthly basis, whereas in the other organizations, it was heldwhenever it seemed necessary. Staff members were selected on the basis of service mindedness towards
the care of the elderly.
Fourteen institutions provide residential care, whereas only one offers day-care service to the elderly. Both
male and female are accepted in these organizations except for two organizations which run exclusively forelderly women. Five organizations take no payment for the facility provided for the aged whereas otherorganizations charge for the stay of the elderly. The charges vary for single room, double room or dormitoryaccommodation.
Thirteen organizations provide only vegetarian food whereas the other two provide with non-vegetarian
food as well. All the organizations provide full medical care for the elderly.
Two organizations identified problems in planning the programme. Eight organization faced problems inimplementation of programme. Five organizations faced financial problems and one organization explained
the conflict that often arises between the staff and the old people. All organizations had good rapport withthe community. All organization believed that their publicity is through the work they do.
Profile of the aged : Majority of the elderly people were in the age group of 71-80 years. Twenty fivepercent of the group belonged to 61-70 years of age. The rest of the elderly were 81 years and above.
Majority of the old people were females (64%). Females are in excess over males in old age because of
higher life expectancy at birth and recent trends in mortality favoring males.
Eighty percent of the elderly people were literates, and twenty per cent were illiterates. Eighty five per cent
of the elderly were married. Seventy two per cent of the elderly have children while rest of them has nochildren.
Fifty two percent of the elderly people were from Coimbatore. The rest of them were from neighboringplaces like Erode, Salem. Seven percent of them had come from other states also.
Status of aged prior to admission in home : Fifty two percent of the elderly lived with their childrenbefore they came to old age home. Twenty three percent lived with their relatives. One percent of theelderly lived with friends and twenty four percent lived alone.
Forty five percent of the elderly were employed and fifty five percent were not employed at all. Sixty fourpercent of the elderly people are in contact with their children, where as thirty six percent have no contactwith any one.
Twenty three percent receive pension by which they maintain themselves, where as the others rely onfriends and relatives for their maintenance and support.
Twenty eight percent of elderly have savings where as seventy two percent have no savings at all.
59

• Leisure time activities : Elderly people follow a schedule to suit their age, which comprises of not muchwork and rest most of the time.
Leisure time activities involve walking, gardening, reading, helping in daily task of the homes, talking, watchingtelevision, listening to radio, singing, painting and performing their own personal hobby.
• Reasons for joining old age home : The family structure is becoming nuclear which is resulting indeprivation of care of the elderly at homes. Majority of the elders came to old age homes with their own
interest, as they did not want to be a burden on their children. Ninety one percent came on their own interest
while friends motivated 9 percent.
The number of years of staying in homes of the elderly is from few months to fifteen years.
• Facilities available in old age home : Ninety four percent provided residential care whereas six percent
provided day care center for the elderly. Basic amenities like food, clothing, toilet and bath, vocationaltraining, health services, recreations, are provided in all the Homes.
Other activities conducted in homes are such as helping the elderly in bathing, cutting nails, combing hair,
feeding, helping the elderly to go to toilet at nights, helping in walking around and dressing.
Vehicle facility is provided in homes. Recreation like TV, Radio and Sports were also provided.
• Social and Psychological perspective ; Basic amenities like food, clothing, toilet and bath, vocationaltraining, health services, recreations, are provided in all the Homes.
Thirty five percent of the old age homes were provided residential care for free of co.st whereas fifty - fivepercent charged for the care they provided.
Sixty seven percent of the elderly go for an outing, which involve shopping, cinema, and religious discourse.Thirty three percent of the elderly preferred to stay inside and never wanted an outing.
Forty percent elderly purchased items for their personal use, where as sixty percent of the elder's did notfind it necessary to purchase. Fifty one percent of the elders have close friends outside their homes withwhom they are in contact, whereas forty nine percent have no contact with any one. (Seventy percent of the elderly miss their friends, twenty three percent miss their jobs and rest of them misstheir native homes and lost ones.
Prayer is carried out in all homes on voluntary basis. Ninety four percent were involved in prayers whereassix percent did not prayer at all.
Case studies also revealed that most of them were happy in these homes and the,se homes have been aboon for them.
CONCLUSION
A solution to the problems does not lie in institutionalization of older persons, but in the encouragement of theirliving with the children by giving the family adequate financial and medical help. Provision of domiciliary servicescan enable the family to look after the aged. Living arrangements of the aged people with the members of thefamily is very essential for a satisfactory life on account of the stronger emotional bonding of parents with theirchildren and grand children. In the institution physical needs of a person can be mitigated, but psychological andemotional needs .such as the need of being a useful and significant member in his own world of near and dearones cannot be satisfied which become quite important for an aging person.
Thus, if we want the actual welfare of the aged people, institutionalization should be discouraged and living withthe family should be encouraged. But. at the same time the requirement of the institution cannot be ruled out for
those aged people, who are neither able to manage their own affairs nor do they have any person to look afterthem. It is important to create the "caring society" together with State, NGOs, community, Family and theperson in need through 'cost - sharing' basis. Institution should be the last resort when other alternative fails.
60

RECOMMENDATIONS
1. A similar research may be conducted on a larger sample with more variables like: age, sex, education,family type, occupation, re employment. Single headed household, rural \urban \ tribal and so on.
2. A reseai'ch may be undertaken to compare the dimensions of insecurity, their extent and coping strategiesadopted by aged, living in the family and those in the institutions.
3. Short term guidance and counseling, directed towards strategies for better physical, financial and socio -economic adjustments be formulated and extended to prepare them better for minimizing the insecurity andenhancing the quality of life.
4. Human Development department be encouraged to lake up long term goals for the welfare of the aged andestablishing a gerontology cell for Senior Citizens.
5. Study also recommends that, all the youth programme must encourage youth to take care of aged in the
society.
REFERENCES
1) AnupriyaM., Is Insihiiiionalization an Answer for Elderly-Au analysis. Social Welfare, Central Social Welfare, New Delhi, 53 (2)
(2006), pp. 30-31.
2) Antoni M.P. Family and Commiiniiy Based Service for the Elderly. (2002)
3) Ball] A.P. Well Being ofthe Elderly. Social Change, (1999), pp. 64-67
4) Basotia GR., K. K. Sharma, Research Methodology. Mangal Deep Publication, Jaipur, (2002), pp.13.
5) Balakri-shnan R, A note on aging and the elderly in less developed world. Social Change, 29 (1&2) (1999). pp. 20.
6) Bhattacliarya S, Social Work — An Integrated Approach — Deep and Deep Publication Private Limited, Delhi (2003). pp. 362.
7) Buck S., My Several Worlds (New York: Pocket Book) (1960), pp. 337.
8) ChadhaN.K., The other side of being old. Social Change: 29 (1&2) (1999), pp. 16.
9) Chandna and Dave C, A Study ofInsecurities in Senior Citizens of Udaipiir City. Social Welfare, 53 (1) (2006), pp. 32-35.
10) Chowdhry P, Encyclopedia ofSocial Science. Alma Ram and Sons, Delhi, 1968, pp. 29.
11) Chowdhry P, Social Work in India. Alma Ram & Sons, Delhi, 1976, pp. 57.12) Dogra, B, Why Basic Change is Essential, www.mainstreamweekly.com/content/general, (2005).
13) D'SOUZA V, Changing Social Scene and its implications for the aged. DESAl K.G (editor), Ageing in India, Bombay: TISS 1982,pp. 71-79.
14) Gangrade K. D., Emerging conception of ageing in India. A socio-citlttiral perspective. BANU A, (editor), Understanding grayingpeople of India. New Delhi: Inter-India Publications, 1999.
15) Help Age India Care of the elderly - A directory of organization for the welfare of the aged in India (2004),
16) Rajan S I, Mishia U S, ShankaraPand Sharma P, India's Elderly-Burden or Challenge. Sage Publication, New Delhi, (1999).17) Jayapralkash Reddy R, Social Research. APM Publishing Co-operation. Delhi, 2004 pp. 1.18) Curban J P, Peacok W, English Verse, Oxford University Press, 1966, pp. 432.19) Krishnaswami DR. Methodology ofResearch in Social Science. Himalaya Publishing Housing, Mumbai, 1999, pp. 34.20) Malkick. A, Elder Abuse and Neglect, Research and development Journal. Help Age India, 7(1) (2001).21) Hansen M V and Linkletter A, How to make the rest ofyour life the best of your life. Nelson Book Publication. USA, 2006.22) Nasireen A, Elderly and their Counseling Need. Social Welfare, (2003), pp. 37-39.23) Guthati R and K, Mehra Aand Janaki R, Voluntary Organisation and the Community - Kenark Publication Pvt. Delhi, 1995, pp. 93.24) Shank.ar R and Singh K, Role ofNGO's in Socio-Economic Development. Abhijeet Publication, New Delhi. 2003.25) Roger W, Caring for Elderly People. Tindall B. (editor), London, (1993)26) Roland L W, Studying your community. Rus.sell sage Foundation, New York, (1959).27) Sanlhosh G, Reseaivh Methodology and Statistical Techniques. Deep & Deep publication Pvt Ltd, Delhi. 2003, pp. 100.28) Benson S, Handbook for Care A.isistants, A care concern publication, London, 1989.29) Hooker S. Caring for elderly people - Understanding and practical help- Tavistock-Routledge-London, 1990.30) Bhardwaj T, National Policy on older person-Analytical review, Social Welfare, 52 (7) (2005), pp. 34-39.
31) Varma, Education of social development programmes. 43 (2) (2004), pp. 13-15.32) Vidyaakr S, Sahaya Directoiy of Voluntary organizations. Udavam Karangal Publication, Coimbatore, 2003.33) Vijayakumar S, Elderly in changing traditionalfamily structure: An Indian scenario. Social Change, 29 (1999), pp. 21 - 23.
34) Idris W and Caring E, Elderly People in the Community. Chapman and Hall, London. 1979.
61

EEaOral/8
Association of Personal-Localite Sources with Demographic and Socio-Economic Variable ofVegetable Growers Women
D K Sujan'. Sarita IVipathi ̂ & Indira Bishnoe^1. Professor. Dept. of Agricullure Exiension. BHU, Varanasi (U.P.)2. Research Scholar, Depl. of Home Science. BHU. Varanasi (U.P.)
[email protected] (09415696759)
Professor, Dept. of Home Science, BHU, Varanasi (U.P.)
ABSTRACT
Today, communication is assuming an important role in every sphere of human life includingagriculture. The higher communicable channel source utilization and indulgence in variousforms of communication have made a significant impact on agricultural developmentscenario. The benefits of personal locality can, however, be realized only if it is shared bythe millions of women vegetable growers who are ultimate users. Keeping this in view astudy was conducted with the following specific objectives: Socio-economic profile of the
respondents. Use of personal locality sources by women vegetable growers.
The study was conducted in Araziline CBDS (Community Block Development Scheme)Chiraigaon Block at Varanasi district purposively. Thereafter, from each block Jive villages
were also selected purposively which had maximum area and production in vegetable crops
as compared to other villages of selected C.D. blocks. There after 10 percent of vegetablefemale growers were selected randomly from each villages to make in total sample of 400.The respondents under study were women and head of the family.
The data was collected with the help of structured uniformed schedule person to person
contact method after establishing report. The collected data was classified, tabulated and
statistically processed with the help of percentage and test progressive farmers/formwomen (76.1%), neighbors (90.7%) and input dealers (97.7%) were highest among old agegroup.
Respondent were 12 (3%) to SC/ST, 363 (90.8%) to other backward classes and 25 (6.2%)to general caste group. The percentage of distribution of the acceptance of PLI, PL2, PL3.PL4, PL5 and PL6 by the SC/ST women were 66.7, 83.3, 58.3, 66.7, 91.7 and 100.0
respectively.). 3.8% women had no membership, 70.7% had membership of one organizationand 25.5% had membership of more than one organization. The women having no
membership were accepting the PLI, PL2, PL3, PL4, PL5 attd PL6 as 73.3%, 100%, 53.3%,80.0%, 100% and 93.3% respectively acceptance of PLI, PL2, PL3, PL4. PL5 and PL6
among illiterate women was 81.3, 91.7, 49.0, 81.3, 96.9 and 99.0 respectively and thesepercentage among women having educational level inter or more were 78.3, 95.7, 60.9,82.6, 91.3 and 95.7 respectively.
The acceptance of relative's personal localite source was approximately 50% or less than itamong all land holding groups. The acceptance of panchayat/co-operative society andinput dealers were 90% or more in all the land holding groups. The percentage distribution
of women according to their land posses.sing status were 3.5, 64.5, 18.0, 9.7 and 4.3 in thelandless, land having less than 1 hectare, land holding between 1 to 4 hectares, land holdingbetween 4 o 10 hectare and land holding greater than 10 hectares respectively The
62

percentage distribution of vegetable grower's women were 66.3, 24.2 and 9.5 in the income
group of Rs. 1 to 1,00.000. Rs. 1,00,001 to 2,00,000 and more than Rs. 2,00,000 respectively.
The relatives personal lolicate acceptable appro.xiniately 50% in all the income groups.
Panchayat/co-operative society and input dealer personal localite sources were accepted
by more than 90% of women in all income groups. The vegetable income has been divided in
three groups namely less than Rs. 12500, Rs. 12501 to Rs. 75000 and more than Rs. 75000
and their percentage was 66.0, 21.5 and 12.5 respectively. Only half of the women accepted
the relative's personal localite source in all income groups.
The relative personal localite source was accepted by half of the women in all age, caste,
social participation, educational level, land holding, total income and vegetable income
groups. More than ninety percent women had accepted the input dealers personal localite
source in all socio-demographic and income groups.
INTRODUCTION
Rural women since time immemorial have played a pivotal role in agricultural production, animal husbandry and
other related activities besides their normal domestic choices. Though, their role in the society is very important,the rural women are often 'Physically visible' but conceptually 'Invisible' and remained marginalized. The bestway to make optimum use of the human resources is to provide them opportunities for self-development throughpersonal locality sources, which improves their capability.
Communication of agricultural technologies to the farmers is a matter of paramount importance for the agricultural
development of the country. 'Rural development depends not only on technology generation process but also ondissemination of technology as per the needs of the target groups in a particular farming system.
Today, communication is assuming an important role in every sphere of human life including agriculture. Thehigher communicable channel source utilization and indulgence in various forms of communication have made
a significant impact on agricultural development scenario. The benefits of personal locality can however berealized only if it is shared by the millions of women vegetable growers who are ultimate users.
AIMS & OBJECTIVES
Keeping this in view a study was conducted with the following specific objectives:
1. Socio-economic profile of the respondents.
2. Use of personal locality sources by women vegetable growers.
MATERIALS & METHODS
The study was conducted in Araziline CBDS (Community Block Development Scheme) & Chraigaon Block atVaranasi district purposively. Thereafter, from each block five villages were also selected purposively whichhad maximum area and production in vegetable crops as compared to other villages of selected C.D. blocks.There after 10 percent of vegetable female growers were selected randomly from each village to make in totalsample of 400. The respondents under study were women and head of the family.
The data was collected with the help of structured uniformed schedule person to person contact method afterestablishing report. The collected data was classified, tabulated and statistically processed with the help ofpercentage and c^ tests.
RESULTS & DISCUSSION
The percentage distribution of the acceptance of personal locality sources according to age. cost and socialparticipation are presented in Table 1. The acceptance of the progressive farmers/form women (76.1%). neighbors(90.7%) and input dealers (97.7%) were highest among old age group.
63

Table 1; Acceptance of personal localite source according to age, caste and social participation
Variables Progressive
farmers/ Farm
women (PL,)
Neighbors
(PL,)
Relatives
(PL,)
Friends
(PL,)
Panchayat/
Cooperative
Society (PL,)
Input
dealers
(PL.)
Age group (years)
Young (20-35) 48(12%) 34(70.8) 44(54.2) 26(54.2) 49(83.3) 44(91.7) 45(93.8)
Middle (36-50) 93 (23.3%) 71(76.3) 83(89.2) 46(49.5) 74(79.6) 89(95.7) 90(96.8)
Old (>51) 259 (64.7%) 197(76.1) 235(90.7) 134(51.3) 212(81.9) 239(92,3) 253(97.7)
X--valuep-vaJue 0.650.72 0.260,88 2,80.87 0.360.84 !.38(),.'5()3 2.170.34
Caste
SC/ST (1)12 (3.0%) 8(66.7) 10(83.3) 7(58.3) 8(66.7) 11(91.7) 12(100.0)
QBC (2)363 (90.8%) 276(76.0) 330(90.9) 183(50.4) 297(81.8) 338(93.1) 352(97.0)
General (3)25 (6.2%) 18(72.0) 22(88.0) 14(56.0) 21(84.0) 23(92.0) 24(96.0)
X^-valuep-value 0.730.695 0.970.62 0.560.76 J.880.39 ().()78().962 ;).460.795
Social Participation (membership numbers)
No Membership (0)15 (3.8%) 11(73,3) 15(100.0) 8(53.3) 12(80.0) 15(100.0) 14(93.3)
Membership of one
organization (1)283 (70.7%) 214(75.5) 257(90.8) 144(50.9) 229(80.9) 261(92.2) 276(97.5)
Membership of more than
one organization (>2)I02 (25.5%) 77(75.5) 90(88.2) 52(51.0) 85(83.3) 96(94.1) 98(96.1)
X^-value 0.04 2.22 0.034 0.31 1.59 1.26
p-value 0.98 0.33 0.98 0.86 0.45 0.53
Figures in parentheses show the percentage
The relatives and friends personal locality sources were highly accepted by the young women whereas the
acceptance of panchayat/co-operative society was highly accepted by the middle age-group women. The
acceptance percentage distribution of different personal localite sources is almost similar in all the age groups
and the visual difference is not found statistically significant (Table 1). The caste wise percentage distribution of
the respondent were 12 (3%) to SC/ST, 363 (90.8%) to other backward classes and 25 (6.2%) to general caste
group. The percentage of distribution of the acceptance of PL,, FL^, PL^, PL^, PL, and PL,, by the SC/STwomen were 66.7, 83.3, 58.3, 66.7, 91.7 and 100.0 respectively. The caste-wise variation observed in the
acceptance of different personal localities is not statistically significant as shown by the X"-values (Table I).3.8% women had no membership, 70.7% had membership of one organization and 25.5% had membership of
more than one organization. The women having no membership were accepting the PL,, PL,, PL,, PL^, PL^and PLg as 73.3%, 100%, 53.3%, 80.0%, 100% and 93.3% respectively. The acceptance of personal localitevariables according to their social participation is not significant.
Education level of women according to their acceptance of personal locality sources is presented in Table 2.
The percentage distribution of acceptance of PL,, PL^, PL,, PL^, PL, and PL,, among illiterate women was
81.3,91.7,49.0, 81.3, 96.9 and 99.0 respectively and these percentages among women having educational levelinter or more were 78.3, 95.1, 60.9. 82.6, 91.3 and 95.7 respectively. Acceptance of input dealers was morethan 93% among all educational level groups. The variation in the acceptance of different personal localitesources among different educational levels are insignificant (Table 2).
64

Table 2: Acceptance of personal localite source according to education and land holding
Variables Progressive Neighbors Relatives Friends Panchayat/ Input
farmers/ Farm (PL,) (PLj) (PL,) Cooperative dealers
women (PL,) Society (PL^) (PL,)
Education
Illiterate (0)96 (24.0%) 78(81.3) 88(91.7) 47(49.0) 78(81.3) 93(96.9) 95(99.0)
Up to Primary level (1)117 (29.2%) 90(76.9) 107(91.5) 59(50.4) 92(78.6) 107(91.5) 114(97.4)
Up to Middle level (2)119 (29.8%) 84(70.6) 105(88.2) 66(55.5) 97(81.5) 110(92.4) 115(96.6)
Up to High School (3)45 (11.3%) 32(71.1) 40(88.9) 18(40.0) 40(88.9) 41(91.1) 42(93.3)
Intermediate and above
(4) 23 (5.7%) 18(78.3) 22(95.7) 14(60.9) 19(82.6) 21(91.3) 22(95.7)
X'-valuep-value 3.960.412 1.830.77 4.190.38 2.290.68 3.050.55 3.620.46
Land holding (hcc.)
Landless (0)14 (3.5%) 9(64.3) 14(100.0) 7(50.1) 12(85.7) 13(92.9) 13(92.9)
<1 marginal (1)258 (64.5%) 197(76.4) 232(89.9) 140(54.3) 204(79.1) 239(92.6) 251(97.3)
1-4 small (2)72 (18.0%) 53(73.6) 64(88.9) 30(41.7) 63(87.5) 65(90.3) 69(95.8)
4-10 middle (3)39 (9.7%) 30(76.9) 39(100.0) 20(51.3) 32(82.1) 38(97.4) 39(100.0)
>10 large (4)17(4.3%) 13(76.5) 13(76.5) 7(41.2) 15(88.2) 17(100.0) 16(94.1)
X'-value 1.24 0.64 4.27 3.33 2.93
p-value 0.87 0.73 0.37 0.50 0.57
Figures in parentheses show the percentage
The percentage acceptance of different personal localite sources according to the land possessed by the household
(Table 2). The acceptance of relative's personal localite source was approximately 50% or less than it among
all land holding groups. The acceptance of panchayat/co-operative society and input dealers were 90% or more
in all the land holding groups. The percentage distribution of women according to their land possessing status
were 3.5, 64.5, 18.0, 9.7 and 4.3 in the landless, land having less than I hectare, land holding between 1 to 4
hectares, land holding between 4 o 10 hectare and land holding greater than 10 hectares respectively. There is
no statistical difference in the acceptance of different personal localite sources among the different land holding
groups (Table 2).
The presentation of percentage acceptance of personal localite sources according the annual income and
vegetable income is presented in Table 3. The percentage distribution of vegetable grower's women were 66.3,
24.2 and 9.5 in the income group of Rs. 1 to 1,00,000, Rs. 1,00,001 to 2,00,000 and more than Rs. 2,00,000
respectively. The relatives personal lolicate was acceptable approximately 50% in all the income groups.
Panchayat/co-operative society and input dealer personal localite sources were accepted by more than 90% of
women in all income groups. The acceptance of different personal localite sources was similar in all income
groups and there is no statistically significant difference in the acceptance of study personal localite sources
among the income groups (Table 3). The vegetable income has been divided in three groups namely less than
Rs. 12500, Rs. 12501 to Rs. 75000 and more than Rs. 75000 and their percentage was 66.0, 21.5 and 12.5
respectively. Only half of the women accepted the relative's personal localite source in all income groups. The
input dealer's personal locality was accepted by more than 95% of women in all income groups. Among the
income groups, there is no statistically significance difference in any personal localite sources (Table 3).
65

Table 3: Acceptance of personal localite source according to annual income and vegetable income
Variables Progressive Neighbors Relatives Friends Panchayat/ Input
farmers/ Farm (PL,) (PL,) (PL,) Cooperative dealers
women (PL,) Society (PL,) (PL,)
Annual Income (In Rs.)
<1,00,000 (1)265 (66.3)% 199(75.1) 242(91.3) 136(51.3) 216(81.5) 245(92.5) 257(97.0)
1,00,000-2,00,000 (2)97 (24.2%) 73(75.3) 86(88.7) 50(51.5) 78(80.4) 89(91.8) 94(96.9)
>2,00,000 (3)38 (9,5%) 30(78.9) 34(89.5) 18(47.4) 32(84.2) 38(100.0) 37(97.4)
x'-valuep-value 0.270.87 0.6460.73 0.220.89 260.88 3.210.20 0.020.99
Vegetable Income
<12,500 (1)264 (66.0%) 198(75.1) 240(90.9) 135(51.1) 216(81.8) 243(92.0) 256(97.0)
12,501-75,000 (2)86 (21.5%) 65(75.6) 76(88.4) 43(50.0) 69(80.2) 79(91.9) 83(96.5)
>75,001 (3)50 (12.5%) 39(78.0) 46(92.0) 26(52.0) 41(82.0) 50(100.0) 49(98.0)
X'-value 0.21 0.64 0.06 0.12 4.30 0.24
p-value 0.90 0.73 0.97 0.94 0.12 0.89
Figures in parentheses show the percentage
CONCLUSION
The relative personal localite source was accepted by half of the women in all age, caste, social participation,
educational level, land holding, total income and vegetable income groups. More than ninety percent women
had accepted the input dealers personal localite source in all socio-demographic and income groups.
RECOMMENDATIONS
On the basis of results obtained from this study, it is recommended that personal localite sources have made the
applicability of advance technology for vegetable cultivation, thus the development of women vegetable growershas grown up in all their socio-economic, education, standard of life etc.
REFERENCES
1. MettrickH, Development Oriented Research in Agriculture. ICRA. Wageningcn, Netherlands, 1993.
66

EEC/0ra]/9
Entrepreneurship TVaimng Programmes For Women
D K Sujan' & Sarita IVipatiiP
1. Professor, Dept. of Agriculture Extension, BHU, Varanasi (U.P.)
2. Research Scholar, Dept, of Home Science. BHU, Varanasi (U.P,)
[email protected] (09415696759)
ABSTRACT
It is a general belief in many cultures that the role of women is to build and maintain the
namely affairs like task of fetching water, cooking and rearing children, since the turn of
the centuiy, the status of women in India has been changing due to growing industrialization,
urbanization, spatial mobility and social legislation with the spread of education and
awareness women have shifted from kitchen to higher level of professional activities.
Entrepreneurship has been a male dominated phenomenon from the veiy early age but time
has changed the situation and brought women as today's most memorable and inspirational
entrepreneurs. In almost all the developed countries in the world women are putting their
steps at par with the men in the field of business. Except some Islamic countries of the world
the law of the country has been made in favour of the development of women entrepreneurship.
The main objective of this research paper work was to organise a skill development
training programme for women they lived in Varanasi city, Kashi Vidyapeeth block, Naria.
INTRODUCTION
Entrepreneurship has become popular and respectable area today, Entrepreneurship is the key to rapid growth
of a country. A Country with able entrepreneur will always go faster on the path of industrialization as compared
to a country which has no able entrepreneurs. Entrepreneurship is an activity that aims at starting establishing
an increasing the size of an enterprise that produces and sells goods or sauces in market. Doing new things and
doing things that are already done in a new way in therefore a simple definition of entrepreneurship.
Women entrepreneurship is a new phenomenon which is recently being recognized as a full-fledged profession
among women. Women are increasingly sealing entrepreneurship as
A annul for economic growth of their families as well as of nation. Some researches have available on
entrepreneurial characteristics and motivation of men but very negligible dates are available regarding womenentrepreneurs.
We know about woman's socialization pattern behavior, how their role and responsibility do not allow them tothink and behave in an entrepreneurial way this is because women have primary responsibility for child care
and household work. Hence they are not encourage to set their personal goals they make decisions only after
seeking the approval of their families and do not show much imitative for personal career development. This
has resulted in women acquiring attitudes and behavior not conducive for entrepreneurship. Assessing and
developing behavior successful is the most important component of women entrepreneurship development.
Thus project worker thought of helping women to become entrepreneur by motivating and providing training onentrepreneurship. This training would help women to get them equipped. The project is more concerned with
development of women and specially women's economic independence. This training will help them to develop
the entrepreneurial competencies among them due to all these reasons provoked the thought of undertaking thisaction project.
67

AIMS & OBJECTIVES
The main objective of the research work was to organise a skill development training programme for semiurban
women , they lived in Varanasi city, kashi vidhyapeeth block ,naria. The aim of this training programme was to
improve their skill, increase their income and improve their life style.
MATERIAL & METHODS
The study was conducted in Varanasi district was purposively selected for the study. In Varanasi district Kashi
Vidyapeeth Block, Naria was selected purposively. Entrepreneurship training was given to twenty semi urban
woman. Out of twenty women, twelve women were selling their product and eight did not sell the product. Data
was collected by personal interview method. The data were processed tabulated and classified.
RESULTS & DISCUSSION
Evolution is the process of deforming the extent to which objectives have been attained. Evaluation of any
programs is identifies as a well planned process to measure the entire programs in terms of the objectives,which examines the success or failure of the programme.
A reaction scale was prepared by the project work to identify their reaction regarding the project. The reaction
scale had four sections.
1. Section 1 - Background Information
2. Section 2- Entrepreneurship training programme
3. Section 3- About their entrepreneurship.
4. Section 4- Opinions and suggestions.
Analysis of the result revealed the following information:
Ibble 1: Percentage distribution of respondent engaged in enterprises (N-2)
Si. No Engaged in enterprise Percentage
1. Engaged 71.42
2. Not engaged 82.58
Table 1 show that majority of respondents (71.42%) were engaged in their own enterprises. 82.58 percent of
woman were not engaged in this enterprises due to their personal problems.
Table 2: Percentage distribution of respondents according to their work group training
Si. No Type of work Percentage
1. Making cigarettes 20
2. Making leaf plate 5
3. Sales women 10
4. Labor 25
5. Stealing 10
6. Making beats nackles
Background Information
30
Ibble 3; Percentage distribution of respondent according to the age of women (N=20)
SI. No Age group of women (In year) Percentage
i. 15-20 20
2. 20-25 40
3. 25-30 25
4. 30-35 15
68

Table 3 Indicates that majority (40 percent) of respondents were in the age group of 20-25 year and only (15
percent) respondent belong to 30-35 years.
Ibblc 4; Percentage distribution of respondent according to the marital status of women N=20)
SI. No Marital status Percentage
1. Married 80
2. Unmarried 20
Table 4 shows that majority of respondents (80.0%) were married and very few (20%) were unmarried.
Table 5: Percentage distribution of respondent according to the type of family (N=20)
SI .No Type of family Percentage
1. Joint 40
2. Nuclear 60
Table 5 shows that majority of the respondents (60%) were from nuclear family and few (40%) of them were
from joint family.
Ibblc 6: Percentage distribution of respondents according to the number of family members (N=20)
SI. No Number of family members Percentage
1. 4-6 50
2. 6-8 15
3. 8-10 20
4. 10 and above 15
Table 6 shows that majority of the respondents were having 4-6 members in their families. Families of respondents
(15%) were having 6-8 & 10 to above members (20%) of responds have 8-10 family members.
Table 7: Percentage distribution of respondents according to their educational level (N=20)
SI. No Level of educatioa Percentage
1. Education 90
2. Uneducated 10
Table 7 shows that (90%) of the respondents were educated only few (10%) respondents were uneducated.
Table 8: Percentage distribution of tbe respondents according to the monthly income of their family (N=20)
SI. No Monthly income Percentage
1. 500-1000 50%
2. 1000-1500 30%
3. 1500-2000 10%
4. 2000 & above 5%
Table 8 Indicates that majority of respondent (50%) belonged to the families having the monthly income between
500-100 whereas 30% of respondents have 1000-1500 monthly income 10% of respondents have 1500-2000monthly income & only 5% of respondents have 2000 above 2000 of per month.
69

Reaction of women entrepreneur regarding entreprencurship training programme: This seciion dealswith the reaction of women entrepreneurs regarding their entreprencurship training programme.
All the respondents opined that
• Entrepreneurship training programme was useful to them.
• All women were shown their entreats in will development training programme.
• They were satisfied with training programme.
• In future they would like to attend the related programme on entrepreneurship.
• They would advise their friends, relatives who want to become entrepreneurs to join entreprencurship trainingprogramme.
CONCLUSION
The following conclusion can be made after the completion of the project.
• The project helped women to start their enterprise.
• They can make house hold decorative materials after getting training programme.
• Out of twenty women, 12 women make product & they get satisfactory profit by sold their product.
• Before training they get profit but after training they get more profit.
RECOMMENDATIONS
The status of women should be acheived at par with men it is possible only as end when women becomeeconomically independent it can be acheived through entrepreneurship Training programme.
REFERENCES
1 Ghosh R Gupta M and Dhar S N, Women and entrepreneurship in India, Entrepreneurship Innovation Kanungo R N (editor). SagePublications. New Delhi, 1998, pp. 156-175.
2. Ali A. Entrepreneurship. growth and development. Charegh Publication Allahabad, India, 1980, pp. .■?6-42.
.
: 1
I j
, 1
70

EEC/Oral/11
An Appraisal ofUzhavarsandhai (Fanner's Market) in Tamil Nadu
R Hemarupaa' & Sathyavathymuthu -Lecturer, Dept. of Home Science, Fatima College, Madurai (Tamil Nadu)
[email protected] (09940875189)
Dean of Home Science, Sri Avinasliilingham University, Coimbatore (Tamil Nadu)
sathyavathymuthu® yahoo.CO. in
ABSTRACT
India is an agrarian country. A large proportion of the population in India still lives in ruralareas and depends upon agriculture for their livelihood. The extraordinary hike in price ofvegetables prompted the government of Tamilnadu to intervene in marketing of vegetables
which has a great influence on the farmer and his life, as well as the consumer's interest topurchase worth while vegetables at a fair price. The outcome of uzhavarsandhai in TamilnaduWAS' studied with major thrust to understand the organizational setup of uzhavarsandhai,benefits derived by both farmers and the consumers. Madurai, Coimbatore and Virudhunagardistricts of Tamilnadu were selected and a total of five uzhavarsandhai from the three areaswere chosen for study. The study woi- made in three different facets- with the officials of theSandhai, the farmers and the consumers. A sample size of Two Hundred and Fifty (250)farmers was selected by random sampling method. They were interviewed with a structuredquestionnaire to elicit information on past marketing problems, impact of uzhavarsandhai,benefits realized and suggestions for its better functioning. Uzhavarsandhai was wellperceived by the officials, farmers and the consumers. It had many attributes such asinfrastructure, location, censoring middlemen, fair prices and parking facility contributingto the economic upliftment of the farmers especially the small and marginal fanners. Theconsumers were also satisfied with the uzhavarsandhai. A steady growth to hundreduzhavarsandhai is a mark of its success in Tamilnadu. The statistical analysis shows that thetotal quantity of arrival in the selected uzhavarsandhai was statistically significant at 5%level; the number of farmers to consumers has turned out to be insignificant. Thus the totalquantity of sales is influenced by the number of consumers. Future focus on storage facilities,loan facilities and seed distribution at subsidized rates and need-based training programsmay be offered through uzhavarsandhai .In conclusion we may state that uzhavarsandhaihas opened up new vistas in farmer's life, a positive change to farming at the introductionof uzhavarsandhai a fascinating venture of government of Tamilnadu.
INTRODUCTION
India is an agrarian country. Half of our countries national income is derived from agriculture. Marketing offresh vegetables faces a number of problems due to their bulky nature, seasonality, lack of proper storagefacilities and high degree of perishability. The extraordinary hike in price of vegetables prompted the governmentof Tamilnadu to intervene in marketing of vegetables which has a great influence on the farmer and his life, aswell as the consumer's interest to purchase worth while vegetables at a fair price. So far the outcome ofuzhavarsandhai has not been studied in a scientific way. Therefore a study was taken up on 'An Appraisal ofUzhavarsandhai (farmer's market) in Tamil Nadu' with the following objectives.
AIMS & OBJECTIVES
1. Understand the organization and administration of uzhavarsandhai in Tamilnadu2. Know the problems faced by the farmers in marketing their produce prior to the introduction of uzhavarsandhai3. Find out the economic benefits realized by the farmers4. Understand the limitations of farmers in uzhavarsandhai and elicit suggestions for better functioning.5. Study the benefits derived by consumers in uzhavarsandhai.
71

MATERIALS & METHODS
Madurai, Coimbatore and Virudhunagar districts of Tamilnadu were selected and a total of five uzhavarsandhai
from the three areas were chosen for study. The study was made in three different facets. The officials of theUzhavarsandhai were interviewed to find out the concept, administration and functions of uzhavarsandhai indetail. Two Hundred and Fifty (250) farmers were selected by random .sampling method. They were interviewedto gather details on past marketing problems, impact of uzhavarsandhai, benefits realized and suggestions forthe improvement of uzhavarsandhai. Consumers - the ultimate beneficiaries of uzhavarsandhai were alsointerviewed to elicit information regarding the benefits received and the suggestions for the improvement ofuzhavarsandhai.
RESULTS & DISCUSSION
• Uzhavarsandhai - Concept, organization and administration: Uzhavarsandhais are located in residentialareas with adequate transport facility and road connections so as to benefit both the farmers and the consumersin a area ranging between .95 acres and ,65 acres, catering to not less than 35,000 household situated within5 to 6 kilometers. The attractive feature for its steady growth are the parking facility, canteen, lavatories,drinking water, police outpost, public adder system, telephone, price display board are present in alluzhavarsandhai irrespective of the area. Madurai uzhavarsandhai alone has the banking facility.
Price for the produce brought for sales is fixed every day by making it 20 percent more than the wholesaleand 15 percent less than retail markets. The hierarchy of the authorities starts with the administrative officeras head, helped by four other assistant administrative officers and six Makkal Nallapaniyallargal, a sweeperand three security guards. The farmers are selected by the Village Administrative Officer based on the landholding documents to get registered in the uzhavarsandhai. The farmers are given an identity card. The salesprocedure starts with the checking of the identity card, weighment of the produce, allotment of shop, receivingweights and balances for starting the sales. Officials submit the reports regularly regarding the quantumsales and profit realized for a month to the District Collector.
• Socio-economic profile of the families: The introduction of uzhavarsandhai has improved the farmerseconomically as more than 50 per cent of them fall into high income group. Land holding pattern reveals thatthe beneficiaries of uzhavarsandhai were small and marginal farmers indicating the aim of uzhavarsandhai.
• Type of marketing and problems faced prior to Uzhavarsandhai: Most of the farmers (above 90 precent) have marketed their produce to the wholesale markets of their area and a few in the local and ruralmarkets. The marketing problems faced prior to uzhavarsandhai are transport constrains, low profit,intervention of middlemen and lack of storage facility.
• Farm products brought to uzhavarsandhai: The statistical analysis shows that the total quantity of arrivalin the selected uzhavarsandhai was statistically significant at 5% level; the number of farmers to consumers
has turned out to be insignificant. Thus the total quantity of sales is influenced by the number of consumers.
Vegetables Madurai Coimbatore Virudhunagar
Farmers Arrival Sales Farmers Arrival Sates Farmers Arrival Sales
(Kg) (Kg) (Kg) (Kg) (Kg) (Kg)
Beetrool 32 56 53 35 86 86 25 46 44
Brinjal 37 81 89 40 95 95 42 65 64
Cauliflower 15 319 314 17 399 399 8 .5 73 564
Coconut 10 597 590 15 67! 670 6 616 583
Ladyfinger 45 78 70 45 84 83 48 5 5 55
Onion (Big) 33 1 16 i 15 45 90 89 37 64 61
Onion(Small) 35 131 130 45 100 97 37 75 73
Potato 36 94 93 35 54 52 1 5 5 5 54
Radish 33 87 37 35 100 99 26 40 39
Tomato 47 80 79 45 90 89 37 64 6!
72

• Uzhavarsandhai's impact on farmers' life: The farmers spent less time in transporting their produce
attributed to the transport facility. Majority (20 per cent) of the time was spent in sales, indirectly reflecting
the profit earned. Provisions of cooling room, increase in number of shops, loan facility and seed distribution
at subsidized rates were the farmers' suggestion for improvement.
• Benefits derived by farmers through the Uzhavarsandhai: Favorable location of the market, price
fixation, censoring middlemen, infrastructural facilities, registration and provision of identity cards, enhanced
income, improved standard of living, socialization with farmers and clients, improved knowledge of science
and technology by exposure to various communication modes were made possible through uzhavarsandhai.
• Consumers' views on Uzhavarsandhai: The consumers were much satisfied with farm fresh vegetables,
parking facility, fair price and proper weighment, ease of transport and availability of fresh vegetables.
CONCLUSION
In conclusion we may state that uzhavarsandhai has opened up new vistas in farmer's life, a positive change to
farming at the introduction of uzhavarsandhai a fascinating venture of government of Tamil Nadu.
RECOMMENDATIONS
1. The government of Tamilnadu should initiate uzhavarsandhai based on the population
2. Storage facilities should be provided within uzhavarsandhai.
3. Training imparted to farmers should be need based.
4. Loan facility at subsidized rates may be extended for the farmers enrolled in uzhavarsandhai.
5. Based on the requirements more number of shops should be constructed.
6. The government needs to take special interest with reference to adult education for illiterate farmers atuzhavarsandhai.
REFERENCES
1. Krishnamurthy S, Fanners market in Tamil Nadu, Kisan World, 11 (2000), pp. 19, 20.
2. Lull M M. National agriculture price policy on anvil, Yojana, 5 (2000), pp. 8-10.
73

EEC/Poster/1
Imparting Health Education to Irula IHbal Women in Coimbatore District
R S Philachon
Ph.D Scholar, Avinashiiingam University for Women, Coimbatore (Tamilnadu)
[email protected] (09899062104)
Health education is dynamic in nature. Therefore, to be effective, it requires interaction between the
individual, the home, the school and the community to increase the abilities of people to make informed decisionsaffecting their personal, family and community well-being. Hygiene deals both with the individual and thecommunity. Karamadai block was chosen as the area of study. From each village 20 women were selectedaltogether ICQ women were selected as a sample for the study. Interview schedule was used as a tool forcollecting data and check list were also used to assess the knowledge gained on health and hygiene practices.
97 per cent had expressed that health is necessary for prevention of diseases. But after education 86 per cent
had gained knowledge and understood the importance of health and sanitation. Change in childhood and schoolhealth hygiene education programme can pave a great way for improvement in sanitation and environment
condition. It has been impressed upon the minds of the people that this programme is essential for keeping good
health and protecting the family and village from various diseases.
EEC/Poster/2
^oblems of Entrepreneursbip Development among Farm Women
Laxmipriya Pradhan', Pranati Das^ & Subha-shree Sahoo^1. Subject Matter Specialist (Home Science), Krishi Vigyan Kcndra, Ranital, Bhaclrak (Orissa)
[email protected] (09438149929)
2. Director, College of Home Science, OUAT, Bhubaneswar
3. Programme Assistant (Home Science), K V K, Bhanjanagar (Orissa)
Women have been regarded as the nuclei of a nation and builder and molder of its destiny. National
development is not possible without developing this important and substantial section of our society. Employment
gives economic status to women and economic status paves way to social status. In India where 30crores ofpeople are in below poverty line, it is possible for any Government to provide means of livelihood to everyone.There are some income generating activities like Mushroom cultivation. Pisciculture, Nursery raising. Improvedpoultry rearing. Bee-keeping, Agro-processing, coir work, vermin composting etc. are promoted by KrishiVigyan Kendra, an ICAR institution and line department to the farm women Entrepreneursbip development isnot only solve the problem of economic development but also to solve the problems of unemployment, unbalancedareas of development , concentration of economic power & division of profit from traditional avenues ofinvestments. Though more than half century has passed after independence, development of womenentrepreneursbip has not been rapidly achieved as the other measures of development. This paper representsthe "Problems of entrepreneursbip development among farm women". A study was undertaken in two districti.e. Bhadrak and Balasore district of Orissa with 120nos of participants on random basis. Thi.s study reveals that
60% women faced socio-personal problems (Lack of self-confidence, socio-cultural barriers). 60% womenhave managerial problems, 70% women have marketing problems, 68% women have financial problems and62% women have problems Govt. Assistant So that appropriate training is needed in various developmentactivities and programmes so that farm women can improve their knowledge, attitudes and skills to performtheir jobs efficiently and effectively.
74

EEC/Poster/3
Designing and Developing Interactive Multimedia as Trainer's Instructional Guide
Varindar Randhawa' & Sumita Roy-
1. Professor and Head, Dept. of Home Science Extension Education,
College of Home Science, Punjab Agricultural University (Ludhiana)
[email protected]/[email protected]/[email protected],
(09876081778)
2. Retired Professor, Dept. of Home Science Extension Education,
College of Home Science, Punjab Agricultural University (Ludhiana)
[email protected] (09463395903)
The cutting edge information technology demands faster system capable of handling communication indifferent domains of instruction. This is amply backed by power of multimedia. The present project aimed atdesigning and developing interactive multimedia for end users of technology transfer in the formal sector of
training. In all 17 training modules containing text and graphic elements were designed by story boarding and
prototypes were developed. Team approach was adopted for inserting artwork and transforming the contentinto a combination of elements of multimedia. This included graphics, still images and video clips for supplementing
text prior to tiansforming data into electronic device of CD-ROMs. The display on individual slide was augmented
with colour in the background, text, bullets and images. The correctness of entire process of designing and
development was ensured through pedagogical validation. Later a variety of animation was inserted on slides tohighlight the content and enhance interactivity. Audio narrations where ever necessary was added to complement
the content for presentation and attracting attention of end users. This was also technically validated followed
by system test and user acceptance test. These CD-ROMs then formed the platform for interactive use on the
computer for which software packages were developed.
EEC/Poster/6
An Analytical Study on the Usage ofTeaching Learning Materials in the Selected Schools ofManipurState
Sisiliya K
PhD Scholar, Dept. of Home Science Extension Education of Avinashilingam University for
Women College, Coimbalore (Tamildadu)
[email protected] (08056447068)
This article reflects the extent of using technological aids and modern techniques in the present position
of high schools of Manipur State. This would give an important insight about technology adoption and its
accessibility among the high schools with the following objectives: (a) To ascertain the extent of using teaching
learning materials in the selected high school (b) To find out the problems encountered by the teachers for
adopting teaching aids in the selected schools. The methods adopted for the present study was survey method.This survey was designed to obtain information about frequency, awareness and interest of using teaching
learning materials and methods in the classroom. Total 30 high schools were drawn randomly from Imphal East
District comprising government, aided and non-aided. Each school has 3 teachers for social studies, one eachfor History, Geography, and Civic. So, a total of 90 teachers participated in the survey. The Questionnaire
method had adopted for collecting data .The study has revealed that though the majority of teachers are awareof various teaching methods and technological aids, the application of such methods and aids into classroomteaching is very limited. However, it was quite obvious that most of the schools had adopted the method whichis traditionally oriented like lecture with blackboard, map and globes as a supplement to lecture for effectiveteaching.
75


FOODS, NtJTRITION, DIETETICS AND HOSPITALITY MANAGEMENT
(Oral & Poster Presentation)


FNDHM/Oral/1
An Epidemiological Study of the Assessment of the Dietary Pattern and Nutritional Deficiencies inRural Areas of Shimla District
AnjaliDewan
Head, Dept. of Home Science,
St. Bede's College, Shimla (Himachal Pradesh)
[email protected] (09816116652)
ABSTRACT
Diet and nutrition are important factors in the promotion and maintenance of good health.
Health and nutritional status of an individual depends on the food they eat. The components
of the diet must be chosen judiciously to provide all the nutrients needed in adequate amountsand proportions. A normal balanced diet must include daily foods from the various food
groups in sufficient amounts to meet the needs of an individual. Selection offoods from thedifferent food groups also results in variety in the diet, which not only ensures nutritionaladequacy but also increases food acceptability. Food habits are an important part of ourdiet which affects the amount and type offood consumed and thus the nutritional status ofthe women. The diets of the women were mainly based on cereals and deficient in vegetables
and fruits. The low intake of these protective foods resulted in nutritional disorders. Theclinical signs of malnutrition, anaemia and vitamin B-complex deficiencies were observed.
Promoting healthy diets and lifestyles to reduce the burden of malnutrition and non
communicable diseases requires a multisectorial approach.
INTRODUCTION
The health and nutritional status of rural women who form the vulnerable group of India's population is far from
satisfactory. In the rural areas of Shimla, they work as homemakers, farmers, food providers, fuel gatherersand animal feeders. Keeping this in mind, the present study has been undertaken with the following objectives:
To find out the anthropometric measurements consisting of weight, height and B.M.I
To determine and compare the nutrient intake with the Recommended dietary allowances
To examine the clinical signs and symptoms of nutritional deficiencies.
To assess the blood parameters of the rural women.
AIMS & OBJECTIVES
1. To find out the anthropometric measurements consisting of weight, height and B.M.I
2. To determine and compare the nutrient intake with the Recommended dietary allowances
3. To examine the clinical signs and symptoms of nutritional deficiencies.
4. To assess the blood parameters of the rural women.
MATERIALS & METHODS
A well structured interview schedule was developed. A sample of 500 rural women in the age group of 20-35
years was randomly selected for the study from the four villages. The food consumption of the subjects wasrecorded by 24-hour recall method for three consecutive days. From the actual consumption of foods daily bythe respondents, the energy, proteins, iron, calcium, vitamin A (Retinol), thiamine, riboflavin, niacin and ascorbicacid content was calculated using food composition tables. The percentage adequacy of the diets was alsocalculated. Body mass index was calculated using the formula given by Wyngaarden, as cited in Srilaxmi(2002).
79

B.M.I =Weight (Kg.)
Height in metres^
The blood samples of the respondents were checked for haemoglobin by cyanmethaemoglobin method of
Dacie and Lewis (1966) and Packed Cell Volume (PCV) by Hunter and Bomford (1967). The results were
statistically analyzed. The morbidity symptoms and the information regarding the illness suffered by the women
since past three months were noted down. All the women were clinically examined using the ICMR schedule.
The presence or absence of the clinical deficiency symptoms was recorded.
RESULTS & DISCUSSION
The diet of rural women was monotonous and lacking in variety. They were more concerned about the quantity
than quality of the diet. The common menu was cereal for breakfast and rice with dal or vegetable for dinner.
The average daily intake of nutrients by the rural women is presented in Table 1.
Table 1: Mean daily nutrient intake of rural women in comparison with RDA
Nutrient RDA Mean Value ± S.D % Diet Adequacy
Energy (Kcal.) 2225 1894 ± 241 117.47
Proteins (gm.) 50 41 ± 3.69 121.95
Fats (gm.) 20 11.4± 1.15 175.40
Iron (mg.) 30 23 ± 1.99 130.43
Calcium (mg.) 400 342 ±31.0 116.95
Vitamin A (pg.) 600 425 ±51.3 141.17
Thiamine (mg.) I.I 0.6 ±0.1 183.33
Riboflavin (mg.) 1.3 0.7 ± 0.2 185.71
Niacin (mg.) 14 9.3 ± 1.03 150.53
Ascorbic acid (mg.) 40 30 ± 5.6 66.66
The adequacy of nutrients was below the RDA's for all the nutrients. The mean daily energy and protein intake
by the respondents was 117.47 and 121.95% adequate as compared to the RDA (ICMR, 1990). The mean
daily intake of iron intake among the subjects was 23 mg. which wasl30.43% of the RDA for iron. The low iron
intake was due to insufficient intake of green vegetables, absence of sprouts. The mean values of thiamine,
riboflavin, niacin in the daily diets of the respondents were inadequate as compared to the RDA's.
• Anthropometric Measurements : The average weight and height of the subjects is shown in Table 2.
Table 2: Anthropometric measurements of the rural women
Parameters Mean Value Normal Value
Weight (Kg.) 40 ± 1.8 50*
Height (cm.) 141 ± 7.9 156*
B.M.I 16 ±0.8 18-23**
The average weight of the rural women ranged from 35 to 55 kg. whereas the range of height was from 115 to
150 cm. The results showed that the rural women were of less height, weight and B.M.I than the normal
values.
• Morbidity & Clinical Symptoms : The illnesses and other clinical symptoms reported among this studywere backache, headache, pain in the legs and hands, diarrhea and fever as shown in Table 3. This may bedue to the considerable workload for women who spent 8-9 hours at work, continued their work at home
80

also and consumed less food. This led to dietary inadequacies. Anaemia was rampant as shown in Table 4.
Clinical symptoms of anaemia such as paleness of conjunctiva and skin, pale and smooth tongue, koilonychia
and fatigue were observed among the rural women. 82% of the respondents complained of lethargy.
Symptoms of other nutritional deficiency diseases such as pale eyes, scarlet raw tongue, angular stomatitis,
cheilosis, mottled enamel, dental caries, phrynoderma, scurvy were observed among the rural women as
shown in Table 5.
Table 3: Existing illnesses and other clinical symptoms
SI. No. Symptoms Number of Subjects (N=SOO) % Rank
1. Cold 98 19.6 5
2. Cough 107 21.4 4
3. Diarrhoea 43 8.6 7
3. Fever 65 13.0 6
4. Headache 119 23.8 3
5. Pain in hands & legs 150 30 2
6. Backache 202 40.4 1
Ibble 4: Clinical symptoms of Anaemia among rural women
Symptoms Number(N=500) %
Pale conjunctiva 218 43.6
Paleness of skin 106 21.2
Pale & smooth tongue 76 15.2
Koilonychia 297 59.4
Feeling of lethargy 410 82
Table 5: Clinical symptoms of other nutritional deficiencies among rural women
Symptoms Number of Subjects (n=500) %
Pale eyes 10 2
Scarlet raw tongue 25 5
Angular stomatitis 43 8.6
Cheilosis 52 10.4
Mottled Enamel 103 20.6
Dental caries 291 58.2
Phrynoderma 8 1.6
Scurvy 38 7.6
Data showed that 58.2% rural women had dental caries. Mottled enamel was observed in 20.6% subjects.
Bleeding gums, loose teeth were present in 7.6% respondents.
• Blood Parameters : The blood haemoglobin (Hb) level, packed cell volume (PCV) and mean corpuscular
haemoglobin concentration (MCHC) values ranged from 7-I2gm. /dl, 25-42% and 22-37% respectively.
The mean Hb value of 9.8 gm. /dl and of MCHC 28% was below normal limit confirming the presence of
iron deficiency anaemia as shown in Ibble 6.
81

Table 6: Blood Parameters of the rural women
Blood Parameters Mean ± S.D Norniul Value
Haemoglobin 9.8 ± 0.4 I2.0*
Packed Cell Volume % 36.7 ± 0.8 32-38-*
Mean Corpuscular Haemoglobin Concentration % 28 ±0.2 32-.3X-*
* WHO (1970)** Hunter & Bomford (1967)
CONCLUSION
The present study revealed that the consumption of milk and milk products, vegetables and fruits was much lessthan the RDA proposed by ICMR (1990). The body weight, height and B.M.I of the rural women were below
normal. There were clinical signs and symptoms of anaemia, B-complex vitamin deficiencies. Promoting healthydiets and lifestyles to reduce malnutrition and non-communicable disea.ses requires a multi.sectoriai approach.
The strategies must not only be directed at ensuring food security for all but the rural women must be encouraged
to consume adequate quantities of safe and good quality foods. Nothing short of radical change will help in
raising the health and nutritional status of the rural women.
RECOMMENDATIONS
An intensive study on the effects of detailed cultural factors including status of women and sharing of food and
food taboos will provide for a better understanding of the various nutritional deficiency di.sea.ses. The occurrenceof diseases of nutritional and non nutritional origin in district Shimla in recent years suggest a need for proper
antenatal services, supplementation of iron-folate tablets in pregnancy and lactation, nutrition support to meetthe RDA during pregnancy and lactation. Screening for various nutritional deficiencies, their treatment andavailability, of food at reduced rates for the poor women can go along way in eradication of malnutrition especiallyin women, adolescent girls and children. Nothing short of radical change will help in raising the health andnutritional status of the rural women.
REFERENCES
1. A global agenda for combating malnutrition, Progress Report. World Health Organization, Geneva, 2000.2. andLawsSM. Practical haematology, English Language Book Society and J.A Churchill Ltd.. London, 1969, pp. 216.
3. Gangadharappa N R, Vijayalakshmi D, et.al. Dietary habits and mitritionai deficiencies • An appraisal oftn-nds in Stnirh India,Gandhi Krishi Vignana Kendra, University of Agricultural Sciences, Bangalore. 2005.
4. Gibney M J and Lee P, Patterns of food and nutrition intake in suburbs of Dublin with chronically high uncinploynicnt. Journal ofNumun. Nutrition and Dietetics, 6 (1) (1993). pp. 13-22.
5. Hunter I and Bomford V N, Clinical haematology, Academic Press, New York, 1967, pp. II.6. Nutrient requirement and recommended dietary allowancesfor Indians. Indian Council of Medical Research. National Institute
on Nutrition, Hyderabad. 1990.
7. Jellife D B, The assessment ofnutritional status of community. World Health Organization, Geneva, 1996, pp. 74.8. Oyarzun M T and Sanjur D, Diet of low income urban women in Central Chile. Rewisia. Chiene-de-Nutriiion. 21 (2) (1993), pp.
87-97.
9. The world health report, reducing risks, promoting healthy life. World Health Organization. Geneva, 2()()2-
82

FNDHM/Oral/3
Quality Evaluation of Moth Bean Based Extruded Products
Gitaryali Rattan' & Madhu Goyal-1. PG Scholar, Dept. of Food & Nutrition, College of Home Science,
SKRAU, Bikaner (Rajasthan)
[email protected] (09314301113)
2. Associate Professor,, Dept. of Food & Nutrition, College of Home Science,
SKRAU, Bikaner (Rajasthan)
[email protected] (09413211221)
ABSTRACT
Molh bean (Vigna aconitifolia) is an inexpensive source of important nutrients <&. also
consumed most popularly among the arid legumes, although in limited forms. In view of
increasing trend of liking towards extruded products it was thought relevant to find out
extrusion potential of moth bean .Hence vadi , bhujia & chakali were developed &
standardized with varying proportion of moth bean along with other ingredients Organoleptic
evaluation of the extruded product on 9 point hedonic rating scale by semi trained panel of
10 members revealed" moderate" (7.70,7.80, 7.90, 7.80, 7.70) to "veiy much liking "(8.70,
8.80, 8.90, 8.70) for the product prepared with 25% of moth bean in each case. Shelf life of
the three products for a period of one month ivflj evaluated on the basis of their overall
attributes, fat acidity & standard plate count (S.P.C) using standard methods. The
Organoleptic score of the product ranged between 7.10 - 8.60 at the end of the storage
period with non significant differences indicating high acceptance of the product .The fat
acidity (1.44 mgKOH/lOOg -20.54 mgKOH/WO g) & Standard plate count (O.lxHy-O.OxlO"found to be in satisfactory range after one month of storage .Thus results clearly indicated
good extrusion potential of molh bean which can easily be exploited for livelihood security
of the people residing in arid areas.
INTRODUCTION
Pulses form an integral part of the vegetarian diet in the Indian sub continent. Besides being a rich source of
protein, they maintain soil fertility through nitrogen fixation and thus play a vital role in furthering sustainable
agriculture. In Indian context, arid legumes consist of moth bean, cluster bean, horse gram and chickpea.
Among the arid legumes moth bean (Vigna aconitifolia [JacqJ.Marechal) is the most consuming pulse of the
people living in harsh environment of arid and semi arid zones. Moth bean has been identified as one of the
potential protein food source. It also possesses high nutritive value in respect of moisture, crude protein, crude
fiber, and ash and nitrogen free extract .It is invariably used by local people only and hitherto under exploited for
their nutritional contribution. Moth bean seeds are mostly consumed as cooked, whole seeds, split peas (dhals)
or as sprouted.
The green immature seeds can be consumed as such or after cooking. Moth bean flour is used for preparation
of traditional products like papad, snacks, nuggets, roti, bhujia, ladoo, mathari, vadi Extruded products such
as vadi, bhujia and chakali gaining popularity in today's multicultural world as per general trend. However,
one necessarily does not have to purchase them from the market, as they can be prepared at household level.
Hence the present study was aimed to assess the quality evaluation of moth bean (RMO-435) based extruded
products.
AIMS & OBJECTIVES
To assess organoleptic acceptability of moth bean based extruded products cS: their shelf life evaluation.
83

MATERIALS & METHODS
• Availability of moth bean: Seeds of RMO-435 varieties of moth bean were procured from AgriculturalResearch Station, SKRAU, Bikaner, Rajasthan. Physically sound seeds were collected after screening andcleaning and stored in air tight containers under suitable hygienic condition.
• Development and Standardization of products: Different extruded products (vadi. bhujia & chakali)were made from moth bean flour by replacing the basic flour i.e. either gram flour & moong dal (basicpulse) in case of vadi as per requirement at different proportions viz.. 25 per cent, 50,75 and even at 1 GO percent.
• Sensory Evaluation: To assess acceptability of the products sensory evaluation was carried out by a
panel of 10 semi trained judges using nine point hedonic ranking scale.
• Shelf life study: The developed products were stored at room temperature for one month .The shelf life
was assessed the basis of following criteria.
1. Organoleptic evaluation of developed products: Stored products were subjected to organoleptic evaluationby pane! of 10 semi-trained judges using 9 point hedonic ranking scale at the interval of 15 days up to Imonth
2. Fat acidity: The fat acidity was determined by the method of AOAC (1995).
3. Microbial evaluation: In the present study products were examined for the presence of organisms
using standard procedure
4. Standard plate count: Standard plate count test for developed products was conducted by pour platemethod as described by APHA (1984).
RESULTS & DISCUSSIONS
• Sensory Evaluation: All the 3 products of extruded category were subjected to organoleptic evaluation bythe panel ofjudges and the pertaining results for all types of vadi prepared either with 25 per cent, 50 percent, 75 or 100 per cent replacement of moong dal were falling into the "liked very much" and "likedmoderately" category since their organoleptic scores were noted to be 8.70,7.70,7.70 and 7.80 respectively.Overall acceptability mean score for bhujia was found to be 8.80, 7.90 ,7.80,6.30 & 5.40 respectively.While the scores for chakali were 8.70,7.70, 6.60,5,40 & 5.30 respectively. However significant differencewas observed among all the treatments for their palatability scores.
• Shelf life study: Under the present study shelf life of the most acceptable products was judged on the basisof their organoleptic evaluation, fat acidity and microbial count after each interval of 15 days during thestorage period of one month.
• Organoleptic evaluation of developed products: Stored moth bean based products were evaluated bya panel of 10 judges using 9 point hedonic rating scale. .The mean scores on organoleptic parameters werefound to be 8.60 ,8.30,8.10 ,7.80 ,7.50,7.20,7.70, 7.30 & 7.30 for vadi, bhujia & chakali respectively, withnon significant statistical difference at 5 % level of significance.
• Fat acidity: The fat acidity contents of vadi. bhujia & chakali sample was analyzed to be 1.44.1.82,4.75, 5.11, 5.75, 12.83, 16.15 and 20.54 mgKOH/100 g at 0, 15 and 30 days of storage. Values increased
non significantly up to 30 days of storage for vadi where as in case of bhujia & chakali significant changes
were found.
• Microbial evaluation: The data regarding the standard plate count all the, moth bean based extruded
products reveals that number of bacteria (CFU) at '0' ,15,& 30"' day of storage was found to be 0.3x 104,0.5x104 .0.8x104, 0.5x10⁴ 0.3x10⁴ ,0.9x104, 0.2x10⁴, 0.5x10⁴, 0.7x10⁴ indicating constant increase inthe microbial count.
84

CONCLUSION
The present investigation reveals that extruded products prepared from moth bean at 25% were well acceptable
on organoleptic parameters & the most acceptable products were found in satisfactory range during storage
period .Thus moth bean possess great extrusion potential with higher acceptability on organoleptic parameters.
RECOMMENDATIONS
1. The present study is recommended to provide a wide scope for popularizing the under utilized and under
exported moth bean legume and its value addition prospects
2. Production of different moth bean based extruded products at commercial level can promote livelihood
security among the rural masses in arid regions.
3. Moth bean possess sound extrusion potential & it can be incorporated for preparing different forms of
extruded products other then used under study.
REFERENCES
1. Arlington V A, Official method ofanalysis, AOAC Association of Official Analytical Chemists, 16"' Ed.. 1995.
2. Standard methodfor the examination ofdairy products, American Public Health Association, 10'" Ed.. INC, New York, 1984,
3. Swaminathan M S, Food science chemistry and experimentalfood. The Bangalore printing and Publishing Co. Ltd., Bangalore,
1987.
85.

FNDHM/Orai/8
A Study on the Nutritional Status of Athletes in the Age Group of 17- 22 Years Undergoing Trainingat Sports Authority of India, Mumbai
S Abraham'& P Machado- __1. Culinary Consultant. Add-Regina
Fads, Working Women's Hostel, Motishah Lane, ^
Byculla East, Mumbai (Maharashtra) ",,
[email protected] (09619206050)
2. Principal, College of Home Science. Nirmala Nikelan, Mumbai (Maharashtra)IS-principal @nirmalaniketan.com W S. a'
ABSTRACT
Food forms the potential source of energy, providing nutrition through the regular diet.Realizing its importance athletes, this study was envisaged. Athletes (n= 46) from SportsAuthority of India, Mumbai were selected and categorized based on sports categories.Nutritional status was assessed using a three-day dietary recall, food frequency questionnaire,anthropometric measurements, fitness performance tests and biochemical analvsis. Dietaryrecall revealed that the mean calcium, beta- carotene and vitamin C intake among male andfemale athletes met the recommendations while a significant difference vfa.y seen in the meanintake of energy, protein and iron. The mean haemoglobin levels were below recommendedlevels. Eighty-two percent of the athletes were anemic. A significant difference was seen inthe iron, beta- carotene, folic acid and vitamin C intake across the three .sport groups. Themean body fat percent was higher among the male athletes involved in power sports andfemale athletes involved in combination of power and endurance sports. Optimizing anathlete's health with good nutrition is vital for peak performance. Nutritional knowledge,diet counseling and early screening of nutritional deficiencies can contribute greatly towardsbuilding better standards in Indian sports both for athletes as well as for their coaches.
INTRODUCTION
India has produced players with exceptional skills who have made their presence fell at the international levelin the individual sports as well as team sports. An athlete's performance is a composite of many differentfactors and attaining this ideal performance is largely a personal choice. Young athletes and their parents arefrequently unaware of the appropriate components of a training diet. Therefore this study was carried out withan aim to understand the nutritional status of these athletes.
AIM & OBJECTIVES
1. To assess the nutritional status of athletes involved in power sports, endurance sports and combination ofpower and endurance.
2. To study the gender differences of the athletes concerning their nutrient intake, fitnes.s performance scores,and biochemical profile.
3. To understand the association between the nutritional status and percent body fat, fitness performance andbiochemical profile among the athletes.
4. To examine the differences between the nutrient intake, blood parameters and fitness performance betweenthe athletes involved in power sports, endurance sports and combination of power and endurance sports.
5. To understand the coach's perception regarding nutrition.
MATERIALS & METHODS
Forty-six athletes were selected for the study from the sports authority of India, Kandivili-Muinbai. Theseathletes were categorized based on the different sports categories, which included power sports, endurancesports and combination of power and endurance sports.
86

Nutritional status of the athletes was assessed using a three day 24 hour dietary recall and food frequency
questionnaire, anthropometric measurements, fitness performance and biochemical analysis.
Coaches were interviewed regarding their nutritional knowledge and the performance of their students.
RESULTS & DISCUSSIONS
Sports have been played worldwide by the young, old males and females and by amateurs and professionals.Many of the athletes and coaches neglect proper nutrition, which forms the foundation for a good physicalperformance. This study was carried out in order to understand the dietary pattern of the athletes and itsrelationship with their performance to improve the fitness levels of these athletes.
Body mass index was calculated based on the height and weight, which showed that 93% of the athletes fellunder the optimal body fat category while 7% were underweight (Figure I). A significant increase was seenin the fat mass among female compared to males. (p=.003).
n Undcrwciglii
UOplitnal Body Fal
Figure 1: Distribution of Athletes based on BMI
Fitness performance test showed athletes showed poor performance among athletes in the muscular strength(47.5%) while superior performance was seen in muscular endurance test (39.1 %). Significant correlation wasobserved in the fitness tests and blood parameters, percent body fat, BMI and nutrient intake.
Skipping meals was a common routine among the athletes (71.9%) with lunch being the most skipped amongthe female athletes. Thirty percent athletes (44% male and 2% female) consumed nutritional supplements in
order to improve their performance. Study by Berglund et al (2001). found that among the elite athletes 76%male and 92% female consumed nutritional supplements.
Meals provided by the hostel were high in carbohydrate, protein and fat. Similar study by Helinski (1952),reported the diets of the Olympic athletes to be high in energy, proteins and fats. The requirements of calcium,beta-carotene and vitamin c were met through this diet. Though the meals provided by the hostel were rich in
carbohydrate and proteins, a vast difference was seen in energy, protein and iron requirements. This could bedue to lesser serving size taken by these athletes during their meals (Table 1).
Ikbie 1: Mean Nutrient Intake Between Male and Female Athletes
Nutrient
Mean Intake
Male
Observed Recommended
Female
Observed Recommended
Energy (Kcal) 2661.69 + 535.86 4320 2205.12 + 362.22 3480
Carbohydrates (g) 403.07 + 86.03 326.88 + 86.27
Prolein.s (g) 91.62 + 33.31 100-120 76.88 ± 33.68 80-100
Fat.s (g) 7,5.83+ 18.41 67.06 + 15..33
Calcium (mg) 1079.38 + 294.56 1000- 2000 1010 + 246.41 1000-2000
Iron (mg) 18.62+4.47 50- 75 15 + 3.76 60- 100
Beta- carotene (meg) 1880.41 + 828.12 1000- 2000 1880.41 + 828.12 1000- 2000
Folic acid (meg) 209.94 + 155.29 209.94 + 155.29
Vitamin C(mg) 128.88 + 88.46 100- 200 128.88 + 88.46 100- 200
87

Iron deficiency is one of the most common nutrient deficiencies in the world and is one of the major concerns
today. Sixty eight percent of the athletes had a haemoglobin level below the normal range. The mean haemoglobin
levels between the male and the female athletes were found to be 13.23 ± 1.13g % and 11.11 + 1.9 g %. These
values were below the reference values for males (14-17 g %) and females (12- 15 g %) suggested by Carlson
(2000) & McArdle (2005). The present study showed a significant reduction in the haemoglobin levels among
the male and female athletes (Wilcoxon's Z= 4.796, p= .000). This may be due to the intense training or
inadequate iron intake leading to insufficiency or iron deficiency anaemia. Malczewska J (2000), also found that
the main cause for iron deficiency among the athletes could be too low iron intake (especially heme iron: 0.3 mg
daily) and nutrients that influence metabolism. Studies have shown that intense training periods are associatedwith an increase in the plasma volume and a corresponding reduction in iron status.
Iron deficiency is one of the major concerns for approximately 15% of the world's population and is the most
common single nutrient deficiency disease (Tobin et al, 2000). Eighty two percent of the athletes in the current
study were found to have iron deficiency anaemia with a percent saturation of < 25 %. All the female athletes(100%) involved in this study were anaemic. The study carried out by Seals (2002) also showed the prevalence
of anaemia among the female athletes.
In 2000- 2002, the World Health Organization classified anaemia based on haemoglobin level in the blood.
According to this classification, anaemia was classified as mild (110- 119 g/1), moderate (100- 109 g/1) and
severe (50- 99 g/1). In the present study, 13.6% of the athletes had mild anaemia, 9% were moderately anaemic
and 9% had severe anaemia.
The Food Frequency Questionnaire showed that the consumption of cereals, pulses, banana, milk, limejuice,
curds, egg and chicken (among non- vegetarians) were on a regular basis. High consumption of chicken among
the non-vegetarians accounted for their high protein intake (Figure 2). Consumption of micronuirieni rich foods
was seen on weekly basis.
120
100
o) 80
ffi 40
c
o
E
chicken egg
JB-
a>
gc
milk&
products
frequency
Mn.
ni■o
! ■ IJh_
oE
meat
la endurancesports
B power sports
i I combination ofboth
Figure 2: Consumption of Foods Rich in Proteins among the Athletes
Coaches play an important role in the optimal performance of the athletes. The coaches in the present studywere aware of the nutritional requirements of the athletes but they emphasized more on carbohydrate loadingfor better performance during the competitive seasons.Good nutrition is not only the key success to the well being of the athletes but also plays an important role forindividuals from the non athletic background. Thus there is a great need for nutritional guidance and advice forthe athletes as well as their coach who play an important role to improve and optimize the health, physicalfi tness and sports performance of these athletes.
88

CONCLUSION
Optimizing an athlete's health with good nutrition is necessary for their overall build up. Nutritional knowledge
and diet counselling and early screening of nutritional deficiencies can contribute greatly towards building better
standards in Indian sports both for athletes as well as for their coaches. Thus there is a great need for
nutritional guidance and counselling for the athletes should take priority.
RECOMMENDATIONS
1. A better representation of athletes across the sports category, age and gender could yield better results.
2. A larger sample size could be included in the study.
3. An intervention study could be carried out.
4. More number of sports could be selected among the three different sports categories to yield better results.
5. A comparative study could be carried out between sports institutions.
6. Nutrition Education could be conducted to create awareness among the athletes.
REFERENCES
1. Beals CA. Eaiiiig behaviours, nulriiioiial status and menstrualfunction in elite female adolescent volleyball players. Journal of
American Dietelic Association 102 (2002), pp. 1293- 1296.
2. Berglund B, Sundgot-Borgen B, Torstveit. Nutritional Supplements in Norwegian elite athletes- impact of international rankingarfvijwnr. American Journal of Sports Medicine 43 (1) (2001); pp. 130- 135.
3. Carlson K, Mahan L K and Escott-Stump S, Krause Food, Nutrition and Diet Therapy, USA, WB Saunders Company. 10'"
Edition. 2000.
4. Kapur D and Agarwal D K, Nutritional anemia and its control, Indian Journal of Pediatrics 69 (7) (2002), pp. 607- 616.
5. Kaur S, Deshmukh P R and Garg B S Epidcmiologlcal correlates of the nutritional anemia in adolescent girls of rural Wardha.,
Indian Journal of Medicine 54 (2006), pp. 517-519.
6. Malczewska J, Raczynski G and Stupnicki R, Iron status in female endurance athletes and in non- athletes International Journal
of Sports Nutrition and Exercise Metabolism 10 (3) (2000). pp. 260- 276.
7. Malczewska J, Stupnicki R, Black W and Turek-lepa E, The Effect of Physical Exercise on Concentrations of Ferritin and
Transferrin Receptor in Plasma ofMale Judaists. International Journal of Sports Medicine 25 (2004), pp. 516-521.
8. McArdle WD and Katch FI. Sports and Exercise Nutrition.; 2°'' Edition 2005, pp. 1-4.
9. Schumacher YO, Schmid Aand Grathwohl D, Haematological Indices andiron Status in Athletes ofVarious Sports and Peifonnance,
Medical Science and Sports Exercise 34 (2002), pp. 869- 875.

FNDHM/Oral/10
Study on Nutritional Status of Primary School Children Covered by Mid-Day Meal Programmes inPaighar and Wada Talukas, Thane District
Nisha Bcllare', Veena Yardi- & Denny John'
1. PhD Scholar, Dept. of Foods, Nutrition and Dietetic.s,
College of Home Science, Nirmala Niketan, Mumbai (Maharashtra)
[email protected] (09967784736)
2. Lecturer. Dept. of Foods. Nutrition and Dietetics.
College of Home Science, Nirmala Niketan, Mumbai (Mahara.shtra)
3. Lecturer, In Institute of Public Health, Mumbai (Maharashtra)
ABSTRACT
The present study was carried out to assess and compare the inilritional stains of prhnarvschool children (6-13 yrs) who were being newly covered by a NGO supported Mid-dav
Meal programme (MDM) in Paighar Taluka and a Government-run MDM in Wada Tahtka
in Thane District of Maharashtra State. Baseline daias were obtained through an assessmentof a total of 1312 subjects (Paighar -660 and Wada-652). The same subjects were followed
after 4 motxths of supplementation through MDM programme and a total of 1042 subjects
(Paighar -562 and Wada-480) was subject of re-assessment. A 24-hr dietary recall to asse.ss
daily nutrient intakes and anthropometric measurements were used for both the groups pre
and post intervention and comparisons were made with PDA (ICMR, 1990) for nutrient
intakes and with NCHS standards (2002) for anthropometric mea.mrements within groups.As part of MDM subjects in Paighar were given khichdi and subjects in Wada were given
the regular MDM based on the cyclic menu recommended by the government. At the time ofre-assessment, all the subjects were found to have a significant increase in the mean heights
(p<0.05), whereas a significant increase in mean weight values were found among subjectsin Wada Taluka (p<0.05). Significant decrease was observed in the mean skin j'old thicknessmeasurements of subjects in Wada taluka post intervention (p<0.05). A significant decrease
(p<0.05) in the MUAC values was observed across all the subjects except in 10-13 yr oldboys and girls in Wada taluka A significant decrease was also observed in the mean energy,carbohydrate and fat intake in subjects in Wada taluka (p<0.05) whereas a significantincrease was observed in the mean energy intake of 6-10 yr old subjects in Paighar taluka
(p<0.05). Intake of energy, macronutrients and micronutrients (calcium, iron, Beta-carotene)was found to be lower than that of RDA in both the groups at baseline as well as postsupplementation. Hence a follow-up study after longer period (6 months- I year) ofintervention would have yielded better results to understand the impact of MDM intervention
in these children.
INTRODUCTION
Children are the invaluable assets of the nation, and their physical and educational development determines theextent to which they contribute to the national growth and prosperity. Primary school children (6-14 years) formabout 20% of the total population (NNMB, 2000). It is estimated that about 40% of these children drop out ofprimary school. National Nutrition Monitoring Bureau (NNMB) surveys (2000) indicate that about 70% ofthese children are undernourished and there is about 30% deficit in energy consumption and over 75% of tlte
children have dietary micronutrient deficit of about 50%.Problems of illiteracy, malnutrition, anemia, vitamin-Aand iodine deficiency are very common among children in India. Recent studies have demonstrated that thereis a high prevalence of iron deficiency among school children in areas affected by endemic goiter in India. Alarge number of families both in rural as well as urban areas in the country are below the poverty line.
90

A hungry child cannot perform well in school thus food insecurity poses a threat to the health and overall
development of children. In 2001 Supreme Court of India ruled that state governments must provide mid-day
meal (MDM) to children of government assisted primary schools.The Mid-day Meal Scheme is the popular
name for school meal programme in India. It involves provision of lunch free of cost to school-children on all
working days. School meal programmes provide children with at least one nutritionally adequate meal a day
which contributes to 1/3'^ of the child's daily requirements in turn leads to higher attention spans, better
concentration and improved class performance.
Hence the surveillance of nutritional status of childrenand the preventive measures and treatment of malnutrition
are undoubtedly important in developing countries. After implementing any kind of programme in order to check
whether that programme is reaching the target group and having an positive impact or not and to know if the
objectives are being met ,it is essential to evaluate it. With the above rationale the present study was undertaken
to study the impact of MDM on the nutritional status of children in Palghar and Wada taluka. Thane district. It
was felt necessary to evaluate to find out the acceptability of the programme among the target group of
children. Evaluation of this kind will certainly provide some feedback and the findings and recommendations of
the study will help towards the improvement of the programme and hence it becomes imperative that a
comprehensive evaluation of the programme be undertaken to judge its efficacy.
AIMS & OBJECTIVES
1. To assess and compare the nutritional status of primary school children covered by an NGO based MDM
in Palghai" taluka with a government based MDM in Wada taluka.
2. To assess nutritional status of primary school children before and after supplementation in terms of:
Anthropometric measurements (height for age, weight for age, mid upper arm circumference (MUAC) for
age, skinfold thickness for age, BMI for age) and compare it with NCHS standards
Nutrient intake of macronutrients (carbohydrates, proteins, fat) and energy and micronutrients (Beta-carotene,
iron and calcium) and compare it with RDA
3. To estimate the nutrient content of the supplement provided and evaluate its adequacy in terms of requirements
as suggested by NNMB
4. To assess the socio-economic background of the subjects in Palghar and Wada taluka.
5. To obtain parent's feedback on the supplementation provided in both the talukas
MATERIALS & METHODS
Palghar and Wada blocks of Thane district were selected for the study.6-13 yr old school going children (both
males and females) were selected for the study from a total of 11 schools from Palghar using cluster sampling
method and from a total of 12 schools from Wada using convenient sampling method.
Table 1-Gender and taluka wise distribution of the sample was as follows
Taluka Baseline Follow-up(Afler 4 months)
M F M F
Palghar 342 318 263 276
Wada 335 317 244 236
At baseline a total of 1312 subjects were present in the study but post intervention some of the subjects were
not present on the day of the survey thus resulting in a total of 1020 subjects in the study. The duration of the
study was for 4 months i.e. from June 2007-0ctober2007.
• Research Tools & Techniques : An Interview schedule was used for obtaining information .This toolwas selected as most of the participants were young.
91

An interview schedule was used for obtaining the following information:-
a) General information and socioeconomic status - Data regarding the general information of the subject
such as age, family background, village, school, class ,education status of parents and profession of parents,
commodities available was collected. Based on the commodities available with the subjects at home the
socioeconomic status of the subjects was interpreted.
b) 24- hr dietary recall - In the present study a 24-hr dietary recall method was taken pre and post i ntervention
A total of 15 house visits of houses near to school areas whose children attend primary-schools were
conducted in Palghar as well as Wada for standardizing the recipes to get an estimate of the portion sizes
and also to double check the information collected from young children regarding their food intake. The
nutrient intakes of all the subjects were also calculated in terms of % RDA and comparisons were made
pre and post intervention. Intake of calories and macronutrients (carbohydrates, protein and fat) andmicronutrientsCbetacarotene, calcium, iron) was calculated using food composition table.
c) Parent's feedback - A total of 90 parents were interviewed post intervention in both the areas i.e. 40 fromPalghar and 50 from Wada to get an idea of the child's daily food consumption pattern, school attendance,parent's view regarding the mid day meal provided in school and also to know about the changes whichshould be made in the mid day meal programme provided in the areas.
d) Anthropometric measurements- Anthropometric measurements in terms of height, weigltt, mid-upperarm circumference (MUAC) and skin-fold thickness (SFT) were taken pre and post intervention in both
the areas .
For comparison of anthropometric measurements and nutrient intakes subjects were grouped as follows
Table 2: Distribution of subjects
Age groups Group
6-8 yrs(Boys) lA
8-10 yrs (Boys) 2A
10-13 yrs(Boys) 3A
6-8 yrs(Girls) IB
8-10 yrs (Girls) 28
10-13 yrs(Girls) 3B
Statistical procedures such as percentages, frequencies, paired t-tests, Chi-square tests were used to analyzethe results.
RESULTS & DISCUSSIONS
• School standard wise distribution of subjects
School standardwise distribution of subjects
22%
20% I
20%
22%
□ Standard 1
a Standard 2
o Standard 3
□ Standard 4
■ Siandaid 5
Figure 1: School standard wise distribution of subjects
92

From the above figure it is clear that out of 1312 subjects, 21.7% belonged to Standard 1,22.3% to Standard2 , 20.2% to Standard 3,20.2% to Standard 4 and 15.6% to Standard 5.
» Age wise distribution of subjects : Out of the total subjects , 43.7% children were 6-8yrs of age,37.1% 8-10 yrs and 18.9% 10-13 yrs of age at baseline and the least percentage of subjects belonged to 10-13 yrs of age.
i Socioeconomic status of subjects : Based on the commodities available with the subjects at home the
socioeconomic status of the subjects was interpreted as follows-
Tablc3: Socioeconomic status of the subjects
Classification Commodities Palghar Wada
Class 1 Fan+T.V+C.D.+ Fridge 7.8% 1%
Class 2 Fan+T.V+C.D. 38.9% 34.6%
Class 3 Fan-i-T.V. 39.3% 30.8%
Class 4 Fan 14.0% 33.6%
It was observed that 7.8% of the subjects belonged to Class 1 in Palghar taluka whereas 1% belonged to Wada
taluka.14.0% of the subjects in Palghar and 33.6% in Wada taluka belonged to Class 4.Hence it was seen that
subjects in Wada taluka belonged to a lower socioeconomic as compared to Palghar. The percentage of illiteracywas also found to be higher in Wada as compared to Palghar.
Table 4: Nutritional content of MDM provided in Palghar and Wada
Per serving Palghar Wada
Amount (gms) 150 260
Energy (kcal) 121 398
Carbohydrate (gms) 21.4 82.7
Protein (gms) 3.8 7.8
Fat (gms) 1.9 3.5
Beta-carotene (meg) 187-
Calcium (mg) 27.7 15.1
Iron (mg) 0.47 0.92
From the above table it can be observed that the nutritional content of the meal provided in Wada was higher in
terms of calories and macronutrient content whereas in Palghar the khichdi provided was higher in terms of
micronutrient content (calcium and betacarotene) because of inclusion of dudhi, tomato, cabbage, red pumpkin
in the khichdi provided.
DIETARY INTAKE
Ihble 5: Mean Intake of energy and protein of subjects
Group Palghar
Mean
energy
(pre)kcai
Palghar
Mean
energy
(post)kcal
Wada
Mean
energy
(pre)kcai
Wada
Mean
energy
(post)kcal
Palghar
Mean
protein
(pre)gms
Palghar
Mean
protein
(past)gms
Wada
Mean
protein
(pre)gms
Wada
Mean
protein
(post)gms
lA 803±163 807±185 781±15I 705±I21 25.1+7.3 29.1+9.3 22.1±6.6 21.6±7.6
IB 781±151 821±196 764±I51 703±120 24.8+7.4 28.7+9.0 20.6±5.4 20.8±7.3
2A 781±148 860±195 872+187 727±113 26.0+7.6 27.9+9.7 25.0±7.5 22.8±7.4
2B 793+160 848+201 888+195 753+131 25.4+7.0 27.4+8.9 24.2+7.8 22.1±7.4
3A 807+162 929+192 870+174 742±140 25.3+7.3 30.4+10.5 26.3+8.1 23.2±7.4
3B 874+169 898+206 876±198 742+148 27.0+7.3 30.5+10.9 25.6+8.2 22.5+7.6
93

'h- ?
From the above table it can be concluded that there was a significant increase in the mean energy intakes
gKrapsersce^iTv group \N and3B postsupplementaxion vnFa\ghaT taiuka.The highest increasewas found in group 3A with an average increase of 122 kcai post supplementation. In Wada taluka the mean
calorie intake decreased significantly across all age groups These low energy intakes across all group.s could
also be because of the fact that many children reach school on an empty stomach in the morning, as early-morning breakfast is not part of the household routine and thus pupils often go hungry for a few hours and findit hard to concentrate in school. The decrease in Wada taluka could be due to a lot of factors such as inadequate
food intake, substitution of home meal by the meal provided in school, low purchasing power of llie subjectssince majority belonged to lower socio economic groups. A study carried out by Sridhar in 2003 to study theimpact of MDM on nutritional status of school children showed that income of the family had an impact on the
calorie intake of the child.
The mean protein intakes significantly increased in group lA ,1B,2B and 3A post supplementation in Palghartaluka could be due to high consumption of protein rich sources in the home diets because the school mealprovided in Palghar did not contribute much to the protein intake of the subjects .It was observed that the meanprotein intake across all the groups increased in terms of % RDA post supplementation. A significant decrease
was observed in group 3A and 3B in Wada taluka post supplementation.
Table 6: Mean intake of betacarotene and iron of subjects
Group Palghar
Mean
Beta
carotene
(pre)mcg
Palghar
Mean
Beta
carotene
(post)mcg
Wada
Mean
Beta
carotene
(prejmcg
Wada
Mean
Beta
carotene
(post)mcg
Palghar
Mean
iron
(pre)mg
Palghar
Mean
iron
(post)mg
Wada
Mean
iron
(prc)mg
Wada
Mean
iron
(post)mg
lA 555.9+175.9 500.3+219.3 235.7±119.2 203.9+139.4 3.2+1.8 3.3±2.3 2.0±1,3 2.3+1.8
IB 539.8±177.7 485.5+233.4 214.8+128.6 196.9±140.2 3.1 ±2.0 3.4±2.0 2.0+1.3 2.7+1.9
2A 522.7±166.9 447.6±2403 204.6±117.6 198.0±135.I 3.1 ±1.6 3.6±2.3 2.1±1.1 2.3±1.4
2B 603.3±149.3 442.9±I94.2 203.7±119.8 2I5,4±121.6 3.0± 1.4 3.7±2.1 1.9±,9 2.2±1.6
3A 530.8+166.0 595.0±258.3 263.4±133.1 220.6+147.6 3.5+2.3 3.5±1.9 1.8±.7 1.9±1.2
3B 597.1+192.5 457,4±282.2 251.4±135.6 201.D±122.3 3.1± 1,4 4.0+.2.8 2.2±1.1 1.9+.91
From the above table it can be inferred that the mean betacarotene intakes was found lo be <l 1 %RDA across
all the groups at baseline and post supplementation. The betacarotene content of the MDM provided at Wadawas found to be negligible and hence did not contribute to the daily betacarotene intake.
The diets of the subjects in both the talukas was found to be deficient in Beta carotene probably because of lack
of vegetables and fruits rich in betacarotene in the diet which could be due to inaccessibility to foods rich in
betacarotene which could be either because of inability to afford or due to unavailability of rich sources ofVitamin A and hence the mean intakes were extremely low in terms of % RDA.
From the above table it can be concluded that the mean iron intakes were <22% RDA across all age groups andit was found that the mean iron intakes in terms of % RDA increased across all the age groups post
supplementation in Palghar taluka. From the above table it can be seen that in Wada taluka acro.ss al 1 the groupsthe mean iron intakes were found to be <12%RDA post supplementation. This shows that the iron content inthe diet of these subjects is very low which could be due to inadequate intake of foods rich in iron.
Hence efforts should be made to improve the nutritional content of the meals in terms of macronutrients and
micronutrients provided in schools as well as in home diets in order to improve the nutritional status of thesechildren and efforts should also be made to educate children, parents and the school authorities regarding theimportance of MDM as a supplement and not as a substitute for home
94

A.NTHROPOMETRIC MEASUREMENTS
'Riblc?: Mean height and wcigiit values of subjects
Group Palghar Palghar Wada Wada Palghar Palghar Wada Wada
Mean Mean Mean Mean Mean Mean Mean Mean
height height height height weight weight weight weight
(prc)cms (post)cms (pre)cms (post)cms (prc)kg (post)kg (pre)kg (post)kg
lA in.8±6.2 113.5±6.2 112.3+6.1 113.5+6.5 16.3+2.1 16.4±2.2 15.2+2.4 15.5±2.5
IB 110.9±6.7 112.7±6.6 112.9+6.0 113.9+6.2 16.1+2.4 16.1+2.2 15.1+2.1 15.4±2.2
2A 122.4±6.5 124.0+6.2 123.3±7.2 124.3±7.2 19.7±2.9 I9.8±3.0 18.9+3.2 19.3±3.4
2B 121.9±6.7 123.8±6.8 123.8±6.6 124.6±6.7 19.7±3.4 19.7+3.5 19.1±3.3 19.3±3.5
3A 130.2+8.3 131.4+8.3 130.3±7.6 131.2±7.8 22.2+4.0 22.8±4.6 22.0+4.0 22.7+4.5
3B 127.3±9.8 129.6+10.1 131.0±8.9 131.9+9.0 21.6+4.7 21.4+4.8 21.5+4.1 22.0+4.3
From the above table it can be seen that there has been a significant increase in the mean height values across
all groups in Palghar and Wadataluka post supplementation (p<0.05). This increase could be possibly due to the
fact that there are increments in height measurements during the school age as this phase involves rapid
growth and development of the child.
A significant increase in the mean weight values in group 1A in Palghar taluka post supplementation has been
observed and a significant increase in the mean weight values across all age groups except in 2B in Wada
taluka. This increase in Wada taluka could be due to the fact that the nutritional content of the meal provided in
Wada is higher than that provided in Palghar. Hence the caloric content of the meal in Palghar needs to be
increased since it provides only 121 kcal whereas the recommended value is 450 kcal.
In a study carried out by Devadas and Rajamal in 1973 on school children proved that when longitudinal records
on heights and weights of children participating in the school lunch programme over a period of five years was
taken , it was seen that children participating in the well organized lunch programme recorded significantly
greater heights and weights over the control group.
Table 8: Mean MUAC and SFT values of subjects
Group Palghar Palghar Wada Wada Palghar Palghar Wada Wada
Mean Mean Mean Mean Mean Mean Mean Mean
MUAC MUAC MUAC MUAC SFT SFT SFT SFT
(pre)cms (post)cms <prc)cms (post)cms (prc)mm (post)mra (prc)mm (post)nim
lA 15.1±1.3 15.0±1.1 14.5+1.2 14.3+1.1 6.0+1.2 5.5+1.3 6.0+1.5 5.1±1.4
IB 15.2+1.2 15.1+i.O 14.6±1.1 14.4+1.0 6.5±l.3 6.2±i.7 6.5±1.6 5.6±1.4
2A 16.0±1.3 15.8+1.3 15.7+1.3 15.4+1.34 6.4+1.5 5.5+1.8 6.9±2.3 5.5+2.3
2B 16.5+1.7 16.0±1.6 15.8±1.5 15.7±1.3 7.2±2.1 6.8±2.0 7.5±2.4 6.6±2.3
3A 16.7±1.6 I6.4±1.8 I6.3±1.7 I6.3±1.7 6.8±1.4 5.4+1.8 7.1+2.3 5.9±2.6
3B 16.6±2.0 16.4±1.9 16.3+1.63 16.2+1.5 6.8+2.2 6.6+1.8 8.0+3.0 7.1+2.6
From the above table it can be seen that there has been a significant decrease in the mean MUAC measurements
in the 2B group post supplementation in Palghar taluka. In Wada taluka there was a significant decrease in the
mean MUAC measurements across all the age groups except in group 3A and 3B. The reason for this decrease
could be related to the health problems that occurred in the subjects during the period of supplementation such
as fever illness, diarrhoea, inadequate food intake and could also be due to the fact that since the nutritional
content of MDM provided in the taluka is below the recommended values for these subjects, the meal is not
adequate enough to supplement their home diets and hence such a decrease is observed.
95

There has been a significant decrease in the mean skin fold thickness in all the groups in Wada taluka postsupplementation and in Palghar taluka a significant decrease has occurred across all the groups except in IBand 3B post intervention. The decrease shows that wasting is prevalent in these areas and could be due to
improper compliance with the MDM or due to health complications which could have occurred during thephase of supplementation such as fever, diarrhea etc.
CONCLUSION
The nutritional content of the meals provided in both the areas was inadequate in terms of calorics, niacronutrientand micronutrient content and hence it needs to be enhanced by inclusion of green leafy vegetables, sprouts,
soy granules, milk, and provision of fish or chicken more frequently for MDM along with variations in the menu.Nutrition education should also be imparted for better functioning of MDM and it should be explained to theparents that supplementation should never be treated as substitution for increasing the effectiveness of thissupplementary programme.
RECOMMENDATIONS
1. A follow up after a longer duration (6 months -1 year) of intervention could have yielded better results.2. Assessment of clinical signs can be carried out.
3. School authorities and parents need to be provided with nutrition education for better results*Palghar and Wada are names of ialukas in Thane district of Maharashtra
REFERENCES
1. Amigo H, Bustos P. Radrigdn M E and Urcia E, Nutritional status ofschool age children ofdiffering socioeconomu- levels. Rev.Med. Chil. 123 (1995), pp 1063-1070.
2. Devadas and Rajammal P. Conducting and evaluating a Nutrition Education Progranvne. The Indian Journal of U.uiie Scicnec, 1(1973), pp 3.
3 Dreze J and Goyai A, Future ofmid-day meals. Economic and Political Weekly, November (2003). pp. 4673-4683.4. Dietary Guidelines for Indians - A manual. National Institute of Nutrition. Hyderabad. 2003.5. Diet and nutritional status of tribal population repeat survey. National Nutrition Monitoring Bureau. National Institute of
Nutrition, Hyderabad, 2000.
6. Sridhar S, l,„pac, ofMid-day meal oa Ike amn.loaal e,am a/Mgoiag cMldre,,. Uapubliated. 21,03.
96

FNDHM/Oral/11
Impact of Nutrition Education in Obese Adolescents
S Kavitha' & R Parimalavalli-
1. Project fellow. Dept. of Food Science,
Periyar University, Salem (Tamil Nadu)
kavithabharathiS 1 @gmail.com (09600875874)
2. Assi.siant Professor, Dept. of Food Science,
Periyar Uniersity, Salem (Tamil Nadu)
raghavharini ©yahoo.com (09486980481)
ABSTRACT
Adolescent obesity is an emerging problem in Indian children and it may be major contributors
to the adult obesity epidemic. Thus, identifying potential risk factors for childhood obesity
and formulating early intervention is crucial in the management of the obesity epidemic. To
impart nutrition education to the obese adolescents in order to improve their dietary habits
and to know the effect of nutrition education. Cross sectional evaluation of anthropometric
parameters in Salem school children (10—16 years). Government school and Private school
in Salem. 998 children, 649 (322 boys, 327 girls) from government school and 349 (146
boys, 203 girls) from private school. Subjects underwent assessment of height and weight
and calculation of BMI. Children were classified as normal, overweight and obese as per
James et al classification. The nutrition education was imparted to overweight and obese
adolescents by using software twice for a period of one month. The scores gained by the
adolescents before and after nutrition education were collected, the quantum improvement
was calctdated and the effect of nutrition education was analyzed using paired sample 't'
test. Out of 649 adolescents 77 (12 per cent) were obese. The private school obese adolescents
had high knowledge scores before (6.08) and after (17.00) nutrition education than the
government school obese adolescents (5.15, 13.64). The difference in mean score increase
between before education and after education was significant at 1% level in both government
and private school obese adolescents. The quantum improvement was higher in private
school obese adolescents (2.79) than government school obese adolescents (2.64).
Adolescent obesity is a global epidemic. This study confirms the importance of interventional
strategies to reduce the prevalence of adolescent obesity.
INTRODUCTION
Many developing countries including India today face the dual burden of diseases of poverty as well as diseases
of affluence. Some of the reasons for this change among many are urbanization and adaption of westernized
life style. World children suffer from protein energy malnutrition and UNICEF (WHO, 2000) reported that one
- third of children were stunting in developing countries in 2000. Obesity is another health problem in world.
Several studies in different countries showed that obesity trend increases. At the community level, obesity
prevention should be based on nutrition education and the enhancement of physical activity in different settings,
such as schools and workplaces, and should enlist the involvement of families as well. Nutrition education is akey element to promoting life long healthy eating and exercise behaviours and should start from the early stagesof life. The goal of nutrition education is to teach children to eat a well-balanced diet that contains a wide varietyof foods, and that children learn to make wise food choices independently. Nutrition education which can
encourage healthy eating habits can play an important role in controlling various diseases. Kalpana and Divya(2008) said that nutrition education is one of the best methods by which awareness can be created among
women and children to modify their dietary pattern. Nutrition education focusing adolescents help to bring down
97
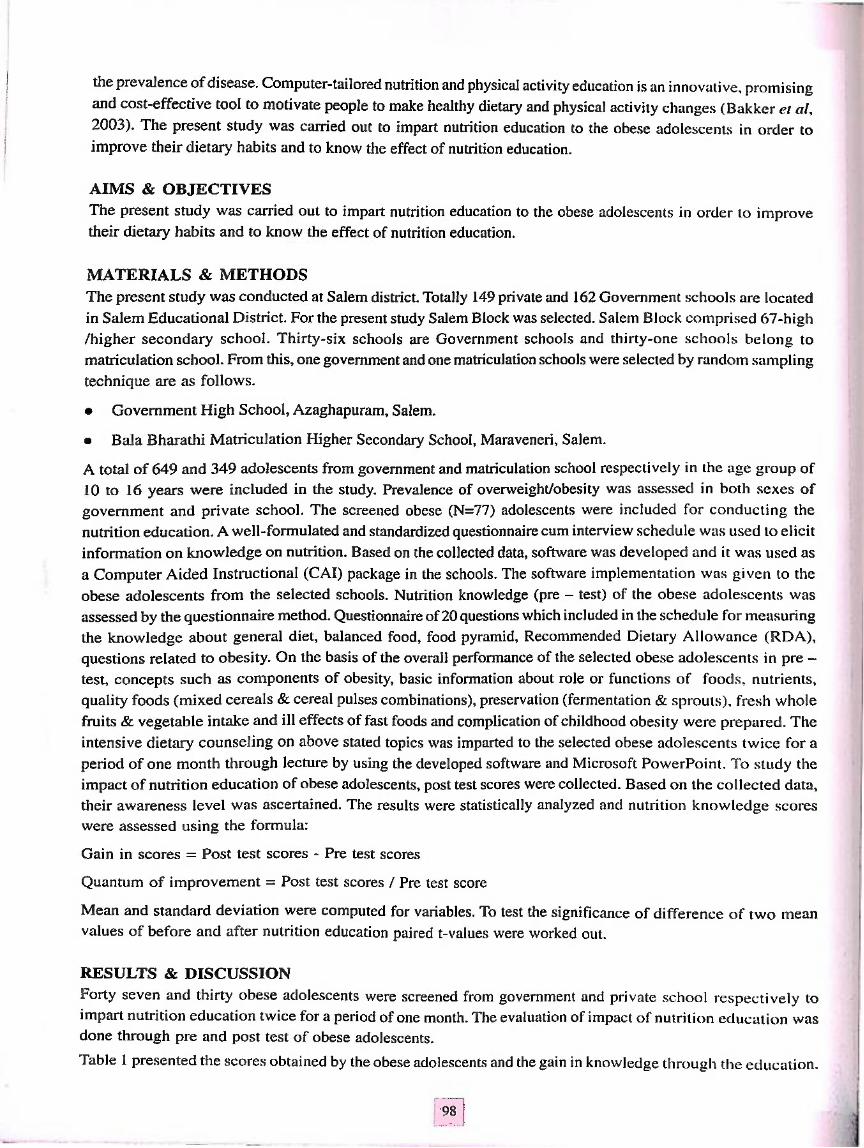
the prevaJence of disease. Computer-tailored nutrition and physical activity education is an innovative, promisingand cost-effective tool to motivate people to make healthy dietary and physical activity changes (Bakker et al,2003). The present study was carried out to impart nutrition education to the obese adolescent.s in order toimprove their dietary habits and to know the effect of nutrition education.
AIMS & OBJECTIVES
The present study was carried out to impart nutrition education to the obese adolescents in order to improvetheir dietary habits and to know the effect of nutrition education.
MATERIALS & METHODS
The present study was conducted at Salem district. Totally 149 private and 162 Government schools are located
in Salem Educational District. For the present study Salem Block was selected. Salem Block comprised 67-high
/higher secondary school. Thirty-six schools are Government schools and thirty-one schools belong to
matriculation school. From this, one govemment and one matriculation schools were selected by random sampling
technique are as follows.
• Govemment High School, Azaghapuram, Salem.
• Bala Bharathi Matriculation Higher Secondary School, Maraveneri, Salem.
A total of 649 and 349 adolescents from govemment and matriculation school respectively in the age group of
10 to 16 years were included in the study. Prevalence of overweight/obesity was assessed in both sexes ofgovemment and private school. The screened obese (N=77) adolescents were included for conducting thenutrition education. A well-formulated and standardized questionnaire cum interview schedule was used to elicit
information on knowledge on nutrition. Based on the collected data, software was developed and it was used as
a Computer Aided Instmctional (CAI) package in the schools. The software implementation was given to theobese adolescents from the selected schools. Nutrition knowledge (pre - test) of the obese adolescents was
assessed by the questionnaire method. Questionnaire of 20 questions which included in the schedule for measuringthe knowledge about general diet, balanced food, food pyramid. Recommended Dietary Allowance (RDA),
questions related to obesity. On the basis of the overall performance of the selected obese adolescents in pre -
test, concepts such as components of obesity, basic information about role or functions of foods, nutrients,quality foods (mixed cereals & cereal pulses combinations), preservation (fermentation & sprouts), fresh whole
fmits & vegetable intake and ill effects of fast foods and complication of childhood obesity were prepared. The
intensive dietary counseling on above stated topics was imparted to the selected obese adolescents twice for a
period of one month through lecture by using the developed software and Microsoft PowerPoint. To study theimpact of nutrition education of obese adolescents, post test scores were collected. Based on the collected data,
their awareness level was ascertained. The results were statistically analyzed and nutrition knowledge scores
were assessed using the formula:
Gain in scores = Post test scores - Pre test scores
Quantum of improvement = Post test scores / Pre test score
Mean and standard deviation were computed for variables. To test the significance of difference of two meanvalues of before and after nutrition education paired t-values were worked out.
RESULTS & DISCUSSION
Forty seven and thirty obese adolescents were screened from government and private school respectively toimpart nutrition education twice for a period of one month. The evaluation of impact of nutrition education wasdone through pre and post test of obese adolescents.
Table 1 presented the scores obtained by the obese adolescents and the gain in knowledge through the education.
98

Ihblc 1: Scores gained by the obese adolescents before and after education (Ns:77)
Type of Schools 't' test Mean Score Value Gain in
Before
Education
After
Education
Scores ♦t' Value
Government School Faired 5.15±2.4 13.64±!.2 8.49±1.3 35.69**
Private School Paired 6.08±3.1 17.00±1.8 10.92±2.1 40.13**
Government vs. Private Independent 8.49±1.3 I0.92±2.1 2.43± 0.8 6.73**
** P (< 0.01)
Statistical analysis revealed that government school obese adolescents obtained a mean score of 5.15 andprivate school obese adolescents had a mean score of 6.08 before education. However, the post educationscores were found to be 13.64 and 17 for government and private school obese adolescents respectively. Asignificant increase in (P < 0.0.1) in nutritional knowledge was observed in both government and private obeseadolescents. When the outcome of the two school obese adolescents was compared, government school obeseadolescents had registered a mean increase of 8.49 and private school obese adolescents had a mean increaseof 10.92. The difference in mean score increase between before education and after education was significantat 1% level in both government and private school obese adolescents.Kalpana et al (2008) also found that computer education obtained a mean score of 5.2 and classroom educationhad a mean score of 5.2 before education. However, the post education scores were found to be 14.3 and 12.1for computer education and classroom education respectively.
Table 2: Quantum improvement by the obese adolescents
lypc of Schools Mean Score Value Quantum of
improvementPre test Post test Gain inScores
Government School 5.15 13.64 8.49 2.64
Private School 6.08 17 10.92 2.79
The table - 2 depicted that the mean knowledge score of the government school obese adolescents improvedfrom 5.15 to 13.64 after nutrition education with gain of 8.49 scores. The quantum of improvement was 2.64times. In the case of private school obese adolescents improved from 6.08 to 17 after nutrition education withgain of 10.92 scores. The quantum of improvement was 2.79 times.
Kalpana et al (2008) also stated that the mean knowledge score of the parents of the male subjects improvedfrom 3.47 to 5.43 after nutrition education with gain of 1.96 scores. The quantum of improvement was 1.56times. The mean lifestyle score improved from 2.33 to 4.83 after nutrition education with gain of 2.5 scores.The quantum of improvement was 2.07 times.
CONCLUSION
Adolescent obesity today is an issue of concern even to an III world developing country like India. Interventionalstrategies are more easily acceptable when implemented at school level. Such school based interventionalstrategies by way of nutrition education could contribute significantly towards curbing this prevalence of childhoodobesity. The present study concluded that nutrition education was effective in obese adolescents.
RECOMMENDATIONS
Regular and repeated personalized and long term interaction with the adolescents and their parents could helpto manage the obesity right in the childhood.
99

1REFERENCES
1. Agras O C, Hepner R and Greenstreel R, Correlation of blood pressure with skin fold thickness and protein levels. AmericanJournal of Disabled Children, 129 (2004), pp. 905-1 1.
2. Bal(kerC,BTai]ovsky C.CarretierR and Page G, Content validation of key features on a national e.xainination ofelinieal decision-making skills, Acad Med, 70 (2003), pp. 276-81.
3. Chandalla E A, Nutrition education in US medical schools, American Joumal of Clinical Nutrition. 65 (2000). pp. 1558.
4. Herr R A and Shekclle R B, Blood pressure in tenth grade students, Circulation, 54 (2001). pp. 99.3-IOO().
5. Kalpana C A and Divya G Software on vitamin A - impact as a leachitig tool on selected women. Res. High. J ADU. 18 (2008),
pp. 15.
6. Lang S, Morgan A, Saunders R, Felton G Ward D and Pale R, Children i laiderstattding of the concept ofphysical activity. Pcdiatric
Exerc Science, 12 (2007), pp. 293-299.
7. Maffis T, Estimated burden of pediatric obesity and co-morbidities in Europe (Part I). The increase in the prevalence of child
obesity in Europe is itself iticreasing, Int J Fed Obes, 1 (2006), pp. 26-32.
8. Ogden C L, Flegal K M, Carrol M D and Johnson C L, Prevalence and trends in overweight among U.S. children and adolescents.JAMA. 288 (2006), pp. 1728-1732.
9. Robinson TN, Reditclng children's television viewing to prevent obesity: A randomized controlled trial. JAMA, 282 (2000). pp.
1561-7.
10. Taveras S M, Burgeson C R, J E Fulton and CC Spain, Physical Education and Physical Activity: Resultsfrom the School Health
Policies and Programs Study 2006, Joumal of School Health. 77 (8) (2005), pp. 435-63.
11. Obesity: preventing and managing the global epidemic, report of a WHO Consultation on Obesity, WHO, Geneva, 2000.
100

FNDHM/Oral/I2
Efficacy of Dark Chocolate on Lipid Profile of Cardio Vascular Patients
S ThUagavathy
Assistant Professor, Dept. of Food Science
Pariyar University, Salem (Tamilnadu)
[email protected] (09443491717)
ABSTRACT
CVD is one of the most costly and burdensome chronic disease of our time and is a condition
that is increasing in epidemic proportions in the U.S and throughout the world. Hyperlipidemiarefers to increased levels of lipids in the blood including cholesterol and triglycerides.
Although hyperlipidemia does not cause a person to feel bad, it can significantly increase
the risk of cardio vascular disease. Blood cholesterol (lipid) reduction can be achieved by
dietary modification as well as by drugs. Essential antioxidant mainly high amount of
flavonoid that has been linked to cardio vascular health. Chocolate found to be a goodsource of such antioxidant called catechins and phenols which have the ability to protect
the body from major health issues, including stroke, heart failure, cancer and diabetes. Thepresent study was aimed to study the efficacy of dark chocolates on lipid profile of theselected hyperlipidemic patients. Dark chocolates were procured from local manufacturer
in Salem district, Tamil Nadu. Catechin content of dark chocolates was analyzed usingspectrophotometer. A number of 22 hyperlipidemic subjects from each gender (56 male and
female) in the age group of 40-60 years were selected from Guru Hospital, Mettur taluk,Salem district by simple random sampling technique. Subjects who have LDL Cholesterol >
100, Triglycerides > 150, Total Cholesterol > 200 were selected and grouped as Control(without supplementation) and experimental (supplemented with lOOgrams dark chocolates)for a period of 40 days. The blood lipid profile assessed by enzymatic method in bothcontrol and experimental groups during supplementation and analyzed statistically. Resultsshowed that TC (14.77%), LDL (36.62%), Triglycerides (21.4%) and VLDL (21.4%)
reductions were observed with 44.08 percent increase in HDL level at the end of study
period. However, statistical analysis states that there is no significant reduction in lipidlevels except TO levels. Hence, it is concluded that the flavanol-containing chocolate barhas the potency to lower blood lipid levels.
INTRODUCTION
CVD is one of the most costly and burdensome chronic disease of our time and is a condition that is increasing
in epidemic proportions in the U.S and throughout the world. Hyperlipidemia refers to increased levels of lipidsin the blood including cholesterol and triglycerides. Although hyperlipidemia does not cause a person to feel bad,it can significantly increase the risk of coronary heart disease. Blood cholesterol reduction can be achieved bydietary modification as well as by drugs. Drugs are less preferred due to their side effects and are prescribedonly in treating severe cases. Hence, dietary modifications are the first in the line of treating hypercholesterolemia.A healthy diet that can be recommended for all healthy people over 2 years of age is low in total fat, saturated
fat and cholesterol and that is moderate in sodium. Fat intake should be lowered to not more than 30% calories,
while limiting saturated fat intake to less than 10% calories. Cholesterol intake is limited to not more than 300mgper day for persons who have already been diagnosed with some form of CVD. A number of specific foods orfood components have blood cholesterol lowering effects and may, therefore, be useful in reducing risk ofCVD. Essential antioxidant mainly high amount of flavonoid that has been linked to cardio vascular health,
chocolate found to be a good source of such antioxidant flavonoids may have the ability to protect the body from
101

major health issues, including stroke, heart failure, cancer and diabetes. Chocolates contain aniioxidanis called Jcatechins and phenols. The present study was aimed to study the efficacy of dark chocolates on lipid profile of 1the selected hyperlipidemic patients.
AIMS & OBJECTIVES
The present study was aimed to study the efficacy of dark chocolates on lipid profile of the selected hyperlipidemicpatients.
METHODOLOGY
Dark chocolates were procured from local manufacturer in Salem district, Tamil Nadu. Catechin content of
dark chocolates was analyzed using spectrophotometer. A number of 22 hyperlipidemic were selected fromeach 56 male and female subjects in the age group of 40-60 years from Guru Hospital, Mettur taluk. Salemdistrict by simple random sampling technique. Selected subjects were grouped as control {n= 10) and experimental(n=12). Subjects who have LDL Cholesterol > 100, Triglycerides > 150, Total Cholesterol > 200 were selectedand grouped as Control groups (without supplementation) and experimental groups (supplemented with 1 OOgramsdark chocolates) for a period of 40 days. The blood lipid profile such as Total cholesterol (TC), low DensityLipoprotein (LDL), High Density Lipoprotein (HDL), Triglycerides (TO) and Very Low Density Lipoprotein(VLDL) was analyzed by enzymatic method in both control and experimental groups during supplementationperiod(0"', 15'*', 30"'' and 40"' days). The data was analyzed statistically by two ways ANOVA and werecompared.
RESULTS & DISCUSSION
Dark chocolate thus prepared had 7.1 mg of catechins per lOOgm. The mean lipid profile of the selectedhyperlipidemic subjects in 0'^ 15"', 30'^ and 45"' days of the study period was taken and is given in the table.Mean total cholesterol levels (mg/dl) of selected control and experimental group were taken on 0"'. 15th, 30"'and 40'" days were (226.7 ± 30.2, 219 ± 26.6,216.3±21.7,210.7 ± 21.9 in the control group and 243.2 ±28.1,236.4 ± 21.9, 220.8 ±20.1, 211.9 ± 14.9 in the experimental groups respectively. Seven point six percent and14.77 percent reduction was observed in control and experimental groups respectively but, there was no significantdifference observed between control and experimental group. Allen et al., (2008) reported that regular intakeof plant-sterol-containing chocolate bar reduced total cholesterol 2.0% and LDL cholesterol 5.3%. bothsignificantIy(F < 0.05). This reduction was on top of the 7% reduction in total cholesterol that occurred duringthe two-week dietary run-in phase.
Low density lipoprotein level (mg/dl) of the selected control and experimental group were about 142.3 ± 23.1,133.8 ±21.8, 129.9 ± 19.2,121.1 ±20.7 and 157.8 ±30.7, 150.4 ±23.1,127.7 ±26.3, 115.5 ± 24.9 respectively.Similar effect as that of TC was noticed in LDL also. Control group has showed 17.5 percent reductionwhereas experimental had 36.62 percent reduction from initial to end of the study period. Statistically significantdifference was not seen between the groups. Baba and co-workers randomly assigned the subjects to receivecontaining low-polyphenolic compounds (placebo-cocoa group) and three different levels of cocoa powder - 13,19.5, and 26 grams per day - for four weeks. In all three high-polyphenol cocoa groups, blood levels of oxidisedLDL concentrations decreased compared with levels observed at the start of the study. Separate analy.sis usingdata from 131 subjects who had elevated LDL cholesterol levels of 3.23 mmol/L at baseline - the normal/desirable LDL level is reported to be less than 2.6 mmol/L (100 mg/dL) were selected. In these subjects, bloodlevels of LDL cholesterol, oxidized LDL. and Apo B concentrations decreased, while levels of HDL cholesterolincreased, relative to baseline levels in all three cocoa groups.
HDL level (mg/dl) was measured for both control and experimental group at their C", 15, 30"' and 40"' day theywere about 23.7 ± 6.6, 25.9 ± 7.1, 28.9 ± 6.6, 32.7 ± 9.7 and 26 ± 7.9, 29.5 ± 5.9, 38 ± 3.6, 46.5 ± lO.lrespectively. An HDL level of control has risen by 27.5 percent and 44.08 percent in experimental groups.There is no significant increase seen in both the groups. Triglycerides (TG) level (mg/dl) were noted onsupplementation of dark chocolates, had about 303.1 ± 67.1, 296.3 ± 67, 287.2 ± 63, 264.5 ± 93.1 and 297.1 ±78.7,281.8 ±78.9,274 ±75.7,244.7 ± 1.6 of control and experimental groups respectively. Significant reduction
102

in TG was observed and significant difference found between groups. An analysis of data from the Framingham
prospective study suggests that decreased levels of triglycerides are associated with decreased CHD risk in thepresence of increased HDL level that is about >lmmol/l (Charlotte, 2008). VLDL levels were noted on both
control and experimental groups about 60.6 ± 13.4, 59.2 ± 13.4,57.4 ± 12.6, 56.9 ± 13.3 and 59.4 ± 15.7, 56.3± 15.7, 56.3 ± 15.7, 55 ± 14.9, 48.9 ± 14.3 respectively. There was no significant difference between bothgroups. Large quantities of LDL are reduced as a result of a reduction in very low density lipoprotein, which in
turn may be due to a reduction in the rate of synthesis of apolipoprotein B (Ediorial, 1998). When triglycerides
decreases VLDL also gets decreased, because 60% of the VLDL particle is triglycerides (NCEP, 2001)
Table 1: Mean blood lipid profile levels (mg/dl) of the selected hyperlipidemic subjects (Ns:22)
Ciitcria Day's Ibtal
Cliolestcrol
F
'value' LM.
F
'value' HX
F
'value'
TH
glycerides
F
'value' MX
F
'value'
Control C" 226.7 ±30.2 142.3±23.1 23.7±6.6 303.l±67.1 60.6±13.4
IS'" 2I9±26.6 133.8+21.8 25.9±7.1 296.3 ±67 59.2±13.4
SO'" 216.3±21.7 129.9+19.2 28.9+6.6 287.2 ±63 57.4±12.6
40'" 210.7+21.9
(NS)121.1 ±20.7
(NS)32.7±9.7
(NS)264.5 ±93.1
211*
56.9±13.3
(NS)Experimental 0'" 243.2 + 28.1 157.8+30.7 26 ±7.9 297.i±78.7 59.4±15.7
15'" 236.4 + 21.9 150.4±23.1 29.5 ±5.9 281.8±78.9 56.3±15.7
30'" 220.8 ±20.1 I27.7±26.3 38±3.6 274 ±75.7 55 ±14.9
40" 21!.9±I4.9 115.5±24.9 46.5±10.1 244.7±71.6 48.9±14.3
F'value' (NS) (NS) (NS) 46.4*rNSi
*Significant at 5% level, (NS) - Not Significant
CONCLUSION
Results showed that TC (14.77%), LDL (36.62%), Triglycerides (21.4%) and VLDL (21.4%) reductions were
observed with 44.08% increase in HDL level from the initial period. Hence, it is concluded that the flavanol-
containing chocolate bar has the potency to lower blood lipid levels.
RECOMMENDATIONS
Proper standardized techniques need to be indentified which can retain the catechin or total flavonol content.
As we continue to learn more about individual flavonoids, we may be able to develop diet strategies that result
in the most potent antioxidant effects in vivo and thereby further reduce the risk of chronic disease.
REFERENCES
1. Allen R R, Carson L. Kwik-Uribe C, et al. Daily consumption of a dark chocolate containing fiavanols and added slerol esters
affects cardiovascular risk factors in a normotensive population with elevated cholesterol. J Nun; 138 (2008) pp. 725-731.
2. Ashar M N and Prajapathi J B. "Role of probiotic cultures and fermented milks in combating blood clioleslerol". Indian Journalof Microbiology, 41 (2001), pp. 75-86
3. Baba S. Natsume M. Yasuda A. Nakamura Y. Tamura T , Osakabe N, Kanegae M and Kondo K, Plasma LDL and HDL
Cholesterol and Oxidized LDL Concentrations Are Altered in Nornio- and Hypercholesierolemic Humans after Intake of Different
Levels of Cocoa Powder. Journal of Nutrition, 137 (2007) pp. 1436-1441.
4. Charlotte, Health benefits of clwcnlaie, Confectionery new,s.com., (2008).
5. King S, Cardiovascular disea.se on the rise in India, Indian express newspaper, (2000).
6. Law M, Plant Slerol and Stanol, margarines and health. British Medical Journal, 320 (2005). pp. 861-864.
7. National Cholesterol Education Programme, NIH News release, 15 (2001).
8. Robert S, "Patient information: High cholesterol and lipids", Hyperlipidemeia. www.americanheail.org., (2008).
103

FNDHM/Orayi4
Women Empowerment through Pleurotus Sajor-Caju Supplemented Biscuit Enterprise
Vimla Dukwal' & Sudesh Jood ̂
1. Assist Professor, College of Home Science, RAU, Bikaner (Rajasthan)
[email protected] (09413940444)
2. Associate Professor, COS, HAU, Hisar (Haryana)
ramjood@redi^maiI.com
ABSTRACT
Female labour is an integral part of the total labourforce in every country. The socioecoitomic
programme for women should create employment potential for women are areas in whichthey can prove to be better workers than man. Among all, mushroom cultivation is oneactivity where 70 percent women are involved in the production, harvesting, packaging and
processing. Considering growing popularity of mushroom among consumers, due to itsflavour, nutrition, medicinal attributes, P. Sajor Caju is suitable income generating activity
for women). P. Sajor Caju is gaining popularity due to its diversability of growth at a widerange of temp. 10-3(PC, biological efficiency [40-125%], simple cultivation technology at
a nominal capital investment can be grown on various kinds of agricultural by product anddecreases environment pollution. During peak period, it grows in flushes but being aperishable gets spoiled easily. So present study was carried out with the objectives to developand test the acceptability of P. Sajor Caju supplemented biscuit and also to test the economic
feasibility as a small scale enterprise. Citric acid treated hot air oven dried powder vvos'used at 5 and 10% level for incorporation. Both biscuit were liked moderately on all .sensoryattributes and stored up to 3 month without significant change in free fatty acid and fatacidity contents of composite biscuit. Cost benefit analysis was done to assess the profitability.Initial cost and net return of 750 kg composite bisctdt were Rs. 33310 and Rs. 41602/monthrespectively. Profit came out to be Rs. 18.52/kg. It showing that inve.stment on this enterprise
is profitable.
INTRODUCTION
Oyster mushroom is the third largest cultivated mushroom in the world and contributes approximately 16 percent to the total world mushroom production'. It is gaining popularity due to its diverse ability of growth at awide range of temperature (lO-BCC) biological efficiency (40-125%) simple cultivation technology at a nominal'capital investment, can be grown on various kinds of agricultural byproduct and decrease the environmental!pollution by recycling the agro and industrial wastes^ Similarly, it is lignicolus fungi which have capabilities toifight against hunger malnutrition prevalent among vulnerable group by producing protein rich foods. It is one ofthe highest proteins prouder per unit area and time from the worthless agro wastes and fit in well to fight themalnutrition^ So present study was undertaken with the following objectives:
1. To develop technology for Pleurotus sajor caju powder.
2. To find out the organoleptic acceptability of value added biscuits.
3. To calculate the cost benefit ratio of supplemented biscuits.
AIMS & OBJECTIVES
Present study was undertaken with the following objectives:
1. To develop technology for Pleurotus .sajor caju powder.
'104

2. To find out the organoleptic acceptability of value added biscuits.
3. To calculate the cost benefit ratio of supplemented biscuits.
MATERIALS & METHODS
The process for preparation of mushroom powder was standardized. Six types of powders from each sun dried
(T,) blanched and sun dried (T,), treated with citric acid and sun dried (Tj), oven dried (T^), blanched and oven
dried (Tj) and treated with citric acid and oven dried (T^). The most acceptable powder was selected throughorganoleptic acceptability of various parameters i.e. colour, aroma, texture and the powder was incorporated in
biscuit at 0,5 and 10 per cent levels and were evaluated for their acceptability on nine point hedonic scale.
Economic feasibility of value added biscuits were also calculated to find out its suitability for manufacturer.
Cost was calculated on fixed and variable cost to calculate the cost benefit ratio.
RESULTS & DISCUSSIONS
• Powder formation : Among all pretreated powders, T6 powder had significantly (P<0.05) higher mean
scores of colour (5.49), aroma (5.10), texture (5.40) and overall acceptability (5.33). These powders were
also analyzed for physico-chemical properties viz. yield, non-enzymatic browning, swelling index, water
retention, dispersibility and water absorption (Table I&2). Data reveals that T^ powder (steeped in citricacid and oven dried) was observed higher values for physico-chemical properties.
• Acceptability of value added biscuits : Colour score of the composite biscuit decreased non-significantly
up to 10 percent level of substitution. Colour score of the control biscuits was 7.80 which decreased non-
significantly with 10 percent level of substitution in wheat flours. Appearance score of control biscuit was
7.80. At 10 per cent level of supplementation in wheat flour caused non significant reduction in appearance
score. Similar trend was also observed in aroma and texture of supplemented biscuits. With regard to taste,
score of control biscuit was 7.80 whereas it increased non-significantly with supplementation of 5 percent
and decreased significantly with supplementation of 10 percent level of mushroom powder. Overall
acceptability was higher in case of control as compare to value added biscuits. Biscuits made by addition of
5 and 10 percent levels of powder were found in the category of 'liked moderately' (Table 3).
• Cost benefit analysis
Fixed cost: Amongst the fixed cost, the depreciation on oven constituted maximum share (5.70%) whereas
weighing balance shared minimum (0.30%) contribution to the total cost. However, dough maker and grinder
constituted the equal share to the total cost i.e. 1.50 percent for each. With regard to utensils and spoons,
contribution was 0.90 percent (Rs 300.00) of total cost. Moreover, interest on fixed cost @ 10 percent per
annum for one year was observed to be 9.90 percent of total cost (Table 4).
Variable cost : Vanaspati ghee accounted for highest share (25.21%) of total cost. It might be due to the
fact that rate of ghee was maximum among other food ingredients used for biscuit preparation. The expenditureon mushroom powder, refined flour and sugar were the other major items which accounted for 8.85, 8.10and 14.86 percent, respectively. Share of ammonia powder, packaging and labour contributed 2.40,4.80 and7.50 percent, respectively of total cost. Similarly, salt, transportation and miscellaneous expenses sharedbetween 1 to 2 percent of total cost. Interest on variable cost @ 10 per cent per annum for 3 monthsaccounted for 3.82 percent of total cost. The total cost of biscuit production was Rs 33,318.00. The proportionof fixed cost was low as compared to variable cost to total cost. Total fixed and variable cost was Rs. 6600and Rs. 26718 which constituted about 19.8 and 80.20 percent of total cost (Table 4).
• Results from value added biscuits : Total quantity of prepared product was 750 kg & selling price Rs.44.42 was calculated for one kilogram biscuit. Similarly gross returns and net return were Rs. 75000 and41682 net returns for three month was Rs. 13894. Manufacturer received Rs. 18.52 as a profit on one
kilogram biscuit. Initially the selling price of biscuits kept low to make it popular among consumers (Table 5).
105

l^ble 1: Organolcptic acceptability of Pleurotiis sajor-caju fresh powder
Substrate / Treatment Colour Aroma Texture Overall acceptability
Tl 3.20 ±0.10 4.10±0.11 5.00 ±0.17 4.10 ±0.15
T2 5.00 ± 0.26 3.20 ±0.01 4.50 ± 0.26 4.23 ± 0.20
T3 5.39 + 0.10 4.90 + 0.25 5.20 + 0.10 5.16±0.17
T4 3.80 ±0.35 4.20 ± 0.34 5.10 ±0.10 4,37 ±0.1!
T5 5.30 ±0.10 3.90 ±0.01 4.70 ± 0.05 4.63 ± 0.25
T6 5.60 ±0.15 5.20 ±0.10 5.40 ± 0.20 5.40 ±0.01
CD (P<0.05) 0.36 0.33 0.29 0.29
Values are mean ± SD of ten panelists
Tl = Sun dried, T2 = Blanched Sun dried, T3 = Steeped in citric acid and Sun dried
T4 = Oven dried. T5 = Blanched and oven dried, T6 = Steeped in citric acid and oven dried
Ihble 2: Physico-chemical properties of Pleurotiis sajor-caju fresh powder
Substrate /
IVcatment
Yield (%)
browning
Non-enzymatlc Water retention
(ml/g)
Swelling index
(ral/g)
Tl 8.30 ± 0.08 0.14 ±0.01 2.30 ±0.15 0.33 ± 0.05
T2 6.67 ± 0.13 0.05 ± 0.00 1.10±0.28 0.56 ± 0.05
T3 8.30 ±0.10 0.10 ±0.00 3.86 ±0.11 0.00 ± 0.00
T4 8.76 ±0.10 0.12 ±0.00 2.90 ±0.01 0.00 ± 0.00
T5 6.76 ± 0.07 0.04 ± 0.00 1.30 + 0.17 0.26 + 0.05
T6 9.00 ±0.10 0.08 ±0.01 4.10 ±0.10 0.53 ±0.11
CD (P<0.05) 0.83 0.01 0.29 0.11
Values are mean ± SD of ten panelists
Tl = Sun dried, T2 = Blanched Sun dried, T3 = Steeped in citric acid and Sun dried
T4 = Oven dried, T5 = Blanched and oven dried, T6 = Steeped in citric acid and oven dried
Ihble 3: Organolcptic acceptability of Biscuits supplemented with Pleurotiis sajor-caju powder
Suppln. level Colour Appearance Aroma Texture Taste Overall acceptability
Control (W) 7.80±0.10 7.8010.10 7.7010.11 7.8010.10 7.8010.10 8.0010.30
95:5 7.80±0.10 7.8010.57 7.8010.10 7.8010.01 7.8010.01 7.8010.34
90:10 7.60±0.15 7.4010.150 7.0010.51 7.20 ±0.10 6.80 ± 0.34 7.2010.01
CD (P<0.05) 0.24 0.64 0.85 0.16 0.32 0.52
Values are mean ± SD of ten panelistsW = Wheat flour
Table 4: Cost component of Pleurotus sajor-caju powder supplemented biscuit
Items Amount (Rs) %agc
Fixed cost (6 months)
Dough maker 500.00 1.50
Oven 1900.00 5.70
Grinder 500.00 1.50
Weighing balance 100.00 0.30
Utensils and spoons etc. 300.00 0.90
Interest on fixed cost @ 10% per annum for one year 3300.00 9.90
Total 6600.00 19.80
Variable cost
Mushroom powder 2950.00 8.85
Refined flour 2700.00 8.10
Sugar 4950.00 14.86
Vanaspati ghee 8400.00 25.21
Salt 329.00 0.99
Ammonia powder 1600.00 4.80
Packing roll 800.00 2.40
Labour 2500.00 7.50
Transportation 600.00 1.80
Miscellaneous (2.5%) 620.00 1.86
Interest on variable cost @ 10% per annum for 3 months 1272.00 3.82
Total 26718.00 80.20
Grand Total 33318.00 100.00
106

Table 5: Cost and return of Pleurotus sajor-caju cultivation
Items Amount (Rs)
Total quantity of prepared product (kg) 750
Total cost (Rs) 33318
Cost/ kg (Rs) 44.42
Gross returns (Rs) 75000
Net returns (Rs) 41682
Net returns/month 13894
Net relums/kg 18,52
Average production of mushroom/bag = 1.60 kg
Average production of mushroom/bag = 1.60 kg
Ibbic 6: Cost and return from Pleurotus sajor-caju biscuits
Particulars Cost
Total quantity of prepared product (kg) 750
CONCLUSION
Blanching treatment to the mushroom adversely affected the texture"* where as stepping in citric acid and evendrying significantly improved the overall quality of mushroom when they were compared with other pre treatments.It might be because of the preservative action of citric acid which prevents the activity of peroxidase andcatalase enzymes prior to dehydration which prevents darkening in the powder^. Loss of weight after blanchingmay be due to removal of water soluble substances®. Water retention was lower due to damage of cell structure.Steeped powder showed highest water absorption capacity due to positive effect on interstitial spaces of cells'.The colour of biscuit is a result of mallard reaction between sugars and proteins^. Biscuits were liked very muchby the panel member food processing activities are traditional women' and can be beneficial enterprise.Development and consumption of such value added products claiming health benefits can go a long way inimproving the nutritional status of the population especially those suffering from protein malnutrition anddegenerative diseases associated with today's changing life style and environment.
RECOMMENDATIONS
Development and consumption of such value added products claiming health benefits can go a long way inimproving the nutritional status of the population especially those suffering from protein malnutrition anddegenerative diseases associated with today's changing life style and environment.
REFERENCES
1. Chadciha K Land SharmaS R, Mushroom reseaivh in India - History, infrastructure and achievement. Advances in Horticulture,
Malhotra Publishing House. New Delhi, (13) 1995.
2. Upadhyay R C and "Verma R N, Nan conventional substrates for growing oyster mushroom. Mushroom Res, 9(1) (2000),pp. 35-38.
3. Ral R D, Nutritional and medicinal values ofmushroom. Advance.s in Horticulture, Malhotra Publishing House. New Delhi, (13)
1997, pp. 531-548.
4. Chandra S & Samsher, Studies on quality of dehydrated oyster mushroom as influenced by various pretreatments and drying
method. Mushroom Res. 11 (2) (2002), pp. 107-112.
5. Negi A. Development and incorporation of fruit powders for value addition of cereal based food products. Unpublished PhDThesis, C C S Haryana Agricultural University, Hisar, 2003.
6. Singh R P, Dang R L, Bhatia A K and Gupta A K, Water binding additives and canned mushmom yield, Ind. Fd. Packer, 36 (1)(1982), pp. 39-43.
7. Pomeranz Y, Functional pivperties of food components. Academic Press Inc., New York. 1985.
8. Raidl MA and Klein B P, Effect of soy or fieldpeaflour substitution on physical and sensory characteristics of chemically leavenedquick breads. Cereal Chem, 60 (5) (1983), pp. .367-370.
9. Mohiuddin A, Entrepreneurship in rural women. Kurukshetra, 35 (12) (1987), pp. 22-25.
107

FT>IDHM/Oral/18
Impact of an Intervention Based on Pearl MilletLodoo on Hemoglobin Status of AdolescentTanu Shree Singh' & Madhu Goyal^
1. PG Scholar. College of Home Science, SKRAU, Bilcaner(Rajasthan)[email protected] (09983582195)
2. Associate Professor and Dean, College of Home Science, SKRAU, Bikaner (Rajasthan),[email protected] (09413211221)
ABSTRACT
Nutritional hassles especially "Anaemia" affecting the general masses of the developingcountries since years. More than thousands of wisely conducted intervention program fornumber of times could not even improve the scenario. Youth are the future holders of anynation, so healthier growth of them means better development of the nation, hut in Rajasthan
the condition of children and youngsters are dismal, more affected are the females. Thereforethe present study was conducted among the three groups of anaemic adole.scent girls'. Eachgroup consists of 10 girls, with the mean haemoglobin status of group A as 9.8lg/di; groupB as 9.65g/dl; and group C as 9.39g/dl. Pearl millet based Ladoo was developed, standardized
and administered to the A group which provided IStng of Iron, supporting 1/3"' of daysrequirement of an adolescent girls. While the B group was supplemented with IFA tabletsproviding 60mg of elemental iron and Control (C) group received no intervention. Theintervention program was scheduled for 45 days and Hemoglobin estimation exercised atevery 15"' day during the intervention program.The results after 45 days of intervention depicted that mean haemoglobin status of group Ahiked to 11.82 ± 0.56g/dl: group B raised to 11.85 ± 0.71g/dl of mean Hemoglobin, whilstthe mean Hb status of group C rendered as 9.39 ± 0.51g/dl. In terms of statistical analysisgroup A and B shows highly significant increase in Hemoglobin levels while the C-grouppossessed non-significant rise in the values. Pearl millet based Ladoo could be an efficientand promiscuous vehicle for reducing the prevalence and mortality stats due to Anaemia, asit is comparable to the elemental tablets which are generally disliked by the adolescent girlsand other rural sector. Dietary iron is more closely linked with people's life hence could bea great weapon for eradication of anaemia.
INTRODUCTION
A recent survey by the State Department of Medical Health and Family Welfare, Rajasthan revealed that 1.84Lacks Students Are Anaemic and About 70,000 Are under Weight.
Anaemia is a major global problem affecting between 20-70% of the population in various countries. In India, itis an important nutritional problem affecting all segments of the population especially infants, adolescents andpregnant women. In earlier stages, anaemia impairs scholastic performances and in young women the reproductiveperformances. The "term nutritional anaemia" defined by WHO encompasses all pathological condition inwhich the blood haemoglobin concentration drops to an abnormally low level owing to a deficiency of one orseveral essential nutrients regardless of the cause of this deficiency.
Cereals including millet are consumed in India as a staple with wide variety of pulses and vegetables in varyingproportions. In spite of various efforts in the past, nutritional deficiencies could not be corrected to the sufficientlevels. Although efficient scientific endeavours might not be underestimated.In the beam of the above scientific proceedings, present research has been propelled towards correcting irohideficiency anaemia via vastly available, immensely nutritional and inexpensively affordable cereal of Rajasthanstate- Pearl Millet. The product developed with pearl millet, other iron rich foods had been planned lo supplement
108

the diet of iron deficient subjects, along with a glass of lemon water (250ml), which essentially enhance the
absorption of non-heme iron, and impact analysis was exercised. This dietary iron had been compared with the
elemental iron in order to signify the magnitude of dietary iron versus the elemental one. Thus the present study
knocks iron deficiency anaemia among the undergraduate girls of College of Home Science, SKJRAU, Bikaner
with the locally available dietary ingredients.
AIMS & OBJECTIVES
Present study has the following objectives:
1. To develop and standardize pearl millet based iron rich Ladoo
2. To evaluate impact of feeding the pearl millet based iron rich Ladoo and iron folic acid tablet on the
haemoglobin status of the subjects
MATERIALS & METHODS
• Selection of Subjects: All the subjects were randomly selected from the campus of College of Home
Science, SKRAU, Bikaner, to find out their nutritional status with special reference to their haemoglobin
status in order to assess the prevalence of anaemia.
• Assessment of Nutritional Status: HEMOGLOBIN ESTIMATION- Hemoglobin level of the selected
subject was estimated by Sahli's method before and after the intervention.
• Interpretation: based on haemoglobin level, the subjects were classified as normal, mild, moderate or
sever anaemic (WHO, 1989) as shown in Table-I.
• Development & Standardization of Pearl Millet Based Iron Rich Ladoo: Pearl millet is a staple food
for arid zone people and economically weaker section in India. In spite of greater availability, low cost and
comparatively good nutritive value, use of pearl millet in food industry is very low because of some major
constraints act as obstacles in its wide spread diversification and acceptability (Sehgal and Kwatra, 2006).
However, this millet is immensely nutritious with a high content of iron it is not utilized by the body due to the
presence of phytic acid and polyphenols. This bane of pearl millet can be booned by germination process, as
there is good correlation between anti nutritional factors reduction and the increment in extractable mineral
with germination time. Thus, the pearl millet based iron rich ladoo was developed with addition of other iron
rich foods. Amount of each ingredient was standardized while developing most acceptable and feasible form
of product.
• Intervention Programme : The intervention program was commenced in the month of July, which lasts
for September 2009, in which 45 moderately anemic girls with the hemoglobin level 8.0 g/dl - 10.9 g/dl aged
17-19 years were selected for the intervention program. Subjects were divided into three groups (15 each)
a) Experimental group (A) received pearl millet based iron rich product for lOOg per day regularly for
45 days.
b) Experimental group (B) received iron folic acid tablets containing of 200mg (60 mg elemental iron)
each every day for 45 days.
c) Control group (C) received no supplementation
• Impact Analysis: The hemoglobin level was measured in all the groups at an identical period of time i.e.
initially and after intervention.
Impact analysis was exercised based on statistical calculations and general re.sponses of the subject, in
order to observe eveiy minute difference due to intervention program. Subjects were even asked for their
experiences regarding the intervention at the time of feeding, related to their menses, acne, pimples and
other usual complications of female adolescents. These observations were carefully noted and been taken
care by the researcher during the study.
109

RESULTS & DISCUSSIONS
The present investigation reports that the mean Hemoglobin levels after 45 days of intervention in group A hiked
to 11.82 ±0.56g/dl; group B raised to 11.85±0.7Ig/dlof mean Hemoglobin, whilst the mean Hb status of group
C rendered as 9.39 ± 0.51g/dl. In terms of statistical analysis group A and B shows highly significant increase
in Hemoglobin levels while the C-group possessed non-significant values. Although elemental iron reports
better increments in Hemoglobin but with comparison to the dietary iron, it is non-significanily different, values
shown in Table 2.
Table 1: Classification of Hb levels
Hemoglobin Levels (G/Dl) Grades of Anaemia
< 8.0 g/dl Severe
8.0 - 9.9 g/dl Moderate
10.0- 11.9 g/dl Mild
> 12g/dl Normal
Table 2 : Mean Hemoglobin leves of the subjects before and after intervention
0 Days 45 Days
A 9.81+0.62 A 1I.85±0.71
B 9.65 ±0.64 B 11.82 ±0.56
C 9.39 ±0.56 C 9.93 ± 0.51
CONCLUSION
Pearl millet based Ladoo could be an efficient and promiscuous vehicle for reducing the prevalence and mortalitystats due to Anaemia, as it is comparable to the elemental tablets which are generally disliked by the adolescent
girls and other rural sector. Dietary iron is more closely linked with people's life hence could be a great weaponfor eradication of anaemia as it not only conquers over deficiencies but also take cares of the overall healthpattern of the population.
RECOMMENDATIONS
1. Assessment of impact of the iron rich ladoo among different age groups particularly population at risk
2. Commercialization of the product to improve the over all health development of needy groups.
3. Analysis of different aspects of the developed product using better methodological techniques.
REFERENCES
1. Bamji M S, Rao N P & Reddy V, Text book of human nutrition, Oxford and IBH Publishing Co. Pvt. Ltd., New Delhi. 2"'' Ed., 1996
2. Rao B S, Title, Nutrition Reviews, 60 (1) (2002), pp. 118-125.
3. Sehgal S & Kwatra A, Processing and ulilization ofpearl millet for nutrition security - Recent trends in millet processing ttndutilization. Publisher, 2003.

FNDHM/Oral/24
Effect of Growth Performance and Certain Blood/Biochemical Constituent of Mice Raised on
Different Levels of Non-Conventional Dietary Protein
Meenakshi Dutta Mazumdar' & Santana Kakoti-
1. Lecturer, Dept. of Home Science, Handique Girls' College Guwahati (Assam)
[email protected] (09864322834)
2. Senior Lecturer, Dept. of Home Science,
Handique Girls' College Guwahati (Assam)
[email protected] (09864106737)
ABSTRACT
Eri Pupe a potential souive of protein about 55-58% is a waste by- product after reeling the
silk. The increasing cost of animal feed has made it obligatory to depend more on
unconventional food for future protein requirements. Therefore, the present study was
an attempt to use unconventional mixtures replacing fish meal graded at (0, 50, 75 and
100%) levels of incorporation in a standard diet of mice. Twenty four weaned mice were
distributed into four groups of six animals on randomized block design. The experimental
feeding was continued for 28 days after which a digestibility trial was conducted for 3
days. Certain. Biochemical profiles viz. blood glucose, serum cholesterol; blood urea nitrogen
and total serum protein were also studied. Average weekly gain in body weight, feed
conversion efficiency, protein efficiency ratio were significantly (P<0.05) higher in
control and El groups. Except crude protein no significant differences were observed
in respect of digestibility of organic nutrients. The level of blood glucose, serum
cholesterol, blood urea nitrogen and total serum protein varied slightly within normal
range and statistically no difference was observed. It is thus concluded that eri pupae
meal can be included upto 50 percent level (4% W/W) replacing fish meal in the diet of
mice.
INTRODUCTION
Eri silk worm (Philosamia ricini) is prevalent in the Brahmaputra Valley and the adjoining hills which is an
Important source of protein (55-58%). It appears that silkworm pupae have a high dietary value, much more
than fish and other animal proteins and at par witli meat from various animal sources. After reeling silk fibre
from cocoons, some pupae are consumed as delicacy by the tribal communities and a large quantity are thrown
away as wastes. Hence, a potential source of protein is wasted regularly.
The blood profile reflects the nutritional adequacy of the diet as well as the nutritional status of the animal.
Many workers had also reported the haemato -biochemical picture of mice and rats on a non-conventional
dietary protein. Therefore, the present investigation was an attempted to evaluate the quality of protein and also
to study certain bio-chemical constituents of albino mice fed on eri pupae meal as a replacement of fish meal.
AIMS & OBJECTIVES
1. To study the growth performance of mice raised on rations containing various levels of eri pupae meal as
replacement of fish meal.
2. To determine digestibility coefficient of different nutrients.
3. To study certain blood-biochemical constituents in mice.
Ill

MATERIALS & METHODS
Twenty four weaned albino mice 21d old were divided randomly into 4 groups viz. Control (C), Experimental-
1 (Ej), Experimental-2 (B,) and Experimental-3 (Ej) on the basis of similar body weights. Four isonitrogenousrations were prepared as per NRG (1978) for growing mice. Control ration was prepared with conventionalingredients i.e. maize, wheat bran, de-oiled groundnut cake and fish meal. However in experimental rations viz.E,, Ej and Ej fish meal was replaced by dried eri pupae meal at 50, 75 and 100 percent levels. These rationswere fed to respective groups of animals C, E, and E^ for a period of 4 weeks. The feed was offered ad. libitumto all the animals equally half in the morning at 9 AM and half in the afternoon at 3 PM and water was made
available all the time. The feed residues were collected and weighed next day morning before offering concentratemixture. A digestion trial was conducted for 3 days on three animals from each group to as.sess the digestibilityof nutrients. During the feeding trial weekly feed intake, weekly gain in body weight, total gain in body weight,protein efficiency ratio and feed conversion efficiency were recorded.
Blood was withdrawn by cardiac puncture under diethyl anesthesia at the beginning and at the end of theexperimental period. Serum was separated by centrifugation and stored at -20"C and analyzed for bloodglucose total serum protein; blood urea nitrogen and serum cholesterol. All the data were statisticallyanalyzed.
RESULTS & DISCUSSIONS
The feed intake, growth rate, feed conversion efficiency, protein efficiency ratio and nutrient digestibility areshown in Fig 1. The average weekly dry matter intake was almost similar in all the groups and no significantdifferences were observed.
Table 1: Average feed intake, growth rate, protein efficiency, food conversion efficiency and nutrient digestibilityon feeding diets containing different levels of eri pupae meal
Parameter Groups
C E. E,
Initial body weightCg)"^ 20.80±1.14 20.80±1.43 20.69±1.10 20.82±1.60
Weekly feed intake(g)'^^ 39,27±1.59 38.51±1.58 37.54*1.67 39.06*1.31
Weekly gain in body weight*(g) 15.50±0.88' 16.05±0.82"' 11.92±0.65' 8.59*0.82"
Total gain in body weight(g)* 63.68±2.04' 64.62±2.37"' 47.68±1.63'^ 43.02*2.01'"
Feed conversion efficiency* 2.59±0.06* 2.44±0.05''' 3.24±0.1P 3.87±0.21"
Protein efficiency ratio* 1.8I±0.04' 1.84±0.03''' 1.49+0.06^ 1.00±0.07"
Nutrient Digestibility (%)
Dry matter 83.44±2.60 81.81±0,83 80.41±1.21 79.18±2.34
Organic matter 83.63±2.57 81.93±0.82 80.31*1.22 79.08*2.35
Crude protein* 58.82±0.69= 51.21±0.62"' 53.77±0.69' 50.46±1.07"
Ether extract 76.20±3.82 77.08±1.11 77.74*1.40 78.52*2.38
Crude fibre 53.23±7.38 53.62±2.05 53.09±2.89 55.63*5,05
Nitrogen retention * 5S.84±0.65'" 57.22±0.62''' 53.72*0.69' 50.59*0,99"
Nitrogen freeExtract 79.33±2.81 78.17±0.67 75.60*1,51 74.06±2.92
* Significant (P<0.05)NS > Non significant abed > Means with different superscripts differ significantly
The average weekly gain and total gain in body weight showed significant differences in E^ and E., groups. Thedecrease in weight gain in E^ and E^ groups could be due to imbalanced amino acid composition and lowerprotein utilization. Secondly, another important factor might be due to the presence of tannin in eri silk wormpupae since these pupae were grown in castor leaves which contain appreciable quantity of tannin. Reed(1995) opined that tannins react with protein and form tannin protein complex which is resistant to enzymedegradation, thereby reducing digestibility of nutrients. The FCE and PER was significantly lower in E, and E^groups which may be due to the presence of anti-nutritional factor like tannin in eri pupae which increased withincrease amount of eri pupae in the diets.
112:

The digestibility of dry matter, organic matter, crude protein, nitrogen free extract and nitrogen retention decreasedalong with the level of incorporation of eri pupae in the diet. On statistical analysis, significant differences wereobserved in digestibility of crude protein and nitrogen retention in E, and Ej groups which may be due to higherfibre concentration of the diets.
The mean values of blood glucose total serum protein, blood urea nitrogen and serum cholesterol of different
groups before feeding experimental diets and at post feeding are presented in Table-2. Statistically, no difference
was observed among the groups both at initial and post feeding. The values of blood glucose, total serum
protein, blood urea nitrogen and serum cholesterol were within the normal range. Similar values have also been
reported by Sharma (2000).
Table 2: Average blood glucose, total serum protein, blood urea nitrogen and serum cholesterol on feedingdifferent levels of eri pupae meals
Blood constituents Dietary treatment
C
(0%EPM)E,
(50% EPM)E,
(75% EPM)E,
(100%EPM)
Blood glucose (mg/lOOmI of blood)
Initial
Post-feeding109.53±0.49
112.60±0.26
109.73±0.77
112.16±1.05
109.63±1.29
111.07±0.57
109.30±0.67
109.96±1.36
Total serum protein (mg/lOOml of blood)
Initial
Post-feeding
6.04±0.08
6.13±0.14
6.10±0.26
6.15±0.04
6.07±0.43
6.01±0.13
6.19±0.32
5.76±0.34
Blood urea nitrogen (mg/lOOmI of blood)
Initial
Post-feeding
17.85±0.88
18.56±0.73
17.73±0.39
19.96±0.20
17.53±0.39
19.37±0.45
17.19±0.51
20.39±0.44
Serum cholesterol (mg/lOOmI of blood)
Initial
Post-feeding
NS: non-significant
56.20±0.52
63.55±0.87
56.14±0.98
64.61±0.92
56.29±0.62
65.37±0.78
56.28+0.62
65.43±0.58
CONCLUSION
Eri silk worm pupae meal has a good potential as a protein source and can be supplemented in the diet of mice
upto 50% level (4%WAV) without any adverse effect on gain in body weight, food conversion efficiency,
protein efficiency ratio, nutrient utilization and blood bio-chemical constituents. As eri pupae can be
procured in fresh condition there is also a scope to prepare protein rich food from eri pupae for human consumption.
RECOMMENDATIONS
Experiments will have to be performed for studying the effect of fat and tannin free eri pupae meal. The fatfree eri pupae becomes rich in protein content and may be a better source of animal protein in the preparationof diets. Lipids may be extracted for utilization in other fields like production of soap, detergents paints andvarnishes etc.
REFERENCES
1. Donangelo C M and Eggum B O, Title, Br Journal ofNutrition. 54 (1985), pp. 741-751.
2. Moclutyre B and Ralston H, Title, Biochemistry Journal, 56 (1934), pp. 13.
3. NRC, Nutrient requirements of laboratory animals. National Academy of Sciences, Wa.shington, D.C, 3^^ Ed., 1978, pp. 35-38.
4. Oscer B L, Hawks Physiological Chemistry. Mcgraw Hill Book Company, New York, 4'" Ed., pp. 2965.
5. Plummer D T, An Introduction to Practical Biochemistry. Tata McGraw Hill Publishing Co. Ltd. India, 1971.
6. Ray 1, Welcome the silk wonn to your dining table, Indian silk, 28 (4) (1989), pp. 25-27.
7. Reed ID, Nutritional toxicology oftannins and relatedpolyphends in forage legumes. Journal Animal. Science, 73 (1995). pp. 1516-
1528.
8. Sharma R K, Study ofhepatoprotective action ofterminalia chebula. Unpublished MD thesis, Govc. Ayurvedic College, Guwahali
(Assam), 2000.
9. Snedecor G W and Cochram W G, Statistical Methods, Allied Pacific, Bombay, 6'" Ed. 1967.
10. Varley H, Practical Chemical Biochemistry, Gulab Vazirani Pvt. Ltd., New Dehli, 4'" Ed.. 1975.
113

FNDHM/OnU/26
Development and Nutritional Analysis of Spirulina Incorporated Biscuits
Vandita Sharma' & Vimla Dunkwal'
1. P G Scholar, College of Home Science. SKRAU, Bikaner(RaJsathan)
[email protected] (09414963355)
2. Assistant Professor. College of Home Science, SKRAU. Bikaner (Rajsalhan)
[email protected] (09413940444)
ABSTRACT
Spirulina is a nutrient rich super food for super health. Super foods can be defined as
foods that have health promoting benefits and disease preventing properties over and above
their usual nutritional value. Spirulina is the common name for human and animal food
supplements produced primarily from two species of cynobacteria, i.e. arthrospirea platensis
and arthrospira maxima. Spirulina have many therapeutic properties such as
hypocholestrolemic, immunological, antiviral and antiglutagenic effects. Spirulina is the
excellent source of protein. The present study was undertaken to assess the nutritional
composition of Spirulina powder, to develop value added products and their nutritional
analysis and to study the effect of storage on value added products usitig Spirulina. Valueadded Biscuits were prepared by using refined wheat flour, sugar powder, ghee, milk,
ammonia, baking powder, custard powder, milk powder, vanilla & pineapple essence and
10 per cent level of Spirulina powder. The mean score for sensory evaluation of developed
value added Biscuit was 7.5 against the control sample 7.9 on nine point hedonic ranking
scale. The developed value added Biscuit contained 2.95 per cent moisture, 19.6g protein,
26.7Ig fat, 2.08g crude fiber, 1.83g ash, 46.83 g carbohydrate and 506.11 kcal energy per
lOOg on dry weight basis. In developed sample a-carotene, vitamin c, iron and potassiumcontent were observed 349.75 pg/lOOg, 2.75 mg/lOOg, 17.62 mg/lOOg and 292 mg/IOOg
respectively. Fat acidity revealed satisfactory quality of the value added Biscuit at the endof three months storage period. Thus, better quality of value added Biscuit bringsconsiderable advantages among the community.
INTRODUCTION
Today food is lower in essential nutrients than foods produced 50 years ago. Farming practices have beendepleted our soil fertility (http://www.spirulinasource.com). Stress from environmental pollutants and life styledemands have increased our dietary requirements for certain essential nutrients. To overcome these problems,
some super foods like Aloe Vera, Garlic, Tomato, Walnut, blue green algae (spirulina) are introduced. Spirulina,Blue green algae (fusiformis) is being used as nutrient dense food materials in natural and health food. It alsohas some potent nutrients and probiotic compounds that enhance health condition. Interest in food application of
micro algae has its origin on three counts. Firstly, in certain countries a small section of the population have beeneating naturally grown algae harvested from lakes etc. without ill effects for centuries. Secondly, the focus on
protein calorie malnutrition in the third world countries was drawn by the FAO in sixties, which lead to identification
of newer protein source particularly algae. Thirdly, spirulina has been proposed by both NASA and the European
space agency as one of the primary foods to be consumed during long stay in space. Spirulina is the nutrient
dense food. It is particularly rich in protein and also contains carotenoids, vitamins, minerals and essential fatty
acids. It contains 55-70 per cent protein, 15-25 per cent carbohydrates, 6-7 per cent moisture and 8-13 per cent
minerals, 3-7 per cent fat and 8-10 per cent fiber.
114

MATERIALS & METHODS
• Procurement of spirulina powder: Spirulina powder was purchased from "Manjul Spirulina SamvardhanSansthan Jaipur.
• Development of value added Biscuit: Most acceptable value addition level of spirulina powder i.e. 10 percent was incorporated into the recipe with other ingredients.
• Oraganoleptic evaluation: The Developed value added Biscuit was standardized using organoleptic
evaluation technique with the help of 10 panel members using 9-point hedonic ranking scale. The developed
value added Biscuit along with control sample served to the panel members for organoleptic evaluation.
• Nutritional evaluation: Prepared Biscuit were analyzed for moisture, crude protein, crude fat, crude fiber,
ash, Vitamin C, a-carotene, iron and potassium contents along with total carbohydrate and energy contents.
RESULTS & DISCUSSION
Oraganoleptic evaluation: Table 1 reveals that the calculated overall mean organoleptic scores for the control
sample of biscuit was to be ranging between 7.8 to 8.0 against 7.3 to 7.7 scores for develop value added biscuit
on nine point hedonic ranking scale. The statistical analysis also showed non significant difference between the
control and developed samples of biscuits.
Nutritional evaluation: Table 2 unfolds the data of nutritional contents of control and developed biscuit.
Moisture content of control and developed sample was analyzed as 2.57 per cent and 2.95 per cent, respectively.
Crude protein content was observed lower (13.01%) in control sample whereas higher value (19.06%) was
observed in developed sample. Data from the table depicts that 28.11 per cent and 26.71 per cent crude fat
found in control and developed sample. Crude fiber content of control and developed biscuit was 1.28 per cent
and 2.08 per cent respectively, indicating higher crude fiber in the developed sample than its control counterpart,
whereas ash content was 1.13 per cent and 1.83 per cent respectively.
In control biscuit total carbohydrate was calculated 53.81 per cent whereas in developed sample 46.83 per
cent. Total energy content of control sample was 520.06 kcal/100 g whereas in developed biscuit it was noted
to be 506.11 kcal/100 g (Table 2). Crude protein, crude fat, crude fibre, total carbohydrate and total energy
content of developed biscuit were found to be higher and significantly differ at I per cent of the control sample.In control sample, b-carotene,vitamin c, iron and potassium content were 335.75 mg/100 g, 1.75 mg/100 g,2.62
mg/lOOg and 152 mg/100 g respectively whereas in developed biscuit values were recorded 349.75 mg/100 g,
2.75 mg/100 g, 17.62 mg/100 g and 292 mg/100 g b-carotene, vitamin C iron and potassium respectively (Table
3). The values were found to differed significantly at I per cent level in developed than that of control sample.
Table: 1 Organoleptic acceptability of value added Biscuit
Sr. No. PRODUCT Mean Scores Of Sensory Characteristics On Nine Point Scale
Colour Appearance Aroma Texture Taste Overall
Acceptability
1 Control 7.8 ??0.22 7.8 ??0.12 7.9 ??0.6I 8.0 ??0.37 8.0 770.12 7.9 770.48
2 Developed 7.4 ??0.66 7.7 ??0.78 7.7 ??0.90 7.6 ??0.80 7.3 770.64 7.5 770.60
3 't' value NS NS NS NS NS NS
Values are mean ±SD of three replicates
NS = Non significant
Spirulina Based Biscuits
115

Table: 2 Proximate composition of value added Biscuit (on dry weight basis)
biscuit Moisture Crude
protein
Crude
fat
Crude
fihcr
Ash Carbohydrate Energy
(kcal)
(%) (%) (%) (%) (%) (%)
Control 2.57 ±0.01 13.1 ±0.16 28.11 ±0.01 1.28 ±0.67 1.13 ±0.02 53.81 ± 0.05 520.6 ± 0.07
Developed 2.95 ± 0.58 19.6 ±0.02 26.71 ± 0.24 2.08 ± 0.45 1.83 ±0.54 46.83 ± 0.22 506.11 ± 0.02
't' value 3.12** 48.20* 9.70* 10.39* 3.32** 32.67* 178.25*
Values arc mean ±SD of three replicates
*signlficantat Insignificant
**significant at 5% significant
Table: 3 Vitamin and mineral content of value added Biscuits
Biscuit Vitamins Minerals
-Carotene(mg/100 g) Vitamin C (mg/100 g) Iron (mg/100 g) Potassium (mg/100 g)
Control
Developed
't' value
335.75 ± 0.43
349.75 ± 0.78
5.89*
1.75 ±0.45
2.75 ± 0.34
22.20*
2.62 0.09
17.62 ±0.11
28.16*
152 ± 0.77
292 ± 0.26
78.74*
Values are mean ±SD of three replicates
*significant at 1% significant
**significant at 5% significant
CONCLUSION
On the basis of present study it can be concluded that spirulina has a great scope in the field of product
development and can be utilized for achieving food and nutritional security for nation.
RECOMMENDATIONS
Therefore, results suggest that there is a great scope for use and marketing of value added products using
spirulina. Since the scope of M.Sc. research is limited, it is suggested that the present investigation may becontinued for following:
1. To study the microbial levels of value added products.
2. To estimate the cost variable of developed value added products.
3. To study commercial aspect of the value added products using spirulina.
REFERENCES
1. Anonymous, Standard recipes as a valuable tool in meal preparation. Southern Hospital, 36 (2) (1968), pp. 46.
2. Arlington V A, Official method of analysis. Association of Official Analytical Chemists (AOAC), 16"' Ed., 1995
3. Gopaian C RamaShastri B V, BalasuhramamanS C, Nutritive value of Indianfoods, National Institute of Nutrition. Indian Councilof Medical Research, Hyderabad, India. 2000.
4. Khader V, Textbook of food science and technology, Directorate of Information and Publication of Agriculture (Indian Council of
Agriculture), 2001, pp. 385-395.
5. A manual of laboratory products techniques. National Institute of Nutrition, Hyderabad, 1980, pp. 49-53.
6. Srilakshmi B, Food science. New Age International Ltd. Publishers, Delhi, 2"" Ed., 2001, pp. 350-352.
7. Swaminathan M S, Food science chemistry and experimentalfood, The Bangalore Printing and Publishing Co. Ltd., Bangalore,
1987.
116

FNDHM/Ora!/28
IVends in Breast Feeding practices among Missing THbes of Jorhat District, Assam
Daisy Kamcng Baruah', Nilimn Neogi- and Mridula S. Barooah^
1. Lecturer, Dept. of Home-science,Sibsagar Girls College (Assam)
2. Associate Professor, Dept. of food and nuirition,AAU, Jorhat (Assam)
3. Professor, Dept. of food an nutrition. AAU, Jorhat (Assam)
ABSTRACT
The practice of breast feeding is almost universal. The present investigation was an attempt
to evaluate the prevalent breast feeding practices in relation to nutritional status of infants
and the impact of nutrition education on the mothers belonging to Missing Tribes of Jorhat
district, Assam. Information on prevalent breast feeding practices were obtained from the
mothers of selected 120 infants (1-12 months) by using pre-tested interview schedule. The
feeding practices were co-related with anthropometric variables (length and weight) with
co-relation co-efficient "r". The impact of nutrition education was recorded before and
after the session with a pre-tested check list. Initiation of breast milk within 1 hour of birthas per Global recommendation was practiced by only 16.67% mothers. About 60% newbornreceived colostrums. Exclusive breast feeding was found among 33.33% infants. Partialbreast feeding practice highly co-related with good nutritional status of the studiedpopulation. The impact of nutrition education on mothers very encouraging inunderstanding the importance of proper breast feeding practice in such community.
INTRODUCTION
Breast feeding is an universal process. Initiation of breast feeding within one hour of birth is critical for newbornhealth and wellbeing'. Colostrum - "the first milk" is must for baby-, prelacteal feeds in the form of jaggery,water, honey etc. to the newborn hampers the practice of exclusive breast feeding for 6 months is still prevailingin these communities^. In recent years, there has been a global decline in the number of breast feeding mothers.
The present investigation was an attempt to evaluate the prevalent breast feeding practices in relation tonutritional status of infants and the impact of nutrition education on the mothers belonging to Missing Tribes(Plain Tribe) of Jorhat district, Assam.
AIMS & OBJECTIVES
1. To evaluate the prevalent breast feeding practices in relation to nutritional status of infants.
2. To record the impact of nutrition education on the mothers of the infants.
METHODOLOGY
The present study was carried out in Jorhat district of Assam. Six villages belonged to Kaliapani Developmental
Block under Teok revenue circle of Jorhat were chosen as venue for the study. 120 infants (1-12 months) from120 households were selected purposively. Information on prevalent breast feeding practices were obtainedfrom the mothers by using pre-tested interview schedule. The nutritional status in terms of length and weightwere assessed with standard procedures and compared with corresponding NCHS standards. The impact ofbreast feeding practices was determined by calculating correlation co-efficient "r". Nutrition education wasimparted to the mothers to determine the impact of nutrition education. A checklist was developed and administeredto the mothers at the beginning and at the end to assess their changes in knowledge and awareness of breastfeeding practices.
117

RESULTS & DISCUSSIONS
The socio-economic back ground information of the families such as occupation, education and income status
of the parents, religion, type and size of the family was primarily assessed.
• Initiation of breast feeding and colostrums feeding : The early initiation of breast milk within 1 hour of
birth of the child as per Global recommendation was done only by 16.67 and 11.66 percent mothers wliile
31.67 and 11.66 percent mothers started to initiate breast milk at least within 6 hours and 6-8 hours respectively.
60 per cent of the mothers fed colostrum to their infants. Majority of the mothers (79.16%), who fed
colostrum to the new boms reported colostrum to be nutritious and good for the health of the baby, while the
rest (20.83%) reported that colostrum was fed only as per elders advice without knowing the health benefits
of colostmm. On the other hand, 40 per cent mothers discarded the colostmm and considered it as impure,
dirty and harmful for the health of the baby which may cause stomach problem. Therefore, discarding
colostmm by the mothers at large was due to a number of misconceptions. This practice was still rampant
in the society and thus depriving a large number of new bom from getting the benefits of colostmm.
• Exclusive breast feeding : WHO (2002) defined exclusive breast feeding as " the practice of feeding
only breast milk excluding water, breast milk substitutes, other liquids or solid foods till 6 months of age".
Table 1 represents the exclusive breast feeding status of the infants.
T^ble 1: Percentage distribution of infants according to breast feeding status
Breast feeding status % of infants N = 120
Exclusive breast feeding upto 6-months 33.33 (40)
Exclusive breast feeding beyond 6 months(7-8 months) 40.83 (49)
Partial breast feeding below 6 months 25.83 (31)
Figures in parenthesis indicate number of infants
Although the rate of exclusive breast feeding was low ( 33.33 % ), it was indeed an encouraging factor which
was possibly due to the influence of post-natal advices by Doctor, ANM and ASHA workers.
• Impact of infant feeding practices on nutritional status of the target population: The anthropometricindicators (weight and length) are considered as an index of child's health. The mean anthropometric profile
of the infants according to breast feeding practices such as Initiation of breast feeding, colostrum feeding,exclusive breast feeding and partial breast feeding are presented in table 2
IVible 2: Nutritional status (weight & length) of studied population in relation to breast feeding practices
Infant Feeding
Practices(IFP)
TotalN=120 Nutritional Status
Weight Length
Underweight Normal Stunted Normal
Initiation of BF
Within 1 hour 16.66 (20) 90.00(18) 10.00 (2) 50.00 (10) 50.00 (10)
Within 6 hours 31.66(38) 97.36 (37) 2.63 (1) 84.21 (32) 15.78 (6)
After 6-8 hours 11.66(14) 92.85(13) 7.14(1) 57.14(8) 42.85(6)
After 2-3 days 40.00 (48) 83.80 (40) 16.60 (8) 95.80 (46) 4.16 (2)
Colostrum Feeding
Yes 60.00 (72) 94.40 (68) 5.50 (4) 69.44 (50) 30.50 (22)
No 40.00 (48) 83.30 (40) 16.60 (8) 95.80 (46) 4.16 (2)
Exclusive Breast feeding (upto 6 months) 33.33 (40) 100.00 (40) 0 95.00 (38) 5.00 (2)
Partial Breast feeding (below 6 months) 25.83 (31) 90.30 (28) 9.67 (3) 77.40 (24) 22.50(7)
Figures within parenthesis indicates no. of infants
j iH8;

Table 2 depicts the nutritional status of studied population in relation to different breast feeding practices.
The correlation co-efficient "r" was analyzed to determine whether the breast feeding practices were correlated
with the anthropometric variables and are presented in table 3.
Ibblc 3: Correlation co-cfllcient "r" between breast feeding practices and anthropometric variables of infants belonging to
Missing IVibes of TRC, Jorhat, Assam
Breast feeding practices Anthropometric variables
Length (cm) Weight (kg)
Colostrum feeding r=0.07 P=0.18
Initiation of breast feeding r=0.05 r=0.24
Exclusive breastfeeding r=0.11 r=0.31
Partial breast feeding r=0.45** r=0.64**
* Correlation is significant at the 0.05 level** Correlation is significant at the O.Oi level
The proceeding analysis verifies positive impact of partial breast feeding on nutritional status, which was highly
positively significant with both length and weight.
These findings is in conformity with the data drawn from NFHS - 2 (2006), that breast feeding with supplements
(partial breast feeding) is more beneficial than exclusive breast feeding even for the children below 4 months.
• Nutrition education : Nutrition education programme was organized for the mothers in small groups at
local primary schools and Anganwadi centres. Lectures and method demonstrations with different teaching
aids (leaflet, folder, chart and poster) were adopted on areas like balanced diet Nutritional care during
pregnancy and lactation. Importance of breast feeding and supplementary feeding. Locally available, low
cost and nutritious supplementary foods and importance of immunization.
• Impact of nutrition education
Fig.l: Awareness of the respondents about infant feeding practices before and after nutrition
education
i) Importance of early initiation of breast feeding and colostrums feeding.
I 0 Positive □ Negative |17%
□ Posilivc □ Negative
83%
Before nutrition education
92%
After nutrition education
ii) Importance of exclusive breast feeding
I Positive ■ Negative
14%
• rKi^.irivt
86%
Before nutrition education
98%
After nutrition education
119

On the whole, the situations were indicative of accepting viable nutrition intervention programs particularly
nutrition education as the mothers were found to be very receptive.
CONCLUSION
The breast feeding practices among the Missing mothers were not optimum as per global recommendation.
However, prevalence of colostrum feeding (60%), exclusive breast feeding (33.33%). were healthy signs
observed among the community. The nutrition education session sensitized the mothers to understand the
importance of this pivotal period of life. So further attempt should be made in such communities through nutrition
intervention programs for adolescent girls, pregnant and lactating mothers and also elderly women for promotion
and protection of optimal breast feeding practices in future days.
RECOMMENDATIONS
• Attempt could be made to create awareness and implement knowledge for educating adolescent girls,pregnant and lactating mothers and also elderly women for promotion and protection of optimal breastfeeding practices in order to make mothers understand the rationale of the practices so that good feedingpractices are sustained for better health and nutritional status of the children.
• Existing health and nutrition intervention programmes in the community aiming at the improvement and wellbeing of the infants and young children, instituted by the government could be strengthened by ensuringactive participation of the community based workers such as trained volunteers, member of communitybased organizations, anganwadi workers, ANM, ASHA, who could guide with appropriate practices and thecommunity as a whole.
REFERENCES
1. UNICEF, Progress for children ; A world Jit for children, A statistical review, (2007).
2. Dash and Choudhury, Breast feeding practices among Santals and Non-Santals of Orissa. Anthropologist 7 (4) (2005), pp.283-287.
3 David J, Honey, an avoidable riskfactor for infant botulism, Pediatric basics 76, (1996).
4. National Family Health Survey-2 (2006); HPS Mumbai, Ministry of Health and family welfare, Govi. of India.
'120'

FNDHM/Poster/2
Dietary Practices and Knowledge System about Health Care, Hygiene, Morbidity Patterns AndSuperstition of It'ibal Children: A Case Study of Koraput, Orissa
Sunita Mishra
Dean & Head, Babasaheb Bhimrao Ambedkar University
(A Central University), Lucknow (UP)
[email protected]/[email protected] (09415228811)
The tribal Children constitute about half of total tribal population. The present study was undertaken on a
group of 209 school going children between the age group of 6-14 years. Keeping in view the backwardness of
the tribal population, in the present study, attempt has been made to assess the prevalence of malnutrition,
hygiene, dietary practices and health related problem among the school going children of tribal community of
Koraput district. The objective of the study is to assess the health profile, knowledge, attitudes and practices
(KAP) regarding nutrients and hygiene, intake of tribal school going children of Koraput district of Orissa, to
impart nutritional education to the children of target group. A rapid survey was undertaken to investigate the
extent of the problem of tribal children. All subjects were surveyed for their health, hygiene, dietary intake, and
anthropometry. A pre tested questionnaire was used. The data on dietary intakes of children were obtained
from their mother and child's age was recorded from the school records. The questions were divided into five
sections; Family and general demographic information, Anthropometric information. Dietary intakes, other health
related knowledge and practices.. Data were collected with the cooperation of school authorities. It was observed
that 48 percent of children were malnourished. 12.5% children had angular stomatitis, 34% of fathers were
working as labourers. Dry and rough skin was found in 28.5% children.
FNDHM/Poster/3
Nutritional Status and its Implications on Health: A Prevalence Study on BPO Workers of Kolkata
Neha Rai Surana' & Indrani Biswas^
1. Ex-sluden(s, M.Sc in Composite Home Science,
Dept. of Home Science, Kolkata (West Bengal)
2. Lecturer, Dept. of Home Science,
J. D. Birla Institute, Kolkata (We.st Bengal)
indrani 1111 ©yahoo.co.in (9831655976)
Over the last 40 years, major changes have taken place in the workplace. The growth in the use of
information technology at work, the globalization of many industries, organizational restructuring, changes in
work contracts and work time scheduling have radically transformed the nature of work in many organizations
which in turn have led to lot of lifestyle disease majorly the non communicable diseases (NCDs). The presentstudy discusses the impact of these workplace transitions on the nutritional status of BPO workers and its
implications on their health. 70 customer care executives working in different BPO organizations in the city of
Kolkata were interviewed by the questionnaire method. The study showed that the prevalence of obesity,
overweight, central adiposity - all risk factors for lifestyle diseases & non communicable diseases (NCDs) wasnegligible among the employees irrespective of the stressful work pattern. The nutritional intake when lookedinto was found to be inadequate in both male and female respondents. Though no major findings came acrossduring the study but the very high prevalence of non communicable disease (NCD) risk factors in an industrialproductive population shows an urgent need to initiate lifestyle modification and nutrition and health promotionprograms in industries to curtail the rising epidemic of non communicable disease.
121

FNDHM/Poster/5
Dietary Factors and Vulnerable Population for Gallbladder Diseases |Neelam Kumari', A. S. Khare^
1. Senior Lecturer, Dept. of Nutrition,
Isabella Thobum College, Lucknow (UP)
[email protected] 09415514214286
2. Ex-student, Dept. of Nutrition
Isabella Thobum College, Lucknow (UP)
Gallbladder disease prevalence is increasing in developing as well as in developed countries. Women are
more prone in comparison to men in both the developing as well as developed countries. The aforementioned
epidemiology of gallstones needs a thorough study of the etiological or the predisposing factors responsible for
the high prevalence of the gallstones in urban community. Present study has been conducted to observe the
dietary factors among subjects, and to identify the at-risk groups of the population regarding gallbladder diseases.
A cross sectional random sampling was carried out to select the study population from a multi-specialty hospital
.The information regarding disease history was collected through pre-tested, pre-designed Que.stionnaire cum
Interview Schedule. Results revealed that the prevalence of gallstone was highest in the age group of 40-50
(28%) and lowest in the age group of 60-70 (4%). Then present with decreasing order in the age of 50-60>20-
30>30-40 (26%, 22%, 20%) respectively. Non-vegetarians, obese, female, middle income groups were found
to be more prone to cholelithiasis(X2 s= 4.2583).The study concluded that eating habit ,higher BMl, consumption
of non-vegetarian food and high fat food are important risk factors for gallbladder diseases. Furthermoredetailed investigations may be done in the above mentioned area.
FNDHM/Poster/6
Value Added Ethnic Weaning Food ofMadhya Pradesh - A Systematic Approach to Attain Nutrittonal'Security jMeera Vaidya', Alpana Singh^ &. Varuna Singh^1. Professor, Food & Nutrition. Govt. M H College of Home Science and Science for Women
(Autonomous), Jabaipur (MP)
meera.vaidya® yahoo.co.in (09826195496)
2. Asst. Proffessor, Food Science & Technology, Jawahar Lai Nehru Krishi Vishwavidyalaya(Jnkvv), Jabaipur (MP)
[email protected] (09826342202)
3. Student, Food & Nutrition, Govt. M H College of Home Science and Science for Women(Autonomous), Jabaipur (MP)
[email protected] (09453436323)
Attainment of nutritional security is going to be the biggest challenge for the country. The problem of
malnutrition and under nutrition of weaning children is admittedly of alarming nature & dimensions. The
significance of ethnic weaning foods to meet the nutritional needs of children is well recognised. Hence aneffort was made to develop value added weaning foods for vulnerable group. Five popular ethnic weaning
foods chapatti, pej, panjiri, sattu & vermicelli were enriched with malted lentil, sesame and carrot powder.Organoleptically these products were well occupated with 15-20 malted lentil flour and 5% both sesame and
carrot powder supplementation. Quite good amount of protein (13.09 to 18.72), Carbohydrates (28.58 - 69.32),
ash (2.18 - 3.92%), energy (340.60 - 416.00 Kcal/100 g.), phosphorous (205.00 - 354.00 mg./lOOg.), calcium
(96.00 - 160.00 mg./IOOg.), iron (4.00 - 9.00 mg./100g.). Zinc (3.54-5.70 mg./lOOg.) and higher amount of P-
carotene (160-354 ?g./100g.) content were present in improved weaning foods. The.se food products with
imposed quality characteristic such as nutrition, easily chewable and digestible would greatly contribute better
nutrition to vulnerable population and suggested to be taken up as an educational tool for on going nutrition
intervention programme for mass popularization and public sensitization.
122.

FNDHM/Poster/7
Comparative Study ofFood Pattern ofWorking Women among Different Income Groups
KumKum Kumari' & Arvind Kumar Sharma-
1. Lecturer, P G Dept. of Home Science, J D Women's College, Patna (Bihar)
[email protected] (09431074229)
2. Liaison Officer, T.M.B.U., Dept. of H.R.D. (H.E.), Patna (Bihar)
[email protected] (09431011564)
This paper deals with the comparative study of food pattern among working women of three income
groups (i.e. high, middle and low). 225working women were selected from five wards under Patna Municipal
Corporation (PMC) through stratified sampling random method for the study. 24 hours recall method was used
to study the meal pattern of the sample women. The analysis revealed that consumption of beverages, fruit
juice, milk, horlicks, etc was highest among high income group followed by medium and low income group
women. Similarly there was positive correlation between income and preparation of food according to meal
planning, taking meal at par with men, consumption of fruits, milk products, coffee. Jam / jelly and canned food
and salad. Consumption of pickles, tea was prevalent equally among women of all income groups. The dietary
pattern and nutrient intake seemed to improve with the rise in economic status of the working women.
FNDHM/Poster/10
Quality Evaluation of Splnilina Based ̂ Khakra'
Vandita Sharmn', Ruma Saha-, Mamta Singh^ & Vimla DukwaP
1. PQ Scholar, Dept. of Food & Nutrition, College of Home Science, SKRAU, Bikaner (Rajasthan)
2. Senior Research Fellow, Dept. of Food & Nutrition, College of Home Science,
SKRAU, Bikaner (Rajasthan)
[email protected] (09414963355)
3. Guest faculty. Dept. of Food & Nutrition, College of Home Science, SKRAU, Bikaner
4. Assistant Profe.ssor, Dept. of Food & Nutrition, College of Home Science,
SKRAU, Bikaner (Rajasthan)
[email protected],[email protected]
Khakra is a form of dried thin spicy chapatti. Spirulina is a nutrient rich super food for super health.
Super foods can be defined as foods that have health promoting benefits and disease preventing properties over
and above their usual nutritional value. Spirulina have many therapeutic properties such as hypocholestrolemic,
immunological, antiviral and antiglutagenic effects. The present study was undertaken to assess the nutritional
composition of spirulina powder, to develop value added products and their nutritional analysis and to study the
effect of storage on value added products using spirulina. Value added khakra were prepared by using wheat
flour, Bengal gram flour, oil, salt, red chili powder, coriander seeds (dry), water for making dough and 10 per
cent level of spirulina powder. The mean score for sensory evaluation of developed and control sample ofkhakra were 7.9 and 7.6 respectively on nine point hedonic ranking scale. The developed value added khakra
contained 21.10 per cent moisture, 25.6g protein, 11.95g fat, 2.92g crude fiber, 4.25g ash, 33.18 g carbohydrateand 346.67 kcal energy per lOOg on dry weight basis whereas control sample contains 21.8 per cent moisture,19.6g protein, 12.12g fat, 2.45g crude fiber, 3.85g ash, 40.18g carbohydrate and348.2 kcal energy per lOOg ondry weight basis. In developed samples a-carotene, vitamin c, iron and potassium content were observed1226.08 |ig/100g, 0.48 mg/lOOg, 19.45 mg/lOOg and 947.5 mg/lOOg respectively while in control sample A-carotene iron and potassium content were observed 202.50 pg/100g,l 1.95 mg/lOOg, 877.5 mg/lOOg respectively.Thus, better quality of value added khakra brings considerable advantages among the community
123

iiia
ET^fDHM/Poster/11
Development of Value Added Products from Nutricereals and the ERect of Packaging and Storageon their Shelf Life
Anjali Dewan
Head, Dept. of Home Science, St. Bede's College, Shimla (Himachal Pradesh)
[email protected] (09816116652)
In the shelf life study of value added products developed out of nutricereals stored in different packaging
for varying period, the microblal quality of developed products like improved flour of wheat. Quality protein
maize dalia. Quality protein maize processed flour and Health mix Super was tested for total viable count. The
products were studied for bacterial, fungal, Aciinomycetes and E.CoU colony count. Absence of fungus and
Actinomycetes coXoTats improved the shelf life of the products as both are major decomposers of food products.
Bacterial colonies were observed during the experimental period. It ranged from 2 to 21 TVC/ml/g in improved
flour of wheat, 2 to 22 TVC/ml/g in Quality Protein Maize dalia and 2 to 22 TVC/ml/g in Quality Protein Maize
Processed flour and 3 to 25 TVC/ml/g in Health Mix super at 10"® dilution in the different packaging for varying
periods of storage. Vacuum packaging samples showed that lowest counts while highest counts were observed
in earthenware pack samples.
FNDHM/Poster/12
Mahrashtrian Snacks: Traditional Rice Delight
Wasnik B B', Deshpande A A^. Gulhane S. V?
1. Assistant Professor. Dept of Home Economics
Mahila Mahavlcllaya Amaravati (Maharashtra)
[email protected] (9527408303)
Our health depends on what we eat daily. The ever growing menace of 'easy way out' has become the
mantra of life for more and more people today. Desire to have a break from traditionally home cooked food has
created a great market for readymade foods or 'junk food'. It is a kind of eatable with very less or no nutritive
value, overdone with fat, sugar, sodium and a few chemicals, just crunching hunger and leading to serious
health problems. The junk food has entered the Tiffin box replacing traditional snacks. The changed life-style,time paucity. Media etc. has lead to the McDowell culture discarding nutritious traditional snacks. The situationis truly alarming and needs attention. The solution for nutritional drain lies in our age-old tested recipes. India
has many different styles, diversified multi-cuisine that varies from region to region and are absolutely Hp
smacking. The present study was designed to document, standardize, enrich, simplify and assess the Nutritivevalue and cost of the Maharashtrian customary snacks prepared from rice, superseded in the modern era The
documented dish Dadpe Pohe and Ubje are good nutritive snacks, cost-effective, time and energy saving andis an universal snack as the ingredients used are easily available in any region.
124

FNDHM/Poster/13
Enhancing Availability ofVegetables in Diet through Nutritional Kitchen Gardening: A Study onIVibalofMP
Ncclu Vishwakarma', Ajay Khare- & Gayath V Singh'
1. Subject Matter Specialist, Krishi Vigyan Kendra, Mandla, JNKVV. Jabbalpur (MP)
neelu_vis]i\[email protected]. [email protected] (09425801341)
2. Programme Coordinator, Kri.shi Vigyan Kendra, Mandla. JNKVV, Jabalpur (MP) ror.jMST Jh3. Senior Lecturer, Amity Institute of Biotechnology, AUUP, Noida
Nutritional Kitchen gardens, employing traditional land-use systems but underutilized production systems, are
the major sources for supplying such diversified food. These are also rich in species diversity. Many uncultivated and
underutilized species supplying dietary diversity and micro-nutrients are found in such kitchen gardens. Baseline study
carried out in four ecologically and socio-economically diverse sites of Nepal revealed that contribution of fruit and
vegetables to the total meal of a household is about 44%. Home gardens supply 60% of the household's total fruit and
vegetable consumption. Yet, these gardens are not fully developed in structure and function to maximize their potential in
catering to demands of households. To identify the actual gap in supply of different nutrition-rich species in Nutritional
Kitchen gardens, nutritional calendars were developed for each season, family and nutritional requirement. Baseline
survey and situation analysis of Front line demonstration have come up with an inventory of plant species available in
home gardens. The availability of different nutrients from the species grown in the home gardens were estimated through
literature review. Distribution of the improved variety of vegetables seeds over the year. Nutritional calendars were
derived from the data on nutrition availability and distribution of the vegetables. Nutritional calendar provided the basic
information on the status of Kitchen gardens with respect to the availability of diversified diets in different agro-ecology
and socio-economic settings. Nutritional gap analysis, farmers' demand and ecological suitability are the basis to determine
the composition of diversity kits for improved Kitchen gardens. Awareness raising, local food diversification and promotion
of diversity kits in Kitchen gardens are important strategies for improving family nutrition of rural poor households.
FNDHM/Poster/16
An Appraisal of Noon Meal Programme in Tamil Nadu
S Premakumari
Professor and Head, Dept. of Food Science & Nutrition,
Avinashiligam University for Women, Coimbatore (Tamil Nadu)
[email protected] (09443140390)
The problem of malnutrition affects not only the health of children, but also their attendance and performance
in schools. As one of the strategies to combat malnutrition among school children, the government of Tamil
Nadu adopted the noon meal programme on P' July 1982. Under this programme 120 million children in twoage categories (5-9 yrs and 10-15 yrs) are receiving a meal supplying 500kcal and 15 g protein per meal. An
evaluation of this programme was carried out in eight schools in three disoicts of Tamil Nadu namely Tiruchirapalli,
Thanjavur and Coimbatore. All the school meal beneficiaries (No. 3479) and 50 per cent of the non beneficiaries
(No. 1634) were selected and their height and weight were recorded. Details on the quantity of food servedthrough the school meal programme were collected and the nutrient content of the meal was calculated. The
mean height and weight of all the beneficiary and non beneficiary male and female children was less than thatof the NCHS standards. Inclusion of more vegetables and greens is required to meet the gross deficiency ofmicronutrients. Use of precooked fortified rice as a measure to save fuel and labour will be a boon to fight the
long standing problem of micronutrient deficiency among growing children.
125

FNDHM/Poster/19
Influence of Changing Food Pattern on Childhood Obesity in the Cities: Jodhpur and Kolkata
Dr. Raka Srivastava' & Prachcc Bald^
1. Head and Assistant Professor, Dept. of Home Science,
Jai Narain Vyas University, Jodhpur (Rajasthan)
2. Research Scholar, Foods & Nutrition, Jai Narain Vyas University,
Jodhpur (Rajasthan)
funkyprachee@gmaiLcom (09414915639)
•Ti
A study on prevalence of childhood obesity in relation to food preferences was carried out in the cities of
Jodhpur and Kolkata. A total of 120 subjects in the age group of 9-12 years of both the .sexes were purposively
selected for the study. The prevalence of obesity was assessed by BMI and the food frequency questionnaire
was developed to take note of the food preferences and pattern. Comparison of BMI and age among Jodhpur
and Kolkata boys indicated no significant difference at the ages of 9 and 12 years but significant difference was
observed for the 11 and 12 year olds. The trend changed with the girls of the two cities where there was no
significant difference between the BMI and age of the girls aged 9,10 and 12 years but at the age of 11 years
significant difference was found. The major contributors of obesity were found to be the irregular dietary
pattern with an enormous intake of "empty calorie" and rich food containing low nutritive portions like fried
foods, fast foods, sweets and cola. The prevalence and food pattem contributing to obesity in children remained
the same irrespective of the cities and sexes, as all the subjects enrolled belonged to the affluent segment of the
society, although, there being a difference in their choice of food items.
112^

''Books are the carriers of civilization.
Without books, history is silent,
literature dumb, science crippled,
thought and speculation at a standstill. "

1
"A room without books
is like a body without a soul. "

FAMILY RESOURCE MANAGEMENT
(Oral & Poster Presentation)


FRM/Orai/1
Utilization ofAbilities of Elders in the Changed Social Context
Sandhya Madhukar Rotkar' & S Y Waghmare-
1. Reader & Head of the Dept. of Home Science,
JES College, Jalna (Maharashtra)
[email protected] and [email protected] (973052684S)
2. Head of the Dept. of Home Science, Smi. Dankunwar Mahila Mahavidyalay,
Jalna (Maharashtra)
ABSTRACT
In view of the alarming increase in the population of the elderly persons about 77 millions
in 2007 and possibility of further increase, the problem of aging needs immediate attention.
Indian culture insists on gracefid treatment to elderly and regards them as a valuable human
resource. Our traditional "extended family for "provided them protection and a strong
psychological support. In such traditional societies the seniors enjoyed unparallel sense of
honor. With the explosion in the transmission of Scientific & technological knowledge and
advent of materialist western culture, the Indian societies started experiencing micro &
macro structural changes in its forms and functions. It is passing through the transitoryphase from "extended family based society "to "nuclear family based society". Althoughthe structure ofJoint family is till wide spread and the sentiments ofjoint-ness continues to
be stronger, the intrinsic psycho structure of the family is being disturbed. It is high time nowthat we should change our approach towards elderly. If we utilize properly their wisdom,
experience and expertise, they will not be a burden to the family. This paper intends to
examine the role of the elders in the new changing context.
INTRODUCTION
In view of the alarming increase in population of the elderly persons, about 77 millions in 2007 and possibility ofits further increase which is likely to be doubled in 2026, the problem of aging needs immediate attention.
Indian Culture insists on graceful treatment to the elderly. They should be considered as a valuable human
resource and their reach experience; residual capacities should be put to optimum use for the benefit of the
Society at large.
It was the primary responsibility of the traditional joint families to protect its dependant members like elderly anddisabled and provide them a strong psychological support.
Particularly, the aged in the traditional societies enjoyed unparallel sense of honor, legitimate authority in family,had decision-making responsibilities and were treated as repositories of experience and wisdom.
With the explosion in the transmission of scientific and technological knowledge and advent of western culture,the Indian societies started experiencing micro & macro structural changes in its forms and functions.
It is passing through the transitory phase from "Extended or Joint Family based society" to "Nuclear Familybased Society". Fortunately the ace of this transition seems to be slow and Family jointness still continuous to bea major sociological phenomenon in the Indian Social structure.
In spite the acceptance of modem technology and the cognitive elements of western culture such as individualismand democracy, the Indian mind seems to be reluctant to abandon the concept of "Joint Family".
Although the structure of Joint Family is still wide spread and the sentiment of joint-ness continuous to bestronger, the intrinsic psycho structure of the family is being disturbed.
In modern materialistic society where usefulness is measured by the economic yardstick the aged are being
regarded as liability.
129

This has seriously affected their status marked by a shift in their position from active participation to passivemembership in the family resulting in their moral degradation.
This is the matter of concern to all the Social activists confronting with the problems of aged.
It is a high time now that we should change our approach towards the elderly. If we utilize properly the fund ofknowledge they have by virtue of their long experience, maturity and wisdom, they will not be a burden. On thecontrary, their valuable guidance, nurturing and educating the family children, participating in housework andsharing various responsibilities should be regarded as significant resources.
AIMS & OBJECTIVES
This paper aims at identifying the qualities and abilities of elder persons and judges their relevance in thechanging social context.
It also intends to discover latent forces responsible for creating Family disturbances.
Conforming to the above purpose, following objectives were in view.
1. To identify the useful services rendered by the elders.
2. To Judge their relevance in the changed social context.
3. To find out the factors responsible for creating inter generational gaps.
4. To examine whether there is any co-relation between the factors like education, age and the approach ofthe elders towards their Families.
5. To know the reasons for the conflicts and psycho disturbances in the familie.s if any.
6. To suggest proper policies for encouraging the active role of the seniors.
■
MATERIALS & METHODS
A group of 156 Senior Citizens (above 60 Yearsof age)of Aurangabad City in Maharashtra coming from lowermiddle income Families was randomly chosen for detailed enquiry.
The Group consisted of 87 male and 69 Female members.
Each member was interviewed with the help of a questionnaire for eliciting the reliable information pertaining tothe objective of the study.
The data thus collected was systematically processed and analyzed to arrive at proper conclusions.
RESULTS & DISCUSSIONS
The observations of this study have been presented in the following tables.
Table 1 shows the education level of the sample elders. Illiteracy is conspicuously absent. Except 11 females(16%) almost all the members have crossed the primary level. Majority of the Female members (nos. 53 i.e.61%) are graduates followed by those who have attended Secondary standard (nos.20 i.e. 23%). Majority ofladies (nos. 42 i.e. 60.9%) are Matriculate. 14 Ladies (20.3%) have done their Post Graduation. 14 Males(16.1%) and 2 Females (2.8%) are Post Graduate.
Table 2 depicts economic status. 67 male members (77%) and 13 Female members (18.9%) are pensionearners. Other income sources are insignificant.
Table3: indicates the range of age. Majority of members fall in the range of 60 to 75 years.Table 4; shows activities performed by the elders. 70 males (80.4%) and 12 Females (17.4%) guide the youngermembers. The most important Job of educating, disciplining and providing strong moral support is performed byalmost all the Grand Parents. The information also reflects that the seniors actively participate in sharingdomestic work, businesses and financial responsibilities. 15 males (17.2%) and 7 Females (10.2%) showsactive interest in social work.
Table 5 reveals number of activities performed by the sample members. Everyone seems to perform at least 2activities. Majority of male members (41 i.e. 47%) perform as many as 4 activities, followed by 54 Femalemember.s doing 2 jobs. 10 Men (11.5%) and one woman (1.4%) get themselves busy in more than 4 activities.
130

Table 6 data about stresses and strains are given from the Table; it becomes evident that main reason for
psychological disturbances affecting seniors is generation gap. 17male (19.6%) and 34 Female members (49.1%)
are sufferers of inter generational disturbances.
Table 7 reflects health problems of elders. According to the Table, a makeable number of seniors. 70 males
(80.4%) and 58 Females (84%) have the trouble of vision loss. 44 men (50.6%) and 30 women (43.4%) suffers
from asthmatic troubles. The informants also reported about other physical and mental disorders like heart
problem, Parkinson's disease, Alzheimer's disease and mental stress.
Table 1: Educational Level of Elders
SI. Education Level Males (87) Females (69)
No. No. Percentage (%) No. Percentage (%)
1 Illiterate - - - -
2 Primary - - 11 16
3 Secondary 20 23 42 60.9
4 Graduate 53 61 14 20.3
5 Post Graduate 14 16 02 2.8
Table 2: Economic Status of Elders
SI. Source of Income Males (87) Females (69)
No. No. Percentage {%) No. Percentage (%)
1 Family Pensions 67 11 13 18.9
2 Business 3 3.5 - -
3 Agriculture - - - -
4 Hou.se Rent 7 8 - -
5 Interest 2 2.3 4 5.8
6 No Source of Income 8 9.2 52 75.4
Ibblc 3: Range of Age
SI. Range of Age Males (87) Females (69)
No. No. Percentage (%) No. Percentage (%)
1 60 to 65 58 66.6 49 71
2 65 to 75 25 28.7 19 27.5
3 75 to 80 03 3.5 01 1.4
4 Above 80 01 1.1-
Table 4: Activities Performed by the Ciders
SI.
No.
Activities Males (87) Females (69)
No. Percentage (%) No. Percentage (%)
1 Guide the young 70 80.4 12 17.4
2 Disciplining & providing moral
.support to grand children 81 93.1 10 14.5
3 Taking care of grand children
cleanliness, diet, rest & sleep 12 13.8 58 84
4 Teaching & helping in grand children studies 75 86.2 7 10.2
5 Participating in domestic/liousc work 27 31 64 93
6 Sharing business & other responsibilities of Family 13 15 - -
7 Share the financial burden to the possible extent 53 60 03 4.2
8 Social Work 15 17.2 07 10.2
9 Others- - - -
131

Ibble 5: No of Activities performed by the Elders
SI.
No.
Number of Activities Males (87) Females (69)
Performed No. Percentage (%) No. Percentage (%)
1 One - - - -
2 Two 20 23 54 78.2
3 Three 16 18.4 10 14.5
4 Four 41 47 04 5.8
5 More than Four 10 11.5 01 1.4
Table 6: Stresses and strains in the Joint Families
SI. Reason for Stress No of elders disturbed
No. & Strain Males (87) Females (69)
No. Percentage (%) No. Percentage (%)
I Family members behaves in
insulting manor 10 11.5 14 20.3
2 Physical disorder 10 11.5 12 17.4
3 Physical dependency- -
- -
4 Economic dependency 8 9.2 47 68
5 Generation Gap 17 19.6 34 49.1
Table 7: Health Problems
SI. Health disorders Males (87) Females (69)
No. No. Percentage {%) No. Percentage (%)
1 Psychological stress 10 11.5 12 17.4
2 Alzheimer's disease 3 3.5 19 27.5
3 Parkinson's disease I 1.1 I 1.4
4 Heart problems 13 15 11 16
5 Asthmatic trouble 44 50.6 30 43,4
6 Vision Loss 70 80.4 58 84
CONCLUSIONS
On the basis of the information collected, following inferences can be arrived at....
a) Almost all the sample seniors seem to be thoughtful, holding liberal views and prepare to adjust with all
odds.
b) Barring few exceptions, they exhibit positive attitude while compromising with the other family members to
avoid the conflicts.
c) Few informants have reported incidence of family disagreement mainly arising out of egos of certain
members disturbing their mental peace.
d) Quarrels between mothers & daughters- in-law have been reported to be the prominent factor responsible
for breaking the quite families.
e) All informants want to keep themselves actively and constructively engaged. They specially preferred to
perform various duties relating to the family children from educating them to giving them moral support.
f) They do other family Jobs also with equal enthusiasm.
132

With the advancing age, their ardent zeal gradually goes on declining and they start facing certain physical and
mental disorders, resulting in the weakening of their abilities.
RECOMMENDATIONS
Rise in the incidence of break-ups of families due to intergenerational conflicts resulting in the degradation of
elders is a concern of all.
While suggesting measures for graceful and peaceful leaving of elders one cannot forget complex city of the
problem. It relates with the tender inter relationship involving emotional bonds.
The genesis of most of the problem concerning to seniors, being socio-cultural, solutions too have to be soughtin the wider social milieu.
It is evident that the elders need moral and emotional support, which they get in "togetherness". They want toleave in family environment where bonds of attachments are many fold and the emotional universe in whichthey can move is vast.
Confirming to the inferences drawn, following measures can be suggested.1. Family counseling centre formulated by the Indian Government can play a crucial role in strengthening the
social fabric by preventing families from breaking up.
2. Considering the complex emotional nature of the issue, solutions cannot be found in legal measures or any
other type of compulsions.
3. Providing financial assistance to aged is not enough. They need moral and emotional support from theirkin's.
4. The elders themselves also can play a very important role in consolidating the family and social structure.They should not undermine themselves. They should awaken their inner soul and recognize their ownpotential for the benefit of entire mankind.
5. Last but not least, according to our ancient philosophy, which advocates four ASHRAMS, the elders withspiritual awakening can accept and bring in practice, the concept of "WANPRASTHA", and reduceattachment to family and wealth that are the main culprits causing family disintegration.
REFERENCES
1. Bhartiya A K. The Aged in India- Policies & Programme, Social Welfare, Sept. 2008.
2. Dak & Sharma, Ageing in India. Ajanla Publishing. New Delhi (1987).
3. Agrawal K, An Experiment of Happy Ageing. Social Welfare. Oct. 2006, pp. 39-40.
4. Patil P, Safe Ageing. Social welfare. October, 2008, pp. 35.
5. Dube A. K., Nutrition Aging. Nutrition ICMR, Hyderabad, 33 (3) (1999), pp. 22.
6. Khan M Z , Elderly in Metropolis, Inter India Publications, New Delhi, 1997.
7. Kaur, Grover and Agrawal, Socio Economic Profile ofthe Rural Aged, Ajanta, Publishing, New Delhi, 1987.
8. Singh Y, Modernization ofIndian Tradition 1994, pp. 177.
133

FRM/OnU/2
Micro Level Study of Ozone Centrifugal Aerated Technology in Treating the Sewage Water
Lakshmi Priya A' & Chltra Prakash -
1. Lecturer, Interior Design and Decoration Dept.. Justice Basheer Ahmed Sayeed College
for Women (A N Session) (Chennai)
lakshmi 16priya@yahoo,CO.In (9994111344)
2. Reader. Resource Management Dept.,
Avinashlingam University. Colmbatore (Tamilnadu)
ABSTRACT
Fresh water resources are considered as vital life-giving and life supporting constituents.
Resource Management, a specialized course of study in Home Science, focuses water resource
since it has been one of the challenging priority areas of research gaining national
significance. The investigator with keen interest in attempting to study the pollutants affecting
the major surface water reservoir, the Singanallur Lake the water source and the effect of
Ozone treatment in rejuvenating the water body, designed a research .study entitled "Micro
Level Study of Ozone Centrifugal Aerated Technology in Treating Sewage Water" with the
following objectives to find out the nature and extent of pollutants present in the water and
to find out the efficiency of Ozone treatment in treating sewage water. The water samples
from the canal and nearby bore well were taken and analyzed. The polluted water was
subjected ozone treatment. It was found that the surface water and bore welt water analysis
reported the presence of pollutants (TDS, TSS, BOD, COD, Nitrate, TPC and Nitrate) above
the prescribed water standards. The ozone treatment significantly decrea.sed the TDS, TSS,
BOD and COD. The ozone treatment further improved the quality of water by increa.sed the
DO level. By further increasing the percentage of ozone and aeration lime the values can be
brought to nil. Ozone is the only environmentally friendly and completely ecological n'£/_y to
produce a healthy chemical free environment in an economical and efficient way.
INTRODUCTION
Water plays a versatile role in the functioning of the biosphere. Life and water have a very close relation andare inseparable. Water resources hold the key for socio-economic development of any country. Fresh water
resources are considered as vital life-giving and life supporting constituents.
AIMS & OBJECTIVES
Home Science Education aims at a healthier, happier and richer family and community life. Resource
Management, a specialized course of study in Home Science, focuses on resource use, augmentation, conservationand management with a futuristic vision to enrich the quality of life of people. Water being the basic resourcefor all human activities has been one of the challengingpriority areas of research gaining national significance.
There has been no in depth study conducted so far to base any planned developmental project in the wake ofhigh concern on the sewage water polluting the major surface water reservoir, the Singanallur Lake. Hence, theinvestigator with keen interest in attempting to study the pollutants affecting the water source and the effect ofOzone treatment in rejuvenating the water body, designed a research study entitled "Micro Level Study ofOzone Centrifugal Aerated Technology in Treating Sewage Water" with the following objectives to;
1. Find out the nature and extent of pollutants present in the water.
2. Find out the efficiency of Ozone treatment in treating sewage water
134

MATERIALS & METHODS
Singanallur Lake has a place in the hearts and minds of all the people who resided along the banks. Thisemotional link needs to be recognized. The effort is to see the lake as an ecological entity with special effortrelated to quality of water. The design formulated for the study consisted of the following main phases.
Water Quality Analysis and Ozone TYeatment of the Selected Water Samples
The standards for water quality by no means are static; they are constantly under review in the light of newknowledge. The analysis required for water samples on the intended use should meet certain quality criteria,with respect to appearance, potability, health and toxicity. These criteria are established by health regulatingagencies to ensure that the water quality in a resource is suitable for the proposed use.
Water quality of natural resources has deteriorated to a very great extent. Modem civilization with its rapidincrease in population and industrialization has led to an accelerated degradation of the fresh water systemssays, Kumar (2004). Rivers and lakes have been used as grounds for dumping human sewage and industrial
wastes of every conceivable kind, many of them being highly toxic. In order to study the extent of pollution
and the possibility to treat the sewage water, samples were collected, analyzed and the methodology of the
study followed is presented in Figure 1
Bore Well Water
Samples
5 bore wells
for 5 days.
Water samples
for Ozone
5 stations
for 4 months
Surface water
Samples
5 litres of water
for five days
Parameters analyzed:*TDS. TSS, BOD, COD,Nitrate and TPC
Parameters analyzed :*
Colour, odour, turbidity, pH, EC,
TDS, TSS, COD, BOD, DO, Sulphate,
Ca, Mg, Phosphate, nitrate, TPC,
Water Quality Analysis and Ozone Treatment
of the Selected Water Samples
Electrical Conductivity (EC), Total Dissolved Solids (TDS), Total Suspended Solids (TSS), Total
Hardness (TH). Biochemical Oxygen Demand (BOD), Chemical Oxygen Demand (COD), Dissolved
Oxygen (DO), calcium (Ca), magnesium (Mg), Total Plate Count (TPC) and Escherichia Coli (.E.coli)
Fig 1: Design of the Study
It is difficult to obtain a representative sample of a heterogeneous and variable material such as wastewater.
In order to find out the pollutants present in the water draining into the lake, water samples were collected
from five specific areas (for four Months) by grab sampling method (Mettupalayam Road. Sathyamangalam
Road, Avinashi Road. Trichy Road, Singanallur).
RESULTS & DISCUSSION
The outcome of the analysis of the selected water samples before draining into Singanallur Lake are discussedunder the following headings:
1. Result of the analysis of the selected water samples
May month sample recorded te highest mean TDS level (1250 mg/I) and April, the least mean TDS level(700 mg/1).
135
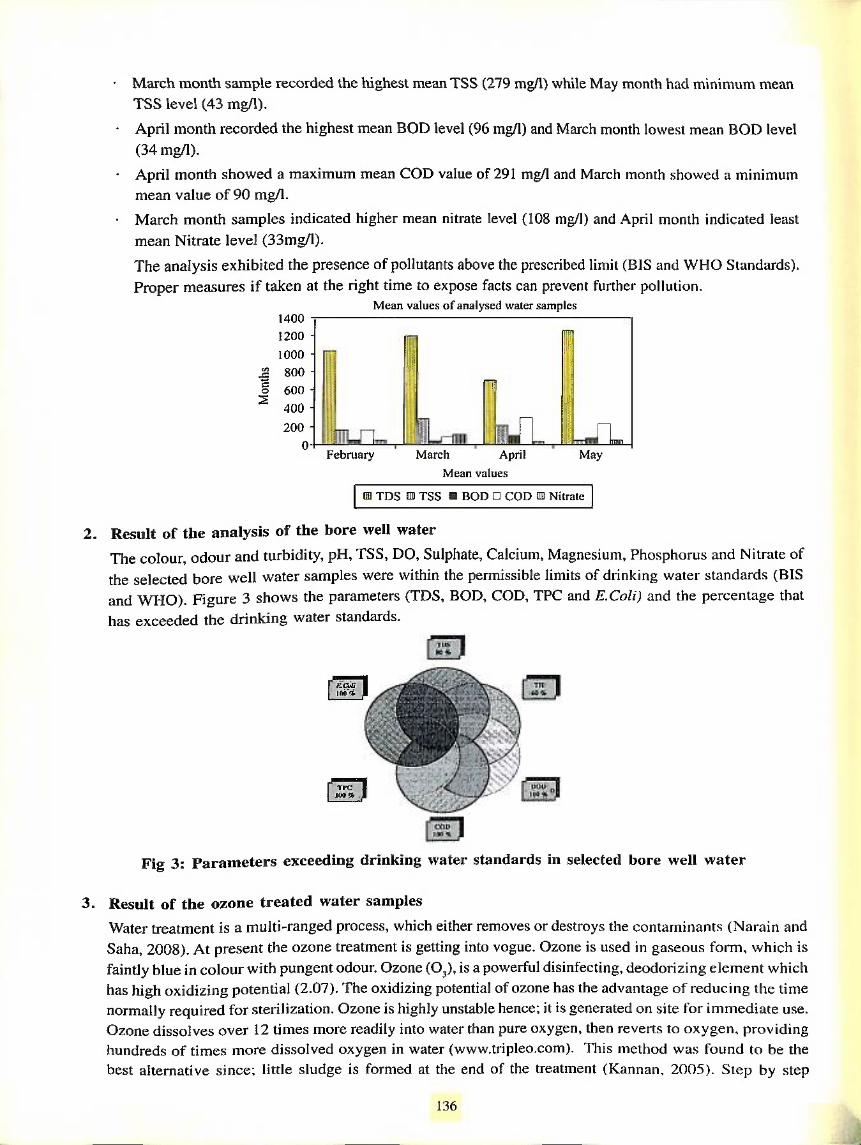
March month sample recorded the highest mean TSS (279 mgA) while May month had minimum mean
TSS level (43 mgA).
April month recorded the highest mean BOD level (96 mgA) and March month lowest mean BOD level
(34 mgA).
April month showed a maximum mean COD value of 291 mgA and March month .showed a minimum
mean value of 90 mgA.
March month samples indicated higher mean nitrate level (108 mgA) and April month indicated least
mean Nitrate level (33mg/l).
The analysis exhibited the presence of pollutants above the prescribed limit (BIS and WHO Standards).
Proper measures if taken at the right time to expose facts can prevent further pollution.Mean values of analysed waler samples
1400 -j1200 -
1000 •
i/i 800
§ 600 •
400 •
200 -
0-1 IIJLFebruary March April
Mean values
May
CD TDS o TSS n BOD □ COD Hi Nitrate
Result of the analysis of the bore well waterThe colour, odour and turbidity, pH, TSS, DO, Sulphate, Calcium, Magnesium, Phosphorus and Nitrate ofthe selected bore well water samples were within the permissible limits of drinking water standards (BISand WHO). Figure 3 shows the parameters (TDS, BOD, COD, TPC and E.Coli) and the percentage thathas exceeded the drinking water standards.
RCalJino.%.
COD
Fig 3: Parameters exceeding drinking water standards in selected bore well water
3. Result of the ozone treated water samplesWater treatment is a multi-ranged process, which either removes or destroys the contaminants (Narain andSaha, 2008). At present the ozone treatment is getting into vogue. Ozone is used in ga.seous form, which isfaintly blue in colour with pungent odour. Ozone (O,), is a powerful disinfecting, deodorizing element whichhas high oxidizing potential (2.07). The oxidizing potential of ozone has the advantage of reducing the timenormally required for sterilization. Ozone is highly unstable hence; it is generated on site for immediate use.Ozone dissolves over 12 times more readily into water than pure oxygen, then reverts to oxygen, providinghundreds of times more dissolved oxygen in water (www.tripleo.com). This method was found to be thebest alternative since; little sludge is formed at the end of the treatment (Kannan. 2005). Step by step
136

Ozone 'frcatmcnt Process
Figure 4
process of the treatment procedure includes pre-ozonation, settling tank, activated carbon filtration, sand
filter, post-ozonation, activated carbon filtration, and sand filter.
4. Result of the analysis of the ozone treated water
The colour, odour, turbidity and EC of the selected water samples turned out to have agreeable after the
ozone treatment. The ozone treatment significantly decreased the TDS at I per cent level and TSS, BOD
and COD at 5 per cent level and TH with no significance in the selected samples.
The ozone treatment further improved the quality of water and has significantly increased the DO level at
5 per cent level. The ozone treatment simultaneously has decreased the calcium and magnesium level at 1
per cent level. There is no significant difference between the phosphate and nitrate level in the water
samples before and after ozone treatment. The bacteriological tests for Total Plate Count and E-coIi showed
a level of Too Numerous to Counts (TNTC) before and after ozone treatment in the selected water samples.
These two parameters should be nil for potable water. By further increasing the percentage of ozone and
aeration time the values can be brought to nil.
It is necessary to allay the years that people associate with using recycled potable water. Reducing pollution
of water can bring measurable health gain, besides lengthening life expectancy.
Mean Values of Untreated and Ozone treatedwater samples
ctltium MtpoeslBoi
I Unlrcaicd wfllcrsiiniplcs q Treated ivaCer samples
Mean values of Untreated and Ozone treated water samples
TSS TH BOD
Parameters
I I UntTtaicd water samples O Treated water samples
A-..
'•,< \ . t>1 •M. . iBUl
137

5. Operating cost of ozone technology
TTie initial capital cost for the ozone plant is Rs 20,000/-. The operational cost is mainly towards powerconsumption by the equipment. The total approximate cost for ozone treatment for treating 25 litres ofpolluted water is Rs. 40 and six paise only (Rs. 40.06).
CONCLUSION
Ozone is the only environmentally friendly and completely ecological way to quit all the polluting factors, themicrobes and all pathogenic agents without producing toxic and dangerous scum, thus producing a healthychemical free environment in an economical and efficient way.
RECOMMENDATIONS
1. User friendly ozone treatment to be opted for a save environment right from the grass root level.
2. Government and Non Governmental organizations to take necessary steps to improvi.se and popularize the
ozone treatment process.
3. Implementation of legislation and regulations to prevent unauthorized dumping of solid and liquid waste intofresh water sources.
4. Research to be carried out at a large scale in treating the polluted water bodies by ozone treatment and
documenting and creating awareness on the benefits of ozone treatment
REFERENCES
1. Aninachalam R and Radhakri.shnan T, Status and concentfor natural resource management. Kurukshclra. 54 (6) (2006). pp. 42.
2. Jee C, Diwan P. Rao A. Ramakrishnaiah S Y B andVenmalh'i A, International Conference on WATER lND/A-4 ■ Water Rt-.ttnirces
Development. Vol. I & II, IniemationaJ Publications and Information Services. New Delhi, 2004. pp, 31 -32. 3.30-3.32.
3. Jeyanthi G P. Bhuvaneswari V and Hemaprabha. Quality evaluation of potable water on treatment with selected medicinal plantproducts. The Indian Journal of Nutrition and Dietetics, 41 (5) (2004). pp. 187-197.
4. Kannan ASK. Wastewater treatment by ozone. National Conference on Sustainable Development of Environment for FutureGeneration - Proceedings. 14"" and IS'" July. Department of Civil Engineering, Centre for Water and Environmental Studies,
Kumaraguru College of Technology. Coimbatore, Tamil Nadu, India, 2005, pp. 82 - 89.
5. Kumar A, A textbook of environmental science. APH Publishing Corporation. New Delhi. 2004. pp. 144-146, 150-15.3.
6. Narain S & Saha P. BIS standards for Drinking Water, Down to Earth, 17 (21) (2008), pp. 36.
138

FRM/Oral/4
Creating Awareness about Recycling of Kitchen Waste
Asha JyotI' & Sowmya L K-1. Selection Grade Lecturer in Home Science. Smt VHD Central
Institute of Home Science, Bangalore
[email protected] (09482394489, 9482394489)
2. Rcsetirch Scholar, Smt VHD Central Institute of
Home Science, Bangalore
ABSTRACT
Waste material is produced as a result of human activity. Over a period of time the quantity
of waste generated has grown significantly due to increasing population and consumerist
nature of the people. The objectives of the study were to gather information about the
different types and quantity of waste generated the methods of waste disposal, to create
awareness about recycling of bio-degradable waste. It hypothesized that the intervention
program has positive impact on the home makers. The research design was divided into twoparts. In the first part household survey wdi conducted to know the existing household
waste management practices before creating awareness and post survey to know the impact
of awareness programme. Interview schedule ivoj used on thirty families from Balepura
village of Devanahalli taluk. The vermicomposting technique was explained through posters,
lectures and demonstration. The major findings of the study are a majority of the familiesfollowed incineration method of waste disposal in the pre demonstration survey in comparison
to 83 percent of the families who .sorted their waste before disposal in the post demonstration.Throwing the waste outside the house was almost stopped and using dust bins and plasticcovers increased in the post awareness survey. Cent percent of the homemakers were selfmotivated, for sorting the waste before disposal and post awareness programme, 17 percentof the homemakers have started composting their waste. The percentage of the families whorecycle their waste increased from 26 percent to 53 percent in the post awareness survey.The waste way recycled into decoration items, cloth bags, mats, children's Bed. pillows etc.Thus, it can be concluded that, post awareness a small percentage of homemakers startedcomposting organic waste and using it for their kitchen garden and household plants.
INTRODUCTION
Waste is defined as any solid of semisolid, liquid or contaminated gaseous materials discarded from industrial,commercial, mining or Agricultural operations or community household activities. Rising quality of life, high rateof resource consumption patterns have had an unintended and negative impact on the environment. Generationof waste far beyond the handling capacities of the government agencies requires drastic measures. The currentemphasis on waste disposal is focused on the community and private sector participation involving behaviorchange and creating awareness.
AIMS & OBJECTIVES
Objectives of the study were to gather information about the different types and quantity of waste generated inthe kitchen, to gain knowledge on the methods adopted for the disposal of waste, to educate about reuse orrecycling of bio-degradable waste and to know the outcome of awareness programme conducted.
MATERIALS & METHODS
The study was limited to ,30 home makers belonging to Balepura village of Devanahalli taluk of Bangaloredistrict. The research design for the study is done in two parts:
139

1. Household survey to find out the existing household waste Management practices followed in the selected
households.
2. Creating awareness on safe and hygienic methods of disposing Household organic waste through
vermicomposting was demonstrated to the selected women folks.
An interview schedule was prepared and used as a tool in order to conduct the survey to elicit the necessary
information. The result of the study is presented below.
Table 1: Capacity of the Household Waste Generated
SI Type of Waste Pre-awarcncss Post-awareness
No Percentage Percentage
1 Kitchen waste
<1K G 30 30
1-2 K G 40 40
>2 KG 30 30
2 Cow dung
<10 K G 30 30
>10 K G 70 70
3 Plant Waste
<2 KG 30 30
>2-5 K G 40 40
5 KG 30 30
The above table reveals that each household generates different types of waste like kitchen waste, cow dung
and plant waste. It was observed that there was no change in the waste generated in pre and post demonstration
survey.
Table 2: Disposal Method Adopted
SI. No Disposal Method Pre awareness Post awareness
Percentage Percentage
1 Incineration 60 0
2 Composting 0 17
3 Discarding outside the house 40 0
4 Sorting 0 83
Table 2 shows the methods of disposal adopted by the households. It was mainly through incineration in pre-
awareness while in post demonstration 17 percent started composting and the remaining households sorted
the waste before disposing.
Table 3: Person in Charge of Disposal of Waste
SI.No Person in Charge Pre awareness Post awareness
Percentage Percentage
1 Home maker 46 70
2 Children 20 .
3 Paid helpers 34 30
Total 100 100
It can be observed from table 3 that, in post awareness survey the majority of the home makers took personal
interest in the waste disposal.
140

After an initial survey, an intervention program was conducted about the importance of waste segregation at
household level and vermicomposting technique for converting organic waste into useful manure through lecturer
and demonstrations.
Table 4: Adoption of Composting Technique
SI. No Adopt composting Pre awareness
Percentage
Post awareness
Percentage
1 Ye.s - 17
2 No 100 83
Total 100 100
One major change in the post awareness survey was the change in attitude towards waste disposal and concern
for the environment. This is revealed through a small, but some change i.e., vermicomposting adopted by 17
percent of the home makers.
In the post demonstration survey it was also observed that recycling was waste increased from26 percent to 53
percent. It was basically used to create decorative items, old clothes into cloth bags and quilts.
Thus, it can be concluded that aiming at eventual minimization and decentralization of waste management
requires deeper community participation, understanding the economic benefits of recovering and recycling of
waste.
CONCLUSIONS
Kitchen waste generated ranged from less than one kilogram to more than 2 kilogram.
Majority of the families followed incineration method of disposal of waste in the pre awareness survey incomparison to 83 percentages of the families who sorted their waste before disposal in the post awareness
survey. Throwing the waste outside the house was almost stopped after the awareness programme. In pre
survey none of the homemakers were composting, their waste. But post awareness programme, it was found
that 17 percent of the homemakers have started composting their waste.Thus, it can be concluded that aiming at eventual minimization and decentralization of waste management
requires deeper community participation, understanding the economic benefits of recovering and recycling of
waste.
RECOMMENDATIONS
1. To understand the knowledge and practice of waste management at household and community level.
2. To prepare an action plan for home makers to promote healthy waste disposal technique.
REFERENCES
1. Chatlwal G R, Encyclopedia of Environment Management, Anmol Publication Pvt Ltd, New Delhi. 2,1998. pp. 438.
2. Darwin and Mishra P C, Man and Environment, Macmillan India Limited, Bangalore, 1983, pp. 1981.
3. Rampal R and Sharma D. Environineiilal Pollution and health hazards. A P H Publishing Company, New Delhi. 2004. pp. 243.
141

FRM/Oral/6
Level of Satisfaction Gained by the Homemakers in Dual Established Families of Andhra Pradesh
K V Padmavathi
Head. Dept. of Home Science, Ch.S D St. Theresa'.s Autonomous
College for Women, Eluni, WG Dist (AP)
[email protected] (9490789765 / 08812234234)
ABSTRACT
Marriage is one of the important social institutions around the world. Each familv passesthrough a life cycle that begins with the marriage of two young persons, grows with thecoming of children, and then again becomes a home of two persons. In India, it is not onlv
a union of two individuals but is an alliance between two families thereby bringing about anew network of relationships. It is a threshold for family formation and family building. A
successful marriage is one that fulfils the needs, goals and expectations of both the marriage
partners. The young married couples go through a series of adjustments to achieve thegreatest degree of satisfaction. One such adjustment is the formation of dual establishedfamilies in which life partners stay apart either for short or extended periods due to variousfamily commitments. The process of migration with its positive and negative con.sequencescontinues to be a social reality. Male migration makes its impact on female members to
undertake the roles and responsibilities of male counterparts. The study was carried out in
Andhra Pradesh by identifying the required sample through snow ball sampling technique.Fanneerselvam (2003) describes snow ball sampling as a restrictive multi-stage .sampling in
which initially certain numbers of sampling units are randomly selected. Later, additionalsampling units are selected based on referral process, which means that the initially selectedrespondents provide addresses of additional respondents to the interviewers. This techniqueis applied for sampling the population related to rare events in which the members of thepopulation are not equally qualified to become the members of the sampling frame. Theobservations regarding the level of satisfaction on family life management revealed that theemployed homemakers were fully satisfied in the aspects of clothing management (44 percent), communication between spouses (39 per cent), and food management and decision-
making (34.5 per cent each).Over 50 per cent offulltime homemakers were fully satisfied inthe activities like food management, communication between spouses and clothingmanagement. It was assessed from the study that a majority of 56 per cent of the homemakersof dual established families derived only partial satisfaction towards family life management.There was a signifcant difference at one per cent level with regard to sati.sfaction derivedbetween employed and fulltime homemakers against socio-economic factors such as largefamily size, expanding stage of family life cycle and homemakers having le.ss than threeyears of experience in dual establishment and families earning above Rs. 40,000/- permonth. The satisfaction perceived by the fulltime homemakers over employed homemakersin the nuclear family type indicated statistically significant at five per cent level.
INTRODUCTION
Marriage Is one of the important social institutions around the world. Each family passes through a life cyclethat begins with the marriage of two young persons, grows with the coming of children, and then again becomesa home of two persons. In India, it is not only a union of two individuals but is an alliance between two familiesthereby bringing about a new network of relationships. It is a threshold for family formation and family building.
142

In this increasing mechanical civilization, home is the only place where one can relax and be oneself. It is alsoa place where a family lives and brings up children. Young and old members of the family live together and learnthe joys of loving, giving and doing things for each other. A happy and warm home enables them to develop
understanding and tolerance, share responsibilities and standby each other.
A successful marriage is one that fulfils the needs, goals and expectations of both the marriage partners. Theyoung married couples go through a series of adjustments to achieve the greatest degree of satisfaction. Onesuch adjustment is the fonnation of dual established families in which life partners stay apart either for short orextended periods due to migrating jobs of spouses and to fulfil various other family commitments. The processof migration with its positive and negative consequences continues to be a social reality. Male migration made
its impact on female members to undertake the roles and responsibilities of male counterparts. The state of
Andhra Pradesh was selected to conduct the research study as the researcher being the native of the same
state. Three hundred samples were identified to collect the data. The sample was selected based on thefollowing criteria:
• Female headed households due to male migration
• Mother tongue, Telugu speaking homemakers for better interaction.
• Seasonal migrant labourers did not constitute the chosen sample.
• Homemakers having a minimum of two years of experience in dual establishment.
Among three hundred samples identified, 200 were employed homemakers and 100 fulltime homemakers. Thedisparity in the sample size was due to non availability of fulltime homemakers according to the criteria laid
down for the sample selection. Spouses staying apart in dual establishment are certainly a phase of sacrifice
in the life cycle of couples in order to achieve common benefits and to promote welfare and happiness for theentire family. Due to male migration, the homemakers hold the total responsibility of managing all the aspects of
family life management. An assessment study was made on the extent of satisfaction obtained by the
homemakers on family management through Likert rating scale. Following Table 1 and Figure highlight the
details regarding level of satisfaction expressed by the homemakers of dual established families.
Tabte 1: Level of Satisfaction Gained by Homemakers on Family Life Management
Aspects*
EH (N : 200) FH(N : 100) Total (N : 300)
FS PS NS FS PS NS FS PS NS
N % N % N % N % N % N % N % N % N %
Communication
between spouses
78 39.0 105 52.5 17 8.5 53 53.0 44 44.0 3 3.0 131 43.7 149 49.7 20 6.7
Realization of values 66 33.0 113 56.5 21 10.5 44 44.0 49 49.0 7 7.0 110 36.7 162 54.0 28 9.3
Achievement of goals 48 24.0 122 61.0 30 15.0 31 31.0 63 63.0 6 6.0 79 26.3 185 61.7 36 12.0
Decision making 69 34.5 111 55.5 20 10.0 38 38.0 52 52.0 10 10.0 107 35.7 163 54.3 30 10.0
Food management 69 34.5 116 58.0 15 7.5 58 58.0 38 38.0 4 4.0 127 42.3 154 51.3 19 6.3
Clotbing management 88 44.0 i03 51.5 9 4.5 50 50.0 46 46.0 4 4.0 138 46.0 149 49.7 13 4.3
Time management 66 33.0 117 58.5 17 8.5 37 37.0 56 56.0 7 7.0 103 34.3 173 57.7 24 8.0
Money management 67 33.5 112 56.0 21 10.5 41 41.0 54 54.0 5 5.0 108 36.0 166 55.3 26 8.7
Energy management 58 29.0 125 62.5 17 8.5 38 38.0 55 55.0 7 7.0 96 32.0 180 60.0 24 8.0
Stress management 35 17.5 123 61.5 42 21.0 31 31.0 57 57.0 12 12.0 66 22.0 180 60.0 54 18.0
Housebold
responsibilities
56 28.0 115 57.5 29 14.5 49 49.0 45 45.0 6 6.0 105 35.0 160 53.3 35 11.7
Use of community
facilities
45 22.5 125 62.5 30 15.0 34 34.0 58 58.0 8 8.0 79 26.3 183 61.0 38 12.7
Safety and .security 47 23.5 120 60.0 33 16.5 37 37.0 49 49.0 14 14.0 84 28.0 169 56.3 47 15.7
Educational guidance
for children
36 28.0 119 59.5 25 12.5 36 36.0 56 56.0 8 8.0 92 30-7 175 58.3 33 1 i-0
Care of cbiidren 51 25.5 123 61.5 26 13.0 43 43.0 46 46.0 11 il.O 94 31.3 169 56.3 37 12.3
143

Religious / spiritual
practices 56 28.0 115 57.5 29 14.5 38 38.0 53 53.0 9 9.0 94 31.3 168 56.0 38 12.7
Acquisition of assets 40 20.0 123 61.5 37 18.5 25 25.0 55 55.0 20 20.0 65 21.7 178 59.3 57 19.0
Cultural events 33 16,5 121 60.5 46 23.0 19 19.0 59 59.0 22 22.0 52 17.3 180 60.0 68 22.7
Sexual relationship 52 26.0 110 55.0 38 19.0 36 36.0 50 50.0 14 14.0 88 29.3 160 53.3 52 17.3
Societal relationship 43 21.5 134 67.0 23 11.5 34 34.0 6! 61.0 5 5.0 77 25.7 195 65.0 28 9.3
Recreation 36 18.0 121 60.5 43 21.5 26 26.0 58 58.0 16 16.0 62 20.7 179 59.7 59 19.7
Care of sick / aged 30 15.0 126 63.0 44 22.0 34 34.0 48 48.0 18 18.0 64 21.3 174 58.0 62 20.7
Self sickness 37 18.5 126 63.0 37 18.5 23 23.0 58 58.0 19 19.0 60 20.0 184 61.3 56 18.7
Family relationship 59 29.5 122 61.0 19 9.5 46 46.0 43 43.0 11 II.O 105 35.0 165 55.0 30 10.0
Social activities 42 21.0 125 62.5 33 16.5 27 27.0 63 63.0 10 10.0 69 23.0 188 62.7 43 14.3
Average 26.5 59.4 14.1 37.1 52.6 10.3 31.8 56.1 12.1
EH — Employed Homemakers; FH — Full time Homemakers
FS — Fully satisfied; PS — Partially satisfied. * Multiple responses
NS-12.1 FS-31.8
Employed Homemakers Full time Homemakers
Both categories of Homemakers
PS - Fully satisfied; PS - Partially satisfied; NS - Not satisfied
Figure 1: Level of Satisfaction Gained by Homemakers on Family Life Management
FS-26.5NS - 14.1 NS-10.3FS - 37.1
The observations on the level of satisfaction of family life management between the two categories of employedand full time homemakers revealed that the employed homemakers were fully satisfied in the a.spects of clothing
management (44 per cent), communication between spouses (39 per cent) and decision making and foodmanagement (34.5 per cent each), but one fifth of them were not satisfied in cultural events, care of sick / aged,
recreation and .stress management.
Over 50 per cent of the full time homemakers were fully satisfied in the activities like food management,
communication between spouses and clothing management followed by household responsibilities, family
relationship and care of children by 43 to 49 per cent of them whereas one fifth of them were not satisfied with
cultural events and acquisition of assets.
It was assessed from the study that on an average the partial satisfaction towards family life management was
obtained by the majority of employed and full time homemakers (59.4 and 52.6 per cent) followed by full
satisfaction by 26.5 and 37.1 per cent and not satisfied by 14.1 and 10.3 per cent respectively.
It was concluded from the observations that a majority of 56.1 per cent of the homemakers of dual establishedfamilies derived only partial satisfaction in the aspects of family life management.
144

Satisfaction derived by the homemakers on dual establishment versus socio-economic variables
The homemakers of dual established families showed their degree of satisfaction on family life management
against socio-economic variables as depicted in Table 2.
It was found through statistical analysis using t-test that there was a significant difference at one per cent
level with regard to satisfaction derived between employed and full time homemakers on family life
management against socio-economic factors such as medium family size of four to six members, expanding
stage of family life cycle, homemakers having less than three years of experience in dual establishment and
families earning above Rs.40000/-. The satisfaction perceived by the full time homemakers over employed
homemakers in the nuclear family type indicated statistically significant at five percent level. It was observed
from the analysis that education did not influence on the degree of satisfaction of homemakers as statistical
analysis showed no significant difference.
Table 2: Satisfaction Derived by Homemakers Versus Socio-economic Variables
Variables
EH (N: 200) FH (N : 100)
't' valueOverall satisfaction score
N Mean S.D. N Mean S.D.
lypc of family Nuclear 151 29.2 9.1 82 31.7 9.3 1.979*
Joint 49 24.9 9.9 18 31.9 8.6 2.677''^
Family size 1 - 3 members 86 29.1 9.2 37 31.7 10.3 I.419''s
4-6 members 106 27.6 9.6 60 31.6 8.5 2.689**
> 6 members 8 25.1 10.6 3 34.0 7.0 1.32i'^5
Family life cycle Beginning stage 11 30.7 9.6 8 32.6 6,7 0.477^5
Expanding stage 171 27,7 9.3 79 31.5 9.7 2.977**
Contracting .stage 18 30.9 10,7 13 32.5 6.6 0.492''s
Educational [cvei High school /
intermediate 7 32.7 8.7 45 .33,2 8.4 0.148^®
Graduates 42 28.0 9.6 32 29.8 11.0 0.750'^^
Post graduates /
professionals 151 28.0 9.5 23 31.5 7.2 1.723"^
Experience in dual
establishment (years)
< 3 118 27.7 9.3 62 32.7 8.6 3.536**
3-6 46 29.6 9.0 24 28.8 10.3 0.360'^'^
> 6 36 27.8 10.5 14 32.4 8.3 1 479NS
Total family income
per month (Rs.)
< 20.000/- 59 28.8 7.4 39 30.2 7.7 0.931
20,001/--40,000/- 80 27.3 11.2 41 31.2 10.3 1.876''5
> 40,000/- 61 28.7 8.9 20 35.8 8.1 3.175**
All respondents 200 28.1 9.5 LOG 31.7 9.1 3.135**
EH - Employed Homemakers; FH - Full time Homemakers.
** Significant at one per cent level ;
* Significant at five per cent level ; NS - Not Significant
It was inferred from the assessment of level of satisfaction against socio-economic variables that there was a
significant difference at one percent level between the full time homemakers and the employed homemakers
on dual establishment.
145

CONCLUSIONS
The homemakers of Dual Established Families were exposed to changing trend of family living. Any change isinevitable in the present global scenario, the homemakers should be able to adjust to the existing circumstancesand tune their minds towards happy family life.
RECOMMENDATIONS
The recommendations emerged from the research study are enumerated beneath;
1. Seminars / workshops / conferences should be conducted for the homemakers of dual established families
to get empowered and to deal with management practices for better family living.
2. Provision should be made to establish creches and play schools at the work spot by public and privateorganizations for the benefit of employed mothers of dual established families.
3. Family counselling centres should be run by the home scientists in order to deal with i.ssues and problems of
spouses in dual establishment and provide proper counselling and guidance in a scientific way.
4. Yoga and meditation centres should be established especially for women group to strengthen body and
mind, free from stress, strain and tensions.
5. Government should formulate a special programme to women and children of dual established families for
development of quality of life and upliftment of standard of living.
REFERENCES
1. Khanna K. A Text Book ofHome Science by the Teachers ofLady Inviii College, Orient Longman. New Delhi. 1V99. pp. 7.1. 113.
114.
2. Sheela J. Woman s marriage in India — Ciiltiirai practices, age and male selection. Dominant Publishers and Distributors. New
Delhi. 2003. pp. 1.
146

FRM/Ordl/7
Types of Electrical Home Appliances used by Women and its Impact on Her Life Style with SpecialReference to Middle Income Group in Sangli City
Susmita S Durgule ' & Shruti S Joshi -
1. Lecturer & Head, Dept. Home Economics, Smt. C B Shall Mahila
Mahavidyalnya, Sangli (Maharashtra)
kalpeshjajal@gmail-com (9423041424)
2. Lecturer Home Science. Smt. C B Shah Mahila Mahavidyalaya, Sangli (Maharashtra)
shruti.sjoshi©rediffmail.com (9422406069)
ABSTRACT
The aim of this paper is to evaluate the effect of use of electrical home appliances on family
life of women in Sangli City. Women being a home maker have a dual role to play in the
family viz. She is a wage earner as well as She is the backbone of family life. She has to play
numerous roles as a wife, a mother and a sister in law and in order to justify all these
versatile roles. She has to make use of all available human or non-human resources. In this
paper, an attempt has been made in evaluate the role of electrical home appliances on
standard of living of woman as well as their leisure time and its use.
INTRODUCTION
Woman and household work pattern is mainly life of considered for as granted way in family life of Indian
women. In society, women's identification is like a home maker. But at this fast life with the help of advanced
and well developed Home Appliances, women have made a great change in normal family life. Basically
Advanced Home Appliances are used by the High Middle Income group women and for them these appliances
may be a status symbol.
But for middle income group family where the woman work as a Home maker as well as a wage earner, the
use of these advanced equipments become necessity. Electrical home appliances are generally used by women
to save their time and energy. They do not only simplify the routine work of the house hold but can at times
improve the Quality of work and its nature. More work can be done within the given time and the dependence
of the house wife on family members for domestic help is reduced to a greater extent.
While studying the types of Electrical Home Appliances used by women from middle income group of SangliCity, It is seen that usage of these Home appliances is limited because women feel that it is not necessary to use
all types of home appliances to make work easy. These women use some home appliances which have been
following characteristics.
Low cost.
Do not require much maintenance.
Are easy to operate.
AIMS & OBJECTIVES
The objectives of this study are:
1. To know why and which Home appliances are used by the women.
2. To understand their attitude towards using electrical home appliances.
3. To evaluate effect of the electrical home appliances on health, time for relaxation and use of leisure time
they got by use of home appliances.
4. To suggest way for maintaining family and social relationship.
147

MATERIALS & METHODS
Sample survey of 100 house wives whose annual income is Rs.2, 00,000/- to Rs.5, 00.000/-.
Standard questionnaire was used to collect the details of electrical home appliances used by women and itsimpact on her life style.
The observation was limited to those families that had only 4 members.
RESULTS & DISCUSSIONS
Figure No. I expresses the types of electrical home appliances used by women from middle income grouphaving annual income 2 lakh to 5 lakh. The values of individual item are the mean of the data collected for
this is taken from 100 House wives.
Figure No.2 expresses that what types of effect occurs on family budgets due to using of electrical homeappliances.
Figure No.3 informs that women agree that by using electrical home appliances they can save their energy.
Figure No.4 describes that using electrical home appliances is Status Symbol.
Figure No.5 expresses that how many women get leisure time after using electrical home appliances.
Figure No.6 expresses the Percentage of family members who help the women operating electrical homeappliances.
Figure No.7 informs how many they utilize their leisure time which is saved after usage of electrical homeappliances.
Figure No.8 describes necessity of electrical home appliances.
Above figures are in terms of percentage. It is significant to note that women use Mixer and Fridge commonly.Mixer is basically used to save energy and time and Fridge is used to keep food commodities. Specially Perishablefoods in good condition or increase their shelf life after these two electrical home appliances Water Purifier andWashing Machine are used by 40-50% women and rest of electrical home appliances are rarely used bywomen of middle income group in Sangli City.
Sangli is a small developing city in Maharashtra State. People are aware of their progress with the help ofvarious human and non-human resources. Women are trying to achieve their family goals, fulfill the demand offamily members, develop easy working method with the help of non-human resources such as earning wages,saving money, electric non electric home appliances.
From the Questionnaire we found that electrical home appliance affect their budget example i ncreasi ng electricitybill, maintenance and cost of the Home Appliances Some women says that using of these home appliances savetheir human resources such as time and energy.
Lots of women thought that there appliances did not affect their social states because they feel that using ofthese appliances become a necessity of their life. It seems that it is a wrong opinion.Woman get more leisure time. They use to this leisure time to fulfill their hobbies, like reading, watching T. V. ormovies, participating in social work, give more attention to children study, for marinating good health somewomen did exerci.se.
Some get help from their family member to operate these equipments.
We studied about - "How does these equipment affect their health. Many women said that there is no effect ontheir health but when we studied about their height and weight we find that 65% women are obese. That means
they are not agree that use of Electric Home Appliance they save energy and its affect on their health and theybecame obese. 15% women find that they are normal weight and 20% women are having low weight. Thereason of their low weight is nothing but hereditary.
Some women try to create new recipes with the help of these equipments.
In Sangli water born disease affect public health specially the health of the children. So women cautious about
their kid's health they have the solutions that to u.se boiling water or water purifier or water filter. 65% Women
use electric water purifier. 20% use boiled water and reaming 15% use normal water.
148

We find that Women get more time to look after their family as well as their work even though she is a housewife. She uses all her human and non human resources, to fulfill the desire or goals of family. She gets mental
satisfaction, physical rest. So she is able to give satisfaction to all her family members mentally, socially, emotionallyand also physically.
) Percentage
Fig. 1: Electrical Home Appliances used by MIG Women
Not agree of
EfTcci on family_Budget: Agree of effect
on familybudget:
Fig. 2: EfTccI on famiiy budgets
Not agree
that savingenergy
Agree that womensave their energy
luijia2!
Fig. 3: Women save their energy due to electrical home appliances
Using ElectricalHome Appliancesis Status Symbol
2S%
75%Using ElectricalHome AppliancesNot Status Symbol
1 1.11|B2
Fig. 4: Status Symbol
Women not agreethat they getleisure time
by using ofElectric Home
Appliance
15%
Due to using ofElectric Home
Appliance womenagree they getleisure Time.
1
B2
Fig. 5: Leisure Time
149

••iJli'I
: f
-
ii■ri
ell
■ : 1. II/I
• V.i
^ ' I'
I •!
Not gives theiropinion
FamilyMembers Not
Help
10% Family MembersHelp to operate
25% / ^> ( ™ Electric Home
I 65% j Appliance\\ /\
! V
Fig. 6: Help of Family Members to operate the Electrical Home Appliances
ijpcicenlagc
70
60
50
40
30
20
10
g 2f sS H •- u
X C<115 =
B •*
O >
? >> v»c ^ V> 2 S
J5 •*' ti0 ̂Fig. 7; Uses of leisure lime
! Percentage
806040
20
0
-
1
-
13Vo
Z
>.
c?
>eoU
£B
Ut
>sM
£P
Fig. 8: The reason of uses of Home appliance
CONCLUSION
Many women get leisure time but they do not know about the productive ways to make use of that. They shouldbe given proper training and Education in this respect. They should accept the fact that they are obese due touse of appliances as these appliances have reduced their physical exercise.
RECOMMENDATIONS
The women should be properly trained to make economical use of electrical home appliances.It is necessary to impart training about preparing the nutritious food with the help of electrical home appliances.They should make use of appliances to get more leisure time and should utilize that for improving thestandard of living of family members.
REFERENCES1.
2.
Gross I H and Crandall E , Management for modern families. Sterling Publisher (P) Ltd.. Delhi. 2"^ Ed.. 1967. pp. .^51. 375.Limaye S and Nimkar A. Pra^aii Cniluivyavasiapan, Maharashtra Vidhyapeeih Granlh Nirmiti Mandal. Nagpur. 1" Bd..pp. 105.
Nickel P and Dorscy J M. Management in Family Uving, New Delhi. 4"' Ed.. 1985. pp. 230. 232. 248.
150
Jl

FRM/Oral/9
Quality of Life of Older Adults through the Eyes of Youth
S Mitra ' & B Dasgupta -
1. Dept. of Post Graduate Studies and Research in Home Science,
SNDT Women's University. Santa CnizfW), Mumbai (Maharashtra)
[email protected] (09322821367)
2. Dept. of Post Graduate Studies and Re.search in Home Science,
SNDT Women's University, Santa Cruz(W), Mumbai (Maharashtra)
ABSTRACT
The main aim of this study waj to investigate the attitudes of youth towards older adults
living in extended families (permanently or occasionally) and ascertain their perception
about the quality of life of older adults. Ninety young adults from Kolkata; staying in extended
families were purposely selected. Kogan's attitude scale towards older adults was used to
assess attitude, and a checklist with a Likert type of scaling tvaj developed to ascertain
quality of life in the home regarding involvement in family affairs.
It was found that the respondents had a positive attitude towards older adults: maternalgrandparents were more involved in household activities; more so when the stay was
occasional. The elderly were involved in family decision making to some extent; this was
significantly felt more by young females. Paternal grandparents were given more assistance
by the family. Conflicts were more when both paternal and maternal grandparents stayed
together in the same house. Older adults were well treated. Location of the house not a
problem and few designing interventions had been undertaken. The study endorsed the factthat accepting ageing was not a lesson that can be taught but rather a belief wisdom, aconsciousness that can be developed and valued over the growing up years in young adults
in extended families.
INTRODUCTION
Generation gap in human adjustment has invited world wide attention. However; t he aged in India havetraditionally enjoyed a high status and respect, they occupied a revered position in the family and in society. Theconsideration of the elderly and the ageing process should include the feelings and attitudes of young peopletowards older adults, since these feelings are likely to influence future roles. To improve the quality of life of ourolder citizens, it's important to inculcate positive attitudes in the young and make them sensitive to the quality oflife of older adults. After all; it is the society and family (of which the young adults are a huge segment) whodecide how the older adults will be treated. These i.ssues need to be brought center-stage for discussion anddebate in society and help find effective solutions. This study is an attempt to find out whether the values,attitudes and beliefs internalized in the era bygone are still inculcated in children growing up with older adults.The main aim of this study was to find out the attitude of the youth towards older adults in extended families (i.e.grand children who have grown up living with grand parents) and ascertain their views on the quality of life ofolder adults who live with them.
AIMS & OBJECTIVES
1. To assess the attitude of youth towards older adults.
2. To verify youth's perception about quality of life of older adults living in families.3. To ascertain the need felt for designing interventions for older adults in residences.
MATERIALS & METHODS
A descriptive research design was adopted for the present study in the city of Mumbai. The sample comprised
151

of ninety young adults aged between 17-25years, staying with older adults permanently or occasionally in theirhomes. A purposive sampling technique was used to get respondents who fulfilled the sample structure and
were willing to participate in the study. Kogan's attitude scale towards older people with a Likeri type scaling
technique was used on a six point scale; representing responses from "strongly disagree to strongly agree". To
find out the quality of life of the older adults in homes, their involvement in various hou.sehold activities, family
decisions, conflicts, type of treatment they received were ascertained through a checklist. The data were coded
and tabulated in terms of mean scores. T-test and One-way Anova were used for statistical significance among
variables of gender, education, type of relationship and length of stay.
RESULTS & DISCUSSION
Table 1: Distribution of young adults according to Attitude and Quality of Life (N=90)
Attitude of Youth and Quality of
Life of Older Adults
N Minimum Maximum Means
Score
Std.
Deviation
Attitude of young adults towards older
adults.(d point scale)
90 2.91 5.00 .3.7124 .38419
Involvement of older adults in household
activities.f¥ point scale)
90 1.13 3.38 2.0569 .46664
Involvement of older adults in family
decision making.(3 point scale)
90 1.25 2.63 2.1278 .30097
Assistance required by older adults living
in familiesfJ point scale)
90 1.25 3.00 2.2611 .44408
Conflicts in the home with older
adults (3 point scale)
90 1.00 2.57 1.6762 .3.3024
Treatment received by older adults
(3 point scale)
90 1.72 2.89 2.5198 .22934
Need for designing intervention 90 1.00 2.00 1.5333 .23342
Problems faced by older adults
because of location
90 1.00 2.00 1.3381 .23986
Table I indicates thatmostof the participants had developed a positive attitude towards older adults. Involvement
of older adults in household activities was 'only when necessary'. Participation of older adults in family decision
making was 'sometimes', assistance required by older adults living in families was 'occasional'. Conflicts with
older adults happened 'sometimes'. Most of the older adults were well treated. Need for designing interventions
were felt by all; half of the homes had done some designing interventions like provision of grab bars, Provisionof easy reach shelf, provision of adequate natural and artificial light, provision of elevated toilet, provision of
special chair and temperature control system. Problems faced by older adults because of location of the house
were 'negligible'.
Ibble 2: Distribution of young adults according to gender (N=90)
Attitude of Youth and Quality of Sex n Means Std. Std. Sig.
Life of Older Adults score Deviation Error (2-tailed)
Mean
Attitude of young adult's towards Male 36 3.7100 .45706 .07618 .961
older adults.(d point scale) Female 54 3.7141 -33150 .0451 1
Involvement of older adults in Male 36 2.0278 .46972 .07829 .631
household activities. (4point scale) Female 54 2.0764 .46797 .06368
152

Involvement of older adults in family Male 36 2.0451 .26076 .04346 *.033
decision making. (3 point scale) Female 54 2.1829 .31540 .04292
Assistance required by older adults Male 36 2.2326 .42274 .07046 .622
living in families. (3 point scale) Female 54 2.2801 .46068 .06269
Conflicts in the home with older Male 36 1.6627 .37897 .06316 .765
adults. (3 point scale) Female 54 1.6852 .29679 .04039
Treatment received by older adults Male 36 2.4630 .22848 .03808 .055
(3 point scale). Fem.ale 54 2.5576 .22404 .03049
Need for de.signing intervention. Male 36 1.4643 .22230 .03705 *.021
Female 54 1.5794 .23121 .03146
Problems faced by older adults Male 36 1.3095 .24744 .04124 .359
because of location of the house. Female 54 1.3571 .23507 .03199
From table 2 it was found that both male and female youths residing with older adults had a positive attitude
towards them. The types of house- hold activities performed by older adults/ grandparents were also similar in
case of both the genders. Females living with older adults felt the involvement of older adults in family decision
making more than males, this was mainly because the females were more home bound than males. There was
no significant difference regarding type of assistance required, conflicts arising and type of treatment meted out
to older adults in homes. There was a significant difference in the views of males and females regarding the
need for designing intervention required. The females felt the difficulties of old age more than the males; they
felt the need for more change to the interiors in the home to make life of older adults more comfortable as
compared to the males. The type of problems faced by the older adults because of the location of the house was
similar in both cases.
Table 3: Distribution of young adults according to education (N=90)
Attitude of Youth and Quality of Age Means Std. Std. Slg.
Life of Older Adults Group n score Deviation Error (2-talled)
Mean
Attitude of young adult's towards 17-2I(UG) 27 3.6133 .29352 .05649 .109
older adults. (6 point scale) 22-26(PG) 63 3.7549 ,41187 .05189
Involvement of older adults in 17-21(UG) 27 2.1157 .49750 .09574 .437
household activities, (4point scale). 22-26(PG) 63 2.0317 .45457 .05727
involvement of older adults in family 17-2I(UG) 27 2.0694 .40182 .07733 .324
decision making. (3 point scale) 22-26(PG) 63 2.1528 .24536 .03091
A.ssisfance required by older adults i7-21(UG) 27 2.2361 .53297 .10257 .729
living in families. (3 point scale) 22-26(PG) 63 2.2718 .40445 .05096
Conflicts in the home with older 17-2i(UG) 27 1.6772 .37712 .07258 .984
adults. (3 point scale) 22-26(PG) 63 1.6757 .31130 .03922
Treatment received by older 17-2l(UG) 27 2.4897 .24413 .04698 .419
adults. (3 point scale) 22-26(PG) 63 2.5326 .22348 ,02816
Need for designing intervention 17-2l(UG) 27 1.5159 .22961 .04419 .645
22-26(PG) 63 1.5408 .23645 .02979
Problems faced by older adults 17-2l(UG) 27 1.3492 .22530 .04336 .775
because of location of the house 22-26(PG) 63 1.3333 ,24744 .03117
Table 3 indicates that the older youths (age 22-26) had slightly more positive attitudes as compared to the
younger (age 17-21 ).This difference however was not found to be significant statistically. The younger group
153

felt the involvement of older adults in household activities slightly more than the older group; this was possibly
because their grandparents were younger and so more active than the grand parents of the older group. Contrarily,
the youths of the older group felt the involvement of older adults in decision making and better treatment of
older adults more than the younger group. Both these differences were not found to be significant statistically.
There was no difference with regard to conflicts in the home, need for designing intervention and problem
faced due to location of the house among the two groups.
Table 4: Distribution of young adults according period of slaying of grandparents. (N=90)
Attitude of Youth and Quality of Whether Std.
Life of Older Adults Permanently Mcan.s Std. Error Sig.
or Temporary n score Deviation Mean (2-tailed)
Attitude of young adult's towards Permanently 45 3.7209 .39032 .05819 .835
older adults. (6 point scale) Temporary 45 3.7039 .38217 .05697
Involvement of older adults in Permanently 45 1.9417 .50326 ,07502 *.018
household activities. (4 point scale) Temporary 45 2.1722 .40001 .05963
Involvement of older adults in family Permanently 45 2.0806 .30982 .04619 .137
decision making. {2 point scale) Temporary 45 2.1750 ,28752 .04286
Assistance required by cider adults Permanently 45 2.3306 .49440 .07370 .139
living in families. (3 point scale) Temporary 45 2.1917 .38027 .05669
Conflicts in homes with older Permanently 45 1.5968 .29100 .04338 *.022
adults.(3 point scale) Temporary 45 1.7556 .35075 .05229
Treatment received by older adults. Permanently 45 2.5358 .22541 .03360 .510
(3 point scale) Temporary 45 2.5037 .23463 .03498
Need for designing intervention Permanently 45 1.5508 .25144 .03748 .481
Temporary 45 1.5159 .21531 .03210
Problems faced by older adults Permanently 45 1.3270 .26660 .03974 .663
because of location of the house Temporary 45 1.3492 .21223 .03164
Table No 4 reveals that there was no difference in the attitude of youth towards older adults living with them
permanently or occasionally, the treatment they received was also same, kind of designing intervention needed
were similar as were the problems faced due to location of the house. Some differences were found regarding
involvement in household activities, those who stayed temporarily were significantly more involved in household
activities than those staying permanently, and this was because adjustments and arrangements of house- hold
chores must have been finalized for the extra workload on a permanent basis. Slight differences were also
observed in involvement in family decision making, those who stayed on a temporary basis were more involved
than those who stayed permanently, however the differences were not significant.
l^ble 5: Distribution of young adults according type of grandparents residing with them (N=90)
Attitude of youth and Quality
of life of older adults
lype of grand
parents n
Means
score
Std.
Devia
tion
Std.
Error
Sig.
(2-
tailed)
Attitude of young adult's towards
older adults(d point scale)
Paternal Grand Parents 47 3.7422 .40127 .05853 .738
Maternal Grand Parents 34 3.6747 .39579 .06788
Paternal as well as
Maternal
Grand Parents 9 3.6993 -24199 .08066
Total 90 3.7124 .38419 .04050
154

Involvement of older .idults in
household activities.
(4 poinl scale)
Patemal Grand Parents 47 1.9734 .43531 .06350 .186
Malemal Grand Parents 34 2.1654 .47446 .08137
Patemal as well as
Maternal Grand P.arents 9 2.0833 .55902 .18634
Total 90 2.0569 .46664 .04919
Involvement of older adults in
family decision making.
(3 point scale)
Patemal Grand Parents 47 2.1144 .28412 .04144 .908
Maternal Grand Parents 34 2.1434 .32147 .05513
Patemal as well as
Maternal Grand Parents 9 2.1389 .33914 .11305
Total 90 2.1278 .30097 .03172
Assistance required by older
adults living in families.
(3 point scale)
Paternal Grand Parents 47 2.3112 .45733 .06671 .537
Maternal Grand Parents 34 2.2022 .45123 .07739
Patemal as well as
Maternal Grand Parents 9 2.2222 .34674 .11558
Total 90 2.2611 .44408 .04681
Conflicts in homes with older
adults. (3 point scale)
Patemal Grand Parents 47 1.6535 .29898 .04361
Matemal Grand Parents 34 1.6597 .37717 .06468 .224
Patemal as well as
Matemal Grand Parents 9 1.8571 .26726 .08909
Total 90 1.6762 .33024 .03481
Treatment received by older
adults. (3 point scale)
Patemal Grand Parents 47 2.5213 .22057 .03217 .446
Matemal Grand Parents 34 2.4951 .24442 .04192
Paternal as well as
Matemal Grand Parents 9 2.6049 .21950 .07317
Total 90 2.5198 .22934 .02417
Need for designing intervention Patemal Grand Parents 47 1.5578 .24091 .03514 .260
Matemal Grand Parents 34 1.4832 .23199 .03979
Paternal as well as
Matemal Grand Parents 9 1.5952 .17857 .05952
Total 90 1.5333 .23342 .02460
Problems faced by older adults
because of location of the house
Patemal Grand Parents 47 1.3435 .24320 .03547 .976
Maternal Grand Parents 34 1.3319 .24799 .04253
Paternal as well as
Maternal Grand Parents 9 1.3333 .21429 .07143
Total 90 1.3381 .23986 .02528
Table 5 indicates that respondents who were staying with paternal grand parents showed more positive attitudes
than those who were staying with maternal grandparents and those who were staying with both, but the differences
were not statistically significant. Involvement of maternal grand parents in household activities was more thanother grandparents. All three groups were equally involved in family decision making and they required thesame amount of assistance. Conflicts was more when both patemal and maternal grandparents were staying inthe family, treatment was better and more designing interventions had been undertaken when both groups werestaying together. Problems faced by older adults because of location of the house were also similar in al thethree groups.
Implications of the study: The study convincingly found that today's youth who lived and grew up with olderadults in their own homes had developed a positive attitude towards ageing and had a realistic perception aboutageing: thus endorsing the fact that accepting ageing is not a lesson that can be taught but rather a belief, awisdom, a consciousness that can be developed and valued over the growing up years.
155

The indication is clear that youth can develop realistic perception of ageing through enriching encounters whichmust be more than the occasional "grandparents' day" or a visit to the old age home. Thus Parents for their own
sake and for the sake of their children should encourage the older adults (grand parents) to live with themthrough the growing years of their children to inculcate such values. Society should re endorse the traditional
concept of the extended family.
Society at large, the Government and NGO's should make special efforts to popularize the concept of theextended family and proved incentives to re- establish the extended family system.
CONCLUSION
It was thus concluded from the present study that the attitude of youth, (both male and female) towards older
adults was positive, more so; when paternal grand parents were staying with them and for the more mature and
older group (22-26yrs). Grand parents who came to stay temporarily and when maternal grandparents stayed
with families more involvement in household activities was observed. The older group and female respondents
felt the involvement of grandparents in family decision making more than the younger group and males. Permanent
as well as paternal grandparents required more assistance than other groups. Conflicts were more when
grandparents stayed temporarily and also when both grandparents stayed together. Treatments received were
also better and more designing interventions were carried out when both grandparents stayed together. Problems
faced by older adults because of location of the house were negligible.
RECOMMENDATIONS
'Interdependence' is the key. Steps should be taken to promote & encourage the extended family systemthrough special offers at various levels starting from educational institutions by giving special considerations forfamilies with grand parents. Society at large, the Government and NGO's can make special efforts to popularizethe concept of the extended family and provide incentives like giving special concessions, passes, food grains,even tax benefits to help re- establish the extended family system. The traditional concept of the extendedfamily can be endorsed by popularizing the benefits of extended families through plays, posters, hoardings etc.exactly the way the small family was promoted. Thus Parents for their own sake and for the .sake of theirchildren should encourage the older adults (grand parents) to live with them through the growing years of theirchildren to inculcate such values.
REFERENCES
1. Brown I, Old and Young, The Bodley Head Ltd., 1971.
2. Victor R C, Old age in modern society - A text book of social gerontology. Croom Helm Ltd.. 1987,
3. Gokhale S D. Ramamurthi P V. Pandit N and Pendsc B S. Ageing in India, Soumya Publication. 1999.
156

FRM/Oral/10
Involvement of Women in Financial Decision Making Process of Rural Households, under DispurAssembly Constituency
Santana Bordoloi Kakati Jupilara Sarma Kalita- & Jayashree S Goswami'1. Head & Selection Grade Lecturer, Dept. of Home Science,
Handiquc Girls' College, (Guwahati)
[email protected] (09864106737)
2. Lecturer, Dept. of Home Science, Handique Girls' College, (Guwahati)
3. Selection Grade Lecturer
ABSTRACT
Financial management of household is concerned with the control offamily income andexpenditure. It is necessary for the fullest accomplishment of satisfaction in life. It forces a
person towards careful selection of goals and alternatives, which help him to satisfy hiswants in order of their importance. Besides, it yields savings, which give one a feeling ofsecurity and confidence. Often this associates with happiness and determines standard ofliving. Rationale: With the dramatic changes raking place due to Industrialization, Educationand Advance technology, women have also undergone changes and have started takingpart in Decision making process of the family. Therefore the present study was taken upassess the involvement of women in financial decision making. Objectives: a) to enquire /know about the involvement of women in fnancial decision making process of the familyand b) to examine the impact of education and gainfid employment on financial decisionmaking process of rural household Material <6 Method: Interview schedule cum questionnaire
used for the purpose of the present study and the survey woi conducted in the monthof September, October during the year 2008-2009. Dispur Assembly Constituency has beenselected as the study area. Nine (10%) out of 90 Polling Station of Dispur Constituencywere selected randomly for the surx'ey. Again, a sample of 10% household has been drawnfrom each of the 9 selected polling stations randomly and the total sample size was 194.Findings: a) Findings of the present study reveals that nearly in 47% (92 household), decisionare taken jointly (by husband and wife) in financial matters; in 30% (58 household )thehead of the family alone take decision and in 10% household, home makers alone take the
decUion. In remaining 13% households, other members also take part in financial Decisionmaking: b) The study reveals that women in dijferenl occupations have varying percentageof involvement in financial decision making process. Women engaged in business andprofessional occupations had 100% involvement in financial decision making. Whereas,92% of women engaged in service and other occupations were found to be involved infinancial matters. Only 38% housewives took part in financial decision making. Conclusion:It has been found from the study that there is pre-dominance ofjoint decision that is decisiontaken by husband and wife. Further, it has been found that participation in financial decisionmaking is relatively higher among household with earning women as compared to non earningones. Thus, it indicates that working women are relatively more involved in financial decisionmaking than their non-working counterparts, which may be taken as an indication of lesserdegree of freedom enjoyed by non-earning women in financial decision making process.
INTRODUCTION
Family is the primary unit of society, consisting of two or more persons living in the same household who arerelated to each other by blood, mairiage or adoption. It is a unit where we intensify the contact of member morethan any other social organization.
Today, this prime institution has undergone dramatic changes due to industrialization, mass education andadvancement of technology. The role of family members, especially women has also undergone changes
157

because of their involvement in labour force. Equalization of educational opportunitie.s and employment statusare also responsible for this.
Regarding financial management of household it is concemed with the control of family income and expenditure.It is necessary for the fullest accomplishment of satisfaction in life. It forces a person towards careful selectionof goals and alternatives, which help him to satisfy his wants in order of their importance. Besides, it yieldssavings, which give one a feeling of security and confidence. Often this associates with happiness and determinesstandard of living.
In this paper, an attempt has been made to analyze the patterns of decision making of the households regardingthe use of family income on the basis of the field level data collected for the purpose.
AIMS & OBJECTIVES
The study is made with the following objectives of assessing the involvement of the women in family resourcemanagement.
1. To enquire / know about the involvement of women in financial decision making process of the family.
2. To examine the impact of education and gainful employment on financial decision making proce.ss of ruralhousehold.
MATERIALS & METHODS
Research Design - For the present study sample survey method is used:• Selection of tools and formulation of questionnaire: Interview technique with questionnaire is used for
the purpose of the present study.• Survey and Reference Period: The field survey was conducted in the month of September. October
during the year 2008-2009.
• Study Area and Size: For the present study, Dispur Assembly Constituency has been selected as studyarea. A two-shaped random sampling design has been used to draw sample, using the electoral roll of 1995collected from Election Officer (Kamrup District) as the sampling frame. In the first step, 10% that is 9 outof 90 Polling Stations have been selected at random. From the pilot study it was found that number of votersis roughly four times to the number of homemakers. On the basis of that, the number of homernakers ineach polling station has been estimated by dividing the number of voters by four. In the next step a sampleof 10% household has been drawn from each of the 9 selected polling stations. The final sample size worksout at 194.
• Collection of Data: The data have been collected from the respondents personally by canvassing a structuredquestionnaire crosschecking was also done wherever feasible to eliminate uncertainties.
• Analysis of Data: For the purpose of analysis, data were reclassified into contingency table. In addition tosimple percentage. Pearson's chi-square test has been used for testing the significance of data.
RESULTS & DISCUSSIONS
Findings of the present study reveals that nearly in 47% (92 household), decision are taken jointly (by husbandand wife) in financial matters, in 30% (58 household )the head of the family alone take decision and in 10%household, home makers alone take the decision. In remaining 13% households, other members also take partin financial Decision making.
Table 1: Process of Decision Making
SI. No. Decision taken by Number Percentage
1 Joini decision (husband &wife) 92 47
2 Husband 58 30
3 Wife herself 20 10
4 Other 24 1 ̂
5 Total 194 100
158
L. i;t

13%
10%47%
30%
□ Joint
[H Husband
□ Housewife
□ Others
The reasons for predominance of joint decision by husband and wife of the family in financial matters may beattributed to rapid and radical changes taking place in the family, spread of education, and change in men'sattitude which induces women to come out from their barrier and take part in decision making process ofhousehold. Moreover, interest of the family being largely dependent on crucial financial decisions, it becomesimperative for the head of the family to consult the home maker.
A number of variables are incorporated into the analysis in order to assess their impact on decision taken forfinancial matters. These include cultural variables such as family system, i.e., nuclear, non-nuclear and resourcefactors like education and employment or earning potential/capacity etc.
An analysis of the possible impact of types of family system in financial decision making process of householdreveals that in nuclear families, the involvement of the women in financial decision making process is moreinten.sive (79% ) as compared to those ofjoint families. This may be attributed to the fact that women in nuclearfamilies are next most responsible and active adult members after their husbands which is not the case in jointfamily. So, homemakers in nuclear family enjoy more authority than their counterpart of joint family.
Education and employment can be expected to exert influences on the role of the women in decision makingprocess. Pearson chi-square test is used and it has been found that both the factors have highly significanteffect on decision making household. This is because education is a tool, which encompass and makes anindividual self confident enough to come forward and get involved in financial decision making process.
Table 2: Involvement of Women o Different Occupation in Financial Decision Making
SI .No. Occupation Yes No Total
Service 22 (92%) (20%) 2 (8%)(2.43%) 24(100%)(12.37%)
2 Business 28 (100%)(25%) 0 28(100%)(14.43%)
3 Professional 01(I00%)(0.9%) 0 1(100%)(0.51%)
4 Others i2(92%)(i0.7%) I(8%)(I.2I%) 13(100%)(6.7%)
5 House wife 49(38.3%)(43.7%) 79(61.7%)(96.3%) 128 (100%)(66%)
6 Total 112 (58%) 82(42%) 194(100%)(100%)
Women's employment status alters her position in family decision making as she brings more resources into thefamily and improves family's financial position. So, working/ earning women are consulted by their husbandwhile making decision. This may be an outcome of her ability to contribute in solving financial problems offamilies to some extent, in acquiring durables for families, in leading a comfortable life and raising the standardof living. This enables the women to take part in decision making process of family which in turn paves the wayfor them to come out of their traditional images of being submissive, shy and docile. This positive impact ofpersonal endowment like education, employment and income upon the relative powers of individual are alsohighlighted in studies made by Bllod and Wolfe (1960) Mahajan (1976), Muktus and Muktas (1990). Kakali(2005). This shows that education and income have greater influence on the development of the level ofaspiration and decision making both being closely associated with each other.
159

CONCLUSION
From the findings, it has been found that there is pre-dominance of joint decision that is decision taken by
husband and wife. Further, it has been found that participation in financial decision making is relatively higheramong household with earning women as compared to non earning ones. Thus, it indicates that working womenare relatively more involved in financial decision making than their non-working counterparts, which may betaken as an indication of lesser degree of freedom enjoyed by non-earning women in financial decision making
process.
The current study is limited to the women in Dispur assembly constituency of Guwahaii. But. study will be
extended to other parts of the city in near future.
RECOMMENDATIONS
1. Increased involvement of women in capacity building program will enhance their self confidence and
empower them to create self help groups which will make them financially self sufficient to some extent.
2. Financial self sufficiency will help them in taking part in decision making process.
3. Home scientists can play a major role in this regard.
REFERENCES
1. Blood R and Wolfe D M, Husband and Wives, The Dynamics of Married Livins. The Free Press, New York, 1960.
2. Mabajan N. Changing Role and Siaius of Women, M.Sc. thesis submitted lo Punjab University. Chandigarh (1976), pp. 12.
3. Mukhtar H and Mukhlar E N. Expenditure Decision and Distribution of Power between husband and wives-. A case study ofKarachi Househase Karachi, Applied Ecomomic Research Centre Paper No: 123 (1990).
4. Kakati S. Family Resource Management And Saving Habits of Women - A study of Dispur Assembly Conslituiency. A thesissubmitted for Ph.D degree to Economics Dept. Gauhati University, (2005).
5. Verghese, M A .Ogale N N and Srinivasan K. Home Management. New Age International Ltd., New Delhi, India. 1997, pp, 2.
160
h

FRM/Oral/I I
Empowerment of Women on Consumer Protection
S Prema ' & A Venmathi -
1. Asst. Professor in Home Science, Queen Mary's College (Chennal)
prema2064(®yahoo.co.in (09840823796)
2. Professor, Family Research Management, Avinaslilingnm University for
Women (Coimbatore)
ABSTRACT
Empowerment of women in the field of consumerism is a too! for opening up the opportunities
for women to enter the world of productive work, to participate in development and to
change their lives into an educated and economically independent woman who takes all
decisions in the purchasing behaviour. The advancement of technology and competition
has brought in to the market a variety of food commodities. Imitation and brand infringement
make it impossible for the ordinary consumer to choose the right quality offood. In short,
the women consumer should be empowered with respect to rights as consumer. With increasing
globalization, liberalization and harmonization of economies of various nations coming
together the issues concerning consumer protection are now being accorded the top most
priority by the respective Government. The growing size and complexity of production and
distribution systems, the high level of sophistication in marketing and newer methods of
advertising, mass marketing methods and emergence of e-commerce result in reduction of
personal interaction between buyers and sellers has contributed to the increased need of
consumer protection.
INTRODUCTION
Women's empowerment begins with the awareness about their rights and responsibilities, encompasses their
political empowerment, economic independence and social upliftment. (l).Women consumers are the keystones
in the economic development of a country (3). Women as consumers are powerful catalysts as individuals and
in groups in creating a healthier planet for themselves, their families, their communities and nations. Women are
'double consumers', they make decisions not just for themselves but for their families as well (7).
In the early times, consumer was considered as king in the market but in the contemporary society, consumers
are no longer safe against the malpractice such as substandard goods and unsatisfactory services (2). Theconsumer has every right to reject any product or service rendered by any manufacturer in the market and can
mould them to produce goods of their choice. Consumer in the market find themselves deceived by wrong
weights and measures, adulterated and substandard products earning great damage to health (8).
The need of the hour is to educate the consumer especially women consumers to form consumer society ororganization to mark it a powerful union at various levels to project their rights of privileges and safeguardthemselves, against the exploitation of the fraudulent businessmen (6). Thus it is essential that women as
consumers need to understand many aspects pertaining to consumer protection.
AIMS & OBJECTIVES
The objectives of the present study were;
1. To promote general awareness of the rights to the consumer by encouraging consumer education.
2. To conscientise and exercise their laws and redressal forum.
161

MATERIALS & METHODS
The household survey is to study the awareness on consumer protection among the selected middle and high
income group women consumers. The study was conducted in Chennai City, a cosmopolitan capital of TamilNadu. The city has been divided intol55 divisions distributed over 10 zones. Among the ten zones, 3 zones were
selected at random for the study. The success of any study depends on the careful selection of the sample.Weighing the merits and demerits of the sampling methods and considering the purpose and nature of theresearch, purposive sampling method was adopted for the study. Interview method was advocated to study thepresent trends in consumer protection. The method of collecting information through personal interview isusually carried out in a structured way. To enable the investigator to put forth questions in a coherent manner,
an interview schedule was framed to collect the data. The investigator later explained the purpose of the study
and collected relevant information from the women consumers. The collected data was systematically consolidated
and analyzed.
RESULTS & DISCUSSION
• Awareness on Consumer Rights: Consumer rights have been drawn out to enable a human being to
achieve social justice and economic equality. It was President John F. Kennedy who declared the consumer
rights for the first time in 1962 American Congress (4).
Table -1: Awareness on Consumer Rights
RightPercentage of Women *
Z value
Middle Income (N=90) High Income (N=90)
Right to Safety 13 44
16.125**
Right to be Informed 33 58
Right to Choose 66 67
Right to be Heard 6 33
Right to Redressal 3 24
Right to Consumer Education 6 22
Right to Healthy Environment 12 62
Multiple response
** Significant at 1% level
'z' - N (0.1) (sample size = 150)
From Table 1, it is clear that majority of high income group women (67%) and middle income group women
(66%) were well aware of the right to choose. The high income group women had better awareness on the
rights especially right to healthy environment(62%). right to be informed (58%) and right to safety (44%).The
awareness of middle income group women consumers were low when compared to high income group women.
The statistical analysis also revealed that there exists a significant difference between the middle and high
income group women on the awareness of consumer rights at 1% level.
Awareness on Legislation: Legislation refers to the laws of the country to protect the interest of consumers.
The awareness on the various laws was low among selected women consumers (5). The knowledge of
high income group women consumers (40%) was higher when compared to middle income group women
consumers (10%) with regard to various consumer protection laws. The extent of awareness on legislation
among women consumers was analyzed and is shown in Table 2.
162

Tkbic 2: Awareness on Legislation
Legislation
Percentage of Women
Z valueMiddle Income
(N=30)
High Income
(N=90)
Agriculture Product, Act, 1937 • 5
12.076**
Prevention of Food Adulteration, 1954 20 30
Fruit Products Order, 1955 13 20
Monopolies and restrictive Trade Practices act. 1969-
5
Weight and Measures act, 1976 20 35
Indian Standards Institution Act, 1952 40 50
Consumer protection Act, 1986 53 60
• Multiple response
• ** Significant at 1% level
• 'z' - N (O.i) (sample Size = 150)
Table 2 reveals that a majority of high income group women (60%) and middle income group women (53%)
were aware only of the Consumer Protection act (1986). This might be because of the propaganda given by theGovernment and Consumer Organizations through various media.
The statistical interpretation indicated that there was significant difference between the middle and high income
group women consumers on the awareness of consumer protection laws at 1% level.
Awareness on Redressal Forum: The Consumer Protection Act 1986 provided the right to seek redressalagainst unfair trade practice or unscrupulous exploitation of consumers through the forum set up under this
Act (8). The awareness on the consumer redressal forum by the selected women consumers shows that
only 57per cent of high income group women and 39% of middle income group women have heard about
consumer redre.ssal forum through the media but they were not aware of the objectives, proceedings and
approach to redressal forum.
Table 3: Income versus Awareness on Redressal Forum
Awareness Income Group Sample Size mean Standard Deviation Z value
Redressal Middle Income 150 216 0.37 2.280*
High income 150 234 0.48
* Significant at 5% level
'Z' - N (0.1) (Sample Size = 150)
Table 3 shows the relationship of income to the awareness of redressal forum. The result shows that there
exists a significant difference between the middle and high income group women consumers at 5% per cent
level. It is inferred that high income group women consumers had greater level of awareness on redressal
forum than middle income group women consumers.
Relationship of Selected Variables Versus Awareness on Consumer Protection Measures
Ibble 4: Selected variable versus Awareness on Consumer Protection
Variables F Ratio
Rights Laws Redrcs.sal
Age 2514* 0.924 '''i 0,264
Educational Status 10.929 8.069 ** 0.201
Homcmaking Experience 3.632 0.303 0,616
** Significant at 5% level
* Signitlcant at 5% level
163

Table 4 and Figure I show the relationship of selected variables with the awareness on consumer protection
measures such as rights, legislation and redressal forum. The statistical interpretations indicated the role of age,
education and home-making experiences in increasing the awareness on right, legislation and redressal forum.
With regard to consumer rights, the education had significant influence at 1% level whereas age and homemaking
experiences had significant influence at 5% level on the awareness of rights. As education increased, the
awareness on the legislation also increased. Both age and homemaking experience did not have significant
influence on the awareness on legislation. Age, education and homemaking experience of women consumers
did not show any significant result in increasing the awareness on redressal forum. It can be concluded that the
awareness of women consumers on consumer rights was satisfactory when compared to legislation and redressal
forum.
■ Scncsl
ID Scrics2
o SericsB
Rights Laws Redressal
Age
Education
Home MakingExperience
Fig. 1: Awareness on Consumer Protection
Need For Consumer Education: Consumer education is one of the most important spheres of work in
consumer protection. Only 80 per cent of middle income group women consumers and 40 per cent of high
income group women consumers realized the need for consumer education to create awareness among women
on better consumerism. The reasons for the need of consumer education as stated by the women consumers
are presented in Table 5.
Table 5:Need for Consumer Education
Reason Percentage of women
Middle Income
N= 120
High Income
N = 60
Make intelligent choice 65 63
Make better manager of their resources of
money, goods time and energy
60 63
Increase the purchasing power of the consumer 59 61
Get maximum satisfaction from the limited resources 57 65
Compare the qualities of goods in the market 55 60
Know about laws 50 67
Improve knowledge on redressal forum 58 62
it is inferred from the study that consumer education might be a powerful tool that could take consumers from
the current disadvantageous position in the market place and would help to protect themselves as well as makeeffective and intelligent choices,
164

CONCLUSION
Consumers can unite together and organize themselves into a national net-work along with consumer activists
to track down fraudulent practices and disseminate information to promote quality of life. In a competitive
economic environment, the consumer has to exercise the choice either in favour of or against the goods and
services. One would have to realize the importance and prepare to exercise their rights with responsibility.Therefore, it is essential to create awareness among women about their rights and responsibilities and the need
for proper development and equal participation in social, political and economic development to enhance women's
empowerment in consumer protection.
RECOMMENDATIONS
1. Establish links with educational institutions like universities, colleges, high schools to emphasize the need forimproving consumer education in the curriculum.
2. Women consumers should involve themselves in monitoring the quality and safety of food in strengtheningconsumer protection.
3. Advocate the development of consumer information programmes through mass media to reach rural andilliterate consumers.
REFERENCES
1. Ahmed F. Consumer Pmwaiuii in India. APH Publishing Corporation, New Delhi (1999). pp. 11.
2. Bal. A. Consiinwr Pmteciion Act, Journal of Economic and Political Weekly. 28 (1) (1993). pp. 432.
3. Dhyani, A.K and Saklani. A. ofRights Among Indian Consumers. Indi.m Journal of M.arketing. 25 (6) (1990). pp. 9-11.
4. Desai, T. and Bhavtin. S. Media and Consumer Protection, Consumer Education and Research Centre. Ahmadabad (1997) pp. 53-56.
5. Gulshan, S.S. Consumer Protection and Satisfaction, Whiley Eastern Ltd, Hyderabad (1994). pp. 18-30.
6. Gupta. K.N. Women's Empowennem and Protection oftheir rights, Social Welfare, 47 (12) (2001). pp. 22-24.
7. Himachalam. D. Con.sumeri.m in India. Indian Journal of Marketing. 21 (5) (1990), pp. II. 13.
8. Sethi. M. and Seetharaman, P. Con.swneri.im A Growing Concept. Phoenix Publishing House. New Delhi (1994). pp. 7,44. 66.
165

FRM/Oral/I2
Sericiiltural Technologies on Rural Women with Reference to Economic Status and Health AspectsShobha B' & Sheela K'
1. Lecturer in Home Science. Smt. VHD Central Institute of Home Science (Bangalore)[email protected] (09448083221)
2. Dean, College of Home Science, Central Agricultural University.
Sangsangre, Tura (Meghalaya)
ABSTRACT
Sericulture is a sustainable economic actively positively favoring the rural poor in theunorganized agricultural sector. An estimated 60 percent of the workforce engaged insericulture are said to be women. There is a need for the farm women to adapt and use theimproved implements and newer technologies, which will help them to increase their wordefficiency, which in-turn improves the quality of life and drudgery alleviation. To make thewomen more competent in various process of sericulture production by creatingand imparting skills to adopt these technologies which make her life safe qualitatively andat the same time reduces health problems. Hence the present .study vvoy undertaken with the
main objective of gaining insight into Seri cultural technologies on rural women with referenceto economic status and health aspects. Two districts ~ Bangalore rural and Kolar inKarnataka state were selected for study comprising 250 households. Out of them 166household belonged to experimental group i.e.. those who practiced newer technologies forsericulture activities (Group I) and the remaining 84 households were the control group whodid not practice newer technologies in sericulture enterprise (Group II). Analysis of thedata revealed that women practicing newer technologies had a substantial increase in the
real income, gained more time and energy to pursue other tasks and were less prone tohealth hazards when compared to women practicing traditional methods of silkworm rearing.
INTRODUCTION
Seiiculture in India is as old as Indian culture, and according to the Indian legend, sericulture was introducedabout 2000 years ago. India is the only country in the world which produces all the four commercial varietiesof silk namely mulberry silk, tassar, muga, eri and mulberry. Silk production in India is largely confined tosouthern region, namely Karnataka, Tamil Nadu and Andhra Pradesh. Karnataka is leading as the premier silkstate.
Sericulture is a sustainable economic actively positively favoring the rural poor in the unorganized agriculturalsector. An estimated 60 percent of the workforce engaged in sericulture are said to be women. Agro basedcottage industries like sericulture being labour intensive, require low initial investment and by earning foreignexchange play a vital role in rural reconstruction programs in the country.
The sericulture industry revolves around both on field and off field activities such as mulberry cultivation andsilk worm rearing At every stage, sericulture workers are confronted with one or the other health risks with thespread of sericulture activities, the number of workers prone to hazards is also on the increase.
Women in sericulture operations face quite a lot of physical and mental drudgery, characterized by long workhours, thereby spending more energy than is physically feasible, difficulties experienced at work, poor managerialskills causes fatigue. Farm women can optimize and synchronize their time in attending to their work with otherhousehold activities.
There is a need for the farm women to adapt and use the improved implements and newer technologies, whichwill help them to increase their word efficiency, which in-lum improves the quality of life and drudgery alleviation.To make the women more competent in various process of sericulture production by creating awareness andimparting skills to adopt these technologies which make her life safe qualitatively and at the same lime reduceshealth problems.
166

The desirable social, economical, educational and psychological development can be achieved only when womenat large are stimulated and motivated to accept and adopt newer technologies and thus improve their life style.Hence the present study was undertaken with the main objective of gaining insight into the Seri culturaltechnologies on rural women with reference to economic status and health aspects.
AIMS & OBJECTIVES
1. To study the socio-economic status of sericulture women.
2. To estimate the mean time & energy expenditure by activities & groups.
3. To know the benefits of introducing newer technologies & also health hazards experienced in sericultureactivities.
MATERIALS & METHODS
A study was carried out on 250 households of Bangalore Rural and Kolar districts of Kamataka State. Twotaluks in Bangalore district comprising of Devanahalli and Hoskote, and Two taluks in Kolar district comprisingof Chikkaballapura and Siddalaghatta was selected. The study was carried out in 16 villages. All the four taluksis fairly well developed with hospitals, transportation, primary health centers, schools and banks. Most of thevillages are provided with basic facilities such as electricity and water supply through installation of bore wells.The taluks have gone into both traditional and commercial cropping.
The household selected for the study were based on purposive random sampling method. Out of 250 households166 households belonged to the experimental group i.e., those who practiced newer technologies in sericultureactivities (Group-1) and the remaining 84 households were the control group who practiced tradidonal sericultureenterprise (Group-II).
Development of Tools and Data Collection: Background information on age, type of family, familysize, education and income of the respondents were gathered. Interview cum observation andquestionnaire method was adopted for collection of data.
RESULTS & DISCUSSION
Socio-economic status is presented in Table 1. Majority of the families in Group-I and Group-II women age wasfound to be 34 years. Majority of the families in Group-I (72%) and in Group-II (61%) belonged to the nucleartype of family. The average family size was found to be 5-6 members.
Table 1: Socio Economic Status
Characteristic Category
Respondents X' Value
Group-I (166) Group-n (84)
N % N %
Age (Years) 21-30 69 42 28 33
3.04'^s31-40 62 37 41 49
41-50 35 21 15 18
Type of Family Nuclear 119 72 51 613.09NS
Joint 47 28 33 39
Family Size £ 4 members 59 35 29 34
1.05'^"5-6 members 69 42 31 37
^ 7 members 38 23 24 29
Education Illiterate 41 25 27 32
3.15«Primary / Middle 70 42 36 43
High School 55 33 21 25
TOTAL 166 100 84 ICQ
♦ Significant at 5% level
NS: Non-Significant
167

The level of education obtained by the respondents in both the groups revealed that majority of the women in
both the groups (42% in Group-I and 43% in Group-II) were educated upto the primary and middle school level.
Statistical analysis was found to be non-significant for age, type of family, family size and education between
the two groups.
8000
htl 987 M ti4000
4984
<800
Fig. 1: Average income from sericulture and subsidiary
The average income obtained from the main and subsidiary occupation to families is presented in above figure.
The findings reveal that the average income from sericulture activity is found to be Rupees. 4,984/- and Rupees.
3,887/- among Group-I and Group-II families. The average income of Group-II families was found to be higher
in agriculture and dairy activities compared to Group-I families. However the statistical findings indicate the
difference in the average income between Group-I and Group-II families is found to be highly significant only
in sericulture and agriculture activities.
Table 2: Information related to sericulture enterprise
Aspects Category Respondents
Group-I(166) Group-II(84) X'Value
N % N %
Area under Mulberry < 1 acre 65 39 58 69 20.16**
Cultivation > 1-2 acres 68 41 16 19
> 2 acres 33 20 10 12
Average ± SD 1.89 ± 1.2 1.29 ± 0.6
Harvesting of Crops / Year Five Crops 98 59 62 74 5.28*
Six Crops 68 41 22 26
Average ± SD S.41 ± 0.5 5.26 ± 0.5
Total 166 100 84 100
* Significant at 5% Level
** Significant at l%Level
N: Non-Significant
Area of mulberry cultivation and harvesting of cocoon crops in a year are shown in Table-2. Analysis of
sericulture activity profile of the families revealed that out of the total respondents in Group-II, 69 percent has
less than 1 acre of land for sericulture cultivation whereas in Group-I, 41 percent of them possessed less than
2 acres of land respectively. Significant difference was found in the area of cultivation between the groups (c^= 20.16**). Majority of the families in both Group-I (59%) and Group-II (74%) took 5 crops per year. Thenumber of crops harvested per year was found to be statistically significant between groups (c- = 3.28*).
168

Ibblc 3: Mean Time and Energy Expenditure by Activities and Groups
Activities
Group-I (166)
Mean
Mean
SD
Group-n (84)
Mean SD
'T' value
A. Household related
Time (mis) 1092 115 960 + 96 9.59**
Energy (K.Ca!) 1609 ± 169 1519 ± 152 4.26**
B. Silk worm rearing
Time (mts) 348 49 480 61 17,22**
Energy (K.Cal) 615 ± 87 865 110 18.51**
Total energy expenditure (K.Cal) 2224 ± 103 2384 ± 117 10.62**
** Significant at 1% LevelNS: Non-Significant
Table-3 results revealed that the mean time spent on household related activities of Group-I women was 1092
mts and energy expenditure was 1609 K.Cal. Group-II women spent 960 mts on household related activities
with the energy expenditure of 1519 K.Cal. For sericulture related activities Group-I women spent 348 mts
expending 615 K.Cal of energy while Group-II women spent 480 mts expending 965 K.Cal of energy respectively.
The difference between both tlie groups for household and silkworm rearing activities was found to be statistically
significant with respect to time and energy expenditure.
Tbbic 4: Procured benefits of introducing newer technologies
Benefits by introducing newer technologiesGroup-I (166)
N %
Reduce Drudgery 157 95
Saves time & Energy 163 98
Easy Way of handling 163 98
Increased Income 164 99
Increased Production 157 95
Reduction in Mulberry Leaf 140 84
Less Diseases 132 80
The benefits stated by the respondents towards introducing newer technologies were increased income (99%;
followed by saves time and energy and easy way of handling (98%), reduced drudgery (95%) and increased
production (95%).
Table 5: Health hazards experienced In sericulture activities
Health Hazards Group-1 (166) Group-II (84) 'z' Test
N % N %
Effect on eye 82 49 42 50 0.89"''
Effect on menstrual cycle 43 26 24 29 0.45"'
Effect of back pain 93 56 66 79 3.50**
Effect of joint pain 80 48 43 51 0.45"''
Frequent Head ache 60 36 45 54 2.65**
Irritability/Allergy/Skin problem 24 15 15 18 0.70"'
Excess of Heat 130 78 54 64 2.38*
No Problems II 7 8 10 0.82"'
* SigniHcant at 5% Level ** Significant at 1% Level NS Non-Significant " Multiple Response
169

The various health hazards experienced by women during participation in sericulture activities are shown inTabIe-5. Study revealed that in Group-I (78%) majority of the women stated excess of heat as a hazard.
Majority of the women in both Group-I and Group-II (56% and 79%) suffered from back pain. This wasfollowed by "frequent" headache among Group-II Women (54%).
Significant difference is observed between the two groups, thus showing that Group-11 women practicingtraditional method for sericulture activities complained more frequently of back pain than Group-I women who
followed newer method which reduces drudgery and simplifies silkworm rearing.
CONCLUSION
Results of the study indicate that women involved in newer technologies had a substantial increa.se in the real
income when compared to women practicing traditional method of silkworm rearing. Majority of them had a
land holding of one to two acres for mulberry cultivation. They harvested five cocoon crops per year. The
benefits experienced by the respondents in practicing newer technologies were increased income, saving oftime and energy, care of handling reduction of drudgery and increased production. Women practicing newer
technologies gain more time and energy for various activities.
Various health hazards were experienced by both the groups of women, Group II women had more number of
complaints than Group I women comparatively. There is an imperative need to build health consciou.snessamong women workers. Women need to be made aware of labour saving devices and improved technologiesso that the work load of the farm women can be minimized, their productivity and the labour efficiency can beincreased
RECOMMENDATIONS
I. The Seri culturists have to be strengthened as producers to help them increase the productivity & organizingwomen group in sericulture so as to facilitate input supply, credit flow and absorption of newer technologies& above all promote the development of self confidence among women through mutual .support.
REFERENCES
1. Antwal PN and Bellurkar C M. Time use pattern of rural women, Journal of Exten.sion Education. 19 (2000), pp. 312-314.
2. Acharya J. Women in sericulture, Puttaraju H P (Editor). Prasaranga, Bangalore University, Bangalore, 199.1, pp. 1-9.
3. Data R K, Production and demand ofsilk in India. International Conference on Sericulture, KSSR and D Institute. Bangalore,1994.
4. Expert consultation on energy and protein requirements, WHO Technical Report, 724. Geneva World Health Organization. 1985,
pp. 178-180.
5. Singal S, Kaushik S and Sethi N, Women's energy expenditure pattern in rural household of Haryana. Journal of ExtensionEducation, 10 (1992), pp. 282-286.
6. Maribasetty, Health hazards in sericulture, Indian Silk, 362 (6) (1997), pp. 39.
7. Narayana K S and Rani P P. Health hazards in sericulture. Social Welfare, 46 (1) (1999), pp, 23-25.
170

FRM/Oral/13
Acceptance of Accessories Made from Reusable Materials
Mamatha B ' & Seema Shirurmutt -
1. Selection Grade Lecturer in Home Science, Smi VHD Central
Institute of Home Science (Bangalore)
[email protected] (9845175373/9482394489)
2. Research Scholar, Smt VHD Central Institute of Home Science (Bangalore)
ABSTRACT
Accessories are ihose decoraiive items that no home can do without them. Making accessoriesusing waste or discarded materials is the way of recycling. Recycling in today's world is amust to save our environment and to have a clean healthy place to live in. Hence this study
undertaken to elicit information on acceptance of accessories made from reusablematerials. A sample of 100 college students were selected randomly of that 50 each fromHome Science and Non Home Science college. A consumer acceptance survey throughexhibition was conducted. The data tiw collected with help of the questionnaire and ratingscale. The findings of the study were that the accessories made from reusable materials wereappreciated and accepted by the students. But Non Home Science students preferredreadymade accessories when compared to Home Science students who mainly preferredhandmade accessories.
INTRODUCTION
Accessories play a vital role in completing the decor and making the house a home. They are the elements thatbring charm, individuality and vitality to a room. Accessories need not always be necessarily bought but theycan be made at home. All it needs a little creativity. Many items can be made use of beautifully instead ofthrowing them away as unwanted items. The old saying "one man's thrash is another man's treasure" appliesaptly to accessories. We can make them even from the waste obtained in household. These wastes are dividedinto three categories. The Usable, Reusable and the Useful. The second one i.e. Reusable can be aptly utilizedto make desired accessories. Accessories when they are hand made, gives a more personalized touch. Onecannot imagine the ideas they can stumble upon when they start recreating from waste, the items made neednot be very elaborate. It can be as simple as making pen stands from bangles or ice cream sticks, paper bagsfrom old newspaper to making elaborate items as decorative candles and so on.If time permits for home maker or students, this hobby can be channelized into useful an occupation which notonly gives a boost to their skill and imagination but also at the same time provide them with economic support.Hence this study was aimed at collecting informadon on the acceptance of accessories made from reusablematerials
AIMS & OBJECTIVES
The aim of the study is to elicit information on the acceptance of accessories made from reusable materials byHome Science and Non Home Science students. The objectives of the study are listed below.
1. To find out the awareness of reusable materials between Home Science and Non Home Science students.
2. To know the acceptability of accessories made from reusable materials.
METHODOLOGY
In order to find out acceptance of accessories made from reusable materials, consumer acceptance surveythrough an exhibition was conducted. Questionnaire and 5 point rating scale were the tools used for the study.A sample of 100 students i.e. 50 each of Home Science and Non Home Science .students were selected.Twelve accessories made from five reusable materials like glass, paper, cloth, wood and metal were selectedfor exhibition. The exhibition was held at Smt. V.H.D Central Institute of Home Science. The tools were
administered and respondents were asked to fill it after viewing the accessories displayed. The data obtainedwere consolidated, tabulated and analyzed statistically.
171

RESULTS & DISCUSSION
Majority of the respondents were in the age range from 18 to 22 years and were studying in UG and PG level.Most of the respondents felt they were aware of the reusable materials and majority of them recognized thereusable materials. Some of the respondents marked leather rubber and plastic as reusable materials. Thoughthese materials can be recycled but they are harmful for the environment.
Reasons for using accessories:
The reasons for using accessories were analyzed; Home Science and Non Home Science students gavefirst preference to decorative purpose followed by as a hobby and functionalism. The fourth and fifthpreferences were to cover space and for the sake of convenience. The data was analyzed statisticallyusing Friedman's two ways ANNOVArank test and was found that there was a highly significant differenceregarding their preference of using accessories.
Reasons for Preference of accessories made from reusable materials:
Figure 1 reveals that higher percentage of the respondents preferred accessories made from reusablematerials because it is creative and saves environment. Higher percentage of the Home science studentspreferred hand made accessories than Non Home Science students.
Fig-1
60
SO
? 40c
z 30«
o. 20
10
0
5.•if
22 ie
ass
Crcatrve
Roaions
Help lo save Peiwial likingenviroAiTieAl
Table 1: Mean acceptance scores of accessories made from five reusable materials
Accessories Design Colour Durability Workman Associated
ship materials
HSc NHSc HSc NHSc HSc NHSc HSc NHSc HSc NHSc
Glass
Tea coaster 3.96 4.18 3.96 3.42 3.94 3,76 3,94 3.76 3.70 3.54
Pen stand 3.68 4.20 3,88 3.26 3.76 3.76 3.76 3.56 3.46 3.20
Paper
Newspaper bag 3.88 3.92 3.32 2.98 2.52 2.82 3.72 3.56 3..36 3.34
Cardboard bag 4.28 4.14 3.82 3.42 3.40 3.20 3.80 3.64 3.52 3.42
Lampsliade 3.48 3.94 3.28 3.02 3.02 2.90 3.46 3.52 3.40 3.06
Cloth
Folder -1 3.84 4.18 3.70 3.88 3.70 3,38 3,80 3.60 3.70 3..34
Folder - 11 3.76 4.12 3.98 3.52 3.56 3.50 4.00 3..^6 3..52 3.32
Multipurpose folder 4.18 4.08 3.84 3.66 3.70 3.54 4.10 3.58 3.44 3.54
Wood
Photo frame 3.40 4,28 3,84 3.36 4.28 3.58 3.90 3.42 3.54 .3.18
Pen and Paper stand 4,06 4.38 3.78 3.56 3.38 3.22 3.74 3.48 3.52 3,20
Metal
Hanging lamp 4.34 4.62 4,04 3,84 3.80 3.70 3.68 3.86 .3.66 3.36
Table Lamp 4.28 4.62 4.14 3.62 3.82 3.52 3.98 3.46 .3.72 3.48
HSc = Home Science, NHSc = Non Home Science
172

Table I reveals the mean acceptance scores of accessories made from five reusable materials. The acceptability
of accessories from reusable materials were studied with reference to different aspect like design, colour,durability, workmanship and associated material used. The rating given for these attributes were very good to
good. Durability in terms of pen stand made from bangles. Newspaper bags and lampshade rated fair by NonHome Science students.
Table 2: Mean acceptance score on cost of accessories
Accessories HSc NHSc
Glass
Tea coaster 3.14 3.02
Pen stand 3.28 3.20
Paper
Newspaper bag 3.42 2.80
Cardboard bag 3.12 3.08
Lamp.shade 3.52 3.38
Clotii
Folder -1 2.68 2.46
Folder-II 2.72 2.64
Multipurpose folder 2.60 2.40
Wood
Photo.frame 3.44 2.78
Pen and Paper stand 3.34 3.12
Metal
Hanging lamp 2.50 2.80
Table Lamp 2.34 2.54
Table 2 depicts that both groups belonging to Home Science and Non Home Science Students had similarresponse regarding cost rating. The respondents felt that the accessories made from cloth and metal wereexpensive when compared to the accessories made from paper, glass and wood for which the students ratedmoderate.
CONCLUSION
The study was an attempt to elicit information on accessories made from waste materials and higher percentageof the respondents were aware of reusable materials. The accessories were well appreciated and acceptedwell by the respondents. But the Non Home Science students preferred ready made accessories when comparedto Home Science students who mainly preferred hand made accessories.
RECOMMENDATIONS
Recycling of materials helps us to conserve energy, land, reduce pollution and saves money. There are manyobjects in the household, which go directly into waste basket. If these objects are used efficiently and transformthe waste into useful accessories, it not only saves the environment but also gives the object a new look and atthe same time satisfaction to the maker of the item, filling an inventor of ideas.
This study can be further extended to sensitize the community regarding reducing, recycling and reusing thewaste into useful form thus making our environment cleaner and healthier to live.
REFERENCES
1. Mehra P. A do il yourself hook - Interior Decorotion. I" Ed., Hind Pocket book. New Delhi, 1997.
2. Richard Waiie. Hoiis-eltold waste recycliiif;. Earth Scan Publication.s Ltd. London. 1995.
173

FRM/Poster/1
Reflections of Homemakers on Dual Establishment through Swot Analysis
KVPadmavathi
Head of the Dept. of Home Science, Ch.S.D.St. Theresa's
Autonomous College for Women, Eluru, WG Dist (AP)
[email protected] (9490789765 / 08812234234)
Empowerment of women is a challenge to society because it breaks the long established pattern of
family life and with this, values and beliefs supporting them. Over the decades there have been significant
changes in the developing countries of the world due to population explosion, urbanization, spread of literacy,
industrial development and exposure to the media of communication. Due to these changes males tend to
migrate to urban areas for maintaining the standard of living. Male migration motivates the formation of dual
established families in which life partners stay apart either for short or extended periods. The process of
migration with its positive and negative consequences continues to be a social reality. Male migration made its
impact on female members to undertake the roles and responsibilities of male counterparts. The homemakerswith their experience in dual establishment gave their opinions on Strengths, Weaknesses, Opportunities and
Threats of staying apart from male counterparts. The homemakers of dual established families enlisted strengthssuch as monetary boon for the family (90 per cent) followed by children's education (88 per cent), enhancing
standard of living (82.6 per cent), empowerment of women (81 per cent) and acquiring assets (80 per cent).
About 84.8 per cent of employed homemakers favoured more on strengths over full time homemakers (75.1
per cent) on dual establishment. Over 90 per cent of homemakers remarked the weaknesses on dual
establishment such as absence of spouse during social functions, burdened with more responsibilities, difficulty
in sharing views over phone. Above 80 per cent of the homemakers stated the opportunities of dual establishments
such as empowerment of women, children acquiring responsibility and freedom for homemaker in resource
management. About 35.9 per cent of employed homemakers and 26 per cent of full time homemakers opined
the threats such as fearful situations in the society and children's misbehaviour affecting their development
respectively.
FRM /Poster/2
Designing Colonial Theme Restaurant reflecting the British Era of Kolkata
Sweta Mesaria' & Neerja JaiswaP
1. Faculty, Dept. of Home Management, Family & Community Sciences,
The Maharaja Sayajirao University of Baroda (Vadodara)
[email protected] (09825240330)
2. Faculty, Dept. of Home Management, Family & Community Sciences,
The Maharaja Sayajirao University of Baroda (Vadodara)
[email protected] (09099769905)
The present design project was undertaken with the objectives, a), to identify the famous historical
monuments of British era in Kolkata, b).to study the design elements used in the interiors of these selected
historical monuments, c).to design a colonial theme Restaurant reflecting British Era of Kolkata in Vadodara
city, and d).to estimate the cost of the design developed for the theme project. The observation sheets wereused to gather the details for developing case studies on the existing interior features of the wall and its treatment,floor and its treatment, ceiling and its treatment, furniture and fumishings, lighting and accessories of the selected
174

British colonial monuments of Kolkata and the existing status of the restaurant "Trident" of the Revival Lord's
Inn at Vadodara. The proposed design project included the schedule of two dimensional drawings made with
the support of "AUTO CAD" version 2005-06. The three dimensional drawings were created from new
software called "Autodesk Inventor" version 2009. Based on the developed case studies on colonial British era
monuments of Kolkata, the flooring, walls, ceiling, lightings and accessories of the selected restaurant at Vadodara
was designed. The designing of the present project would be useful as a resource material for the staff,
students and institutions pursuing interiors as one of the subject in their curriculum. It would also be useful for
the professionals In the field of Interiors.
FRM/Poster/3
A Study on Usage of Mobile Phone amongst College Students in Kolkata
Komal Sharma' & Phorum Shah-
1. Lecturer (Sel Gr) and Seclional-incharge, Resource Management Section,
Dept. of Home Science, J. D. Birlii Institute. Kolkata (West Bengal)
[email protected] (9830401721)
2. Ex-.student, M.Sc in Resource Management, Dept. of Home Science.
J. D. Birla Institute, Kolkata (West Bengal)
To find out the Overdependence on Mobile Phone, 100 female college- going students in the age group18-21 and 21 -24 years in the city of Kolkata were surveyed by the questionnaire method. The areas integratedunder this study were the usage pattern and home, health, social and emotional adjustment of these students. In
this research work, the students who had a habit of using their cell phone for more than 2 hours and for sending
more than 10 messages daily were referred as overly dependent on their cell phones. The results showed that
'mobile phone' use is higher in younger age group (I8-21years). 1095-2190 hours (43 -91 valuable days) in ayear Is spent knowingly or unknowingly over the cell phones to stay connected with others. Nearly half of therespondents get 'depressed', 'irritated', 'anxious' and 'annoyed' when their cell phone do not ring for more
than 30 minutes . In the study it was found that if home adjustment is unsatisfactory, then there is an increasein the number of messages sent per day. The study showed that students who have very unsatisfactory home,
health, social and emotional adjustments have a habit of usage of cell phones daily for 2hours and above.
FRM/Poster/4
Middle Income Group Families with Working and Non-Working Wife & their Income & ExpenditurePatterns- A Comparative Study
Ratna Bannerjee' & Ishita Biswas-
1. Ex-student, M.Sc in Resource Management, Dept. of Home Science,
J. D. Birla Institute, Kolkata (West Bengal)
2. Lecturer, Resource Management Section, Dept. of Home Science,
J, D. Birla Institute, Kolkata (West Bengal)
[email protected] (92305 .36797)
The study entitled 'How middle income group families with working and non-working wife spend andsave-a comparative study conducted In Kolkata metropolis' was done to determine the effect on the expenditureand saving patterns with respect to the earnings of the woman in the family. With the changing economicpatterns, woman has started going out to work and her monetary contribution has affected the life-style to agreat extent. To understand this change, the pattern of expenditure and saving was studied & compared to thatof the families with non-working women. Data on expenditures and savings was collected from families withworking wife In the income range of Rs.20000-40000. The income group was further classified in the range ofRs.20000-30()00 and Rs.30000-40000. The study revealed that the families with working women had a tendencyto spend more even though they belonged to the same Income group. Non-working wife preferred saving to
175

• f
i ; -. • ': !
investment and also safer modes of investment than shares which involve higher risks. It may be brought inafter the study that there is a psychciogical factor that plays in the mind of the family members with workingcouple with respect to their expenses which gives them the confidence to face life as it comes and live a betterlife than others with the same income.
FRM/Posler/5
An Analysis ofthe Occurrence of Carpal l\umel Syndrome among Men and Women Using Computers
Agrata Wahi ' & Nandita Da.s -
1. Ex-Studeni, M.Sc in Resource Management,
J. D. Birla Institute. Kolkata (West Bengal)
2. Lecturer. Dept. of Home Science,
J. D. Birla Institute, Kolkata (West Bengal)
[email protected] (9903121849)
A Study was conducted to find out the incidence of carpal tunnel syndrome, an inflammatory di.sorder ofthe median nerve at the wrist, on 78 computer users working in 7 different companies in Kolkata. Men andwomen in the age group of 25-60 years were studied. The study revealed that 55% of men and 77% of womenshowed symptoms of carpal tunnel syndrome. Men in the age group of 46-60 years and women in the agegroup of 36-45 years were most affected. The study also showed that men and women working for more than10-15 years on the computer, which requires repetitive movement of the wrist while using the mouse weremore prone to have signs of carpal tunnel syndrome. It was seen that only 15% of computer users used thecorrect posture while sitting and using the mouse and 85% used incorrect postures while doing the same. Thosewho look rest in-between work just once and still showed symptoms were 83% whereas. 62% of respondentswho did not reveal symptoms took rest thrice These aspects require re-evaluation of workplace designs withflexibility of height of work place and chair as well as reach distance of operator with emphasis on goodworking postures.
FRM/Poster/8
Feasibility of Improved Sickle in Drudgery Reduction of Farm Women
Manju Gupta', Sudesh Gandhi^ &Asha Rani'Senior Extension Specialist, Krishi Vigyan Kcndra,
Bawali Disti Rewari, CCSHAU Hisar, (Hariyana)
[email protected] (09810305422,09416868186)
Senior Scienti.st Dept. of FRM Specialist, CCSHAU, Hisar (Hariyana)
sgandhi021 @gmail.com
Senior Extension Specialist, Directorate of Extension Education, CCSHAU. Hi.sar (Hariyana)
I.
2.
3.
In rural areas, about 60 percent of agricultural operations are handled exclusively by women. Duringharvesting season, local sickle is mainly used in cutting of wheat, maize, guar etc. by farm women which is notwork efficient and leads to drudgery of women. Hence, the present study was undertaken to introduce theimproved sickle and assessing its acceptability among rural women. The data were collected from 30 womenrespondents of different villages through personal interview schedule consisting of statements on tool factor,stress, output and overall acceptability. Feasibility study exhibits that improved sickle was highly acceptable byrural women. Majority of the women (93.7%) reported that it was very efficient in cutting crop and henceincreased the output by 20 percent. It also reduced stress in the form of physiological fatigue and bio-inechanicalstress. Cutting was faster due to serrated and self-sharpening blade of the sickle. The design of the handlegave a better grip leading to lesser grip fatigue (3.8%). The improved sickle was highly acceptable in the fieldscoring 92.9 percent and has been adopted successfully by respondents of different villages. Therefore, improvedsickle needs to be used by the farmwomen in crop harvesting which reduces the drudgery and increases herwork efficiency.
176

" The test of literature is,
I suppose, whether we ourselves
live more intensely for the reading of it. "

''The greatest gift is a passion for reading.
It is cheap, it consoles, it distracts,
it excites, it gives you the knowledge of the world
and experience of a wide kind.
It is a moral illumination. "

HUMAN DEVELOPMENT, FAMILY STUDIES AND EARLYCHILDHOOD EDUCATION AND DEVELOPMENT
(Oral & Poster Presentation)


iWiTiVlii,-
HD/Oral/2
Assessment of Knowledge, Attitude and Practice ofAnganwadi Workers About Non-Formal Preschool Education
Ila Jogi
Head, Dcpi. of Home Science, Mahila Mahavldyalaya, Karad,
Disc. Satara (Maharashtra),
[email protected], (09422384738)
ABSTRACT
Anganwadi worker is a key person in the Integrated Child development Services programme
and has multiple responsibilities for the development of women and children. The AWWs not
only provide package of ICDS sendees to the beneficiaries but also maintains close and
continuous contacts with the community. She also acts as crucial link between the village
population and the government administration and thus becomes a central figure in
ascertaining and meeting the needs of the community she lives in. The study was undertaken
to asses the level of knowledge, attitude and adoption of NFPSE by AWWj to know variousdifficulties encountered by AWWs in carrying out preschool activities and invite suggestionsby AWWs for increasing effectiveness of preschool education. The study waj conducted inKarad ICDS block in Satara district of Western Mahatashtra. Forty were selected forthe study. Data was collected with the help of developed and pre-tested structured schedulethrough personal interview with the AWWs. A scale for assessment of level of knowledge,nature of attitude and the practice of NFPSE was developed by observing procedure andfollowing steps meticulously and responses were sought in five point continuums with scoringkey. It is evident majority (50.00, 62.50 and 67.50 percent) of the respondents were in themedium category for their level of knowledge, their favourable attitude to some extent andpractice of NFPSE activities respectively. Almost more than fifty percent of the AWWs reporteddifficulties such as inadequate space for AWCs, lack of adequate toys, lack of communityparticipation, lack of proper teaching aids, overburden of work, multifarious jobs, tasksand assignments to be performed in addition to their legitimate work, lack of co-operationfrom other organization/institutions. Suggestions offered by AWWs were provision of teachingaids and playing materials, their existing amount of honorarium should be increased,sufficient space for buildings to accommodate AWCs, non-assignment of additional workother than their legitimate work, organization of training programmes etc.
INTRODUCTION
Anganwadi worker is a key person in the Integrated Child development Services programme and has multipleresponsibilities for the development of women and children. Anganwadi is the focal point for the delivery of the
services to children and mothers in their doorsteps through Anganwadi worker. The AWWs not only providepackage of ICDS services to the beneficiaries but also maintains close and continuous contacts with thecommunity. She also acts as crucial link between the village population and the government administration andthus becomes a central figure in ascertaining and meeting the needs of the community she lives in.The productivity of an organization depends upon employee's job performance and infrastructure, methods, jobdesign and raw materials. Besides the technological considerations, the job performance of the worker dependsprimarily on employee's ability and motivation to perform. The ability generally depends upon skill, job knowledgeand factors like intelligence but the motivational aspect of the individual is "job performance" which is morecomplex phenomenon. Motivation or willingness to work is a more important factor and it directly affects thequality of work produced by an individual. Present study is an attempt to understand role of AWWs in ICDS.
■. 119'

AIMS & OBJECTIVES
1. To asses the level of knowledge, altitude and adoption of NFPSE by AWWs.
2. To know various difficulties encountered by AWWs in carrying out pre-school activities.
3. To invite suggestions by AWWs for increasing effectiveness of pre-school education.
MATERIALS & METHODS
The study was conducted in Karad ICDS block in Satara district of Western Mahatashtra. Forty AWWs were
selected for the study. Data was collected with the help of developed and pre-tested structured schedule
through personal interview with the AWWs. A scale for assessment of level of knowledge, nature of attitude
and the practice of NFPSE was developed by observing procedure and following steps meticulously and responses
were sought in five point continuums with scoring key.
RESULTS & DISCUSSION
• Assessment of Knowledge, Attitude and Practice of Non-Formal Pre-School Education Activities by the
AWWs:
AWWs are in true sense having major role in the functioning of Anganwadis. Efficient execution of duties
by the AWWs as far as carrying out NFPSE activities appropriately to a great extent depends upon how farand to what extent they possess complete knowledge about the same, posses' favourable attitude towards
and implement these activities in effective manner which has the impact on overall development of children.
It is in this context very much necessary to know level of this attributes (knowledge, attitude, and practice).Attempt was therefore, made to assess these attributes. Quantification was done with the help of simple
teacher made scale and responses were sought in five point response continuum with scoring key. Distribution
of AWWs on the strength of score earned by them on different attributes is presented below.
Table-l: Knowledge, Attitude and Practice of Non-Formal Pre-School Education Activities by the AWWs
SI. Attributes Respondents Reporting
No. No. (N= 40) Percent
1. Knowledge
i) Low (Below 82) 7 17.50
ii) Medium (82-98) 20 50.00
iii) High (Above 98) 13 32.50
2. Attitude
i) Un favorable (Below 82) 6 15.00
ii) Favorable to some extent ((82-96) 25 62.50
iii) Favorable (Above 96) 9 22.50
3. Practice
i) (Below 67) 4 iO.OO
ii) Medium (67-74) 27 67.50
iii) (Above 74) 9 22,50
It is evident from the table majority (50.00, 62.50 and 67.50) of the respondents were in the medium category
for their level of knowledge, their favourable attitude to some extent and practice of NFPSE activities respectively.
This was followed by the number of respondents who were included in the high category of these attributes.
Numbers of respondents who find their place to accommodate themselves were in the low category of knowledge,attitude and practice of NFPSE worked out to be 7, 6 and 4 respectively. In an attempt to understand logic and
rationality behind these findings, it was understood that probably emphasis might not have been given on training
input for carrying out pre-school education activities and training programmes arranged for them mostly coveredaspects such nutrition, health and immunization etc.
180

Difficulties Encountered by AWWs in Carrying out Pre-School Education Activities:
AWWs were encountering variety of difficulties in carrying out pre-school education activities in their
respective. Difficulties spelled out by them have been presented in the table below.
Table 2: Dlfllcultics Encountered by AWWs in Carrying out Pre-SchooI Education Activities
SI.
No.
Difficulties Respondents Reporting
No. (N= 40) Percent
1. Insufficient space for AWCs 32 80.00
2. Lack of adequate toys to children 28 70.00
3. Lack of proper teaching aids 24 60.00
4. Lack of supervision/guidance from supervisor/CDPO 9 22.50
5. Lack of community participation 25 62.50
6. Lack of other organizations/ institutions' involvement. 22 55.00
7. Time spent in completing records and attending the meetings. 8 20.00
8. Poor response of parents of beneficiaries 11 27.50
9. Overburden of work 23 57.50
Above table elucidates that majority (80.00 percent) of AWWs were experiencing serious difficulty of
inadequate space for AWCs and so finding difficulties in carrying out various types of activities. Besidesnon-availability of adequate space, buildings provided for AWCs are suffering from other problems such as
leakage, lack of ventilation and light etc.
This difficulty is followed by the number of AWWs who have reported lack of adequate toys, lack of
community participation, lack of proper teaching aids, overburden of work, multifarious jobs, tasks and
assignments to be performed in addition to their legitimate work, lack of co-operation from other organization/institutions. Some AWWs although their number was less however reported their difficulties as lack of
supervision/guidance from supervisory personnel and lot of time consumed in completion of records and
attending monthly meetings.
Suggestion Offered by AWWs for Increasing Effectiveness of Pre-School Education:
Table 17: Suggestions Ofl°ered by AWWs for Increasing Eflectlveness of Pre-School Education
SI. Suggestions offered by AWWs Respondents Reporting
No. No. (N= 40) Percent
1. Sufficient Space for AWC buildings 28 70.00
2. Playing material should be provided 30 75.00
3. Adequate teaching aids should be provided 32 80.00
4. Equipments should be provided 16 40.00
5. Training programme for AWWs should be organized 23 57.50
6. Honorarium should be increased 29 72.50
7. Additional work other than legitimate work
should not be assigned as far as possible. 28 70.00
8. Quality of food served should be improved 13 32.50
9. Maximum possible community participation should be sought 18 45.00
10 Co-ordination with primary schools be established and maintained 14 35.00
181

Information in the table denotes that majority (80.00 percent) of the respondents suggested that teaching aidsshould be provided to the maximum possible extent. Because it is the teaching aid that makes teaching effective,attracting children to remain present in the Anganwadi. Provision of playing materials has been .suggested by asmany as 30 AWWs. Play material is also responsible for influencing physical and motor development besidesencouraging development of creativity, concept formation, logic, radonality, thinking and reasoning. Play materialalso provides an opportunity to the children for social interaction developing thereby social relations andunderstanding each other in true sense.
This has been followed by the number ofrespondents who have suggested that their existing amount of honorariumshould be increased (72.50 percent), sufficient space for buildings to accommodate AWCs (70.00 percent),non-assignment of additional work other than their legitimate work(70.00percent), organization of trainingprogrammes (57.50 percent), maximum possible community participation and provision of sufficient equipmentsin the AWCs besides getting co-ordination and co-operation from primary schools and supply of quality food for
serving to the beneficiary children should be made available.
CONCLUSION
Majority of the AWWs were in the medium category for their level of knowledge, their favourable attitude to
some extent and practice of NFPSE activities. Almost more than fifty percent of the AWWs reported difficulties
such as insufficient space for AWCs, lack of adequate toys for children, lack of community participation, lack
of proper teaching aids, overburden of work, lack of co-operation from other organizations.
AWWs offered suggestions for effective implementation of the programme to fulfill the objectives. Some of the
worth mentioning suggestion were adequate teaching aids and play materials should be provided, amount of
remuneration they are presently receiving should be increased, provision of sufficient space for AWCs, non-
assignment of additional work other than their legitimate work, organization of training programmes, maximum
possible community participation and provision of sufficient equipment in AWCs.
RECOMMENDATIONS
1. Training programmes should be organized at a regular interval to strengthen the capabilities of AWWs.
2. Monitory returns in terms of honorium should be revised in commensurate with the quantum of efforts put
forth by them in performing their duties.
3. Provision for adequate infrastructural facilities should be made.
REFERENCES
1. Dongre AR, Deshmukh P R and Garg B S. Perceived Responsibiliiies of Anganwadi Workers and Malnutrition in Rural Wardha,
Online Journal of Health & Allied Sciences. 7 (1) (2008) ISSN 0972-5997
2. Chattopadhyay D, Knowledge and skills of anganwadi workers in Hoogly district, West Bengal, Indian Journal of Community
Medicine. XXIX (3) (2004), pp. 117 .
3. Shobha J, Welfare services for women and children. Discovery Publishing House, New Delhi, 2003, pp. 134-142.
4. Punhani R and Mahajan R, Research on ICDS: An Overview. National Institute of Public Co-operation and Child Development,
New Delhi, 1989.
182

HD/Onil/3
A Study on Knowledge, Attitude and Practices Regarding Gender l^IatedA^ects among R^alPeople
D Vijayarani ' & G Baradha -
1. Lecturer in Home Science, V V Vanniaperumal College for Women,
Virudhunagar and PhD Scholar in Avinashilingam University for Women,
Coimbatore (Tamil Nadu)
[email protected] (09486030789)
2. Profes.sor in. Human Development, Avinashilingam University for Women,
Coimbatore (Tamil Nadu)
ABSTRACT
Gender is the social interpretation of attitude, behavior, relationships, moral values and
social values of an individual on the basis of sex. Indian women continue to be discriminatedeven in 21" century. There is an urgent need to promote social awareness about genderamong the rural people. Hence a study was taken to identify the knowledge, attitude andpractices regarding gender related aspects such marriage, child rearing food, health,education, savings, and property rights among rural men and women. Sixty samples wereselected from the village Vadamalaikurichi in Virudhunagar taluk from VirudhunagarDistrict using simple random sampling technique. A self made interview schedule was usedto collect information from the respondents. It was found that no significant difference inthe knowledge, attitude and practices between rural men and women regarding the genderrelated aspects. But there a significant difference in the practice of gender related
aspect of marriage between rural men and women. Eighteen percent of males and 56percent offemales got married below the age of 18. It was disheartening to note that onlyIS percent of males and 16 percent offemales knew the legal age for men and only 18percent of males and nine percent of females knew the legal age for women. It was shockingto find that 96percenl of males and 97 percent offemales opined that they get dowryduring their son's marriage, whereas 71 and 75 percent of males and females respectivelyknew that getting dowry is punishable. Ninety six and 94 percent of males and femalesrespectively told that both the parents are responsible to take care of the children but inpractice children are taken care by the females only. Eighty five percent of the respondentsknew that both males and females have the right to get property from their parents. But 96percent of the male respondents and all the female respondents like to give their propertyto their sons only. We have to get over the traditional sex roles and practice egalitarian sexroles in our day today life. This is only possible by means of a complete revolution in ourthinking and attitude towards gender equality. Equality is only possible when ideology ofpeople changes in society through gender sensitization.
INTRODUCTION
The Indian Constitution, in Articles 14, 12, and 16 provides for equality between men and women. But inpractice there is often denial of equality for women in large parts of India, particularly in rural areas. Genderis the social interpretation of attitude, behaviour, relationships, moral values and social values of an individualon the basis of sex. It refers to the socially determined and culturally specific differences between women andmen. It is the basis of differences in behaviour, expectations, roles and responsibilities that all women and menlearn in the context of their own societies. Indian society makes a distinction between men and women, whichhas made women, almost everywhere and in each sector, inferior to men. They have fewer rights, controlfewer resources, work longer hours than men, which either undervalued or underpaid. It is this genderingwhich helps in perpetuating the gender difference, in India. Gender determined attitude and roles are verycommon and found at various levels from childhood to adulthood; from family to workplace. In the era of
183 ■

globalization women are still in the last position in education, health and socio-economic status. Nearly 35 percent of women are illiterate in India. They contributed half to total population and also have their 1/3 share in therevenue of the country. But they are only one per cent owner in the entire property of the country. Indianwomen continue to be discriminated even in 21" century. Hence there is an urgent need to promote socialawareness to gender issues and women's human rights.
AIMS & OBJECTIVES
With this aim the study on gender awareness among rural population was taken up with the objectives to:• identify the knowledge, attitude and practices regarding gender related aspects among women and men of
the selected rural area and
• compare and analyze the knowledge, attitude and practices towards gender related aspects of the selectedrural people
MATERIALS & METHODS
The sample size consists of 60 which include educated and illiterate males and females belonging to differentcaste and income levels from the village of Vadamalaikurichi in VirudhunagarTaluk from Virudhunagar district.
The simple random sampling was followed in selecting the rural men and women. A self made interview
schedule was used to collect information on knowledge, attitude and practices regarding gender related aspectsof education, marriage, child rearing, food, health, savings and property rights after developing a rapport with
the respondents. Codes were allocated and appropriate scores were given to measure the knowledge, attitudeand practices of gender related aspects. The overall total score of the knowledge, attitude and practice itemswere calculated. For all the positive statements, expressing a favourable attitude,; the scores were fixed to
range from 3 to 1, for responses ranging from Always, Rarely, Never and forYes-1 and No-0. And for negative
statements, expressing a negative attitude; the scores were fixed to range from 1 to 3, for responses rangingfrom Always, Rarely, Never and for Yes-0 and No-1.
RESULTS & DISCUSSION
The collected data was analyzed using percentiles and the statistically treated. The findings are presented
below:
Of the 60 subjects studied, 48 percent belonged to 31 to 35 years out of whom 46 percent were males and 50percent were females. Thirty seven percent belonged to 26 to 30 years out of whom 32 percent were males and40.6 percent were females. With regard to education 38 percent were illiterates out of whom 40 percent werefemales and 35 percent were males. Thirty four percent females and 28percent males completed their primaryeducation 65 percent of the respondents belonged to coolie. Out of whom 71 percent were males and 59percent were females. Twenty eight percent of females were unemployed and three percent of males were
unemployed
• Marriage
a) While there is no significant difference in the knowledge and attitude of gender related aspect of
marriage between rural men and women, significant difference between rural men and women was
found in the practice of marriage. It was found that 18 percent of males and 56 percent of females gotmarried below the age of 18.
b) It was disheartening to note that only 18 percent of males and 16 percent of females knew the legalage for men; only 18 percent of males and nine percent of females had the awareness on the legal agefor women.
c) It was happy to find that all the respondents considered their sons and daughters in mate selection.
d) It was shocking to find that 96percent of males and 97 percent of females opined that they get dowryduring their son's marriage. Whereas only 71percent of males and 75 percent of females knew thatgetting dowry is punishable.
184

Child rearing
e) The selected rural men and women had similar Knowledge, attitude and practice of gender related
aspect of child rearing.
Ninety six percent of males and 94 percent of females told that parents are responsible to take care
of the children.
Care of the children by Males Care of the children by Females
Ven
R
eV
lUOn
80
60-
40-
20-
o4a A
B D E
Mules
G H
I Always B Rarely □ Never
R
"5u
C D EFemales
I Always B Rarely □ Never
Fig I: A-Eating, B-Bathing, C-Dressing, D-Toilet training, E-Guidance for studies,F- Accompanying to school, G-Playing, H- Health care
a) It was happy to know that all the respondents' children of both the sexes were immunized.b) Sixty one percent of males and 56percent of females expressed that male child always enjoy higher status
in the family• Health
a) All the respondents' son and daughter were taken care when they fall sick. Ninety five percent of therespondents viewed that husbands were taken care well when they fall sick and seventy two percent ofthe respondents felt that wives were taken care when they fall sick.
• Food
a) There is no discriminatory practice in providing food to their son and daughter. Ninety three percent of therespondents opined that rarely there was discrimination in giving food to the husbands and 70 percent ofthe respondents' expressed that rarely there was discrimination in giving food to the wives.
• Education
a) As far as education is concerned knowledge, attitude and practice of rural men and women did not differ
Zlct
00 .|
80'
60-
40- ;P!|20- iiilj
<1- / •
Men Women
□ Ahvnys □Rnrely □ Never
Fig 3: Rural men and women'sattitude on preference of higher
education for boys
'T' 1.'
;'-l
t:l| ; ■'(' iiilRi-Men Women
0Always, □Rarely □ Never
Fig 4: Rural men and women'sattitude on preference of higher
education for girls
185

Ibble 1: Purpose of Saving Money
SI. No Purpose of Saving Money For Males (%) For Fcmalc.s (%)
1. Marriage 17 42
2. Education 35 15
3. Medical 8 3
4. Future 45 33
• Property rights
a) There is no significant difference in the knowledge and attitude of rural men regarding issue of property
rights.
b) Eighty five percent of the respondents knew that both males and females have the right to get property
fixim their parents. But 96 percent of the males and all the females preferred to give their property to
their sons only. Eighteen percent of male respondents and 31percent of female respondents like to give
their property to their daughters also.
CONCLUSION
It is necessary to generate awareness among the rural people about gender equality through gender sensitization.
We have to get over the traditional sex roles and practice egalitarian sex roles in our day today life. We mustspread scientific thinking on a massive scale and encourage people to give up superstitions and backward ideas.This is only possible by means of a complete revolution in our thinking and attitude towards women. Equality isonly possible when ideology of people changes in society. A cultural struggle is needed to sweep away allremnants of the disgusting practices particularly with respect to women. These should be replaced with scientificthinking and genuine and complete equality between men and women. Therefore gender-sensitive education isnecessary for the rural people that treats women and men, girls and boys equally and encourages them toachieve their full potential-
RECOMMENDATION
Gender-sensitive education is necessary for the rural people that treats women and men, girls and boys equallyand encourages them to achieve their full potential-
REFERENCES
1. Katju J M, The ideal of women's emancipation. The Journal of Women's Empowerment, 24, (1) (2009). pp. 2-5.2. Subburaman. Women education and development-camp approach. Journal of Extension & Research. 9 (1 & 2) (2007).
il86,

HD/Oral/4
Awareness of Never Married Adults (20-35 Years) Regarding Matrinionlal Websites
Mansi V Mehta & Kamini. P Rege
1. Research Siudeni, Podar Education Network, Podar Centre, Mumbai (Maharashtra)
[email protected] (09867087977)
2. Assistant Professor, College of Home Science, Nirmala Niketan, Mumbai (Maharashtra)
ABSTRACT
Internet has changed our life in every way; even the way of searching for a spouse by
registering on matrimonial sites. The objective was to examine the awareness of never married
adults (20-35 years) regarding matrimonial websites. Desired information ivai' elicited from
100 never married adults located in Mumbai through a questionnaire that comprised of
thirteen questions on awareness. The results revealed that more of the participants were
aware of - i) the websites, such as Shaadi.com, bharatmatrimony.com, jeevansathi.com; ii)
the source of information included internet, television, newspaper. However a majority of
the participants were unaware of individuals who found a spouse or had a bad experience
as a consequence of using matrimonial websites. Indians have become tech savvy and jumpedon the Internet bandwagon to find the Mr/Mrs Right, but still the customs, traditions and
core values remain the same. Choosing a spouse has become tough for current generation
as they believe in tested kind of relationships and are unprepared to choose a partner who
is strange for them. Researching about the increasing popularity of matrimonial websites isrecommended as it is an eye-opener and enlightens the young adults regarding their alertness,understanding, judgment and information regarding matrimonial websites.
INTRODUCTION
In today's world everyone (child or adult) is so familiar with the word internet. India is very renowned for its
use of technology especially in the urban areas. In a metropolitan city like Mumbai there is widespread use ofinternet for many reasons, such as finding information, social networking, and making friendships. But we
cannot forget the importance of finding a spouse through matrimonial services and also the matrimonial websites.There can be a variety of problems when utilizing online dating sites. Following is a list of less than positiveaspects of Matrimonial website: d) instincts about a person are based not just on what ideas they want tocommunicate, but on appearance, body language, facial expressions and tone of voice all subtleties that are lost
when communicating via computer, no matter how many emoticons you use, g) photos can be out-of-date or aninaccurate representation, dishonesty abounds made up profiles, exaggerated claims and married people posing
as single and more, chemistry can not be determined online, h) some users spam sites with fake profiles that arein reality advertisements to other services, such as prostitution, multi-level marketing, or other personals websites,i) even when members' profiles are real, there is still an inherent lack of trust with other members because such
sites may give them an unending supply of new targets of opportunity for Intemet fraud.
AIMS & OBJECTIVES
To examine the awareness of never married adults (20-35 years) regarding matrimonial websites.
MATERIALS & METHODS
• Sample Size: The total sample size consists of ICQ never married adults (50 females and 50 males) fromMumbai, Thane and Navi Mumbai.
! 1187.

Sampling Technique: In social science research, snowball sampling is a technique for developing a research
sample where existing study subjects recruit future subjects from among their acquaintances. Thus the
sample group appears to grow like a rolling snowball. As the sample builds up you gain enough data to use
for your data.
Inclusion and Exclusion Criteria: The inclusion criteria for participants were: a) those who reside in
Mumbai, Thane and Navi Mumbai; b) who is between 20 to 35 years of age; c) coming from divorced/
single/remarried/widow/widower family; d) belonging to any community, caste and religion; e) having an
educational qualification of post SSC, employment status (employed/ non- employed) and matrimonial website
user or non user.
Exclusion criteria were: a) divorcee, widow/ widower or remarried; b) exceptional/special adult (physically/
mentally challenged); c) belonged to the lower socio-economic strata; d) who were already into a relationship/is dating.
Sample Characteristics: There were 100 never married males between 20- to 35 years. More of theparticipants were graduates and some possessed a post-graduate degree. Majority of the participants wereHindus; very few were Christians and Muslims. More of the participants belonged to nuclear families andfew from joint families and extended families. A majority of the participants were in service. Only a few
were professionals. Most of the participants fell in Rs. 50,000 and above income bracket. None of theparticipants had chosen their life partner, however they were in the process of searching the same.Tool, Method and Procedure: Desired information was elicited from 100 never married adults located inMumbai through a semi structured, self constructed face to face questionnaire (open and closed endedquestions) that comprised of thirteen questions on awareness for a period of 45 minutes.
RESULTS & DISCUSSION
• Meaning of Matrimonial WebsitesMore of the never married participants defined matrimonial website as a source by which an individual couldget to know, more specific information of spouse they would be searching and also have broader perspectivefor selecting a spouse, few indicated that it helps people to find their life partner though it may or may not befruitful, yet another set mentioned, that a matrimonial website is where people advertise themselves alongwith their details, such as photograph, age, occupation to find partner for getting married and that it provideswide variety/ range of people to select for a life partner. (Refer to Table 1).
• Awareness Regarding the Names of the Matrimonial Websites
Majority of the never married participants indicated Shaadi.com, moderate mentioned Bharatmatrimony.comand little less than half of the participants stated Jeevansathi.com. (Refer to Table 2).
• Sources for Knowing the Names of Matrimonial WebsitesThe participants indicated varied sources through which they came to know regarding the matrimonial
websites. More of the participants viewed the advertisement on the internet and television. The strikingdifference was found among the responses of participants regarding the source, namely newspaper andhoardings. Few of them indicated friends, relatives and parents being the source (Refer to Table 3).
Table 1: Never Married Adults' Awareness Regarding the Meanings of Matrimonial Website
Meanings of the matrimonial website Never Married
Females
f (n=50)
Never Married
Males
f (n=50)
NeverMarried
Adults
f (n=100)
Source by which an individual could get to
know, more specific information of spouse 20 15 35
Helps people to find their life partner though
it may or may not be fruitful 8 10 18
People advertise themselves along with their
details, such as photos, age, occupation 7 8 15
188

Tbblc 1: Never Married Adults' Awareness Regarding the Meanings of Matrimonial Website
Meanings of the matrimonial website Never Married
Females
f (n=50)
Never Married
Males
f (n=SO)
NeverMarried
Adults
f(n=100)
A place where an individual can actually
advertise oneself to reach all over the world 5 8 13
Provides wide variety/ range of people to
select for a life partner 5 5 10
It is a place where one can find a perfect
soul mate and also get varied choices 3 4 7
A meeting point / place for all the
spinsters and bachelors 1 3 4
Table 2: Never Married Adults' Awareness, Regarding the Names of Matrimonial Websites
Names of the matrimonial websites Never Married Never Married Never Married
Females Males Adults
f {n=50) f (n=50) f (n=100)
Shaadi.com 40 32 72
Bharatmatrimony.com 29 25 54
Jeevansathi.com 24 12 36
Simplymarry.com 9 9 18
Any other 5 4 9
• Matrimony.com 5 4 9
• Rediffmatchmaker.com 2 2 4
• Marriage.com 1 1 2
• Just marry.com 1 0 1
• Dawoodibore.com 1 0 1
• Find your match.com 1 0 1
• Saathi.com 1 0 1
Note. Multiple responses were obtained
Table 3: Never Married Adults' Awareness Regarding Sources/ Modes that Facilitate in Knowing the Names of
XMatrimonial Websites Sources/modes that
Never Married Never Married Never Married
facilitate in knowing the names Females Males Adults
of matrimonial websites f (n=50) f (n=50) f {n=100)
Viewed the advertisement on/in 40 35 75
• Internet 35 30 65
• Television 34 26 60
• Newspaper 28 17 45
• Hoardings 17 10 27
Had conversation with 17 11 28
• Friends/ social groups 14 9 23
• Relatives 8 4 12
• Parents 4 4 8
Through marriage bureaus 4 0 4
• Any other
• Heard advertisements on radio 1 2 3
• Viewed posters in the train 1 0 1
Note. Multiple responses were obtained
■l#' ;

• Knowledge Regarding Individuals, Who Had Found a Spouse through the Matrimonial Website and theirExperiences
Majority of the participants (never married females [32]; never married males [33]) indicated that they didnot know anyone who had found a spouse through matrimonial website. However some of the participants
(never married females [14]; never married males [17]) indicated that they knew people who had found a
spouse through matrimonial website. Substantial majority of the never married adults (never married females
[44]; never married males [43]) indicated that they did not know anyone who have had a bad experience as
a consequence of using matrimonial websites, while very few (never married females [6]; never married
males [7]) knew people who bad experience as a consequence of using matrimonial websites.
CONCLUSION
Finding a mate through matrimonial website is a very fascinating thing which many people have started using it.
Everything has its beginning, a history, but there is no particular history for marriages through matrimonialwebsites. But here the history of internet and marriage are mentioned earlier separately. There are many
factors also that do affect the selection of mate through internet (Shackelford, Goetz, & Buss, 2007). But as we
all know that there are always two sides of the same coin, similarly there are advantages and disadvantages,
barriers and suggestions of selecting a spouse through matrimonial websites. Taking the opinions of adults
might give us a more clear view on what they think matrimonial websites are all about.
RECOMMENDATION
Most importantly, the nature of this study is beneficial for the never married adults as they are provided with theopportunity to introspect and reflect on their thoughts, feelings and emotions in relation to their opinions andawareness regarding matrimonial websites and providing a scope for searching a spouse.1. Attitude of parents regarding their son/ daughter searching for a spouse through matrimonial website.2. Study could focus on the perception of parents searching spouse for their never married son/ daughter
through matrimonial websites.3. Further studies could include individuals who have already found their spouse through matrimonial websites
along with the never married adults.4. Research can be done to find out the attitudes and perception of special individuals, such as widowers/
widows, remarried, divorcee, handicapped parents' with regard to searching for a spouse through matrimonialwebsites.
5. Marital satisfaction among the partner (husband and wife) married through matrimonial website.
6. Other ways of finding a spouse through internet, such as online dating, orkut, chatting and its advantages andlimitations.
REFERENCES
1. Keller M C.Thiessen D and Young R K, Male assortment in datins and married couples. Personality and Individual Differences,
21 (2) (2006), pp. 217-221.
2. Rubin A and Babbie E, Research methodsfor social work. Pacific Grove, CA: Brooks/Cole, 3"^ Ed., 1997.
3. Shackelford T K, Goetz A T and Buss D M, Mate retention in marriage: Further evidence of the reiiahiiity ofthe mate retention
inventory. Personality and Individual Differences, 39 (2007), pp. 415-425.
u _

HD/Oral/5
Appraising Perceived Self-Efficacy and its Influence on Specffic Efficacy Outcomes
K Arockia Maraichclvi ' & Hasna K T'
1. Lecturer. Dept. of Human Development. Avinashilingam University for Women,
Coimbatore (Tnminadu)
[email protected] (09843114463)
2. Research Scholar, Dept. of Human Development, Avinashilingam University for
Women, Coimbatore (Tamil Nadu)
ABSTRACT
Meta analysis across different spheres of functioning confirms the influential role of perceived
self efficacy in humans' self development, adaptation and change (Bayer et al., 2000 and
Miritz et al., 2000). Cibb (2000) brings out the fact that there are at least four kinds of self
efficacy outcomes (behavioural, emotional, social and academic outcomes) in an adolescenteach of which is instrumental in e.xplaining how adolescent's behave and their willingness
to persist the behaviour. Therefore, this study was etnbarked by appraising perceived selfefficacy to these efficacy outcomes before and after enhancement. Two hundred adolescentgirls (100 each in 2'"' and 3"' year graduation) from Avinashilingam University for Women,Coimbatore were selected. The tools used were Standardized Effectiveness Scale to knowthe effectiveness type of the sample and a Rating scale to find out the accomplishment ofSpecific Efficacy Outcomes (SEC). While categorizing the self effectiveness type only 28%
of the girls were found to be effective before enhancement. The substantial leap in the meanscores and t value significance for the data of SEO score on all the three efficacy outcomes(Behavioural and emotional outcome. Social outcome and Academic outcome) portrays theefficacious nature of effective girls when compared to their counterparts. The enhancementprogramme imparted to the secondary sample of ineffective girls (143 out of 200 girls)proved to be efficient as 70% of them shifted themselves from the ineffective to effective
face, thus proving the worth of the self efficacy enhancement programme.
INTRODUCTION
'Street children' being a problem created by the society, a movement against social and human inequality,exploitation, abuse and cruelty needs to be focused by the researchers to fill the gap existing between the street
children and the community as a whole (Navreet, 2003),. Thus, it is of an imperative need to improve the healthstatus, develop good psycho-social qualities and facilitate them to venture on a vocation in order to sketch theminto the mainstream of the society. Aligned with this milieu, an education programme was developed withspecial reference to street children known as "Life Enrichment Education (LEE)" focusing on improving theirphysical, psycho-social and vocational strength.LEE is designed to enhance the quality of life of the street children through life skills. Life skills have beenidentified by WHO (1994) as "the abilities for adaptive and positive behaviour that enable individuals to dealeffectively with the demands and challenges of everyday life".
Life Enrichment Programme can be operationalised to specific situations. The characteristics and situation ofthe street children in responding to their needs and problems were collected by reviewing previous researches,observation of the life style of street children residing in the rehabilitation homes and the interview with theDirectors of these homes. Based on this information the needs, problems of these children were evinced andrecognized that these group of children have to be educated on certain aspects namely importance of goodphysical health, abstaining from substance use, awareness on sexual and reproductive health, training to manageemotions, motivating to be assertive, building up decision making and goal setting ability and exposure to vocationaltraining.
191

It is presumed that LEE lessons may motivate these children to realize their self positively, help them to restoretheir health and well-being, promote healthy interactions with their own peers and other people and instigatethem to understand the responsibilities to lead a contented and successful life in the years ahead. Therefore, thisstudy was embarked with the trust that through the designed LEE Programme, the chosen unprotected sectionof the children can be encouraged to a hopeful prospect. Hence the objectives framed for this study were to• Assess the street children's existing knowledge/attitude/skill (KAS) on their life style with respect to
a) Health care
b) Psycho-social issues and
c) Vocational issues
• Develop an appropriate curriculum of LEE for street children and chalk out its strategies
• Enhance the selected street children's overall development by imparting LEE to gain insight on health care,
psycho-social and vocational issues
• Assess the efficacy of LEE imparted to the street children
• Obtain the feedback of LEE and
• Preparation of a guidebook on LEE for future use.
MATERIALS & METHODS
The methodology pertaining to this study is presented as follows
• Selection of the Area and Sample : Don Bosco Anbu Illam' for boys at Ukkadam, Coimbatore and
'Mariyalaya' for girls at Ganapathy, Coimbatore, Tamil Nadu were identifed and selected for the studyaiming to impart LEE among street children. All the 66 boys and 52 girls within the age frontier residing inthe selected rehabilitation homes were chosen for the study.
• Construction of Tools : The trivia of the tools primed, constiucted and used are
1. Interview schedule to elicit general background of the selected street children
2. Interview schedule to elicit KAS of the selected street children on life enriching activities - It was further
divided into three components for the three dimensions
a) Interview schedule to assess the KAS of the respondents on physical dimension: brings thedata on health care by incorporating questions on physical fitness, nutrition, hygiene, disease control,
details of substance use, knowledge on reproductive health and on STD's and AIDS.
b) Interview schedule to assess the KAS of the respondents on psycho-social aspects: gets theinformation on communication and listening skill, interpersonal relationship, assertive behaviour,emotional development, decision making and problem solving ability, enhancing moral values andutilization of leisure time.
c) Interview schedule to elicit the vocational aptitude of the selected sample: devised to collect
data on the motivation to undergo vocational training
On implementing the suggestions of experts the interview schedule was redesigned and pilot study was conductedwith twenty-five respondents. The modified schedule was quantified by scores and administered to the selected
sample before and after LEE to evaluate its efficacy, in terms of their knowledge gain, attitudinal change andskills developed in adopting healthy practices.
• Questionnaires to determine the feedback of the LEE programme : The checklist designed todetermine the feedback of LEE was alienated into two sections namely
a) From the Directors and educators of the rehabilitation homes
b) From the teachers of the school where the beneficiaries were enrolled
• Questionnaire to evaluate the suitability of the guidebook : The guidebook primed was tested for itssuitability to the target group's needs and interest with the help of a questionnaire by administrating tosubject experts.
192

• Conduct of the Study : The study was conducted in four phases, as given below:
Phase I: Establishing rapport - The personnel of rehabilitation homes, were oriented about the importance
of LEE intervention to street children and were convinced for their benevolence. Also a sense of trust and
a rapport in and with the children (the beneficiaries) was established to maximize the degree of trust.
Phase II: Collection of data - The interview schedule was administered to the beneficiaries to find out initial
KAS base on life enriching activities. Each child was interviewed in person by the investigator by spending20 to 25 minutes.
Phase III: Conducting LEE - LEE was conducted in three stages
a) Selection of the content: Tlie content selected was categorized into three dimensions namely
• Physical Dimension (Health care - nutrition, hygienic practices, disease control and physical fimess;Abstaining from substance use; Awareness on sexual and reproductive health, HIV/AIDS)
• Psycho-social Dimension (Social development - interpersonal relationship, communication and listeningskill, assertive behaviour; Emotional control and behaviour. Decision making and problem solvingability; Developing acceptable moral behaviour; Utilization of leisure time)
• Vocational Dimension (Exposure to various vocations; Motivation).
b) Method of instruction : The method of knowledge acquisition, attitude change and skill acquisitionfollowed in this research, include role play, situation analysis, small group tasks, debates, content analysis,brainstorming, relaxation and tmst building exercises and games. LEE was conducted for a period of fivemonths with an approximate period of instruction of one hour daily in each rehabilitation homes. Theperiod of instruction varies for each and every aspect depending upon its depth essential for the selectedsection of street children toting up to 379 hours (Physical Dimension- 75 hours; Psycho-social Dimension- 256 hours; Vocational Dimension - 18 hours)
c) Efficacy of the LEE intervention : On completion of LEE, the interview schedule on physical, psycho-social and vocational aspects were re-administered to the selected street children, to find out the efficiency
of the programme.
Phase rV: Preparation of the Guidebook - A guidebook on Life Enrichment Education was developed forwider use among the children residing in other institutions. Experts scrutinized the developed content foreffective documentation.
• Analysis of Data : For the analysis of data, percentage, t-test and test of ANOVA were performed.
RESULTS & DISCUSSION
The data collected from the study was thrashed out under the subsequent heads.
• General profile of the selected adolescent girls
a) A great majority (42.5%) of them were in their nineteenth year.
b) Vast majority of them were Hindus (79%) followed by Christians (13.5%).
c) Majority of them were city bom (74%).
d) Seventy nine per cent of them belonged to nuclear family.
• Appraisal of effectiveness of the selected adolescent girls in relation to self disclosure, opennessto feedback and perceptivcness
a) The average overall total score of the 200 respondents were in the range of 500-700 against a maximumof 1000 for each of the statement related to self disclosure.
b) Prior to the enhancement programme the beneficiaries were not conscious of their wrong discernmentwith regard to openness to feedback which was obvious Irom the overall mean score in the range of 6.5-
7.5 against a maximum of 10.
c) The grand total on perceptiveness showed only a slight difference among 2"^ and 3"^ year graduates.
193

Categorization of the selected adolescent girls based on their e^'ectiveness
Based on the SE score 28 per cent of the second year and 29 per cent of the third year girls were categorized
as being effective totaling it to a total of 28.5 per cent. Meddling into the other categories of effectiveness
other than effective type, 143 of them were grouped into various other categories, hence called ineffective
or secondary sample to ease the conduct of the study.
Specific Outcome Accomplishment (SEC) by the selected sample in relation to behavioural and
emotional outcome, social outcome and academic outcome
The level of SEO accomplishment is discussed under the following heads
a) Behavioural and emotional outcome accomplishment by the selected sample
• With respect to the interpersonal strength the total score ranges from 370-450, highlighting the fact
that one fourth of the sample was well adjusted to any situation.
• The data with regard to interpersonal strength and involvement in family between the second and
third year mean scores was not statistically significant and they are in need of certain enhancementprogramme to boost up their self-efficacy.
• The't' value calculated on emotional health revealed that the third year graduates could be more
efficacious in accomplishing the affective strength.
b) Social outcome accomplishment of the selected sample
• The't' value between the counterparts on cooperation, empathy and assertiveness was significant
highlighting the fact that age and experience determines the level of self-efficacy and thereby itsoutcome.
• The total score on self control and responsibility fell in the range of 350 - 460, which projects that only
one fourth of the sample possesses self control over their behaviour.
c) Academic outcome accomplishment of the selected sample
• Regarding the data on confidence in academic matters, the grand mean score obtained was only13.98 by the second years' whereas third years had an upheaval of 14.37.
• The importance of possessing the personality type - academic hardiness got into the wits of only fewselected girls that resulted in a total mean score of 13.34.
• With respect to the total scoreof self in school and functioning in school, the't' value being significantat five per cent level projects that the third year graduates could function in school better than secondyear graduates.
• Comparing SEO score of behviourai and emotional outcome, social outcome and academicoutcome with efficacious nature of the selected sample : The change in the level ofaccomplishment of behavioural and emotional outcome, social outcome and academic efficacy outcomewith preference to the efficacious nature of the selected adolescent girls was depicted in Table I.The leap in the overall mean score and the statistically significant't' value calculated with the data onall the specific efficacy outcomes revealed that the selected effective girls due to their enhanced level
of self-efficacy were more conversant on accomplishing these outcomes.
• Categorization of the secondary sample based on their effectiveness after enhancementprogramme: The categorization made after the enhancement programme particularly with secondarysample is compared to the categorization of all the respondents before the enhancement programmes.Out of 143 girls categorized as ineffective or secondary sample before enhancement, 101 of them
were categorized as effective after enhancement marking the efficiency of the enhancement
programme.
194

Table 1: -Comparing SEO score of academic outcome with efficacious nature of the sampie
SI.
No.
Academic outcome Effective (57)Ineffecl ve (143) 't' value
Total
MSS0
Total
MSSD
Behavioural and emotional outcome
1 Interpersonal strength 12.56 2.11 10.26 0.12 4.3055**
2 Intrapersonal strength 12.65 1.86 10.66 0.11 3.7252**
3 Involvement in family 14.11 2.86 11.60 1.29 4.6986**
4 Affective strength 12.74 2.41 9.34 0.21 6.3646**
Grand Score 52.05 5.81 41.86 1.73 4.7641**
Social outcome
Co-operation 13.84 2.35 10.41 0.23 6.1514**
2 Empathy 14.04 2.41 11.99 0.69 3.6765**
3 Self control and responsibility 13.56 1.84 10.71 0.52 5.1112**
4 Assertiveness 13.95 1.76 10.16 0.37 6.797**
Grand Score 55.39 6.06 43.21 1.81 5.4519**
.Academic outcome
1 Academic confidence 14.79 2.25 10.93 0.180 5.6642**
2. Academic hardiness 13.58 1.84 10.24 0.006 4.9011**
3. Self in .school 12.14 2.91 9.4 0.205 4.0060**
4. Functioning in school 12.51 1.75 10.20 2.886 3.3897**
Grand Score 53.09 6.33 40.78 3.277 4.5159**
MS-Mean Score ; ** Significant at 1 per cent level
CONCLUSION
To conclude this research investigated how self-efficacy relates to its outcomes as a consequence of development.Also the study had proved the fact that self-efficacy could influence choice of activities, effort and persistence
with behaviour reflecting the performance of previously learned skills. Hence, Self-efficacy is the belief that
one can master a situation and produce positive outcomes.
RECOMMENDATIONS
1. The knowledge of self-efficacy has to be imparted to the children before the period of adolescence as itwould help them to improve the effectiveness and outcome accomplishments.
2. The school curriculum should be strengthened by incorporating aspects in the education system to augmentthe effectiveness of the children.
3. The self-efficacy of the adolescent boys could be assessed and compared with girls to check out theeffectiveness in their work.
4. The enhancement programme for self-efficacy can be conducted for a wider span of time to have an
effective outcome by gaining the knowledge on pros and cons of every construct.
REFERENCES
1.
2.
3.
BoyerD A, Zollo J S, Thompson CM, Vancouver JB, Shevii'mgKaadSms'E, A quantitative review of the effects of iitanipnlaiedselfefficacy on performance. Poster Session Presented at the Annual Meeting of the American Psychology Society, Miami, 2000,pp. 400.
Gibbs C J, Self efficacious teachers - New directions in the reconslniclion ofteacher education. Professorial lecture at AucklandUniversity of Technology, 2000. pp. 76.
Miritz S E, Feltz D L, Fahrbach K Rand Mack D E, The relation of self efficacy measures to sport performance: A inela-analyticreview, Research Quarterly for Exercise and Sport, (71) (2000), pp. 280-294.

HD/Oral/6
Psychosocial Impacts of Changing Family Patterns on the Elderly in Kolkata
Paromita Ghosh
Reader, Dept. of Home Science, University of Calcutta (West Bengal)[email protected] (09830035739)
ABSTRACT
The aim of the investigation was to study the changing pattern of relationships of the middleclass aged with their family members and its impact on their depression levels. Two studieswere conducted. In study 1 a questionnaire was administered on stratified random samples
of 66 male and 74 female elderly. It was found that majority of them felt they could stay
most peacefully with and would prefer to die in the presence of their spouse and children.
In study 2 , an information blank and the Beck Depression Inventory were administered on
stratified random samples — one of 50 elderly staying with and another of 50 elderly residing
without their offspring. It was revealed that the elderly desire to stay with ojf.spring mainlyfor security; the offspring generally discourage close grandparent-grandchildren relation;
most children staying separately have infrequent contact with aged parents; the spouses are
more caring towards the ailing elderly but the aged staying apart from their offspring are
more depressed.
INTRODUCTION
The elderly in India are at crossroads. It used to be customary for them to stay with the families of their adult
offspring. But the situation is fast changing. There has been large scale disintegration of the joint family systemin India mainly owing to migration of the younger generation in search of better careers and intergenerational
conflicts. Consequently, many elderly have been forced to reside separately. The practice of sending the senior
citizens to old-age homes has also become popular in the urban areas of the country.
The older persons who stay apart from their offspring suffer from deficits in social support and interpersonalconnectedness leading to psychological problems like loneliness, anxiety, depression etc. The Indian elderly, ingeneral, long to stay within their intact families. However, some of them are fast realizing that by residingseparately, they can maintain their independence, dignity and avoid burdening their children.
AIMS & OBJECTIVES
To study the changing pattern of relationships of the elderly with their family members and its impact on their
depression levels.
MATERIALS & METHODS
• Hypotheses for Study 1
1 Majority of the elderly feel that they can live most peacefully with their spouse and offspring.
2 Most of the elderly prefer to die in the presence of spouse and children.
• Hypotheses for Study 2
1. Majority of the aged persons want to reside with their offspring for the sake of family cohesion.
2. Most of the elderly perceive that their offspring discourage their loving relationship with their grandchildren.
3. There is frequent contact between mo.st of the aged staying separately and their offspring.
196

4. During illness, the elderly perceive more caring attitude of the spouse than the children.
5. There is difference in the levels of experienced depression between the aged persons residing with and
without their offspring.
Sample
Study 1: Stratified random samples of 66 male and 74 female middle class Bengali elderly residents of
Kolkata were selected. 70 of them were aged between 60-70 years while another 70 were of 70-80 years.
Persons of different marital statuses and living arrangements were selected.
Study 2: Stratified random samples (each comprising 65% men and 35% women aged between 60 and 90
years) - one of 50 elderly residing with offspring and another of 50 elderly living apart were selected. In the
latter sample, 25 persons lived alone while the rest 25 stayed with spouse. Ail the participants belonged to
middle class Bengali families of Kolkata; none were childless.
Tools
i) Questionnaire to assess the attitudes of the aged regarding aging and dying was administered in Study 1.
ii) Information Blank to collect data regarding the family relations of the elderly. It was used in Study 2.
iii) The Beck Depression Inventory (Beck et al., 1961) is a standardized test which measures depression in
adults. It was administered in Study 2.
RESULTS & DISCUSSION
Ibble 1: Persons with Whom the Aged Can Stay Most Peacefully
Responses Men Women Total
Spouse 4(6%) 8(11%) 12 (9%)
Spouse and Children 55 (83%) 48 (65%) 103 (74%)
Children 5(8%) 2(3%) 7(5%)
Siblings 2(3%) 12 (16%) 14 (10%)
Alone 0 4(5%) 4(3%)
Total 66 74 140
Table 1 reveals that an overwhelming proportion of old people believe that they can reside most peacefully with
their immediate family. So hypothesis l.I is verified. This is in line with the result of Nandal et al. (1987).
Ihble 2: Presence of Persons Most Desired by The elderly When Dying
Responses Men (N=66) Women (N=74) Total {N=140)
Children 9(14%) 16 (22%) 25 (18%)
Spouse and Children 54 (82%) 44 (59%) 98 (70%)
Other Family Members 3 (5%) 12 (16%) 15 (11%)
Friends 0 2(3%) 2(1%)
Table 2 shows that a vast majority of the senior citizens prefer the presence of nearest ones at the end of life in
tandem with the finding of Nandal et al. (1987). Thus hypothesis 1.2 is supported.
Table 3: Reasons Aged Persons Want to Stay With Children
Responses Living Arrangement
AIone(N=25) With Spouse(N=25)
of OlTspring (N=50)
With Spouse and Family
Security 25 (100%) 25 (100%) 50(100%)
Family Togetherness 17 (68%) 14 (56%) 36 (72%)
Absence of Loneliness 23 (92%) 18 (72%) 46 (92%)
Financial Help 15 (60%) 11 (44%) 17 (34%)
Care During Illness 20 (80%) 18 (72%) 23 (46%)
Sharing Responsibilities 18 (72%) 11 (44%) 27 (54%)
197

It is obvious from Table 3 that the elderly have cited many reasons. The factor of security tops the list followedby absence of loneliness in consonance with the findings of Taqui et al. (2007) and Munshi et al. (2008). Sohypothesis 2.1 is not accepted.
l^ble 4: OlTspring's Encouragement for Loving Relation Between the Elderly and their Grandchildren
Responses Living Arrangement
Alone(N=25) With Spouse(N=25) With Spouse and Family
of Offspring (N=50)
Yes 4 (16%) 4 (16%) 11 (22%)
Sometimes 16 (64%) 14 (56%) 15 (30%)
No 5 (20%) 7 (28%) 24 (48%)
Most of the elderly living apart perceives that their offspring only encourage occasional loving interaction withthe grandchildren. 48% of those living with offspring feel that their children discourage the development ofaffectionate grandparent - grandchildren relations. Thus hypothesis 2.2 is upheld.
Table 5: Frequency of Contact with Offspring Living Apart
Frequency of Contact by Offspring Living Arrangeme It
Alone (N=25) With Spouse (N=25)
Daily Visit 0 0
Weekly Visit 3 (12%) 3 (12%)
Monthly Visit 13 (52%) 10 (40%)
Yearly Visit 4 (16%) 8 (32%)
No Visit 5 (20%) 4(16%)
Daily Phone Call 4 (16%) 1 (4%)
Weekly Phone Call 4 (16%) 13 (52%)
Monthly Phone Call 11 (44%) 7 (28%)
Yearly Phone Call 4 (16%) 1 (4%)
No Phone Calls 2 (8%) 3 (12%)
Table 5 reveals that for majority of the elderly, the contacts with their offspring (living separately) are infrequent
so hypothesis 2.3 is not verified. There are a few elderly whose children do not contact showing extreme
apathy. This may lead to psychological problems among the aged (Taqui et al., 2007; Munshi et al., 2008).
Table 6: Perceived Attitudes of Family Members During Illness of Elderly
Attitudes Living Arrangement
With Spouse
(N=25)
With Spouse and Family
of Offspring (N=50)
Uncaring. Harsh 0 35 (70%)
Caring, Loving 20 (80%) 3 (6%)
Helpful But Cold 5 (20%) 12 (24%)
Table 6 shows that majority of the aged residing with spouse enjoy affectionate care during sickness but those
living with spouse and offspring often meet with harsh attitudes from the latter (congruent with the finding of
Dandekar, 1996). Thus hypothesis 2.4 is accepted.
198

'Rible 7: Result of t-Tcst For Din'crcnce in Mean Depression Scores Between the Two Samples
Samples Mean S.D. t calculated t crit „ Inference
Elderly Living Without Offspring
(N=50)
46.20 9.82
+ 6.10
±2.63 The difference is
signiricantat.Ol levelof significance
Elderly Living With Offspring (N=50) 33.64 10.73 (df = 98)
Table 7 shows significant difference in mean depression scores of the two samples. So hypothesis 2.5 is
supported. The elderly living apart experience more depression. This agrees with the results of Taqui et al.
(2007) and Munshi et al. (2008).
CONCLUSION
It is more convenient and emotionally fulfilling for the Indian elderly to stay within the family fold. But socialchanges have forced them to live separately. Deprived of filial care, they are vulnerable to psychologicalproblems like depression. So humane support services for the elderly are urgently required.
RECOMMENDATION
Day care centres for the elderly should be set up in every locality so that they can interact among themselves
in a congenial milieu. Medical, counseling and emergency services as well as recreational facilities must beavailable in such centres. Visits to the households of the lonesome elderly should be regularly arranged to assistthem, undertake errands for them, and give them company and to take care of them. The neighbours andvolunteers must be mobilized for this purpose.
REFERENCES
1. Beck A. Ward C Mendelson, M Mack J and Erbaugh J, An inventoryfor measuring depression. Archives of General Psychiatry,
4 (1996), pp 561-571.
2. Dandekar K, The elderly in India, Sage Publications, New Delhi, 1996
3. Munshi Y I. Iqbal M, Raflque H and Ahmad Z, Geriatric morbidity pattern and depression in relation to family support in agedpopulation of Kashmir valley. The Internet Journal of Geriatrics and Gerontology, 4 (1) (2008), pp. 1-6.
4. Nandal, D S, Khatri R S and Kadian R S, Aging problems in the structural context, Edited by M L Sharma and T M Dak, Agingin India, New Delhi, 1987.
5.
6.
Sharma V Singh, K Mehta M and Neetima, Living arrangement of rural women in Haryana: A survey. Journal of Psychometry,21(2) (2007), pp. 65-72.
Taqui A M. Itrat A, Kidwal W and Qadri Z, Depression in the elderly: Doesfamily system play a role? A cross-sectional study.BMC Psychiatry, 7 (2007), pp, 57.
.199'

HD/Oral/8
Media Preferences among Urban Adolescents ofJammu
Neeru Sbarma' & Ruchira Sapni^1. Associate Professor, PG Dept. of Home Science.
University of Jammu (Jammu)
[email protected] (09419212010)
2. Designation, PG Dept. of Home Science,
University of Jammu, (Jammu)
ABSTRACT
The present research was carried out to study media preferences among urban adolescents
of Jammu (Urban), in context of age and sex. The sample size was 120 adolescents, 60 early
adolescents (30 boys and 30 girls); and 60 late adolescents (30 boys and 30 girls): selected
using multistage sampling. Interviews were conducted using a schedule with both open and
close ended questions. The results reveal that Television is the most preferred medium in
which educational, sports programme, movies and cartoons are the most preferred. For
females especially TV is the most preferred media. Male adolescents, both early and late,prefer computers and video games. Majority of the adolescents spend 2-3 hours, on anaverage, watching TV. Majority of adolescents do not prefer watching late night programmeson TV. Parental involvement was found to be more with females than males while watching T
V or reading. Most of the adolescents spend Rs 50 to Rs 100 monthly from their pocketmoney on computer, DVD's, books and magazines, but late adolescent males do not hesitateto spend Rs 200-Rs 400. The study also shows that majority of early adole.scents find readingboring whereas for late adolescents it stimulates a feeling of curiosity. These adolescentsprefer to read English books and newspapers only and that too in the evening. It is mostlythe mothers who encourage them to read.
INTRODUCTION
Adolescence is probably the most challenging and complicated period of life to describe study or experience.The biological changes of puberty are universal, but in their particular expression, timing and extent, the varietyshown is enormous and depends, of course on sex, genes and nutrition. They must adjust to their changing bodysize and shape, to their awakening sexuality, to new ways of thinking and they must begin to strive for emotionalmaturity and economic independence that characterize adulthood.
There is no doubt that today's youth are confronted with a media environment that is very different from theone faced by their parents or even their parents. Terms such as digital television and World Wide Web did noteven exist 20 or 30 years ago. One of the most profound changes concerns the sheer proliferations of mediaoutlets and technologies. The advents of cable and satellite television have dramatically increased the numberof channels available in most homes today. Digital technology is multiplying this capacity. Many homes are
equipped with CD Players, DVD Players, Personal computers. Modems and digital cameras. At a very youngage, then children are learning about keypads. Joysticks, mouse pads and remote controls. As these technologies
proliferate they are changing the nature of more traditional media. In other words, old distinctions between thetelevision screen and computer screen or between print and broadcast are becoming less meaningful.
The media, specially television, continue to attract and fascinate the young and while there is a real potential foryouthful audience to benefit from positive media messages, "adolescents often identify with media characters
who are unnaturally thin or who engage is unhealthy behaviors such as smoking cigarettes, drinking alcohol orengaging in unprotected sex". The messages carried by the media about what is appropriate or inappropriatefor males and for females are important influences on gender development as well. A special concern is the
200

way females are pictured on television. Television is a source of gender role socialization.
The report from the Kaiser foundation (1999) revealed the following:
• While children are also more likely to have access to a computer with CD-ROM drive and internet access.
• Using total person hour measurements the researchers are able to quantify the amount of daily interactions
children have with all media. For 2-7 years old. This was 3 hours per day, 8-13 year olds spend 6 % hours
per day engaged in media use. For 14-18 years olds the figure is 6!^ hours daily.
• Boys spend more time than girls, mostly as a result of their greater interaction with video games, computers
and TV.
• Girls spend more time with print media than boys and after the age of 8. They also spend more time with
music media such as radio, tapes and CD's.
Media, it seems, is exerting a powerful influence in the lives of children, according to a study conducted by
Sharma (2006) on media preference in early years, many factors influence adolescent's development but media
is the one of the most important resource which has great influence on them. A survey was conducted byPrathm, an NGO, in New Delhi (The Tribune, Oct 2004), reveals that the reading skill of Indian children are
poor. There is a need to understand the reason behind poor reading at this age. Poor reading ability is anindication to lack of preference for newspapers, literature, etc. Media has both positive and negative to play. It
is observed that children spend most of the time watching TV and they don't indulge in any kind of reading task(Sharma, 2006). Poor reading results in deficiencies later on in life, especially at the time of adolescence,because from here on they have to make important decisions about their life and career.
Media influence on today's generation is paramount. Media is becoming important agent of socialization and
there is a need to monitor the influences, so parental involvement in media usage also needs to be studied.Media has influenced adolescents in every aspect, may it be food, education, clothes, hair, etc. Adolescents
prefer doing things in way which is shown by media, without thinking its right or wrong.
Since so much media literacy work is based upon concerns regarding the effects of media impressionablechildren and adolescents, studying the relationship between media and youth offers us an important insight intothis relationship and has the added advantage for those, of those working with young people, in providing witha subject matter that students are curious about.
AIMS & OBJECTIVES
The present study was conducted to find out:
1) Media preference among urban adolescents of Jammu and understand the content they prefer .
2) Compare the types of media preferred among:
a) Early and late adolescents,
MATERIALS & METHODS
• Sample
a) Size: The sample for the present comprises of two groups:
Grotip I (Early Adolescence): It consists of 60 adolescent boys (n=30) and girls (n=30) in the agegroup of 12-15 years.
Group II (Late Adolescence): It consists of 60 adolescent boys (n=30) and girls (n=30) in the agegroup of 15-18 years.
• Sampling Procedure: The sample for the present study was selected using multi-stage sampling technique.There are 113 urban areas of Jammu, out of which, 10 were selected using random sampling technique(lottery method). From the 10 areas, 120 adolescents were identified, fulfilling the criterion for sampleselection.
201

Criteria for sample selection: The following criteria were taken into consideration for selection of sample.
a) Sex: Equal number of boys and girls were selected.
b) Age: Only those in the age range of 12-18 years were included.
c) Residence: Only adolescents residing in urban areas of Jammu were selected.
d) Qualification of Parents: Education of parents was at least graduation.
Tool Use
Interview Schedule: The interview schedule for the adolescents included questions on preference for TV,
computers, DVD's, audio cassettes, videogames and newspapers/ magazines and time spent in other activitiesat home. The interview schedule consists of open ended as well as close ended questions.
Data Collection: Data was collected in two phases
a) Pilot Study: In this phase, the interview schedule for adolescents was prepared and pre-tested on 20adolescents, 10 in the age group 12-15 years and 10 in the age group 15-18 years, 5 boys and 5 girls,
respectively in each age group. Modifications were made based on pre-testing.b) Data Collection: After the selection of sample, data was collected by home visits in the Jammu city. The
researcher interviewed each child individually which took 20 minutes to one hour.
Data Analysis: Data obtained by the use of various tools were subject to both quantitative and qualitativeanalysis.
a) Qualitative Analysis: Content analysis was done of all the responses obtained by use of interview schedule.b) Quantitative Analysis: Chi-square was used to compare the data across age and sex.
RESULTS & DISCUSSION
• Abbreviations to be keyed:
a) EA: Early Adolescence.
b) LA: Late Adolescence.
c) M: Males.
d) F: Females.
e) H: High.
f) A: Average.
g) L: Low.
h) D: Daily.
i) W: Weekly.
• Background Information:
Table No.l: shows that 43.3% of males in early adolescent group belong to the age group of 12-13 years and
60% of females in same group belong to the age group of 14-15 years. Similarly the sample chosen showsthat 50% of the males and 53% females in late adolescent group or 16-17 years of age. Overall early
adolescent sample was mostly 14-15 years (31.2%) and in late adolescence it was 16-17 years old (37.2%).
l^ble 1: Showing Age Distribution of the Respondents
Age(in Years) Males Females Total
(N=60) % (N=60) % (N=120) %e
Early Adolescence
12-13 13 43.3 06 20 19 22.8
13-14 09 30 06 20 15 18
14-15 08 26.6 18 60 26 31.2
Late Adolescence
15-16 06 20 04 13.3 10 12
16-17 15 50 16 53.3 31 37.2
17-18 09 30 10 3.3 19 22.8
202

Table 2: Showing the Qualincation of Parents
Qualification Motlier's Qualification Fathers Qualification
Early Adolescence Late Adolescence Early Adolescence Late Adolescence
llO'"
M F Total
(n=30) (n=30) (n=60)
M F Total
(n=30) (n=30) (a=60)
M F Total
(n=30) (n=30) (n=60)
M F Total
(d=30) (n=30) (n=60)
06 01 07 04 03 07 01 - 01 _
1211. 11 08 19 09 06 15 07 03 10 08 04 12
Graduate 13 21 34 17 21 38 22 27 49 22 26 38
10.16* 0.24 3.9 1.4
•Significant difference at 5% level.
Table no 2 shows that the fathers and mothers of the early adolescent males were graduates, 22 and 13
respectively. Fathers and mothers of the early adolescent females were graduates, 27 and 21 respectively.
Similarly fathers and mothers of late adolescent males were graduates 22 and 17 respectively. Fathers and
mothers of late adolescent's females were graduates, 26 and 21 respectively. There is significant difference in
the qualification of mothers of early adolescent males and females at 5 % level.
Media Preferences
Table No. 3 shows preference towards various media among adolescents. First preference by early adolescent
males was given to TV followed by computer, video game, DVD's, magazines and lastly to newspapers.
Maintaining the first preference for TV as the most preferred media source the early adolescent females
show their second and third preference as computers, magazines, with no liking towards video games, DVD's
and newspapers.
Among the various media, first preference by late adolescent's males was given to TV, followed by computer
and videogames and no inclination towards any other means of media. Similarly late adolescent's females
preferred TV followed by computer as their preference among of media showing little preference towards
other of media.
Ibble 3: Showing Media Preferences among Adolescents by Age and Sex
EARLY ADOLESCENCE LATEADOLESCENCE
MALES
(n=30)
FEMALES
(n=30)
MALES
(n=30)
FEMALES
(n=30)
Preferences 1 2 3 4 5 6 1 2 3 4 5 6 1 2 3 4 5 6 1 2 3 4 5 6
TV 10 06 05 04 03 03 19 08 01 02- -
19 07 02 02-
22 08-
COMPUTER 07 08 07 07 01-
09 14 01 04-
02 11 13 02 03 01-
08 20 01-
VIDEOGAMES 08 07 05 07 02 01-
03 05 06 06 10 05 19 04 01 - 14 10 01 05
NEWSPAPER 04 01 02 09 13-
03 08 06 07 06- -
03 15 12 02 06 14 08
MAGAZINES 01 01 02 02 14 10 02 01 05 08 07 07- -
03 12 15 01 04 12 13
DVD's 04 04 10 08 01 03-
01 10 04 10 05 05 07 15 02 02 02 12 10 03 04
Ibbic 4: Showing Preference for Watching TV at Late Night
Responses Early Adolescence Late Adolescence
M F Total % M F Total %
(n=30) (n=30) (n=60) (n=30) (d=30) (n=60)
Yes 09 07 16 26.6 20 19 39 65
No 21 23 44 73.3 10 11 2! 35
203.

Table 4 shows that 73% early adolescents do not prefer watching T.V late at night but 65% late adolescents doprefer it. The table further shows that maximum number of females and males during early adolescents do notprefer to watch T.V at late night whereas the maximum number of late adolescents both male and femaleprefer to watch T.V at late night.
I^ble 5: Showing Involvement of Parents While Using Media
RESPONSES EARLYADOLESCENCE LATE ADOLESCENCE
Male Female Total Male Female Total
(n=30) (n=30) (n=:6(l) (n=30) (n=30) (n=60)
Do your parents accompany you while doing following?
Watching T.V Yes 19 22 41 18 27 45
No 11 08 19 12 03 15
Using Internet Yes 06 16 22 10 16 26
No 24 14 38 20 14 34
Reading Newspaper Yes 13 04 17 04 08 12
No 17 26 43 26 22 48
Playing Videogames Yes 10 04 14 09 03 12
No 20 26 46 21 27 48
Table 5 shows that in both early adolescent and late adolescence, majority of males as well as females say that
their parents accompany them while watching T.V, whereas only a minor portion of both early as well as late
males and female adolescents say they don't. It further shows that majority of males and females in both early
as well as late adolescent group sat that parents accompany them for using internet, reading newspaper and
playing videogames. Parental involvement is maximum while watching TV than any other media source.
CONCLUSION
A study on the preference of media among early and late adolescents revel's that electronic media is the major
media preference among urban adolescents. Television, computer, video games, DVDs, magazines, newspaper
are as the major media preferences. Electronic media as a media preference among urban adolescents hasboth positive and negative influence on the adolescents. This view, though partly, is shared by Misra and Khattri
(1985), Phatak and Singh (1986) and Joshi and Manial (1998) who agree to a positive influence of electronic
media over adolescents.
This present study shows that television is the mast preferred source of media amongst urban adolescence who
spend 2 hours daily in watching television. Computers follow in the preference when majority of the adolescents
spend 4-5 hours weekly on computer, 2-3 hours weekly in playing video games and DVD's. In the presentresearch the adolescents spend 2 hours daily in front of television whereas Kaiser Foundation results put thefigure at 6 Vz hours.
Preference for television has also been found in other studies like Sethi et al (1997) who reveal easy accessibilityof both print and electronic media. In the present research print media was the least preferred source. Thestudy of Wadkar (1998) reveals that 75% of children spend their evening watching television: most of them did
so more out of habits, than design.
The present research reveals that maximum numbers of adolescents spend Rs.50-100 from their pocket moneyon computers, DVD's and books. The study further reveals that maximum number of adolescents both male
and female prefer reading educational material whereas very few read animation material. The study also
shows that majority of early adolescents say that reading makes them bored whereas late adolescents believethat it makes them curious. Further all the adolescents both early and late (male and female) were of the view
that their reading choices at school and at home are totally different.
All the urban adolescents in the present study prefer to read English books and newspapers only and theyprefer to read in the evening. Parental involvement is more with the females than males, while watching T.V or
204

reading .Mothers motivates their adolescents to read too. Age differences are seen in preference for late night
viewing of programmes on T.V. In a similar study by Verma maximum adolescents viewed T.V with their grand
parents, uncles and aunts. Family environment according to family cohesion scale was averaged when most
preferred media source was TV, Computer and Video games only in showing the first preference as Video
games by the age and sex families have been rated low on active recreational orientation and control dimension
which may be the reason that early adolescence and males prefer to use passive recreational such as TV,Computer and Video games.
RECOMMENDATION
From the results of the present study, few suggestive measures are proposed for parents and government.
1. The parents should spend the time with adolescents in various daily activities, which include watchingtelevision using computer, playing videogames, reading newspaper and magazines and other routine tasks.
2. The parents should keep a vigil on the type of material they are viewing and accessing.
3. The parents need to fix a schedule for watching T.V, using intemet and reading magazines.
4. The government should promote positive aspects of T.V programmes and should ban charmels showingaggressive programmes.
5. The government should promote the programmes related to media exposure.
6. Late night viewing should be discouraged as it is known to cause sleep and heart problems.
7. Media literacy should be an important part of environmental science curriculum.
REFERENCES
1. Berger K S and Thompson R A, The developing person through the life span, Warth Publishers, New York, 1998, pp 357-359.
2. Joshi V and Maniar A, Influence of TV viewing on adolescents. Communicator, January- March, 1998, pp. 7-11.
3. Luecke Alaska D, Anderson D R, Collins P A and Schmitt K L, Gender constancy and television viewing, DevelopmentalPsychology, 31 (1995), pp. 773-780.
4. Misra, Effects of television viewing on academic performances of school children, Psycho-Lingua, 15 (1) (1995), pp. 1-6.
5. Phatak AB and Singh V V, Television and Students Journal of Indian Education, 12 (3) (1986), pp. 39-43.
6. Sethi N, Chhikara S and Kumari L, Media preference among children: A comparative study. Journal of Indian Education, 23 (3)(1997), pp. 12-16.
7. Signoreielli N and Bacue A, Recognition and respect: A content analysis of prime time television characters. Sex Roles, 40 (7-8)(1999). pp. 527-544.
8. Wadkar A J, Television viewing, A Survey Progress of Education, LXX 111 (3) (1998), pp. 63-66.
9. Wilson J B and Stransburger C V, Children adolescents and the media. Sage Publications, London, New Delhi, 2002.

HD/OraI/9
Socio—Psychological and Economic Status ofInstitutionalized Elders
N Prabbavathy Devi' & P Tamilarasi Murugesan^
1. Lecturer, Dept. of Home Science, Quaicl-E-Millath Govt. College of Women,
Chennai (Tamilnadu)
[email protected] (09444312012)
2. Professor, Dept. of FSMD, Avinashilingam University for Women,
Coimbatore (Tamilnadu)
ABSTRACT
The phenomenon of population ageing has become one of the most dramatic and influentialdevelopment in the twentieth century. The aged in the traditional societies enjoyed unparallelsense of honour, legitimate authority in family, had decision making responsibilities andwere treated as repositories of experience and wisdom. Joint families have been apeculiarity and an important identity of Indian society. Modernization, liberalization andglobalization have disintegrated the Indian family system and elders are forced to seek stayin old age homes. The methodology included survey to elicit information about functioningof the five paid and five unpaid old age homes using questionnaire. Background informationof 400 senior citizens both male and female in the age group of 60 to 80+ years wascollected using interview schedule.
The main sources of income were grants sanctioned by the state and central government.Percentage offemale elders was more than males i.e. 74 per cent. Forty four per cent hadno issues. More than 50 per cent did not have anybody to take care of their minimal needs.Though the elders were satisfied with their fulfillment of basic needs, the satisfactory levelsof psychological and financial needs were not fully met. The psychological factors leadingto depression were social inactivity, helplessness, lack of interest, boredom and loneliness.Hence, the management of old age homes were recommended to provide emotional support,arrange for social and income generating activities.
INTRODUCTION
Indian society was having traditional informal support system such as joint family, kin and community. Due tomodernization, liberalization and globalization, the capacities of these traditional informal support systems is slowlyweakening and are not in a position to fulfill even the basic needs of the elderly'.
Despite the belief that children are the security of the aged, institutions for the aged are mushrooming since 1990's. In1998, India had 728 old age homes catering to the needs of poor, destitute, widows, sick and handicapped^
Migration of younger generation, lack of proper care within the family, insufficient housing, especially in urban area,economical hardship and break-up in joint family are some of the reasons for institutionalization of the elderly^
AIMS & OBJECTIVES
Realizing the need of the elder's care the study focused on to (i) study the functioning of the selected paid and unpaidhomes for the senior citizens and (ii) understand the background information and life style pattern of institutionalizedelders.
MATERIALS & METHODS
From the publication of Helpage India, a total number of 39 homes for senior citizens, comprising of 23 paid and 16unpaid homes were found in and around Chennai. Based on the cooperation rendered by the management, willingnessof the senior citizens and ease of accessibility, five from each paid and unpaid homes were selected. Totally 400 seniorcitizens, i.e. 200 from paid and 2(X) from unpaid homes both male and female in the age group of 60 to 80 + yearswere randomly selected. A structured questionnaire was used to elicit the functioning of the old age homes from therespective head of the institutions. Interview schedule was used to collect background information of the elders.
206

RESULTS & DISCUSSION
• Functioning of the old age homes
The Successful operation ofan institution is dependent to a large extent upon the organization structure, managerial
function and effectiveness of its personnel. Table 1 depicts the functioning of the old age home.
Table 1: Managerial functions of the old age homes
Aspects Paid (N=5) Unpaid (N=5)
Criteria for seleclion ofinmates Age 60 years and above, ability to do their
work, pensioner / regular income
Age above 60 years ability to do
their work destitute, deserted, non
pensioner
TVpe of accommodation Single, double, dormitory and cottage type Single and dormitory
Charges for accommodation
and food
American plan (charge for room and food)
single - 1000-1500,
double-850.1000.
dormitory - 500-600,
cottage - 1900,
deposit - 2000-5000
Free of cost
Source of income Grant from state and central govemment,
charges from the inmates, donations
Grant from state and central
govemment, donations
Recreation facilities Television, radio, library, entertainment
program
Television, radio, library,
entertainment program, income
generating activities
Medical care Periodical checkup in all the homes Checkup only in four homes
Records and registers Admission, food, medical, administration,
expenses, others
Admission, food, medical,
administration, expenses, others
The common criteria for selection of inmates was age above 60 years and ability to do their own work. The main
source of income for the homes were the grants sanctioned by the state and central government and aids in the form
of cash and kind. Important records and registers were maintained by the management of the homes.
• Background information of the elders
i) Sex wise distribution of elders: In overall sex ratio of the India's population there were more males than
females. But for the aged population, female percentage distribution is higher The sex-wise distribution of
the selected elder is presented in table 2.
Table 2: Sex Wise Distribution of the Selected Elders
Sex Institutionalized elders (n=400)
Paid homes Unpaid homes Total
No. % No. % No. %
Male 69 35 34 17 103 26
Female 131 65 166 83 297 74
Total 200 100 200 100 400 100
The table shows that out of 400 elders 26 percent were males and 74 percent were females.
ii) Details of the offspring of the elders: Family plays a veiy important role in our lives especially in Indiansociety where blood relationship takes priority over other relationships. Table 3 shows tlie details ofthe offspringof the elders.
207

Table 3: Details of the offspring of the elders
Number of children Institutionalized eiders (n=330*)
Paid homes Unpaid homes
Male Female Male Female Total
No. % No. % No. % No. % No. %
None 11 22 48 42 13 50 88 63 160 44
One 10 20 26 23 2 8 24 17 62 17
Two 13 26 19 17 6 23 12 9 50 19
Three 8 16 10 9 2 8 6 4 26 9
Four 5 10 5 4- -
8 6 18 5
Five and above 3 6 6 5 3 11 2 1 14 6
Tolal 50 100 114 100 26 100 140 100 330 100
* 70 elders are unmarried
Table shows that 44 percent ofthem had no issues. This finding communicates that childless elders had only option
to register into an old age home after retirement since no other family members or relatives were willing to take up
the responsibility ofsupporting them.
iii) Occupational status of elders: A man's occupation decides his status in society and gives him economic
and social security in life. Table 4 presents the occupational status of elders before joining the old age
home.
Ihble 4: Occupation of the Institutionalized Elders Before Entering Old Age Home
Occupation Paid (ns200) Unpaid (n=200)
Male Female Total Male Female Total
No. % No. % No. % No. % No. % No. %
No job 7 10 97 74 104 52 4 12 118 72 122 61
Clerk 18 26 2 2 20 10 3 9 2 1 5 2
Business man- - - - - -
7 20-
7 4
Agriculturist - - - - - -
3 9 2 1 5 2
Administrative officer 14 20- -
14 7- - - - - -
Teacher 7 10 2! 16 28 14-
-4 2 4 2
Technical worker 14 20- -
14 7 3 9-
3 2
Ex-service men- - - - - -
6 18-
6 3
Others 9 14 11 8 20 10 8 23 40 24 48 24
Total 69 100 131 100 200 100 34 100 166 100 200 100
The table states that 73 percent of the female in both and unpaid homes were unemployed as against 11 percent
of males in both the homes.
iv) Income level of the eiders: Aging brings about a host of problem major one being economic hardship dueto which elderly are not able to maintain their optimum standards of food, clothing and housing amenities'". The
Income level of the selected elders and presented in Table 5.
208

Table 5: Income Level of the Elders
Institutionalized elders (n=400)
Monthly Income
(Rs)
Paid homes Unpaid homes Total
Male Female Male Female
No. % No. % No. % No. % No. %
No income 7 10 97 74 28 82 118 72 250 62
Less than 1000 23 33 19 15 6 18 48 28 96 24
1001-3000 18 26 12 9 - - - -30 8
3001-5000 11 16 3 2- - - -
14 3
5001-7000 7 10- - - - - -
7 2
7001-9000 3 5- - -
- - -3 1
Total 69 100 131 100 34 100 166 100 400 100
A majority of 62 percent of elders were not earning but they were financially supported by their relatives, friends
and welfare institutions. Pension was the most common source of income of male elderly in paid homes.
v) Reasons for residing in old age homes; The various reasons for which the elders have joined in the
selected old age homes are presented in Table 6.
Ihblc 6; Reasons for living in old age home
Reasons Paid home (n=200) Unpaid home (n=200)
Male Female Total Male Female Total
No. % No. % No. % No. % No. % No. %
No body to take care 37 53 68 52 105 52 14 41 100 60 114 57
Early widow hood - 5 3 5 3 - 8 5 8 4
Disagreed with daughter/
daughter in law 9 13 12 9 21 10 3 9 12 7 15 7
Disagreed with son /
son in law 4 6 16 12 20 10 3 9 3 1
Neglected by relatives - 1 1 1 1 4 11 14 8 18 9
To have peace of mind 4 6 4 3 8 4 - • -
Poverty - - - 5 15 20 12 25 13
To be independent 11 16 16 13 27 14 5 15 12 8 17 9
Migration of son/daughter
to other state / country 4 6 9 7 13 6
Total 69 100 131 100 200 100 34 100 166 100 200 100
More than 50 percent of the elders in homes did not have anybody to take care of their minimal needs, since their
children were found to be working partners. The predominant reason for 13 percent of the elders in unpaid homes
was poverty. The study also revealed that in paid homes 14 percent of the elders wanted to be independent
without being burden to tlieir children.
vi) Leisure time activities of the elderly: One of the major problems faced by the elderly is to spend their freedme. Recreation activities promoted emotional relief and well being which helped them to adjust to their newhome, away from their family The recreational activities of the elderly are presented in Table?.
.209

l^ble 7: Leisure Time Activities of the Eiders
Activities
(Rs)
Institutionalized eiders (n=400)
Paid homes Unpaid homesTotal
Male Female Male Female
No. % No. % No. % No. % No. %
Talking with friends 12 17 34 26 12 35 48 29 106 27
Listening to radio 5 7 10 7 1 3 4 2 20 5
Watching television 17 25 34 26 8 24 36 22 95 24
Others (Bhajan, Chanting) 5 7 13 10 1 3 8 5 27 6
Nil - - - - 4 11 24 14 28 7
Total 69 100 131 100 34 100 166 100 400 100
The most popular recreational activity among 31 percent of the elders seemed to be gathering day to day information
on politics, sports and movies from dailies, while 27 percent were happy sharing their thoughts and feelings with
their peer group.
vii) Satisfaction about the needs of the elders: The needs of elders are special by virtue of their unique
position viz old, widowed, marginalized or even poor, destitute and disabled'. The satisfaction about the needs
of the elders are presented in table 8.
Table 8: Satisfaction about the needs of the elders
Needs
Institutionalized elders (n=400)
Paid homes Unpaid homesTotal
Male Female Male Female
No, % No. % No. % No. % No. %
Food 64 93 127 97 34 100 166 100 391 98
Shelter 61 88 128 98 31 91 159 96 379 95
Clothing 69 100 131 100 34 100 166 100 400 100
Safety 58 84 123 94 33 97 163 98 377 94
Finance 37 24 31 24 6 18 12 7 86 23
Psychological feelings 11 16 8 6 1 3 3 2 23 6
The elders were quite happy as far as the basic necessities were concerned. Only 22 percent were financially
satisfied and 6 percent were psychologically satisfied,
viii) Psychological factors leading to depression
Table 9: Psychological Factors Leading to Depression
Psychological factors Institutionalized elders (n=400)
Paid homes Unpaid homes Total
Male Female Male Female
No. % No. % No. % No. % No. %
Boredom 6 9 17 13 4 11 24 14 51 13
Loneliness 4 6 12 9 12 35 48 29 76 19
Lack of interest 36 52 81 62 18 53 50 30 185 46
Sadness 37 53 77 58 12 35 43 26 169 42
Self pity 6 9 22 17 11 32 42 25 81 20
Fatigue 9 13 31 24 I 3 12 -7 53 13
Lack of sleep /oversleeping 15 22 30 23 4 12 38 23 87 22
Lack of appetite/over eating 4 6 17 13 2 6 37 22 60 15
Social inactiveness 19 28 77 58 23 68 116 70 235 59
Helplessness and hopelessness 37 53 68 52 14 41 100 60 219 55
Pre occupation with health 42 67 88 67 20 59 108 15 258 65
Apathy 23 33 31 24 7 21 43 26 104 26
Psycliomoior in activity 1 - 1 - - I - 3 - -
Suicidal tendencies- - - -
1-
I- -
2i:o

From the table it is revealed that the factors leading to depression are in the order ofpre occupation with health, social
inactiveness, helplessness, lack of interest, sadness, lack of sleep or over sleep, self pity, loneliness, lack of appetiteand boredom.
CONCLUSION
Family support is found to be the important factor for socio-psychological well being ofthe elders. Thus the management
of the old age homes are recommended to provide emotional support which can be arranged through social workers,personnel fi-om voluntary and social organizations. College and school students from near by educational institutions
can be motivated to make frequent visits and make them cheerful. The government is recommended to framenational policy on old age pension and other benefits that need to be provided for the elders and the elder arerecommended to plan for their retirement in terms of economic security and investment opportunities.
RECOMMENDATION
The management of the old age homes are recommended to provide emotional support which can be arranged
through social workers, personnel from voluntary and social organizations. College and school students from
near by educational institutions can be motivated to make frequent visits and make them cheerful. Thegovernment is recommended to frame national policy on old age pension and other benefits that need to beprovided for the elders and the elder are recommended to plan for their retirement in terms of economicsecurity and investment opportunities.
REFERENCES
1. Dube A K. Niiiriiioii ageing. Nutrilion. ICMR, Hyderabad, 33(3) (1999), pp. 22.
2. Mandal M, The woiic ofNCOSfor older persons, Rc-Warch and DevelopmenlJournal, 5 (1) (1998), pp. 22-37.
3. Praka.sh 1J, Ageing. The Indian Experience, Report of work-sijop organized on 9-10"'August 2001 by Bangalore University, Bangalore.
2001, pp. 74.
4. Kumar S V, The graying population in India: 1991 census results. Research and Development Journal, 31 (3) (1997), pp 4.
5. Khan M Z, Elderly in metropolis. Inter-India Publications, New Delhi. 1997, pp. 81.
6. Puri Sccma and Khanna Kumud, Health and nutrition profile of middle class elderly woman living in New Delhi. Research and
Development Journal. 5 (3) (1999), pp. 18-26.
7. Mi.shra S, Scenario ofsegregated seniors. Indian Journal of Gerontology, (3) (1993), pp. 104 -110.
8. Sharma K L, Elderly women ofKachci Basti: a socio psychologicalprofile. Indian Journal ofGerontology, 13(1 and 2) (1999), pp. 40 -
57.
9. JamxinaD. Ageing women in India: a profile. Research and Development Journal, 1(3) (1995), pp. 4 and 9.
10. Kohli A and Verma S K, Development of geriatric depression scale in Hindi. Research and Development Journal, 6 (2) (2000), pp. 26.
21 i;

HD/Oral/10
Academic Stress and School Environment: A Study ofAdolescents of Jammu, J and K ^Neeni Sharma' & Ruchira Sapru^
1. Associate Professor, PG Dept. of Home Science,
University of Jammu (Jammu)
[email protected] (09419212010)
2. Designation, PG Dept. of Home Science,
University of Jammu (Jammu)
ABSTRACT
Adolescence is a period when the expectations on academic front start building up from the
parents, schools and even the community. In the present system of high competition the
situation becomes even worse when, students feel they are too stressed to handle such pressures
and come up to the mark set forth by others for them. A student's level of academic attainment
is to a great extent influenced by the kind of school environment apart from his/her innate
characteristics. Keeping in view these points a study was conducted, to explore the perceptions
adolescents' hold towards the school environment, on two groups of adolescents, 100
academically stressed and 100 academically unstressed, drawn after application ofstandardized test in the preliminary part of the study. These two groups were further
administered with standardized tools to know their perceptions regarding their schoolenvironment. Results reveal that adolescents in both the groups had varied perceptions
towards the school environment and that stressed adolescents perceived school environment
as less favorable than unstressed ones.
INTRODUCTION
The educational aims of a society are identifiable through many sources, school being one such setting fromwhich society holds many expectations. Schools may be said to be effective if they are successful in carrying
out their social, political, cultural and economic functions. Further, a student's level of academic attainment is to
a great extent influenced by the kind of school environment apart from his/her innate characteristics. And when
we talk of school environment, many other factors come into minds which are responsible for performance of
students. Teacher-student interaction, psychological climate of classroom, teachers' personality and theirexpectations regarding students' achievement are some important considerations. Teachers bring certain attitudesto the classroom and act in ways which may raise or lower students' self esteem and performance. Adolescenceis a critical stage in a student's life and it is adolescent's own potential which determines the goals of his/her
development, along with the demands put forth by the society in which he/ she lives since it is a critical time forforming future aspirations especially with regard to career. Educational excellence contributes significantly to
the academic success and professional placement of students.
Though, school life is considered as one of the best times of life, yet the adolescents due to their emotional
instability and physiological changes get stressed out very easily at times while trying to establish their independententities. Many forces work against each other, some pushing the young person forward and others hold himback. Presently, adolescents face demands and expectations, which appear to be more numerous and complex
than what adolescents faced only a generation ago. This adds on to the already accumulating pressure and
creates a crisis of identity, in general, manifested as stress.
Teachers' perception and expectations are equally important for students' achievement; in fact a good match
between teacher and student leads to better performance than that of a poor match. Teachers' perceive only
those students a.s achievers who take part in curricular as well as extra curricular activities, who are always
212

attentive in the class and well responsive quick learners. On the other hand teachers perceive those students as
underachievers who don't take part in curricular and extra curricular activities, who belong to 'backward'
families and disturbed home environment show less interest in the studies and their activities always disturb
other people. Teachers have limited time to give individual attention because of enormous pressure to finish the
heavy load of syllabus and this puts extra burden and pressure on the pupils as now they are expected to gainindependence in academics too.
So, a need arises to study the psychosocial climate of schools as perceived by the adolescents, so that possible
changes could be brought about by the school authorities and educators for desirable changes which are resultant
in the students outcomes as well.
AIMS & OBJECTIVES
To study the difference in the perception of academically stressed and unstressed adolescents regarding
a) School Environment.
b) The role school and teachers in academic achievement of adolescents.
MATERIALS & METHODS
• Sample: The sample for the present study comprised of 200 adolescents (ICQ stressed and 100 unstressed),who were screened from an original sample of 600 students using standardized tools. Both boys and girlsstudying in classes 8"' to 10"' were selected.
• Tools Used: Following tools were applied on the sample for data collection.
a) School Environment Inventory: Developed by KB Misra (1984), it measures the psychological climateof schools as perceived by pupils, measuring the quality and quantity of cognitive, emotional and socialsupport available to students during their school life. SEI has items belonging to 6 dimensions, namely-Creative stimulation. Cognitive encouragement. Permissiveness, Acceptance, Rejection and Control. SEIcontains 70 items related to above-mentioned dimensions of the school environment.
b) Interview Schedule for Adolescents'. The schedule for adolescents was prepared to assess theperceptions towards school environment and beliefs regarding the influence of teachers on their perceptionsand performance.
• Procedure: At the outset rapport had already been established with the students, while they were approachedin the first phase of the study when Scale for Assessing Academic Stress (Uday Sinha, Vibha Sharma andM.K.Nepal,2002) was administered on them, and from which two groups of 100 adolescents each weredrawn after analysis of the original sample. These two groups of adolescents were then administered theSchool Environment Inventory and the interview schedule in different sessions in the classroom.
• Statistical Analysis: The data obtained were analyzed using mean, standard deviation, t values, and -rsquare.
RESULTS & DISCUSSION
Students in both the groups, as shown in Figures 1, a, b and c, believe that the schools are responsible for their
academic performance; however, students in both the groups affirm that a highly structured school environmentis unsafe for them. 61% Stressed adolescents believe that their school does not make them think to the best of
their ability while 55% students in the other group think their school does. While 31% stressed students view
that school culture makes the schools effective, 27% unstressed adolescents think it is the school services
which make schools effective.
Stressed adolescents perceive school environment less favorable than unstressed ones as evident from the t-
values (Table 1) which show a significant difference in the dimensions of Creative stimulation, cognitiveencouragement, acceptance, permissiveness, and rejection. Among these dimensions only in rejection the stressed
213

adolescents show a higher mean whereas in the dimension of control, no differences were observed. This
shows that stressed adolescents perceive a rejection from school environment whereas both the groups find
school environment equally controlling.
Table 2 reveals that teachers are considered as the ones whose role in adolescents life is to guide them in the
right direction (48%stressed & 40%unstressed), while 79% unstressed adolescents were satisfied with the
teachers and their teaching, only 61 % stressed adolescents expressed their satisfaction. 32% stressed adolescents
believe teachers do influence students thinking only if the teachers are affectionate whereas 34% students in
unstressed group consider they should have a positive attitude. Thirty eight percent students in stressed groupfeel that because of an ease in communication, teachers of same sex can be considered as the role models,
while 21% unstressed adolescents believe in such a situation lesser inhibitions occur.
Chi square values reveal a significant difference among students in both the groups. Teachers who are balancedin their approach and positive are more liked by students in the unstressed group. Ilatov and Shamai (1998) also
reported that gender, academic composition and teachers' communication style are important part of teacher-student interaction and teachers influencing children
l^ble 1: Mean and Standard Deviation of Stressed and Unstressed Adolescents on School Environment Inventory
Dimensions of SEI Stressed
Adolescents'
(N=100)
Unstressed
Adolescents'
(N=100) t-Value
X a X a
Creative Stimulation 46.4 4.5 51.3 5.0 1.2"
Cognitive Encouragement 27.5 3.9 29,2 2.6 3,3*
Acceptance 19,2 2.6 26.0 3.2 15,6*
Permissiveness 20.0 4.5 24.6 2,9 8.6*
Permissiveness 15,9 3.4 12.5 2,6 8.6*
f) Control 26.4 2.6 26.3 3,2 0,7
♦Difference significant at .05 level
Thble 2: Adolescents Views about Teacher's Role
Responses Stressed Unstressed %
GroupN=100 GroupN=100
Teacher is...
One who lights a students imagination 26 34 30 1,78
Guides in the right direction 48 40 33
A friend who is ready to help anytime 26 26 26
Are you satisfied with your teachers and their teaching?
Yes 61 79 70 9.2*
No 39 21 30
Teachers' influence a students thinking...
Yes
If teacher has a positive attitude 19 34 26,5
Is affectionate 32 30 31 7.86*
Is unbiased 29 18 23.5
Always ready to help and guide 20 18 19
Teachers of ones own sex can be only considered as role models
Yes 75 61
Can easily identify with them 17 20 18,5
There is an ease in communication 38 20 29
Have lesser inhibitions 20 21 25.5 4.5*
No 25 39
It can be either sex also 18 21 19,5
Depends on one's attitude 7 18 14
* Difference significant at ,05
214

structured ScMei Cnwwwt
7UOflVtV
studrvt*
[ossres9«dOi«i« oiMfmedO'C^d
stheemnietAdeitMeitB thMc
rante 0«ai TM ttsiy
taSfrctnoOnxs oirAtrndOrM
Fig 1 (a, b): Showing adolescents views about school environment
Seheel Made EtTecdve
/I LktSchool cullure School School semces Focus on
(AsiinclPiwoss toochm^
loSltosssO Croup BUft«lre$8«el Gfoupl
CONCLUSION
Keeping in view the results of the study it is concluded that school environment was perceived by adolescentsas highly structured and therefore, unsafe. Stressed adolescents consider their school environment less favorablefor them, which is apparent from the results of School Environment Inventory whereas, the students in the othergroup perceived it as favorable on various dimensions like creative stimulation, encouragement, acceptance,permissiveness and rejection in school environment. Teachers are perceived as guides and most of the adolescentsare satisfied with their teachers, furthermore, communicating with and sharing problems with same sex teachersis easier, though major differences in the perceptions of stressed and unstressed adolescents is not found, yettheir views are seen to vary when it comes to factors like acceptance and rejection on the part of teachers inthe school and also on the pattern of interaction.
RECOMMENDATION
Policy Suggestions:
I. Adolescents
• Adolescents should identify strategies to develop effective study habits
• Develop a positive attitude towards parents, consider them their friends
• Treat their suggestions positively
• Involve themselves in extra curricular activities, which will help them in
• Develop positive attitude and invigorate a sense of confidence, and dispel any negative influence.
• Involve themselves in a healthy peering interaction for developing better academic and co curricularatmosphere.
• Inculcate a sense of dignity in themselves by rational thinking and positive attitude,
• Collate their activities in such a manner which is useful for doing away any stresses.Adolescents, both asindividual and as a part of a group should develop a habit of positive questiorung amongst themselves,with parents, and
215

• Teachers for clarifying any doubts that crop up in class and home.
• Inculcate reading habits by going through good literature, cognitively stimulating material which sharpens
their concentration.
u. Parents:
• Set realistic goals for their children keeping in view their capabilities, aptitudes and learning skills.
• Develop an encouraging approach towards their children, which will help in infusing confidence in them.
• Avoid drawing comparisons amongst children instead infuse a sense of confidence amongst the
underachievers to boost their dormant capabilities.
• Monitor the academic and co curricular activities of children.
• For overall development of adolescents, parents need to encourage their children for equiv-distribution oftime towards academics as also extra curricular activities for their all round development.
iii. Teachers:
• Teaching and role of teachers should be reality oriented instead of following the process of abstraction soas to make students better learners.
• Identify the positive as well as negative capabilities of students and encourage them to improve theirfaculties.
• Avoid distinguishing the academic achievers and non-achievers, instead should help raise the level of
expectations and performance of underachievers.
• Act as friends, guides, and counselors for improving and overall development of their students.
• Render positive advice periodically to help students improve their performance.
• Implement specific intervention programme to de-stress children and boost their morale and attitude.
iv. Community
• Should play a positive role in the overall development of children in their community or neighborhood.
• They as a group should essentially avoid creating spot distinctions amongst achievers and non-achievers.
• Encourage a positive interaction between the achievers and underachievers by infusing a sense of propriety
and belonging among them.
• Avoid making a distinction among the children on the basis of caste and economic status.
• Help by identifying weak areas not only amongst children but also their parents and suggest measures toimprove on these weaknesses.
• Organize stress-relieving programme in the community for children.
• Involve children in various activities of the community, so that they feel a part of it and become confident.
V. Government:
• Provide school based counseling for regular monitoring of stress.
• Monitor the academic capabilities of teachers and encourage improvement and improvisation amongst
faculty.
• Pay special attention to the academic programs being implemented in different institutions.
• Academic programmes, syllabus pattern and the overall work load should be monitored regularly for
developing non stressful and healthy academic flow.
• Aptitude te.sting and psychological testing should be made a part of school curriculum.
• Provision of special teachers or resource rooms for weak children.
216

!>-• --
REFERENCES
1. Chadha N K and Sahni V, A co relational study ofteacher pupil relations and academic achievement, Journal of Education and
Psychology. 46 (1-2) (1983), pp. 24-27.
2. Ilatov Z Z and Shamai S, Teacher student classroom interactions: The influence ofgender, academic dominance and teacher
conmiiinicalion style. Adolescence, 33 (1998), pp. 269-277 ,
3. Sharma K, Verma B P and Swami V D, Vocational interests of adolescents as a function of their socio economic status, Asian
Journal of P.sychology and Education, 23(5-6) (1990), pp. 26-33.
4. Sharma S, Teachers perceptions and parent child relationships among adolescents ofJammu, Unpublished M.Sc Dissertation,
Dept. of Home Science, University of Jammu, Jammu, 1996,
5. Verma S and Gupta J, Some aspects of high academic stress and sytnptoms. Journal of Personality and Clinical Studies, 6(1)(1990), pp. 7-12.
i.l .

HD/Oral/14
Efficacy ofModern Family Planning Methods in Rural Conmmnity of Jharkhand
Asha Kumari
Senior Lecturer, Dept of Home Science,
Ranchi University. Ranchi (Jharkhand)
[email protected] (09386612166)
ABSTRACT
In Jharkhand only 36 percent of married women are currently using some method ofcontraception compared with 56 percent at the national level and 34 percent in Bihar {NFHSIII). Contraceptive prevalence is considerably higher in urban areas (60%) than in ruralareas (28.2%) Female sterilization is by far the most popular method 23.4 percent of currentlymarried women are sterilized. By contrast only 0.4% of women reported that their husbandsare sterilized. Overall female sterilization accounts for 66 percent of total contraceptiveuse. lUD (intrauterine device) 1 percent and condom 3 percent. The newly Jharkhand stateis one of the most industrialized regions of the country. The contraceptive prevalence rate inJharkhand especially in rural areas is very low. The major problems faced were early married,high percentage of low birth weight, low coverage of Antenatal care, husband denial forco-operation for utilizing contraceptive tools etc. The main objective of this study is toknow the contraceptive prevalence among rural Tribal masses and their health problems.Survey has been done on the basic of secondary data from RCH and personal interview.Result showed that the existence of well developed network of low literacy levels, Genderdisparities, high prevalence of STD's' and RTI's^ and proportionality lower levels of use ofcondoms and other modem contraceptive methods are some of the factors attributed to therapid growth of health related problems, increasing population, low birth spacing. RTI andSTD. There is strong need to develop a behavior change strategy based on the communicationenvironment. To design the local level assessment of communication, on environment,formulate strategy, to make easily accessible the materials to make it suited for the localneeds around the each of the intervention site.
INTRODUCTION
In Jharkhand only 36 percent of married women are currently using some method of contraception comparedwith 56 percent at the national level and 34 percent in Bihar (NFHS III). Contraceptive prevalence is considerablyhigher in urban areas (60%) than in rural areas (28.2%) Female sterilization is by far the most popular method23.4 percent of currently married women are sterilized. By contrast only 0.4% of women reported that theirhusbands are sterilized overall female sterilization accounts for 66 percent of total contraceptive use. lUD(intrauterine device) 1 percent and condom 3 percent.
The newly Jharkhand state is one of the most industrialized regions of the country. The contraceptive prevalencerate in Jharkhand especially in rural areas is very low. The major problems faced were early married, highpercentage of low birth weight, low coverage of Antenatal care, husband denial for co-operation for utilizingcontraceptive tools etc. The size of the family which is determining factor in the usage of contraceptive metliodsis mostly determined by the economic status of family and also by presence of son in the family. The couple asmentioned earlier would attempt to have at least one male child. In the Christian community (Oraons) peopleprefer to have 2-3 children whereas in Sarna community the average number of children is 4-5. In rural areasdue to lacks of awareness proper knowledge and lack of information about modem family planning methods,the rural masses therefore remain unaware and do not motivated with the concept.
The major problems are the health service providers often are unable to reach the most affected rural areas forvarious reasons. The shopkeeper (who stock contraceptives) and resource persons of the villages do notprovide knowledge about various tools of family planning. Even the basic knowledge about its usage, side
218

■w.
effects necessity and means are absent. They strongly believe on home remedies and traditional methods aregenerally prepared by the traditional healers. These remedies are used for menstrual regulation spacing ofchildren and for permanent conception. In Tribal population faith in the Traditional methods is high and theirusage seems to be quite prevalent. In some primitive tribe family planning is banned. They adopt Traditionalmethods for birth spacing. Access to condoms and pills was very low. Copper - T was rarely used.
AIMS & OBJECTIVESTo know the contraceptive prevalence among rural Tribal masses and their health problems.
MATERIALS & METHOD
Survey has been done on the basic of secondary data from RCH and personal interview with the Tribal ruralpeople in some villages near by Ranchi town, Jharkhand state. Couple interview and talk with communitymembers and health care workers were carried out for the collection of information Focus Group discussionwas also adopted.
RESULTS & DISCUSSION
Result showed that the existence of well developed network of low literacy levels. Gender disparities, highprevalence of STD's' and RTFs- and proportionality lower levels of use of condoms and other modemcontraceptive methods are some of the factors attributed to the rapid growth of health related problems, increasingpopulation, low birth spacing, RTI and STD.Female in rural masses didn't know that condoms prevent HIV.Knowledge about STDs was much lower. STDs were also prevalent among the women but due to hesitationand embarrassment women do not share the problems with her husband or other female family members.
Table 1: As per information the unmet need for the state as follows
Si. No. Item Contraceptives Qty. Required
by the status
Qty. Allotted
by the DOFW
Gap
(unmet need)
Bihar
i Condom (Million pcs.) 3.75 3.00 0.75
2 Oral Contraceptive pills (Lakh cycles) 25.00 10,00 15.00
3 lUPS (Lakh Pcs) 4.00 2.00 2.00
STD: Sexually Transmitted disease RTI: Reproductive Tract infection
Jharkhand
i Condom (Million pcs.) 2.00 2.00
2 Oral Contraceptive pills (Lakh cycles) 2.00 2.00
3 lUPS (Lakh Pcs) 0.60 0.60
DOFW: Dept. of Family Welfare, Govl. of India
Ihble 2: Changes in seiectcd indicator for RCH' Project
Changes In key RCH Indicators among matched districts covered during two rounds of RCH surveys - India
RCH
Component Indicator 1998-99 2002-03
%
Change
Mean -2SD •t-2SD Mean -2SD •I-2SD
Family Planning Contraceptive prevalence Rate 47.7 47,4 48.0 52,0 51.6 52,5 4.3*
Unmet Need for Spacing 8.7 8.5 8.8 6.0 5.9 6.2 -2.7*
Unmet Need for Limiting 10.8 10.7 11.0 9.9 9.7 10.1 -0.9*
Total Unmet Need for
Family planning
19,5 19,3 19.7 15,9 15,6 16.1 -3.6*
219.

Antenatal Care Any Antenatal Check-up 64.5 64.1 65.0 74.0 73.4 74.6 9.5*
Received Antenatal Check-up
during the first Trimester
29.5 29.0 29.9 40.1 39.4 40.7 10.6*
Iron & Folic Acid Tablets
received
48.8 48.3 49.3 60.8 60.2 61.5 12.0*
At least one Tetanus Toxoid
Injection received
74.6 74.2 75.0 80.1 79.6 80.6 5.5*
Full AN care received (At least
3 AN vistis, received IFA Tab
and at least one IT injection)
31.9 31.5 32.4 40.3 39.7 41.0 8.4*
Natal Care Deliveries assisted by
Health Professional
39.6 39.1 40.1 47.5 46.8 48.2 7.9*
Place of delivery :
Public Institutions
24.0 23.6 24.4 18.5 18.0 19.0 -5.5*
Private Institutions 9.4 9.1 9.7 21.5 20.9 22.1 12.1*
Home 66.3 65.8 66.8 59.4 58.7 60.2 -6.9*
Home deliveries assisted
by relatives / friends 53.0 52.5 53.6 45.2 44.5 46.0 -7.8*
Post Natal Care ANM making home visit
within 2 weeks of delivery 14.1 13.7 14.5 12.7 12.3 13.1 -1.4*
Child
Immunization
Full Immunization 52.0 51.3 52.7 44.6 43.7 45.6 -7.4*
BCG 73.4 72.7 74.0 74.1 73.2 74.9 0.7
DPT3 64.6 63.9 65.3 57.5 56.6 58.4 -7.1*
Polio3 66.1 65.4 66.7 57.0 56.1 58.0 -9.1*
Measles 58.1 57.4 58.8 55.2 54.2 56.1 -2.9*
RCH: Reproductive and Child Health Dept of Family Welfare, Govt. ofIndia
CONCLUSION
As a conclusion it was found that the contraceptive prevalence rate in Jharkhand was very low. The reproductive
and child health was launched in October 1997 incorporating new approach to population and developmentissues, family planning services new areas in RTI, SID but still the problems exist among rural masses. They
are unaware about the modem technology and current information regarding these issues. There are low % ofawareness about the condoms and other contraceptive device.
There is strong need to develop a behavior change strategy based on the communication environment. Todesign the local level assessment of communication, on environment, formulate strategy, to make easily accessible
the materials to make it suited for the local needs around the each of the intervention site. The communication
campaign should be primarily address specific issues such as improving negotiation skills for safer sex, enablingearly identification of STD symptoms and enhancing treatment seeking behavior. Participatory methods at
community level, life skill education peer based education and site based out reach Programmes will be themajor approaches should be used.
RECOMMENDATION
• This is important to formulate strategies for easy access of materials that are suited for local need.
• Campaign regarding safer sex and contraceptive use should be primarily devised.
• Life skill education , peer based education & site based outreach programs should be the major issues which
should be addressed and implemented.
22G

REFERENCE
1. National Family Health Survey, 2005-2006.
2. Simmons O, Population Education- A Review ofthefield. Studies infamily planning, Population Council, New York, 52 (1970).
3. United Nations, Report of the International conference on Population and Development, Cairo, (5-13), 1994.
4. Wayland, Solan R, Population Education, Family Planning and the school curriculum. Journal of family Welfare, 15 (2) (1981).
5. RCH Data, Govt. of India.
•Wr

HD/Oral/16
Positive Therapy for Enhancement of Self-Es^m, Seif-Effiracy ahid Management ofStress AmongWomen in Local Governance in Coimbatore District JM Sbanmugavani S Rajkakshmi KC Leelavathy'1. PhD, Scholar, Extension Education, Dept. of Home Science,
Avinashilingam University for Women, Coimbatore (Tamil Nadu)
[email protected], (09715543061)
2. Lecturer, Dept. of Home Science, Extension Education, Avinashilingam
University for Women, Coimbatore (Tamil Nadu) k3. Lecturer, Dept. of Home Science, Extension Education, Avinashilingam *
University for Women, Coimbatore (Tamil Nadu)
ABSTRACT
Women in India had a high and glorious tradition. Modern living has brought with it not
only innumerable means of comfort but also a plethora of demands that tax human body
and mind. Stress is an inescapable part of human life is manageable to a large extent. The
objectives are following: Assessment of anxiety, stress, self-esteem, self-efficacy and general
profile of elected women councilors, Imparting Positive Therapy training to reduce theirstress and anxiety level, enhance their self-esteem and self-efficacy and evaluating the impact
of the programme. The area selected for the present study is Coimbatore District in Tamil
Nadu State. The Coimbatore District comprises of two corporation and ten municipalitieswith 130 women councillors. Among 130 women councillors, 63 had attended the programme.
The tools used for conducting the research were questionnaire, Rosenberg self-esteem scale.
General self-efficacy scale, Stress inventory and Anxiety inventory. The mean dijference
before and after training as revealed by t-value is significant at 0.01 level for self-efficacy,
self-esteem, stress and anxiety level. Women today are storming all the male bastions andproving themselves to be equally good in all most all walks of life.
INTRODUCTION
Women in India had a high and glorious tradition. All nations have attained their pinnacle of glory only when
women have been free, cultured and pure. Women have been the transmitter of culture in all societies. Modern
living has brought with it not only innumerable means of comfort but also a plethora of demands that tax humanbody and mind. Stress is an inescapable part of human life is manageable to a large extent. With proper
understanding of the processes that cause stress, the situation can be well managed. The stress management isvery easy if we sincerely analyze the reasons of stress. Physical stress management techniques have been
used since a long time.
The investigator had undertaken the study entitled "Positive Therapy for enhancement of Self-Esteem, Self-Efficacy and Management of Stress among Women in Local Govemance in Coimbatore District" with thefollowing objectives: to
Assessment of anxiety, stress, self-esteem, self-efficacy and general profile of elected women councilors
Imparting Positive Therapy training to reduce their stress and anxiety level, enhance their self-esteem and
self-efficacy
Evaluating the impact of the programme.
AIMS & OBJECTIVES
• Assessment of anxiety, stress, self-esteem, self-efficacy and general profile of elected women councilors
• Imparting Positive Therapy training to reduce their stress and anxiety level, enhance their self-esteem and
self-efficacy
• Evaluating the impact of the programme.
222

MATERIAL & METHODS
The area selected for the present study is Coimbatore District in Tamil Nadu State. The Coimbatore District
comprises of two corporation and ten municipalities with 130 women councillors. Among 130 women councillors,
63 had attended the programme. The tools used for conducting the research were questionnaire, Rosenberg
self-esteem scale. General self-efficacy scale. Stress inventory and Anxiety inventory.
The Coimbatore district comprises of two corporation and ten municipalities with 130 women councillors.
Among 130 women councillors, 63 alone attended the programme. The details of the sampling are given in
Table 1.
Tabiel; Selection of (he Sample
Name of the Place Category Tbtal number of Women Member
Councillors Attended
Coimbatore Municipal Corporation 16 7
Trippur Municipal Corporation 18 13
Kurichi Municipality 10 6
Goundampulaym Municipality 6 3
Mettupalayam Municipality 10 S
Kuniamuthur Municipality 12 9
Valampalayam Municipality 9 6
Pollachi Municipality 17 6
Valparai Municipality 7 -
Udumalpet Municipality 13 2
Nallur Municipality 6 1
Fnlladam Municipality 6 2
Total 130 63
Communication was sent to 130 women councillors whereas 63 only attended the programme. The porgramme
was planned in consultation with the Director, TNIUS; Director, Center for Women Studies and Head/Professor,
Department of Home Science Extension Education, Avinashilingam University for Women, Coimbatore.
Imparting Stress Management Techniques
Every day session on positive therapy was conducted by the author of positive therapy Dr. Hemalatha Natesan,Professor and Head of the Department of Psychology, Avinashilingam University, Coimbatore. Apamphlet on "StressManagement Techniques" was prepared in local language and distributed to the women counciUors.
Afternoon session was conducted by Dr. S Radhakrishnan, Director, SKITRAC, Coimbatore. He spoke onacceptance of dual roles a house wives and career women, resolving role-conflicts, time management and tomanage the negative emotions. Highlight of his speech is "Anything can be changed easily in our life". Sochange is possible, accept the change, change requires only two minutes. Reduce stress, anxiety level throughself-analysis.
Enhancing Communication Skills and Self-esteem and Self-efficacy
On the second day (04.03.2008) the programme started with prayer, thought for the day and Presentation ofprevious day report Dr. V Ganeshan, Retired Professor, Bharathiar University, Coimbatore spoke on"Enhancement of self-concept, self-esteem and self-efficacy, auto suggestion, thought stopping, cognitiverestructuring, management of stress". He asked the participants to write "Who am I?" He also taught laughingtherapy to the participants.
At 2:00p.m. Dr. O Vijayalakshmi, Reader in Psychology (Rtd.), Avinashilingam University for Women, Coimbatoregave lecture on "Healthy Human Relation". Salient points of her speech were "all professional people need and usea variety of interpersonal skills in every aspect of their work; they can achieve these by observing others and imitatingthem continuously.
223

She also mentioned the important qualities for interpersonal effectiveness they are Warmth, Genuineness, Empathic
understanding and conditional posture.
On the third day (05.03.2008) the programme started with prayer, thought for the day and presentation of
previous day report Dr. V Shanmuga Ganesan, Reader in Psychology, SRKV College of Education, Coimbatore
conducted interactive session on "Developing Public Speaking Skills". He explained with stories and jokes.
After lunch, session started at 2.00 p.m. Dr.K. Thangamani, Head and Professor, Department of Home Science
Extension, Avinashilingam University for Women, Coimbatore conducted theory session in Dance and Music
therapy. Dr. Rajalakshmi, Lecturer, Department of Home Science Extension, Avinashilingam University for
Women, Coimbatore conducted the practical session on "Dance and Music Therapy".
On the fourth day (06.03.2008) the programme started with prayer, thought for the day and previous day report
presentation. Mr. Kavithasan, HRD Manager, Coimbatore presented lecture on "Self confidence and developing
leadership skills" through Tamil poetry. Dr. P. Kanagasabapathy, Director, TNIUS, Coimbatore explained the
importance of family system in Indian Economy and our culture. Moreover Indian women played a major role
in saving that to investment on gold. As a woman you have to play a major role in developing our nation.
RESULTS & DISCUSSIONS
The findings of the study are discussed under the following:
Mean and T-values of Self-esteem and Self-ef^cacy
The mean and t-values of self-esteem and self-efficacy are presented in Table II.
Table 2: Mean Values And T-Values of Self-Esteem and Self-EfUcacy N=63
Variables Before training After Tt-aining Difference t - value
Self-esteem 75.79 ±9.16 85.44 ±9.96 9.65 5.66
Self-efficacy 86.67 ± 10.77 97.14 ±3.69 10.47 7.30
**Significantat0.01 level
The above table shows that mean values of self-esteem and self-efficacy were assessed. The mean values of
self-esteem and self-efficacy were increased after training programme. The mean difference before and after
training as revealed by t-value is significant at O.OI level for both self-efficacy and self-esteem. It is evident that
the programme has a good impact on the personality development of women councilors.
• Mean and T-values of Stress and Anxiety
The mean and t-values of stress and anxiety are given in Table 3.
Table 3: Mean Values and T-Values of Stress and Anxiety
Variables Before training After Training Difference t - value
Stress 12.24 ±4.79 5.73 ±4.24 6.51 14.58
Anxiety 9.94 ± 7.08 4.06 ± 6.05 5.88 10.93
**Significantat0.01 level
The mean values of stress and anxiety level of women councilors were assessed. The mean values of stress
and anxiety were found to be increased after training programme. The mean difference before and after
training as revealed by t-value is significant at 0.01 level for both stress and anxiety level. Hence it is clear that
the programme has a good impact on the personality development of women councilors and has reduced the
stress and anxiety among women councilors.
224

Symptoms of Stress Experienced by the Sample Before and After IVaining
Table 4 explains the symptoms of stress experienced by the women councillors before and after training.
Table 4: Symptoms ot Stress Experienced by the Sample Before and ARer IVaining
Aspects
Percentage of Women
Councillors (N:63)
Before IVaining ARer TVaining
Lack of sleep 92 44
Carelessness 92 30
Incapable of decision making 89 25
Lack of appetite 87 25
Disturbed sleep 75 16
Disturbed breath 65 22
Confusion 62 22
Headache 56 25
Stomach ache 56 24
Day dreams 40 •
111 health 40 6
Restlessness 40 5
Giddiness 35 5
Indigestion 32 3
Loss of weight 22 10
Sweating 17 8
*Multip]e responses
The above table depicts the symptoms of stress experienced by the women councillors before and after training.
Majority (92 per cent) of them experienced lack of sleep and carelessness followed by struggle in decision
making (89 per cent) lack of appetite (87 per cent), indigestion (32 per cent), loss of weight (22 per cent) and
sweating (17 per cent) before training as a symptoms of stress experienced by women councillors. After
training programme 44 per cent experienced lack of sleep, 30 per cent carelessness five per cent restlessness,
giddiness and three per cent indigestion.
• Advantages Expressed by Women Councillors Through Music and Dance Therapy
Music has a harmonizing effect on pain regulating neuro endocrine functions, important opiods of the pain
inhibiting systems. Music gives enormous stimulation to the secretion of endorphins and encourage faster
healing. It can be perceived by the patient. Music strengthens the immune activity and paves to good health.
Music increases the activity of immune system too.
Dance therapy is the therapeutic use of movement to improve the mental and physical well being of a
person. It focuses on the connection between the mind and body to promote health and healing. Benefits
expressed by women councillors through music and dance therapy are given in Table 5.
225

Table 5: Advantages Expressed by Women Councillors through Music and Dance Therapy
Benefits % of Women Councillors (N:63)
Improvement in concentration and memory power 81
Creating peace of mind 78
Relaxation 70
Stimulation of creativity 62
Reduced stress 60
Leads to good health 54
Creation of happy atmosphere 49
Sleeping well 46
Avoid fear 40
Developed self confidence 33
Reduced Anxiety 29
*Multiple responses
The above table expressed that most of the women councillors benefited through music and dance therapy.
Eighty one per cent reported that music and dance therapy helped to improve their concentration and memory
power, while 78 per cent of them perceived therapy as a capable of creating peaceful mind in one's life, 70 per
cent felt that it helped the individual as a relaxation, stimulation of creativity(62 per cent), reduced stress (60
per cent), leads to good health (54 per cent), avoid fear (40 per cent) developed self confidence (33 per cent)and reduced anxiety (29 per cent).
CONCLUSION
Women today are storming all the male bastions and proving themselves to be equally good in all most all walks
of life. Women in India today are also poised to take off. They are standing on the threshold of a new era. It
should be realized that every issue is a woman's issue from water to militarization, violence to economicplanning, ecology to economic development and from kitchen to parliament.
Women are making efforts round the world to see that their rights are respected, their voices heeded, theiropportunities widened. The "Voice from the kitchen" is being heard in international forum.
They should be brought into the mainstream of national development not as beneficiaries but as contributors and
partakers along with men and as rightful claimants of social security. Let us all strive to give women the placethey so richly and rightfully deserve in society. The hand that rocks the cradle rules the world. Swami Vivekanandahas put beautifully the ideals of service which need be imbibed by elected members;
"It is great privilege
For all of us to be allowed
To do anything for the world
In helping the world
We really help ourselves"
Same has been put in Gita: "We should pursue the path of excellence without fear or favour and work ceaselessly
to achieve the objectives".
"A woman is like a rose - a bud with no water and no light,
If you give it freedom, air, foofi,
It will open up,
I think women like that can bloom"
Get up and empower yourself.
226

RECOMMENDATION
• The importance and requirement of training are felt in every job equipping the personnel to discharge assigned
functions in an efficient and effective manner. For the women Municipal Corporation members training
have far greater importance because of dieir lack of exposure to public affairs and public dealings. Intensive
orientation cum training programme has continuously to be organized. Such training should be continuous
and spread over different phases rather than once for all.
REFERENCES
1. HarshipinderandPiiramjilA,f/i>'j/cfl/Sfrej^Mo/ifl5eHieHfa/«oHg Women, Psychological Studies, National Academy of Psychology,
India, 46 (1-2) (2001), pp. 69.
2. Janaki D, Women issues- Perspectives from Social History, Dhana Publication, Chennai, 2001, pp.11.
227

HD/OraI/18
A Study on Significance ofTt'aditional Toys for Pre School Children
Usha Kothari' & Nasreen Gazdar^
1. Assistant t Professor, PC Dept. of Home Science,
Jai Narain Vyas University, Jodhpur (Rajasthan)
[email protected] (09352574802 / 09352353136)
2. Lecturer, PG Dept. of Home Science,
Jai Narain Vyas University, Jodhpur (Rajasthan)
ABSTRACT
The Study has been undertaken to identify and determine the safety aspect, cost, educationalvalues, appropriateness and durability of traditional toys. A purposive sample of 75 mothers
who has pre-school children was selected within the municipal limit of Jodhpur city
(Rajasthan). These mothers were interviewed on a structured schedule by the investigators
at parent-teacher meetings and at homes. The findings lead to the conclusions that safety,cost, educational values and durability of toys were observed in traditional toys. Overall
majority said that present day, like weapon toys and Barbie dolls should be banned. Thesetoys stimulate feeling of aggressiveness, violence and sex at on early age. Toys are simplythe best for pre-school. Traditional building blocks and play-doll are for better for children'slearning.
INTRODUCTION
Toys are important shapers of the self in childhood and often continue in later life as symbols of different
"leisure pursuits". Toys allow the child to explore life observations and experiences safety. Personal toys allowthe child to project feelings and role expectations, to gain awareness, to clarify ideas and sometimes to releasenegative emotions. Toys provide an opportunity to experiment which is valuable to growth, first time experiencesand self-satisfying activity. The relationship one has with toys will reflect the cycle changes in life.
Children learn by doing. It is through interacting with materials around him that he learns. These toys need notinvolved a high cost. Folk toys, traditional festival toys, natural materials, etc have all get great educationalpotential. It is necessary for parents to find out the variety of materials that exist in the immediate environmentof the child and how they can be used to make the teaching-learning process meaningful and interesting.
Children play with toys or games as a form of entertainment, traditionally in some forms of entertainment,mirroring the adult world they are trying to understand. Play is children's work and toys are the tools used inplay. In addition, toys can keep children occupied and if properly chosen can assist in physical, mental, socialand emotional development.
Children do not to be taught how to play as play comes naturally; while there may be a required learning patternor temporary age barrier, toys are the very essence of "fun". Through the process of learning and acquiringnew skills toys mirror for children life's daily lesson-success defeat, acceptance, frustration, challenge, enjoymentand more.
The educational value of toys is generally measured on the ability to "teach" or reinforce concepts and
methodologies. Through toys the children learn new color, textures, movement and objects. For example, buildingblocks can reinforce counting concepts or color and pattern creation. Some toys are recognized by generationof parents as providing superior educational value; these long lasting toys are usually known for their durabilityand effectiveness, while other toys appear and disappear In a season or two.
Toys are a part of our culture. In fact toys might be considered the tools of play. Antique toys, as part of ourhuman heritage, provide us with objects that allow us to reach across time and learn about our post. Toys that
228

are part of the preschool life experience allows them to leam their society's values and perhaps to discovermore about themselves with children thinking about toys as product of culture they realize that "Toys are us."
India has a rich tradition of mother's infant games which can be particularly useful for facilitating sensory-motor development and which are unfortunately becoming absentee now.
Toys are not only present alongside the child In his home or during his play time. One finds it also, more andmore often. In other places such as the school and even the hospital where It is not only the child's companionbut also one of the privileged tools of the teaching profession, of pediatricians, doctors-psychologists and otherspecialists.
The preschool year is the period In life which Erikson terms "Industry". It is a wonderful place for children todevelop the sense of productivity It is also the time when children love to participate In games with rules. Thetraditional games are truly games of skills. Through participation in these games, children leam how to fit Into arule-governed society. They learn physical skills and skills of concentration.
AIMS & OBJECTIVES
1. To identify the various traditional toys.2. To determine the safety aspects, appropriateness, cost educational value and durability of traditional toys.
MATERIALS & METHODS
A purposive sample of 75 mothers was used for the present study. An interview schedule for the study wasprepared with the help and guidance of the supervisor and subject experts. The interview schedule includesvarious questions to-gaiher Information about the traditional toys. This schedule In Its final form deals withtraditional toys in which the survey of traditional toys was done. Opinion regarding, safety of the toys, cost ofthe toys, educational values of the toys, durability of the toys. An interview schedule was distributed to theparents during parent teachers meeting organized by school from time to time. The data collected for thepresent study was analyzed by tabulation the data. Percentage were calculated to determined the used of toysby preschool children. X- test was applied to see the significance of traditional toys.
RESULTS & DISCUSSIONS
The result shows clearly that toys can be made from various waste material and It is good to note that presentsample around 53.34 percent of the mothers do make toys for the children. The popular traditional toys madewere clay toys, gulli danda, puppets, hand made dolls, paper made toys, wooden toys, zhun-zhuna, pebbles,ferki/lattu. Today's many children and their parents are obsessed with glossy, high priced factory made toysperhaps not realizing what child can gain from simple home make playthings.
A study done by Kotharl U (2002) had 41.9 percent yes and 58.1 percent of mothers had not ever made toys forthe children.
On the basis of finding it was found that many mothers had made more than one toys firom various wastematerials like soft toys, paper toys, clay toys, building block, and puppets.
The study also Indicates that the above traditional toys are missing now days. The rich heritage of Indian toyshas largely remained outside the pail of modern education. Most traditional toys makers have been facingsinking market for their goods. Toys based on local materials design and folklore has all been swept away bysexist Barbie dolls, and video games, animated stories guns flood the Indian toy market. The whole traditional ofmaking toys with one's creativity has given way to factory made toys, which exhibit more of the westernculture.
The result indicate that in all the respondents 92 percent of mothers said that traditional toys helps children's Inlearning the adult task.
The (X^ = 39.66, P<.01) value on safety of toys shows that many of the traditional toys are not safe like gullidanda, clay toys, zhun-zhuna, pebbles, ferki/lattu etc. But traditional toys like soft toys, hand made dolls, woodentoys are proven to be safe. The results reveal that most of the respondent 73.34 percent had not experiencedhaving their children hurt by traditional toys.
229

The mothers opinion regarding appropriateness of traditional toys (X^66.12, P<.01) were found to be significant.Most often traditional toys are the raw materials of play and include building blocks, clay and paints, water,design cubes, collage material scissors and paste for which there are no blueprints to follow as traditional toysage, were and tear they can appropriately repaired or thrown out.
The educational value was found to be more significant regarding traditional toys (X^-61.9,P<.01). Throughtraditional games children learn how to fit into a rule-govemed society. They learn physical skills and skills ofconcentration. It is not only the child's companion but also are of the privileged tools of teaching profession, ofdoctors, pediatricians and other specialists. But present day toys have a negative impact on children's emotionaland physical growth, and in the future, may disturb the peace of our society. Therefore, we have to protectchildren from these dangerous toys i.e. present day toys and encourage the use of traditional toys.
The study also pointed out that toys like balls, building blocks, dolls/soft toys and house utensils, in early childhoodoffers good mental exercise. Even these toys are capable of involving children in play for longer time andprovide opportunity to assemble.
Regarding cost of toys the value shows that the traditional toys are much reasonable. A large variety ofmaterials is used for making toys and other play materials: day, wood and fabric are the common ones. Thosethat are made by hand are the real timeless ones where each is a fresh creation, and those made by moulds arenearer to the technique of modem production.
Some of the traditional toys were found to be more durable as these toys were never worn out so they weregiven to poor or stored in the child's room.
Safety Tips
• As toys are, wear and tear, they should be appropriately repaired or thrown out. Broken and worn toys canpose potential hazards for children of all ages.
• Be alert Toys should not be left unattended in potentially dangerous places such as on stairs.
• Supervise play activities appropriately.
CONCLUSION
Analyzing the result lead to the conclusion that maximum consideration in choosing the toys bought by parentsis given to age and safety of the toys. Most of the mothers have not experienced having their children hurt bytraditional toys. Traditional toys are capable of involving children in play for longer time and provide opportunityto assemble. Most of the mother had made more than one toy from various waste materials like clay toys, softtoys, paper toys, building block, wind chime and puppets. When the kids are really small they can have verysimple homemade toys like rattles etc. Since children are the future citizens of the world and so one canlogically conclude and recommend that toys help from future society at large.
RECOMMENDATIONS
Toys play a major role in a Childs life, entertainment, mental development, creativity, skill enhancement in facttoys leads to over all development. Traditional toys have their own reasons when it comes to learning like forexample the traditional toys that would have a lot to do with the basic concepts of shapes, sizes, colour etc. thatwould help the child in his mental development. Such traditional toys can never be replaced by the automatichigh tech toys that are available these days which are very attractive. Preschool children enjoy playing with thewooden rocking horses and pull toys. These toys are good for inducing the initial knowledge of transportation,wheel and animals. Overall traditional toys are more reasonable than present day toys. Hence the mothersshould be encouraged to make traditional toys from locally available waste and inexpensive materials.
REFERENCES
1 - Thakkar A. Significance ofearly childhood education, Department of Preschool and Elementary Education, NCERT, New-Delhi,
1987.
2. Kothai U, Child rearing and personality, Jodhpur Books Treasure 1996, pp. 1-7.
230

HD/Oral/19
Lnpact of SHGS (Sgsy) on Socio-Economic Status of Women Weavers of Manipur
Elangbam JcnitaDevi' &SantaAnand-
1. PhD Scholar, Lady Irwin College (New Delhi)
[email protected] (09862000782)
2. Reader, Dept. of Communication & Extension
Lady Irwin College (New Delhi)
ABSTRACT
Universally SHCs have been accepted as a means for poverty alleviation and empowermentof poor and marginal rural poor women socially, politically and economically. A number ofstudies have been conducted throughout the country to evaluate its impact and efficacy.However, very few researches have been done in the North-East region particularly in thestate of Manipur. The paper is an attempt by the researcher to fill up this gap. A study wasconducted on SHGs of women weavers under SGSY scheme of Imphal East, Manipur statewith an objective to assess the impact of SHCs approved by District Rural DevelopmentAgency (DRDA) on socio-economic status of women weavers. The researcher studied all the26 SHGs in the Imphal East district. All the 248 respondents were personally interviewed.The findings of the study indicate that though all the 248 respondents were benefited socially,politically and economically, it has not brought any significant changes so far. Though thegain in income is not statistically significant yet majority of the women felt that they havebeen able to spend some more money for the educational needs of their children which woj'a limitation criteria. Since most of them belonged to families living below poverty line (BPL)meeting their basic needs of food, clothing and shelter was possible in the past too, but theywere now able to plan their expenditure more insistently. Indeed, SHGs has created someopportunities of leadership and thereby bringing achievement of social positions for someof the key functionaries and office bearers of these SHGs. This has induced a sense ofidentity as well as confidence to these women. They felt that they have gained more respectfrom the family members after getting loan and subsidy through the scheme and therebyadding slightly more comfortable life than in the past. The study has highlighted some of theconcerns of mobilizing SHGs especially in the cultural and political fabric of Manipurstate.
INTRODUCTION
Woman is the companion of man, gifted with equal mental capacities • Gandhiji
Poet-Philosopher Rabindranath Tagore once said that woman is the builder and molder of a nation's destiny.No family or community or nation can have sustainable all round development socially, politically and economicallyunless women are empowered and made equal partners of decision making and progress with men. Ruralwomen constitute about 77% of the total female population in India. Therefore, denying women the rights fordecision making and entrepreneurship by subjugating them within the confine of the house will do irreparabledamage to the progress and development of the nation. It is well known fact that women contribute significantlytowards the national economy especially in the development of agriculture, handloom and handicraft sectors.
In India poverty in general and extreme poverty in particular has a gender dimension. Women are the mostvulnerable group affected by poverty. Poverty is a product of vicious cycle of low per capita income, low savingand consequently low capital formation and productivity. In rural areas, it is mainly due to unemployment,underemployment and low earning. Rural women play a cmcial role in the process of moving their families outof poverty. A woman's earning forms a significant part of the income of the rural families.
In view of the above, it is important that the ingrained potentials of the women are converted into productiveassets rather than treating it as family and social liabilities through economic empowerment i.e. empowering
231

women by making access to credit, skill and capacity building. These investments to women are not charity butproductive social investment with high rate of return.
Self Help Groups (SHGs)SHGs are community based organizations of the poor. Fundamentally, SHGs are entities for saving and borrowings.Women SHGs have been recognized as an effective means for generating income and empowerment through
injection of micro credit. A woman SHG is a voluntary group formed to attain some common goal. These aresmall informal groups of the poor created at the grass root level for the purpose of enabling members to reapeconomic benefits through mutual help, responsibility and team work. Most of the members liave similar social
identity; heritage, caste; occupation and come for a common cause and manage resource for the benefit of thegroup members.
Swamajayanti Gram Swarozgar Yojana
The Swamajayanti Gram Swarozgar Yojana (SGSY) was a govemment initiative to remove poverty in mralareas through self employment. The SGSY was launched with effect from Aprill, 1999.
The objective of the SGSY is to bring the assisted poor families (Swarozgaris) above the poverty line byproviding them income-generating assets through a mix of Bank Credit and Govemment Subsidy. It is based onthe belief that mral poor in India have competencies and given the right support can be successful producers of
valuable goods or services.
AIMS & OBJECTIVES
The purpose of the study is to assess the impact of SHGs under SGSY on socio-economic status of womenweavers in Imphal-East District, Community Development Block-II in Manipur.
MATERIALS & METHODS
26 SHGs were selected purposely from the approved list of SHGs by DRDA for the study. 248 respondents
were personally interviewed. Percentage, f-test and t-test were used for analysis.
RESULTS & DISCUSSIONS
From the survey, out of 26 SHGs, 17 SHGs were functioning well and other 9 SHGs were found to be defunct.From the study it was found that there are only twelve (70.6%) SHGs which had twenty members each at thetime of formation but at present it have reduced to five (29.4%) SHGs. Two (11.8%) SHGs had 22 (twentytwo) members at the initial stage. The number of members ranges from 15-17. At present the minimum numberof members in a SHG is 12. Out of 17 (seventeen) SHGs, 12 SHGs have decreased their members, 4 SHGs
have maintained same members and one SHG had increased the number of members from 15 to 16 with the
consent of the bank.
During the research, it was observed that the major bottle neck faced by the SHGs is in the area of bank linkageand finance. Out of 17 SHGs under study, 13 (76.4%) groups faced this problem. 23.5% (4) groups did not havethe problem of bank linkage and finance but faced administrative problems. These groups were those whichhad received revolving fund and term loan as well as subsidy.
Impact Assessment
Table 1: Mean & Standard Deviation of Percentage of Impact Assessment Score with Respect to
Religion
Religion No. of cases Mean ±SD
General 219 30,9567±5,40945
Muslim 29 29.8066±3,96583
i-Value 1.105
d.f. 246
P-Vaiue 0.270
232

The above table analyses the impact assessment with respect to religion. General (Meitei) and Muslim category
were the two religious groups considered for the analysis. There were 219 Hindus with mean impact assessment
score of 30.95% and 29 Muslim members with impact assessment mean score of 29.80. Therefore, it can be
concluded that the religion of members of a SHG has insignificant role with respect to impact.
Table 2: Mean & Standard Deviation of Percentage of Impact Assessment Score with Respect to
Type of Family
Type of Family No. of cases Mean ±SD
Nuclear 186 31.0858±5.35962
Joint 62 30.0315±4.93815
t-Value 1.367
d.f. 246
P-Value 0.173
To assess the impact of type of family on SHGs, two categories of families namely nuclear and joint family
were considered. From the above analysis, it can be concluded that the impact of SHGs was independent of the
type of families the members belonged to.
Ibble 3: Mean & standard deviation of percentage of Impact assessment score with respect to
age (yr)
Age No. of cases Mean ±SD
20-30 31 29.7089±4.55056
30-40 80 31.2744±5.8030I
40-50 93 31.5028±5.23030
50-60 37 29.4529±4.41779
60 & above 7 28.7805±5.10061
F-Value 1.792
d.f. 4,243
P-Value 0.131
The above table presents the impact of SHGs with respect to the age of its members. 248 respondents were putinto five different age groups. From the analysis, it was found that the impacts of SHGs are not dependent on
the age of members.
Table 4: Mean & Standard Deviation of Percentage of Impact Assessment Score with Marital
Status
Marital Status No. of cases Mean ±SD
Unmarried 31 26.9866±4.55236
Married 206 3I.4847±5.14477
Widow 11 29.2239±4.80657
F-Value 11,210
d.f. 2.245
P-Value 0.000
The above table presents the impact of marital status on the performance of SHGs. To study the impact the
respondents were classified into three groups namely unmarried, married and widow. From the analysis it wasobserved that the marital status of members make a significant impact on the performance of the SHGs.
233

Table 5: Mean & Standard Deviation of Percentage of Impact Assessment Score with Individual
Monthly Income (Rs.)
Monthly Income No. of cases Mean ±SD
Below 1000 62 31.9748±4.67108
1000 - 2000 57 3I.5362±5.89236
2000 - 5000 111 30.0857±5.00507
5000 - 10000 12 28.4553±5.51627
10000- 15000 6 30.4878±7.04705
F-Value 2.200
d.f. 4,243
P-Value 0.070
The above table presents the analysis of the role of individual monthly income on the impact of SHGs. The
members were classified into 5 (five) income categories. The P-value is 0.070 which was higher than the
standard value of 0.05. The analysis can be interpreted that individual monthly income is insignificant while
assessing the impact of SHGs. One of the reasons for the above could be the fact that individual earnings hardly
make any impact to other members of the group. Though individual incomes are important parameter for
individual members, it is of little consequence when the impact of SHGs as a whole is considered.
Table 6: Mean & Standard Deviation of Percentage of Impact Assessment Score with Category
of Family
Category of Family No. of cases Mean ±SD
No card 158 31.6641±5.53544
APL 13 29.4934±3.94597
BPL 58 28.9319±4.68083
AAY 19 30.5006±3.82155
F-Value 4.300
d.f. 4. 244
P-Value 0.006
The above table analyses the effect of category of family on the assessment of impact of SHGs. For this, the
members were grouped into four categories namely no card, APL, BPL and AAY. It can be observed that the
highest impact mean value is in the case of no card. It is because of the reason that they do not get any benefit
given by the government and SHG becomes the only avenue to improve their quality of life. Therefore, this
reason makes the category of family an important parameter on the overall performance of the SHGs.
CONCLUSION
The income from SHG activities is marginal and not enough to create assets and improve the quality of life.Therefore, effort should be concentrated on increasing individual earning through proper selection of activity,marketing arrangements and cost effective management measures.
Other problem areas are bank linkage and getting loans sanctioned from the banks. Amounts given under SGSY
are also inadequate. The ca.sual, unsupportive and beauraucratic attitude of implementing agencies are constant
impediment to the success of SHGs. However, self improvements and .social empowerment of women membersare contributions of SHG movement.
234

RECOMMENDATIONS
SHGs are helpful in terms of increased in socio-economic status to some extent. Since rural women cannot go
alone, there is need for more encouragement from all the stakeholders to enhance the capacity building of SHGmembers for more development and sustenance of SHGs.
REFERENCES
1. Purushotham P. National Study on SSCY - A process study centre for self employment and rural entrepreneurship. National
Institute of Rural Development (NIRD), Hyderabad, 2006.
2. Selvakumar M and Sundas R, Swaniajayanti Gram Swarozsor Yojatia (SGSY) - Tool for Poverty Eradication, Kurukshetra,
Ministry of Rural Development, 56 (2) (2007).
3. Manimekalai N and Rajeswari G, Einpowertnent ofwomen through selfhelp group (SHG), Margin, 32 (4) (2000).
4. Sultana M. Women empowerment through self help groups with reference to VikarabadMandal ofRanga Reddy district inAndhra
Pradesh. SEDME, 32 (3) (2005).
5. Dasgupta R, Working and Impact of Rural Self Help Groups and other forms of Micro Financing, Indian Journal of Agriculture
Economics 56 (3) (2001).

sis £5
HD/Oral/20
Changmg Role ofFather: AStudy of Fathei^' Participation in th^C^e of &eir Mentally RetardedChildren _jKunjan IHvedi' & Pratibha Bohra^1. Associate Professor, HDFS, Dept. of Home Science,
Jai Narain Vyas University, Jodhpur (Rajsathan)
[email protected] (09413848390)
2. Research Scholar, HDFS, HDFS, Dept. of Home Science,
Jai Narain Vyas University, Jodhpur (Rajasthan)
ABSTRACT
Present study was conducted on father ly changing role, focusing on their participation in
the care and their feelings towards their mentally retarded children residing in Jodhpur city.
Care included the different areas such as the physical care, social participation, personal
feelings, recreation and behavior management of the child,
The purposive sampling consisted offathers of 30 moderately M.R. children between the
age group of 15-18 years.
Results revealed that fathers are increasingly becoming active fathers. Fathers of M R childrenare moderately involved and take part in selected child care activities like playing, conversingand visiting their schools. They do not take part in activities like feeding and taking a walkwith the child. Most fathers had fatalistic attitude towards the handicap of their child at the
same time they take it as a responsibility entrusted to them.
INTRODUCTION
All humans look alike when they are bom but they do differ in height, weight, colour and in their mental
capabilities. Mental capability, if below average level is understood as mental retardation [MR].In all classes, races. Socio-economic level, caste, gender, religion .MR is found as a universal phenomenon.
According to 'The AAMR [1982] mental retardation deals with significantly sub average general and intellectualfunctioning resulting in or associated with concurrent impairment in adaptive behavior and manifested duringthe developmental period [Chintamanikar,1992]. Most of the researchers till date have proved that MR is
quantitative rather than qualitative. There is no more hidden reality about the problem and magnitude of MR
children.
Birth of a MR Child puts parents and siblings under distress and many of them develop guilt complex. Bringingup of these children is a great challenge. On one hand here is observable negligence and avoidance of suchchildren, there is overprotection on the other. By over protection and denial behavior parents invite adjustmentdifficulties for these children. Also, both mother and father need to actively share this challenge. Warm andpositive behavior of mothers, fathers and family members make happy and positive quality of life of thesechildren.
Father, traditionally was mostly the breadwinner and provider of economic support. But in the rapidly changinglife patterns the enhanced and enlightened status of women has brought fathers in the forefront with regard tochild care. When the child is MR, fathers' contribution in their care becomes more crucial and significant. It is
repotted that both, mother and father are deeply affected by the presence of retarded child in the family.
However, mothers have been found to be more vulnerable and have more negative attitude than fathers.
AIMS & OBJECTIVES
Present study was conducted with the broad objective of assessing the participation and attitude of fathers'
towards the care of mentally retarded children.
236

MATERIALS & METHODS
30 moderately MR children between ages 15-18 year were selected on purposive basis from 2 institutions of
Jodhpur city.
1. Navjyoti Manovikas Kendra
2. Sanjivani Mental Health Rehabilitation and Research Institute.
The sample for the study comprised of fathers of these children.
To study the level of fathers' participation, the different tools selected were:
1. Background information sheet- A self-constructed sheet in Hindi was developed to collect information or
the socio-demographic of the sample.
2. Questionnaire on fathers 'participation in child care [FPCC] - A self-constructed questionnaire was used toassess fathers' participation and their attitude towards care of their MR Child.
There were 40 questions, a mixture of objective, and subjective based on caring activities from different domains
in the finalized version of the Questionnaire.
Purpose of the study and the instruction regarding the FPCC were explained to the fathers and were read out
to them. They were asked to fill up the questionnaire taking as much time as required. Mothers' absence, while
fathers filled up the questionnaire was ensured for maintainiiig objectivity in their responses.
RESULTS & DISCUSSIONS
Table 1 shows father participation in child care activities
Table 1: Fathers 'Participation in Total Caring of the Child
Whether Participated Reason for Non participation
Yes 30 Lack of time 36.67%
No interest 20%
No 70 Busy in other work 10%
Any other 33.33%
70 percent fathers say that they don't take part in any activity with MR Child after coming back from work.The reasons referred are varied. 36.67 percent fathers say they do not have time, 20 percent fathers say that
they are busy in other work. 33.33 percent fathers chose not to give any reason for it. Unlike the present study
Elaine and Richard [2008] reported that fathers of intellecmally impaired child were more mindful in theirparenting role and use less avoidance in relation to their child related parenting tasks.
Ibblc 2: Participation in Childcare Activities by Fathers of MR Child
Personal Care 46.67%
Feeding 3.33%
Play 26.67%
School visit 70%
Parent teacher meeting 43.33%
Share personal experiences 53.33%
Walking with the child[weeklyl 10%
Recreation 43.33%
Table 2 shows that as high as 46.67 percent fathers take care of personal hygiene of their MR children and
43.33 percent of fathers indulge in recreational activities. 26.67 percent fathers in this study indulged in activities
237

involving play whereas only 3.33 percent of fathers take care of feeding of their MR Child. Communicating
with the MR Child is difficult but a very necessary task 53.33 percent fathers share personal experiences with
the child. Fathers, who do take a walk with the child, do it very seldom [10% weekly].
School is the second home to children but there too parents have to play an active role in coordinating between
the demands of the school and the individual child with his unique potentialities. 70 percent fathers do visit the
schools once in a month but only 43.33 percent of fathers attend parent teacher meeting. It is mostly the
mothers who attend these meetings more regularly. Dallas and Spas ford [1995, cited Wollet, 1999] also make
similar distinction in the child care activities taken up by fathers and mothers.
It appears from the present study that even though fathers are involved in child care activities their participation
is not as high as that of mothers and other members of the family.
Dasgupta [1995] distinguishes parents and their child rearing techniques in term of control and discipline.Studies suggest that use of reasoning and explanation is more effective when accompanied by the feelings of
parents.
l^ble 3: Problem Behavior and its Management
Handling Child's Aggression Sleeplessness Bed wetting
With love 70.00% Yes 70.00% Yes 06,67%
Medication 06.67% No 30.00% No 93.33%
Ignoring 23.33%
Echoing the same view the present study reveals that 70 percent fathers handle their child's' aggression with
love while 23.33 percent fathers ignore the child's' aggression. Very few [6.67%] agreed to be using medicines
for calming their child. 70 percent fathers said that their children have problem in sleeping. 93.33 percent of the
MR children in the present sample have toilet control and did not generally wet their beds. Only 3.33% fathers
said that they clean their bed whenever needed.
Table 4: Fathers Feeling on Having a MR Child
Situation Feelings and Reaction Percentage (%)
While introducing the child Feels Ashamed 16.67%
Feels guilty 10.00%
Normal 73.33%
On detection of disability Past Sin 03.33%
Fate 03.33%
Hurt & unhappy 73.33%
N/A 20.00%
Coping techniques Pampering with things 73.33%
Waste of money 23.33%
Sending to MR Institutions For better care 60%
Family freedom 30%
Training 20%
Table 4 shows fathers feelings on having a MR Child. Mixed feelings on detection that their child has MR are
reported in table 4. A majority [73.33%] felt hurt and unhappy, whereas only 3.33 percent each said that they
felt it was their fate or results of past sins. While introducing this child 16.67 percent feel ashamed, 10 percentfeel guilty, 73.33 percent have normal feelings. 73.33 percent fathers agreed pampering the child by getting
'238

them their favorite things whereas 26.67 percent fathers do not indulge their children. 23.33 percent fathers felt
that care of child is a waste of money. The physical, psychological and financial stress of looking after the MR
Child appeared to develop a feeling of dejection and hopelessness in them. Even then only 50 percent fathers
agreed
on option of sending the child to a residential institution for reasons as proper care [60%], family's freedom[30%]
and better training [20%].
CONCLUSION
It can be concluded that fathers' participation in child care activities is not as high as could be possible. Their
feelings and attitude towards child care activities are found to be positive, satisfactory and encouraging. For
such children of lesser GOD, early intervention, training centers, day care centers, integrated schooling andmost importantly sensitization, awareness and education of the parents are some important measures needed
for improving the quality of life.
RECOMMENDATIONS
REFERENCES
1. Chitamanikar, Exceptional children: Theirpsychology and education, Sterling Publisher Private Ltd, New Delhi, 1992, pp. 41-44.
2. Dasgupta P, Crowing up in Families, in P. Barnes Edited Personal, Social and Emotional Development in Children, Milton
Keynes, Open University Press, 1995
3. Elaine E Macdonald and Richard P Hastings, Mindful parenting offather of children with intellectual disabilities, Journal of Childand Family Studies. 23 (206) (2008), pp. 206.
4. Margali t M and Raviv A, Mother's perception of family climate in families with mentally retarded child. The Exceptional Child, 20,
(1983), pp. 163-169.
5. Rastogi C K, Attitude of parents towards their mentally retarded children, Indian Journal of Psychiatry, 23 (206) (1981).
6. Shanker and Uday, Problem children, Atmaram & Sons, Lucknow, 1978, pp. 425.
7. Wollet A, Working with families, in D. Messer& F. Jones 11999]. Psychology of Social Care. London, Jessica Kingsley, 1997, pp.113.
!239ii

HD /Poster/2
Enhancmg the Lives of Street Children through Life Enrichment Education (LEE)
K Arockia Maraichelvi' & N Jayapoorani^
1. Lecturer, Avinashilingam University for Women,
Coimbatore (Tamil Nadu)
[email protected] (09843114463)
2. Head, Dept. of Human Development, Avinashilingam University for Women,
Coimbatore (Tamil Nadu)
Indeed by emphasizing the debilitating aspects of street life, most studies have brought street children toprominence as "a category of children whose life circumstances place them at physical and psychosocial risk"
(Veale et al., 2000). It was in this context; the study entitled "Enhancing the lives of street children through LifeEnrichment Education" was undertaken with a main objective of enhancing the selected street children'soverall development by imparting LEE to gain insight into selected physical and psychosocial aspects. This
research conducted in Coimbatore city, Tamil Nadu, India comprised of 66 boys and 52 girls residing in
rehabilitation homes. An interview schedule was framed to secure adequate information on their knowledgebase in reference to physical and psycho-social aspects before and after imparting LEE. The data collectedwas systematically computed and subjected to systematical analysis. The substantial leap of the awarenesspercentage and the't' value significant at 1 percent level with regard to the selected aspects of physical dimension
(physical health care, substance use and reproductive health care) and psycho-social dimension (communication
and listening skill, assertive behavior, emotional health and moral behavior) unmistakably designate that the
LEE program had made a better headway in the minds of the selected street children. Promotion and protection
of street children's life is dependent on education, health and attitudinal changes in behavior and confidence tolead an independent life. Hence the society is responsible to frame suitable strategies to mould their livelihood,which can be made possible with LEE as it brings forth attitudinal changes, behavior modification and desirablehealth practices.
HD /Poster/81
A Study ofPersonality, Rigidity and Leadership Preference of Undergraduate Commerce Students
Krishnakali Bhattacharyya' & Pragjyoti Bhowmik^1. Senior Lecturer, Dept. of Home Science, J. D. Biria Institute, Kolkata (West Bengal)
[email protected]/krishnakalLbhatiacharyya® yahoo.CO
(09433040111)
Ex-Student, Dept. of Home Science, Human Development Section,
J. D. Birla Institute, Kolkata (West Bengal)
2.
Education is a driving force for economic development. Commerce education aims to enable the student
develop the ability and understanding of goods and services offered by business sector. Acquiring knowledge inany sphere is influenced by personality make -up and rigidity. Fair trading is only possible if the country is
headed by potential leader(s).Adolescent students with their capacity for abstract thinking is expected to havepreference for certain leadership styles which they think will help them to carry forward what they are acquiringnow. Thus the present investigation aims to study personality, rigidity and leadership preference of undergraduateCommerce students of colleges of South Kolkata. The survey was carried out on 87 male and 79femalestudents selected on the basis of educational status, community, family type, number of siblings and religion.The data were collected by administering Eysenck Personality Questionnaire-R, Dimension of Rigidity Scaleand Leadership Preference Scale. The results revealed that there is a significant gender difference among thesubjects in all the personality dimensions, in emotional and behavioral rigidity. However, no significant differencewas found between male and female students regarding intellectual, dispositional, social, perceptual and creativerigidity. The commerce students also unanimously showed preference for democratic leadership.
240

HD /Poster/9
impact of Social Change and OtherApproaches for SelfDevelopment of Girls in Jharkhand State
Renu Bose', Bhartiyan-& Kumkum Kumari'1. Head, PG Dept of Home Science, V B U, Hazaribag (Jharkhand)
renu_bose@ sify.com (9431506688)
2. Lecturer. Depl of Home Science, l.GS. College, Mandu, Ramgarh, Hazaribagh (Jharkhand)
Lecturer, J. D. Women's College, Bailey Road, Patna (Bihar)
The eleventh plan's emphasis is on gender equality and on arresting the decline in the child sex ratio.Nutrition program for Adolescent Girls, Kishore Shakatd Yojana, Balika Samridhi Yojana" are the current schemes
carrying to the girl child. Though, the schemes are definitely not health and family welfare oriented issues, theyrequire to be treated and viewed as protection issues. Child trafficking, sexual exploitation are the problems that
the society is increasingly being confronted with. In Jharkhand State every year 30 thousand women child fromtown area are being under trafficking. In which 67 percent women under the age of less them 18 years and
mainly tribal girls, 10 percent women under the trafficking are illiterate, 12 percent women disappears from thetown area. In a bid to control the high dropout rate among girls, the govemment has now proposed scheme to
provide supplementary nutrition to adolescent girls. Various schemes engaged in improving the holistic life of
girls but due to many causes they have to face problems in every walk of life.
HD /Poster/10
Impact ofMothers Education on Cognitive Abilities of Pre-School Children
Suman Bhanot' & Shabnam Ansari^
1. Head, Dept. of Human Development, N D University of Agriculture &
Technology, Faizabad (UP)
[email protected] (09415332928)
2. Ex-Student, Depl. of Human Development, N D University of
Agriculture & Technology, Faizabad (UP)
The present study was conducted in Kumarganj, Faizabad district of Eastern Uttar Pradesh. The purpose
of the study was to assess cognitive abilities of hundred preschool children. Sample of the study comprised 50girls and 50 boys of age between 3 to 5 years. The standardized Pandey's Cognitive Development Test was
used to assess the cognitive abilities of pre-school children. Data was analyzed in terms of frequency, percentage
and chi square (•=■-). The statistical analysis revealed that maternal education has a significant effect on cognitiveabilities of preschool children. The pre-school children with educated mothers have high cognitive abilities thanpreschool children of illiterate motliers.
HD/Poster/lI
Education and Employment as Related to Modernity: A Study of Social Change in Women ofHazaribagRenu Bosc
Head, PG Dept. of Home Science, V B U, Hazaribag (Jharkhand)renu_bose@ sify.com (09431506688)
The research reported in concerned with the study of social change in women of Hazaribag. It attemptsto examine the influence of education and employment on the extent of social change of women. Social change
^24'I

has two faces one is the material changes and the other is the non-material changes. This research is concerned
with measurement of social change through the measure of one's attitudes, beliefs and values. Modernization
signifies a process of epochal transition. It implies emergence of a culture of high-tech, formal organization,
secularized value system and vigorous psycho-social mobilization. The modernity scale developed by Singh
(1984 b) consists of four dimensions namely, personality, socio-cultural, political and health has been used for
the study. The second means of measurement of social change is the measurement of one's values in different
areas of one's life which were also used in the study. A sample of 240 women has been selected for the study.
Analysis of the data and discussions made and major finding obtained.
HD/Poster/13
A Study of Achievement Motivation and Study Habits of Bengali Medium and English Medium Adolescent Girls
Punam Mehra' & Arpita Saha^
1. Sectional In-charge, Human Development Section,
Dept. of Home Science, J. D. Birla Institute, Kolkata (West Bengal)
[email protected] (9830348670)
2. Ex-Student, Human Development Section, Dept. of Home Science,
J. D. Birla Institute, Kolkata (West Bengal)
Study habit in adolescence is very important for future achievement. The present study aims to investigate
the impact of medium of instruction on achievement motivation and study habits of adolescent girls' .Eighty girls
from Bengali medium and eighty from English medium schools were selected by the method of purposive
sampling as subjects. Their community, age group, (14-18 years), educational qualification, type of family,
marital status and socio-economic status were taken into consideration. The data pertinent to study were
collected with the help of two questionnaires, namely, (1) Deo- Mohan-Achievement Motivation Scale and (2)
Palsane and Sharma Study Habit Inventory. Collection of data was followed by statistical analysis. The result
of t-test indicated that there is no significant difference between Bengali and English medium school girls in the
areas of achievement motivation and study habit. However it was found that achievement motivation and study
habit were positively correlated for both the groups. Therefore it may be concluded that medium of instructiondo not have much impact on achievement motivation and study habit, although the two have been found to be
positively correlated.
HD /Poster/14
Impact ofTechnologieal Advancements on Family and Community
Aqjali Pattanaik', Laxmipriya Dei^ & Swamanjali Misra'
1. Professor, PG Dept of Home Science, Berhampur University, Berhampur (Odisha)
[email protected] (09438012561)
2. Reader, Dept. of Home Science, Govt. Women's College Keonjhar (Odisha)
3. PhD Student, F.G Dept. of Home Science, Berhampur University (Odisha)
The 21" century which has provided to our fast developing youth a plethora of opportunities, now demands
a lot from them. Amidst this situation of development, when a separation is seen between old parents and their
children, the so-called technological developments have brought them together. Now a day the ways in which
parents train and stimulate their children also change systematically with the modernization of the family. The
tremendous impact of social change on family life can be seen in the systematic change in the ways in whichparents train and stimulate their children in a democratic way. It is all the transcendence of human race that
people today reach the height of maximum luxury upgrading from the days of their very ancient stone and cave
242

age. The advent of satellite communication, cellular and truck line communication enable us to access our
family members, friends, relatives even across continents in a flick of second. Of course where science and
technology has made us materially rich in the socio-economic front, the world is also going to be a big looser.The most disastrous consequences of over indulgence are, when people try to emulate their role models in filmsand TV that ultimately leads tliem on to crime. The decline due to advanced technology also has crept in the
entire society, the parents have failed the children, the teachers have failed the students, the government hasfailed the people and the spiritual leaders have failed the aspirants. But everyone should know that science is a
good servant but bad master.
HD/Poster/16
Impact of the Use of Cell Phones on the Educational Interest, Creative Thinl^g and PersonalValues of Teenagers
Jyoti Mankar
Associate Professor, Shri. Shivaji College, Akola (Maharashtra)
[email protected] (09823159324)
The changing scenario of Indian society due to use of cell phones amongst teenagers is very confusing
as its utility and side effects, both are observable and alarming. The aim of the study is to know the personalityprofile of the cell phone users and to correlate the extent of use of cell phones with creative thinking, educational
interest and personal values of teenagers. A questionnaire and interview schedule was used to collect data by
stratified random sampling method and Baker Mehadi's test on creative thinking was administered. The resultsrevealed that the use of cell phone for a longer period of time lowered the educational interest, showed lesspersonal values, like importance of truth, self capability, goodness etc. The constant use of cell phones failed toshow the relation ship of creative thinking with educational interest in appositive manner.
HD/Poster/17
Nutritional Status and Quality of Life of Rehabilitated Leprosy "S^ctims of Burla Town, Odisha
Tillottama Khandapani' & Braja Kishori Mishra-
1. Re.search Scholar, PG Dept. of Science, Sambalpur University,
Jyoti Vihar (Odisha)
[email protected] (0986II21935)
2. Head. PG Dept. of Science, Sambalpur University, Jyoti Vihar (Odisha)
Leprosy is stigmatized disease that apart from the physical ailments and the deformities causes, psycho-
social-economic problems to the people affected. It is one of the major public health problems of developing
countries and is well known for the strong stigma associated with it. Leprosy is widely prevalent in India.According to the NLEP progress report for the year ending March 2008-09, India reported 1, 34,000 cases ofleprosy. Odisha is one of the state in which the leprosy situation is highly endemic. All most 1 in every 10,000suffers from leprosy in Odisha. Health and nutrition profile of any vulnerable section of society is of primeimportance to determine their functional levels. In this backdrop an attempt has been made in this paper toassess the health and nutrition status of the leprosy victims of two leprosy colonies of Burla town, Odisha.Socio-economic, information of all the 150 victims residing in these two colonies were collected by the help ofa pre tested interview schedule .The measurement of height and weight was recorded by stranded instruments.The weight and height of all the victims in the age group of 20 to 80 years were observed to be less than theweight and heights of reference Indian man and woman. Body Mass Index (BMI) revealed that all most all thevictims suffered from moderate to severe grades of malnutrition. The socio-economic variables do not have
243

much influence on the anthropometric measurements and prevalence of malnutrition. The study also aims todetermine the quality of life (QOL) and general mental health of rehabilitated leprosy victims. World HealthOrganization Quality of life Assessment BREF (WHOQOL-BREF)-was used to assess QOL of the victims; a
Self-Reporting Questionnaire (SRQ) was used to evaluate general mental health of the victims. QOL andgeneral mental health scores of rehabilitated leprosy victims were worse than those of the general population.
HD /Poster/18
Matrimonial Website: Challenges and Solution Perceived by Never married Adults (20-35 Years)
Mansi V Mebta' & Kamini P Rege ̂1. National Franchise Supervisor, Podar Education Network, Podar Centre,
Parel, Mumbai (Maharashtra)
[email protected] (09867087977)
2. Assistant Professor, College of Home Science,
Nirmala Niketan, Mumbai (Maharashtra)
There is widespread use of internet in metropolitan cities for finding information, social networking, andmaking friends and even for searching for a spouse using matrimonial websites. The objective was to examinechallenges (advantages and barriers) and solutions perceived by the never married adults for searching aspouse through matrimonial websites. Desired information was elicited from 100 never married adults locatedin Mumbai through a questionnaire (open and closed ended questions). The results revealed that the perceivedadvantages were that a) the matrimonial websites provide an array of options/variety for people to choose, b)eases the process of finding/selecting mate; c) benefits introvert and shy individuals. While the barriers includeda) hiding one's true identity; b) falling prey to fraud cases; c) misusing the information available on matrimonialwebsites; d) threatening the authenticity and privacy. The suggestions provided were a) investigating the profilesand their information appropriately, b) maintaining laws/policies with regard to authenticity and privacy, c)making it mandatory to collect proof/authentic evidence, d) taking serious actions against fraud cases. Researchingregarding the increasing popularity of matrimonial websites is an eye-opener and enlightens the young adults,their parents and website owners regarding challenges, alertness, understanding and judgment regardingmatrimonial websites.
HD /Poster/19
Non-Formal Pre-Scbooi Education and its Impact on Development of Children Under ICDSProgramme
Ilia Jogi
Head, Dept. of Home Science, Mahila Mahavidyalaya,
Karad, Dist. Satara (Maharashtra)
[email protected] (09422384738)
Early childhood is the blossoming stage of human personality and formative period in child's life. The
development fostered during this period lays foundation for building superstructure of an individual's personality.Integrated child development Services (ICDS) is the countrywide program aimed at all-round development ofchildren through package of services including Non Formal Pre-School Education. Non-Formal Pre-SchoolEducation (NFPSE) under ICDS scheme is a crucial component of the package of services envisaged underthe scheme. It aims at physical, motor, psycho-social and cognitive development of a child in cogent and holisticmanner. It also aims at school readiness and development of positive attitudes towards education and providesintellectual stimulation through non-formal pre-school activities. The national goal to achieve universal primary
education can be achieved only through strengthening of pre-school education in Anganwadi Centres. Theneed for pre-school education is considered more pronounced in the case of children from culturally and socio-economically disadvantaged homes.
244

TEXTILE SCIENCE, DESIGN, CLOTHING AND FASHION STUDIES
(Oral & Poster Presentation)


TSDCFS/Oral/2
Printing of Silk with Croton Leaves {Codium variegatum)
Rachna Singh', Ekta GroveH, Nargis Fatima' & Sristi Maurya^1. Ex-research Scholar, Dept. of Clothing & Textiles, SHIATS, Ailahabad-211007 (UP)
2. Asst. Professor, Dept. of Clothing & Textiles. SHIATS. Allahabad-211007 (UP)
groverckta 1 @rediffmail.com (09450308089 /09889908769)
3. Asst. Professor, Dept. of Clothing & Textiles, SHIATS, Allahabad-211007 (UP)
4. Teacher, Dept. of Clothing & Textiles, SHIATS, Allahabad-211007 (UP)
[email protected] (0945593770)
ABSTRACT
Man's urge to decorate his clothing and the fabrics of his environment, by means of printing,
dates back to the very early times and fabrics so patterned existed before woven orembroidered ones. In this sphere of textile activity, Indians were the pioneers in the art ofprinting with natural colours. The traditional printers all over India in general printed
cotton textiles rather than silk fabrics. The appropriate technical knowledge of colour
extraction and standardization of printing is of immense value and requires a detailed study.Besides, the focus is on increasing export of textile goods and the use of natural colours fordyeing and printing of textile materials may enhance export prospects, as there is a growinginterest for naturally dyed products among foreign buyers. Hence keeping in mind thesefacts, an attempt has been made to optimize the printing recipe for printing of silk fabrics.Fresh Croton leaves (Codium variegatum) were taken for dye extraction. Two thickeners i.e.Gum tragacanth and gum acacia and three mordants i.e. alum, CuSO^ and FeSO^ in various
concentrations were used for preparation of printing paste. The standardized recipe wasused for dye extraction and printing recipe a standardized by optimizing concentrationof dye concentrate, and mordants concentration through visual evaluation and colourfastness testing. Various utility articles were printed with standardized printing recipe usingscreen printing technique. It was observed that between two thickeners, gum acacia gave
best results with 8ml dye concentrate using 10% alum, 1% CuSO^ and FeSO^. Thecolourfastness was found to be satisfactory and the printed articles were also highlyappreciated by the entrepreneurs. The use of various mordants with acacia thickener producedvarious shades of pink. Since the natural dyed and printed products have much demand inthe international market, further research can be done on printing of silk with other sourcesof natural dyes in combination with the natural thickeners.
INTRODUCTION
Man's urge to decorate his clothing and the fabrics of his environment, by means of printing, dates back to thevery early times and fabrics so patterned existed before woven or embroidered ones. Printing, a method ofornamentation employed first by ancient Indians and Egyptians is generally defined as 'localized dyeing' i.e.dyeing which is confined to certain portions of the fabric that constitute the design. The evidence of printing inIndia was found during the 4"' century B.C. and .such fabrics were exported to China, where they were muchused and admired, and later imitated.
In this sphere of textile activity, Indians were among the pioneers in the art of printing with natural colours.Printing with indigo was more of a mystery to many foreign travelers to India because they could observe notrue colour when fabric was dipped in indigo bath. The traditional printers all over India in general printed cottontextiles rather than silk fabrics. As a result the traditional recipes for use of natural sources for printing on cottontextiles were well established and have been documented to an extent; though even in this area, contributionsfrom academic institutions remained almost negligible and hence systematic or accurate data of various popularshades produced by the traditional (so called vegetable) printers was hardly ever documented. The research
247

efforts devoted to natural dyes are negligible. If there had been significant research on the use of natural dyes,
it is probable that they would have already been much more widely used than they currently are. Although many
studies on extraction and processing of natural dyes on various fibers have been reported, the use of natural
colour is still very limited due to non-availability of standard shade card, precise and specific way of application
and standard norms. The appropriate technical knowledge of colour extraction, purification and standardization
of printing techniques is of immense value and require detailed study. Besides, the focus is on increasing export
of textile goods and the use of natural colours for dyeing and printing of textile materials may enhance export
prospects, as there is a growing interest for naturally dyed products among foreign buyers. Hence keeping in
mind these facts an attempt has been made to optimize the printing recipe for printing of silk fabrics.
AIMS & OBJECTIVES
The aim of the research is to explore untapped resources of natural dye for value addition of silk through
printing and dyeing. Keeping in mind this aim, the study has been carried out to optimize the recipe of printing ofsilk using natural dye extracted from Croton Leaves {Codium variegatum)
MATERIALS & METHODS
• Pre treatment of the fabric: Before dyeing and printing, the entire length of the fabric was washed by the
method recommended by Dantyagi (1983). A detergent solution containing 0.5 ml of genteel per 100 ml of
water was prepared. It was heated to 50°C. Silk fabric was dipped into this solution and stirred gently for
about 30 minutes. It was kneaded, squeezed in the soap solution and then rinsed under tap water till free
from traces of detergent. After that, fabric was partially dried in shade and ironed when half wet. Silk
samples of size 5x5 inches, weighing 2 gm were taken for conducting the experiments.
• Preparation of the screens: Screen was prepared by stretching the nylon mesh tightly over the wooden
frame. The design was drawn and painted with enamel paint, blocking out those portions, which were not
required to be printed.
• Thickener used: Gum acacia and gum tragacanth were taken as thickeners for preparation of printing
paste. Gum tragacanth was obtained from leguminous plants like astragalous gummifier as dried-up exudates
while gum acacia exudates from the stems and branches of acacia nilotica was used.
• Selection of dye: Fresh Croton leaves {Codium variegatum ) were selected for the study. The collected
leaves were crushed and used in fresh state for extraction of dye.
• Extraction of dye: following recipe was used for extraction of dye and preparation of colour concentrate.
Dye concentration 12 gram
Extraction Media Acidic (HCl)
Concentration of HCl 1.0 ml
Extraction time 60 minutes
Temperature 80° C
Dye solution was prepared by adding 12 gm of crushed leaves in a beaker containing 100 ml of water and 1
ml of HCl. The temperature of solution was raised upto 80° C for 60 minutes to extract the dye from leaves.
After that solution was allowed to cool and was filtered for preparation of dye concentrate.
Preparation of colour concentrate: The clear extracted solution, prepared by optimized dye concentration,
was concentrated by heating to obtained dye concentrate. For this 100 ml. of dye solution was reduced to 5
ml concentrate through evaporation using hot plate. Different concentration were obtained by dissolving i.e.
(2, 6, 8 and 12 ml) dye concentrate separately in 100 ml of water and reduced to 5 ml, for preparation of
printing paste.
248

• Preparation of printing paste: 5 and 2 gm powder of thickeners like gum acacia and gum tragacanth,respectively were added by sprinkling to the each dye concentrate under constant stirring and final volume
was made up to 50 ml with addition of water. The paste were kept for ovemight. Four printing pastes wereprepared for each thickener using different dye concentrates i.e. 2, 6, 8 and 12 ml
• Effects of different mordants on printing: To see the effects of different mordants i.e. copper sulphate,ferrous sulphate and alum on printing, three different concentrations of each mordant were taken and added
to the printing paste separately. For alum three concentrations i.e. 5,10 and 15%(o.w.f) were taken and for
copper sulphate and ferrous sulphate both 1, 2 and 3% (o.w.f.) were taken separately in printing paste
already prepared. Samples were printed with all three concentration of each mordant and based on results
obtained by visual evaluation based on depth of shade, clarity of design and overall appearance, one best
concentration of each mordant was optimized. Silk samples were printed with all the printing pastes prepared
by these concentrates and based on visual evaluation, best colour concentrate and best thickener was
optimized.
• Colour fastness of printed samples: The final printed samples were subjected to colour fastness tests.
The tests conducted were.
(a) Colour fastness to Light: Test method IS: 686-1957.
(b) Colour fastness to Washing: Test method 18:3361-1979 (ISO-2).
(d) Colour fastness to Crocking: Test method IS: 971-1956
(c) Colour fastness to Perspiration: Test method IS: 766-1956.
RESULTS & DISCUSSION
• Printing of silk samples: Silk samples of size 6x6 cm were printed with printing paste prepared by gum
tragacanth and gum acacia thickeners using different dye concentrations and samples were evaluated by
judges for three attributes i.e. depth of shade, clarity of design and overall appearance. The results are
reported in Table 1.
Ibble 1: Selection of thickeners and optimization of dye concentrate
i i
d Z srenekcihT
used noitartne
cnoCof
eyd
etartnecnoC
(mi)
skraM
obtained
1 muG
Tragacanth243
2
6315
8502
i2
470
2 muG
Acacia*2086
6677
8**
783
12
656
* Selected Thickener
** Optimised concentration of dye
Results reveal that the samples printed with gum acacia were given the higher preferences by the judges ascompared to gum tragacanth, which scored 783 marks. Also it was found that clarity and sharpness of designedges was more in case of samples printed with gum acacia than the samples printed with gum tragacanththickeners hence gum acacia was selected for further study. Wliile comparing various concentrations of dyeconcentrate, it was observed that maximum score was given to the sample printed by 8 ml dye concentration:hence it was selected as optimum. Since the results of visual evaluation as well as the statistical analysis were
in favour of Gum Acacia, it was selected for the printing of final samples and was considered more suitable forprinting, of silk with natural dye extracted from Coclium variegattim leaves.
249

Results for the optimization of mordants concentration : Samples were printed with printing paste
using three mordants (alum, copper sulphate and ferrous sulphate) in three concentrations i.e. 5%, 10% and
15% for alum and 1, 2 and 3% for both copper sulphate and ferrous sulphate separately. Each samplewere visually evaluated and given marks, which are recorded and reported in Table 2.
Table 2: Visual evaluation score for different concentrations of mordants
SI. No. Mordants Concentration of mordant Marks obtained
1 Alum 5% 543
10%* 607**
15% 557
2 Copper sulphate 1%* 780**
2% 699
3% 612
3 Ferrous Sulphate 1%* 696**
2% 666
3% 602
* Selected (optimized) concentration of mordant
** Maximum Marks
Table 2 clearly reveals that alum mordant showed best results with 10% concentration as it scored maximum
marks, while in case of copper sulphate and ferrous sulphate both, maximum score was given to the samples
printed with 1% mordant concentration. Hence 10% concentration for alum and 1% concentration for
copper sulphate and ferrous sulphate were selected as optimum. While comparing various attributes of the
printed samples using three mordants, the best results were obtained with the copper sulphate mordant.
Colourfastness of printed samples: Samples printed with optimized concentration of dye and mordants
using selected thickeners were subjected to colourfastness test and the results are reported in Table 3a and
3b. Data in these tables reveals that samples mordanted with alum and copper sulphate mordants showed
good (5) light fastness whereas samples mordanted with ferrous sulphate mordants showed very good (6)
light fastness. The rating for washing fastness was given on the basis of change in colour as well as staining
on adjacent test fabrics i.e. silk and cotton. It was observed that copper sulphate and ferrous sulphate
mordanted samples showed slight (4) change in colour. The staining on silk test sample was found to range
between slight to negligible (4/5) whereas for cotton test sample it was slight (4) change.
While comparing perspiration fastness it was observed that all the mordanted samples showed good results
for alkaline perspiration solution than acidic perspiration solution. In case of crocking fastness, the results of
dry crocking were found to be good as compared to wet crocking. Also the staining on adjacent test samples
(silk and cotton) was minimum in dry crocking as compared to wet crocking in all the mordanted samples.
Recipe developed for printing of silk: On the basis of results obtained, the final recipe for printing of silk
with Codium variegatum leaves was optimized which is as follows:
Final recipe for printing of silk (3gm)
Dye concentrate 8 ml
Gum Acacia 5 gram
250

Mordant Concentration
Alum 10%
CuSOj 1%
FesOj 1%
• Developed products : Various apparel and furnishings were prepared using the optimized printing recipe.
CONCLUSION
In order to satisfy the demand of green minded consumers, the present study was planned, to be look out for
safer alternative for printing with natural dyes. Croton Leaves was found to be a good source of natural dye forprinting of silk. The use of various mordants with acacia thickener produced various shades of pink colour.
Since the natural dyed and printed products have much demand in the international market, further research
can be done on printing of silk with other sources of natural dyes in combination with the natural thickeners.
RECOMMENDATIONS
Since international market is focusing towards the use of eco friendly products, the recipe developed in present
study for printing of silk can be commercialised. Further much emphasis should be given to explore othersources of natural dyes and thickeners for preparation of other eco-friendly textiles in order to have an edge inthe competitive global market.
REFERENCES
1. Clarke W, An introdudion of textile printing, Butlerworth and Co. Ltd. London, 4"' Ed, 1974, pp. 278.
2. Jaiswal G, Direct and resist priming ofsilk using natural dyes. Unpublished M.Sc Dissertation, GB.P.U.A. &T, Pantnagar, 2002,pp. 106.
3. Mittal R M and Trivedi S S, Thickeners in textile printing, Coiourage, 28 (22) (1981), pp. 48.
4. Prayag R S, Technology of textile printing, L R Prayag Company, Dharwad, 1997, pp. 237.
5. Ramanathan A, Magic of silk. Indian Silk, 36 (4) (1997), pp. 6-7.
251

TSDCFS/OraI/3
Sustainable Traditional Preparatory Processes- New Hopes for Social, Ecological and HygieneConcerns
Manju Hundekar' & Ela Dedhia-
1. Principal, School of Fashion Technology, MKSSS, Karvenagar, Pune (Maharashtra)
2. Assoc. Professor. Dept. of Textiles & Fashion Technology.
College of Home Science, Nirmala Nikelan, Mumbai (Maharashtra)
elainanojdedhia@yahoo,com (09619495951)
ABSTRACT
Ajrakh, a dying art which boasts of a very old block printing tradition and immense potential
to reduce environmental and economical hazards, has been the focus of this study. The data
collected through primary sources- (personal interviews of eight ajrakh artisans from
Dhamadka and AJrakhpur) and secondary sources such as visits to museums and libraries
unfolded interesting information about the traditional craft including the traditional printing
methods that uses environment friendly ingredients such as, camel dung, processing with
castor oil, treatment of myrobolan, steaming of the fabric and bleaching with sunlight, use of
gum, jowar and rice flour, which now-a-day's nobody is using due to many reasons. The
craftsmen, those having the skills but diversified themselves were selected and were educated
to experiment the documented traditional recipes. The Sindh recipe with slight variation was
found to give in the very good to excellent, fastness properties ranging between 4 and 5 as
per the ISO standards, for washing fastness in staining, perspiration, light and dry-cleaning,
thus ensuring good quality of printing. Almost four dijferent origins, cotton, linen, silk and
wool of total twelve varieties were experimented for printing. The testing with ISO standards
confirmed the suitability of these fabric varieties for Ajrakh printing. Many preparatory
processes used were found supporting to energy conservation and production of environment
friendly fabrics with acceptable quality. The hand spun cotton treated using documented
preparatory process with slight variations, when tested for bacteria and fungus resulted in
% reduction= Nil.
INTRODUCTION
Ajrakh a unique resist and mordant printing technique is practiced at Anjar and Dhamadka in Kutch area of
Gujarat. The printed Ajrakh cloth has blue, red, black and white colours, in several geometrical grid patterns,
resembling those found at Fostat (Refer Plate 1).
1BPlate No. 1 : The sample of original Sindhi Bepasi (printed on both the sides) Ajrakh. two pieces joined
together with Machchi Kata. The sample is dyed with Indigo, printed with madder and iron rust.
252

Teli Ajrak is the most traditional form of all the different varieties of Ajrakh, and is justifiably famous for its
unique and magical properties. When worn, used and washed ffequendy, the colours instead of fading become
more brilliant and luminous; in fact the fabric eventually gives way, but the colours remain fresh.
Ajrakh involves almost fifteen to seventeen tedious as well as skillful processes, which holds the prime importance
in achieving the desired results.
Today there are very few Ajrakh printers who are into their occupation. They use tradidonal Ajrakh designs on
lungies, safa, shawls home furnishings, salwar-kameez and dupattas etc., a limited product range. Also same
blocks are used in home furnishings and apparel products with slight variations. None of these printers use the
traditional age old method of Ajrakh production as they find it very laborious and not cost effective.
The only way to get a holistic idea of this occupation and art was through a series of interviews with the
practitioners of this art. Thus, four of the leading Ajrakh producers of Dhamadka and Ajrakhpur were interviewed
through a series of meetings exploring a range of areas. To revive Dhamadka Ajrakh, it was very essential to re-
enlist artisans who had moved away from Ajrakh making, particularly using natural dyes and the age-old process.
AIMS & OBJECTIVES
1. To document current and age old recipes and practices of Ajrakh making.
2. To identify artisans who had moved away from this art and to bring them back to this profession.
3. To evaluate fabrics printed through traditional recipes for sustainability.
MATERIALS & METHODS
To revive Dhamadka Ajrakh, the traditional Ajrakh makers were canvassed. In doing this, the primary focus was
on those who had moved away from Ajrakh only in the recent past. Of all the artisans interviewed two were
selected on the basis of their interview, interest, and young age.
The two selected artisans were first encouraged to re-leam and practice their traditional craft. To do this, they
were first introduced to the Dhamadka Ajrakh process documented by Lotika Varadrajan, and also to the
process documented by Bilgrami with slight modifications.
The Ajrakh making process involved (Refer Plate 2):
1. Preparatory washing of the gray fabric using beating method
2. Kumbh (application of steam to the washed gray fabic in a coil form)
3. Saaj (treatment with soda, castor oil and camel dung)
4. Sealing of the saaj treated fabric in a sack cloth and keeping it in a closed room
5. Washing and beating of the fabric
6. Application of natural mordant - myrobolan
7. Resist printing, de-gumming and dyeing (the resist substances used are guch which is mud resist andkariyana which is a mixture of the gum from babul tree and chuna or lime.)
8. Dyeing with natural indigo and alizarine
9. Repetitive treatment with cow dung, washing, and sun drying
To find out the sustainability of the traditional process, the products from these exercises were then tested forcolori'astness as per by ASTM and ISO standards for sunlight and washing to ensure that the product development
was going in the right direction.
253

1)
3)
5)
Fabric after sodakhar, saj and Kasai process 2) Fabric mth kiryanu process |
Kut printing 4) Kharah printing
Dyeing with indigo and alizarine 6) Dyeing with indigo and alizarine
Plate No. 2: Samples of stages of Ajrakh making of Sindh
RESULTS & DISCUSSIONS
Information collected through interview schedule of khandani Ajrakh artisans revealed the following: Thelargest market for Ajrakh material is local, but the economic conditions of this population precludes from creating
really intricate Ajrakhs thereby perpetuating the vicious cycle of low quality because of the lack of market, and
the inability of the market to grow because of the poor product quality.
Ajrakh has also shown promise for export, based on the appreciation of the tradition of Ajrakh printing by the
Canadian who value the vegetal aspect of colouration, and its eco-friendliness.
Table I gives the clear idea about the differences between the results in terms of quality parameters obtained
from the printed fabrics with slightly modified method documented at Sindh and traditional method documented
at Dhamadka.
The results shows that the process documented at Sindh gave better results mainly for cross staining on otherfabrics, that is, acetate, cotton, nylon and wool in comparison with the results of the process documented atDhamadka. Besides, the printing quality in terms of brightness of the colour was also found better in the Sindhprocess
Tests revealed that the Ajrakh produced using the process documented Biligrami was aesthetically superior to
the one documented by Lotika Varadrajan, and it was decided to use this process with some changes because of
the unavailability of few materials mentioned by her.
Experiments for Ajrakh printing carried out on, cotton (handspun cotton, cotton twill, knitted cotton, and voile),silk (tussah, georgette, gazi silk, satin silk, crepe silk), linen and on hand spun wool, confirmed the suitability ofthese fabric varieties for Ajrakh printing, for ISO standards.
The hand spun cotton treated with documented preparatory process with slight variations, was tested for bacteriaand fungus Staphylococcus aurus and Klesiella pneumoiae through the 'Antibacterial Quantitative Test' at CIRCOT,Matunga, Mumbai. The percentage of Bacteria and Fungus present in the fabric, re.sulted in - A=31 *10000, B=31 * 10000, R=% Reduction=Nil.
254

Table 1: Colour Fastness of fabrics printed by SMTRC processes
Sindh Dhamadka
Colour Fastness to Washine
ISO 105/ C06 AIM at 40 deg C 105/ C06 AIM at 40 deg C
Change in Shade 4 4
Cross staining on other
Acetate 5 4
Cotton 4 to 5 3 to 4
Nylon 4 to 5 3 to 4
Polyester 5 4 to 5
Acrylic 5 5
Wool 4 3
Colour Fastness to Light
ISO 105/B 02 105/B 02
Rating > 6 (Ibstcd up to grade 6) > 6 (Tested up to grade 6)
CONCLUSION
Nature serves human beings and is the source of our bare necessities. In present days the global trend is
towards saving nature. In the light of this awakening, the trend is changing, from manmade textiles to environment
friendly ones.
Ajrakh is a very old block printing tradition that uses all natural ingredients which has immense potential toreduce environmental and economical hazards. The use of steam, camel dung, castor oil, myrobolan, naturalgum, clay, sunlight, proves the strong ecological support against usage of chemicals and electrical power.
In this study the preparatory processes which produce sustainable printed fabrics with acceptable colorfastness
have been revived and the artisans have been encourage to follow their old profession. It is accepted that thiswould have a tremendous social impact also the additional benefit of antibacterial properties, adds to the hopes
for this craft with respect to the hygiene concerns.
RECOMMENDATIONS
1. Age old recipes and processes need to be experimented and tested again to identify their superior advantages
with and objective to commercialize them and ensuring that India does not loose out its rich tradition.
2. Motivation and encouragement is needed by individuals, institutions and the Govemment to bring back lost
artisans and thereby lost traditions which were environmentally and socially friendly.
REFERENCES
1. Askari N & Crill R, Cosliimes of the Indus - CosUimes and textiles ofPakistan, Merrell Holberton Publication, London. 1997.
2. Askari N & Crill R, Colours of the Indus. Costume and Textiles of Pakistan, New Age International Publication Ltd. New Delhi,Bangalore. Bombay, Calcutta. Guwahati, Hyderabad, Lucknow, Pune, London, 1997.
3. Barnes R. Fragments of .splendour ■ Indian resist-dyed te.xiile.s, P E Newberry Collection in the Ashmolean Museum, Ashmolean,No.22 (Spring/Summer), 1992, pp. 3.
4. Barendse R J, Trade and state in the Arabian Seas: A sunvyfrom the fifteenth to the eighteenth century. Journal of World History. 2(2) (2000), pp. 225.
5. Burnard J, Chintz and cotton - India's Gift to the world. Kangaroo Press, London, 1994.
6. Bilgrami M, Sindh jo Ajrakh, Orchid Press, Thailand. 1990
7. Chattopadhyay K. Handicrafts of India Indian councilfor cultural regions. New Delhi, 1975.8. Buhler A. Indian resist-dyed fabrics, in Handwovenfabrics of India, Mapin Publishing, Ahmedabad. Dhamija J and Jain J (editors).
1989.
9. Sarabhai G and Jayakar P. Journal of Indian Textile History. Volumes I to VII, Irwin J (editor). Calico Mu.seum of Textiles/SarabhaiFoundation. Ahmedabad. First Reprint. 1997
10. Mohanty B C et.al. Natural dyeing processes of India, Tlie Studies in Contemporary Textile Crafts of India Series, Calico Museumof Textiles. Ahmedabad. 1987.
11. Vardrajan L. Ajarkh, The New Order Book Company. Ahmedabad, 1993.
255

TSDCFS/Oral/4
Development of Spray Tank Cover for Farm Workers
Priya Makkar', Saroj S JeetSingh^, Neelam Pruthi'«S:NeelamMRose^1. Ph.D Student, Dept. of Clothing & Textiles, 1C College of Home Sciences,
Chaudhary Charan Singh Agricultural University, Hisar (Hariyana)
[email protected] (09416674111)
2. Professor. Dept. of Clothing & Textiles, I C College of Home Sciences,
Chaudhary Charan Singh Agricultural University. Hisar (Hariyana)
sarojsjsingh@gmail,com(094666I2666) , i ^3. Scientist, Dept. of Clothing & Textiles, IC College of Home Sciences,
Chaudhary Charan Singh Agricultural University, Hisar (Hariyana)
4. Assoc. Professor, Dept. of Clothing & Textiles, I C College of Home Sciences.
Chaudhary Charan Singh Agricultural University, Hisar (Hariyana)
ABSTRACT
In developing countries, the use of pesticides is one of the most relevant occupational hazards
for agricultural workers. An effort was made to design and construct the spray tank cover
with functional features for the farm workers who are involved in pesticide spraying through
this specially designed 'spray tank cover'. The pesticide residue was found to be much lower
when the sprayers sprayed with tank covers.
INTRODUCTION
About 1,00,000 years ago, the range of materials available for clothing was small as people used animal skins for
covering their body. However with the development of textile technology, greater varieties like cotton or natural
fibers like wool, flax, hemp are available for clothing purposes. Today the changing face of textiles can be seenfrom design to manufacture and will continue to evolve in the future. A new range of high-tech textiles, what
they call 'Intelligent Textiles', for specialized applications is fast becoming popular that possesses some unique
properties like flame resistance, chemical resistance, oil and dirt resistance, easy breathability and overall high
level of hygienic properties. One of the applications of such type of textiles is the manufacture of 'functional
textiles' for farm workers.
AIMS AND OBJECTIVES
Thus keeping in view the needs and problems faced by the farmers, present study was undertaken with the
following objectives.
1. To study the health problems faced by farm workers,
2. To develop spray tank cover for farm workers engaged in pesticide spraying.
MATERIALS & METHODS
To find out the problems faced by farm workers during pesticide spraying, 50 male farm workers were randomly
selected from various villages of Hisar district of Haryana state. Functional features as per their requirements
were incorporated in the cover. The design for the tank cover was developed and constructed for field trials.
The fabrics used for construction were selected to provide maximum protection and easy accessibility. Suitable
Patterns was developed to provide maximum comfort, protection and improve job efficiency.
For field trials, five male respondents who were actually involved in pesticide spraying were selected and their
suitability as well as acceptability was recorded on the developed performa. Residue assessment of pesticide onthe functional clothing was done by GLC to assess effectivity,
256

RESULTS & DISCUSSION
• Health problems faced by male farm workers : The findings of investigation revealed that among the
male farm workers were involved in spraying pesticides and 98% respondents when exposed to
'Hiblc 1; Health problems faced by male farm workers (N = 50)
Hcaltli Problem Activities
Seed treatment Fertilizer applicationIrrigation
WeedingPltna protection Harvesting
ThrashingCleaning
DryingiPikcng
StorageVegetable lPikcung
Skin irrilalion and itching 25
(50)
20
(40)
• 40
(80)
49
(98)
40
(80)
40
(80)
40
(80)
-25
(50)
25
(50)
5
(10)
Eye irritation and itching 5
(10)
- - -49
(98)
40
(80)
40
(80)
40
(80)
-- -
-
Running nose - - 25
(50)
-49
(98)
- -32
(64)
-10
(20)
--
Shortne.s.s of breath-
- - -32
(64)
10
(20)
-- - - - -
Chest pain -- -
- 29
(58)
--
- - - - -
Nausea- - - -
29
(58)
-- 10
(20)
- -10
(20)
-
Vomiting and diarrhea-
- - -29
(58)
-- 5
(10)
- - - -
Abdominal pain- - - -
29
(58)
-- -
- - - -
Headache 49
(98)
49
(98)
49
(98)
49
(98)
49
(98)
49
(98)
49
(98)
49
(98)
49
(98)
49
(98)
49
(98)
-
Sweating 49
(98)
49
(98)
49
(98)
49
(98)
49
(98)
49
(98)
49
(98)
49
(98)
49
(98)
49
(98)
49
(98)
-
Figures in parenthesis represent percentages
Multiple responses
pesticide/insecticide complained of skin irritation and itching, eye irritation and itching and running nose. They
also complained of headache and sweating during pesticide spraying. Strong chemical formulation of the pesticide/insecticide was the main cause of these problems.
All the respondents (100%) felt that face, head, neck, hand, feet, upper body and lower body needed protectionduring plant protection.
• Development of Spray Tank Cover : To protect the farm workers a cover for spray tank was developed.The developed tank cover has three layers : inner most layer made of polythene, middle layer from foam and
the outer layer was any strong fabric. The polythene sheet restricted the contact of pesticide with the body,
foam acted as a shock absorber and the outer layer provided strength to the cover.
Drafting of spray tank cover
Size of fabric
Centre panel (front and back) 23"xl7" (two pieces)
Side panel 23"x 9" (two pieces)
Base 26"x 9" (one piece)
257

Procedure
• Drafting of the cover pattern
a) Centre panel
Take a piece of fabric (23"x 17") and fold it widthwise. Mark its comers as A, B, C
and D. Mark point E on AB line, BE='/4". Join EC with a straight line
23"
_EB
center
Panel
D 8,5" C
Fig-1
b) Side panel
Take a piece of fabric (23"x 9") and fold it widthwise. Mark its comers as A, B, C
and D. Mark point E on AB line, BE=r'. Join EC with a straight line
EB
F
O
L
D
23" side
Panel
c) Base
Take a piece of fabric 26"x 9" and fold it first widthwise and then lengthwise.
Mark its comers as A, B, C and D. Mark point E on BC line such that BE=i^".
Join AE with a curve.
D 4.5" C
Fig 2
13"
D
Base
4.5"FOLD
Fig 3
Guidelines for cutting and stitching
a) All seam allowances are included. Cut centre panels, side panels and base as shown in the figures-1 to 3.
b) Position centre panels (front and back) with side panels and tack. Stitch a zipper 13" along the side panel
and front panel as shown in the diagram starting from the top edge. Leave an opening of 3" two inches
below the zipper. Finish the opening by tucking the edges.
c) Position base of the bag and stitch.
d) Turn and finish the top edges.
e) Prepare six strings. 10" each, position four of them and stitch on the top edges. Attach remaining twostrips on the top of zipper ends to secure the opening.
258

SPRAY TANK COVER
Pesticide residue assessment: Residue assessment of pesticide on the functional clothing was done by GLC and
the results are presented in Table 2.
Ibble 2: Residue of cypermethrin
Partofbody Residues in g/g
Back of kurta (without tank cover) 3.29
Back of kurta (with tank cover) 0.65
Due to over flowing of spray tank or leakage in the tank, pesticide solution on dripping at the back of the sprayer.
After GLC of kurta. it was found that the exposure of the body to the pesticide was reduced by 5 times in case
of sprayer who sprayed with tank cover on.
CONCLUSION
Therefore it is recommended that these spray tank covers be used by farm workers while spraying pesticide.
The developed spray tank cover was found to be highly suitable and acceptable by all the respondents. Furtherpesticide distributors should supply these covers along with the pesticides.
REFERENCES
1. Das K G, Pesticide analysis, Marcei Dekker Inc. New York, USA, 1981.
2. Calumpang and Medina, Applicator exposure to imidocloprid while spraying mangoes, Environmental Contamination and Toxicology,
New York, 1996.
259

TSDCFS/Oral/5
Fragrance Lingerie
Foram T Shah' & Pratima GoyaP
1. Merchandiser, Export Unit
[email protected] (09930543171)
2. Head, Dept. of Texiile.s & Fashion Technology,
College of Home Science, Nirmala Niketan, Mumbai (Maharashtra)
[email protected] (09892997098)
ABSTRACT
Micro-encapsulation is an innovation wherein active material is enveloped in a coating or
capsule which protects it from external environment like oxidation, heat, moisture and
evaporation and releases it in controlled and slow manner on mechanical agitation.
Fragrances, flavors, essential oils, vitamins, anti-microbial agents, deodorants and variety
of other substances are encapsulated in these microcapsules. Taking advantages of micro-
encapsulation technique, the researcher has designed and developed perfumed lingerie sets
using micro-encapsulated fragrances. Four popularly used micro-encapsulated fragrances
were applied on four popularly used fabrics for lingerie. Fastness tests for evaluating
retention properties were carried out. Results of fastness tests showed aroma retention evenafter 30 cycles of wash, rub and abrasion. Consumer survey was conducted to identify their
preference of fragrance, color and design for lingerie set. Peifumed lingerie set developed
based on the preferences of the consumers. Results of the survey showed acceptance of
perfumed lingerie by the consumers as it was a new concept and consumers are always in
search of innovative products.
INTRODUCTION
A 'consumer-oriented' 21" century challenges garment and fabric producer to come up with innovations whichresult from the technological advancements to not only help in strengthening the existing product line but also todiversify and flourish in new areas. Micro-encapsulation is one such innovation that resulted from advanced
technology. The fabrics used for the study were encapsulated with fragrance and developed into perfumedlingerie using micro-encapsulated fragrances. Since lingerie is a broad term, the present study is concentrated on
designing of brassieres and panties as it is the most widely worn women apparel.
AIMS & OBJECTIVES
1. To design and construct lingerie (brassieres and panties) with micro-encapsulated fragrance.2. To ascertain the retention properties of microencapsulated fragrances on different fabrics and product stage.
MATERIALS & METHODS
• Survey of retailers to ascertain the most preferred fabric, colors, styles in lingerie (brassieres and panties).
• Application of the 4 different microencapsulated fragrances(rose, lavender, strawberry and lime) on each ofthe 4 fabric different type of fabrics (woven cotton, knitted cotton, knitted cotton blend and knitted lace)..
This was done by soaking the fabric in the fragrance using acrylic binder followed by curing at 100°C -
150°C depending on the type of fabric used.
Testing
a) Wash fastness was carried out using mild soap solution and water at normal temperature.b) Other fastness tests like rub (dry), acid and alkaline perspiration and abrasion resistance test were carried
out on the treated samples to check the aroma retention.
260
- ..al

c) Subjective evaluation for all the four tests was done by 30 respondents using purposive sampling techniquebased on the exclusion criteria of those suffering from cold and cough.
• Construction
Consumer survey was carried out using 100 female respondents to ascertain their preferences with respectto fragrance, color and design of lingerie sets. Based on consumer survey results, lingerie sets were developedby two different procedures.
i) Perfumed Lingerie Set A Fabric : (a) Encapsulation of fabric with preferred ftagrance (b) Curing (c)Development of 3 Lingerie sets
ii) Perfumed Lingerie Set B Fabric : (a) Development of 3 Lingeiie sets (b) Encapsulation of fabric withpreferred fragrance (c) Curing Total six sets of Perfumed lingerie sets were developed.
• Comparison of their fragrance retention properties of both the wash fastness tested samples was carried outby the same set of 30 respondents as earlier.
• Consumer survey was carried out to study the preferences of perfumed lingerie with respect to acceptance,
marketability; price range was carried out (100 female respondents).
RESULTS & DISCUSSION
1. Survey results of the Retailers
• Lace was the most pi'efeired fabric by the consumers for lingerie followed by knitted cotton blend, knittedcotton and woven cotton.
• Semi-padded brassiere style was the most selling brassiere style followed by plain and fully padded.
• Low waist panty was the most selling panty style followed by Briefs and thongs.
• Other results are represented in the following graphs.
s- 6. i7%
No- 93.33%
□ Yes- 6.67%
□ No- 93.33%
00%-
n Yes
El No
Awareness of fragrance/ scented fabrics
Yes-100% No.0%
Perfumed Lingerie - New Concept
Lime gave best results with respect to Wash fastness, mb (Dry) fasmess, perspiration (acid and alkaline)fastness and abrasion tests in all the four fabrics followed by Rose, Strawberry and Lavender.
2. Results of consumer survey:• Majority (98%) of the respondents were not aware of fragrance/ scented fabric.• Rose was the most preferred fragrance by the consumers.• Slate Gray was the most preferred colour for the lingerie set (semi-padded brassiere with low waist panty).• Salmon Rose was the preferred colour for the lingerie set (plain brassiere with brief).• Lavender was the most prefeiTed color for the lingerie set- Padded Brassiere with Thongs.• Procedure- B which was done at product stage showed better fragrance retention properties as compared
to Procedure- A which was done at fabric stage.
3. Survey results of respondents:• Majority of the respondents both buyers and sellers showed 100% preference for perfumed lingerie sets
and ascertained that it will have good marketability in domestic as well as International market.
261

100%
60%
40%
20%
S Sample- A
O Sample- B
Siudenu Housewives Working Rctailcn Women
Preference for perfumed samples
All respondents affirmed that perfumed lingerie Set- B has more fragrance than perfumed lingerie
Set - A.
CONCLUSION
Majority of the consumers as well as retailers were unaware of fragrance fabrics- Since majority of respondents
had high buying capacity, they showed preference for buying perfume lingerie set if available in the market.
RECOMMENDATIONS
Different products like night wear, shirts, kurtis, and socks can also be developed using this technique.
REFERENCES
1. Jadhav D, Microencapsulatian in lextileprocessing, Textile Excellence, 5 (15) (228), pp. 33-36.
2. Ramachandran T, Ganesan P, Hariharan S, Thinimoorthy M, Application of functionalfinishesfor apparels. Man-Made Textiles in
India. 2008. pp. 62.
3. Nisar N, Application and evaluation of micro-encapsulated aromatic oil formulation on handkerchieffor relieving headache during
sinusitis and migraine, Unpublished M.Sc Dissertation. Nirmala Niketan College of Home Science, Mumbai, 2003.
4. Virdi M. Application and evaluation of microencapsulatedperfumes onfour textile fabrics. Unpublished M.Sc Dissertation. Nirmala
Niketan College of Home Science. Mumbai. 2000.
262

TSDCFS/Oral/7
Extraction of Dye from Peepal (Ficus religiosa) Bark and Leaves and its Application for DyeingCotton and Silk Fabrics
Inderpal Rai', Sabra Ureshi- & Sandeepa KumawaF1. Director, K N College for Women,
Jai Narain Vyas University, Jodhpur (Rajasthan)
[email protected] (09414145249)2. Project Assistant, Dept. of Home Science,
Jai Narain Vyas University, Jodhpur (Rajasthan)mgkq.sabr.i@gmaiLcom
3. Research Scholar, Dept. of Home Science,Jai Narain Vyas University, Jodhpur (Rajasthan)[email protected]
9
ABSTRACT
Dye is any substance, natural or synthetic used to color various materials, especially textiles,
leather and food. The dye is usually used from an aqueous solution and may require a
mordant to improve the fastness of the dye on the fibers. Natural dyes were of animal,
vegetable and mineral origin. The greatest source of dyes has been the plant kingdom,
notably roots, berries, bark, leaves and wood, but only a few have been used on a commercial
scale. This is because preparation and extraction of natural dyes entails intensive labor,
sustained supply of raw materials, and right technologies. These factors made synthetic
dyes the most convenient alternative.
In the present study peepal (Ficus religiosa) used as a natural dye source to dye cotton
and silk fabric. The chemicals used as mordants for the research work were harda, alum,
tannic acid and ferrous sulphate. Dye obtained from leaves and bark gave different shades
of brick red, pale cream, light brown and brownish red. Highest intensity of colour wasobserved when harda (myrobolan) was used a mordant whereas the lowest was in case of
alum. Acidic pH gave better results than alkaline OH. Other parameters like washing; rubbing
and sunlight fastness also gave excellent result. The natural antibacterial property of the
samples dyed with peepul bark and leaves also assessed
INTRODUCTION
Natural dyes are a class of colorants extracted from vegetative matter and animal residues, most of them are
mordant dyes as they require the inclusion of one or more metallic salts of aluminum, iron, chromium, copper
and others for ensuring reasonable fastness of the color to sunlight and washing. Natural dyes were extensively
used for the dyeing of all natural fibers until the middle of the nineteenth century. Natural dyeing industry canpromote indirect employment in cultivation of plants and herbal matters in waste lands which are widely spread
ail over India.
Ficus religiosa Linn (Peepal) is a large deciduous tree with few or no aerial roots with leaves bright green in
colour, the part used was leaves and bark. The bark is astringent, sweet, cooling and aphrodisiac, and itsaqueous extract has an antibacterial property against Staphylococcus aureus and Escherichia coll. Leaves andtender shoots have purgative properties and are also recommended for wounds and skin diseases.
AIMS & OBJECTIVES
The present study was designed in consideration with the following objectives:
1. To study the dyeing properties of peepal (Ficus religiosa) leaves and bark on cotton and silk fabrics.
263

2. To study the effect of mordant treatments on physical property of peepal leaves and bark dye.
3. To study the colour fastness and anti microbial properties of dye.
MATERIALS & METHODS
1. Materials Used :
a) Fabric: Plain weave 100% pure cotton and silk fabric was used.
b) Dye material: Peepul bark and leaves were collected from the peepal trees growing in the university
campus.
c) Mordants : harda (Terminalia chebula), alum (aluminum potassium sulphate) and tin (stannous chloride)
were used.
2. Experimental Method:
a) Preparatory process : a) degumming for silk, b) scouring for cotton to remove natural / added impurities.
b) Aqueous Extraction of the dye from peepal leaves and bark.
• The Cotton and silk fabric samples were treated with a mordant prior to dyeing. The samples were dyed
with 10-15% (owf) of the dye maintaining the temperature at 80°-90°C for 45 minutes. The pH of dyes
was maintained at 4-5 (accidie) 9-10 (alkline). After the dyeing process the samples were allowed to
cool in the dye bath for 10 - 15 minutes. This was followed by washing under tap water and drying in
shade. Dyeing on an un-mordanted cotton fabric also performed to get the control sample.
3. Testing :
a) Colour fastness of the samples was assessed using the ISO standards.
b) L* a* b* values were obtained using a spectrophotometer.
c) Antimicrobial properties of samples were assessed.
RESULTS & DISCUSSION
The different color shades obtained on dyeing cotton with peepul leaves and peepul bark using different mordants
is tabulated in Table 1.
Table 2 (a-b) & Table 3 (a-b) indicate that the samples mordanted with 5% harda. alum and stannous chloride
showed good to excellent colour fastness. All silk and cotton fabrics samples showed excellent fastness to
perspiration in also cases except in alkaline medium where 5% harda showed slight staining on adjacent fabric,
samples dyed with Peepal leaves and bark showed excellent to outstanding fastness to sunlight.
Table 1: Colour shades obtained with dilTcrcnt mordants
SI. No, Mordants Cotton & Silk dyed shade of Ficus rcllgiosa (peepul)
Pre-mordanting
. .....
Peepal leaves Peepal bark Peepal leaves | Peepal bark
l-Iarda
Alum
.Stannous Chloride
Acidic (pH4-5) Alkaline (pH9-ll»
1.
2.
3.
Pale Cream
Light Brown
Brick red
Rose pink
New Mushroom
Brunt sund stone
Brownish red
Jaipuri pink
ValcanoGolden yellow Candy Light cream
264

IbbIc 2(a): Assessment of colour fastness properties (peepal leaves) extract (pH 4-5)
Mordant
Cone, of Washing Rubbing Fastness Perspiration Fastness LightMordant Fastness Dry Wet Acidic Alkaline Fastness
on_e
s
CC CS CC CS CC CS CC CS CC CS
Harda on Cotton 5% 5 5 4 5 5 5 5 5 5 5 5<3
*2o
sHarda on Silk 5% 4 4.5 4 5 4 4.5 5 5 4 4.5 5
2CL.
Alum on Cotton 5% 5 5 5 5 5 5 5 4.5 5 5 5
Alum on Silk 5% 5 5 5 4 5 3 5 5 5 5 6
Stannous Chloride
on Cotton 5% 5 5 5 5 5 5 5 5 5 5 CI
Stannous Chloride
on Silk 5% 5 5 5 5 5 4.5 5 5 5 5 6
CC • Colour Change, CS - Colour Staining, CI - Colour Increase, IH - Increase Hue
Ibble 2(b): Assessment of colour fastness properties (peepal bark) extract (pH 4-5)
gnitnadrom-erP
Mordant Cone, fo
MordantWashing
Fastness
Rubbing FastnessPerspiration Fastness Light
Fastness DryWetAcidicAlkaline
CCCS
CCCS
CCCS
CCCS
CCCS
4.5Harda on
Cotton5%44.54 4.544.554.544.5
Harda on
Silk5%44.54.55455454.54
Alum on
Cotton5%44 54 5555555
Alum on
Silk5%54.5544.554.55455
Stannous Chloride
on Cotton5%55555454.5555
Stannous Chloride
on Silk5%5545455554.55
CC - Colour Change, CS - Colour Staining, CI - Colour Increase, IH - Increase Hue
Ibble 3(a): Assessment of colour fastness properties (peepal leaves) extract (pH 9-10)
Mordant
Cone, of Washing Rubbing Fastness Perspiration Fastness LightMordant Fastness Dry Wet Acidic Alkaline Fastness
eue
c
CC CS CC CS CC CS CC CS CC CS
Harda on Cotton 5% 5 5 5 5 5 5 5 5 5 5 6n
■2o
E
2a.
Harda on Silk 5% 5 5 4.5 5 5 4.5 5 5 5 5 5
Alum on Cotton 5% 5 5 5 5 5 5 5 5 5 5 6
Alum on Silk 5% 5 5 5 5 5 5 5 5 5 5 CI
Stannom Chloride
on Cotton 5% 5 5 5 5 5 4 5 5 5 5
Stannous Chloride
on Silk 5% 5 5 5 5 5 5 5 5 5 5 CI
CC - Colour Change, CS - Colour Staining, CI - Colour Increase, IH - Increase Hue
265

Table 3 (b): Assessment of colour fastness properties (pecpal bark) extract (pH 9-10)
1 !
i
I
hi >■ '.i
Cone, of Washing Rubbing Fastness Perspiration Fastness Light
MordantMordant Fastness Dry Wet Acidic Aikaline Fastness
CC CS CC CS CC CS CC CS CC CS
u Harda on Cotton 5% 5 4 5 4 4 4 4 4 5 5 5
sre
■gHarda on Silk 5% 4 5 5 4 4 5 4.5 5 4 5 5
o
£ Alum on Cotton 5% 4.5 5 4 4.5 5 4 4.5 5 4 5 CI
£Cu Alum on Silk 5% 4 4 4 5 4 5 4.5 5 4 4.5 5
Stannous Chloride
on Cotton 5% 5 5 5 4 5 3.5 4 5 4 4,5 CI
Stannous Chloride
on Silk 5% 4 5 4 5 4 5 4 5 5 4 6
CC - Colour Change, CS - Colour Staining, CI - Colour Increase, IH - Increase Hue
Table 4: Effect of mordants on colour characteristics of dyed
Mordant Control Sample L* a* b*
Cotton 68.445 4.477 10.316
Silk 79.585 1.767 11.279
5% Alum pH 4 Cotton 59.478 17.031 10.977
5% Alum pH 9 Cotton 70.242 13.277 8.446
5% Harda pH 4 Silk 38.328 25.962 13.790
5% SnC12 pH 4 Silk 45.139 27.325 22.921
5% SnC12 pH 9 Silk 62.391 20.600 13.790
5% Harda pH 9 Silk 63.044 12.544 15.360
Table 4 shows the colour characteristics of the Ficus religiosa natural bark dyed samples with and withoutmordants. The dyed samples do not show any significant variation in tone on mordanting as is evident from thevalues of colour coordinates. Here, L* represents lightness / darkness; a*, the green value; and b*, the yellow/ blue value. The L* a* b* values of only selected natural dyes which have good fastness properties arementioned in the Table. 5% Alum at pH 9 on cotton has the highest L* value (i.e. 70.242), there by indicatingthat the corresponding cotton sample is the lightest while the 5% Alum at pH 4 on cotton has the lowest L*value (i.e. 59.478), it indicating that the corresponding 5% Alum pH 9 cotton sample is the darker one. Controlsilk sample has the highest L* value (i.e. 79.585), indicating that, 5% Harda at pH 9 on silk sample is the lightestand the 5% Harda at pH 4 on silk has the lowest L* value (i.e. 38.328), This indicates that the control silksample is the darker one.
Table S: Antl tnlcroblal properties of the samples dyed withJicus religiosa (pccpul) leaves and barkextract
Parameters Unit Undyed
cotton
sample
Undyed silk
sample
Pecpal leaves dyed cotton sample
Mordant Harda Mordant
Alum
Mordant
SnC12
(pH9) (pH 4) (pH 9) (pH9) (pH4)
TBC pergm 2750 3000 1430 1800 2290 1500 1570
Yeast & Moulds pergm 90 120 90 70 100 60 80
Coliform MPN per gm <3 <3 <3 <3 <3 <3 <3
E- Coli pergm Absent Absent Absent Absent Absent Absent Absent
Salmonella pergm Absent Absent Absent Absent Absent Absent Absent
Staphylocous
Aureus pergm Absent Ab.sent Absent Absent Absent Ab.sent Absent
TBC= Total bacterial count
266

It can be observed from table 5 that undyed silk and cotton fabric have TBC per gm of 3000 & 2750 respectively.
TBC in case of cotton fabric dried with peepal bark was 1500 while for silk it was 1570. The same values for
cotton dyed with peepal leaves was 1430 and in that for silklSOO. Similarly yeast & mould per gm in dyedcotton fabric with peepal leaves was found to be 90.
CONCLUSION
From the result of the present studies, it may be concluded that:
1. All cotton and silk fabrics dyed with peepal leaves and bark and pre-mordanted with 5% concentration
showed good to excellent results for washing and rubbing fastness.
3. All the samples showed good to excellent colour fastness to both alkaline and acidic perspiration.4. All the samples showed fair to good colour fastness to sunlight. But samples pre-mordanted with alum and
stannous chloride showed change in colour tone.
5. Peepul bark and leaves dyed samples exhibited antibacterial property and hence such fabric would bebeneficial for persons suffering from skin allergies.
RECOMMENDATION
REFERENCES
1. Macfoy L. et.al. Laboratory inyesiigaiioii of selected natural dye-yielding plant species, Colourage, 2003.
2. Purohit S S and Das N P. Handbook ofmedicinal plants - Complete source book, Agrobios Publicadons, India, 2003.
3. Kumar S R, et.al. Dyeing of cotton fabric with flowers of helichrysum bracteatum dye, Colourage, 2003.
4. Sood A. Dyeing of cotton fabric with bougainviilea, Asian Textile Journal XLVIII (2000).
5. Samy P V Raja, Ecodyeing of cotton and silk with areca nut extract: A study; Man Made Textiles in India, 1998, pp. 41/3.
6. Sckar N, Application ofnatural colorants to textiles - Principles and limitations, Colorage XLVI (7) (1999) pp. 33-34.
7. Devi S A, Sumnathy Surekha B and Katyayini, V K LT, Book of papers. Convention Proceeding on Natural dyes, IIT Delhi, 2001.
8. Devi S A, et al, Annalo - A bright natural colourfor silk, Indian Silk, April, 2001.
267

TSDCFS/Oral/9
Designing Middy Tops •witti Wearable Electronics
S Jayapriya' & S Amsamani^
1. Lecturer & Head, Costume Design and Fashion, Kongunadu Arts and
Science College, Coimbatore (Tamilnadu)
2. Reader, Dept. of Textiles & Clothing, Avinashilingam Women's University,
Coimbatore (Tamilnadu)
ABSTRACT
Clothing is one of the most important basic needs of mankind. In several instances technology
has made available to the consumer a variety of additional products as also new attributes
in apparels as well as technical textiles. Wearable electronics are defined as electronics
worn on or attached to the human body to add functionality without coming in the way of
day-to-day activities. In this present study a safe electronic device to measure Blood Pressure
of individuals was designed and given to ten doctors for evaluating the effectiveness of
these wearable electronics in sensing blood pressure. Also middy tops were designed such
that the designed wearable electronic component could be fixed. The study proved that clothing
which has been just an aspect ofprotection and modesty has surely changed into a challenging
element of medical textiles. The embedded blood pressure component in the middy tops were
comfortable and also show correct readings.
INTRODUCTION
The modem era is a period of educated consumer who demands products exactly matching his individual
requirements. The use of textiles for clothing known to mankind from primitive age was gradually extended tohousehold and domestic applications.
Wearable electronics products propose to use clothing as the platform for a range of communications. They areused to monitor the physiological functions like blood pressure and temperature of the wearer. Smart textiles arethe foundation of new 2V' century. Bio textiles ore-textiles uncover an enormous potential for the market of the
"Second Skin".
• Need for Clothing: Clothes symbolizes a person's attitudes, values, interest and taste. Clothes easily showthe personal characteristics of a man. They also fulfill important psychological needs of conformity and self-confidence. Awareness of one's physical attributes and drawbacks as also awareness of ones personality isthe essence of acquiring good clothing sense. From the very early days till the development of modem world,man discovered that one of the most effective ways of establishing status and social standing was to dresswithin society in accordance with age, function and position.
• Smart Clothing: "Smart textiles" make use of integrated or applied electronics (e.g. sensors) whereas "intelligent
textiles" produce predictable effects by interacting with the environment and wearer.
• Wearable Electronics: Wearable electronics are defined as electronics worn or attached to the human body
to add functionality without coming in the way of day-to-day activities. It is a conventional hard electronic
components simply attached to the textile with little or no true integration. New "electronic textiles" could
help monitor the activities of patients with chronic illnesses. It is possible to construct knitted fabric sensors
that increase or decrease resistance when stretched. The term 'wearable electronics' refers to the reliable,
robust implementation of microelectronic circuits into innovative textiles or garments in a way that is suitable
for everyday use.
268

• Various Applications of Wearable Electronics; There are sensors to sense environmental conditions andstimuli, which offer both sensing and signal transmission function.TheseaiephmahVi usedto tiveasuie strain,
temperature, displacement, pressure, electric currents and magnetic field. A smart slurt, uses optical fibers todetect bullet wounds and has special sensors and interconnects to monitor the body's vital signs during
combat conditions. There are a number of other exciting new products in the marA-et like, a smart Aercbiefwith a solid micro-controller that senses the touch along the fabric, and a child's T-shirt with a built-in globalpositioning satellite system that allows parents to track the child s whereabouts.
AIMS & OBJECTIVES
The objectives of the study are as follows:1. To integrate variety of sensory parameters in clothing, for biological phenomenon such as blood pressure.2. To study the performance of the designed blood pressure monitor in the selected middy tops.3. To evaluate the of performance wearable electronics embedded middy tops.
MATERIALS & METHODS
• How Sensors Work: Sensors are tiny electronic devices that can both detect and generate electrical signalsfrom the movement and position of any given object, including the motion of the human body. These signalsare then transmitted wirelessly to a microconlfoller and analyzed using specially designed algonthms.
• Design of Wearable Electronics: A battery is connected to analog to digital voltage converter. Tiie di^itdl dcitHis transformed to control unit. The control unit lies in the keys which is source of input. The control unit is in
turn connected to LCD driver and to LCD. The battery is connected to a motor which in turn is connected tocuff and pressure sensor. The pressure sensor transfers through analog voltage to analog to digital voltageconverter. Following the above design structure a wearable electronics for sensing blood pressure wasdeigned. It was decided to embed, wearable blood pressure monitor in the middy tops.
• Measurement of Blood Pressure using Wearable Blood Pressure Monitor: The wearable electronics is designedaccurately so that its working is effective. The start button is pressed and the hand is kept parallel to theheart. After one minute the systolic pressure and diastolic pressure is indicated. The pulse pressure is alsomonitored by this. Variations in numerous factors include heart rate, stroke volume, the elasticity and diameter
of the arterial ves.sels, sympathetic nervous system and chemical mediators can influence Blood Pressure. Inan adult the pressure during systole is 120 mmHg and during diastole is 80 mmHg. Raised blood pressure isknown as hypertension. Lowered blood pressure is known as hypotension. These variations in blood pressurecan be detected for an individual.
• Evaluation of Designed Wearable Blood Pressure Monitor: The designed wearable electronics were given toten doctors for evaluating the working of wearable electronics for sensing blood pressure
• Selection of Age Group (Samples) and Garment: Adult women 30-40 years who were suffering from raisedand lowered blood pressure were selected. Middy tops was selected for garment designing.
• Construction of Selected Middy Tops Designs: The middy tops were designed in such a manner that thedesigned wearable electronic component could be fixed at the hem line of the sleeve. Therefore each of thedesigned middy tops had to have a lining in the sleeve which could hold the blood pressure measuring wearableelectronics. An outer sleeve was to hide the inner sleeve. The tops were constructed using various fabrics.
• Data Collection : The three constructed middy tops were given to ten women who had variation of raised andlowered blood pressure. They were requested to wear the middy top for ten days from 10 A.M. to 5 P.M.Apart from this, the middy tops were also given to ten women with normal blood pressure. They were alsoasked to wear the middy tops for a day from 10 A.M. to 5 P.M. The samples were requested to check theirblood pressure at regular intervals or when they felt a need. In case they experienced discomfort during
269

wear, they were free to remove the garment. A proforma was given after every wear to evaluate the fitting,aesthetic appeal, transport of air and moisture, comfort properties of the middy tops.
RESULTS & DISCUSSIONS
The working of wearable blood pressure monitor was rated 'good' by the doctors. It was found that the wearableelectronics could be embedded for the selected middy top designs easily.
Table 1: Fit of constructed middy tops
Middy Ease Grain Comfort
top Proper
fit
Loo.se
fit
Tight
fit
Straight
grain
Cross
grain
Bias
grain
Comfor
table
Fairy
comfortable
Not
comfortable
A 96 4 0 100 0 0 100 0 0
B 95 5 0 100 0 0 100 0 0
C 90 10 0 100 0 0 100 0 0
The Table I show that the constructed middy tops excelled is comfort, straight grain, proper fit as reted by more
than 90 per cent of judges. The aesthetic appeal, transport of air and moisture was rated good by 100 per cent
of the samples. The general appearance and fitting was evaluated to be good. The women did not express any
discomfort, such as irritation and heaviness.
CONCLUSION
The result of this study has proved that clothing which has been just an aspect of protection and modesty has
surely changed into a challenging element of medicine. In the hierarchy of human needs, clothing ranks second
top most priority next to food. A new range of truly wearable electronics with textile characteristics can bewithin reach by integrating intelligent electronics and innovative textile structures. Innovative products might be
developed with the ability to sense respond, and adjust to different types of external stimuli.
Most of the textile experts are expecting electronic clothing to become a part of day to day activities.
RECOMMENDATIONS
Various other sensory parameters in clothing, for biological phenomenon such as body temperature can be
studied.
The performance of the designed blood pressure monitor can be embedded in other garments including shirt andjackets.
REFERENCES
1. Tortora P G. Textiles, Macmillan Publications, London. 1982, pp. 48.
2. Nakamura A, Fiber science and technology, Oxford and IBH Publishing House, New Delhi, 2000, pp. 20.
3. Holt J M, Fabrics and clothing. Bell, G and Sons Ltd., London, 1960, pp. 33
270

TSDCFS/Oral/12
Enzymatic Singeing of Jute Cotton Fabrics
R Uma Maheswari' & S. Amsamani-
1. Lecturer, Kongunadu Arts and Science College, Coimbalore (Tamilnadu)
[email protected], [email protected]
(09047752315 / 09952514131)
2. Reader, Avinashilingam University for women, Coimbatore (Tamilnadu)
ABSTRACT
Textile processing is a growing industry that traditionally uses a lot of water, energy and chemicalsstarting from pesticides for growing cotton to high quantity of waters that results in waste being
discharged into streams leading to hazards. Today a number of chemical based processes are inuse in the textile industry and a majority of them have drawbacks from economic and environmental
point of view. Virtually all these drawbacks can be eliminated by using enzymes. Further the use of
enzymes results in reduced process time, energy and water. The small fibres or fibrils protrudingfrom the fabric render a fuzzy surface and the gradual entanglement of fibrils results in the formation
of pills. This paper discuss about the application of cellulase enzyme in order to remove the shortfibres from jute cotton fabrics and a comparison between commercial enzyme application and
synthesized enzyme application,
INTRODUCTION
With growing population and rapid industrialization people have well understood the importance of ecology. Thusthe concept of eco-friendly and re-cycle able products are fully recognized which has brought natural fibers into
the picture. Cotton well known for its comfort properties is cultivated to limit extends as compared to its demand.Natural fibers which are known for their biodegrade ability are much in demand; one such fiber is Jute. Jute is
a versatile, eco-friendly, recyclable and economical fiber. Jute is often blended with other fibers like cotton
(called JUCO), that is ideal for clothing, accessories and home furnishing. The awareness of environmentalimpacts of chemical processing of textiles combined with strict legislation on industrial effluents and consumer
interest to use eco-friendly products has led to the advanced, non-polluting chemical process for textile fibrousmaterial. Enzyme treatment is considered as the good alternative to harsh chemicals. Enzymes are the nature'scatalyst and logical tools for development of new biotechnology based solutions for wet processing.
AIMS & OBJECTIVES
Based on the present need a study was made with the following objectives:1. Obtain suitable blending composition of jute cotton yams,2. Convert the yam into suitable fabric through weaving.3, Extract the enzymes from suitable microbial source for singeing.4, Subjecting the woven fabric to suitable processing namely singeing,
MATERIALS & METHODS
• Powerloom woven plain weave Jute-cotton (JUCO) fabrics with 50:50 compostion and 116 ends/inch and 30picks/inch.
• Processing of jute cotton fabric: Grey fabric from loom requires preparatory process to convert it into themarketable product. The conventional methods of wet processing of cotton led to the growth in the case ofenzymes preparatory process infer Gupta et al (2005).
• Extracted enzyme bio-polishing: Cellulase is the enzymes used to modify surface properties of cellulosicfabrics. Fungi are the main cellular producing micro organism infers Shukla et.al (2005).
271

• Selection of source for cellular production and extraction : Aspergillus's flavus strain a fungal source for
cellulose enzyme was selected and got from the from the P.G students of Bio textiles. Department of textiles
and clothing, Avinashilingam University for woman, Coimbatore and used for the study
• Selection of media, preparation, inoculation and extraction of enzyme: Wheat bran holds the key and is the
most commonly used in various processes remark Pandey et.al (1999). Wheat bran was prepared and
inoculated with the fungi Aspergillus's flavus. After five days the enzyme extraction was done using simplecontact method.
• Determination of optimum Enzyme concentration: Optimum pH and temperature for application of cellulose
enzyme was found to be 5.5 and 55°C respectively as described by Amsamani and Amsaveni (2008). The
concentrations of enzymes were varied from 2, 4, 6, 8 and 10 ml with M: L ratio as 1: 8 one gram of Jute
cotton fabric incubated for 24hrs. After 24 hours the samples were washed. The sample with maximum
reduction in hairiness and minimum loss in weight was taken as optimum enzyme concentration.
• Actual bio-polishing: From the optimized concentration for cellulose enzyme treatment Jute cotton fabric was
treated with cellulose enzyme and material liquor ratio of 1:8 with pH 5.5 and temp of 55°C was incubated for24 hours. After 24 hours the temperature was raised to 90''C to stop the enzyme activity. Then the fabrics
were washed in cold water.
RESULTS & DISCUSSION
• Visual Evaluation: The visual evaluation proved that the enzyme treatment ofjute cotton (50:50) fabric weregood in general appearance, smooth in textile and medium to bright in colour.
• Thickness: When compared to the original, the increase in thickness was found to be minimum in case of
extracted enzyme treated and commercial enzyme treated jute-cotton (50:50) samples.
• Weight: Extracted enzyme treated 50:50jute cotton sample samples show minimum increase in weight when
compared to the commercial enzyme treated and original samples.
• Strength: When compared to the original sample the extracted enzyme treated and commercial enzyme
treated Jute cotton (50:50) samples showed minimum lose in strength.• Elongation: Elongation of all the extracted enzyme treated samples showed an increase along warp and weft
when compared to its original samples
• Stiffness (warp and weft): Maximum loss in stiffness along warp and weft was observed in all the extractedenzyme treated samples when compare to the original samples.
CONCLUSION
In the textile industry "Eco-friendly" is a buss word and this has led for safer technology in production of every
garment. Hence this study throws light on which was the usage of eco-friendly fabrics, eco-friendly processingand the results of the study proved potentiality of enzymes in production of green label products which wouldserve as a right solution to solve the environmental issues.
RECOMMENDATIONS
1. The study can be carried out by varying the composition of the blend of Jute cotton yams.2. After processing dyeing can be carried out using a natural source.
REFERENCES
1. Bardhan and Sarkar, Technical applications ofjute - An overview, Manmade Textiles in India, XLVI (4) (2003) pp. 125-127.
2. EJRI Board Consultants and Engineers. Technology of textiles and spinning, weaving, dyeing, scoring, drying, printing and bleaching.Engineers India, Research, Institute, Delhi, pp. 429.
3. Gupta S Garg and N Saini R, Textbook of clothing, textiles and laundry, Kalyanl Publishers, New Delhi, 2005, pp. 174.
4. Shukia S R, Anathanarayan Land Damle J A, Production and application of cellulose enzyme, Colouragc, 52 (2) (2005) pp. 41,44
5. Pandey A, Selvakumar P, Soccal C R and NIgtnam P, Solid state fermentation for production of indu.strial enzymes. Current Science.
77 (I) (1999) pp. 13.
272

TSDCFS/Oral/13
Economic Rehabilitation of Persons with Disabilities in the Garment Sector - Current Scenario
Manprcct Cliahal'. Secmu Sekhri- & Ritu Malhur'1. Lecturer & Head. Dept. of Fashion & Apparel Science, Lady Invin College (New Delhi)
[email protected] (09810598098)
2. Reader, Dept. of Fashion & Apparel Science. Lady Irvvin College (New Delhi)
3. Reader, Dept. f Fashion & Apparel Science. Lady Irwin College (New Delhi)
ABSTRACT
There is a general consensus the world over that employment is the most essential but the
toughest aspect of rehabilitation. True economic independence of the disabled person, realizing
their limitations in self and professional employment opportunities would mean exploring
the world of employment and taking up the challenge of innovation in the area of vocational
training, it requires preparing them for employment and convincmg the employers to extend
them suitable employment opportunities. There is a lot of scope for the private sector to stepin and create employment opportunities for disabled workers. The garment sector can playa significant role in providing gainful employment to the disabled. Some indeed are doing
this with a measure of modest success. However much needs to be done. Therefore, the
present study was planned in order to highlight the existing trends of vocational training
and employment for persons with disabilities (PWDs) in garment manufacturing process.
Three .separate semi-structured interview schedules were developed to obtain the requiredinformation fmm the personnel in charge in the Garment Manufacturing Units (GMUs), the
PWDs already employed in GMUs and fwni special educators and/or the heads of governmentand non government organizations involved in the vocational training of PWDs. Besides,the existing vocational training programmes for PWDs in garment manufacturing processwere studied and compared with the current job requirements. On the basis of analysis of theinformation gathered above and the suggested recommendations, new training modules would
be evolved which would make PWDs professionally more competent, thus engaging them inproductive employment in GMUs.
INTRODUCTION
Economic rehabilitation aims at developing and enhancing the functional abilities of a PWD, so that he/she isgainfully occupied resulting in economic contribution to self and the family. Employment opportunities for PWDs,however, have so far been restricted due to several challenges that need to be overcome, both from the demandside (employers) and from the supply side (job seekers). Vocational training provided by voluntary organizationsis not professionally designed, lacking in marketability and employability. Moreover, physical and mental impairmentis more vi,sible to the employers as compared to the abilities of PWDs.
Therefore, attempts need to be continued to expand the scope of employment in private sector which constitutemore than 90% of the total employment force. In keeping with developments on the economic front as well astechnological growth, vocational training programmes must be designed and implemented, ensuring that highstandards are set.
AIMS & OBJECTIVES
1. To obtain information from personnel in charge in the Garment Manufacturing Units (GMUs) and the personswith di.sabilities (PWDs) already employed in GMUs regarding their training and employment.
2. To obtain inlormalion regarding training and employment of PWDs in garment manufacturing process, fromgovernment and non government organizations (GOs & NGOs) involved in their vocational training.
273

3. To study the existing vocational training programmes (VTPs) for PWDs in garment manufacturing process.
4. To suggest recommendations for designing suitable VTPs for PWDs in garment manufacturing process.
METHODOLOGY
• Phase I: Two separate semi- structured interview schedules were designed for gathering first hand information
regarding the experiences of employed PWDs and their employers in GMUs. Purposive sampling technique
was used to interview 25 personnel in charge in GMUs located in Delhi and NCR. Care was taken that the
final sample included GMUs employing PWDs and also those not employing them. Census sampling technique
was used to interview all the 50 PWDs employed in 25 GMUs visited.
• Phase n : Interview schedule was developed to obtain information regarding training and employment of
PWDs from special educators and/or the heads of GOs & NGOs involved in their vocational training. Purposivesampling technique was used to short list the GOs & NGOs in Delhi and NCR providing VTPs in garment
manufacturing process to loco motor impaired, hearing impaired and visually impaired. All the short listed
organizations were contacted but only 18 organizations which were presently running vocational courses in
garment manufacturing process were visited for interaction.
• Phase in: In phase III, various existing VTPs in garment manufacturing process for PWDs in the mainstream
as well as in the special institutions were studied and compared with the existing job requirements in the
GMUs.
• Phase rv : On the basis of analysis of the information gathered above, recommendations for designing
suitable VTPs for PWDs in garment manufacturing process were suggested.
RESULTS & DISCUSSION
A detailed analysis of the information received in different phases was done. However, the salient findings were
as follows:
• Phase I :
a) 70% of the GMUs were employing PWDs as they have potential to perform.
b) Reason for not employing was non-availability of skilled PWDs.c) The role played by the GMUs in training unskilled PWDs can be emphasized as 22% of them were
trained in the company itself.
d) Only 6% were trained in apparel training institutions which reflect the lack of accessibility to these institutions
for the PWDs.
e) 50% of the trained PWDs got jobs within 6 months and 42% got job immediately after training. Thus,
there is demand for skilled work force.
f) Majority of the PWDs were able to retain their jobs for more than two years.g) Performance of PWDs was considered at par with other employees.h) Majority (76%) of the PWDs were willing to get further training.i) Majority (80%) of the GMU personnel were ready for minor adjustments to accommodate well trained
PWDs in future.
• Phase II :
Majority (73.26%) of the organizations visited were working for the persons with loco motor impairment.
Organizations dealing with persons with hearing impairment were 59.94% whereas 26.64% were providingservices for persons with visual impairment. Personal interest and aptitude were reported as the most importantcriteria for selection of a specific vocation by an individual. The analysis of information regarding variousconstraints faced during training of PWDs highlighted following issues:
a) Shortage of funds and lack of adequate infrastructure for training.b) Difficulty in arranging for trained and experienced faculty.
c) Commuting to the place of training is a big problem for PWDs.
d) Low educational and economic level of PWDs.
274

e) Trainees mostly belong to the migratory families, so they are not regular in training and more time is
required to train them.
It was revealed that only 33.30% of the organizations had a placement cell through which they try to place
the trained and efficient trainees in the industries are placed. Placement officers accepted that employment
rate (including all opportunities) of majority (46.62%) of the organizations was below 10%. Moreover, only
33.3% of the organizations agreed that they follow-up with the placed trainees to check the job sustainability.
The analysis of information regarding various constraints faced during placement of PWDs highlighted followingissues:
a) Courses are not industry oriented and there is lack of exposure to industrial machines & its workingenvironment.
b) Not able to cope with long working hours & non-disabled friendly transportation and work place.c) Limited placement options and lack of contacts with the industry.
d) Lack of sensitization among the employers regarding the capabilities of PWDs.
Phase III :
Existing mainstream VTPs for PWDs: The Director-General of Employment and Training under theMinistry of Labor is running Industrial Training Institutes (TTIs) for imparting training in formal programmeslike Garment Technology & Fashion Technology and non-formal programmes like Cutting & Sewing, DressDesigning & Fashion Designing. Other government institutes providing similar kind of training programmesare polytechnics. National Institute of Open Schooling, Board of technical education etc. Period of training ofthese courses is 1-2 years and have different eligibility criteria. There are instructions for 3% reservation ofseats for people with disabilities in these institutes but they are not utilized due to inaccessible environmentand lack of adaptation of syllabi, machines and equipment according to their requirements. Moreover, thoughthese courses impart exhaustive knowledge, they fail to match the skill competencies demanded in the jobmarket.
Existing segregated VTPs for PWDs: Various GOs & NGOs have undertaken specialized trainingprogrammes for PWDs which include cutting and tailoring, dress & fashion designing, basic tailoring etc.These courses were either self developed or followed the guidelines of NIOS, NCVT, INIFD etc. Theduration of these courses ranges between 6 months and 1 year, depending on the nature of the trade. However,vocational training provided by voluntary organizations is very traditional, not professionally designed, lackingin marketability and employability. There is a wide gap of skills because of lack of exposure to work life skillsand latest technology.
Phase IV :
The various recommendations for designing suitable VTPs for PWDs in garment manufacturing processsuggested by the personnel in charge in GMUs and the special educators and/or the heads of GOs & NGOshave been summed as follows:
a) The training programme should be able to recognize the potential of PWDs and should fetch them decentemployment.
b) The course curriculum should strictly match the skill requirements of the industry and should be upgradedaccording to the advancement in the technology.
c) The infrastructure should be upgraded and trainees should be trained to work on industrial machinery.d) Machines could be made user friendly by making necessary modifications so that they are comfortable
working on it.
e) Ideal duration for any vocational course should be 3-6 months keeping in view the availability of thetrainees.
f) Training programmes should make PWDs learn multiple tasks so that they are easily absorbed in theindustry and their work profile is made more versatile.
g) The training module should have theoretical component along with the practical aspect to make themmore knowledgeable at work.
h) Internship should be an integral part of training module which would help them to get acclimatized to the
275

working conditions of the industry,
i) PWDs can be trained as machine operators as it is in demand, but at least 3 months practical training is
must.
j) Other areas like handling of stores, quality checking, Hnishing and packaging, alterations of garments etc.
can also be included depending upon their interests and capabilities,k) People with impaired hearing can do almost all types of jobs like layering, cutting, tailoring etc. Person on
wheel chairs can perform jobs like fusing machine operator, bundling, ticketing etc.
CONCLUSION
On the basis of the salient findings and the suggested recommendations, new VTPs would be evolved to match
the present job requirements in the garment sector. According to the degree of disability, residual capabilities and
level of education of persons with loco motor impairment, hearing impairment and visual impairment, differenttasks performed in garment manufacturing process would be segregated. As per the feedback obtained from
personnel in charge of GMUs, one additional compulsory module on work readiness would also be developed.
Accessibility to these improved intervention programmes would make PWDs professionally more competent,thus engaging them in productive employment in GMUs. Effective linkage among the PWDs, training institutions,
employers, government, industry associations and the NGOs would push the philosophy of'inclusion' with more
energy and enthusiasm.
RECOMMENDATIONS
1. A replication of the study could be done for other disabilities like mental retardation and mental illness.
2. Other areas of apparel industry like weaving, printing, embroidery etc. could also be explored for training
PWDs for gainful employment.
REFERENCES
1. Bhanu.shali K. Revisiting social work in the field of health- Ajourney from welfare to empowennent. Seminar organized by Faculty of
Social Work, The Maharaja Sayajirao University of Baroda, Vadodara. 2007.
2. Kundu C L. Disability status in India, Rehabilitation Council ofIndia Publication, New Delhi, 2003, pp. 301.
3. Mohapatra C S, Disability management in India - challenges & cominitments, NIMH, Secundcrabad in collaboration with Indian
Institute of Public Administration. New Delhi, 2004, pp. 104.
276

TSDCFS/Oral/14
Influence of Technological Advancement on Awareness of Indian Regional Embroidery
AnvitaSAganval'.UK Vairagade- & PSLatlikar'1. Senior Lecturer. Dr. (Saw) I B P Mahila College.
Samrailt Nagar. Akuragabad (Mahara.shinO
[email protected] (0982.1078838)
2. Head. Dept. ol' Home science. Dr. (Saw) 1 B P Maliila College,
Samraih Nagar, Akuragabad (Mahara.shlra)
3. Senior Lecturer. Dr. (Saw) 1 B P Mahila College,
Samriiih Nagar. Akuragabad (Mahara.sluni)
(Tin'Oc
5S
ABSTRACT
The demand for embroidered garment in the modem society is due to the increasing fashion changes.
Indian embroidery has a global appeal and is in demand all over the world. The present study has
been undertaken with a view to judge the awareness regarding Indian regional embroideries due to
technological advancement & social change & to compare the findings between females of higher
& middle income group in Aurangabad. For the above study the data was collected through
questionnaire-cum-interview & random sampling method. The sample size was 100 females (50from each income group) between age groups of 18 to 35 yrs. It was found that few regional types
of embroidery like Kashmiri, Chikankari, Kutch & Kathiawari, & Kantha are popular amongst
them among them, Kashmiri was tlie most popular. Awareness regarding Manipuri, Kasuti,& Chambarumal was found to be very low. Respondents were aware of these embroideries mostly through
exhibitions, fashion shows in the higher income group & through books, magazines & newspapers
amongst middle income group. It was observed that movies & T.V. programmes has a (noticeable)effect on the awareness about regional embroideries.
INTRODUCTION
Embroidery is the art or handicraft of decorating fabric or other material with design sdtched in strands of
threads or yams such as metal strips pearl, beads, guilds and sequins. According to the Fashion Pundits ifembroidery is added on to the garment it gives the garment a very rustic look.
Indian embroidery has been in vogue as a traditional method of fabric ornamentation, has a global appeal and isin demand all over the world. India has a very rich heritage in embroideries.
The traditional embroidery of each state has influence of not only in the neighbouring states but also in foreigncountries like Persia, China, and Iran, etc. but also the neighboring states too. The embroideries of the differentstates are unique. Some of the well known regional embroideries of India are Phulkari of Punjab, Kantha ofBengal, Kashida of Bihar, Kutchi &. Kathiawari of Gujarat, Kasuti of Kamataka, Kashmiri embroidery, Manipuriembroidery, & Chikankari of Uttar Pradesh.
Fashion is vicious circle keeps on changing its trends from time to time, place to place, and people to people.However this change has hardly tapped the beauty of traditional embroidery of any state. Infact in today's worldthe traditional motifs colours & techniques have occupied almost a permanent base in the field of textiles.
Each type of the Indian regional embroidery has a unique regional design concept, stitch structure, techniques,color combination & application. Indians do seem to be of these varried Indian embroidery types or know the
skills to apply them to clothing.
Due to growing commercialization, aesthetics & nuances of the essence of the various embroideries have got
diluted. People seems reluctant to pay for the very fine & exquisite hand embroidered pieces for its real worthand this has lead to the deterioration in quality of commercially available hand embroidery. The genuine classic
277

appeal of Indian embroidery practiced & developed over centuries seems to be getting inferior as a result of
this. But now in this world of globalization & due to advancement of technology the same hand embroidery can
be replicated by machines which cuts down the cost to a large extent and people prefer to buy such products.
Change in social cultural has increased the demand of regional embroidery. People want to experience different
types of culture & be a part of it. This is the main reason for the demand of different types of regional embroidery.
AIMS & OBJECTIVES
1. To study the influence of technological advancement on awareness of Indian regional embroidery amongst
the population.
2. To compare the awareness among the higher & middle income group.
3. To promote the diminishing art of regional embroidery.4. To derive methods to popularize the Indian regional embroideries.
MATERIALS & METHODS
1. Selection of Area: The study was carried out is four areas i.e. Samarth Nagar, N-3, Cidco, Shray Nagar, and
Hudco of Aurangabad city.
2. Selection of sample: Sample size for the survey was 100 females from age group 18 to 35 years, 25 each
from above stated locality.
3. Data Collection: For the above study the data was located through questionnaire method & random sampling
method was adopted.
4. Analysis of data: The data collected was tabulated & statistically analyzed by means of percentage &
average.
RESULTS & DISCUSSION
The age group for the study was 18-35 yrs as this age group is much conscious about their style of garment. Itwas found that most of respondents were aware of embroidery (98% from each income group). Reference to
hand embroidery was found more in higher income group (60%) then middle income group. (36%). It was notedthat most of the respondents from both the group loved to wear embroidered garment mostly on religious
functions because of its beautiful, ethnic and graceful look. A very few respondents negatively responded to
embroidered garments, the reason being personal cost and need for extra maintenance.
Regarding awareness of regional embroidery it was noted that only few regional region embroidery like Kashmiri,
Chikankari, Phulkari , Kutch & Kathiawar, & Kantha were popular amongst the population studied Kashmiriembroidery was the most popular (92% in higher income group and 68 % in the middle income group), followed
by Chikankari, Phulkari, Kutchi, Kathiawari and Kantha. Awareness about Manipuri embroidery, Kasuti
embroidery, and Chamba rumal was very low.
People of income group became aware of these embroideries mostly through exhibition & fashion shows amongstthe higher income group while middle income group people got to know about these through books, magazines &newspaper.
Respondent from higher income group preferred regional embroidery due to its delate & attractive look whereas those from middle income group preferred it due to its delicats look & colors used. The respondents are not
much aware of the motifs used in the regional embroideries.
The respondents from the middle income group found finds the above garment expensive & not easily accessible
in the market where as the respondents from the higher income group were satisfied with cost and availability of
above garments in the market.
Shopping via-e- shopping is not yet popular amongst both the income groups. There was mixed dilemma for
buying the readymade regional embroidered garment or by self designed clothes using regional embroidery byboth the income groups.
278

It was strongly suggested by the entire respondent that regional embroideries should be popularized more. The
best means to popularize it was through promotion to cottage industries through government schemes & throughhandicraft exhibition.
I
UMabri
y sedB#niettw# WeiFN"
UTV
SIMM
f rMMsei0mm
qcpniiliNui ,
j] -D aj 0]
tl trerenVMMcM9»■ nurniriiiiiLiiiji i iiiiihi
S}Ttmhcf)
*>&> ttmmm
eUVKl»o«fc*M
»1 M«HMuM noJwn11 tflVKMWUt'lM
IIICONCLUSION
The demand for embroidered garments in the modem society is increasing due to changing fashion. People arenot aware of .some of the traditional Indian embroideries. Also accessibility to the tradition embroidered garments
is difficult in the market as these are mainly available during festive seasons and in the handicraft exhibitions.Therefore it was fest some of the traditional embroideries need to be popularized & developed into an industrialcraft in order to save the reminiscent beauty of the past & revaluating art.
RECOMMENDATIONS
If government promotes export facility for the regional embroidered goods, the taste for these embroideries willdevelop all over the world and which will provide greater employment opportunities. Training programmes maybe conducted in all different states for promoting the art of all different regional embroideries.Government can undertake the training programmes under the exchange schemes and tniin people.
REFERENCES
Not received from the author.
279

TSDCFS/Oral/17
Chemical and Structural Characteristics of Non-Mulberry Silk Pupae of Antheraea assama Ww
Mamata Goswami Adhikari' & Manjoo Goswami Mishra-
1. Selection Grade Lecturer, Cotton College, Guwahati (Assam)
mamatag_adhikari @yahoo.com (09954063140)
2. Selection Grade Lecturer, Handique Girls College. Guwahati (Assam)
manjugm200l @yahoo.com (09864154297)
ABSTRACT
Utilization of bio-waste materials for producing value added products have gained recent
importance. Assam state is rich in silk production. 58 countries all over the world are engaged
in various activities pertaining to Sericulture. Silk waste is a major bio-waste of the Silk
industry in Assam. Two kinds of silk wastes are obtained from the silk industry, cocoon
wastes and pupae wastes. Present work was aimed to utilize the pupae produced as a bio-
waste from muga silk industry for commercially profitable purpose, which was till now thrown
out as bio-waste causing environmental pollution. Therefore to produce regenerated fiber,
the proteins of spent silkworm pupae were taken for this work. Protein was isolated, purified
and characterized. 64.7g% protein in raw pupae powder and 82.19g% in defatted pupae
powder were obtained. The proteins were purified, molecular weight determined, bonding
patterns, degree of crystallinity and thermal properties were evaluated.
INTRODUCTION
During recent years, importance has been put throughout the world on utilization of bio-waste materials for
producing value added products. One of the important bio-waste produced in our country is the silkworm pupae,which is available to the tune of 23334 tones (dry weight basis) annually. This bio-waste, at present does not
have much profitable commercial use.
It has been reported by various workers that the protein contents in silkworm pupae vary from 48.70% -
79.80g%. If properly extracted around 7000 tons of fat and 12000 tons of protein are likely to be available from
the pupae as a byproduct in India alone. So far, most of the pupae waste is being utilized both for enhancingfertility of soil or as food for poultry, fish and pig. Many plant and animal protein were used to regenerate protein
fiber. Proteins like zein, arachin, soybean, casein, chicken feather and egg white proteins were successfully used
to produce fiber. Fibers made from plant and animal proteins were attempted for two reasons for solving economic
problem by producing a merchantable product from by-product. These protein when spun into a fiber had similarchemical design like that of natural fibers, but needed strict control of viscosity of the spinning material. Protein
to be spun should be highly purified and its characterizations is also very important as high degree of purification
leads to high degree of yield.
The present investigation was undertaken to conduct a systematic study on the evaluation of the chemical
constituents of muga .silkworm pupae, and then to isolate and purify the protein contents. Further, attempt was
also made to evaluate the characteristics and properties of the isolated protein.
AIMS & OBJECTIVES
Aim of the present inve.stigation is to extract the protein from waste pupae of Antheraea assama. and to purify,analyze all the properties suitable for fiber formation.
280

MATERIALS & METHODS
Air dried pupae powder were used for the experimental work. ANLAR grade chemicals were used. Standard
method for analysis and isolation of protein were used 6, 8. Fractionation, purification and determination of
molecular weight were done by using Sephadex G-25, Sephadex-G-100 and molecular marker. Infrared Spectra
of isolated protein were recorded, crystellinity of the isolated protein were measured by X-ray diffraction. Thedegree of crystellinity (K) was calculated. Thermogravimetry (TG) and Differential thermogravimetry (DTG)
were earned out by using Simadzu thermal analyzer. Differential Scanning Calorimetry (DSC) was measured
by DSC equipment.
RESULT & DISCUSSION
The protein content from the pupae powder was isolated and analyzed which was found to be statistically viable
as yield of protein (%) was found to be homogenous and correlation of pupae protein (%), protein in solution (%)and actual yield (%) was found to be highly significant. The yield of protein was found to be more than that of
other vegetable sources like soybean, groundnut, maize etc which are generally used for manufacturing regenerated
protein fiber 2,4, 10, 11, 12.
Pupae protein is a combination of many proteins. Isolation of each fraction from total pupae protein was carried
out.
Ibble 1; Estimated protein
Solvents used for
Dc- fatting
Crude Protein (g %) Soluble Protein (%)
Kjeldahl method Automatic analyzer
N-hcx:ine 82.19 84.00 75-00
Chloroform 83-50 85-50 75.20
Methanol 85-00 86.00 76-50
Petroleum ether 89-50 90.00 80.00
Chloroform : methanol
mixture (2:1)
87-00 88.00 78.00
T
IbbleZ: Comparative account of elements
Elements Waste Pupae Cocoon filament Fibroin Sericine
C 43.65 46.35-47.55 48.00-49.10 44.32-46.29
H 6.04 5.97-6.77 6.40-6.51 5.72-6.42
0 25.35 27.67-29.60 26.0-27.90 30.35-32.50
N 16.91 17.38-18.65 17.35-18.89 16.44-18.30
S 1.19 0.15 - 0.15
Protein was purified by Gel-filtration chromatography. 40 Fractions of eluent were collected in fraction collector.
Each fraction containing 3 ml of eluent was measured for protein concentration in UV absorption spectro
photometer at 280 nm. Single peak on UV absorption spectra indicated purity of proteins (Fig 1)
a,s
3 •• ....
• •
'' ' ♦ • •
2 ..J 1.S ■
« »t.
• ♦♦D •
, -
01
13
.. ♦♦
PrvetiM nun«flt
Fig 1: Purification of protein
281

Molecular weight of partially purified pupae protein when ascertained by SDS PAGE, approximate molecular
weight of pupae protein of A.assama was found to be in the range of 29 Kda-250 Kda(Kilo Dalton) when
calibrated with molecular marker (Fig 2).
Log Molecular Weight
s 4e(a
z ̂a
8 2e
A 1
O
^ 0<
1 3 5 7 9 11 13 15 17 19 21 23 25 27 29 31 33 35 37 39
PracUon number
Fig 2: Molecular weight of fractionated proteins
In the present study the presence of protein in the pupae with a native mass of more than 300 Kda were found.
Pupae protein produced 7-10 bands on SDS Page, with mass of 29, 47, 69, 125, 205 Kda and remaining band
showed mass of 300 Kda.
Purified protein were characterized with the help of IR Spectroscopy, IR spectra of the isolated protein (Fig 3)
showed peaks at 1404/cm for C=0 deformation, ati665/cm for>C=0 stretching and from 3330-2000/cm for N-
H stretching vibrations. N-H stretch vibration between 3000-2500/cm in combination with highly characteristics,
medium to weak absorption peaks between 2000-2220/cm were also present. The band at i329.27/cm attributed
to carboxyi ate anion showed the presence of L aspartic acid. 1222.32/cm found to be C=S stretching vibration
for sulphur compound. These entire characteristic bands exhibit the requirement of a pure protein molecule. The
band at 1665/cm, 1547/cm, 758/cm were the amide stretching attributing to the conformation of crystalline
region.
Table 3: Bond stretching
Group Non-H bonded
Structure, cm-1 Present inve.stigation,cni-l
N-H stretching 3460 3420-3301
C-H stretching 1690 1673-1646
OH stretching 3600 3451-3432
i.
>«
a
I
\ A;
/
/
rA'
V
I I ii
1 M) !«'
M ̂ ' I J '
iiii
fil
''I I*1 I 1/ I. I,
■ li l!
r
/ili!'
Wave number, cm '
Fig 3: IR Spectra of pupae protein
282
' Ii i j iII s« 1
I I

X-ray defractograms of the pupae protein revealed both crystalline and amorphous regions as well as transition
between the two regions. The degree of crystallinity was found to be 33%.
Fig : X-ray dOlfractograin of pupae protein
Thermo gravimetric (TG) differential thermo gravimetric (DTG) and differential thermal analysis (DTA) showed
that the decomposition of proteins took place in three main degradation points referred to as initiation, propagation
and carbonization. The TG Curve showed initial mass loss at 60°C, second stage at 90°C and third stage at
170°C. DTG also clearly illustrated thermal decomposition behavior of protein.
TMiMntmcCi
Fig 5: TG and DTG curve of pupae protein
Fig 6: DSC thermo gram
DSC thermot gram of pupae protein showed an endothermic peak at 67.49 °C indicating the initial point ofremoval of absorbed moisture till 95.58°C Protein showed noticeable thermal stability up to 219.70°C. Thethermal transition (Tg) was recorded at 232.I6°C and the sample showed a prominent exothermic peak at338.80"C.It established that pupae protein showed an important quality of stability, which is very very necessaryfor fiber formation
CONCLUSION
Quantity of protein in the pupae being very high it can be used for many purposes other than fiber formation.
283

Present investigation demonstrated that protein fraction can be isolated and purified. Data them collected on
crystellinity, molecular weight, and thermal behavior of isolated proteins revealed that this protein like all other
vegetable and animal protein can be used for fiber formation 3, 8.
RECOMMENDATIONS
Commercial production of this fiber needs further investigation.
REFERENCES
1. AOAC. Associaiioii ofOfficial Analytical Chemists, Washington DC, 1984.
2. Cheng U W, t/ S Patent Application. 1998, pp. 783,725.
3. Freddi G, et.al. Preparation and Characterisation ofAntheraeapemyi Silk Fibron. Journal of Applied Polymer Science. 82 (3) (1994),
pp. 52: 775.
4. Joseph L M, AZLONS. Hot Rine Hant and Winston, N Y. 1976 pp. 85.
5. Lowry O H, Rosenbrough N J, Fair A Land Randall RJ, Protein Measurement with thcFolin Phenol Reagent. Journal of Biol. Chem,
193 (1951), pp. 267.
6. Majumdar S K. Beneficial insect bio technology. Frontiers Industrial Entomology in Prospective Research in Entomological Research,
Ed O P Aggarwal. ScientiHc Publisher, Jodhpur, 1994, pp. 285.
7. OSMA. Official and Standard Methods of Analysis, The Royal Society of Chemistry, Cambridge. UK.
8. Rao P U, Journal of Agric Food Chemistry, 42 (1994), pp. 2201.
9. Tsukda M. Freddie G MatsumurM. ShioZaki H and Ishikawa H J, Journal of Applied Polymer Science, 27 (7) (1992), pp. 44:2203.
10. Whiter E and Gould S P. American Dyestuff Reponer, 28 (1939), pp. 641.
11. Wormel R L. Milk Caesin and Peanut Protein Fibres, Journal of Textile Institute, 44 (7) (1953). pp. 258.
12. Schmidt W F, Line M J, Physical and chemical structures of poultry feather fibers in fiber process developinent, Non Wood
Conference, 135. Tappi Press, Atlanta, U.S.A. 1996.
284

TSDCFS/Oral/18
Influence of Education and Communication Media on the Clothing Awareness and PurchasingPractices of TVibal Girls
Smriti Rekha Sarkar'. Animesh Sil- & Sangeeta Deo'1. Asst. Professor, Dept. of Textiles & Apparel Designing, College of Home Science, Rajendra
Agricultural University. Pu.sa (Bihar)
samastipur, [email protected]. (09934484960)
2. Asst. Professor (Agri. Statistics), T C A, Dholi, MuzalTarpur, Pusa, Samastipur (Bihar)
[email protected]. Assoc. Professor. Dept. of Textiles & Apparel Designing, College of Home Science,
Rajendra Agricultural University. Pusa, Samastipur (Bihar)
deosangeeta321 ©gmail.com. deo.s.angeeta321 @gm.'iil.com (09934255866)
ABSTRACT
Growth of education and media facilities has changed a lot in the deep rooted Socio
economic and psychological status of tribal. Education has created awareness amongthem to select serviceable, functional and comfortable fabrlc/apparel for their personaluse. Communication media acts as a bridge between textile and garment industry andultimate consumers. The study vvoj' aimed to know the effect of education on the clothingawareness and influence of communication media on the clothing purchasing practicesof college going tribal girls in Ranchi district of Jharkhand .The present investigationvi'fli' carried out in Kanke block and Ranchi Sadar of Ranchi district where most of thecolleges are situated. A Sample of 200 tribal college girls were selected through Multistage Stratified Random Sampling Technique from the five different colleges usingPPS sampling method. Data was collected with the help of pre-tested purposelystructured interview schedule. In the study area It was observed that communicationmedia had highly significant correlation (0.706**) with the clothing purchasingpractices of tribal college girls and statistically significant Correlation (0.289**) wasfound between respondents education and clothing awareness at 1% level of significant.Enhancement in education and media facilities has brought a change in all sections ofcontemporary society.
INTRODUCTION
The tribal of India are the indigenous, autochthonous people of the land in the sense that they had been longsettled in different parts of the country before the 'Aryan' speaking people penetrated India to settle down. Nowthe 'tribal' word indicates a half-starved community, which is deprived of even the basic facilities like clotiiing,food, employment, education and health (Singh, 1972). With tlie opening of several institutions in the tribal area,people of different parts arrived in the tribal area, witli these people the tribal came in close contract. They haveacted as innovators unconsciously. Besides these, there are the planned schemes various media faciliries producedan impact on the tribal. They directly and indirectly affected all sectors of life and in long run being structuralchange in the society. The consumer of today tends to prefer clothing that is aesthetically attractive, sociallyacceptable, physically comfortable, economically obtainable, fashionable and at the same time easily maintained.In order to achieve these goals, the consumer needs to improve his knowledge regarding quality, design, finish,properties of textile material and care of clothing. In tribal community deep rooted cultural forces and traditionare prevailing. They have their own dress code. Though, enhancement in education and media facilities hasbrought a change in all sections of life. Clothing market today is highly complex. However, the intelligent consumerlearns about new thing in the market through modern communication media and makes rational purchase. Mediais an excellent means of trade and acts as a middleman between producer and the purchaser.
AIMS & OBJECTIVES
1. To study some personal variables of the tribal girls of Ranchi districts of Jharkhand.2. To assess the influence of education and communication media on clothing awareness and purchasing practices
of tribal girls.
285

MATERIALS & METHODS
In Jharkhand, Ranchi district was selected purposively for the study. Kanke block and Ranchi Sadar were
selected for conducting the survey work. Data were collected through personal interview method with the help
of pre-tested purposely structured interview schedule. A sample of 200 tribal college girls was allocated in
different sample college through Multistage Stratified Random Sampling Technique using probability proportional
to size method. Observation method was also used to get qualitative information.
Data were analysed by employing percentage distribution, coefficient of correlation and rank weighted average.
(No. of respondents in each rank X Rank No.)
Rank weighted average = Total no. of respondents in all ranks
Then ranking was done according to the lowest order of magnitude.
RESULTS & DISCUSSIONS
Table I reveals that majority of the respondents (68%) belonged to the age group of 21 to 25 years followed by
the age group of up to 20 years (22.5) and very few respondents (9.5%) belonged to the age group of above 26
years. It was also observed that the larger number of respondent (54%) were enrolled in professional courses
followed by graduation level and above (36%) and only 10% girls were studying in Inter level under the above
age group. It was found that with the efforts of Govt., NGOs and especially the Christian Missionaries tribal
have acquired much higher level of education and professional training in the area under study.
l^ble 1: Age and education of respondents (N = 200)
SI. No. Variables No. of respondents Percentage
1. Age group
(i) Up to 20 years 45 22.50
(ii) 21 to 25 years 136 68.00
(iii) 26 years and above 19 9.50
2, Education level
(i) Up to inter 20 10,0
(ii) Graduation and above 72 36.0
(iii) Professional 108 54.0
The quality of a fabric is determined by the characteristics of each of its components. To select wisely a better
clothing material or garment in less price, one should know about the fabric quality. However in this present
study it was found that 40.5% respondents did not have any technical knowledge regarding the fabric quality.
Though, they try to check the fabric quality while purchasing. Gayan and Mazumdar (2002) found in their study
that majority of the respondents had faced problems regarding quality aspects.
Table 2 reveals that 71% respondents checked about the type of material. 29% of the respondents thought aboutdurability of the dress materials followed by colour fastness (16.5%). Though, the colour fastness is a very
important aesthetic quality of a textile material, may be due to negligence many people do not care for that.
Table 2: Checking of fabric quality by the respondents (N = 200)
Si. No. Fabric quality Frequency Percentage
I. Colour fastness 33 16.5
2. Durabilitv 58 29,0
3. Type of material 142 71.0
4. Print 28 14.0
5. Blend 3 1.5
6. Particular finish 14 7.0
Multiple responses were found
286

It can be noticed from the above table that very few respondents checked about the blend. Majority of the
respondents checked the type of material just by feeling with hands. Statistically significantly correlation was
found between respondents education and clothing awareness at 1% level of probability (0.289**). So, definitelyeducation influenced the tribal about selecting best and suitable material to wear and check the fabric quality.
Based on the result presented in Table 3, the order of media preferences revealed that 56.4% preferred to see
magazines before purchasing of garment followed by television (50.0%) and movie (20.0%), 18.0% respondents
preferred to see advertisements of a particular brand or manufacturer, very few preferred internet. It is common
practice among the college girls to purchase the women's magazines or fashion magazines and see it in their
leisure time or whenever they wanted to see it. With the colourful background and wearing style of the attractive
models attract the young generation to Imitate them.
Ibble 3: Distribution of respondents based on their media preferences (N s 94)
SI. No. Fabric quality Frequency Percentage
1. Television 47 50.0
2. Internet 6 6.4
3. Magazine 53 56.4
4. Movie 19 20.0
5. News Paper • -
6. Window display • -
7. Advertisement 17 18.0
Multiple responses are possible
N = 94, respondents watched media before purchasing
India is considered one of the biggest markets for retail business with a large base consisting of a population of
1 billion of which 300 million are active spenders. Better organized retailing is slowly and steadily growing in all
over India (Roy, 2001).
A critical glance at Table 4 reveals that retail shop was preferred by 53.5% respondents "Always". 61.5%respondents preferred to buy from wholesale shop "Sometimes". 73.5% respondents "Never" purchased from
footpath shop and co-operatives (67%).
Ihble 4: Preferential choices of place for purchasing clothes (N s 200)
SI. No. Place of purchase Always Sometimes Never
I. Retail shop 107 (53.5) 79 (38.5) 14 (7.0)
2. Wholesale shop 27 (13.5) 123 (61.5) 50 (25.0)
3. Govt. shop 6 (3.0) 96 (48.0) 98 (49.0)
4. Foot path shop 3(1.5) 50 (25.0) 147 (73.5)
5. Door to door selling 3 (1.5) 66 (33.0) 131 (65.5)
6. Cut piece shop 38 (19.0) 109 (54,5) 53 (26.5)
7. Show room 36 (18,0) 118(59.0) 46 (23.0)
8. Cooperatives 6 (3.0) 60 (30.0) 134 (67.0)
Figures in parentheses indicate percentage of total response
Retail shops were highly preferred because of the provision of credit facilities, discounts as well as bargaining."Sometimes" respondents preferred to buy from whole sale shop and manufacturer's show room when they
wanted to purchase in bulk and give importance to the quality and sticked to the particular brand.Non-availability of variety, unattractive, unappealing and out dated material were the reason for not preferringco-operative store.
287

Table 5 reveals about the factors considered by the respondents while purchasing clothes. Cost was the first
important factor considered by the majority of the respondents followed by colour combination and design. The
result of weighted average rank showed that price, colour combination, design, durability, easy care, fashion and
colour fastness in order of preferences. Most of the respondents ranked cost as the first important factor may be
due to they have to make provision for clothing purchase within their limited clothing budget. Tribal people loveto adorn themselves. Preference for colour combination and design may be due to the reason that they want the
clothes should suit to their personality and enhance their personal beauty.
Table 5: Factors considered by the respondents during their clothing purchase (N = 200)
SI. Factors No. of respondents assigning ranks Rank
No. Weight
Average
Rank
1st 2nd 3rd 4th 5th 6th 7th
I. Cost 72 18 31 22 31 6 19 3.0 1
(36.0) (9.5) (15.5) (11.0) (15.5) (3.0) (9.5)
2. Fashion 25 17 14 33 22 33 56 4.7 6
(12.5) (8.5) (7.0) (16.5) (11.0) (16.5) (28.0)
3. Design 14 64 44 36 14 22 6 3.3 3
(7.0) (32,0) (22.0) (18,0) (7,0) (11.0) (3.0)
4. Colour combination 35 25 56 42 25 14 3 3,2 2
(17.5) (12.5) (28.0) (21.0) (12.5) (7.0) (1-5)
5. Colour fastness 8 11 3 25 36 64 53 5.4 7
(4.0) (5.5) (1.5) (12.5) (18.0) (32.0) (26.5)
6. Durability 28 28 28 22 33 33 28 4.1 4
(14.0) (14.0) (14.0) (11.0) (16.5) (16.5) (14.0)
7. Easy care 17 33 25 19 42 28 36 4.3 5
.. (8,5) .. .(16-5) . (12.5) .. (9.5) (21.0) (14,0) (18.0)
Figures in parentheses indicate percentage to respective total
The data enfolded in Table 6 reveals that majority of the respondents (51.5%) got the information of sale system
fi"om newspaper followed by advertisement on the shop (28.0%). 25% respondents received the sale information
through television and 22% by window display.
Ihble 6: Distribution of respondents depending on the basis of their source of sale information (N = 200)
SI. No. Source of information Frequency Percentage
1, Advertisement on the shop 55 28.0
2. Television 50 25.0
3. Radio - -
4. Newspaper 103 51.5
5. Pump let/Leaflet 42 21.0
6. Shop displayAVindow display 44 22.0
7. Others - -
Multiple responses possible
Newspaper serves day to day news at the door step. It sends a message to the mass any where e.g. during
traveling, in office, in college library as well as in home etc. So, timely availability of the sale information at the
door step may be the cause of referring it by most of the respondents.
288

Further the study revealed that majority of the respondents considered magazine is the most effective media
followed by television and movie. Magazines are stored for future references. College girls may not get much
time to sit and watch the television for a specific programme at specific time. Magazine can be referred in their
leisure time. If a telecast programme was missed that can not be viewed again. This may be reason for considering
magazine as the most effective media for obtaining information regarding clothing and fashion trend by most of
the tribal college girls.
An in-depth analysis showed that communication media had highly positive correlation with clothing positive
correlation with clothing purchasing behaviour (0.706**) at 1% level of significance.
CONCLUSION
Based on the overall findings it can be concluded that respondent preferred to see magazine and television toknow the fashion trend, brand etc. before clothing purchase. Retail shop was preferred for purchasing. Cost
was the important factor considered during clothing purchase. Newspaper was the source of getting saleinformation. Though, magazine was considered as the most effective media for getting the information regarding
clothing and fashion. Highly significant correlation was found between communication media and clothing
purchasing behaviour. The finding of the study would help the entrepreneurs, garment industry, textile and
accessory indu-stries and other related industries to promote sale providing information regarding new technicaladvancement in the area of clothing and textile and their products through the most preferred media. A good
number of respondents did not know about the quality of the fabric, though statistical significant correlation was
found between respondents education and clothing awareness. Training can be imparted to teach textile quality,performance and care of particular fabric and garment.
RECOMMENDATIONS
REFERENCES
1. Das P, Iiiipaciofcloiltiug and textiles adveriixenwiii on the female siiideius at Baroda. Unpublished M.Sc Dissertation, University of
Baroda. 1981.
2. Gayan S and Mazumdar L. Factors injineticing the clothing purchasing practices in the hotiseholds of Assam, Textile Industrial Trade
Journal. 40(1-2) (2002). pp. 4.t-45.
3. Kulloli S D and Shailaju D N. Clothing piinhasing habits ofrural and urban families. Textile Dyer and Printer, 31 (no) (1996), pp.
17-20.
4. Roy R S, Retail boom picks tip paces as RMG segments get organized. The Indian Textile Journal, 3(4) (2001), pp. 137.
5. Sarkar S R and Sil A. A study ofselected variables associated with clothing selection, fashion adoption andpurchasing behaviour of
tribal girls. Textile Trend. LIl (3) (2009), pp. 26.
6. Singh K S. Tribal situation in India. Proceedings of Seminar, Indian Institute of advanced study, Simla, 1972.
289

TSDCFS/Oral/19
Impact of Handloom Weaving 'Draining on Socio-Economic Status of Rural Women
Sangceta Deo
Assoc. Professor, Departmenl. of Textiles & Apparel Designing, College of Home Science,
Rajendra Agricultural University, Pusa, Samastipur (Bihar)
deosangeeta321 @gmail.com, (09934255866)
ABSTRACT
Women's participation in income generating activities is believed to increase their status and decision-
making. Women empowerment is an important tool for bringing change in their mental set-up
which ultimately leads to change in their living pattern. For this purpose six month training on
handloom weaving and decoration was conducted among socially backward class of rural society.
Personal interview schedule was used for collection of data to study the impact of training on
knowledge gain, change in social status and standard of living through well structured questionnaire.
Ensuring a rightful place for women in the family and society and recognizing her contribution to
the family income was one of key areas that received attention under the training. Women started
tackling money matters of their own contribution of income which finally resulted into better access
to resources. Being an earning member with increased, knowledge and awareness, their social
status changed and they could afford better food, clothing, education and standard of living and
looked for still better things in life. Active involvement in decision making, interacting with others
and with exposure to communication media changed their family life styles.
INTRODUCTION
Woman plays an important dual role in the society. Though her role in the society is very important the rural
women are often physically visible but conceptually invisible. The best way to make optimum use of rural
women as an important human resource is to provide them opportunities for self development through technological
trainings which improves the existing knowledge, skill and enhances capabilities thereby improving competency
to meet the ever changing society. It ultimately leads to change in their living pattem. Women empowerment
brings change in their mental set-up enhancing their possibilities to adapt to social change. Women's participation
in income generating activities is believed to increase their status and decision making power. The economic
contribution of rural women is related to their status and role in family and in the society. If women are economically
a parasite, they can never contribute and keep pace with the changing society. The problem of rural poverty
cannot be tackled without providing opportunities of productive employment to women, contribute a large share
of what they earn to basic family maintenance. Economic independence by means of small scale enterprise of
handloom weaving will keep pace with far reaching social change.
AIMS & OBJECTIVES
1. To study the socio-personal characteristics of trainees.
2. To study the impact of training on socio-economic status of family and gain in knowledge
MATERIALS & METHODS
The six months training programme on handloom weaving and Decoration was imparted at the Department of
Textile and Appai-el Designing to thirty trainees who were selected from socially backward class of rural society
290

around the Pusa Block of Samastipur district. The study was conducted among these thirty selected trainees
purposively considering the access to the researcher. The pre-post research design was utilized for collection of
data. Tools used for the study was interview schedule, knowledge test. To assess the knowledge gain, a well
structured questionnaire containing eighteen questions was formulated. Knowledge items were distributed before
and after they were exposed to the training. Each correct answer was assigned a score of one whereas zero
was assigned to a wrong answer. The maximum score attainable by respondent could be eighteen. The difference
between pre and post exposure was taken as knowledge gain of an individual. Questionnaire regarding change
in status, income level, adoption of training as an enterprise were personally monitered through personalised
interview. The proper statistical methods used were mean, frequency percentages.
RESULTS & DISCUSSION
Socio-personal characteristics/profile of respondents is given in Table 1. It was evident that age of the respondents
ranged from 18 to 35 years with an average age of 19.3 years. Most of the trainees were from middle age group,
i.e. 60 per cent. The group comprises of young and middle aged women. Sixty percent of the respondents were
having high school education. Twenty percent of the respondents had graduation degree. Majority of the
respondents, i.e. sixty per cent had joint family system and forty per cent had nuclear family system.
Table 1: Socio-pcrsonncI profile of respondents
Characteristic Category Frequency
Age (years) Young (Upto 18 years) 12 (46.00)
Middle (18-35 years) 18 (60.00)
Old (above 35 years) 0
Educalion Middle 6 (20.00)
High 18 (60.00)
Graduate 66 (20.00)
Family typcNuciear 12 (40.00)
Joint 18 (60.00)
Figures in parenihesis indicate percentages
Gain in knowledge: It is seen from the Table 2 that 86 per cent of the trainees had low level of knowledge
score regarding handloom weaving and decoration before the training. After the training two-third of the
trainees, i.e. 66.6 per cent had gained medium level of knowledge. The gain might be attributed to the fact
that most of the trainees were voluntary participant with zeal to earn income. Also they had paid for high fees
of training in order to acquire skill to become entrepreneur.
Tbble 2: Distribution of respondents according to gain in knowledge
Level of knowledge
Pre-training
Frequency
Post-training Jevel
Gain in knowledge
Low level (0-6) 24 (80.00) 2 (6.60) 0
Middle level (7-12) 6 (20.00) 20 (66.6) 14
High ]evel(13-18) 0 8 (26.6) 8
Mean 8.3! 15.20 6.89
Figures in parenthesis indicate percentage.s
Increase in income level; One of the key areas that received attention under the training was ensuring a
rightful place for women in the family and society by recognizing her contribution to the family income.
291

Table 3: Distribution of respondents according to income level
Level of income Frequency
Pre-tralning Post-training
1. Upio 2000 26 (86.66) 21 (70.00)
2. 2000-4000 3(10.00) 8 (26.66)
3. Above 4000 I (3.33) I (3.33)
Figures in parenthesis indicate percentage
Perusal of Table 3 showed that there were only 10 per cent of the respondents in income group of Rs. 2000-4000
whereas it increased to 26.66 per cent of the respondents. It was due to the efforts of respondents taking up
handicrafts, embroidery work after attending to their domestic chores. Most of the respondents were direly in
need of an opportunity to earn to serve their families.
" Change in social status: Bringing women along the mainstream through training showed remarkable change
in participation in taking decision (60%) awareness level of modem living standards (56.6%) and acquiring
leadership qualities (66.6%). It finally resulted into improvement in managerial autonomy as well as social
recognition.
Table 4: Distribution of respondents according to factors contributing to social status
Characteristics Frequency
Prc-training Post-training
1. Decision making 10 (33.3) 18 (60.0)
2. (.eadership 6 (20.0) 20 (66.6)
3. Awareness and knowledge of modem living 5 (16.6) 17 (56.6)
Figures in parenthesis indicate percentages
Active involvement in decision making, interacting with other trainees, exposure to communication has changed
their lives.
Spending paltem: Table 5 showed that women start tackling money matters of their own contribution of
income which finally resulted into better access to resources. Most of the respondents showed happiness and
satisfaction by spending their money on most important aspect of household work. Spending on proper
education of children (66.66%) and purchase of simple devices for kitchen (73.3%) were their first priority
followed by clothing, accessories and food items. Being an earning member with increased knowledge and
awareness, their social status changed. They can now afford better food, clothing, education and standard of
living and look for still better things in life
Table 5: Distribution of respondents according to spending pattern of their own income
Activity Frequency
1. Education of children 20 (66.66)
2. Food items 10(33.30)
3. Clothing 15 (50.00)
4. Purchase of kitchen wares 22 (73.30)
5. Jewellery and accessories 18 (60.00)
Multiple choices possible
CONCLUSION
RECOMMENDATIONS
292

REFERENCES
1. Kumar N K, Sandcep K and Subnimaniam R, Training ejfeciiveness - an analysis of dairy trainees, Joumsd of Exlsasion Education,
9 (1) (1994). pp. 1916-1918.
2. Sliipm K. Impact of mushroom cultivation training pmgraiiune on rural women • a critical study in Samastipur district of Bihar,
Unpublished M.Sc Disxcrtation. RAU. Pusa. Bitmr. 2004.
3. Sinha R K and Ramusha M N. Tassar as an enlciprise hrings prosperity, Indian Silk. 48 (4) (2009). pp. 14-16.
I
L..293

TSDCFS/Oral/21
Value Addition ofJainsem from Meghalaya with Indian Embroidery
Marsoki M Hek' & Deepa Rathi^
1. Lecturer, Shillong University
2. Associate Professor, Dept. of Textiles & Fashion Technology,
College of Home Science, Nirmala Niketan (Mumbai)
[email protected], (09869019041)
ABSTRACT
India has its own traditional arts and crafts. One of the most beautiful legacies of the Indian crafts
is the ornate embroideries. Jainsem the traditional costume of Meghalaya are not embroidered.
They are made of different fabrics worn either plain or printed. In this study an attempt was made
to enhance the Jainsem of the Khasi tribe from Meghalaya by the incorporation of India traditional
embroideries; Chikankari and Phulkari. A variation in designs was made in terms of layout. Based
on the result of first survey, twenty-four Jainsem were hand embroidered, with both Chikankari
and Phulkari embroidery. The hand embroidered Jainsem were evaluated by conducting survey
for their acceptability and suitability by consumers and retailers in Shillong. From the results of the
survey it was seen that a similarity exists between retailer's and consumer's preferences. The
embroidered Jainsem was well accepted by both retailers and consumers where in, Chikankariembroidered Jainsem was preferred over Phulkari embroidered Jainsem.
INTRODUCTION
Meghalaya or 'abode of the clouds' is a source of inspiration to any poet, a dramatic canvas for an artist'sdream, and the ideal retreat for people in search of beauty and solitude.
• Costume: The Khasi lady wears a dress called 'Jainsem' on a regular daily basis which flows loose fromthe shoulders down to the ankles, and is not caught in the waist. The 'Jainsem' consist of two identical piece
of cloth depending on the height of the wearer. One of the two ends of the Jainsem is passed under the left
armpit and its two comers are pinned onto the right shoulder similarly the other Jainsem is passed throughthe right armpit and pinned onto the left shoulder in which the right overlaps the left. The upper part of her
body is clad in a blouse beneath the Jainsem.
• Chikankari: Chikankari is a fine and intricate shadow-work type of embroidery done by white yam on
colourless muslins called tanzeb (tan meaning body and zeb meaning decoration).• Phulkari: The origin of phulkari could well be traced to the IS"* century- and is mentioned in the Guru
Granth Sahib the holy book of the sikhs. Phulkari literally means flower embroidery, a form of craft thatbecame synonymous with dupattas or shawls which were embroidered over.
AIMS & OBJCETIVES
'Jainsem' is a traditional costume of the Khasi tribe from Meghalaya. The Khasi's has no origin for embroideries;
enhancement by embroidery is not a common practice though simple machine embroidery designs for border
scallops are used. The study explores the possibility of is incorporating Indian embroidery on Jainsem; with an
expectation that this would contribute to utilizations of these ornate embroideries that are little known to theKhasi tribe, and provide product diversification to the traditional Jainsem. The aim of the study is to enhance the
outlook of Jainsem by hand embroidering, using Indian traditional embroideries.Also the study was carried out with the objective to involve and collaborate with a non-govemmental-organizationbased in Shillong for training and implementing the study so as to introduce Indian embroidery in the region ofShillong.
294

MATERIALS & METHODS
Fabric type: Cream colored georgette fabric
Thread type: different colored cotton anchor embroidery threads and silk floss
The methodology followed was:
• Collection of relevant data leading to compilation of motif and layout applicable for the two embroideries.
• Rendering on paper, designs based on border and spaced-out lay suitable for Chikankari and Phulkari
embroideries.
• Designing of questionnaire and conduction of the survey to short list six preferred designs for border andspaced-out layout by textile experts
• Hand embroider 24 Jainsem using chikankari and phulkari embroidery stitches (12 each) using border and
spaced out layout.
• Formulation of second questionnaire, conducting tlie second survey, so as to evaluate the preference and
acceptance of the embroidered Jainsem by the 30 retailers based in Shillong (9 male and 21 female)
• Formulation of questionnaire no. 3. Conduction of survey no 3 so as to evaluate the preference and acceptance
of the embroidered Jainsem by 70 consumers of Jainsem in Shillong and Mumbai. (30 and 15 workingwomen in Shillong and Mumbai respectively, and 25 housewives in Shillong.)
• Analysis of the cost of the embroidered Jainsem and determination of selling price.
• Planning of the training programme.
RESULTS & DISCUSSION
The result and the findings obtained are reported under following section related to the three surveys.
• Experts' responses regarding layout of the design: According to selection of design placement byexperts the analysis revealed that majority of the experts' preferred border layout over spaced-out layout.Amongst the 20 design rendered on paper for each embroidery, the textile experts ranked design number 20of border layout and design number 7 of spaced-out layout as the first rank with 55% rating
• Result of the two survey related to retailers and the consumers
a) The finding reveals that the retailers and the consumers preferred chikankari embroidery over phulkariembroidery.
b) The expert's layout preference in comparison with the layout preferences for the embroidered Jainsemby the retailers and consumers did not match.
c) The 'over-all appearance' of chikankari embroidered Jainsem was the main factor considered for the
selection by the retailers and consumers.
d) The motif of Phulkari embroidered Jainsem was the criteria for selection by the retailers whereas both'placement of motif and 'motif it self was the main factors for selection by the consumers.
e) The data reported that both the group of respondent ranked Chikankari embroidered Jainsem as 'excellent'and phulkari embroidered Jainsem as 'good'.
f) The data analyzed showed that respondents indicated preference for gold and silver embroidery as theother alternative embroidery on Jainsem.
g) The price range which the retailers suggested the consumers would pay for these Jainsem was Rs 500
and The consumers were willing to pay Rs 401 - Rs 501 for the Jainsem.
295

h) The retailers and the consumers felt that the embroidered Jainsem would be readily accepted by the
Khasi people, thereby a high local market potential for embroidered Jainsem.
Cost determination of the embroidered Jainsem : The cost price of the embroidered Jainsem varied
depending on the size of each motif, material and labour charge. The material cost was Rs 184.The labour
charges for embroidery vallied from Rs 10 to Rs 60 depending upon the width and length of the border and
the size of the motif.
Training programme: Details were planned for conducting 3 to 4 weeks training programme in collaboration
with a non-governmental organisation based in Shillong. The aim was to train girls in skills related to Indian
traditional embroideries.
CONCLUSIONS
Enhancing Jainsem by the incorporation of Indian embroideries was accepted by the Khasi people. Indicatingthat these embroidered Jainsem would have a high potential value in the local market of Shillong. Further
incorporation of such embroideries would enhance the appearance of Jainsem adding more variety and grace to
its total outlook.
RECOMMENDATIONS
The recommendations for the study are as follows:
• Fusing of both border and spaced-out layout.
• Making variation by use of other type of material, colour and all over embroidery including the back side
of Jainsen.
• Incorporation of other Indian embroideries.
296

TSDCFS /Poster/1
A Study on Buying Behaviour and Construction of Jeans for Females According to Preference
Samita Gupta ' & Bincliya Lalwani -
1. Senior Lecturer. J. D. Birla Institute, Kolkata (West Bengal)
[email protected] (098.11181119)
2. Teacher. Laxmipath Singhania Academy. Kolkata (West Bengal)
Jeans are a way of life for people of all ages from all walks of life. Designers and merchandisers must
be aware of the fashion change and how it will affect development and marketing of jeans. Keeping this
objective in inind, a study on various product characteristics influencing selection of jeans was undertaken.
Jeans with ten innovative patterns were constructed and tlieir acceptance by the target group was studied. The
study was conducted using a structured questionnaire for a purposive random sample of 150 females. The data
collected was analyzed by percentage, ranking, hypothesis z and chi-square tests. 15 designs were sketched
and 10 designs were finally selected for construction by taking opinion of 10 judges. The design features
included dart equivalent seamlines, stylelines, godets, fullness in form of pleats and gathers. Jeans designed
with pleats were preferred over the ones with gathers. Designs broken up by many seamlines detracted from
the beauty of surface texture, which explained rejecdon of the sample constructed with many seamlines and
acceptance of ones with adequate seamlines. The study also revealed that some respondents did not prefer the
constructed jeans over the regular ones available in the market. Thus, a new product although being innovative
still needs an effective promotional mix to be accepted by consumers.
TSDCFS /Poster/2
Probing Entrepreneurial Qualities of Students in Professional and Non-Professional Courses Studying Fashion and
Textiles
Manushi Tewari ' & Shailee Mehra -
1. Lecturer, J. D. Birla Institute. Kolkata (West Bengal)
[email protected] (09830671576)
2. M.Sc Student. J. D. Birla Institute, Kolkata (West Bengal)
The main objective of the study was to find out the difference in entrepreneurship skills of female
students of professional and non-professional courses. The data was collected by questionnaire method from
132 students form professional and non-professional courses related to textiles and fashion. It was observed
that the students who are doing a professional course scored significantly high in tlie areas of Self Perception of
Entrepreneurship Traits and Organization Ability and Managerial Skills. They scored above average in the area
of Human Engineering. Personality Maturity and Executive Reaction Pattern. However, no significant difference
was found regarding human relations between the two groups. On the other hand, students from non-professionalcourse scored above average only in the areas of Self Perception of Entrepreneurship Trait and organizationAbility and Managerial Skills, average in the areas of Human Relation and Human Engineering, below average
in the area of Personality Maturity Scale and extremely poor in the area of Executive Reaction Pattern. Takenas a whole, the students pursuing professional course scored higher in all the areas of entrepreneurship thanstudents from non-professional course. However, students of non-professional course are not totally devoid of
these qualities although they scored slightly low in these areas.
297

TSDCFS/Poster/3
A Comparative Study of Non-Working and Working Wives on the Roie Played by Them in theSelection of their Husbands Clothing
Smita Parekh
Lecturer, J. D. Birla Institute. Kolkata (West Bengal)
[email protected] (09874146094)
The present study was undertaken with an aim to find out the influence of different factors on the
selection of clothing by non-working and working wives for their husbands and to understand their choice of
clothing. The study was conducted using a structured questionnaire for a purposive random sample of 200
females - ICQ each of non-working and working wives. The data collected was analyzed by percentage, chi-
square tests and ranking. It was found, shopping jointly is preferred as combined decision helps in making
better selection and judging the quality of fabric. Husbands of working wives prefer readymade garments
where as those of non-working prefer combination of material and readymade. Quality of the fabric and
occasion were ranked 'first' by non-working and working wives when considering factors before purchasing
material and garments respectively. Occasion and budget are ranked first by non-working and working wives
when considering personal factors respectively. It can be concluded that husbands from both the category give
importance to the suggestions of their spouses while selecting their apparel. Thus business entrepreneurs dealing
in men garments must take into consideration the influence that the homemakers who are also decesion makers
have on the sales while planning their marketing compaign.
TSDCFS/Poster/4
Designing of Utility Garments for Spastic Persons
Shweta l\iteja', Anshu- & Archana Singh^1. Lecturer, J. D. Birla Institute, Kolkata (West Bengal)
[email protected] (09748934245)
Teacher, Dept. of Textiles & Clothing, C.S.A.U.A. & T, Kanpur (UP)
[email protected] (09369847753)
Asst. Professor, Dept. of Textiles & Clothing, C.S.A.U.A. & T, Kanpur (UP)
[email protected], (09415668605)
2.
3.
i'i
Clothing is one of the basic necessities of human life. Clothing can improve appearance, hide physical
defects and give aesthetic pleasure to the wearer. To help the persons with disabilities to cope with their
physical restrictions and at the same time to provide them with attractive style becomes a challenge. An investigationwas conducted to design suitable functional clothing for individuals having cerebral palsy in Kanpur. The study
was carried on 40 respondents, selected through purposive sampling in the age group of 10-21 years. It was
found that most of the respondents faced problems in donning, doffing and manipulating the fasteners. Precoded
interview schedule was used for collection of data and was analyzed by frequency, percentage, weighted score,
mean and rank methods. A total of 20 garment designs were sketched according to the need and suggestions of
the respondents. The features included easy to manipulate fasteners, large crotch length, large armhole, shoulder
openings, opening for incontinence and unequal front and back length of the garment. The sketches were shown
to a panel of 15 judges. Out of 20 sketches, the 4 most preferred sketches were selected for con.struction.Satisfaction of the respondents for the constructed garments was also assessed through acceptability scale andit was found to be satisfactory.
298
..iOA

TSDCFS/Poster/10
Antimicrobial Finishes Using Medicinal Herbs
V Krishnaveni & S. Amsaniani ̂
1. Senior Lecturer. Department of Fashion Technology,
KumaniOuru College of Technology, Coimbalore (Tamilnadu)
[email protected])m (09486112284))
2. Reader. Department of Textiles & Clothing.
Avinashilingum Deemed University. Coimbalore (Tamilnadu)
[email protected]. (09944435506)
Textile.s come to our help in every walk of life, in either conspicuous or in conspicuous form. The fields
of application of technical textiles are unlimited and the ideas often revolutionary. Healthcare is a seriousbusiness which is not only influenced by practicing medical professionals. Good hygiene is an aid to health,
comfort and social interactions. It directly aids in disease prevention or disease isolation. Textiles being vulnerable
to microorganisms attack would cause many cross infections and allergic reactions. The number of bio-functional
textiles with an antimicrobial activity has increased considerably over the last few years. The awareness of
health and hygiene for consumers has increased the demand for antimicrobial textiles whilst in the past it was
predominantly technical textiles, which had. antimicrobial finishes in particular protecting against bacteria and
fungi, now-a-days textiles worn close to the body have been developed for a variety of different applications asfar as medical and hygienic tasks. Antimicrobial finish on fabrics can minimize the transfer of microorganisms
onto the wearer by creating a physical barrier. It prevents the skin diseases caused by the microorganisms. The
various medicinal plants found in nature exhibit excellent anti-microbial properties. A new approach is made to
make the textile material antimicrobial using natural medicinal herbal extracts on cotton fabrics. The herbs.
Marigold and Cassia Senna easily available in Tamil Nadu, was chosen for the study. The plant extract was
screened by qualitative antimicrobial test for the presence of active principles. It involves the applications of
Marigold and Cassia Senna floral extracts of the plant onto cotton fabric by optimizing the process conditions-
pH, time and temperature. The fabrics were treated with 50%, 75% and 100% concentrations. Methanol was
used as a solvent for extraction. The extract was applied on cotton fabric by pad -dry- cure method with cross-
linking agents (alum). The treated samples have been tested for activity as per AATCCI47, AATCClOO and
AATCC30 agar diffusion test methods. Fabric property tests for all treated and untreated samples were carried
out, which indicates a little change in the properties. 100% treated fabric was found to be much softer and its
washing fastness was found to be better than all the other treated samples. Antibacterial and antimycotic tests
were carried out for all the treated and untreated samples. 100% Marigold petal and 75% Cassia Senna petal
treated sample was found to be the best of all exhibiting a good dye shade and antimicrobial activity
TSDCFS/Poster/11
Trial for Utilization of Bio-Waste from the Non-Mulberry Silk Industry (AAssama Ww) of Assam
Manjoo G.Mishra ' & Mamta Goswami Adhikar -
1. Selection Grade Lecturer, Department, of Zoology,
Cotton College, Guwahati (Assam)
manjugm2001 @yahoo-com (09864154297)
2. Selection Grade Lecturer. Handique Girls College. Guwahati (Assam)
[email protected], (09954063140)
This paper reports the result on the re-use of pupae, a by-product of reeling which is a bio-waste from
the silk industry of Antheraea assama (Ww). Attempt has been made to utilize this bio-waste to produceeconomically viable product i.e. "Regenerate protein fibres", like other protein fibre produced from casein,
aralac. ardil. zein etc. The attempt of the present investigation will also prevent environmental pollution caused
299
gyrtiri -- .

by the putrefaction of pupae. After reeling the pupae are thrown out as waste which is to the tune of 23,334 tons
(dry weight basis) annually which constitute 60 percent of the dry weight of cocoon. This results in wastage of
potential resource. A systematic study of the chemical components of waste pupae of A.assama were carried
out, protein was analyzed, partially characterized and found to be suitable for producing regenei ated fibres and
attempt was made to utilize the protein extract to produce fibres. The resultant product was tested for
fineness, strength and elongation and compared with other regenerated protein fibres.
TSDCFS/Poster/12
Application of Madhubani Designs for Apparels Using Screen Printing Technique
Ekta Grover' & Shristi Maurya^
1. Assistant Professor, Department of Clothing & Textiles Halina School of Home Science
SHIATS, Allahabad-211007 (UP)
groverektal @recliffmail.com (09450308089/09889908769)
2. Teacher, Dept. of Clothing & Textiles, SHIATS, Allahabad (UP)
India had always been known as the land that portrayed cultural and traditional vibrancy through its
conventional arts and crafts. Every region in India has its own style and pattern of art, which is generally known
as folk art. Perhaps the best-known genre of Indian folk paintings is the Madhubani paintings from the Mithilaregion of the state of Bihar. Traditionally Madhubani paintings were done by hand which was a tedious, time
consuming and laborious process but in due course of time with easy availability of different styles of printing,
these paintings can be done on cloth by using various printing techniques. Hence in the present study an attempt
was made to develop designs inspired from Madhubani paintings of Bihar for ladies kurtis and sarees. Totaltwenty designs, ten each for ladies kurtis and sarees were developed manually and these designs were subjected to visual evaluation for selection of two best designs from each category in order to apply these on
various articles. Screens were prepared for selected designs by photochemical method. Cotton fabric samples
were printed with two classes of dyes namely pigment dyes and poly vinyl chloride (PVC) inks. The printedsamples were subjected to colour fastness testing for selection of best dye to print final articles using screen-
printing. The cost of each product was calculated including the expenditure on raw materials, transport andlabour charges. The sale price was calculated after adding 25% profit to the calculated cost of the products.Final products were printed with PVC colours as this showed best colourfastness. The total cost of printingladies kurtis ranged from Rs. 456.6 to Rs. 469.1; whereas for sarees it wasRs. 1476.27 to Rs. 834.83 dependingon the screens involved and the colours used for printing of articles. All the articles were highly appreciated by
the entrepreneurs and they were also willing to accept these designs.
TSDCFS/Poster/13
AStudy on Purchasing Practices ofMothers Residing in DifferentApartments with Special Referenceto Pre-School Children's Clothing
Shabnam Hazarika', Rumi Saikia Borah - & Malaya Bora'1. Lecturer, Dept. of Home Science, Handique Girls' College, Guwahati (Assam)
[email protected] (09864076192)
2. Associate Professor, Dept. of LPM, College of Veterinary Science,
Khanapara, Guwahati (Assam)
rumisaikiaborah @gmail.com (09957907470)
3. Retd. Head, Dept. of Home Science, Handique Girls' College, Guwahati (Assam)
[email protected], (09954033373)
Knowledge and practices regarding selecting and purchasing of suitable clothing for pre-schooler arefound to be limited in different sections of our society. Considering the importance of studying this aspect, thepresent study was undertaken to study the socio-economic status of the respondents residing in different
300
—it.

apartments of Guwahati city, to find out the clothing purchasing practices of respondents in respect to preschool children and suggest measures, if any, for improving the existing practices of respondents regarding
purchasing of children clothing. The descriptive method of research was adopted. The locale of the study wasGuwahati city of Kamrup district of Assam. Altogether 150 respondents having pre-school children were selectedrandomly. The data was collected with a help of a stmctured, pre-tested, reliable and valid interview schedule
and were calculated using suitable statistical analysis like frequency and percentage. Majority of the respondentspurchased clothing during festivals, and factors considered were price, design and print etc. 100 percent of the
respondents preferred cotton fabric as summer wear. A great majority (96.00%) of the respondents had never
lodged any complaints in the Consumer Court to establish their rights regarding purchasing of children's clothing.
It was suggested that vocational courses on clothing construction should be conducted to develop skills inplanning, selecting and purchasing children clothing. Consumer awareness program should be planned andorganized for the mothers. Orientation programme can be organized by NGOs and Department of Clothing and
Textiles on shopping hints / tips for purchasing clothing especially for young children.
TSDCFS/Poster/14
A Comparative Study of Handmade and CAD Created Textile Motifs & Prevalence of CADSoftware's in Textile Export Units of Jaipur
Inderpal Rai' & Aditi Mertin-
1. Director, K N College. JNV University, Jodhpur (Raj.isthan)
[email protected] (0941414,5249)
2. Researcli Scholar and Guest Faculty, JNV University, Jodhpur (Rajasthan)
[email protected]. (09602648557)
In the era of mass production and mass customization, the world is also demanding an energy efficientmanufacturing practice. This paper aims at comparison between the handmade design and digitalized designs.In the study various experimental abstract CAD designs were developed using Auto CAD and Photoshoptechnique and were compared with handmade designs. On the other hand survey was conducted to study the
prevalence and usage of CAD software's in textile units of Jaipur region. As a result of comparative study
significant difference was observed among both the designs. CAD generated designs scored better in colour,
design and presentation categories and also time consumed was reduced and beautiful effects were produced.Whereas survey finding in Jaipur showed that just 5.33% of garment manufacturing units used CAD systemand 12.5% of home furnishing / printing units used CAD for design development. 84.6% of textiles/ fashiontraining institutes had CAD as their core subject. Thus, it can be concluded through the study that CAD processis economical for customized production and at the same time pollution and fabric wastage can be controlled. Adesigner can produce numerous effects and designs in a short time by incorporating this modernized technology
in their day-to-day designing process.
TSDCFS/Poster/15
Studies on Repeated Dyeing of Silk with Red Sandalwood Using Selective Mordants
Dcepali Singhec' & Ipshita Chalerjee -1. Principal & Reader. Textile & Clothing Section,
J. D. Birla Institute. Kolkata (West Bengal)
[email protected] (09531040390)
2. Ex-Student, M.Sc in Compo.site Home Science.
J D Birla Institute. Kolkata (West Bengal)
The draw backs of synthetic dyes based on limited and irreplaceable petro-chemicals have prompted
environmentalist to look for eco-friendly products and technologies. In tlie recent years a number of studieshave been carried out to study the different methods of application of natural dyes on various natural as well as
301

synthetic fibres, using various mordants by different routes. However, not much has been appraised regardingways of obtaining darker hues which is difficult to achieve with most natural dyes, or ways to improve thefastness properties of textile materials dyed with natural dyes. Further, very few studies have reported the useof natural mordants. Most natural dyes have to be used in huge quantities to get an appreciable depth of shade.
This along with relative high cost of the natural dyes makes the process economically unviable. Thus, with anobjective to reduce the amount of dye required to get an appreciable depth of shade, degummed silk fabric(100% mulberry silk) was pre-mordanted with different mordants in various concentrations followed by dyeingwith different amounts of red sandalwood by the exhaust method. Additionally, for comparison purpose thesame sample was repeated dyed (twice & thrice) to appraise whether such treatment could improve thefastness and the depth of shades thus produced. Repeated dyeing of the pre-mordanted silk fabrics yieldeddarker shades with improved wash and rubbing fastness. Among the mordants, ferrous sulphate in variousconcentrations imparted darker shades, while the shades obtained with stannous chloride and aluminium sulphate(alum) as a mordant were duller in comparison. It was also found that pomegranate rind could.be used as a
mordant to improve the fastness of silk when dyed repeatedly in multiple stages as it gave satisfactory results.
TSDCFS/Poste/16
Sari - A Rite of Passage
Armaiti Shukia
Selection Grade Lecturer, Dept. of Textile & Apparel Design,
SVT College of Home Science, SNDT Women's University,
Sir Vithaidas Vidya Vihar, Santacruz (W), Mumbai (Maharashtra)
[email protected] (09920135123)
A sari is traditionally perceived as a symbolic icon. It was first worn by a girl on the commencement of
her menstrual cycle. This was an occasion of celebration and a milestone for the young girl. Draping the sari
was thus used as a rite of passage from girlhood to womanhood. In a cosmopolitan metropolis like Mumbai the
rituals surrounding this milestone are slowly dying away. Mumbai is slowly being enveloped by the styles andtastes of the western milieu. The vast choices in dressing styles, extensive daily commuting and increase in
educational levels are slowly pushing the ritual of the first draping of a sari to a later date. Thus, with the
objective of exploring and understanding the changing perspectives of teenage girls towards the sari a qualitative
study was undertaken in the western suburbs of the city of Mumbai. This paper seeks to relocate the sari not
only as an essential in a teenage girl's wardrobe but also as an instrument used to cultivate her identity, as a
platform for negotiations, as a statement or simply to honor a rich heritage.
302

"Books are not made forfurniture,
but there is nothing else that
so beautifully furnishes a house. "

"All books are divisible into two classes,
the books of the hour,
and the books of all time."

SPONSORS


With Best Compliments
Vasundhra
Arts & Prints Pvt. Ltd.
Mr. Pramod Nahata
Vasundhra Arts & Prints Pvt. Ltd.
59,Suren Sarkar Road
Near Beliaghata Jora MandirKolkata - 700 010
Ph No.23633639
With Best Compliments
Name
Occupation
Contact No.
Office No
Address
Ravi Shankar Agarwal
Share Broking
9830278222
033-22131373
21 Hemanta Basu Sarani
5 Floor R-507
30.S

ENVIROMENTAI CONSULTANTS
280. B. B. Ganguly St. Kolkata -0700 012 Ph/Fax : 22365592
Wishing All The Students & Participants - Taking Part In The Forth Coming"28'''. Biennial National Home Science Conference" To Be Held At Kolkata
Hosted By:}. D. Biria Institute, Kolkata
A Great Success With Prosperity & Good Luck
With Best Complements From :
Mr. Arup DasguptaProprietor
ENVIRONMENTAL CONSULTANTS
A House Of Environmental Solution In Respect Of Industries Etc.Organisation Nominaied For
"Nation's Industrial Excellence Award 2003"
Organised By Indian Organisation for Commerce And Industry, Delhi.
Office : 280. B. B. Ganguly Street. 1-'. Floor. KolkaUi - 700 012Contact No. Tele Fax : 033 2236 5592
Cell No. : 99039 14480/98319 15040
For Correspondence : Block - 15. Type - Iv. Flat No. 8, Hrbc Housing Estate.Dumurjaia. Howrah - 711 101
Ph : 0333291 2285 / 0332667 1498
NIPPO(BATTERIES / TORCHES & RECHARGEABLES )
GLIDE(INTERNATIONAL SHAVING SYSTEMS)
NUBY/Purple
Turtle/GoodBaby(BABY CARE PRODUCTS)
5, COMMISSARIAT ROAD, HASTINGS, KOLKATA - 700 022Phone : 2223 - 4133/4262 , Fax :2223-4132
E-mail - [email protected]
Head Otrice : P-17 MISSION ROW EXTN., KOLKATA - 700 013
.t()6

With Best Coniplhuents
SARAT BOOK DISTRIBUTORS
18 B Shyamacharan Dey Street
Kolkata 700073
Ph: 2241 8389
Fax: 2241 8060
E-Mail: [email protected]
Website: Www.Saratbookhouse.Com
With Best Conipliinents
MR. RAMESH KHEMKA
M/S Furnishings
53, Budhanagar
Bhubaneshwar-751006
Ph no." 9437033280
307

w
With Best Compliments
MR. MILAN AGARWAL
17/lc Niharika Building,
Flat 302, Alipore Road,
Kolkata-27
With Best Compliments
MR. MANISH DHANUKA
522/l/A/l Srirampore(Mahe.sh)GTroadKolkata 712201
Ph no.- 9830024243

Jl
A' With lic'st Coniplunents
Mr. Sachin Bhansali
Adhunik metaliks Ltd.
2/1A Sarat Bose Road,
Lansdowne Tower
Kolkata - 700 020
Ph no." 9831700132
With Best Complituents
Mr. Sanjay Jhunjhimwala
TURTLE LTD.
2()A. Round Tank Lane
Kolkala-71111()l
Ph no.-9831044388

A WELL WISHER
DEVANSHISAREES PRIVATE LIMITED
154,Foreshore Road,Ramkristopur,
Howrah -711101
Ph-2641 -6590,2641 -6591,2223-2844(R)
Fax:-i-91-033-2640-0763
Email: Gauts 111 @ Yahoo. Coin if
With Best Compliments
Mr. Riyazuddin Khichh
Joy Guru Granites & Marbles Pvt. Ltd.
1/3 Mahendra Roy LaneKolkaia-17
Ph no.- 64182932. 983(820570
310

With Best Compliments
k-
Mr. M.P. KhaitanENGINEERS & CONTRACTORS
15. Ganesh Chandre Avenue
Kolkata 700013
Ph no.-22112647/9874
With Best Compliments
Mr. Chittranjan Choudhury
CDC Printers Pvt. Ltd.Tangra Industrial Estate-II (Bengal Pottery)
45, Radhanath Chowdhury Road
Kolkata-700 015
Tel: +9133 2329 8856
Fax;+9133 2329 8858
E-mail : [email protected]
• • ■311

;u '.'/TlTO??
O' CRtATP-t
Zee Institute of Creative ArtsNow in KOLKATA
Zee Inslitule of Creative Arts (ZICA) is the nalion's first full-fledged classical and digital
animation training academy and a division ot the Zee NeUvork Education Group
ZICA offers industry relevant job oriented courses
Animation
Gaming
Visual Effects
VolW
jan«°5y.2010
wvaitable
To register for a free Seminar and workstiop onCareers in Animation call:
033-40065644 / 2282 0123 / 0124/09331720675
E-mail: [email protected]: Camac St. and in Sector V
WWW ̂icdKolKata Org
Refer a friend and receive
Rs. fiOfi.noconejtUons & /estnclioni,
With Best Compliments
Mr. Akshay Jain
Ultratech Cement Ltd.
UltraTech
The Engineer's Choice
Dr. U.N.Bruhmachari Street, 7"' Floor
Constantia, Kolkata 700017
Ph No.- 9830126070
.112

With Best Compliments
Mr Vijay Siroiha
M/S Maheshpur Tea Co Ltd.
16, Bondfield Lane
Kolkata -700 016
With Best Compliments
Mr. Sumit Agarwal
Dollar Industries Ltd.
313

With Best Compliments
Mr Hatim Lakdawala
HUSAMI STORES
35 Netaji Sudhha RoadKoIkata-700 00!
Phone: 033-30289641/42/43/44
With Best Compliments
Mr. Vijay Singh Sethia
Shringar Gem And Jewellerys Pvt.Ltd.
28b,Rowland Road ,1" Floor
"Radhaniketan"
Kolkata - 700 020
314
. - --

With Best Coniplinwnts
Nabonita Das
E/14 Housing Estate
Baltikuri Quaiters,
Howrah-711 113
With Best Co/npli/nents
M/S Henna Leather
Flat 47, Calcutta Leather Complex,Bantaia-Kai7aciana, Kolkata
315

With Best Compliments
MS. NABONITA CHAKRABORTY
MR. SHIV SHANKAR CHAKRABORTY
With Best Compliments
MR. RANJAN SARKAR
Shyampiir
Sarkar Para
Budge BudgeKolkata - 700 137
316

With Best Compliments
Mr. Sankar Ghosh
M/s Screen Complex (Printing Press)
43,Anjuman Ara Begum Row,Kolkata-700033
With Best Compliments
MR. ASHOK PODDAR
CLASSIC INTERNATIONAL KOLKATA
.^17

roEAL TRADERS
Manufacturers of:-
Concrete Vibrators & Mixer & its Parts
Address
71-C Netaji Subhas RoadGooptu Mansion, P' Floor
Kolkata-700001
Mobile : 0983148030009836709552
Tele + Fax : 033-22433080
Prakash Singh
PRAKASH ROADLINK CORPN.
31, Prasanna Kumar Tagore Street
Kolkata-700 006
Tel : 2259 0303 / 2961, 3096 7413 (O)
Mobile: 9331041968
318

RESRVE BANK OF INDIA
www.rbi.org.in
Raj at Kumar GhoshAssistant Manager
Department of Administration & Personnel Management15. Nctaji Subhas Road, Kolkata - 700 001, INDIA
Tel : (033) 2230 8331, Ext. 6686
Fax:91-33-22309589
E-mail: [email protected]
HOUSE OF INDUSTRIAL MACHINERY
Ralll Wolf AIRMATIC• M-» um «• *ni«
OUALITT AS NCCDBO
r a I DiiupQ ESAB GAS & WELDING EQPTS 1
&. Sons
138, Canning Street (Ground Floor), B.R.B. Basu Road,Kolkata-1, Phone: 2243 8554, Telefax; 2243 8556 ,
Mobile: 9831681922, Email: yusufally [email protected] I
We are pleased to imiodiice oui-selves as stockist for Workshop, gtuage& industrial tools.We are the authorizeddealers lor Makita pt^wer t«H>ls. Rail) woll", Bosch & Dewalt.For welding cquipnieni we ;iie dealeis of ESAB &ARC-TEC welding machines and electrode.
APPIJCATION - C \insiiuct ion Works. Fabrication of Steel Industry, Wood working Industries & GarageTools. Industrial & Donicstic Pumps. All types of Industrial Machinery.
3iy

Mobile : 98301 19263
NEW BARRACKPORE NURSHING HOME
+
DR. BRINDABAN DAS
52(39), B.T. ROAD, TALPUKUR
KOLKATA- 123
With Best Compliments
Mr. Kanhaiya Lai BeriwalDirector
K. L. Jute Products Pvt. Ltd.
205, Rabindra Sarani Kolkala -700 007 (India)
22. Canning Street, Kolkala -700 001 (India)E-Mail:[email protected]
OITice: 22421681/82
Residence : 23200574
Mobile:9831011300
320

With Best Coiupliinents
Md. Ashfaque
Crown Cinema
Rafi Ahmed Kidwai Road
Kolkata-700016
SHRABANPS BEAUTY SALON
4'hrabani'An exdulle l^nfH«are Centre for Ladies
OPEN ALL DAYS • CREDIT & DEBIT CARD ACCEPTED
MATRIXLOreal . {nwii f/itfft
I A. Rashhchari Avenue, Kolkata - 70 029
(Near Basanti Devi College)Contact #98300 18610
Timiims; 10:30 AM to 7:30 PM
?2\

l\h(fi Bust CompRments'l'nym.
PLYWOOD
Chalta Rahe....
Lir<lttc>
INDIA'S LARGEST INTERIOR
INFRASTRUCTURE COMPANY
SHANTINIKETAN BUILDINC.
8. CAMAC STREET, 3rd FLOORROOM NO.-«. KOLKATA-700 017
Phono : 91-33-30S2 2246/46
Fnx : 01-33-3051 6010
With Best Compliments
PRAMOD GOENKA
Father of Prachi Goenka
M.Sc H.D. (Part 1)
Sponsored 50 Water Jars.
.^22

With Best Complinienis
SWATIBALASARIA
Yoopet bottles (SOOmi each)
FN Department,
Final BSc.
Ph no: 9007103531
With Best Conip/i/nents
ARCHANA CHOUDHARY
Yoopet bottles (SOOml each)
FN Department,
Final BSc.
Ph no: 9007103531
■ 'Sii ■ -l'

With Best Compliments
SURESH KUMAR AGARWAL
Father of Tiilika Agarwal
M.Sc-H.D. (Part 1)
Sponsored 400 Water Bottles.
With Best Compliments
PriyaFood Products Limited
Suchi AgarwalB.Com 3"' Year
324

With Best Compliments
Mr. Pramod gupta
Sujata Biscuits
From:
Shradha Budhia
Textiles & Clothing SectionFinal B.Sc
Ph no : 9874961043
With Best Compliments
Kamal Kumar Khandelwal
Father of Shikha Khandelwal
M.Sc H.D. (Part 1)
Sponsored 7kg Tea Leaves.
325

UNO Sera Tbuen
With Best Compliments
Mr. Vijay Kumar Bansal
Tblsyan NEC Ltd.
APEX PLAZA
1st Floor
3, Nungambakkam High RoadChennai - 600034
32r.

Ramesh Kumar Narwani
ONEfSTOP SHOP FOR SAI^
Shop No, 1. 2, 3 & 4 ® ]4, Sudder Street
(Beside Globe Cinema) Modge Lone, Kolkata - 700 016Tel : 2249 6160, 2249 6991, 3028 0186 o Fox : 033-2217 1315
E-mail : [email protected]
With Best CoiiipUnients
Mr. Jai Bangani
BGM Consortium Ltd,
224, A. J. C. BOSE ROAD
KOLKATA - 700 019
Ml

With Best Compliments
MS. SONI KHANDELWAL
15G, Dr. Deodar Rahaman Road
Kolkata - 700 033
DONATE BLOOD SAVE LIFE
REGISTER WITH; WWW.webbloodbank.orgFOR THALASSEMIA PATIENTS
32S

With Best Compliments
P.D. PRASAD & SONS PVT. LTD
POP INTERNATIONAL LTD
POP CONTAINER LINES
Govl. Approved : Shipping, Air, Land & Nepal, Bangladesh
Facility : 'IVansport, Insurance, Claims & Warehouse destufflng, Stalling Facility
Your Partener in East Coast of India
A Professional managed company offering services to shipowners, Exporters, and Importers
Regd. & City Office:-2. N.C. Dutta Sarani
'Sagar Estate', @Nd FloorUnit No> 12 & 21-22
Kolkata- 700001
Tel: 2230-6242/3143Fax:2220-6248
Email : [email protected]
Allow us to Exceed Your Expectations!! 943?3n224Human development dept
With Best Compliments
Sumitra Roy
Nabamita Bhattacharya
Sanjib Dasgupta
238, Maniktala Main Road
Kolkata - 700 054
320

With Best Compliments
Mr. Ajit Singh Kochar
M/S. SPECTRUM ENTERPRISES
Old China Bazar Street
Kolkata - 700 001
With Best Compliments
Ms. Sriparna Chakraborty
M. Sc. Part I
Food & Nutrition
184C, Bacharam Chatterjee Road
Behala
Kolkata -700027
330

With Best Cotupliments
SOUMEN LAHIRI
Hillview, Asansole
Burdwan 713304
With Best Couiplimeuts
MS. POOJA KHAN
M. Sc. Part I
Food & Nutrition
120B, Ranikuthi Tollygunge
Kolkata-700 040
Hki......

With Best Compliments
MS. RUPINDER KAUR
M. Sc. Part I
Food & Nutrition
1/A, Shiv Krishna Daw Lane
Kolkata - 700 007
With Best Compliments
MS. KHUSHBOO AGARWAL
PGDDAN
332

With Best CompUnieiits
MS. DAMANJEET KAUR
)
With Best Coiuplinients
M. Sc. Part I
Food & Nutrition
G P G Lane. Chetla
Kolkata-700 027
MS. TANIA DAS
PGDDAN
Chhy anir Appartment,
65, Pioneer Park, Barasat
Kolkata-700 120
333
I
. t

With Best Compliments
MS. MAHEK GUPTA
PGDDAN
With Best Compliments
Mr. S. R. Mukherjee
RILAXONCoir and Felt Divn. of Gujrat Composite Ltd.
14 Netaji Subhas Road
Kolkata-700 001
Contact: 98300 75593
334

■ V-vV
With Best Comp/iments
I -"! }
TRISHAKTICOMMERCIALPVT. LTD.
f
2, Indian Exchange Place,
Kolkata-700 001
With Best Compliments
SUNNY CREATIONS
25 A, Cama Street
Vardhan Mai'ket
2nd Floor, Shop No. 247
KoIkata-700016
335
All.:'

With Best Compliments
Mr. Sonu Choudhary
TRUWOOD CONNECT
25,Blagk Lane
Kolkata-700 012
With Best Compliments
MS. RACHNA SUMAN SHAW
PGDDAN
33(->

ABACUS &§GlP BRAIN GYM
CREATING INTELLI<5ENCE
WHOLE BRAIN DEVEl.OPMENT PROeRAMME FOR CHILDREN IN THE A(3E
GROUP OF 4 TO 13 YEARS AT BEHALA AND KHIDDERPORE CENTRE
CONTACT NISHA KUMAR-9830633041, 9830030685
With Best CoDipliuients
TRIPS INDIA
336/21/1, N. S. C. Bose Road
Kolkata-700 047

With Best Compliments
INDIAN SILK HOUSE AGENCIES
With Best Compliments
ALUMNI ASSSOCIATION
of
J D Birla Institute
338

With Best Complinwnts t '11
Mr. Vivek Kathotia
M/S. FORT GROUP
OUPThe Fourth Dimension of Space
Wit/i Best Conip/iments
Mr. Basudev Bagchi
PRAYAG GROUP OF INDUSTRIES
GROUP
334

With Best Compliments
Mr. Surendra Singh
SINGH MEHANDI INDUSTRIES
0
Si©
naHSINQH M€HANDI INDUSTRtSS
With Best Compliments
Mr. Arjun Santhalia
SPS STEELS ROLLING MILLS LTD.
ELEGANTS T E E L
70?0' SM8.SPSl0 67^
INDIA'S NUMBER ONE QST BAR
340

With Best Compliments
Mr. Vijay Goyal
DRIVE ENGINEERING PVT LTD
2AB Ambika Garden,
23 Raja Santosh Road, AUpore
Kolkata-700 027
With Best Compliments
Mr. Rajat Kejriwal
SHREEPRIYA EXPORTS
27, Mirza Ghalib Street, 2nd Floor
Kolkata - 700 016
341

With Best Compliments
MS. ANUSHI PARAMANIK
AARA
54, Chowringhee
Kolkata- 700 071
With Best Compliments
Ms. Keshab Saha
M/S. SAHA ENTERPRISE
58B, A. P. C. Road
Kolkata-700 009
Ml

With Best Compliments
Mr. Kuntal Patra
HITECH SYSTEM
43/7, KM Lane, Salkia
Howrah - 711 106
A
Well
Wisher
343

With Best Compliments
^Swastika Enterprises
CAST JRON founders &E N G
MOOMi MCOiMY
IS: 1726
y STQM003 CH1521MS2
Jabakusum House,2nd Floor34, Chittaranjan Avenue, Koikata-700 012Phone : 2212-0019/1086,Fax: 2212-1797
E.mall: [email protected][email protected])Website: www.swastikaenterprises.com
SINCE 35 YEARS. MANUFACTURING & SUPPLYING SWASTIKA BRAND
SANITARY G INDUSTRIAL CAST IRDN CASTINGS.
: ITEMS MANUFACTURING BY US
1. Swastika Brand ISi Marked Cast Iron Manhole Cover
Wrth Frame as per 15:1726:1991.
a) Circular Cover with Square Base (Frame ]
b) Rectangular Cover.
c) Square Cover.
2. Swastika Brand C. I. Cover With Frame( Single Seal).
a) Round Cover with Round Base (Frame)
b) Rectangular Cover.
c) Square Cover.
3. Swastika Brand C. I. Cover With Frame (Double Seal).a) Round Cover with Round Base (Frame)
b) Rectangular Cover.
c) Square Cover.
4. Swastika Brand Lamphole Type Cover with Frame.
5. Swastika Brand Overhead Tank Cover with Frame.
6. Swastika Brand Hinge Cover with Frame.
7. Swastika Brand Recess Type Cover with Frame.
8. Swastika Brand Circular Cover wth Sqr. Frame
(Vented Type in the Middle of the Cover)
9. Swastika Brand Foot Steps.
10. Swastika Brand Hinge Gratings.
11. Swastika Brand Gully Gratings.
12. Swastika Brand Surface & Valve Boxes.
13. Swastika Brand Eartii Plate & Pit Cover.
14. Cast iron Transformer Housing Boxes for Airport
Runway.
15. Industrial & Others Castings as per Customer's
Drawings I Speufications.
H it
STRICT QUALITY CONTROL OF RAW MATERIALS USED & FINISHED GOODS PRODUCEDWe have our own Physical & Chemical Laboratories up to date calibrated for testing our products
Factory : 58/11. Netaji Subhas Road, Liluah, Howrah-711 204, Telefax : 2645-4312
344

rriaUing hhe luorld our Family
• c
ikb f •!
A Govt. recognised Export House & Star Exporter
345

sherwoodESTATE
The best place to live lifeDcvalspan Maikalad by
srijan IHERITME | I^K 98302 I 21 21I l*|ft6ALTr GROUP
SHERWOOD ESTATE DEVELOPERS
207 A. J, C. Bose Road
Kolkata - 700 017
www.sherwoodestate.com
STIES
Sherwood Estate, 169 N.S.C. Bose Road
Sherwood Estate Classic, 46 Vivekananda Sarani
Sherwood Estate Elite, 64 Mvekananda Sarani
Sherwood Estate Premium
138 Vivekananda Sarani, Narendrapur
Kolkata - 700 103
346

With Best Compliments
RUMPA NAYAK(1st Year, Food & Nutrition)
347

With Best Compliments
Mrs. Usha Maheshwari
NIKHAAR PARLOUR
348

U)
Ji.
>o
m
Sherwood Estate Kckoid
Greenfield Cit
y K^
-aio
Srijen Midlands
Snja
n He
rlta
gd Enclave Kohsta
buil
ds tomorrow... today.
Continental Koruia
PS Sr
tfan Tec
h Pa
rk (f
T Pa/k) K
ekai
a
Gala
xy Mall As
ansa
The Grand Chennal Cno-ra
Srij
an bel
ieve
s in Integrating creativity, o
xoer
lenc
e
and
technical ex
pert
ise Into the
mos
t extensive
vari
ety o
f high qua
Bty pr
oper
iies
. Fro
m Re
slde
nlla
l
dream homes to superior Com
morc
ioi hu
bs.
Inirastruclures. (T zones, TownsKps to
futfit
spe
dflc
as well as multl-utllity desires. Sh
apin
g a vis
ion
sparkling with hopes, aspirations and pr
ospe
ct.
Buil
ding
Ide
as fro
m beyond tomorrow... tod
ay.
I
^ijan
Srijan Healt
y Lt
d.Sn
jon It
ouse
36/1A Bgin Road, Ko
lkat
a 700 020
Phone: 033 40401010
Mobile: 00300 93135
e.tTial; ea
ieeesrijanrealty.com
uuw.
snja
nrea
ltv.
com

i:'...A,vjrwWipSgtOUp.in- ^-■-',-I^.'.:^--, - . - ■..W
tr:.L • v.-i- ••/ -•B
J'S to launch: a School of Business and
.-V .^■r- • •
i-i 1 . •••-i J.j K.*?^t'v 1^*'f',- • •
C ' 4i. .--*«•* •'v
'-0 ^ • '■ ^- ■
Masseom bii its
r' : ^ ^ -Cpreating landmarks of.distinction was .what PS^Group set out to do in ;•the year 198,5. Over 120 projects Undertaken and completed on,time during ,
t i- ' r Oie last-25 years in Koikata and other parts of the country (Chennai, Colmbatore,f->— > : Pune, Deihi) and abroad (Colombo, Sn Uanka) stands testimony to their
;,' : dedication to meticulous olannino and execution. From luxurious hiahrises to ■
' i"' ::^Xheir'ciient's listlist comprises of the who's who of.the city viz. families of Sri . ;•";hflhrirfl Rariie I nrH'.R-P .RInha Rlr M W .Rirrar :Maharaia v>f:' . ; Prarhathesh. Chandra Barua, Lord :S.P. Sinha, Sir N.N. Sircar, Maharaja of
' j ' •'' V ' Natdre, Maharaja.df Santosh, Mrsr-Suchltfa Sen; etc. ' ^
r . -'- their mission Is to becdrfie- not dnlv the bido'est. but the-most rpssnected - ^' ' ! • - i.
f; ; . ; ' js basically,an empowerment prograrnrhe for youngsters living in the city's . '' ' ■ ■ ■ slums.and 'Supersoft! which is a soft skills training,programme for making ^ ^
■ ' young boys and glrls-better human'.beings,■-effective cbmmunicators.-and ,'-v=/•,!';J -;:'"industry rsady (erhployable). ' ' - ! . • • ! • ''--r
i ' -- •■ •• /: : •:
are in the process :bf starting from thenekt academic year Uwdrid'dasf' ; .'^.; ;'!^^^^^^^^i V ! •' ■ • ' School.for Business & Eritreprerieurship and Media & Jdurnalism to be called •. ^ •: •
1 in".-ii
SI
, • ■ • ■- .. ' -I' V -p-n^S
ROUPDoveloping Properllos * Building Homes
I.
Trinity Tower, 83 Topsia Road (S), Koikata 700046, jndla- i ■ i 'T: 91.33.2285 2285, F: 91.33,2285 2539 ^ •
Js\
I 'si? li
M
19

LEADINSTITUTE OF LEADERSHIP
ENTERPRENEURSHIP
& DEVELOPMENT
Where successful entrepreneurs along with world renowned professors would take classes."
Offering the best Post Graduate
Business Management & EntrepreneurshipDevelopment programme for Home Science students.
The insrinitf is lociuctl within the most upcoming part of the Kolkata i.e. on thePark Street coiinecttir in Topsia.
It would be centrally air conditioned and have state of the art infrastructure such
as Wi-I-i connectivity, very well stocked library (8000 Books and 6000 AudioVisual Program to start with) with access to the world's best digital libraries.Every student would be provided with a laptop (at a concessional price).
The Campus would comprise of .^0,000 sft. of built up area Including a state-of-the-art auditorium, conference moms. Studio, Student Activitj' Area (comprisingof Gym, Amphitheatre, Coffee Shop, Canteen, Dance floor etc). Every classroom would have audio visual presentation facilities.
The institute already has a tie up with over 130 Internationally acclaimedAcademicians, bxlucationists. Research Scholars, Professionals working in wellrenowned universities and Corporates within and outside India to be visitingfaculties. Similar arrangement has been made with IAS officials and CMDs,C.liCs & Cl-O's, 1 IR professionals working with the top companies in Kolkata.
The institute already has a collaboration with some of the world's best
entrepreneurship development initiatives such as those promoted by TIE, CII,National E.ntreprcneurship Network, Indian Innovation Center etc. to be able
to facilitate students who would like to launch companies of their own and
become cnireprcneurs.
Senior Scientist'Award
at 28th Biennial National Conference of Home Science Association oflndia
is sponsor by
Institute of Leadership Enterpreneurship & Development (ILEAD)
Trinity Tower, 83. Topsia Road (South), Kolkata 700 046, India,Phone: +91-33-2285 2285 Fax: +91-33-2285 2339, e-mail; [email protected]

Warid's Gold Standa/d
black green
You may be surprised to know that black tea
provides you many of the benefits you may
have associated only with green tea. Truth is.
both are packed with antioxidants that play
a role in lowering the risks of cancer,
cardiovascular diseases, gastric ulcer, high blood
pressure and high blood sugar, Green tea is not
oxidised, black tea Is fully oxidised and both have
health giving properties. And if you drink black tea,
like most of us in India do, good for you.
Because the more you drink tea, the better
for your well being. Cheers!
Chai piyo mastjiyoTEA BOARD OF INDIA www.teaboard.gov.ln
/JfM
4309.2009 .
H