ChlorophyllaFluorescence Induction in Higher Plants: Modelling and Numerical Simulation
21
J . theor . Biol . (1998) 193, 131–151 Article No . jt980692 0022–5193/98/130131 + 21 $30.00/0 7 1998 Academic Press Chlorophyll a Fluorescence Induction in Higher Plants: Modelling and Numerical Simulation A S,*† G,‡ B J. S* R J. S* *Bioenergetics Laboratory , University of Geneva , CH-1254 Lullier -Jussy /Geneva , Switzerland †Department of Biophysics , University of Bucharest , R-76900 Bucharest , Romania (Received on 22 December 1997, Accepted on 17 February 1998) Chlorophyll a fluorescence induction is extensively used as a probe of photosynthesis, and thus, it has become necessary to quantitatively analyse it to extend its usefulness. We simulate the experimental data of fluorescence transients in strong light through numerical integration, both in dark- and light-adapted plants. In the mathematical model used here we have considered for the first time the redox reactions at both the acceptor and the donor sides of photosystem II, and the non-photochemical quenching by the oxidised plastoquinone molecules from the lipid matrix of the thylakoid membrane. The model is based on assumptions established in the literature and also the values of input parameters used in simulations. The simulated fluorescence induction curves show the characteristic O : J : I : P steps as in the experimental ones and, in specific conditions, the presence of a dip (D) between the I and P steps of the transient. Moreover, it has been shown here how typical patterns of fluorescence kinetics are influenced by the state of the sample by studying the basic effects of the influence of some parameters [i.e. the connectivity between different PS II units, initial QB:Q - B ratio and the ratio of the starting states of the oxygen evolving complex (S1 :S2 ), number of plastoquinone molecules in the plastoquinone pool, initial redox state of the plastoquinone pool, and the rate of plastoquinol oxidation]. In this way the information can be drawn from the experimental curves relative to these parameters. 7 1998 Academic Press Introduction Chlorophyll a (Chl a ) fluorescence induction observed in plants, algae and cyanobacteria, known also as the fluorescence transient or Kautsky effect (Kautsky & Hirsch, 1931), has been extensively studied (see reviews, Govindjee & Papageorgiou, 1971; Papageorgiou, 1975; Fork & Mohanty, 1986; Krause & Weis, 1991; Dau, 1994; Joshi & Mohanty, 1995; Govindjee, 1995). It consists of light intensity dependent polyphasic changes in Chl a fluorescence emission when a dark-adapted leaf, or a suspension of isolated chloroplasts or intact photosynthetic cells, is illuminated with continuous light (see Fig. 1, curves 1 and 2). In the first phase of the transient (time-scale from zero to one or several seconds, depending on the light intensity) the fluorescence intensity rises quickly from an initial low value, F 0 (the O level), to a higher one, F P (the P level). Under low light, fluorescence rises to an intermediary step denoted as F pl (curve 1, Fig. 1), but under high light, typically over 500 W m -2 , two intermediary steps designated as F J (the ‘‘J’’ or the I 1 level) and F I (the ‘‘I’’ or the I 2 level) normally appear (curve 2, Fig. 1; see Strasser & Govindjee, 1991, 1992; Neubauer & Schreiber, 1987). The F P level becomes saturated from 100 Wm -2 and is then denoted as F M . A dip between I and P is sometimes present in fluorescence transients and is labelled as D (Munday & Govindjee, 1969). It is well established now that the variable fluorescence F V (t ) [defined as F(t )- F 0 , where F(t ) is the fluorescence intensity at any time t ] is related ‡ On sabbatical from Department of Plant Biology, University of Illinois, 265 Morril Hall, Urbana, IL 61801, U.S.A.
-
Upload
independent -
Category
Documents
-
view
2 -
download
0
Transcript of ChlorophyllaFluorescence Induction in Higher Plants: Modelling and Numerical Simulation
J. theor. Biol. (1998) 193, 131–151Article No. jt980692
0022–5193/98/130131+21 $30.00/0 7 1998 Academic Press
Chlorophyll a Fluorescence Induction in Higher Plants: Modellingand Numerical Simulation
A S,*† G,‡ B J. S* R J. S*
*Bioenergetics Laboratory, University of Geneva, CH-1254 Lullier-Jussy/Geneva, Switzerland†Department of Biophysics, University of Bucharest, R-76900 Bucharest, Romania
(Received on 22 December 1997, Accepted on 17 February 1998)
Chlorophyll a fluorescence induction is extensively used as a probe of photosynthesis, and thus, it hasbecome necessary to quantitatively analyse it to extend its usefulness. We simulate the experimental dataof fluorescence transients in strong light through numerical integration, both in dark- and light-adaptedplants. In the mathematical model used here we have considered for the first time the redox reactionsat both the acceptor and the donor sides of photosystem II, and the non-photochemical quenching bythe oxidised plastoquinone molecules from the lipid matrix of the thylakoid membrane. The model isbased on assumptions established in the literature and also the values of input parameters used insimulations. The simulated fluorescence induction curves show the characteristic O : J : I : P stepsas in the experimental ones and, in specific conditions, the presence of a dip (D) between the I and Psteps of the transient. Moreover, it has been shown here how typical patterns of fluorescence kineticsare influenced by the state of the sample by studying the basic effects of the influence of some parameters[i.e. the connectivity between different PS II units, initial QB:Q−
B ratio and the ratio of the starting statesof the oxygen evolving complex (S1:S2), number of plastoquinone molecules in the plastoquinone pool,initial redox state of the plastoquinone pool, and the rate of plastoquinol oxidation]. In this way theinformation can be drawn from the experimental curves relative to these parameters.
7 1998 Academic Press
Introduction
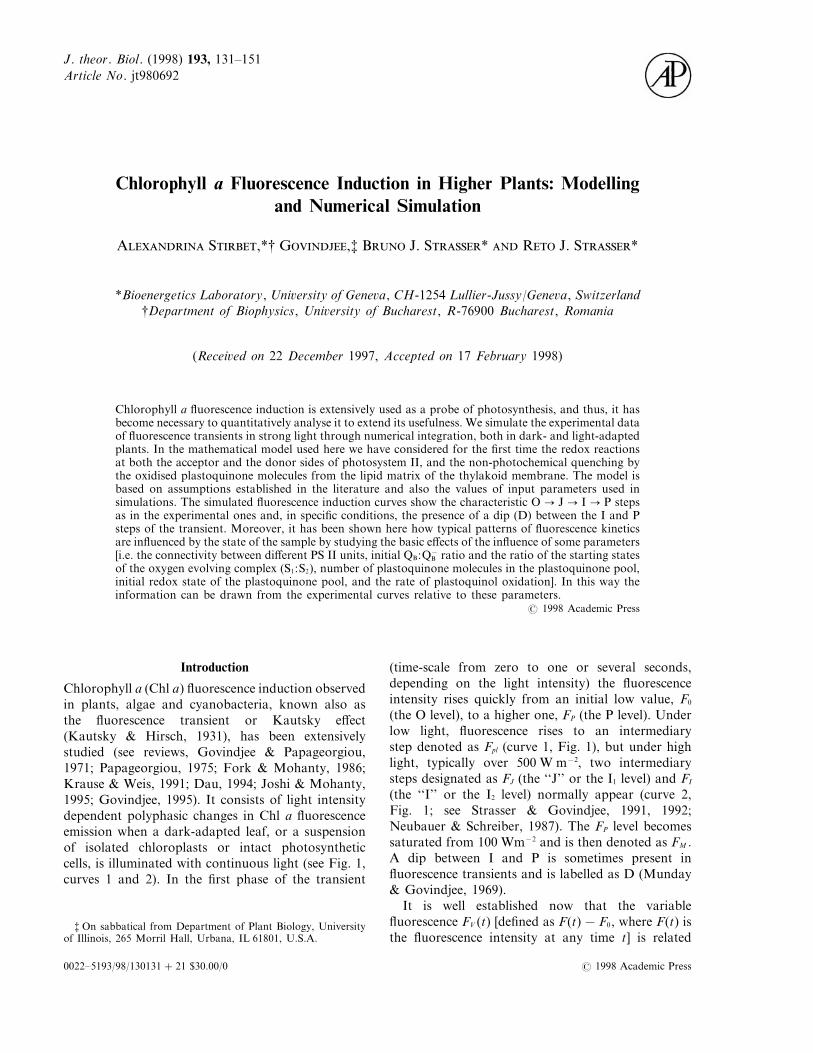
Chlorophyll a (Chl a) fluorescence induction observedin plants, algae and cyanobacteria, known also asthe fluorescence transient or Kautsky effect(Kautsky & Hirsch, 1931), has been extensivelystudied (see reviews, Govindjee & Papageorgiou,1971; Papageorgiou, 1975; Fork & Mohanty, 1986;Krause & Weis, 1991; Dau, 1994; Joshi & Mohanty,1995; Govindjee, 1995). It consists of light intensitydependent polyphasic changes in Chl a fluorescenceemission when a dark-adapted leaf, or a suspensionof isolated chloroplasts or intact photosyntheticcells, is illuminated with continuous light (see Fig. 1,curves 1 and 2). In the first phase of the transient
(time-scale from zero to one or several seconds,depending on the light intensity) the fluorescenceintensity rises quickly from an initial low value, F0
(the O level), to a higher one, FP (the P level). Underlow light, fluorescence rises to an intermediarystep denoted as Fpl (curve 1, Fig. 1), but under highlight, typically over 500 W m−2, two intermediarysteps designated as FJ (the ‘‘J’’ or the I1 level) and FI
(the ‘‘I’’ or the I2 level) normally appear (curve 2,Fig. 1; see Strasser & Govindjee, 1991, 1992;Neubauer & Schreiber, 1987). The FP level becomessaturated from 100 Wm−2 and is then denoted as FM .A dip between I and P is sometimes present influorescence transients and is labelled as D (Munday& Govindjee, 1969).
It is well established now that the variablefluorescence FV (t) [defined as F(t)−F0, where F(t) isthe fluorescence intensity at any time t] is related
‡ On sabbatical from Department of Plant Biology, Universityof Illinois, 265 Morril Hall, Urbana, IL 61801, U.S.A.
6
5
4
3
2
1
10–410–5 10–3 10–2
FP
FP
FI
123
Fpl
FJ
FO
10–1 100
Time (s)
F(t
)/F
0
. .132
F. 1. Fast Chl a fluorescence induction curves (fluorescence asa function of time—from 50 ms to 1 s) measured on dark adaptedPisum sativum leaves illuminated with 12 Wm−2 (curve 1),600 Wm−2 (curve 2), and 600 Wm−2 in the presence of DCMU(curve 3). Wavelength of illumination, 650 nm. For definition ofsymbols, see Glossary.
presented (see Stirbet & Strasser, 1995, Stirbet et al.,1995, and Stirbet & Strasser, 1996). The model isbased on six main assumptions: (1) Chl a fluorescencereflects the concentration of the reduced electronacceptor QA (Duysens & Sweers, 1963); (2) for allpractical purposes, the PS II units are consideredhomogeneous; (3) excitation energy can be exchangedbetween several PS II units (Joliot & Joliot, 1964);(4) the rate constant of the QA reduction is modulatedby the redox state of the oxygen evolving complex(OEC), the so-called S-states (Delosme, 1971 ; Joliotet al., 1971); (5) oxidised plastoquinone poolmolecules quench Chl a fluorescence (Vernotte et al.,1979); and (6) a so-called ‘‘two-electron-gate process’’acts on the acceptor side of PS II (Velthuys & Amesz,1974; Bouges-Bocquet, 1973). In order to prove thegenerality of the model, we have also simulatedspecific fluorescence curves such as those obtainedwith DCMU treatment or with pre-illumination(light-adaptation) of the leaf.
Modelling of the Fast Phase of Chl a FluorescenceInduction: Theory and Assumptions
Chl a fluorescence emission in vivo comes from bothPS I and PS II photosystems, the contribution of PSI being smaller (10–25% of F0—see Lavergne & Trissl,1995). As PS I does not contribute to the variablefluorescence (Butler, 1978), it was not consideredhere. However, the use of uncorrected fluorescencetransients (neglecting PS I contribution) causes thevalues of the ratio N=FV /F0 and of the connectivityparameter C (see below) to be slightly under-evaluated. In this paper we only simulate the variablefluorescence induction curves and do not fit themexactly with the experimental data; so neglecting thecontribution of PS I fluorescence does not affect theresults.
The first phase of Chl a fluorescence induction ismainly related to the photochemical processes andcharge separation reactions that take place at the PSII level (Dau, 1994; Govindjee, 1995; Joshi &Mohanty, 1995). Therefore, for the modelling of thefluorescence transients to be precise, the structure andfunction of these reaction centres must be defined.
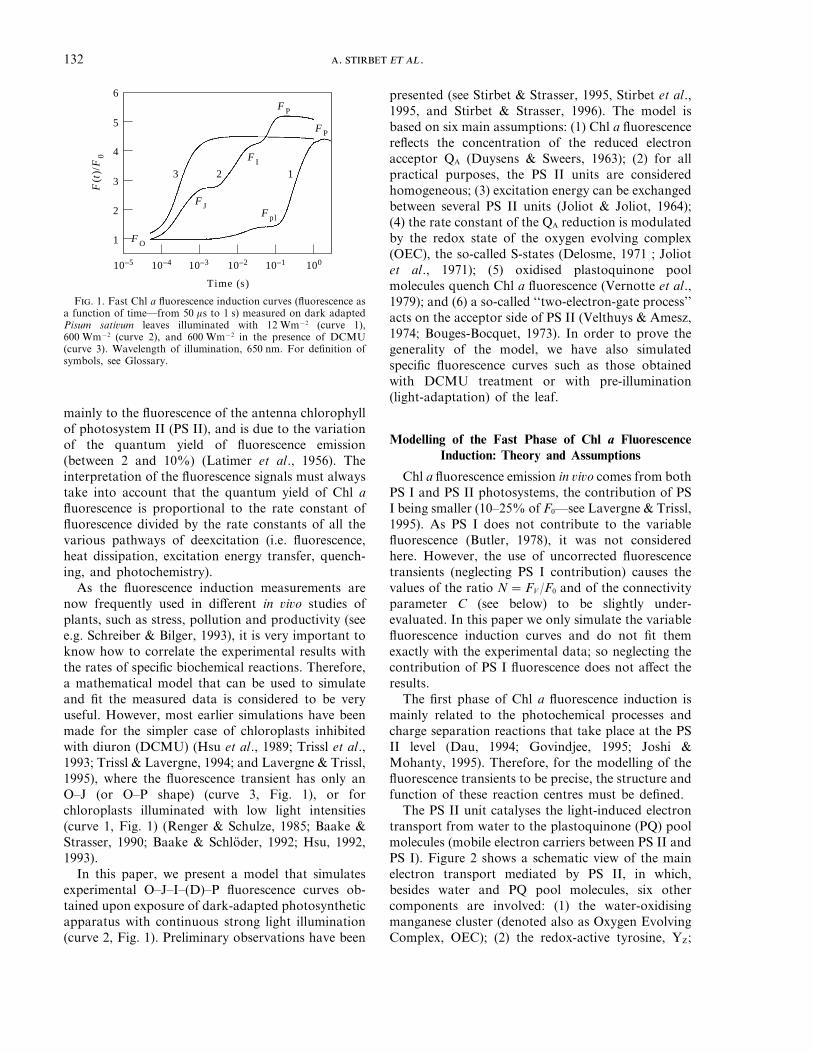
The PS II unit catalyses the light-induced electrontransport from water to the plastoquinone (PQ) poolmolecules (mobile electron carriers between PS II andPS I). Figure 2 shows a schematic view of the mainelectron transport mediated by PS II, in which,besides water and PQ pool molecules, six othercomponents are involved: (1) the water-oxidisingmanganese cluster (denoted also as Oxygen EvolvingComplex, OEC); (2) the redox-active tyrosine, YZ;
mainly to the fluorescence of the antenna chlorophyllof photosystem II (PS II), and is due to the variationof the quantum yield of fluorescence emission(between 2 and 10%) (Latimer et al., 1956). Theinterpretation of the fluorescence signals must alwaystake into account that the quantum yield of Chl afluorescence is proportional to the rate constant offluorescence divided by the rate constants of all thevarious pathways of deexcitation (i.e. fluorescence,heat dissipation, excitation energy transfer, quench-ing, and photochemistry).
As the fluorescence induction measurements arenow frequently used in different in vivo studies ofplants, such as stress, pollution and productivity (seee.g. Schreiber & Bilger, 1993), it is very important toknow how to correlate the experimental results withthe rates of specific biochemical reactions. Therefore,a mathematical model that can be used to simulateand fit the measured data is considered to be veryuseful. However, most earlier simulations have beenmade for the simpler case of chloroplasts inhibitedwith diuron (DCMU) (Hsu et al., 1989; Trissl et al.,1993; Trissl & Lavergne, 1994; and Lavergne & Trissl,1995), where the fluorescence transient has only anO–J (or O–P shape) (curve 3, Fig. 1), or forchloroplasts illuminated with low light intensities(curve 1, Fig. 1) (Renger & Schulze, 1985; Baake &Strasser, 1990; Baake & Schloder, 1992; Hsu, 1992,1993).
In this paper, we present a model that simulatesexperimental O–J–I–(D)–P fluorescence curves ob-tained upon exposure of dark-adapted photosyntheticapparatus with continuous strong light illumination(curve 2, Fig. 1). Preliminary observations have been
Lightabsorption
Exciton
Exciton
Fluorescence PS I Cyt b/f
PQH2PQ
QBH22H+
QB2–QB
–QB
QAQA
P
Phe Phe Phe–
2H2O
O2 + 4H+
P* P+
QA
S2
S1S0
S4
S3
OEC
YZ
QA–QA
–QA–
e–e–
2e–
e–
e–
e–
e–
e–
e–
e–
Chl a Chl a
133
F. 2. A schematic diagram of electron transport reactions considered in the model (see text for explanation). Chl a=chlorophyll aantenna; OEC=oxygen evolving complex in Sn states; YZ = primary electron donor to P680+; P=P680, the PS II reaction centre Chla; Phe=pheophytin a; QA, QB =bound plastoquinones; PQ=plastoquinone pool; Cyt b/f=cytochrome b6/f complex; PSI=photosystem I.
(3) the photochemical reaction centre (P680) which isthe primary electron donor of PS II; (4) onepheophytin a molecule (Phe) which is the primaryelectron acceptor of PS II; (5) one tightly boundplastoquinone (QA); and (6) one loosely boundplastoquinone (QB). Kinetic measurements supportthis theory of the structure of the main electrontransport chain (see reviews by Hansson &Wydrzynski, 1990; Seibert, 1993; Diner & Babcock,1996, 1977). There are evidences for some sidepathways of electron transport, but these are ignoredin the present model.
The electron transport at PS II level starts withthe exciton trapping by the photochemical reactioncentre chlorophyll a (P680) which induces the
primary charge separation: P680+Phe− (Greenfield &Wasielewski, 1996). This primary radical pair candecay by several pathways: transfer of the electronfrom Phe− to QA (the secondary charge separation),recombination and reformation of singlet excitedstate of the photochemical reaction centre P680*,formation of P680 triplet state, and other non-radiative pathways. Under normal conditions,electron flow from Phe− to QA is the major reaction.QA, which is a one-electron acceptor, stabilises thecharge separation. Subsequently, the reduction ofP680+ to P680 occurs by the transfer of one electronfrom YZ. Q−
A reduces a plastoquinone molecule, QB,loosely bound to a specific site on PS II centre, namedthe QB-binding site (Crofts & Wraight, 1983). The full
. .134
reduction of QB requires the addition of two electrons;therefore, two photochemical turnovers of thereaction centre are needed (two-electron gatingmechanism). Velthuys (1981) has suggested that Q−
B
remains bound at the QB-binding site before thesecond reduction, as the affinity of QB binding siteis low for PQ and PQH2, but high for Q−
B . Onlyafter the protonation of Q2−
B does the plastoquinol(QBH2 = PQH2) unbind from the reaction centre anddiffuse into the membrane. Then, an oxidisedplastoquinone molecule will (eventually) bind to theQB-binding site, and the process of QB reduction canbe repeated.
On the donor side of PS II unit, the oxidised YZ isreduced by OEC. The rate constant for this processdepends on the redox state of the water-oxidisingmanganese cluster (Babcock et al., 1976). It has beenproposed that this dependence is due to electrostaticeffects. The OEC cycles through the so-called Sn states(see Fig. 2), the subscript indicating the number ofoxidising equivalents in the system. The stepwiseaccumulation of four positive charges on theoxidising side of PS II constitutes a condition for thesplitting of two water molecules and the release offour electrons, four protons and of molecular oxygen(Kok et al., 1970). The oxygen molecule is releasedduring the S4 to S0 transition (for reviews, see Renger,1993; Britt, 1996).
The electron transport chain described above,dealing with the redox reactions around the PS IIcentre, is schematically illustrated in Fig. 2. We haveused this reaction scheme in the kinetic analysis of thephotosynthetic system. Similar to the models ofRenger & Schulze (1985) and Hsu (1992), the excitontrapping (P680 : P680*) and the primary chargeseparation (P680*Phe : P680+Phe−) have been in-troduced indirectly in the model through the rateconstant of QA reduction, kL. This one is a global rateconstant and depends on several parameters, forexample light intensity, absorption cross section ofthe antenna of PS II units, rate constants of excitontrapping and primary charge separation. The reversereaction represents the complex process of chargerecombination.
In the photosynthetic membranes, the PS II centresdo not function in an isolated state. An efficientexcitation energy transfer between several PS II unitstakes place, that increases the efficiency of the lightconversion process. This process is commonly denotedas PS II connectivity (Joliot & Joliot, 1964; Joliot etal., 1973) or grouping (Strasser, 1978 and 1981).
It is well known that during the exposure to lightof a dark adapted green plant, the primary quinoneacceptor QA accumulates in its reduced form Q−
A (see
for example the review on Chl a fluorescenceinduction phenomenon by Govindjee, 1995). The netQ−
A accumulates as the plastoquinone molecules of thePQ pool become reduced. The plastoquinol (PQH2) isreoxidised by the cytochrome b6/f complex (Cyt b/f),this being the limiting reaction of the linear electrontransport chain (Stiehl & Witt, 1969; Haehnel, 1984).Since the oxidised QA is a strong quencher of the PSII fluorescence (Duysens & Sweers, 1963), theaccumulation of the reduced QA seems to be the mainfactor that must be considered when the fluorescenceinduction is analysed. The photochemical reactioncentre of PS II in its oxidised state, P680+, is alsoan efficient fluorescence quencher (Butler, 1972;Sonneveld et al., 1979; Deprez et al., 1983; Shinkarev& Govindjee, 1993). However, we will not considerP680+ quenching here, because under most con-ditions, there is no significant accumulation of P680+
as the abundant water molecules keep it reduced viaOEC and the primary donor YZ (Dau, 1994).
In view of the above, since the concentrations of Q−A
and P680+ depend mainly on the processes occurringat the PS II level, the first assumption of our model ofthe fast phase of Chl a fluorescence induction is thatthe variable fluorescence is related mainly to PS IIkinetics. More specifically, Chl a fluorescence yieldmainly reflects the number of the closed PS II centresduring the time interval of our analysis. However, PSI activity is also indirectly considered, as the rateconstant of plastoquinol reoxidation by the Cyt b/fcomplex depends on the rate of reduction of the PSI photochemical reaction centre in its oxidised state(P700+). It must be noted that, for simplicity, in thepresent model we have considered the reoxidationreaction of plastoquinol to have a first order kinetics.
The second assumption of the model is that, onaverage, all PS II units have the same kineticcharacteristics (a homogeneous PS II population),and each one of them is served by the same numberof PQ pool molecules.
The third assumption of the model is that thefraction of closed reaction centres, B(t)= [Q−
A ]total (t)/([Q−
A ]total (t)+ [QA]total (t)), influences the relative vari-able fluorescence, V(t)= [F(t)−F0]/(FM −F0), andthe ‘‘global’’ reduction rate of QA, kL. Furthermore,according to the theory of the PS II connectivity(Joliot & Joliot, 1964; Strasser, 1978; Butler, 1980;Strasser, 1981; Trissl & Lavergne, 1994; and Lavergne& Trissl, 1995) the following relationships are valid:
V(t)=B(t)
1+C[1−B(t)]; (1)
135
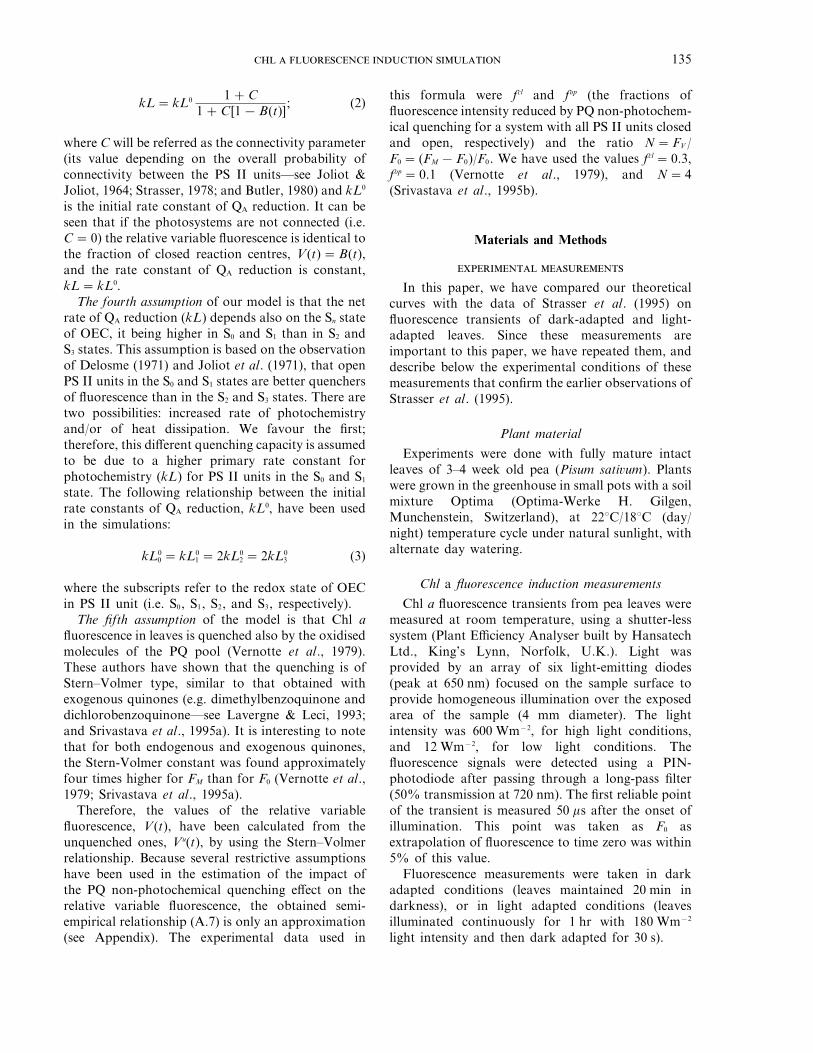
kL= kL0 1+C1+C[1−B(t)]
; (2)
where C will be referred as the connectivity parameter(its value depending on the overall probability ofconnectivity between the PS II units—see Joliot &Joliot, 1964; Strasser, 1978; and Butler, 1980) and kL0
is the initial rate constant of QA reduction. It can beseen that if the photosystems are not connected (i.e.C=0) the relative variable fluorescence is identical tothe fraction of closed reaction centres, V(t)=B(t),and the rate constant of QA reduction is constant,kL= kL0.
The fourth assumption of our model is that the netrate of QA reduction (kL) depends also on the Sn stateof OEC, it being higher in S0 and S1 than in S2 andS3 states. This assumption is based on the observationof Delosme (1971) and Joliot et al. (1971), that openPS II units in the S0 and S1 states are better quenchersof fluorescence than in the S2 and S3 states. There aretwo possibilities: increased rate of photochemistryand/or of heat dissipation. We favour the first;therefore, this different quenching capacity is assumedto be due to a higher primary rate constant forphotochemistry (kL) for PS II units in the S0 and S1
state. The following relationship between the initialrate constants of QA reduction, kL0, have been usedin the simulations:
kL00 = kL0
1 =2kL02 =2kL0
3 (3)
where the subscripts refer to the redox state of OECin PS II unit (i.e. S0, S1, S2, and S3, respectively).
The fifth assumption of the model is that Chl afluorescence in leaves is quenched also by the oxidisedmolecules of the PQ pool (Vernotte et al., 1979).These authors have shown that the quenching is ofStern–Volmer type, similar to that obtained withexogenous quinones (e.g. dimethylbenzoquinone anddichlorobenzoquinone—see Lavergne & Leci, 1993;and Srivastava et al., 1995a). It is interesting to notethat for both endogenous and exogenous quinones,the Stern-Volmer constant was found approximatelyfour times higher for FM than for F0 (Vernotte et al.,1979; Srivastava et al., 1995a).
Therefore, the values of the relative variablefluorescence, V(t), have been calculated from theunquenched ones, Vu(t), by using the Stern–Volmerrelationship. Because several restrictive assumptionshave been used in the estimation of the impact ofthe PQ non-photochemical quenching effect on therelative variable fluorescence, the obtained semi-empirical relationship (A.7) is only an approximation(see Appendix). The experimental data used in
this formula were fcl and fop (the fractions offluorescence intensity reduced by PQ non-photochem-ical quenching for a system with all PS II units closedand open, respectively) and the ratio N=FV /F0 = (FM −F0)/F0. We have used the values fcl =0.3,fop =0.1 (Vernotte et al., 1979), and N=4(Srivastava et al., 1995b).
Materials and Methods
In this paper, we have compared our theoreticalcurves with the data of Strasser et al. (1995) onfluorescence transients of dark-adapted and light-adapted leaves. Since these measurements areimportant to this paper, we have repeated them, anddescribe below the experimental conditions of thesemeasurements that confirm the earlier observations ofStrasser et al. (1995).
Plant material
Experiments were done with fully mature intactleaves of 3–4 week old pea (Pisum sativum). Plantswere grown in the greenhouse in small pots with a soilmixture Optima (Optima-Werke H. Gilgen,Munchenstein, Switzerland), at 22°C/18°C (day/night) temperature cycle under natural sunlight, withalternate day watering.
Chl a fluorescence induction measurements
Chl a fluorescence transients from pea leaves weremeasured at room temperature, using a shutter-lesssystem (Plant Efficiency Analyser built by HansatechLtd., King’s Lynn, Norfolk, U.K.). Light wasprovided by an array of six light-emitting diodes(peak at 650 nm) focused on the sample surface toprovide homogeneous illumination over the exposedarea of the sample (4 mm diameter). The lightintensity was 600 Wm−2, for high light conditions,and 12 Wm−2, for low light conditions. Thefluorescence signals were detected using a PIN-photodiode after passing through a long-pass filter(50% transmission at 720 nm). The first reliable pointof the transient is measured 50 ms after the onset ofillumination. This point was taken as F0 asextrapolation of fluorescence to time zero was within5% of this value.
Fluorescence measurements were taken in darkadapted conditions (leaves maintained 20 min indarkness), or in light adapted conditions (leavesilluminated continuously for 1 hr with 180 Wm−2
light intensity and then dark adapted for 30 s).

. .136
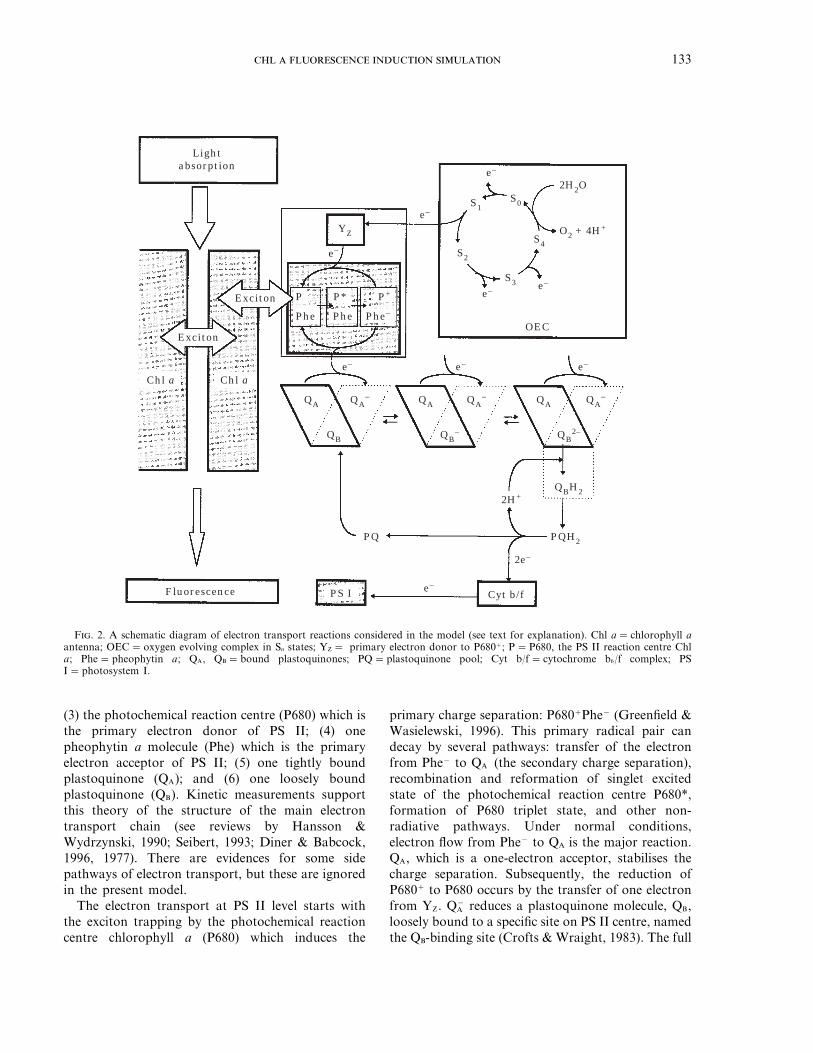
The concentration of reactants in a 0.5 s time rangehave been obtained through numerical integration ofOrdinary Differential Equations systems (ODEs)associated with the reactions presented in Fig. 3(a)and (b). In these figures the reaction chains related toPS II units which are initially in S1QAQB and S0QAQ−
B
states [Fig. 3(a)], and in S0QAQB and S1QAQ−B states
[Fig. 3(b)] are shown. For simplicity, we havenormalised the total number of PS II centres indifferent redox states and the total number ofplastoquinones in the pool. For example, at time zero:
[S1QAQB]+ [S0QAQ−B ]+ [S0QAQB]+ [S1QAQ−
B ]=1
and
[PQ]+ [PQH2]= n
where n is the total number of the plastoquinonemolecules in the pool.
The PS II units with YZ and P680 in the oxidisedstates (Y+
Z and/or P680+) have been noted with anasterisk after Sn (e.g. S3*Q−
A QB). Those Sn : Sn+1
transitions that are much faster than the following(succeeding) reaction in the chain (e.g. S0 : S1
transition compared to Q−A QB : QAQ−
B reaction—seeTable 1 for the corresponding rate constants) havebeen considered to take place simultaneously with thelight reaction, in order to reduce the number ofequations in the ODE systems. All the reactions in the
considered model are of first order (except QBH2-PQexchange reaction, which is of second order) and witha kinetics of mass action type. The loosely boundplastoquinol molecule (QBH2) is replaced by a new PQmolecule from the pool, and it diffuses to theoxidation site on the Cyt b/f complex. We haveconsidered that the QB-site is always occupied (withQB, Q−
B , Q2−B , or QBH2). Also, at the beginning of
illumination we have assumed that all of the PS IIunits are in the open state (i.e. the fraction of closedreaction centres equal to zero, B=0) for both typesof samples, the dark adapted and the light adaptedleaves.
The numerical algorithm used for the simulationswas the Livermore Solver of Ordinary DifferentialEquations (LSODE) procedure (Hindmarsch, 1980),with the initial concentrations of the reactants and therate constants of the reactions as parameters. Wehave used the values of the rate constants presentedin Table 1 (unless otherwise noted). These values arecomparable to those reported in the literature (seereferences in Table 1).
Before simulating the experimental O–J–I–Pcurves, it was necessary to evaluate the rate constantfor QA reduction of the reaction centres in state S1
(kL01 ) in our specific experimental conditions
(600 Wm−2 illumination intensity, pea leaves). It wasobtained by comparing the simulated transients fordifferent values of kL0
1 , and the experimental one ofDCMU treated leaves. Theoretical curves have been
T 1The values of input parameters used in simulations and the corresponding values from literature
Input parameters Dark adapted leaf Light adapted leaf Reported values References
N=FV /F0 4 2 2–4 Srivastava et al. (1995b)fcl; fop 30%; 10% 30%; 10% 30–20%; 5–10% Vernotte et al. (1979)Total number of PQ in the pool;
(initial ratio PQ:PQH2) 6; (6:0) 6; (4:2) 5–10 Lavergne et al. (1992)Initial ratio: S1:S0 0.8:0.2 0.8:0.2 0.75:025 Kok et al. (1970)
Forbush et al. (1971)Initial ratio: QB:Q−
B 0.7:0.3 0.7:0.3 0.7:0.3 Wollman ( 1978)0.5:0.5 Rutherford et al. (1984)
t1/2; and Keq for: 230 m; 20 230 ms; 20 100–200 ms; 15–20 Diner, 1977Q−
A QBt QAQ−B Robinson & Crofts (1983)
t1/2; and Keq for: 460 ms; 10 460 ms; 1 300–500 ms; 50 or 1 Diner (1977)Q−
A Q−B t QAQ2−
B Crofts & Wraight (1983)2t1/2; and Keq for: 1 ms; 10 1 ms; 10 1 ms; 1 or 10 Crofts et al. (1984)QAQBH2 +PQt QAQB +PQH2
t1/2 for: PQH2 : PQ 10 ms 3.5 ms 4–10 ms Haehnel (1976)t1/2 for: S0 : S1 30 ms 30 ms 30 ms Babcock (1987)t1/2 for: S1 : S2 110 ms 110 ms 110 ms Babcock (1987)t1/2 for: S2 : S3 350 ms 350 ms 350 ms Babcock (1987)t1/2 for: S3c S4 : S0 1.3 ms 1 ms 1–1.3 ms Babcock (1987)
f cl and f op are the fractions of the Chl a fluorescence that have been quenched by the oxidised PQ molecules from the pool, for a systemwith all PS II units closed and open respectively; t1/2 is the half time of a forward first order reaction; 2t1/2 is the half time of a secondorder reaction (i.e. the PQ exchange reaction), with 2t1/2 = ln 2/(2kE [PQ]0); and Keq is the equilibrium constant of reaction.

S1QAQBS2QA
–QB
S2QAQB– S3QA
–QB–
S1QA–QB
–
S2QA–QB
2–
S2QA–QBH2
S2QA–QB
S2QAQB–
S1QAQB2–
S1QAQBH2
S1QAQB
S3QAQB2–
S3QAQBH2
S3QAQBS3*QA
–QB S0QA–QB
S3*QA–QBH2
S3*QA–QB
2–
S3*QAQB– S0QAQB
–
PQH2
PQH2
PQH2 PQ
PQH2
PQH2
PQ
PQ PQ
PQ
kL1
k1AB
k1BA
k1AB
k1BA
k2AB
k2BA
k1AB
k1BA
k1ABkox
PQH2
k1BA
k2AB k2
BA
kH k–H
kH k–H kH k–H
kH k–H
kE k–E kE k–E
kE k–E kE k–E
kL2
kL3
kL3
kL1
kL1
kS3
kL3
kL0
(a)
S0QAQBS1QA
–QB
S1QAQB– S2QA
–QB–
S3*QA–QB
–
S3*QAQB2–
S3*QAQBH2 S0QAQBH2
S0QAQB
S2QAQB2–
S2QAQBH2
S2QAQBS2*QA
–QBS3QA
–QB
S3QA–QBH2
S3QA–QB
2–
S2*QAQB– S3QAQB
–
PQH2
PQH2
PQH2 PQ
PQH2
PQ
PQ
PQH2
PQ
PQ
kL0
k1AB
k1BA
k1AB
k1BA
k2AB k2
BA
k1AB k1
BA
koxPQH2
k2AB k2
BA
kH k–H
kH k–H
kH k–H
kE k–E kE k–E
kE k–EkE
kL1
kL2
kL2
kS3kL0
kS2
kL2
kL3
(b)
S1QA–QBH2
S1QA–QB
PQH2
PQkE k–E
137
F. 3. PS II redox reaction chain for the units initially in (a) S1QAQB and S0QAQ−B states; (b) S0QAQB and S1QAQ−
B states.
. .138
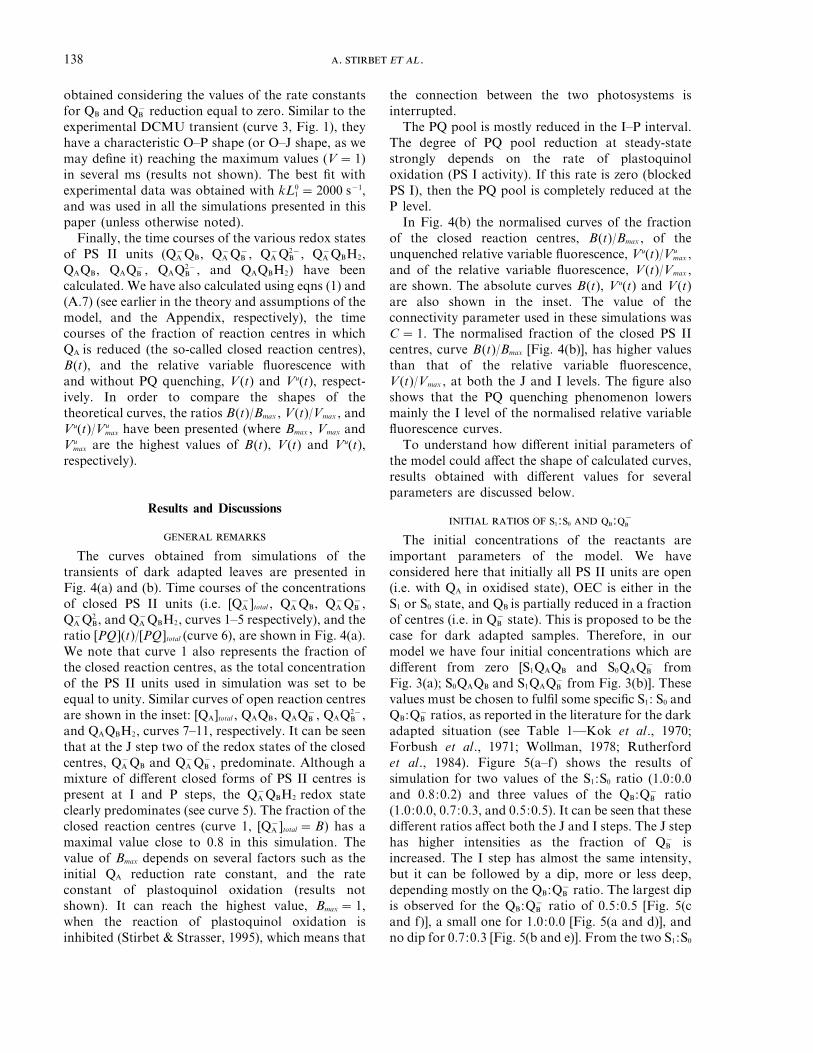
obtained considering the values of the rate constantsfor QB and Q−
B reduction equal to zero. Similar to theexperimental DCMU transient (curve 3, Fig. 1), theyhave a characteristic O–P shape (or O–J shape, as wemay define it) reaching the maximum values (V=1)in several ms (results not shown). The best fit withexperimental data was obtained with kL0
1 =2000 s−1,and was used in all the simulations presented in thispaper (unless otherwise noted).
Finally, the time courses of the various redox statesof PS II units (Q−
A QB, Q−A Q−
B , Q−A Q2−
B , Q−A QBH2,
QAQB, QAQ−B , QAQ2−
B , and QAQBH2) have beencalculated. We have also calculated using eqns (1) and(A.7) (see earlier in the theory and assumptions of themodel, and the Appendix, respectively), the timecourses of the fraction of reaction centres in whichQA is reduced (the so-called closed reaction centres),B(t), and the relative variable fluorescence withand without PQ quenching, V(t) and Vu(t), respect-ively. In order to compare the shapes of thetheoretical curves, the ratios B(t)/Bmax , V(t)/Vmax , andVu(t)/Vu
max have been presented (where Bmax , Vmax andVu
max are the highest values of B(t), V(t) and Vu(t),respectively).
Results and Discussions
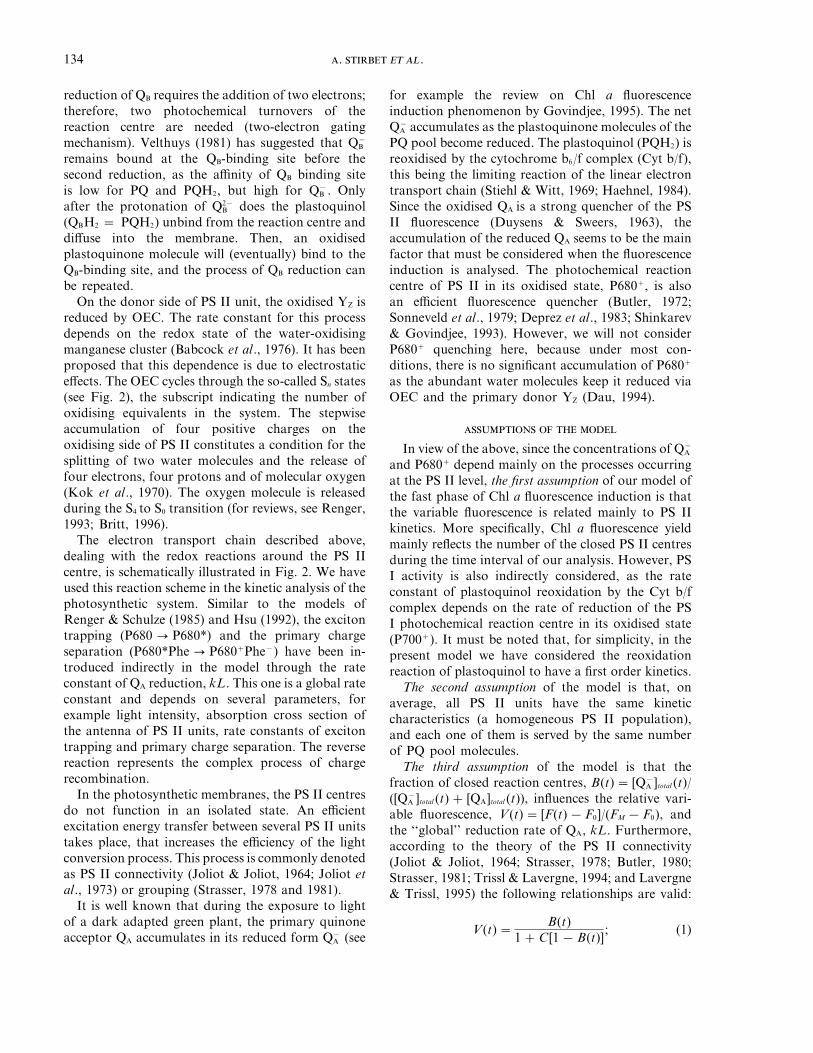
The curves obtained from simulations of thetransients of dark adapted leaves are presented inFig. 4(a) and (b). Time courses of the concentrationsof closed PS II units (i.e. [Q−
A ]total , Q−A QB, Q−
A Q−B ,
Q−A Q2
B, and Q−A QBH2, curves 1–5 respectively), and the
ratio [PQ](t)/[PQ]total (curve 6), are shown in Fig. 4(a).We note that curve 1 also represents the fraction ofthe closed reaction centres, as the total concentrationof the PS II units used in simulation was set to beequal to unity. Similar curves of open reaction centresare shown in the inset: [QA]total , QAQB, QAQ−
B , QAQ2−B ,
and QAQBH2, curves 7–11, respectively. It can be seenthat at the J step two of the redox states of the closedcentres, Q−
A QB and Q−A Q−
B , predominate. Although amixture of different closed forms of PS II centres ispresent at I and P steps, the Q−
A QBH2 redox stateclearly predominates (see curve 5). The fraction of theclosed reaction centres (curve 1, [Q−
A ]total =B) has amaximal value close to 0.8 in this simulation. Thevalue of Bmax depends on several factors such as theinitial QA reduction rate constant, and the rateconstant of plastoquinol oxidation (results notshown). It can reach the highest value, Bmax =1,when the reaction of plastoquinol oxidation isinhibited (Stirbet & Strasser, 1995), which means that
the connection between the two photosystems isinterrupted.
The PQ pool is mostly reduced in the I–P interval.The degree of PQ pool reduction at steady-statestrongly depends on the rate of plastoquinoloxidation (PS I activity). If this rate is zero (blockedPS I), then the PQ pool is completely reduced at theP level.
In Fig. 4(b) the normalised curves of the fractionof the closed reaction centres, B(t)/Bmax , of theunquenched relative variable fluorescence, Vu(t)/Vu
max ,and of the relative variable fluorescence, V(t)/Vmax ,are shown. The absolute curves B(t), Vu(t) and V(t)are also shown in the inset. The value of theconnectivity parameter used in these simulations wasC=1. The normalised fraction of the closed PS IIcentres, curve B(t)/Bmax [Fig. 4(b)], has higher valuesthan that of the relative variable fluorescence,V(t)/Vmax , at both the J and I levels. The figure alsoshows that the PQ quenching phenomenon lowersmainly the I level of the normalised relative variablefluorescence curves.
To understand how different initial parameters ofthe model could affect the shape of calculated curves,results obtained with different values for severalparameters are discussed below.
1:0 :−
The initial concentrations of the reactants areimportant parameters of the model. We haveconsidered here that initially all PS II units are open(i.e. with QA in oxidised state), OEC is either in theS1 or S0 state, and QB is partially reduced in a fractionof centres (i.e. in Q−
B state). This is proposed to be thecase for dark adapted samples. Therefore, in ourmodel we have four initial concentrations which aredifferent from zero [S1QAQB and S0QAQ−
B fromFig. 3(a); S0QAQB and S1QAQ−
B from Fig. 3(b)]. Thesevalues must be chosen to fulfil some specific S1: S0 andQB:Q−
B ratios, as reported in the literature for the darkadapted situation (see Table 1—Kok et al., 1970;Forbush et al., 1971; Wollman, 1978; Rutherfordet al., 1984). Figure 5(a–f) shows the results ofsimulation for two values of the S1:S0 ratio (1.0:0.0and 0.8:0.2) and three values of the QB:Q−
B ratio(1.0:0.0, 0.7:0.3, and 0.5:0.5). It can be seen that thesedifferent ratios affect both the J and I steps. The J stephas higher intensities as the fraction of Q−
B isincreased. The I step has almost the same intensity,but it can be followed by a dip, more or less deep,depending mostly on the QB:Q−
B ratio. The largest dipis observed for the QB:Q−
B ratio of 0.5:0.5 [Fig. 5(cand f)], a small one for 1.0:0.0 [Fig. 5(a and d)], andno dip for 0.7:0.3 [Fig. 5(b and e)]. From the two S1:S0

1.0
0.8
0.6
0.4
0.2
0.0
1.0
0.8
0.6
0.4
0.2
0.010–6 10–5 10–4 10–3 10–2 10–1
Time (s)
B(t
)/B
ma
x;
Vu(t
)/V
um
ax;
V(t
)/V
ma
xC
on
cen
tra
tio
n (
rel.
un
its)
10–5
1
0
0
1
I
O
O
J
D
P
4
32
1
J
D
IP
(a)
(b)
5
6
10–4
10
7
8
9
11
10–3 10–2 10–1
10–5 10–4 10–3 10–2
B/BmaxB
Vu/Vumax
Vu
V
V/Vmax
10–1
Time (s)
Time (s)
B;
Vu;
VC
on
cen
tra
tio
n
139
F. 4. Typical theoretical curves obtained with our model with input parameters for dark adapted conditions presented in Table 1.(a) Time course of the concentrations of [Q−
A ]total =B, Q−A QB, Q−
A Q−B , Q−
A Q2−B , Q−
A QBH2 and PQ/[PQ]total (curves 1–6, respectively); [insetin panel (a)] time course of the concentrations of [QA]total , QAQB, QAQ−
B , QAQ2−B , and QAQBH2 (curves 7–11, respectively); (b) time course
of B(t)/Bmax , Vu(t)/Vumax , and V(t)/Vmax—where B(t) is the fraction of closed PS II centres at time t, and Bmax , is the highest value of B(t);
Vu(t) is the unquenched relative variable fluorescence at time t, and Vumax , is the highest value of Vu(t); and V(t) is the PQ-quenched relative
variable fluorescence at time t, and Vmax is the highest value of V(t); [inset in panel (b)] time course of B(t), Vu(t) and V(t). For explanationof the symbols O, J, I, D, and P see the text.
ratios used in the simulations, the ratio of 0.8:0.2 onlyproduced a slight dip. For the ratio QB:Q−
B =0.5:0.5we have also observed a decrease of approximately5–10% in the value of the relative variablefluorescence at the P level (results not shown).
In the present paper we have used the initial ratiosS1:S0 =0.8:0.2 and QB:Q−
B =0.7:0.3 in all the other
simulations. We must note that we have chosen thevalue of 0.7:0.3 for the QB:Q−
B ratio, as reported forisolated chloroplasts (Wollman, 1978), and not0.5:0.5, as reported for spinach leaves (Rutherfordet al., 1984), because normally, the transients in highlight of most dark adapted leaves do not show asignificant dip.

0.0
1.0
0.8
0.6
0.4
0.2
0.0
Time (s)
V(t
)/V
ma
xV
(t)/
Vm
ax
10–6 10–5 10–4 10–3 10–2 10–1
O
O O
O O
O
JJ J
JJ
D D D
DDD
IS1:S0 = 1.0: 0.0
QB:QB– = 1.0: 0.0
S1:S0 = 1.0: 0.0
QB:QB– = 0.7: 0.3
S1:S0 = 1.0: 0.0
QB:QB– = 0.5: 0.5
S1:S0 = 0.8: 0.2
QB:QB– = 1.0: 0.0
S1:S0 = 0.8: 0.2
QB:QB– = 0.7: 0.3
S1:S0 = 0.8: 0.2
QB:QB– = 0.5: 0.5
I I
II
P P P
PPPI
J
1.0
(a) (b) (c)
(d) (e) (f)
0.8
0.6
0.4
0.2
Time (s)
10–6 10–5 10–4 10–3 10–2 10–1
Time (s)
10–6 10–5 10–4 10–3 10–2 10–1
0.2
0.4
0.6
0.8
1.0
Rel
ati
ve
va
ria
ble
flu
ore
scen
ce,
V(t
)
0.010
C = 4
C = 1
C = 0
2 3
Time (ms)
. .140
F. 5. Simulated Chl a fluorescence induction curves (V(t)/Vmax ) in dark adapted conditions for different values of initial S1:S0 and QB:Q−B
ratios: (a) 1.0:0.0 and 1.0:0.0; (b) 1.0:0.0 and 0.7:0.3; (c) 1.0:0.0 and 0.5:0.5; (d) 0.8:0.2 and 1.0:0.0; (e) 0.8:0.2 and 0.7:0.3; and (f) 0.8:0.2and 0.5:0.5. For definition of symbols, see the Glossary.
An important parameter of the present model is theconnectivity parameter, C, which depends on theprobability of connectivity between the PS II units(see Strasser et al., 1992). C is the constant for thecurvature of the hyperbola, V vs. B, derived by Joliot& Joliot (1964) and Strasser (1978) [see eqn (1)].Figure 6 shows the influence of connectivity onthe fluorescence transients of a DCMU treated leaf.We have simulated the fluorescence inductioncurves for two extreme values of the connectivity
parameter (i.e. C=0 and C=4), and for C=1. Inthe linear time plot, the sigmoidal shape of thesimulated curves for C=1 and 4 can be observed. Itmust be noted that the sigmoidicity of experimentalDCMU transients was the first argument thatfavoured the PS II connectivity concept (Joliot &Joliot, 1964).
The effect of the connectivity on the fluorescencetransient curves simulated for the untreated darkadapted leaf is presented in Fig. 7(a) and (b). Thefraction of closed centres, B [Fig. 7(a)], and thequenched relative variable fluorescence, V [Fig. 7(b)],both normalised at their highest values, have beencalculated for various values of the connectivityparameter (i.e. C=0, 1, 1.5, and 2). The absolutecurves are presented in the inserts. According to eqn(2) from the theory and assumptions of the model, theQA reduction rate (kL) increases with the number ofthe closed centres, B(t). This increase is morepronounced for larger values of C (e.g. for C=1, thekL value when all centres are closed is doubledcompared to that when all centres are open, but forC=2 it is tripled). As a consequence, as the C valueincreases, an increased number of PS II centres areclosed [see Fig. 7(a) inset] due to a higher electrontransport rate. However, the relative variablefluorescence decreases with C [see Fig. 7(b) inset], asthe connectivity diminishes the loss of trapped energyas fluorescence, favouring a better utilisation of theexcitons.
F. 6. Simulated Chl a fluorescence induction curves in darkadapted conditions (see Table 1) in the presence of DCMU.Relative variable fluorescence curves, V(t), have been calculated ata fixed initial QA reduction rate constant, kL1
0 =2000 s−1, but withvarying connectivity parameter, C=0, 1, and 4.

0.2
0.4
0.6
0.8
1.0
0.2
0.0
0.4
0.6
0.8
1.0
0.010–110–210–310–410–510–6
Time (s)
C = 0
C = 0
C = 0
(a)
(b)
C = 0
C = 0.5
C = 1
C = 2
J
J
I
I
P
P
O
O
C = 2
C = 2
C = 2
Time (s)
V(t
)/V
ma
xB
(t)/
Bm
ax
B(t
)V
(t)
1.0
0.8
0.6
0.4
0.210–4 10–3 10–2 10–1
Time (s)10–4 10–3 10–2 10–1
0.8
0.6
0.4
0.2
0.0
141
F. 7. Simulation results for Chl a fluorescence induction obtained in dark adapted conditions (see Table 1), with different values ofthe connectivity parameter, C=0, 0.5, 1 and 2: (a) time course of B(t)/Bmax ; [inset in panel (a)] time course of B(t); (b) time course ofV(t)/Vmax ; [inset in panel (b)] time course of V(t). For definition of symbols, see the Glossary.
For the normalised fraction of PS II closed centres,B/Bmax curves, small increases at the I-step can beobserved with increasing values of C. For the V/Vmax
curves the J and I steps have lower values as C isincreased. As can be seen, the connectivity parameterhas much more influence on the normalised relativevariable fluorescence curves V/Vmax than on the B/Bmax
curves.Since 1964 (Joliot & Joliot) the connectivity of PS
II antenna has been measured with fluorescence
techniques. According to Paillotin (1976) the quan-tum yield of the excitation energy trapping by an openreaction centre, 8P(t), is:
8P(t) =8Po [1−V(t)] (4)
where 8Po is the quantum yield of the excitationenergy trapping by an open reaction centre att=0. Therefore, for steady state conditions anda given light intensity, the electron transport rateis proportional to the relative quantum yield,

0.2
C = 0
C = 0.5
C = 0.5
C = 1 C = 2 (adapted)
C = 2 (ad)
C = 1.5
C = 2
C = 2
0.010
B(t)
V
1.0
0.2
0.4
0.6
0.8
0.00.20.0 0.4 0.6 0.8 1.0
B(t)
P(t
)/
Po
= 1
–V(t
)
. .142
F. 8. The relative quantum yield of the exciton energy trapping of an open reaction centre, 1− V(t), as a function of the fractionof closed reaction centres, B(t), for different values of the connectivity parameter, C=0, 0.5, 1, 1.5 and 2; (inset) the differencesDV=[1−V(t)]for C$ 0 − [1−V(t)]for C=0 as a function of the fraction of closed reaction centres, B(t), for different values of the connectivityparameter, C=0, 0.5, 1, 1.5 and 2. All the curves are obtained with the input parameters for dark adapted conditions presented in Table 1,except the curve C=2 (adapted) which was obtained with an increased value of the rate constant of plastoquinol oxidation, kP =300 s−1
instead of 70 s−1, and an increased value of the PQ exchange reaction, kE =1000 s−1 instead of 100 s−1. For definition of symbols, see theGlossary.
8P(t)/8Po =1−V(t). In Fig. 8 the simulated curves[1−V(t)] vs. B(t) are shown, for different values ofthe connectivity constant C. It is evident that a higherdegree of connectivity produces an increase in thevalue of [1−V(t)] and therefore, the value of theelectron transport. However, we put forward thehypothesis that the connectivity has also a morequalitative goal: the stability of the system in anoptimal state relative to the environmental con-ditions. The difference of the relative quantum yieldsbetween the connected and the unconnected case:
DV=[1−V(t)]for C$ 0 − [1−V(t)]for C=0 (5)
is a function with a well defined optimum (see Fig. 8inset) which is linked to the redox buffering capacity
of the system. The numerical simulations made fordark adapted samples show that at steady state thesystem is far away from the optimum. However, if weconsider an ‘‘adapted’’ system (e.g. with an increasedvalue of the rate constant of plastoquinol oxidation,kP =300 s−1 instead of 70 s−1, and of the PQ exchangereaction, kE =1000 s−1 instead of 100 s−1) the resultsshow that the system approaches the optimum of thisfunction. A fitting procedure can allow us todetermine the best choice of the rate constants, butthis will be the objective of another paper. Therefore,we can conclude that the connectivity influences thefunction of the photosynthetic systems both asactivity (the electron transport) and stability of thesystem towards external perturbations (stressbuffering, Kruger et al., 1997).
0.2
0.4
0.6
0.8
1.0
0.2
0.0
0.4
0.6
0.8
1.0
V(t
)
V(t
)/V
ma
xV
(t)/
Vm
ax
V(t
)
0.75
0.5020
I
P1
1
44
400
Time (ms)
0.9
0.520 40
PP
P
I
I
I
J
J
1
2
3
4
41–45
5
D
3
2
1
5
(6:0)
InitialPQ:PQH2
(5:1)
(4:2)
(3:3)
(2:4)
O
O
[PQ] = 6
[PQ] = 6
[PQ] = 2
[PQ] = 2
(a)
(b)
0
Time (ms)
0.010–510–6 10–4 10–3 10–2 10–1
Time (s)
143
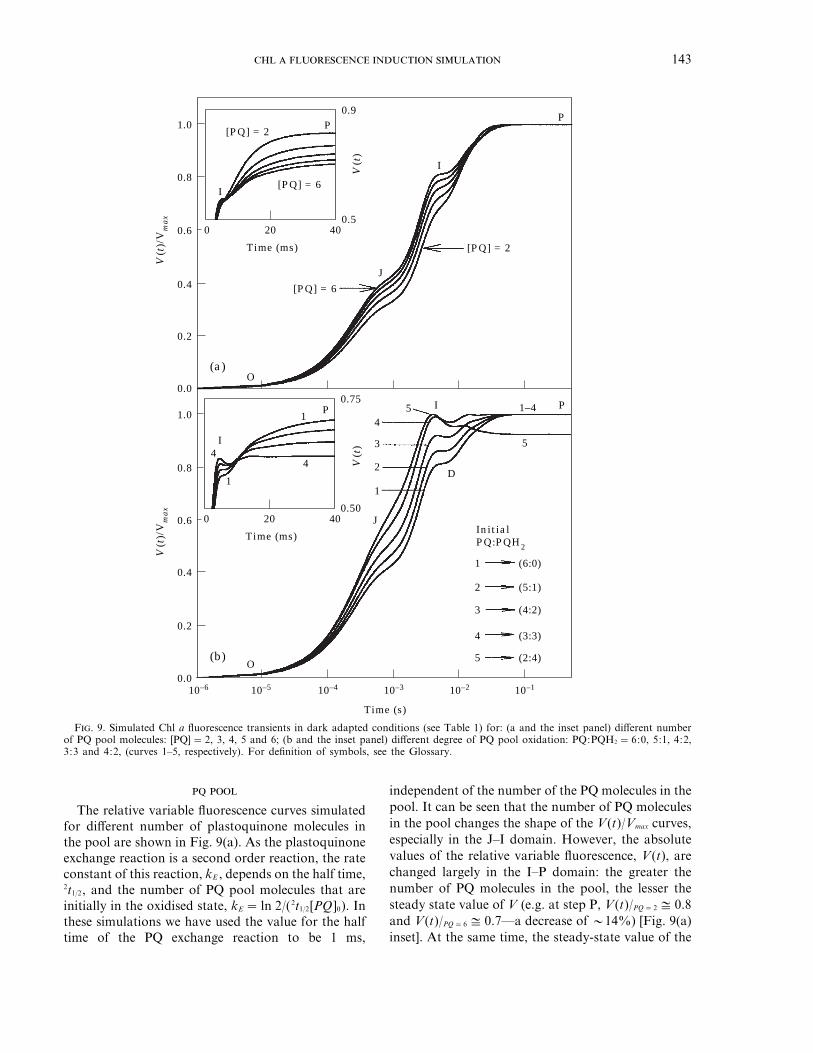
F. 9. Simulated Chl a fluorescence transients in dark adapted conditions (see Table 1) for: (a and the inset panel) different numberof PQ pool molecules: [PQ]=2, 3, 4, 5 and 6; (b and the inset panel) different degree of PQ pool oxidation: PQ:PQH2 =6:0, 5:1, 4:2,3:3 and 4:2, (curves 1–5, respectively). For definition of symbols, see the Glossary.
The relative variable fluorescence curves simulatedfor different number of plastoquinone molecules inthe pool are shown in Fig. 9(a). As the plastoquinoneexchange reaction is a second order reaction, the rateconstant of this reaction, kE , depends on the half time,2t1/2, and the number of PQ pool molecules that areinitially in the oxidised state, kE =ln 2/(2t1/2[PQ]0). Inthese simulations we have used the value for the halftime of the PQ exchange reaction to be 1 ms,
independent of the number of the PQ molecules in thepool. It can be seen that the number of PQ moleculesin the pool changes the shape of the V(t)/Vmax curves,especially in the J–I domain. However, the absolutevalues of the relative variable fluorescence, V(t), arechanged largely in the I–P domain: the greater thenumber of PQ molecules in the pool, the lesser thesteady state value of V (e.g. at step P, V(t)/PQ=2 3 0.8and V(t)/PQ=6 3 0.7—a decrease of 014%) [Fig. 9(a)inset]. At the same time, the steady-state value of the
0.2
0.4
0.6
0.8
1.0
0.2
0.4
0.6
0.8
1.0
4
4
3
2
1
3
2
1
300
koxPQH2 (s–1)
D
J
J
J
I
I
P
P
1
1
4
1
41
4
4
O
PI
200
100
70
4
3
2
1
300
koxPQH2 (s–1)
200
100
70
0.0
0.0
1
2
34
Time (s)
(a)
(b)
60
I P
D
J
O
Time (s)
1
0
0
10–3
10–510–6 10–4 10–3 10–2 10–1
10–4 10–2 10–1
10–310–4 10–2 10–1
Time (s)
V(t
)
V(t
)/V
ma
xV
(t)/
Vm
ax
V(t
)
. .144
fraction of closed centres B(t) at P decreases by08% as the number of PQ molecules in thepool increases from two to six (results not shown).It is obvious that the number of PQ pool moleculesper PS II centre in the sample is very importantfor the fitting of the model with experimental data.As was shown earlier (Lavergne et al., 1992;Hsu, 1992), there is a high probability that thenumber of PQ molecules which serve one PS II
unit is not the same for all PS II. However, we donot consider the PS II and PQ heterogeneity in thepresent work (see the second assumption of themodel).
It must also be noted, that the area over thefluorescence curve in the linear plot is proportional tothe number of PQ pool molecules, in agreement withliterature predictions (Malkin & Kok, 1966) [see theinset in Fig. 9(a)].
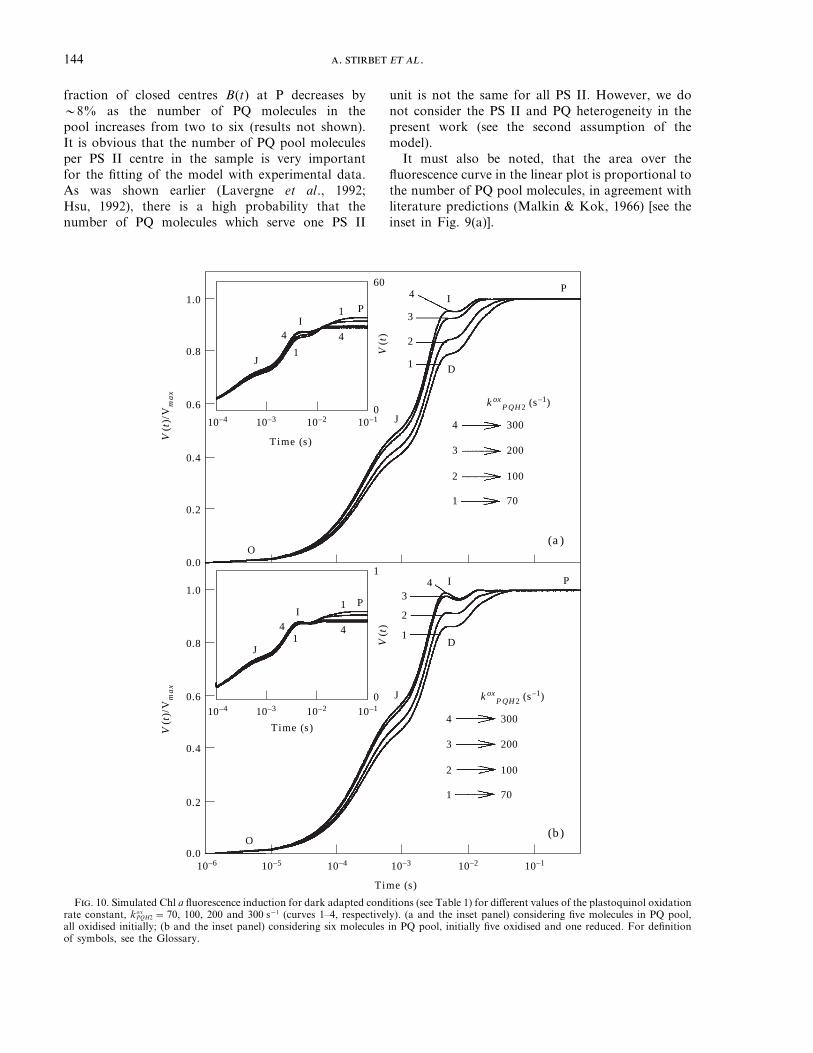
F. 10. Simulated Chl a fluorescence induction for dark adapted conditions (see Table 1) for different values of the plastoquinol oxidationrate constant, kox
PQH2 =70, 100, 200 and 300 s−1 (curves 1–4, respectively). (a and the inset panel) considering five molecules in PQ pool,all oxidised initially; (b and the inset panel) considering six molecules in PQ pool, initially five oxidised and one reduced. For definitionof symbols, see the Glossary.
145
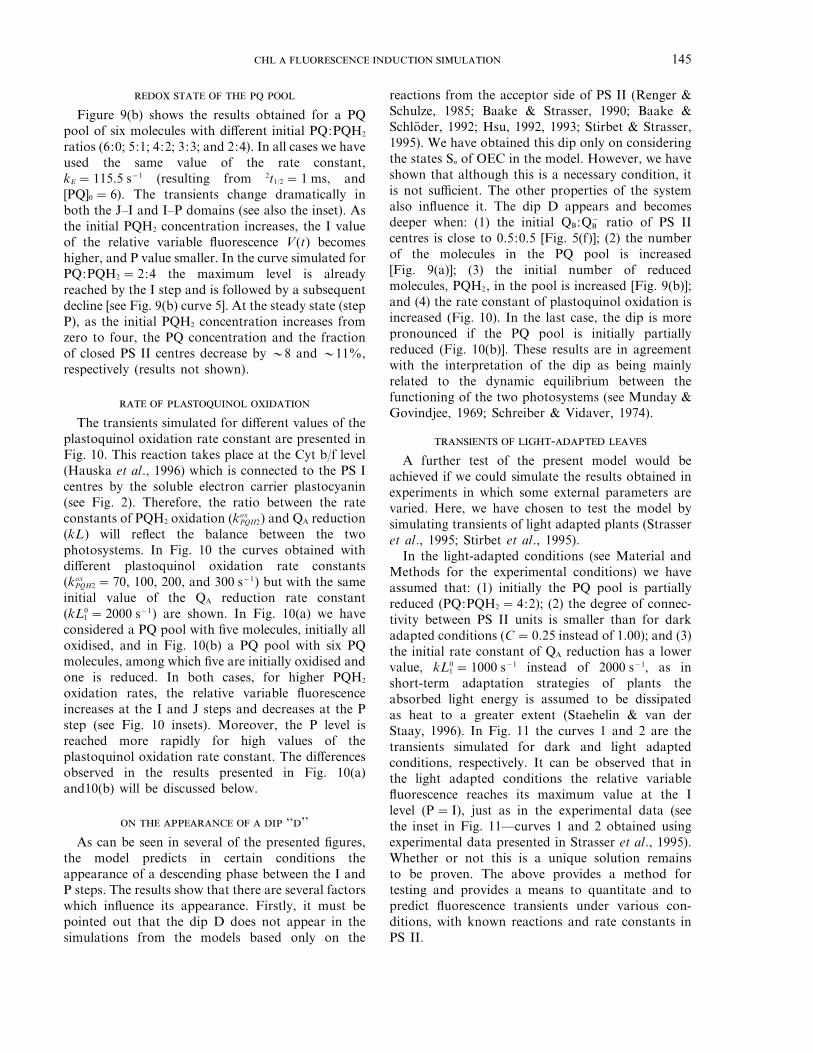
Figure 9(b) shows the results obtained for a PQpool of six molecules with different initial PQ:PQH2
ratios (6:0; 5:1; 4:2; 3:3; and 2:4). In all cases we haveused the same value of the rate constant,kE =115.5 s−1 (resulting from 2t1/2 =1 ms, and[PQ]0 =6). The transients change dramatically inboth the J–I and I–P domains (see also the inset). Asthe initial PQH2 concentration increases, the I valueof the relative variable fluorescence V(t) becomeshigher, and P value smaller. In the curve simulated forPQ:PQH2 =2:4 the maximum level is alreadyreached by the I step and is followed by a subsequentdecline [see Fig. 9(b) curve 5]. At the steady state (stepP), as the initial PQH2 concentration increases fromzero to four, the PQ concentration and the fractionof closed PS II centres decrease by 08 and 011%,respectively (results not shown).
The transients simulated for different values of theplastoquinol oxidation rate constant are presented inFig. 10. This reaction takes place at the Cyt b/f level(Hauska et al., 1996) which is connected to the PS Icentres by the soluble electron carrier plastocyanin(see Fig. 2). Therefore, the ratio between the rateconstants of PQH2 oxidation (kox
PQH2) and QA reduction(kL) will reflect the balance between the twophotosystems. In Fig. 10 the curves obtained withdifferent plastoquinol oxidation rate constants(kox
PQH2 =70, 100, 200, and 300 s−1) but with the sameinitial value of the QA reduction rate constant(kL0
1 =2000 s−1) are shown. In Fig. 10(a) we haveconsidered a PQ pool with five molecules, initially alloxidised, and in Fig. 10(b) a PQ pool with six PQmolecules, among which five are initially oxidised andone is reduced. In both cases, for higher PQH2
oxidation rates, the relative variable fluorescenceincreases at the I and J steps and decreases at the Pstep (see Fig. 10 insets). Moreover, the P level isreached more rapidly for high values of theplastoquinol oxidation rate constant. The differencesobserved in the results presented in Fig. 10(a)and10(b) will be discussed below.
‘‘’’
As can be seen in several of the presented figures,the model predicts in certain conditions theappearance of a descending phase between the I andP steps. The results show that there are several factorswhich influence its appearance. Firstly, it must bepointed out that the dip D does not appear in thesimulations from the models based only on the
reactions from the acceptor side of PS II (Renger &Schulze, 1985; Baake & Strasser, 1990; Baake &Schloder, 1992; Hsu, 1992, 1993; Stirbet & Strasser,1995). We have obtained this dip only on consideringthe states Sn of OEC in the model. However, we haveshown that although this is a necessary condition, itis not sufficient. The other properties of the systemalso influence it. The dip D appears and becomesdeeper when: (1) the initial QB:Q−
B ratio of PS IIcentres is close to 0.5:0.5 [Fig. 5(f)]; (2) the numberof the molecules in the PQ pool is increased[Fig. 9(a)]; (3) the initial number of reducedmolecules, PQH2, in the pool is increased [Fig. 9(b)];and (4) the rate constant of plastoquinol oxidation isincreased (Fig. 10). In the last case, the dip is morepronounced if the PQ pool is initially partiallyreduced (Fig. 10(b)]. These results are in agreementwith the interpretation of the dip as being mainlyrelated to the dynamic equilibrium between thefunctioning of the two photosystems (see Munday &Govindjee, 1969; Schreiber & Vidaver, 1974).
-
A further test of the present model would beachieved if we could simulate the results obtained inexperiments in which some external parameters arevaried. Here, we have chosen to test the model bysimulating transients of light adapted plants (Strasseret al., 1995; Stirbet et al., 1995).
In the light-adapted conditions (see Material andMethods for the experimental conditions) we haveassumed that: (1) initially the PQ pool is partiallyreduced (PQ:PQH2 =4:2); (2) the degree of connec-tivity between PS II units is smaller than for darkadapted conditions (C=0.25 instead of 1.00); and (3)the initial rate constant of QA reduction has a lowervalue, kL0
1 =1000 s−1 instead of 2000 s−1, as inshort-term adaptation strategies of plants theabsorbed light energy is assumed to be dissipatedas heat to a greater extent (Staehelin & van derStaay, 1996). In Fig. 11 the curves 1 and 2 are thetransients simulated for dark and light adaptedconditions, respectively. It can be observed that inthe light adapted conditions the relative variablefluorescence reaches its maximum value at the Ilevel (P=I), just as in the experimental data (seethe inset in Fig. 11—curves 1 and 2 obtained usingexperimental data presented in Strasser et al., 1995).Whether or not this is a unique solution remainsto be proven. The above provides a method fortesting and provides a means to quantitate and topredict fluorescence transients under various con-ditions, with known reactions and rate constants inPS II.

0.2
0.4
0.6
0.8
1.0
0.0
Time (s)
V(t
)/V
ma
x
1 2
1
010–4
10–510–6 10–4 10–3 10–2 10–1
10–3 10–2 10–1
Time (s)
O
J
IP
1
2
V(t
)
. .146
F. 11. Time course of the variable Chl a fluorescence induction, V(t)/Vmax , simulated with input parameters corresponding to the darkadapted and light adapted conditions (see Table 1) (curves 1 and 2, respectively). In the inset, the curves obtained with experimental datapresented in Strasser et al. (1995) are shown. For definition of symbols, see the Glossary.
Conclusions
The mathematical model of the first phase of Chla fluorescence induction in plants presented hereutilises the redox reactions at both the acceptor anddonor sides of PS II [see Figs 2 and 3(a) and (b)]. Theconsistency of the model is supported by the fact thatthe rate constants of the reactions used in simulationshave values close to those reported in the literature(see Table 1). The global rate of reduction of QA wasconsidered to include the light reaction in the model,and we have assumed that its value is two times higherin the S0 and S1 states than in the S2 and S3 states.Partial connectivity between PS II units [see eqns(1)–(3), and PQ non-photochemical quenching (seeAppendix) were also needed to explain the experimen-tal data. The simulated fluorescence transient parallelthe characteristic O–J–I–P steps observed in exper-imental transients. According to this model, thepolyphasic O–J–I–P shape of the induction curve isdue to the dynamic variations of the concentrationsof various redox states of PS II units [see Fig. 4(a)].At the J step, Q−
A QB and Q−A Q−
B states predominate.A mixture of different closed states of PS II units ispresent at the I and P steps, the Q−
A QBH2 state havingthe highest concentration.
The simulation presented in Fig. 4 shows that evenwith high light intensity the PS II units are not all inthe closed state when the maximum fluorescence yield
is attained, as the reoxidation of PQH2 by PS I isactive. Only in the case of PS I inhibition can thefraction of PS II closed centres reach the maximumvalue, B=1.
It was shown that the connectivity between PS IIantenna influences the function of the photosyntheticsystems both quantitatively (enhancing the electrontransport) and qualitatively (increasing the stability)(see Fig. 8). The connectivity parameter between PSII units strongly modifies the shape of the normalisedrelative variable fluorescence curve, mainly byslowing down the O–J phase [see Figs 4(b) and 7(b)].
The PQ non-photochemical quenching affects inparticular the I step of the normalised transient,decreasing its value [see Fig. 4(b)].
The number of plastoquinone molecules per PS IIcentre was assumed to be identical for all the centresin this current model (i.e. a homogeneous distributionof PQ). This, of course, does not challenge theexistence of heterogeneity (Melis & Homann, 1975).The simulated transients obtained with differentnumber of molecules in the PQ pool have modifiedshapes, especially in the I–P region [Fig. 9(a) inset].We have shown that the relationship between thecomplementary area of the fluorescence transient andthe number of plastoquinone molecules is still validwhen non-photochemical quenching by the PQ-poolis considered. Moreover, the model predicts that the
147
initial degree of PQ pool oxidation also influences thetransient [Fig. 9(b)].
The ratio between PS II and PS I activity, expressedhere as the ratio between the rate constants of QA
reduction and PQH2 oxidation, also strongly influ-ences the transient. The relative variable fluorescenceintensity at the J and I steps increases as the activityof PS I is accelerated, and for high PS I activity (i.e.plastoquinol oxidation rate constant q300 s−1) it canreach its maximum value as early as the I level[Fig. 10(b)]. At the same time, the P step decreaseswith the increase of PS I activity (Figs 9 and 10insets).
The results presented here show that in certainconditions, a descending region of the curve appearsbetween the I and P steps, usually denoted as dip D.It was not possible to simulate this dip with any of themodels that use only the acceptor side of PS II.Therefore, we can conclude that it is mainly due to theSn states. However, this dip is also influenced by manyother factors, such as the ratio between the rates ofPS II and PS I activities, the degree of PS IIconnectivity, the initial QB:Q−
B ratio, the number ofmolecules in the PQ pool, and the initial numberof oxidised plastoquinone molecules in the pool.The dip is more pronounced when the relativeactivity of PS I is increased, the connectivityparameter C is higher, the initial value of the QB:Q−
B
ratio is close to 0.5:0.5, the number of molecules inthe PQ pool is higher, and the initial number ofoxidised plastoquinone molecules in the pool ishigher.
The simulated curves of fluorescence induction ofthe light adapted plants exhibit, as in the experimentalones, only the O, J, and I(=P) levels (Fig. 11).
In conclusion, the model presented here allows thepossibility to obtain quantitative information fromfluorescence transients of leaves, regarding theindividual PS II reactions and the interaction of PS IIwith PS I, which are often difficult to measuredirectly. The simulations also take into account thedonor side of PS II and the non-photochemicalquenching by PQ, until now neglected. The next stepto be achieved in this work is to provide the fitting ofexperimental data with the theoretical data obtainedthrough numerical simulation, in order to calculatethe values of the input parameters of the model. Weexpect to establish in this way, data banks for theenormous amount of samples being measured inecological and environmental investigations.
We thank Alaka Srivastava for the experimental data onfluorescence transients of light-adapted leaves used in thispaper, and Merope Tsimilli for helpful discussions. This
work was supported by Swiss National Foundation (GrantNo. 3100-046860.96/1).
REFERENCES
B, E. & S, J. P. (1992). Modeling the fast fluorescencerise of photosynthesis. Bull. Math. Biol. 54, 999–1021.
B, E. & S, R.J. (1990). A differential equation modelfor the description of the fast fluorescence rise (O–I–D–P-transient) in leaves. In: Current Research in Photosynthesis,Vol. 1 (Baltscheffsky, M., ed.), pp. 567–570. The Netherlands:Kluwer Academic Publisher.
B, G.T. (1987). The photosynthetic oxygen-evolvingprocess. In: New Comprehensive Biochemistry, Vol. 15, Photo-synthesis (Amesz, J., ed.), pp. 125–158. Amsterdam: Elsevier.
B, G. T., B, R. E. & S, K. (1976). Reactionkinetics for positive charge accumulation on the water side ofchloroplast photosystem II. FEBS Lett. 61, 286–289.
B-B, B. (1973). Electron transfer between the twophotosystems in spinach chloroplasts. Biochim. Biophys. Acta314, 250–256.
B, R. D. (1996). Oxygen evolution. Structure, dynamics, andenergy conversion efficiency in photosystem II. In: Advances inPhotosynthesis, Vol. 4, Oxygenic Photosynthesis: The LightReactions (Ort, D. R. &. Yocum, C. F., eds), pp. 137–164. TheNetherlands: Kluwer Academic Publishers.
B, W. L. (1972). On the primary nature of fluorescence yieldschanges associated with photosynthesis. Proc. Natl. Acad. Sci.U.S.A. 69, 3420–2422.
B, W. L. (1978). Energy distribution in the photochemicalapparatus of photosynthesis. Ann. Rev. Plant Physiol. 29,345–378.
B, W. L. (1980). Energy transfer between Photosystem IIunits in a connected package model of the photochemicalapparatus of photosynthesis. Proc. Natl. Acad. Sci. U.S.A. 77,4697–4701.
C, A. R. & W, C. A. (1983). The electrochemicaldomain of photosynthesis. Biochim. Biophys. Acta 726, 149–185.
C, A. R., R, H. H. & S, M. (1984). Reactions ofquinols at catalytic sites; a diffusional role in H-transfer. In:Advances in Photosynthesis Research, Vol. 1 (Sybesma, C., ed.),pp. 461–468. The Hague: Martinus Nijhoff/Dr. W. Junk.
D, H. (1994). Molecular mechanisms and quantitative models ofvariable photosystem II fluorescence. Photochem. Photobiol. 60,1–23.
D, R. (1971). New results about chlorophyll fluorescence ‘‘invitro’’. In: Proceedings of the 2nd International Congress onPhotosynthesis Research (Forti, G., Avron, M. & Melandri, A.,eds), pp. 187–195. The Netherlands: W. Junk.
D, J., D, A., G, N. E., P, G. & B,J. (1983). Probing fluorescence induction in chloroplasts on ananosecond time scale utilizing picoseconde laser pulse pairs.Biochim. Biophys. Acta 752, 444–454.
D, B. A. (1977). Dependence of the deactivation reactions ofPhotosystem II on the redox state of the plastoquinone pool A,varied under anaerobic conditions. Equilibria on the acceptorside of Photosystem II. Biochim. Biophys. Acta 460, 247–258.
D, B. A. & B, G. T. (1996). Structure, dynamics, andenergy conversion efficiency in photosystem II. In: Advances inPhotosynthesis Vol. 4, Oxygenic Photosynthesis: The LightReactions (Ort, D. R. & Yocum, C. F., eds), pp. 213–247. TheNetherlands: Kluwer Academic Publishers.
D, L. M. N. & S, H. E. (1963). Mechanism of the twophotochemical reactions in algae as studied by means offluorescence. In: Studies on Microalgae and PhotosyntheticBacteria (Japanese Society of Plant Physiologists, ed.),pp. 353–372. Tokyo: University of Tokyo Press.
F, B., K, B. & MG, M. P. (1971). Cooperation ofcharges in photosynthetic O2 evolution. II. Damping of flashyield oscillations deactivation. Photochem. Photobiol. 14,307–321.

. .148
F, D. C. & M, P. (1986). Fluorescence and othercharacteristics of blue-green algae (cyanobacteria), red algae, andcryptomonads. In: Light Emission by Plants and Bacteria(Govindjee, Amesz, J. & Fork, D. C., eds), pp. 451–496.New York: Academic Press.
G (1995). Sixty-three years since Kautsky: chlorophyll afluorescence. Aust. J. Plant Physiol. 22, 131–160.
G & P, G. (1971). Chlorophyll fluorescenceand photosynthesis: fluorescence transients. Photophysiology 6,1–50.
G, S. & W, M. R. (1996). Excitation energytransfer and charge separation in the isolated Photosystem IIreaction center. Photosynth. Res. 48, 83–97.
H, W. (1984). Photosynthetic electron transport in higherplants. Ann. Rev. Plant. Physiol. 35, 659–693.
H, O. & W, T. (1990). Current perceptions ofphotosystem II. Photosynth. Res. 23, 131–162.
H, G., S, M. & B, M. (1996). The cytochromeb6f complex—composition, structure and function. In: Advancesin Photosynthesis. Vol. IV. Oxygenic Photosynthesis: The LightReactions (Ort, D. R. & Yocum, C. F., eds), pp. 377–398. TheNetherlands: Kluwer Academic Publishers.
H, A. C. (1980). LSODE and LSOI, two initial value ofordinary differential equation solvers. A.C.M. Signum News-letter, 15, 10–11.
H, B.-D. (1992). A theoretical study on the fluorescenceinduction curve of spinach thylakoids in the absence of DCMU.Biochim. Biophys. Acta 1140, 30–36.
H, B.-D. (1993). Evidence for the contribution of the S-statetransitions of oxygen evolution to the initial phase offluorescence induction. Photosynth. Res. 36, 81–88.
H, B.-D., L, Y.-S. & J, I.-R. (1989). A method for analysisof fluorescence induction curve from DCMU-poisoned chloro-plasts. Biochim. Biophys. Acta 975, 44–49.
J, A. & J, P. (1964). Etude cinetique de la reactionphotochimique liberant l’oxygene au cours de la photosynthese.C.R. Acad. Sci. Paris 258, 4622–4625.
J, P., B, P. & J, A. (1973). New evidencesupporting energy transfer between photosynthetic units.Biochim. Biophys. Acta 305, 317–328.
J, P., J, A., B, B. & B, G. (1971). Studies ofsystem II photocentres by comparative measurements ofluminescence, fluorescence, and oxygen emission. Photochem.Photobiol. 14, 287–305.
J, M. K. & M, P. (1995). Probing photosyntheticperformance by chlorophyll a fluorescence: analysis andinterpretation of fluorescence parameters. J. Sci. Ind. Res. 54,155–174.
K, K. K., M, R. M., J, S. K., B, K.E. & C, S. M. (1992). Alternative measure of photosystemII electron transfer inhibition in anthraquinone-treated chloro-plasts. Photochem. Photobiol. 55, 125–132.
K, H. & H, A. (1931). Neue Versuche zurKohlensauereassimilation. Naturwissenschaften 48, 964.
K, B., F, B. & MG, M. (1970). Cooperation ofcharges in photosynthetic oxygen evolution. I—A linearfour-step mechanism. Photochem. Photobiol. 11, 457–475.
K, G. H. & W, E. (1991). Chlorophyll fluorescence andphotosynthesis: the basics. Ann. Rev. Plant. Physiol. Plant. Mol.Biol. 42, 313–349.
K, H. J., T-M, M. & S, R. J. (1997).Light stress provokes plastic and elastic modifications instructure and function of photosystem II in camellia leaves.Physiol. Plantarum 101, 265–277.
L, J. R. (1983). Quenching of fluorescence. In: Principlesof Fluorescence Spectroscopy, Chap. 9, pp. 258–301. New York:Plenum Press.
L, P., B, T. T. & R, E. (1956). Quantumyields of fluorescence of plant pigments. Science 124,585–586.
L, J. & L, E. (1993). Properties of inactive photosystemII centres. Photosynth. Res. 35, 323–343.
L, J. & T, H.-W. (1995). Theory of fluorescenceinduction in photosystem II: derivation of analytical expressionsin a model including exciton-radical-pair equilibrium andrestricted energy transfer between photosynthetic units. Biophys.J. 68, 2474–2492.
L, J., B, J.-P. & J, P. (1992). Plastoquinonecompartimentation in chloroplasts. II—Theoretical aspects.Biochim. Biophys. Acta 1101, 13–22.
L, S. S. (1971). Solute perturbation of protein fluorescence.Quenching of the tryptophyl fluorescence of model compoundsand of lysozime by iodine ion. Biochemistry 10, 3254–3263.
M, S. & K, B. (1966). Fluorescence induction studies inisolated chloroplasts. I—Number of components involved in thereaction and quantum yields. Biochim. Biophys. Acta 126,413–432.
M, A. & H, P. H. (1975). Kinetic analysis of thefluorescence induction in DCMU poisoned chloroplasts.Photochem. Photobiol. 21, 431–437.
M, J. C., J. & G (1969). Light induced changes inthe fluorescence yield of chlorophyll a in vivo. III—The dip andthe peak in the fluorescence transient of Chlorella pyrenoidosa.Biophys. J. 9, 1–21.
N, C. & S, U. (1987). The polyphasic rise ofchlorophyll fluorescence upon onset of strong continuous illumi-nation: I—Saturation characteristics and partial control by thephotosystem II acceptor side. Z. Naturforsch. 42c, 1246–1254.
P, G. (1976). Movement of excitation in the photosynthesisdomain of photosystem II. J. theor. Biol. 58, 237–252.
P, G. (1975). Chlorophyll fluorescence: an intrinsicprobe of photosynthesis. In: Bioenergetics of Photosynthesis(Govindjee, ed.), pp. 319–371. New York: Academic Press.
R, G. (1993). Water cleavage by solar radiation—an inspiringchallenge of photosynthesis research. Photosynth. Res. 38,229–247.
R, G. & S, A. (1985). Quantitative analysis offluorescence induction curves in isolated spinach chloroplasts.Photobiochem. Photobiophys. 9, 79–87.
R, H. H. & C, A. R. (1983). Kinetics of theoxidation-reduction reactions of the Photosystem II quinoneacceptor complex, and the pathway for deactivation. FEBS Lett.153, 221–226.
R, A. R., G & I, Y. (1984). Chargeaccumulation and photochemistry in leaves studied bythermoluminiscence and delayed light emission. Proc. Natl.Acad. Sci. U.S.A. 81, 1107–1111.
S, U. & B, W. (1993). Progress in chlorophyllfluorescence research: major developments during the past yearsin retrospect. Prog. Bot. 54, 151–173.
S, U. & V, W. (1974). Chlorophyll fluorescenceinduction in anaerobic Scenedesmus obliquus. Biochim. Biophys.Acta 368, 97–112.
S, V. P. & G (1993). Insight into the relationshipof chlorophyll a fluorescence yield to the concentration of itsnatural quenchers in oxygenic photosynthesis. Proc. Natl. Acad.Sci. U.S.A. 90, 7466–7469.
S, M. (1993). Biochemical, biophysical and structuralcharacterisation of the isolated photosystem II reaction centercomplex. In: The Photosynthetic Reaction Center, Vol. 1(Deisenhofer, J. & Norris, J., eds), pp. 319–356. New York:Academic Press.
S, A., R, H. & D, L. N. M. (1979).Chlorophyll a fluorescence as a monitor of nanosecond reductionof the photooxidized primary donor P680+ of photosystem II.Biochim. Biophys. Acta 548, 536–551.
S, A., S, R. J. & G (1995a). Differentialeffects of dimethylbenzoquinone and dichlorobenzoquinone onchlorophyll fluorescence transient in spinach thylakoid. J.Photochem. Photobiol. 31, 163–189.
S, A., S, R. J. & G (1995b). Polyphasicrise of chlorophyll a fluorescence in herbicide-resistant D1mutants of Chlamidomonas reinardtii. Photosynth. Res. 43,131–141.

149
S, L. A. & S, G. W. M. (1996). Structure,composition, functional organization and dynamic properties ofthylakoid membranes. In: Advances in Photosynthesis. Vol. 4.Oxygenic Photosynthesis: The Light Reactions (Ort, D. R. &Yocum, C. F., eds), pp. 11–30. The Netherlands: KluwerAcademic Publishers.
S, H. H. & W, H. T. (1969). Quantitative treatment of thefunction of plastoquinone in photosynthesis. Z. Naturforsch.24B, 1588–1598.
S,A.D.&S,R. J. (1995). Numerical simulation of thefluorescence induction in plants. Archs. Sci. Geneve 48, 41–60.
S, A. D. & S, R. J. (1996). Numerical simulation ofthe in vivo fluorescence in plants. Math. Comp. Simulations 42,245–253.
S, A. D., G, S, B. J. & S, R. J. (1995).Numerical simulation of chlorophyll a fluorescence induction inplants. In: Photosynthesis: from Light to Biosphere, Vol. 2(Mathis, P., ed.), pp. 919–922. The Netherlands: KluwerAcademic Publishers.
S, R. J. (1978). The grouping model of plant photo-synthesis. In: Chloroplast Development (Akoyunoglou, G. et al.,eds), pp. 513–524. The Netherlands: Elsevier.
S, R. J. (1981). The grouping model of plant photo-synthesis: heterogeneity of photosynthetic units in thylakoids. In:Structure and Molecular Organization of the PhotosyntheticApparatus (Akoyunoglou, G., ed.), pp. 727–737. Philadelphia:Balaban International Science Service.
S, R. J. & G (1991). The F0 and the O–J–I–Pfluorescence rise in higher plants and algae. In: Regulation ofChloroplast Biogenesis (Argyroudi-Akoyunoglou, J. H., ed.),pp. 423–426. New York: Plenum Press.
S, R. J. & G (1992). On the O–J–I–P fluorescenttransient in leaves and D1 mutants of Chlamydomonasreinhardtii. In: Research in Photosynthesis, Vol. 2 (Murata, N.,ed.), pp. 20–32. The Netherlands: Kluwer Academic Publishers.
S, R. J., E, P. & G (1992). Anequilibrium model for electron transfer in photosystem IIacceptor complex: an application to Chlamidomonas reinhardtiicells of D1 mutants and those treated with formate. Archs. Sci.Geneve 45, 207–224.
S, R. J, S, A. & G (1995). Polyphasicchlorophyll a fluorescence transient in plants and cyanobacteria.Photochem. Photobiol. 61, 32–42.
T, H.-W. & L, J. (1994). Fluorescence induction fromphotosystem II: analytical equations for the yields ofphotochemistry and fluorescence derived from analysis of amodel including exciton radical pair equilibrium and restrictedenergy transfer between photosynthetic units. Austr. J. PlantPhysiol. 22, 183–193.
T, H.-W., G, Y. & W, K. (1993). Theoretical fluorescenceinduction curves derived from coupled differential equationsdescribing the primary photochemistry of photosystem II by anexciton-radical pair equilibrium. Biophys. J. 64, 974–988.
V, B. R. (1981). Electron-dependent competition betweenplastoquinone and inhibitors for binding to photosystem II.FEBS Lett. 126, 277–281.
V, B. R. & A, J. (1974). Charge accumulation at thereducing side of system 2 of photosynthesis. Biochim. Biophys.Acta 325, 138–148.
V, C., E, A.-L. & B, J.-M. (1979). Quench-ing of the system II chlorophyll fluorescence by theplastoquinone pool. Biochim. Biophys. Acta 545, 519–527.
W, F. A. (1978). Determination and modification of theredox state of the secondary acceptor of photosystem II in thedark. Biochim. Biophys. Acta 503, 263–273.
APPENDIX
The experimentally measured relative variable Chla fluorescence is affected by the PQ pool; oxidised PQ
pool molecules quench antenna Chl a fluorescence(Vernotte et al., 1979). Below, we deduce arelationship between the quenched, V(t), and theunquenched, Vu(t), relative variable fluorescence.
The main assumption is that Chl a fluorescencequenching induced by oxidised plastoquinones fromthe PQ pool obeys the Stern–Volmer relationship(Lehrer, 1971; Vernotte, 1979; Lakowicz, 1983;Karukstis et al., 1992; Lavergne & Leci, 1993,Srivastava et al., 1995a). For a homogeneouspopulation of fluorescence centres that shares thesame PQ pool we can write:
Fu(t)F(t)
=1+K[PQ](t), (A.1)
where Fu(t) is the unquenched fluorescence, F(t) is thequenched fluorescence, [PQ](t) is the oxidisedplastoquinone concentration, all at the time t, and Kis the Stern–Volmer quenching constant of that PS IIpopulation. Experimental results (Vernotte et al.,1979; Srivastava et al., 1995a) have shown that thevalue of K is not the same for closed and open centres.These values of K, Kcl and Kop, can be obtained fromfluorescence induction experiments with DCMU anddithionite treated leaves (see Vernotte et al., 1979).According to the Stern–Volmer equation:
FDCMU+ dithioniteM
FDCMUM
=1
1− fcl =1+Kcl[PQ]total , (A.2)
and
FDCMU+ dithionite0
FDCMU0
=1
1− fop =1+Kop[PQ]total . (A.3)
where fcl and fop are the fractions of the fluorescenceintensity that have been reduced by PQ non-photochemical quenching for a system with all PS IIunits closed and open, respectively. The values offcl and fop, measured in chloroplasts by Vernotteet al. (1979), have been 20–30% and 5–10%,respectively.
For a heterogeneous PS II population (i.e. withopen and closed units) the ratio between theunquenched and quenched fluorescence can bewritten as:
Fu(t)F(t)
=1+K (t)[PQ](t) (A.4)
where K(t) is a function depending on Kcl and Kop,which was approximated with the relationship:
K(t)=B(t)(Kcl −Kop)+Kop. (A.5)

. .150
We have also assumed that the fraction of closedcentres does not depend on this non-photochemicalquenching by oxidised PQ.
The relative variable fluorescence V(t)= [F(t) −F0]/(FM −F0) can be written as a function of theexperimental ratio N=FV /F0 = (FM −F0)/F0, whereFV is the total variable fluorescence, F0 the initialfluorescence, and FM the maximum value of thefluorescence. We have:
V(t)=1N 0F(t)
F0−11. (A.6)
A semi-empirical relationship of the relativevariable fluorescence, V(t), as a function of the
unquenched relative variable fluorescence, Vu(t), wasobtained using eqs (A.4)–(A.6):
V(t)=K0[PQ]0 −K(t)[PQ](t)
N(1+K(t)[PQ](t))
+Vu(t)(N+1)(1+KM [PQ]M )− (1+K0[PQ]0)
N(1+K(t)[PQ](t))
(A.7)
where: K0 = the initial value of K(t), KM =themaximal value of K(t), [PQ]0 = the initial value of[PQ](t), and [PQ]M =the value of [PQ](t) corrspond-ing to KM .
Glossary
B(t): fraction of the closed PS II centres at time tBmax : highest value of theoretical B(t)
C: connectivity parameter, a numerical constant depending on the degreeof connectivity between the PSII units [see the eqns (1) and (2)]
F(t): fluorescence at time tFM : maximal fluorescence
FDCMUM : maximal fluorescence in the presence of DCMU
FDCMU+ dithioniteM : maximal fluorescence in the presence of DCMU and dithionite
FDCMU0 : initial fluorescence in the presence of DCMU
FDCMU+ dithionite0 : initial fluorescence in the presence of DCMU and dithionite
F0: initial fluorescenceFP : fluorescence at the peak of the transientFV : total variable fluorescence, equal to FM −F0
fcl and fop: fraction of the fluorescence quenching for all closed and all open PSII centres respectively
K: Stern–Volmer constantK(t): theoretical Stern–Volmer ‘‘constant’’ for a system with both closed and
open PS II centres at time tKcl and Kop: Stern–Volmer constant for all closed and all open PS II centres
respectivelyKM : maximal value of K(t)K0: initial value of K(t)
k1AB and k1
BA : forward and backward rate constants of the first reduction of QB byQ−
A
k2AB and k2
BA : forward and backward rate constants of the second reduction of QB
by Q−A
kE and k−E : forward and backward rate constants of the exchange reaction betweenQBH2 and PQ from the pool
kH and k−H : forward and backward rate constants of Q2−B protonation
koxPQH2: rate constant of plastoquinol oxidationkL: global rate constant of the light reaction leading to QA reductionkL0: initial rate constant of the light reaction leading to QA reduction
kL0, kL1, kL2, and kL3: rate constants of the light reaction leading to QA reduction for PS IIunits with OEC in S0, S1, S2 and S3 states, respectively
kL00 , kL0
1 , kL02 , and kL0
3 : initial rate constants of the light reaction leading to QA reduction forPS II units with OEC in S0, S1 , S2 and S3 states, respectively
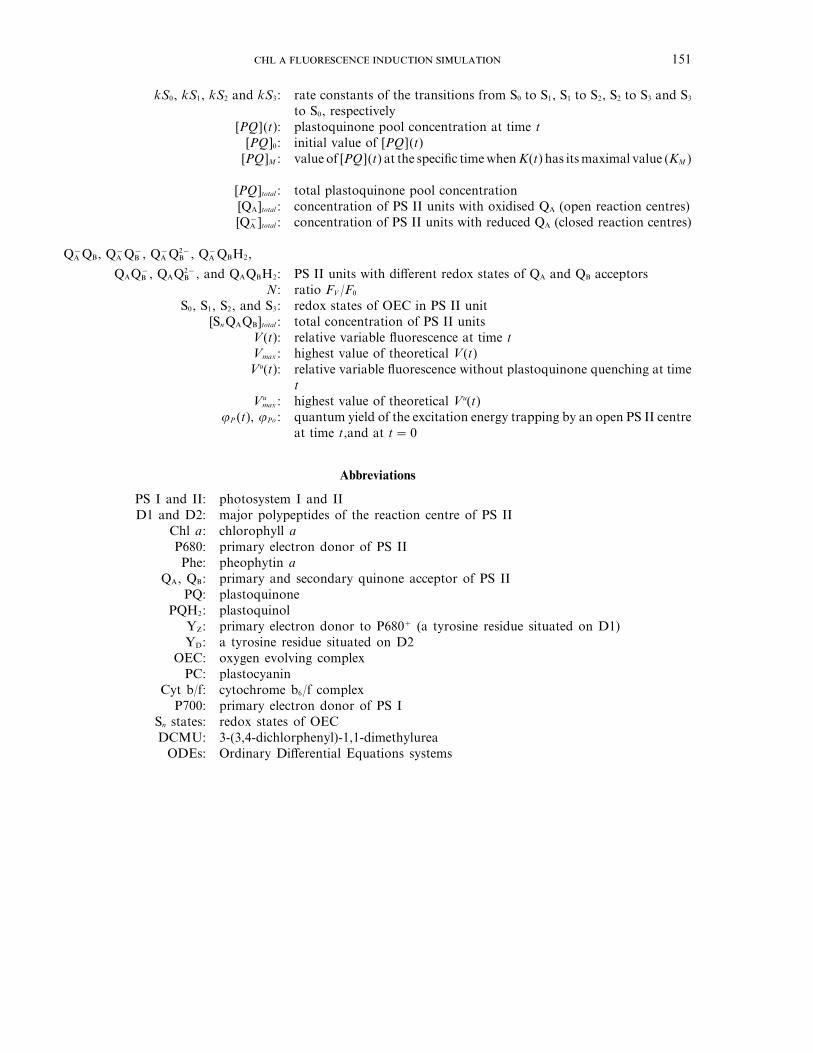
151
kS0, kS1, kS2 and kS3: rate constants of the transitions from S0 to S1, S1 to S2, S2 to S3 and S3
to S0, respectively[PQ](t): plastoquinone pool concentration at time t
[PQ]0: initial value of [PQ](t)[PQ]M : value of [PQ](t) at the specific timewhenK(t) has itsmaximal value (KM )
[PQ]total : total plastoquinone pool concentration[QA]total : concentration of PS II units with oxidised QA (open reaction centres)[Q−
A ]total : concentration of PS II units with reduced QA (closed reaction centres)
Q−A QB, Q−
A Q−B , Q−
A Q2−B , Q−
A QBH2,
QAQ−B , QAQ2−
B , and QAQBH2: PS II units with different redox states of QA and QB acceptorsN: ratio FV /F0
S0, S1, S2, and S3: redox states of OEC in PS II unit[SnQAQB]total : total concentration of PS II units
V(t): relative variable fluorescence at time tVmax : highest value of theoretical V(t)Vu(t): relative variable fluorescence without plastoquinone quenching at time
tVu
max : highest value of theoretical Vu(t)8P (t), 8Po : quantum yield of the excitation energy trapping by an open PS II centre
at time t,and at t=0
Abbreviations
PS I and II: photosystem I and IID1 and D2: major polypeptides of the reaction centre of PS II
Chl a: chlorophyll aP680: primary electron donor of PS IIPhe: pheophytin a
QA, QB: primary and secondary quinone acceptor of PS IIPQ: plastoquinone
PQH2: plastoquinolYZ: primary electron donor to P680+ (a tyrosine residue situated on D1)YD: a tyrosine residue situated on D2
OEC: oxygen evolving complexPC: plastocyanin
Cyt b/f: cytochrome b6/f complexP700: primary electron donor of PS I
Sn states: redox states of OECDCMU: 3-(3,4-dichlorphenyl)-1,1-dimethylurea
ODEs: Ordinary Differential Equations systems