ChIld lAbOuR, GENdER INEquAlIty ANd RuRAl/uRbAN ...
70
WORKING PAPER NO.20 CHILD LABOUR, GENDER INEQUALITY AND RURAL/URBAN DISPARITIES: how can Ethiopia’s national development strategies be revised to address negative spill-over impacts on child education and wellbeing? Tassew Woldehanna Bekele Tefera Nicola Jones Alebel Bayrau
-
Upload
khangminh22 -
Category
Documents
-
view
0 -
download
0
Transcript of ChIld lAbOuR, GENdER INEquAlIty ANd RuRAl/uRbAN ...

W O R K I N G P A P E R N O . 2 0
ChIld lAbOuR, GENdER INEquAlIty ANd RuRAl/uRbAN dIsPARItIEs:how can Ethiopia’s national development strategies be revised to address negative spill-over impacts on child education and wellbeing?tassew Woldehannabekele teferaNicola JonesAlebel bayrau
this paper examines the Ethiopian Government's emphasis on the intensification of agricultural activities in order to increase livelihood options and provide better safety nets for the poor (e.g. through food or cash-for-work programmes).
drawing on a sample of 1999 households with at least one child aged 6 to 17 months in 2002, and from additional household data collected from 3115 children aged 7 to 17 years from twenty sentinel sites, the young lives Project sought to understand the impact on child labour and child schooling of public policy interventions formulated within the PRsP, and how changes are mediated through gender and rural-urban differences.
these were the key findings: children were commonly involved in fetching water, firewood and dung both for household use and sale, although they were more likely to attend school when there was adequate household labour. school attendance was significantly lower in rural than in urban sites, while dropout rates were dramatically higher in rural areas. Maternal education levels significantly decreased the likelihood of children combining work and school. Increased land and livestock ownership led to a greater demand for child labour and reduced school enrolment. the involvement of households in more diversified activities increased the demand for labour which is frequently met by children, particularly boys, with girls commonly substituting for their mothers.
In light of the above, young lives recommends the following measures to help reduce child labour and increase schooling:
introducing cash transfers and credit provisions to poor families to offset school costs especially for older
and rural children, and to cushion the adverse impact of household shocks;
improving school availability in rural areas and strengthening the policy focus on female education, including
investment in adult literacy programmes;
introducing credit measures to facilitate labour transactions;
modernising domestic and farm technologies to reduce labour intensity;
rationalizing livestock raising patterns;
improving women’s productive work opportunities while simultaneously ensuring that their care work
burden is reduced by considering subsidized community childcare arrangements or preschool services;
introducing safety nets, particularly for female-headed households;
improving community infrastructure, especially energy and water sources and affordable transportation;
reducing vulnerability to shocks such as drought through investing in irrigation schemes.
Published by
young lives save the Children uK 1 st John's lane london EC1M 4AR
tel: 44 (0) 20 7012 6796 Fax: 44 (0) 20 7012 6963 Web: www.younglives.org.uk
IsbN 1-904427-21-9 First Published: 2005
All rights reserved. this publication is copyright, but may be reproduced by any method without fee or prior permission for teaching purposes, though not for resale, providing the usual acknowledgement of source is recognised in terms of citation. For copying in other circumstances, prior written permission must be obtained from the publisher and a fee may be payable.
designed and typeset by Copyprint uK limited
•
•
•
•
•
•
•
•
•
Young Lives is an international longitudinal study of childhood poverty, taking place in Ethiopia, India, Peru and Vietnam, and funded by DFID. The project aims to improve our understanding of the causes and consequences of childhood poverty in the developing world by following the lives of a group of 8,000 children and their families over a 15-year period. Through the involvement of academic, government and NGO partners in the aforementioned countries, South Africa and the UK, the Young Lives project will highlight ways in which policy can be improved to more effectively tackle child poverty.

the young lives Partners Centre for Economic and social studies (CEss), India
department of Economics, university of Addis Ababa, Ethiopia
Ethiopian development Research Institute, Addis Ababa, Ethiopia
General statistical Office, Government of Vietnam
Grupo de Análisis Para El desarrollo (GRAdE), Peru
Institute of development studies, university of sussex, uK
Instituto de Investigación Nutricional (IIN), Peru
london school of hygiene and tropical Medicine, uK
Medical Research Council of south Africa
RAu university, Johannesburg, south Africa
Research and training Centre for Community development, Vietnam
save the Children uK
south bank university, uK
statistical services Centre, university of Reading, uK

Child labour, gender inequality and rural/urban disparities
Child labour, gender inequality and rural/urban disparities:
how can ethiopia’s national development strategies be revised to address negative spill-over impacts on child education and wellbeing?tassew Woldehannabekele teferanicola Jonesalebel bayrau
WorKing paper no.20

Child labour, gender inequality and rural/urban disparities
ii
ii
prefaceThispaperisoneofaseriesofYoungLivesProjectworkingpapers,aninnovativelongitudinalstudyofchildhoodpovertyinEthiopia,India(AndhraPradeshState),PeruandVietnam.Between2002and2015,some2000childrenineachcountryarebeingtrackedandsurveyedat3-4yearintervalsfromwhentheyare1until14yearsofage.Inaddition,1000olderchildrenineachcountryarebeingfollowedfromwhentheyareaged8years.
YoungLivesisajointresearchandpolicyinitiativeco-ordinatedbyanacademicconsortiumandSavetheChildrenUK,incorporatingbothinter-disciplinaryandNorth-Southcollaboration.InEthiopia,theresearchcomponentoftheprojectishousedundertheEthiopianDevelopmentResearchInstitute,whilethepolicymonitoring,engagementandadvocacycomponentsareledbySavetheChildrenUK,Ethiopia.
YoungLivesseeksto:
producelong-termdataonchildrenandpovertyinthefourresearchcountries
drawonthisdatatodevelopanuancedandcomparativeunderstandingofchildhoodpovertydynamicstoinformnationalpolicyagendas
traceassociationsbetweenkeymacropolicytrendsandchildoutcomesandusethesefindingsasabasistoadvocateforpolicychoicesatmacroandmesolevelsthatfacilitatethereductionofchildhoodpoverty
activelyengagewithongoingworkonpovertyalleviationandreduction,involvingstakeholderswhomayuseorbeimpactedbytheresearchthroughouttheresearchdesign,datacollectionandanalyses,anddisseminationstages
fosterpublicconcernabout,andencouragepoliticalmotivationtoacton,childhoodpovertyissuesthroughitsadvocacyandmediaworkatbothnationalandinternationallevels.
InEthiopia,theprojecthasreceivedfinancialsupportfromtheUKDepartmentforInternationalDevelopmentandCanada’sInternationalDevelopmentResearchCentre.Thissupportisgratefullyacknowledged.
Forfurtherinformationandtodownloadallourpublications,visitwww.younglives.org.uk
•
•
•
•
•

Child labour, gender inequality and rural/urban disparities
iiiiii
the authorsTheauthorsofthispaperarebasedatthefollowinginstitutionsandthecontactpersonforqueries/commentsonthispaperisTassewWoldehannawhocanbecontactedatthegivenemailaddress:
TassewWoldehanna,DepartmentofEconomics,AddisAbabaUniversity,Ethiopia;e-mail:[email protected]
BekeleTefera,SavetheChildrenUK,Ethiopia
NicolaJones,YoungLives,SavetheChildrenUK,London
AlebelBayrau,EthiopianDevelopmentResearchInstitute(EDRI),YoungLivesProject,Ethiopia
acknowledgementsHelpfulcommentsonthispaperwereprovidedbyEdoardoMasset,HowardWhite,RachelMarcusandColetteSolomon,whicharegratefullyacknowledged.WealsothankBamlakAlamerewforprovidingresearchassistanceandAmareAsgedom,ZelalemLetyibeluandHirutBekeleforcarryingoutthebackgroundqualitativestudy.ThepaperwaseditedbyColetteSolomon.Allerrorsandopinionsexpressedarethoseoftheauthors.

Child labour, gender inequality and rural/urban disparities
iv
abstractTheEthiopianGovernmenthasemphasisedtheintensificationofagriculturalactivitiesinordertoincreaselivelihoodoptionsandprovidebettersafetynetsforthepoor(e.g.throughfoodorcash-for-workprogrammes).
Drawingonasampleof1999householdswithatleastonechildaged6to17monthsin2002,andfromadditionalhouseholddatacollectedfrom3115childrenaged7to17yearsfromtwentysentinelsites,theYoungLivesProjectsoughttounderstandtheimpactonchildlabourandchildschoolingofpublicpolicyinterventionsformulatedwithinthePRSP,andhowchangesaremediatedthroughgenderandrural-urbandifferences.
Thesewerethekeyfindings:childrenwerecommonlyinvolvedinfetchingwater,firewoodanddungbothforhouseholduseandsale,althoughtheyweremorelikelytoattendschoolwhentherewasadequatehouseholdlabour.Schoolattendancewassignificantlylowerinruralthaninurbansites,whiledropoutratesweredramaticallyhigherinruralareas.Maternaleducationlevelssignificantlydecreasedthelikelihoodofchildrencombiningworkandschool.Increasedlandandlivestockownershipledtoagreaterdemandforchildlabourandreducedschoolenrolment.Theinvolvementofhouseholdsinmorediversifiedactivitiesincreasedthedemandforlabourwhichisfrequentlymetbychildren,particularlyboys,withgirlscommonlysubstitutingfortheirmothers.
Inlightoftheabove,YoungLivesrecommendsthefollowingmeasurestohelpreducechildlabourandincreaseschooling:
introducingcashtransfersandcreditprovisionstopoorfamiliestooffsetschoolcostsespeciallyforolderandruralchildren,andtocushiontheadverseimpactofhouseholdshocks;
improvingschoolavailabilityinruralareasandstrengtheningthepolicyfocusonfemaleeducation,includinginvestmentinadultliteracyprogrammes;
introducingcreditmeasurestofacilitatelabourtransactions;
modernisingdomesticandfarmtechnologiestoreducelabourintensity;
rationalisinglivestockraisingpatterns;
improvingwomen’sproductiveworkopportunitieswhilesimultaneouslyensuringthattheircareworkburdenisreducedbyconsideringsubsidizedcommunitychildcarearrangementsorpreschoolservices;
introducingsafetynets,particularlyforfemale-headedhouseholds;
improvingcommunityinfrastructure,especiallyenergyandwatersourcesandaffordabletransportation;
reducingvulnerabilitytoshockssuchasdroughtthroughinvestinginirrigationschemes.
•
•
•
•
•
•
•
•
•

Child labour, gender inequality and rural/urban disparities
�
Contents
�. Introduction 2
2. Literaturereviewonchildschoolingandchildlabour 5
2.1 socio-economic environment of the household 5
2.2 school factors 7
2.3 individual child characteristics 9
2.4 Village and community factors 9
2.5 policy and programme factors 10
2.6 research lacunae 10
3. Theoreticalframework �2
4. ChildlabourandchildschoolinginEthiopia:national‑leveldata �4
5. YoungLivesdataandmethodsofanalysis �9
5.1 quantitative methods 19
5.2 qualitative methods 20
6. Quantitativeandqualitativeanalysisanddiscussion 2�
6.1 Children’s main activities 21
6.2 Children’s dropout rates 22
6.3 univariate analyses of factors affecting child schooling and labour 25
6.4 triangulating multivariate analyses results and qualitative research findings 26
6.4.1 Children’scharacteristics 29
6.4.2 Familycharacteristics 31
6.4.3 Communitycharacteristics 37
7. Summaryandpolicyimplications 38
References 44
AppendixA�:Descriptionofvariablesusedintheregression 50
AppendixA2:Detailedregressionresults 52
AppendixA3:YoungLives’definitionofsocialcapital 64
AppendixA4:YoungLives’definitionofhouseholdwealth 65

Child labour, gender inequality and rural/urban disparities
2
1. introduction1
Althoughtheimportanceofaddressingchildhoodpolicyaspartofbroaderpovertyreductioneffortsisincreasinglyacknowledged(atleastrhetorically)bydonors,governmentsandcivilsocietyactors,theinclusionofdetailedchild-sensitivepoliciesinnationalpovertystrategiesisstillalltoorare.Whileeasilyobservablechildindicators,suchasinfantmortality,nutritionalstatusandchildschoolingareincluded,lessobviousimpactsofbroadereconomicdevelopmentstrategiesonchildren’swellbeingremainlargelyinvisible(Heidel,2004).Contentanalysisof23interimandfinalPovertyReductionStrategyPapers(PRSPs),forexample,revealedthatmostlacknotonlyanycomprehensivestrategytoaddresstheneedsofpoorchildrenandtheirfamilies,especiallycaregivers,buttheyalsofrequentlyoverlookimportantelementsofchildren’sexperiencesofpoverty,includingchildtrafficking,sexualexploitation,accesstoHIV/AIDSpreventionandeducation(Marcuset al.,2002).Moreover,whilethePRSPpolicyframeworkplacesconsiderableemphasisoncivilsocietyconsultations,childrenandyoungpeoplehaveoftenbeenmarginalisedorcompletelyexcludedfromsuchprocesses(Minujinet al.,2005).
ThispaperanalysestheextenttowhichtheEthiopianSustainableDevelopmentandPovertyReductionProgramme(SDPRP)2(2002-2005)ismakingadifferencetopoorchildren’slives,andhowchangesaremediatedthroughgenderandrural-urbandifferences.Specifically,itisconcernedwiththeimpactofonekeypillarofthePRSP,theAgriculturalDevelopmentLedIndustrialisation(ADLI)policy,onchildenrolmentandchildwork(paidandunpaid).3Theunderlyingassumptionisthat,becauselabourisabundantandcapitalscarce,newlivelihoodopportunitiesshouldbelabour-intensiveandagriculture-based.However,givenimperfectlabourandcreditmarkets,thedemandforlabourmayintheshorttermbemetbyinvolvingchildrenineitherpaidornon-paidwork.Ourhypothesisisthatthepromotionoflabour-intensiveagriculturalactivities,whileaugmentingaggregateeconomicdevelopment,couldbedetrimentaltochildwellbeingwithoutprecautionarysocialriskmanagementmeasures.Inordertocreateawin-winsituationwherebothnationaleconomicdevelopmentandchildren’srights(socio-economic,civicandcultural)arerealisedwithinthePRSPframework,adeepunderstandingoftheindividual-,family-,community-andpolicy-levelfactorsaffectingchildlabourandchildschoolingisrequired.
Theoretically,childlabourandeducationalparticipationaretheresultofhouseholddecisionsshapedbypoverty(determinedbytheavailabilityofassets,inputs,creditandinsurance),labourandcreditmarketimperfections,andparentaleducationlevels.However,whilethispovertyhypothesissuggeststhattherecouldbeapositivecorrelationbetweenexpenditure/wealthandchildschooling,liquidityconstraintsandimperfectlabourmarketsmayresultintheoppositerelationship(BhalotraandHeady,2003;Nielsen,1998).Inotherwords,intheabsenceofperfectaccesstocreditandtheimperfectsubstitutionofhiredlabourforfamilylabour,livestockownershipandthecultivationoflargerlandholdingsmayinfactleadtogreaterdemandsforchildlabourthanschooling(Coulombe,1998).Inaddition,parentaleducationlevelsmayaffectchildlabourindependentlyofincomeifparentsdonot
1 This paper is one of a series of Young Lives Project working papers. For further information and to download all ourpublications,visitwww.younglives.org.uk
2 Ethiopia’sPRSPisknownastheSDPRP.3 The Rural Development Policy Paper explicitly explains that it will not prioritise the promotion of a non-agricultural
employmentprogrammeprioritybecauseitimpliesurbanemployment.AlthoughtheNewCoalitionforFoodSecuritypolicyframeworkdiscussesnon-farmactivities,thefocusremainsruralandagriculture-dominated.

Child labour, gender inequality and rural/urban disparities
3
valueeducation,orareunconvincedthatthereturntoschoolingmayoffsetanyincomelostduetoschoolattendance.
Theeffectoftheseelementsmaybemediatedbythestructureofthehousehold(householdcomposition)andsocietal/culturalnorms.Thenumberofsiblings,birthorder,dependencyratio,numberofable-bodiedadults,gendercomposition,andhouseholdsizeallinfluencethehousehold’slaboursupply(BhalotraandHeady,2003).Forinstance,labourmarketopportunitiesavailabletowomenmayinfluencethesubstitutionofchildrenforwomen’sdomesticandcarework.Culturalnormsmayalsohaveanimpactonchildlabourindependentlyofincomeandeducationifspecifictasks(eitherhouseholdoroutsidethehome)areculturallydesignatedaschildren’s(orgirls’orboys’)work,suchascattleherdingorwatercollectioninthecaseofEthiopia.
ThemainobjectiveofthispaperistoinvestigatethekeydeterminantsofchildlabourandchildschoolinginordertounderstandthepossibleimpactonhouseholdsandchildrenofpublicpolicyinterventionsformulatedwithinthePRSPinordertoimprovenationaldevelopmentandachievetheMillenniumDevelopmentGoals(MDGs).Specifically,thefollowingresearchquestionsareaddressed:
DoestheSDPRP’slabour-intensiveagriculturalproductionfocusleadtogreaterpressureonchildrentostayathomeandcarryoutagricultural,domesticand‘careeconomy’(Elson,1996)taskswhiletheirparentswork?
Howsignificantisthelevelofparental(paternalormaternal)educationondecision-makingaboutchildren’sschoolattendanceinthecontextofscarceresources?
Isthereagenderdifferenceintimespentonlabour(incomeornon-incomegenerating)andschoolenrolmentrates?Ifso,whatfactorsarelikelytocontributetothisgenderdisparity?
Dochildreninfemale-headedhouseholds(duetowomen’smorelimitedaccesstoassetsandlandownership)havegreaterpressurestoforgoeducationalopportunitiesinordertoengageinpaidorunpaidlabourthanthoseinmale-headedhouseholds?
ThepaperfollowsBecker’s(1981,1965)theoryofhouseholdproduction,butismodifiedtoincludetheimpactofcertainconstraintsonhouseholds’abilitytomaximisetheircapacities.Theseconstraintsare:time(ofparentsandchildren);budgets;production;creditandmarketconditions.Withinthisframework,thepaperdevelopsamultinomiallogit(multiplechoice)econometricsmodelwherebythedependentvariableisdifferentcombinationsofworkandschooling:schoolonly;workandschool;workonly;minimalwork(i.e.neitherworknorschool).
Theempiricaldataisbasedonahouseholdsurveyof1999familiesin20woredas(sub-districts)carriedoutaspartoftheYoungLivesinternationallongitudinalsurveyin2002,andfollow-upqualitativefieldworkonchildschoolingandlabourinfiveworedasinearly2005.Thequalitativeresearchinvolvedfocusgroupandkeyinformantdiscussionswithlocalofficials,communityleaders,teachers,familiesandchildren.Theresearchcapturestheexperiencesofpoorchildreninfiveregionalstates,coveringmorethan90percentoftheEthiopianpopulation.Theyencompassdiverselivelihoodpatterns,culturalandreligioustraditions,humandevelopmentlevelsandethniccompositionsandprovidevaluableinformationabouttheimpactofmacro-levelpovertyeradication/developmentpoliciesindiversecontexts.
•
•
•
•

Child labour, gender inequality and rural/urban disparities
4
Thepaperisorganisedasfollows.Section2reviewstheoreticalandempiricalliteratureontherelationshipbetweenchildlabourandschoolingindevelopingcountrycontexts.Section3presentsthetheoreticalframeworkusedinthepaper.Section4analysesnational-leveldataonEthiopianchildlabourandeducation.TheYoungLivesdataandmethodofanalysisarediscussedinSection5,whiletheresultsarepresentedinSection6.Section7concludeswiththekeypolicyimplicationsofourfindingsandmapshowchildrencanbebettermainstreamedintothesecondroundofthePRSPpolicyframework(2005-10).
Child labour, gender inequality and rural/urban disparities
5
2. literature review on child schooling and child labour
Alargeliteratureonthefactorsthatinfluenceparents’decisiontoeducatetheirchildreninbothdevelopedanddevelopingcountrycontextspointstotheimportanceofthefollowingvariables:thesocio-economicenvironmentofthehome;theschoolenvironment;individualchildcharacteristics;villageandcommunityfactors;andpolicyandprogrammefactors(Tilak,1989;WaltersandBriggs,1993;Burney,1995;BredieandBeeharry,1998).
2.1 Socio‑economicenvironmentofthehousehold
Thesocio-economicstatusofthehouseholdencompasseshouseholdassetendowmentandincome,genderofthehouseholdhead,parents’educationallevels,occupationandlabourmarketparticipation,andthesizeandcompositionofthehousehold(WaltersandBriggs,1993;Burney,1995;BredieandBeeharry,1998;CanagarajahandNielsen,1999).
a)Householdassetsandincome:Theprobabilityofachildbeingenrolledinschoolisinfluencedbythehousehold’sassetendowment(MoockandLeslie,1985;WaltersandBriggs,1993),buttherelationshipisneitherlinearnorfullypredictable.AccordingtoBurney(1995)therearethreepossibleeffectsofassetendowmentonchildschooling.Thefirstisthe“purewealtheffect”ofassets,whichhasapositiveimpact.Thesecondisthe“opportunitycosteffect”ofassets,whichhasanegativeeffectbecausetheproductivityofchildlabourincreasesbecauseofgreaterassets.The“bequesteffect”ofassets,whichreferstoinvestinginachild’sfuture,isathirdfactorandhasanindeterminateeffect.
StudiesinAfrica(CanagarajahandNielsen,1999)andAsia(Burney,1995)showcontroversialormixedeffectsoffarm ownershipontheprobabilityofchildschooling.Forexample,ahigherendowmentofsmalllivestockshowednegativeeffectsonenrolmentinBotswana(Chernichovsky,1981,citedinMoockandLeslie,1985),whileWaltersandBriggs(1993)foundahigherprobabilityofschoolenrolmentforchildrenfromhouseholdswhoowntheirownhome.
Althoughvariablebycountry,regionandlocation,householdtypes,genderofthechildandthelevelofeducationconsidered,anumberofstudieshavefoundthathousehold incomehasasignificantpositiveeffectontheprobabilityofchildschoolenrolment(e.g.MoockandLeslie,1985;Burney,1995;BredieandBeeharry,1998).Theimpactofhigherincomeonschoolenrolmentwasgreaterforfarmingthannon-farmhouseholdsand,foreachhouseholdtype,theimpactofhigherincomewasgreaterfortheenrolmentofmalecomparedtofemalechildren(Burney,1995).Similarly,BasuandVan(1998)foundthatchildlabourreducedchildschoolingamongthepooresthouseholds.However,childrenofland-richfamiliesaremorelikelytobeinworkinsteadofattendingschoolcomparedtochildrenofland-poorhouseholds,indicatingthatassetownershipandchildschoolingcouldbenegativelyrelated,orthatassetownershipandchildlabourcouldbepositivelycorrelated.Possiblereasonsforthisso-called“wealthparadox”includecreditmarketimperfectionswhichmightresultinchildlabourandlowschoolenrolment(e.g.Ranjan,1999,2001;JafareyandLahiri,2002)andlabourmarketimperfectionsthatcouldleadtochildlabourandanegativeimpactonchildschooling(BhalotraandHeady,2003).

Child labour, gender inequality and rural/urban disparities
6
InthecaseofEthiopia,however,Cockburn(2001)foundthataccessto,orownershipof,assetsthatareusedinchildworkactivities(orthatcomplementchildwork)mayreducetheprobabilityofachildattendingschool.Whilelandqualityincreasestherelativeprobabilityofchildren’senrolment,ownershipofsmalllivestockreducestheprobabilityofschoolattendanceamongyoungerboysbecausechildlabourisdeemedmoreimportantforanimalherdingthancropproductionactivities.Thistrendisinturnreinforcedbycreditconstraintsonfarmerstohireadditionallabourandthefactthathiredlabourisusuallyanimperfectsubstituteformoreflexiblefamily(child)labour.
Similarly,thehousehold’sdistancefromfuel-woodandwatersourcesmayinfluenceschoolenrolmentdecisionsbecauseoftheimplicationforhouseholdlabourdemand:children’stimecanbeusedforfetchingfirewoodandwaterattheexpenseofattendingschoolordoinghomework.InCôted’Ivoire,thechancesofenrolmentforboysdecreasedwhenthehousehold’sdistancefromafuel-woodsourceincreased(Appleton,1991;BredieandBeeharry,1998).Thesamestudyindicatesthatthehousehold’sdistancetowatersourcesalsoaffectsthelikelihoodofchildrencompletingprimaryschooling.
b)Parentaloccupation:Thechancesofschoolenrolmentweregreaterforchildrenfromhouseholdsheadedbycivilservantsand,particularlyinthecaseofgirls,increasedinaccordancewiththestatusofparentaloccupationsinAsia(Tilak,1989).Therelationshipbetweeneducationandownershipoffamily-ownedbusinesses(usuallyinurbanareas),however,appearsmixed.WhileAppleton(1991)andBredieandBeeharry(1998)foundthatchildrenwerelesslikelytogotoschoolifparentsvaluedtheircurrentcontributionmorethanthepotentialbenefitsfromschooling,otherstudiesfoundincreasedschoolattendanceinhouseholdswithnon-farmbusinesses(CanagarajahandCoulombe,1998;CanagarajahandNielsen,1999).
c)Householdcomposition:Householdsizeinfluencestheamountofresourcesandtimeinvestedbyparentsinchildschooling(Tilak,1989;WaltersandBriggs,1993).Resourcelimitationsmaythereforeforcelargefamilyhouseholdstodiscriminateamongtheirchildren,butthereweredifferentialimpactsongirlsversusboysandyoungerversusolderchildren(Burney,1995).
Greateradultlabourendowmentthatcansubstitutechildlabourinahouseholdwasfoundtosignificantlyincreasetheprobabilityofchildenrolment,especiallyatsecondarylevelsinTanzania(BredieandBeeharry,1998).Similarly,inAsia,Tilak(1989)foundthatthenumberofyearsofschoolingforboysincreasedinproportiontothenumberofworkingsisters,whileinCôted’Ivoire,Coulombe(1998)foundthattheprobabilityofchildschoolingincreasedwithhighernumbersoffemalesiblingsinthe7-14agegroup.Thenumberoffemalesinthe15-59agegroupalsohadasimilareffectonchildschoolattendance.However,theprobabilityofschoolattendancewasfoundtobelowerinGhanawhenthenumberofolderhouseholdmembers(over60yearsofage)increased(CanagarajahandCoulombe,1998,citedinCanagarajahandNielsen,1999).Thepresenceofpreschoolagechildrenwasalsofoundtohaveanegativeeffectongirls’enrolmentinNicaragua(RosatiandRossi,2003)andinBotswana(Chernichovsky,1981,citedinMoockandLeslie,1985).
d)Parentaleducationandexpectations:Theimpactofparentaleducationonchildenrolmenthasbeenmuchstudiedandhasalsobeenusedasanindicatoroftheintergenerationalmultipliereffectofschooling(WorldBank,2004).Overall,higherparentaleducationlevelshaveastrongpositiveimpactonschoolenrolment(MoockandLeslie,1985;Tilak,1989;Bustillo,1989;WaltersandBriggs,1993;Burney,1995;BredieandBeeharry,1998;Handa,1999;RavallionandWodon,2000;Ray,2003),but

Child labour, gender inequality and rural/urban disparities
7
thesignificanceoftheimpactmayvarydependingonthewaythevariableisdefined,thegenderandageoftheparentandchild,andotherconditioningfactors.
Someresearchershaveinvestigatedtheimpactoffathers’andmothers’educationseparately(e.g.MoockandLeslie,1985;Bustillo,1989;Burney,1995;Ray,2003).Insomedevelopingcountrystudies,paternaleducationisassumedtohaveanindirectinfluencethroughincomeprovision,whilematernaleducationhasadirectinfluencethroughchildrearingandeducationalsupervision(Burney,1995).Inparticular,maternaleducationlevelswerefoundtohaveasignificantlypositiveimpactontheprobabilityofgirls’schoolenrolmentcomparedtothatofboys(Bustillo,1989).Whenhouseholdheadswereeducatedandworking,thegenderdisparityofenrolmentwasnarrowand,forsomeagegroupsoreducationlevels,wasevenbetterforfemales(Tilak,1989).InGhana,theeducationofadultfemales,comparedtothatofadultmales,wasfoundtohaveasignificantlypositiveeffectonthenumberofyearsachildstaysinschool(Ray,2003).However,inthePhilippines(SmithandCheung,1982)andinTaiwan(Hermalin,SeltzerandLin,1982),genderdisparitiesineducationalparticipationwerefoundtobesignificantlyaffectedbyfathers’educationallevels.
Intermsofthegenderofhouseholdheads,BredieandBeeharry(1998)foundthatmaleheadsfavourboys’educationandthat,ingeneral,thelevelofinvestmentinchildren’seducationwashigherthanwithfemaleheads.InruralareasofCôted’Ivoire(Grootaert,1998;Coulombe,1998)andinGhana(BhalotraandHeady,2003),therateofschoolattendancewaslowerinfemale-headedhouseholdsandespeciallysoforgirls.
Parentalexpectationsofthevalueofschoolingarealsoidentifiedintheliteratureasinfluencingthedecisiontoeducatechildren.Whileexpectationsoffutureearningswerefoundtobeasignificantdeterminantforpost-primaryschooling,BredieandBeeharry(1998)notethatresearchonthisvariableattheprimaryschoollevelintheAfricancontextisinconclusive.
2.2 Schoolfactors
Schoolfactorswerecitedinmanystudiesasconstitutingmoreimportantdeterminantsofeducationalenrolmentthanthesocio-economicstatusofthehomeenvironment(HeynemanandLoxley,1983,citedinTilak,1989).Inparticular,improvementinschoolfactorswasfoundtohaveagreaterimpactonlowerincomeandruralchildren(Bustillo,1989),andtohavedifferentialeffectsontheenrolmentofchildrenbygender(Tilak,1989).Themostcommonlystudiedschoolfeaturesincludetheavailabilityandqualityofschoolfacilities,proximityandcosts,staffing,andschooltype(Tilak,1989;Bustillo,1989;WorldBank,2004).
a)Physicalaccess:Expansionofprimaryschools,throughpublicexpenditureorprivateinvestment,reducesoneofthesupply-sideconstraintsonhouseholdenrolmentdecisions(Handa,1999;WorldBank,2004).Improvingaccess,orthelevelofprovisioningeneral,significantlyinfluencesthelevelofenrolment,althoughitsimpactmaybevariablebylevelofschoolingandregion(BredieandBeeharry,1998).4
Ifaschoolisclosetoachild’shome,thelikelihoodofenrolmentishighforbothgirlsandboys.Withanincreaseinphysicaldistance,girls’participationinschoolingislowerduetologisticalproblemsandassociatedsafetyrisks(Tilak,1989).Enrolmentratesattheprimaryschoollevelforboysandgirlsare
4 However,empiricalevidenceismixed.ATanzanianstudy,forexample,indicatesthattherewasnosignificantinfluenceofpercapitagovernmentexpenditureonprimaryschoolsontheprobabilityofchildenrolment(BredieandBeeharry,1998).

Child labour, gender inequality and rural/urban disparities
8
alsoaffectedbytheavailabilityofsecondaryschools(Lavy,1996,citedinHanda,1999).InthecaseofMozambique,improvedaccessaugmentedboys’enrolmentoverthatofgirls(Handa,1999).
b)Costs/financing:Costsofschooling,bothdirect(e.g.userfees,schooluniforms,transport)andindirect(e.g.childwork-related),areamongthefactorsthatinfluenceparentaldecisionsaboutchildeducation(Bustillo,1989;BredieandBeeharry,1998;WorldBank,2004;KattanandBurnett,2004).Overall,Africancasestudiesindicatethattheprobabilityofenrolmentinprimaryschoolwaslessinfluencedbydirectcoststhanopportunitycosts,althoughtheresultsshowedmixedpatterns.Incaseswheredirectcostsmatter,theimpactwasfoundtobemoresignificantforpoorhouseholdsthanrichhouseholdsaspoorerfamiliestendtohavemorechildrenandlimitedbudgets.Somestudiesalsofoundthatthedirectcostsofschoolingwerehigherforgirlsthanforboys,whichmayreducethechanceofschoolingforgirls(Tilak,1989).
Studiesindicatethatuserfeesinprimaryeducationareamajorconstrainttoenrolmentandschoolcompletionformillionsofchildrenaroundtheworld(Colclough,1996,citedinOxaal,1997;KattanandBurnett,2004).AccordingtoColclough(1996),whenprimaryschoolfeeswereintroducedinMalawi,enrolmentinitiallydeclinedand,althoughrateslaterrose,thepacewasslowerthanbeforefeeswereintroduced.Whenfeeswereremoved,enrolmentincreasedquicklyagain.However,KattanandBurnett(2004)raisetheconcernthatremovalofprimaryeducationfeesmayhaveitsowndrawbackswhenfeesmakeupasubstantialshareofthebudgetforimprovingaccessorqualityofschooling,unlessthedeficitiscoveredfromalternativesources.
Intermsofindirectoropportunitycosts,BredieandBeeharry(1998)indicatethattheprobabilityofenrolmentislowerforchildrenwithhigheropportunitycostsinrelationtohouseholdincomeandtheexpectedbenefitsofschooling.Ingeneral,thecharacteristicsofthechild,socialnormsandlabourmarketfeaturesconditionthelevelofopportunitycostsforeachhouseholdandleadtovaryingdecisionsregardingchildschooling(WorldBank,2004).WhileinMadagascaropportunitycostswereslightlyhigherforgirlsthanforboys(BredieandBeeharry,1998),someLatinAmericancasesindicatethatgirlshaveloweropportunitycostscomparedtoboys(Bustillo,1989).
c)Qualityandrelevance:Commonlycitedschoolqualityindicatorsarestaffing,schoolpassrates,physicalfacilitiesandrelevance.InruralMozambique,thesize,leveloftrainingandcompositionofteachingstaffwereimportantdeterminantsofhouseholdenrolmentdecisions(Handa,1999).Increasinggirls’enrolmentinschoolispositivelyassociatedwithahigherproportionoffemaleteachersinschoolsandthisassociationismoreimportantintraditionalsocietiesandathigherschoolinglevels(Tilak,1989).InruralMozambique,thenumberoftrainedteacherswasfoundtohaveapositiveandstatisticallysignificantimpactonthelikelihoodofprimaryschoolenrolment(Handa,1999).Gendercompositionandtrainingfactors,especiallytheproportionoftrainedfemaleteachers,werefoundtohaveapositiveandsignificantinfluenceonenrolment.
Femalepassrates(ratherthanmalepassrates)werealsofoundtohaveasignificantpositiveeffectontheprobabilityofenrolment,perhapsbecausefemalepassratesserveasbetterproxiesofschoolqualitybecausegirls’overallperformanceinschooltendstobepoorerthanthatofboys(Handa,1999).
Improvementinthequalityofschoolfacilitiesisalsoassociatedwithhigherschoolenrolment.Improvedschoolfacilitieswerefoundtocontributesignificantlytofasterenrolmentgrowthinthecase

Child labour, gender inequality and rural/urban disparities
9
ofGhana(WorldBank,2004).Handa(1999)foundthatimprovementsinthequalityofclassroomsareassociatedwithahigherprobabilityoffemaleenrolmentinMozambique,whileavailabilityoftoiletfacilitiesinschoolwasfoundtobeanimportantconsiderationforparentswhensendinggirlstoschoolinBangladesh(Oxaal,1997).Theliteraturealsosuggeststhatparentsmayprefertosendtheirdaughterstogirls-onlyratherthanco-educationalschools,becauseoffearsthatcontactwithboysandmaleteachersmayleadtoinappropriatesexualactivityorphysicalabuse(Oxaal,1997).Suchdecisionsare,however,conditionedbyotherfactorssuchasavailabilityandcost.
Relevanceofthecurriculumisarelatededucationqualityvariablethatinfluenceshouseholds’perceptiontowardsschooling.AnOXFAM(1999)participatorystudyinMozambique(citedinHanda,1999)indicatedthatthemoreapplicablesubjectsinthecurriculumaretodailyfamilylife,suchaslanguageandaccounting,thegreatertheprobabilityofsendingchildrentoschool.
2.3 Individualchildcharacteristics
Childcharacteristicssuchasgender,ageandbirthorder,employmentopportunitystatus,nutritionstatus,andparticipationinpreschoolprogrammeshavealsobeenthefocusofempiricalinvestigation(MoockandLeslie,1985;Ray,2003;WorldBank,2004).First,genderdifferencesinhouseholds’decisionsregardingchildschoolingarerelatedtodifferencesinpreferences,returnsorboth(AldermanandKing,1998).Theliteratureindicatestheco-existenceofhigherreturnstofemaleschoolingbutlowparentalinvestmentingirls’schooling.StudiesfromGhana(Ray,2003)andNepal(MoockandLeslie,1985)indicate(controllingforothercharacteristics)lowerchancesofenrolmentforgirlsthanboys.
TheageofthechildwasfoundtobeasignificantdeterminantofenrolmentinNepal(MoockandLeslie,1985),witholderchildrenhavingahigherprobabilityofenrolmentthanyoungones.However,accordingtoDeVreyer(1993),citedinBredieandBeeharry(1998),thebirthorderofthechildmatters.Householdsinvestlessintheeducationoftheirfirst-bornthaninthatoftheirotherchildren.
AstudybyGlewweet al.(1999)inthePhilippinesindicatesthattheenrolmentofmalnourishedchildreninprimaryschoolwasdelayedbecausetheyappearphysicallysmallattheirminimumageofenrolment.ProbabilityofschoolenrolmentinNepalwasfoundtoberelatedtothenutritionalstatusofthechild,althoughtheresultsmayvarydependingonthetypeofnutritionalstatusindicatorused(MoockandLeslie,1985).Forinstance,haemoglobinlevelusedasameasureofacutemalnutritionwasnotasignificantdeterminantoftheprobabilityofenrolment.However,theheight-for-ageandweight-for-heightindicatorswerepositiveandhadasignificantinfluenceontheprobabilityofenrolment.Theyalsofoundthattheeffectofchronicmalnutrition,suchasheight-for-age,wasstrongerthantheacutemalnutritionindicatorssuchasweight-for-heightandhaemoglobinlevels.
2.4 Villageandcommunityfactors
Amongthevillage-orcommunity-levelfactors,highervillageliteracywasfoundtohaveasignificantlypositiveinfluenceonchildschoolinginPakistan,althoughtheimpactwasdifferentiatedbygender,agecohortandhouseholdtype(Burney,1995).Itseffectwasinsignificantforboysfromnon-farmhouseholdsintheagecategoryof17yearsandabove.Participationofchildreninschoolingeneral,andthatofgirlsinparticular,wassignificantlyinfluencedbythelevelofurbanisationinAsia(Tilak,

Child labour, gender inequality and rural/urban disparities
�0
1989).StudiesinGhanashowmoreenrolmentinurbancomparedtoruralareas(WorldBank,2004).Thiscouldbeduetoahigherconcentrationofpublicandprivateschoolsinurbanareas.
Socio-culturalfactorssuchasattitudestowardswomen’seducation,religiousandmarriageinstitutions,raceandethnicity,andclasssystemsallinfluencetheeducationalparticipationofchildren,especiallygirls,throughtheireffectonsocietalvaluesystemsandgenderroles(Tilak,1989).Forinstance,insocietieswheredaughtershaveagreaterroleinsupportingparentsduringoldage,investmentingirls’educationishigher.InGhana,schoolenrolmentwasmuchhigherforchildrenfromChristianfamiliesthanthosefromfamiliespractisingindigenousreligions(CanagarajahandCoulombe,1998),whileinCôted’IvoireschoolattendancewashigherforchildrenfromChristianfamiliesthanforthosefromMuslimfamilies(Coulombe,1998;CanagarajahandNielsen,1999).Incountrieswherethelegalageofmarriageislower,suchasinsomeAsiancountries,enrolmentratesarelowerforgirls,mainlyinpost-primaryschooleducation(Tilak,1989).
2.5 Policyandprogrammefactors
Atamacrolevel,investmentinexpansionofschoolsandimprovingtheaccessibilityandcoverageoftheeducationsystemenhancesenrolment(WorldBank,2004).UniversalprimaryeducationpoliciesinEastAsiancountriesreducedsignificantdisparitiesbetweenmalesandfemalesineducation(Tilak,1989).SchoolenrolmentsubsidiesintheformoffoodrationstohouseholdsinruralBangladeshreducedtheincidenceofchildlabourandledtoasmallimprovementinschoolparticipationrates(RavallionandWodon,2000),whileinPakistanschoolenrolmentincreasedwithareductioninthecostofschooling(HazarikaandBedi,2003).InAsia,programmesthatreduceparentalschoolingexpenditure,suchastextbookschemes,scholarshipsandsupplementaryfeedingprogrammes,significantlyincreasedfemaleenrolment(Tilak,1989).
2.6 Researchlacunae
Theliteratureonchildschoolingandlabouridentifiedthefollowingasimportantfactorsshapingparentalchoicesaboutchildren’sschoolingand/orlabour:wealth;ownershipofproductiveassets;parentaloccupations;individualchildcharacteristics;gendercompositionofthehousehold;andbirthorder.However,itdoesnotprovideconclusiveevidenceaboutrelativeimpacts.
Welearnfromtheliteraturereviewthatownershipofproductiveassetssuchaslandandlivestockcanaffectchildschoolinginvariousways.Itcanhaveanegativeeffectonschoolingbecauselargerassetholdings—especiallylivestockforwhichchildrenaretraditionallyresponsible—maycompelhouseholdstoforgotheincomethatchildworkbrings.Intheabsenceofaperfectlabourmarket,landandlivestockownershipcanalsohaveanegativeeffectonchildschoolingandchildwork.Ownersoflandandlivestockwhoareunabletohireproductivelabourmayhaveanincentivetoengagetheirchildreninsteadofsendingthemtoschool.Similarly,ifhouseholdsdonothaveaccesstocredit,oriftheycannotusetheirassetstoaccesscredittoemploylabour,theywilloftenusetheirchildrentogeneratework.Whiletheincomeeffect(incomecontributionofassets)tendstoincreasechildenrolmentandreducechildwork,theproductivityeffect(ifaccesstoassetsraisesthereturnsfromchildwork)tendstoreducechildenrolmentandincreasechildwork.

Child labour, gender inequality and rural/urban disparities
��
Wefoundthattheeffectofeconomicshocksandparentaloccupationonchildschoolingandlabourisnotwellexploredintheliterature,especiallyintermsofempiricalevidence.Therefore,thekeycontributionsofthispaperaretodeterminetheeffectsofassetownership(e.g.landandlivestock),economicshocks,parentaleducationallevelsandoccupations,liquidityconstraintsandgendercompositiononchildschoolingandlabourinEthiopia.Inaddition,weconsidertheeffectsofsocialrelations(suchassocialcapital,bothcognitiveandstructural),birthorderandcommunityfactorsasmediatingvariables.

Child labour, gender inequality and rural/urban disparities
�2
3. theoretical frameworkThissectionpresentsthegeneralframeworkfollowedinthispaper,whichisbasedonamodifiedversionofBecker’s(1981)householdproductionmodel.5Weadoptthisframeworktoanalysethedeterminantsandtherelativeimportanceoffactorsaffectingchildschoolingand/orworkbecausethemodelisabletoencompassbothdemand-andsupply-sideaspectsofeducation/childwork.Thatis,itfacilitatesananalysisoftheincomeandsubstitutioneffectsofsupply-sidefactorsofchildworkanddemand-sidefactorsforchildeducation,aswellastheneteffects(incomeandproductivityeffects)ofvariablesshapingchildschoolingandchildworkdecisions.Withthishouseholdmodel,itisalsopossibletoincludeconstraints(liquidityandlabourmarketconstraints)thathouseholdsmayface.
Becker’smodelstatesthatahouseholdmaytrytomaximiseutility,subjecttoincome,time,production,cash,labourandotherconstraints.Theutilityofthehouseholdiscomposedoffamilymembers’leisureandcompositeconsumptiongoods(i.e.foodandnon-foodexpenditures)aswellaschildren’sschooling.Utilityisalsocomposedof“utilityshifters”suchassocialnorms,tastesandaltruisticmotives.Goodscanbepurchasedfromthemarketand/orproduced.Thetimeusedtoproducecompositeconsumptiongoodscanbesuppliedbyparentorchildlabour,whilehouseholdincomecanbeearnedbysellinggoodsproducedinahouseholdenterpriseorbyworkingasawagelabourer.Althoughrolesdifferwidelyacrosscountrycontexts,bothparentsandchildrenallocatetheirtimebetweenmarketwork,farmandhomeproduction,domesticandcaringwork(includingchildrearing),educationandleisure.
Thecentraloutcomeofahousehold’sconstrainedutilitymaximisationdecision-makingwithinthecontextofimperfectcapitalandlabourmarketsisthatchildrenwillgotoschooland/orworkdependingontheavailabilityofhouseholdtimeforworkandleisure,income,assets,labourmarketconditions,wagesforadultsandchildren,andpreferenceshifterssuchasparents’educationandsocialnorms.Usingthismodelasaframework,itispossibletoestimatechildlabourandchildschoolingbasedonthemainattributesahouseholdpossessessuchasphysical,socialandhumancapitalendowments,householdcomposition,labour,capitalmarketconditionsandsocialnorms.
Thepovertyhypothesis(Bonnet,1993)statesthatanincreaseinparents’wagesraisesthesupplyoflabourandincreaseshouseholdincome.Ifchildeducationisviewedasanormalgood,childschoolingwillbeincreasedandchildlabourreduced.Ifdomesticandcaringworkisseenbysocietyasmothers’responsibility,anincreaseinthewagesofmothers/caregiverswillincreasetheirinvolvementinthemarketinordertogeneratemoreincome,butresultinginlesstimeavailablefordomesticandcaringwork.Hence,children’sworkinghoursathomemayincreaseandresultinlowerschoolenrolment.Conversely,anincreaseinchildren’swagesorhouseholdworkincreasestheopportunitycostsofchildeducationandreduceschildschooling.
Caregivers’(predominantlymothersorfemaleadults)marketworkmayhavebothpositiveandnegativeimpactsonhumancapitalformation.Ontheonehand,caregiversmaywithdrawfrommarketorfarmworktoincreasethetimeavailableforchildcarewhenthenumberofchildreninthefamilyincreases.Ontheotherhand,thisdeclineinfamilyincomemaycreateanincentivetowithdrawolderchildrenfromschoolandallowthemtoworktosubstituteforthelossinincome.
5 SeealsoPörtner(2001),CignoandRosati(2000),Schultz(1997).

Child labour, gender inequality and rural/urban disparities
�3
Anincreaseinlandholdingorotherfamilyassets,suchaslivestock,inasituationofperfectland,creditandlabourmarkets,islikelytoraiseincomeandhenceincreasetheabilitytoaffordchildeducationandreducetheneedforchildwork,i.e.anincome(wealth)effect(BasuandVan,1999).However,inthecontextofimperfectcapitalandlabourmarkets,householdsmayhavetorelyoninternalassets,suchaschildren’slabour,insteadofinvestinginlonger-termhumancapitaldevelopment.
Whenhouseholdsfacebudgetconstraintsorlackaccesstocredittoeducatetheirchildren,theyareineffectbeingdeniedaccesstoloansthatcouldaugmenttheirfutureincome(assumingthatchildren’shighereducationwilltranslateintohigherearningsinthelong-run).Torelaxbudgetconstraints,parentsmaysendtheiryoungerchildrentoschoolwhiletheolderchildrengotoworkandearnanincome(CignoandRosati,2000).However,thispatternmaybemediatedbyfamilysizeandbirthorder.Birdsall(1991)foundthatinsomecaseshouseholdswithliquidityconstraintsinvestintheeducationoftheirfirstbornchild(whenfamilysizeissmall)andoftheirlastborn(whenfamilysizeislarge).
Inthecaseofeconomicshocks,householdsmayfollowadiversificationstrategyintheirinvestmentinchildreninordertoreducethefamily’sexposuretoshocks.Thismayresultinparentssendingtheirchildrentoworksothattheycanearnanincomeimmediatelyandbuildhumancapitalthroughon-the-jobtraining(Levison,1991).Otherresearch,however,hasshownthatadeclineineconomicactivitiesmayreducecurrentemploymentopportunitiesrelativetothefuture,andtherebyalsoloweropportunitycostsofchildren’seducation.Consequently,parentsmaydecidetoincreasetheirinvestmentineducation.If,however,parentswhoareconstrainedbylackofcreditfaceeconomicshocks,thismayhavetheoppositeeffect,i.e.theymaywithdrawchildrenfromschoolandinvolvetheminlow-payingjobsforsurvival(JacobyandSkoufias,1997).

Child labour, gender inequality and rural/urban disparities
�4
4. Child labour and child schooling in ethiopia: national-level data
TocomplementtheYoungLivesdata,wedrawontheEthiopianCentralStatisticsAuthority(CSA)reportonchildlabour,whichprovidesanationallyrepresentativedataset.ThisisparticularlyimportantasYoungLivesdataarenotderivedfromanationallyrepresentativesample,eventhoughitisstrongintermsofcoverageofvariablesrelatedtochildworkandschooling.TheYoungLivesProjectover-sampledthepoor6and,becausetheresearchsitesarelocatedrelativelyclosetomainroadsforlogisticalpurposes,theYoungLivessamplesitesdonotcaptureextremelyremoteareas.Inthissection,usingtheCSAchildlabourreportof2002,weanalyseparticipationratesofchildreninschoolingandworkandtherelationshipbetweenchildworkandwealth(proxiedbyhouseholdexpenditure),anddisaggregatebyrural-urbanandregionalcategories.
EnrolmentinformalandinformalschoolingAccordingtothe2002CSAChildLabourSurveyreportonchildattendanceinformalandinformalschooling,about33percentofchildrenagedbetween5and17yearsattendedformalschool,while5percentofchildrenattendedinformalschoolssuchasreligiousschools(Table4.1).About56percentofchildrenhadneverattendedschool.Thedropoutrateduringthesurveyyearwas5percent,withboysdroppingoutmorethangirls.Schoolattendanceincreasedwithage,with36percentofchildrenbetween7and12yearsoldattendingschool.Themainreasonsgivenfornotattendingschool,inorderofimportance,were:
childrenaretooyoung(31.9percent);
childrenareneededtohelpwithhouseholdchores(18.7percent);
aschoolisnotavailableforthem(10.4percent);
childrenareneededtogeneratehouseholdincome(9.5percent);
parentscannotaffordschooling(8.7percent);and
familiesdonotpermitschooling(7.5percent).
InAddisAbaba,however,themainreasonforchildrennotattendingschoolwasthattheirfamiliescouldnotaffordit.ThisseemsreasonablegiventhatresidentsinAddisAbabahavetopayhigherschoolfeesandtransportcoststosendtheirchildrentoschool,whereasinothersiteschildrentypicallywalktoschool.LackofschoolsisnotthemainreasoninAmhara,Tigray,SNNP,OromiaandAddisAbabaRegionswheretheYoungLivessampleislocated,butitisthemainprobleminregionssuchasAfarandSomali.
6 SelectedonthebasisoftheEthiopianGovernment’sfoodsecuritydefinition.
•
•
•
•
•
•

Child labour, gender inequality and rural/urban disparities
�5
Table4.1:Statusof(formalandinformal)schoolattendanceofchildrenaged5‑17yearsin2001
Category %Attendingformalschool %Attendinginformalschool %Dropouts
Urban 74.3 5.8 0.1Rural 27.2 4.5 0.2RegionTigray 35.7 4.9 0.4Afar 27.8 6.1 0.0Amhara 31.3 3.7 0.3Oromia 32.4 5.6 0.2Somali 25.0 7.9 0.1Benshangul-Gumuz 44.1 1.3 0.4SNNP 30.1 3.5 0.2Gambella 56.3 1.5 0.5Harari 60.4 8.5 0.1Addis Ababa 79.3 8.4 0.1Dire Dawa 53.0 16.5 0.4Age5-6 6.0 5.7 0.17-12 35.8 5.0 0.313-14 49.1 3.6 0.215-17 42.8 3.6 0.3SexMale 36.9 5.9 0.3Female 29.9 3.5 0.2Total 33.4 4.7 0.2
Source: CSA (2002).
Children’sparticipationindomesticandproductiveactivitiesThenationalChildLabourSurveyprovidesdataonthedistributionofchildworkbetweenruralandurbanareasandamongregionsinthecountry(Table4.2).About52percentofthechildrenwerereportedtobeengagedinproductiveactivities.Girlsweremainlyengagedindomesticactivities(e.g.collectingfirewoodandwater,foodpreparation,washingclothes)whileboyswereinvolvedinproductiveactivities(e.g.cattleherding,weeding,harvesting,ploughing,pettytrading,wagework).Theparticipationrateinproductiveactivitieswas62percentforboysand42percentforgirls.Fordomesticactivities,thisfigurewas22percentforboysand44percentforgirls.Inruralareas,childrenweremorefrequentlyengagedinproductiveactivitiesthanindomesticactivities,whereasinurbanareastheoppositewastrue.Surveyalsoreportedthatchildworkwashigherinfouroftheregionswhereoursampleislocated(Amhara,Oromia,SNNP,Tigray)thanintheotherregions.ChildworkwasverylowinAddisAbaba(wheremostofoururbansamplechildrenarelocated).

Child labour, gender inequality and rural/urban disparities
�6
Table4.2:Distributionofworkingstatusofchildrenaged5‑17yearsin2001
Category Housekeeping activity only
Productive activity only
Housekeeping or productive activities
Both sexes (male + female) 33.3 7.4 44.7Male 22.8 11.7 50.3Female 44.3 2.9 39.0Urban (male + female) 59.1 4.5 14.3Urban male 53.0 4.0 15.8Urban female 64.5 4.9 12.9Rural (male + female) 29.4 7.8 49.4Rural male 18.6 12.8 55.1Rural female 40.9 2.5 43.4Age5-9 35.3 6.0 32.910-14 32.9 7.6 54.815-17 28.6 10.7 56.8Tigray 33.5 5.7 36.3Afar 30.0 20.3 35.7Amhara 26.2 12.1 45.3Oromia 34.7 6.9 46.4Somali 42.9 8.9 30.1Benshangul-Gumuz 41.5 2.9 39.0SNNP 34.6 3.2 51.0Gambella 53.8 4.4 23.2Harari 58.9 5.3 16.9Addis Ababa 56.7 6.0 6.5Dire Dawa 51.8 7.3 19.2
Source:CSA(2002).
Theaveragenumberofworkinghoursofchildreninvolvedinproductiveactivitieswas33perweek.One-thirdofchildreninvolvedinproductiveactivitiesworkedformorethan40hoursperweek.Theintensityofworkinproductiveactivitieswashigherforboys(36hours)thangirls(33hours)inruralareas,whereasinurbanareasitwashigherforgirls(31hours)thanboys(28hours).Thesurveyalsorevealedthatthehighestproportionofchildren(35.6percent)involvedindomesticactivitiesworkedabout3-4hoursperday.
Ofchildrenworkinginproductiveactivities,about88percentwereinvolvedinactivitiessuchasstreetvending,shoeshining,messengerservices,agricultureandrelatedlabouractivities,andaslabourersinmining,construction,manufacturingandtransport.Thisfigurewas89percentforruralworkingchildrenand52percentfortheirurbancounterparts.Surveyalsoindicatesthattheparticipationrateof5-9year-oldchildrenin‘elementaryoccupations’(e.g.subsistencefarming,waterandfirewoodcollection)washigherthanthatof10-14and15-17year-oldchildren,indicatingthatyoungerchildrenweremorelikelytoparticipateinlow-payingactivities.Theparticipationrateofworkinggirlsinelementaryoccupationswasslightlylowerthanthatofworkingboysinbothruralandurbanareas.Occupationgroupsofservicesandshopandmarketsalesaccountedforabout26percentofurbanworkingchildren,withgirls(28percent)participatingmorethanboys(23percent).

Child labour, gender inequality and rural/urban disparities
�7
Thesurveyalsorevealedthatsubstantialnumbersofchildrenwhoattendedschoolwerealsoinvolvedinproductiveanddomesticactivities.Ofthechildrenattendingschool,only3.9percentwerenotinvolvedinanyhouseholdorproductiveactivities,while17.8percentwereinvolvedinproductiveactivitiesand16.4percentindomesticactivities.
Inbothruralandurbanareas,themajorityofchildren(39percent)startedworkingattheageoffive.Theproportionofchildrenwhostartedworkingattheageoffivewashigherforrural(41percent)thanurbanchildren(22percent)becausetheformerassistedparentsinfarmactivitiesandlivestockherdingfromanearlierage.
EffectsofchildlabouronschoolingThesurveyrevealedthatschoolingwashighlyaffectedbychildren’sinvolvementinproductiveandhouseholdactivities.Childrenmighthavebeenlateorabsentfromclassduetotheirinvolvementinworkactivitiesandmayhavespentlesstimestudyinganddoinghomework.Amongchildrenwhowereattendingschoolandworking,about39percentrespondedthattheirinvolvementinworkhadaffectedtheirschooling.Thisfigurewas29percentforurbanchildrenand42percentforruralchildren,buttherewasnosignificantdifferencebetweenmaleandfemalechildreninthisregard.Giventhemarkedgenderdivisionofgirlsbeingengagedinhousekeepingactivitiesandboysengagedinproductiveactivities,wecanassumethatthenegativeeffectonschoolingwassimilarforbothproductiveandhousekeepingactivities.
RelationshipbetweenchildlabourandwealthWhenweanalysedtheparticipationrateofchildrenineconomicactivitybywealthcategory(proxiedbyexpendituregroup)forallchildrenandforthosewhoattendedschool,participationineconomicactivityincreasedwithincreasingexpenditure,reachedamaximumatthe100-300Birrexpenditurelevelanddeclinedthereafter(Figure2.1).Forthosechildrennotattendingschool,therewasapositiverelationshipbetweenwealthandchildlabourparticipation.Theresultsshowedaremarkabletrendwhenthisrelationshipwasdisaggregatedbyruralandurbanareas.Forurbanchildrenattendingschool,participationratesineconomicactivitydeclinedasthelevelofhouseholdwealthincreased(Figure2.3).Forthosewhodidnotattendschool,participationratesdeclineduptoacertainlevelofwealth(600-1000Birrpermonth)andthenstartedtorise.7Thisresultforurbanareasindicatesthatchildlabourwasmorecloselyrelatedtoincomepoverty.However,inruralareas,therewasapositiverelationshipbetweenthelevelofexpenditure(wealth)andchildren’sparticipationratesineconomicactivity(childlabour)uptoacertainlevelofwealth.Figure2.1indicatesthatforboththosewhowereattendingschoolandthosewhowerenot,theparticipationrateinworkincreasedasthelevelofhouseholdexpenditureorwealthincreased.Thismaybeaconsequenceofthe“wealthparadoxeffect”whichexplainsthatparticipationofchildrenineconomicactivitycanincreasewithwealthinruralareaswhenitisrelatedtolandownership,sincefailuresincreditandlabourmarketsmeanthatlandownerscannotemployexternallabourersandthususetheirchildrentoworkthelandinstead–asobservedinPakistanandGhana(BhalotraandHeady,2003).
7 Bywayofcomparison,1000Birrishigherthantheaveragemonthlycivilservantsalary.

Child labour, gender inequality and rural/urban disparities
�8
Figure 1. Relationship between child labour and expenditure%
eng
aged
in e
cono
mic
act
ivit
ies 70.0
60.0
50.0
40.0
30.0
20.0
10.0
0.0
<=100 100-300 301-600 601-1000 >=1001
Attending plus non-attending Attending school Not attending school
Figure 2. Relationship between child labour
% e
ngag
ed in
eco
nom
ic a
ctiv
itie
s
<=100 100-300 301-600 601-1000 >=1001
Expenditure group
Attending plus non-attending Attending school Not attending school
100.0
90.0
80.0
70.0
60.0
50.0
40.0
30.0
20.0
10.0
0.0
Figure 3. Relationship between child labour and wealth in urban Ethiopia
% e
ngag
ed in
eco
nom
ic a
ctiv
ity
<=100 100-300 301-600 601-1000 >=1001
Expenditure group
Attending plus non-attending Attending school Not attending school
80.0
70.0
60.0
50.0
40.0
30.0
20.0
10.0
0.0
Figure 1. Relationship between child labour and expenditure
% e
ngag
ed in
eco
nom
ic a
ctiv
itie
s 70.0
60.0
50.0
40.0
30.0
20.0
10.0
0.0
<=100 100-300 301-600 601-1000 >=1001
Attending plus non-attending Attending school Not attending school
Figure 2. Relationship between child labour
% e
ngag
ed in
eco
nom
ic a
ctiv
itie
s
<=100 100-300 301-600 601-1000 >=1001
Expenditure group
Attending plus non-attending Attending school Not attending school
100.0
90.0
80.0
70.0
60.0
50.0
40.0
30.0
20.0
10.0
0.0
Figure 3. Relationship between child labour and wealth in urban Ethiopia
% e
ngag
ed in
eco
nom
ic a
ctiv
ity
<=100 100-300 301-600 601-1000 >=1001
Expenditure group
Attending plus non-attending Attending school Not attending school
80.0
70.0
60.0
50.0
40.0
30.0
20.0
10.0
0.0

Child labour, gender inequality and rural/urban disparities
�9
5. young livesdata and methods of analysis
5.1 Quantitativemethods
WeusedYoungLivessurveydataofEthiopiawhichcovers1999householdswhichhadatleastonechildaged6to17monthsin2002(thesamplechildren).Fromtheadditionalhouseholddatacollected,informationwasalsoobtainedfromatotalof3115childrenaged7to17years.Thedatawascollectedfrom20sentinelsitesin5regions,namelyAddisAbaba,Oromia,Tigray,AmharaandSNNP.TheseregionswereselectedbecausetheycontainthemajorityoftheEthiopianpopulation(96percent).ThesentinelsitesweredistributedoverthefiveregionsinsuchawaythatAmhara,OromiaandTigraycomprised20percenteachofthesample,whileSNNPcomprised25percentandAddisAbaba15percent.Fortypercentofthechildrenwerefromurbanareasandtheremaining60percentfromruralareas.Withinregions,sentinelsitestargetedpoorareasbasedonthegovernment’sfoodinsecuritydesignation.Threeoutoffoursentinelsitesineachregionareinhighfooddeficitworedas(districts)andoneisalowerfooddeficitworeda.Consequently,thesentinelsitesover-sampledthepoor,butincludedadegreeofvariationforcomparativepurposes.
Forthispaper,weadoptadefinitionofchildlabourbasedonacombinationoftheILOdefinitionandachildrightsperspectivederivedfromtheUnitedNationsConventionontheRightsoftheChild(UNCRC).ILOConventions138and182categorisechildlabourasengagementbychildrenunder15years(exceptinthecaseofhazardousworkwheretheagelimitis18years)inworkactivitiesoutsidethehouseforatleasttwohoursperdayorfourteenhoursperweekanddoublethenumberofhoursfordomesticactivities.However,wefollowtheUNCRCdefinitionwhichidentifieschildlabourersasallpersonsunder18yearsofageinharmfuloccupationsorworkactivitiesinthelabourmarketortheirownhouseholdwhichmayinterferewiththeirdevelopment.Byexplicitlyconsideringbothpaidandunpaid,domesticworkandworkoutsidethehousehold,weavoidthegenderbiasoftheILOdefinitionwhicharbitrarilyassignslessweighttodomestic-basedwork.
Bothdescriptiveandmultivariateanalyseswereusedtoexplorethecorrelationbetweenchildschoolingandlabourontheonehand,andvariablesincludinghouseholdcomposition,poverty,creditmarkets,socialcapitalandurban-rurallocation,ontheother.DatawereinitiallycapturedusingaMicrosoftAccessdatabaseandanalyseswerecarriedoutusingStataversion8andSPSS12.0.Thedescriptivemethodofanalysisincludescross-tabulationsofchildren’smainactivitieswithdifferentvariablesthatareexpectedtoinfluencechildschoolingandlabour.WealsoconductedunivariateanalysesusingPearson’schi-squaredtest (χ2)totestthenullhypothesisthatthepairsofvariablesareindependentofeachother.
Inordertodeterminethefactorsthataffectchildschoolingandlabour,weconductedmultivariateregressionanalysesusingamultinomiallogitmodel.Thefourmainactivitieschildreninthesurveyedhouseholdswereclassifiedintoare:schoolingonly,workonly,schoolingandwork,andminimalwork.Thesechoicesaremutuallyexclusive.Asdiscussedabove,inthequantitativeanalysiswedefinechildlabouraschildren7to17yearsoldthatareinvolvedincash, in kind or non-wage economic activities.Achildisconsideredtobe“workingonly”ifs/heisinvolvedinanytypeofworkforatleast14hoursperweek.Inthispaper,achildisconsideredtobeinschoolifs/heiseithercurrently

Child labour, gender inequality and rural/urban disparities
20
enrolledinschoolorhasatleastattendedsomeyearsofschooling.8Achildisinvolvedin“schoolingonly”ifs/heattendsschoolandspendsher/hisout-of-schooltimemainlystudying.Achildwhoworksafterschool,andtherebyuseshis/herleisureandstudytimeonwork,isclassifiedas“workingandschooling”.Finally,ifachildisneitherinvolvedinanyworknorenrolledinschool,s/heisconsideredtobeengagedin“minimalwork”.
Therefore,thedependentvariableweusedinouranalysesofthedeterminantsofchildschoolingandchildlabouriscategorisedintooneofthosefouroutcomes:schoolingonly,workonly,workandschooling,andminimalwork.ThedefinitionsandsummaryofthevariablesthatareincludedinourstudyofchildschoolingandlabourarepresentedintheAppendix(TableA1.1andTableA1.2).
5.2 QualitativemethodsQualitativeresearchwascarriedoutinfiveofthetwentyYoungLivessitesinFebruaryandMarch2005.OnesitefromeachofthefiveregionsrepresentedintheYoungLivessamplewasselected,fourofwhichwereruralandoneurban.Acombinationoffocusgroupdiscussions(withYoungLivesparentsandchildren),semi-structuredin-depthinterviews(withchildren,parentsandteachers)andinterviewswithkeyinformants(schooldirectorsandcommunitydevelopmentworkers)werecarriedoutineachsiteoverafour-weekperiod.Approximatelythirtypeoplewereinterviewedineachsite.Analyseswerebasedon:
adebriefingworkshopwherethefiveresearchassistantsandseniorresearcherspresentedtheirfindingsanddiscussedsimilaritiesanddifferencesacrossthesites;
thetranscriptsoftapedinterviews(translatedintobothEnglishandAmharic);
extensivefieldnotesandfieldreportspreparedbytheresearchassistants.
Theanalysessoughttoidentifybothcommonpatternsanddifferencesacrossallthesites.Particularattentionwasalsopaidtothegenderdynamicsatplayatthehousehold,schoolandcommunitylevels.
8 Notethatthosewhoareliteratewithoutattendingformalschoolareassumedtobetheequivalentofgradethree.
a)
b)
c)

Child labour, gender inequality and rural/urban disparities
2�
6. quantitative and qualitative analysis and discussion
6.1 Children’smainactivitiesThissub-sectionpresentstheresultsofthedescriptiveanalysesofourchildschoolingandlabourstudy.Table6.1indicateschildren’smainactivitiesinthefiveregionswhereoursamplechildrenarelocated.Ascanbeseen,about53percentofthesamplechildrenattendedschool,withthehighestschoolattendanceregisteredinAddisAbaba(about84percent)andthelowestinAmhararegion(about32percent).About9percentofthesampledchildrenwereengagedinworkonly.Atleast12percentofthechildreninoursamplespenttheirtimecombiningworkwithschoolingandaboutone-quarterofchildreninthesamplewereinvolvedinminimalwork.Thetablealsoindicatedthat,ofthetotalsamplechildrenwhowereengagedinworkonly,thelargestproportionwasfromAmhara(about30percent)followedbyOromia(about11percent).ThehighestnumberofsampledchildreninvolvedinminimalworkwasreportedinSNNP(about32percent)andTigray(about31percent)(seeTable6.1).
Table6.1:Children’smainactivitybyregion(in%)fromYoungLiveshouseholdswhohadatleastoneone‑year‑oldchildin2002
Main activityRegions
Addis Ababa Amhara Oromia SNNP Tigray TotalSchooling only 84.26 32.43 49.36 48.56 61.95 52.94Work and schooling 1.27 30.37 10.89 13.46 2.77 12.52Work only 1.02 23.37 11.07 6.25 4.37 9.51Minimal work 13.45 13.83 28.68 31.73 30.9 25.03
Table6.2presentsdifferencesbetweenruralandurbanchildren’sactivitiesineachregion.Approximately79percentofurbanand37percentofruralchildrenwereinschoolwithoutbeinginvolvedinanyworkactivities.Theproportionofchildrenwhocombinedschoolwithworkwaslargerinruralareas(about18percent)thaninurbanareas(4percent).Similarly,thenumberofchildrenengagedinworkonlywashigherinruralareasthaninurbanareas.About31percentofchildrenresidinginruralareasand15percentofchildreninurbanareaswereinvolvedinminimalwork.Similarly,itispossibletosee,forexample,thatinAmharaatleast60percentofruralchildrencombinedschoolwithwork,thehighestamongthefiveYoungLivesregions.Morebroadly,only31percentofruralchildrenattendedschoolastheirmainactivity.Inallregions,nourbanchildrenhad“workonly”astheirmainactivity.Moreover,asexpected,inallregionslargerproportionsofurbanchildrenhad“schoolingonly”astheirmainactivity.
Table6.2:Child’smainactivity(in%)Main activity Rural Urban TotalSchooling only 37.23 78.79 52.94Work and schooling 17.47 4.36 12.52Work only 14.51 1.28 9.51Minimal work 30.79 15.57 25.03

Child labour, gender inequality and rural/urban disparities
22
Table6.2a:Comparisonofchildrenwhoattendschoolorwork(in%)
% of children involved in work % attending school
Region YL CSA YL CSAAddis Ababa 1.27 6.5 84.26 79.3Amhara 30.37 45.3 32.43 31.3Oromia 11.07 46.4 49.36 32.4SNNP 6.25 51.0 48.56 30.1Tigray 4.37 36.3 61.95 35.7
WhenweuseYoungLivesdatatocomparethepercentageofchildrenparticipatingintheworkforce,AmharahadthehighestchildparticipationratefollowedbyOromiaandSNNP.However,CSAdatashowedhighestchildparticipationinSNNPfollowedbyOromiaandAmhara.Forchildrenattendingschool,CSAfigureswerelowerforallregionsincludingAddisAbabaindicatingthatschoolenrolmentwashigherintheYoungLivessampledatathantheCSAdata.Thedifferencemaypartlybeexplainedbythefactthat,whileYoungLivesover-samplesthepoor,theresearchsitesareclosertomainroads,whereastheCSAdataincludeveryremoteareas.
Thehoursworkedperdayandtheaverageyearsofschoolingfordifferentcategoriesofschool/workparticipationisprovidedinTable6.2b.Wedidnotfindanysignificantdifferenceinhoursworkedbetweenchildrenwhowereonlyworkingandthosewhocombinedschoolwithwork.Thedifferenceineducationalperformancebetweenthesetwogroupsisrelatedtothelackoftimethatchildrenhadtospendonstudyingandhomeworkaftergoingtoschoolandworkinganaverageof5.8hoursperday.Wealsofoundnosignificantdifferenceintheaverageyearsofschoolingbetweenthosewhohadonlyattendedschoolandthosewhohadcombinedschoolwithwork.Furthermore,thedropoutratesseemveryhigh.Thepercentageofchildrenwhohadbeeninschoolatanytime(includingthosecombiningschoolwithwork)was95.2percent,butonly70percentofthemwerestillinschool,whiletheremaining25percenthaddroppedout.
Table6.2b:Hoursworkedandaverageyearsofschooling
School only School & work Work only
Hours per day working 5.8 6
Years of schooling 1.91 1.86
% still attending school 69.8 60.2
6.2 Children’sdropoutratesOneofthereasonsthatchildlabourraisesconcernsisthatwhereitundermineschildren’sdevelopmentitisaviolationofchildren’srightsandfurther,canlimitchildren’scapacitytotakeadvantageofeducationinordertoincreasetheiremploymentpossibilitiesinthefuture,thusraisingtheriskofintergenerationalpovertytransfers.Ofthe3115childrenbetween7and17yearsofage,35percenthaddroppedoutofschool(Table6.2c).Thedropoutratewashighestjustaftercompletingfirstgradeorinsecondgrade,usuallyattheageofeightyears,implyingthatmanydropoutsoccurbeforechildrenareabletoreadandwriteproperly.Thedropoutratewassubstantiallyhigher(81percent)forruralthanurban(19percent)children.Itwasslightlyhigherforgirls(36percent)thanforboys(34

Child labour, gender inequality and rural/urban disparities
23
percent).Thedropoutrateswerehigherforchildrenwhocombinedschoolwithworkthanforthosewhoonlystudied,indicatingthatchildworkispartlyresponsible(ifnotthemainreason)fordroppingout.Whenwecomparemale-headedhouseholdsandfemale-headedhouseholds,thedropoutrateissignificantlyhigherformale-headedhouseholds.Thisis,atleastpartlyduetothefactthattherateofchildworkishigherinmale-headedthanfemale-headedhouseholds.Thissuggeststhatoncefemaleheadsdecidetosendtheirchildrentoschool,theyaremorelikelytoremaininschool.
Table6.2c:DropoutratefordifferentgroupsofYLchildrenGroup Dropout rateRural 81.1Urban 18.9Female 36.0Male 34.1School only 30.21School and work 39.84Female-headed HH 26.4Male-headed HH 37.1Years of schoolingZero 11.88One 73.03Two 10.88Three 0.91Four 0.91Five 0.27Six 0.09Seven 0.09Eight 0.64Nine 1.28Total 35.1
Table6.3showschildren’smainactivitybysexandlocation.Weclassifiedoursamplechildrenintotwoagegroups:7to11(primaryschoolchildren/younger)and12to17(secondaryschoolchildren/older).ThisismainlybecauseinEthiopiaitiscommonforchildren’sworktodifferbetweenagegroups,duetoevolvingphysicalandpsychologicalcapacities.9Accordingly,atleast52percentoftheyoungerchildrenand54percentoftheoldergrouponlyattendedschool.Similarly,ahigherproportionoftheolderagecategory(17percent)had“workandschooling”astheirmainactivitycomparedtotheyoungercategory(nearly9percent).Additionally,alargerproportionoftheyoungergroup(31percent)wereengagedin“minimalwork”comparedtotheolderchildren(17percent).
Inrelationtogenderdifferences,theresultsindicatedthatalargershareofgirlsthanboyshadattendingschoolastheirmainactivity,butalargershareofboysinthetwoagegroupshadcombinedworkandschool.
9 Cockburn(2001)similarlyclassifiedhissampleintotwocategories:6-10and11-15.

Child labour, gender inequality and rural/urban disparities
24
Table6.3:Children’smainactivitybysexandlocation
Between 7 and 11 Between 12 and 17 All children Between 7 and 11
Between 12 and 17
Boys Girls Total Boys Girls Total Boys Girls Total Rural Urban Rural UrbanSchool only 49.70 54.72 52.31 52.75 54.65 53.74 51.5 54.69 52.94 35.82 84.21 39.29 73.28
Work & school 10.04 7.66 8.80 22.02 12.82 17.23 15.33 9.93 12.52 12.47 1.70 24.74 17.23
Work only 10.28 5.33 7.70 11.01 12.54 11.80 10.60 8.50 9.51 11.68 0.00 18.62 11.80
Minimal work 29.99 32.30 31.19 14.22 20.00 17.23 23.02 26.88 25.03 40.04 14.09 17.35 17.23
Total 100 100 100 100 100 100 100 100 100 100 100 100 100
Moreover,ourfindingsontheuseofchildren’stimebetweenthesetwoagegroupsinruralandurbanareasindicatethatabout36percentofruraland84percentofurbanyoungerchildrenhad“schoolingonly”astheirmainactivity.Thecorrespondingpercentagesfortheircounterpartsare39percentand73percent.Alargershareofyoungerchildreninruralareas(about13percent)attendedschoolandworkastheirmainactivitycomparedtotheircounterpartsinurbanareas(about2percent).Asimilartrendwasobservedforolderchildreninruralandurbanareas.Thenumberofchildreninvolvedinminimalworkwasalsolargerinruralareas(about40percent)comparedtourbanchildren(about14percent).However,theproportionofchildrenengagedinminimalworkinruralandurbanareasisalmostthesameforolderchildren(seeTable6.3).
Theliteraturesuggeststhatahousehold’spovertystatusorincomeandassetownershipaffectstheuseofchildren’stimeindifferentwaysaccordingtothecontext.Therefore,exploringtherelationshipbetweenachild’smainactivitiesandhouseholdpovertystatusishighlypolicyrelevantwhenconsideringhowtoreducechildhoodpoverty.Accordingly,thestudyresultsindicatethatchildrenwhohad“schoolingonly”astheirmainactivitywerefromwealthierhouseholds,andthisistrueforbothsexes.Childrenfromhouseholdswithmorelivestock,orthegreatestlandandassetbase,combinedschoolingwithwork(primarilycattleherdingandfarming)astheirmainactivity.Ruralchildrenwhodidminimalworkwerechildrenofhouseholdswithlesslivestockandland.10Similarly,inurbanareasschool-goingchildrencamefromwealthierhouseholds,whilechildrenfromhouseholdsthatownedmorelivestockcombinedschoolingwithworkastheirmainactivity.TheseresultsarepresentedinTables6.4and6.5.
Table6.4:Children’smainactivitybysexandpoverty/wealthstatus
Main activity
Boys Girls All children
Wealth LandAsset base Livestock Wealth Land
Asset base Livestock Wealth Land
Asset base Livestock
School only 0.1965 0.605 2.71 1.43 0.21 0.55 2.64 1.36 0.2016 0.573 2.67 1.39
School & work 0.06 1.24 3.25 2.14 0.08 1.32 3.08 2.04 0.07 1.28 3.17 2.09
Work only 0.04 0.99 3.00 1.69 0.04 1.38 3.13 2.00 0.05 1.11 3.02 1.77
Minimal work 0.11 1.17 3.30 1.72 0.12 0.89 2.98 1.38 0.16 0.57 2.61 1.17
Total 0.16 0.78 2.86 1.61 0.18 0.70 2.73 1.49 0.17 0.7 2.75 1.48
10 Cockburn(2001)alsofoundthatworkingchildrenwerefromhouseholdswiththehighestlandandlivestockownership,andinactivechildrenwerefromhouseholdswithlowlevelsofassetownership.

Child labour, gender inequality and rural/urban disparities
25
Table6.5:Children’smainactivitybylocationandpoverty/wealthstatus
Main activity
Urban children Rural children
Wealth Land Asset base Livestock Wealth Land Asset base Livestock
School only 0.34 0.09 1.91 0.673 0.08 0.99 3.34 2.03
School & work 0.29 0.14 2.31 1.074 0.04 1.41 3.28 2.22
Work only 0.6 0.02 2 0 0.04 1.14 3.05 1.81
Minimal work 0.32 0.04 1.75 0.5 0.07 0.87 3.09 1.55
Total 0.33 0.09 1.90 0.66 0.07 1.08 3.27 1.98
6.3 UnivariateanalysesoffactorsaffectingchildschoolingandlabourThissub-sectionpresentstheresultsofcross-tabulationsofchildren’stimeuseagainstvariablesthatareexpectedtobecorrelatedwithchildren’stimeuse.Table6.6showsthesummaryoftheresults.
Thefollowingvariablesallhaveasignificantpositiverelationshipwithchildlabour–thatis,theyarelikelytoincreasetheinvolvementofchildreninlabouractivitiesrelativetoeducation:sexofthechild;sexofthehouseholdhead;maritalstatusofthehouseholdhead;socialsupport;whetherthehouseholdisinvolvedinagriculture;landownership;numberoflivestockowned;thehouseholdassetbase;seriousdebt;themeandistancetoschool;andproxyvariablesformother’sinvolvementinnon-farmandagriculturalwork.
Thefollowingvariableshaveanegativeandstatisticallysignificantrelationshipwithachild’suseoftime–thatis,thesevariablesarelikelytoincreaseachild’sinvolvementinschoolingrelativetolabouractivities:location;wealth;cognitivesocialcapital;absolutestructuralsocialcapital;citizenship;householdsinvolvedinoff-farmwageemployment;mother’sinvolvementinnon-farmwagework;father’syearsofschooling;and meanschoolingofmaleandfemaleadultsolderthan17years.However,achild’srelationshipwiththehouseholdhead,mother’syearsofschoolingandthesexofthehouseholdheadhavenocorrelationwithachild’smaintypesofactivity.Atthisjuncture,wedonotdiscusstherelationshipofthevariablesindetailastheunivariateanalysisdoesnotconsidertheeffectsofothervariables,butsimplygivesanindicationastowhichvariablestoconsiderforthemultivariateanalysis.

Child labour, gender inequality and rural/urban disparities
26
Table6.6:Pearson’schi‑squaretestforthedeterminantsofachild’smainactivity
Variable SignPearson
chi2Degree of freedom P-value
Location (1 if urban; 0 if rural) Negative 307.67 3 0.000***Wealth index Negative 267.26 6 0.000***Father’s years of schooling Negative 327.23 36 0.000***Mother’s years of schooling Positive 3.43 6 0.753Sex of child (1 if male; 0 if female) Positive 23.81 3 0.000***Sex of head (1=male; 0=female) Positive 5.01 3 0.171Cognitive social capital Negative 59.73 12 0.000***Absolute structural social capital Negative 84.5 21 0.000***Social support Positive 207.12 36 0.000***Citizenship Negative 30.72 3 0.000***Dummy for household head divorce Positive 17.88 3 0.000***Region 622.95 12 0.000***Ownership of land Positive 224.76 3 0.000***Total number of livestock owned Positive 209.18 12 0.000***Dummy for household in serious debt Positive 141.47 3 0.000***Household asset base index Positive 189.07 9 0.000***Child’s relation to head Negative 4.999 3 0.172Mean distance to school Positive 770.56 18 0.000***Mean schooling of male adult over the age of 17 Negative 497.40 132 0.000***Mean schooling of female adult over the age of 17 Negative 647.9732 126 0.000***
***significantatleastat1%;*significantatleastat10%
6.4 Triangulatingmultivariateanalysesresultsandqualitativeresearchfindings
TheresultsofthemultivariateanalysesofthedeterminantsofchildschoolingandlabourarepresentedinTable6.7.Asmentionedpreviously,thechild’sdecisionsabouther/hismainactivityarediscretechoices,namelyschoolingonly,schoolingandwork,workonlyandminimalwork.Ourmultinomiallogitmodeltakesacategoricaldependentvariablegroupedintothesefourmaintypesofchildren’stimeuseanddifferentexplanatoryvariablesincludinghouseholdcomposition,childcharacteristics,productiveassetownership,wealth,debtandsocialcapital.
Weestimatedanumberofmultinomiallogitmodels.First,werantheregressionforthetotalsampleinwhichweestimatedthemodelbyincludingthesexofthechildandthelocationwherethechildisliving(rural/urban).Wealsoransixotherseparateregressionsforboysandgirls,forruralandurbanchildren,andformale-andfemale-headedhouseholds.Theestimationresultsforthetotalsamplearereportedinthemainbodyofthereport,andtheresultsfortheothersixregressionsinAppendixA2.
Weconducteddifferentteststodeterminewhetherourresultsarerobustandsensible.Aswearedealingwithcross-sectionaldata,wemadearobustestimationtohandleproblemsofheteroscedasticity.Moreover,wecalculatedaconditionindextocheckformulticollinearityintheregression,whichwas28.43,indicatingthatmulticollinearitywasnotaproblem(Belsley,KuhandWelsh,1980).Wealsotestedwhetherthedifferentoutcomescanbecombined(Hausmantest).Inalltests,wefoundrobustandsensibleresults.Foralltheregressions,weestimatedtheoddsratio,marginaleffectandpredictedvalue.However,thefollowingdiscussionisbasedonresultsfromtheoddsratio.Thereportedfigures

Child labour, gender inequality and rural/urban disparities
27
inthetablesareincidentalcoefficients.Wedidnotincludethemarginaleffectandpredictedvaluesinthisreport.Therefore,theregressionresultsforthetotalsamplearepresentedinTable6.7fortheoddsratio.
Inourtotalsampleestimation,weincludedlocationandregionvariablestoseehowchildlabourandschoolingdifferbetweenruralandurbanareasaswellasbetweenthefivemajorregionswhereoursamplechildrenarelocated.Theresultsindicatedthaturbanchildrenweremorelikelytoattendschoolrelativetoworking,orcombinedschoolingwithwork,comparedtotheirruralcounterparts.Inaddition,theprobabilityofachilddoingminimalworkdecreasedforchildrenresidinginurbancomparedtoruralareas.Thisindicatesthatchildschoolingandlabourhavedifferentcharacteristicsinruralandurbanareas,suggestingtheneedtohavedifferentpoliciestoaddresschildpovertyinthedifferentareas.RegionaldummiesrevealedthatchildreninAmharaandOromiaweremorelikelytocombineworkwithschoolingcomparedtothebasecategory(schoolingonly).However,althoughstatisticallyinsignificantinOromia,childreninbothregionswerelesslikelytobeengagedinworkonlyandminimalworkrelativetoattendingschool.ChildreninSNNPwerelesslikelytobeinvolvedinworkonlycomparedtoschoolingonlybutwithagreaterchanceofcombiningworkandschoolingandengagedinminimalwork.InTigray,childrenwerelesslikelytoworkandcombineworkandschoolingcomparedtothereferencegroupalthoughthereisahighprobabilityforminimalwork.Suchregionalvariationsinchildren’stimeutilizationmaycallforregion-specificpolicyinterventionstotacklechildhoodpoverty,butwouldfirstrequiremorein-depthanalysis.

Child labour, gender inequality and rural/urban disparities
28
Table6.7:Determinantsofchildschoolingandlabour(allsamples)(Amultinomiallogitmodelusingschoolingonlyasabasecategoryforcomparison)
Name of variablesSchooling &
work Work only Minimal workAge of a child 0.178*** 0.276*** 0.005
(4.82) (6.99) (0.20)Dummy for a male child 0.273* 0.336** -0.174*
(1.77) (1.99) (1.74)Dummy for male-headed HH -0.050 0.093 0.242
(0.20) (0.32) (1.45)Mother’s years of schooling -0.085** 0.031 0.032
(2.09) (0.61) (1.40)Father’s years of schooling -0.001 -0.122*** -0.030
(0.02) (2.74) (1.61)Number of male children under 7 years old -0.156 -0.246 -0.055
(1.15) (1.64) (0.66)Number of female children under 7 years old 0.151 0.143 -0.089
(1.16) (1.00) (1.03)Number of male HH members >17 years old -0.419*** -0.067 -0.053
(2.99) (0.49) (0.69)Number of female HH members >17 years old 0.142 -0.290* -0.192**
(1.09) (1.74) (2.13)Number of elder children between 7&17 -0.290*** -0.178* 0.196***
(2.92) (1.65) (3.91)Number of younger children between 7&17 -0.052 -0.342*** -0.335***
(0.57) (3.35) (4.66)Dummy for urban residence -0.657** -1.045** -0.459**
(2.07) (2.41) (2.46)Dummy for Amhara region 1.769*** -0.180 -0.662**
(3.34) (0.27) (2.53)Dummy for Oromia region 0.517 -0.588 -0.309
(0.94) (0.85) (1.29)Dummy for SNNP region 0.339 -0.995 0.196
(0.63) (1.39) (0.94)Dummy for Tigray region -1.194** -1.795** 0.162
(2.01) (2.52) (0.63)Wealth index constructed from consumer’s durables 0.111 -6.687*** -7.499***
(0.06) (2.71) (6.22)Wealth index squared -1.169 5.285 7.200***
(0.33) (0.96) (3.75)Hectares of land owned 0.398*** 0.264** 0.086
(3.49) (2.24) (0.93)Mean distance (km) to public and private primary schools 0.136*** 0.243*** -0.068**
(3.80) (5.99) (2.31)Total number of livestock owned 0.162** 0.176** 0.051
(2.13) (2.13) (1.06)Number of events that decrease the HH welfare 0.116*** 0.111** 0.023
(2.69) (2.33) (0.76)Cognitive social capital 0.042 0.075 0.042
Continuedoverleaf

Child labour, gender inequality and rural/urban disparities
29
Name of variablesSchooling &
work Work only Minimal work(0.43) (0.68) (0.68)
Absolute structural social capital -0.100 -0.370*** -0.063(1.10) (3.63) (1.19)
Number of organisations from which one gets social support 0.121*** 0.208*** 0.046(2.72) (4.19) (1.54)
Social capital: citizenship -0.180* -0.017 -0.098(1.66) (0.14) (1.43)
Dummy for the HH head being divorced 0.042 0.785** -0.029(0.11) (2.07) (0.11)
Relationship to the index child (1 if brother/sister; 0 otherwise) -30.124 0.827 -1.625
(0.00) (0.70) (1.44)Dummy for a HH being in serious debt 0.526*** 0.473*** 0.239**
(3.27) (2.68) (2.18)Constant -5.199*** -4.725*** 0.517
(6.37) (4.72) (1.16)Observations 2845 2845 2845Pseudo R2 0.2578
Absolutevalueofzstatisticsinparentheses;*significantat10%;**significantat5%;***significantat1%
6.4.1 Children’scharacteristicsEmployingadummyforthesexofthechild,ourquantitativeresultsfoundthatboysweremorelikelythangirlstocombineworkandschoolingortobeengagedinworkonly,butwerelesslikelytobeinvolvedinminimalworkcomparedtotheirfemalecounterparts(seeTable6.7).Ourqualitativefindings,however,clearlyrevealedthatwhenbothdomesticandnon-paidworkarefactoredin,thengirlswerealsoactivelyinvolvedinlabouractivities.AsTable6.8shows,thereisadivisioninthetypesofactivitiesinwhichgirlsandboysarepredominantlyengaged,butintheabsenceofmaleorfemalesiblings,childrenoftensubstitutedfortheothersex.
Table6.7Continued

Child labour, gender inequality and rural/urban disparities
30
Table6.8:GenderDifferencesinChildWorkActivities
Activity Gender differences
1.On-farm activities
Ploughing / digging Commonly boys
Weeding Both boys and girls, especially older children (12+ years)
Harvesting Both boys and girls, but more typically boys
Planting / transplanting Both boys and girls
Irrigation Both boys and girls
Herding, ‘ojo’ (tending livestock and pulling pack animals)
Boys and girls, but role changes as age increases, with girls taking on more domestic work
Fodder collection, especially in tigray Boys
2. Off-farm activities
Terracing Both boys and girls
3. Non-farm activities
Construction (e.g. Road, tree planting) Commonly boys
• Mini-bus conductors, household maids, construction workers,
• Waiters, kitchen hands in restaurants
• Apprentices in garages/ workshops
• Brokering,
• Shoe shining,
• Working as a porter
• Mini-bus conductors are commonly boys, housemaids commonly girls;
• Both girls and boys engage in work at construction sites; in catering houses; cleaning cups and dishes in restaurants; shoe shining
• Only boys work as apprentices in garages, but girls also serve in other vocational apprenticeships;
• Boys do more brokering, working as porters and gofers
4. Non-farm/ market-related
Loading goods on pack animals for market Both boys and girls, but commonly boys
Street vending (roasted grain or kollo, chewing gum, cigarettes, etc.)
Selling injera and ambashaBoth sexes are involved in street vending, but commonly girls
Crushing stones for sale Only boys
Collecting rock salt Only boys
Collecting firewood/ dry cow dung to sell Both boys and girls, but more commonly girls
Sex-related work Both boys and girls, but more often girls
5. Domestic work
Collecting firewood for domestic use Both boys and girls
House cleaning and plastering Only girls
Fetching water Both boys and girls, but girls as boys grow older
Cleaning Both boys and girls
Cooking food Only girls
Caring for siblings / childcare Both boys and girls, but more often girls

Child labour, gender inequality and rural/urban disparities
3�
Theageofthechildalsohadapositiveandsignificantimpactonchildschoolingandwork,indicatingthatolderchildrenweremorelikelytocombineworkwithschoolingandwereinvolvedinworkonlyrelativetothereferencegroup(schoolingonly).Similarly,theprobabilityofachildbeingengagedinminimalworkincreasedwithagealthoughitisstatisticallyinsignificant.Theseresultswerealsoconsistentwithourqualitativefindingswhereyoungerchildrenoftennotedthatoldersiblingswereshoulderingmoreofthefamilyworkburden.Forexample,agrade3studentfromWuribnoted:“My brother…also works on farms because my father has died. He goes to school only three days a week. He encourages me to study hard”(2005).Ontheotherhand,wefoundinallfivequalitativeresearchsitesthatchildrenstartedworkasyoungasfourorfiveyearsofagebothbecausehouseholdsurvivalinanon-technological,largelyruralsociety,ishighlylabour-intensiveandincludeschildren’srolesasnormal.
In the village no one eats without working. There is always something to be done by children as early as 3 years of age and sometimes even at the age of 2. If a boy is above 3, tending sheep and cattle is his job. Girls of the same age help in household chores such as making coffee and gathering firewood (2005).
6.4.2 Familycharacteristics
Ourquantitativeresultsindicatethatthepresenceofolderchildrenaged7to17yearsdecreasedtheprobabilityofachildcombiningworkwithschool,beingengagedinworkonlyandminimalworkrelativetoschoolingonly,suggestingalaboursubstitutionorbirthordereffect.Weestimatedthemodelbyincludingthenumberofmaleandfemalechildrenbetween7and17yearsonly.Ourresultsshowedthatthepresenceofchildrenwithinthisagerangereducedthelikelihoodthatboyswouldhavetocombineworkandschoolandthatgirlswouldbeinvolvedinworkonly.Thepresenceofyoungerchildren(youngerthan7)inthehouseholdhadnoimpactonthewayoldersiblingsallocatedtheirtime.
Thebirthordereffectwasfurthersupportedbyourqualitativefindings.Forexample,onechildfromWuribnoted:“My two brothers help me in my study. Both are government employees”.Similarly,afocusgroupparticipantfromthesamesitenoted:“Girls become absent from school and will be at home to cook for other children, substituting for their mother when she goes somewhere for funerals, mourning, etc.” (2005).
TheburdenonsiblingsseemedparticularlydifficultinKirkoswhereHIV/AIDSappearedtobemoreprevalent(oratleastmoreopenlydiscussed)thaninothersites.ThereisagrowingnumberofAIDSorphanswhoareshoulderingfamilyresponsibilities.However,oneimportantexceptiontothetrendofyoungerchildadvantagewasnotedinthecaseofanimalherding.InSemhaandBilbala,forinstance,oldersiblingswereabletoattendschoolwhentheyoungerchildrenbecomeoldenoughtotakeovertheherding.
Separateregressionsforfemale‑andmale‑headedhouseholdswereruntoascertainifboysandgirlshavedifferentpatternsofinvolvementinschoolingandworkdependingonthesexofthehouseholdhead.Wefoundthatinfemale-headedhouseholdsthereweregreaterdemandsonboys’labourattheexpenseoftheirschoolingandhencemalechildrenweremoreoftencompelledtocombineworkandschoolingrelativetoschoolingonly.Boysinmale-headedhouseholdsweremorelikelytocombine

Child labour, gender inequality and rural/urban disparities
32
workwithschoolingandparticipatedinworkonlyrelativetoattendingschoolonly,butwerelesslikelytobeinvolvedinminimalwork.Thequalitativeresearchsuggestedthatthiswasmainlybecauseboyswererequiredtotakeonagriculture-relatedwork,especiallyploughing,whichisanactivitytypicallyassignedtoadultmales.TheoneinterestingexceptiontothispatternwasinthecaseofpolygamousfamiliesinUdugawheremothersemphasisedtheimportanceofsons’educationbecause,inthecontextoflargefamiliesandmultiplewives,childrenstandtoinheritlittle,ifany,land.
Inthecaseofthemaritalstatusofthehouseholdhead,ourresultsindicatedthatchildreninfamilieswhereparentsareinaunstablepartnershipweremorelikelytoworkonlyrelativetoattendingschoolonly,andthatgirlchildrenweremostlikelytobenegativelyaffected.
Parentaleducation:Ourquantitativeresultsindicatethatmaternaleducationlevelssignificantlydecreasedthelikelihoodthatchildrenwouldcombineworkandschoolcomparedtoschoolingonly.Similarly,childrenwithbettereducatedfatherswerelesslikelytobeinvolvedinworkonlycomparedtothereferencegroup.Theseresultsimplythatchildrenofeducatedparentsaremorelikelytoattendschool,whichmayhaveaninterestingpolicyimplicationforadulteducation.Inaseparateregressionforfemale-headedhouseholds,althoughstatisticallyinsignificant,morematernaleducationwasfoundtobeassociatedwithagreaterprobabilityofcombiningworkandschoolandparticipatinginworkonlyrelativetoschoolonly.Inthecaseofmale-headedhouseholds,however,maternaleducationreducedtheprobabilitythatchildrencombinedworkwithschool;fathers’educationreducedthelikelihoodofchildrenbeinginvolvedineitherworkorminimalwork.11
Theimportanceofmaternaleducationwasalsoevidentinthequalitativeresults.Forexample,oneeducatedmotherexplainedhervisionofindependenceforherdaughterasfollows:“What I want for her is to learn. Then once she is educated she can decide for herself. I cannot tell her to get married now” (Bilbala,2005).However,moresalientthanparentaleducationper seweretheattitudesofparentstowardschildworkandchildschooling.Forasignificantnumberofparents,childinvolvementinhouseholdorpaidlabourwasseenasanatural,unavoidableresponsibility,asthefollowingrespondentsillustrate:
If children do not respect our order to do work at home or in the field after school, then we will deny them lunch or dinner. So, they realise that they will be hungry unless they work. It is mandatory that they work (Bilbalaparent,2005).
I do not see the benefit of education and I want my daughter to stay at home and help my mother instead(Wuribfather,2005).
Parents say that if we all went to school, there would be no one to take care of the cattle and to work for the family (Wuribgirl,2005).
Children are helping parents, in the meantime they are learning necessary life skills, which they will make use of in the future. So it does them little harm (Bilbalacommunityleader,2005).
Inadditiontothesociallysanctionedviewthatchildworkisimportantintermsofcontributingtothepooloffamilylabour,andbeingamechanismforpassingonskillstotheyoungergeneration,anumberofurbanrespondentsstatedthattheypreferredinvolvingchildreninlabouractivitiesratherthanhavingthemidleandcourtingtroubleonthestreets.Forexample,onegirlteenagerfromKirkosnoted:
11 SeeTable6.9whichreportsselectedcoefficientsfromafullyspecifiedmodelreportedinAppendixA2.5andA2.6.

Child labour, gender inequality and rural/urban disparities
33
Little children aged 6 and 7 are employed in the garages. Because their families prefer to keep them busy instead of seeing them on the streets(2005).
Likewise,ateacherfromKirkosarguedthat:
Children in the streets would not be there if parents controlled them better. Engaging them in work is better than letting them be on the streets(2005).
Table6.9:Effectofsexofachildandmother’seducationonchildschoolingandwork12
Schooling&working WorkingOnly Minimalwork
formale‑headedhouseholdonlyDummyforamalechild 0.375** 0.505*** -0.134
(2.19) (2.70) (1.25)Mother’syearsofschooling -0.144*** -0.083 0.039
(2.91) (1.03) (1.30)Observations 2297 2297 2297
Forfemale‑headedhouseholdsonlyDummyforamalechild -0.177 -0.799 -0.90*
(0.50) (1.56) (1.88)Mother’syearsofschooling 0.061 0.104 0.026
(0.71) (1.26) (0.55)Observations 548 548 548
Robuststatisticsinparentheses;*Significantat10%;**significantat5%;***significantat1%.
Wealtheffect:Inourmodel,thepovertyhypothesisofchildlabourandschoolingisanalysedbyincludinghouseholdwealth.Theresultsindicatedthatuntilthethirdorfourthwealthquintileschildrenofwealthierhouseholdsweremorelikelytocombineworkwithschoolingrelativetoschoolingonly.13Wefoundaninverted-Urelationship(non-linearrelationship)betweenwealthandchildrencombiningschoolandwork:aninitialincreaseinwealthraisedthelikelihoodthatchildrencombinedschoolingandwork,butthisdeclinedafterreachingapeakatacertainlevelofwealth.Theresultswerethesamewhenthemodelwasrunforruralandurbanareasseparately(seeTablesA2.3andA2.4intheAppendix).Thisindicatesthatatsufficientlyhighlevelsofwealth,childschoolingincreasedsincechildrenofwealthierhouseholdswerelesslikelytoworkattheexpenseoftheirschooling;butbeforethatgivenwealthlevel,combinedworkandschoolincreased.Wealthhadanegativeandstatisticallysignificantimpactonchildrenbeinginvolvedinlessthantwohoursofworkperdayandworkonlyrelativetoschoolingonly.
Whilethequalitativeresultsalsofoundthatasignificantnumberofchildrenfrombothpoorandlesspoorhouseholdscombinedschoolandwork,themorecommonfindingwasthathouseholdpovertycompelschildrentowork,frequentlyattheexpenseoftheireducation(eitherattendanceortimeto
12 Extractedfromamultinomiallogitmodelusingschoolingonlyasabasecategoryforcomparison.13 Duetoexogeneityproblems,somevariablesincludingthetypeofhouseholdactivity(ownnon-farmbusinessandoff-farm
wageemployment)andmother’sworkburdenandmarketworkhadtobeomittedfromourempiricalmodels.Hence,thediscussion on the effects of these variables are derived from the qualitative findings only. When a household’s workloadincreases,whetherinnon-farmbusinessesoragriculturalwork,childlabourmaybereducedasaresultofapositiveincomeeffect (wealth effect or poverty hypothesis). On the other hand, when labour shortages are created as a result of wageemployment,parentsmayusechildlabourinsteadofusinghiredlabour.Wealsotriedtoassesstheeffectofmother’sworkburdenandmarketworkonhumancapitalformation.

Child labour, gender inequality and rural/urban disparities
34
dohomework).Asonemotherlamented:“She was a second grade student but when the school leaders asked her to buy pens, books and all that, we could not afford it. So she had to quit. Then she started to look after cattle, collect firewood”(Bilbala,2005).Evengovernmentalsafetynetprogrammessuchasfood-for-workschemesoftendirectlyorindirectlyinvolvechildlabour.Forexample,Bilbalaschoolteachersemphasisedthat:
Food-for-work schemes involve both parents and children. Some parents send their children to work on their behalf, and these children are absent from school. They (children) tell us that…they cannot eat unless they work(2005).
Similarly,inTigrayoneparentobserved:
There are two small girls in the village who go to school as well as work in the food-for-work programme. This helps the family as our region has been affected by drought. As you know, first comes food and water so sometimes they are absent from school in order to complete the work(Enderta(aYoungLivesparent),2005).
Ownershipofassets:Theownershipofproductionassetssuchaslandandlivestockcanaffectchildschoolinginvariousways.Itmayhaveapositiveeffectonschoolingbecauselargerassetholdingsmayallowhouseholdstoforgotheincomethatchildworkbrings.However,intheabsenceofaperfectlabourmarket,landandlivestockownershipcanalsohavetheoppositeeffectonchildschoolingandchildlabour,whichismorelikelyinEthiopia.Ownersoflandandlivestockwhoarenotabletohireproductivelabourmayhaveanincentivetousetheirchildren’slabourinsteadofsendingthemtoschool.Similarly,ifhouseholdsdonothaveaccesstocredit,oriftheycannotusetheirassetstogainaccesstocredittoemploylabour,theywillusetheirchildren’slabour.
Ourregressionanalysisresultsindicatedthatthesizeofahousehold’slandholdingshadapositiveandsignificantimpactonchildrenworkingorcombiningworkandschoolrelativetoschoolingonly.Thatis,childrenofhouseholdswithgreaterlandsize(becauseofopportunitycosteffects)weremorelikelytospendtheirtimeworkingorcombiningschoolandworkthanattendingschoolonly.Theimpactonchildren’sengagementinminimalwork,however,wasinsignificant.Thesefindingsaresupportedbythequalitativeresearchwhichhighlightedtheproblemsofgrowinglandfragmentationandlandlessnessduetoacombinationofpopulationpressuresandpoorqualityland.Thatis,whilelandownershipoftennecessitatessomechildinvolvementinlabouractivities,italsoprovidesgreatereconomicsecuritythanthatenjoyedbyfamilieswhohavebeencompelledtorentorselltheirlandduetonaturaldisastersandfinancialstrains.Suchfamiliesareoftenforcedtomigrateinsearchoflow-payingoff-farmworkortosendtheirchildrentoworkonconstructionsites,sellfoodinthevicinityofplacessellingalcohol(simultaneouslyincreasingtheriskofsexualharassment,abuseandexploitation)orallowtheirchildren,particularly,daughters,tobetraffickedtoArabcountries.
Wealsoexpectedthenumberoflivestockthatahouseholdownstoinfluencechildschoolingandlabour.Theresultsforthisvariableindicatedthatthenumberoflivestockahouseholdownshadapositiveandsignificantimpactonchildrenengagedinworkonlyorcombiningworkandschool.Intheabsenceofperfectlabourandcreditmarkets,ownershipoflargernumbersoflivestockledtogreaterchildlabour.

Child labour, gender inequality and rural/urban disparities
35
Runningseparateregressionsforruralandurbanareasrevealedthattheresultsreportedforthewholesamplealsoheldtrueforruralhouseholds.14Thereasonforthisfindinginruralareasisthatchildrenwerewidelyusedtoherdcattle.Evenricherhouseholdswhocouldaffordtosendtheirchildrentoschoolpreferredthemtoworkorherdcattlesotheydidnotforgoresourcestopayhiredlabourersforherding.ThiswasfoundtobeparticularlyprevalentinSemha/AratoandBilbalainNorthernEthiopiawhereownershipofanimalsisalsotraditionallyviewedasastatussymbolinadditiontoitseconomicvalue.Inurbanareas,however,althoughownershipoflivestockhasapositiveeffectoncombiningworkandschoolandengagedinworkonly,theeffectisstatisticallyinsignificant.
Table6.10:Theeffectoflivestockownershipandcredit,invariousactivitiesonchildschoolingandworkbyresidence15
Variable
Rural area Urban area
Schooling & Working
Working only
Minimal work
Schooling and
working Minimal
Work
Total number of livestock owned 0.317** 0.208 0.011 0.235 0.223*
(3.55) (3.18) (0.19) (1.22) (1.95)
Dummy for a HH being in serious debt 0.664*** 0.578*** 0.356*** 0.337 0.123
(3.58) (3.05) (2.58) (0.96) (0.55)
Robuststatisticsinparentheses;*Significantat10%;**significantat5%;***significantat1%
Liquidityconstraintorcreditmarkethypothesiswasexaminedbyincludingthedebtsituationofthechild’sfamilyinourregressionmodel.Resultsindicatedthatchildrenfromhouseholdswithseriousdebtweremorelikelytobeengagedinworkonly,combineworkwithschoolingandinvolvedinminimalworkrelativetoschoolingonly.Separateregressionsinruralareasessentiallyrevealsthesameresultswiththewholesample.Aninterestingimplicationisthatrelievinghouseholdliquidityproblemscanreducechildlabourandincreasechildschooling.Thispointwasfurtherunderscoredbythequalitativefindingswhichrevealedthat,mainlyduetodrought-relatedreasons,householdswereunablerepayloanstomicrofinanceinstitutions.Insuchcases,theironlyoptionwastoresorttomoney-lenderswhooftenchargedcloseto100percentinterest,therebycompoundingimpoverishedfamilies’debtburden.However,itisalsoimportanttopointoutthatbecausecreditiscommonlygiventofamiliestopurchaseadditionallivestock,theimpactonchildrencanbenegativeasitputsadditionalpressureonthemtobeinvolvedinherdingactivities.
Credit is being given for different sectoral activities. A person may take loans to buy five or six sheep. While on the one hand the credit is economically advantageous, on the other, it is creating burden on the children. Children may be absent from school (Bilbalateacher,2005).
Thestudyalsofoundthatchildrenofhouseholdswhofacedagreaternumberofadverseeventsthatdecreasedhouseholdwealthandwelfareweremorelikelytocombineworkandschooling,engagedinworkonlyandminimalworkrelativetoschoolonly.Theeffectinourmodelofsucheconomicshockswas,however,statisticallyinsignificant.Aseparateregressionformaleandfemalechildrenshowedthatthenumberofeventsthatdecreasedthehousehold’swelfaresignificantlyincreasedtheinvolvementofmalechildreninschoolingandworkcombinedandworkonly(seeTablesA2.1andA2.2inthe
14 Table6.10reportsselectedcoefficientsfromafullyspecifiedmodelreportedinAppendicesA2.3andA2.4.15 Extractedfromamultinomiallogitmodelusingschoolingonlyasabasecategoryforcomparison.

Child labour, gender inequality and rural/urban disparities
36
Appendix).Ourqualitativeresearchalsoindicatedthathouseholdsreliedontheirchildrentoworktosupplementhouseholdincomeintimesofcrisessuchasdroughtandthedeathofthebreadwinner.ThiswasparticularlythecaseintheSemha/AratositeinTigrayandinBilbala,Amhara,whichhavebeensubjecttorecurrentdroughtsinrecentyears.Here,childrenwereofteninvolvedinsubstitutingfortheirparentsinfood-for-workprogrammesforwhichthehouseholdreceivedpaymentingrain,oilorcash.
Wenowturnourdiscussiontothesocialcapitalcharacteristicsofahousehold,whichhasbeenlittlediscussedintheliteratureonchildschoolingandlabour.Forthepurposeofthispaper,wedefinesocialcapitalastheformalandinformalrelationshipsamongindividualsandcommunitiesandtherelationshipsoftrustandtoleranceinvolved.Ourhypothesisisthatsocialcapitalmayhelpimprovechildschoolingandreducechildren’sengagementinlabouractivitiesthroughthefollowingchannels:communicationandthereductionofinformationasymmetries;raisingawarenessabouttheimportanceofchildschoolingandtheproblemsassociatedwithchildlabour;andthroughitscomplementaryeffectongovernmentaleffortstoincreaseeducationalaccessandencourageenrolment.Weincludedfourindicatorsofsocialcapitalinourregressionmodel:cognitivesocialcapital;thenumberoforganisationswhichprovidesocialsupport;citizenship;andabsolutestructuralsocialcapital.Allhadsignificantimpactswiththeexceptionofabsolutestructuralsocialcapital.16
Theresultsindicatedthatcognitivesocialcapital(reflectingcaregivers’perceptionsoftrust,self-esteem,senseofbelongingandperceptionsofcommunityco-operation)increasedthelikelihoodofcombiningworkandschool,workonlyandminimalworkcomparedtoattendingschoolalthoughtheresultsarestatisticallyinsignificant.
Thenumberoforganisationsfromwhichahouseholdreceivessocialsupportwasfoundtobepositivelyandsignificantlyassociatedwithcombiningschoolingandworkandengagedinworkonlyrelativetoschoolingonly.Thevariabledoesnotshowasignificanteffectforminimalworkrelativetoschoolingonly.FindingsfromthequalitativeresearchinAmharaandTigrayregionssuggestthatthiscouldbebecausesocialsupportiscommonlyprovidedintheformoffood-for-workprogrammes.Asdiscussedabove,theseprogrammestypicallyinvolvedchildrenworkingalongsidetheirparentstocomplete,forexample,constructionorterracingwork,andincreasingthelikelihoodthatchildrenhavetocombineworkandschool.Incontrast,severalrespondentsnotedthatsupportfromNGOsmadeiteasierforchildrentoattendschoolbycoveringthecostsofuniformsandeducationalmaterials:
Previously there was Save the Children, which supports children. There is also another organisation, Godanaw. Godanaw is very good as it gives support for uniforms. If you get your children uniforms and show them the receipt, they refund the money. One time I was also supported to buy educational materials for one of my children (Kirkosmother,2005).
Citizenship(definedaswhetherornotthecaregiverhasworkedwithothersinthecommunitytoaddressacommonissue)reducedchildworkandschoolingrelativetoschoolingonly.Thesamepatternemergedforworkonlyandminimalworkalthoughthecoefficientswerestatisticallyinsignificant.
16 SeeAppendixA3forthedefinitionofthefourindicatorsofsocialcapital.

Child labour, gender inequality and rural/urban disparities
37
6.4.3 CommunitycharacteristicsTheavailabilityofschoolsinnearbyareashasbeenidentifiedintheliteratureasanimportantdeterminantofchildschoolingandlabourdecisions.Weincludedthemeandistancetopublicandprivateprimaryschoolsinourmodel.Theresultsindicatedthatdistancetoschoolhadapositiveandsignificantimpactontheprobabilityofachildcombiningschoolingwithworkandengagedinworkonlyrelativetoschoolingonly.Thatis,asdistanceincreased,childrenweremorelikelytobeinvolvedinworkonlyand/orcombininglabouractivitiesandschoolrelativetoschoolonly.However,ithasnoimpactonminimalwork.
Thequalitativefindingsalsoindicatedthatgreaterproximitytoschoolincreasedthelikelihoodofchildschooling(atleastrelativetoworkonly).Forexample,aparentfromBilbalaadmittedthathewaspersuadedtosendhischildtoschoolbecauseofthecombinationofanearbyschoolandtheexampleofhispeerswhowereinvestingintheirchildren’seducation:
He could learn as there is school nearby and everyone is going. I saw my friends sending their children to school and I followed suit (2005).
Similarly,ateachernotedthatsomeover-agechildrenwerestartingschoolingdueinparttogreateraccess:
Children should officially start formal schooling at the age of 7. However, there are now 16-year old children starting school with 7-year old kids. Parents’ attitudes and school distance largely account for this change(Bilbala,2005).
Oneimportantadvantageofcloserschoolsislinkedtocostsavings.Notonlydidparentshavetospendlessontransportation,theydidnothavetocoverthecostsofaccommodationandfoodforchildrenwholivedoutsidethefamilyhomeduringtheweekinordertoattendschool.Inaddition,thepositiveassociationbetweenchildschoolingandschoolavailabilitywasparticularlystronginthecaseofgirls,asparentshadpreviouslybeenreluctanttosendtheirdaughterstodistantschoolsmade(particularlyinruralareas)becauseofsafetyconcerns.AstheheadoftheWomen’sAssociationinSemha/Aratonoted:
It is hard to send girls very far for further education because we are scared of rape…if we cannot find any one to go with them; they won’t go to school (2005).
Thissuggeststhatschoolaccessisnotonlyimportantintermsofreducingthetransportcoststohouseholds,butalsointermsofalleviatingparentalfearsabouttheirdaughters’safetyandapotentiallossoffamilyhonour.

Child labour, gender inequality and rural/urban disparities
38
7. summary and policy implicationsUsingasampleof3115childrenbetween7and17yearsofage,amultinomiallogitmodelofchildschoolingandlabourwasdevelopedtoassessthefactorsassociatedwithchildschoolingandlabourforruralandurbanEthiopiainselectedregions.Themodelwasalsorunforrural,urban,female-headedandmale-headedhouseholds,aswellasformaleandfemalechildrenseparately.Wecomparedtheeffectofchild-,family-andcommunity-levelcharacteristicsonchild“schoolingandwork”combined,child“workonly”and“minimalwork”relativeto“schoolingonly”.Wefoundthatachild’ssexandage,familycomposition,maternaleducation,householdwealthandassetlevels,accesstocredit,exposuretoadverseshocks,andcaregivers’socialcapital,areimportantinexplainingchildren’stimeuse.Thesequantitativefindingswerecomplementedbyqualitativeresearch.Inadditiontoprovidingamorenuancedunderstandingofthequantitativeresults,thequalitativefindingsalsounderscoredtheimportanceofaccessibilityofschoolsandparentalattitudestowardschildeducationandwork.
Overall,thepaperemphasisestheneedforpolicy-makersanddonorstogivedueconsiderationtoout-of-schoolvariables,particularlyfactorsthatshapechildren’sinvolvementinworkactivities,whendevelopingpolicystrategiestoachieveuniversalandrelevanteducationforallchildren.InordertomeettheMDGtargetofuniversaleducationforallby2015,thereisanurgentneedtofocusnotonlyoneducationsectorpoliciesbutalsotointroduceachild-sensitiveperspectivetobroaderpovertyreductionstrategies.Theextenttowhichdevelopmentapproachesrelyonthelargelyinvisiblelabourofwomenandchildrenandthepotentiallynegativespill-overimpactsonchildschoolingandgeneralwellbeingmustbeconfronted.
Inthisregard,ourfindingsunderscoretheimportanceofintroducingachild-sensitiveperspectivetonationaldevelopmentstrategiestoensurethatconsiderationsofchildren’srighttoeducationarenotlimitedtoeducationpoliciesonly.Rather,thereisanurgentneedtoconsidertheextenttowhichpovertyreductionapproachesareactuallyleadingtoanincreaseinchildlabourand/orcaregivers’labourwhichmayinturnhaveanegativeimpactonchildeducationandgeneralwellbeing.AscanbeseenfromTable7.1below,considerationsofchildlabourwerenotexplicitlymentionedinthefirstEthiopianSustainableDevelopmentPovertyReductionProgram(2002-5).Inordertoaddressthislacuna,thediscussionbelowattemptstolinkthequantitativeandqualitativeresearchfindingstopolicyimplicationsforEthiopia’ssecondphaseofthePovertyReductionStrategyProgramme(2006-10).Theseinclude:
acontinuedandstrengthenedpolicyfocusonfemaleeducation;
modernisingdomesticandfarmtechnologiestoreducelabourintensity;
rationalisinglivestockraisingpatterns;
introducingcashtransfersandcreditprovisionstopoorfamiliestooffsetschoolcostsespeciallyforolderandruralchildren,andcushiontheadverseimpactofhouseholdshocks;
improvingwomen’sproductiveworkopportunitieswhilesimultaneouslyensuringthattheircareworkburdenisreduced;
•
•
•
•
•

Child labour, gender inequality and rural/urban disparities
39
improvingcommunityinfrastructure,especiallyenergyandwatersourcesandaffordabletransportation;
reducingvulnerabilitytoshockssuchasdroughtthroughinvestinginirrigationschemes.
Table7.1:ContentanalysisoffrequencyandcontextinwhichchildrenandtheirfamiliesarementionedintheEthiopianSDPRP
Category/ term Frequency Child(ren) (vulnerable social group; food poverty: wasting/ stunting/ malnutrition; education; dependency ratio; family health services)
59
Infants – (mortality and morbidity) 9Out-of-school children/ street children/ orphans 17Child participation 0Sexual exploitation/ sex trafficking 0Child labour / work 0Childcare 1Child-headed household 0Violence (against women impacting on children) 2UNCRC 0Girls (education, fetching water, harmful traditional practices) 24Boys 12Daughters (education) 3Youth/ young people/ adolescents 25HIV/AIDS education and prevention for out-of-school youth and street adolescents 2Other family membersFamily 23Parents 3Family planning 4Fathers 0Mothers/ maternal (importance in terms of education; childcare; literacy and new knowledge) 14Women 88Male/female head (-ed households) 22Gender 65
Source:MOFED(2002),EthiopianSDPRP(2002-2005).
Childcharacteristics
Gender: Whilethequantitativefindingsfoundthatboysweremarginallymorelikelythangirlstohavetocombineschoolandworkthanstudyfull-time,ourqualitativefindingsrevealedthatalthoughthereweredifferencesinthetypeandspatialdistributionofworkactivitiesundertaken,workpressureswereawidespreadrealityforboysandgirlsalike.Moreover,thetaskscommonlyassignedtogirlswereoftenashazardousand/ortime-consumingasthoseforwhichboysaretraditionallyresponsible.Inthisregard,itisimportantthatpolicypractitionersadopt a broad definition of child labourandfocusnotonlyonaddressingparticularly“harmfulordisabling”formsoflabour,butalsolabouractivitieswhichcompromisechildren’sabilitytoattendschool,dohomeworkandplay.
Age:Giventhatolderchildrenaremorelikelytofacepressurestobeinvolvedinlabouractivitiesandsimultaneouslyneedtocopewithgreaterscholasticdemands,itisimperativethatincentives are
•
•

Child labour, gender inequality and rural/urban disparities
40
provided to families to continue children’s education and minimise their labour demands.Inthisregard,cash transfers to promote child schooling in higher gradesratherthanfood-for-workprogrammes,whichtypicallyinvolvechildrenaswellasparents,wouldbeonepossiblesolution.Developingemployment training programmes for secondary school studentsthatwouldenhancefuturejobandincomeprospectswouldalsoprovideanincentivetohouseholdstocontinuetoinvestintheirchildren’seducation.Similarly,theaffirmative action programmes for girlswhocompletegrade8tohavepreferentialaccesstoemploymentopportunitiesinlocalgovernmentofficesinsomeYLsites,constitutesagoodpracticethatshouldbescaledup.
Inaddition,giventhatformanyimpoverishedfamilies,children’sinvolvementinlabouractivitieswillremainarealityinatleasttheshorttomediumterm,itisimportantthatchild labour guidelinesaredevelopedtoraiseawarenessaboutthepotentiallynegativeeffectsonchildwellbeing.Theseincludeexcessiveworkinghours,dangerousconditionsandpoorpaymentforthedifferenttypesofworkinwhichchildrenarecommonlyinvolved.Ratherthanoutliningtheconditionsunderwhichchildworkis“acceptable”,thefocusoftheseguidelinesshouldbeongraduallyphasingoutchildwork.Moreover,greatcareneedstobetakenthattheguidelinesdonotindirectlyresultinemployersnolongerofferingemploymenttochildrenandyoungpeoplesothattheyarecompelledtoenterlessregulatedandmoreexploitativeformsofwork.Instead,anotherfocusofsuchaninitiativeshouldbeonraisinglocalauthorities’awarenessofproblemsoftenassociatedwithchildwork(inadequatetimeforstudy,inadequateprotectionfromabuseandinjury,stigmatisation,etc.).Theseguidelineswouldneedtobedisseminatedtolocalauthorities,communities,householdsandchildren,andinthecaseofnon-compliance,mechanismsshouldbeestablishedwherebychildrenandsympatheticadultscouldreportconcerns.
Urban/ruraldivideSchoolattendancewassignificantlylowerinruralcomparedtourbanYoungLivessites,anddropoutratesweredramaticallyhigherinruralareas.Thisindicatesthatchildeducationandlabourhavedifferentcharacteristicsinruralandurbanareas,suggestingtheneedfordifferentialpolicystrategies.Partofthesolutionclearlynecessitatesimproving school availability in rural areas.Bothourquantitativeandqualitativefindingssuggestthatdistancefrompublicorprivateschoolsnegativelyaffectedschoolattendance.Ourqualitativeresultsfurtherfoundthatdistancetoschoolwasanimportantfactorinparentaldecisionstosendtheirdaughterstoschool.Stepsshouldalsobetakentodevelopmoreflexible school timetables and curriculatoallowruralchildrentobeabsentduringpeaktimesintheagriculturecyclewhichiswhenmanychildren,especiallyboys,dropouteithertemporallyorpermanently.
MaternaleducationBothourquantitativeandqualitativefindingsfoundthatmaternaleducationlevelssignificantlydecreasedthelikelihoodofachildcombiningworkandschooling,whilepaternaleducationreducedthelikelihoodthatachildwouldbeengagedinworkratherthanschool.Theeffectofmaternaleducationheldtrueforchildreninmale-headedhouseholds,implyingnotonlythatchildrenofeducatedmothersaremorelikelytoattendschool,butthatmaternaleducationhasamorepronouncedpositiveeffectonchildschoolingwhenwomencandecidefreelywithoutmaleintervention.Thissuggeststhatwomen’sempowermenthasasignificantpositiverelationshipwithhumancapitaldevelopment.Educatinggirlstodaymeansmoreeducatedmothersanddaughterstomorrow.Inthis

Child labour, gender inequality and rural/urban disparities
4�
regard,theEthiopianEducationSectorDevelopmentPlan(2002-5)hashadavisibleimpactonpromotinggirls’educationandsucheffortsshouldbecontinuedandstrengthened.However,giventhestronglinksbetweenfemaleadulteducationandcommitmenttochildschooling,investment in adult literacy programmesisalsolikelytohaveafar-reachingimpactandcreateavirtuouscircleofmoreeducatedmothersandgirlsovertime.
Familycomposition
Ourresultsshowthatchildrenweremorelikelytobeattendingschoolonlywhentherewasadequatelabourinthehousehold:morechildrenaged7-17yearsaswellasmoremaleadultsgenerallydecreasedchildren’sworkburden.Inotherwords,boththebirthordereffectandthelaboursubstitutionhypothesiswereconfirmed.Thisindicatesthatformanyruralhouseholdsengagedinlabour-intensiveagriculturalandpettytradingactivities,childrenareoftenneededtofilllabourgaps.Thishasaparticularlysignificantimpactondropoutratesinmale-headedhouseholdsandonchildenrolmentinfemale-headedhouseholdswherechildren(especiallyboyswhoneedtocompensateforthelackofadultmaleagriculturallabourpower)arelesslikelytoattendschoolthaninmale-headedhouseholds.Bypromotinglabour-intensiveincome-generatingactivities,thecorepillarofEthiopia’sPRSP—AgriculturalDevelopmentLedIndustrialization(ADLI)—isreinforcingthetraditionalpatternofrelianceonalargenumberofoffspring.Moreover,giventhatyoungchildrenoffourorfiveyearsarealreadyengagedineconomicactivities,itwouldseemthatADLI’sassumptionaboutasurplusoflabourmaynotberealisticinallareasandthatthereisinfactinadequateadultlabourtomeethouseholddemands.Asdiscussedfurtherbelow,ifsufficientprecautionarysocialriskmanagementmeasuresarenottaken,thepresentpolicyofreducingpovertybyintensifyingagricultureanddiversificationthroughlabour-usetechnologieswillactuallyincreasechildlabour.
Wealth/assets/credit
Aninverted-Urelationshipbetweenwealthandchildworkwasfoundimplyingthatonlyathighlevelsofwealthischildlabourreducedinruralareas.However,increasedlandownershipledtogreaterdemandforchildlabourandhencereducedschoolenrolment,indicatingthatthelabourdemandeffectdominatedthewealtheffect.Similarly,ownershipoflivestockledtoanincreaseinchildlabourparticularlyinruralareasaschildrenwereneededtoherdtheanimals.Additionally,althoughaccesstocreditwasgenerallypositivelycorrelatedwithchildenrolment,ourqualitativefindingsfoundthatcreditwasoftenlinkedtothepurchaseofadditionallivestock,therebyexacerbatingchildlabourdemands.Thissuggeststhatpovertyreductionpremisedonlabour-intensiveagricultureismorelikelytoincreasechildlabourifconditionsinthelabourandcreditmarketsarenotimproved.However,thenegativeincomeeffectsofreducingchildlabourandincreasingchildschoolingcouldbeoffsetifcredit measures to facilitate labour transactions(hiringlabour)weretaken.Morespecifically,significantprogresstowardsachievingtheMDGgoalofuniversaleducationforallcouldberealisediflong-term credit programmes targeted specifically at covering educational expenseswereintroduced.Inaddition,creditforlabour(aspartofworkingcapital)ratherthanstart-upcapital(e.g.livestockormachinery),wouldenablethepoortosubstitutehiredlabourforchildlabour.ItwillbeimportantthatthesetypesofconsiderationsareexplicitlyintegratedintheimplementationguidelinesfortheHousehold-levelFoodSecurityProgrammerecentlyintroducedinTigrayandAmhara.

Child labour, gender inequality and rural/urban disparities
42
Livelihooddiversification
Whilethereismuchtobesaidforpromotinglivelihooddiversificationinordertocushiontheimpactofeconomicshocksonthehouseholdandincreaseincome-generatingopportunities,theinvolvementofhouseholdsinmorediversifiedactivitiesincreasesthedemandforlabourwhichisfrequentlymetbyinvolvingchildren,particularlyboys,inwork.Inordertoaddressthisnegativespill-overeffect,labour-savingpolicyimprovementsshouldfocusonmodernising farming and household technologies.Thiscouldinclude,forexample,initiativestoimproveaccesstowater,increaseduseofherbicidestoreducedemandforweedinglabour,introducingmodernstovesthatsaveenergyandreducetheneedfortime-consumingfuel-woodcollection,andtheintroductionofsimplefarmtechnologysuchasbetterploughs.Equallyimportantly,livestock-raisingpatternsneedtoberationalisedinordertoreducethedemandforchildinvolvement.Optionsincludeintroducingindoorlivestockfarming,community-sharedlivestockherdingwherehouseholdspoolresourcestoeithercareforlivestockonarotationalbasisorpayforhiredadultlabourtotakecareofanimals,aswellascommunity-ratherthanhousehold-levelfodderproduction.
Caregivers’workburdenandsocialcapitallevels
Caregivers’productiveandcareworkburdenalsohasseriousimplicationsforchildren’sinvolvementinschoolandwork.Asmothers’workburdenincreases,girlsarecommonlyusedtohelpwiththeirmothers’responsibilities,indicatingthatincreasedinvolvementofwomeninproductiveworkactivitiesismoredetrimentaltogirls’thanboys’useoftime.Whilewomen’saccesstoindependentincomemaybepositiveinthattheyaremorelikelythanfatherstoinvesttheiradditionalincomeintheirchildren’seducationandgeneralwellbeing,girls’timeisneededtohelpshoulderdomesticresponsibilities.Accordingly,akeypolicyconcernshouldbetointroducenewtechnologiesthatreducewomen’sdomesticburdeninordertointurnreducegirls’substitutioninsuchworkandfacilitatetheireducation.Moreover,ifitisimperativeforhouseholdsurvivalandcommunitydevelopmentthatalladults(maleandfemale)areinvolvedinincome-generatingschemes,itwillbeimportantforthegovernmenttoconsidersubsidisedcommunitychildcarearrangementsorpreschoolservicestorelieveolderchildrenofsubstitutingfortheirmothers’carework.Inaddition,particularlyinthecaseoffemale-headedhouseholds,theintroductionofsafetynetsshouldbeconsideredsothatwomenwillnotbecompelledtorelyontheirsonstosubstituteforthelabourofanadultmalepartner.
YoungLivesfindingsdo,however,indicatethatcaregivers’socialcapitallevelsmaymitigatetheseimpactstosomeextent.Thatis,acaregiver’scognitivesocialcapitalreduceschildworkandincreaseschildschooling,andactivecitizenshipincreasesschoolingrelativetocombinedchildworkandschooling.Thissuggeststhatrecentgovernmentaleffortstomobilisecommunitiestotacklelowschoolenrolmentanddropoutratesmaybehavingapositiveinfluenceoncommunityattitudestowardseducation.Ifthisisthecase,itshouldbecontinued,aslongasrelatedpressurestocontributefinanciallyorin-kindtoschoolexpansionarenotoverlyburdensome.
Infrastructuraldevelopment
Ourqualitativeresearchfoundthatchildrenwerecommonlyinvolvedinfetchingwater,firewoodanddungbothforhouseholduseandsaletosupplementfamilyincome.Becauseofthedangersinvolvedinchildrenwalkinggreatdistancesunaccompanied(potentialexposuretoviolenceandsexualabuse,

Child labour, gender inequality and rural/urban disparities
43
wildanimalattacks,etc.),itisimportantforthegovernmenttofocusresourcesonthe development of fuel-saving mechanismsand/orthedevelopment of alternative energy sources.Thiswouldnotonlyalleviatepressuresonchildrenbutwouldalsobeinthebestinterestsofenvironmentalprotection,particularlyasthecountryisfacingrapidandwidespreaddeforestationandsoilerosion.Similarly,children’sinvolvementinfuel-woodanddungcollectiontoearnmoneytosupplementtheireducationcostscouldbeminimizedbyproviding families with credit for educationpurposes,aswellasdeveloping safer, alternative income-generating means for childreninimpoverishedfamilieswhohavenochoicebuttorelyonchildlabour.
Otherinfrastructuralimprovementsthatwouldsignificantlyreduceworkburdensonchildrenwouldbereducingthedistancetowatersourcesbyconstructing wells and piped water sourcesinallvillagesanddeveloping better public transport systemstoreducechildren’sinvolvementinpreparingandtakingpackanimalstothemarket.Whilerapidroadconstructionisbeingcarriedout,poorcommunitiesareunabletotakefulladvantageofthisdevelopmentasaffordable transportisstillscarce.Bettertransportwouldalsoreducetheamountoftimecaregiversinvolvedinpettytradewouldneedtobeabsentfromhome.

Child labour, gender inequality and rural/urban disparities
44
referencesAlderman,H.andKing,E.(1998)‘Genderdifferencesinparentalinvestmentineducation’,Structural Changes and Economic Dynamics,Vol.9,pp.453-468.
Andvig,J.(2001)‘ChildLabourinAfrica’,Social Protection Unit Discussion Paper,WashingtonD.C.:WorldBank.
Appleton,S.(1991)Socio-economic Determinants of Education, Health and Fertility in Africa, D.PhilThesis(Unpublished),Oxford.
Basu,K.andVan,P.H.(1999)‘TheEconomicsofchildlabour:Reply’,American Economic Review, 89,p.5.
Basu,K.andVan,P.H.(1998)‘Theeconomicsofchildlabour’,American Economic Review,88(3),pp.412-27.
Becker,G.S.(1965).TheTheoryofAllocationofTime.Economic Journal75:493-517.
Becker,Gary(1981).ATreatizeontheFamily.Cambridge:HarvardUniversityPress.
Belsley,D.,Kuh,E.andWelsh,R.(1980)Regression Diagnostics,NewYork:JohnWileyandSons.
Bhalotra,S.andHeady,C.(2003)‘Childfarmlabour:Thewealthparadox’,The World Bank Economic Review,17,pp.197-227.
Birdsall,N.(1991)‘BirthOrderEffectsandTimeAllocations,inT.P.Schultz(ed),Research in Population Economics. A Research Annual,Vol.7,Greenwich,CNandLondon:JAIPress.
Bonnet,M.(1993)‘ChildLabourinAfrica’,International Labour Review,132,pp.371-89.
Bredie,J.W.B.andBeeharry,G.K.(1998)‘SchoolEnrolmentDeclineinSub-SaharanAfrica:beyondthesupplyconstraint’,World Bank Discussion PaperNo.395,WashingtonD.C.:TheWorldBank.
Burney,N.A.(1995)‘Determinantsofchildschoolenrolment:evidencefromLDCsusingchoice-theoreticapproach’,International Journal of Social Economics,Vol.22,No.,pp.24-40.
Bustillo,I.(1989)‘FemaleEducationAttainmentinLatinAmerica:ASurvey’,PHREE Background Paper Series,DocumentNo.PHREE/89/16,WashingtonD.C.:TheWorldBank.
Canagarajah,S.andCoulombe,H.(1998)‘ChildLabourandSchoolinginGhana’,World Bank Policy Research Working PaperNo.1844,WashingtonD.C.:WorldBank.
Canagarajah,S.andNielsen,H.S.(1999)‘ChildLabourandSchoolinginAfrica:AComparativeStudy’,SP Discussion PaperNo.9916,WashingtonD.C.:TheWorldBank.
Cigno,A.andRosati,F.(2000)‘WhyDoIndianChildrenWork,andisitbadforthem?’Discussion PaperNo.115,Bonn:IZA.
Cockburn,J.(2001)Child Labour Versus Education: Poverty constraint or income opportunity? CentrefortheStudyforAfricanEconomies(CSAE),Oxford:OxfordUniversity.
Colclough,C.(1996)‘Educationandthemarket:whichpartsoftheneoliberalsolutionarecorrect?’World Development,Vol24,No4.

Child labour, gender inequality and rural/urban disparities
45
Coulombe,H.(1998)Child Labour and Education in Côte d’Ivoire,Backgroundpaper,WashingtonD.C.:WorldBank.
CSA(2002)‘EthiopiaChildLabourSurvey’,Statistical Bulletin262.
Elson,D.(1996)“’Gender-Neutral,Gender-Blind,orGender-SensitiveBudgets’:ChangingtheConceptualFrameworktoIncludeWomen’sEmpowermentandtheEconomyofCare”,PaperpresentedtotheCommonwealthMinistersResponsibleforWomen’sAffairs,FifthMeeting,PortofSpain,Trinidad,25-28November.
Glewwe,P.,Jacoby,H.G.andKing,E.M.(1999)‘Earlychildhoodnutritionandacademicachievement:alongitudinalanalysis’,FCND Discussion PapersNo.68,FoodConsumptionandNutritionDivision,Washington,D.C.:IFPRI.
Grootaert,C.(1998)‘ChildlabourinCôted’Ivoire’,World Bank Policy Working PaperNo1905.
Handa,S.(1999)‘RaisingprimaryschoolenrolmentinDevelopingCountries:TheRelativeImportanceofsupplyanddemand’,FCND Discussion PaperNo.76,FoodConsumptionandNutritionDivision,Washington,D.C.:IFPRI.
Hazarika,G.andBedi,A.S.(2003)‘SchoolingCostsandChildWorkinRuralPakistan’,Journal of Development Studies,Vol.39,pp.29-64.
Heidel,K.(2004)Poverty Reduction Strategy Papers - blind to the rights of the (working) child? The (I-)PRSP perception of child labour - A problem outline and annotated collection of source material,KindernothilfeandWerkstattOkonomie.
Hermalin,A.I.,Seltzer,J.A.andLin,C.H.(1982)‘Transitionsintheeffectoffamilysizeonfemaleeducationattainment:thecaseofTaiwan’,Comparative Education Review 26(2):pp.254-70..
Jacoby,HandE.Skoufias(1997)‘Risk,FinancialMarkets,andHumanCapitalinaDevelopingCountry’The Review of Economic Studies64(3):311-335
Jafarey,S.andLahiri,S.(2002)‘Willtradesanctionsreducechildlabour?Theroleofcreditmarkets’,Journal of Development Economics,Vol.68,pp.137-56.
Kattan,B.R.andBurnett,N.(2004)User Fees In Primary Education,EducationSectorHumanDevelopmentNetwork,Washington,D.C.:TheWorldBank.
Lavy,V.(1996)‘SchoolSupplyConstraintsandChildren’sEducationalOutcomesinRuralGhana’,Journal of Development Economics,Vol.51,pp.291-314.
Levison,D.(1991)‘Children’sLaborForceActivityandSchoolinginBrazil’,Ph.Ddissertation,UniversityofMichigan
Marcus,R.,Wilkinson,J.andMarshall,J.(2002)‘PovertyReductionStrategyPapers(PRSPs)–WhatCanTheyDeliverForChildrenInPoverty?’Journal of International Development14(8),1117-1128.
Mendez,E.G.andDuro,E.(2002)‘LatinAmerica:Apendingdeptforsocialpolicies’inB.Grimsrud(ed.),The next steps: Experiences and analysis of how to eradicate child labour,Oslo:Fafo.
Minujin,A.andDelamonica,E.(2005)Children Living in Poverty. A review of child poverty definitions, measurements, and policies,DivisionofPolicy&Planning,NewYork:UNICEF.

Child labour, gender inequality and rural/urban disparities
46
Moock,P.andLeslie,J.(1985)‘ChildhoodMalnutritionandSchoolingintheTeraiRegionofNepal’,Discussion Paper Education and Training Series ReportNo.EDT17,pp.1-40,Washington,D.C.:WorldBank.
Nielsen,H.(1998)‘ChildLaborandSchoolAttendance:TwoJointDecisions’.University of Aarhus CLS Working Paper Series,No.98-015.
Oxaal,Z.(1997),‘EducationandPoverty:AGenderAnalysis’,BRIDGE development-gender ReportNo.53,Brighton:InstituteofDevelopmentStudies,UniversityofSussex,UK.
OXFAM(1999)Access to Basic Education and Health in Mozambique,Oxfam-GB,Maputo,Mozambique.
Pörtner,C.(2001)‘Children’sTimeAllocationintheLagunaProvince,thePhilippines’TheWorldBank.
Ranjan,P.(1999)‘Aneconomicanalysisofchildlabour’,Economics Letters,64,pp.99-105.
Ranjan,P.(2001)‘Creditconstraintsandthephenomenonofchildlabour’,Journal of Development Economics64,pp.81-102.
Ravallion,M.andWodon,Q.(2000)‘DoesChildLabourDisplaceSchooling?EvidenceonBehaviouralResponsestoanEnrolmentSubsidy’,The Economic Journal,Vol.110,pp.158-175.
Ray,R.(2003)‘TheDeterminantsofChildLabourandChildSchoolinginGhana’,Journal of African Economies,Vol.11,No.4,pp.561-90.
Rosati,F.andRossi,M.(2003)‘Children’sworkingHoursandSchoolEnrolment:EvidencefromPakistanandNicaragua’,The World Bank Economic Review,Vol.17,No.2,pp.283-95.
Schultz,T.P.(2001)‘Schoolsubsidiesforthepoor;EvaluatingtheMexicanProgresapovertyprogram’,Centre Discussion paperno834,EconomicGrowthCentre,YaleUniversity.
Smith,HandP.Cheung(1982)‘Socialoriginsandsex-differentiatedschoolinginthePhilippines’,inKellyG.andC.Elliot(eds.)Women’s Education in the Third World: Comparative Perspectives,Albany:StateUniversityofNewYorkPress.
Tilak,J.B.G.(1989)‘FemaleSchoolinginEastAsia:AReviewofGrowth,ProblemsandPossibleDeterminants’,PHREE Background Paper Series,DocumentNo.PHREE/89/13,WashingtonD.C.:WorldBank.
Walters,P.B.andBriggs,C.M.(1993)‘FamilyEconomy,ChildLabour,andSchooling:EvidencefromearlyTwentieth-CenturySouth’,American Sociological Review,Vol.58,No.2,pp.163-181.
WorldBank(2004)Books, Buildings, and Learning Outcomes: An Impact Evaluation of World Bank Support to Basic Education in Ghana,ReportNo.28779,WashingtonD.C.:WorldBank.

Child labour, gender inequality and rural/urban disparities
47
appendix a1: description of variables used
in the regression
TableA1.1VariablesusedtoanalysedeterminantsofchildlabourinEthiopia
Variable name Definition
Main activity of a child (dependent variables) 0 if schooling only; 1 if both schooling and working; 2 if working only; and 3 if the child is engaged in minimal work
Age of child Age in years
Dummy for male child 1 if male; 0 otherwise
Dummy for male-headed HH 1 if female; 0 otherwise
Mother’s years of schooling Education level of the mother (in years)
Father’s years of schooling Education level of the father (in years)
Number of male children <7 Number of male children under 7 years old
Number of female children <7 Number of female children under 7 years old
Number of male children >17 Number of male children over 17 years old
Number of female children >17 Number of female children over 17 years old
Number of younger children Number of younger children aged between 7 and 17
Number of elder children Number of elder children aged between 7 and 17
Dummy for urban residence Dummy for urban (1 if urban; 0 if rural)
Dummy for Amhara region Dummy for Amhara
Dummy for Oromiya region Dummy for Oromiya
Dummy for SNNP region Dummy for SNNP
Dummy for Tigray region Dummy for Tigray
Wealth index Wealth index constructed from consumer durables
Wealth index squared Wealth index squared
Land size in hectares Hectares of land owned
Mean distance (km) to public and private primary school Mean distance from public or private school
Total livestock Total number of livestock owned
Number of events Number of events that decrease the household welfare
Cognitive social capital Cognitive social capital
Absolute structural social capital Absolute structural social capital
Social support Number of organisations providing social support
Social capital: citizenship Dummy for citizenship
Dummy for the HH head being divorced Dummy for marital status of the household head/respondent: 1 if divorced; 0 otherwise
Child relationship Dummy for the relationship to the index child (1 if brother/sister; 0 otherwise)
Any serious debt Dummy for any serious debt: 1 if yes; 0 otherwise

Child labour, gender inequality and rural/urban disparities
48
TableA1.2.Summarystatisticsofvariablesincludedintheregression
Variables Observation Mean Std. Dev. Minimum Maximum
Age of child 2845 11.116 3.107 7.00 17.00
Dummy for male child 2845 0.479 0.500 0.00 1.00
Dummy for male-headed HH 2845 0.815 0.388 0.00 1.00
Mother’s years of schooling 2845 1.865 3.286 0.00 16.00
Father’s years of schooling 2845 2.431 3.879 0.00 18.00
Number of male children <7 2845 0.503 0.626 0.00 3.00
Number of female children <7 2845 0.457 0.626 0.00 3.00
Number of male children >17 2845 1.229 0.762 0.00 6.00
Number of female children >17 2845 1.322 0.706 0.00 6.00
Number of elder children 2845 0.916 1.098 0.00 7.00
Number of younger children 2845 0.941 1.105 0.00 7.00
Dummy for urban residence 2845 0.377 0.485 0.00 1.00
Dummy for Amhara region 2845 0.206 0.404 0.00 1.00
Dummy for Oromiya region 2845 0.178 0.382 0.00 1.00
Dummy for SNNP region 2845 0.268 0.443 0.00 1.00
Dummy for Tigray region 2845 0.222 0.415 0.00 1.00
Wealth index 2845 0.169 0.166 0.00 0.75
Wealth index squared 2845 0.056 0.090 0.00 0.56
Land size in hectares 2845 0.739 0.887 0.00 10.00
Mean distance (km) to public and private primary school
2845 2.755 2.972 0.50 9.17
Total livestock 2845 1.546 1.305 0.00 4.00
Number of events 2845 2.206 1.896 0.00 11.00
Cognitive social capital 2845 3.460 0.826 0.00 4.00
Absolute structural social capital 2845 1.464 1.146 0.00 7.00
Social support 2845 2.373 2.486 0.00 12.00
Social capital: citizenship 2845 0.688 0.823 0.00 2.00
Dummy for the HH head being divorced 2845 0.050 0.217 0.00 1.00
Child relationship 2845 0.005 0.072 0.00 1.00
Any serious debt 2845 0.379 0.485 0.00 1.00

Child labour, gender inequality and rural/urban disparities
49
appendix a2: detailed regression results
TableA2.1:Determinantsofchildschoolingandlabour(Femalechildren)
Variables Schooling & working Working only Minimal work
Age of a child 0.180*** 0.396*** 0.042
(3.57) (6.54) (1.19)
Dummy for male-headed HH -0.285 -0.223 0.060
(0.84) (0.56) (0.27)
Mother’s years of schooling -0.041 0.079 0.049
(0.79) (1.30) (1.59)
Father’s years of schooling 0.009 -0.177** -0.004
(0.18) (2.11) (0.15)
Number of male children under 7 years old 0.083 -0.122 0.025
(0.42) (0.50) (0.22)
Number of female children under 7 years old 0.337 -0.056 -0.098
(1.49) (0.25) (0.81)
Number of male HH members >17 years old -0.576*** -0.197 -0.117
(2.62) (0.83) (1.24)
Number of female HH members >17 years old -0.021 -0.684** -0.278**
(0.11) (2.04) (2.22)
Number of elder children between 7 & 17 -0.407** -0.114 0.231***
(2.46) (0.59) (3.48)
Number of younger children between 7 & 17 -0.104 -0.350** -0.377***
(0.75) (2.41) (3.53)
Dummy for urban residence -0.304 -0.473 -0.524**
(0.70) (0.81) (2.06)
Dummy for Amhara region 1.873*** -0.699 -0.912**
(2.59) (0.81) (2.53)
Dummy for Oromia region 0.405 -0.855 -0.143
(0.52) (1.01) (0.47)
Dummy for SNNP region 0.327 -0.933 0.167
(0.40) (0.99) (0.65)
Dummy for Tigray region -1.173 -2.093** -0.018
(1.51) (2.44) (0.05)

Child labour, gender inequality and rural/urban disparities
50
Variables Schooling & working Working only Minimal work
Wealth index constructed from consumer’s durables 0.665 -8.506** -7.802***
(0.24) (2.50) (5.01)
Wealth index squared -4.249 7.063 7.891***
(0.90) (1.07) (3.43)
Hectares of land owned 0.540** 0.418** 0.033
(2.44) (2.10) (0.25)
Mean distance (km) to public and private primary schools 0.119** 0.288*** -0.085**
(2.23) (4.67) (2.09)
Total number of livestock owned 0.182 0.254** 0.034
(1.60) (2.24) (0.53)
Number of events that decrease the HH welfare 0.085 0.140* -0.026
(1.41) (1.96) (0.66)
Cognitive social capital 0.129 0.212 0.187**
(0.85) (1.26) (2.23)
Absolute structural social capital -0.122 -0.414** -0.075
(0.80) (2.09) (1.02)
Number of organisation from which one gets social support 0.078 0.178** 0.023
(1.22) (2.45) (0.57)
social capital: citizenship -0.287* 0.016 -0.056
(1.67) (0.09) (0.62)
Dummy for the HH head being divorced 0.522 0.883* -0.051
(1.11) (1.70) (0.14)
Relationship to the index child (1 if brother/sister; 0 otherwise) -30.196*** 1.042 -30.898***
(38.27) (1.09) (49.20)
Dummy for a HH being in serious debt 0.534** 0.094 0.347**
(2.26) (0.35) (2.38)
Constant -5.111*** -5.842*** 0.117
(4.29) (3.99) (0.19)
Observations 1510 1510 1510
Pseudo R2 0.2707
Robustzstatisticsinparentheses;*significantat10%;**significantat5%;***significantat1%

Child labour, gender inequality and rural/urban disparities
5�
TableA2.2:Determinantsofchildschoolingandlabour(Malechildren)
Variables Schooling & working Working only Minimal work
Age of a child 0.140** 0.086 -0.087
(2.53) (1.42) (1.62)
Dummy for male-headed HH 0.131 0.331 0.458*
(0.41) (0.81) (1.69)
Mother’s years of schooling -0.151** -0.064 -0.007
(2.30) (0.70) (0.17)
Father’s years of schooling 0.003 -0.076 -0.056*
(0.08) (1.29) (1.96)
Number of male children under 7 years old -0.335* -0.215 -0.106
(1.79) (0.97) (0.78)
Number of female children under 7 years old 0.008 0.368 -0.036
(0.05) (1.64) (0.29)
Number of male HH members >17 years old -0.273 0.113 0.063
(1.47) (0.64) (0.52)
Number of female HH members >17 years old 0.263 0.218 -0.049
(1.56) (0.98) (0.37)
Number of elder children between 7 & 17 -0.221* -0.291** 0.156*
(1.68) (2.21) (1.88)
Number of younger children between 7 & 17 0.052 -0.136 -0.186
(0.43) (0.82) (1.15)
Dummy for urban residence -0.978** -1.496*** -0.411
(2.50) (2.87) (1.47)
Dummy for Amhara region 1.611** 0.599 -0.410
(1.98) (0.40) (0.93)
Dummy for Oromia region 0.378 -0.351 -0.655
(0.46) (0.23) (1.51)
Dummy for SNNP region 0.280 -0.760 0.260
(0.31) (0.48) (0.67)
Dummy for Tigray region -1.279 -1.367 0.411
(1.55) (0.90) (0.96)
Wealth index constructed from consumer’s durables 0.225 -6.132* -6.924***
(0.09) (1.84) (3.45)

Child labour, gender inequality and rural/urban disparities
52
Variables Schooling & working Working only Minimal work
Wealth index squared 0.047 5.304 4.379
(0.01) (0.76) (1.17)
Hectares of land owned 0.302** 0.150 0.094
(2.08) (0.89) (0.72)
Mean distance (km) to public and private primary schools 0.161*** 0.211*** -0.028
(3.11) (3.67) (0.65)
Total number of livestock owned 0.137 0.089 0.056
(1.26) (0.66) (0.76)
Number of events that decrease the HH welfare 0.145** 0.115 0.104**
(2.23) (1.58) (2.22)
Cognitive social capital -0.021 -0.072 -0.132
(0.16) (0.46) (1.44)
Absolute structural social capital -0.097 -0.366** -0.099
(0.78) (2.18) (1.30)
Number of organisation from which one gets social support 0.167*** 0.231*** 0.093**
(2.76) (3.38) (2.16)
social capital: citizenship -0.129 -0.009 -0.188*
(0.90) (0.06) (1.74)
Dummy for the HH head being divorced -0.562 0.758 0.022
(0.98) (1.33) (0.05)
Relationship to the index child (1 if brother/sister; 0 otherwise) -32.243*** -30.670*** -0.096
(41.11) (31.08) (0.06)
Dummy for a HH being in serious debt 0.496** 0.903*** 0.114
(2.25) (3.45) (0.70)
Constant -4.650*** -3.316* 1.120
(3.98) (1.76) (1.51)
Observations 1335 1335 1335
Pseudo R2 0.2812
Robustzstatisticsinparentheses;*significantat10%;**significantat5%;***significantat1%

Child labour, gender inequality and rural/urban disparities
53
TableA2.3:Determinantsofchildschoolingandlabour(ruralareas)
Variables Schooling & working Working only Minimal
work
Age of a child 0.103** 0.216*** -0.137***
(2.34) (4.90) (3.63)
Dummy for a male child 0.373** 0.480*** -0.001
(2.05) (2.63) (0.01)
Dummy for male-headed HH -0.099 0.172 0.136
(0.32) (0.50) (0.58)
Mother’s years of schooling -0.163** -0.025 0.065
(2.49) (0.37) (1.48)
Father’s years of schooling 0.013 -0.176*** -0.133***
(0.31) (3.07) (4.17)
Number of male children under 7 years old -0.210 -0.331** -0.085
(1.35) (2.04) (0.76)
Number of female children under 7 years old -0.118 -0.058 -0.148
(0.75) (0.37) (1.34)
Number of male HH members >17 years old -0.528*** -0.267 -0.017
(2.93) (1.52) (0.15)
Number of female HH members >17 years old 0.105 -0.330 -0.094
(0.63) (1.43) (0.68)
Number of elder children between 7 & 17 -0.245** -0.118 0.282***
(2.08) (1.00) (4.21)
Number of younger children between 7 & 17 0.066 -0.316*** -0.195*
(0.61) (2.58) (1.85)
Dummy for Oromia region -1.437*** -0.433 0.518**
(5.48) (1.39) (2.28)
Dummy for SNNP region -3.204*** -1.578*** 0.953***
(5.80) (3.11) (3.67)
Dummy for Tigray region -2.884*** -1.545*** 1.102***
(8.60) (4.51) (4.28)
Wealth index constructed from consumer’s durables 0.671 0.628 -6.053**
(0.18) (0.11) (2.04)
Wealth index squared -16.255 -59.374* -2.531
(1.05) (1.79) (0.22)
Hectares of land owned 0.398*** 0.274** 0.121
(2.98) (2.01) (1.12)

Child labour, gender inequality and rural/urban disparities
54
Variables Schooling & working Working only Minimal
work
Mean distance (km) to public and private primary schools 0.088** 0.208*** -0.083**
(2.31) (4.94) (2.55)
Total number of livestock owned 0.317*** 0.289*** 0.011
(3.55) (3.18) (0.19)
Number of events that decrease the HH welfare 0.013 0.070 0.003
(0.24) (1.33) (0.06)
Cognitive social capital 0.075 -0.007 0.045
(0.63) (0.06) (0.55)
Absolute structural social capital -0.031 -0.291** -0.080
(0.29) (2.35) (1.19)
Number of organisation from which one gets social support 0.154*** 0.213*** 0.066*
(3.02) (4.00) (1.81)
social capital: citizenship -0.038 0.163 -0.014
(0.31) (1.28) (0.16)
Dummy for the HH head being divorced 0.875* 1.357*** 0.116
(1.92) (2.89) (0.29)
Relationship to the index child (1 if brother/sister; 0 otherwise) -45.227 1.166 -2.038
(.) (0.97) (1.34)
Dummy for a HH being in serious debt 0.664*** 0.578*** 0.356***
(3.58) (3.05) (2.58)
Constant -2.511*** -3.913*** 0.955
(3.03) (4.61) (1.63)
Observations 1729 1729 1729
Pseudo R2 0.2606
Robustzstatisticsinparentheses;*significantat10%;**significantat5%;***significantat1%

Child labour, gender inequality and rural/urban disparities
55
TableA2.4:Determinantsofchildschoolingandlabour(urbanareas)
Variables Schooling & working Working only Minimal work
Age of a child 0.307*** 0.544*** 0.153***
(3.84) (3.80) (3.40)
Dummy for a male child 0.235 -0.209 -0.498***
(0.72) (0.37) (2.75)
Dummy for male-headed HH 0.302 -0.356 0.225
(0.77) (0.57) (0.83)
Mother’s years of schooling -0.077 -0.032 -0.019
(1.12) (0.42) (0.65)
Father’s years of schooling -0.068 0.043 0.054**
(1.20) (0.65) (2.17)
Number of male children under 7 years old -0.390 -0.756 0.014
(1.26) (1.21) (0.09)
Number of female children under 7 years old 0.670** 0.729 0.063
(2.35) (1.58) (0.39)
Number of male HH members >17 years old -0.354 0.577** -0.059
(1.10) (2.30) (0.53)
Number of female HH members >17 years old -0.035 -0.164 -0.259*
(0.17) (0.50) (1.84)
Number of elder children between 7 & 17 -0.439** -0.648 0.099
(2.04) (0.94) (0.94)
Number of younger children between 7 & 17 -0.242 0.156 -0.261*
(1.46) (0.70) (1.82)
Dummy for Amhara region 1.414* 0.739 -0.089
(1.80) (0.53) (0.22)
Dummy for Oromia region 0.453 -0.046 -0.294
(0.57) (0.03) (0.88)
Dummy for SNNP region 1.496*** 1.261 0.510**
(2.74) (1.37) (2.26)
Wealth index constructed from consumer’s durables 3.995 6.395 -7.086***
(1.20) (0.59) (3.64)
Wealth index squared -6.351 -22.537 5.572**
(1.26) (1.52) (2.05)

Child labour, gender inequality and rural/urban disparities
56
Variables Schooling & working Working only Minimal work
Hectares of land owned -1.472* 0.644 -0.337
(1.90) (0.42) (1.42)
Mean distance (km) to public and private primary schools
-5.972 -6.473 -0.187*
(.) (.) (1.68)
Total number of livestock owned 0.235 0.177 0.223*
(1.22) (0.41) (1.95)
Number of events that decrease the HH welfare 0.343*** -0.084 -0.044
(3.98) (0.31) (0.74)
Cognitive social capital -0.056 1.438** 0.023
(0.31) (2.53) (0.21)
Absolute structural social capital -0.348 -1.196** -0.117
(1.51) (2.55) (1.13)
Number of organisation from which one gets social support
0.184* 0.435*** -0.002
(1.86) (3.20) (0.03)
social capital: citizenship -0.117 -0.622 -0.275*
(0.45) (1.18) (1.95)
Dummy for the HH head being divorced -1.404 -0.766 0.430
(1.29) (0.63) (0.92)
Relationship to the index child (1 if brother/sister; 0 otherwise)
-30.193*** -29.131*** -31.535***
(28.76) (20.23) (44.84)
Dummy for a HH being in serious debt 0.337 1.041** 0.123
(0.96) (1.99) (0.55)
Constant -4.659*** -13.204*** -1.173
(3.44) (3.12) (1.58)
Observations 1116 1116 1116
Pseudo R2 0.1997
Robustzstatisticsinparentheses;*significantat10%;**significantat5%;***significantat1%

Child labour, gender inequality and rural/urban disparities
57
TableA2.5:Determinantsofchildschoolingandlabour(Female‑headedHH)
Variables Schooling & working
Working only
Minimal work
Age of a child 0.166* 0.350*** 0.032
(1.92) (3.11) (0.46)
Dummy for a male child -0.177 -0.799 -0.490*
(0.50) (1.56) (1.88)
Mother’s years of schooling 0.061 0.104 0.026
(0.71) (1.26) (0.55)
Father’s years of schooling -0.106 -1.569* -0.007
(0.99) (1.84) (0.13)
Number of male children under 7 years old -0.861* -0.049 0.404*
(1.85) (0.13) (1.92)
Number of female children under 7 years old 0.021 1.203** -0.071
(0.05) (2.27) (0.24)
Number of male HH members >17 years old -0.536 0.032 -0.019
(1.58) (0.13) (0.13)
Number of female HH members >17 years old -0.260 0.159 -0.474***
(1.06) (0.62) (2.85)
Number of elder children between 7 & 17 -0.409 -0.388 0.150
(1.64) (1.39) (1.08)
Number of younger children between 7 & 17 -0.000 -0.274 -0.326*
(0.00) (0.97) (1.73)
Dummy for urban residence -0.590 -3.144*** -0.887*
(0.83) (3.42) (1.74)
Dummy for Amhara region 0.447 -0.411 -0.538
(0.50) (0.33) (0.83)
Dummy for Oromia region -0.296 -0.917 -0.670
(0.35) (0.73) (1.06)
Dummy for SNNP region 0.454 -0.578 0.371
(0.52) (0.50) (0.81)
Dummy for Tigray region -3.044*** -3.452*** -0.833
(2.86) (2.94) (1.31)
Wealth index constructed from consumer’s durables -1.204 -8.113 -5.770
(0.24) (0.97) (1.49)

Child labour, gender inequality and rural/urban disparities
58
Variables Schooling & working
Working only
Minimal work
Wealth index squared -4.249 -7.180 6.428
(0.50) (0.50) (1.14)
Hectares of land owned 0.831** 0.252 0.347
(2.25) (0.61) (1.12)
Mean distance (km) to public and private primary schools 0.185 0.002 0.025
(1.55) (0.02) (0.28)
Total number of livestock owned 0.312 -0.077 0.105
(1.49) (0.32) (0.76)
Number of events that decrease the HH welfare 0.178 0.434*** 0.050
(1.47) (2.70) (0.63)
Cognitive social capital 0.067 0.788** -0.105
(0.33) (2.45) (0.65)
Absolute structural social capital -0.249 -1.864*** -0.287*
(0.87) (3.97) (1.74)
Number of organisation from which one gets social support 0.156 0.741*** 0.129
(1.38) (3.73) (1.51)
social capital: citizenship 0.035 -0.116 0.051
(0.12) (0.46) (0.24)
Dummy for the HH head being divorced -0.072 0.333 0.105
(0.13) (0.58) (0.26)
Relationship to the index child (1 if brother/sister; 0 otherwise) -35.006*** 5.550** -1.659
(29.01) (2.24) (1.31)
Dummy for a HH being in serious debt 0.390 0.615 -0.380
(0.94) (1.01) (1.28)
Constant -3.496** -6.534*** 1.003
(2.05) (3.00) (0.84)
Observations 548 548 548
Pseudo R2 0.3360
Robustzstatisticsinparentheses;*significantat10%;**significantat5%;***significantat1%

Child labour, gender inequality and rural/urban disparities
59
TableA2.6:Determinantsofchildschoolingandlabour(male‑headedhouseholds)
Variables Schooling & working Working only Minimal
work
Age of a child 0.190*** 0.248*** 0.004
(4.49) (5.39) (0.12)
Dummy for a male child 0.375** 0.505*** -0.134
(2.19) (2.70) (1.25)
Mother’s years of schooling -0.144*** -0.083 0.039
(2.91) (1.03) (1.30)
Father’s years of schooling 0.014 -0.086* -0.041**
(0.40) (1.89) (2.06)
Number of male children under 7 years old -0.100 -0.274 -0.197**
(0.67) (1.60) (2.09)
Number of female children under 7 years old 0.156 0.004 -0.119
(1.04) (0.02) (1.27)
Number of male HH members >17 years old -0.344** -0.205 -0.114
(2.00) (1.09) (1.23)
Number of female HH members >17 years old 0.172 -0.799** -0.063
(1.13) (2.42) (0.54)
Number of elder children between 7 & 17 -0.305*** -0.241* 0.190***
(2.68) (1.95) (3.43)
Number of younger children between 7 & 17 -0.113 -0.381*** -0.375***
(1.06) (2.89) (3.74)
Dummy for urban residence -0.629* -0.929** -0.388*
(1.94) (1.99) (1.91)
Dummy for Amhara region 2.083*** 0.442 -0.742**
(2.67) (0.30) (2.41)
Dummy for Oromia region 0.809 -0.077 -0.211
(1.00) (0.05) (0.75)
Dummy for SNNP region 0.491 -0.447 0.237
(0.57) (0.30) (0.95)
Dummy for Tigray region -0.671 -1.268 0.364
(0.83) (0.85) (1.22)
Wealth index constructed from consumer’s durables -1.014 -7.906*** -7.775***
(0.49) (3.21) (5.98)
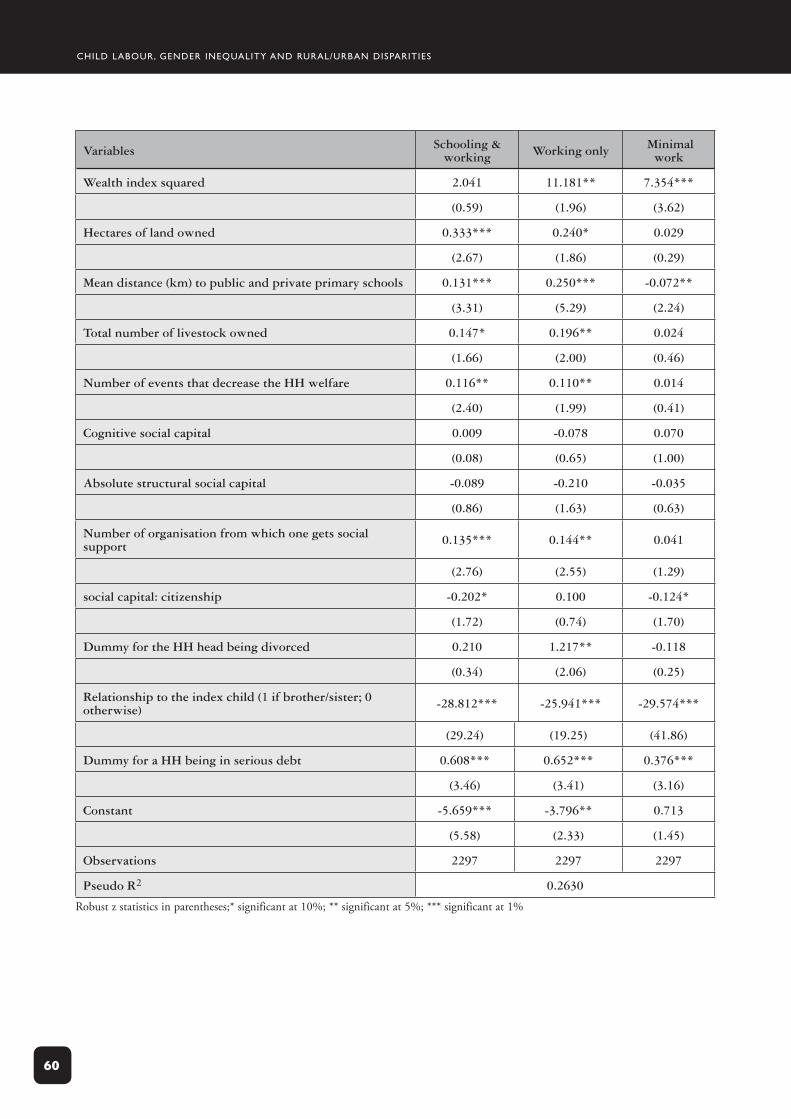
Child labour, gender inequality and rural/urban disparities
60
Variables Schooling & working Working only Minimal
work
Wealth index squared 2.041 11.181** 7.354***
(0.59) (1.96) (3.62)
Hectares of land owned 0.333*** 0.240* 0.029
(2.67) (1.86) (0.29)
Mean distance (km) to public and private primary schools 0.131*** 0.250*** -0.072**
(3.31) (5.29) (2.24)
Total number of livestock owned 0.147* 0.196** 0.024
(1.66) (2.00) (0.46)
Number of events that decrease the HH welfare 0.116** 0.110** 0.014
(2.40) (1.99) (0.41)
Cognitive social capital 0.009 -0.078 0.070
(0.08) (0.65) (1.00)
Absolute structural social capital -0.089 -0.210 -0.035
(0.86) (1.63) (0.63)
Number of organisation from which one gets social support 0.135*** 0.144** 0.041
(2.76) (2.55) (1.29)
social capital: citizenship -0.202* 0.100 -0.124*
(1.72) (0.74) (1.70)
Dummy for the HH head being divorced 0.210 1.217** -0.118
(0.34) (2.06) (0.25)
Relationship to the index child (1 if brother/sister; 0 otherwise) -28.812*** -25.941*** -29.574***
(29.24) (19.25) (41.86)
Dummy for a HH being in serious debt 0.608*** 0.652*** 0.376***
(3.46) (3.41) (3.16)
Constant -5.659*** -3.796** 0.713
(5.58) (2.33) (1.45)
Observations 2297 2297 2297
Pseudo R2 0.2630
Robustzstatisticsinparentheses;*significantat10%;**significantat5%;***significantat1%

Child labour, gender inequality and rural/urban disparities
6�
appendix a3: young lives’ definition of social capital
Fourtypesofsocialcapitalwereexamined,namely,absolutestructuralsocialcapital,socialsupport,cognitivesocialcapitalandcitizenship.
Absolute structural social capital (ASSC)isbasedonthenumberofgroupstowhichacaregiverbelongs.ASSCisdescribedasgreatifthenumberofgroupstowhichthecaregiverbelongsisthreeormore;mediumifthenumberofgroupsisonetotwo;andzeroifthecaregiverisnotamemberofanygroup.
Social support (SS) typeofsocialcapitalisbasedonwhetherornotthecaregiverhasreceivedsupport(emotional,economicorother)fromeithergroupsorindividuals,intheyearbeforethesurvey.Itisconsideredhighifacaregivergetshelpfromfiveormoregroupsandmediumifthecaregivergetshelpfromonetofourgroups.
Cognitive social capital (CSC) isbasedonthecaregiver’sperceptionsofthelocalcommunity.TheindexofCSCisacombinationoftheresponsestothequestionsastowhetherthecaregiverfeelsshe/heispartofthecommunity,whethershe/hefeelspeopleingeneralcanbetrusted,whethershe/hefeelspeoplewouldtryandtakeadvantageofher/himiftheycould,andwhethershe/hefeelspeoplegenerallyget alongwitheachother.Ifthecaregiver’sresponseispositivetoatleastthreeofthesetheyhavehighcognitivesocialcapital,mediumiftheygiveonlyoneortwopositiveanswersandifallquestionsareanswerednegativelywecategorisedthemashavingnocognitivesocialcapital.
Citizenship (CIT) isbasedonwhetherornotthecaregiverhasworkedwithothersinthecommunitytoaddressacommonissue.Thecitizenshipindexlooksatthequestionsaboutjoiningtogethertoaddresscommonissuesand/ortalkswiththelocalauthorityonproblemsofthecommunity.Thisindexisadichotomous(0or1)variable.Theindexisgivenavalue‘1’ifthecaregivereitherjoinstogetherwithotherstoaddresscommonissuesortalkswiththelocalauthorityaboutproblemsinthecommunity.Otherwise‘0’wasgiven.

Child labour, gender inequality and rural/urban disparities
62
appendix a4: young lives’ definition of household wealth
AnimportantvariableinYLdataisthewealthindex,whichattemptstomeasuretherelativepovertystatusofhouseholds.Thewealthindexwasconstructedbasedonthefollowingvariables:
Thenumberofroomsperpersonasacontinuousvariable;
Asetofelevenconsumerdurabledummyvariables,eachequaltooneifahouseholdmemberownedaradio,fridge,bicycle,TV,motorbike/scooter,motorvehicle,mobilephone,landlinephone,modernbed,tableorchair,andsofa;
Asetofthreedummyvariablesequaltooneifthehousehadelectricity,brickorplasteredwall,orasturdyroof(suchascorrugatediron,tilesorconcrete);
Adummyvariableequaltooneifthedwellingfloorwasmadeofafinishedmaterial(suchascement,tileoralaminatedmaterial);
Adummyvariableequaltooneifthehousehold’ssourceofdrinkingwaterwaspipedintothedwellingoryard;
Adummyvariableequaltooneifthehouseholdhadaflushtoiletorpitlatrine;and
Adummyvariableequaltooneifthehouseholdusedelectricity,gasorkerosene.
Thewealthindexcapturesvariablesthatarebroaderthanproductionassets,suchashomeownershipandthedurabilityofthathome,plusaccesstoinfrastructuresuchaswaterandsanitation.Theconstructionofthewealthindexissummarisedinthefollowingtable.
Constructionofthewealthindex
Components of index and score Contributing variables
H = Housing quality (/4) Rooms/person, wall, roof, floor durability.
CD = Consumer Durables (/11)Radio, fridge, bicycle, TV, motorbike/scooter, motor vehicle, mobile phone, landline phone, modern bed, table or chair and sofa.
S = Services (/4) Electricity, water, sanitation, cooking fuel.
Wealth Index = (H+CD+S)/3 Range = 0.0 – 1.0
1.
2.
3.
4.
5.
6.
7.

the young lives Partners Centre for Economic and social studies (CEss), India
department of Economics, university of Addis Ababa, Ethiopia
Ethiopian development Research Institute, Addis Ababa, Ethiopia
General statistical Office, Government of Vietnam
Grupo de Análisis Para El desarrollo (GRAdE), Peru
Institute of development studies, university of sussex, uK
Instituto de Investigación Nutricional (IIN), Peru
london school of hygiene and tropical Medicine, uK
Medical Research Council of south Africa
RAu university, Johannesburg, south Africa
Research and training Centre for Community development, Vietnam
save the Children uK
south bank university, uK
statistical services Centre, university of Reading, uK

W O R K I N G P A P E R N O . 2 0
ChIld lAbOuR, GENdER INEquAlIty ANd RuRAl/uRbAN dIsPARItIEs:how can Ethiopia’s national development strategies be revised to address negative spill-over impacts on child education and wellbeing?tassew Woldehannabekele teferaNicola JonesAlebel bayrau
this paper examines the Ethiopian Government's emphasis on the intensification of agricultural activities in order to increase livelihood options and provide better safety nets for the poor (e.g. through food or cash-for-work programmes).
drawing on a sample of 1999 households with at least one child aged 6 to 17 months in 2002, and from additional household data collected from 3115 children aged 7 to 17 years from twenty sentinel sites, the young lives Project sought to understand the impact on child labour and child schooling of public policy interventions formulated within the PRsP, and how changes are mediated through gender and rural-urban differences.
these were the key findings: children were commonly involved in fetching water, firewood and dung both for household use and sale, although they were more likely to attend school when there was adequate household labour. school attendance was significantly lower in rural than in urban sites, while dropout rates were dramatically higher in rural areas. Maternal education levels significantly decreased the likelihood of children combining work and school. Increased land and livestock ownership led to a greater demand for child labour and reduced school enrolment. the involvement of households in more diversified activities increased the demand for labour which is frequently met by children, particularly boys, with girls commonly substituting for their mothers.
In light of the above, young lives recommends the following measures to help reduce child labour and increase schooling:
introducing cash transfers and credit provisions to poor families to offset school costs especially for older
and rural children, and to cushion the adverse impact of household shocks;
improving school availability in rural areas and strengthening the policy focus on female education, including
investment in adult literacy programmes;
introducing credit measures to facilitate labour transactions;
modernising domestic and farm technologies to reduce labour intensity;
rationalizing livestock raising patterns;
improving women’s productive work opportunities while simultaneously ensuring that their care work
burden is reduced by considering subsidized community childcare arrangements or preschool services;
introducing safety nets, particularly for female-headed households;
improving community infrastructure, especially energy and water sources and affordable transportation;
reducing vulnerability to shocks such as drought through investing in irrigation schemes.
Published by
young lives save the Children uK 1 st John's lane london EC1M 4AR
tel: 44 (0) 20 7012 6796 Fax: 44 (0) 20 7012 6963 Web: www.younglives.org.uk
IsbN 1-904427-21-9 First Published: 2005
All rights reserved. this publication is copyright, but may be reproduced by any method without fee or prior permission for teaching purposes, though not for resale, providing the usual acknowledgement of source is recognised in terms of citation. For copying in other circumstances, prior written permission must be obtained from the publisher and a fee may be payable.
designed and typeset by Copyprint uK limited
•
•
•
•
•
•
•
•
•
Young Lives is an international longitudinal study of childhood poverty, taking place in Ethiopia, India, Peru and Vietnam, and funded by DFID. The project aims to improve our understanding of the causes and consequences of childhood poverty in the developing world by following the lives of a group of 8,000 children and their families over a 15-year period. Through the involvement of academic, government and NGO partners in the aforementioned countries, South Africa and the UK, the Young Lives project will highlight ways in which policy can be improved to more effectively tackle child poverty.