Determination of Formaldehyde Yields in E-Cigarette Aerosols
Upload
independentCategory
view
1download
0
Meteorol Atmos Phys 102, 307–323 (2008)DOI 10.1007/s00703-008-0319-2Printed in The Netherlands
1 Departamento de Fısica, Universidad de Le�oon, Le�oon, Spain2 Laboratoire d’A�eerologie=OMP, UMR 5560, Universit�ee de Toulouse III, CNRS-UPS, Toulouse, France3 Laboratoire des M�eecanismes et Transferts en G�eeologie, LMTG-UMR 5563 UR 154
CNRS Universit�ee Paul-Sabatier IRD, Toulouse, France
Chemical composition of urban aerosols in Toulouse,France during CAPITOUL experiment
A. I. Calvo1, V. Pont2, C. Liousse2, B. Dupr�ee3, A. Mariscal2, C. Zouiten3, E. Gardrat2,P. Castera2, C. G. Lacaux2, A. Castro1, R. Fraile1
With 3 Figures
Received 30 March 2008; Accepted 28 April 2008Published online 4 December 2008 # Springer-Verlag 2008
Summary
Ambient PM10 and PM2.5 aerosols were monitored inToulouse from March 2004 to February 2005 (ExtensiveObserved Period (EOP)) as part of the research projectCAPITOUL (Canopy and Aerosol Particles Interaction inTOulouse Urban Layer). Concentrations of 8 major ions(Naþ, NHþ
4 , Kþ, Mgþ2, Caþ2, Cl�, NO�3 , SO2�
4 ), 15 metalelements (Al, Ba, Cd, Ce, Cr, Cu, Fe, La, Mn, Ni, Pb, Sr,Th, Ti, Zn), and carbonaceous aerosols [TC, POM and EC
(total carbon, organic carbon and elemental carbon, respec-tively)] were measured in a total of 52 samples of each size.Inter-seasonal variations were analyzed. Weekly PM2.5 andPM10 total mass concentrations (major ionsþ carbonþmetal elements) were 4.4–18.0mg m�3 and 6.5–23.5mg m�3,with an annual average concentration of 11.0 � 3.6 mg m�3
and 13.2 � 4.3mg m�3, respectively. The highest concen-tration for sulfate was found in summer and fall, whereasthe highest NO�
3 concentration was observed in winter.This study is strengthened by Kruskal–Wallis and Mann–Whitney statistical tests.
On average, carbonaceous species constitute between 49%and 75% of the monthly concentration registered, POM con-centration always remaining higher (ratio more than 51%)than EC in both size ranges. The average OC=EC ratioswere 2.70 � 0.81 and 2.70 � 0.60 for PM2.5 and PM10, re-
spectively. Secondary organic carbon concentrations were sig-nificantly higher in the warmer seasons reaching in summeraverage ratios of 65.9% and 64.5% of the total OC concentra-tion for PM2.5 and PM10, respectively. Secondary organiccarbon was produced in the fine fraction of the aerosol.
Metal elements analysis and enrichment factor calcula-tions show that traffic emissions were the major influenceon the chemical composition of the urban aerosol. A receptormodeling study was conducted using Principal ComponentFactor Analysis followed by multi-linear regression analysisin order to provide quantitative insights into the sources ofspecific chemical components in PM10.
1. Introduction
There has been a growing interest in recent yearsfor monitoring and characterizing size-segregat-ed ambient particulate matter (PM). Atmosphericaerosol loading has increased dramatically sincethe preindustrial period (Legrand and Mayewski1997; Junker and Liousse 2006) and will certain-ly continue increasing in the next century (Wolfand Hidy 1997).
Atmospheric particles have environmental im-pacts on the climate (Broecker 2000; IPCC 2001;Liu and Daum 2002; Prospero et al. 2002), onbiogeochemical cycles in ecosystems (Nriagu
Correspondence: V�eeronique Pont, Laboratoire d’A�eerologie=OMP, UMR 5560, Universit�ee Paul Sabatier – Toulouse III, 14, av.
E. Belin, 31400 Toulouse, France (E-mail: [email protected])

1988; Nriagu and Pacyna 1988), on outside visi-bility (Husar et al. 1997; Kim et al. 2001; Watson2002), and on human health (Schwartz andDockery 1992; Dockery et al. 1993; Maynardand Maynard 2002). Lary et al. (1997) andRavishankara (1997) revealed that heterogeneousprocesses occurring on the surface of aerosolscan alter chemical cycles by acting either as asink or as a source, perhaps even catalytically,of gas-phase species. Chemical modifications ofthe particle surface may alter the light scatteringand absorption properties of aerosols.
Aerosols are composed of a wide range of ele-ments, including minerals, dust, sea salt, nitrates,sulfates, water, and carbonaceous aerosols, andthey greatly vary in particle size and chemicalcomposition (Spurny 1998; Harrison and Yin2000; Alfaro-Moreno et al. 2002). Fine atmo-spheric particles are a complex mixture of manyspecies derived from various sources, and thus adeep understanding of their chemical composi-tion is necessary for the purpose of source identi-fication and pollution control (Huang et al. 2006).
The metal fraction, although usually very lowin mass, may represent a substantial part of thetoxicity of aerosol particles (Linak and Wendt1993; Gatebe et al. 1996; Schwela 2000). Aerosolsmay have their origin in natural processes (duststorms, volcanic eruptions, etc) (Hobbs et al.1991; Koltay et al. 1999; Viana et al. 2002;Moreno et al. 2005; Wang et al. 2007), but manyare of anthropogenic origin (hydrocarbon combus-tion, metal industry, forest fires or traffic) (Pacyna1986; Querol et al. 2002; Lin et al. 2005; Alastueyet al. 2006; Birmili et al. 2006).
Atmospheric aerosols, especially in urban areas,contain a significant fraction of carbonaceousmaterial (Hamilton and Mansfields 1991; Roggeet al. 1993; Andrews et al. 2000). They consistof black carbon (EC) and a complex mixtureof hundreds of organic elements with different
chemical and physical properties (Rogge et al.1993; Turpin et al. 2000). These are the maincomponents of atmospheric particles emitted bytraffic (both diesel and gasoline) (Frasser et al.1999) and heating.
The monitoring of complex mixtures of aero-sols in various geographical regions is very muchneeded. Nested between the Mediterranean Seaand the Atlantic Ocean, Toulouse has recentlyknown a strong demographic growth making itone of the first metropolises in Southern Europe.Because of this Toulouse was chosen as thepilot site of this study within the frame of theCAPITOUL campaign.
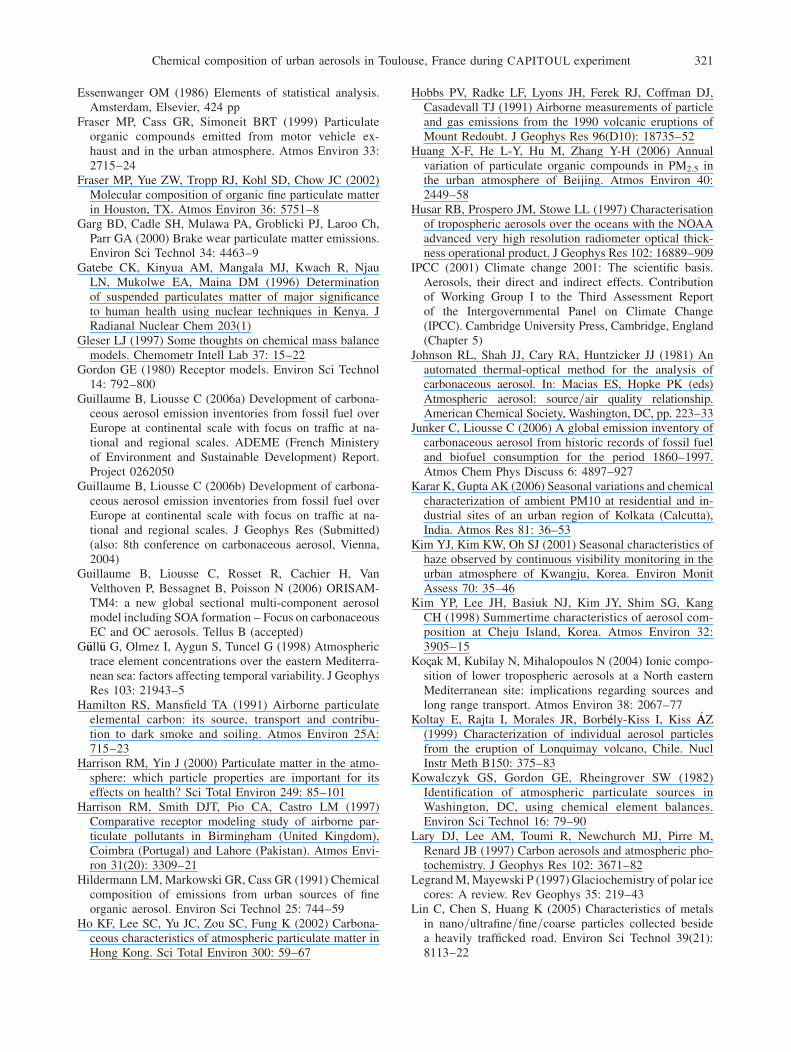
CAPITOUL (Canopy and Aerosol ParticlesInteraction in TOulouse Urban Layer) is a re-search project carried out in the city of Toulouse,France, from March 2004 to February 2005, andaiming at improving knowledge on urban meteo-rology, aerosols, and gaseous pollution. Duringthe CAPITOUL campaign two experimentalperiods were defined: (1) an extensive observa-tion period (EOP) from March 2004 to February2005 in the city center of Toulouse, and (2) anintensive observation period (IOP) from 1st to8th July 2004 in Toulouse and the nearby townof Escalquens (fifteen kilometers southeast ofToulouse) (Fig. 1). Systematic monitoring of at-mospheric composition in Toulouse will serve asa base line to monitor the influence of anthropo-genic activities on this region.
This paper will focus exclusively on the EOP
database. Further studies will deal with thechemical characterization of aerosols using theIOP database to better understand the chemicalageing processes during transport.
Using the CAPITOUL data base, we per-formed a statistical-descriptive analysis of theintra-annual variation of the aerosol chemicalcomposition as a function of size. Previous studieshave reported measurements of the intra-annual
Fig. 1. Map of the study zonein the Midi-Pyr�een�eees region (France)
308 A. I. Calvo et al.

and intra-seasonal aerosol changes in differentcities of the world (Viana et al. 2003; Ye et al.2003; Karar and Gupta 2006) but there are notvery many complete studies which include theanalysis of a large spectrum of components (e.g.carbonaceous species, metals elements and majorions). Intra-annual and intra-seasonal changesenable us to find possible factors determiningthe variation and the formation mechanism ofsecondary components to explain the observa-tion, and the relative contribution of both naturaland anthropogenic sources.
2. Methodology
2.1 Description of the site
Toulouse is a city located in the southwest ofFrance, far from local oceanic and orographicinfluences, with a semi-continental climate char-acterized by two dominant winds (south-easternand north-western). Toulouse (capital of theMidi-Pyr�een�eees region) and its surroundings havea population of about 965,000 inhabitants.Owing to an important industrial development,Toulouse has undergone a significant demograph-ic growth. Consequently, industrial and vehiculartraffic emissions have augmented, which hasresulted in an increase of the background pol-lution. Indeed, between 1991 and 2005, overToulouse and its surroundings, mean annual nitro-gen dioxide concentrations have increased of 5 upto 20mg=m3 according to sites (ORAMIP 2005).
2.2 Experimental EOP protocol
During EOP aerosol samples were collected onthe roof of the Post Office building (some 30 mabove ground level) in the centre of the urbanarea of Toulouse (43� 360 1900 N, 1� 260 3400 E).This monitoring site can be considered as ur-ban, as the sampling height above surroundingstreets does not enable us to define it as a trafficsite. Aerosols were collected on filters with apumping system (specific development realizedat Laboratoire de M�eet�eeorologie Physique atClermont-Ferrand) at a constant flow rate of1 m3 h�1 with head cutters (PM10 and PM2.5).For each size two simultaneous samplings werededicated to a) carbonaceous aerosols, and b) tomajor ions and metal elements aerosols, respec-
tively. Pumping was continuous throughout thesampling week. During the sampling year (EOP),four filters a week were carried out using thismethod.
For major ions and metal elements aerosolsamplings, aerosols were collected on Teflon fil-ters (Pall Zefluor, 47 mm diameter). In the caseof carbonaceous aerosol samplings, aerosolswere collected on quartz fiber filters (WhatmanQMA, 47 mm diameter). Before the samplingsthese filters were cleaned by means of a bakingprocedure (450 �C for 24 h).
A total of 52 aerosol samples were collectedand analyzed in this study. All the proceduresfollowed were strictly quality-controlled to avoidany possible contamination of the samples.
2.3 Analytical methodology
2.3.1 Carbonaceous aerosols
Total Carbon (TC), Elemental Carbon (EC) andOrganic Carbon (OC) were determined using theDRI Model 2001 Thermal=Optical CarbonAnalyzer following the Interagency Monitoringof Protected Visual Environments (IMPROVE)thermal=optical reflectance (TOR) protocol(Chow et al. 1993, 2001, 2004). No pre-treatmentto extract carbonate carbon is applied. Thethermo-optical method enables an optimal differ-entiation between OC and EC thanks to an opti-cal correction of the charring which is essentialfor a less-biased measurement of carbon frac-tions (Johnson et al. 1981). A set of field blanksamples was analyzed to apply corrections to thevalues obtained.
2.3.2 Major ions
The analysis of major ions was carried out byionic chromatography in liquid phase. The con-tents of half the filter of each sample wereextracted ultrasonically using 15 ml of deionizedwater. Cations (Naþ, NHþ
4 , Kþ, Mgþ2, Caþ2)were analyzed with an ICS 1000 chromatographusing a CS 12A (4 mm) column with a CG12Aon guard. Metasulfonic acid 20 mM was used aseluent in mode isocratic. A self-regenerating sup-pressor (CSRS ULTRA) and a conductivity de-tector DS6 were used in these analyses.
Anions (Cl�, NO�3 , SO2�
4 ) were analyzed withan AX 500 chromatograph. Setup conditions
Chemical composition of urban aerosols in Toulouse, France during CAPITOUL experiment 309

are as follow: AS11 (4 mm) column with aAG11 guard column a self-regenerating suppres-sor ASRS ULTRA and a conductivity detectorCD 20. The gradient weak base eluent (0.05–10 mM NaOH) was used for anion ion detection.
For the final results blank values were takeninto account. The limits of detection were lessthan 10 ppb for anions and cations.
2.3.3 Metal elements
One quarter of the filter was used to determinemetal elements (Al, Ba, Cd, Ce, Cr, Cu, Fe, La,Mn, Ni, Pb, Sr, Th, Ti, Zn) by inductively cou-pled plasma mass spectrometry ICP-MS (Elan6000, Perkin Elmer Sciex) after total chemicaldissolution applying high-purity HNO3 and HF.The limits of detection for metal elements wereless than 10 ppt. Blank values were removedfrom raw sample concentrations. The uncertaintyof measurements was about 20%. The other quar-ter of the filter was used to obtain AnalyticalElectronic Sweeping Microscope (AESM) images.
2.4 Statistical methodology
We used two non-parametric tests to assess thestatistical significance of seasonal descriptiveanalyses. The Kruskal–Wallis test is a non-parametric test used to compare three or moresamples. This test can be used at the same timeto verify the homogeneity of both means andvariances (Sneyers 1990). The Mann–Whitneytest is a non-parametric statistical significancetest that compares two unpaired groups by com-bining both sets of data into a single set. Whenthe value is over 1.96 for a 0.05 significance lev-el, it means that there is evidence to reject thenull hypothesis (both sets come from the samepopulation) in favor of the alternative hypothesis(Essenwanger 1986).
The Kruskal–Wallis test allows us to deter-mine whether there are differences between theseasonal chemical composition of PM2.5 andPM10 aerosols, and the Mann–Whitney test as-sesses the significance of these differences.
Source types for aerosol constituents wereidentified by means of Principal ComponentsFactor Analysis (PCA) using XLSTAT statisticalsoftware and the Pearson test. The contributionof each source group to the aerosol burden was
then quantitatively assessed using Multi-LinearRegression Analysis (MLRA).
3. Results and discussion
In the following section, PM10 and PM2.5 referto the sum of the measured species in respectivesamplings. To consider the Particulate OrganicMatter (POM), raw data of Organic Carbon aremultiplied by factor 1.3 (Liousse et al. 1996;Chazette and Liousse 2001).
3.1 Annual chemical trend of PM10and PM2.5 aerosols
In Toulouse the total annual average massconcentrations of PM2.5 and PM10 aerosolsare 11.0 mg m�3 and 13.2 mg m�3, respectively.Carbonaceous aerosols are predominant with av-erage annual values of 6.1 mg m�3 and 6.4 mg m�3
(accounting for 55.1% and 48.2% of the totalconcentration) for POM, and 1.9mg m�3 and2.0 mg m�3 (accounting for 17.5% and 15.4% ofthe total concentration) for EC, with respect toPM2.5 and PM10, respectively. Sulfate, nitrateand ammonium have average annual values of1.3mg m�3, 1.1mg m�3, and 0.5mg m�3 for PM10,and 1.0 mg m�3, 0.6 mg m�3, and 0.4 mg m�3 forPM2.5, respectively. Average annual values ofmetal elements are respectively 0.6 mg m�3 and1.2 mg m�3 for PM2.5 and PM10.
Significant seasonal variations of particulatepollutants were obtained using the raw weeklyaverage concentrations of PM10 and PM2.5chemical components. Seasons were defined asfollows: spring (March, April, and May), sum-mer (June, July, and August), fall (Septemberand October) and winter (November, December,January, and February). This division groupstogether months with roughly similar meteoro-logical conditions. PM2.5 and PM10 show asimilar seasonal trend (Table 1). Concentrationsof PM2.5 and PM10 aerosols and most of theirchemical components (NHþ
4 , Cl�, NO�3 , POM
and EC) are generally higher in winter than inother seasons. PM2.5 total mass concentrationis higher in winter – with an average mass of13.7 mg m�3, than in spring, summer and fall,with 9.9mg m�3, 10.2 mg m�3, and 10.5 mg m�3,respectively. Similarly, PM10 shows the highestmass concentration in winter (average mass
310 A. I. Calvo et al.: Chemical composition of urban aerosols in Toulouse, France during CAPITOUL experiment

Table
1.
Aver
age
seas
on
alan
dan
nu
alco
nce
ntr
atio
ns
(mg
m�
3fo
rca
rbo
nac
eou
san
dm
ajo
rio
ns
and
ng
m�
3fo
rm
etal
elem
ents
)an
dst
andar
ddev
iati
ons
(�S
D)
for
PM
2.5
and
PM
10
inT
ou
lou
se
SPRIN
G(M
,A,M)
SUMMER
(J,J,A)
FALL
(S,O)
WIN
TER
(N,D,J,F)
TOTAL
PM2.5
PM10
PM2.5
PM10
PM2.5
PM10
PM2.5
PM10
PM2.5
PM10
No
13
13
14
14
99
16
16
52
52
OC
4.4
5�
1.4
94
.29�
1.2
04
.53�
1.5
44
.69�
1.0
54
.08�
0.7
34
.62�
0.6
95
.58�
2.0
06
.30�
2.1
24
.71�
1.6
15
.02�
1.6
0
BC
1.4
3�
0.4
21
.52�
0.4
31
.37�
0.3
61
.47�
0.3
52
.18�
0.7
92
.22�
0.8
12
.85�
1.4
32
.98�
1.5
31
.95�
1.0
62
.05�
1.1
1
Naþ
0.1
0�
0.0
60
.26�
0.1
40
.10�
0.0
40
.27�
0.1
30
.14�
0.0
50
.35�
0.1
30
.11�
0.1
00
.23�
0.1
50
.11�
0.0
70
.27�
0.1
4
NH
þ 40
.34�
0.2
00
.49�
0.3
40
.34�
0.1
10
.39�
0.1
30
.38�
0.2
60
.36�
0.2
70
.54�
0.2
50
.72�
0.4
50
.40�
0.2
20
.51�
0.3
5
Kþ
0.0
3�
0.0
10
.05�
0.0
10
.04�
0.0
10
.05�
0.0
20
.05�
0.0
20
.07�
0.0
20
.06�
0.3
60
.07�
0.0
30
.04�
0.0
20
.06�
0.0
2
Mgþ
20
.02�
0.0
10
.04�
0.0
20
.02�
0.0
10
.04�
0.0
20
.02�
0.0
10
.05�
0.0
20
.01�
0.0
10
.02�
0.0
10
.02�
0.0
10
.04�
0.0
2
Caþ
20
.08�
0.0
30
.14�
0.0
50
.16�
0.0
50
.24�
0.0
80
.15�
0.1
0.2
5�
0.1
40
.08�
0.0
30
.13�
0.0
50
.11�
0.0
70
.18�
0.0
9
Cl�
0.0
4�
0.0
40
.16�
0.1
50
.04�
0.0
30
.11�
0.1
30
.03�
0.0
20
.13�
0.1
10
.16�
0.1
40
.35�
0.3
40
.07�
0.1
00
.20�
0.2
4
NO
� 30
.39�
0.3
60
.91�
0.6
20
.18�
0.0
80
.46�
0.1
70
.31�
0.1
50
.72�
0.2
71
.42�
0.6
92
.05�
0.9
80
.61�
0.6
61
.08�
0.8
8
SO
2�
40
.94�
0.5
61
.27�
0.5
21
.20�
0.4
11
.52�
0.5
11
.38�
0.9
41
.67�
1.0
80
.82�
0.3
61
.07�
0.4
1.0
4�
0.5
81
.34�
0.6
5
Al
10
4.1
2�
87
.75
13
6.1
9�
83
.18
25
6.7
2�
15
3.1
44
48
.44�
43
7.9
72
03
.37�
13
3.5
03
94
.59�
16
9.7
71
57
.20�
87
.46
33
1.3
3�
24
5.3
81
73
.63�
12
2.3
23
16
.37�
27
2.7
4
Pb
7.8
3�
3.9
29
.14�
3.9
86
.55�
2.9
68
.73�
4.3
59
.91�
3.2
11
4.7
6�
4.7
21
3.6
4�
9.4
32
0.8
4�
16
.64
9.7
0�
6.4
91
3.6
8�
11
.04
Ni
45
.96�
44
.25
73
.05�
39
.77
10
2.1
6�
86
.90
32
0.9
7�
34
5.2
50
.88�
0.7
11
.38�
0.6
40
.56�
0.1
30
.71�
0.1
53
5.2
2�
54
.57
82
.37�
16
6.6
6
Cu
8.8
6�
4.1
01
1.4
2�
3.5
31
2.8
3�
2.7
61
9.3
8�
12
.41
10
.54�
3.1
11
5.5
1�
5.7
81
3.8
0�
10
.19
27
.78�
20
.06
11
.53�
6.6
11
9.0
1�
14
.26
Fe
51
2.4
4�
34
0.8
07
43
.65�
37
2.1
84
04
.12�
26
9.0
37
81
.86�
66
3.7
62
46
.71�
12
8.5
84
94
.42�
16
0.3
72
02
.24�
20
0.1
43
9.6
5�
23
0.8
03
24
.72�
26
3.6
05
96
.23�
40
3.3
3
Ti
7.0
7�
3.6
71
4.9
3�
9.3
98
.05�
6.3
41
6.4
9�
6.1
41
0.5
8�
9.9
82
4.5
6�
12
.23
5.4
2�
4.9
61
4.6
9�
6.8
07
.43�
6.3
81
7.1
1�
9.0
4
Mn
9.5
1�
6.5
91
2.4
0�
7.4
89
.00�
5.8
31
4.9
4�
13
.78
5.8
8�
2.7
08
.17�
2.7
55
.28�
2.7
17
.12�
3.3
07
.50�
5.0
71
0.7
5�
8.5
0
Zn
13
.34�
7.4
61
5.8
2�
7.0
31
4.5
4�
3.4
32
0.1
7�
13
.07
15
.98�
5.1
12
5.1
3�
9.2
82
0.1
7�
9.0
33
6.2
8�
31
.73
16
.57�
7.3
42
5.9
4�
21
.80
Cr
74
.18�
70
.55
11
5.5
6�
63
.51
54
.97�
95
.78
16
6.0
3�
31
7.2
60
.80�
0.3
71
.38�
0.3
82
0.6
4�
57
.91
18
.99�
46
.56
35
.97�
68
.63
72
.47�
16
9.9
4
Sr
0.8
9�
0.4
61
.51�
0.4
71
.04�
0.3
61
.66�
0.3
91
.03�
0.7
12
.41�
1.0
40
.53�
0.2
11
.00�
0.5
50
.88�
0.4
81
.61�
0.7
6
Cd
0.1
8�
0.1
40
.26�
0.1
80
.34�
0.3
41
.04�
1.0
70
.20�
0.0
80
.26�
0.0
90
.31�
0.2
50
.50�
0.4
60
.25�
0.2
10
.44�
0.4
9
Ba
2.5
7�
0.9
04
.13�
1.2
33
.32�
1.0
24
.40�
1.3
33
.81�
1.3
87
.40�
2.0
13
.00�
1.5
95
.64�
3.5
33
.12�
1.3
15
.29�
2.5
9
La
0.0
2�
0.0
10
.17�
0.0
40
.03�
0.0
10
.20�
0.0
60
.04�
0.0
30
.31�
0.1
40
.01�
0.0
00
.24�
0.2
00
.02�
0.0
20
.23�
0.1
4
Ce
0.2
1�
0.0
90
.24�
0.0
80
.30�
0.1
20
.43�
0.1
90
.45�
0.0
20
.84�
0.4
10
.22�
0.0
70
.42�
0.0
80
.29�
0.1
50
.46�
0.3
0
Th
0.0
2�
0.0
10
.03�
0.0
10
.03�
0.0
10
.05�
0.0
20
.04�
0.0
30
.07�
0.0
30
.01�
0.0
00
.02�
0.0
10
.02�
0.0
20
.04�
0.0
2
No
Nu
mb
ero
fsa
mp
les
invo
lved
inca
lcu
late
dm
ean
val
ue

16.7 mg m�3), and concentrations of 11.6 mg m�3,12.5 mg m�3, and 12.8 mg m�3 in spring, summerand fall, respectively. This trend is due to thedynamic conditions in winter. Indeed, a low at-mospheric boundary layer in cold temperaturesprevents pollutants from dispersing and diluting.
In summer, on the one hand, a high boundarylayer enhances dispersion, which results in lowerconcentrations of some elements. On the otherhand, high temperatures and solar insolation en-hance photochemical activities and cause an in-crease in the concentrations of some otherpollutants. This is the case of SO2�
4 PM 2.5 con-centrations, with values of 1.2mg m�3 in summer,1.4 mg m�3 in fall, and falling to 0.8 mg m�3 inwinter. This variation illustrates both photochem-ical activity and removal efficiency.
Focusing on PM2.5 carbonaceous aerosols, animportant feature is their high load in all seasons.The quantity of POM is predominant (>51%)all year round, and represents the majority ofTC concentration, with POM=TC ratios of 0.80,0.81, 0.71, and 0.72 in spring, summer, fall andwinter, respectively. Winter with 7.2 mg m�3 and2.8 mg m�3 for POM and EC, respectively, isthe season when the highest carbonaceous con-centration is registered. EC and POM, mainlyproduced by combustion, present significant sea-sonal differences (spring and summer differentfrom fall and winter in both sizes), probablydue to the heating systems in the cold seasons.In warmer seasons POM appears exclusively inthe fine fraction of the aerosol, as intense gaseousphotochemistry favors heterogeneous nucleationof Volatile Organic Compounds. NO�
3 shows adistinct seasonal variation reaching its peak inwinter (1.4 mg m�3) and its lowest concentration(0.2 mg m�3) in summer. Nitrate is formed in theatmosphere predominantly through oxidation ofNOx from a number of sources including trafficemissions, main source in Toulouse. Seasonalvariation is not expected in the source strengthof NO�
3 because this source is relatively stablethroughout the year as shown by Park and Kim(2004) in South Korea. The difference may beexplained by another process. Indeed, the reac-tion between gas-phase ammonia and nitric acidto form particulate-phase ammonium nitrate isfavored by low ambient temperatures in winter(Stelson and Seinfeld 1982; Seinfeld and Pandis1998; Park and Kim 2004).
A higher Ca2þ concentration was registeredin summer and fall with 0.2mg m�3 (versus0.1 mg m�3 in spring and winter). Ca2þ is mainlyof crustal origin, and soil particles can becomemore easily airborne particles in the dry seasonsas a result of sandblasting. Moreover, someSaharan dust events may bring this crustal ele-ment over the Toulouse area (Dessens and VanDinh 1990). Indeed, the highest values of calci-um over the whole period studied have beenfound for the first week in September 2004 andfirst week in October samplings. From the 09=03to 09=05 and from the 10=05 to 10=08 dustevents occurred over the southwestern France(TOMS aerosol index for the September episode,HYSPLIT back trajectories and NAAPS (NavyAerosol Analysis and Prediction System) simula-tions have been computed for these dates), whichmade calcium concentrations reach values twiceas high as PM10 mean concentrations.
The Kruskal–Wallis test was applied to assessthese seasonal differences in each chemical com-ponent. P-values under 0.05 are considered to bestatistically significant. For PM10 significant dif-ferences were found in Kþ, Mg2þ, Ca2þ, Cl�,NO�
3 , POM, and EC with p-values under 0.05,and for PM2.5 these differences were foundfor Kþ, Mg2þ, Ca2þ, Cl�, NO�
3 , and EC withp-values under 0.003. The Mann–Whitney test(�¼ 0.05) confirms that winter is the seasonthat shows the greatest differences to the otherseasons.
POM presents statistically significant seasonaldifferences for PM10 but not for PM2.5. Thehighest POM concentration is observed in winter.This suggests that our site measurement is large-ly influenced by surroundings sources such asvehicles exhausts and domestic heating in winter.During warmer seasons when heating is cut offand photochemistry is efficient enough to pro-duce secondary organic gases likely to nucleatetowards secondary organic aerosol, POM con-centrations are lower than in winter. Trafficintensity, evaluated through vehicular monthlycounts performed by CIGT, (DIRSO CIGT,2005), varies lowly along the year (� 4% aroundthe mean annual count value). Industrial sourcesover the Toulouse area do not vary in large pro-portion throughout the year as they are in contin-uous working in production. It suggests that POM
emissions from these sources can be considered
312 A. I. Calvo et al.

as constant in Toulouse. Thus, we can note thatcontribution of Secondary Organic Carbon inwarmer seasons is less important than the heatingcontribution in total POM of the samplings.
3.2 Estimation of secondary organic carbon
While EC is derived only from combustion pro-cesses, organic carbon (OC) is produced by bothprimary and secondary sources (Liousse et al.1996, 2004, 2005; Kim et al. 1998; Castro et al.1999; Ho et al. 2002; Park et al. 2002; Yuet al. 2004; Cousin et al. 2005).
There are no direct measurements of thetwo fractions of Primary Organic Carbon (OCp)and Secondary Organic Carbon (SOC). OnlyTotal Organic Carbon (OCtot) can be measured.Indirect methods have been developed to quanti-fy the contributions of Primary and SecondaryOrganic Carbon to carbonaceous aerosols. Insome studies, OC=EC ratios exceeding 2.0 havebeen used to indicate the presence of second-ary organic aerosols (Turpin et al. 1990a, b;Hildermann et al. 1991; Chow et al. 1996). TheOC=EC ratio traduces the enrichment in organiccarbon of the carbonaceous aerosol (Castro et al.1999). During the study period, OC=EC ratios forPM2.5 and PM10 vary in a correlated way,reaching values between 1.3 and 4.3 for PM2.5,and between 1.4 and 3.8 for PM10, with averageratios of 2.7� 0.8 and 2.7� 0.6 for PM2.5 andPM10, respectively. Average seasonal OC=EC ra-tios are 3.1, 3.3, 2.0, and 2.2 for PM2.5, and 2.9,3.2, 2.2, and 2.4 for PM10 in spring, summer, falland winter, respectively. These values suggestthat, as to be expected, there is enrichment inorganic carbon during spring and summer. Thisresult traduces that there is an increase in theformation of secondary organic carbon throughgas=particle conversion of Volatile OrganicCompounds (VOC) as a result of photochemicalactivity. These PM2.5 values are similar toOC=EC ratios found by Lin and Tai (2001) with2.6 in Taiwan (11=1998–4=1999), by Chow et al.(1994) who found a ratio of 2.5 in Anaheim-USA-(11=1987–12=1987), or the 2.6 ratio ob-tained by Fraser et al. (2002) (3=1997–2=1998).For PM10 similar ratios have been registeredin Taiwan (11=1998–4=1999) by Lin and Tai(2001) with 2.4, or in Portugal (Castro et al.
1999) with 2.7 in Oporto (4=1993–9=1993) and3 and 2.1 in Coimbra (4=1992–9=1993 and10=1992–3=1993, respectively).
In fall, this ratio becomes lower for PM2.5 andPM10, with a minimum value of 1.3 for PM2.5and 1.4 for PM10 (sampled from 25th October to2nd November). It can be associated with an EC
increase due to the emissions of heating systemsand a very limited mixing height evolution usu-ally associated with winter episodes (Crespı et al.1995). Moreover, OC decreases because of alower concentration of secondary organic carbonattributed to a lower photochemical activity. Thistrend is more important in PM2.5.
Several indirect methodologies have been ap-plied to evaluate the SOC concentration in ambi-ent aerosols (Turpin and Huntzicker 1991, 1995;Pandis et al. 1992; Castro et al. 1999; Lin and Tai2001; Viidanoja et al. 2002). According to Castroet al. (1999), the production of SOC can be cal-culated from the following equation:
OCsec ¼ OCtot � EC�ðOC=ECÞmin;
where OCsec is the SOC, OCtot is the total OC,and (OC=EC)min is the minimum ratio observed.
With this relationship samples with minimumOC=EC ratios are assumed to be formed by ex-clusively primary carbonaceous compounds (sec-ondary organic carbon is negligible, because ofthe source proximity) (Castro et al. 1999).
Minimum OC=EC ratios of the order of 1.3and 1.4 have been observed in fall for PM2.5and PM10, respectively. Similar minimum OC=EC ratios with 1.1, 1.1, 1.2, and 1.3 were foundat Aveiro, Coimbra, Oporto (Portugal), andBirmingham (UK), respectively (Castro et al.1999). These values are reliable for SOC produc-tion calculations only if the sources can be con-sidered constant all throughout the year.
In winter in Toulouse the sources contributingto OC and EC concentrations are supposed tobe the following: traffic, industrial and domesticactivities (heating and water heating). Trafficand industrial emissions vary in low proportionsand can be supposed constant all year long. On theother hand, the non-constant domestic heatingsources have to be taken into account. Thanksto the annual primary OC and EC France Inven-tory Data Base (Guillaume and Liousse 2006a;Guillaume and Liousse 2006b), we establishmonthly domestic (heating and water heating)
Chemical composition of urban aerosols in Toulouse, France during CAPITOUL experiment 313

variations of primary OC=EC throughout the year(called CURV in the rest of the text). We want toreproduce this annual trend of domestic sourcesvariability for our measured OC=EC ratios. Thus,we consider (OC=EC)min measured in October(standing purely for primary organic fraction)and by fitting CURV we calculate monthly (OC=EC)min related to variability of domestic sourcesin Toulouse throughout the study year. For bothsizes, a value of 1.5 was obtained for January,February, March, November and December, 1.4and 1.3 (for PM10 and PM2.5, respectively) forApril and October, and 1.1 for both sizes forMay, June, July, August and September. SOC
calculations were performed using these values.Average seasonal data for concentrations of
secondary organic carbon (SOC) are given inTable 2. The important contribution of SOC toOCtot concentration in spring and summer forPM2.5 results from the intensity and rapidity ofphotochemical activities in these seasons. Aver-age SOC=OCtot percentage in spring and summeris around 59% and 66%, respectively, for PM2.5,and around 54% and 64% for PM10. In fall andwinter, OCp concentration is the main componentof OCtot, with OCp=OCtot percentages of 65% and73% for PM2.5, and 60% and 70% for PM10. Inwintertime, organic carbon emissions in urbanareas are essentially primary in origin (Chu andMacias 1981; Strader et al. 1999; Chu 2004; Chuet al. 2004). The primary carbonaceous emis-sions from motor vehicles and heating systemshave mostly contributed to the OC and EC levelsin Toulouse in fall and winter. Photochemicalactivity is lower in these seasons, leading to arelative decrease in the levels of secondary or-ganic carbon.
A high correlation can be observed betweenEC and SOC concentrations in warm seasons,with 0.71 and 0.68 for PM2.5, and 0.71 and
0.85 for PM10 in spring and summer, respective-ly. These coefficients agree with the results foundby Castro et al. (1999), who registered 0.64 inAveiro (Portugal) in an urban area in summer.The results suggest the fast formation of SOC
near sources, since EC can be considered as acombustion tracer.
3.3 Metal elements
Total annual average metal elements concentra-tions are 0.6mg m�3 and 1.2 mg m�3, accountingfor 6.4% and 9.8% of total aerosol concentra-tion (carbonþmetal elementsþmajor ions) forPM2.5 and PM10, respectively. Fe, Al, Ni and Crhave the highest concentrations for both PM2.5and PM10, accounting for over 91% of total an-nual metal elements mass concentration (Fe andAl accounting for about 79% in both sizes).
Generally, with regard to seasonal concen-tration, it is in summer when the highest totalconcentration is found, with 874.0 ng m�3 and1804.8 ng m�3 for PM2.5 and PM10, respectively;in contrast, the lowest concentration is registeredin winter, with 443.0 ng m�3 and 905.2 ng m�3
(versus 787.2 ng m�3 and 1138.5 ng m�3 in springand 510.2 ng m�3 and 991.2 ng m�3 in fall). Agradual increase of the total metal elementconcentrations can be observed from winter tosummer. Voutsa et al. (2002) found higher con-centrations in Thessaloniki (Greece) in calmweather, suggesting emissions from local sourcesas the origin.
For each major ions and metal element ofthe mixed aerosol we observe different seasonaltrends. For Ti, Ba, La, Ce, and Th the highestconcentrations are found in fall for both sizes,whereas the highest Pb, Zn, and Cu concentra-tions were found in winter for PM10 and PM2.5.Finally, for Al, Ni and Cd the highest concentra-
Table 2. Seasonal levels of OCsec and standard deviation (SD). OCsec=OCtot ratios and correlation coefficientbetween BC and OCsec (r) for PM2.5 and PM10
PM2.5 PM10
OCsec
(mgm23)SD OCsec==
OCtot(%)r OCsec
(mgm23)SD OCsec==
OCtot(%)r
Spring 2.67 1.09 59.05 0.71 2.34 0.81 54.07 0.71Summer 3.04 1.24 65.85 0.68 3.03 0.71 64.51 0.85Fall 1.39 0.73 35.44 �0.74 1.76 0.85 39.47 �0.82Winter 1.33 0.91 26.69 �0.36 1.69 1.09 30.30 �0.45
314 A. I. Calvo et al.

tions were registered in summer for both sizes(see Table 1).
High concentrations of soil-related elements(Al, La, Ce, Ba, Ti, Th) are expected in dry sea-sons (summer and fall in our study) as soil par-ticles bearing these elements are produced by theresuspension of surface soil due to winds, andresuspension in turn depends on the moisture ofthe surface soil (Al-Momani et al. 1998; G€uull€uuet al. 1998). Pb, Zn, and Cu are the majorelements linked to traffic emissions; their highwinter concentrations may be due to their accu-mulation in the decreasing boundary layer height.
An interesting result is shown for nickel (Ni)and chromium (Cr): indeed, whatever size weconsider Ni concentrations reach the highestvalues in summer and the lowest ones in winter,while Cr reaches the highest values in warmerseasons (spring and summer) but shows strong
values in winter. In the Toulouse region, Ni isemitted essentially by the combustion of heavyfuel oil which contains traces of this metal andCr may come mainly from foundries (recyclingof lead batteries on the outskirts of Toulouse andother boiler-making activities). Ni and Cr emis-sions of the Midi Pyr�een�eees region are amongthe lowest in France. Toulouse is the prefectureof the Haute Garonne Department, which is oneof the highest emitting of the region (http:==www.citepa.org=emissions=regionale=regions=index_en.htm). Even if the typical seasonal vari-ation of these two compounds cannot be fullyexplained due to lack of high resolved Ni andCr emissions maps, we had to underline the highlevels of these concentrations of our samplings.Dongarr�aa (Dongarr�aa et al. 2007) reported valuesof average Ni and Cr concentrations in differentcities over Europe about ten times lower.
Fig. 2. Seasonal traceelements enrichment factors(EnF) in (a) PM2.5 and(b) PM10
Chemical composition of urban aerosols in Toulouse, France during CAPITOUL experiment 315

3.3.1 Enrichment factors
In this section the influence of the varioussources by calculating enrichment factors (EnF)with reference to local crustal element concentra-tions is described. EnF can be calculated to showthe degree of enrichment of a given element inthe atmosphere compared to the relative abun-dance of that element in crust material and it isdefined as:
EnF ¼ ðCx=CrÞsample=ðCx=CrÞcrust;
where (Cx=Cr)sample is the ratio of concentrationof an element x to a reference element (r) inthe sample and (Cx=Cr)crust is the same ratioin sediment material. Ratios for metal elementsin the sediments of the river Garonne have beenobtained by Martin and Meybeck (1979). Despitethe fact that there is no rule for the referenceelement choice, Si, Al, and Fe are the most com-mon elements used for this purpose. Because ofthe high correlation (range between r¼ 0.86 andr¼ 0.98) found between Fe and Cr, Mn or Ni(link to anthropogenic origin), and because ofthe lack of Si measurements, aluminum was usedas the reference assuming low contributions ofanthropogenic aluminum. The seasonal enrich-ment factors are calculated for each elementand shown in Fig. 2.
In general, enrichment factors higher than 1point towards sources other than crustal dust.Nevertheless, the literature assumes that ele-ments with enrichment factors greater than 10are supposed to be due to other sources ratherthan background contribution (Parekh et al. 1989;Al-Momani et al. 1998). EnF 10 is taken as thethreshold for this study.
If the annual EnFs of PM10 and PM2.5 areobserved, Ni, Cu and Cr show high coefficients,suggesting an anthropogenic origin. EnFs ofthese elements range between approximately 100and 10,000. Pb, Zn and Na appear to be enrichedto a lower extent (10<EnF<100). EnFs between1 and 10 have been found for the rest of theelements (Fe, Ti, Mn, Sr, Ba, La, Ce, Th, Mgand Ca). Ti, La (PM2.5 La is the only value<1), Th and Mg have an EnF very close to 1,thus suggesting in the case of these elements anegligible contribution of anthropogenic sources.
Important seasonal EnFs variations were foundfor Ni, Cr, Fe and Mn, showing a maximum in
spring for all of them in both sizes. The Ni EnF ismore than 10 in all the seasons and a strong de-crease is observed in fall and winter (with valuesof 4.2, 1.8, 14 and 16 for PM10 and 9.4, 7.6, 20and 14 in spring, summer, fall and summer, re-spectively). For Cr, the EnF is more than 10 inspring and summer and only in spring for Fe andMn. The ratio EnFPM2.5=EnFPM10 of metal ele-ments was calculated and it can be seen that it isin spring and summer when the highest ratio isfound for the four elements showing a higherenrichment of fine particles. It denotes that an-thropogenic sources have a higher contribution inthe fine mode.
Concerning the influence of marine sources,annual average of ratios [Cl�]=[Naþ] observedin Toulouse are 0.8 for PM10 and PM2.5, whichare significantly lower than the ratio of 1.8 re-ported for sea water (Seinfeld and Pandis 1998).This typically marine ratio is closer to the winterratio (seasonal ratios: 0.3, 0.3, 0.3, and 1.8 forPM2.5 and 0.5, 0.3, 0.4, and 1.7 for PM10, inspring, summer, fall and winter, respectively).In winter a [Cl�]=[Naþ] ratio close to a typicalmarine ratio can be explained by frequent incom-ings of oceanic air masses over the Toulouse re-gion. A seasonal decrease in this ratio could bedue to the reaction of nitric and sulfuric acid withNaCl particles and the subsequent volatilizationof HCl (Mihalopoulos et al. 1997; Kocak et al.2004; Sciare et al. 2005).
3.3.2 Influence of the sources
The variability of some element concentrationscannot be explained only by crustal or marinesources. In order to identify the contribution ofthe different sources in Toulouse we appliedPrincipal Component Factor Analysis (PCA) andMulti-Linear Regression Analysis (MLRA).
A total of 12 elements were included in thePrincipal Component Analysis so as to definesources that could explain the PM10 fraction an-alyzed (see Table 3). Only elements whose originis known are included in this analysis so that itshould be more precise to define the influentsource. The results show four factors accountingfor more than 80% of the accumulative variance.
The first factor, accounting for 33.89% of thetotal variance, is highly correlated with Pb, Cu,Zn, EC and K and moderately with Al. The
316 A. I. Calvo et al.

source identified is traffic emissions. Pb and EC
are strongly associated with exhaust emissionsfrom petrol and diesel vehicles (Harrison et al.1997; Yatin et al. 2000; Guillaume et al. 2006;Salma and Maenhaut 2006), whereas Cu, Zn andK are attributed to rubber tyres and brake liningabrasion (Garg et al. 2000; Weckwerth 2001;Pakkanen et al. 2003; CE 2004; Salma andMaenhaut 2006; Viana et al. 2006).
The second factor, which explains 25.21% ofthe total variance, correlates with Al, Fe, Mn,Mg, Ca, and Na. This factor may be attributedto a crustal source. The third factor, accountingfor 12.58%, with high loadings in Na and Cl,may be attributed to marine influence. Fe andMn are weakly defined by the fourth and last
factor, which explains 9.20% of the total vari-ance. It is linked to industrial emissions (Gordon1980; Kowalczyk et al. 1982).
Aluminum is present in the first and the secondfactor. Even though the highest Al correlation isobserved in the second factor (corresponding tocrustal source), it is necessary to consider thatthere is probably a part of Al concentration thatis linked to traffic emissions. Al is not emitted bycombustion, but road dust (Wojas and Almquist2007) and particles from rubber tyres thatcontain Al in lower proportion (Salma andMaenhaut 2006) may be re-suspended to theatmosphere simultaneously with emissions fromfuel combustion.
Once the major sources have been identified,the MLRA method is applied to our database of47 samples. MLRA was applied using the 12metal elements and compound concentrationssuch as dependent variables, and absolute factorscores (obtained from PCA) such as independentvariables (Thurston and Spengler 1985; Pio et al.1991). Thus, we try to show the dependence ofeach chemical component on each one of thepreviously identified sources. Table 4 showsthe MLRA results and regression coefficientsstrengthening the validity model. The lowest re-gression coefficient is found for the aluminumvariable (r2¼ 0.555) conferring a greater uncer-tainty to the weight of the different sources in thecase of this element. Normalized Beta coeffi-cients have been estimated from these linear cal-culations providing the relative weight of eachvariable (i.e. sources) for each explained variable(i.e. metal and major elements). The higher theabsolute value of this normalized coefficient, the
Table 4. Multi-linear regression analysis of elemental composition in PM10 in Toulouse
Variable Constant Factor 1 Factor 2 Factor 3 Factor 4 r2
Al 232.00 64.76 82.06 43.11 0.66 0.555Pb 13.26 4.50 �2.28 0.57 �0.54 0.781Cu 15.63 5.86 �0.33 4.08 2.77 0.805Fe 503.48 100.85 154.02 �48.72 201.62 0.805Mn 8.49 1.72 3.67 �1.20 3.86 0.937Zn 23.75 7.58 �1.25 6.70 �4.82 0.675BC 1.95 0.50 �0.27 0.02 �0.14 0.856Mg 0.04 �0.00 0.01 0.00 �0.01 0.919Ca 0.18 0.02 0.03 �0.04 �0.02 0.709Na 0.27 �0.02 0.06 0.05 �0.05 0.891Cl 0.19 �0.03 0.01 0.17 0.05 0.875K 0.06 0.01 0.00 �0.00 �0.01 0.826
Table 3. Factor analysis of elemental compositionpattern in PM10 in Toulouse. Only loadings over j0:40jare given
Variable Factor 1 Factor 2 Factor 3 Factor 4
Al 0.49 0.53Pb 0.81Cu 0.81Fe 0.47 0.62 0.49Mn 0.40 0.73 0.47Zn 0.69BC 0.83Mg 0.85 �0.42Ca 0.56 �0.46Na 0.71 0.46Cl 0.86K 0.84Variance (%) 33.89 25.21 12.57 9.20Source Traffic Crustal Marine Industrialþ
incineration
Chemical composition of urban aerosols in Toulouse, France during CAPITOUL experiment 317

Table 5. Beta coefficients and standard deviation (�SD) based on a 95% confidence interval of elemental compositionin PM10 in Toulouse
Variable Factor 1 Factor 2 Factor 3 Factor 4
Al 0.48 � 0.21 0.53� 0.21 0.20 � 0.21 0.01 � 0.21Pb 0.81� 0.15 �0.35 � 0.15 0.06 � 0.15 �0.05 � 0.15Cu 0.81� 0.14 �0.03 � 0.14 0.34 � 0.14 0.20 � 0.14Fe 0.47 � 0.11 0.62� 0.11 �0.14 � 0.11 0.49� 0.11Mn 0.40 � 0.08 0.73� 0.08 �0.17 � 0.08 0.47� 0.08Zn 0.69� 0.18 �0.10 � 0.18 0.37 � 0.18 �0.23 � 0.18BC 0.83� 0.12 �0.39 � 0.12 0.02 � 0.12 �0.12 � 0.12Mg �0.16 � 0.09 0.85� 0.09 0.03 � 0.09 �0.42 � 0.09Ca 0.35 � 0.17 0.56� 0.17 �0.46� 0.17 �0.26 � 0.17Na �0.23 � 0.10 0.70� 0.10 0.46� 0.10 �0.36 � 0.10Cl �0.27 � 0.11 0.10 � 0.11 0.86� 0.11 0.24 � 0.11K 0.84� 0.13 �0.01 � 0.13 �0.07 � 0.13 �0.33 � 0.13
Fig. 3. Electronic Sweeping Microscope (MEB) pictures: (a) Sample from 5th to 9th April 2004. (b) Spectrum associatedto particle 1. (c) Sample from 22nd–28th February 2005. (d) Spectrum associated to particle 2. 1) Detail of a particlecomposed mainly of iron and manganese. 2) Sulfur, iron, oxygen, and calcium crystal. 3) Particle with a defined formcomposed mainly of sulfur, calcium, and potassium. 4) Lead and sulfur particle. 5) Iron, sulfur, and calcium particle.6) Layer rich in carbon covering both filters
318 A. I. Calvo et al.

stronger the weight of the source in the elementcomposition. A standard deviation based on a95% confidence interval is given for this beta co-efficient. Table 5 shows the most influent sourcesin bold.
This statistical approach reinforces the influ-ence of both vehicular and crustal sources inthe Al concentrations. Cl concentrations in theaerosol are clearly of marine origin. A small con-tribution is attributed to industrial source.
Furthermore, iron in the aerosols may be ofmultiple origins. The major influence is crustalsource, while industrial and vehicular emissionsseem to have the same load in aerosol composi-tion. Analytical Electronic Sweeping Microscope(AESM) pictures have shown the presence of thisnon-crustal Fe (Fig. 3a, c). The associated analyt-ical spectra (Fig. 3b and d) show the presence ofFe plus Mn in the first crystal registered (Fig. 3a),and Fe plus S and Ca in the second one (Fig. 3c).Mn, S and Ca could be of industrial and vehicu-lar origin, respectively. These non-crustal compo-nents are present in the same crystal (Fig. 3d), sowe may also attribute a non-crustal origin to theiron in the aerosol composition.
There are clearly major limitations to the ef-fectiveness of multivariate statistical techniquesin source apportionment of atmospheric aerosolsand their components. This problem becomeseven more complex by the fact that individualsource categories do not constantly emit chemi-cal components or with a constant ratio. Thus,source signatures are temporally variable and thisreal variability in source composition is probablymore important than analytical imprecision as alimit on the ability of multivariate techniques toprovide clear-cut distinctions of sources. Inevita-bly, the multivariate method will be a blunt toolwhich will identify only major categories ratherthan the vast number of diverse contributorysources (Yang 1994; Gleser 1997; Christensenand Sain 2002).
4. Conclusions
This study has provided data on the chemicalcomposition of atmospheric aerosols close tosources related to human activities in Toulouse.PM2.5 and PM10 show a similar inter-seasonaltrend. PM2.5 constitutes a large fraction of PM10,with an average of 0.8� 0.1 of PM10 mass.
Weekly aerosol mass concentrations in Tou-louse are in the range of 4.4–18.0 mg m�3, witha mean of 11.0� 3.6mg m�3 for PM2.5, and 6.5–23.5 mg m�3, with a mean of 13.2� 4.3 mg m�3
for PM10.Winter concentrations of PM2.5 and PM10 are
generally higher than in other seasons becausethe low height of the atmospheric boundary layerin cold temperatures hinders the dispersion ofpollutants. Mass average concentration in thisseason is 13.7 mg m�3 for PM2.5 and 16.7 mg m�3
for PM10. Winter is the season with the highestNO�
3 concentrations: 1.4 mg m�3 and 2.0 mg m�3
for PM2.5 and PM10, respectively. Low ambienttemperature in winter enhances the reaction be-tween gas-phase ammonia and nitric acid to formparticulate-phase ammonium nitrate.
High SO2�4 concentrations were found in sum-
mer with 1.2mg m�3 and 1.5mg m�3, and fall with1.4mg m�3 and 1.7mg m�3 for PM2.5 and PM10,respectively. Higher temperatures and solar inso-lation enhance photochemical activity and causean increase of this anion in these seasons.
On average, carbonaceous species constitutebetween 49% and 75% of the monthly concentra-tion registered, POM concentration being alwayshigher (>51%) than EC concentration for PM2.5and PM10. The highest carbonaceous concentra-tion was found in winter.
The average OC=EC ratios are 2.7� 0.8 and2.7� 0.6 for PM2.5 and PM10, respectively,which is consistent with the ratios found in othercities in the world.
Secondary organic carbon concentrations aresignificantly higher in warm seasons owing tomore favorable conditions for gas=particle con-version, accounting for 59.0% and 65.9% forPM2.5 and 54.1% and 64.5% for PM10 of thetotal OC concentration in spring and summer,respectively. Most of the secondary fraction be-longs to the fine particle mode.
In Toulouse EC and OCsec were found to bestrongly correlated in the warm seasons, whichindicates the fast production of SOC throughphotochemical activity close to the source.
Total annual average metal element concentra-tions are 0.6mg m�3 and 1.2 mg m�3, accountingfor 6.4% and 9.8% of total aerosol concentrationfor PM2.5 and PM10, respectively. Enrichmentfactor analysis shows that Ni, Cu, Cr, Pb, Zn,and Na (10.000<EnFs<10) are enriched by dif-
Chemical composition of urban aerosols in Toulouse, France during CAPITOUL experiment 319

ferent sources, whereas Fe, Ti, Mn, Sr, Ba, La,Ce, Th, Mg, and Ca have their EnFs close to 1,mainly having a crustal origin.
Principal Component Analysis and Multi-Lin-ear Regression Analysis were used to assess thecrustal source as well as the influence of marine,traffic and industrial sources, highlighting thecomplex multiple influence of various sourcesin the Toulouse area.
Future studies will focus on the influence oflocal mesoscale dynamics on atmospheric aero-sol composition. The data included in the IOP
CAPITOUL database will be analyzed consider-ing meteorological data in the city to better un-derstand processes of chemical and size ageingof aerosols.
Acknowledgements
The authors wish to thank Antonio M. Ortın for his help withthe graphs, and Laurent Gomez (Meteo-France), Paulo Laj(LAMP) and Edouard Rey (ORAMIP) for their technical andscientific support during the campaign.
References
Alastuey A, Sanchez de la Campa A, Querol X, de la Rosa J,Plana F, Mantilla E, Viana M, Ruiz CR, Garcıa Dos SantosS (2006) Identification and chemical characterisation ofindustrial PM sources in SW Spain. J Air Waste Manage56: 993–1006
Alfaro-Moreno E, Martinez L, Garcıa-Cuellar C, Bonner JC,Murray JC, Rosas I, Ponce-de-Leon Rosales S, Miranda J,Osornio-Vargas AR (2002) Biological eVects induced invitro by PM10 from three diVerent zones of Mexico City.Environ Health Persp 110: 715–20
Al-Momani IF, Aygun S, Tuncel G (1998) Wet deposition ofmajor ions and trace elements in the eastern Mediterra-nean basin. J Geophys Res 103: 8287–93
Andrews E, Saxena P, Musarra S, Hildemann LM, KoutrakisP, McMurry PH, Olmez I, White WH (2000) Concentra-tion and composition of atmospheric aerosol from the1995 SEAVS experiment and a review of the closurebetween chemical and gravimetric measurements. J AirWaste Manage 50: 648–64
Birmili W, Allen A, Bary F, Harrison R (2006) Trace metalconcentrations and water solubility in size-fractionatedatmospheric particles and influence of road traffic. Envi-ron Sci Technol 14(4): 1144–53
Broecker WS (2000) Abrupt climate change: causal con-straints provided by the paleoclimate record. Earth SciRev 51: 137–54
Castro LM, Pio CA, Harrison RM, Smith DJT (1999)Carbonaceous aerosol in urban and rural European atmo-spheres: estimation of secondary organic carbon concen-trations. Atmos Environ 33: 2771–81
CE (2004) II Position Paper on PM, CAFE Programme,Environment D.G., European Commission, 214 pp
Chazette P, Liousse C (2001) A case study of optical andchemical ground apportionment for urban aerosols inThessaloniki, Atmos Environ 35(14): 2497–506
Chow JC, Watson JG, Pritchett LC, Pierson WR, Frazier CA,Purcell RG (1993) The DRI thermal=optical reflectancecarbon analysis system: description, evaluation and appli-cations in U.S. air quality studies. Atmos Enviro 27A:1185–201
Chow JC, Watson JG, Fujuta EM, Lu Z, Lawson DR (1994)Temporal and spatial variations of PM2.5 and PM10aerosol in the southern California air quality study. AtmosEnviron 28: 2061–80
Chow JC, Watson JG, Lu Z, Lowenthal DH, Frazier CA,Solomon PA, Thuillier RH, Magliano K (1996) Descrip-tive analysis of PM2.5 and PM10 at regionally rep-resentative locations during SJVAQS=AUSPEX. AtmosEnviron 30: 2079–112
Chow JC, Watson JG, Crow D, Lowenthal DH, Merrifield T(2001) Comparison of IMPROVE and NIOSH carbonmeasurements. Aerosol Sci Technol 34(1): 23–34
Chow JC, Watson JG, Chen L-WA, Arnott WP, Moosm€uullerH, Fung KK (2004) Equivalence of elemental carbon bythermal=optical reflectance and transmittance with differ-ent temperature protocols. Environ Sci Technol 38(16):4414–22
Christensen WF, Sain SR (2002) Accounting for dependencein a flexible multivariate receptor model. Technometrics44: 328–37
Chu LC, Macias ES (1981) Carbonaceous urban aerosol –primary or secondary? In: Macias ES, Hopke PK(eds) Atmospheric aerosol: source=air quality relation-ship. American Chemical Society, Washington, DC,pp. 251–68
Chu SH (2004) PM2.5 episodes as observed in the speciationtrends network. Atmos Environ 38: 5237–46
Chu SH, Paisie JW, Jang BWL (2004) PM data analysis – acomparison of two urban areas: Fresno and Atlanta.Atmos Environ 38: 3155–64
Cousin F, Liousse C, Cachier H, Bessagnet B, Guillaume B,Rosset R (2005) Aerosol modelling and validation duringEscompte 2001. Atmos Environ 39(8): 1539–50
Crespı SN, Artı~nnano B, Cabal H (1995) Synoptic classifica-tion of the mixed-layer height evolution. J Appl Meteorol34(7): 1668–77
Dessens J, Van Dinh P (1990) Frequent Saharan dust out-breaks north of the Pyrenees: a sign of climatic change?Weather 45: 327–33
DIRSO (Direction Interr�eegionale des Routes Sud-Ouest)CIGT (Cellule d’Ing�eenierie et de Gestion du Trafic),Vehicular counts performed on major routes in Toulouseover 2005
Dockery D, Pope CA, Xiping X, Spengler J, Ware J, Fay M,Ferris B, Spiezer F (1993) An association between airpollution and mortality in six US cities. N Engl J Med329(24): 1753–59
Dongarr�aa G, Manno E, Varrica D, Vultaggio M (2007) Masslevels, crustal component and trace elements in PM10 inPalermo, Italy. Atmos Environ 41(36): 7977–86
320 A. I. Calvo et al.
Essenwanger OM (1986) Elements of statistical analysis.Amsterdam, Elsevier, 424 pp
Fraser MP, Cass GR, Simoneit BRT (1999) Particulateorganic compounds emitted from motor vehicle ex-haust and in the urban atmosphere. Atmos Environ 33:2715–24
Fraser MP, Yue ZW, Tropp RJ, Kohl SD, Chow JC (2002)Molecular composition of organic fine particulate matterin Houston, TX. Atmos Environ 36: 5751–8
Garg BD, Cadle SH, Mulawa PA, Groblicki PJ, Laroo Ch,Parr GA (2000) Brake wear particulate matter emissions.Environ Sci Technol 34: 4463–9
Gatebe CK, Kinyua AM, Mangala MJ, Kwach R, NjauLN, Mukolwe EA, Maina DM (1996) Determinationof suspended particulates matter of major significanceto human health using nuclear techniques in Kenya. JRadianal Nuclear Chem 203(1)
Gleser LJ (1997) Some thoughts on chemical mass balancemodels. Chemometr Intell Lab 37: 15–22
Gordon GE (1980) Receptor models. Environ Sci Technol14: 792–800
Guillaume B, Liousse C (2006a) Development of carbona-ceous aerosol emission inventories from fossil fuel overEurope at continental scale with focus on traffic at na-tional and regional scales. ADEME (French Ministeryof Environment and Sustainable Development) Report.Project 0262050
Guillaume B, Liousse C (2006b) Development of carbona-ceous aerosol emission inventories from fossil fuel overEurope at continental scale with focus on traffic at na-tional and regional scales. J Geophys Res (Submitted)(also: 8th conference on carbonaceous aerosol, Vienna,2004)
Guillaume B, Liousse C, Rosset R, Cachier H, VanVelthoven P, Bessagnet B, Poisson N (2006) ORISAM-TM4: a new global sectional multi-component aerosolmodel including SOA formation – Focus on carbonaceousEC and OC aerosols. Tellus B (accepted)
G€uull€uu G, Olmez I, Aygun S, Tuncel G (1998) Atmospherictrace element concentrations over the eastern Mediterra-nean sea: factors affecting temporal variability. J GeophysRes 103: 21943–5
Hamilton RS, Mansfield TA (1991) Airborne particulateelemental carbon: its source, transport and contribu-tion to dark smoke and soiling. Atmos Environ 25A:715–23
Harrison RM, Yin J (2000) Particulate matter in the atmo-sphere: which particle properties are important for itseffects on health? Sci Total Environ 249: 85–101
Harrison RM, Smith DJT, Pio CA, Castro LM (1997)Comparative receptor modeling study of airborne par-ticulate pollutants in Birmingham (United Kingdom),Coimbra (Portugal) and Lahore (Pakistan). Atmos Envi-ron 31(20): 3309–21
Hildermann LM, Markowski GR, Cass GR (1991) Chemicalcomposition of emissions from urban sources of fineorganic aerosol. Environ Sci Technol 25: 744–59
Ho KF, Lee SC, Yu JC, Zou SC, Fung K (2002) Carbona-ceous characteristics of atmospheric particulate matter inHong Kong. Sci Total Environ 300: 59–67
Hobbs PV, Radke LF, Lyons JH, Ferek RJ, Coffman DJ,Casadevall TJ (1991) Airborne measurements of particleand gas emissions from the 1990 volcanic eruptions ofMount Redoubt. J Geophys Res 96(D10): 18735–52
Huang X-F, He L-Y, Hu M, Zhang Y-H (2006) Annualvariation of particulate organic compounds in PM2.5 inthe urban atmosphere of Beijing. Atmos Environ 40:2449–58
Husar RB, Prospero JM, Stowe LL (1997) Characterisationof tropospheric aerosols over the oceans with the NOAAadvanced very high resolution radiometer optical thick-ness operational product. J Geophys Res 102: 16889–909
IPCC (2001) Climate change 2001: The scientific basis.Aerosols, their direct and indirect effects. Contributionof Working Group I to the Third Assessment Reportof the Intergovernmental Panel on Climate Change(IPCC). Cambridge University Press, Cambridge, England(Chapter 5)
Johnson RL, Shah JJ, Cary RA, Huntzicker JJ (1981) Anautomated thermal-optical method for the analysis ofcarbonaceous aerosol. In: Macias ES, Hopke PK (eds)Atmospheric aerosol: source=air quality relationship.American Chemical Society, Washington, DC, pp. 223–33
Junker C, Liousse C (2006) A global emission inventory ofcarbonaceous aerosol from historic records of fossil fueland biofuel consumption for the period 1860–1997.Atmos Chem Phys Discuss 6: 4897–927
Karar K, Gupta AK (2006) Seasonal variations and chemicalcharacterization of ambient PM10 at residential and in-dustrial sites of an urban region of Kolkata (Calcutta),India. Atmos Res 81: 36–53
Kim YJ, Kim KW, Oh SJ (2001) Seasonal characteristics ofhaze observed by continuous visibility monitoring in theurban atmosphere of Kwangju, Korea. Environ MonitAssess 70: 35–46
Kim YP, Lee JH, Basiuk NJ, Kim JY, Shim SG, KangCH (1998) Summertime characteristics of aerosol com-position at Cheju Island, Korea. Atmos Environ 32:3905–15
Koc�ak M, Kubilay N, Mihalopoulos N (2004) Ionic compo-sition of lower tropospheric aerosols at a North easternMediterranean site: implications regarding sources andlong range transport. Atmos Environ 38: 2067–77
Koltay E, Rajta I, Morales JR, Borb�eely-Kiss I, Kiss �AAZ(1999) Characterization of individual aerosol particlesfrom the eruption of Lonquimay volcano, Chile. NuclInstr Meth B150: 375–83
Kowalczyk GS, Gordon GE, Rheingrover SW (1982)Identification of atmospheric particulate sources inWashington, DC, using chemical element balances.Environ Sci Technol 16: 79–90
Lary DJ, Lee AM, Toumi R, Newchurch MJ, Pirre M,Renard JB (1997) Carbon aerosols and atmospheric pho-tochemistry. J Geophys Res 102: 3671–82
Legrand M, Mayewski P (1997) Glaciochemistry of polar icecores: A review. Rev Geophys 35: 219–43
Lin C, Chen S, Huang K (2005) Characteristics of metalsin nano=ultrafine=fine=coarse particles collected besidea heavily trafficked road. Environ Sci Technol 39(21):8113–22
Chemical composition of urban aerosols in Toulouse, France during CAPITOUL experiment 321

Lin JJ, Tai H-S (2001) Concentrations and distributions ofcarbonaceous species in ambient particles in KaohsiungCity, Taiwan. Atmos Environ 35: 2627–36
Linak WP, Wendt JOL (1993) Toxic metal emissions fromincineration: mechanisms and control. Prog EnergyCombust Sci 19(2): 145–85
Liousse C, Penner JE, Chuang C, Walton JJ, Eddleman H(1996) A global three-dimensional model study of carbo-naceous aerosols. J Geophys Res 100: 19411–32
Liousse C, Andreae MO, Artaxo P, Barbosa P, Cachier H,Gr�eegoire JM, Hobbs P, Lavou�ee D, Mouillot F, Penner J,Scholes M, Schultz MG (2004) Deriving global quantita-tive estimates for spatial and temporal distributions ofbiomass burning emissions. In: Granier C, Artaxo P,Reeves C (eds) Emissions of atmospheric trace compounds.Kluwer Academic Publishers, Dordrecht, pp. 77–120
Liousse C, Michel C, Bessagnet B, Cachier H, Rosset R(2005) 0-D-Modelling of carbonaceous aerosols overgreater paris focusing on the organic particle formation.J Atmos Chem 51: 207–21
Liu Y, Daum PH (2002) Anthropogenic aerosols: indirectwarming effect from dispersion forcing. Nature 419:580–1
Martin JM, Meybeck N (1979) Elemental mass-balance ofmaterial carried by major world rivers. Mar Chem 7:173–206
Maynard AD, Maynard RL (2002) A derived associationbetween ambient aerosol surface area and excess mor-tality using historic time series data. Atmos Environ 36:5561–7
Mihalopoulos N, Stephanou E, Kanakidou M, Pilitsidis S,Bousquet P (1997) Tropospheric aerosol ionic composi-tion in the Eastern Mediterranean region. Tellus Series B49: 314–26
Moreno T, Querol X, Alastuey A, Viana M, Gibbons W(2005) Exotic dust incursions into central Spain: implica-tions for legislative controls on atmospheric particulates.Atmos Environ 39: 6109–20
Nriagu JO (1988) A silent epidemic of environmental poi-soning. Environ Pollution 50: 139–61
Nriagu JO, Pacyna JM (1988) Quantitative assessment ofworldwide contamination of air, water and soils by tracemetals. Nature 320: 735–8
ORAMIP (Organisme R�eegional de l’Air en Midi Pyr�een�eees)(2005) 15 ans d’�eevolution du dioxide d’azote dansl’agglom�eeration toulousaine (http:==www.oramip.org=content=oramip=LES_ETUDES=)
Pacyna JM (1986) In: Nriagu JO, Davidson CI (eds) Toxicmetals in the atmosphere. Wiley, New York
Pakkanen TA, Kerminen V-M, Loukkola K, Hillamo RE,Aarnio P, Koskentalo T, Maenhaut W (2003) Size distri-bution of mass and chemical components in street-leveland rooftop PM1 particles in Helsinki. Atmos Environ 37:1673–90
Pandis SN, Harley RA, Cass GR, Seinfeld JH (1992)Secondary organic aerosol formation and transport. AtmosEnviron 26A: 2269–82
Parekh PP, Ghauri, B, Husain L (1989) Identification ofpollution sources of anomalously enriched elements.Atmos Environ 23(7): 435–42
Park SS, Kim YJ (2004) PM2.5 particles and size-segregatedionic species measured during fall season in three urbansites in Korea. Atmos Environ 38: 1459–71
Park SS, Kim YJ, Fung K (2002) PM2.5 carbon measure-ments in two urban areas: Seoul and Kwangju, Korea.Atmos Environ 36: 1287–97
Pio CA, Santos IM, Anacleto TD, Nunes TV, Leal RM(1991) Particulate and gaseous air pollutant levels at thePortuguese west coast. Atmos Environ 25: 669–80
Prospero JM, Ginoux P, Torres O, Nicholson SE, Gill TE(2002) Environmental characterization of global sourcesof atmospheric soil dust identified with the nimbus 7 totalozone mapping spectrometer (TOMS) absorbing aerosolproduct. Rev Geophys 40(1): 1002, DOI: 10.1029=2000RE000095
Querol X, Alastuey A, Rosa J, Sanchez de la Campa A, PlanaF, Ruiz C (2002) Source apportionment analysis of atmo-spheric particulates in an industrialised urban site insouthwestern Spain. Atmos Environ 36: 3113–25
Ravishankara AR (1997) Heterogeneous and multiphasechemistry in the troposphere. Science 276: 1058–65
Rogge WF, Mazurek MA, Hildemann LM, Cass GR (1993)Quantification of urban organic aerosols at a molecularlevel: identification, abundance and seasonal variation.Atmos Environ 27: 1309–30
Salma I, Maenhaut W (2006) Changes in elemental compo-sition and mass of atmospheric aerosol pollution between1996 and 2002 in a Central European city. Environ Pollut143: 479–88
Schwartz J, Dockery DW (1992) Increased mortality inPhiladelphia associated with daily air pollution concen-trations. Am Rev Respir Dis 145: 600–4
Schwela D (2000) Air pollution and health in the urbanareas. Rev Environ Health 15(1–2): 13–42
Sciare J, Oikonomou K, Cachier H, Mihalopoulos N,Andreae MO, Maenhaut W, Sarda-Est�eeve R (2005) Aero-sol mass closure and reconstruction of the light scatter-ing coefficient over the Eastern Mediterranean Sea duringthe MINOS campaign. Atmos Chem Phys 5: 2253–65
Seinfeld JH, Pandis SN (1998) Atmospheric chemistry andphysics: from air pollution to climate change. John Wiley& Sons Inc., New York, 1360 pp
Sneyers R (1990) On the Statistical Analysis of Series ofObservations WMO Tech Note 143, Geneva, 192 pp
Spurny KR (1998) On the physics chemistry and toxicologyof ultrafine anthropogenic atmospheric aerosols (UAAA):new advances. Toxicol Lett 97: 253–61
Stelson AW, Seinfeld JH (1982) Relative humidity and tem-perature dependence of the ammonium nitrate dissocia-tion constant. Atmos Environ 16: 983–92
Strader R, Lurmann F, Pandis SN (1999) Evaluation ofsecondary organic aerosols formation in winter. AtmosEnviron 33: 4849–63
Thurston GD, Spengler JD (1985) A quantitative assessmentof source contribution to inhalable particulate matter inmetropolitan Boston. Atmos Environ 19: 9–25
Turpin BJ, Huntzicker JJ (1991) Secondary formation oforganic aerosol in the Los Angeles Basin: a descriptiveanalysis of organic and elemental carbon concentrations.Atmos Environ 29: 3527–44
322 A. I. Calvo et al.

Turpin BJ, Huntzicker JJ (1995) Identification of secondaryaerosol episodes and quantification of primary and sec-ondary organic aerosol concentrations during SCAQS.Atmos Environ 29: 3527–44
Turpin BJ, Cary RA, Huntzicker JJ (1990a) An in-situ, time-resolved analyzed for aerosol organic and elementalcarbon. Aerosol Sci Technol 12: 161–71
Turpin BJ, Huntzicker JJ, Adams KM (1990b) Intercompar-ison of photoacoustic and thermal-optical methods for themeasurement of atmospheric elemental carbon. AtmosEnviron 24(7): 1831–35
Turpin BJ, Saxena P, Andrews E (2000) Measuring andsimulating particle organics in the atmosphere: problemsand prospects. Atmos Environ 34: 2983–3013
Viana M, Querol X, Alastuey A, Cuevas E, Rodrıguez S(2002) Influence of African dust on the levels of atmo-spheric particulates in the Canary Islands air qualitynetwork. Atmos Environ 36: 5861–75
Viana M, Querol X, Alastuey A, Gangoiti G, Men�eendez M(2003) PM levels in the Basque Country (Northern Spain):analysis of a 5 year data record and interpretation ofseasonal variations. Atmos Environ 37: 2879–91
Viana M, Querol X, Alastuey A (2006) Chemical character-isation of PM episodes in NE Spain. Chemosphere 62:947–56
Viidanoja J, Sillanpaa M, Laakia J, Kerminen VM, HillamoR, Aarnio P, Koskentalo T (2002) Organic and blackcarbon in PM2.5 and PM10: 1 year of data from an urbansite in Helsinki, Finland. Atmos Environ 36: 3183–93
Voutsa D, Samara C, Kouimtzis T, Ochsenk€uuhn K (2002)Elemental composition of airborne particulate matter inthe multi-impacted urban area of Thessaloniki, Greece.Atmos Environ 36: 4453–62
Wang X, Boselli X, D’Avino L, Pisani G, Spinelli N,Amodeo A, Chaikovsky A, Wiegner M, Nickovic S,
Papayannis A, Perrone MR, Rizi V, Sauvage L, Stohl A(2007) Volcanic dust characterization by EARLINETduring Etna’s eruptions in 2001–02. Atmos Environ,doi: 10.1016=j.atmosenv.2007.10.020
Watson JG (2002) Visibility: science and regulation. J AirWaste Manage 52: 628–713
Weckwerth G (2001) Verification of traffic emitted aerosolcomponents in the ambient air of Cologne (Germany).Atmos Environ 35: 5525–36
Wojas B, Almquist C (2007) Mass concentrations and metalsspeciation of PM2.5, PM10, and total suspended solids inOxford, Ohio and comparison with those from metropoli-tan sites in the Greater Cincinnati region. Atmos Environ41(39): 9064–78
Wolf ME, Hidy GM (1997) Aerosols and climate: Anthro-pogenic emissions and trends for 50 years. J Geophys Res102: 11103–21
Yang H (1994) Confirmatory factor analysis and its ap-plication to receptor modeling. Unpublished Ph.D.dissertation, University of Pittsburgh, Department ofMathematics and Statistics
Yatin M, Tuncel S, Aras NK, Olmez I, Aygun S, Tuncel G(2000) Atmospheric trace elements in Ankara, Turkey: 1.factors affecting chemical composition of fine particles.Atmos Environ 34: 1305–18
Ye B, Ji X, Yang H, Yao X, Chan CK, Cadle SH, Chan T,Mulawa PA (2003) Concentration and chemical compo-sition of PM2.5 in Shanghai for a 1 yr period. AtmosEnviron 37: 499–510
Yu S, Dennis RL, Bhave PV, Eder BK (2004) Prim-ary and secondary organic aerosols over the UnitedStates: estimates on the basis of observed organic car-bon (OC) and elemental carbon (EC), and air qualitymodelled primary OC=EC ratios. Atmos Environ 38:5257–68
Chemical composition of urban aerosols in Toulouse, France during CAPITOUL experiment 323
Copyright © 2022 FDOKUMEN