Differences in Fatty Acid Profile and Physical-Chemical ... - MDPI
Upload
khangminh22Category
view
1download
0
TECHNICAL BULLETIN NO, 833 • October 1942
Chemical and Physical Properties of
Some of the Important Alluvial Soils
of the Mississippi Drainage Basin
By
R. S. HOLMES, Associate Chemist Division of Soil and Fertilizer Investigations
and
W. E. HEARN, Senior Soil Scientist Division of Soil Survey
Bureau of Plant Industry
UNITED STATES DEPARTMENT OF AGRICULTURE, WASHINGTON, D. C.
For sale by the Superintendent of Documents, Washington, D. G. • Price 20 cents

Technical Bulletin No. 833 • October 1942
Chemical and Physical Properties of Some of the Important Alluvial Soils of the
Mississippi Drainage Basin ^ By R. S. HOLMES, associate chemist, Division of Soil and Fertilizer Investigations,
and W. E. HEARN, senior soil scientist, Division of Soil Survey, Bureau of Plant Industry
CONTENTS
Page Introduction 1 Description of alluvial soil samples from the
Mississippi River and its tributaries . 4 Mississippi River lowlands 6 Western tributaries 9 Eastern tributaries 12
Methods of laboratory examination 14 Analytical results 14
Mississippi River lowlands 15 Mechanical analyses of the alluvial
soils 15 Chemical analyses of the alluvial soils. 20 Chemical analyses of the colloids 26 Derived data for the colloids 31
Western tributaries 33 Mechanical analyses of the alluvial
soils 33 Chemical analyses of the alluvial
soils 38 Chemical analyses of the colloids 45 Derived data for the colloids 51
Analytical results—Continued Page Eastern tributaries 54
Mechanical analyses of the alluvial soils 56
Chemical analyses of the alluvial soils 56
Chemical analyses of the colloids 58 Derived data for the colloids 62
Base content in the nonclay materials in the alluvial soils of the Mississippi River and its tributaries 65
Eastern tributaries 67 Mississippi River lowlands 67 Western tributaries 68 Comparison of base content in the
nonclay and colloidal materials 69 Mineralogical composition of the colloids. 70
General discussion 71 Summary and conclusions 77 Literature cited 79
INTRODUCTION
The enormous volume of analytical data on soils and soil colloids that accumulated in the former Bureau of Soils and the Bureau of Chemistry and Soils was concerned almost exclusively with mature soils, or at least those developed from materials that have been in place for a long time. A great deal of work has been done on soils developed from glacial, lacustrine, loess, and other transported ma- terials. In recent years many of these data have been accumulated especially for the purpose of ascertaining the chemical characteristics of soils in their relation to the system of field classification of soils developed by the late C. F. Marbut and his coworkers (27)} Therefore, it seemed very worth while to undertake a study of alluvial soils ^
1 Submitted for publication March 1942. 2 Italic numbers in parentheses refer to Literature Cited, p. 79. 3 Alluvial soils—A zonal group of soils, developed from transported and relatively recently deposited
material (alluvium) characterized by a weak modification (or none) of the original material by soil-forming processes {36, p. 1162).
467217°—42 1

2 TECHNICAL BULLETIN 83 3, U. S. DEFT. OF AGRICULTURE
along similar lines in order to determine the effects of transferring and mixing material from various residual sources to the flood plains of rivers. For the purpose of this study the delta area of the Mississippi River seemed admirably suited as its parent material manifestly is transported from widely different sources. The scope of the work, after being started, was widened to include one or more samples taken from the alluvial plains of many of the larger tributaries to the Mis- sissippi. These extensions furnish additional data concerning the character of the alluvium derived from various areas. It is important at the present time to make available for general use in any intensive food-production campaign these data concerning the general fer- tility of alluvial soils, the major elements of which they are composed, and their productivity and durability in comparison with that of residual soils.
The great importance and increased potential value of the alluvial soils of the Mississippi River and its tributaries become apparent upon reviewing the part that such soils have played in the economic history of mankind from the dawn of civilization. Many factors have con- tributed to the importance of this widely distributed group of soils. Among these are the proximity of the soils to water transportation and water supply, to forests for fuel and construction, and to fish and game for food; the productivity of the soil and the ease of cultiva- tion; and the fact that in arid or semiarid regions a large part of the alluvial soil is easily adapted to irrigation. Many of the earlier civi- lizations were developed upon alluvial soils of arid or semiarid regions.
Much of the wealth of Babylonia was derived from the alluvial soils of the Tigris and Euphrates Rivers along which the nation was founded several thousand years before Christ. The Euphrates flowed through the very center of Babylon, the fortress and city marking the height of the development of the nation in magnitude and in grandeur. The ancient people of Babylon appreciated the value of their alluvial soils, expending much of the wealth derived from them in building a vast system of irrigation which won for the country the title of ^^ granary of the world.'^ After the Mongol invasions of the thirteenth and fourteenth centuries and the Turkish conquest of 1516, which destroyed the irrigation works, this wealth, culture, and agricultural practice gradually declined. Until recent years this potential agri- cultural wealth remained in a state of relative chaos. Even the forested parts of the drainage areas of the Tigris and Euphrates were allowed to depreciate to the point of utter destruction. With the construction, in 1918, of the Hindie barrage and canal system, »300,000 acres of the land were restored to agriculture (24-). The achievement of the Babylonians, the character of their soils, and the recent con- structive interest of the Turks and the British in the restoration of agriculture are reviewed by Whitney (4^ ) •
The importance of alluvial soils to Egypt since ancient times and the annual enrichment of the silt by means of irrigation from the Nile are too well known to be repeated here. But the more recent effort to bring greater areas of this very productive soil under cultivation is worthy of note. The Aswan Dam, constructed at the First Cataract on the Nile, backs the water up the river for a distance of 225 miles to Wadi-Halfa, serving to hold back more than 5,000,000 cubic meters of water. This stored water has increased the cultivable land of Egypt 50 percent. Egypt owes to natural irrigation seven million acres of

ALLUVIAL SOILS OF THE MISSISSIPPI BASIN 3
land that produce two or three crops per year. Since 1925, the Sennar Dam on the Blue Nile, 200 miles above its union with the White Nile, now makes possible the irrigation, by a superb canal system, of an additional 5,000,000 acres of delta land that lie between the Blue and White Niles in Anglo-Egyptian Sudan. This area is nearly as large as the whole cultivated land of Egypt (26).
The diverse alluvial soils of China and their extensive utilization deserve mention. The alluvial soils of China, together with river terraces and the combined deltas of the Hwang Ho (Yellow River), Hwai Ho, and Yangtze Kiang, constitute the most important agri- cultural soils in China. These soils furnish sustenance to the greater part of China's population of more than 400,000,000 inhabitants. The river soils of China, like those of the drainage area of the Missis- sippi River in the United States, are extremely diversified. Thorp reports (35) that the alluvial soils of north China are calcareous, many of them saline. This is especially true of the Yellow River alluvium. There is little calcareous alluvial soil on the Yangtze River. In central and in south China, where the rainfall is heavier and the temperature higher than in north China, the alluvial soils are non- calcareous, and many of them are acid. In these soils profile develop- ment is in evidence. Incipient podzolization has taken place in many of the alluvial rice-paddy soils. This podzolization process is strongest and most clear-cut in its development upon the material that has been transported from the acid soils of the hills.
Despite the importance of alluvial soils to the past and present peoples of the earth, there has been no systematic investigation of the chemical composition of these soils in the United States from the standpoint of their classification and genesis. The reason is obvious: Most of the investigations of soils for the purpose of studying their genesis and morphological development have included those developed from certain geological material weathered under known climatic conditions. As alluvial soils are young, as many are composed of rather diversified material transported from different sources, and as most of them frequently receive additional fresh material, their chemical composition has consequently been of little significance in the study of continental soil types. Thorp (35) gives the com- plete chemical composition of the soils and the major constituents of their colloids for four profiles of alluvial soils of China. Rob- inson and Holmes (31) report the chemical analysis of both soils and colloids for the following soil series: Huntington, from the Potomac River in Montgomery County, Md.; Sharkey, from the Mississippi River in Issaquena County, Miss. ; and the Wabash, from the Missouri River in Nemaha County, Nebr. In 1880, Hilgard reported the com- position, by acid digestion, of certain alluvial soils from the Missis- sippi, Arkansas, Red, White, and Ouachita Rivers (20).
The plan of work of the present investigation involved the collec- tion of profiles of soils representative of the larger areas of alluvial soils in the Mississippi River delta and in the flood plains of tribu- taries sufficiently far from the mouths of the various streams so as not to be influenced by the alluvial materials from sources other than the stream itself. This collection was made by scientists of the Division of Soil Survey.
The samples so collected are described by the various collectors. The samples were all subjected to examination by mechanical analy-

4 TECHNICAL BULLETIN 8 3 3, U. S. DEPT. OF AGRICULTURE
sis and by chemical analysis of the soils and of their colloids. Specia examinations were made on some samples, as reported in the following pages.
FIGURE 1.— Map showing approximate location of soil profiles used in the present investigation of soils of the Mississippi River drainage basin.
DESCRIPTION OF ALLUVIAL SOIL SAMPLES FROM THE MISSISSIPPI RIVER AND ITS TRIBUTARIES
As the alluvial soil in each of these river basins is derived from extensive areas of diverse geological material, special effort was made to obtain samples representing the dominant soil of each region. To accomphsh this the samples were taken fairly close to the stream, where the river had not recently changed its course, over extensive areas of first-bottom land. The approximate location of the soil pro- files ^ used in the present investigation is given on the map (fig. 1), and the descriptions are as submitted by the collectors.
4 In this bulletin the term profile (36) refers to both the soils that have been slightly altered by soil-forming processes and to the geological section of the material.

ALLUVIAL SOILS OF THE MISSISSIPPI BASIN
Key to locations of soil profiles indicated by number on map figure 1.
MISSISSIPPI RIVER LOWLANDS
Map No.
Lab. No. Location
C2972-C2977 C1896-C1898 C3264-C3266 C3279-C3281 C1893-C1895
C1890-C1892 C1886-C1889
C1915-C1921 C3261-C3263
C3270-C3272
C1922-C1924
C2106-C2108 C5316 C5315
C4417-C4418
1 mile south of New Albin, Allamakee County, Iowa. 8 miles northwest of Cairo, 1 mile east of Mississippi River. 18y2 miles northeast of Forrest City, St, Francis County, Ark. 6 miles northeast of Lake Village, Chicot County, Ark. 5 miles northwest of Yazoo City, 2 miles west of Yazoo River, Yazoo County,
Miss. 5 H miles west of Rolling Fork, Sharkey County, Miss. 6 miles south of Onward, west side of U. S. Highway No. 61, Sharkey County,
Miss. H mile north of Onward, Sharkey County, Miss. 18 miles north of Baton Rouge, 4 miles west of Mississippi River, Pointe Coupée
Parish, La. 43^ miles south of Gonzales, 2 miles west of Mississippi River, Ascension Parish,
La. 1 mile south of Vacherie and y2 mile west of Mississippi River, St. James Parish,
La. 6 miles southeast of Houma, Terrebonne Parish, La. Burrwood, La., out in the river one-third distance from left bank, 3 miles southeast of southwest pass, in Gulf at lat. 28°54' N. long. 89°23' W. Out in Gulf of Mexico, each near the point lat. 26°0' N., long. 85°52' W.
WESTERN TRIBUTARIES TO THE MISSISSIPPI RIVER
C2999-C3001 C3002-C3007 C3008-C3013 C3014-C3017 C3726-C3729 C2994-C2997 C2981-C2983
C2881-C2883 C3267-C3269 C3273-C3275 C3282-C3284 C3276-C3278
Milk River, 3 miles northwest of Nashua, Valley County, Mont. Missouri River, J^ mile northeast of Fort Peck, Valley County, Mont. Yellowstone River, 1 mile southeast of Sidney, west side of river, Sidney, Mont. Missouri River, 2 miles north of Mobridge, Walworth County, S. Dak. Platte River, 1 mile southwest of Maxwell, Lincoln County, Nebr. Arkansas River, 3 miles east of Fort Dodge, Ford County, Kans, Verdigris River on State Highway 51, 7 miles west of Wagoner, Wagoner County,
Okla. Arkansas River, 1 mile south of Van Buren, Crawford County, Ark, White River, 1 mile northeast of De Vails Bluff, Prairie County, Ark. Arkansas River, 2 miles northeast of Woodson, Pulaski County, Ark. Ouachita River, 9 miles southwest of Bastrop, Morehouse Parish, La. Red River, 2 miles southeast of Alexandria, Rapides Parish, La.
EASTERN TRIBUTARIES TO THE MISSISSIPPI RIVER
C1899-C1901
C1902-C1904
C1905-C1907
C1908-C1910 C1911-C1913 C1882-C1885
C1914
Ohio River, 3 miles northeast of Golconda, 111., in Livingston County, Ky., east side of Ohio River, on Kentucky soil.
Cumberland River, 23^ miles south of Smithland, Livingston County, on south side of river.
Tennessee River, 10 miles northwest of Waverly, 200 feet from east side of river, Humphreys County, Tenn.
Duck River, 7 miles northwest of Columbia, Maury County, Tenn. Clinch River, Grainger County, Tenn., intersection of U, S, No. 25 and river. Big Black River, 14 miles southeast of Vicksburg, Warren County, Miss. Loess material 3 miles northeast of Yazoo City, Yazoo County, Miss.

MISSISSIPPI RIVER LOWLANDS
WABASH SILT LOAM
COLLECTOR.—T. D. Rice. LOCATION.—1 mile south of New Albin, AUamakee County, Iowa. DESCRIPTION.—Cover of blue grass; open forest of elm, maple, birch,
and ash. Flat area of first bottom; water struck at 90 inches be- low surface. No tributaries of any size enter the Mississippi near this location.
C2972, 0 to 10 inches. Dark-brown, heavy silt loam. C2973, 10 to 25 inches. Black, silty clay loam with faint brown stains. C2974, 28 to 42 inches. Gray, fine sandy loam with lumps or pockets of clay. C2975, 44 to 62 inches. Black silty clay. C2976, 68 to 78 inches. Gray clay loam. C2977, 80 to 94 inches. Dark-bluish, faintly stained silty clay.
RILEY SILT LOAM
COLLECTORS.—^W. E. Hearn and R. S. Holmes. LOCATION.—8 miles northwest of Cairo, 1 mile east of the Mississippi
River, from an area locally known as Dogtooth Bend, Alexander County, 111.
DESCRIPTION.—Gently undulated first bottom above river level. The area of bottom land at this point is rather extensive though not uniform in texture or color. Oak, hickory, maple, and birch vege- tation.
C1896, 0 to 12 inches. Dark-gray silt loam. C1897, 16 to 36 inches. Grayish-brown fine sandy loam. C1898, 40 to 68 inches. Dark-gray silty clay.
PANTHER^ CLAY
COLLECTOR.—W. T. CARTER. LOCATION.—18K miles northeast of Forrest City, St. Francis County,
Ark. DESCRIPTION.—The area of soil is flat, poorly drained Mississippi
alluvium, used chiefly for cotton where drainage has been provided largely by ditching.
C3264, 0 to 8 inches. Dark-gray clay faintly mottled with brown. C3265, 8 to 20 inches. Gray, waxy silty clay with splotches of yellowish brown. C3266, 20 to 44 inches. Light-gray clay with yellowish-brown spots.
SHARKEY CLAY
COLLECTOR.—^W. T. Carter. LOCATION.—6 miles northeast of Lake Village, Chicot County, Ark. DESCRIPTION.—This soil occupies flat, poorly drained areas, heavily
timbered with species of oak and other hardwood trees. In places drainage, though slow, is adequate for cultivation, and cotton is grown extensively.
C3279, 0 to 8 inches. Dark-gray waxy clay. C3280, 8 to 20 inches. Gray silty clay with rust-brown splotches. C3281, 20 to 50 inches. Bluish-gray clay with rust-brown spots.
5 Tentative name. See p. 17.

ALLCVIAL SOILS OF THE MISSISSIPPI BASIN 7
YAZGO SILTY CLAY LOAM
COLLECTORS.—W. E. Hearn and R. S. Holmes. LOCATION.—5 miles northwest of Yazoo City, 2 miles west of Yazoo
River, Yazoo County, Miss. DESCRIPTION.—This soil is extensive in area; dominantly level,
smooth surface; does not overflow frequently. The larger part of the area is under cultivation to cotton, corn, and leguminous crops.
C1893, 0 to 6 inches. Light-brown or grayish-brown silty clay loam. C1894, 8 to 24 inches. Bluish-gray or dark-gray silty clay, mottled with rust
brown. C1895, 24 to 68 inches. Light-gray clay, mottled with rust brown.
SHARKEY CLAY
COLLECTORS.—W. E. Hearn and R. S. Holmes. LOCATION.—5K miles west of Rolling Fork, Sharkey County, Miss. DESCRIPTION.—This area of Sharkey soil is rather extensive and has
an almost level, flat surface, and is poorly drained. The sample was collected from a forested area where large sweetgum, ironwood, walnut, hickory, red oak, and honeylocust prevail.
CI890, 0 to 4 inches. Dark, grayish-brown clay. CI891, 4 to 22 inches. Dark, bluish-gray clay, mottled with rust brown. C1892, 22 to 80 inches. Steel-gray or bluish-gray silty clay mottled with rust
brown. SHARKEY SILTY CLAY LOAM
COLLECTORS.—W. E. Hearn and R. S. Holmes. LOCATION.—6 miles south of Onward on the west side of U. S. High-
way No. 61, Sharkey County, Miss. DESCRIPTION.—The area is flat and poorly drained, heavily forested;
growth consists mainly of oak, hickory, elm, hackberry, and gum. The surface soil has the appearance of containing considerable organic matter. The soil is locally known as ^^buckshot land,'' because the soil breaks into small rounded and angular particles after it has been plowed and exposed to atmospheric action.
C1886, 0 to 12 inches. Very dark, grayish-brown silty clay loam with faint mottles of gray and brown.
C1887, 12 to 16 inches. Dark-purplish, tough to plastic clay, with a reddish- brown tint. This coloration is not found in the larger areas of the Sharkey soil.
C1888, 16 to 30 inches. Dark-gray, heavy, tough to plastic silty clay containing some brown mottles.
C1889, 30 to 90 inches. Light-gray or bluish-gray heavy plastic silty clay, mottled, rusty brown. There is no uniformity in the distribution or amount of mottles present in this layer.
Soil material taken from excavation and a deep-water well near the excavation.
COLLECTORS.—W. E. Hearn and R. S. Holmes. LOCATION.—One-fourth mile north of Onward, Sharkey County, Miss. DESCRIPTION.—At 14 feet below the surface the material is a bluish-
gray or light-gray, heavy plastic silty clay with some mottles of rust brown. According to information obtained from the engineer in charge, this heavy material continues downward to a depth of approximately 50 feet below the surface. It is underlain by fine sand or sandy loam, whitish to grayish in color. This is the stratum from which water is obtained.

8
In an excavation 14 feet deep, a large number of layers of different material were observed. Some of these layers were very thin and consisted of well-decomposed organic matter, silt, or clay. Appar- ently it has taken a long time to build up the delta material to a thickness of 50 to 60 feet.
Samples of material were taken from the well at the following depths: C1915, 14 feet. Bluish-gray siltv clay. C1916, 18 feet. Light-gray silt loam. C1917, 25 feet. Gray silt loam. C1918, 40 feet. Gray sandy loam. C1919, 58 to 68 feet. Gray sandy loam. 01920, 70 to 80 feet. Composed of a mixture of black, brown, and white coarse
sand with rather clean surfaces. C1921, 100 feet. Light-brown sandy loam.
COLLECTOR.—W. T. Carter. LOCATION.—18 miles north of Baton Rouge, 4 miles west of the
Mississippi River, Pointe Coupée Parish, La. DESCRIPTION.—This soil is on a high, nearly flat, bottom land occupied
largely by cultivated soil. It has fair surface and under drainage, due to local bayous, which give free local drainage; overflows do not occur often because of levees, which have not allowed inunda- tion here since 1927. The land lies several feet higher than the first bottoms of the river, which have large areas of poorly drained soils, largely of the Sharkey series.
C3261, 0 to 8 inches. Light-brown silt loam, which, on drying, has a grayish hue. C3262, 8 to 24 inches. Mottled light-brown and yellowish-brown silt loam. C3263, 24 to 38 inches -\-. Mottled |grayish-brown and yellowish-brown silt
loam.
SHARKEY SILTY CLAY
COLLECTOR.—W. T. Carter. LOCATION.—4K miles south of Gonzales, about 2 miles from the Mis-
sissippi River, Ascension Parish, La. DESCRIPTION.—This is a flat, poorly drained soil having a high water
table (about 2 feet below the surface), occupied by willow oak, water oak, sycamore, hackberry, palmetto, and other vegetation. It is not cultivated, owing to poor drainage, but is rarely overflowed from river inundation now, as it is protected by levees.
C3270, 0 to 8 inches. Dark-gray, very heavy silty clay with Vjrown spots and streaks.
C3271, 8 to 24 inches. Bluish-gray, heavy silty clay with brownish-yellow spots. C3272, 24 to 48 inches -f. Gray silty clay or heavy silt loam with yellow spots
and streaks.
ROBINSONVILLE ^ SILT LOAM
COLLECTOR.—^A. M. O'Neal. LOCATION.—1 mile south of Vacherie and K mile west of the Mississippi
River, St. James Parish, La. DESCRIPTION.—The sample is representative of a large area. At this
point this soil extends back from the river from IK to 2 miles before merging with the heavier textured Sharkey soils. Away from the
6 Tentative name. See p. 17. '' Tentative name, see p. 17.

TECHNICAL BULLETIN 8 3 3, U. S. DEPT. OF AGRICULTURE 9
Mississippi or in the ''Bayou'' section of Louisiana, the develop- ment is less extensive.
C1922, 0 to 6 inches. Grayish-brown or gray silt. C1923, 10 to 24 inches. Dark-gray heavy silt loam. C1924, 48 to 80 inches. Gray mottled with yellow, silty clay loam.
SHARKEY CLAY
COLLECTOR.—A. M. O'Neal. LOCATION.—6 miles southeast of Houma, in Terrebonne Parish, La. DESCRIPTION.—This soil is quite extensive in this locality. C2106, 0 to 6 inches. Very dark grayish-brown, very heavy clay. C2107, 10 to 24 inches. Gray very heavy clay. C2108, 48 to 80 inches. Light-gray, extremely heavy clay.
OTHER MISSISSIPPI AND GULF DEPOSIT»
COLLECTOR.—R. Dana Russell. C5316. A core of sediment taken at the mouth of the Mississippi River at Burr-
wood, La., one-third the distance from the left bank; depth of water at this point, 29 feet; vertical depth of core taken, 4.8 feet; 2 inches in diameter. The top 4 feet of the sample consisted of soft brown ooze, rather uniform in texture but shghtly laminated. The last 8 inches were a rather clean, fine, and very fine sand of light-gray color.
C5315. A core of sediment taken 3 miles southeast of the southwest pass of the Mississippi River in the Gulf of Mexico, at 28°54' N. latitude, 89°23' W. longitude; depth of water, 70 feet; vertical depth of sample, 7 feet; diameter, 2 inches. The material was a black silty oozy clay. It had an odor of hydrogen sulfide when fresh. When dry it was a light gray and appeared rather uniform in texture.
COLLECTOR.—C. S. Piggot. B4417 to C4418. Two cores of sedimentary material taken near each other at
a point in the Gulf of Mexico, 26°0' N. latitude, and 85°52' W. longitude, which is approximately two-thirds the distance from the mouth of the Mississippi River to the south end of Florida. The depth of water at this point was 1,770 fathoms, or 2 miles. The core samples were each approximately 6 feet deep, with diameter of 2 inches. The sediment was a black oozy plastic clay material when collected. When the material became thoroughly dry it showed the sedimentary material to be distinctly laminated and stratified. The thicker strata were dark gray in color, hard to break or crush, whereas the thinner strata were a light gray to white in color and were easily broken or crushed.
WESTERN TRIBUTARIES
HAVRE CLAY
COLLECTOR.—M. J. Edwards. LOCATION.—Milk River, Valley County, Mont. ; 3 miles northwest of
Nashua, which is near the union of the Milk and Missouri Rivers. DESCRIPTION.—Surface is gently undulating; cultivated area. C2999, 0 to 8 inches. Gray, heavy silty clay becoming heavier with depth. C3000, 15 to 25 inches. Dark-gray heavy silty clay, which becomes more friable
below 30 inches. Carbonate ñakes are common below a depth of about 24 inches.
C3001, 40 to 60 inches. Gray, moderately heavy clay, containing calcareous material.
467217°—42—2

10 TECHNICAL BULLETIN 8 3 3, U. S. DEPT. OF AGRICULTURE
HAVRE SILTY CLAY
COLLECTOR.—M. J. Edwards. LOCATION.—Missouri River, ji mile northeast of Fort Peck, Valley
County, Mont. C3002, 0 to 8 inches. Moderately heavy dark-gray clay. C3003, 15 to 30 inches. Dark-gray silty clay. C3004, 30 to 45 inches. Light-gray silty clay. C3005, 70 to 90 inches. Moderately heavy dark-gray clay. C3006, 100 to 145 inches. Finely laminated brownish-yellow and gray loam,
containing iron nodules. C3007, 160 inches +. Gray fine sand.
YELLOWSTONE RIVER BOTTOM, HAVRE SILTY CLAY LOAM
COLLECTOR.—M. J. Edwards. LOCATION.—^546 feet east of the bridge across Yellowstone River,
Richland County, Mont., southeast of Sidney and about 95 feet north of the road.
DESCRIPTION.—The area sampled was a cultivated field, nearly level. Growth on uncultivated areas consisted of silver sagebrush, buck- brush, and ash.
C3008, 0 to 8 inches. Gray silty clay loam, moderately friable. C3009, 15 to 25 inches. Gray silty clay loam. C3010, 42 to 50 inches. Gray silty clay. C3011, 60 to 75 inches. Gray silt loam. 03012, 80 to 96 inches. Gray silty clay. C3013, 120 inches+ . Gray, fine light sandy loam.
LAUREL LOAM
COLLECTOR.—T. D. Rice. LOCATION.—Missouri River, Walworth County, S. Dak., about 2
miles north of Mobridge. DESCRIPTION.—This sample was taken from the top of a flat terrace
about 10 feet above the present level of the river. The vegetation consisted of scattering cottonwood, buckbrush, ash, and bur oak, and cover of grasses.
C3014, 0 to 10 inches. Grayish-brown loam with pockets of white, sandier material and lumps of dark-gray clay.
C3015, 28 to 42 inches. Light grayish-brown silty clay loam. C3016, 48 to 72 inches. Dark-gray silty clay. C3017, 84 to 96 inches. Gray silty clay loam.
LAMOURE FINE SANDY LOAM
COLLECTOR.—T. D. Rice. LocATioN.^Platte River, 1 mile southwest of Maxwell, Lincohi
County, Nebr. DESCRIPTION.—This sample was taken from an area of flat bottom
land about 4 feet above the level of the Platte River. Underdrain- age is good, as the entire Platte Valley is underlain by sand and gravel, usually at less than 3 feet.
C3726, 0 to 10 inches. Very dark grayish-brown fine sandy loam. C3727, 10 to 24 inches. Daxk-brown, fine sandy loam. C3728, 24 to 36 inches. Brown sandy loam. 03729, 36 to 42 inches. Brown sandy loam underlain by loose sand and gravel.

ALLUVIAL SOILS OF THE MISSISSIPPI BASIN 11
LINCOLN LOAM
COLLECTOR.—E. G. Fitzpatrick. LOCATION.—Arkansas River, 3 miles east of Fort Dodge, Ford County,
Kans., about 30 feet from the river. C2994, 0 to 10 inches. Grayish-brown friable loam. The material is calcareous. C2995, 10 to 18 inches. Grayish-brown line sandy loam, slightly compact, and
calcareous. C2996, 18 to 30 inches. Mottled, yellowish-brown and gray fine sand containing
a few calcium carbonate pebbles. C2997, 40 to 55 inches+. Grayish-brown gravelly sand, largely quartz and
feldspar. YOHOLO LOAM
COLLECTOR.—E. G. Fitzpatrick. LOCATION.—Arkansas River, 1 mile south of Van Buren, Crawford
County, Ark. C2881, 0 to 8 inches. Reddish-brown, loose, friable loam. C2882, 18 to 30 inches. Reddish-brown, very fine sandy loam. C2883, 30 to 38 inches. Reddish-brow^n, very fine sandy loam.
PORTLAND SILTY CLAY LOAM
CoLi-ECTOR.—W. T. Carter. LOCATION.—Arkansas River, 2 miles northeast of Woodson, Pulaski
County, Ark. DESCRIPTION.—This is a flat, slowly drained soil. Much of the land
is used for alfalfa, cotton, and corn. C3273, 0 to 10 inches. Brown silty clay loam. C3274, 10 to 26 inches. Brown silty clay loam. C3275, 26 to 48 inches+ . Reddish-brown silty clay.
VERDIGRIS LOAM
COLLECTOR.—E. G. Fitzpatrick. LOCATION.—Verdigris River, ji mile south of river bridge, on vState
Highway No. 51, 7 miles west of Wagoner, Wagoner County, Okla. C2981, 0 to 8 inches. Dark-brown loam. C2982, 16 to 24 inches. Dark-brown loam. C2983, 40 to 50 inches. Brown, very fine sandy loam.
WAVERLY SILTY CLAY
COLLECTOR.—W. T. Carter. LOCATION.—White River, 1 mile northeast of De Vails Bluñ", Prairie
County, Ark. DESCRIPTION.—This is a low, flat, poorly drained soil, which is not
practical for cultivation because it is too wet and too frequently overflowed.
C3267, 0 to 10 inches. Light-gray silty clay splotched with brown. C3268, 10 to 22 inches. Grayish-brown silty clay loam. C3269, 22 to 48 inches+ . Gray silty clay loam with brown splotches.
BIBB SILT LOAM
COLLECTOR.—W. T. Carter. LOCATION.—Ouachita River, 9 miles southwest of Bastrop, More-
house Parish, La., above the entrance of Bayou Bartholomew.

12 TECHNICAL BULLETIN 83 3, U. S. DEPT. OF AGRICULTURE
DESCRIPTION.—The sample was taken from a poorly drained area lying along the Ouachita River, which drains the Coastal Plain soils largely, although some tributaries rise in Ouachita Parish. Water and willow oaks and other trees grow thickly.
C3282, 0 to 8 inches. Gray silt loam with yellow and brown splotches. C3283, 8 to 20 inches. Mottled gray and yellow silt loam. C3284, 20 to 38 inches+. Rather compact gray and yellow mottled heavy silty
clay. MILLER CLAY
COLLECTOR.—W. T. Carter. LOCATION.—Red River, 2 miles southeast of Alexandria, Rapides
Parish, La. DESCRIPTION.—This soil occurs in flat areas and has slow drainage.
It is highly productive and where drained adequately is used ex- tensively.
C3276, 0 to 8 inches. Reddish-brown heavy clay. C3277, 8 to 24 inches. Red heavy clay, which is calcareous below a depth of
12 inches. C3278, 24 to 50 inches+ • Red calcareous clay, which continues to a depth of
several feet. EASTERN TRIBUTARIES
HUNTINGTON LOAM
COLLECTORS.—W. E. Hearn and R. S. Holmes. LOCATION.—Ohio River, 3 miles northeast of Golconda, 111., in Liv-
ingston County, Ky., east side of river in Kentucky. DESCRIPTION.—The area of alluvium at this point was not extensive
but was well drained and high enough not to be frequently over- flowed.
C1899, 0 to 10 inches. Brown loam, mellow and friable. There is a sharp line between the soil and subsoil.
C1900, 20 to 60 inches. Brown silty clay, uniform in color; rather heavy and firm but breaks easily under normal moisture conditions.
C1901, 80 to 120 inches. Light-brown silty clay with almost the same structure as the layer above.
FRESHLY DEPOSITED SEDIMENT
COLLECTOR.—Vv". J. Leighty. LOCATION.—Various points from Cincinnati, Ohio, to Cairo, 111. DESCRIPTION.—Fourteen samples were obtained from freshly de-
posited sediment on the Ohio River at the time of the flood of Jan- uary and February 1937 (21).
C2327 to C2340, 0.3 to 2.5 inches. Samples were dried and crushed; all were essentially a light brown;texture of almost all of the samples was silty clay loam.
HUNTINGTON SILT LOAM
COLLECTORS.—W. E. Hearn and R. S. Holmes. LOCATION.—2^ miles south of bridge across Cumberland River near
Smithland, Livingston County, Ky.; and from first bottom land. The elevation at this point is 336.9 feet above sea level.
C1902, 0 to 12 inches. Brown mellow silt loam. C1903, 12 to 40 inches. Brown heavy silt loam. C1904, 40 to 70 inches+ . Light-brow^n, faintly mottled with gray, silty clay;
rather stiff but breaks fairly easily. This material extends downward to a depth of many feet and grades into fine sand. Chert and gravel overlie solid limestone at Í40 feet below the surface.

ALLUVIAL SOILS OF THE MISSISSIPPI BASIK 13
HUNTINGTON SILTY CLAY LOAM
COLLECTORS.—W. E. Hearn and R. S. Holmes. LOCATION.—10 miles northwest of Waverly, Humphreys County,
Tenn.; about 200 feet from the Tennessee River on the east side. C1905, 0 to 10 inches. Brown silt loam, mellow and friable. C1906, 12 to 36 inches. Dark-brown silty clay loam, heavy and slightly compact. C1907, 40 to 90 inches. Light-brown silty clay loam, firm and heavy but not
compact.
COLLECTORS.—W. E. Hearn and R. S. Holmes. LOCATION.—About 7 miles northwest of Columbia, Tenn., and 2
miles from the Monsanto Phosphate Mines on Duck River, Maury County, Tenn.
C1908, 0 to 10 inches. Brown silt loam, rather heavy but mellow and friable. C1909, 12 to 38 inches. Dark-brown silty clay loam, heavy and slightly compact. C1910, 38 to 66 inches. Dark-brown silty clay loam, slightly compacted and
tough, very uniform in color. Below the depth of 12 inches the material is slightly compact and heavier than the typical Huntington silt loam.
HUNTINGTON LOAM
COLLECTOR.—J. W. Moon. LOCATION.—Clinch River, Grainger County, Tenn., at intersection
of U. S. Highway No. 25 with the Clinch River. The area of alluvial soil here was not extensive.
C1911, 0 to 14 inches. Dark-brown mellow loam. C1912, 14 to 34 inches. Brown friable loam. C1913, 34 to 62 inches. Yellowish-brown, mellow, heavy fine sandy loam.
VICKSBURG SILT LOAM
COLLECTORS.—W. E. Hearn and R. S. Holmes. LOCATION.—Big Black River, Warren County, Miss. ; 14 miles south-
east of Vicksburg. C1882, 0 to 10 inches. Light-brown silt loam; mellow and friable; at about 8
inches a slight compactness and some mottles of gray and brown appear. C1883, 10 to 50 inches. Dark-brown silt loam. It appears to contain more
organic matter than the soil and contains fewer splotches of gray material. C1884, 50 to 86 inches. Mottled light-gray and rusty-brown heavy silt loam. C1885, 86 to 108 inches. Mottled light-gray and brown silty clay loam.
LOESS MATERIAL, SILT
COLLECTORS.—W. E. Hearn and R. S. Holmes. LOCATION.—3 miles northeast of Yazoo City, Yazoo County, Miss.
The sample was taken from a road cut 18 or 20 feet deep, leading up through the eastern bluff of the Yazoo River and consists of material known as loess.
C1914, 72 to 90 inches. This material is very uniform in texture and in color. It is light yellow or buff, somewhat porous, unconsolidated yet slightly cemented and unstratified. It is thickest along the western boundary and becomes shallower as it extends eastward in the State, covering virtually all the drainage area of the Black River that lies east and somewhat parallel to that of the drain- age area of the Yazoo River. This sample more nearly represents the raw unleached and un weathered loess that lies beneath the soils than it does the soil or soil material.

14 TECHNICAL BULLETIN 833, U. S. DEPT. OF AGRICULTURE
METHODS OF LABORATORY EXAMINATION
All soils were air-dried, pulverized, and passed through a 2-mm. sieve. Gravels and stones larger than 2 mm. in diameter were dis- carded. The subsamples of both the soil and colloid selected for chemical analysis were ground to pass through a sieve of 80 meshes to the inch.
Mechanical analyses were made by the pipette method described by Olmstead, Alexander, and Middleton (28). The pH values of the soils were determined by the hydrogen electrode method described by Bailey (4). The chemical analyses of both the soil and colloid were made according to the procedure described by Robinson (30). Organic matter was determined by the combustion method.
The colloids were extracted from the soils with the aid of the supercentrifuge, essentially as described by Brown and Byers (8). In order to obtain comparable results, the quantity of soil used for colloid extraction was estimated to contain at least 100 gm. of clay. It was dispersed in approximately 3 gallons of distilled water and agitated in a mechanical agitator described by Holmes and Edgington (22). The suspension was then decanted into sufficient water to make 10 gallons and centrifuged at the rate of flow of 1 liter per 17 seconds. The diameter of the bowl of the centrifuge was 4 inches, the speed 17,000 revolutions per minute. Very few colloid particles extracted under the conditions mentioned exceeded 0.0003 mm. in diameter. The colloid was collected on Pasteur Chamberland filters, and the filtrate was used again as a dispersion medium for the sediment removed from the centrifuge bowl. The process was re- peated 3 to 5 times, or until 50 gm. or more of colloid were extracted.
ANALYTICAL RESULTS
Data for the various soils that constitute, to some extent, a natural group are presented in tables, with a brief discussion of each. Be- cause of the variable quantities of organic matter and water in both the soils and colloids, the data for their chemical composition are cal- culated on the basis of inorganic soil material dried at 110° C. This method of calculation shows the true relation between the quantities of inorganic constituents in different soils. The percentages of ignition loss, organic matter, and nitrogen are calculated on material dried at 110° C.
Certain derived data for the colloids have been calculated and assembled in a separate table for each group of soils. In calculating these derived data, the percentage of each constituent is divided by its formula weight. These quotients represent the relative number of formula weights present. The number of formula weights of one constituent are compared to the number of formula weights of other constituents in the ratios. Fuller discussion of the methods of cal- culation of these ratios and illustrations of their use in consideration of the chemical relationship in connection with soil colloids will be found in various publications of the Department of Agriculture (9,10,11, 23). The methods for the calculations of other derived data are given in the text. In this bulletin, the term ''base content^' is used to designate the combined quantities of calcium, magnesium, potassium, and sodium oxides.
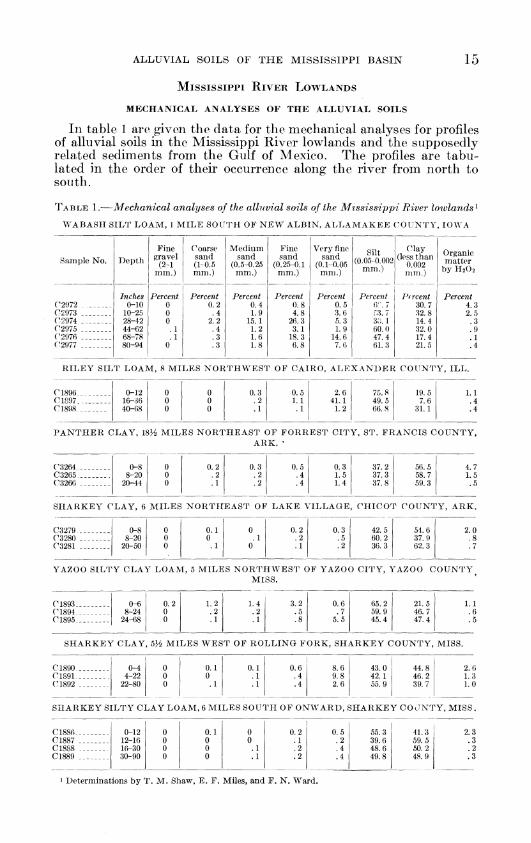
ALLUVIAL SOILS OF THE MISSISSIPPI BASIK 15
MISSISSIPPI RIVER LOWLANDS
MECHANICAL ANALYSES OF THE ALLUVIAL SOILS
In table 1 are given the data for the mechanical analyses for profiles of alluvial soils in the Mississippi River lowlands and the supposedly related sediments from the Gulf of Mexico. The profiles are tabu- lated in the order of their occurrence along the river from north to south.
TABLE 1.—Mechanical analyses of the alluvial soils of the Mississippi River lowlands^
WABASH SILT LOAM, 1 MILE SOUTH OF NEW ALBIN, ALLAMAKEE COUNTY, IOWA
Sample No. Depth
Fine gravel
(2-1 mm.)
Coarse sand (1-0.5 mm.)
Medium sand
(0.5-0.25 mm.)
Fine sand
(0.25-0.1 mm.)
Very fine sand
(0.1-0.05 mm.)
Silt (0.05-0.002
mm.)
Percent 0:\ 7 ^3. 7 3o. 1 60.0 47.4 61.3
Clay (less than
0.002 mm.)
Pf rcent 30.7 32.8 14.4 32.0 17.4 21.5
Organic matter
by H2O2
C2<)72 C2073 C2974 C2975 r2976 02977
Inches 0-10
10-25 28-42 44-62 68-78 80-94
Percent 0 0 0
. 1
.1 0
Percent 0.2 .4
2.2 .4 .3 .3
Percent 0.4 1.9
15.1 1.2 L6 1.8
Percent 0.8 4.8
26.3 3.1
18.3 6.8
Percent 0.5 3.6 5.3 1.9
14.6 7.6
Percent 4.3 2.5 .3 .9 .1 .4
RILEY SILT LOAM, 8 MILES NORTHWEST OF CAIRO, ALEXANDER COUNTY, ILL.
C1896__ C1897.^ C1898__
0-12 0 0 0.3 0.5 16-36 0 0 .2 1.1 40-68 0 0 .1 .1
2.6 75.8 19.5 41.1 49.5 7.6
1.2 66.8 31.1
LI .4 .4
PANTHER CLAY, 18H MILES NORTHEAST OF FORREST CITY, ST. FRANCIS COUNTY, ARK. ^
C3264 . C3265 . C3266 .
0-8 0 0.2 0.3 0.5 0.3 37.2 56.5 8-20 0 .2 .2 .4 1.5 37.3 58.7
20-44 0 .1 2 .4 1.4 37.8 59.3
4.7 L5 .5
SHARKEY CLAY, 6 MILES NORTflEAST OF LAKE VILLAGE, CHICOT COUNTY, ARK.
C3279 . C3280 . C3281 _
0-8 0 0.1 0 0.2 0.3 42.5 54.6 8-20 0 0 .1 .2 .5 60.2 37.9
20-50 0 .1 0 .1 .2 36.3 62.3
2.0 .8 .7
YAZOO SILTY CLAY LOAM, 5 MILES NORTHWEST OF YAZOO CITY, YAZOO COUNTY MISS.
C1893- C1894. C1895
0-6 0.2 1.2 1.4 3.2 0.6 65.2 2L5 8-24 0 .2 .2 .5 .7 59.9 46.7
24-68 0 .1 .1 .8 5.5 45.4 47.4
1.1 .6 .5
SHARKEY CLAY, 5H MILES WEST OF ROLLING FORK, SHARKEY COUNTY, MISS.
C1890 C1891 C1892
0-4 0 4-22 0
22-80 0
0.1 0.1 0.6 8.6 43.0 0 .1 .4 9.8 42.1 .1 .1 .4 2.6 55.9
44.8 46.2 39.7
2.6 1.3 1.0
SHARKEY SILTY CLAY LOAM, 6 MILES SOUTH OF ONWARD, SHARKEY CO UNTY, MISS.
C1886-. C1887 . C1888 C1889 .
0-12 0 0.1 0 0.2 0.5 55.3 41.3 12-16 0 0 0 .1 .2 39.6 59.5 16-30 0 0 .1 .2 .4 48.6 50.2 30-90 0 0 .1 .2 .4 49.8 48.9
' Determinations by T. M. Shaw, E. F. Miles, and F. N. Ward.

16 TECHNICAL BULLETIN 8 3 3, U. S. DEPT. OF AGRICULTURE
TABLE 1.—Mechanical analyses of the alluvial soils of the Mississippi River lowlands—Continued
MATERIAL FROM A WELL H MILE NORTH OF ONWARD, SIIARKEY COUNTY, MISS-
Sample No. Depth
Fine gravel
(2-1 mm.)
Coarse sand (1-0.5 mm.)
Medium sand
(0.5-0.25 mm.)
Fine sand
(0.25-0.1 mm.)
Very fine sand
(0.1-0.05 mm.)
Silt (0.05-0.002
mm.)
Clay (less than
0.002 mm.)
Organic matter
by H3O2
C1915 Feet
14 18 25 40
58-68 70-80
100
Percent 0 0 0 0 .8
28.3 0
Percerd 0
2 LO 6.4 8.1
59.1 .5
Percent 0.2 .1
1.4 21.2 26.7 7.4
57.6
Percent 0.5 1.3
14.8 16.7 20.6
.5 35.3
Percent 1.3
19.5 20.7 8.7 3.6 .1 .4
Percent 55.3 66.9 50.2 38.0 18.8 2.0 2.9
Percent 42.5 11.4 11.4 8.4
20.5 2.4 2.9
Percent 0
C1916 .3 C1917 --- 2 C1918 .2 C1919 C1920 C1921
.5 0
2
ROBINSONVILLE SILT LOAM, 18 MILES NORTH OF BATON ROUGE, POINTE COUPEE PARISH, LA.
C3261 Inches
0-8 8-24
24-38+
0.1 0 0
0.1 .1 .1
0.1 .1 .1
0.8 .6 .9
20.7 14.6 12.5
66.5 73.1 70.8
10.4 10.9 15.3
1.0 C3262 C3263 _._
.4 2
SHARKEY SILT Y CLAY, 41/2 MILES SOUTH OF GONZALES, ASCENSION PARISH, LA.
C3270 . C3271-. C3272^
0-8 0. 8-24 .1
24-48+ .2
0.1 .1 .2
0.1 0 .1
0.2 .2
1.1 1.6 1.5
52.4 63.3 66.7
43.7 34.1 30.8
2.1 .4
0
ROBINSONVILLE SILT LOAM, 1 MILE SOUTH OF VACHERIE, ST. JAMES PARISH, LA.
C1922.. C1923_. C1924.
0-6 10-24 48-80
0.2 *0.1 0.6 4.5 79.7 13.6 .1 .1 .4 2.1 68.4 28.3 .2 .2 .5 .8 69.0 29.2
1.1 .4
0
SHARKEY CLAY, 6 MILES SOUTHEAST OF HOUMA, TERREBONNE PARISH, LA.
C2106_-__ C2107____ C2108 ___
0-6 0 10-24 0 48-80 0
0.2 .2 .1
0.2 .1 .1
20.6 16.7 16.0
73.8 81.0 81.5
4.5 1.5 1.5
SEDIMENT FROM CHANNEL OF THE MOUTH OF THE MISSISSIPPI RIVER AT BURRWOOD, PLAQUEMINES PARISH, LA.
C5316 0.9
SEDIMENT FROM 3 MILES SOUTHEAST OF SOUTHWEST PASS OF THE MISSISSIPPI RIVER IN GULF OF MEXICO AT 28°54' N., 89°23' W.
C5315 C5315
0-8 72-84
0 0
0 0
0.1 .1
0.3 .1
1.5 .6
42.5 43.4
54.0 54.3
1.1 .8
SEDIMENT 2 FROM GULF OF MEXICO AT 26°0' N., 85°52' W., AT A DEPTH OF WATER OF 1,770 FATHOMS
C4417 C4418
0-72 0-72
0 0
0 0
0 0
0 0
0.1 30. 8 .1 31.1
67.1 66.8
1.3 1.3
2 Samples taken close to each other, at a point approximately Vs the distance from the mouth of the M is- sissippi River to the southern part of Florida.

ALLUVIAL SOILS OF THE MISSISSIPPI BASIN 17
The samples of the first two profiles, the one from northern Iowa and the other from southern Illinois, contain considerably more sand than do the other samples taken south of Cairo from the area commonly known as the Mississippi lowlands. This is to be expected, as the upper Mississippi River and its tributaries flow over a much higher gradient than do the lower Mississippi and its lowland tributaries which have a slope of less than 6 inches per mile. The samples of the Mississippi alluvium lying south of the mouth of the Ohio, representing the first 60 to 70 inches, are composed largely of silt and clay. The average of the total sand content of these samples is only 3.7 percent and that of the silt and clay expressed in whole numbers is 50 (50.08 percent) and 45 (44.98 percent), respectively. Very fine sands compose the major portion of the total sands. Although the alluvial soils are composed almost wholly of very fine sands, silt, and clay, the ratios of these components vary widely for different areas. During inundation of the lowlands much of the coarser material is deposited upon the areas lying along and adjacent to the stream current, form- ing bars and ridges that constitute the natural levees. At the same time the larger portion of the silt and clay remains suspended and is carried farther inland and is deposited in varying proportions.
Bonsteel (7) in 1901 first classified the Yazoo Mississippi delta soils into two soil series, the Yazoo and Sharkey, basing his classifi- cation largely on texture, color, and drainage conditions. He defines the Yazoo series and the Sharkey clay as follows:
The Yazoo sandy loam occupies long low ridges extending along the margins of the principal stream courses of the delta portion of the area. The ridges form the front lands and rise from 10 to 15 feet above the general level of the delta. They are thus drained in two directions. *******
Lying along the margins of the Yazoo sandy loam, the Yazoo loam forms an intermediate type between the sandy soils of the ridges and the heavy cla3^s of the interior.
The Yazoo clay occupies the low-lying border of the front lands and the higher ridges through the open country between streams.
The Sharkey clay is the most extensive soil type of the delta region, com- prising about two-thirds of the area. It occurs in large, irregular areas between stream courses and forms a central basin-shaped depression below the ridges of the front land.
The Sharkey clay represents the undisturbed settling of the finest clay particles brought into the delta during periods of general overñow.
Recent surveys of the soils of the delta area point to the desirability of subdividing the areas of both the Sharkey and Yazoo soils. These new series, so far as they are concerned with the samples analyzed, are given in the tables and text of this bulletin. The Sharkey soils are closely related to the Panther soils but differ from them in being alkaline to calcareous and slightly more friable and permeable through- out the profile. The Yazoo soils are developed largely from materials brought down by local tributary streams and mixed with the Mis- sissippi River sediments, whereas the Robinsonville soils consist chiefly of fresh or recent alluvial of the Mississippi River. The Robinsonville soils range from about neutral in pH value to alkaline and calcareous, whereas the Yazoo soils are acid to strongly acid in reaction.
467217° -42 3

18 TECHNICAL BULLETIN 8 3 3, U. S. DEPT. OF AGRICULTURE
The Yazoo profile from near Yazoo City, Miss , the Robinsonville from near Baton Rouge, La., and the Robinsonville from near Vacherie, La., were all formerly classified as Yazoo soils. These three soil profiles, though far removed from each other, are very similar in mechanical composition. Their major component is silt, which generally decreases in quantity with depth whereas the clay content increases. This may be due partially to illuviation, but most probably the major cause is the result of a more perfect natural separation of the coarser particles as the natural levees grew higher. In spite of the fact that the Yazoo soils are considered the most sandy of the lowlands soils, these three profiles show a very low sand content coarser than the very fine sands (0.01 to 0.05 mm. in diameter). The mechanical analysis of 16 Yazoo sandy loams and loams reported by Bonsteel (7) show similar results.
The data for the Sharkey soils show them to be composed almost wholly of approximately equal portions of silt and clay. Although the content of silt and clay vary with a profile, there is no uniformity in such variation. The profile C1886-C1889, from Onward, Miss., differs somewhat from the normal Sharkey soil profile. The surface soil is darker in color and more poorly drained. The subsoil has a distinctive reddish-brown tint and has the appearance of being very high in clay. However, the analysis of this soil profile shows it to have a variable clay content with the highest concentration in the subsoil. As a whole it is slightly higher in clay but somewhat lower in organic matter than the more typical Sharkey soil profile (C1890 to C1892) at Rolling Fork.
The analysis of the material (C1915 to C1921) taken from the well shows this material to be very similar to the Sharkey soil profiles down to the depth of about 25 to 30 feet. At that depth the content of coarser sands begins to increase and continues to do so to the depth of 75 or 80 feet, at which depth the material is composed almost wholly of rather clean fine gravel, coarse and medium sands. The clay and silt found in the sample taken at the depth labeled 70-80 feet had the appearance of being contaminating material rather than a normal part of the layer.
The sandy material at this depth is rather typical of what one should expect in view of findings by Stephenson et al., in the investigation of water-bearing capacity of Mississippi alluvium (33). They report that the recent alluvium is composed of clay, sand, and gravel to the depth of 125 to 200 feet.
* * * These materials are saturated with water to a level within 15 feet or less of the surface, and the porous sands and gravels, which largely compose the lower half of the deposits, contain vast quantities of water that can readily be procured by means of properly constructed wells and pumps. * * * This water is cased off and the wells are sunk into the deeper Eocene formations, the waters of which are at most places under a sufficiently high head to cause flows at the surface. * * * Water from the alluvial deposits is commonly hard and moderately high in mineral content.
There are a number of fio wing wells at and in the vicinity of Onward and Rolling Fork that are 800 to 1,200 feet deep with flows from 30 to 40 gallons per minute and with static heads of 35 or 40 feet (33).
The Sharkey clay (C2106 to C2108), 6 miles south of Houma, La., and the Robinsonville silt loam (C1922 to C1924), 1 mile south of Vacherie, La., and ji mile from the Mississippi River, represent the

Tech. Bul. 833. U. S. Dept. of Agriculture PLATE 1
A typical area of virgin Sharkey soil, 1 mile north of Round Lake, St. Martin Parish, La.

20 TECHNICAL BULLETIN 8 3 3, U. S. DEPT. OF AGRICULTURE
two dominant soil series that predominate in the lower Mississippi River flood plains. The Sharkey profile contains an average of 78.8 percent clay and 17.8 percent silt. The Robinsonville profile contains an average of 23.7 percent clay and 72.3 percent silt. The silt and clay complement each other, for the sand is low in both. This Sharkey profile is the highest in clay of any of the Mississippi River profiles in this investigation. It represents the kind of material that settles out from the quiet or slowly moving waters during overflows. The deposition of such material nearly always occurs some distance away from the main river channel, under environments frequently similar to those shown in plate 1. The Robinsonville soil is generally located on the higher land adjacent to, or paralleling, the river. It is formed from the moving water from which the suspended clay is not deposited as fast as is the sand and silt. The similarity of the mechanical analysis of the sediments taken from the mouth of the river and those 3 miles south of its mouth indicates that the sediments carried to sea by the Mississippi River are approximately of the same textural composition.
The two samples of sediments taken from farther out in the Gulf of Mexico just off the continental shelf are nearly identical in texture. They are about 13 percent higher in clay than the river sediments and contain little, if any, true sand.
CHEMICAL ANALYSES OF THE ALLUVIAL SOILS
In table 2 are given the chemical analyses of soils of the Mississippi River lowlands and of two sedimentary samples from the bottom of the river at its mouth, and two from the Gulf of Mexico. The samples are tabulated in the order of their occurrence from north to south. It is obvious that for so large a number of soils selected from such a large area, these soils are remarkably similar in chemical composition. The most marked differences that do occur are in the major constit- uents and can be attributed to variations in the content of clay. The average clay of soils is higher in iron oxide and alumina and lower in silica than nonclay fractions. With the exceptions of a few soil pro- files, these data indicate that the soil material composing this large number of soil profiles was very thoroughly mixed, perhaps many times, before being deposited. The exceptions would naturally be expected to occur in the alluvial material from farthest up the river. This is particularly true in the case of the Wabash soil profile from New Albin, Iowa. This profile is composed of the material brought down by the upper Mississippi River and its many tributaries from Minnesota and Wisconsin. The topography of this area has been much altered during the glacial periods by the variable amounts and kinds of glaciated material left upon it. The glaciated area, most of which lies on the east side of the river, has been covered by loess material. It is also a land of many lakes containing in places beds of lacustrine ma- terial. Perhaps the Minnesota River at one time contributed to this profile a portion of lacustrine material from the glacial Lake Agassiz. The time required to build up this alluvium from the depth sampled (94 inches) cannot easily be estimated, but it is to be assumed, from the description of the profile, its variations in texture, and its chemical composition, that it has been built up during a long period of time of material varying much in texture and chemical composition.

Sample No.
C3279 C3280 03281
TABLE 2.—Chemical analyses of alluvial soils of the Mississippi River lowlands ^
WABASH SILT LOAM, 1 MILE SOUTH OF NEW ALBIN, ALLAMAKEE COUNTY, IOWA
C2972 C2973 C2974 C2975 C2976 C2977
Depth
Inches 0-10
10-25 28-42 44-62 68-78 80-94
SÍO2
Percent 71.98 72.36 75.73 71.66 73.84 71.37
Percent 0.73 .70 .36 .71 .56 .58
AI2O3
Percent 12.82 12.30 7.10
12.60 8.56
Fe203
Percent 4.54 5.21 3.32 4.70 3.28 3.46
MnO CaO MgO K2O Na20 P2O5 SO3 CO2 Com- bined water
Percent Percent Percent Percent Percent Percent Percent Percent Percent 0.14 1.42 1.13 2.38 1.00 0.19 0.17 0 3.77 .14 1.66 1.19 2.00 1.03 .20 .11 0 3.36 .09 5.17 1.34 1.28 .77 .11 .02 4.09 .79 .23 1.77 1.19 2.25 1.03 .20 .05 .66 2.99 .05 4.02 1.88 1.70 1.06 .13 .02 3.53 1.47 .04 4.58 1.92 1.88 .95 .09 .09 3.64 1.60
RILEY SILT LOAM, 8 MILES NORTHWEST OF CAIRO, ALEXANDER COUNTY, ILL.
Igni- Or Total tion
loss game
matter N PH
Percent Percent Percent Percent 100. 27 8.90 5.43 0.27 6.9 100. 26 6.52 3.27 .17 6.9 100. 20 5.83 1.00 .05 7.9 100.04 5.63 2.04 .09 7.5 100.10 5.73 .73 .04 7.7 99.88 6.48 1.24 .04 7.8
1.39 1.38 1.58
2.20 2.12 2.36
1.36 1.64 1.25
0.07 .09 .14
0.03 .07
1.08 1.34 .00
2.18 1.38 2.81
100.06 100.14 100.46
5.03 L81 0.10 3.21 .50 .04 4.56 L06 .07
PANTHER CLAY, I8I/2 MILES NORTHEAST OF FORREST CITY, ST. FRANCIS COUNTY, ARK.
6.10 5.83 5.82
1.53 2.26 1.58 2.19 1.56 2.14
0.48 .63 .63
0.19 .13 .10 I
0.16 .08 .03
5.84 5.16 5.17
SHARKEY CLAY, 6 MILES NORTHEAST OF LAKE VILLAGE, CHICOT COUNTY, ARK.
100. 46 100. 35 100. 25
11.33 6.89 6.15
5.83 1.82 L03
0.29 .15 .08
0-8 64.82 0.91 8-20 69.58 .74
20-50 63.18 .78
17.20 15.26 18.40 '
6.01 4.77 5.91
0.12 .09
0.99 .98
1.10
1.85 2.60 0.65 0.19 0.09 0 1.60 2.47 .96 .16 .06 0 2.18 2.59 .64 .13 .07 0
4.92 3.72 5.34
YAZOO SILTY CLAY LOAM, 5 MILES NORTHWEST OF YAZOO CITY, YAZOO COUNTY, MISS.
C1893 0-6 C1894 8-24 C1895 24-68
76.44 67.68 68.70
0.71 .74 ¡ .64
11.36 16.17 15.80
3.83 5.43 5.13
0.29 .09 I .09
0.50 0.93 2.08 1.02 0.15 0.09 0 2.65 .52 1.55 2.32 .62 .17 .04 0 4.67 .70 1.56 2.33 1.22 .12 .03 0 4.06
100.07 100.00 100.29
3.84 5.34 4.63
1.22 .70 .59
0.08 .07 .05
See footnotes at end of table.
7.8 7.6 7.5
5.9 5.0 4.8
100. 34 100.39 100. 40
7.34 4.95 6.87
2.54 1.28 L60
0.15 1 .08 1 .09 i
i
6.5 6.8 7.0
5.3 5.1 5.3
>
d
>
w O
O
C/2
bO

Sample No.
C1886- C1887. C1888_ C1889.
«1915 C1916_ C1917 C1918, C1919 C1920 C1921
TABLE 2.—Chemical analyses of alluvial soils oj the Mississippi River lowlands^Cjnthmed
SHARKEY CLAY, 5^ MILES WEST OF ROLLING FORK, SHARKEY COUNTY, MISS.
C1890 C1891 C1892
Depth
Inches 0-4
4-22 22-80
SÍO2
Percent 69.12 68.96 69.91
TÍO2
Percent 0.65
.65
AI2O3
Percent 15.23 15.58 15.06
Fe203
Percent 5.01 4.92 4.71
MnO
Percent 0.09
CaO
Percent 1.06
1.04
MgO
Percent 1.54 1.53 1.53
K2O
Percent 2.44 2.39 2.38
Na20
Percent 0.88 .85 .95
P2O5
Percent 0.21
.16
.14
Percent 0.12
.08
.06
CO2
Percent 0 0 0
Com-
water Total
Percent ¡Percent 4.14 I 100.49 4.21 103.37 3.71 100.28
Igni- tion loss
Percent 7.30 5.55 4.90
Or- ganic
matter
Percent 3.30 1.40 1.25
Percent 0.17
.11
.06
SHARKEY SILTY CLAY LOAM, 6 MILES SOUTH OF ONWARD, SHARKEY COUNTY, MISS.
0-12 12-16 16-30 30-90
68.86 63.04 66.01 66.11
0.73 .75 .70 .70
MATERIAL FROM A WELL H MILE NORTH OF ONWARD, SHARKEY COUNTY, MISS.
Feet 14 18 25 40
58-68 68-81
100
68.85 75.43 76.52 80.38 79.04 89.76 88.67
0.76 .53 .49 .39 .50 .22 .20
15.27 10.73 9.76 8.17 9.84 4.54 5.11
5.33 2.87 3.11 2.43 2.92 1.32 1.11
0.13 .03 .04 .03 .06 .04 .02
1.44 2.28 2.46 2.49 1.62 1.54 1.42
1.71 1.30 1.29 .85 .62 .43 .60
2. 35 2.40 2.20 1.98 1.80 1.40 1.19
0.95 1.34 1.30 1.28 .76 .69 .78
0.18 .14 .15 .17 .12 .04 .04
0.05 .07 .03 .07 .14
0.40 .79
1.71 .46 .44 .10 .50
3.26 1.59 1.15 1.52 2.09 .50 .31
100. 28 99.50
100. 21 100. 22 99.96
100. 67 100. 03
3.94 3.12 3.04 2.04 3.03 .80
1.00
0.34 .76 .18 .06 .51 .20 .21
ROBINSONVILLE SILT LOAM, 18 MILES NORTH OF BATON ROUGE, POINTE COUPEE PARISH, LA.
C3261 C3262
Inches 0-8
8-24 24-33+
78.50 77.62 75. 28
0.57 .73 .73
9.46 10.38 11.55
3.20 3.11 3.45
0.02 .04 .04
1.4 1.2
C3263 1.4
1.07 1.09 1.33
2.15 2.32 2. .38
1.79 1.67 1.50
0.15 .18 .20
0.17 .15 .18
1.40 1.62 1.91
0.04 .03 .03 .01 .03 .01 .01
pH
0.09 0 4.44 100. 37 7.36 3.05 0.20 5.6 .07 0 5.57 103. 30 6.81 1.31 .10 6.8 .07 0 4.76 133.19 6.00 1.30 .09 7.6 .08 0 4.89 100. 45 6.22 1.40 .08 7.7
7.7 7.9 8.0 8.1 7.9 7.9 8.0
99.89 100. 17 100. 00
2.75 2.25 2.62
L37 .60 .72
0.10 .05 .05
5.8 6.4 7.4
bO
O w o >
d
O
> O ?d I—! O
f
d id

SHARKEY SILTY CLAY, A\i MILES SOUTH OF GONZALES, ASCENSION PARISH. LA.
C3270 . C3271 . 03272^
0-8 8-24
24-48+
71.98 76. 44 76.58
0.74 .62 .64
13.90 4.22 12.18 3.71 11.92 3.98
0.05 .06 .11
0.97 .84 .71
1.34 1.05 1.00
1.90 1.58 1.51
0.75 .88 .84
0.18 .19 .05
0.12 .06
3.85 100. 00 7.00 3.27 0.17 2. 96 103. 57 3.99 1.06 .06 2. S7 100.29 3.41 .56 .05
C1922 C1923 C1924
ROBINSONVILLE SILT LOAM, 1 MILE SOUTH OF VACHERIE, ST. JAMES PARISH, LA.
0-6 10-24 48-80
78.63 72. 46 70.80
0.65 .76 .75
11.00 13.74 14.44
2.25 4.20 4.52
0.06 .08 .06
0.87 .91 .92
0.70 ! 1.24 1.34
2.48 2. 17 3.38
1.30 1.31 .93
0.13 .13 .17
0.16 .10
1. 94 100. 17 I 3.38 109.45 3.66 : 100.53 |
3.46 1.55 0.08 4.49 1.20 .07 4.38 .75 .06
SHARKEY CLAY, 6 MILES SOUTHEAST OF HOUMA, TERREBONNE PARISH, L.'^
C2106 . C2107_. C2108.
0-6 10-24 48-80
59.91 59.40 59.14
0. 80 .77 .76
19.66 20.04 20.03
6.29 6.70 7.00
0.07 .09 .10
1.14 1.09 1.20
2.53 2.26 2.75
2.67 2.64 2.69
0.26 .42 .60
0.26 . 17 .15
0.12 .08 .26
6.85 : 100.56 6. 55 103. 21 5. 94 100. 62
11.78 9.26 8.76
5.29 2.90 3.00
0.28 . 15 . 13
C5316^
SEDIMENT FROM CHANNEL OF THE MOUTH OF THE MISSISSIPPI RIVER AT BURRWOOD, PLAQUEMINES PARISH, LA.
12.96 ! 0.71 16.30 1.46 2.62 100.78 5.91
SEDIMENT FROM 3 M...ES SOUTHEAST OF SOUTHWEST PASS OF THE MISSISSIPPI RIVER IN GULF OF MEXICO AT 28°54' N., 9°23' W
C5315_ C5315_„
0-8 72-84
64. 32 64.12
0.74 .70
15.40 15.77
6.22 6.59
0.11 .11
l.Cl 1.72
2.34 2.18
2.95 2.82
2.35 2.28
0.16 .17
0.18 .32
1.33 .90
SEDIMENT 2 FROM GULF OF MEXICO AT 26°0' N., 85°52' W., AT A DEPTH OF WATER OF 1,770 FATHOM
C4417-_ C4418_.
0-72 0-72
55.78 55.80
0.65 .65
15. 55 14.90
5.73 6.41
0.12 .11
5.90 5.68
3.55 3.46
2.57 2.62
L69 1.90
0.18 .15
0.63 6.37 6.18
2.43 2.15
101. 15 100. 29
1.63 1.72
clS2%m^clu^^^^^ C1923,C1921, 2 Samples taken close to each other, at a point approximately E. H. Bailey. ^ ^' ^' ^«^^^s; pH determinations by mouth of the Mississippi River to the southern part of Florida.
0.09 .09
6.6 7.0
5.9 7. 1
5.9 7. 1 7.1
2.75 2.85
100. 46 100. 53
5.70 5.57
1.66 1.87
0.12 .13
8.3 8.0
8.4 8.3
at a point approximately % the distance from the
d
>
w o
w K
U2
^ ^
>
CO

24 TECHNICAL BULLETIN 83 3, XJ. S. DEPT. OF AGRICULTURE
Examination of the data for the Wabash soil profile at New Albin, Iowa, shows it to be highly stratified. The material from 0 to 25 inches is rather constant in texture and chemical composition, com- posed largely of silt and clay that contain no calcium as carbonates; it is rather high in organic matter and has a pH of 6.9. The material from 28 to 42 inches is much coarser in texture than the above stratum and has only half as much clay; it contains about 9.0 percent CaCOa (assuming all the CO2 to be from calcium carbonate). It is low in organic matter and has a pH of 7.9. The above stratum is underlain by a stratum from 44 to 62 inches of rather black material composed largely of silt and clay. This layer perhaps represents the pre- agricultural surface soil in the bottom, before sheet erosion took place. This material contains but little calcium as calcium carbonate, is higher in organic matter, and less basic than the stratum above it. The silt and clay are underlain by a stratum from 68 to 94 inches similar in texture and composition to the calcareous stratum from 28 to 42 inches.
The Riley profile near Cairo, 111., represents a fairly large area of land lying along the entire border of a peninsula formed by an abrupt bend in the Mississippi River at the southern end of the State of Illinois. The islands of Burnham, Bumgard, and Angelo Towhead, formed by the river a short distance away from this area, are mapped as the Riley soil series by the Illinois Agricultural Experiment Station.
The chemical composition of the Riley profile indicates a thoroughly mixed soil material. The percentage of calcium carbonate is low and is confined to the more sandy portion of the soil profile. The quantities of the more active bases, especially that of sodium, are relatively high throughout the profile. Subsequent data show the colloid of this soil to be very much lower in sodium than the whole soil and only slightly higher in the other more active bases. This shows that the non- colloidal material of this soil contains much mineral matter other than quartz.
The chemical data for the Panther clay profile near Forrest City, Ark., show slight but characteristic differences worthy of note. This soil profile, though high and somewhat uniform in clay content, is slightly lower in bases, especially calcium, than other soils of similar texture of this group. It has a pH of 5.9 to 4.8, becoming more acid with depth. These differences indicate that this alluvium has lost more bases and is much older than any of the other profiles in this table. There are also evidences of incipient profile development indi- cated by the accumulation of calcium, manganese, and organic matter in the surface horizon.
The Sharkey silty clay 4)^ miles south of Gonzales, La., and the profile from 6 miles south of Houma, La., are similar in chemical composition in respect to all constituents, except potassium and phos- phorus oxides, when differences in clay and silt contents are considered. These constituents are definitely higher in both the soils and the colloids of the Houma profile. These differences in chemical com- position probably may be attributed to the influence of material deposited in the Houma area during overflows from the Atchafalaya River. These soils show no evidence of proflle development except the small accumulation of organic matter in the surface soil and perhaps a perceptible amount of illuviation that naturally takes place in the surface of almost all soil. With few exceptions the alluvial material becomes more basic with depth. Particularly is this true for

ALLUVIAL SOILS OF THE MISSISSIPPI BASIN 25
the Sharkey profile near Onward, Miss. (C1886 to C1889), and the material from the well nearby (C1915 to C1921). All the material examined from the well contained small but varying amounts of carbonates. The pH values varied from 7.7 to 8.1. The high and variable content of sand in the lower strata of the well profile prohibits a fair comparison of the chemical composition of this material to that of the Sharkey soil profiles. A better conception of the composition of the clays of this material may be had from subsequent data for the chemical composition of the colloids.
In all respects except in the amounts of silica and calcium carbonates the Gulf sediments (C4417 and C4418) from a depth of 1,770 fathoms are essentially the same in chemical composition as the samples from the mouth of the Mississippi and the Sharkey soil from Houma, La. Carbon dioxide in the Gulf samples is 6.37 and 6.18 percent. In the sample from the mouth of the river the percentages of carbon dioxide are 1.46, 1.33, and 0.90. The Sharkey soil has none. The silica is lower in the Gulf sediments than it is in the Sharkey soils, because of the greater abundance of calcium carbonate and the minor quantities of quartz sand.
In order to make the data for the sediments from the channel of the mouth of the Mississippi River and from the Gulf of Mexico comparable to that of the other soils, the sediments were leached with distilled water to free them from the excess soluble salts that they had acquired from the sea water. Upon leaching the sediments from the Gulf which had acquired considerable calcium carbonate, the colloidal material remained flocculated and thus permitted the removal of the excess sodium chloride, but the river sediments which contained only a normal amount of calcium carbonate soon became deflocculated and prevented the removal of all the acquired sodium chloride. Therefore, the river sediments are, in comparison to those of the Mississippi alluvium, abnormally high in sodium oxide, whereas the Gulf sediments are abnormally high in calcium oxide.
The major differences in chemical composition of the Yazoo soils compared to the soils of the Sharkey series are those normally asso- ciated with difference in texture and in the content of the bases. However, the soils of the Yazoo profile from near Yazoo City, Miss. (C1893 to C1895), are relatively low in organic matter, calcium, and magnesium oxides, and are acid throughout the profile. The range in pH values is from 5.3 to 5.1. The low contents of organic matter and bases and the acid character of this soil are probably due to the presence of coastal plain material transported from areas drained by the northeastern tributaries of the Yazoo River. The four principal tributaries to the upper Yazoo River are the Coldwater, Little Tal- lahatchie, Yocona, and Yalobusha Rivers. These rivers drain the upland portion of the Yazoo drainage basin which comprises some 5,800 square miles of the Gulf Coastal Plain. Some of this upland is covered by loess material. The areas of both loess and Coastal Plain material show pronounced surface and vertical erosion. The results of a detailed study of erosion in two representative creek val- leys of this section are reported by Happ, Rittenhouse, and Dobson (18). From this information, together with other considerations, it is evident that the Yazoo Delta is composed of variable quantities of material transported from the Gulf Coastal Plain admixed with mate- rial carried by the Mississippi River.
467217°—42 4

2Ö TECHNICAL BULLETIN 8 3 3, U. S. DEPT. OF AGRICULTURE
The soil profile of the Robinsonville series from north of Baton Rouge, La. (C3261 to C3263), has a relatively high base content and a range in pH values from 5.8 to 7.4. The soil is productive and is used largely for the growing of sugarcane. The Robinsonville soil profile from, near Vacherie, La. (C1922 to C1924), is well supplied with bases, and its pH values range from 5.9 to 7.1. The compositions of the two latter Robinsonville soil profiles are strikingly similar to those of the Sharkey soils of the Mississippi Delta when textural differences are considered.
CHEMICAL ANALYSES OF THE COLLOIDS
The data in table 3 show the colloids of the various soil profiles to be essentially the same in chemical composition both within the profile and in the various profiles. There are, however, certain interesting differences within the profiles and between the profiles.
The following are the most common variations in the profiles: A low content of silica in the surface that increases slightly with depth and a somewhat higher content of alumina and combined water that decreases with depth. This type of variation does not occur in all the profiles but is to be noted in the profiles farthest up the river. It is most pronounced in the Wabash profile of northeastern Iowa and the Riley profile of southern Illinois. This indicates that the more recent alluvium is slightly more laterized than the earlier. Whether this is the result of stratification or profile development is not easy to say, but there are reasons to suspect pronounced stratification. The water shed that contributes to the Wabash profile from Iowa is exten- sive and diversified in geological material and topography. It has a very unequal distribution of rainfall. Since the alluvium, at this point has not been t^-ansported far from the mouths of the many tributaries to the upper Mississippi River, stratification should be expected.

Sample No.
TABLE 3.—Chemical analyses of the alluvial soil colloids of the Mississippi River lowlands
WABASH SILT LOAM, 1 MILE SOUTH OF NEW ALBIN, ALLAMAKEE COUNTY, IOWA
C2972 C2973 C2974 C2975 C2976 C2977
Depth
Inches 0-10
in-2.5 28-42 44-62 68-78 80-94
SÍO2
Percent 48.08 51.15 51.22 51.11 51. 40 52. 03
Percent 0.58 .55 .59 .54 .58 .56
AI2O3
Percent 23.23 20.07 19. 07 20.10 19.60 17.80
Fe203
Percent 11.16 12.09 12.40 11.93 12.70 13.66
Percent 0.17
.12
.12
Percent 2.52 2.72 3.46 3.11 3.12 3.34
MgO K2O Na20
ercent Percent 1.91 1.62 1.83 1.51 2.73 1.34 2.61 1.58 2.62 1.40 2.60 1.28
Percent Percent 0.15 0. 35 .17 .34 .08 .37
.30
.34
.25
.25
.18
.34
SO3
Percent 0.18 .08 .09 .08 .07 .05
CO2
Percent 0 0 0 0 0 0
Com- Igni- bined Total tion water loss
Percent Percent Percent 10.11 103. 06 17.07 9.03 103. 22 14. 02 8.88 133. 53 13. 31 8.54 103. 27 11.84 8.50 103. 59 11.46 7.91 99. 91 10. 62
Organ- ic mat-
ter
Percent 7.74 4.85 4.83 3. 63 3.23 2.94
RILEY SILT LOAM, 8 MILES NORTHWEST OF CAIRO, ALEXANDER COUNTY. ILL.
C1896 C1897 C1898
0-12 16-36 40-68
50. 88 52.84 54.00
0.59 .58 .56
21.75 21.16 21.35
9.87 10.65 9.62
0.08 .07 .23
1.44 2.40 1.40 2.78 1.21 2.78
2.24 0.73 0.24 0.06 0 10.12 100. 40 12.20 2.31 2.48 .11 .32 .09 0 8.14 100. 62 11.08 3.26 2.70 .14 .24 .09 0 7. 75 100. 67 9.89 2.32
PANTHER CLAY, IS^/^ MILES NORTHEAST OF FORREST CITY, ST. FRANCIS COUNTY, ARK.
C3264 C3265 C3266
0-8 8-20
20-44
52.48 53.00 53.10
0.59 .62 .66
23. 67 23.42 23. 20
8.54 8.77 8.85
0.07 .05 .04
1.31 1.18 1.62
2.50 2.51 2.48
1.90 1.79 1.72
0.01 .07 .06
0.22 .16 .14
0.11 .07 .04
8.84 8.74 8.70
100. 24 11.92 103. 38 10.62 100. 61 9.81
SHARKEY CLAY, 6 MILES NORTHEAST OF LAKE VILLAGE, CHICOT COUNTY. ARK.
C3279 C3280 C3281
0-8 8-20
20-50
52.92 53. 42 53.58
0.65 .63 .58
22.60 22.75 22.40
9.38 9.84
0.07 .06 .07
1.47 1.41 1.44
2.84 2.85 3.14
2.47 2.46 2.22
0.32 .30 .29
0.25 .17 .13
0.13 .14 .12
7.53 100. 63 103. 89 100. 49
9.62 9.24
YAZOO SILTY CLAY LOAM, 5 MILES NORTHWEST OF YAZOO CITY, YAZOO COUNTY, MISS.
C1893 C1894 C1895
0-6 8-24
52.10 53.28 54. 10
0.73 .60 .54
23.40 22.55 23. 06
9.02 9.33 8.92
0.16 .05 .05
1.13 1.08 1.01
2.07 2.41 2.55
2.24 2.13 1.87
0.38 0.34 .30 .19
See footnote> at end of table.
3.38 2.06 1.20
2.26 2.55 1.67
0.08 0 8.56 100. 21 10.70 2.32 .06 0 8.40 100.11 9.54 1.25 .06 0 7.43 100. 29 8.42 1.07

TABLE 3.—Chemical analyses of the alluvial soil colloids of the Mississivpi River lowlands—Continued
SHARKEY CLAY, 5H MILES WEST OF ROLLING FORK, SHARKEY COUNTY, MISS.
Sample No. Depth SÍO2 TÍO2 AI2O3 Fe203 MnO CaO MgO K2O Na20 P2O5 SO3 CO2 Com- bined water
Total Igni- tion loss
Organ- ic mat-
ter
C1890-. C1891 C1892..
Inches 0-4
4-22 22-80
Percent 52. 80 52.66 53.08
Percent 0.68 .69 .60
Percent 23.46 23.00 23.18
Percent 8.36 9.89 9.11
Percent 0.07 .07 .05
Percent 1.72 1.32 1.45
Percent 2.28 2.42 2.39
Percent 2.43 2.33 2.33
Percent 0.32 .38 .35
Percent 0.28 .18 .17
Percent 0.11 .11 .08
Percent 0 0 0
Percent 8.18 8.16 7.67
Percent 100. 69 100.81 100. 46
Percent 11.27 10.21 9.74
Percent 3.36 2.23 2.24
SHARKEY SILTY CLAY LOAM, 6 MILES SOUTH OF ONWARD, SHARKEY COUNTY, MISS.
to 00
>
w d e
CI886 C1887 C1888 Cl 889
0-12 51.90 0.79 24.07 8.62 0.09 1.26 2.18 2.66 0.12 0.30 0.12 0 8.29 100. 56 11.90 12-16 52.70 .74 23.60 8.39 .07 1.33 2.89 2.74 .11 .19 .13 0 7.57 100. 31 9.00 16-30 52.61 .69 22.64 9.32 .05 1.62 2.56 2.22 .47 .17 .11 0 7.45 99. 95 9.77 30-90 53.48 .66 21.95 9.19 .07 1.78 2.55 2.24 .51 .23 .14 0 7.70 100. 50 9.20
MATERIAL FROM A WELL H MILE NORTH OF ONWARD, SHARKEY COUNTY, MISS.
ROBINSONVILLE SILT LOAM, 18 MILES NORTH OF BATON ROUGE, POINTE COUPEE PARISH, LA.
3.94 1.55 2.51 1.62
C1915 C1916_ _ _
Feet 14 18 25 40
58-68 68-81
100
52.84 52.54 52.47 52.19 53.40 5L90 52.80
0.66 .62 .72 .72 .71 .61 .64
21.21 21.45 20.90 2L65 21.83 23.28 22.72
9.30 10.36 10.11 11.00 9.36 8.60 8.82
0.08 .07 .16 .11 .08 .10 .09
1.74 1.89 1.18 .91 .68 .76 .64
2.43 2.42 2.71 2.41 2.40 1.86 L98
2.34 2.13 2.18 2.20 2.13 2.51 2.56
0.47 .54 .52 .74 .86 .70 .70
0.17 .32 .27 .12 .21 .28 .20
0.07 .08 .10 .10 .07 .08 .10
0 0 0 0 0 0 0
8.12 7.93 8.27 8.06 8.03 9.56 7.76
99.90 100. 57 100. 31 100. 78 100.12 100. 57 99.66
9.13 12.35 10.49 11.33 9.86
15.29 12.24
LIO 4.80
C1917 2.42 C1918^ 3.56 C1919 1.99 C1920 C1921
6.34 4.86
C3261 Inches
0-8 8-24
24-38+
5L54 52.28 52.05
0.62 .51 .64
21.10 2L66 23.00
9.80 10.54 10.03
0.09 .08 .09
2.43 2.23 2.49
2.48 2.48 2.66
2.32 2.27 2.06
0.09 .10 .10
0.25 .24 .23
0.13 .12 .13
0 0 0
9.94 7.70 7.18
100. 79 100. 21 100. 60
14.52 10.32 9.82
5.08 C3262-_ _ 2.84 C3263 2.88
Ö
O
O Pi I—I
O

SHARKEY SILTY CLAY, iy2 MILES SOUTH OF GONZALES, ASCENSION PARISH, LA.
C3270-. C3271_. C3272_.
0-8 8-24
24-48+
52.00 50.78 50.02
0.67 .66 .65
23.54 24.22 24.52
8.44 9.78
10.10
0.05 .06 .06
1.38 1.47 L47
2.65 2.58 2.34
L81 L43 1.25
0.16 .11 .07
0.14 .10
9.29 9.20 9.50
100. 20 100.47 100.13
13.04 11.19 10.89
ROBINSONVILLE SILT LOAM, 1 MILE SOUTH OF VACHERIE, ST. JAMES PARISH, LA.
C]922_. C1923_ C1924
0-6 10-24 48-80
51.46 51.76 51.82
0.69 .70 .67
21.56 23.22 22.65
0.17 .10 .10
1.44 1.43 1.38
2.61 2.37 2.16
2.26 2.42 2.62
0.25 .23
0.20 .12 .18
9.03 8.50 8.75
99.94 100. 78 100.60
13.35 10.98 10.30
4.14 2.20 L52
4.75 2.71 L70
>
d <
c
o
Ul m H-! Tí
>
SHARKEY CLAY, 6 MILES SOUTHEAST OF HOUMA, TERREBONNE PARISH, LA.
C2106_ C2107_ C2108_
0-6 10-24 48-80
53.54 52.58 53.30
0.66 23.80 .68 23.74 .67 23.03
7.65 7.82 8.45
0.05 .05 .06
1.27 1.08 1.20
1.99 2.32 2.48
2.39 1.87 2.60
0.61 .53 .60
0.18 .12 .14
8.12 8.62 7.82
100. 54 99.54
100. 54
IL 68 10.68 9.47
3.88 2.25 1.79
SEDIMENT FROM CHANNEL OF THE MOUTH OF THE MISSISSIPPI RIVER AT BURRWOOD, PLAQUEMINES PARISH, LA.
53. 90 0.08 2.95 0.21 0.18 0.07 7.56 9.32 L84
SEDIMENT FROM 3 MILES SOUTHEAST OF SOUTHWEST PASS OF THE MISSISSIPPI RIVER IN GULF OF MEXICO AT 28°54' N., 89°23' W.
C5315_. C5315.
0-8 72-84
51.46 52.30
0.64 .63
23.22 23.17
9.77 9.52
0.10 .09
L12 L31
2.31 3.02
2.62 2.51
0.19 .20
0. 22 0. 20 .20 .22
0.04 .23
8.25 7.42
100.14 100.82
10.29 9.96
2.18 2.49
SEDIMENT 2 FROM GULF OF MEXICO AT 26°0' N., 85°52' W., AT A DEPTH OF WATER OF 1,770 FATHOMS
C4417 0-72 0-72
54.94 54.64
0.68 .69
21.10 21.12
8.63 8.80
0.08 .08
2.27 2.01
2.79 2.86
2.48 ±.21
2.48 2.42
0.12 .19
0.17 .17
0.20 .20
0.89 .66
6.47 6.65
100.82 100.49
9.34 9.70
2.12 2.56 C4418
Average i - _ 52.32 ±.83
0.64 ±.05
22.36 ±L02
9.68 ±.92
0.09 ±.03
L60 ±.50
2.15 ±.33
0.33 ±.20
0.23 ±.06
0.11 ±.03
8.33 ±.63 Average deviation i
1 Determinations by R. S. Holmes, with exception of C3264-C3266 and C3270-C3272, 2 These averages do not include the Gulf samples (C4417-C4418). determmed by G. Edgington.
CO.

30 TECHNICAL BULLETIN 8 3 3, U. S. DEPT. OF AGRICULTURE
The variations in the Riley profile from Cairo, 111., are similar to those of the Wabash but are less prononnced. They also reflect the presence of the sedimentary material from the Missouri Tiiver. The profile is much lower in calcium oxide and higher in potassium oxide throughout the profile than the Wabash. In fact, the colloid from the bottom horizon of the Riley profile is practically identical in composition to that of the colloids from the Missouri alluvium (C3014 to C3017) in table 7. This indicates that the greater part of the alluvium at Cairo came from the drainage area of the Missouri River and not from that of the upper Mississippi.
The colloids of the Sharkey profile at Onward, Miss., sampled to the depth of 100 feet, remained essentially the same in composition to the depth of approximately 50 feet. The colloids below the 50 feet depth are definitely lower in calcium and magnesium oxides. This is the result of the removal of these constituents by the carbonated waters that exist in the same strata, which are located at these depths. The analysis of the water from a well 62 feet deep at Snave, 7 miles southwest of Onward, shows it to contain 188 p. p. m. of calcium, 85 p. p. m. of magnesium, and 620 p. p. m. of bicarbonates (33).
VARIATIONS BETWEEN THE PROFILES
The variations in the composition of the colloids in respect to the different profiles are slight. They are most pronounced in the Wabash profile, which represents the upper Mississippi alluvium, when compared to the alluvium profiles located south of the mouth of the Missouri River. The colloids of the alluvium from the upper Mississippi River differ from those of the alluvium south of the confluence of the Missouri River by having an appreciably higher con- tent of calcium and iron and a slightly higher content of phosphorus. The soil colloids from south of the mouth of the Missouri River are all higher in potassium than the colloids from the upper Mississippi. However, the colloids as a whole extracted from thé profiles located south of the mouth of the Missouri River are very similar to one another in chemical composition. There are certain areas that seem to have received more of the material carried by the Missouri River than others. For example, the colloids of the two profiles that differ most widely are those of the Sharkey clay (C3279 to C3281) at Lake Village, Ark., and the Sharkey silty clay (C3270 to C3272) at Gonzales, La. These two soils are 215 miles apart and are on opposite sides of the river. The averages for the composition of the colloids of each of the two profiles show the colloids from the Lake Village pro- file to be higher in silica, magnesium oxide, and the monovalent bases. The silica is higher by 2.38, the magnesium oxide by 0.42, the potassium oxide by 0.88, the sodium oxide by 0.23 percent, respectively. In respect to the other constituents, the colloids of these two profiles are essentially the same. These differences are small but consistent and significant. They characterize the Lake Village alluvium as being somewhat less weathered and less lateri- tized than the Gonzales alluvium. Though the Lake Village profile is located just south of the mouth of the Arkansas River, it reflects little the presence of the Arkansas River material. The composition of the Lake Village colloids, when compared with the composition of the colloids from the Arkansas and then with the composition of the Missouri and tributary rivers, and with that of the Yellowstone and

ALLUVIAL SOILS OF THE MISSISSIPPI BASIN 31
Phitte Rivers, as given in table 7, is seen to be more nearly the same as that of the colloids from the Missouri, Yellowstone, and Platte^ Rivers than it is that of the colloids from the Arkansas River.
The colloids C4417 and C4418 from the Gulf of Mexico sediments, with the exceptions of the contents of silica and calcium and mag- nesium oxides, are essentially the same in chemical composition as the averages for the colloids of the Mississippi alluvium. The higher content of colloidal silica is no doubt the result of the siliceous residue from the diatoms and radiolaria skeletons. But little of the carbonates of the two samples of Gulf sediments is in the colloidal state.
Colloids of the alluvial soils contain little or no carbon dioxide. The colloids of the Gulf sediments contain 0.89 and 0.66 percent carbon dioxide. If this is combined in dolomite and the calcium and mag- nesium oxide percentages corrected for equivalent amounts of carbon dioxide, the percentages are 1.61 and 1.53 calcium oxide and 2.45 and 2.58 magnesium oxide. The averages for the Mississippi alluvium are 1.60 percent calcium oxide and 2.48 percent magnesium oxide. These figures indicate that the colloids of the Gulf sediments, when corrected for additive material by marine life, are essentially the same as the averages for the colloids for the Mississippi alluvium. Assum- ing the source of this material to be from the Mississippi River, these data indicate that the Gulf marine environments have altered its chemical composition little if at all.
DERIVED DATA FOR THE COLLOIDS
In table 4 are assembled the ratios, by formula weights, of the silica to the various other constituents. As a whole, these ratios are remark- ably uniform throughout this whole group. The averages of ratios of silica to sesquioxides is 3.12; to alumina, 3.99; to iron oxide, 14.64; to the combined water plus the water equivalent of the total bases, 1.51 ; and to the total bases, 7.59. The average deviations in the same order are: 0.10, 0.21, 1.51, 0.11, and 0.77. None of these varies from the average by more than 11 percent. They verify the conclusions reached in the discussion of the chemical composition of the colloids. The ratios of silica to the sesquioxides are slightly lower in the surface horizon of the first three profiles. The ratios of silica to iron oxide and silica to total bases vary the most widely. The ratios of silica to iron oxide vary in no uniform manner within the profile. Since the iron oxide is most affected by profile development and in most soils shows some rather uniform type of variation within the profile, it cannot be said that this sporadic variation is indicative of profile development but is rather the result of stratification. The ratios of silica to total bases indicate no significant variations within the profile but do show slight variation between the profiles. The larger the ratio, the lower the total bases. These ratios as a whole are similar in value to the ratios for the better soils formed in place in the drainage area. They also indicate colloidal material that is rather high in mineral material. The mineralogical composition of these colloids is con- sidered in the general discussion. In general, the colloids of the most acid soils are lowest in total bases. This statement is not true in the case of the colloids from the deep well profile C1915 to C1921. Since these soils are known to contain bicarbonates, the pH values as de- termined in this laboratory do not represent their t'^ne hydrogen-ion concentrations under natural field conditions.

32 TECHNICAL BULLETIN 833, U. S. DEPT. OF AGRICULTURE
TABLE 4.—Derived data: Alluvial soil colloids of the Mississippi River lowlands
WABASH SILT LOAM, 1 MILE SOUTH OF NEW ALBIN, ALLAMAKEE COUNTY, IOWA
Depth SiOz R2O3
SÍO2 AI2O3
SÍO2 Fe203
SiOa SiOa Com- bined
water ^
Com- bined water Sample No. Combined water of
the soil acids 1 Total bases 2 of the soil
acids 1
C2972 C2973 C2974 C2975 C2976 C2977
Inches 0-10
10-25 28-42 44-62 68-78 80-94
2.69 3.12 3.22 3.13 3.13 3.33
3.51 4.32 4.56 4.32 4.42 4.97
11.45 1L25 10.91 11. 39 10. 67 10.14
1.18 1.31 1.34 1.37 1.39 1.49
7.14 7.55 5.89 6.03 6.20 6.05
Percent 10.11 9.63 8.84 8.54 8.50 7.91
Percent 12.13 11. 05 11.47 11.07 10.97 10. 50
RILEY SILT LOAM, S MILES NORT IWE3T OF CAIRO, ALEXANDER COUNTY, ILL.
C1896 C1897 C1898
0-12 3.08 6-36 3.21
40-68 3,33
3.97 4.24 4.50
7.67 10.12 7.18 8.14 7.40 7.75
12. 10 9.86 9.94
PANTHER CLAY, I8I/2 MILES NORTHEAST OF FORREST CITY, ST. FRANCIS COUNTY ARK.
C3264 C3265 C3266
0-8 3.06 3.77 16.28 8-20 3.10 3.84 16.07
20-44 3.12 3.89 15 96
10.74 10.61 10.67
SHARKE Y CLAY, 6 MILES NORTHEAST OF LAKE VILLAGE, CHICOT COUNTY, ARK.
C3279 C3280 C3281
0-8 3.14 8-20 3.12
20-50 3.22
YAZOO SILTY CLAY LOAM, 5 MILES NORTHWEST OF YAZOO CITY, YAZOO COUNTY MISS.
C1893 C1894 C1895_
0-6 3.03 3.78 15.78 8-24 3.13 3.95 15.24
24-68 3.19 3.98 16.12
10.40 9.78 9.40
SHARKEY CLAY, 5H MILES WEST OF ROLLING FORK, SHARKEY COUNTY, MISS.
C1890 C1891 C1892
0-4 3.10 3.83 16.77 4-22 3.05 3.89 14.15
22-80 3.11 3.88 15.59
1.54 1.55 1.63
7.44 7.67 7.66
8.18 8.16 7.66
10.30 10.21 9.74
SHARKEY SILTY CLAY LOAM, 6 MILES SOUTH OF ONWARD, SHARKEY COUNTY, MISS
C1886 C1887 C1888 C1889
0-12 2.98 3.66 16.00 12-16 3.09 3.79 16.70 16-30 3.19 3.95 16.80 30-90 3.26 4.13 15.45
1.51 1.59 1.63 1.61
7.87 8.29 6.63 7.57 7.08 7.45 7.01 7.70
10.27 9.94 9.67
10.00
MATERIAL FROM A WELL }4 MILE NORTH OF ONWARD, SHARKEY COUNTY, MISS.
C1915 C1916 C1917 C1918 C1919 C1920 C1921
Feet 14 3.30 4.23 15. 12 18 3.18 4.16 13.48 25 3. 25 4.26 13.69 40 3.09 4.09 12.62
58-68 3.26 4.15 15.17 68-81 3.06 3.83 16.03
100 3.16 3.94 15. 92
1.53 1.55 1.49 1.58 1.64 1.40 1.68
7.11 7.00 6.30 8.65 9.30 9.88 9.90
8.12 7.93 8.27 8.06 8.03 9.56 7.76
10.34 10.02 10.42 9.87 9.75
11.13 9.36
1 Combined water-fwater equivalent of the total bases. 2 Calcium, magnesium, potassium, and sodium oxides 3 Ignition loss less organic matter and CO2.

ALLUVIAL SOILS OF THE MISSISSIPPI ÜASIN 33
TABLE 4.—Derived data: Alluvial soil colloids of the Mississippi River lowlands—Continued
liOBINSONVILLE SILT LOAM, 18 MILES NORTH OF BATON ROUGE, POINTE COUPEE PARISH, LA.
Depth SÍO2 R2O3
SÍO2 AI2O3
SÍO2 re203
SÍO2 SÍO2 Com- bined water ^
Com- bined water
Sample No. Combined water of the soil acids 1 Total bases 2 of the
soil acids 1
C3261 C3262 C3263
Inches 0-8
8-24 24-38+
3.20 3.13 3.00
4.14 4.10 3.84
13.97 13.20 13.79
1.26 1.60 1.62
6.56 6.86 6.47
Percent 9.94 7.70 7.18
Percent 12.29 10.00 9.59
SHARKEY SILTY CLAY, ^H MILES SOUTH OF GONZALES, ASCENSION PARISH, LA.
C3270 C3271 C3272
_--_ 0.8 . i 8-24
...._; 24-48+
3.05 2.82 2.74
3.75 3.55 3.46
16.37 13.79 13.16
1.38 1 7.83 ^ 1.30 i 7. 55 ¡ 1.33 i 8.45
9.29 12.27 9. 20 11. 12 9. 50 11.28
ROBINSONVILLE SILT LOAM, 1 MILE SOUTH OF VACHERIE, ST. JAMES PARISH, LA.
C1922 C1923 C1924
i 0-6 !
10-24 48-80
3.16 3.01 3.07
4.05 ! 3.78 3.88
14. 26 14. 69 14.70
1.39 1.47 1.46
7.42 7.77 8.06
9.03 i 8.50 8.75
11.11 10.50 10.67
SHARKEY CLAY, 6 MILES SOUTHEAST OF HOUMA, TERREBONNE PARISH, LA.
0-6 10-24 48-80
3.17 3.11 3.46
3.82 3.75 3.92
18.62 17.88 16. 77
1.62 1.52 1.63
9.00 ' 9.03 1 7.96
1 8.12 1 8.62 7.82 !
i
9.99 10.38 9.82
C2106_ C2107^ C2108
SEDIMENT FROM CHANNEL OF THE MOUTH OF THE MISSISSIPPI RIVER, AT BURRWOOD, PLAQUEMINES PARISH, LA.
C5316^ 0-54 3.27 16.64
SEDIMENT FROM 3 MILES SOUTHEAST OF SOUTHWEST PASS OF THE MISSISSIPPI RIVER IN GULF OF MEXICO AT 28°54'N., 89°23'W.
C5315 0-8 72-84
2.97 3.03
3.76 3.83
14.00 14.60
1.57 1.63
7.93 7.09
8.25 7.42
10.19 C5315 9.63
SEDIMENT i FROM GULF OF MEXICO AT 26°0' N., 85°52' W., AT A DEPTH OF WATER OF 1,770 FATHOMS
C4417_ C4418
0-72 0-72
3.50 3.47
4.42 4.39
16.94 16.51
1.92 1.86
7.77 7.61
6.47 6.65
8.58 8.80
Average ^ Average devia-
tion
3.12
±.10
3.99
±.21
14.64
±1.51
1.51
±.11
7.59
±.77
8.33
±.63
10.35
±.66
* Samples taken close to each other, at a point approximately % the distance from the mouth of the Mis- sissippi River to the southern part of Florida.
5 These averages do not include the samples from the Gulf of Mexico (C4417-C4418).
WESTERN TRIBUTARIES
MECHANICAL ANALYSES OF THE ALLUVIAL SOILS
In table 5 are given the data for the mechanical analysis of one or more soil profiles from certain of the western tributaries to the Mississippi River. The first three profiles are from the Milk, upper
467217°—42 5

34 TECHNICAL BULLETIN 8 3 3, U. S. DEPT. OF AGRICULTURE
Missouri {IJf), and Yellowstone Rivers. These three rivers together with their many tributaries drain the northern part of the Great Plains province known as the Missouri Plateau. The data for the mechanical analysis of the samples from these profiles contribute little in differentiating these soils. The soils are composed almost wholly of very fine sand, silt, and clay. The average percentages of clay in the profiles from the Milk, upper Missouri, and Yellowstone Rivers are 45, 34, and 23, respectively. The nonclay portions of the profiles are composed largely of silt. The unusually high percentage of clay in the Milk River profile undoubtedly reflects characteristic glacial material, such as covered the drainage area of the Milk River {16). The valley of the Milk River from Havre to its union with the Missouri is a broad flood plain from 2 to 4 miles wide. It is thought that this valley was formed and occupied by the Missouri River before it was displaced by glaciation. The Milk River, which is a much smaller river than would be expected for such a large valley, now meanders tortuously over this wide flood plain which was filled by glacial till to a depth of 100 feet or more above the former channel {14),
The depths of the glacial covering over the drainage area of the Milk River vary widely, ranging from 0 in places along the deeper cut
TABLE 5.—Mechanical analyses of alluvial soils from western tributaries to the Mississippi River ^
MILK RIVER: HAVRE CLAY, 3 MILES NORTHWEST OF NASHUA, VALLEY COUNTY, MONT.
Sample No. Depth
Fine gravel
(2-1 mm.)
Coarse sand (1-0.5 mm.)
Me- dium sand
(0.5-0.25 mm.)
Fine sand
(0.25-0.1 mm.)
Very fine sand
(0.1-0.05 mm.)
Silt (0.0.5- 0.002 mm.)
Clay (less than 0.002 mm.)
Or- ganic
matter byH20j
C2999 . Inches
0-8 15-25 40-60
Percent 0.2 .1 .2
Percent 0.2 .1
0
Percent 0.2 .1 .1
Percent 0.9 1.5 .6
Percent 2.5 5.9 8.0
Percent 46.3 51.7 41.7
Percent 47.6 39.7 48.2
Percent 1.7
C3000 6 C3001 .3
MISSOURI RIVER: HAVRE SILTY CLAY, H MILE NORTHEAST OF FORT PECK, VALLEY COUNTY, MONT.
C3002 C3003 C3004 C3005 C3006 100-145 0 .2 .2 1.7 37.1 40.6 19.2 .2 C3007 160-f 0 .1 .1 46.6 40.6 6.2 5.9 .3
YELLOWSTONE RIVER: HAVRE SILTY CLAY LOAM, NEAR SIDNEY, RICHLAND COUNTY, MONT.
0-8 0.1 0.2 0.4 2.1 5.2 54.5 35.1 15-30 0 0 .1 .1 .3 43.7 54.4 0 0 0 .1 LO 11.3 55.2 31.2
70-90 0 0 0 .2 .3 37.8 59.5 100-145 0 .2 .2 1.7 37.1 40.6 19.2
160+ 0 .1 .1 46.6 40.6 6.2 5.9
C3008. C3009. C3010. C3011. C3012. C3013.
0-8 0 0.3 0.7 7.2 9.6 52.7 23.8 15-25 0 .2 1.6 8.3 64.7 23.4 42-50 0 .1 1.3 5.3 57.4 34.7 60-75 0 .1 1.6 13.0 70.4 13.6 80-96 .3 .1 .3 2.7 59.6 35.5
120-f 0 .3 56.0 21.2 17.7 4.4
5.3 1.0 1.0 .6
MISSOURI RIVER: LAUREL LOAM, 2 MILES NORTH OF MOBRIDGE, COUNTY, S. DAK.
C3014. C3015. C3016. C3017.
WALWORTH
0-10 0 0.1 0.5 16.6 23.3 37.5 19.6 28-42 .1 .1 .1 .1 15.4 55.4 26.7 48-72 .1 .1 .1 .2 1.5 51.3 45.1 84-96 .3 .2 .1 .5 1.8 72.5 23.5
1.8 1.3

ALLUVIAL SOILS OF THE MISSISSIPPI BASIN 35
TABLE 5.—Mechanical analyses of alluvial soils from western tributaries to the Mississijyyi River ^—Continued
PLATTE RIVER: LAMOURE FINE SANDY LOAM, 1 MILE SOUTHWEST OF MAXWELL, LINCOLN COUNTY, NEBR.
Sample No. Depth
C3726 Inches
0-10 C3727 10-24 C372H 24-36 CS79Q 3fi-42
Fine irravel
(2-1 mm.)
Percent 2.3 3.6 3.3 4.3
Coarse sand (1-0.5 mm.)
Percent 10.5 10.5 15.5 13.9
Me- dium sand
(0.5-0.25 mm.)
Percent 9.7
10.9 17.2 24.2
Fine sand
(0.25-0.1 mm.)
Percent 13.6 14. 1 20.8 28.8
Verv fine sand
(0.1-0.05 mm.)
Percent 20.5 15.0 9.0
Silt (0.05- 0.002 mm.)
Percent 28.3 32.9 18.5 9.8
Clay (less than 0.002 mm.)
Percent 11.3 11.0 17.2 10.7
Or- ganic
matter bylTîOî
Percent 3.5 1.8 .3 .3
ARKANSAS RIVER: LINCOLN LOAM. 3 MILES EAST OF FORT DODGE, FORD COUNTY KANS.
C2994_^ C2995__. C2996__ C2997-
0-10 10-18 18-30 40-55+
0. 5 5.7 9.4 17.0 2.0 47.4 15.8 1.2 7.4 12.8 21.8 10.0 31.5 13.0 3.9 11.3 16.0 37.4 18.1 9.8 3.2
14.8 31.1 19.1 26.8 5.3 1.4 1.3
1.5 1.6 .1
0
ARKANSAS RIVER: YOHOLO LOAM, 1 MILE SOUTH OF VAN BUREN, CRAWFORD COUNTY, ARK.
C2881_ C2882_ C2883...
0-8 18-30 30-38
0.1 0 0
0.0 . 1
0
0. 1 . 1
0
1 2. 1 43.0 42.7 11.2 2.4 72.7 19.9 4.7
10.7 36.1 44.1 8.8
0.5 0 0
ARKANSAS RIVER: PORTLAND SILTY CLAY LOAM, 2 MILES NORTHEAST OF WOOD- SON, PULASKI COUNTY, ARK.
C3273_. C3274_. C3275_.
0-10 10-26 i 26-48+!
0.1 0.1 0.2 0.9 68.6 28.6 0 .1 .1 .7 69.8 28.4 0 0 .1 .2 46.9 52.6
1.2 .7
0
VERDIGRIS RIVER: VERDIGRIS LOAM, 7 MILES WEST OF WAGONER, WAGONER COUNTY, OKLA.
C2981_ C2982_ C2983_
0-8 0 0.1 0.2 10.8 16-24 0 0 .1 6.1 40-50 0 0 .2 7.8
26.8 36.3 I 43.8
44.0 16.2 41.6 15.1 33.4 14.4
1.5 .6
0
WHITE RIVER: WAVERLY SILTY CLAY, 1 MILE NORTHEAST OF DE VALLS BLUFF, PRAIRIE COUNTY, ARK..
C3267_ 'C3268_ C3269_
0-10 0 0 0.1 10-22 0 .1 .1 22-48+ 0 .4 .2
0.9 i 4.3 3.7
4.6 60.8 31.3 4.1 56.9 23.1 8.3 59.1 27.7
1.9 1.1 .4
OUACHITA RIVER: BIBB SILT LOAM, 9 MILES SOUTHAVEST OF BASTROP, MORE- HOUSE PARISH, LA.
€3282. C3283- C3284_
0-8 0.1 0.1 0.1 0.6 9.9 67.3 19.5 8-20 0 .1 .1 .4 5.8 72.8 19.9
20-38+ .1 .4 .2 .4 1.7 64.8 31.9
2.0
^4
RED RIVER: MILLER CLAY, 2 MILES SOUTHEAST OF ALEXANDRIA, RAPIDES PARISH, LA.
C3276 0-8 8-24
24-50+
0.1 .1 .1
0.1 .1
0
0.1 .1 .1
0.3 .2 .1
0.5 .2 .1
34.5 28.9 39.9
61.8 70.1 59.2
2.4 C3277 €3278
.1
.2
Í Determinations by T. M. Shaw, E. F. Miles, and F. N. Ward.

36 TECHNICAL BULLETIN 833, U. S. DEPT. OF AGRICULTURE
channels to 50 feet or more over the more level undissectecl areas. Since the time of glaciation the deposits of glaciated material have been severely eroded where bordering the major stream courses. In places much of it has been largely removed, exposing the rather barren, partly weathered shales (16). A part of the northwest area of the upper Missouri River was glaciated but none of the area of the Yellowstone River. The Yellowstone River and tributaries from the south and west to the upper Missouri drain land composed largely of loosely consolidated sandstones and shales. This area has been severely eroded to great depths in the West, where the gradient was great, but in the East where the gradient was less, the erosion was much less. It was eroded nearly to its present form before the glacial epoch. Therefore, the more recent alluvial material transported from such areas is not excessively high in clay.
The soil profile from the Missouri at Mobridge, S. Dak., is composed no doubt largely of material transported from the Milk, upper Miss- ouri, and Yellowstone Rivers. It is similar in mechanical composition to a composite of the three. The average percentage of clay is 29, whereas the average percentage of clay for the three tributaries is 34.
The mechanical analysis for the soil profile from the Platte River at Maxwell, Nebr., just below the union of the North Platte and the South Platte Rivers, is unusually low in clay. It has a high percentage of sand, especially of the larger sizes. Some of this material has been transported, perhaps by both wind and water, from the sand hills of Nebraska. But the larger portion of this alluvium has come from the high plains of western Nebraska and eastern Wyoming, a part of which is drained by the North Platte River. This area, which was once covered by a very loosely consolidated sandstone known as the Arikaree formation, has been much eroded and no doubt is the major cause of the very sandy character of the Platte River profile.
The soil profile from the upper Arkansas River at Fort Dodge, Kans., is somewhat similar in mechanical composition to that of the Platte. They both contain some fine gravel and a rather high con- tent of sand. However, the surface horizon of the Arkansas profile contains approximately 47 percent silt and 16 percent clay; yet these constituents show an accelerated decrease in the lower horizons in which the fine gravel, coarse and medium sands show the most definite accelerated increase. The second profile from the Arkansas River, at Van Buren, Ark., some 400 miles down the river from the first profile, contains virtually no fine gravel, coarse or medium sands. It is composed almost wholly of very fine sand, silt, and clay, with an average clay content of 8.2 percent. The third Arkansas River profile, at Woodson, Ark., which is on the Mississippi River lowlands, is composed almost wholly of silt and clay, with an average of 61.8 percent silt and 36.5 percent clay. This increase in the content of the silt and clay as it is transported farther from its source is the result of the decrease in the stream gradient and the increase in the distance transported.
The alluvial soil profiles from the Verdigris, White, and Ouachita Rivers arcj all similar in mechanical composition, composed largely of very fine sand, silt, and clay, with the content of silt predominating. This is to be expected, as the older geological material from whicli these soils are formed is more firmly consolidated than the more recent sedimentary rock of the drainage areas of the other rivers.

Tech. Bul.8 33. U. S. Dept. of Agriculture PLATE 2
CO
An illustration of the fluvial deposits of the Red River, north of Childress, Texas.

38 TECHXICAL BULLETIN 8 3 3, U. S. DEPT. OF AGRICULTURE
The Miller profile from the Red River south of Alexandria, La., is composed of approximately one-third silt and two-thirds clay. The Red River rises west of the Cap Rock escarpment in north central Texas. It cuts its way through the Highland Rim into the Permian Red Beds Plains of Texas and Oklahoma, across which it follows a tortuous course to northwest Louisiana. The character of the soils in the upper basin of the Red River and the low gradient of the stream has not permitted it to establish a very definite channel; the stream load is large and features due to fluvial deposits are to be expected (pi. 2). From the Louisiana border the river flows over an area of low gradient, following the axis of a structural depression which con- tains many lakes and swamps. These lakes and swamps were caused by the existence of a great raft, or log jam, which has produced an overflow area that has become to a great extent a natural settling basin to the Red River during overflows caused by flood from the west. In this area the river deposits much of its load of larger particle-sized suspended matter but carries much of the finer material to the lower lands, as shown by the character of the profiles of the Red River alluvium at Alexandria. (For a more complete description of the Red River log raft, see references 3 and 15 in the Literature Cited).
CHEMICAL ANALYSES OF THE ALLUVIAL SOILS
In table 6 are given the chemical analyses of the alluvial soil profiles of the western tributaries to the Mississippi River. The percentages of major constituents, namely, silica, alumina, and iron oxide, vary widely. These variations follow rather closely the variations of the quantities of clay and nonclay fractions. Therefore, they contribute little to an understanding of the differences in the chemical character of the soils. The percentages of other constituents that are more nearly the same in both the clay and nonclay fractions show differences which are of interest.
The soil profiles of the Milk, the upper Missouri, and the Yellow- stone Rivers, whose drainage areas are confined to the Missouri Plateau, are rather similar in composition. The alluvial soils of the Milk River are somewhat lower in calcium and magnesium oxides than the other two. The average percentages of calcium and mag- nesium oxides in the profiles from the three rivers are, respectively, 1.75 and 1.81, for the Milk; 2.89 and 2.11, for the Missouri; and 2.67 and 3.15, for the Yellowstone. This reflects some of the differences in composition of the glacial drift that covers the major part of the drainage area of the Milk River and the tertiary material that con- stitutes the larger part of the drainage area of the upper Missouri and Yellowstone Rivers. Though the soils of the Milk River are not as high in bases as the soils of the Missouri and Yellowstone Rivers, they are well supplied in bases and other essential plant food constitu- ents investigated. The area of alluvial soils on the Milk River is unusually large,^ as previously stated, for so small a river. These soils are extensively used for wheat, various irrigated crops, and pasture lands (pi. 3).

Tech. Bul. 833, U. s. Dept. of Agriculture
A, Pasture s^csrie on irrigated land in the Mille River Valley, near Tampico, Valley County, Mont. B, The result of extreme erosion on Badlands. "Hell's Half-Acre," 4 miles west of Powder River, Natrona County, Wyo.
39

Sample. No.
TABLK 6.—Cheniicdl analyses of alluvial soils from western trihuiaries to the Mississippi River *
MILK RIVER: HAVRF] CLAY, 3 MILES NORTHWEST OF NASHUA, VALLEY COUNTY, MONT.
C2999. C3000 C3001
SÍO2
Percent 67.32 68.96 67. 50
TÍO2
Percent 0.69
.60
.61
AI2O.3
Percent 15.05 14.17 14.53
Fe203
Percent 5.42 4.81 5.15
MnO
Percent 0.05
.05
.04
CaO
Percent 1.42 1.93 1.91
MgO K2O NazO
Percent Percent Percent 1.81 2.82 0.80 1.75 2.78 .97 1.87 2.41 .96
P2O5 SO3 CO2
^ercent Percent Percent 0.20 0.23 0.42 .18 .21 .80 .19 .21 .12
Coni- binod water
Percent 3.53 3.12 3.20
Total
Percent 99.76
100.03 99.71
don h^^^^^' loss
Percent 6.57 5.22 4.90
Percent 2.72 1.35
Percent 0.16
.10
.06
MISSOURI RIVER: HAVRE SILTY CLAY, 1/2 MILE NORTHEAST OF FORT PECK, VALLEY COUNTY, MONT.
C^3002_ C3003^^ C3004_^ C3005_. C3006- C3007
0-8 66. 30 0.50 13.70 4.92 0.05 2.55 2.09 2.48 1.14 0.18 0.25 2.04 15-30 63.04 .66 16.16 5.87 .04 2.12 2.14 2.56 .80 .19 .22 1. 14 30-45 65.50 .56 13.13 4.84 .05 3.47 2.32 2.28 1.23 .15 .19 3. 65 70-90 61.83 .58 16.77 6.04 .04 1.86 2.41 2.50 1.30 .16 1.26 1.18
100-145 68.20 .44 11.40 4.03 .05 3.83 2.26 2.13 1.53 .16 .34 3.79 160+ 74.14 .32 9.41 3.65 .05 3.52 1.47 1.99 1.73 .11 .17 2.80
2.95 4.06 2.32 3. 85 1.62 .61
99. 55 99.42
100.12 100.15 100.16 100.44
C.3008- C3009_. C3010- C3011_ C3012_. C3013_.
0-8 15-25 42-50 60-75 80-96
120+
YELLOWSTONE RIVER: HAVRE SILTY CLAY LOAM, NEAR SIDNEY, RICHLAND COUNTY, MONT.
100. 34 68.04 0.57 12.73 4.68 0.26 2.42 2.89 2.38 0.34 0.15 0.18 2.68 3.04 66.72 .61 12.67 4.47 .06 2.57 3. 35 2.57 .79 .14 .19 3.44 2.79 64. 34 .64 15.20 4.32 .06 2.31 4.02 2.29 .61 .07 .22 2. 55 4.12 70.06 .55 10.34 3.80 .06 2.63 3.64 2.35 .57 .07 .13 3.70 1.90 63. 30 .68 14. 68 4.95 .06 2.83 3.50 1.96 .38 .02 .12 3.47 3.48 76.50 .37 7.69 3.38 .04 3.28 1.48 1.69 1.80 .19 .12 2.44 1.03
100. 37 100.75 99.80 99.43 100.01
MISSOURI RIVER: LAUREL LOAM, 2 MILES NORTH OF MOBRIDGE, WALWORTH COUNTY, S. DAK.
C3014 C3015. C3016 C3017
0-10 70.35 0.47 11.46 3.70 0.04 3.28 28-42 67.58 .53 12.41 4.16 .05 3.53 48-72 64.03 .64 14.58 5.29 .05 3.24 84-96 t)4. 46 .62 11.67 4.45 .05 4.70
2.17 2.36 2.43 3.02
7.32 2.54 0.16 7.06 1.96 .17 6.85 .93 .07 5.93 .95 .08 6.14 .78 .05 3.56 .15 .02
2.07 1.57 0.20 0.17 3.75 1.20 100. 43 6.86 2.00 0.13 2.32 1.38 .19 .17 3.75 1.94 100. 37 7.20 1.57 .10 2.38 1.17 .20 .18 2. 80 3.47 100. 46 7.55 1.35 .10 2.20 1.2() .19 .14 4.37 2.33 99. 4r, 7.45 .79 .05
pH
7.7 8.4 8.4
8.1 8.1 8.4 8.1
7.97 2.40 0. 10 8.0 7.97 1.85 .07 8.1 8.63 2.10 .10 8.1 6.75 1.20 .09 8.4 7.95 1.07 .05 8.7 3. 69 .22 .02 9.1
8.8 8.1 8.5 8.5
O
H
S o >
d
Ö
O
>
H-1 O d

C3726__ C3727_. C3728__ C3729_.
C2994 C2995. C2996.
("2881 C2882 C2883.
C3273 C3274^ C3275
C2981_ C2982 C2983
C3267 C3268_ C3269
PLATTE KIVER: LAAIOL'KE FINE SANDY LOAM, 1 MILE SOUTHWEST OF MAXWELL, LLVCOLN COUNTY, NEBK.
0-10 10-24 24-36 36-42
79.61 76.33 80.50
0.33
.28
.21
9.06 10. 10 9.44 8.73 i
2.95 2.64 3.08 2.50
0.04 .03 .03 .03
1.55 1.48 3.06 1.91
.99 2.57 1.58 0.14 0.11 0.00 0.91 99.90 4.58 3.70 0.19
.74 2.50 1.74 .13 .09 0 .92 100.28 2.74 1.84 .10
.V3 2.41 1.44 .14 .10 2.53 .68 100.35 3.27 .06 (2)
.44 2.42 1.65 .11 .09 1.43 .43 100.49 1.90 .04 (2)
ARKANSAS RIVER: LINCOLN LOAM, 3 MILES EAST OF FORT DODGE, FORD COUNTY KANS.
0-10 10-18 18-30
70.00 72. 13 81.80
0.49 .40 .21
10.93 10.03 8.22
3.88 3.62 2.33
0.05 .05 .03
4.32 3.97 1.26
1.12 1.00 .53
2.41 2.73 3.10
1.22 1.99 2.15
0.18 .15 .11
.19
.13
3.32 2.92 0
1.33 .90 .25
99. 58 100.08 100. 12
6.30 5.34 .55
1.72 1.57 .30
ARKANSAS RIVER: YOHOLO LOAM, 1 MILE SOUTH OF VAN BUREN, CRAWFORD COUNTY, ARK.
0-8 83.26 18-30 ! 86.60 30-38 I 82.54
0.49 8.98 .32 5.43 .65 7.91
1.83 0.04 0. 93 0.76 2.01 1.61 0.11 0.08 0 0.16 1.69 ! .02 .66 .52 2.10 1.85 .08 .06 0 .83 2.34 .03 .80 .70 1.95 1.45 .13 .07 0 1.46
100. 26 100. 16 100. 03
2.61 1.00 1.63
2.45 . 17 .17
ARKANSAS RIVER: PORTLAND SILTY CLAY LOAM, 2 MILES NORTHEAST OF WOODSON, PULASKI COUNTY, ARK.
0-10 I 10-26 26-48+
71.70 0.85 13.10 4.45 73.48 .84 12. 54 4.32 62.02 .91 16.34 6.68
0.08 .07
0.99 1.50 2.43 1.16 0.24 0.20 1.12 1.55 2.29 1.24 .15 .23 1.78 2.87 2.70 .97 .17 .28
VERDIGRIS RIVER: VERDIGRIS LOAM, 7 MILES WEST OF WAGONER, WAGONER COUNTY, OKLA.
0-8 16-24 40-50
82.60 84.58 85.26
0.57 .56 .56
7.59 6.99 6.40
3.06 3.09 3.00
0.05 .04 .03
0.78 .58 .50
0.65 .56 .55
1.14 1.05
0.90 1.20 1.01
0.15 .11 .12
0.19 .13 .11
1.88 1.58 1.44
99.56 100. 47 99.91
3.82 2.26 1.91
WHITE RIVER: WAVERLY SILTY CLAY, 1 MILE NORTHEAST OF DE VALLS BLUFF. PRAIRIE COUNTY, ARK.
0-10 ! 10-22 i 22-48-r-
76.03 79.43 78.33
0.82 .70 .81
11.98 10.44 10.39
4.04 3.80 3.98
0.11 .09 .09
0.67 .74 .83
0.66 .61 .70
1.93 1.78 L75
0.17 .15 .18
0.07 .05
2.64 1.91 2.20
99.50 100.11 99.72
4.97 3.31 3.31
2.39 1.43 1.13
1 Determinations by G. J. Hough, except C3002-C3007 by R. S. Holmes, and nitrogen determmations by A. E. Yelmgren; pH determinations by E. H. Bailey.
3 Not determined.
0.11 .10 .03
0. 06 .02 .02
2.83 99.53 4.58 1.80 0.15 2.58 100. 41 3.76 L21 .08 4.92 100. 00 6.07 .90 .11
0.11 .04 .04
8.2 8.3
7.2 7.0 7.0
6.9 6.7 7.8
6.8 6.3 6.0
5.6 6.4 6.5
>
Q
w
td

03276 C3277 C3278
TABLE 6.—Chemical analyses of alluvial soils from western tributaries to the Mississippi River ^—Continued
OUACHITA RIVER: BIBB SILT LOAM, 9 MILES SOUTHWEST OF BASTROP, MOREHOUSE PARISH, LA.
Sample No. Depth SÍO2
Percent 80.56 79.17 72.79
TÍO2 AI2O3 Fe203 MnO CaO MgO K2O Na20 P2O5 SO3 CO2 Com- bined H2O
Total Igni- tion loss
Organic matter
Percent 2.52 1.05 .70
N PH
C3282 Inches
0-8 8-20
20-38+
Percent 0.70 .69 .75
Percent 10.75 10.53 13.37
Percent 2.67 3.04 4.41
Percent 0.01
.01
.02
Percent 0.36 .40 .50
Percent 1.02 .76
1.26
Percent 1.93 2.04 2.13
Percent 0.85 .96
1.18
Percent 0.11 .07 .08
Percent 0.11 .15 .09
Percent 0 0 0
Percent 1.68 2.07 3.20
Percent 100. 75 99.89 99.78
Percent 4.16 3.10 3.88
Percent 0.15
.06
.05
4.3
C3283 03284
4.3 4.6
RED RIVER: MILLER CLAY, 2 MILES SOUTHEAST OF ALEXANDRIA, RAPIDES PARISH, LA.
0-8 8-24
24-50+
58.70 54. 65 54. 66
0.87 .87 .93
18.74 18.97 17.51
6.44 7.17 6. 56
0.07 .09 .08
1.28 2.43 4.03
3.93 4.86 4.80
3.04 3.14 2.91
0.63 .51 .57
0.20 .24 .16
0.27 .26 .31
0 1.30 2. 86
6.05 5.67 4.87
100. 22 100.16 100.25
8.66 7.60 7.90
2.78 .68 .18
0.21 .09 .06
6.8 8. 1 7.9
1 Determinations by G. .1. Hoii^ib, except O 3002 O 3007 by R. S. Holmes, and nitrogen determinations by A. E. Yelmgren; j) H determinations by K. H. Bailey.
to
O
Öd d
H
CO
d
C
> O
o d H d

ALLUVIAL SOILS OF THE MISSISSIPPI BASIK 43
The soils from the Missouri River profile 2 miles north of Mobridge, S. Dak., are very similar to the average composition of the alluvial soils of the Milk, upper Missouri, and Yellowstone Rivers, except in the content of calcium. The calcium oxide in the Missouri profile at Mobridge averages 3.69 percent. The average percentage for the Milk, upper Missouri, and Yellowstone is 2.58. This enrich- ment of calcium no doubt comes from the sediments transported by the Upper Missouri River and other smaller local tributaries which drain the Badlands of eastern Wyoming and of western South Dakota and North Dakota (pi. 3). The soils of the Platte River profile are similar in composition to those of the Missouri and its tributaries, except in the low content of magnesium. The average percentage of magnesium oxide in the Platte profile is 0.73; the average for the Missouri and its tributaries is 2.47. This would indicate that there is much less dolomitic material in the drainage area of the Platte River than there is in the Missouri. The content of calcium in the profile of the Platte is fairly high but stratified; the carbonate is limited to the lower horizons. The soils of the Arkansas River profile 3 miles east of Fort Dodge, Kans., like those of the Platte River, are relatively low in magnesium. The calcium as carbonate, which is relatively high, is confined to the top 18 inches of the profile. The other two soil profiles from the Arkansas River are from Van Buren and Woodson, Ark. These two locations are on the Arkansas below the crossing of the Permian Red Beds Plains of Kansas and below the confluence of the Salt Fork, Cimarrón, and Canadian Rivers, which cross the Red Beds Plains of Texas and Oklahoma. The soils at Van Buren and Woodson are reddish brown in color. The in- tensity of the red color is more pronounced in the extracted colloids than it is in the soils. The soils of the Fort Dodge profile are grayish brown, the colloids light brown. Yet in general the soils from all three profiles, if the content of clay is considered, are rather similar in composition. The calcium as calcium carbonate varies in quantity and is concentrated in certain layers.
The soil profiles of the Verdigris, White, and Ouachita Rivers are composed largely of material transported from the Interior Highlands (3). Virtually all the Interior Highlands are covered by Paleozoic and pre-Paleozoic material. The Paleozoic material is much older, and perhaps less erosive, than that of the Great Plains. The Ver- digris River drains the eastern slope of the Flint Hills, which lie west of the Ozark Plateaus. The White River drains the eastern slopes of the Ozark Plateaus and the north escarpment of the Boston Mountains. The larger part of the drainage area of the Ouachita River lies in the southeastern slope and foothills of the Ouachita Mountains. The soils of the Verdigris, White, and Ouachita Rivers are all more acid and are, in general, considerably lower in calcium, magnesium, and potassium than the alluvial soils examined from the Great Plains. The acidity is rather constant in each profile but varies widely among the difl^erent profiles. The range in the pH values from top to bottom of the Verdigris River profile is 6.8 to 6.0; of the White River profile, 5.6 to 6.5; and of the Ouachita River profile, 4.3 to 4.6. The content of calcium, as well as the pH value, is lowest in the Ouachita soils.

44 TECHNICAL BULLETIN 8 3 3, U. S. DEPT. OF AGRICULTURE
The soils of the Red River profile at Alexandria, La., differ widely in composition from those of the Ouachita River. Though some of the northern tributaries to the Red River drain the same kind of material as that drained by the Ouachita, the Red River soils have more of the characteristics of color and texture of the material of the Red Beds Plains of Texas and Oklahoma. The Red River soils are high in bases. This is especially true of the percentages of magnesium and potassium oxides, which are rather uniform throughout the profile and average 4.53 and 3.03 percent, respectively. The percentage of calcium oxide is fairly high but not uniformly distributed. Tests show that the calcium as carbonate does not occur in approximately the first 12 inches of this soil. It has probably been removed by leaching. The percentages of calcium as oxide vary from 1.28 in the surface to 4.03 in the layer at 24 to 50 inches. The percentages of carbon dioxide vary from 0 in the surface to 2.86 in the bottom layer. As the con- tents of magnesium vary only slightly with the calcium and carbon dioxide, it would appear that little of it is dolomitic. A microscopic examination of the soil shows the presence of calcium carbonate con- cretions in the lower horizon and an abundance of micaceous material throughout the profile.
The chemical and mineralogical composition of the Red River alluvium and the Spearfish soil profile reported by Brown and Byers {9) are very similar, although the soils are widely separated geograph- ically and are derived from formations differing in age. The Spearfish soil is derived from Triassic shale in South Dakota, the Red River alluvium largely from transported material derived from the Permian Red Beds Plains of Texas and Oklahoma. In the profiles of the Spear- fish soil and the Red River alluviuni, calcium oxide averages are 8.98 and 2.58 percent; magnesium oxide, 5.80 and 4.53; potassium oxide, 3.43 and 3.03; and sodium oxide, 0.28 and 0.57, respectively. Jones {25) states that— the volume of ferruginous sediment [of the Red River] is greatly augmented in Louisiana by the addition of iron oxides from various Tertiary formations which contain considerable quantities of iron-bearing minerals such as glauconite, limonite, hematite, magnetite, and ilmenite.
As the content of phosphorus in soils is of so great importance agri- culturally, it is of interest to examine with care the magnitudes of the quantities in this group of soils. The data do not show the percent- ages of phosphorus pentoxide to be unusually high in any of the soils. The highest average percentage for any one profile is 0.20 for the Red River profile, the lowest is 0.09 for thie Ouachita River profile. The average for all the profiles is 0.15 percent. The highest of these averages is not unusually high, nor is the lowest abnormally low.
The sulfur content, like that of the phosphorus, is also important, although not so frequently is it the limiting factor in plant growth. The percentages of sulfur trioxide do not show a wide variation. The highest average percentage for a profile (0.28) occurs in the Red River profile. The lowest is 0.07 percent, in the profile of the White River. Although in general much of the material composing these alluvial soils is transported from semiarid areas that are rather high in certain soluble salts and variable quantities of the slightly soluble salts, such as the sulfates and carbonates of calcium, there is little evidence that

ALLUVIAL SOILS OF THE MISSISSIPPI BASIN 45
any considerable quantity of these salts remains in the alluvial soils examined except in the carbonates. Only one soil profile, that of the upper Missouri River, contains a stratum of calcium sulfate-bearing material. This stratum (sample C3005), 70 to 90 inches deep, contains 1.26 percent total sulfur trioxide, 85 percent of which is in the form of calcium sulfate. The abnormally high content of clay in this stratum (59.5 percent) has probably prevented the removal of the sulfate by solution in limiting the free movement of water either vertical^ or laterally within the stratum.
With reference to sulfates in alluvial soils, Hilgard (W) has the following to say of the composition of the Red River soils of Louisiana.
* * * The most unexpected feature exhibited by this analysis, is the fact that in none of these soils the sulphates are present to any unusual extent. It has been usual to ascribe the extraordinary thriftiness of the Red River soils to the gypsum supposed to be brought down from the great gypsum formation of the Llano Estacado, traversed by the river; but it is evident that whatever effect the presence of that substance may originally have exerted upon the decomposition of the soil minerals, it has been so altered in transitu that only the lime has re- mained in the shape of carbonate, while the sulphuric acid has been carried into the Gulf.
In general, the soil profiles from all the river lowlands contain vary- ing amounts of carbon dioxide, except those soils of the Verdigris, White, and Ouachita Rivers, which drain portions of the Interior Highlands. The quantities of carbon dioxide as well as the pH values are highest in the soils of those rivers that drain the drier areas. It is reasonable to assume that all the carbon dioxide is present as dolo- mitic material or as calcium carbonates, except in the lower layers of the Milk, Missouri, and Yellowstone river profiles, in which the pH values exceed that of calcium carbonate (8.3 pH). In these layers there are probably small quantities of sodium carbonates.
The percentages of organic matter in the surface layers of these 12 alluvial soil profiles range from 1.72 to 3.70, with an average for the 12 of 2.41. These quantities, though not high, are confined largely to the surface layers, except in the profiles of the Yellowstone and Missouri Rivers. In these, relatively large portions of the organic matter are distributed down through the profiles. This indicates that these soils are of rather recent deposition and that the quantities of organic surface soil-bearing material, though variable, constitute a considerable portion of the sedimentary material. Perhaps this portion of surface material in the river sediment has been increased with the more extensive cultivation of the soils.
In the other profiles the distribution of the organic matter within the profile indicates that when deposited the sediments contained little organic matter and that the larger part of the organic matter now present in the surface soil is an accumulation of residues of plants grown in place.
CHEMICAL ANALYSES OF THE COLLOIDS
In table 7 are assembled the data for the composition of the colloids of the alluvial soils of the western tributaries to the Mississippi River. It may be said at the start, from a glance at the whole of these data, that the difference in composition of these colloids is not great. In studying the groups of colloids that are most similar to each other in composition, the table may be divided into two parts. The first

46 TECHNICAL BULLETIN 83 3, U. S. DEPT. OF AGRICULTURE
group, more or less a natural one, comprises all the colloids from the soil profiles lying north of the Arkansas River or, rather, the soil colloids of the Missouri River and its tributaries. It may be ob- served from the carbon dioxide content that only the colloids from the Yellowstone River and the two lower horizons of the Platte River contain carbonates. However, the soils of all these colloids contained carbonates, except the two upper layers of the Platte River profile. The carbonates of these layers were either not present in the colloidal state or were lost from the colloids by solution in the process of ex- traction. But in either case, virtually all these colloids were formed from material in an alkaline environment. They were also formed under a climate with a normal annual temperature for the area that ranged from 40° to 50° F. and a normal annual precipitation of 10 to 20 inches.

TAB 1^1^ 7.—Chert deal analyses of alluvial soil eolio ids from western iributaries to the Mississippi River ^
MILK RIVER: HAVRE CLAY, 3 MILES NORTHWEST OF NASHUA, VALLEY COUNTY, MONT.
Sample No. 1 )epth SiOa TÍO2 AI2O3 F02O3 MnO CaO MííO K2O NaoO P2O5 S 0.3 C()2 Com- bined water
C2999 C3000
Inches 0-8
15-25 40-60
Percent 55.30 55.34 55. 22
Percent 0.59 .63 .56
Percent 22.20 21.30 21.64
Percent 8.24 8.62 8.71
Percent 0.04 .05 .05
Percent 1.55 1.62 1.47
Percent 3.05 2.85 2.93
Percent 2.55 2.39 2.26
Percent 0.15 .22 .23
Percent 0.18 .20 .22
Percent 0.20 .20 .21
Percent 0 0 0
Percent 6.81 7.17
C3001 6.93
Total Ig-
nition loss
Percent] Percent 100.96 Í 9.35 100. 59 i 9. 17 100.43 ! 8.71
Or- gan i e
Percent] Percent 2.73 2.15 1.91
MISSOURI RIVER: HAVRE SILTY CLAY, 1/2 MILE NORTHEAST OF FORT PE(^K, VALLEY COUNTY, MONT.
0.22 .15 .13
pH
7.7 8.4 8.4
C3002 0-8 54.45 0.68 22.00 7.88 0.04 1.64 2.96 2.46 0.28 0.24 0.20 0 7.35 100.18 10.17 3.04 0.23 8.1 C3003 15-30 54.74 .72 22.44 7.91 .03 1.74 2.91 2.76 .29 .19 .21 0 7.09 100. 93 9.57 3.67 .16 8.1 C30Ü4 30-45 53.88 .65 22.25 8.45 .04 1.69 2.88 2.56 .22 .26 .18 0 7.65 100. 71 9.40 1.89 .16 8.4 C3005 70-90 54.70 .52 22.08 9.12 .03 1.40 2.68 2.41 .20 .13 .18 0 6.95 100. 40 8.10 1.27 .11 8.1 C3006 100-145 53.68 .56 21.73 10.20 .07 1.44 2.73 2.48 .31 .16 .10 0 6.54 100. 00 8.69 2.30 .13 8.8 C3007-- 160+ 51.72 .60 20.77 12.57 .16 1.62 2.67 2.34 .26 .19 .25 0 6.58 99.73 8.75 2.32 .14 8.7
YELLOWSTONE RIVER: HAVRE SILTY CLAY LOAM, NEAR SIDNEY, RICHLAND COUNTY, MONT.
>
f
Ö M
U2
O
C3008 0-8 ' 51.82 0.54 24. 16 7.91 0.11 2.39 2.47 2.83 0.13 0.15 0.16 0.18 7.91 100.76 10.76 2.90 0.21 8.0 C3009 15-25 51.95 .53 24.03 7.92 .08 2.38 2.72 2.64 .12 .11 .13 .72 7.52 100. 84 10.29 2.23 .14 8.1 C3010 42-50 51.17 .52 23.71 7.69 .10 2.26 2.67 2.79 .15 .03 .09 .85 8.00 100. 13 10.58 1.87 .23 8.1 C3011 60-75 50.80 .58 23.74 8.05 .07 2.30 3.01 2.25 .29 .07 .09 .78 8.47 100. 49 10.75 1.65 .16 8.4 C3012 80-96 1 51.40 .52 23.98 7.56 .09 2.82 2.96 2.64 .15 .13 .09 .12 8.46 100. 92 10.02 1.57 .11 8.7 C3013 120+1 49.20 .52 25. 37 8.16 . 14 2.88 2.86 2.33 .16 .20 .11 .18 8.32 100.25 11.25 3.00 .28 9.1
MISSOURI RIVER: LAUREL LOAM, 2 MILES NORTH OF MOBRIDGE, WALWORTH COUNTY, S. DAK.
C3014 0-10 53.55 0.53 21. 69 9.79 0.07 1.77 2.34 2.64. 0.11 0.27 0.13 0 7.14 100. 01 11.11 4.28 0. 28 8.8 C3015 28-42 54.00 .51 21.62 10.11 .06 1.76 2.63 2.34 .17 .22 .18 0 6.84 100. 44 10.00 3.39 .22 8.1 C3016 48-72 54. 13 .52 22.54 9.63 .06 1.48 2.60 2.16 .13 .15 .13 0 6.45 99.98 9.09 2.82 . 16 8.5 C3017 84-96 52. 58 .61 22.41 9.16 .06 2.11 2.79 2.44 .27 .17 .14 0 7.78 100. 52 9.82 2.21 .17 1 8.5
See footnotes at end of table.
ÍP
^ ^
5.
hi^ ^

TABLE 7.—Chemical analyses of alluvial soil colloids froiri western tributaries to the Mississippi River ^—Continued
PLATTE RIVER: LAMOURE FINE SANDY LOAM, 1 MILE SOUTHWEST OF MAXWELL, LINCOLN COUNTY, NEBR.
Sample No. Depth
Inches 0-10
10-24 24-36 36-42
SÍO2
C3726 C3727
Percent 54.10 53. 35 50.40 51.22
C3728 C3729
TÍ02
Percent 0.56 .56 .49 .49
AI2O3
Percent 20.87 21.95 21.23 22.92
FeaOs MnO CaO MgO K2O
Percent Percent Percent Percent Percent 7.86 0.17 2.24 2.84 3.09 8.06 .11 1.96 2.92 2.94 7.87 .10 4.76 2.80 2.56 8.13 .10 3.32 2.35 2.25
Na2L P2O5 SO3
Percent Percent Percent 0.09 0.27 0.29 .18 .18 .15 .09 .15 .10 .16 .13 .09
C02
Percent 0 0 2.43 1.16
Percent 8.31 8.13 7.49 8.04
Percent 100. 69 100. 49 100. 47 100. 36
Percent 20.10 14.66 12.14 11.62
Or- ganic
matter
Percent 12.75 7.11 2.40 2.20
Percent 0.74 .43 . 17 .20
PH
6.8 8.2
00
o
w d
ARKANSAS RIVER: LINCOLN LOAM, 3 MILES EAST OF FORT DODGE, FORD COUNTY, KANS.
C2994. C2995-. C2996_
0.52 .53 .57
3.05 3.07 2.38
2.68 2. 53 2. .34
0.18 .21 .20
0.18 .23 .32
0.14 .16 .23
3.32 4.32 .56
7.85 8.04 9.00
100.40 100. 07 100.17
16. 31 13.39
3.04 4. 55 4.23
ARKANSAS RIVER: YOHOLO LOAM, 1 MILE SOUTH OF VAN BUREN, CRAWFORD COUNTY, ARK.
C2881 C2882 C2883
0-8 47.52 0.52 24.24 10.07 0.19 2.11 18-30 48.30 .52 24.56 9.66 .19 2.13 30-38 48.38 .59 24.00 10.52 .15 1.16
3.29 3.58 3.68
2.81 0.32 0.28 0.10 0 2.76 .17 .22 .09 0 2.48 .28 .09 .08 0
8.91 8.44 8.97
100. 34 11.98 3.37 100. 62 11.24 2.90 100. 36 11.00 2.23
ARKANSAS RIVER: PORTLAND SILTY CLAY LOAM, 2 MILES NORTHEAST OF WOODSON, PULASKI COUNTY, ARK.
C3273 C3274 C3275
0.27 .35
0)
0-10 48.90 0.54 23.97 9.78 0.10 1.35 3.57 2.81 0.14 0.32 0.09 0 9. 00 100. 57 10.89 2.49 0. 22 10-26 49.34 .60 23.86 9.62 .08 1.38 3.46 2.61 .13 .20 .08 0 8.29 99.65 10.48 2.38 .18 26-48+ 48.85 .60 24.19 9.57 .08 1.37 4.41 2.70 .13 .18 .08 0 8.11 100. 27 9.54 1.56 .14
7.9 7.9 8.1
0 7.2 0 7.0 0 7.0
6.9 6.7 7.8
VERDIGRIS RIVER: VERDIGRIS LOAM, 7 MILES WEST OF WAGONER, WAGONER COUNTY, OKLA.
11.12 0.18 2. 16 1.56 2.64 0.16 0. 40 0. 11 0 9.29 100. 25 13.42 4.55 0 6.8 11.46 .15 1.53 1.03 2.34 .25 .30 .09 0 7.80 100.13 10.29 2.70 0 6.3 11.04 .20 1.81 1.14 2.69 .09 .46 .07 0 9.17 100. 28 11.70 2.78 0 6.0
Ö
O
2 O
H r¡ W

WHITE HIVER: WAVERLY SILT Y CLAY, 1 MILE NORTHEAST OF DE VALLS BLUEF, PRAIRIE COUNTY, ARK.
C3267 C3268 C3269
C3282 C3283 C3284
C3276 C3277 C3278
Average Average de-
viation___
0-10 49.75 0.70 26.96 8.78 0.17 0.93 2.02 2.08 0.02 0.34 0.10 0 8.98 100. 83 12.44 3.79 0. 30 10-22 49.70 .66 26.30 9.20 .16 L13 2.04 2.16 .01 .35 .19 0 8.85 100.75 11.69 3.11 .25 22-48+ 49. 55 .62 26.39 9.20 .10 L07 2.10 L90 .07 .39 .15 0 8.95 100.49 n.67 2.98 .34
OUACHITA RIVER: BIBB SILT LOAM, 9 MILES SOUTHWEST OF BASTROP, MOREHOUSE PARISH, LA.
C3282 0-8 51.18 0.68 26.81 7.57 0.04 0.38 2.08 L87 0.09 0.15 0.06 0 8.96 99.87 12.99 4.42 0.31 C3283 8-20 50.96 .68 26.85 9.14 .03 .42 2.23 L85 .09 .13 .13 0 8.62 101.13 11.19 2.81 .18 C3284 20-38+ 50. 74 .64 25.55 9.28 .04 .48 2.58 2.04 .15 .10 .09 0 8.61 100. 28 10.02 L54 .13
RED RIVER: MILLER CLAY, 2 MILES SOUTHEAST OF ALEXANDRIA, RAPIDES PARISH, LA.
0-8 8-24
24-50+
49.82 49.75 48.73
0.52 .53 .60
22.75 22.91 22.69
9.32 9.38 9.84
0.06 .06 .06
1.63 L60 1.32
5.59 5.30 5.51
2.57 3.15 2.73
0.25 .33 .30
0.17 .15 .15
0.12 .15 .06
50.96
±2.24
0.58
dz.05
23.37
±1.59
9.13
±1.01
0.10
±.05
2.06
±.86
2.89
±.60
2.50
±.24
0.18
±.07
0.21
±.07
0.14
±.05
1 Determinations by R. S. Holmes, with following exceptions: C2999-C3Ü01, C3002- C3004, C3267-C3269, C3273-C3275, and C3282-C3284, by G. Edgington; nitrogen deter- minations by A. E. Yelmgren; pH determinations by E. H. Bailey.
2 Not determined.
7.55 6.80 7.61
7.95
±.67
100. 35 100.16 99.60
2.42 1.81 1.25
0.16 .10 .12
5.6 6.4 6.5
4.3 4.3 4.6
6.8 8.1 7.9
O
02
1j
>
CO

50 TECHNICAL BULLETIN 8 3 3, U. S. DEPT. OF AGRICULTURE
As the silica content of soil colloids is related to many of its proper- ties an examination of it is presented first. The colloids from soils of the Missouri River and its tributaries are all rather uniform and high in silica. The tendency towards uniformity becomes greater if the data are calculated to calcium carbonate free basis, and the colloids show more nearly their true mineralogical similarity. The two per- centages of silica in the Platte River profile of 50.40 and 51.22, con- verted to calcium carbonate free basis, become 53.33 and 52.61, re- spectively, and all the percentages of the Yellowstone profile become slightly higher. The average percentage in the colloids of the Milk River profile is 55.29; for the Missouri, at Fort Peck, 53.86; for the Missouri, at Mobridge, 53.57; for the Yellowstone, 51.06; and for the Platte, 52.27. The greatest difference in these averages is that of the Milk and Yellowstone Rivers. This slight difference no doubt is due to the difi'erence in geological material and not to the difference in climate.
In layers C3006 and C3007 of the Missouri River profile, which contain high percentages of iron oxide, the color of the colloid indi- cates the presence of iron not combined as silicates.
The other constituents, especially alumina, iron oxide, and the oxides of magnesium and potassium, are remarkably similar in all the col- loids of this group. The greatest divergence from uniformity in these constituents occurs in the percentages of alumina in the Yellow- stone River profile, in which the percentages of alumina are approxi- mately 2 percent higher than in the colloids of Havre clay and Havre silty clay, whereas the percentages of silica are correspondingly lower. The percentages of calcium oxide are more variable than the other constituents, but, when corrected for calcium as carbonate, the range is not wide. These data indicate that, mineralogically, these colloids are all very similar. The mineral composition of the soil colloids is discussed on pp. 70.
The second group of colloids in this table, which comprise the col- loids of the soils of the Arkansas River and those rivers south of it, is an arbitrary one. These colloids are derived from soil materials from three or more different geographical provinces. These materials were weathered under a somewhat warmer normal annual tempera- ture and in general a greater annual precipitation than were the geo- logical materials from which the first group of soil colloids were derived.
The data show the colloids of the second group to be slightly more laterized than those of the first group. The percentages of silica are all a little lower in the second group than in the first, and in general both the alumina and iron oxide are somewhat higher. However, the percentages of silica, alumina, and iron oxide for the upper Arkan- sas profile at Fort Dodge, Kans., are somewhat deceptive. When calculated to calcium carbonate free basis, the percentages of silica are 48.40, 47.34, and 49.07; the alumina, 21.90, 21.58, and 21.32; the iron oxide, 8.05, 7.94, and 12.63. These data are more in accord with those for the other colloids, except the 12.63 percent of iron oxide in the colloids of the bottom layer, C2996. In this layer the reddish- yellow color of the colloid indicates the presence of iron not combined with the silicates, whereas the two layers above, C2994 and C2995, are relatively low in iron and light gray in color. The color of virtu- ally all the other colloids of this group indicates the presence of more

ALLUVIAL SOILS OF THE MISSISSIPPI BASIN 51
or less iron not combined as silicates. The reddish color is most pro- nounced in middle and lower Arkansas and Red River profiles. How- ever, these colloids contain little more iron and in some cases not as much iron as soil colloids less red in color. The red color perhaps is not due to any large amount of iron oxide but simply to its chemical form and state of fine division.
In general these colloids are fairly high in the three bases, calcium, magnesium, and potassium, excepting those transported from the Interior Highlands by the Verdigris, White, and Ouachita Rivers. In these the potassium and magnesium are better retained than the calcium. The calcium in the t^lloids, like that of the soils, is lowest in the Ouachita profile. It is doubtful if the very low calcium in the Ouachita profile can be attributed wholly to material transported from the Ouacbita uplift. It is possible that much of the material in the Ouachita profile is of Coastal Plain origin. The profile was taken too far south of the Ouachita uplift to be free from Coastal Plain material.
The colloids of the Red River profile are most similar in composi- tion to those of the lower Arkansas River. They are both high in mag- nesium and potassium and are particularly marked by their high mag- nesium content. The average percentage of magnesium oxide in the colloids of the Arkansas River is 3.38; in the Red River, 5.50. Base exchange determinations for the Red River colloids show that only 0.46 percent of the magnesium oxide and 0.11 percent of the potassium oxide are exchangeable.
The discussion of the mineralogical composition of these soil col- loids will be found on p. 70.
The averages and the average deviations given in table 7 for the various constituents of the soil colloids of the western tributaries show them to be rather constant in composition, as a whole, in respect to silica, alumina, iron oxide, magnesium, potassium, and combined water. The other constituents (titanium, calcium, sodium, phos- phorus, and sulfur oxides), which are much smaller in quantity (total of their average, 3.17 percent), vary more widely.
DERIVED DATA FOR THE COLLOIDS
The derived data, table 8, bring into clear relief the degree of variation within the soil colloids of the western tributaries to the Mississippi River. These data, like those shown in table 7 for the colloids of the Platte River and those to the north of it, show these colloids to be more closely similar to one another than they are to the colloids from the river alluvials lying to the south of the Platte. All silica-sesquioxide ratios of the northern group of colloids are greater than 3, except for two layers of the Yellowstone River profile, whereas all the same ratios for the southern group are less than 3, except for the first two layers of the upper Arkansas profile. There is almost as clear a division between the silica-alumina ratios of 4.+ and 4.— for the northern and southern groups, respectively, except for the Yellowstone River colloids. The ratios of silica-iron oxide show the iron in proportion to the silica to be somewhat lower in the northern group of colloids, except in the two lower layers (C3006 and C3007) of the upper Missouri profile, in which the color indicates a concentration of free iron oxide (Fe203XH20). The red

52 TECHNICAL BULLETIN 8 3 3, U. S. DEPT. OF AGRICULTURE
color is most pronounced in the colloids of the profiles from the Red and Arkansas Rivers, with the total content of iron oxide but little greater than in colloids of less red color. This is particularly true of the colloids of the Verdigris River, which have an average of 11.15 of silica-iron oxide in contrast to 13.85 for the colloids of the Red River profile.
TABLE 8.—Derived data: Alluvial soil colloids from western tributaries to the Missis sippt River
MILK RIVER: HAVRE CLAY, 3 MILES NORTHWEST OF NASHUA, VALLEY COUNTY MONT.
Depth SÍO2 SÍO2 SÍO2 SÍO2
SÍO2 Com- bined
water ^
Com- bined
Sample No. Combined water of the soil acids 1 R2O3 AI2O3 Fe203 Total bases 2 of the
soil acids 1
C2999 C3000
Inches 0-8
15-25 40-60
3.42 3.50 3.44
4.22 4.40
17.84 17.02
1.80 1.75 1.80
6.93 7.17 7.26
Percent 6.81 7.17 6.93
Percent 9.19 9.47 9.21 C3001 ------ 4.33 16.85
MISSOURI RIVER: HAVRE SILTY CLAY, 1/2 MILE NORTHEAST OF FORT PECK VALLEY COUNTY, MONT.
C3002 C3003 C3004 C3005 C3006 C3007
0-8 15-30 30-45 70-90
100-145 160+
3.42 3.38 3.31 3.33 3.23 3.04
4.20 4.29 4.19 4.16 4.19 4.22
18.38 18.40 16.97 15.95 14.00 10.94
1.67 1.71 1.61 1.80 1.88 1.75
6.80 7.35 6.64 7.09 6.78 7.65 7.57 6.95 7.17 6.54 7.00 6.58
9.74 9.56
10.03 9.11 8.77 8.82
YELLOWSTONE RIVER: HAVRE SILTY CLAY LOAM, NEAR SIDNEY, RICHLAND COUN- TY, MONT.
C3008 C3009 C3010 C3011 C3012 C3013
0-8 3.01 3.64 17.40 15-25 3.03 3.67 17.43 42-50 3.03 3.66 17.67 60-75 2.99 3.63 16.81 80-96 3.03 3.63 18.07
120+ 2.73 3.29 16.02
1.50 1.59 1.51 1.41 1.37 1.34
6.34 7.91 7.01 7.52 7.16 8.00 6.82 8.47 5.65 8.46 5.54 8.32
10.35 9.74
10.16 10.04 11.12 11.00
MISSOURI RIVER: LAUREL LOAM, 2 MILES NORTH OF MOBRIDGE, COUNTY, S. DAK.
WALWORTH
C3014 0-10 28-42 48-72 84-96
3.26 3.26 3.20 3.16
4.19 4.24 4.08 3.98
14.57 14.20 14.94 15.25
1.73 1.77 1.90 1.54
7.48 7.24 7.77 6.39
7.14 6.84 6.45 7.78
9 29 C3015 8 75 C3016 8 53 C3017 10 24
PLATTE RIVER : LAMOURE FINE SANDY LOAM, 1 MILE SOT LINCOLN COUNTY, NEBR.
JTHWEST OF MAXWELL
C3726 0-10 10-24 24-36 36-42
3.55 3.34 3.25 3.09
4.40 4.12 4.02 3.79
18.31 17.60 17.03 16. 75
1.48 1.48 1.54 1.51
6.23 6.28 6.51 7.26
8.31 8.13 7.49 8.04
10 92 C3727 - 10 68 C3728 9 79 C3729 - 9 98
ARKANSAS RIVER: LINCOLN LOAM, 3 MILES EAST OF FORT DODGE, FORD COUNTY, KAXS.
C2994 0-10 10-18 18-30
3.04 3.01 2.81
3.77 3.72 3.88
15.97 15.83 10.24
1.30 1.23 1.30
4.71 4.71 6.99
7.85 8.04 9.00
10 80 C2995 C2996
10.90 11.22

ALLUVIAL SOILS OF THE MISSISSIPPI BASIN 53
TABLE 8.—Derived data: Alluvial soil colloids from western tributaries to the Missis- sippi River—Continued
ARKANSAS RIVER: YOHOLO LOAM, 1 MILE SOUTH OF VAN BUREN, CRAWFORD COUNTY, ARK.
Depth SÍO2 SÍO2 SÍO2 SÍO2 SÍO2 Com-
bined water 3
Com- bined
Sample No. Combined water of the soil acids 1 R2O3 AI2O3 Fe203 Total bases 2 of the
soil acids 1
C2881 C2882
Inches 0-8
18-30 30-38
2.63 2.66 2.67
3.33 3.34 3.42
12.55 13.31 12.23
1.22 1.12 1.25
5.12 5.07 5.50
Percent 8.91 8.44 8.97
Percent 11.67 11.30 n.59 C2883
ARKANSAS RIVER: PORTLAND SILTY CLAY LOAM, 2 MILES NORTHEAST OF WOODSON, PULASKI COUNTY, ARK.
C3273. C3274. C3275.
0-10 2.77 3.47 13.30 10-26 2.79 3.51 13.64 26-48+ 2.74 3.43 13.57
VERDIGRIS RIVER: VERDIGRIS LOAM, 7 MILES WEST OF WAGONER, WAGONER COUNTY, OKLA.
C2981 0-8 16-24 40-50
2.45 2.43 2.46
3.13 3.14 3.10
11.17 10.83 11.45
C2982 C2983
1.25 7.88 9.29 1L23 1.56 9.86 7.80 9.26 1.32 8.71 9.17 10.80
WHITE RIVER: WAVERLY SILTY CLAY, 1 MILE NORTHEAST OF DE VALLS BLUFF PRAIRIE COUNTY, ARK.
C3267 C3268 C3269
0-10 10-22 22-48+
2.59 2.62 2.61
3.13 3.21 3.19
15.05 14.36 14. 33
1.41 L41 L40
9.29 8.81 8.92
8.98 8.85 8.95
10.59 10.54 10.61
OUACHITA RIVER: BIBB SILT LOAM, 9 MILES SOUTHWEST OF BASTROP, MOREHOUSE PARISH, LA.
C3282. C3283 C3284.
0-8 2.74 3.62 17.97 8-20 2.64 3.22 14.80
20-38+ 2.74 3.38 14.55
RED RIVER: MILLER CLAY, 2 MILES SOUTHEAST OF ALEXANDRIA, RAPIDES PARISH, LA.
03276 - 0-8 8-24
24-50+
2.94 2.93 2.85
3.71 3.70 3.64
14.20 14.17 13.17
L34 1.44 L30
4.16 4.20 4.17
7.55 6.85 7.61
n.i3 10.42 11.01
C3277 C3278
Average 2.98
±.26
3.74
±.34
15.12
±1.97
L49
±.16
6.80
±L15
7.95
±.68
10.30
±.74 Average devia-
tion
1 Combined water+water equivalent of the total bases. 2 Calcium, magnesium, potassium, and sodium oxides.
3 Ignition loss less organic matter and CO2.
The ratios of silica-total bases (i. e., the ratio of silica to the sum of the calcium, magnesium, potassium, and sodium oxides) for these colloids vary more widely than any of the other ratios. These ratios are lowest for the colloids from the Red and Arkansas Rivers. The average for the 3 profiles of the Arkansas River and the one of the Red River, comprising 12 samples in all, is 5.10. The average for the 3 profiles of the Verdigris, White, and Ouachita Rivers is 9. The extent of hydrolysis and leaching that has taken place in the Interior Highlands over that of the Great Plains is perhaps well expressed by

54 TECHNICAL BULLETIN 8 3 3, U. S. DEPT. OF AGRICULTURE
these figures. However, it is not to be assumed that these 2 geo- graphical provinces are of the same geological formations. They are not. And perhaps they differed rather widely in readily decomposable minerals.
The ratios of silica to the combined water plus the water equivalent of the total bases are less variable than those of the silica-total bases. They are highest in the colloids from the profiles of the Milk and Missouri Rivers. They are considerably lower and more constant for the colloids of the other rivers. The average of the silica-combined water plus water equivalent of total bases for the Arkansas and Red River profiles is 1.29; for the Verdigris, White, and Ouachita Rivers, 1.42. Though the colloids from these two groups are very much unequally debased, as indicated by their ratios of silica-to tal bases, the ratios given do not indicate that there has been a replacement of water equivalent to the bases removed; nor do the percentages of combined water (table 8, col. 8) in the colloid which are low in bases differ significantly from those that are high. The percentages of combined water in all the colloids are very much the same. The average is 7.95. The average deviation is ±0.68, which is only 8.55 percent of the average. The percentages of combined water of soil acids (which is the combined water plus the water equivalent of the four bases) are about as constant as the combined water. They average 10.30 and show an average deviation of ±0.74, which is 7.17 percent of the average.
EASTERN TRIBUTARIES
MECHANICAL ANALYSES OF THE ALLUVIAL SOILS
The mechanical analyses of alluvial soil profiles from the Ohio, Cumberland, Tennessee, Duck, Clinch, and Big Black Rivers and of the loess material east of Yazoo City, Miss., are given in table 9. The data show these alluvial soil profiles to be rather uniform, as a whole, in mechanical composition. With the exception of the Clinch River profile and the top horizon of the Ohio profile, these soils are composed almost wholly of very fine sand, silt, and clay. The coarser texture of Clinch alluvium is the result of the rather high gradient and the lack of any extensive valley flat over which the water may spread. The Ohio profile was taken from a natural levee very near the present channel of the river. This probably accounts for the low clay content in the top horizon. The 14 samples of sediments deposited by the 1937 Ohio flood {21) are similar in texture to the Ohio alluvium. The other rivers of the group also have rather high gradients, but these profiles were taken from level agricultural land at varying distances from the channels of the rivers. The high content of silt and clay indicates that this material was settled out either from backwater or from rather shallow slowly moving waters.

ALLUVIAL SOILS OF THE MISSISSIPPI BASIN 55
TABLE 9.—Mechanical analyses of alluvial soils from eastern tributaries to the Mississippi River i
OHIO RIVER: HUNTINGTON LOAM, 3 MILES NORTHEAST OF GOLCONDA, ILL., IN LIVINGSTON COUNTY, KY.
Sample No. Depth
Fine gravel
(2-1 mm.)
Coarse sand (1-0.5 mm.)
Medium sand
(0.5-0.25 mm.)
Fine sand
(0.25-0.1 mm.)
Very fine sand
(0.1-0.05 mm.)
Silt (0.05- 0.002 mm.)
Clay (0.002-0 mm.)
Organic matter
by H2O2
C1899 Inches
0-10 20-60
80-120 . 3-2. 5
Percent 0 0 0 1.1
Percent 0.2 0 0 .2
Percent 0.4 .1
0 .2
Percent 2L0
.4
.2
.6
Percent 25.2 4.2 L2 3.4
Percent 37.9 59.1 64.1 66.0
Percent 14.0 35.7 34.2 26.0
Percent 0.7
C1900 .3 C1901 . 1 C2327-C2340 2 1.9
CUMBERLAND RIVER: HUNTINGTON SILT L0AM,2H MILES SOUTH OF SMITHLAND' LIVINGSTON COUNTY, KY.
C1902_ C1903_ C1904_
0-12 12-40 40-70+
0.1 .1
0
0.2 .1 .1
2.3 2.8
12.3 63.1 n.4 57.0 6.3 60.9
21.0 28.2 32.1
TENNESSEE RIVER: HUNTINGTON SILT LOAM, 10 MILES NORTHWEST OF WAVERLY, HUMPHREYS COUNTY, TENN.
C1905 0-10 12-36 40-90
0.1 0 0
0.2 0 0
0.2 .2
0
4.6 1.3 L9
17.7 14.5 19.2
53.5 52.2 49.1
22.7 30.1 29.1
0.7 C1906 1.5 C1907 .5
DUCK RIVER: HUNTINGTON SILT LOAM, 7 MILES NORTHWEST OF COLUMBIA, MAURY COUNTY, TENN.
C1908 0-10 12-38 38-66
0.1 0 0
0.1 0 0
0.2 .1
0
3.2 .5 .1
6.8 2.8 LI
63.1 60.0 62.3
24.3 33.9 34.7
1.9 C1909 1.9 C1910 1.4
CLINCH RIVER: HUNTINGTON LOAM, AT INTERSECTION OF U. S. HIGHWAY NO. 25 WITH CLINCH RIVER, GRAINGER COUNTY, TENN.
C1911 0-14 14-34 34-62
0 0 .1
0.5 .5 .5
2.3 2.5 5.5
2L0 20.7 24.3
18.5 19.3 19.3
40.5 38.7 34.3
15.6 17.0 14.6
1.3 C1912 1.1 C1913 1.1
BIG BLACK RIVER: VICKSBURG SILT LOAM, 14 MILES SOUTHEAST OF VICKSBURG, WARREN COUNTY, MISS.
C1882 _-_ 0-10 10-50 50-86
86-108
0 0 0 0
0.1 0 .1 .1
0 0 .3 .7
0.3 .1
L7 4.0
0.9 .5
1.1 L7
87.4 84.3 74.8 71.0
10.9 14.0 21.4 22.1
1.0 C1883 .9 C1884 .4 C1885 .3
LOESS MATERIAL, 3 MILES NORTHEAST OF YAZOO CITY, YAZOO COUNTY, MISS.
C1914. 72-90 0.1 93.0
1 Determinations by T. M. Shaw, E. F. Miles, and F. N. Ward. 2 Average of the 14 samples of sediment from the Ohio flood of January and February 1937, taken at various
points between Cincinnati, Ohio, and Cairo, 111. (el).

56 TECHNICAL BULLETIN 83 3, V. S. DEPT. OF AGRICULTURE
The Big Black River alluvium is strikingly different from that of any of the other rivers. The averages for the profile show it to con- tain less than 3 percent of material above silt size, 79.4 percent silt, and 17.1 percent clay. The mechanical analysis shows no evidence of stratification, but it does show a progressive decrease in clay content as the alluvium is built up. The character of this alluvium is de- termined largely by the loess that covers the drainage area of the Big Black River. The drainage area of the Big Black River, which lies east and somewhat parallels that of the Yazoo River, is covered almost entirely by loess material. This material is deepest (approximately 50 feet) at the crest of the eastern bluffs of the Yazoo Valley, but it becomes more shallow as it spreads eastward, covering virtually all the drainage area of the Big Black River.
Some general idea of the character of this loess material may be had from the mechanical analysis of raw or unweathered loess (sample C1914) given in this table and its chemical data given in subsequent tables. The mechanical analysis shows it to be composed almost entirely of silt and clay, with only 5.5 percent clay. The portion of this clay present when the loess was laid down and that since formed is not known.
CHEMICAL ANALYSES OF THE ALLUVIAL SOILS
In table 10 are given the chemical analyses of the alluvial soil profiles frum the eastern tributaries to the Mississippi River. The major constituents, silica, alumina, and iron oxide, vary with the content of clay. The minor constituents are distributed more equally be- tween the clay and nonclay fractions. Because of this more equal distribution, the minor constituents reveal more interesting facts regarding the origin of these soils and of their true chemical differences than do the major constituents.
The Ohio, Cumberland, and Tennessee profiles contain about the same amounts of the minor constituents, manganese, calcium, mag- nesium, potassium, sodium, phosphorus, and sulfur. This is espe- cially true of the manganese, phosphorus, and sulfur. The four bases, calcium, magnesium, potassium, and sodium, vary more widely. They are somewhat lower in the Cumberland profile than in the Ohio and Tennessee profiles. The content of calcium is considerably higher in the 14 samples of fresh Ohio sediments reported in table 10 at the bottom of the Ohio River profile. The pH values range from 6.8 to 7.7.

TABLE 10.—Chemical analyses of the alluvial soils from eastern tributaries to the Mississippi River i
OHIO RIVER: HUNTINGTON LOAM, 3 MILES NORTHEAST OF GOLCONDA, ILL., IN LIVINGSTON COUNTY, KY.
Sample No.
C1899 C1900 C1901 C2327-C2340 2__
Depth
Inches 0-10
20-60 80-120
. 3-2. 5
SIO2
Per- cent 79.60 68.96 67.00 69.75
TIO2
Per- cent 0.76 .98 .91 .91
AI2O3
Per- cent 9.56
15. 40 16.67 13.90
re203
Per- cent 3.67 5.82 6.11 5.75
MnO
Per- cent 0.13 .19 .19 .20
CaO
Per- cent 0.69
.45
.38 1.28
MgO
Per- cent 0.81 1.13 1.21 1.32
K2O
Per- cent 1.69 2.43 2.50 2.33
Na20
Per- cent 0.81
.77
.64
.50
P2O8
Per- cent 0.12 .19 .17 .21
SO3
Per- cent 0.08 .07 .06 .19
CO2
Per- cent 0 0 0 .82
Com- bined water
Per- cent 2.17 4.05 4.23 3.89
Total
Per cent
100.09 100. 46 100.07 100.04
Igni- tion
Per- cent 4.47 5.21 5.00 7.98
Organic matter
Per- cent 2.35 1.21 .81
4.09
CUMBERLAND RIVER: HUNTINGTON SILT LOAM, 2H MILES SOUTH OF SMITHLAND, LIVINGSTON COUNTY, KY.
Per- cent 0.11 .09 .07 .19
pH
7.3 6.7 5.8
C1902_. C1903__ C1904_
0-12 12-40 40-70+
81.04 78.00 74.44
9.40 11. 71 12.90
3.16 3.91 4.56
0.19 .18 .17
0.40 .35
0.49 .60
1.51 1.64 1.77
0.17 .19
0.07 .04 .06
2.62 2.26 3.45
100. 32 100. 02 99.96
4.45 4.04 4.20
1.88 1.82 .77
0.11 .07 .06
TENNESSEE RIVER: HUNTINGTON SILT LOAM, 10 MILES NORTHWEST OF WAVERLY, HUMPHREYS COUNTY, TENN.
C1905_. C1906-. C1907_.
0-10 12-36 40-90
76.44 72. 00 70.45
0.89 .94 .83
11.59 14.14 14. 22
4.06 4.89 5.18
0.17 .17 .11
0.65 .71 .95
0.72 .99 .97
1.81 1.66 2.12
0.47 .50 .47
0.19 .16 .31
0.06 .05 .13
2.98 3.93 3.82
100.01 100.18 99.56
4.92 5.80 4.75
2.00 1.95 .97
C1908_. C1909._ C1910__
DUCK RIVER: HUNTINGTON SILT LOAM, 7 MILES NORTHWEST OF COLUMBIA, MAURY COUNTY, TENN.
0.11 .14 .07
0-10 12-38 38-66
78.56 75.50 72.42
1.00 1.02 1.01
8.96 10.71 13.30
3.95 4.48 5.36
0.15 .13 .18
CLINCH RIVER: HUNTINGTON LOAM, AT INTERSECTION OF U. S. HIGHWAY NO. 25 WITH CLINCH RIVER. GRAINGER COUNTY, TENN.
C1911._.. C1912___ C1913___.
0-14 14-34 34-62
78.13 77.83
0.58 .66 .73
9.72 10.41 9.25
3.57 3.50 2.91
0.11 .11 .12
0.83 .67 .66
0.71 .69
2.83 2.58 2.66
0.54 .27 .52
0.14 .14
0.12 .10 .03
2.33 2.55 2.27
99.61 99.51
100. 57
4.70 4.44 3.94
2.43 1.94 1.71
C1882_. C1883.. C1884.. C1885_.
BIG BLACK RIVER: VICKSBURG SILT LOAM, 14 MILES SOUTHEAST OF VICKSBURG, WARREN COUNTY, MISS.
0.13 .11 .09
0-10 10-50 50-86
86-108
81. 67 80.74 77.48 77.84
0.74 .81 .75 .77
9.25 9.94 11.17 10.96
2.35 2.57 3.61 3.51
0.11 .10 .16 .13
0.58 .57 .50 .46
0.46 .55 .67 .71
1.84 1.83 1.87 1.72
1.25 1.27 .95 .95
0.10 .10 .16 .15
0.06 .07 .07 .10
1.74 2.02 2.74 3.07
100.15 100. 57 100.13 100. 36
2.85 2.96 3.37 3.59
1.13 .95 .65 .53
0.09 .08 .07 .06
C1914_.
LOESS MATERIAL, 3 MILES NORTHEAST OF YAZOO CITY, YAZOO COUNTY, MISS.
10.19 1.81 1.23 1.90 100.14
5.6 5.1 5.1
6.6 5.9 5.3
1.24 .99 .90
0.62 .72 .78
1.45 1.60 1.72
0.33 .22 .34
0.68 .41 .38
0.12 .10 .10
0 0 0
2.69 3.65 4.13
99.75 99.53 99.62
4.87 6.56 6.02
2.24 3.02 1.97
0.14 .16 .11
5.7 6.1 5.4
7.5 7.8 7.6
6.3 5.2 5.3 5.4
olS'fn^^lo^l^^^A ^? ^ Edgington, with the following exceptions: C1907, C190S-C1910, 2 Average of the 14 samples of sediment from the Ohio flood of January and February CI91I7CI912, by G. J. Hough; nitrogen determmations by A. E. Yelmgren; pH deter- 1937, taken at various points between Cincinnati, Ohio, and Cairo, 111. ' (21) mmations by E. H. Bailey. > \ /
>
f m o M f m
o
w
1—1
td >

58 TECHNICAL BULLETIN 8 3 3, U. S. DEPT. OF AGRICULTURE
It has frequently been noted by soil surveyors of this Bureau that fresh alluvium is in general more alkaline than the soils from which it was transported. The parent rock formations from which these river sediments are derived are of consolidated Paleozoic sediments in all but the Ohio River. The formations are sandstones, calcareous shales, acid shales, conglomerates, thick limestone, dolomites, cherty limestone, iron ore, and phosphate beds. Much of the area drained by the Ohio River is of glacial origin. However, in the formation of the soils in the drainage area of these rivers, much of the lime has been lost from the parent material by solution. This is apparent from the composition of the river waters. (See general discussion, p. 74.)
The Duck River soil profile is similar to the first three except in the quantities of phosphorus. The percentages of phosphoric oxide range from 0.38 to 0.68; the percentages in the other soils range from 0.12 to 0.31. The Duck River drains areas of commercial phosphate beds and soils of the Maury series. The chemical and physical properties of this latter soil have been reported by Alexander, Byers, and Edg- ington (1). The percentages of phosphorus oxide in the six horizons of the Maury silt loam, taken to the depth of 90 inches, are 0.62, 0.34, 1.72, 5.34, 4.09, and 2.72; the parent rocks contain 2.76.
The Clinch River profile contains about the same percentage of bases as those of the Ohio, Cumberland, Tennessee, and Duck Rivers, but the potassium oxide is higher; it ranges from 2.58 to 2.83 percent. The average percentage of potassium oxide for the other soils of this group is 1.86.
The Big Black River profile, unlike the others, is derived from loess. The loess material (C1914) contains 1.33 percent carbon dioxide; the soil none. The soil is leached, and the calcium and magnesium oxide average 0.53 and 0.60 percent, respectively. If we assume the carbon dioxide to be associated with calcium and mag- nesium as dolomite, there remains in the loess 0.97 and 0.98 percent of calcium and magnesium oxides of feldspathic type. These are twice the quantities of those bases remaining in the soil.
About one-half of the noncarbonate calcium and magnesium has been removed. Comparable loss of potassium and sodium oxides has not occurred. The percentages of potassium oxide in loess and the average percentage in the soil are 2.12 and 1.81; of sodium oxide, 1.23 and 1.10. About 85 percent of the potassium and 90 percent of the sodium yet remain. The Grenada soil reported by Marbut (27, p. 53) and the Memphis soil reported by Robinson and Holmes {31) are both derived from loess material of this general locality and are correspondingly high in alkali bases. Apparently loess-derived soils, although well leached, contain much unweathered feldspathic material.
CHEMICAL ANALYSES OF THE COLLOIDS
The data for the chemical composition of the colloids of the soil profiles of the eastern tributaries to the Mississippi River are given in table 11. These data show the colloids from the five rivers— Ohio, Cumberland, Tennessee, Duck, and Clinch—to be essentially the same in chemical composition. The range in percentages for the three major constituents is not wide. The deviation from the average is small. The variations in the secondary constituents are somewhat

ALLUVIAL SOILS OF THE MISSISSIPPI BASIN 59
greater. This is especially true for the calcium and potassium oxides. The calcium is highest in the colloids of the Duck River. In this profile much of the calcium is probably retained as phosphates. The percentages of potassium oxide are highest in the Ohio and Clinch profiles. Their averages are about 3.5 percent. A microscopic ex- amination of the soil by I. C. Brown indicates that the potassium in the nonclay fraction of the soil is largely confined to the muscovite in the Ohio profile and orthoclase in the Clinch. The soil of the Ohio River averages 2.21 percent potassium oxide; of the Clinch River, 2.69 percent. Apparently the Clinch River soil is richer in potassium than the Ohio, largely because of the difference in potassium-bearing minerals. The colloids of the Clinch River are slightly higher in potassium than those of the Ohio profile, because of a greater supply of the minerals in each soil. In subsequent table 15 it is shown that the dominant clay mineral in the colloids of the Ohio and Clinch River soils is hydrous mica. This would suggest that the hydrous mica was formed from muscovite in the case of the Ohio and from orthoclase in the case of the Clinch River soils. Since the feldspar is not a platy or layered mineral, there must have been an almost complete decomposition and resynthesis rather than a simple alter- ation.

TABLE 11.—Chemical analyses of alluvial soil colloids from eastern tributaries to the Mississippi Riv
OHIO RIVER: HUNTINGTON LOAM, 3 MILES NORTHEAST OF GOLCONDA, ILL. IN LIVINGSTON COUNTY, KY.
Sample No. Depth SÍO2 TÍO2 AI2O3 Fe203 MnO CaO MgO K2O Na20 P2O5 SO3 CO2 Com- bined water
Total Igni- tion loss
Organic matter
C1899 Inches
0-10 20-60
80-120 . 3-2.5
Percent 43.43 43.42 44.15 43.63
Percent 0.55 .70 .61 .58
Percent 27.75 26.52 25.58 27.54
Percent 12.62 13.50 13.30 12.15
Percent 0.27 .09 .09 .23
Percent 0.37 .70 .66
1.26
Percent 2.21 2.01 2.10 1.78
Percent 3.49 3.40 3.55 3.08
Percent 0.48 .09 .57 .66
Percent 0.55 .46 .44 .49
Percent 0.10 .12 .11 .22
Percent 0 0 0 0
Percent 9.03 9.32 8.90 8.95
Percent 100.85 100. 33 100. 06 100. 35
Percent 13.08 11.71 10.63 14.53
Percent
C1900 C1901__ 2.63
C2327-C2340 2 _
CUMBERLAND RIVER: HUNTINGTON SILT LOAM, 21/2 MILES SOUTH OF SMITHLAND, LIVINGSTON COUNTY, KY.
C1902 C1903. C1904.
0-12 12-40
40-70+
45.66 45.65 45.52
0.76 .83 .72
25.60 26.76 26.71
11.32 11.75 11.95
0.10 .10 .06
0.89 .64 .63
L76 1.68 1.75
2.91 0.52 0.72 0.06 0 9.40 99.82 13.48 2.81 .38 .63 .08 0 9.00 100. 31 11.46 2.72 .59 .54 .07 0 9.13 100. 39 11.18
4.50 2.69 2.25
TENNESSEE RIVER: HUNTINGTON SILT LOAM, 10 MILES NORTHWEST OF WAVERLY, HUMPHREYS COUNTY, TENN.
C1905 C1906. C1907_
0-10 12-36 40-90
44.17 44.03 43.68
0.71 .69 .64
26.80 25.93 27.10
11.53 11.95 11.68
0.34 .19 .18
L02 L56 1.78
1.76 1.75 1.51
2.52 2.64 2.69
0.32 .48 .52
0.54 .51 .54
0.11 .14 .13
10.10 10.04 10.07
99.92 99.91
100. 52
13.82 13.51 12.52
4. 15 3.86 2.72
DUCK RIVER: HUNTINGTON SILT LOAM, 7 MILES NORTHWEST OF COLUMBIA, MAURY COUNTY, TENN.
C1908 C1909. C1910.
0-10 12-38
44.01 45.86 45.36
0.84 .84 .77
25.89 25.78 25.38
10.82 10.10 11.10
0.29 .24 .20
2.47 2.63 1.61
1.39 1.63 1.66
3.11 2.18 2.68
0.57 .48 .52
L29 .82 .73
0.13 .13
9.95 9.50 9.98
100. 76 100.19 100.14
14.27 14.65 13.19
4.80 5.69 3.56
CLINCH RIVER: HUNTINGTON LOAM, AT INTERSECTION OF U. S. HIGHWAY NO. 25 WITH CLINCH RIVER, GRAINGER COUNTY, TENN.
C1911 C1912 _ . C1913
0-14 14-34 34-62
44.08 43.77 44.60
0.72 .70 .68
28.35 27.35 25.98
10.88 10.96 11.20
0.21 .17 .16
1.51 1.79 1.53
1.66 1.57 1.70
3.57 3.52 3.90
0.38 .38 .17
0.35 .35 .36
0.08 .17 .21
0 0 0
9.00 9.15 9.16
100. 79 99.88 99.65
12.54 12.92 13.58
3.89 4.15 4.86
o
ô
o
w d
00 CO
u
O
d

BIG BLACK RIVER: VICKSBURG SILT LOAM, 14 MILES SOUTHEAST OF VICKSBURG, WARREN COUNTY, MISS.
C1882_ C1883_. C1884_. C1885_.
0-10 10-50 50-86
86-108
47.50 47.60 48.05 47.93
0.94 .90
24.94 25.05 25.00 27.43
11.60 11.20 10.54 9.62
0.26 .26 .16 .14
1.18 .77
2.07 1.94 1.77 1.88
1 76 0.26 0.55 0.20 0 9.86 101.12 15.00 5.70
2.05 .26 .62 .13 0 10.08 100. 86 14.64 5.06
1 88 .06 .48 .12 0 9.89 99.61 12.61 3.01
1.77 .12 .47 .11 0 9.60 100. 52 12.10 2.77
C1914-
Average of first five profiles Average deviation of first five
profiles Average of Big Black River
profile Average deviation of Big Black
River profile
LOESS MATERIAL, 3 MILES NORTHEAST OF YAZOO CITY, YAZOO COUNTY, MISS.
2.02 72-90
I Determinations by R. S. Holmes.
49.57
44.49
±.76
47.77
±.22
0.55
1.72
±.06
.84
±.14
19.! 15.18
26.50
±.71
25.60
±.90
11.64
±.70
10.74
±.66
0.24
0.18
±.06
.21
±.05
1.59
1.32
±.58
1.74
±.15
1.92
±.09
2.06
3.05
±.43
1.86
±.10
0.39
0.43
±.06
.17
±.08
0.26
0.59
±.17
.53
±.05
0.09
0.11
±.03
.14
±.03
8.24
9.45
±.39
±.13
2 Average of the 14 samples of sediment from the Ohio fiood of January and February 1937, taken at various points between Cincinnati, Ohio, and Cairo, 111. (21).
>
< f w o H-1
O
M
>
O

62 TECHNICAL BULLETIN 8 3 3, U. S. D'EPT. OF AGRICÜLTURíE
The average composition for the 14 samples of the Ohio River sedi- ments collected immediately after the flood of January and February 1937 {21) is reported at the bottom of the Ohio River profile. The composition of both the sediments and their colloids is remarkably similar to that of the soils and colloids of the Ohio River profile in the constituents other than calcium, sulfur, phosphorus, and organic matter. These latter constituents are all higher in the sediments. The calcium oxide and sulfur trioxide are approximately twice as high as the averages for the profile. The percentages of organic matter in both the sediments and their colloids are higher than they are in the surface layer of the profile. The pH values were determined for the sediments shortly after they were collected and dried. They ranged in value from 6.8 to 7.7. The fact that most of all the fresh alluvia react alkaline, as observed by soils field men, finds an explanation in the higher calcium content in the fresh sediments of the Ohio River than in the older alluvium. The Ohio fiood of January and February 1937 was the greatest known since the first white settlements, and it produced unparalleled conditions for the deposition of sedimentary material. Some conception of the character and quantity of sedi- ment left in places along the river may be had from plate 4, A and 5.
DERIVED DATA FOR THE COLLOIDS
Table 12 contains data derived from the chemical composition of the colloids of the eastern tributaries of the Mississippi River. Within each profile no significant variations occur. No profile development is evident. In the entire group no great variation is found. In the Ohio River profile the ratios of silica to sesquioxide, to alumina, and to iron oxide are lowest and vary most widely. However, it is not to be inferred that this soil profile is not typical of the Ohio River allu- vium. The average for the ratios of silica to sesquioxide in the colloids of this Ohio profile is 2.12; the average for the colloids from 14 samples of recent alluvium from the Ohio River is 2.10, with an average devia- tion of ±0.02 {21). In other particulars the colloids of the Ohio pro- file are verv similar to those of the recent Ohio alluvium.

Tech. Bu!. 833. U. S. Dept. of Agriculture PLATE 4
A, Sedimentary material deposited on field lying along Ohio River, Washington County, Ind., 1937. The excavation shows clearly the line of demarcation be- tween the original top soil and the recently deposited material. B, This field on the Ohio River in Crawford County, Ind., during the 1937 flood was affected in the reverse manner to the above.
63

64 TECHNICAL BULLETIN 8 3 3, U. S. DEPT. OF AGRICULTURE
TABLE 12.^—Derived data: Alluvial soil colloids from the eastern tributaries to the Mississippi River
OHIO RIVER: HUNTINGTON LOAM, 3 MILES NORTHEAST OF GOLCONDA, ILL., IN LIVINGSTON COUNTY, KY.
Depth SÍO2 SÍO2 SÍO2 SÍO2 SÍO2 Com-
bined water 3
Com- bined water
R2O3 AI2O3 Fe203 Combined water of the soil acids 1
Total bases 2 of the soil
acids 1
C1899 .. _ Inches
0-10 20-60
80-120 .3-2.5
2.06 2.10 2.20 2.10
2.66 2.78 2.95 2.69
9.15 8.58 8.83 9.70
1.19 1.17 1.17 1.23
6.86 7.16 6.31 6.48
Percent 9.03 9.32 8.90 8.95
Percent 11. 60
C1900 11 14 C1901 C2327-C2340<
10. 97 10. 80
CUMBERLAND RIVER: HUNTINGTON SILT LOAM, 2H MILES SOUTH OF SMITHLAND, LIVINGSTON COUNTY, KY.
C1902. C1903. C1904.
0-12+ 12-40+ 40-70+
2.36 2.23 2.22
3.02 2.90 2.90
10. 72 10.33 10.13
1.21 1.29 1.24
7.70 8.52 7.31
9.40 9.00 9.13
11.17 10.60 11.00
TENNESSEE RIVER: HUNTINGTON SILT LOAM, 10 MILES NORTHWEST OF WAVERLY, HUMPHREYS COUNTY, TENN.
C1905. C1906. C1907.
0-10 2.33 12-36 2.23 40-90 2.15
2.85 10.18 2.88 9.80 , 2.74 9.94
1.13 1.10 1.09
7.85 10.10 6.92 10.04 6.84 10.07
11.77 11. 96 11.98
DUCK RIVER: HUNTINGTON SILT LOAM, 7 MILES NORTHWEST OF COLUMBIA, MAURY COUNTY, TENN.
C1908. C1909. C1910.
0-10 2.28 2.88 12-38 2.42 3.02 38-66 2.37 3.03
10.81 12.09 ; 10.86
1.14 1.18 1.14
6.40 9.95 6.47 9.50 7.06 9.98
12.12 11.63 11.91
CLINCH RIVER: HUNTINGTON LOAM, AT INTERSECTION OF U. S. HIGHWAY NO. 25 WITH CLINCH RIVER, GRAINGER COUNTY, TENN.
C1911 C1912 C1913
0-14 14-34 34-62
2.19 2.13 2.26
2.75 2.67 2.88
10.78 10. 46 10.47
1.20 1.17 1.18
6. 55 6. ,38 6.45
9.00 9.15 9.16
11.02 11.21 11 15
BIG BLACK RIVER: VICKSBURG SILT LOAM, 14 MILES SOUTHEAST OF VICKSBURG, WARREN COUNTY, MISS.
C1882. C1883. C1884. C1885.
0-10 2.47 3.24 10.90 10-50 2.51 3.23 11.30 50-86 2.57 3.26 12.11 86-108 2.43 2.97 13.23
1.23 1.22 1.27 1.29
8.31 9.86 9.02 10.08
10.36 9.89 9.58 9.60
11.57 11. 66 11.29 11.10
LOESS MATERIAL, 3 MILES NORTHEAST OF YAZOO CITY, YAZOO COUNTY MISS.
C1914 72-90 2.76 4.10 8.42 1.42 7.52 8.24 10 16
Average of first five profiles - 2.24
±.08
2.48
±.03
2.86
±.10
3.17
±.10
10.21
±.65
11.88
±.78
1.17
±.03
1.25
±.03
6.99
±.49
9.32
±.65
9.45
±.39
9.86
±.13
11 42 Average deviation
of first five pro- files ±.41
11.40
±.21
Average of Big Black River pro- file
Average deviation of Big Black River profile
1 Combined water + water equivalent of the total bases. 2 Calcium, magnesium, potassium, and sodium oxides. ? Ignition loss less organic matter and CO2. < Average of the 14 samples of sediment from the Ohio flood of January and February 1937, taken at various
points between Cincinnati, Ohio, and Cairo, 111. (el).

ALLUVIAL SOILS OF THE MISSISSIPPI BASIN 65
The data for the Big Black River profiles stand apart from those of the other five profiles. The data for the Ohio, Cumberland, Tennessee, Duck, and Clinch Rivers are averaged for comparison with the averages for the Big Black River. The averages of the ratios of silica to other constituents in the colloids of the Big Black River are all higher than those of the first five. This indicates that the Big Black River colloid is less weathered and leached than the others. In comparison to the silica, the Big Black River colloid has lost more bases than the colloids from the other rivers. The bases are replaced by water, but the Big Black River colloids have not acquired as much water as the quantities of remaining silica indicate. The average of the ratios of silica to total bases in the Big Black River is 9.32; in the others, 6.99. The average percentage of combined water in the Big Black River colloid is slightly greater than it is in the colloids of the other rivers, but the average percentages of water plus the water equivalent of bases are nearly equal.
The various ratios as well as the percentages of combined water vary somewhat, but the sum of the water equivalent of the bases plus the combined water more nearly approaches a constant value in the colloids of all the soils. The mean is 11.4 percent. The average deviation from the mean is ± 0.41 percent. This indicates that the mineralogical composition of the colloids in this group of soils is essentially the same.
BASE CONTENT IN THE NONCLAY MATERIALS IN THE ALLUVIAL SOILS OF THE MISSISSIPPI RIVER AND ITS TRIBUTARIES
It is obvious that the weathering of the primary minerals of these soils is in continuous progress. The loss of bases by the soil minerals through hydrolysis becomes a source of supply to the colloids. It therefore is of interest to ascertain the base content of the nonclay portion of these soils. The percentages of bases in the nonclay
A-(BYC) portion were calculated by the following formula: —ini)_n =^per-
centage of base in the nonclay fraction of the soil; 4== percentage of base in the whole soil; 5=percentage of base in the colloids; and (7= percentage of clay in the whole soil. These results are subject to two inherent errors: (1) The analytical errors in the composition of the soil and colloid; and (2) the assumption that the clay is the same in composition as the colloid. However, in many of these soils the percentages of calcium, magnesium, and potassium oxides do not differ widely in the soil and colloid. The sodium differs more widely and is always higher in the soil than in the colloid.
In order to present these data in such a form as to permit a com- prehensive survey of the whole group of soils, profile averages of bases are assembled in table 13. These averages are permissible in these profiles because of the uniformity of the composition of the bases in each profile. Included in this table is a comparison of the bases in the nonclay material of these soils, with the average as estimated in the 10-mile crust of the earth {39). This comparison is not intended as a measure of the extent of weathering that has

66 TECHNICAL BULLETIN 8 3 3, V, S. DEPT. OF AGRICULTURE
taken place in the material. The geological materials and the min- erals from which large groups of soil are formed, as well as the com- position of the 10-mile crust of the earth at various places, are both too varied for such a comparison to mean much as a measure. It does, however, give some comparison of the abundance of the bases in minerals undergoing decomposition to the general average conx- position of those in the crust of the earth that are not.
TABLE 13.—Average percentage of hases in nonclay portion of alluvial soils of the Mississippi River and its tributaries and a comparison of these with the corre- sponding bases in the 10-mile crust of the earth ^
EASTERN TRIBUTARIES
Location
Bases in nonclay material Bases compared with correspond-
ing constituents of the earth's crust 1
CaO
Percent 0.45 .25 .28 .51 .55 .45
MgO K2O NaoO
Percent O.eo .39 .39 .19 .46
].22
Total bases CaO MgO
Peicent 16.6 6.9
15.3 7.9
13.0 8.2
K2O XaoO
Ohio River - -- Percent
0.65 .27 .60 .31 .51 .32
Percent 1.75 1.21 1.21 1.12 2.51 1.63
Percent 3.75 2.12 2.48 2.13 4.03 3.62
Percent 9.4 5.5 6.2
11.2 12.1 9.9
Percent 61.8 42.7 42.7 3P.6 88.7 57.6
Percent 27.7
Cumberland River 12.0 Tennessee River . _ 12.0 Duck River 5.8 Clinch River Big Black River _ _ -_ _
14.1 37.5
Average .41 .44 1.57 .59 3.02 9.0 11.3 55.5 18.2
MISSISSIPPI RIVER LOWLANDS
New Albin, Iowa _ Cairo, 111 Forrest City, Ark__ Lake Village, Ark Yazoo City, Mi".s_ Rolling Fork, Miss. Onward, Miss Onward, Miss.2 Baton Rouge, La Gonzales, La Vacherie, La
Average
2. 97 1.13 2.10 1.24 7.44 65.3 28.8 74.2 1.88 1.16 2.16 1.67 6.87 41.3 29.6 76.3 .22 .25 2.75 1.33 4.55 4.8 6.4 97.2 .56 .70 2.80 1.10 5.16 12.3 17.9 98.9 .26 .70 2.43 1.29 4.68 5.7 17.9 85.9 .65 .88 2.42 1,31 5.26 14.3 22.5 85.5 .95 1.34 2.52 1,42 6.23 20.9 34.2 89.0
1.97 .76 1.89 1, 10 5.72 43.7 19.4 66.8 1.22 .98 2.30 1,87 6.37 26.8 25.0 81.3 .51 .33 1.73 1.29 3.86 11.2 8.4 61.1 .74 .74 2.59 1.35 5.42 16.3 18.9 91.5
1.08 .82 2.33 1.36 5.60 23.9 20.8 88.5
38.4 51.7 41.2 34.1 39.9 40.6 44.0 34.1 57.9 39.9 41. 8
42.1
WESTERN TRIBUTARIES
Milk River Missouri Rivcr_ Yellowstone River__ Platte River Arkansas River Red River Verdigris River White River Ouachita River
Average: Rivers of Great Plains Rivers of Interior Higl;
lands 4 General average
1.89 0.81 2.88 1.50 7.08 41.5 20.7 101.8 3.17 2.08 2.36 1.86 10.27 87.2 53.1 83.4 2.69 3.38 2.99 .80 9.86 59.1 86.2 105. 6 1.41 .62 2.43 1.82 6.28 31.0 15.9 85. 9 .88 .50 2.36 1.80 5.54 19.6 12.8 83.4
4.36 2.95 3.35 1.03 11.69 95.8 75.3 118. 3 .40 .48 .75 1.19 2.82 8.8 14.8 20.5 .66 .13 1.73 .53 3.07 14.5 3.3 61.1 .42 .60 2.14 1.30 4.46 8.1 15.3 75.6
2.53 1.72 2.73 1.47 8.45 55.7 44.0 96.4
.49 .40 L54 1.01 3.45 10.5 11.1 54.4 1.85 1.28 2.33 1.31 6.78 40.6 32.9 82.3
45.7 56.7 26.8 55.5 54.9 31.4 36.3 16.2 39.6
30.7 40.5
1 Percentage by weight of CaO=4.55, MgO = 3.92, K20 = 2.83, Na20 = 3.23 in the 10-mile crust of the earth 39).
2 This material was from a bored well 14 to 100 feet deep. 3 Milk, Missouri, Yellowstone, Platte, Arkansas, and Red Rivers. * Verdigris, White, and Ouachita Rivers.

ALLUVIAL SOILS OF THE MISSISSIPPI BASIN 67
EASTERN TRIBUTARIES
With few exceptions the percentages of calcium, magnesium, potassium, and sodium oxides for the eastern tributaries to'the Missis- sippi River, assembled in the first section of table 13, indicate that these soils are rather thoroughly debased with respect to all four bases except potassium. Less hydrolysis apparently has occurred in the Ohio, Clinch, and Big Black River profiles, in which higher per- centages of calcium, potassium, and sodium are noted, than in the other three. The higher percentage of bases in the Ohio profile are perhaps caused by the influence of the glacial material transported from its drainage area to the north. The higher base content of the Clinch River is to be expected, as the soil is composed of considerably more material above silt size than occurs in other soils of this group and of material more recently disintegrated in which the mechanical weathering dominates the chemical. The material of the Big Black River is of loess origin and, from all indications, not deeply weathered and leached. Microscopic examination shows the sodic plagioclase feldspars predominate over other kinds, a factor that accounts for its high sodium content.
MISSISSIPPI RIVER LOWLANDS
The nonclay portions of the various soil profiles of the Mississippi River lowlands are in general relatively high in total bases. They are all remarkably high and uniform in contents of potassium and sodium. The contents of calcium and magnesium are more variable. The profiles on the upper part of the river at New Albin, Iowa, and Cairo, 111., contain carbonates, and the high percentages of calcium and magnesium oxides indicate the probable presence of dolomitic material. It may be seen from the composition of the whole soil, p. 2, that these two profiles are more stratified than others of this group and that the carbonate material is largely concentrated in the lower layers. Much of the calcium and magnesium in the profile at New Albin no doubt was transported from the glacial material of the drainage area of the upper Mississippi River. That of the Cairo profile likewise is partially of glacial origin, but more largely, since it lies below the con- fluence of the Missouri River, is composed of materials from the Great Plains.
The nonclay material in the proflle at Forrest City, Ark., unlike the soil at New Albin and Cairo, is low in both calcium and magnesium (0.22 and 0.25 percent) although high in potassium and sodium. The soil is acid with a range in pH of 5.9 in the surface to 4.8 at a depth of 44 inches. The profile is very uniform in texture, and as a whole contains less than 2 percent of material above silt size (0.05 mm.). According to the description on p. 6, it is poorly drained and, as related to other profiles of this group, is a much older deposi- tion. No doubt the time element, the high water content, and the small particle size of the soil material have aided in the removal of the calcium and magnesium from this soil by solution. Perhaps the same thing has taken place in other profiles of this group but to a lesser extent.

68 TECHNICAL BULLETIN 8 3 3, U. S. DEPT. OF AGRICULTURE
In the case of the Yazoo City profile, which is well drained and has a low water table, the nonclay material is also low in calcium (0.26 percent). The soil is acid and has a pH of 5.3. The loss of calcium and the development of acid character perhaps took place before the material was deposited in its present location (see p. 25). The nonclay material of the Baton Rouge profile is unlike that of the Yazoo City profile in composition but very similar to it in texture and envi- ronment. The material contains a rather high content of each of the four bases. The percentage of calcium oxide is 1.22. The range of pH in the soil profiles is from 5.8 to 7.4. The soil, like that of the Yazoo City profile, is well drained and has a low water table. The material of this profile no doubt is composed largely of slightly weath- ered material transported by the western tributaries to the Mississippi lowlands. The material of the Yazoo profile is composed to some extent of varying quantities of loess and Coastal Plain material which covers the eastern drainage area of the Yazoo River. The high base content, especially that of calcium in the nonclay material of soil samples from the bored well at Onward, Miss., is to be expected. The nonclay material is relatively high in calcium, the colloidal material is not. The water from wells in this vicinity contains much calcium and magnesium bicarbonates. (See p. 18.)
WESTERN TRIBUTARIES
In the study of the base contents in the nonclay material of the western tributaries to the Mississippi, it is well to divide the rivers into two groups. The first group includes the rivers whose drainage areas are confined largely to the Great Plains and the higher lands to the west: The Milk, Missouri, Yellowstone, Platte, Arkansas, and Red Rivers. The second group includes those rivers that drain portions of the Interior Highlands: The Verdigris, White, and Ouachita Rivers. The nonclay material in the soil profiles of the first group of rivers contains a somewhat variable but a relatively high content of each of the four bases, calcium, magnesium, potas- sium and sodium. The average percentage of calcium oxide is 2.53; of magnesium oxide, 1.72; of potassium oxide, 2.73; and of sodium oxide, 1.47. The total is 8.45 percent. These averages are much higher than those for the profiles of the eastern tributaries, and somewhat higher than those for the Mississippi River profiles. The contents of bases in the second group also vary rather widely but are all lower than the corresponding ones of the first group. In the second group the average percentage of calcium oxide is 0.49; of magnesium oxide, 0.40 ; of potassium oxide, 1.54 ; and of sodium oxide, 1.01. These data show that the nonclay materials from the rivers of the Interior Highlands are rather similar in composition to that of the eastern tributaries.
The comparison of the contents of bases in the nonclay material of these soils to those of the 10-mile crust of the earth shows that the material from the eastern tributaries and the rivers of the Interior Highlands is rather thoroughly debased in respect to the calcium, magnesium, and sodium, but that the potassium in general is more than 50 percent retained. The contents of bases retained in the nonclay material of the Mississippi River profiles are quite variable. As a whole they are approximately 75 percent debased, except in the

ALLUVIAL SOILS OF THE MISSISSIPPI BASIN 69
case of potassium which is well retained. The calcium, magnesium, and sodium of the nonclay material of the western tributaries, exclusive of those of the Interior Highlands, are about 50 percent retained. The average content of the potassium is little less than the average for the 10-mile crust of the earth.
The comparison of these data for the eastern tributaries and the rivers of the Interior Highlands with those of the western tributaries shows, perhaps to some extent, the difference in disintegration and debasing that has taken place in these different drainage areas. The causes of these differences cannot be attributed to any one factor. One factor is the difference in geological material, another the differ- ence in length of time weathered, but perhaps the greatest factor is the difference in climate, particularly the rainfall. A review of these data shows that the potassium in every case has been little affected by the weathering processes in comparison to the magnesium, calcium, and sodium.
However, the loss of bases from the nonclay material is not to be assumed to be lost from the soil as a whole. Much of the bases is not. The colloidal material seems to retain certain of these bases to a greater or lesser extent than it does others. This may be seen from a comparison of the averages of the bases in the nonclay part of the alluvial soils of the Mississippi Valley and the averages of the bases in the colloidal part. These averages are assembled in table 14.
TABLE 14.—Comparison of average percentages of hases in noncolloidal ^ and colloidal material of the alluvial soils of the Mississippi River Valley
Sam- ples
CaO MgO K2O NajQ
Location Noncol-
loidal Colloi-
dal Noncol- loidal
Colloi- dal
Noncol- loidal
Colloi- dal
Noncol- loidal
Colloi- dal
Eastern tributaries Number
19 44 35
9
Percent 0.41 1.08 2.53 .49
Percent 1.32 1.60 2.31 1.10
Percent 0.44 .82
1.72 .40
Percent 1.74 2.48 3.16 1.86
Percent 1.57 2.33 2.73 1.54
Percent 3.05 2.15 2.58 2.17
Percent 0.59 1.36 1.41 1.01
Percent 0.43
Mississippi River .33 Western tributaries 2 Rivers of Interior Highlands 3.
.20
.10
1 Assuming that all material less than 0.002 mm. has the same composition as the material less than 0.0002 mm.
2 Milk, Yellowstone, Missouri, Platte, Arkansas, and Red Rivers. 3 Verdigris, White, and Ouachita Rivers.
COMPARISON OF BASE CONTENT IN THE NONCLAY AND COLLOIDAL MATERIALS
In 64 out of a total of 107 samples from which the averages shown in table 14 were calculated, the percentages of potassium oxide are higher in the colloidal than in the noncolloidal material. The potas- sium is higher in all samples of colloidal material from the eastern tributaries and the rivers of the Interior Highlands than it is in the noncolloidal material, except in the case of the Big Black River profile in which the contents of potassium are relatively low and approximately the same in both the colloidal and noncolloidal ma- terial. This indicates that the Paleozoic shales of the areas drained by the eastern tributaries and the rivers of the Interior Highlands are more thoroughly weathered and perhaps more enriched originally with potassium-bearing micas than the Cretaceous shales of the

70 TECHNICAL BULLETIN 8 3 3, U. S. DEPT. OF AGRICULTURE
areas drained by the western tributaries. Many of the micas con- tain about 10 percent potassium oxide {5) and are known to be quite resistant to weathering. But it is to be expected that, as they become fragmented and partially hydrolyzed in becoming a part of the clay minerals, they would retain a considerable part of their potassium {13). It is also known that the potassium in most soil colloids is firmly held. Most of the potassium is not readily exchangeable and is therefore not readily removed by the drainage waters.
The percentages of calcium and magnesium oxide are higher in the colloidal than in the noncoUoidal material in all samples except those that contain carbonates. The percentages of calcium, magnesium, and potassium oxides in the colloidal material are less variable than those of the noncoUoidal material. Although it is to be assumed that the colloidal part of these soils is the more important, the effect of the abundance and character of the noncoUoidal material upon the aeration and internal drainage of the soil and its mineral composition as a constant supply of bases to the colloids is not to be ignored.
MiNERALOGICAL COMPOSITION OF THE CoLLOIDS
Because of the interest in clay minerals and their relationship to chemical and physical properties of soils, the data of table 15 were assembled. These data consist of the derived data and the per- centages of minerals determined in certain colloids of each group of alluvial soils and of the averages and the average deviations for the derived data of the colloids for each group. It may be seen from the average deviations and the derived data of tables 3, 4, 7, 8, 11, and 12 that these averages differ little from the composition of any one sample of the group.
In view of the recent progress in mineralogical examination of clays and the determinations of clay minerals in soil colloids, S. B. Hendricks and L. T. Alexander were asked to determine the minerals of the particular colloids reported in table 15. The methods used are described in their publications {2, 19).
The derived data and the mineralogical composition of the colloids of the eastern tributaries are rather similar to those of the colloids of the rivers of the Interior Highlands. The similarity of the derived data indicates that there is some dominant colloidal mineral, whose ratio of silica to sesquioxides is less than 3, which is common to all the colloids of these two groups. The mineralogical examination shows this dominant mineral to be hydrous mica. Grim, Bray, and Bradley {17) give the formula 2K20.3R'0.8R''2O3.24SiO2.12HoO as representing the average of their analyses of illite of clay sediments. In this formula the ratio of silica to sesquioxides is 3. Assuming the sesquioxides in the above formula to be 1 mol of iron oxide to 3 of alumina, the percentage of water is 7.50. The lower ratios of silica to sesquioxides in the colloid of the eastern tributaries can probably be accounted for by the presence of free iron oxide, the variability of the composition of the hydrous micas and the presence of kaolin. The ideal composition of kaolinite is Al2O3.2SiO2.2H2O, in which the ratio of silica to alumina is 2 and the percentage of water is 13.9. Perhaps it is the water of the kaolinite in these samples that raises their average percentage, 9.45, above that of the hydrous micas, 7.5.

ALLUVIAL SOILS OF THE MISSISSIPPI BASIN 71
TABLE 15.—Mineraloqical composition and review of data: Colloids of alluvial soils of the Mississippi River, its tributaries, and lowlands
EASTERN TRIBUTARIES: OHIO, CUMBERLAND, TENNESSEE, DUCK, AND CLINCH RIV^ERS
" Molecular ratios
Com- bined water
Per- cent 9.45
±.39 9.32 9.00
Com- bined water of the
soil acids 1
Soil minerals 2
Item SiOo SÍO2 SÍO2 SÍO2 Kao- linite
Mont- moril- lonite
Hy-
R2O3 AI2OC n20+total bases Total bases drous micas
Average of 15 sam- ples 2.24
±.08 2.10 2.23
2.86 ±.10 2.78 2.90
1.17 ±.08 L17 1.29
6.99 ±.49 7.16 8.52
Per- cent 11.42 ±.41 11.14 10. 60
Per- cent
Per- cent
Per- cent
Average deviation Sample No. C1900 3 Sample No. C1903 3
'l5±5" 10±5
10±5 10±5
70±10 70±10
MISSISSIPPI RIVER LOWLANDS
Average of 44 sam- ples 3.12
±.10 3.09 3.12
3.99 ±.21 3.79 4.32
L51 ±.11
1.59 1.31
7.59 ±.77 6.63 7.55
8.33 ±.63 7.57 9.63
10.35 ±.66 10.27 11. 65
Average deviation_ Sample No. C1877 s Sample No. C2973 K
10±5 ]0±5
35±iÖ 35±10
50±10 50±10
WESTERN TRIB1 JTARIES: MILK, YELLOWSTONE, MISSOUI SAS RIVERS
II, PLATTE, AND ARKAN-
Average of 35 sam- ples_ 3.08
±.22 3.03 2.93
3.87 ±.11 3.67 3.70
1.51 ±.18 1.59 1.44
6.24 ±.89 7.01 4.20
7.73 ±.62 7.52 6.85
10.23 ±.78 9.74
10.42
Average deviation. Sample No. C3009 3 Sample No. C3277 3
15±5 15±5
35±10 20±5
50±10 60±10
RIVERS OF INT ERIOR HIGHLANDS: VERDIGRIS, WHITE, AND C )UACH ITA RIVERS
Average of 9 sam- ples 2.59
±.09 2.74
3.24 ±.15 3.38
1.42 ±.07
1.47
9.00 ±.63 8.74
8.80 ±.31 8.61
10. 59 ±.47 11.73
Average deviation. Sample No. C3283 3 15±5 10±5 70±10
1 Combined water plus the water equivalent of the bases corrected for calcium carbonate content. 2 Minerals determined by Hendricks and Alexander. 3 The mineralógica! composition of a sample typical of its group.
The ratios of silica to sesquioxides for the colloids of the Mississippi River lowlands and the western tributaries averages 3.12 and 3.08, respectively. In general, the color of these colloids indicates the presence of httle free iron oxide (FcsOg. XH2O). The dominant mineral of these colloids is also given as hydrous mica. The examination indicates an average content of about 50 percent of hydrous mica and about 35 percent of montmorillonite, which is a considerably higher percentage of montmorillonite than occurs in the colloids of the eastern tributaries.
The ratios of silica to total bases show a rather high base content. The variations in these ratios are in general small and too inconsistei 11 to be of aid in a mineralogical classification.
GENERAL DISCUSSION
The important differences in the soil and the comparative amount? of plant food constituents between the alluvial soils and the eastern tributaries and western tributaries, as well as those of the Mississippi

72 TECHNICAL BULLETIK 83 3, U. S. DEFT. OF AGRICULTURE
River lowlands, are brought out in this general discussion. These differences in the chemical composition and physical characteristics are reflected in the potential value as well as in the present agricultural values and use of these lands.
Those constituents that are frequently lacking in soils to the extent of limiting plant growth and also the percentages of the clay are assembled in table 16. The contents of these constituents are re- ported here in the surface horizon only for both the soil and colloid. The attention is directed to the surface soil for three reasons: First, for the sake of simplicity; second, because the surface soil is fairly representative of the whole soil; and third, because cultivated plants feed largely from the surface soil.
TABLE 16.—Clay content and content of certain constituents in the surface horizons of alluvial soils and colloids of the Mississippi drainage area
MISSISSIPPI RIVER LOWLANDS
Item Clay CaO MgO KaO MnO P2O6 N
Range in soil _ _ Percent
10.4-73.8 37.6
Percent 0. 50-1.96
1.12 1.13-2. 52
1.58
Percent 0. 70-2. 53
L41 1. 91-2.84
2.35
Percent 1. 90-2.67
2.42 1. 62-2.47
2.21
Percent 0.05-. 29
.11 . 05-.17
.10
Percent 0.07-. 26
.18 . 16-. 35
.26
Percent 0.08-. 29
.17 Average in soil ___ Range in colloid . . _ __ Average in colloid _ _ _
WESTERN TRIBUTARIES
Range in soil Average in soil Range in colloid___ Average in colloid.
0. 36-4. 32 1.72
. 38-7. 40 2.13
0. 65-3. 93 1.66
1. 56-5. 59 2.90
1.14-3. 04 2.27
1.87-3.09 2.59
0. 01-. 26 .07
. 04-. 19 .11
0.11-20 .17
. 15-. 40 .25
0. 06-. 19 .14
EASTERN TRIBUTARIES
Range in soil Average in soil Range in colloid.__ Average in colloid-
10. 9-24. 3 18.1
0. 40-1. 24 .73
. 37-2.47 1.24
0.46-. 81 .63
1.39-2. 21 1.97
1. 45-2. 83 1.85
1. 76-3. 49 2.89
0.11- 19 .14
.10-.34 .24
0.10-. 68 .23
. 35-1. 29 .66
0.09-. 14 .12
These data show the soils sampled on the Mississippi lowlands to range in clay content from 10.4 to 73.8 percent. The average per- centage of clay for the 11 surface soils examined is 37.6. In sampling these soils no attempt was made to represent the soils that are ex- tremely low or high in clay, but rather to sample the dominant soil of the important series. The clay content of these soils is high in comparison to that of the surface horizon of residual soils. The soils differ, too, from most residual soils in silt content. The quan- tities of silt and clay in the soils of the Mississippi lowlands, as may be seen from table 1, are virtually complementary; that is, within a few percent the two components make up the whole soil. For the best agricultural use this type of mechanical composition has both its good and bad features. Both the water-holding and base-exchange capacities of soils are determined largely by the content of clay. The clay buffers both the toxic constituents that sometimes develop in the soil and also the toxic chemicals that are inadvertently added to the soil in fertilizer material or in sprays and dusts that are used as insecticides and fungicides. On the other hand, the detrimental effect of the high clay content is well recognized in the cultivation of
ALLUVIAL SOILS OF THE MISSISSIPPI BASIK 73
the soil. It is a well-known fact that the most sandy soils are cul- tivated easier than are clay soils. Russell {32, pp. 170 and 54-6) speaks of the detrimental effect of excessive quantities of silt and clay in certain English soils and maintains that soils having over 15 to 20 percent of fine silt are difficult to drain and cultivate. On the other hand, the nonclay material in these alluvial soils, as shown in table 13, is rather high in constituents essential to plant growth. The more finely divided this material is the greater its influence on the soil solution.
As far as total quantities are concerned, these soils are apparently well supplied in the constituents essential to plant growth. In general, the percentages of calcium, magnesium, and potassium oxides are higher and less variable in the colloid than in the whole soil. The percentages of manganese and phosphorus oxides show a greater variation than the other three constituents. Both the soils and the colloids of the eastern tributaries are higher in potassium and in manganese but definitely lower in magnesium and calcium than are the sous of the western tributaries. The differences in the content of manganese and potassium may be attributed to differences in geological material as well as climate, but the differences in the con- tents of calcium and magnesium are caused largely by difference in climatic conditions. An explanation of some of these differences is to be found in the quantity and composition of the soluble salt and sediment carried by the various rivers. Much data have been re- ported pertaining to the saline content {12) and the quantity of the sediments (57, 38) carried by many of the rivers of both the eastern and western drainage areas. But for the sake of simplicity, certain data relating to the development of these soils are reviewed only for the Ohio and the Missouri Rivers. These rivers are the largest and most representative of the two drainage areas. The drainage area of the Ohio is 214,000 square miles; that of the Missouri is 526,000 square miles. The average fiow of the Ohio is 270,000 cubic feet per second; that of the Missouri is only 94,000. The average salinity of the Ohio is 175 p. p. m.; of the Missouri, it is 346 p. p. m. The quantity of soluble salts carried by the Ohio is 190 tons per square mile per year; that of the Missouri is 50 tons. The salts of the two rivers differ in composition {12, p. 123).
The average composition of the soluble salts in the Ohio and the Missouri Rivers is shown in table 17.
From the data in table 17 there is estimated a loss of an average of 108 pounds of calcium per acre per year from the Ohio drainage area and 24 pounds from the Missouri drainage area. The quantities of magnesium removed are approximately one-fourth that of the calcium. In the waters of the Ohio River the carbonates predominate over the sulfates and chlorides; in the Missouri River the reverse is true. If corrections for contamination of sulfates and chlorides could be made, a much greater difference of carbonates to sulfates and chlorides would obtain in the waters of the Ohio River. Differences in the composition of the soil exist not only in the minor constituents but also in the major constituents. The average quantities of silica lost to the Ohio River is 74 pounds per acre; to the Missouri, 13 pounds per acre. These differences in soluble silica may appear at first to be little related to soil development, but when continued for ages the effect becomes more real. The effect of this upon the soils is most

74 TECHNICAL BULLETIK 8 3 3, U. S. DEPT. OF AGRICULTURE
marked in the composition of the colloids and is perhaps best illus- trated in the ratios of silica to sesquioxides and silica to alumina. The ratio of silica-sesquioxides in the colloids of the surface soil of the Ohio River at Golconda, 111., is 2.06; the average for the 14 samples of sediments collected along the Ohio River immediately after the 1937 flood is 2.10. The ratios for the silica to sesquioxides for the colloids of the Missouri River soils are much higher. On the Missouri River at Fort Peck, the ratio of silica to sesquioxides is 3.43; at Mobridge, S. Dak., 3.26; and at Auburn, Nebr., 3.16 (81). The difl^erence between the silica-alumina ratios for the colloids of the two rivers shows differences of approximately the same magnitude.
TABLE 17.- -Average composition of the solvble salts in the Ohio and the Missouri Rivers
River CO3 SO4 Cl NO3 Ca Mg Na+K Fe203 SÍO2 Salinity
Ohio Missouri
Percent 30. 29 25.63
Percent 16.97 30. 44
Percent 7.17 3.52
Percent 1.64 .85
Percent 18. 25 15. 22
Percent 4.70 4.68
Percent 8.10
10.97
Percent 0.43 .20
Percent 12.45 8.49
P.p. m. 175 346
Although the sedimentary material from both the eastern and west- ern drainage areas is mixed and mingled together and constitutes the source of the alluvial soils of the Mississippi lowlands, it is obvious from a comparison of the chemical composition of the soil colloids of the three areas that the material from the west constitutes the major portion of the materials in the Mississippi lowlands. This is par- ticularly evident from the comparison of the ratios of silica-sesqui- oxides in colloids of the soils from the Missouri, Mississippi, and Ohio Rivers. The average value for the ratio of silica-sesquioxides in the colloids of the Missouri River soils is 3.26; for the Mississippi, 3.12; and for the Ohio, 2.12. The derived data reported in tables 4, 8, and 12 also confirm the relative relationship of the soils of the lower Mis- sissippi to the alluvial soil of the western and eastern tributaries. Since there is no weighted value assigned to the data for the soils of the various rivers, the averages reported in tables 3, 7, and 11 are not to be interpreted as weighted averages representing the average com- position of the area as a whole.
Some information regarding the relative quantities of sediments transported from the western and eastern drainage areas to the Mis- sissippi lowlands is to be had from a comparison of the quantities of silt carried by the Missouri and Ohio Rivers {38). At St. Charles, Mo., 28 miles above the mouth of the Missouri River, during the period February 1 to October 31, 1879, the average concentration of sedi- ment was 2,543 p. p. m.; the mean discharge, 83,343 cubic feet per second; volume of sediment per day, 686,345 cubic yards. At Padu- cah, 45 miles from the mouth of the Ohio River, during the period December 16, 1878, to December 30, 1879, the average concentration of sediment was 221 p. p. m.; the mean discharge, 229,146 cubic feet per second; volume of sediment per day, 123,470 cubic yards.
Because of the wide diversification of geological material represented in the combined drainage areas of the Mississippi River, which is ap- proximately 1,250,000 square miles, it is to be expected that the allu- vial soils of this river, in addition to containing the plant food con-

; ALLUVIAL SOILS OF THE MISSISSIPPI BASIIST 75
stituents previously noted, are rather well supplied with the rare, or '^trace," elements that are frequently emphasized in current literature as being essential to normal plant and animal development (6). Recently some work has been done in this Bureau on the determina- tion of certain constituents in these soils. Whetstone and others (^0) report 47 to 48 p. p. m. of boron and 5 to 9 p. p. m. of arsenic in the Sharkey soil profile at Houma, La. Edgington^ found zinc in the amount of 167 p. p. m. in the Sharkey soils at Houma, La., 96 p. p. m. at Gonzales, La., and 138 p. p. m. at Lake Village, Ark. In the same soils Hough^ found fluorine in the amounts of 590,360, and 579 p. p. m., respectively. Williams and Lakin^ found selenium present in all samples of Mississippi alluvium examined, the quantities ranging from 0.3 to 0.6 p. p. m. This indicates that a portion of this soil material was transported from seleniferous soils of the western drainage areas. It is probable that other areas containing abnormal quantities of one or more trace elements may have a similar effect upon the composi- tion of these soils.
Alluvial soils generally are more fertile than soils of the adjacent uplands from which they are transported, especially in the more humid districts where soils are subject to strong leaching. According to the soil survey report of Roane County, Tenn. {S4-), the Huntington soils, which consist of alluvium derived from limestone, are outstand- ingly productive for such crops as corn, timothy, clover, and pasture, all of which make strong vegetative growth. Furthermore, these soils produce nearly their maximum yields with very simple soil manage- ment and with little or no fertilizer and give comparatively little response to fertilization, crop rotation, and other soil-building prac- tices; whereas soils from the uplands from similar parent rocks give very much lower yields of these crops under simple practices and without fertilizers, but give marked response to fertilization and crop rotation. In the same county, the Pope soils, which consist of al- luvial material from shales and sandstones, are much more productive than upland soils derived from shale and sandstone, but are less pro- ductive than the Huntington. Soil survey reports from other coun- ties from the Tennessee Valley, as well as reports from Iowa and Nebraska, show in a similar way the greater productivity of alluvial soils as compared with the soils of the uplands. This higher pro- ductivity probably is due partly to higher fertility and partly to higher water-holding capacity and greater effective moisture suppl}^ of the soils of the bottom lands as compared with those of the uplands.
Recent soil investigations in the Yazoo-Backwater area in Missis- sippi^ show considerable variation in fertility of the soils for cotton and corn, although most of these soils are more productive for these crops than are soils of the uplands. Some of the alluvial soils, es- pecially those from the more local sources, are more acid, less fertile, and less productive than the soils of the main part of the delta, which consist largely of Mississippi River sediments. The unequal dis- tribution of the soil material transported into the Yazoo-Backwater areas in Mississippi by the upper tributaries of the Yazoo River and that by the Mississippi River no doubt accounts in many cases for the variations in fertility of the soils in this area.
8 Unpublished data, Division of Soil Chemistry and Physics. 9 Joint investigation by the U. S. Department of Agriculture. Soils of the Mississippi Backwater Areas,
Yazoo Segment. July 1941.

Tech. Bul. 833, U. S. Dept. of Agriculture PLATE 5
Sugarcane grown on Mississippi alluvium in southern Louisiana.

ALLUVIAL SOILS OF THE MISSISSIPPI BASIN 77
The alluvial soils of the Mississippi River are composed largely of material transported from western areas over which the climatic con- ditions are more conducive to the development of fertile soil material than to luxuriant plant growth. In the development of this soil material there is evidence that mechanical weathering far exceeds the chemical weathering. It is to have been expected that soils formed of such material are of rather durable character and perhaps would remain so for a comparatively long period under climatic conditions rather severe upon the soil but favorable to luxuriant plant growth. These are perhaps the conditions that prevail on the Mississippi delta area, which have made it possible for these soils to produce for many years, with the use of little fertilizer, the rather bountiful yields of the heavy-feeding plants, such as cotton, corn, and sugarcane (pi. 5). The residual soils of the South do not produce yields of these crops comparable to those of the alluvial soils. In general, alluvial soils throughout the world have been found to be productive and durable. For more than 350 years certain alluvial soils of Puerto Rico (29) have produced rather large yields of sugarcane without extensive use of fertilizer. The productivity and durability of the alluvial soils of Egypt, Iraq, India, and China are well known.
SUMMARY AND CONCLUSIONS
As increasingly larger areas of upland soils have been thrown out of cultivation from time to time, largely because of mismanagement, a greater utilization of our alluvial soils became apparent. Little scien- tific investigation had been made of these soils, and, therefore, it was deemed advisable to make a careful examination of some of the more important alluvial soils along the Mississippi River and its main trib- utaries. The purpose of this study is to determine the chemical and mechanical composition of these soils with regard to their inherent fertility, the sources of the materials, and the adaptation of the soils to agricultural uses.
The alluvial soils investigated in the Mississippi drainage area in- clude 11 soil profiles from the Mississippi lowlands, 12 profiles from the western tributaries of the Mississippi River, 6 profiles from the eastern tributaries, soil material from a 100-foot bored well in the Mississippi alluvium, material from the channel of the river at its mouth, and sedimentary material from the Gulf of Mexico.
The alluvial soils studied from the western drainage area of the Mississippi River are from the following tributaries: Milk, upper and middle Missouri, Yellowstone, Platte, upper, middle, and lower Ar- kansas, Verdigris, White, Ouachita, and Red Rivers. The alluvial soils from the eastern drainage area are from the Ohio, Cumberland, Tennessee, Duck, Clinch, and Big Black Rivers.
Complete field descriptions of the several soil-profile samples are given, including location, drainage, texture, consistence, and color.
The laboratory determinations made are as follows: Mechanical and chemical analyses of the soil; pH values; chemical analyses of ex- tracted colloids; mineralógica! determinations on certain colloidal ma- terial; and determination of certain minor elements on a few of the soils. From the analytical data of the soils and colloids the chemical composition of the nonclay material is estimated.

78 TECHNICAL BULLETIK 8 3 3, U. S. DEPT. OF AGRICULTURE
Analytical results and derived data are tabulated for each soil group. These data are discussed in relation to the composition of the material and its geographical source and development. The derived data in- dicative of colloidal soil minerals and the minerals determined in cer- tain colloids of each group of alluvial soils are reported in a separate table.
The mechanical analyses indicate that the greater part of the coarser material is not carried long distances from its source. The texture of the alluvial material becomes more uniform and smaller in particle size, as the distance that it is transported increases. The alluvial soils of the lower Mississippi River are composed almost wholly of varying quantities of silt and clay.
The chemical analyses as well as the mechanical analyses of the soils show little evidence of profile development in place. Calcium, how- ever, and, in some instances, magnesium, are lower in certain of the older areas of alluvium where drainage is poor. The chemical compo- sition of alluvial soils derived from various geological areas reflects in general the differences in their geological material as well as the differ- ence in the altered composition of the soils as they develop in the areas made up of these materials.
The chemical composition of the colloids of all the soils of the lower Mississippi delta are essentially similar. The colloids of the sedi- ments of the Gulf of Mexico, when corrected for the material received from marine life, are strikingly similar to the colloids of the lower delta soil. The material taken from the lower portion of the well near Onward, Miss., contains strata of various sandy materials. However, the colloidal part of this soil is essentially the same in chemi- cal composition with the exception of the removal of calcium by solution and, to some extent, of the magnesium.
The composition of the colloids from the various tributaries reflects the character of the soils drained by them and also the geological material. The phosphate deposits and phosphatic soils of Tennessee are reflected in the colloidal material deposited by the Tennessee and Duck Rivers, which drain them. Likewise, the alluvial soil of the Clinch River shows the influence of the limestone area drained by that river. Again, the influence of the high percentage of potassium and magnesium in the Permian Red Beds of Texas and Oklahoma is very pronounced in the Red River alluvium.
There are essential differences in the chemical composition of the soils of the eastern and western tributaries. The principal differences in the chemical composition of the alluvial material from the Great Plains and the soils transported from them and those of the eastern tributaries are reflected in the composition of their colloidal materials. The principal differences in the colloidal materials of these two groups of soils are found in the variations of their major constituents. This is best expressed by the ratios of silica to sesquioxides. The average of these ratios for the colloids of the eastern tributaries, not including that of the Big Black River, is 2.24. The average for the colloids of the western tributaries, not including the Verdigris, White, and Ouachita Rivers, which drain the Interior Highlands, is 3.08. The average for the colloids for the three rivers draining the Interior Highlands is 2.59. The soil and geological materials of the Interior Highlands are more of the nature of the eastern tributaries. The composition of the soils and the river water of the eastern and western

ALLUVIAL SOILS OF THE MISSISSIPPI BASm 79
drainage areas of the Mississippi show the influence of unequal dis- tribution of rainfall over the two areas.
The chemical composition of the soils and colloids of the Mississippi lowlands shows definitely that the major portion of this material is derived from the eastern slopes of the Rocky Mountains and the Great Plains area to the east of them. This is evidenced by the similarity of the composition of the colloids of the Mississippi alluvium and by the data reviewed pertaining to the silt content of the Missouri and the Ohio Rivers.
The productivity of most of these alluvial soils is in harmony with various features of their chemical composition. The chemical features include the relatively high content of bases, phosphorus, and organic matter. These soils are derived from widely separate and diversified geological sources. They apparently contain all the ele- ments essential to plant growth. Of the minor elements, zinc, boron, arsenic, and selenium were found in representative soils of the Mis- sissippi River.
LITERATURE CITED
(1) ALEXANDER, L. T., BYERS, H. G., and EDGINGTON, G. 1939. A CHEMICAL STUDY OF SOME SOILS DERIVED FROM LIMESTONE.
U. S. Dept. Agr. Tech. Bui. 678, 28 pp. (2) HENDRICKS, S B., and NELSON, R. A.
1939. MINERALS PRESENT IN SOIL COLLOIDS! II. ESTIMATION IN SOME REPRESENTATIVE SOILS. Soü Sci. 48: 273-279, illus.
(3) ATWOOD, W. W. 1940. THE PHYSIOGRAPHIC PROVINCES OF NORTH AMERICA. [536] PP.,
illus. Boston, New York, etc. (4) BAILEY, E. H.
1932. THE EFFECT OF AIR DRYING ON THE HYDROGEN-ION CONCENTRATION OF THE SOILS OF THE UNITED STATES AND CANADA. U. S. Dept. Agr. Tech. Bui. 291, 44 pp., illus.
(5) BAYLEY, W. S. 1917. DESCRIPTIVE MINERALOGY. 542 pp., illus. New York and London.
(6) BEESON, K. C. 1941. THE MINERAL COMPOSITION OF CROPS WITH PARTICULAR REFERENCE
TO THE SOILS IN WHICH THEY WERE GROWN. A REVIEW AND COMPILATION. U. S. Dept. Agr. Misc. Pub. 369, 164 pp.
(7) BoNSTEEL, J. A., and party. 1901. SOIL SURVEY OF THE YAZOO AREA, MISSISSIPPI. U. S. Dept. Agr.
Bur. Soils Field Operations Rpt. 3: 359-388, illus. (8) BROWN, I. C., and BYERS, H. G.
1932. THE FRACTIONATION, COMPOSITION, AND HYPOTHETICAL CONSTITU- TION OF CERTAIN COLLOIDS DERIVED FROM THE GREAT SOIL GROUPS. U. S. Dept. Agr. Tech. Bui. 319, 44 pp.
(9) and BYERS, H. G. 1935. THE CHEMICAL AND PHYSICAL PROPERTIES OF DRY-LAND SOILS AND OF
THEIR COLLOIDS. U. S. Dept. Agr. Tech. Bui. 502, 56 pp. (10) RICE, T. D., and BYERS, H. G.
1933. A siuDY OF CLAYPAN SOILS. U. S. Dept. Agr. Tech. Bui. 399, 43 pp.
(11) BYER3, H. G., ALEXANDER, L. T., and HOLMES, R. S. 1935. THÏ] COMPOSITION AND CONSTITUTION OF THE COLLOIDS OF CERTAIN
OF THE GREAT GROUPS OF SOILS. U. S. Dept. Agr. Tech. Bui. 484, 39 pp.
(12) CLARKE, F. W. 1924. THE COMPOSITION OF THE RIVER AND LAKE WATERS OF THE UNITED
STATES. U. S. Geol. Survey Prof. Paper 135, 199 pp. (13) DENISON, I. A., FRY, W. H., and GILE, P. L.
1929. ALTERATION OF MUSCOVITE AND BIOTITE IN THE SOIL. U. S. Dept. Agr. Tech. Bui. 128, 33 pp.

80 TECHNICAL BULLETIK 8 3 3, U. S. DEPT. OF AGRICULTURE
(14) FENNEMAN, N. M. 1931. PHYSIOGRAPHY OF WESTERN UNITED STATES. 534 pp., illus. NCW
York and London. Qö)
1938. PHYSIOGRAPHY OF EASTERN UNITED STATES. 714 pp., illus. New York and London.
(16) GiESECKER, L. F., MORRIS, E. R., STRAHORN, A. T., and MANIFOLD, C. B.
1929. SOIL SURVEY (RECONNAISSANCE) OF THE NORTHERN PLAINS OF MONTANA. U. S. Bur. Chem. and Soils Soil Surveys, ser. 1929, No. 21, 74 pp., illus.
(17) GRIM, R. E., BRAY, R. H., and BRADLEY, W. F.
1937. THE MICA IN ARGILLACEOUS SEDIMENTS. Amer. Min. 22: 813-829, illus.
(18) HAPP, S. C, RITTENHOUSE, G., and DOBSON, G. C.
1940. SOME PRINCIPLES OF ACCELERATED STREAM AND VALLEY SEDIMEN-
TATION. U. S. Dept. Agr. Tech. Bui. 695, 134 pp., illus. (19) HENDRICKS, S. B., and ALEXANDER, L. T.
1939. MINERALS PRESENT IN SOIL COLLOIDS: I. DESCRIPTIONS AND METH-
ODS FOR IDENTIFICATION. Soil Sei. 48: 257-271, illus. (20) HiLGARD, E. W.
1884. REPORT ON THE COTTON PRODUCTION OF THE STATE OF LOUISIANA, WITH A DISCUSSION OF THE GENERAL AGRICULTURAL FEATURES OF THE STATE. U. S. Bur. of the Census, 10th Census U. S., 1880, 5, 93 pp., illus.
(21) HOLMES, R. S. 1939. SOME OBSERVATIONS ON OHIO RIVER ALLUVIAL DEPOSITS. Soil Sci.
Soc. Amer. Proc. 1938: 323-329, illus. (22) — and EDGINGTON, G.
1930. VARIATIONS OF THE COLLOIDAL MATERIAL EXTRACTED FROM THE SOILS OF THE MIAMI, CHESTER, AND CECIL SERIES. U. S. Dept. Agr. Tech. Bui. 229, 24 pp., illus.
(23) HEARN, W. E., and BYERS, H. G.
1938. THE CHEMICAL COMPOSITION OF SOILS AND COLLOIDS OF THE NORFOLK AND RELATED SOIL SERIES. U. S. Dept. Agr. Tech. Bul. 594, 33 pp., illus.
(24) JOHNSON, H., and GUEST, H. 1937. THE WORLD OF TODAY. 1033 pp., iUus. New York.
(25) JONES, V. H. 1933. SEDIMENTATION IN RED RIVER BELOW THE MOUTH OF WASHITA RIVER.
Iowa Univ. Studies in Nat. Hist. 15, No. 4, 30 pp., illus. (26) LUDWIG, E.
1936. THE NILE: LIFE-STORY OF A RIVER. 352 pp., illus. London. (27) MARBUT, C. F.
1935. SOILS OF THE UNITED STATES. U. S. Dept. Agr. Atlas of American Agriculture pt. 3, 98 pp., illus.
(28) OLMSTEAD, L. B., ALEXANDER, L. T., and MIDDLETON, H. E.
1930. A PIPETTE METHOD OF MECHANICAL ANALYSIS OF SOILS BASED ON IMPROVED DISPERSION PROCEDURE, U. S. Dept. Agr. Tech. Bui. 170, 23 pp., illus.
(29) ROBERTS, R. C, and party. 1942. SOIL SURVEY OF PUERTO RICO. U. S. Bur. Plant Indus. Soil Surveys,
ser. 1936, No. 8, 503 pp., illus. (30) ROBINSON, W. O.
1930. METHOD AND PROCEDURE OF SOIL ANALYSIS USED IN THE DIVISION
OF SOIL CHEMISTRY AND PHYSICS. U. S. Dept. Agr. Cir. 139, 20 pp. (Revised, 1939.)
(31) and HOLMES, R. S.
1924. THE CHEMICAL COMPOSITION OF SOIL COLLOIDS. U. S. Dept. Agr. Dept. Bui. 1311, 42 pp.
(32) RUSSELL, SIR E. J.
1932. SOIL CONDITIONS AND PLANT GROWTH. Ed. 6, 636 pp., illus. Lon- don, New York, etc.
(33) STEPHENSON, L. W., LOGAN, W. N., WARING, G. A., and HOWARD, C. S.
1928. THE GROUND-WATER RESOURCES OF MISSISSIPPI. U. S. (jeol. Sur- vey Water-Supply Paper 576, 515 pp., illus.

ALLUVIAL SOILS OF THE MISSISSIPPI BASITsT 81
(34) SwANN, M. E., ROBERTS, W., HUBBARD, E. H., and PORTER, H. C. 1942. SOIL SURVEY OF ROANE COUNTY, TENNESSEE. U. S. BuF. Plant
Indus. Soil Surveys, ser. 1936, No. 15, 125 pp., illus. (35) THORP, J.
1936. GEOGRAPHY OF THE SOILS OF CHINA. 552 pp., illus. Nanking. (36) UNITED STATES DEPARTMENT OF AGRICULTURE.
1938. A GLOSSARY OF SPECIAL TERMS USED IN THE SOILS YEARBOOK. U. S. Dept. Agr. Yearbook (Soils and Men) 1938: 1162-1180.
(37) UNITED STATES WAR DEPARTMENT, CORPS OF ENGINEERS. 1930. SEDIMENT INVESTIGATIONS ON THE MISSISSIPPI RIVER AND ITS
TRIBUTARIES PRIOR TO 1930. U. S. Waterways Expt. Sta. Paper H: 1-84.
(38) 1931. SEDIMENT INVESTIGATIONS ON THE MISSISSIPPI RIVER AND ITS
TRIBUTARIES, 1930-1931. U. S. Waterways Expt. Sta. Paper U: 1-105, illus.
(39) WELLS, R. C. 1937. ANALYSIS OF ROCK AND MINERALS FROM THE LABORATORY OF THE
UNITED STATES GEOLOGICAL SURVEY 1914-36. U. S. Geol. Survey Bul. 878, 134 pp.
(40) WHETSTONE, R. R., ROBINSON, W. O., and BYERS, H. G. 1942. BORON DISTRIBUTION IN SOILS AND RELATED DATA. U. S. Dept.
Agr. Tech. Bui. 797, 32 pp., illus. (41) WHITNEY, M.
1925. SOIL AND CIVILIZATION: A MODERN CONCEPT OF THE SOIL AND THE HISTORICAL DEVELOPMENT OF AGRICULTURE. 278 pp., illuS. New York.

ORGANIZATION OF THE UNITED STATES DEPARTMENT OF AGRI- CULTURE WHEN THIS PUBLICATION WAS EITHER FIRST PRINTED OR LAST REVIS^ED.
Secretary of Agriculture CLAUDE R. WICKARD.
Under Secretary PAUL H. APPLEBY.
Assistant Secretary GROVER B. HILL.
Chief, Bureau of Agricultural Economics HOWARD R. TOLLEY.
Director of Agricultural War Relations SAM BLBDSOE.
Director of Extension Work M. L. WILSON.
Director of Finance W. A. JUMP.
Director of Foreign Agricultural Relations L. A. WHEELER.
Director of Information MORSE SALISBURY.
Director of Personnel T. ROY REíD.
Land Use Coordinator ERNEST A. WIECKING.
Librarian RALPH R. SHAW.
Solicitor ROBERT H. SHIELDS.
Chief, Office of Civilian Conservation Corps Activities. FRED MORRELL.
Chief, Office of Plant and Operations ARTHUR B. THATCHER.
Administrator of Agricultural Marketing ROY F. HENDRICKSON.
Administrator of Agricultural Conservation and M. CLIFFORD TOWNSEND.
Adjustment. Chief, Agricultural Adjustment Agency FRED S. WALLACE.
Chief, Soil Conservation Service HUGH H. BENNETT.
Manager, Federal Crop Insurance Corporation-- LEROY K. SMITH.
Chief, Sugar Division JOSHUA BERNHARDT.
Administrator of Agricultural Research E. C. AUCHTER,
Chief, Bureau of Animal Industry JOHN R. MOHLER.
Chief, Bureau of Agricultural Chemistry and W. W. SKINNER, Acting. Engineering.
Chief, Bureau of Dairy Industry O. E. REED.
Chief, Bureau of Entomology and Plant Quar- P. N. ANN AND.
antine. Chief, Office of Experiment Stations JAMES T. JARDINE.
Chief, Bureau of Plant Industry R. M. SALTER.
Chief, Bureau of Home Economics LoUISE STANLEY.
Superintendent, Beltsville Research Center C. A. LOGAN.
President, Commodity Credit Corporation J. B. HUTSON.
Administrator of Farm Security Administration C. B. BALDWIN.
Governor of Farm Credit Administration ^ALBERT G. BLACK.
Chief, Forest Service _ EARLE H. CLAPP, Acting. Administrator, Rural Electrification Administration.. HARRY SLATTERY.
82
U. S. GOVERNMENT PRINTING OFFICE: 1942
Copyright © 2022 FDOKUMEN