Physical, chemical, and microbiological characteristics of ...
20
See discussions, stats, and author profiles for this publication at: https://www.researchgate.net/publication/11591870 Physical, chemical, and microbiological characteristics of microbial mats (KOPARA) in the South Pacific atolls of French Polynesia Article in Canadian Journal of Microbiology · December 2001 Impact Factor: 1.22 · DOI: 10.1139/cjm-47-11-994 · Source: PubMed CITATIONS 27 READS 67 12 authors, including: Jean Guezennec Institut Français de Recherche pour l'Exploit… 145 PUBLICATIONS 3,516 CITATIONS SEE PROFILE Eric Deslandes Université de Bretagne Occidentale 89 PUBLICATIONS 1,474 CITATIONS SEE PROFILE Jean Trichet Université d'Orléans 105 PUBLICATIONS 1,351 CITATIONS SEE PROFILE Claude Payri Institute of Research for Development 182 PUBLICATIONS 2,480 CITATIONS SEE PROFILE Available from: Jean Guezennec Retrieved on: 12 May 2016
-
Upload
khangminh22 -
Category
Documents
-
view
0 -
download
0
Transcript of Physical, chemical, and microbiological characteristics of ...
Seediscussions,stats,andauthorprofilesforthispublicationat:https://www.researchgate.net/publication/11591870
Physical,chemical,andmicrobiologicalcharacteristicsofmicrobialmats(KOPARA)intheSouthPacificatollsofFrenchPolynesia
ArticleinCanadianJournalofMicrobiology·December2001
ImpactFactor:1.22·DOI:10.1139/cjm-47-11-994·Source:PubMed
CITATIONS
27
READS
67
12authors,including:
JeanGuezennec
InstitutFrançaisdeRecherchepourl'Exploit…
145PUBLICATIONS3,516CITATIONS
SEEPROFILE
EricDeslandes
UniversitédeBretagneOccidentale
89PUBLICATIONS1,474CITATIONS
SEEPROFILE
JeanTrichet
Universitéd'Orléans
105PUBLICATIONS1,351CITATIONS
SEEPROFILE
ClaudePayri
InstituteofResearchforDevelopment
182PUBLICATIONS2,480CITATIONS
SEEPROFILE
Availablefrom:JeanGuezennec
Retrievedon:12May2016

Physical, chemical, and microbiologicalcharacteristics of microbial mats (KOPARA) in theSouth Pacific atolls of French Polynesia
L. Mao Che, S. Andréfouët, V. Bothorel, M. Guezennec, H. Rougeaux,J. Guezennec, E. Deslandes, J. Trichet, R. Matheron, T. Le Campion, C. Payri,and P. Caumette
Abstract: Microbial mats that develop in shallow brackish and hyposaline ponds in the rims of two French polynesianatolls (Rangiroa and Tetiaroa) were intensively investigated during the past three years. Comparative assessment ofthese mats (called kopara in polynesian language) showed remarkable similarities in their composition and structure.Due to the lack of iron, the color of the cyanobacterial pigments produced remained visible through the entire depth ofthe mats (20–40 cm depth), with alternate green, purple, and pink layers. Profiles of oxygen, sulfide, pH, and redoxshowed the anoxia of all mats from a depth of 2–3 mm. Analyses of bacterial pigments and bacterial lipids showedthat all mats consisted of stratified layers of cyanobacteria (mainlyPhormidium, Schizothrix, Scytonema) and purpleand green phototrophic bacteria. The purple and green phototrophic bacteria cohabit with sulfate reducers(Desulfovibrioand Desulfobacter)and other heterotrophic bacteria. The microscopic bacterial determination emphasizedthe influence of salinity on the bacterial diversity, with higher diversity at low salinity, mainly for purple nonsulfurbacteria. Analyses of organic material and of exopolymers were also undertaken. Difference and similarities betweenmats from geomorphological, microbiological, and chemical points of view are discussed to provide multicriteria ofclassification of mats.
Key words: microbial mats, cyanobacteria, bacterial pigments, French Polynesia atolls, exopolymers.
Résumé: Les tapis microbiens qui se développent dans des mares saumâtres et hyposalines en pourtour de deux atollsde la Polynésie Française (Rangiroa et Tetiaroa) ont été étudiés intensivement au cours des trois dernières années. Unsuivi comparatif de ces tapis (appelés kopara en Polynésien) a montré des similitudes remarquables dans leur composi-tion et leur structure. À cause de l’absence de fer, la couleur des pigments reste visible dans toute la profondeur destapis (20 à 40 cm de profondeur), avec des alternances de vert, pourpre et rose. Les profils d’oxygène, de sulfure et deredox montrèrent l’anoxie des tapis dès 2 à 3 mm deprofondeur. Les analyses des pigments et des lipides bactériensont montré que tous les tapis consistaient en des couches stratifiées de cyanobactéries (principalementPhormidium,Schizothrixet Scytonema) et de bactéries phototrophes pourpres et vertes. Ces dernières cohabitent avec des bactériessulfato-réductrices (Desulfovibrioet Desulfobacter) ainsi que d’autres bactéries hétérotrophes. Les observations micros-copiques ont montré l’influence de la salinité sur la diversité bactérienne des différents tapis principalement pour lesbactéries pourpres non sulfureuses. Des analyses de matériaux organiques et d’exopolymères ont également été réali-sées. Les différences et les similitudes entre les tapis sont discutées du point de vue géomorphologique, chimique etmicrobiologique de façon à fournir des critères de classification des tapis microbiens de Polynésie.
Mots clés: tapis microbiens, cyanobactéries, pigments bactériens, atolls de la Polynésie Française, exopolymères.
[Traduit par la Rédaction] 1012
Can. J. Microbiol.47: 994–1012 (2001) © 2001 NRC Canada
994
DOI: 10.1139/cjm-47-11-994
Received January 17, 2001. Revision received June 18, 2001. Accepted July 30, 2001. Published on the NRC Research Press Website at http://cjm.nrc.ca on November 2, 2001.
L. Mao Che and C. Payri. Laboratoire d’écologie marine, Université du Pacifique, Papeete, Polynésie Française.S. Andréfouët. Remote Sensing and Biological Oceanography Laboratory, College of Marine Science, University of South Florida,FL 33701, U.S.A.V. Bothorel and P. Caumette.1 Laboratoire d’écologie moléculaire, Université de Pau, BP 1155, F 64013 Pau CEDEX, France.M. Guezennec, H. Rougeaux, and J. Guezennec.Institut français de recherche pour l’exploitation de la mer (IFREMER), Centrede Brest, BP 70, 29280 Plouzane, France.E. Deslandes.Université de Bretange Occidentale, Laboratoire des algues marines, Technopole Brest-Iroise, 29280 Plouzane,France.J. Trichet. Université d’Orléans, Laboratoire de géologie, BP 6759, 45067 Orléans CEDEX 2, France.R. Matheron. Université Aix-Marseille 3, Microbiologie, F 13397, Marseille CEDEX 20, France.T. Le Campion. Centre d’océanologie de Marseille, Station Marine d’Endoume, 13007 Marseille, France.
1Corresponding author (e-mail: [email protected]).

Mao Che et al.Introduction
Marine microbial mats are encountered in a large varietyof sites found in coastal areas, such as sandy beaches (VanGemerden et al. 1989), marshes (Nicholson et al. 1987;Pierson et al. 1987), deltas and estuaries (Guerrero et al.1993), hypersaline ponds (Krumbein et al. 1977; D’Amelioet al. 1989; Caumette et al. 1994), salterns, and lagoons, ei-ther in cold, temperate, or warm climates. These ecosystemsare generally constituted of vertically laminated, stratified,cohesive, viscous layers, a few millimetres to several centi-metres thick, produced by the development of different mi-croorganisms that coexist through steep vertical gradients ofoxygen, sulfide, and light. Most of these mats are composedof oxygenic phototrophic prokaryotes forming green layerson top and anoxygenic phototrophs forming purple or green-brown layers below in the anoxic zone, where they cohabitwith anaerobic heterotrophs.
Microbial mats may also be found in atolls (Defarge et al.1994a, 1994b, 1996), one of the main types of coral reef for-mations with banks, fringing, and barrier reefs. Mats are en-countered in shallow ponds in the elevated sections (motu orislet) of the rims of the atolls, in residual spillways, in drylagoons, and on flat areas that may be temporarily sub-merged. A few French Polynesian mats, locally called“kopara”, have been previously described by Trichet (1967)and investigated from a geochemical point of view (Defargeet al. 1994a, 1996). These mats dominated by cyanobacteria(Rougerie et al. 1997) were remarkable for their productionof a large number of viscous laminated layers due to the ex-cretion of exopolysaccharides (EPS), each layer a few milli-metres thick forming an entire mat of about 20–50 cm thick.In contrast to most of the coastal microbial mats, kopara ismainly constituted of pure bacterial material, free of otherorganic deposits, such as plant material, clay, iron com-pounds, or metal-organic chelates. Therefore, the color ofthe microbial pigments remains visible in the core samplesdown to the bottom of the mat. Previous geochemical analy-ses (Trichet 1967; Defarge et al. 1994a, 1994b) have shownthe important role of this pure material in the geochemicalcycle of carbon, in carbonate precipitation, forming modernstromatolites also called microbialites (Burnes and Moore1987), and in the formation of phosphorite deposits(Rougerie et al. 1997; Trichet and Fikri 1997).
During the past 20 years, most of the studies on microbialmats in coastal zones, including atoll mats, focused on theirbiogeochemical role, mainly in the biogeochemical cycles ofcarbon and sulfur (Van Gemerden 1989; Jørgensen and Co-hen 1977), with the helpful use of microsensors for environ-mental parameters (Kühl et al. 1994; Revsbech et al. 1983).Only a few studies have reported on the microbial bio-diversity within the mats (Ward et al. 1994; Nübel et al.1999), and only a few microorganisms have been isolatedand studied. The latter are restricted to a few physiologicalgroups of microbes, such as cyanobacteria (Cohen et al.1975), purple anoxygenic bacteria (Caumette 1993; Stal etal. 1985; Glaeser and Overmann 1999), fermentative bacte-ria (Mouné et al. 1999, 2000), sulfate reducers (Caumette etal. 1991), or methanogens (Oremland and King 1989).
In this study, atoll kopara mats of French Polynesia wereintensively studied using a multidisciplinary comparative ap-proach to describe their physico-chemical and microbiologi-
cal features. The aim of this study was (i) to check the influ-ence of the geomorphological environment of the mats ontheir physico-chemical and microbiological features and(ii ) to describe the bacterial communities, pigment com-pounds, and EPS from the most interesting mats. TwoFrench Polynesian atolls, Rangiroa and Tetiaroa, have beeninvestigated for this purpose.
Materials and methods
Sampling sites and procedureRangiroa atoll (15°14′23′ ′S, 147°60′58′ ′W) (Fig. 1) was selected
because its rim (202 km long) is one of the most diversified in theTuamotu Archipelago (Andréfouët et al. 2001), including most ofthe known types of rim. It is also the second largest atoll in theworld (1763 km2). In October 1997, we surveyed the ponds thatcould be inventoried and mapped according to a mosaic of threemultispectral SPOT-HRV images at a 20-m resolution. The algo-rithm used to locate the ponds is described in Andréfouët andRoux (1998). In a second stage, a large pond (IT) in the south ofthe Tetiaroa atoll (16°90′S, 149°35′W, Society Archipelago) was in-vestigated in October 1997 (Fig. 1). Tetiaroa, an atoll easily acces-sible, allows for checking to see if the information derived fromRangiroa is valid for other mats in other atolls. In the Rangiroaatoll, for each pond identified by remote sensing, a quick surveywas made to verify the degree of stratification of the mats. Salinityand temperature were systematically measured. Only a few matspresented nice nondisturbed laminations. Therefore, only two rep-resentative laminated mats were investigated in detail (located inmotu Pavete, R2, and Tivaru, R59, in the north-western part). InTetiaroa, the mat located in IT was sampled for comparisons withRangiroa mats.
Samples were collected by means of a plexiglas core-sampler,12 cm in diameter and 60 cm long. After collection, the cores weresliced and subsamples were frozen for further analyses describedbelow. The three microbial mat systems were studied for both theirmicrobial community structure and EPS contents. The differentsections of R2 (Table 1) were the uppermost green layer (layer R2-1; 0–0.05 cm), a purple–red layer (layer R2-2; 1–3 cm), a red layer(layer R2-3; 3–5 cm), and two lower sections of beige sand: layersR2-4 and R2-5 (5–10 cm and 10–14 cm, respectively) and layersR2-6 to R2-8 (14–21 cm and 28–50 cm, respectively). Samplesfrom R59 (Table 1) were divided into R59 G (layers 1b and 1v; 0–1 cm), R59 P (layers 1′ and c; 1–2 cm depth), and R59-2 (below2 cm depth), corresponding to the green layer, the purple layer, andthe deeper sediment (white–pink sandy material), respectively. Thedifferent sections of IT (Table 1) comprise an uppermost greenlayer (layer IT-1; 0–0.5 cm), a purple–red layer (layer IT-1′ + IT-2;0.5–6 cm), a beige layer (IT-3 + IT-4; 6–13 cm), a red layer (IT-5;13–19 cm), and the sandy sediment (layers IT-6-7; 19–26 cmdepth).
Physical and chemical analysesWater temperature and dissolved oxygen were directly measured
in situ with a YSI 55 oxymeter. Water salinity was estimated insitu with an ATAGO S-10 refractometer.
Oxygen profiles along the core were estimated by using micro-electrodes connected to a picoamperemeter Keithley 480, accord-ing to the method described by Van Gemerden et al. (1989).
pH and redox were measured in the sliced sections of the lami-nated mats with mini-electrodes of pH or redox connected to aCRISON 507 pH/redox meter.
Total acid-volatile sulfide (AVS) was analyzed by using themethylene blue method after acid extraction, according to Cline(1969) and Jørgensen and Cohen (1977). Samples of the mats werecollected in the sliced sections of the cores and fixed in 10 mL of
© 2001 NRC Canada
Mao Che et al. 995
10% Zn-acetate solution. The samples were then distilled in thelaboratory through N2 after addition of pure HCl. The H2S–Zn-acetate distillates were analyzed after methylene blue formationwith a spectrophotometer KONTRON UVIKON 737. The methodhas a detection limit of about 10µM with a standard error of about5%.
Analyses of organic and mineral carbonAnalyses of organic carbon were done by coulometric method
(applied to samples from stations IT and R2), after decarbonatationof sample by 1N HCl at room temperature. The total organic car-bon content was deduced from titration of 0.25 N NaOH by theCO2 produced during the oxidation of the residual organic carbon.R59 samples were analyzed by pyrolytic method (Espitalié et al.1985).
Inorganic carbon has been determined by difference between to-tal carbon and organic carbon on a LECO CNS autoanalyzer (ITand R2 samples) or specifically by pyrolysis (R59 samples).
Microorganism observations and pigments analysesFrom the subsamples collected in the sliced sections of the
cores, the bacterial communities were directly observed underphase-contrast microscopy, by using a Olympus microscope OM2.Both oxygenic and anoxygenic phototrophic bacteria were identi-fied on morphological features according to the descriptions givenin the Bergey’s Manual for Systematic Bacteriology(1993). Asubsample of each sliced section of the core samples was thenfixed in 3% formaldehyde and sea-water solution supplementedwith borax buffer, for further observations of cyanobacteria.
Subsamples for scanning electron microscopy (SEM) wereglued to aluminium stubs, gold-sputtered, and examined using aPhilips XL 30 operating at 30 kV. EDAX analysis (EDAX Edx 4i)was carried out on nongold-coated specimens, according toCosterton and Irvin (1981) and Vandevivere and Baveye (1992).
Pigments were analyzed by high-pressure liquid chromatogra-phy (HPLC) on freeze-dried sliced sections, as mentioned in Ta-ble 1. An exact amount comprised between 0.3 and 4 g of freeze-dried material was ground and extracted in methanol–acetone (6:4,v/v) in the dark. HPLC was performed with a Hewlett Packard sys-tem (two 110 pumps and a 1040A detector) with a reverse-phasecolumn Zorbax ODS (4.6 nm diam., Du Pont de Nemours Instru-ments). A linear gradient from 0.3 M ammonium acetate in metha-nol–acetonitrile–water (5.1:3.6:1.3, by vol.) to acetonitrile–ethyl-acetone (3:7, v/v) was used with a flow rate of 2 mL·min–1. Theisolated pigments were detected with a spectrophotometerequipped to run the spectrum of each pigment at each peak in thechromatogram. The pigments were identified according to their re-tention time and their spectra between 300 and 800 nm by compar-ison with quantitative spectra of standard pigments obtained withthe same method. According to the amount of freeze-dried materialanalyzed (Table 1), we could estimate the amount of each pigmentby the mass of freeze-dried sample material. A standard error of 5–10% was applied to each calculation.
Exopolysaccharide (EPS) and lipids analysesFreeze-dried samples (1 g) were extracted for lipid analysis fol-
lowing a modified Bligh and Dyer method (Bligh and Dyer 1959;White et al. 1979). The extracted lipids were fractionated into neu-tral lipids, glycolipids, and polar lipids by silicic acid column chro-matography, using appropriate volumes of dichloromethane,acetone, and methanol, respectively.
Analyses of lipids were done by gas chromatography (GC) andgas chromatography – mass spectrometry (GC–MS). Nonadecanoicacid (C19:0) was added to the polar phospholipid fractions as aninternal standard. The samples were subjected to a mild acidmethanolysis, and the resulting fatty acid methyl esters were sepa-
rated on a FISONS 8000 GC equipped with a flame ionization de-tector. A fused silica capillary column coated with a nonpolarphase was used (60 m × 0.20 mm i.d.; film thickness 0.25µm).Hydrogen was the carrier gas. The temperature program was asfollows: initial temperature 50°C for 1 min, increased to 140°C at15°C·min–1 for 6 min, then to 280°C at 2°C·min–1 for 55 min, andfinally to 300°C at 4°C·min–1 for 5 min.
GC–MS analyses were carried out using a Carlo Erba (Rodano,Italy) model 5160 HRGC chromatograph coupled to a quadrupoleNermag R10–10H mass spectrometer. The GC–MS analyses wereperformed under the same conditions as those described above, buthelium was used instead as the carrier gas (1.5 bar). Identificationof fatty acid methyl esters was based on comparison of relative re-tention times against internal standards and GC spectra. Electronenergy in electron impact was 70 eV. The position of double bondswas determined by preparing dimethyldisulfide adducts (Nichols etal. 1986).
For EPS analyses, dry samples (10 g) were suspended in200 mL of 20 g·L–1 NaCl and heated at 80°C for 4 h. Solutionswere then centrifugated at 12 000 ×g for 15 min to remove sedi-ments and cells. Exopolymers were precipitated from the super-natant with ethanol at 50% (v/v) and washed with ethanol–watermixtures (70–100%). They were dialyzed against distilled waterand lyophilized. EPS were stored at room temperature. In the EPS,the protein content was determined by the method of Lowry et al.(1951), with bovine serum albumin as standard. Uronic acid con-tents were measured by themeta-hydroxyphenyl method (Filisetti-Cozzi and Carpita 1991), and neutral sugars were analyzed by theorcinol-sulfuric acid method (Rimington 1931).
For fourier transform infra-red (FTIR) spectroscopy, pelletswere obtained by grinding a mixture of 2 mg of exopolysac-charides with 200 mg of dry KBr and then pressing into a 16 mmdiam. mold. FTIR spectra were recorded on a BOMEM MB100 in-strument with a resolution of 4 cm–1. Spectra were obtained in the4000–400 cm–1 region, and sulfate contents were determined bythe method of Lijour et al. (1994).
Sugar determination was done by GC analyses. Methanolysiswas performed in methanolic 2 M HCl at 100°C for 4 h, and themethylglycosides were converted to the corresponding trime-thylsilyl derivatives, as described by Montreuil et al. (1986). Hy-drolysis was performed in 2 M trifluoroacetic acid at 120°C for2 h, and the monosaccharides were reduced and converted in thecorresponding alditol acetates, as described by Blakeney et al.(1983).
GC was carried on a GC-8000 system, using a CP-Sil-5CB col-umn (0.25 mm × 60 m), operated from 50 to 140°C at 20°C·min–1
and from 140 to 240°C at 2°C·min–1 for the per-O-trimethylsilylmethylglycosides. A temperature programme of 50–150°C at20°C·min–1 and 150–230°C at 1.5°C·min–1 was used for alditol ac-etates.
Results
Inventory and macroscopic description of the mats inRangiroa and Tetiaroa
In Rangiroa, 66 regions were classified as Kopara, usingSPOT HRV imagery (Andréfouët et al. 2001, 2002). Thesurvey performed in October 1997 confirmed that all theseregions included microbial mats, but with various types ofdeposits. Most of them were not laminated, mainly becauseof animal or anthropogenic activities inside the pond. Othersmay have been flushed in the recent past after big swellevents and may have lost their laminated stratified structure.Finally, only four ponds were well laminated over a largearea. Two of these ponds (R2 and R59) were investigated in
© 2001 NRC Canada
996 Can. J. Microbiol. Vol. 47, 2001

© 2001 NRC Canada
Mao Che et al. 997
October 1997 during the preliminary survey and again inApril 1999. They are located in the north-western part of theatoll (Fig. 1), in the motus Pavete (R2) and Tivaru (R59).
R2 has already been described by Defarge et al.(1994a).The 30-cm-thick microbial mat covered a surface of about10 000 m2, under 20 cm of water depth. The water salinityranged from 5 to 7 ppt, and the water temperature was 34°Cat the time of sampling. In the R59 pond, the orange mat hada surface of 7000 m2 and was 10–15 cm thick. This mat waspartly covered with a 10 cm water depth and was partly opento air. Water salinity and temperature ranged, respectively,between 20 and 38 ppt and 31 and 36°C. A high-resolutionmap of this mat is available in Andréfouët et al. 2002. R2and R59 represent hyposaline and saline mats, respectively.
In Tetiaroa (Fig. 1), the pond IT had an area of 70 000 m2
and presented two environmental types of mats. The easternpart was strongly bioturbated by fish activities and water en-trance. Conversely, the western part, in central position inthe motu, presented the expected stratified type of mat. Sam-pling took place on this part of the mat. The mat was about
30 cm thick. The water salinity was almost constant at 5 ppt.The temperature of the water ranged from 30 to 34°C.
The three marmelade-like mats (R2 and R59 in Rangiroaand IT in Tetiaroa) were cohesive, forming gelatinous or vis-cous layers, were soft to the touch, and were free of granularhard material. The red, pink, or grey colors were preservedin the entire depth of the mats, as revealed by the core sam-ples in Plexiglas tubes. The mats occurring in theoligohaline ponds IT and R2 were similar in their colors.The surfaces were mostly dark green. Below the surfacelayer, a green layer occurred and was generally 4–10 mmthick. Then, a purple layer of 4–5 mm in thickness was gen-erally present. Deeper, below these three thin layers, red,pink, or grey thicker layers (20–60 mm thick) alternated tothe bottom of the mat. By contrast, in the brackish to marinepond R59, the microbial mat had an orange surface layer,5 mm thick with an irregular surface due to the formation ofvertical small cones. Below this orange layer, an olive-greenlayer of 5–10 mm in thickness was present above a red topurple layer of about 10–15 mm in thickness. Below this, a
Fig. 1. Location of the studied mats in Rangiroa (R2 and R59 mats) and Tetiaroa (IT) atolls. In Tetiaroa map, motu (emerged land)appears black, the inner slope of the lagoon appears light gray, mats and residual spillways inside motus appear white. Similar detailscannot be shown for Rangiroa because of a different scale.

© 2001 NRC Canada
998 Can. J. Microbiol. Vol. 47, 2001
red to pink layer of 50–70 mm was observed. Within thislatter layer, very thin whitish grey layers could occur. Be-low, the sediment consisted of white to pink sandy materialwith grains of an average diameter of 0.5–1 mm.
Physical and chemical characteristics of the three matsstudied
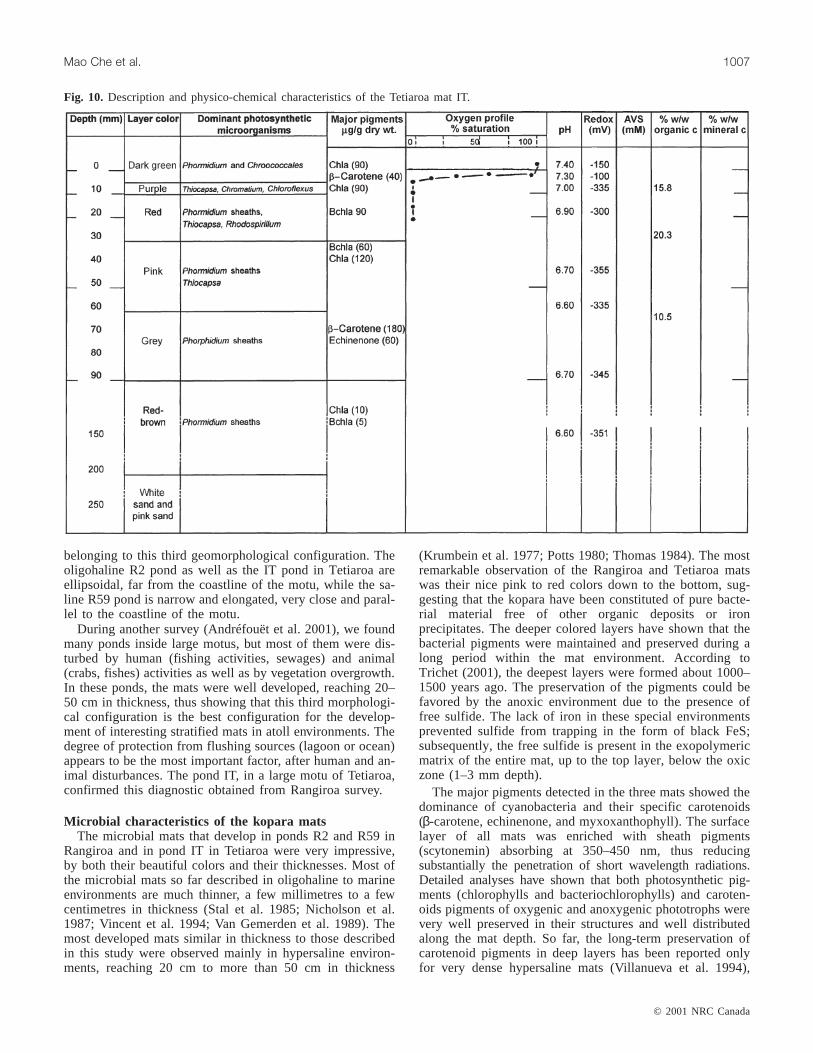
The pond IT was similar to R2 with respect to to its salin-ity and geomorphological environment. In the three mats,oxygen was present in the upper few millimetres of the mats,as revealed by the microprofiles (Figs. 8, 9, and 10). In theoligohaline mats (IT and R2), oxygen was maximum(200 µM) at the surface of the mat and decreased down to0 µM at 0.5 and 1.5 mm depth, respectively. In contrast, inthe R59 mat, the maximum oxygen concentration was foundat 1 mm depth reaching 200µM under 425µE·m–2·s–1. It de-creased below this depth to be only 25µM at 2 mm depthand down to 0µM at 4 mm depth. These observations are inagreement with the pH and redox profiles. In the twooligohaline mats (IT and R2), the highest pHs were detectedin the surface of the mat (pH 7.4 and 9.4, respectively). Be-low in the IT mat, the pH decreased regularly down topH 6.6 at 150 mm depth in the red-brown lowest layer. Inthe R2 mat, it decreased strongly in the first 20 mm depthdown to pH 6.65 and then was gradually stabilized at aroundpH 7.2 down to 300 mm depth in the brown sand below themat. The redox potential in both mats had negative valuesdecreasing regularly from the surface of the mats (–150 or–60 mV for IT or R2, respectively) to the deepest layers ofthe two mats (–351 and –350 mV, respectively). In contrast,in the brackish to marine R59 mat the highest pH value cor-responded to the oxygen maximum at 1 mm depth(pH 9.28). Below this depth, the pH decreased down to 7.3at 70 mm depth. The redox potential with positive values inthe surface of the mat (+80 mV) decreased rapidly to benegative at 5 mm depth (–162 mV). Below this, it decreasedregularly down to –420 mV at 70 mm depth.
Sliced section Depth (cm)Amount of freeze-dried material (g) Layer color
IT-1 0–0.5 0.3 GreenIT-1′ 0.5–1 0.3 PurpleIT-2 1–6 0.3 RedIT-3 6–10 0 BeigeIT-4 10–13 2 BeigeIT-5 13–19 0.7 RedIT-6-7 19–26 4 Pink sandR2-1 0–0.5 0.3 GreenR2-2 1–3 0.3 PurpleR2-3 3–5 0.3 RedR2-4 5–10 0.3 BeigeR2-6 14–21 0.5 BrownR2-8 28–50 1 PinkR59-1b (R59 G) 0–0.5 0.5 Dark greenR59-1v (R59 G) 0.5–1 1 GreenR59-1′ (R59 P) 1–1.3 0.5 PurpleR59-c (R59 P) 1.3–2 0.5 WhiteR59-2 >22 0.5 Sandy pink
Table 1. Amount of material analyzed by HPLC.
Pigment Elution order
Scytonemin 1Fucoxanthin 2Astaxanthin 3Aphaninophyll 4Bacteriophaeophorbidea 5Myxoxanthophyll 6cis-Myxoxanthophyll 7Unknown carotenoid 477 8Caloxanthin 9Zeaxanthin 10cis-Zeaxanthin 11Unknown rhodopin-like 12Canthaxanthin 13cis-Canthaxanthin 14cis-Canthaxanthin 15Okenone 16Bacteriochlorophylla 17Bacteriochlorophyllc 18Unknown pigment
(4oxo g.carotenoid?)19
Spirilloxanthin 20Chlorophyll a (409) 21Rhodopin 22Echinenone 23Bacteriophaeophytina 24Lycopene 25Phaeophytina 26γ-Carotene 27β-Carotene 28cis β-Carotene 29
Table 2. Identification of pigments from themats analyzed by HPLC according to theirelution order.

AVS were measured in the three mats. In the oligohalinemats R2 and IT, AVS values were very close, increasingfrom 0 mM at the surface of the mat up to 0.7–1 mM at100 mm depth. In the brackish to marine mat, the amount ofAVS was higher, up to 2.5 mM at 70 mm depth (Fig. 9)showing a most important sulfide production in this marinemat.
Organic and mineral carbon were analyzed in the threemats (Figs. 8, 9, and 10). The resulting values were stillhigher for the organic carbon than for the mineral carbon. In
the upper 30 mm of the three mats, these values ranged from15 to 22% of organic carbon weight per freeze-dried matweight. This percentage decreased with depth to be only 1–10% w/w at the bottom of the mats. In contrast, mineral car-bon increased slightly with depth, from 1 to 9% in the upperlayers to 6–11% in the deepest layers. X-ray diffractometryrevealed that mineral carbon deposits consisted mainly ofmagnesium carbonate precipitates (magnesite, MgCO3),which are typical of microbial bioprecipitation or organo-mineralization processes (Defarge et al. 1994a, 1994b).
© 2001 NRC Canada
Mao Che et al. 999
Fig. 2. HPLC analyses of pigments extracted from samples collected in a core of the Rangiroa (R2) mat at different depth horizons.The numbers above the HPLC peaks correspond to the pigments listed in Table 2. The chromatograms present the peaks of the elutedpigments at only one wavelength (550 nm).

Microbiological and pigment characteristicsThe major structure and building of the mats were due to
the large development of filamentous cyanobacteria. In R2and IT oligohaline mats, the upper 5 mm green layers weredominated by living cyanobacteria, microscopically relatedto the genusPhormidiumand the familyChroococcaceae,according to morphological observation. SomeScytonema-like filaments could also be observed in the surface layers ofthe emerging parts of both mats. Below this, the entire matswere constituted of the organic sheaths of nonliving cyano-bacteria that form the organic structure of the mats. In thebrackish to marine mat R59, the surface orange layer wascomposed of a dominant population ofSchizothrix-likecyanobacteria that form small cones at the surface. In addi-tion, some filaments ofChloroflexus-like bacteria were ob-served in this upper orange layer. Below this, the olive-greenlayer containedPhormidiumand Chroococcaceaeas domi-nant morphotypes. Similar, to the previous two mats, the en-tire R59 mat was also composed ofPhormidium-likesheaths.
Anoxygenic phototrophic bacteria were observed in sev-eral purple and red layers of the three mats and were tenta-tively identified on a morphological basis. The dominantmorphological type corresponded to purple phototrophs con-taining intracellular sulfur globules, likeChromatium andThiocapsa, or those without sulfur globules, likeRhodo-spirillum or Rhodopseudomonas, Rhodobium, and Blasto-chloris (Figs. 8, 9, and 10). Several strains of these differentanoxygenic phototrophs were isolated and maintained inpure culture for further physiological analyses. These strainswill be presented and discussed in a further paper. In the thinpurple layer occurring below the cyanobacterial green layer,Chromatium-like andThiocapsa-like cells were dominant inthe three microbial mats. These bacteria were still present, butless abundant in the deepest red layers where they cohabitedwith the other types of phototrophic purple nonsulfur-likebacteria (Rhodospirillum-like or Rhodopseudomonas-like bac-teria).
The pigments produced by the oxygenic and anoxygenicphototrophs were analyzed in the different layers of themats. The analyzed pigments identified by HPLC are listedin Table 2. Twenty-nine different pigments were identifiedaccording to standard characteristics. Figures 2–5 present theHPLC chromatograms obtained at 550 nm and the estimatedpigment composition obtained from the samples of theoligohaline ponds R2 in Rangiroa and IT in Tetiaroa. Pig-ments were present and preserved in the entire mats; how-ever, their concentrations decreased with depth. Thus, thechromatograms of the deeper layers were obtained with 20times more concentrated samples than chromatograms of theupper layers.
Scytonemin is only present in the upper green layer of thetwo oligohaline mats R2 and IT as a photoprotectant pig-ment. In this layer, the dominant pigments were typical ofcyanobacteria with Chlorophyll (Chl)a, echinenone,β-caro-tene, and myxoxanthophyll as the major pigments, with less
abundant other carotenoid pigments, such as zeaxanthin. Chla was found very abundant in R2 (Fig. 3) in the surfacelayer. Most of the cyanobacterial pigments were abundantfrom the surface layer down to 6 cm depth, and some of themwere found dominant at this depth (zeaxanthin, canthaxanthin,β-carotene, myxoxanthophyll, and echinenone). Concentra-tions decreased in the lower layers, but still could be de-tected down to 20 cm depth (Fig. 3). Concentrationsmeasured in micrograms per gram of dry weight were lowerin IT (Figs. 4 and 5). In addition to these cyanobacterial pig-ments, purple bacterial pigments could be detected mainly inthe purple and red layers between 0.5 and 6 cm depth. Themost abundant pigments were bacteriochlorophyll (Bchl)a,bacteriopheophytin, and rhodopin, typical of purple bacteria,andγ-carotene, typical of the Chloroflexacaeae group (greenfilamentous bacteria). All anoxygenic phototrophic pigmentscould be detected in very low concentrations below 10 cmdepth (Fig. 3). The pigments of anoxygenic phototrophswere in lower concentrations than the cyanobacterial pig-ments, particularlyγ-carotene, typical of green phototrophs,which were often detected in very low amounts at the lowestlimit of all the different pigments.
Results obtained for the R59 mat are presented in Figs. 6and 7. In this mat, only the upper 2 cm was analyzed. As forthe two previous mats, the cyanobacterial pigments, Chlaand γ-carotene, were the most abundant. The other cyano-bacterial pigments were less abundant. Bchla is also veryabundant in the purple and red layers below the orange layer.γ-Carotene is abundant at 2 cm depth.
Distribution of microbial lipids and EPS in the threemats
The phospholipid-like fatty acid (PLFA) profiles from thedifferent mats are listed in Table 3. They showed remarkablesimilarities among the three different sites. The microbialbiomass expressed as total PLFA ranged from 154 to542 nmol·g–1, with a maximum for all mats occurring in thesubsurface sediments.
All sampling sites were characterized by the presence ofmono-unsaturated fatty acids C16:1ω7, C18:1ω9, and C18:1ω7. These were the predominate mono-unsaturates in the up-per layer of the microbial mats. The deeper layers of IT andR2 mats were characterized by a decrease in these mono-unsaturated acids. This is clearly associated with an increasein saturated acids, with 10Me C16:0 and cyclo C19:0 as themajor acids. These acids were present in low concentrationsin the R59 samples.
SEM images revealed the presence of mineral constituentssometimes surrounded by a fibrous film, identified as anexopolymer based on both physical aspects and C and Ocontent, as determined by EDAX. Yields of EPS extractedfrom the bacterial mats are listed in Table 4. In theoligohaline mats IT and R2, the highest amounts of EPSwere found in the uppermost layers, 26.8 and 46.8 mg·g–1 ofdry sample, respectively. For these mats, the exopolymerproportion decreased markedly with increasing depth and
© 2001 NRC Canada
1000 Can. J. Microbiol. Vol. 47, 2001
Fig. 3. Distribution of the main pigments of cyanobacteria and anoxygenic phototrophic bacteria detected in the sampled core of theRangiroa (R2), through the depth of the mat. The concentration of each pigment was calculated by comparison of the spectrum ofeach eluted pigment detected by its peak in the chromatogram with the spectrum between 300 and 800 nm of a standard solution ofeach pigment. A standard error of 5–10% should be applied to each calculation.

© 2001 NRC Canada
Mao Che et al. 1001

© 2001 NRC Canada
1002 Can. J. Microbiol. Vol. 47, 2001
was negligible beyond 8 cm in the R2 mat. Conversely, inthe R59 mat, the highest amount was detected in the purplelayer (48.8 mg·g–1 dry sample). The whole mat had a veryhigh EPS content along its entire depth.
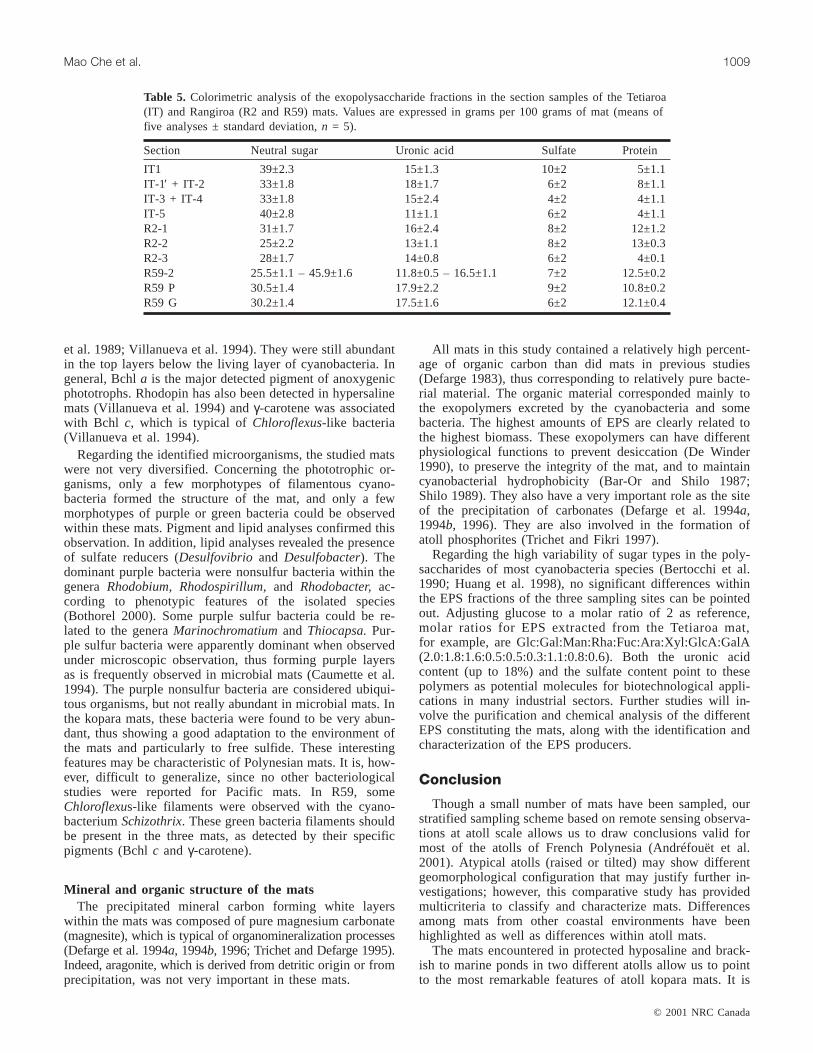
The gross chemical composition of the crude EPS frac-tions is listed in Table 5. Protein concentrations ranged from4 to 13%. Neutral sugars predominated for all samples, butall EPS were polyanionic in nature due to the presence ofuronic acids, with concentrations ranging from 11% to 18%.
Infrared spectroscopy was performed on all EPS fractions.FTIR exhibited a broad band beyond 3000 cm–1, resultingfrom O-H and C-H stretching bands at 3420 cm–1 and2900 cm–1, respectively, and also exhibited an intense absorp-tion band at 1630–1650 cm–1 with a shoulder at 1730 cm–1
due to the presence of carboxylic groups of the uronic acids.Sulfate contents, as determined by the presence of a doubletat 1250 cm–1, ranged from 6 to 10%.
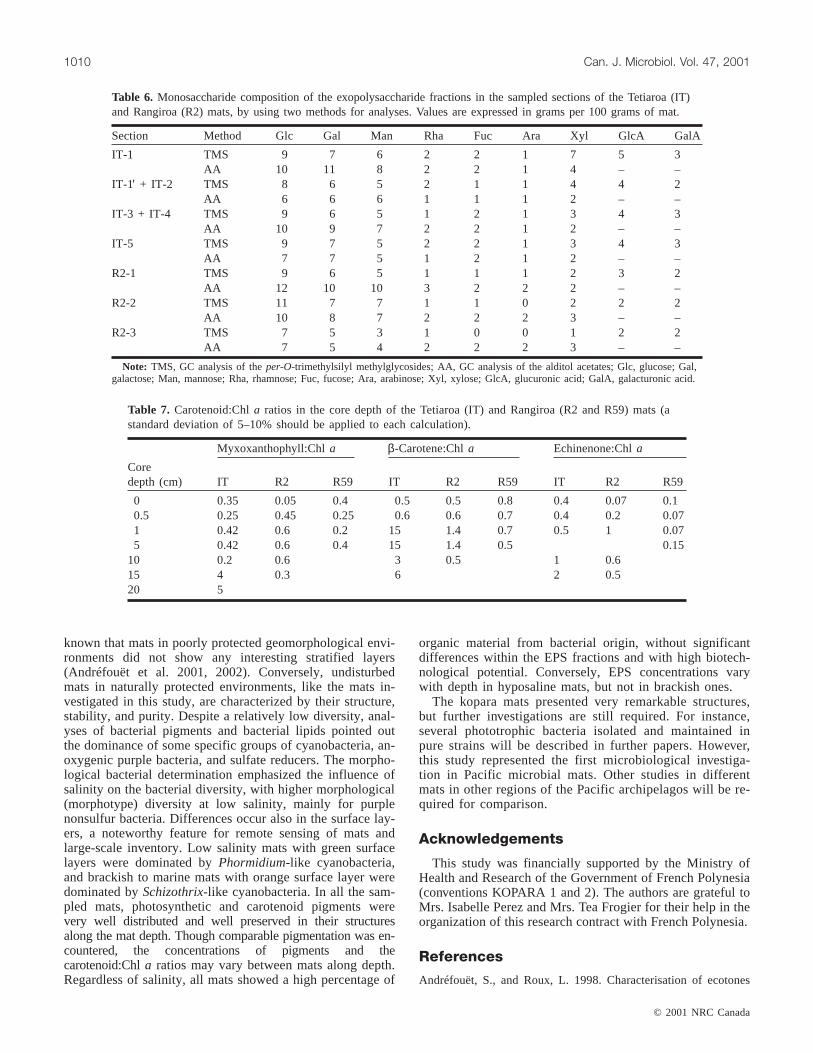
GC analysis of monosaccharides, such asper-O-
Fig. 4. HPLC analyses of pigments extracted from samples collected in a core of the Tetiaroa (IT) mat at different depth horizons. Thenumbers above the HPLC peaks correspond to the pigments listed in Table 2. The chromatograms present the peaks of the eluted pig-ments at only one wavelength (550 nm).

© 2001 NRC Canada
Mao Che et al. 1003
Fig. 5. Distribution of the main pigments of cyanobacteria and anoxygenic phototrophic bacteria detected in the sampled core of theTetiaroa (IT) mat, through the depth of the mat. The concentration of each pigment was calculated by comparison of the spectrum ofeach eluted pigment detected by its peak in the chromatogram with the spectrum between 300 and 800 nm of a standard solution ofeach pigment. A standard error of 5–10% should be applied to each calculation.

trimethylsilyl methylglycosides or alditol acetates, is pro-vided in Table 6. For both sampling sites, the EPS composi-tion showed no marked changes with depth. Glucose,galactose, and mannose predominated as neutral sugars withequal amounts in all samples. 6-Deoxy hexoses, such asrhamnose and fucose, were found in lower concentrations,as was xylose. Only traces of arabinose were determined.Glucuronic and galacturonic acids were the only uronic ac-ids identified in all fractions, with the first one predominat-ing.
Discussion
Geomorphological environments of the matsAccording to Andréfouët et al. (2001, 2002), kopara
mats in Rangiroa atoll were encountered in three types
of ponds within different geomorphological configurations.
Mats of the eastern part of the atoll, lagoon-side, and atthe periphery of motus
These areas are frequently flushed by lagoonal waters andmay actually belong to the intertidal domain. These grey toblack mats are a few centimetres in thickness.
Mats of the northern and western side of the atoll, inresidual spillways
Residual spillways make narrow basins orient trans-versally through the rim. Water seldom enters the spillwaysvia the ocean, only when very high northern swells hit theatoll. On the other hand, lagoonal water can frequently flushthe spillway when strong southeastern tradewinds blow inaustral winter. Small tongues of kopara mats a few centi-metres thick may exist only in these shallower and protected
© 2001 NRC Canada
1004 Can. J. Microbiol. Vol. 47, 2001
Fig. 6. HPLC analyses of pigments extracted from samples collected in a core of the Rangiroa (R59) mat at different depth horizons.The numbers above the HPLC peaks correspond to the pigments listed in Table 2. The chromatograms present the peaks of the elutedpigments at only one wavelength (550 nm).

© 2001 NRC Canada
Mao Che et al. 1005
Fig. 7. Distribution of the main pigments of cyanobacteria and anoxygenic phototrophic bacteria detected in the sampled core of theRangiroa (R59) mat, through the depth of the mat. The concentration of each pigment was calculated by comparison of the spectrumof each eluted pigment detected by its peak in the chromatogram with the spectrum between 300 and 800 nm of a standard solution ofeach pigment. A standard error of 5–10% should be applied to each calculation.

parts, but they are frequently invaded by vegetation. How-ever, despite their protection, these mats are very narrowand their thickness averages only a few centimetres.
Mats inside the large motusAll the large ponds with thick stratified mats are encoun-
tered in large motus. The studied mats were found in ponds
© 2001 NRC Canada
1006 Can. J. Microbiol. Vol. 47, 2001
Fig. 8. Description and physico-chemical characteristics of the Rangiroa mat R2.
Fig. 9. Description and physico-chemical characteristics of the Rangiroa mat R59.
© 2001 NRC Canada
Mao Che et al. 1007
belonging to this third geomorphological configuration. Theoligohaline R2 pond as well as the IT pond in Tetiaroa areellipsoidal, far from the coastline of the motu, while the sa-line R59 pond is narrow and elongated, very close and paral-lel to the coastline of the motu.
During another survey (Andréfouët et al. 2001), we foundmany ponds inside large motus, but most of them were dis-turbed by human (fishing activities, sewages) and animal(crabs, fishes) activities as well as by vegetation overgrowth.In these ponds, the mats were well developed, reaching 20–50 cm in thickness, thus showing that this third morphologi-cal configuration is the best configuration for the develop-ment of interesting stratified mats in atoll environments. Thedegree of protection from flushing sources (lagoon or ocean)appears to be the most important factor, after human and an-imal disturbances. The pond IT, in a large motu of Tetiaroa,confirmed this diagnostic obtained from Rangiroa survey.
Microbial characteristics of the kopara matsThe microbial mats that develop in ponds R2 and R59 in
Rangiroa and in pond IT in Tetiaroa were very impressive,by both their beautiful colors and their thicknesses. Most ofthe microbial mats so far described in oligohaline to marineenvironments are much thinner, a few millimetres to a fewcentimetres in thickness (Stal et al. 1985; Nicholson et al.1987; Vincent et al. 1994; Van Gemerden et al. 1989). Themost developed mats similar in thickness to those describedin this study were observed mainly in hypersaline environ-ments, reaching 20 cm to more than 50 cm in thickness
(Krumbein et al. 1977; Potts 1980; Thomas 1984). The mostremarkable observation of the Rangiroa and Tetiaroa matswas their nice pink to red colors down to the bottom, sug-gesting that the kopara have been constituted of pure bacte-rial material free of other organic deposits or ironprecipitates. The deeper colored layers have shown that thebacterial pigments were maintained and preserved during along period within the mat environment. According toTrichet (2001), the deepest layers were formed about 1000–1500 years ago. The preservation of the pigments could befavored by the anoxic environment due to the presence offree sulfide. The lack of iron in these special environmentsprevented sulfide from trapping in the form of black FeS;subsequently, the free sulfide is present in the exopolymericmatrix of the entire mat, up to the top layer, below the oxiczone (1–3 mm depth).
The major pigments detected in the three mats showed thedominance of cyanobacteria and their specific carotenoids(β-carotene, echinenone, and myxoxanthophyll). The surfacelayer of all mats was enriched with sheath pigments(scytonemin) absorbing at 350–450 nm, thus reducingsubstantially the penetration of short wavelength radiations.Detailed analyses have shown that both photosynthetic pig-ments (chlorophylls and bacteriochlorophylls) and caroten-oids pigments of oxygenic and anoxygenic phototrophs werevery well preserved in their structures and well distributedalong the mat depth. So far, the long-term preservation ofcarotenoid pigments in deep layers has been reported onlyfor very dense hypersaline mats (Villanueva et al. 1994),
Fig. 10. Description and physico-chemical characteristics of the Tetiaroa mat IT.

such as for the Solar Lake (Sinai) hypersaline mat during aperiod estimated at 2500 years (Boon and De Leeuw 1987).Here, the present study has shown that good preservation of
pigments is also possible in oligohaline mats. In the top lay-ers, the ratio of carotenoids:Chla was similar for the threemats (Table 7): between 0.3 and 0.4 for myxoxantho-phyll:Chl a, 0.5 and 0.8 forβ-carotene:Chla, and 0.1 and0.4 for echinenone:Chla. In the deeper layers, these ratiosincreased to reach 1–6 according to the pigments and themats. Such an increase was generally observed forβ-carotenein several mats (Vincent et al. 1994; Villanueva et al. 1994),but not for myxoxanthophyll:Chla or echinenone:Chla ratios,which were found to decrease with depth (Vincent et al.1994).
The typical pigments of purple phototrophic bacteria(Bchl a and rhodopin) were abundant at 1 cm, 2 cm, and3 cm depth in IT, R59, and R2 mats, respectively. These pig-ments proved the massive development of anoxygenicphototrophic bacteria with carotenoids of the spirilloxanthinseries. In addition, in the same layer, the abundance ofγ-car-otene was typical of the presence of anoxygenic green bacte-ria, such as Chloroflexus. However, Bchl c, which ischaracteristic of some green bacteria and typical ofChloro-flexus, was not detected in the mats or was in very lowamounts. These carotenoids and Bchl pigments of purpleand green bacteria were detected in many mats (Palmisano
© 2001 NRC Canada
1008 Can. J. Microbiol. Vol. 47, 2001
Fatty acids (%) IT-1IT-1′ +IT-2
IT-3 +IT-4 IT-5 R2-1 R2-2 R2-3
R59 G +R59 P
iC14:0 0.33 0.77 0.39 0.29 0.81 1.35 0.89 0–4.7C14:0 0.73 1.03 0.90 0.84 1.09 1.58 1.38 0.68–1.74iC15:0 4.05 5.45 5.66 6.42 6.13 6.70 4.19 2.7–5.9aC15:0 1.75 3.42 2.87 3.24 2.73 3.98 3.27 1.18–3.17C15:0 0.85 1.11 1.87 1.76 1.10 1.10 0.83 0.97–2.23iC16:0 2.57 4.13 4.24 4.91 4.49 5.77 4.50 1.80–3.86C16:1ω9 3.38 1.10 0.43 0.76 1.61 0.93 0 0.32–1.72C16:1ω7 7.76 5.36 1.64 0.25 4.48 3.02 2.30 3.78–5.81C16:1ω5 1.70 1.73 1.60 0.21 3.18 0.63 0 0.50–1.82C16:0 17.99 16.19 18.71 21.97 18.80 14.10 28.62 20.58–26.83iC17:1ω7c 0.38 1.78 1.38 0.00 0.95 1.61 1.59 0–0.3210Me C16:0 2.55 8.20 17.65 20.43 3.98 3.66 8.87 0–0.67iC17:0 1.27 1.91 2.02 2.30 1.51 1.88 1.28 0.92–1.96aC17:0 + C17:1ω8 1.82 3.31 3.41 3.84 2.57 3.29 2.15 1.25–3.56C17:1ω6 0.45 0.68 3.15 3.53 1.55 0.26 0 0–0.77Cyclo C17:0 0.00 0.00 0.00 0.00 0.00 0.00 0.00 0–0.99C17:0 0.95 1.46 1.74 1.87 1.32 1.49 1.78 1.07–2.01C18:3 0.66 0.90 0.57 0.00 0.45 0.52 0 0.52–2.22C18:2ω6,9 0.32 1.21 2.83 0.74 0.72 0.89 0 0.18–0.61C18:1ω9 10.01 3.30 1.81 1.28 9.93 3.68 3.89 0–6.65C18:1ω7c 25.94 16.01 2.46 2.52 9.52 20.67 10.13 13.30–27.52C18:1ω7t 1.44 0.23 1.41 1.49 0.48 0.29 0 0–2.4C18:1ω5 0.57 0.24 0.39 0.00 0.34 0.18 0 0–0.62C18:0 4.34 6.78 10.42 11.48 7.77 7.12 15.12 3.19–15.24brC19:1 4.54 3.57 2.56 3.48 3.43 3.37 2.30 0–3.8010Me C18:0 1.37 3.02 1.16 1.34 2.05 2.00 1.22 0–0.56Cyclo C19:0 0.41 3.31 4.47 5.07 4.29 4.33 4.17 2.43–8.82C20:1ω9 0.00 1.74 2.37 0.00 2.18 2.78 0 0.92–2.02C20:1ω7 0.00 0.52 1.42 0.00 1.76 1.14 0 0.75–1.46C20:0 1.12 0.70 0.47 0.00 0.76 1.51 1.52 0.46–4.26
Total PFLA (nmol·g–1) 323.54 422.97 179.42 154.38 414.62 474.12 168.40 158.3–521.7
Table 3. PLFA profiles in the section samples from the Tetiaroa (IT) and Rangiroa (R2 and R59) mats.
Section ofthe mats Depth (cm)
Amount of EPS(mg·g–1 dry material)
IT-1 0–1 26.8±0.8IT-1′ + IT-2 1–6 11.2±0.7IT-3 + IT-4 6–13 4.3±0.1IT-5 13–19 4.5±0.1R2-1 0–2.7 46.8±1.1R2-2 2.7–4.5 9.4±0.7R2-3 4.5–8 1±0.5R2-4 8–13.7 0R2-5 13.7–18.5 0R59-2 25.1±1.1R59 P 48.2±1.7R59 G 37.1±1.2
Table 4. Total amount of the exopolysaccharides (EPS) in thesection samples of Tetiaroa (IT) and Rangiroa (R2 and R59)mats (means of five analyses ± standard deviation).
et al. 1989; Villanueva et al. 1994). They were still abundantin the top layers below the living layer of cyanobacteria. Ingeneral, Bchla is the major detected pigment of anoxygenicphototrophs. Rhodopin has also been detected in hypersalinemats (Villanueva et al. 1994) andγ-carotene was associatedwith Bchl c, which is typical ofChloroflexus-like bacteria(Villanueva et al. 1994).
Regarding the identified microorganisms, the studied matswere not very diversified. Concerning the phototrophic or-ganisms, only a few morphotypes of filamentous cyano-bacteria formed the structure of the mat, and only a fewmorphotypes of purple or green bacteria could be observedwithin these mats. Pigment and lipid analyses confirmed thisobservation. In addition, lipid analyses revealed the presenceof sulfate reducers (Desulfovibrio and Desulfobacter). Thedominant purple bacteria were nonsulfur bacteria within thegeneraRhodobium, Rhodospirillum, and Rhodobacter, ac-cording to phenotypic features of the isolated species(Bothorel 2000). Some purple sulfur bacteria could be re-lated to the generaMarinochromatiumand Thiocapsa.Pur-ple sulfur bacteria were apparently dominant when observedunder microscopic observation, thus forming purple layersas is frequently observed in microbial mats (Caumette et al.1994). The purple nonsulfur bacteria are considered ubiqui-tous organisms, but not really abundant in microbial mats. Inthe kopara mats, these bacteria were found to be very abun-dant, thus showing a good adaptation to the environment ofthe mats and particularly to free sulfide. These interestingfeatures may be characteristic of Polynesian mats. It is, how-ever, difficult to generalize, since no other bacteriologicalstudies were reported for Pacific mats. In R59, someChloroflexus-like filaments were observed with the cyano-bacteriumSchizothrix. These green bacteria filaments shouldbe present in the three mats, as detected by their specificpigments (Bchlc and γ-carotene).
Mineral and organic structure of the matsThe precipitated mineral carbon forming white layers
within the mats was composed of pure magnesium carbonate(magnesite), which is typical of organomineralization processes(Defarge et al. 1994a, 1994b, 1996; Trichet and Defarge 1995).Indeed, aragonite, which is derived from detriticorigin or fromprecipitation, was not very important in these mats.
All mats in this study contained a relatively high percent-age of organic carbon than did mats in previous studies(Defarge 1983), thus corresponding to relatively pure bacte-rial material. The organic material corresponded mainly tothe exopolymers excreted by the cyanobacteria and somebacteria. The highest amounts of EPS are clearly related tothe highest biomass. These exopolymers can have differentphysiological functions to prevent desiccation (De Winder1990), to preserve the integrity of the mat, and to maintaincyanobacterial hydrophobicity (Bar-Or and Shilo 1987;Shilo 1989). They also have a very important role as the siteof the precipitation of carbonates (Defarge et al. 1994a,1994b, 1996). They are also involved in the formation ofatoll phosphorites (Trichet and Fikri 1997).
Regarding the high variability of sugar types in the poly-saccharides of most cyanobacteria species (Bertocchi et al.1990; Huang et al. 1998), no significant differences withinthe EPS fractions of the three sampling sites can be pointedout. Adjusting glucose to a molar ratio of 2 as reference,molar ratios for EPS extracted from the Tetiaroa mat,for example, are Glc:Gal:Man:Rha:Fuc:Ara:Xyl:GlcA:GalA(2.0:1.8:1.6:0.5:0.5:0.3:1.1:0.8:0.6). Both the uronic acidcontent (up to 18%) and the sulfate content point to thesepolymers as potential molecules for biotechnological appli-cations in many industrial sectors. Further studies will in-volve the purification and chemical analysis of the differentEPS constituting the mats, along with the identification andcharacterization of the EPS producers.
Conclusion
Though a small number of mats have been sampled, ourstratified sampling scheme based on remote sensing observa-tions at atoll scale allows us to draw conclusions valid formost of the atolls of French Polynesia (Andréfouët et al.2001). Atypical atolls (raised or tilted) may show differentgeomorphological configuration that may justify further in-vestigations; however, this comparative study has providedmulticriteria to classify and characterize mats. Differencesamong mats from other coastal environments have beenhighlighted as well as differences within atoll mats.
The mats encountered in protected hyposaline and brack-ish to marine ponds in two different atolls allow us to pointto the most remarkable features of atoll kopara mats. It is
© 2001 NRC Canada
Mao Che et al. 1009
Section Neutral sugar Uronic acid Sulfate Protein
IT1 39±2.3 15±1.3 10±2 5±1.1IT-1′ + IT-2 33±1.8 18±1.7 6±2 8±1.1IT-3 + IT-4 33±1.8 15±2.4 4±2 4±1.1IT-5 40±2.8 11±1.1 6±2 4±1.1R2-1 31±1.7 16±2.4 8±2 12±1.2R2-2 25±2.2 13±1.1 8±2 13±0.3R2-3 28±1.7 14±0.8 6±2 4±0.1R59-2 25.5±1.1 – 45.9±1.6 11.8±0.5 – 16.5±1.1 7±2 12.5±0.2R59 P 30.5±1.4 17.9±2.2 9±2 10.8±0.2R59 G 30.2±1.4 17.5±1.6 6±2 12.1±0.4
Table 5. Colorimetric analysis of the exopolysaccharide fractions in the section samples of the Tetiaroa(IT) and Rangiroa (R2 and R59) mats. Values are expressed in grams per 100 grams of mat (means offive analyses ± standard deviation,n = 5).
© 2001 NRC Canada
1010 Can. J. Microbiol. Vol. 47, 2001
known that mats in poorly protected geomorphological envi-ronments did not show any interesting stratified layers(Andréfouët et al. 2001, 2002). Conversely, undisturbedmats in naturally protected environments, like the mats in-vestigated in this study, are characterized by their structure,stability, and purity. Despite a relatively low diversity, anal-yses of bacterial pigments and bacterial lipids pointed outthe dominance of some specific groups of cyanobacteria, an-oxygenic purple bacteria, and sulfate reducers. The morpho-logical bacterial determination emphasized the influence ofsalinity on the bacterial diversity, with higher morphological(morphotype) diversity at low salinity, mainly for purplenonsulfur bacteria. Differences occur also in the surface lay-ers, a noteworthy feature for remote sensing of mats andlarge-scale inventory. Low salinity mats with green surfacelayers were dominated byPhormidium-like cyanobacteria,and brackish to marine mats with orange surface layer weredominated bySchizothrix-like cyanobacteria. In all the sam-pled mats, photosynthetic and carotenoid pigments werevery well distributed and well preserved in their structuresalong the mat depth. Though comparable pigmentation was en-countered, the concentrations of pigments and thecarotenoid:Chla ratios may vary between mats along depth.Regardless of salinity, all mats showed a high percentage of
organic material from bacterial origin, without significantdifferences within the EPS fractions and with high biotech-nological potential. Conversely, EPS concentrations varywith depth in hyposaline mats, but not in brackish ones.
The kopara mats presented very remarkable structures,but further investigations are still required. For instance,several phototrophic bacteria isolated and maintained inpure strains will be described in further papers. However,this study represented the first microbiological investiga-tion in Pacific microbial mats. Other studies in differentmats in other regions of the Pacific archipelagos will be re-quired for comparison.
Acknowledgements
This study was financially supported by the Ministry ofHealth and Research of the Government of French Polynesia(conventions KOPARA 1 and 2). The authors are grateful toMrs. Isabelle Perez and Mrs. Tea Frogier for their help in theorganization of this research contract with French Polynesia.
References
Andréfouët, S., and Roux, L. 1998. Characterisation of ecotones
Myxoxanthophyll:Chla β-Carotene:Chla Echinenone:Chla
Coredepth (cm) IT R2 R59 IT R2 R59 IT R2 R59
0 0.35 0.05 0.4 0.5 0.5 0.8 0.4 0.07 0.10.5 0.25 0.45 0.25 0.6 0.6 0.7 0.4 0.2 0.071 0.42 0.6 0.2 15 1.4 0.7 0.5 1 0.075 0.42 0.6 0.4 15 1.4 0.5 0.15
10 0.2 0.6 3 0.5 1 0.615 4 0.3 6 2 0.520 5
Table 7. Carotenoid:Chla ratios in the core depth of the Tetiaroa (IT) and Rangiroa (R2 and R59) mats (astandard deviation of 5–10% should be applied to each calculation).
Section Method Glc Gal Man Rha Fuc Ara Xyl GlcA GalA
IT-1 TMS 9 7 6 2 2 1 7 5 3AA 10 11 8 2 2 1 4 – –
IT-1′ + IT-2 TMS 8 6 5 2 1 1 4 4 2AA 6 6 6 1 1 1 2 – –
IT-3 + IT-4 TMS 9 6 5 1 2 1 3 4 3AA 10 9 7 2 2 1 2 – –
IT-5 TMS 9 7 5 2 2 1 3 4 3AA 7 7 5 1 2 1 2 – –
R2-1 TMS 9 6 5 1 1 1 2 3 2AA 12 10 10 3 2 2 2 – –
R2-2 TMS 11 7 7 1 1 0 2 2 2AA 10 8 7 2 2 2 3 – –
R2-3 TMS 7 5 3 1 0 0 1 2 2AA 7 5 4 2 2 2 3 – –
Note: TMS, GC analysis of theper-O-trimethylsilyl methylglycosides; AA, GC analysis of the alditol acetates; Glc, glucose; Gal,galactose; Man, mannose; Rha, rhamnose; Fuc, fucose; Ara, arabinose; Xyl, xylose; GlcA, glucuronic acid; GalA, galacturonic acid.
Table 6. Monosaccharide composition of the exopolysaccharide fractions in the sampled sections of the Tetiaroa (IT)and Rangiroa (R2) mats, by using two methods for analyses. Values are expressed in grams per 100 grams of mat.

using membership degrees computed with a fuzzy classifier. Int.J. Remote Sens.19: 3205–3211.
Andréfouët, S., Claereboudt, M., Matsakis, P., Pagès, J., andDufour, P. 2001. Typology of atoll rims at landscape scale inTuamotu Archipelago (French Polynesia) using SPOT-HRV im-ages. Int. J. Remote Sens.22(6): 987–1004.
Andréfouët, S., Hochberg, E.J., Payri, C., Atkinson, M.J., Muller-Karger, F.E., and Ripley, H. 2002. Multi-scale remote sensing ofmicrobial mats in atoll environment. Int. J. Remote Sens. (spec. is-sue Remote Sensing of the Coastal Marine Environment). In press.
Bar-Or, Y., and Shilo, M. 1987. Characterization of macromolecularflocculents produced byPhormidium sp. strain J1 and byAnabaenopsis circularisPCC 6720. Appl. Environ. Microbiol.53: 2226–2230.
Bertocchi, C., Navarini, L., and Cesaro, A. 1990. Review paper:polysaccharides from cyanobacteria. Carbohydr. Polym.12:127–153.
Blakeney, A.B., Harris, P.J., Henry, R.J., and Stone, B.A. 1983. Asimple and rapid preparation of alditol acetates for monosac-charide analysis. Carbohydr. Res.113: 291–299.
Bligh, E.G., and Dyer, W.J. 1959. A rapid method of total lipid ex-traction and purification. Can. J. Biochem. Physiol.37: 911–917.
Boon, J.J., and De Leeuw, J.W. 1987. Organic geochemical aspectsof cyanobacterial mats.In The cyanobacteria.Edited byP. Fayand C. Van. Baalen Elsevier, Amsterdam, the Netherlands.pp. 471–492.
Bothorel, V. 2000. Caractérisation et identification de bactériesphototrophes anoxygéniques isolées de tapis microbienspolynésiens. M.Sc. thesis, University of Pau, France.
Burnes, R.V., and Moore, L.S. 1987. Microbialites: organo-sedimentary deposits of benthic microbial communities. Palaios,2: 241–254.
Caumette, P. 1993. Ecology and physiology of phototrophic bacte-ria and sulfate-reducing bacteria in marine salterns. Experientia,49: 473–481.
Caumette, P., Baulaigue, R., and Matheron, R. 1991.Thiocapsahalophila sp. nov., a new halophilic phototrophic purple sulfurbacterium. Arch. Microbiol.155: 170–176.
Caumette, P., Matheron, R., Raymond, N., and Relexans, J.C.1994. Microbial mats in the hypersaline ponds of Mediterraneansalterns (Salins-de-Giraud, France). FEMS Microbiol. Ecol.13:273–286.
Cline, J.D. 1969. Spectrophotometric determination of hydrogensulfide in natural waters. Limnol. Oceanogr.14: 454–458.
Cohen, Y., Padan, E., and Shilo, M. 1975. Facultative anoxygenicphotosynthesis of a cyanobacteriumOscillatoria limnetica. J.Bacteriol.123: 855–861.
Costerton, J.W., and Irvin, R.T. 1981. The bacterial glycocalyx innature and disease. Annu. Rev. Microbiol.35: 299–324.
D’Amelio, E.D., Cohen, Y., and Des Marais, D.J. 1989. Compara-tive functional ultrastructure of two hypersaline submergedcyanobacterial mats: Guerrero Negro, Baja California, Mexico,and Solar Lake, Sinai, Egypt.In Microbial mats: physiology andecology of benthic microbial communities.Edited byY. Cohenand E. Rosenberg. American Society of Microbiology, Washing-ton, DC. pp. 97–113.
De Winder, B. 1990. Ecophysiological strategies of drought toler-ant phototrophic micro-organisms in dune soil. Ph.D Thesis,University of Amsterdam, the Netherlands.
Defarge, C. 1983. Contribution à l’étude géochimique et pétro-logique des formations protostromatolitiques de Polynésie. Appli-cation à la connaissance des mécanismes de la précipitation descarbonates de calcium au sein de matières organiquessédimentaires. Ph.D. thesis. University of Orléans, France.
Defarge, C., Trichet, J., Maurin, A., and Huchner, M. 1994a.Kopara in Polynesian atolls: early stages of formation of calcar-eous stromatolites. Sediment. Geol.89: 9–23.
Defarge, C., Trichet, J., and Couté, A. 1994b. On the appearance ofcyanobacterial calcification in modern stromatolites. Sediment.Geol. 94: 11–19.
Defarge, C., Trichet, J., Jaunet, A.M., Robert, M., Tribble, J., andSansone, F.J. 1996. Texture of microbial sediments revealed bycryoscanning electron microscopy. J. Sediment. Res.66: 935–947.
Espitalié, J., Deroo, G., and Marquis, F. 1985. La pyrolyse Rock-Eval et ses applications. Rev. Inst. Fr. Pet.41: 563–579.
Filisetti-Cozzi, T.M.C.C., and Carpita, N.C. 1991. Measurement ofuronic acids without interference from neutral sugars. Anal.Biochem.197: 157–162.
Glaeser, J., and Overmann, J. 1999. Selective enrichment and char-acterization ofRoseospirillum parvum, gen. nov., and sp. nov., anew purple nonsulfur bacterium with unusual light absorptionproperties. Arch. Microbiol.171: 405–416.
Guerrero, R., Ashen, J.B., Solé, M., and Margulis, L. 1993.Spirosymplokos Deltaeiberinov. gen. nov. sp.: variable diametercomposite spirochete from microbial mats. Arch. Microbiol.160: 461–471.
Huang, Z., Liu, Y., Paulsen, B.S., and Klavenes, D. 1998. Studieson polysaccharides from three edible species of Nostoc(cyanobacteria) with different colony morphologies: comparisonof monosaccharide compositions and viscosities of polysaccha-rides from field colonies and suspension cultures. J. Phycol.34:962–968.
Jørgensen, B.B., and Cohen, Y. 1977. Solar Lake (Sinai). 5. Thesulfur cycle of the benthic cyanobacterial mats. Limnol.Oceanogr.22: 657–666.
Krumbein, W.E., Cohen, Y., and Shilo, M. 1977. Solar Lake (Si-nai). 4. Stromatolitic cyanobacterial mats. Limnol. Oceanogr.22: 635–656.
Kühl, M., Lassen, C., and Jørgensen, B.B. 1994. Optical propertiesof microbial mats: light measurements with fiber-opticmicroprobes.In Microbial mats: structure, development and en-vironmental significance. NATO ASI series. Vol. G35.Editedby L.J. Stal and P. Caumette. Springer Verlag, Heidelberg, Ger-many. pp. 149–166.
Lijour, Y., Gentric, E., Deslandes, E., and Guezzenec, J. 1994. Es-timation of the sulfate content of hydrothermal vent bacterialpolysaccharides by fourier transform infra-red spectroscopy.Anal. Biochem.220: 244–248.
Lowry, O.H., Rosenbrough, N.J., Farr, N.J., and Randall, R.J.1951. Protein measurement with the Folin-Ciocalteu reagent. J.Biol. Chem.193: 265–275.
Montreuil, J., Bouquelet, S., Debray, H., Fournet, B., Spik, G., andStrecker, G. 1986. Glycoproteins.In Carbohydrate analysis, apractical approach.Edited byM.F. Chaplin and J.F. Kennedy.IRL Press, Oxford. pp. 143–204.
Mouné, S., Manac’h, N, Hirschler, A., Caumette, P., Willison, J.C.,and Matheron, R. 1999.Haloanaerobacter salinariussp. nov., anovel halophilic fermentative bacterium that reduces glycine-betaine to trimethylamine with hydrogen or serine as electrondonors; emendation of the genusHaloanaerobacter. Int. J. Syst.Bacteriol.49: 103–112.
Mouné, S., Eatock, C., Matheron, R., Willison, J.C., Hirschler, A.,Herbert, R., and Caumette, P. 2000.Orenia Salinariasp. nov., afermentative bacterium isolated from anaerobic sediments of Medi-terranean salterns. Int. J. Syst. Evol. Microbiol.50: 721–729.
Nichols, P.D., Guckert, J.B., and White, D.C. 1986. Determinationof monounsaturated fatty acid double bonds and geometry formicrobial cultures and complex consortia by capillary GC-MS
© 2001 NRC Canada
Mao Che et al. 1011
© 2001 NRC Canada
1012 Can. J. Microbiol. Vol. 47, 2001
and their dimethyl disulphide adducts. J. Microbiol. Methods,5:49–55.
Nicholson, J.A.M., Stolz, J.F., and Pierson, B.K. 1987. Structure ofa microbial mat at Great Sippewissett Marsh, Cape Cod, Massa-chusetts. FEMS Microbiol. Ecol.45: 343–364.
Nübel, Ü., Garcia-Pichel, F., Kühl, M., and Muyzer, G. 1999.Quantifying microbial diversity: morphotypes, 16S rRNA genes,and carotenoids of oxygenic phototrophs in microbial mats.Appl. Environ. Microbiol.65: 422–430.
Oremland, R.S., and King, G.M. 1989. Metanogenesis inhypersaline environments.In Microbial mats, physiologicalecology of benthic microbial communities.Edited byY. Cohenand E. Rosenberg. American Society of Microbiology Press,Washington, DC. pp. 180–190
Palmisano, A.C., Wharton, R.A., Cronin, S.E., and Des Marais,D.J. 1989. Lipophilic pigments from the benthos of a perenni-ally ice-covered Antarctic lake. Hydrobiologia,178: 73–80.
Pierson, B., Oesterle, A., and Murphy, G.L. 1987. Pigment lightpenetration, and photosynthetic activity in multilargered micro-bial mats of Great Sippewissett Salt Marsh, Massachusetts.FEMS Microbiol. Ecol.45: 365–376.
Potts, M. 1980. Blue-green algae (Cyanophyta) in marine coastalenvironments of the Sinai Peninsula; distribution, zonation,stratification and taxonomic diversity. Phycologia,19: 60–73.
Revsbech, N.P., Jørgensen, B.B., Blackburn, T.H., and Cohen, Y.1983. Microelectrode studies of the photosynthesis and O2, H2Sand pH profiles in a microbial mat. Limnol. Oceanogr.28:1062–1074.
Rimington, C. 1931. The carbohydrate complex of serum protein.II. Improved method of isolation and redetermination of struc-ture. Isolation of glucosaminodimannose from protein of oxblood. Biochem. J.25: 1062–1071.
Rougerie, F., Jehl, C., and Trichet, J. 1997. Phosphorus pathwaysin atolls: interstitial nutrient pool, cyanobacterial accumulationand carbonate-fluoro-apatite (CFA) precipitation. Mar. Geol.139: 201–217.
Shilo, M. 1989. The unique characteristic of benthic cyanobacteria.In Microbial mats: physiology and ecology of benthic microbialcommunities.Edited byY. Cohen and E. Rosenberg. AmericanSociety for Microbiology, Washington, D.C. pp. 207–213.
Stal, L.J., Van Gemerden, H., and Krumbein, W.E. 1985. Structureand development of a benthic marine microbial mat. FEMSMicrobiol. Ecol. 31: 111–125.
Staley, J.T., M.P. Bryant, N. Pfennig, and J.G. Holt (Editors). 1993Bergey’s manual for systematic bacteriology. Vol. 3. The Wil-liams and Wilkins Co., Baltimore, Md. U.S.A.
Thomas, J.C. 1984. Formations benthiques à cyanobactéries dessalins de Santa Pola (Espagne). Composition spécifique,morphologie et caractéristiques biologiques des principauxpeuplements. Rev. Investig. Geol.38/39: 139–158.
Trichet, J. 1967. Essai d’explication du dépôt d’aragonite sur dessubstrats organiques. C.R. Acad. Sci. Fr.265D: 1464–1467.
Trichet, J. 2001. (Université d’Orleans, France.) Unpublished data.Trichet, J., and Defarge, C.H. 1995. Non-biologically supported
organomineralization. Bull. Inst. Oceanogr.14: 203–236.Trichet, J., and Fikri, A. 1997. Organic matter in the genesis of
high-island atoll phosphorites: the lagoonal link. J. Sediment.Res.67: 891–897.
Van Gemerden, H. 1989. Microbial mats: a joint venture. Mar.Geol. 113: 3–25.
Van Gemerden, H., de Wit, R., Tughan, C.S., and Herbert, R.A.1989. Laminated microbial ecosystems on sheltered beaches inScapa Flow, Orkney Islands. FEMS Microbiol. Ecol.62: 87–102.
Vandevivere, P., and Baveye, P. 1992. Effects of bacterialextracellular polymers on the saturated hydraulic conductivity ofsand columns. Appl. Environ. Microbiol.58(5): 1690–1698.
Villanueva, J., Grimalt, J.O., de Wit, R., Keely, B.J., and Maxwell,J.R. 1994. Chlorophyll and carotenoid pigments in solar salternmicrobial mats. Geochim. Cosmochim. Acta,58: 4703–4715.
Vincent, W.F., Downes, M.T., Castenholz, R.W., and Howard-Williams, C. 1994. Community structure and pigment organisa-tion of cyanobacteria-dominated microbial mats in Antarctica.Eur. J. Phycol.28: 213–221.
Ward, D.M., Ferris, M.J., Nold, S.C., Bateson, M.M.,Kopkczynski, E.D., and Ruff-Roberts, A.L. 1994. Species diver-sity in hot spring microbial mats as revealed by both molecularand enrichment culture approach—relationship betweenbiodiversity and community structure.In Microbial mats, struc-ture, development and environmental significance. NATO ASISeries. G.35.Edited by L. Stal and P. Caumette. Springer-Verlag, Heidelberg, Germany. pp. 33–44.
White, D.C., Davis, W.M., Nickels, J.S., King, J.D., and Bobbie,R.J. 1979. Determination of the sedimentary microbial biomassby extractable lipid phosphate. Oecologia,40: 51–62.