
EFFECT OF STORAGE CONDITIONS ON THE CHEMICAL, PHYSICAL AND SENSORY CHARACTERISTICS OF STANLEY PLUM...
18
EFFECT OF STORAGE CONDITIONS ON THE CHEMICAL, PHYSICAL AND SENSORY CHARACTERISTICS OF STANLEY PLUM PASTES WEN-MIN WANG, MUHAMMAD SIDDIQ, NIRMAL K. SINHA and JERRY N. CASH' Department of Food Science & Human Nutrition Michigan State University, East Lansing, MI 48824 Accepted for Publication May 10, 1994 ABSTRACT Stanley p l u m were processed into purees and then pastes by heat concentration to 25 and 3O"Brix. The Brix of these two pastes was increased to 40 and 45 ', respectively, by sugar addition. Pastes were stored at 4 and 22 f2C in the dark for up to 24 weeks. Physical-chemical characteristics and microbio- logical quality were determined at 4 week intervals. Sensory evaluation was conducted at 0 and 24 weeks. Total solids, water acrivity, rheological properties and microbiological quality were stable during storage. Total acid, total anthocyanins, total pectin and Hunter 'L' and 'a' values decreased significant- ly during storage (P < 0.01). The degradation rate of total anthocyanins was much higher for pastes stored at 22C than those at 4C. Hue angle and Hunter 'b ' values increased during storage. Sensoiy evaluation indicated that pastes were still acceptable after 24 weeks of storage. INTRODUCTION Purple plums are an integral part of Michigan agriculture and are well positioned as a fresh market and/or processing crop that can be harvested between the cherry and apple crops. The development of a strong market for Michigan plums is particularly relevant for the state's fruit growers because it is one of their most important minor crops. At present approximately one-half of the plums are consumed fresh while the rest are processed (Espie 1992). The major processed plum products available in the market are whole canned plums, prunes and prune juice. Other processed forms, such as juice, sauce, paste, juice 'To whom correspondence should be sent Journal of Food Quality 18 (1995) 1-18. All Righrs Reserved. Copyright 1995 by Food & Nutrition Press, Inc. Trumbull, Connecticut. 1
-
Upload
independent -
Category
Documents
-
view
4 -
download
0
Transcript of EFFECT OF STORAGE CONDITIONS ON THE CHEMICAL, PHYSICAL AND SENSORY CHARACTERISTICS OF STANLEY PLUM...

EFFECT OF STORAGE CONDITIONS ON THE CHEMICAL, PHYSICAL AND SENSORY CHARACTERISTICS
OF STANLEY PLUM PASTES
WEN-MIN WANG, MUHAMMAD SIDDIQ, NIRMAL K. SINHA and JERRY N. CASH'
Department of Food Science & Human Nutrition Michigan State University, East Lansing, MI 48824
Accepted for Publication May 10, 1994
ABSTRACT
Stanley p l u m were processed into purees and then pastes by heat concentration to 25 and 3O"Brix. The Brix of these two pastes was increased to 40 and 45 ', respectively, by sugar addition. Pastes were stored at 4 and 22 f 2 C in the dark for up to 24 weeks. Physical-chemical characteristics and microbio- logical quality were determined at 4 week intervals. Sensory evaluation was conducted at 0 and 24 weeks. Total solids, water acrivity, rheological properties and microbiological quality were stable during storage. Total acid, total anthocyanins, total pectin and Hunter 'L' and 'a' values decreased significant- ly during storage (P < 0.01). The degradation rate of total anthocyanins was much higher for pastes stored at 22C than those at 4C. Hue angle and Hunter 'b ' values increased during storage. Sensoiy evaluation indicated that pastes were still acceptable after 24 weeks of storage.
INTRODUCTION
Purple plums are an integral part of Michigan agriculture and are well positioned as a fresh market and/or processing crop that can be harvested between the cherry and apple crops. The development of a strong market for Michigan plums is particularly relevant for the state's fruit growers because it is one of their most important minor crops. At present approximately one-half of the plums are consumed fresh while the rest are processed (Espie 1992). The major processed plum products available in the market are whole canned plums, prunes and prune juice. Other processed forms, such as juice, sauce, paste, juice
'To whom correspondence should be sent
Journal of Food Quality 18 (1995) 1-18. All Righrs Reserved. Copyright 1995 by Food & Nutrition Press, Inc. Trumbull, Connecticut. 1

2 W. WANG, M. SIDDIQ, N.K. SINHA and J.N. CASH
concentrate and prune bits have not been developed and marketed on a scale similar to other fruits like apples, pears, apricots, etc. (Siddiq ef al. 1994). A great deal of work has already been done in our group to develop plum juice from Stanley, as well as from several other cultivars of plums which may be grown in Michigan (Siddiq et al. 1994; Chang e? al. 1994). In addition to juice, the apparent success of several recently developed new products in the U.S. that use fruit pastes indicates that plum paste might find very good acceptance in the marketplace. Such a product could utilize fairly large quantities of fruit and give a "value added" product, which would increase use of plums, especially Stanley plums, which is the most abundant plum cultivar grown in Michigan.
Factors affecting the quality and the shelf-life of a certain food product include: intrinsic properties of foods, such as composition, moisture content, pH etc., as well as extrinsic factors such as, storage time, temperature, light, etc. Texture, color and microbial contamination are the most frequently used indicators of storage stability (Canellas ef al. 1993; Wrolstad ef al. 1990; Weinert ef al. 1989). The objectives of this study were: (a) to develop a processing procedure to produce pastes from Stanley plums, and (b) to evaluate the effect of storage conditions on various quality indices of plum paste including chemical, physical, sensory and microbial characteristics.
MATERIALS AND METHODS
Whole Plum Samples
Stanley plums grown in northern Michigan, harvested at maturity in September 1992 were used for this study. The plum samples were frozen at -20C immediately after harvest and kept at that temperature for later process- ing.
Plum Paste Production
Frozen plums were allowed to thaw overnight at 4C. After washing with tap water plums were heated to 9% and macerated for 10 min in double jacketed stainless steel kettles. The macerate was cooled slightly and the pits removed by passing the mixture through a stainless steel screen. The depitted macerate was passed through a finisher (Dodge, Mishawaka, IN) equipped with 0.060-in. screen. The plum puree was stored at -2OC until further processing. For paste production, thawed samples were concentrated by heat to 25 and 30"Brix. One batch was filled hot (85C) into 12-oz jars. The other batch had sucrose added

STORAGE EFFECTS ON STANLEY PLUM PASTES 3
to give a 15"Brix increase. The paste with added sugar was mixed well, heated to 85C, and hot filled (85C) into glass jars. The jars were sealed immediately, cooled to room temperature, and then stored at 4+2 C or 22+2C in the dark.
Quality Evaluation of Plum Paste
Plum paste samples stored at 4+2C and 22+2C in the dark were evaluated every 4 weeks for up to 24 weeks for various quality indices. The experiment was replicated and each jar served as a replication. Mean values in the results represent duplicate measurements from each jar.
Soluble Solids and Total Solids
Percent soluble solids of samples was measured using an Abbe-3L (Bausch & Lomb Optical Co., Rochester, NY) refractometer. The results were expressed as Brix at 20C. For total solids, 6 g of each sample were weighed into aluminum weighing dishes that had been dried in a vacuum oven (Hotpack, Philadelphia, PA) for 1 h at lOOC under a pressure of 27 in. Hg. Drying of samples was done in the vacuum oven for 8 h at lOOC under 27 in. Hg. The dried samples were allowed to cool in a desiccator for 30 min and then weighed. The percent total solids were calculated using the formula: % Total Solids = (dried sample weight/fresh sample weight) x 100.
pH and Total Acid (TA)
Paste samples (5 g) were diluted with 45 ml distilled water and the pH measured with a pH meter (Model 601A, Coming Glass Works, Medfield, MA.). For total acid, paste samples (5 g) were mixed with 95 ml distilled water and titrated to pH 8.1 with 0. 1N NaOH. Results are expressed as % malic acid by weight using the formula % malic acid = ml NaOH x 0. 1N NaOH x 0.067 meq x 100/5g sample.
Total Pectin
Extraction of pectin was according to the method of McCready and McComb (1952). The colorimetric measurement of galacturonic acid was done using the method of Kintner and Van Buren (1982). The concentration of pectin was calculated from a standard curve using galacturonic acid.
4 W. WANG, M. SIDDIQ, N.K. SINHA and J.N. CASH
Moisture Content and Water Activity
The moisture content of samples was calculated from percent total solids using the formula: % moisture content = 100 - % total solids. For water activity, approximately 2 g of sample were measured using a water activity system (CX-1, Decagon Devices, Inc., Pullman, WA) at different storage temperatures.
Total Anthocyanins
Total anthocyanins were extracted according to the method of Skalski and Sistrunk (1973) and Cash et al. (1976) with a slight modification based on the method of Lees and Francis (1971). Samples (10 g ) were mixed with 20 ml of 0. 1N HCI buffer. The mixture was blended in a Waring Blendor for 1 min with 100 ml of acidified ethanol solution (95% ethanol: 1.5N HCI = 85: 15, v/v). The extraction solution was made up to 200 ml and kept in the dark for 2 h. The mixture was centrifuged under refrigeration at 9000 x g for 10 min and absorbance was measured at 535 nm using a spectrophotometer (Milton Roy Spectronic-70, Rochester, NY). Total anthocyanins were calculated using the formula: Total Anthocyanin (mg/100g) = [(absorbance x dilution factor)/E] x (lOOg/lOg). The factor E is 98.2 for the acid-ethanol solvent (Francis 1982; Fuleki and Francis 1968).
Color
Color of triplicate samples of paste was measured with a Hunter Color Difference Meter (D25 DP-9000 system, Hunter Associates Laboratory, Reston, VA). About 200 g of sample were placed in a standard optical cell for the measurement after standardization with a pink tile (L = 73.49; a = 17.34; b = 10.28). This system is based on the Hunter ‘L’, ‘a’ and ‘b’ coordinates. The ‘L’ represents lightness, from white (L=lOO) to black (L=O), and ‘a’ and ‘b’ indicate hue, measuring +a (redness), -a (greenness), +b (yellowness) and -b (blueness).
Rheological Properties
Rheological properties, apparent viscosity, flow behavior index and consistency index, were determined using an experimental procedure based on the method of Castell-Perez (1990). A Brookfield HBTD viscometer (Brookfield

5 STORAGE EFFECTS ON STANLEY PLUM PASTES
Engineering Laboratories, Inc., Stoughton, MA) connected with a data acquisition system (Dianachart PC-Acquisition Model PCA- 14, Dianachart Inc., Rockaway, NJ) was used to measure the rheological properties of plum pastes. The sample temperature was maintained at 30 f0 .2C using a water circulator.
Sensory Analysis
The sensory test of paste from whole plums was carried out to determine the effects of processing conditions and storage conditions at the beginning and end of storage using a descriptive test with unstructured scaling (Poste et al. 1991). Samples were tested by an untrained panel of 60 judges (including faculty, staff, and students in the Department of Food Science and Human Nutrition) for color, acidity, sweetness, consistency, flavor, and overall acceptance. Panelists were asked to evaluate the first 5 descriptors by intensity only and the last one by personal preference. A 15-cm horizontal line was used for evaluation of each sensory attribute. Panelists were asked to record each evaluation by marking the horizontal line at the point that best reflected their perception of the magnitude of that property. At each sensory test 2 samples (about 15 g paste) in duplicate were evaluated at room temperature. The tests were all done on one day beginning at mid-morning and ending mid-afternoon.
All sensory tests were held in the sensory evaluation laboratory of the Department of Food Science and Human Nutrition at Michigan State University under cool white fluorescent lighting.
Microbial Content
Samples were tested for total (standard) plate count (SPC), coliform counts, and yeast and mold counts using the methods of Pestka (1993).
Statistical Analysis
In this study, the experiment was designed as a four factor (concentration x sugar x time x temperature) randomized model. Mean, standard deviation, standard errors, ANOVA tables, and correlations were determined using the Super ANOVA software (Abacus Concepts, Inc., Berkeley, CA), Lotus software, and SAS software. Interactions between statistically significant factors may not be biologically significant. Therefore, those interactions important both statistically and biologically were focused upon. LSD test for multiple comparisons was applied to determine significantly different treatment effects.

6
1 0 . 9 4 - ' 0 . 9 3 ' ' 1
W. WANG, M. SIDDIQ, N.K. SINHA and J.N. CASH
1,
I 0 4 8 I2 1 6 2 0 2 4
s o
s 4 s - L
4 0
1.4 !
0 4 8 I2 I6 2 0 2 J
Time (Weeks)
0 4 8 It 1 6 2 0 2 4 1.00
0.99 - - - * 0 . 9 8
0 .97 - 5 ., -
0.92 ! I
FIG. 1. CHANGES IN TOTAL SOLIDS, SOLUBLE SOLIDS, TOTAL ACID, TOTAL PECTIN, WATER ACTIVITY, MOISTURE CONTENT AND TOTAL ANTHOCYANINS
OF PLUM PASTES STORED AT 4 AND 22C
STORAGE EFFECTS ON STANLEY PLUM PASTES 7
RESULTS AND DISCUSSION
Soluble Solids and Total Solids
No substantial changes were detected in soluble solids or total solids of plum pastes during storage (Fig. 1). Changes in composition during storage which result in variation of soluble solids and total solids have been reported by O'Brien and Morrissey (1989) and Kanujoso and Luh (1967). Measurement of solid content is fundamental for examining the quality of fruit pastes during storage. None of the plum pastes in the present study showed any significant changes in total or soluble solids, indicating the stability of these important quality characteristics.
pH and Total Acid (TA)
Storage time produced a significant increase in pH, especially after 16 weeks, of plum pastes (P<O.O5), while storage temperature had no effect on paste pH (data not shown). The pH was stable in all samples during the first 16 weeks of storage, then increased (from 3.45 to 3.50) for most plum pastes at the end of storage, except in the unsweetened 30"Brix paste. A significant decrease (P<O.O5) in TA as a function of storage time was observed (Fig. 1). However, no difference was found between samples stored at 4 and 22C. Similarly, method of processing (i.e., heat concentration or sugar addition) did not affect the stability of TA.
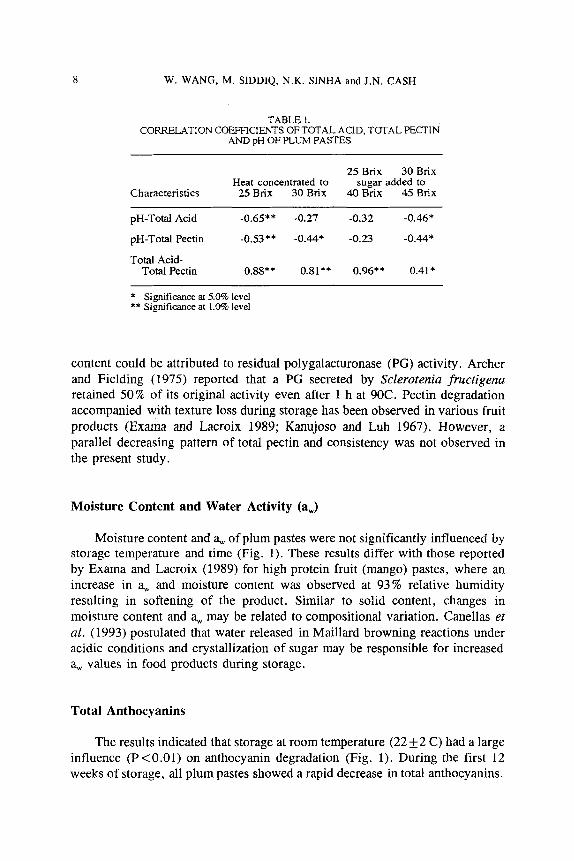
Correlation coefficients between pH and total acid as well as total pectin are listed in Table 1. The decrease in total acid and total pectin (mainly water-solu- ble) of plum pastes was significantly related to an increase in pH in several treatments (unsweetened 25 Brix and sweetened 30"Brix for total acid; unsweet- ened 25 and 30"Brix and sweetened 30"Brix for pectin). A similar relationship was observed by Kanujoso and Luh (1967) who found that increased acidity was accompanied by a decrease in pH and an increase in water-soluble pectin. R o m e 1 et al. (1992) also found that titratable acidity and pectin content showed similar trends with a pattern of change opposite to pH in fruit juice and wine.
Pectin Content
Changes in total pectin were significantly influenced (P <0.05) by storage time, but not by temperature (Fig. 1). The greatest decline in pectin content was observed during the first 12 weeks for all paste samples. This decline in pectin
8 W. WANG, M. SIDDIQ, N.K. SINHA and J.N. CASH
TABLE 1. CORRELATION COEFFIClENTS OFTOTAL ACID, TOTAL PECTIN
AND pH OF PLUM PASTES
25Brix 30Brix Heat concentrated to sugar added to
Characteristics 25Brix 30Brix 40Brix 45Brix
pH-Total Acid -0.65** -0.27 -0.32 -0.46*
pH-Total Pectin -0.53** -0.44* -0.23 -0.44*
Total Acid- Total Pectin 0.88** O.Sl** 0.96** 0.41*
* Significance at 5.0% level ** Significance at 1.0% level
content could be attributed to residual polygalacturonase (PG) activity. Archer and Fielding (1975) reported that a PG secreted by Sclerotenia fructigena retained 50% of its original activity even after 1 h at 90C. Pectin degradation accompanied with texture loss during storage has been observed in various fruit products (Exama and Lacroix 1989; Kanujoso and Luh 1967). However, a parallel decreasing pattern of total pectin and consistency was not observed in the present study.
Moisture Content and Water Activity (a,)
Moisture content and a, of plum pastes were not significantly influenced by storage temperature and time (Fig. 1). These results differ with those reported by Exama and Lacroix (1989) for high protein fruit (mango) pastes, where an increase in a, and moisture content was observed at 93% relative humidity resulting in softening of the product. Similar to solid content, changes in moisture content and a, may be related to compositional variation. Canellas et al. (1993) postulated that water released in Maillard browning reactions under acidic conditions and crystallization of sugar may be responsible for increased a, values in food products during storage.
Total Anthocyanins
The results indicated that storage at room temperature (22 f 2 C) had a large influence (P<O.Ol) on anthocyanin degradation (Fig. 1). During the first 12 weeks of storage, all plum pastes showed a rapid decrease in total anthocyanins.

STORAGE EFFECTS ON STANLEY PLUM PASTES 9
Samples stored at 4+2C did not lose as much pigment. Similar results for higher retention of anthocyanins in samples stored at refrigerated temperature than those stored at nonrefrigerated temperature were also observed in blackberry juice and wine (Rommel et al. 1992) and in grape pigments (Palamidis and Markakis 1975). The protective effect of sugar on anthocyanin pigments of strawberries during storage, as reported by Wrolstad ef al. (1990) was not observed in this study.
Table 2 shows the correlation coefficients between total anthocyanins and Hunter CDM (color difference measurements) values. Hunter ‘a’ value and chroma (in all samples) and Hunter ‘L’ value in both 30”B sweetened and unsweetened pastes had significant positive correlation with anthocyanins. Whereas Hunter ‘b’ value and hue angle showed significant negative correlation with anthocyanins, high positive correlations of Hunter ‘a’ values with total anthocyanins confirmed that anthocyanin pigments were the major color source of plums (Timberlake and Bridle 1982), which appear as red in acidic medium (like plum paste, Brouillard 1982). Anthocyanin pigments may be degraded to colorless components or may undergo polymerization resulting in browning (Markakis 1982). Negative correlation between hue angle and Hunter ‘b’ values and total anthocyanins implied some degradation of anthocyanin pigments to colorless components or other pigments not measured contributing to color.
TABLE 2. CORRELATION COEmCIENTS BETWEEN H W E R CDM VALUES
AND TOTAL ANTHOCYANINS OF PLUM PASTES
25Brix 30Brix Heat concentrated to sugar added to
Characteristics 25Brix 30Brix 40Brix 45Brix
Hunter ‘L‘ 0.27 0.60** 0.28 0.60**
Hunter ‘a’ 0.94** 0.93** 0.88** 0.89**
Hunter ‘b‘ -0.55** -0.51** -0.91** -0.70**
Hue angle -0.94** -0.88** -0.93** -0.84**
Chroma 0.94** 0.94** 0.90** 0.92**
Color Difference Measurement * Significance at 5.0% level ** Significance at 1.0% level

10 W. WANG, M. SIDDIQ. N.K. SINHA and J.N. CASH
Color
Hunter ‘L’, ‘a’ and ‘b’ values, hue angle and chroma of plum pastes are shown in Fig. 2. Hunter ‘L’ values (lightness index) of paste samples decreased during the 24 weeks of storage, with a higher rate of browning observed for samples stored at 4C. Canellas et al. (1993) observed no color changes during the first 3 months of storage in different fruit and vegetable products. Increased browning as a function of storage time, especially extended, has been observed in raisins (Canellas et al. 1993), citrus fruit products (Handwerk and Coleman 1988) and carrots (Baloch et al. 1973).
Higher positive correlation between Hunter ‘L’ values and chroma as well as Hunter ‘a’ (Table 3) than with anthocyanins (Table 2) implied that polymerization reactions overpowered degradation of total anthocyanins. Rommel et al.( 1992) reported that Hunter ‘L’ values increased with degradation of total anthocyanins and decreased with browning or polymerization reactions. It could be assumed that the browning effect observed was mainly nonenzymatic, since no polyphenol oxidase activity was detected in any of the samples at the beginning of storage. The potential condensation reactions that could contribute to pigment polymerization and then browning include: anthocyanin copigmenta- tion, anthocyanin-phenolic condensation, Maillard reaction and ascorbic acid degradation (O’Brien and Morrissey 1989; Markakis 1982).
As storage time increased, the Hunter ‘a’ values of plum pastes decreased, which indicated a reduction in redness (Fig. 2). The rate of change in redness significantly increased (P < 0.05) with storage temperature, which was similar to changes observed in total anthocyanins (Fig. 1). These results indicated that low temperature storage was better for color retention of plum pastes. Wrolstad et al. (1990) reported that sugar had a protective effect on color retention during storage. However, in the current study, sugar addition did not show any protective effect on the Hunter ‘L’ or ‘a’ values of plum pastes. Hunter ‘b’ values (yellowness index) of all plum pastes continued to increase during storage (Fig. 2). Neither method of paste production nor any storage temperature had a protective effect on different Hunter values.
Hue angle of plum pastes increased with the storage time, with a significant- ly higher rate for samples stored at 22C (P<O.O5) than at 4C. For chroma, all paste samples showed a similar decreasing pattern, which was significantly influenced (P<O.O5) by storage time and temperature (Fig. 2). Rommel et al. ( 1992) reported that chroma decreased with increasing percentage of polymeric color and browning, which was confirmed by high positive correlation between Hunter ‘L’ values and chroma (Table 3).

STORAGE EFFECTS ON STANLEY PLUM PASTES 1 1
0 4 8 1 2 16 20 2 4
30 1 I
LO “1 n 9 L - E 8
z 7
6
0 4 8 1 2 16 2 0 2 4
Time (Weeks)
- 25’Brix (4 C ) --O- 25’Brix ( 2 2 C )
---t 30.Brix (4 C ) --O- 3O’Brix (22 C ) - d-
-t - 25‘B. rugnr added to 40-B 14 C ) 25.B. sugnr added to 4O.B (22 C ) 30’B, sugnr added to 45’B (4 C ) W B , sugnr added to 45”B (22 C)
3s
3 0
2 5
2 0
I5 ! I 0 4 8 12 16 2 0 14
1 4 ! I 0 4 8 I2 1 6 2 0 2 4
Time (Weeks)
FIG. 2. CHANGES IN HUNTER ‘L’, ‘a’ AND ‘b’ VALUES, HUE ANGLE AND CHROMA OF PLUM PASTES STORED AT 4 AND 22C

12 W. WANG, M. SIDDIQ, N.K. SINHA and J.N. CASH
TABLE 3. CORRELATION COEFFTCIENTS OF HUhTER 'L' VALUES WITH
OTHER HUNTER C D M ~ VALUES OF PLUM PASTES
25Brix 30Brix Heat concentrated to sugar added to
Characteristics 25Brix 30Brix 40Brix 45Brix
Hunter 'a' 0.49** 0.78** 0.66** 0.83**
Hunter 'b' -0.62** -0.85** -0.51** -0.91**
Hue angle -0.50** -0.81** -0.56** -0.88**
Chroma 0.47** 0.76** 0.69** 0.80**
1 Color Difference Measurement * Significance at 5 .M level ** Significance at 1.0% level
Rheological Properties
Storage conditions had no significant effect (P < 0.05) on apparent viscosity, consistency index (K), or flow behavior index (77) of paste samples (Fig. 3). Both particle size and air bubbles interfered with rheological parameters. Alviar and Reid (1990) reported that for high consistency samples filling is quite difficult without incorporation of air bubbles, which affects the flow behavior of fluids. However, during actual processing of pastes, the presence of air bubbles can be expected, so the K and 17 values that were obtained through this test may be more practical than if they had been obtained for samples that were degassed.
Sensory Evaluation
Table 4 shows the p values of ANOVA measuring the difference between storage times and temperatures for sensory attributes, These results indicated that the interference of heat concentration and sugar addition were not significant at 5 % level. The effects of storage time and temperature on sensory characteris- tics are shown in Table 5. Storage for 24 weeks at 4C significantly decreased (P<O.O5) color of unsweetened and sweetened 30"Brix pastes. The results in part I1 of Table 5 show that most sensory characteristics were not significantly affected by 24 weeks of storage at 22C, except for increased color and acidity of 30"Brix paste and decreased viscosity (consistency) of sweetened 30"Brix paste. Unsweetened 25"Brix and sweetened 30"Brix pastes stored at 22C had significantly higher overall acceptance (P <O.Ol) as compared with samples stored at 4C (Table 5, part 111).

- 3O"Uri
x (4
C)
--O
-
30'B
rix
(22
C)
, I
0 4
8 It
16
2
0
24
----C
-
-C
-
--a---
25"B
rix.
sug
nr n
dded
to
4O
"Uri
x (4
C)
25"B
rix.
sug
nr n
dded
to
40"B
rix
(22
C)
30"B
rix.
sug
nr a
dded
to
4S"B
rix (4 C
) 30
"Bri
x, s
uga
r nd
ded
to
45"B
rix
(22
C)
0.42 1
I I
- v F -
0.4
I %
- 2 0
.40
: 50
L
2Q
.$ 0
.39
$
<
4 0
.38
.- :i
v
40
G
a m c
w
% 2 0
.37
k. -
c
0.3
6
30
0
J
8 I
t
16
2
0
24
0
4 8
It
1
6
20
2
4
Tim
e (W
eeks
) T
ime
(Wee
ks)
FIG
. 3. C
HA
NG
ES IN
APP
AR
ENT
VIS
CO
SITY
, FLO
W B
EHA
VIO
R I
ND
EX (0)
A
ND
CO
NSI
STEN
CY
IN
DEX
(K)
OF
PLU
M P
AST
ES S
TOR
ED A
T 4
AN
D 2
2C
0 z m 1 2 m
.e r
Ld
r
c
w

14 W. WANG, M. SIDDIQ, N.K. SINHA and J.N. CASH
TABLE 4. P VALUES OF ANALYSIS OF VARIANCE FOR DIFFERENCE IN SENSORY
ATTRIBUTES OF PLUM PASTES
Sensory Attributes
Sweet- Consis- Overall Source Color Acidity ness tency Flavor acceptance
I A B
AxB
_n A B
AxB
m - A B
AxB
0.377 0.069 0.076
0.600 0.283 0.592
0.720 0.455 0.242
0.73 1 0.100 0.056
0.620 0.092 0.593
0.897 0.010 0.180
0.446 0.868 0.427
0.494 0.910 0.787
0.971 0.965 0.628
0.522 0.898 0.553
0.356 0.690 0.660
0.789 0.794 0.317
0.955 0.766 0.441
0.786 0.983 0.335
0.741 0.752 0.834
0.288 0.934 0.063
0.548 0.479 0.994
0.658 0.514 0.061
I Difference between the beginmng and the end of storage at 4 C I1 Difference between the begnning and the end of storage at 22 C 111 Difference between 4 C and 22 C stonge after 24 weeks A Heat concentrated pastes B Pastes concentrated with heat and then with sugar addition
The results of the sensory evaluation showed that storage time had a negative effect on quality and overall acceptance of plum pastes, but storage temperature showed a variable effect. However, lower total acid, lower total anthocyanins, darker color, and constant rheological properties determined by objective analysis were not confirmed by subjective evaluation. Less sensitive results from sensory evaluation have also been observed for canned tomato paste (Eckerle el al. 1984).
Microbial Analysis
During 24 weeks of storage, only 3 samples had yeast and mold contamina- tion (data not shown). This contamination may have occurred during preparation of samples for measurement. Since most of the plum pastes contained no live microorganisms from 0 to 24 weeks of storage, it can be assumed that microor- ganisms were destroyed under the processing conditions used in this study.

STORAGE EFFECTS ON STANLEY PLUM PASTES 15
TABLE 5. VALUES OF t-TEST OF MEAN SCORES OF DIFFERENCE IN SENSORY
ATTRIBUTES OF PLUM PASTES
25Brix 30Brix sugar added to
Characteristics 25 Brix 30 Brix 40 Brix 45 Brix
g Color Acidity Sweetness Consistency Flavor Overall acceptance
,n Color Acidity Sweetness Consistency Flavor Overall acceptance
m Color Acidity Sweetness Consistency Flavor Overall acceptance
-
0.244 1.340
-3.976* * - 1.242 -0.394 -6.371 **
1.222 1.923
- 1.447 0.400
-0.773 0.722
- 1.283 -3.062** -5.240** - 1.593 -1.176 5.651**
-5.088** -3.195** -3.91 1 ** 3.717**
- 1.828 -0.509
3.347** 3.986**
-0.613 -0.569 1.703
-0.466
- 1.779 -0.634 -4.343** -3.064' * -0.090 -0.996
0.339 4.120** -2.716** 2.690**
-1.346 -2.473*
0.142 0.385
.. 1.759 0.480 1.202
-0.679
-0.435 -3.667** -4.3 59* * -3.078** -0.1 19 -3.192**
-2.13 1 * 7.357** 5.831** 2.783* *
-0.3 1 1 -4.075 * *
0.122 0.459 0.150 -2.248 * * 0.188 -1.902
-2.064* -6.618** -5.404** -0.53 1 -0.119 6.069**
I Difference between the beginnrng and the end of storage at 4 C 11 Difference between the beginrung and the end of stonge at 22 C 111 Difference between 4 C and 12 C stonge after 24 weeks * Significance at 5 0% level ** Significance at 1 0% level
CONCLUSIONS
Plum pastes under different storage conditions were generally stable for most of the physical and chemical properties, except for pectin content, total anthocyanins and CDM values. Heat concentration resulted in degradation of titratable acids, total anthocyanins and pectin content. Rheological properties of all paste samples were significantly increased by heat concentration but not by sugar addition. Sensory evaluation indicated that plum pastes could be characterized by acidity, sweetness, and consistency sensation, whereas, the preference could be adequately predicted by flavor and color under suitable

16 W. WANG, M. SIDDIQ, N.K. SINHA and J.N. CASH
Brix/acid ratio. Based on relatively lower loss of anthocyanin pigments at 4C than at 22C, refrigerated storage is recommended for better retention of the characteristic color of plum pastes. Future studies should focus on changes in anthocyanin composition during processing and storage and its relationship to Hunter color values. Once the relationship is established, the anthocyanin stability may be monitored by Hunter color values, an easier measurement procedure, especially for commercial processing of plum pastes.
ACKNOWLEDGMENT
Acknowledgment is made to Michigan Agricultural Experimental Station, the Food and Crop Bio-processing Center at Michigan State University and Michigan Plum Advisory Board for their support of this research.
REFERENCES
ALVIAR, M.S.B. and REID, D.S. 1990. Determination of rheological behavior of tomato concentrates using back extrusion. J. Food Sci. 55, 554-555.
ARCHER, S.A. and FIELDING, A.H. 1975. Thermostable polygalacturonase secreted by Sclerotinia fmctigena. J . Food Sci. 40, 423-424.
BALOCH, A.K., BUCKLE, K.A. and EDWARDS, R.A. 1973. Measurement of nonenzymatic browning of dehydrated carrot. J. Sci. Food Agric. 24,
BROUILLARD R. 1982. Chemical structure of anthocyanins. In Anthocyanins as Food Colors, (P. Markakis, ed.) pp. 1-40, Academic Press, New York.
CANELLAS, J., ROSSELLO, C., SIMAL, S. , SOLER, L. and MULET, A. 1993. Storage conditions affect quality of raisins. J . Food Sci. 58, 805-809.
CASH, J.N., SISTRUNK, W.A. and STUTTE, C.A. 1976. Characteristics of Concord grape polyphenol oxidase involved in juice color loss. J. Food Sci.
CASTELL-PEREZ, M. E. 1990. Evaluating the rheological properties of Power-law fluids using mixer viscometry . Ph. D. Dissertation, Michigan State University, East Lansing, MI.
CHANG, T.-C., SIDDIQ, M., SINHA, N.K. and CASH, J.N. 1994. Plum juice quality affected by enzyme treatment and fining. J. Food Sci. 59,
ECKERLE, J.R., HARVEY, C.D. and CHEN, T.S. 1984. Life cycle of canned tomato paste: correlation between sensory and instrumental testing methods. J. Food Sci. 49, 1188-1193.
389-398.
41, 1398-1402.
1065- 1069.

STORAGE EFFECTS ON STANLEY PLUM PASTES I7
ESPIE, M. 1992. Michigan agricultural statistics 1991. Michigan Agricultural Statistics Service, Lansing, MI.
EXAMA, A. and LACROIX, C. 1989. Development of a high protein fruit paste. 11. Storage stability. Sci. Aliments 9, 307-3 17. In Food Sci. Technol. Abstr. (1989) 21(12),12576.
FRANCIS, F.J. 1982. Analysis of anthocyanins. In Anthocyanins as Food Colors, (P. Markakis, ed.) pp. 182-207, Academic Press, New York.
FULEKI, T. and FRANCIS, F.J. 1968. Quantitative methods for anthocyanins. 2. Determination of total anthocyanin and degradation index for cranberry juice. J . Food Sci. 33, 78-83.
HANDWERK, R.L. and COLEMAN, R.L. 1988. Approaches to the citrus browning problem. A review. J. Agric. Food Chem. 36, 231-236.
KANUJOSO, B.W.T. and LUH, B.S. 1967. Texture, pectin, and syrup viscosity of canned cling peaches. Food Technol. 21, 457-461.
KINTNER, P.K. and VAN BUREN, J.P. 1982. Carbohydrate interference and its correction in pectin analysis using the m-hydroxydiphenyl method. J. Food Sci. 47, 756-759.
LEES, D.H. and FRANCIS, F.J. 1971. Quantitative methods for anthocyanins. 6. Flavonols and anthocyanins in cranberries. J. Food Sci. 36, 1056-1060.
MARKAKIS, P. 1982. Stability of anthocyanins in foods. In Anthocyanins as Food Colors, (P. Markakis, ed.) pp. 163-180, Academic Press, New York.
McCREADY, R.M. and McCOMB, E.A. 1952. Colorimetric determination of pectic substances. Anal. Chem. 24, 1630-1635.
O’BRIEN, J. and MORRISSEY, P.A. 1989. Nutritional and toxicological aspects of the Maillard browning reaction in foods. CRC Crit. Rev. Food Sci. Nutri. 28, 211-248.
PALAMIDIS, N. and MARKAKIS, P. 1975. Stability of grape anthocyanin in a carbonated beverage. J . Food Sci. 40, 1047-1049.
PESTKA, J.J. 1993. Food Microbiology Laborarory Manual, Dept. of Food Science and Human Nutrition, Michigan State Univ., East Lansing, MI.
POSTE, L.M., MACKIE, D.E., BULTER, G. and LARMOND, E. 1991. Laboratory Methods for Sensory Analysis of Food, Research Branch, Agric. Canada, Ottawa.
ROMMEL, A., WROLSTAD, R.E. and HEATHERBELL, D.A. 1992. Blackberry juice and wine: processing and storage effects on anthocyanin pigment composition, color and appearance. J . Food Sci. 57, 385-391.
SIDDIQ, M., ARNOLD, J.A., SINHA, N.K. and CASH, J.N. 1994. Effect of polyphenol oxidase and its inhibitors on anthocyanin changes in plum juice. J . Food Processing Preservation 18, 75-84.
SKALSKI, C. and SISTRUNK, W.A. 1973. Factors influencing color degradation in Concord grape juice. J. Food Sci. 38, 1060-1064.

18 W. WANG, M. SIDDIQ. N.K. SINHA and J.N. CASH
TIMBERLAKE, C.F. and BRIDLE, P. 1982. Distribution of anthocyanins in food plants. In Anrhocyanins as Food Colors, (P. Markakis, ed.) pp. 126-162, Academic Press, New York.
WEINERT, I.A.G., SOLMS, J. and ESCHER, F. 1989. Quality of canned plums with varying degrees of ripeness. 1. Chemical characterization of color changes. Lebensm. Wiss. Technol. 22, 307-312.
WROLSTAD, R.E., SKREDE, G. , LEA, P. and ENERSEN, G. 1990. Influence of sugar on anthocyanin pigment stability in frozen strawberries. J. Food Sci. 55, 1064-1065.