Chemical Analyses of Water from Lakes and Streams in Quttinirpaaq National Park, Nunavut Canadian...
31
Chemical Analyses of Water from Lakes and Streams in Quttinirpaaq National Park, Nunavut J.A. Babaluk, N. Gantner, W. Michaud, D.C.G. Muir, M.Power, J.D. Reist, R. Sinnatamby, and X. Wang Central and Arctic Region Fisheries and Oceans Canada 501 University Crescent Winnipeg, MB R3T 2N6 2009 Canadian Data Report of Fisheries and Aquatic Sciences 1217
Transcript of Chemical Analyses of Water from Lakes and Streams in Quttinirpaaq National Park, Nunavut Canadian...

Chemical Analyses of Water from Lakes and Streams in Quttinirpaaq National Park, Nunavut
J.A. Babaluk, N. Gantner, W. Michaud, D.C.G. Muir, M.Power, J.D. Reist, R. Sinnatamby, and X. Wang
Central and Arctic Region Fisheries and Oceans Canada 501 University Crescent Winnipeg, MB R3T 2N6
2009
Canadian Data Report of Fisheries and Aquatic Sciences 1217
Canadian Data Report of Fisheries and Aquatic Sciences
Data reports provide a medium for filing and archiving data compilations where little or no analysis is included. Such compilations commonly will have been prepared in support of other journal publications or reports. The subject matter of the series reflects the broad interests and policies of Fisheries and Oceans Canada, namely, fisheries management, technology and development, ocean sciences, and aquatic environments relevant to Canada.
Data reports are not intended for general distribution and the contents must not be referred to in other publications without prior written clearance from the issuing establishment. The correct citation appears above the abstract of each report. Each report is abstracted in the data base Aquatic Sciences and Fisheries Abstracts.
Data reports are produced regionally but are numbered nationally. Requests for individual reports will be filled by the issuing establishment listed on the front cover and title page.
Numbers 1-25 in this series were issued as Fisheries and Marine Service Data Records. Numbers 26-160 were issued as Department of Fisheries and Environment, Fisheries and Marine Service Data Reports. The current series name was changed with report number 161.
Rapport statistique canadien des sciences halieutiques et aquatiques
Les rapports statistiques servent de base à la compilation des données de classement et d'archives pour lesquelles il y a peu ou point d'analyse. Cette compilation aura d'ordinaire été préparée pour appuyer d'autres publications ou rapports. Les sujets des rapports statistiques reflètent la vaste gamme des intérêts et politiques de Pêches et Océans Canada, notamment la gestion des pêches, la technologie et le développement, les sciences océaniques et l’environnement aquatique, au Canada.
Les rapports statistiques ne sont pas préparés pour une vaste distribution et leur contenu ne doit pas être mentionné dans une publication sans autorisation écrite préalable de l'établissement auteur. Le titre exact figure au haut du résumé de chaque rapport. Les rapports à l'industrie sont résumés dans la base de données Résumés des sciences aquatiques et halieutiques.
Les rapports statistiques sont produits à l'échelon régional, mais numérotés à l'échelon national. Les demandes de rapports seront satisfaites par l'établissement d'origine dont le nom figure sur la couverture et la page du titre.
Les numéros 1 à 25 de cette série ont été publiés à titre de Records statistiques, Service des pêches et de la mer. Les numéros 26-160 ont été publiés à titre de Rapports statistiques du Service des pêches et de la mer, ministère des Pêches et de l'Environnement. Le nom de la série a été modifié à partir du numéro 161.

Canadian Data Report of Fisheries and Aquatic Sciences 1217
2009
CHEMICAL ANALYSES OF WATER FROM LAKES AND STREAMS IN QUTTINIRPAAQ NATIONAL PARK, NUNAVUT, 2001-2008
by
J.A. Babaluk, N. Gantner1, W. Michaud2, D.C.G. Muir3, M. Power2, J.D. Reist, R. Sinnatamby2, and X. Wang3
Central and Arctic Region Fisheries and Oceans Canada
501 University Crescent Winnipeg, MB R3T 2N6
1Department of Environmental Biology, University of Guelph, Guelph, ON, N1G 2W1 2Department of Biology, University of Waterloo, Waterloo, ON, N2L 3G1 3Environment Canada, 867 Lakeshore Road, Burlington, ON, L7R 4A6

©Minister of Supply and Services 2009
Cat. No. Fs 97-13/1217E ISSN 0706-6465
Correct citation for this publication is: Babaluk, J.A., Gantner, N., Michaud, W., Muir, D.C.G., Power, M., Reist, J.D., Sinnatamby, R., and
Wang, X. 2009. Chemical analyses of water from lakes and streams in Quttinirpaaq National Park, Nunavut, 2001-2008. Can. Data Rep. Fish. Aquat. Sci. 1217: v + 24 p.
ii
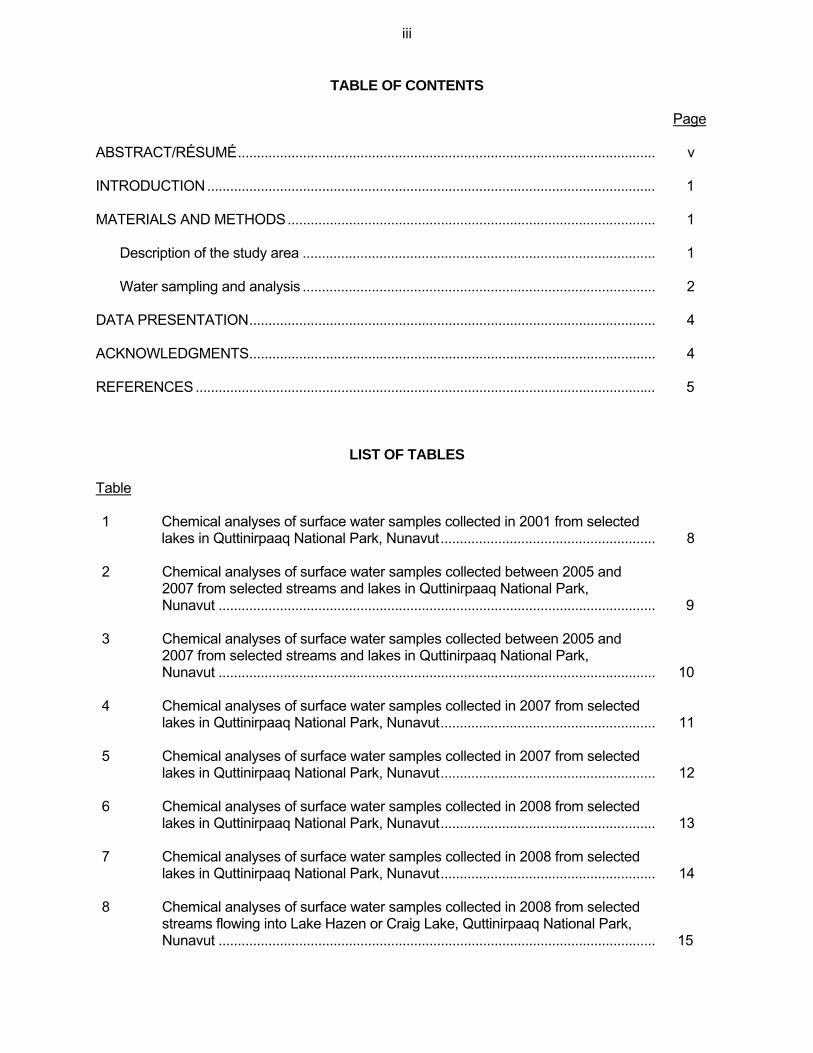
TABLE OF CONTENTS
Page ABSTRACT/RÉSUMÉ............................................................................................................. v INTRODUCTION..................................................................................................................... 1 MATERIALS AND METHODS................................................................................................ 1 Description of the study area ............................................................................................ 1 Water sampling and analysis ............................................................................................ 2 DATA PRESENTATION.......................................................................................................... 4 ACKNOWLEDGMENTS.......................................................................................................... 4 REFERENCES........................................................................................................................ 5
LIST OF TABLES
Table 1 Chemical analyses of surface water samples collected in 2001 from selected
lakes in Quttinirpaaq National Park, Nunavut........................................................ 8 2 Chemical analyses of surface water samples collected between 2005 and
2007 from selected streams and lakes in Quttinirpaaq National Park, Nunavut .................................................................................................................. 9
3 Chemical analyses of surface water samples collected between 2005 and 2007 from selected streams and lakes in Quttinirpaaq National Park, Nunavut .................................................................................................................. 10
4 Chemical analyses of surface water samples collected in 2007 from selected lakes in Quttinirpaaq National Park, Nunavut........................................................ 11
5 Chemical analyses of surface water samples collected in 2007 from selected lakes in Quttinirpaaq National Park, Nunavut........................................................ 12
6 Chemical analyses of surface water samples collected in 2008 from selected lakes in Quttinirpaaq National Park, Nunavut........................................................ 13
7 Chemical analyses of surface water samples collected in 2008 from selected lakes in Quttinirpaaq National Park, Nunavut........................................................ 14
8 Chemical analyses of surface water samples collected in 2008 from selected streams flowing into Lake Hazen or Craig Lake, Quttinirpaaq National Park, Nunavut .................................................................................................................. 15
iii
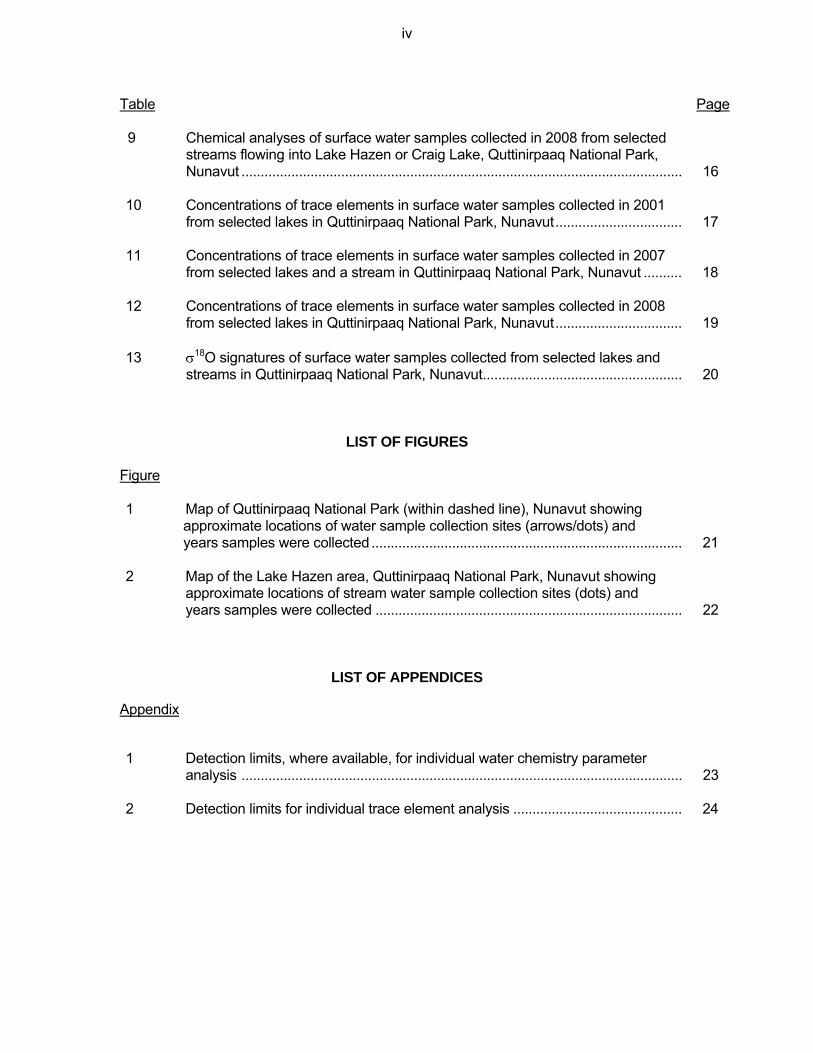
Table Page 9 Chemical analyses of surface water samples collected in 2008 from selected
streams flowing into Lake Hazen or Craig Lake, Quttinirpaaq National Park, Nunavut ................................................................................................................... 16
10 Concentrations of trace elements in surface water samples collected in 2001 from selected lakes in Quttinirpaaq National Park, Nunavut................................. 17
11 Concentrations of trace elements in surface water samples collected in 2007 from selected lakes and a stream in Quttinirpaaq National Park, Nunavut .......... 18
12 Concentrations of trace elements in surface water samples collected in 2008 from selected lakes in Quttinirpaaq National Park, Nunavut................................. 19
13 σ18O signatures of surface water samples collected from selected lakes and streams in Quttinirpaaq National Park, Nunavut.................................................... 20
LIST OF FIGURES
Figure 1 Map of Quttinirpaaq National Park (within dashed line), Nunavut showing
approximate locations of water sample collection sites (arrows/dots) and years samples were collected ................................................................................. 21
2 Map of the Lake Hazen area, Quttinirpaaq National Park, Nunavut showing approximate locations of stream water sample collection sites (dots) and years samples were collected ................................................................................ 22
LIST OF APPENDICES
Appendix 1 Detection limits, where available, for individual water chemistry parameter analysis ................................................................................................................... 23
2 Detection limits for individual trace element analysis ............................................ 24
iv

ABSTRACT Babaluk, J.A., Gantner, N., Michaud, W., Muir, D.C.G., Power, M., Reist, J.D., Sinnatamby, R., and
Wang, X. 2009. Chemical analyses of water from lakes and streams in Quttinirpaaq National Park, Nunavut, 2001-2008. Can. Data Rep. Fish. Aquat. Sci. 1217: v + 24 p.
Selected chemical data collected between 2001 and 2008 from lakes and streams in Quttinirpaaq National Park, Nunavut are tabulated. Key words: chemical elements; lake surveys; nutrients (mineral); stream surveys; trace elements;
water analysis; water chemistry.
RÉSUMÉ Babaluk, J.A., Gantner, N., Michaud, W., Muir, D.C.G., Power, M., Reist, J.D., Sinnatamby, R., and
Wang, X. 2009. Chemical analyses of water from lakes and streams in Quttinirpaaq National Park, Nunavut, 2001-2008. Can. Data Rep. Fish. Aquat. Sci. 1217: v + 24 p.
Certaines données chimiques recueillies entre 2001 et 2008, sur les lacs et ruisseaux du parc national Quttinirpaaq (Nunavut), sont présentées sous forme de tableau. Mots-clés: éléments chimiques; relevés des lacs; nutriants (élément minéral); relevés de cours
d’eau; oligoéléments; analyse de l’eau; composition chimique de l’eau.
v

INTRODUCTION
Fisheries and Oceans Canada (DFO), with the cooperation of Parks Canada, has been conducting
field research in Quttinirpaaq National Park (formerly Ellesmere Island National Park Reserve),
Nunavut since 1990. Initial research involved studies of contaminants in sediments (Muir et al.
1995) and in muscle tissue of Arctic char (Salvelinus alpinus) (Muir and Lockhart 1992; Muir and
Lockhart 1993; Gantner et al. 2009) in one of the Park’s lakes (Lake Hazen). Intermittently
between 1992 and 2008, DFO and Environment Canada personnel, along with students and staff
from the universities of Guelph and Waterloo, also conducted assessments of the char populations
within the Park, in particular Lake Hazen char (e.g., population structure, genetic and
morphological variation, life history types). Some results of these studies have been reported by
Brown Gladden et al. (1995), Reist et al. (1995), Babaluk et al. (1997, 2001, 2002), and Guiguer et
al. (2002). Babaluk et al. (2007a, b) and Gantner et al. (2009) have also summarized most of the
available biological data for char populations within the Park.
Water samples for chemical analysis were collected opportunistically in Quttinirpaaq National Park
during the course of the char studies. Babaluk et al. (1999) summarized the chemical data from
water samples between 1990-1998, adding to the existing information base on the area’s water
chemistry (Oliver and Corbett 1966; Gregor and Dahl 1990; Clark 1997; Keatley et al. 2007). This
report presents the chemical data from additional water samples collected in the Park between
2001 and 2008.
MATERIALS AND METHODS
DESCRIPTION OF THE STUDY AREA
Quttinirpaaq National Park is located at the northern end of Ellesmere Island, Nunavut (Fig. 1,
inset). The Park, with an area of 37 775 km2, is the second largest national park in Canada and is
described in detail in Parks Canada (1994). There are relatively few lakes in the Park and most are
located on the Hazen Plateau and along the coastal areas of the Grant Land Mountains (Fig. 1).
This study was confined to lakes from these two areas that either contain Arctic char populations
or were assumed to, including Lake Hazen (81° 50' N, 70° 25' W, Fig. 1). Lake Hazen is the largest
lake in the Canadian Arctic Archipelago, with a surface area of 537.5 km2 (Inland Waters
Directorate 1973) and a recorded maximum depth of 267 m (G. Köck, Austrian Academy of
1
Science, Vienna, pers. comm. 2008).
WATER SAMPLING AND ANALYSIS
Water samples were collected from the following lakes in Quttinirpaaq National Park in 2001
(unnamed lakes were assigned unofficial names based on nearby officially named topographic
features; map coordinates are given as were recorded in the field): an unnamed lake, hereafter
Clements Markham Lake (82° 38’ N, 68° 50’ W); Heintzelman Lake (81° 42’ N, 66° 56’ W); Lake
Hazen (~81° 49’ N, 71° 20’ W); an unnamed lake, hereafter Lower Beaufort Lake (81° 54’ N, 63°
17’ W); Turnabout Lake (81° 54’ N, 68° 16’ W); and an unnamed lake, hereafter Upper Beaufort
Lake (81° 54’ N, 63° 16’ W).
Water samples were collected from Lake Hazen and several adjacent streams in Quttinirpaaq
National Park in 2005 (map coordinates are given as were recorded in the field). Inflowing streams
included: Blister Creek (81° 48’ 29” N, 71° 31’ 30” W); Mesa Creek (81° 54’ 25” N, 69° 46’ 26” W);
Skeleton Creek (81° 49’ N, 71° 15’ W); and Snow Goose River (81° 50’ N, 71° 05’ W). Water was
also collected from the Ruggles River (Lake Hazen’s outlet) (81° 42’ N, 70° 25’ W).
In 2006, a single water sample was collected from Lake Hazen.
Water samples were collected from the following lakes in Quttinirpaaq National Park in 2007
(unnamed lakes were assigned unofficial “letter” names as there were no nearby officially named
topographic features; map coordinates are given as were recorded in the field): Heintzelman Lake;
an unnamed lake, hereafter Lake D (82° 06’ N, 67° 32’ W); an unnamed lake, hereafter Lake E
(81° 49’ N, 69° 26’ W); an unnamed lake, hereafter Lake F (81° 49’ N, 69° 24’ W); an unnamed
lake, hereafter Lake G (81° 50’ N, 69° 14’ W); an unnamed lake, hereafter Lake H (81° 57’ N, 69°
56’ W); and Lake Hazen.
Water samples were collected from the following lakes in Quttinirpaaq National Park in 2008
(unnamed lakes were assigned unofficial “letter” names as there were no nearby officially named
topographic features; map coordinates are given as were recorded in the field): Clements
Markham Lake (82° 37' 27" N, 68° 59' 07" W) (previously named, see above); Craig Lake (81° 51’
40” N, 68° 53’ 47” W); an unnamed lake, hereafter Lake C (82° 05' 12" N, 68° 24' 23" W); and Lake
Hazen.
.
2

Water samples were collected from the following streams flowing into either Lake Hazen or Craig
Lake in 2008 (map coordinates are given as were recorded in the field): Blister Creek; an unnamed
stream flowing into Craig Lake, hereafter Craig Creek; Cuesta Creek (81° 52’ 49” N, 70° 12’ 56”
W); an unnamed stream flowing into Lake Hazen in the vicinity of the Henrietta Nesmith Glacier,
hereafter, Henrietta Nesmith Creek (81° 45’ 45” N, 72° 22’ 14” W); Mesa Creek; an unnamed
stream flowing into Lake Hazen near Hazen Camp, hereafter Muskox Creek (81° 50’ 12” N, 71°
15’ 37” W); Ptarmigan Creek (81° 47’ 03” N, 71° 56’ 00” W); Salor Creek (81° 54’ 09” N, 68° 54’
28” W); and Traverse River (81° 40’ 45” N, 72° 02’ 25” W).
Lake and stream sampling locations including dates sampled are shown in Figs. 1 and 2,
respectively and Tables 1-13.
Water samples from the lakes were collected in acid-washed polyethylene bottles during the open-
water season by hand-dipping the samples from a boat, except for Lake Hazen in 2005 when the
samples were collected through a hole in the ice. Water samples from the streams were collected
in acid-washed polyethylene bottles during the open-water season by hand-dipping the samples
from shore. Samples for dissolved element and nutrient analyses were refrigerated after collection
and samples for trace element analyses were preserved in the field by addition of nitric acid (50%
by vol.). Water samples collected for σ18O analysis were obtained in situ by immersing a 125 mL
bottle after rinsing in local waters twice. Bottles were filled and sealed subsurface to eliminate all
atmospheric oxygen in the bottle. Bottles were stored in refrigerated, dark conditions until
analysed. The samples were transported to laboratories in Winnipeg, MB, Waterloo, ON, or
Burlington, ON for subsequent analyses.
The majority of water samples for dissolved element and nutrient analyses were analyzed at
Fisheries and Oceans Canada’s Freshwater Institute Analytical Water Chemistry Laboratory in
Winnipeg (Tables 1, 4, 5, 6, 7, 8, and 9) following the procedures of Stainton et al. (1977).
Estimates of precision for these procedures are given in Appendix 1 and Stainton et al. (1977).
Others were analyzed at Environment Canada’s Canada Centre for Inland Waters Analytical
Water Chemistry Laboratory in Burlington, ON (Tables 2 and 3). Trace elements were analyzed at
the Bodycote Testing Group Laboratory (formerly Norwest Labs) in Winnipeg by inductively
coupled plasma mass spectrometry (ICP-MS) using commercial ICP standards and NRC standard
reference materials (Tables 10, 11, and 12). Detection limits are given in Appendix 2. Analysis of
σ18O (Table 13) was conducted at the University of Waterloo Environmental Isotope Lab (UW-EIL),
with σ18O values obtained following the CO2 water equilibration method outlined in Epstein and
3
Mayeda (1953) and Fritz et al. (1987). CO2 was equilibrated with water in a 25ºC temperature
controlled bath with continuous shaking for 3 hours. CO2 was then extracted using a VG903 Dual
Inlet Isotope Mass Spectrometer to determine σ18O values. All obtained results were corrected
based on EIL-12 (sealed container of laboratory water) calibrated to the international reference
materials for VSMOW (Vienna Standard Mean Ocean Water) and SLAP (Standard Light Antarctic
Precipitation) from the International Atomic Energy Agency.
DATA PRESENTATION
Chemical data for Quttinirpaaq National Park waters collected in 2001 are presented in Tables 1
and 10; chemical data for Quttinirpaaq National Park waters collected in 2005 are presented in
Tables 2 and 3; chemical data for Quttinirpaaq National Park waters collected in 2006 are
presented in Tables 2 and 3; chemical data for Quttinirpaaq National Park waters collected in 2007
are presented in Tables 2, 3, 4, 5, 11, and 13; and chemical data for Quttinirpaaq National Park
waters collected in 2008 are presented in Tables 6, 7, 8, 9, 12, and 13.
In all tables, standard symbols are used to represent elements (Weast 1990). Other symbols and
abbreviations used in the tables are as follows: Alk. = alkalinity, Chl. A = chlorophyll A, Cond. =
conductivity, DIC = dissolved inorganic carbon, DOC = dissolved organic carbon, NH3 = ammonia,
NO3 = nitrate, NO2 = nitrite, Org. acids = organic acids, POC = particulate organic carbon, PON =
particulate organic nitrogen, SC = suspended carbon, SIO2 = silica, SN = suspended nitrogen, SO4
= sulphate, SRP = soluble reactive phosphorus, SRSi = soluble reactive silicon, TDN = total
dissolved nitrogen, TDP = total dissolved phosphorus, and TSS = total suspended solids.
ACKNOWLEDGMENTS
The work was done in part with the support of Parks Canada and Natural Resources Canada
(Polar Continental Shelf Project, Resolute). Both organizations provided logistical support. The
authors thank Debbie Iqaluk, Pilipoosie Iqaluk, Geoff Power, Alex Stubbing, and Rick Wastle for
field assistance. Rob Bajno and Jim Johnson provided constructive comments on the manuscript.
Final synthesis and write-up of this work was facilitated through the Canadian International Polar
Year project entitled, Variability and Change Effects on Chars in the Arctic, funded through Indian
and Northern Affairs Canada and Fisheries and Oceans Canada.
4
REFERENCES
Babaluk, J.A., Halden, N.M., Reist, J.D., Kristofferson, A.H., Campbell, J.L., and Teesdale, W.J.
1997. Evidence for non-anadromous behaviour of arctic charr (Salvelinus alpinus) from Lake
Hazen, Ellesmere Island, Northwest Territories, Canada, based on scanning proton
microprobe analysis of otolith strontium distribution. Arctic 50: 224-233.
Babaluk, J.A., Heuring, L.G., Reist, J.D., and Billeck, B.N. 1999. Selected chemical analyses of
water from lakes in Ellesmere Island National Park Reserve, Nunavut. Can. Data Rep. Fish.
Aquat. Sci. 1050: iv + 7 p.
Babaluk, J.A., Wissink, H.R., Troke, B.G., Clark, D.A., and Johnson, J.D. 2001. Summer
movements of radio-tagged arctic charr (Salvelinus alpinus) in Lake Hazen, Nunavut,
Canada. Arctic 54: 418-424.
Babaluk, J.A., Evans, C.L., and Reist, J.D. 2002. Micro-PIXE analysis of Arctic char, Salvelinus
alpinus, otoliths from Quttinirpaaq National Park, Nunavut. Can. Data Rep. Fish. Aquat. Sci.
1092: xiv + 143 p.
Babaluk, J.A., Sawatzky, C.D., Wastle, R.J., and Reist, J.D. 2007a. Biological data of Arctic char,
Salvelinus alpinus, from Lake Hazen, Quttinirpaaq National Park, Nunavut, 1958-2001. Can.
Data Rep. Fish. Aquat. Sci. 1197: vi + 98 p.
Babaluk, J.A., Sawatzky, C.D., Wastle, R.J., and Reist, J.D. 2007b. Biological data of Arctic char,
Salvelinus alpinus, from selected lakes in Quttinirpaaq National Park, Nunavut, 1990-2002.
Can. Data Rep. Fish. Aquat. Sci. 1196: vii + 78 p.
Brown Gladden, J.G., Postma Maiers, L.D., Carmichael, T.J., and Reist, J.D. 1995. Mitochondrial
DNA control region sequence variation in Arctic char (Salvelinus alpinus (L.)). Can. Data
Rep. Fish. Aquat. Sci. 968: iv + 18 p.
Clark, D.A. 1997. Assessment the health of the Lake Hazen ecosystem. Ecological Monitoring and
Assessment Network Third Annual Science Meeting, Saskatoon, January 21-25.
http://www.cciw.ca/eman.
5

Epstein, S., and Maydea, T. 1953. Variation of 18O content of waters from natural sources.
Geochim. Cosmochim. Ac. 4: 213-224.
Fritz, P., Drimmie, R.J., Frape, S.K., and O’Shea, O. 1987. The isotopic composition of
precipitation and groundwater in Canada. In Isotope techniques in water resources
development. International Atomic Energy Agency Symposium 299, March 1987, Vienna. pp.
539-550.
Gantner N., Power, M., Babaluk, J.A., Reist, J.D., Köck, G., Lockhart, W.L., Solomon, K.R., and
Muir, D.C.G. 2009. Temporal trends of mercury, cesium, potassium, selenium, and thallium
in Arctic char (Salvelinus alpinus) from Lake Hazen (Nunavut): effects of trophic position,
size and age. Environ. Toxicol. Chem. 28: 254-263.
Gregor, D., and Dahl, M. 1990. Final report on the 1989/1990 Lake Hazen water quality study.
Department of Canadian Heritage (Parks Canada), Winnipeg. 46 p.
Guiguer, K.R.R.A., Reist, J.D., Power, M., and Babaluk, J.A. 2002. Using stable isotopes to
confirm the trophic ecology of Arctic charr morphotypes from Lake Hazen, Nunavut, Canada.
J. Fish Biol. 60: 348-362.
Inland Waters Directorate. 1973. Inventory of Canadian freshwater lakes. Environment Canada,
Water Resources Branch. Ottawa.
Keatley, B.E., Douglas, M.S.V., and Smol, J.P. 2007. Limnological characteristics of a high arctic
oasis and comparisons across northern Ellesmere Island. Arctic 60: 294-308.
Muir, D.C.G., and Lockhart, W.L. 1992. Contaminant trends in freshwater biota. In Synopsis of
research conducted under the 1991/1992 Northern Contaminants Program. Indian and
Northern Affairs Canada, Environmental Studies Report No. 68. Ottawa. pp. 121-125.
Muir, D.C.G., and Lockhart, W.L. 1993. Contaminant trends in freshwater biota. In Synopsis of
research conducted under the 1992/1993 Northern Contaminants Program. Indian and
Northern Affairs Canada, Environmental Studies Report No. 70. Ottawa. pp. 167-173.
Muir, D.C.G., Grift, N.P., Lockhart, W.L., Wilkinson, P., Billeck, B.N., and Brunskill, G.J. 1995.
6

Spatial trends and historical profiles of organochlorine pesticides in Arctic lake sediments.
Sci. Total Environ. 160/161: 447-457.
Oliver, D.R., and Corbett, P.S.. 1966. Aquatic habitats in a High Arctic locality: the Hazen Camp
study area, Ellesmere Island, N.W.T. Defense Research Board of Canada, Ottawa. 172 p.
Parks Canada. 1994. Ellesmere Island National Park Reserve resource description and analysis.
Vol. 1 and 2. Department of Canadian Heritage, Winnipeg.
Reist, J.D., Gyselman, E., Babaluk, J.A., Johnson, J.D., and Wissink, R. 1995. Evidence for two
morphotypes of arctic char (Salvelinus alpinus) from Lake Hazen, Ellesmere Island,
Northwest Territories, Canada. Nord. J. Freshwat. Res. 71: 496-410.
Stainton, M.P., Capel, M.J., and Armstrong, F.A.J. 1977. The chemical analysis of fresh water. 2nd
ed. Can. Fish. Mar. Serv. Misc. Spec. Publ. 25: 166 p.
Weast, R.C. (ed.) 1990. Handbook of chemistry and physics. 70th edition. Boca Raton, Florida,
CRC Press, Inc.
7
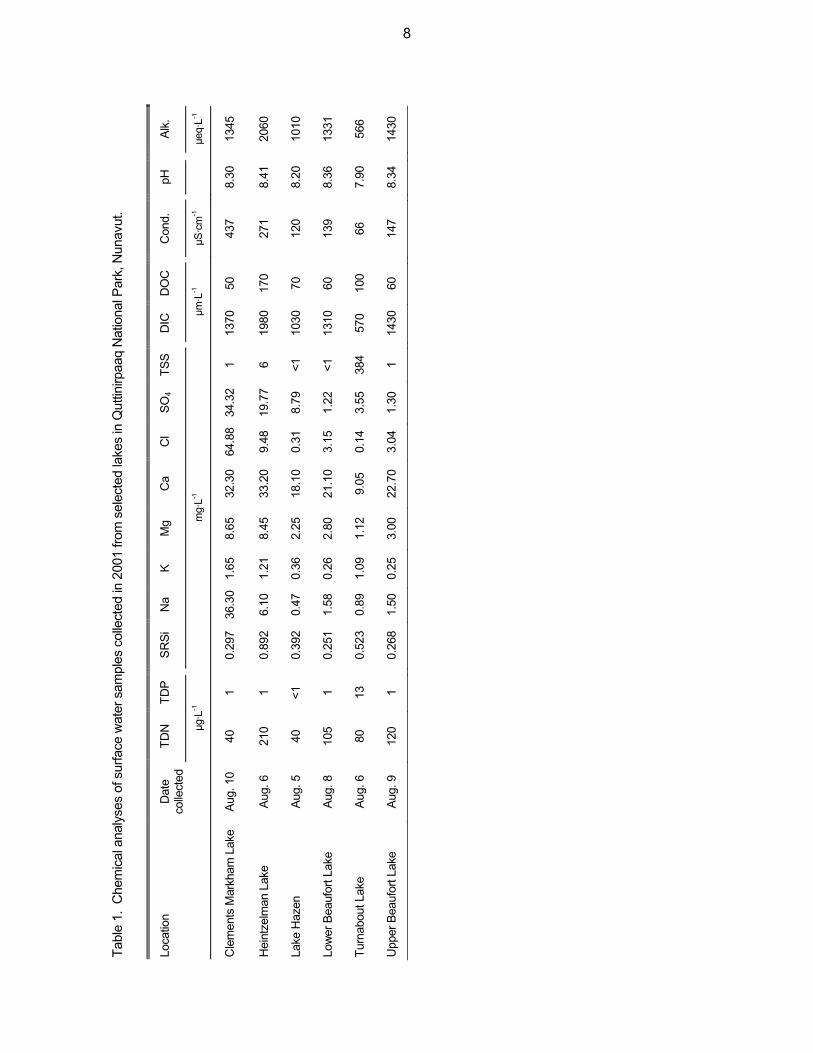
Tab
le 1
. C
hem
ical
ana
lyse
s of
sur
face
wat
er s
ampl
es c
olle
cted
in 2
001
from
sel
ecte
d la
kes
in Q
uttin
irpaa
q N
atio
nal P
ark,
Nun
avut
.
Loca
tion
D
ate
colle
cted
TD
NT
DP
SR
Si
Na
KM
gC
aC
lS
O4
TS
SD
ICD
OC
Con
d.pH
Alk
.
µg·L
-1m
g·L-1
µm·L
-1µS
·cm
-1
µeq·
L-1
Cle
men
ts M
arkh
am L
ake
Aug
. 10
40
1 0.
297
36.3
01.
65
8.65
32
.30
64.8
8 34
.32
1 13
70
50
437
8.30
1345
Hei
ntze
lman
Lak
e A
ug. 6
21
0 1
0.89
2 6.
101.
21
8.45
33
.20
9.48
19
.77
6 19
80
170
271
8.41
2060
Lake
Haz
en
Aug
. 5
40
<1
0.39
2 0.
470.
36
2.25
18
.10
0.31
8.
79
<1
1030
70
12
0 8.
2010
10
Low
er B
eauf
ort L
ake
Aug
. 8
105
1 0.
251
1.58
0.26
2.
80
21.1
0 3.
15
1.22
<1
13
10
60
139
8.36
1331
Tur
nabo
ut L
ake
Aug
. 6
80
13
0.52
3 0.
891.
09
1.12
9.
05
0.14
3.
55
384
570
100
66
7.90
566
Upp
er B
eauf
ort L
ake
Aug
. 9
120
1 0.
268
1.50
0.25
3.
00
22.7
0 3.
04
1.30
1
1430
60
14
7 8.
3414
30
8

Tab
le 2
. C
hem
ical
ana
lyse
s of
sur
face
wat
er s
ampl
es c
olle
cted
bet
wee
n 20
05 a
nd 2
007
from
sel
ecte
d st
ream
s an
d la
kes
in Q
uttin
irpaa
q N
atio
nal
Par
k, N
unav
ut. C
= c
orre
cted
(deg
rada
tion
prod
uct,
pheo
phyt
in, s
ubtra
cted
), U
F =
unf
ilter
ed, F
= fi
ltere
d.
Loca
tion
Dat
e C
hl. A
co
llect
ed
Chl
. A
(C)
NO
3NO
2
(UF
) N
O3N
O2
(F)
NO
2
(UF
) N
O2
(F)
NH
3
(UF
) N
H3
(F)
Cl
SO
4D
OC
DIC
µg·L
-1m
g·L-1
Blis
ter C
reek
Ju
ne 8
, 200
5 <0
.1
<0.1
0.13
1 0.
069
0.00
2 0.
004
0.00
5 <0
.005
0.
76
33.1
0 4.
3 10
.3
Lake
Haz
en
June
5, 2
005
<0.1
na
0.03
5 0.
049
0.00
2 0.
002
<0.0
05
0.02
2 0.
30
10.7
0 0.
6 13
.8
Lake
Haz
en
June
6, 2
005
<0.1
<0
.1
0.
042
0.03
9 0.
003
0.00
2 0.
006
<0.0
05
0.31
11
.00
0.9
14.4
Lake
Haz
en
June
9, 2
005
<0.1
<0
.1
0.
034
0.03
7 0.
004
0.00
2 0.
005
<0.0
05
0.30
10
.70
0.6
14.1
Mes
a C
reek
Ju
ne 6
, 200
5 4.
9 <0
.1
0.
230
0.17
7 0.
003
0.01
0 0.
008
0.00
7 1.
13
157.
00
8.0
10.0
Rug
gles
Riv
er
June
11,
200
5 <0
.1
<0.1
0.03
5 0.
049
0.00
2 0.
004
<0.0
05
<0.0
05
0.34
10
.70
0.7
14.0
Ske
leto
n C
reek
Ju
ne 8
, 200
5 1.
4 1.
7
0.19
3 0.
066
0.00
4 0.
007
0.01
1 0.
016
1.24
69
.10
12.1
15
.7
Sno
w G
oose
Riv
er
June
7, 2
005
1.7
<0.1
0.20
8 0.
083
0.00
2 0.
005
0.01
0 0.
008
1.28
83
.60
8.2
14.0
Lake
Haz
en
Aug
ust 3
, 200
6 0.
8 na
0.02
3 0.
032
0.00
3 0.
004
0.00
5 0.
005
0.18
9.
23
0.5
11.5
Lake
D
July
28,
200
7 1.
2 0.
8
0.00
5 0.
020
0.00
4 0.
009
0.02
2 <0
.005
0.48
1.22
2.8
9.5
Lake
G
July
27,
200
7 1.
0 0.
8
<0.0
05
0.00
8 0.
003
0.00
3 <0
.005
<0
.005
2.
09
20.5
0 1.
6 31
.6
Hei
ntze
lman
Lak
e Ju
ly 2
6, 2
007
2.0
1.4
0.
020
0.03
1 0.
004
0.00
4 0.
012
<0.0
05
11.2
0 28
.40
2.2
25.2
Lake
Haz
en
July
31,
200
7 1.
0 <0
.1
0.
028
0.03
5 0.
004
0.00
3 <0
.005
<0
.005
0.
16
8.64
0.
6 11
.5
9

Tab
le 3
. C
hem
ical
ana
lyse
s of
sur
face
wat
er s
ampl
es c
olle
cted
bet
wee
n 20
05 a
nd 2
007
from
sel
ecte
d st
ream
s an
d la
kes
in Q
uttin
irpaa
q N
atio
nal
Par
k, N
unav
ut. U
F =
unf
ilter
ed, F
= fi
ltere
d.
Loca
tion
Dat
e C
a co
llect
ed
(UF
) M
g (U
F)
K
(UF
) N
a (U
F)
PO
CP
ON
SIO
2
(UF
) S
RP
(U
F)
SR
P
(F)
TD
N
(UF
) T
DN
(F
) T
DP
(U
F)
TD
P
(F)
mg·
L-1
Blis
ter C
reek
Ju
ne 8
, 200
5 24
.5
2.41
1.
14
0.75
0.
754
0.08
0 1.
94
0.00
64
0.00
09
0.38
6 0.
265
0.03
71
0.00
57
Lake
Haz
en
June
5, 2
005
22.6
2.
55
0.42
0.
56
0.05
3 <0
.002
0.
96
0.00
03
0.00
10
0.07
0 0.
174
<0.0
005
0.00
82
Lake
Haz
en
June
6, 2
005
23.3
2.
61
0.43
0.
59
0.05
0 0.
003
1.00
0.
0004
0.
0005
0.
073
0.08
5 <0
.000
5 0.
0017
Lake
Haz
en
June
9, 2
005
22.7
2.
53
0.42
0.
57
0.04
5 0.
003
0.95
0.
0003
0.
0004
0.
079
0.07
8 <0
.000
5 0.
0007
Mes
a C
reek
Ju
ne 6
, 200
5 48
.6
14.6
0 3.
86
7.31
13
.500
0.
705
2.25
0.
0048
0.
0012
0.
824
0.50
8 0.
2360
na
Rug
gles
Riv
er
June
11,
200
5 22
.5
2.56
0.
42
0.58
0.
048
<0.0
02
0.97
0.
0003
0.
0005
0.
081
0.07
7 0.
0006
0.
0015
Ske
leto
n C
reek
Ju
ne 8
, 200
5 37
.2
8.59
3.
35
3.80
2.
630
0.24
8 2.
90
0.01
01
0.00
12
0.80
7 0.
572
0.07
20
0.01
48
Sno
w G
oose
Riv
er
June
7, 2
005
43.7
7.
42
2.58
3.
33
5.72
0 0.
505
2.32
0.
0079
0.
0012
0.
783
0.41
1 0.
3390
0.
0112
Lake
Haz
en
Aug
. 3, 2
006
18.2
2.
06
0.32
0.
45
0.13
8 0.
0100
0.
75
0.00
05
0.00
08
0.05
4 0.
058
0.00
21
0.00
21
Lake
D
July
28,
200
7 12
.4
1.66
0.
61
0.45
0.
254
0.03
1 0.
65
0.00
16
0.00
03
0.21
7 0.
202
0.01
32
0.00
43
Lake
G
July
27,
200
7 38
.3
12.5
0 2.
84
2.70
0.
306
0.01
5 2.
66
0.00
10
0.00
04
0.09
6 0.
103
0.00
40
0.00
31
Hei
ntze
lman
Lak
e Ju
ly 2
6, 2
007
37.7
9.
21
1.27
6.
83
0.18
8 0.
024
2.08
0.
0011
0.
0010
0.
153
0.15
6 0.
0078
0.
0035
Lake
Haz
en
July
31,
200
7 18
.3
2.03
0.
32
0.50
0.
095
0.01
0 0.
74
<0.0
002
0.00
02
0.05
6 0.
063
0.00
12
0.00
18
10

Table 4. Chemical analyses of surface water samples collected in 2007 from selected lakes in Quttinirpaaq National Park, Nunavut.
Location Date collected Na K Ca Mg TSS Cl SO4 Cond. pH Alk.
mg·L-1 µS·cm-1
µeq·L-1
Heintzelman Lake
July 26 6.72 1.25 37.20 9.10 1 10.23 27.98 293 7.67 2075
Lake D July 28 0.47 0.64 12.60 1.71 <1 0.63 1.26 83 7.35 832
Lake E July 28 3.02 2.99 36.60 13.50 14 2.69 18.52 305 8.10 2945
Lake F* July 28 3.41 3.34 33.90 14.40 1 3.14 16.32 296 8.16 2806
Lake F* July 29 3.44 3.36 33.90 14.70 <1 2.44 17.88 297 8.12 2967
Lake G July 27 2.62 2.75 37.20 11.80 <1 2.14 20.66 291 8.10 2646
Lake H July 29 2.57 3.28 25.30 8.15 1 1.78 3.44 205 7.73 2007
Lake Hazen, off Blister Creek
Aug. 5 0.51 0.36 19.40 2.25 2 0.24 9.08 124 7.40 985
* replicate sample.
11

Table 5. Chemical analyses of surface water samples collected in 2007 from selected lakes in Quttinirpaaq National Park, Nunavut.
Location Date collected NO3 NO2 TDN TDP SN SC DIC DOC
µg·L-1 µm·L-1
Heintzelman Lake
July 26 12 1 144 1 24 250 2459 212
Lake D July 28 <1 4 180 2 78 220 905 268
Lake E July 28 1 <1 138 1 46 570 3142 244
Lake F* July 28 1 <1 100 1 24 250 3102 201
Lake F* July 29 <1 <1 111 1 10 210 3125 217
Lake G July 27 1 <1 91 <1 16 200 2965 190
Lake H July 29 <1 <1 561 2 30 320 2344 738
Lake Hazen, off Blister Creek
Aug. 5 28 <1 39 <1 12 270 1185 92
* replicate sample.
12

Tab
le 6
. Che
mic
al a
naly
ses
of s
urfa
ce w
ater
sam
ples
col
lect
ed in
200
8 fro
m s
elec
ted
lake
s in
Qut
tinirp
aaq
Nat
iona
l Par
k, N
unav
ut.
Lo
catio
n
Dat
e S
RS
ico
llect
ed
Na
KC
aM
gT
SS
Fe
Cl
SO
4C
ond.
pHA
lk.
mg·
L-1
µS·c
m-1
µeq·
L-1
Cle
men
ts M
arkh
am
Lake
A
ug. 8
0.31
844
.50
2.14
37.2
09.
801
<0.0
174
.09
44.1
950
47.
9514
63
Cra
ig L
ake
Aug
. 6
1.14
0 4.
44
2.44
44
.20
16.3
0 12
0.
02
2.47
56
.65
34
3
8.18
2622
Lake
C
Aug
. 4
0.62
3 1.
17
0.96
28
.60
3.60
<1
<0
.01
0.78
2.
08
15
8
7.95
1745
Lake
Haz
en, o
ff H
azen
Cam
p A
ug. 1
30.
400
0.57
0.42
21.2
02.
403
0.02
0.25
10.4
011
37.
7310
67
Lake
Haz
en, o
ff P
tarm
igan
Cre
ek
Aug
. 13
0.40
20.
570.
4222
.00
2.30
20.
020.
2711
.10
117
7.77
1061
13

Table 7. Chemical analyses of surface water samples collected in 2008 from selected lakes in Quttinirpaaq National Park, Nunavut.
Location Date collected
NO3 NO2 TDN TDP SN SC DIC DOC
µg·L-1 µm·L-1
Clements Markham Lake
Aug. 8 <1 63 75 1 44 210 1628 91
Craig Lake Aug. 6 32 <1 136 2 44 470 2810 277
Lake C Aug. 4 <1 <1 154 2 27 260 1902 243
Lake Hazen, off Hazen Camp
Aug. 13 27 <1 67 1 6 140 1164 62
Lake Hazen, off Ptarmigan Creek
Aug. 13 28 <1 52 <1 20 150 1164 52
14

Tab
le 8
. C
hem
ical
ana
lyse
s of
sur
face
wat
er s
ampl
es c
olle
cted
in 2
008
from
sel
ecte
d st
ream
s flo
win
g in
to L
ake
Haz
en o
r Cra
ig L
ake,
Qut
tinirp
aaq
Nat
iona
l Par
k, N
unav
ut.
Loca
tion
Dat
e S
RS
ico
llect
ed
Na
KC
aM
gT
SS
Fe
Cl
SO
4C
ond.
pHA
lk.
mg·
L-1
µS·c
m-1
µeq·
L-1
Blis
ter C
reek
A
ug. 1
2 0.
687
1.60
0.
78
69.6
0 5.
00
3 0.
02
0.68
15
7.59
400
7.
62
81
5
Cra
ig C
reek
A
ug. 6
1.
590
2.65
2.
82
65.6
0 18
.90
50
0.05
3.
13
54.1
4
419
8.
15
36
35
Cue
sta
Cre
ek
Aug
. 10
0.87
7 1.
19
0.52
28
.60
3.60
2
<0.0
1 0.
70
95.4
6
289
7.
78
10
52
Hen
tietta
Nes
mith
C
reek
A
ug. 5
0.68
90.
980.
7863
.60
3.50
30.
020.
5010
4.90
332
7.87
1343
Mes
a C
reek
A
ug. 7
0.
348
0.49
0.
24
20.2
0 1.
63
11
<0.0
1 0.
19
34.0
2
118
7.
31
47
9
Mus
kox
Cre
ek
Aug
. 1
1.93
0 2.
05
1.19
69
.30
11.6
0 20
0.
09
0.58
13
4.00
429
8.
00
18
18
Pta
rmig
an C
reek
A
ug. 1
1 0.
738
2.69
0.
93
99.2
0 7.
20
7 <0
.01
1.00
23
8.32
550
7.
70
99
5
Sal
or C
reek
A
ug. 3
1.
150
4.58
2.
40
43.8
0 16
.60
1 0.
02
2.59
56
.29
34
7
8.16
2674
Tra
vers
e R
iver
A
ug. 4
1.
130
1.87
0.
91
54.9
0 12
.90
3 <0
.01
2.98
54
.09
35
7
8.13
2753
15
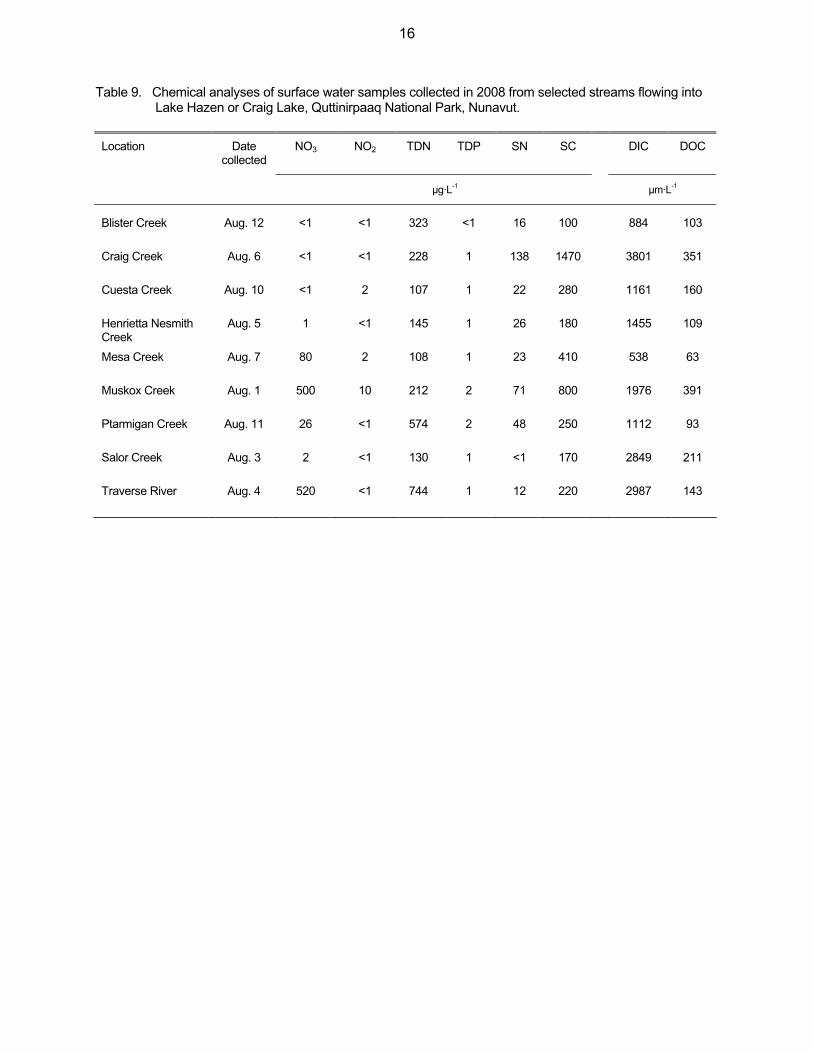
Table 9. Chemical analyses of surface water samples collected in 2008 from selected streams flowing into Lake Hazen or Craig Lake, Quttinirpaaq National Park, Nunavut.
Location Date collected
NO3 NO2 TDN TDP SN SC DIC DOC
µg·L-1 µm·L-1
Blister Creek Aug. 12 <1 <1 323 <1 16 100 884 103
Craig Creek Aug. 6 <1 <1 228 1 138 1470 3801 351
Cuesta Creek Aug. 10 <1 2 107 1 22 280 1161 160
Henrietta Nesmith Creek
Aug. 5 1 <1 145 1 26 180 1455 109
Mesa Creek Aug. 7 80 2 108 1 23 410 538 63
Muskox Creek Aug. 1 500 10 212 2 71 800 1976 391
Ptarmigan Creek Aug. 11 26 <1 574 2 48 250 1112 93
Salor Creek Aug. 3 2 <1
130 1 <1 170 2849 211
Traverse River Aug. 4 520 <1 744 1 12 220 2987 143
16

Table 10. Concentrations of trace elements in surface water samples collected in 2001 from selected lakes in Quttinirpaaq National Park, Nunavut. Collection dates are in parentheses. All values in mg·L-1.
Element Location
Clements Markham
Lake (Aug. 10)
Heintzelman Lake
(Aug. 6)
Lake Hazen
(Aug. 5)
Lower Beaufort
Lake (Aug. 8)
Turnabout Lake
(Aug. 6)
Upper Beaufort
Lake (Aug. 9)
Aluminum (Al) 0.078 0.406 0.063 0.071 11.2 0.134
Antimony (Sb) <0.006 <0.006 0.008 <0.006 <0.010 <0.006
Arsenic (As) <0.01 <0.01 <0.01 <0.01 <0.02 <0.01
Barium (Ba) 0.0170 0.0233 0.0111 0.0038 0.112 0.0040
Beryllium (Be) <0.0006 <0.0006 <0.0006 <0.0006 <0.001 <0.0006
Bismuth (Bi) <0.008 <0.008 <0.008 <0.008 <0.01 <0.008
Boron (B) 0.008 0.004 <0.002 <0.002 0.025 <0.002
Cadmium (Cd) <0.0006 <0.0006 <0.0006 <0.0006 <0.001 <0.0006
Calcium (Ca) 33.2 33.7 19.1 22.2 11.6 23.8
Chromium (Cr) <0.0009 <0.0009 <0.0009 <0.0009 0.012 <0.0009
Cobalt (Co) <0.0008 <0.0008 <0.0008 <0.0008 0.0050 <0.0008
Copper (Cu) <0.001 0.002 <0.001 <0.001 0.014 <0.001
Iron (Fe) 0.034 0.333 0.025 0.044 11.5 0.088
Lead (Pb) <0.002 <0.002 <0.002 <0.002 0.009 <0.002
Lithium (Li) 0.003 0.003 0.002 <0.001 0.016 0.001
Magnesium (Mg) 8.61 8.54 2.14 2.77 3.02 2.98
Manganese (Mn) 0.0010 0.0054 0.0002 0.0016 0.124 0.0026
Molybdenum (Mo) <0.001 <0.001 <0.001 <0.001 <0.002 <0.001
Nickel (Ni) <0.001 0.002 <0.001 <0.001 0.009 <0.001
Phosphorus (P) <0.03 <0.03 <0.03 <0.03 0.24 <0.03
Potassium (K) 1.5 1.3 <0.4 <0.4 4.9 <0.4
Selenium (Se) 0.009 0.029 0.018 0.018 0.018 0.022
Silicon (Si) 0.416 1.78 0.501 0.357 21.5 0.489
Silver (Ag) <0.001 <0.001 <0.001 <0.001 <0.002 <0.001
Sodium (Na) 36.2 5.7 0.5 1.7 1.1 1.5
Strontium (Sr) 0.192 0.131 0.0950 0.0367 0.0684 0.0392
Sulfur (S) 12.9 7.01 2.86 0.502 1.41 0.507
Thallium (Tl) 0.005 <0.004 <0.004 <0.004 <0.008 <0.004
Tin (Sn) <0.003 <0.003 <0.003 0.003 0.011 <0.003
Titanium (Ti) <0.0004 0.0136 <0.0004 0.0019 0.319 0.0009
Vanadium (V) <0.001 0.001 0.002 0.002 0.020 0.002
Zinc (Zn) 0.0048 0.0036 0.0049 0.0064 0.0366 0.0068
17
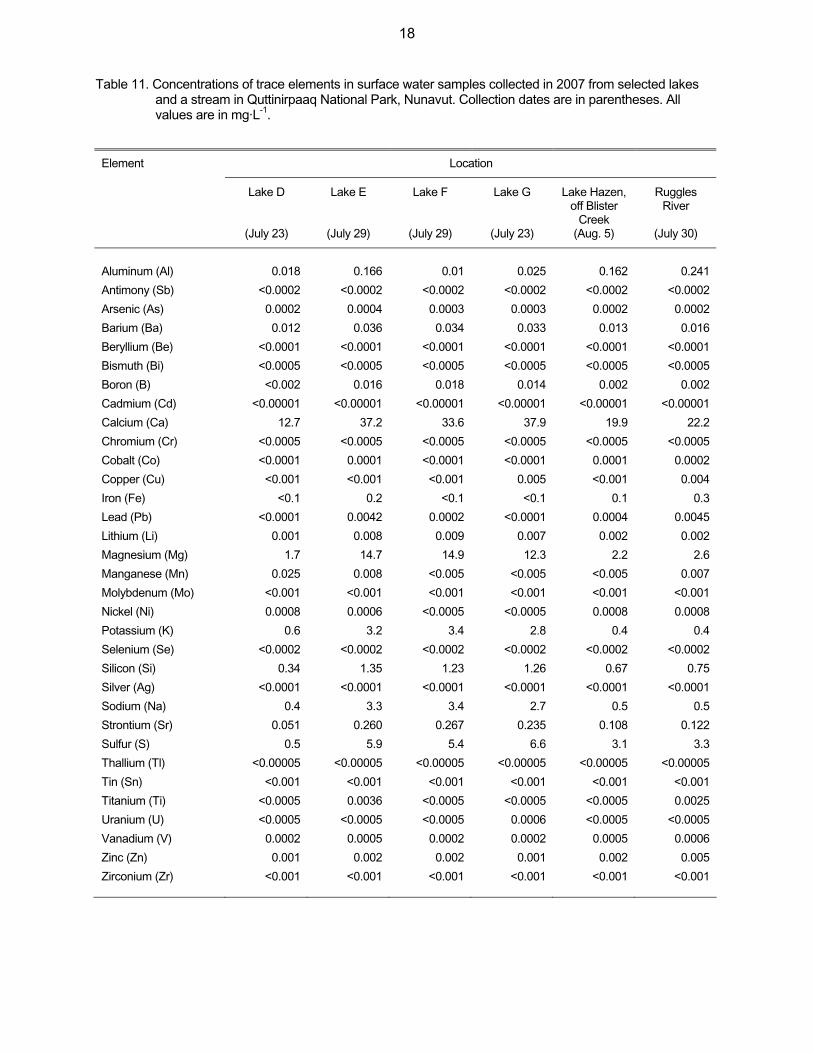
Table 11. Concentrations of trace elements in surface water samples collected in 2007 from selected lakes and a stream in Quttinirpaaq National Park, Nunavut. Collection dates are in parentheses. All values are in mg·L-1.
Element Location
Lake D
(July 23)
Lake E
(July 29)
Lake F
(July 29)
Lake G
(July 23)
Lake Hazen, off Blister
Creek (Aug. 5)
Ruggles River
(July 30)
Aluminum (Al) 0.018 0.166 0.01 0.025 0.162 0.241
Antimony (Sb) <0.0002 <0.0002 <0.0002 <0.0002 <0.0002 <0.0002
Arsenic (As) 0.0002 0.0004 0.0003 0.0003 0.0002 0.0002
Barium (Ba) 0.012 0.036 0.034 0.033 0.013 0.016
Beryllium (Be) <0.0001 <0.0001 <0.0001 <0.0001 <0.0001 <0.0001
Bismuth (Bi) <0.0005 <0.0005 <0.0005 <0.0005 <0.0005 <0.0005
Boron (B) <0.002 0.016 0.018 0.014 0.002 0.002
Cadmium (Cd) <0.00001 <0.00001 <0.00001 <0.00001 <0.00001 <0.00001
Calcium (Ca) 12.7 37.2 33.6 37.9 19.9 22.2
Chromium (Cr) <0.0005 <0.0005 <0.0005 <0.0005 <0.0005 <0.0005
Cobalt (Co) <0.0001 0.0001 <0.0001 <0.0001 0.0001 0.0002
Copper (Cu) <0.001 <0.001 <0.001 0.005 <0.001 0.004
Iron (Fe) <0.1 0.2 <0.1 <0.1 0.1 0.3
Lead (Pb) <0.0001 0.0042 0.0002 <0.0001 0.0004 0.0045
Lithium (Li) 0.001 0.008 0.009 0.007 0.002 0.002
Magnesium (Mg) 1.7 14.7 14.9 12.3 2.2 2.6
Manganese (Mn) 0.025 0.008 <0.005 <0.005 <0.005 0.007
Molybdenum (Mo) <0.001 <0.001 <0.001 <0.001 <0.001 <0.001
Nickel (Ni) 0.0008 0.0006 <0.0005 <0.0005 0.0008 0.0008
Potassium (K) 0.6 3.2 3.4 2.8 0.4 0.4
Selenium (Se) <0.0002 <0.0002 <0.0002 <0.0002 <0.0002 <0.0002
Silicon (Si) 0.34 1.35 1.23 1.26 0.67 0.75
Silver (Ag) <0.0001 <0.0001 <0.0001 <0.0001 <0.0001 <0.0001
Sodium (Na) 0.4 3.3 3.4 2.7 0.5 0.5
Strontium (Sr) 0.051 0.260 0.267 0.235 0.108 0.122
Sulfur (S) 0.5 5.9 5.4 6.6 3.1 3.3
Thallium (Tl) <0.00005 <0.00005 <0.00005 <0.00005 <0.00005 <0.00005
Tin (Sn) <0.001 <0.001 <0.001 <0.001 <0.001 <0.001
Titanium (Ti) <0.0005 0.0036 <0.0005 <0.0005 <0.0005 0.0025
Uranium (U) <0.0005 <0.0005 <0.0005 0.0006 <0.0005 <0.0005
Vanadium (V) 0.0002 0.0005 0.0002 0.0002 0.0005 0.0006
Zinc (Zn) 0.001 0.002 0.002 0.001 0.002 0.005
Zirconium (Zr) <0.001 <0.001 <0.001 <0.001 <0.001 <0.001
18

Table 12. Concentrations of trace elements in surface water samples collected in 2008 from selected lakes in Quttinirpaaq National Park, Nunavut. Collection dates are in parentheses. All values are in mg·L-1.
Element Location
Clements Markham Lake*
(Aug. 8)
Clements Markham Lake*
(Aug. 11)
Lake C
(Aug. 4)
Lake Hazen, off Hazen Camp
(Aug. 13)
Aluminum (Al) 0.031 0.020 0.008 0.067
Antimony (Sb) <0.0002 <0.0002 <0.0002 <0.0002
Arsenic (As) <0.0002 <0.0002 0.0002 <0.0002
Barium (Ba) 0.020 0.020 0.009 0.013
Beryllium (Be) <0.0001 <0.0001 <0.0001 <0.0001
Bismuth (Bi) <0.0005 <0.0005 <0.0005 <0.0005
Boron (B) 0.017 0.017 0.005 0.003
Cadmium (Cd) 0.00002 <0.00001 <0.00001 <0.00001
Calcium (Ca) 37.9 38.5 29.8 21.4
Chromium (Cr) 0.0006 <0.0005 <0.0005 <0.0005
Cobalt (Co) <0.0001 <0.0001 <0.0001 <0.0001
Copper (Cu) <0.001 <0.001 <0.001 <0.001
Iron (Fe) <0.05 <0.005 <0.05 0.07
Lead (Pb) 0.0003 <0.0001 <0.0001 0.0001
Lithium (Li) 0.003 0.003 0.002 0.002
Magnesium (Mg) 9.8 9.9 3.5 2.3
Manganese (Mn) <0.005 <0.005 <0.005 <0.005
Molybdenum (Mo) <0.001 <0.001 <0.001 <0.001
Nickel (Ni) <0.0005 <0.0005 <0.0005 0.0005
Potassium (K) 1.7 1.7 0.8 <0.4
Selenium (Se) <0.0002 <0.0002 <0.0002 <0.0002
Silicon (Si) 0.32 0.32 0.58 0.48
Silver (Ag) <0.00001 <0.00001 <0.00001 <0.00001
Sodium (Na) 44.8 45.3 1.1 0.5
Strontium (Sr) 0.240 0.248 0.098 0.112
Sulfur (S) 13.5 13.7 0.8 3.2
Thallium (Tl) <0.00005 <0.00005 <0.00005 <0.00005
Tin (Sn) <0.001 <0.001 <0.001 <0.001
Titanium (Ti) 0.0027 0.0022 <0.0005 0.0016
Uranium (U) 0.0006 0.0006 <0.0005 <0.0005
Vanadium (V) <0.0001 <0.0001 0.0001 0.0002
Zinc (Zn) 0.002 <0.001 <0.001 <0.001
Zirconium (Zr) <0.001 <0.001 <0.001 <0.001
*replicate sample.
19

Table 13. σ18O signatures of surface water samples collected from selected lakes and streams in Quttinirpaaq National Park, Nunavut. σ18O are in parts per mil (‰) relative to the international reference standard Vienna Standard Mean Ocean Water (VSMOW).
Location Date collected σ18O
VSMOW
Lake D July 23, 2007 -23.84
Lake E July 29, 2007 -20.21
Lake F July 29, 2007 -19.01
Lake F* July 29, 2007 -20.81
Lake G July 23, 2007 -21.54
Lake Hazen Aug. 5, 2007 -28.04
Clements Markham Lake Aug. 8, 2008 -28.59
Clements Markham Lake* Aug. 8, 2008 -28.50
Craig Lake Aug. 6, 2008 -22.17
Lake C Aug. 4, 2008 -23.36
Lake Hazen, off Hazen Camp Aug. 13, 2008 -28.38
Lake Hazen, off Ptarmigan Creek Aug. 13, 2008 -28.23
Blister Creek Aug. 12, 2008 -26.25
Craig Creek Aug.6, 2008 -19.79
Cuesta Creek Aug. 10, 2008 -26.03
Henrietta Nesmith Creek Aug. 5, 2008 -26.31
Mesa Creek Aug. 7, 2008 -26.22
Mesa Creek* Aug. 7, 2008 -26.19
Muskox Creek Aug. 1, 2008 -25.70
Ptarmigan Creek Aug. 11, 2008 -26.20
Ptarmigan Creek* Aug. 11, 2008 -26.13
Salor Creek Aug. 3, 2008 -21.77
Traverse River Aug. 4, 2008 -25.97
* replicate sample.
20

Fig
ure
1. M
ap o
f Q
uttin
irpaaq N
atio
nal P
ark
(w
ithin
dash
ed li
ne),
Nunavu
t sh
ow
ing a
ppro
xim
ate
loca
tions
of w
ate
r sa
mple
colle
ctio
n s
ites
(arr
ow
s/dots
) and y
ears
sam
ple
s w
ere
colle
cted.
Qu
ttin
irpa
aq
Na
tion
al
Pa
rk
Arc
tic
Oce
an
Elle
sm
ere
Isla
nd
Cle
me
nts
Ma
rkh
am
La
ke
(20
01
, ‘0
8)
L
ake
C(2
00
8)
La
ke
D(2
00
7)
La
ke
H(2
00
7)
La
ke
s E
, F
& G
(2
00
7)
La
ke
Ha
zen
(20
01
, ‘0
5,
‘06
, ‘0
7, ‘0
8)
Cra
ig
La
ke
(20
08
)
Turn
ab
ou
tL
ake
(2
00
1)
He
intz
elm
an
La
ke
(2
00
1, ‘0
7)
Lo
we
rB
ea
ufo
rtL
ake
(2
00
1)
Up
pe
rB
ea
ufo
rtL
ake
(2
00
1)
400
40K
m
N
EW
S
85
°80
°
75
°65
°
75
°70
°65
°
82
°
81
°
81
°
82
°
83
°
70
°80
°
Gra
nt L
and
Mou
ntai
ns
Haz
en P
late
au
21

Fig
ure
2. M
ap o
f th
e L
ake
Haze
n a
rea, Q
uttin
irpaaq N
atio
nal P
ark
, N
unavu
t sh
ow
ing a
ppro
xim
ate
loca
tions
of st
ream
w
ate
r sa
mple
colle
ctio
n s
ites
(dots
) and y
ears
sam
ple
s w
ere
colle
cted.
01
02
03
0
Km
Sno
w
Goo
seR
iver
(20
05
)S
kele
ton
Tra
vers
eR
iver
Lake
Haz
en
Cu
est
aC
ree
k
Ch
an
dle
rF
iord
Salo
r C
ree
k
Cra
igC
ree
k
Rug
gles
Riv
er
He
nrie
tta
Ne
sm
ith
Cre
ek
Me
sa C
ree
k
(20
08
)
(20
08
)
(20
05
)Mu
skox
Cre
ek
(20
08
)B
liste
r C
ree
k(2
00
5,
‘08
)
(20
05
, ‘0
8)
(20
08
)(2
00
8)
(20
08
)
(20
07
)
(20
05
)
Pta
rmig
an
Cre
ek
(20
08
)
Cre
ek
22

Appendix 1. Detection limits, where available, for individual water chemistry parameter analysis parameter as provided by Fisheries and Oceans Canada, Arctic and Freshwater Institute Analytical Water Chemistry Laboratory, Winnipeg, MB (C. Anema, pers. comm. 2008).
Parameter Detection limit Units
NO3 0.8 µg·L-1
NO2 0.6 µg·L-1
SN 0.15 µg·L-1
TDN 9 µg·L-1
TDP 1 µg·L-1
DIC 29 µm·L-1
DOC 9.5 µm·L-1
SC 1 µg·L-1
SP na na
Alk. na µeq·L-1
SRSi na mg·L-1
Cl 0.05 mg·L-1
SO4 0.03 mg·L-1
TSS 0.1 mg·L-1
Cond. 1.2 µS·cm-1
Na 0.01 mg·L-1
K 0.01 mg·L-1
Mg 0.001 mg·L-1
Mn na na
Ca 0.045 mg·L-1
Fe na mg·L-1
pH na na
23

Appendix 2. Detection limits for individual trace element analysis (inductively-coupled plasma mass spectrometry method) as provided by Bodycote Testing Group (formerly Norwest Labs), Winnipeg, MB. All values in mg·L-1.
Element Analysis Year
2001 2007 2008
Aluminum (Al) 0.009 0.005 0.005
Antimony (Sb) 0.006 0.0002 0.0002
Arsenic (As) 0.01 0.0002 0.0002
Barium (Ba) 0.0002 0.001 0.001
Beryllium (Be) 0.0006 0.0001 0.0001
Bismuth (Bi) 0.008 0.0005 0.0005
Boron (B) 0.002 0.002 0.002
Cadmium (Cd) 0.0006 0.00001 0.00001
Calcium (Ca) 0.2 0.2 0.2
Chromium (Cr) 0.0009 0.0005 0.0005
Cobalt (Co) 0.0008 0.0001 0.0001
Copper (Cu) 0.001 0.001 0.001
Iron (Fe) 0.003 0.1 0.05
Lead (Pb) 0.002 0.0001 0.0001
Lithium (Li) 0.001 0.001 0.001
Magnesium (Mg) 0.06 0.1 0.1
Manganese (Mn) 0.0002 0.1 0.005
Molybdenum (Mo) 0.001 0.001 0.001
Nickel (Ni) 0.001 0.0005 0.0005
Phosphorus (P) 0.03 na na
Potassium (K) 0.4 0.4 0.4
Selenium (Se) 0.004 0.0002 0.0002
Silicon (Si) 0.004 0.05 0.05
Silver (Ag) 0.001 0.0001 0.00001
Sodium (Na) 0.4 0.4 0.4
Strontium (Sr) 0.0001 0.001 0.001
Sulfur (S) 0.009 0.3 0.3
Thallium (Tl) 0.004 0.00005 0.00005
Tin (Sn) 0.003 0.001 0.001
Titanium (Ti) 0.0004 0.0005 0.0005
Uranium (U) na 0.0005 0.0005
Vanadium (V) 0.001 0.0001 0.0001
Zinc (Zn) 0.0007 0.001 0.001
Zirconium (Zr) na 0.001 0.001
24