HOW TO GRAB YOUR AUDIENCE Understanding the psychology of ...
Upload
independentCategory
view
2download
0
Inhalation Toxicology, 21:297–326, 2009Copyright c© Informa UK Ltd.ISSN: 0895-8378 print / 1091-7691 onlineDOI: 10.1080/08958370802464273
Characterizing Mineral Dusts and Other Aerosols fromthe Middle East—Part 1: Ambient Sampling
Johann P. Engelbrecht, Eric V. McDonald, and John A. GilliesDesert Research Institute (DRI), 2215 Raggio Parkway, Reno, Nevada 89512-1095, USA
R. K. M. JayantyRTI International, Raleigh, North Carolina 27675-9000, USA
Gary CasuccioRJ Lee Group, Inc., Monroeville, Pennsylvania 15146, USA
Alan W. GertlerDesert Research Institute, 2215 Raggio Parkway, Reno, Nevada 89512-1095, USA
The purpose of the Enhanced Particulate Matter Surveillance Program was to provide scien-tifically founded information on the chemical and physical properties of dust collected over aperiod of approximately 1 year in Djibouti, Afghanistan (Bagram, Khowst), Qatar, United ArabEmirates, Iraq (Balad, Baghdad, Tallil, Tikrit, Taji, Al Asad), and Kuwait (northern, central,coastal, and southern regions). Three collocated low-volume particulate samplers, one each forthe total suspended particulate matter, <10 µm in aerodynamic diameter (PM10) particulatematter, and <2.5 µm in aerodynamic diameter (PM2.5) particulate matter, were deployed ateach of the 15 sites, operating on a ‘1 in 6’ day sampling schedule. Trace-element analysiswas performed to measure levels of potentially harmful metals, while major-element and ion-chemistry analyses provided an estimate of mineral components. Scanning electron microscopywith energy dispersive spectroscopy was used to analyze the chemical composition of small in-dividual particles. Secondary electron images provided information on particle size and shape.This study shows the three main air pollutant types to be geological dust, smoke from burnpits, and heavy metal condensates (possibly from metals smelting and battery manufacturingfacilities). Non-dust storm events resulted in elevated trace metal concentrations in Baghdad,Balad, and Taji in Iraq. Scanning-electron-microscopy secondary electron images of individualparticles revealed no evidence of freshly fractured quartz grains. In all instances, quartz grainshad rounded edges and mineral grains were generally coated by clay minerals and iron oxides.
INTRODUCTIONThe purpose of the Enhanced Particulate Matter Surveil-
lance Program (EPMSP; Engelbrecht et al., 2008) was to pro-vide information on the chemical and physical properties ofaerosols collected at 15 locations in the Middle East. Resultsfrom this program are available to US Department of Defenseoccupational-health physicians, as well as environmental healthprofessionals, to assist them in assessing potential human healthrisk from exposure to ambient particulate matter at their Middle
Received 12 June 2008; revised 5 September 2008; accepted 8September 2008.
Address correspondence to Johann Engelbrecht, Desert Research In-stitute, 2215 Raggio Parkway, Reno, NV 89512-1095, U.S.A. E-mail:[email protected]
East military bases. In addition, information on dust allows foran assessment of its potential harmful effect on military equip-ment. Examples of major-element and trace-element chemistry,and other physical properties, are presented.
In total, 3,136 filter samples were collected on a ‘1-in-6’day schedule, along with one-time bulk (dust and soil) sam-ples (Engelbrecht et al., in press), at each of the 15 sites. Sam-ple media included Teflon
©R membrane and quartz fiber filtersfor chemical analysis (71 species), and Nuclepore
©R filters forscanning electron microscopy (SEM) and computer-controlledSEM (CCSEM). In order to fully understand mineral dusts,their chemical and physical properties and mineralogical inter-relationships were accurately established. The purpose of thechemical analysis was to determine levels of potentially harm-ful trace elements such as lead, arsenic, and other metals. Themajor-element and ion-chemistry analyses provide an estimate
297

298 J. P. ENGELBRECHT ET AL.
FIG. 1. Map of 15 sampling sites from which ambient aerosol samples were collected over a period of approximately 1 year. Bulksurface-soil samples for re-suspension in the laboratory and analysis were also collected at each site.
of mineral components (e.g. quartz, clays, hematite, evaporates),which themselves may be hazardous to health or else could becarriers of other toxic substances. SEM with energy dispersivespectroscopy (EDS) analyzes the chemical composition of smallindividual particles of relevance to understanding mineralogicalinter-relationships such as surface coatings, intergrowths, andother particle features. Secondary electron images provide in-formation on particle size and shape, which also can be linkedto human health effects (e.g. shards of quartz or asbestos fibersthat cause physical injuries to lung tissue). The CCSEM is forautomated analysis of a large number of individual particlesand provides data on individual particle-size distributions andchemical composition.
SAMPLING
Sampling SitesThe 15 sampling localities (Figure 1) were selected to rep-
resent areas of potential exposure to military personnel. Sitesincluded were one in Djibouti, two in Afghanistan (Bagram andKhowst), one in Qatar, one in the United Arab Emirates (UAE),six in Iraq (Balad, Baghdad, Tallil, Tikrit, Taji, and Al Asad),and four in Kuwait (northern, central, coastal, and southernregions).
Three criteria were used for selection of the EPMSP sites. Thefirst was the intent to collect air samples from the largest geo-
graphic dispersion within the area of responsibility of the USCentral Command. The second was to select locations whereUS military forces were present, as they are the exposed pop-ulation of concern for this study. Finally, the sites selected hadto have preventive-medicine or military public-health personnelstationed for the duration of the sampling campaign, since theywere the scientists, engineers, and technicians responsible forsample collection.
Sampling Equipment and Filter MediaThree sizes of dust samples were collected using collocated
low-volume (5 L/min) Airmetrics MiniVol©R particulate sam-
plers, one each for total suspended (TSP), PM10, and PM2.5
particulate matter, deployed at each of the 15 sites. The threesamplers were set to start and stop simultaneously, to providefilter sets for comparing the three size fractions.
The filter media (filters) were selected according to the fol-lowing requirements for each analytical technique:
• The 47 mm diameter Teflon©R filters were for
gravimetry, X-ray fluorescence spectrometry (XRF; 40elements), and inductively coupled plasma mass spec-trometry (ICP-MS; 12 metals).
• The 47 mm diameter quartz fiber filters werefor gravimetry, ion chromatography (4 anions, 1cation), inductively coupled plasma optical emission

CHARACTERIZING AEROSOLS FROM THE MIDDLE EAST—PART 1 299
TABLE 1Summary of 1-in-6 day sampling schedule followed at each sampling site in theater. One shipment of 132 exposed filters was lostin transit, but these were replaced by adding sampling days to the end of the original sampling schedule. Analyzed filter days are
those for which filter sets were collected for either chemical or computer-controlled scanning electron microscopy (CCSEM)analysis.
Site No. Site Locality Site ID Start End Scheduled sampling days Analyzed filter days
1 Djibouti DJI-LEM 2005-12-05 2007-06-09 60 702 Bagram, Afghanistan AFG BAG 2005-12-07 2004-05-21 60 753 Khowst, Afghanistan AFG SAL 2006-04-28 2007-06-22 60 604 Qatar QAT UDE 2006-02-16 2007-02-06 60 605 United Arab Emirates UAE DHA 2006-02-18 2007-02-07 60 606 Balad, Iraq IRQ ANA 2006-01-15 2007-03-24 60 607 Baghdad, Iraq IRQ VIC 2006-01-08 2007-01-11 60 588 Iraq IRQ ADD 2006-01-15 2007-02-15 60 609 Tikrit, Iraq IRQ SPE 2006-01-12 2007-03-12 60 62
10 Taji, Iraq IRQ TAJ 2006-02-05 2007-02-11 60 6011 Iraq, Al IRQ ALA 2006-01-08 2006-12-26 60 5612 Northern Kuwait KUW BUE 2006-01-28 2007-02-04 60 5913 Central Kuwait KUW AAS 2006-03-14 2007-03-19 60 6014 Coastal Kuwait KWT SHU 2006-01-20 2007-03-20 60 6115 Southern Kuwait KUW ARI 2006-01-21 2007-01-15 60 60
Total 900 921
spectrometry (ICP-OES; 4 cations), and thermal opti-cal transmission (3 carbon species).
• The 47 mm diameter Nuclepore©R filters were for in-
dividual particle analysis by SEM (secondary electronimages) and CCSEM (28 chemical species).
Sampling ScheduleThree different sample sets were collected on different sam-
pling days, Sample Set T on Teflon membrane filters, SampleSet Q on quartz fiber filters, and Sample Set N on Nuclepore
©R
filters.A 1-in-6 day sampling schedule was essentially followed;
however, although the sites did sample at this frequency, not allwere sampled on the same sixth day. On each sampling day ei-ther Teflon
©R , quartz fiber, or Nuclepore©R filters were used. Over
a period of 1 month, there were 2 sampling days each for Teflon©R
and quartz fiber filters, and 1 sampling day for Nuclepore©R fil-
ters. For Nuclepore©R filters, the sampling period was 2 h, so as to
provide lightly loaded filters with dispersed single particles, asrequired for CCSEM analysis. A summary of sampling days anddays for which filters were collected for analyses is in Table 1.The laboratory analyses performed in the course of the EPMSPare summarized in Table 2.
ANALYTICAL PROCEDURESTo fully understand their potential impact on human health,
ambient aerosols and re-suspended soils were chemically, phys-ically, and mineralogically characterized.
The Teflon©R membrane and quartz fiber filters were condi-
tioned and weighed prior to and after sampling, to measure themass of particulate matter sampled in the field during each 24-hour sampling period1. From the flow volumes recorded on datasheets in the field and measured mass, particulate matter (PM)concentrations were calculated to micrograms per cubic meter (µg/m3) of sampled air.
In the course of this study, Teflon©R filters, including 92 field
and 22 laboratory blanks were analyzed by energy dispersiveX-ray fluorescence spectrometry (EDXRF) for 40 chemical ele-ments, including sodium, magnesium, aluminum, silicon, phos-phorus, sulfur, chlorine, potassium, calcium, titanium, vana-dium, chromium, manganese, iron, cobalt, nickel, copper, zinc,gallium, arsenic, selenium, bromine, rubidium, strontium, yt-trium, zirconium, molybdenum, palladium, silver, cadmium, in-dium, tin, antimony, barium, gold, mercury, thallium, lead, lan-thanum, and uranium. EDXRF is a non-destructive analyticaltechnique performed on filter samples. After completion andvalidation of the EDXRF results, the same Teflon
©R filters weredissolved in nitric and hydrochloric acid mixture, and the solu-tions analyzed by inductively coupled plasma mass spectrome-try (ICP-MS) for 12 trace metals: antimony; arsenic; beryllium;cadmium; chromium; lead; manganese; nickel; vanadium; zinc;mercury; and strontium. Water extractions were performed onhalf of each of the quartz fiber filters, including field and labo-ratory blanks. Aliquots of the extractions were analyzed by ionchromatography for water soluble anions, sulfate (SO2–
4 ), nitrate(NO–
3 ), chloride (Cl–), phosphate (PO3–4 ), and the ammonium

300 J. P. ENGELBRECHT ET AL.
TABLE 2Summary of the approximate number of analyses performed on filter media and bulk samples in the course of the study
Total Analytical Species/parameters Samples/Particles/ Total analysesSamples method analyzed (Est.) Units (Estimate)
AMBIENT FILTER SAMPLESTeflon filtersMass 1224 Gravimetric 1 1,224 1,224Elemental analysis 1224 XRF 40 1,224 48,960Trace metal analysis 1224 ICP-MS 12 1,224 14,688Quartz fiber filtersMass 1223 Gravimetric 1 1,223 1,223Soluble anions and ammonium 1223 1C 5 1,223 6,115Soluble cations 1223 ICP-OES 4 1,223 4,892Carbon and carbonate 1223 TOT 9 1,223 11,007Nuclepore filtersIndividual particle analysis 0.5–15 micron 243 CCSEM 28 256,334 7,177,352Images & spectra 84 SEM 1 84 84Ultrafines <0.5 micron 15 CCSEM 28 1,558 43,624
Subtotal 7,309,169RESUSPENDED DUST SAMPLESTeflon filtersMass 30 Gravimetric 1 30 30Elemental analysis 30 XRF 40 30 1,200Trace metal analysis 30 ICP-MS 12 30 360Quartz fiber filtersMass 30 Gravimetric 1 30 30Soluble anions 30 IC 4 30 120Soluble cations 30 AA 4 30 120Carbon and carbonate 30 TOR 9 30 270Ammonium 30 AC 1 30 30Nuclepore filtersIndividual particle analysis 15 CCSEM 28 14,900 417,200
Subtotal 419,360BULK DUST SAMPLESSoil chemistryHydogen-ion activity 15 pH 1 15 15Carbonate content 15 Acid digestion 1 15 15Electrical conductivity 15 EC 1 15 15Elemental and minerals analysisElemental analysis 15 XRF 13 15 195Minerals analysis 15 XRD 12 15 180Particle-size analysisParticle-size distribution (sand, silt, clay) 15 PSD 1 15 15
Subtotal 435Total analyses 7,728,964
Acronym Analytical Method ApplicationAA Atomic Absorpsion Cation analysisAC Automated Colorimetry Ammonium analysisCCSEM Computer Controlled Scanning Electron Microscopy Individual particle size, shape and chemistry (0.5–15 micron)EC Electrical Conductivity Salts in soil1C Ion Chromatography Anion and ammonium analysisICP-MS Inductively Coupled Plasma Mass Spectrometry Trace metal analysisICP-OES Inductively Coupled Plasma - Optical Emission Spectrometry Cation analysisPSD Particle-size distribution Particle-size distribution by laser diffractionSEM Scanning Electron Microscopy Secondary electron particle image & XRF spectrumTOR Thermal Optical Reflectance OC, EC and Carbonate analysisTOT Thermal Optical Transmission OC, EC and Carbonate analysisXRD X-ray Diffraction Mineral analysisXRF X-Ray Fluorescence Spectrometry Major elemental analysis

CHARACTERIZING AEROSOLS FROM THE MIDDLE EAST—PART 1 301
FIG. 2. Averaged particulate mass concentrations and uncertainties for (A) TSP, (B) PM10, and (C) PM2.5 on Teflon©R filters for
each of the 15 sites. Averaging period is approximately 1 year. Also shown are the 24 h and 1-year Military Exposure Guidelines(MEGs) for particulate matter.
(NH+4 ) cation. Further aliquots of the extractions were analyzed
by inductively coupled plasma optical emission spectrometry(ICP-OES), for water soluble cations, sodium (Na+), potassium(K+), calcium (Ca2+), and magnesium (Mg2+).
Punches from the remaining half of each of the quartz fiberfilters were analyzed for organic carbon and elemental carbon
by the NIOSH method.2 Separate punches were acidified todissolve carbonate (CO2–
3 ), and the latter was determined by thedifference in total carbon between non-acidified and acidifiedpunches.
SEM individual particle analysis was performed on approx-imately 258 filters selected from approximately 555 sampled

302 J. P. ENGELBRECHT ET AL.
Nuclepore©R filters. A dual approach was followed, the first being
the CCSEM and the second being secondary electron imagingby high magnification SEM.
CCSEM is a combination of backscattered electron imageryand EDS that automatically analyzes in a cost-effective fashiona large number (1,000–1,500) of individual particles for parti-cle size and chemical composition. The particles are groupedin ‘bins’ by chemical composition and particle size. From thesechemical measurements, the mineralogy of individual particlescan be inferred, for example Si particles being quartz and Caparticles being calcite. From each of the 15 sites, at least oneTSP, at least four PM2.5, and 3–10 PM10 Nuclepore
©R filterswere analyzed by CCSEM. Also, one PM2.5 filter from each sitewas analyzed for its ultrafine (0.01–0.50 µm diameter) individ-ual particle content. Although labor intensive, the field emissionelectron source of the SEM allows for very high magnificationand sharp secondary electron images. This technique is for thestudy of particle shape, surface coatings, and chemical compo-sition. More than 80 secondary electron images representing all15 sites were collected in this way.
Upon completion of analysis, filter results underwent a firstlevel of quality assurance, before being uploaded to appropriatefolders on the EPMSP webpage by each laboratory. The DesertResearch Institute retrieved these files for second-level qualityassurance, including data validation, flagging, and compilationinto folders for each site. Results were tabulated and graphicallydisplayed as time-series plots, pie-charts, and stacked bar-chartsas part of a third level of quality assurance.
Chemical, mineralogical, and electron-microscopy results ofall analyzed filter and bulk soil samples for each of the 15 siteswere submitted to the US Army Center for Health Promotion andPreventative Medicine (USACHPPM) for archiving, followinga final quality-assurance review.
RESULTSAll analytical results for each site—together with statistics,
and graphical representations were compiled on spread sheets.Of 2,308 (excluding blanks) Teflon
©R membrane and quartz fiberfilters sampled in the field, 2,207 (96%) were chemically ana-lyzed, and after the elimination of voided results, a filter recoveryof 2,022 (88%) was provided for subsequent data analysis. Thefollowing results include some sites and key chemical speciesthat highlight areas of potential concern to the US Departmentof Defense.
GravimetryTime-series plots for TSP, PM10, and PM2.5 24h gravimetric
and chemical abundances from Teflon©R and quartz fiber filters
were compiled for each of the 15 sites. Averaged concentrationlevels (Figure 2, Table 3) show highest particulate matter con-centrations for TSP at Tikrit (605 µg/m3) and PM10 at Tallil(303 µg/m3). Differences among sites for PM2.5 total mass con-centrations are less, with Tikrit giving the highest annual averagePM2.5 concentration of 111 µg/m3.
TABLE 3Mean mass concentrations for TSP, PM10, and PM2.5 size fractions, as well as the TSP:PM10:PM2.5 mass ratios for each of the 15
sites, as measured on Teflon©R filters. For comparison, the mean concentrations and ratios from sites in the southwestern urban
(CSN) and rural (IMPROVE) US are also given
Concentration (µg/m3) Ratio
Site No. Site location TSP PM10 PM2.5 TSP PM10 PM2.5
1 Djibouti 92 72 35 1.27 1 0.492 Bagram, Afghanistan 174 108 38 1.62 1 0.353 Khowst, Afghanistan 184 127 75 1.45 1 0.594 Qatar 282 165 67 1.71 1 0.415 United Arab Emirates 196 140 52 1.40 1 0.376 Balad, Iraq 242 184 56 1.31 1 0.307 Baghdad, Iraq 371 250 103 1.48 1 0.418 Tallil, Iraq 411 303 65 1.36 1 0.219 Tikrit, Iraq 605 298 111 2.03 1 0.37
10 Taji, Iraq 348 213 81 1.63 1 0.3811 Al Asad, Iraq 142 95 37 1.49 1 0.3912 Northern Kuwait 416 211 67 1.98 1 0.3213 Central Kuwait 352 298 87 1.18 1 0.2914 Coastal Kuwait 268 176 60 1.52 1 0.3415 Southern Kuwait 290 199 62 1.45 1 0.31CSN US SW urban (city) — 40 12 — 1 0.30IMPROVE US SW rural (desert) — 13 5 — 1 0.36

TAB
LE
4C
ompa
rativ
eta
ble
show
ing
conc
entr
atio
nra
nges
inµ
g/m
3of
mea
nPM
2.5
site
conc
entr
atio
ns,a
sw
ella
sva
riou
sai
r-qu
ality
and
heal
thst
anda
rds
Ran
geof
Ann
ual
NIO
SHO
SHA
Mea
nof
15Si
tes
USA
CH
PPM
USA
CH
PPM
US
EPA
US
EPA
WH
OR
EL
:TW
APE
L:T
WA
Site
Ran
king
(10-
hrda
y(8
-hr
day
PM2.
58-
hour
1-Y
ear
Ann
ual
24hr
TW
A40
-h40
-hA
nnua
lMea
n2n
d3r
dA
ir-M
EG
Air
-ME
GN
AA
QS
NA
AQ
San
nual
wor
kwee
k)w
orkw
eek)
Sym
bol
Nam
eM
nem
onic
Met
hod
Min
Max
Hig
hest
Hig
hest
Hig
hest
µg/
m3
µg/
m3
µg/
m3
µg/
m3
µg/
m3
µg/
m3
µg/
m3
(a)
(b)
(c)
(d)
(e)
(f)
(g)
(h)
(i)
(j)
(k)
(l)
Part
icul
ate
Mat
ter
Mas
sC
once
ntra
tions
TSP
TSP
Mas
sTe
flon
TM
AC
GR
AV
9260
5IR
QSP
EK
UW
BU
EIR
QA
DD
PM10
PM10
Mas
sTe
flon
TM
AC
GR
AV
7230
3K
UW
AA
SIR
QV
ICIR
QTA
J15
020
PM2.
5PM
2.5
Mas
sTe
flon
TM
AC
GR
AV
3511
1IR
QSP
EIR
QV
ICK
UW
.AA
S15
1535
10
PM2.
5C
hem
ical
Con
cent
ratio
nsC
l−C
hlor
ide
CL
ICIC
0.14
90.
857
UA
ED
HA
IRQ
TAJ
IRQ
AD
DN
O− 3
Nitr
ate
N3I
CIC
0.58
62.
064
IRQ
VIC
AFG
BA
GQ
AT
UD
EPO
3− 4Ph
osph
ate
PHIC
IC0.
047
0.16
6IR
QV
ICIR
QA
LA
KU
WA
RI
SO2− 4
Sulf
ate
S4IC
IC2.
138
11.9
15K
WT
SHU
KU
WA
RI
UA
ED
HA
NH
+ 4A
mm
oniu
mN
4IC
IC0.
865
3.62
9K
WT
SHU
KU
WA
RI
KU
WA
AS
Ca2+
Cal
cium
CA
EC
ICP-
OE
S0.
247
3.55
5IR
QV
ICIR
QSP
EIR
QA
LA
K+
Pota
ssiu
mK
PEC
ICP-
OE
S0.
086
0.25
0IR
QTA
JA
FGSA
LIR
QV
ICM
g2+M
agne
sium
MG
EC
ICP-
OE
S0.
036
0.26
0K
UW
AA
SU
AE
DH
AIR
QV
ICN
a+So
dium
NA
EC
ICP-
OE
S0.
057
0.31
0U
AE
DH
AD
JIL
EM
IRQ
VIC
CO
3(C
)C
arbo
nate
carb
onC
3TC
TO
T0.
855
2.24
1IR
QV
ICIR
QA
LA
IRQ
SPE
CE
lem
enta
lcar
bon
EC
TN
ICT
OT
1.15
25.
085
KU
WA
RI
KW
TSH
UIR
QSP
E50
00O
CO
rgan
icca
rbon
OC
TN
ICT
OT
1.37
39.
864
AFG
BA
GA
FGSA
LIR
QTA
JT
OC
Tota
lcar
bon
TC
TC
TO
T3.
400
14.5
43IR
QV
ICA
FGSA
LA
FGB
AG
Ag
Silv
erA
GX
CX
RF
0.00
90.
016
IRQ
SPE
AFG
SAL
DJI
LE
M10
10A
lA
lum
inum
AL
XC
XR
F0.
465
3.20
7IR
QSP
EK
UW
AA
SIR
QV
IC50
0050
00A
sA
rsen
icA
SXC
XR
F0.
002
0.05
6IR
QV
ICIR
QTA
JIR
QA
NA
1.11
10A
uG
old
AU
XC
XR
F0.
003
0.01
6A
FGSA
LD
JIL
EM
IRQ
VIC
Ba
Bar
ium
BA
XC
XR
F0.
007
0.06
6IR
QV
ICK
UW
AA
SO
AT
UD
E3.
4250
0B
rB
rom
ine
BR
XC
XR
F0.
003
0.01
9IR
QV
ICIR
QA
NA
KU
WA
RI
6370
070
0C
aC
alci
umC
AX
CX
RF
0.54
96.
481
IRQ
VIC
IRQ
SPE
KU
WA
AS
5000
Cd
Cad
miu
mC
DX
CX
RF
0.01
10.
020
IRQ
SPE
KU
WA
RI
DJI
LE
M0.
244
0.00
55
Cl
Chl
orin
eC
LX
CX
RF
0.04
10.
799
IRQ
VIC
DJI
LE
MIR
QTA
J15
00C
oC
obal
tC
OX
CX
RF
0.00
10.
001
IRQ
SPE
IRQ
TAJ
KU
WA
RI
5050
Cr
Chr
omiu
mC
RX
CX
RF
0.00
10.
002
IRQ
SPE
IRQ
TAJ
KU
WA
RI
12.2
500
1000
Cu
Cop
per
CU
XC
XR
F0.
001
0.01
0IR
QV
ICIR
QA
NA
KW
TSH
U10
0010
00Fe
Iron
FEX
CX
RF
0.42
02.
847
IRQ
SPE
KU
WA
AS
IRQ
VIC
Ga
Gal
lium
GA
XC
XR
F0.
002
0.00
7IR
QV
ICIR
QSP
EIR
QTA
J
303

Hg
Mer
cury
HG
XC
XR
F0.
005
0.01
0IR
QSP
EA
FGSA
LIR
QTA
J0.
205
110
10In
Indi
umIN
XC
XR
F0.
015
0.02
9IR
QSP
EA
FGSA
LIR
QTA
J10
010
0K
Pota
ssiu
mK
PXC
XR
F0.
211
1.07
4IR
QV
ICIR
Q-
SPE
IRQ
TAJ
La
Lan
than
umL
AX
CX
RF
0.00
50.
060
IRQ
VIC
KU
WA
AS
KU
WB
UE
PM2.
5C
hem
ical
Con
cent
ratio
nsM
aM
agne
sium
MG
XC
XR
F0.
175
1.48
6IR
QSP
EK
UW
AA
SIR
QV
ICM
nM
anga
nese
MN
XC
XR
F0.
006
0.04
7IR
QSP
EIR
QV
ICK
UW
AA
S0.
342
0.15
1000
Mo
Mol
ybde
num
MO
XC
XR
F0.
006
0.01
0IR
QSP
EIR
QTA
JK
UW
AR
I10
000
Na
Sodi
umN
AX
CX
RF
0.11
10.
496
IRQ
VIC
DJI
LE
MU
AE
DH
AN
iN
icke
lN
IXC
XR
F0.
002
0.01
2A
FGSA
LIR
QSP
EIR
QV
IC4.
910
00P
Phos
phor
usPH
XC
XR
F0.
034
0.32
3IR
QSP
EIR
QV
ICK
UW
AA
S10
0Pb
Lea
dPB
XC
XR
F0.
005
0.58
1IR
QV
ICIR
QTA
JIR
QA
NA
1.5
1.5
0.5
5050
PdPa
lladi
umPD
XC
XR
F0.
007
0.01
3IR
QSP
ED
JIL
EM
IRQ
TAJ
Rb
Rub
idiu
mR
BX
CX
RF
0.00
20.
005
IRQ
SPE
IRQ
TAJ
AFG
SAL
SSu
lfur
SUX
CX
RF
0.67
13.
727
QA
TU
DE
UA
ED
HA
KU
WB
UE
SbA
ntim
ony
SBX
CX
RF
0.02
70.
074
IRQ
AN
AIR
QSP
ED
JIL
EM
1250
050
0Se
Sele
nium
SEX
CX
RF
0.00
10.
003
IRQ
SPE
IRQ
VIC
IRQ
TAJ
200
200
SiSi
licon
SIX
CX
RF
1.18
28.
876
IRQ
SPE
KU
WA
AS
IRQ
VIC
5000
5000
SnT
inSN
XC
XR
F0.
022
0.03
7IR
QSP
EIR
QV
ICO
AT
UD
E20
0020
00Sr
Stro
ntiu
mSR
XC
XR
F0.
004
0.03
0U
AE
DH
AIR
QV
ICO
AT
UD
E15
10T
iT
itani
umT
TX
CX
RF
0.01
70.
155
KU
WA
AS
IRQ
SPE
AFG
SAL
Tl
Tha
llium
TL
XC
XR
F0.
003
0.00
6IR
QV
ICIR
QSP
EIR
QTA
JU
Ura
nium
UR
XC
XR
F0.
021
0.03
7IR
QSP
EIR
QTA
JK
UW
AR
I20
025
0V
Van
adiu
mV
AX
CX
RF
0.01
20.
107
IRQ
VIC
IRQ
SPE
KU
WA
AS
0.72
500
YY
ttriu
mY
TX
CX
RF
0.00
20.
003
IRQ
SPE
IRQ
TAJ
KU
WA
AS
1000
1000
Zn
Zin
cZ
NX
CX
RF
0.01
40.
043
IRQ
TAJ
IRQ
VIC
KW
TSH
U72
0Z
rZ
irco
nium
ZR
XC
XR
F0.
003
0.01
1IR
QV
ICIR
QSP
EK
UW
AA
S50
0050
00A
sA
rsen
icA
SMC
ICP-
MS
0.00
20.
004
IRQ
VIC
IRQ
SPE
IRQ
TAJ
1.11
10B
eB
eryl
lium
BE
MC
ICP-
MS
0.00
00.
001
IRQ
SPE
IRQ
TAJ
KU
WA
RI
0.01
42
Cd
Cad
miu
mC
DM
CIC
P-M
S0.
000
0.00
2IR
QA
NA
IRQ
VIC
IRQ
TAJ
0.24
40.
005
5C
rC
hrom
ium
CR
MC
ICP-
MS
0.00
30.
013
IRQ
SPE
AFG
SAL
KU
WA
AS
12.2
0(C
onti
nued
onne
xtpa
ge)
304

TAB
LE
4C
ompa
rativ
eta
ble
show
ing
conc
entr
atio
nra
nges
inµ
g/m
3of
mea
nPM
2.5
site
conc
entr
atio
ns,a
sw
ella
sva
riou
sai
r-qu
ality
and
heal
thst
anda
rds
(Con
tinu
ed)
Ran
geof
Ann
ual
NIO
SHO
SHA
Mea
nof
15Si
tes
USA
CH
PPM
USA
CH
PPM
US
EPA
US
EPA
WH
OR
EL
:TW
APE
L:T
WA
Site
Ran
king
(10-
hrda
y(8
-hr
day
PM2. 5
8-ho
ur1-
Yea
rA
nnua
l24
hrT
WA
40-h
40-h
Ann
ualM
ean
2nd
3rd
Air
-ME
GA
ir-M
EG
NA
AQ
SN
AA
QS
annu
alw
orkw
eek)
wor
kwee
k)Sy
mbo
lN
ame
Mne
mon
icM
etho
dM
inM
axH
ighe
stH
ighe
stH
ighe
stµ
g/m
3µ
g/m
3µ
g/m
3µ
g/m
3µ
g/m
3µ
g/m
3µ
g/m
3
(a)
(b)
(c)
(d)
(e)
(f)
(g)
(h)
(i)
(j)
(k)
(l)
Hg
Mer
cury
HG
MC
ICP-
MS
0.00
00.
001
IRQ
SPE
IRQ
AD
DU
AE
DH
A0.
205
110
10M
nM
anga
nese
MN
MC
ICP-
MS
0.01
10.
055
IRQ
SPE
KU
WA
AS
AFG
SAL
0.34
20.
1510
00N
iN
icke
lN
IMC
ICP-
MS
0.00
20.
014
AFG
SAL
IRQ
SPE
IRQ
VIC
36.7
1000
PbL
ead
PBM
CIC
P-M
S0.
007
0.54
6IR
QV
ICIR
QTA
JIR
QA
NA
1.5
1.5
0.5
5050
SbA
ntim
ony
SBM
CIC
P-M
S0.
001
0.05
0IR
QA
NA
IRQ
VIC
AFG
BA
G12
500
500
SrSt
ront
ium
SRM
CIC
P-M
S0.
002
0.01
9Q
AT
UD
EIR
QV
ICU
AE
DH
A15
10V
Van
adiu
mV
AM
CIC
P-M
S0.
001
0.00
9IR
QSP
EIR
QV
ICK
WT
SHU
0.72
500
Zn
Zin
cZ
NM
CIC
P-M
S0.
028
0.06
9IR
QTA
JK
WT
SHU
IRQ
AN
A72
0
(a)a
nd(b
)The
rang
ein
annu
alm
ean
conc
entr
atio
nva
lues
amon
gth
e15
site
s.M
ean
conc
entr
atio
nsca
lcul
ated
fore
ach
chem
ical
spec
ies
and
each
site
onth
ePM
2.5
size
frac
tion
unle
ssst
ated
othe
rwis
e.(c
),(d
)and
(e)T
hree
site
sw
ithth
ehi
ghes
t,se
cond
high
est,
and
thir
dhi
ghes
tann
ualm
ean
conc
entr
atio
npe
rspe
cies
.Site
mne
mon
ics
are
(1)D
JIL
EM
=D
jibou
ti,(2
)AFG
BA
G=
Afg
hani
stan
Bag
ram
,(3)
AFG
SAL
=A
fgha
nist
anK
how
st,(
4)Q
AT
UD
E=
Qat
ar,(
5)U
AE
DH
A=
Uni
ted
Ara
bE
mir
ates
,(6)
IRQ
AN
A=
Iraq
Bal
ad,(
7)IR
QV
IC=
Iraq
Bag
hdad
(8)
IRQ
AD
D=
Iraq
Talli
l,(9
)IR
QSP
E=
Iraq
Tik
rit,
(10)
IRQ
TAJ
=Ir
aqTa
ji,(1
1)IR
QA
LA
=Ir
aqA
lA
sad,
(12)
KU
WB
UE
=N
orth
ern
Kuw
ait,
(13)
KU
WA
AS
=C
entr
alK
uwai
t,(1
4)K
WT
SHU
=C
oast
alK
uwai
t,(1
5)K
UW
AR
I=
Sout
hern
Kuw
ait
(f)
and
(g)
USA
CH
PPM
8-ho
uran
d1-
year
Air
-ME
Gs:
USA
CH
PPM
Mili
tary
Exp
osur
eG
uide
lines
(ME
G)
for
Dep
loye
dM
ilita
ryPe
rson
nel,
Tabe
l1.
Mili
tary
Exp
o-su
reG
uide
lines
for
Air
-Ja
nuar
y20
04T
G23
0A
dden
dum
(http
://ch
ppm
-ww
w.a
pgea
.arm
y.m
il/do
cum
ents
/TG
/TE
CH
GU
ID/T
G23
0.pd
f)re
vise
dJu
ly20
08(h
ttp://
chpp
m-
ww
w.a
pgea
.arm
y.m
il/do
cum
ents
/FA
CT
/Par
ticul
ate%
20M
atte
rFa
ctsh
eet
2008
30%
20Ju
ly08
final
).(h
)an
d(i
)U
SE
PAN
AA
QS:
Uni
ted
Stat
esE
nvir
onm
enta
lPro
tect
ion
Age
ncy
Am
bien
tAir
Qua
lity
Stan
dard
s,1
year
and
24h
(http
://w
ww
.epa
.gov
/air
/cri
teri
a.ht
ml)
.(j
)W
HO
TW
Aan
nual
:W
orld
Hea
lthO
rgan
izat
ion
(WH
O)
annu
altim
e-w
eigh
ted
aver
age
(TW
A),
Air
qual
itygu
idel
ines
-gl
obal
upda
te20
05,
http
://w
ww
.who
.int/p
he/h
ealth
topi
cs/o
utdo
orai
raq
g/en
/inde
x.ht
ml
(k)
NIO
SHR
EL
TW
A:
Nat
iona
lC
ente
rfo
rD
isea
seC
ontr
ol(C
DC
),N
atio
nal
Inst
itute
for
Occ
upat
iona
lSa
fety
and
Hea
lth(N
IOSH
),re
com
men
ded
expo
sure
limit
(RE
L),
10-h
ourt
ime-
wei
ghte
dav
erag
e(T
WA
),40
-hou
rwor
kwee
k(h
ttp://
ww
w.c
dc.g
ov/n
iosh
/npg
/npg
d002
2.ht
ml)
,IN
DE
Xof
Che
mic
alA
bstr
acts
Serv
ice
Reg
istr
yN
umbe
rs(C
AS
No.
)(h
ttp://
ww
w.c
dc.g
ov/n
iosh
/npg
/npg
dcas
.htm
l).
(l)
OSH
APE
LT
WA
:O
ccup
atio
nal
Safe
tyan
dH
ealth
Adm
inis
trat
ion
stan
dard
s,pe
rmis
sibl
eex
posu
relim
it(P
EL
),tim
e-w
eigh
ted
aver
age
(TW
A)
8-ho
urda
y,R
egul
atio
ns(S
tand
ards
-29
CFR
),TA
BL
EZ
-1,L
imits
for
Air
Con
tam
inan
ts(h
ttp://
ww
w.o
sha.
gov/
pls/
osha
web
/ow
adis
p.sh
owdo
cum
ent?
pta
ble=
STA
ND
AR
DS&
pid
=999
2).
305

306 J. P. ENGELBRECHT ET AL.
FIG. 3. Location of Department of Defense (DOD) lands in the southwestern US in relation to five rural IMPROVE sites (DomeLand National Wildlife Area, Joshua Tree National Park, Bosque del Apache National Wildlife Reserve, Salt Creek, and SanAndres National Wildlife Reserve) and five urban Chemical Speciation Network (STN) sites (Las Vegas, Los Angeles, Tucson,Albuquerque, and El Paso).
Although both Teflon©R and quartz fiber filters were weighed,
gravimetric results from the latter were often found to be lessreliable. This is due to the brittle nature of the glass fiber filtermedium and subsequent loss of mass from small bits of fiberbreaking off edges of the filters. In some instances, this wasnegligible but, in other cases, it resulted in underestimation ofthe PM mass collected on quartz fiber filters.
The high average particulate matter (TSP, PM10, and PM2.5)levels from each site are to a large extent determined by thenumber and intensity of dust-blowing events. Differences inPM measurements among Baghdad, Taji, Balad, and Tikrit (allwithin 200 km of each other along the Tigris River valley) canbe ascribed to varying contributions from local dust sources, in-cluding dirt and paved roads, agriculture, and disturbances ofthe desert floor by motorized vehicles.
The PM2.5:PM10 mass ratios vary substantially among the15 sites, from 0.21 for Tallil, Iraq to 0.59 for Khowst, depend-ing on the fraction of coarse dust in the air. For the Iraq andKuwait sites, the average PM2.5:PM10 mass ratio is 0.33, whichis slightly less than the average ratio of 0.36 for the rural south-western area of the US (Table 3). This signifies that, on average,the PM2.5:PM10 particulate mass distribution of sampled areasin the Middle East is similar to that of the drier parts of the
southwestern area of the US. This low value is typical of regionsdominated by geological dust, in contrast to rural areas, wherecombustion processes such as coal or wood burning dominate(Engelbrecht et al., 2001), and where the PM2.5:PM10 ratios areon average as high as 0.85.
Although no longer monitored in the US or considered ahealth standard, TSP was measured as part of the EPMSP be-cause of the impact of coarse dust on military equipment. Av-erage TSP:PM10 mass ratios vary from 1.18 for Central Kuwaitto as high as 2.03 for Tikrit, Iraq, emphasizing dominance bycoarse dust at the latter site.
Air Quality and Health StandardsTable 4 provides a summary of concentration levels mea-
sured in the course of the EPMSP, as well as US and interna-tional health standards. It should be noted that the air-qualitystandards listed in this table have qualifiers regarding the wayin which samples are to be collected, analytical methods are tobe applied, as well as which chemical species to be consideredor excluded. References for each air-quality and health standardare listed as a footnote to Table 4. For this study, tabled valuesserve as indicators only. Because of health risks associated with

CHARACTERIZING AEROSOLS FROM THE MIDDLE EAST—PART 1 307
FIG. 4. Annual mean distributions of 12 trace metals for (A) TSP, (B) PM10 , and (C) PM2.5 size fractions for each of the 15 sites.
the finer fraction, only PM2.5 levels are presented in this docu-ment. It will be shown that trace metals—such as lead, arsenic,cadmium, antimony, and zinc—are concentrated in the PM2.5
fraction (Figures 4–6 and 10B). Also, fine aluminum silicateminerals such as clays are generally concentrated in the finefraction.
When results are averaged for the sampling period ofapproximately 1 year, all sites exceed the USACHPPM 1-yearair Military Exposure Guideline (MEG) value of 15 µg/m3
for PM2.5. Other standards that were exceeded are the WorldHealth Organization (WHO)’s guidelines for particulate matter(20 µg/m3 for PM10, 10 µg/m3 for PM2.5). It is of note that the

308 J. P. ENGELBRECHT ET AL.
FIG. 5. Time-series plot of trace metal concentrations from Baghdad, Iraq showing corresponding elevated values for (A) lead,(B) zinc, (C) arsenic, and (D) cadmium on the 19 October 2006, 30 November 2006, and 11 January 2007 event days. These metalsare concentrated in the PM2.5 size fraction.
USACHPPM 24 h air MEG for PM10 (250 µg/m3) was exceededat 3, and for PM2.5 (65 µg/m3) at 7, of the 15 sites (Figure 2) bythe average PM values for the sites (http://chppm-www.apgea.army.mil/documents/FACT/Particulate%20Matter Factsheet2008 30%20July 08 final.pdf).
The US Environmental Protection Agency’s annual NationalAmbient Air Quality Standard for PM10 of 50 µg/m3 was re-voked in December 2006, because of a lack of evidence linkinghealth problems to long-term exposure to coarse particles.
Depending on the analytical method and standard or guide-line applied, the chemical species aluminum, cadmium, and leadwere noted as possibly exceeding maximum guideline values.
The USACHPPM 1-year interim air MEG of 3.42 µg/m3 foraluminum was on average exceeded at all 15 sites. We assumethat this guideline is for aluminum metal or soluble aluminumsalts. Since aluminum measured in samples from all 15 siteswas identified as inert aluminum silicates (i.e. part of the crys-talline mineral structure), including feldspars, micas, or clays,this guideline should not apply. The Occupational Safety andHealth Administration’s 8h guideline value of 5000 µg/m3 forrespirable alumina (aluminum oxide), as shown in Table 4, wasnot exceeded.
Although the USACHPPM 1-year air MEG for cadmium of0.244 µg/m3 was not exceeded, the WHO’s guideline value of

CHARACTERIZING AEROSOLS FROM THE MIDDLE EAST—PART 1 309
FIG. 6. Comparative time series plots of lead concentrations for (A) Baghdad, (B) Balad, and (C) Taji. The events showing elevatedlead levels occur on different days for the three sites and on days for which no major regional dust storms were measured, implyinglocal point sources for lead with fluctuating emission rates or variable meteorological conditions. High event days are listed intables alongside the figures. Events recorded (R) or not recorded (NR) on field data sheets, together with their total TSP masslevels, are shown in the adjacent tables.

310 J. P. ENGELBRECHT ET AL.
FIG. 7. Major soil-forming elements (A) silicon, (B) aluminum, (C) calcium, and (D) manganese as measured on Teflon©R filters.
Corresponding peak values represent dust blowing events on 9 March 2006, 8 May 2006, 13 August 2006, 19 October 2006, and30 November 2006.
0.005 µg/m3 was exceeded at all 15 sites, as measured by XRF.As measured by the more sensitive ICP-MS method, however,all 15 sites had average measured cadmium values below thisWHO guideline.
Mean lead levels for all 15 sites fall within the USACHPPM1-year MEG of 1.5 µg/m3. The average level for Baghdad, Iraqexceeds the WHO guideline of 0.5 µg/m3, as analyzed by bothXRF and ICP-MS. As demonstrated below, this is largely due toa single metals emitting event on 30 November 2006, possiblyfrom secondary lead smelters (Figures 4 and 6A).
Short-term health guidelines such as the USACHPPM 8-hourMEG, as well as National Institute of Occupational Safety andHealth (NIOSH) and Occupational Safety and Health Admin-istration standards should be considered for such short-termevents.
Comparisons with Rural and Urban Sites in the USTo provide perspective on results from the 15 Middle East-
ern sites, we compared these with results from five rural andfive urban PM2.5 sites in the southwestern US (Figure 3). The10 US sites were selected because of their proximity to mili-tary bases in drier regions of the US. Average particulate mat-ter and chemical values were calculated for the period 2002–2006.
The five rural sites are at Dome Land National WildlifeArea, Joshua Tree National Park, Bosque del Apache Na-tional Wildlife Refuge, Salt Creek National Wildlife Refuge,and San Andres National Wildlife Refuge, which form part ofthe Interagency Monitoring of Protected Visual Environments(IMPROVE) air-quality-monitoring network (http://vista.cira.colostate.edu/improve/).

CHARACTERIZING AEROSOLS FROM THE MIDDLE EAST—PART 1 311
FIG. 8. Annual mean major chemistry for (A) TSP, (B) PM10, and (C) PM2.5. Concentrations are expressed as mass fractions ofoxides, sulfate (in gypsum), chloride (in salt), nitrate, and ammonium.
The five urban sites are in Las Vegas (Nevada), Los Angeles(California), Tucson (Arizona), Albuquerque (New Mexico),and El Paso (Texas) and form part of the US EnvironmentalProtection Agency’s Chemical Speciation Network (CSN)monitoring program (http://www.epa.gov/ttn/airs/airsaqs/detaildata/downloadaqsdata.htm).
Average PM2.5 mass and chemical concentration levels fromthe deployment sites are—except for a few species such as ni-trate, sodium, and rubidium—greater than chemical abundances
in PM2.5 samples measured at rural IMPROVE and urban CSNsites in the southwestern US.
Trace MetalsAnnual mean ICP-MS trace-metal analysis results of 12
chemical species were compiled per size-cut (TSP, PM10, PM2.5)and sampling site (Figure 4). Lead is the most abundant tracespecies found in Baghdad aerosol and also contributes substan-tially to measured trace metals at Taji and Balad. It is of note that,

312 J. P. ENGELBRECHT ET AL.
FIG. 9. Comparison of dust samples from the Middle East, Sahara, China, US, world average dust, and world rocks. In the caseof the EPMSP samples, mean TSP results are shown: (a) Djibouti; (b) Bagram and Khowst in Afghanistan; (c) Qatar; (d) theUAE; (e) Balad, Baghdad, Tallil, Tikrit, and Taji in Iraq; (f) Al Asad in Iraq; (g) Northern, Central, Coastal, and Southern Kuwait;(h) average Southern Sahara (Goudie, 2006); (i) average Northern Sahara (Goudie, 2006); (j) average China (Goudie, 2006);(k) Arizona (Goudie, 2006); (l) Western Texas (Labban et al., 2004); (m) Utah Western Desert (Labban et al., 2004); (n) averageworld dust (Goudie, 2006); and (o) average world crustal rocks (Clarke, 1916).
TABLE 5For ambient samples, the number of Nuclepore
©R filters analyzed by computer-controlled scanning electron microscopy(CCSEM) for each sampled size fraction
Site No. Site locality Site ID TSP PM10 PM2.5 Total
1 Djibouti DJI LEM 2 9 4 152 Bagram, Afghanistan AFG BAG 2 9 6 173 Khowst, Afghanistan AFG SAL 1 10 5 164 Qatar QAT UDE 1 10 5 165 United Arab Emirates UAE DHA 3 8 7 186 Balad, Iraq IRQ ANA 1 10 5 167 Baghdad, Iraq IRQ VIC 2 7 7 168 Tallil, Iraq IRQ ADD 2 9 7 189 Tikrit, Iraq IRQ SPE 2 3 4 9
10 Taji, Iraq IRQ TAJ 2 8 7 1711 Al Asad, Iraq IRQ ALA 2 9 9 2012 Northern Kuwait KUW BUE 1 8 7 1613 Central Kuwait KUW AAS 1 8 5 1414 Coastal Kuwait KWT SHU 1 10 5 1615 Southern Kuwait KUW ARI 2 9 8 19
Total 25 127 91 243

CHARACTERIZING AEROSOLS FROM THE MIDDLE EAST—PART 1 313
FIG. 10. Composite of all CCSEM PM10 results measured on Nuclepore©R filters, grouped by site. All size fractions, from 0.5 µm
to 10 µm diameter particles, are shown in (A), while the 0.5–1.0 µm diameter (fine fraction) subset is shown in (B), demonstratingthat lead (Pb) is concentrated in this fine fraction.
for all sites, the lead concentrations (in µg/m3) are nearly identi-cal for the three size fractions (TSP, PM10, PM2.5). Since PM10 iscontained in TSP and PM2.5 in PM10, this implies that most, if notall, the lead occurs in the PM2.5 size fraction. Most combustionproducts (elemental carbon and particulate organic compounds)also occur in the fine (PM2.5) and ultra-fine fractions, and somelead may be a component of combustion products for these loca-tions. Fine lead and zinc, together with other associated metals,also are generated from condensed fumes emitted by metallurgi-cal processes such as lead-zinc smelters or backyard electroniccircuit board smelting operations (Carroll & Essik, 2008). Leadalso occurs as an additive in leaded gasoline and is emitted withgasoline vehicle emissions.
A major lead emitting event, far exceeding the USACHPPM1-year air MEG value of 1.5 µg/m3, was recorded at the Baghdadsite on 30 November 2006, with a smaller spike on 11 January2007, and a few other days (Figure 5A). Similar elevated con-centration levels also were recorded for zinc (Figure 5B), arsenic(Figure 5C), and cadmium (Figure 5D) on the same days. Thisimplies that these (and antimony) trace metals were emitted bythe same or a collocated source.
Very low concentration levels of arsenic and cadmium weremeasured in TSP and PM10, and in lower concentrations inPM2.5, on 9 March 2006 and 8 May 2006—most likely asso-ciated with dust events on those 2 days. Similar associationsamong lead, arsenic, cadmium, and antimony were measured atBalad and Taji, pointing to a similar source type, such as sec-ondary lead battery and electronic-circuit-board smelters affect-ing all three sites. The relationship between known dust eventsand elevated lead emissions for the three sites at Baghdad, Taji,and Balad is shown in Figure 6. The table alongside each timeseries plot shows the recorded high-dust days and correspondingmeasured TSP levels. There is little concordance between thehigh dust and high lead days, pointing to two distinct but dif-ferent sources—one for geological dust and the other for tracemetals (lead, arsenic, cadmium, antimony, zinc). Lead spikesoccur on different days for each of the three monitoring sites,indicating different wind directions for point sources in relationto the monitoring sites, as well as variable meteorological con-ditions. The presence of individual particles of zinc and lead aswell as lead in vehicle emissions, from the Balad–Baghdad–Tajiregion were confirmed by SEM–EDS (Figures 12 and 13).

314 J. P. ENGELBRECHT ET AL.
FIG. 11. SEM and CCSEM results of ultrafines (<0.5 µm diameter) measured on 15 PM2.5 samples collected on Nuclepore©R
filters. Compositions of 100 particles analyzed for all species are shown in (A), while individual minor and trace metals are shownon an expanded scale in (B).
A further trace element of interest is manganese, which washighest at Tikrit (Table 4). The highest manganese concentra-tions occurred in TSP and PM10, and the lowest concentrations inthe PM2.5 fraction. For all 15 sites, manganese is associated withthe coarse fraction of dust corresponding to days of high par-ticulate matter concentrations and also to recorded dust events(Figure 7D).
Major Chemical SpeciesElevated levels of major chemical species occur during dust
events at all 15 sites. In the case of Baghdad, major dust eventswere recorded on 9 March 2006, 8 May 2006, 13 August 2006,19 October 2006, and 30 November 2006. This is reflected bythe time-series plots for silicon, aluminum, calcium, and man-
ganese (Figure 7), which are similar for iron, magnesium, potas-sium, and sodium. The large mass differences between the TSPand PM10, as well as PM10 and PM2.5, soil-forming compo-nents show that these chemical species are largely in coarse dustfractions. As previously shown (Table 3), the coarse mineralscontain the major chemical species; the proportion of mineraldust in the PM2.5 fraction is small (on average <38).
Total particulate matter distribution (Figure 2) is reflected inthe total major element distribution patterns—with Tikrit, Tallil,and Central Kuwait having the highest average total major-element concentrations. The mass fractions of major chemicalspecies are graphically presented as oxides, nitrate, sulfate, am-monium, and chloride (Figure 8). Although there are differencesamong some sites, there is consistency among the three size

CHARACTERIZING AEROSOLS FROM THE MIDDLE EAST—PART 1 315
FIG. 12. Secondary electron images and EDS spectra of two particles on a Nuclepore©R filter sampled in Balad, Iraq: (A) zinc/lead
(Zn/Pb) particle with carbon, possibly from a lead and dry cell battery smelting facility; and (B) lead (Pb) particle from leadsmelting. Dark circles in the field are approximately 0.4 µm pores in the Nuclepore
©R membrane filters.

316 J. P. ENGELBRECHT ET AL.
FIG. 13. Secondary electron images and EDS spectra of two particles on a Nuclepore©R filter sampled in Balad, Iraq. Both (A)
and (B) are sections of carbon chains containing high concentrations of lead (Pb), bromine, and chlorine often associated withemissions from leaded gasoline vehicles.
fractions: TSP and PM10 are similar for all 15 sites. Mass frac-tions of SiO2 are smallest in PM2.5, because this oxide is largelycontained in hard and coarse mineral quartz. The SiO2 content isthe highest at Khowst in Afghanistan for all size fractions; thisfinding can be ascribed to a high percentage of SiO2-rich silt in
local dust. Similarly, CaO and CO2, which are both contained inthe carbonate mineral calcite, have slightly higher mass fractionsin TSP and PM10.
Chloride from sea salt was found in TSP and PM10 at Dji-bouti, a site on the Gulf of Aden. Sulfate, partly as secondary

CHARACTERIZING AEROSOLS FROM THE MIDDLE EAST—PART 1 317
FIG. 14. Secondary electron images from Bagram (A and B), Qatar (C), and United Arab Emirates (D) samples. Dark circles inthe field are approximately 0.4 µm pores in the Nuclepore
©R membrane filters.
ammonium sulfate and also as gypsum, is concentrated in thePM2.5 size fraction. High concentrations of sulfate were found inPM2.5 at Djibouti, Qatar, UAE as well as Coastal and SouthernKuwait. Sulfate as secondary ammonium sulfate was in all like-lihood from sulfur dioxide emissions from petrochemical andother industries in the Middle East. Compared to the other sites,UAE and Al Asad samples had slightly higher CaO, MgO,and CO2 contents representing contributions from calcite anddolomite soils in these two regions (Engelbrecht et al., in press).
In general, analyzed dust from these 15 Middle East sitesare not considered to be out of the ordinary. A comparison ofTSP filter chemistry from this program with dust from various
parts of the southwestern US, Sahara, and China is given inFigure 9. Most dust samples contain mixtures of silicate min-erals, carbonates, oxides, sulfates, and salts, in various propor-tions, as reflected by their chemistry. Differences lie in the rel-ative proportions of these minerals and subsequent chemicalcomponents. Compared with the Sahara, China, US, and worlddusts, Middle East samples had lower proportions of SiO2 andhigher proportions of CaO and MgO. The last two componentsare contained in the carbonate minerals calcite and dolomite andwere found in higher concentrations at the UAE and Al Asadsites. Fe2O3 and MnO occur as various iron–manganese miner-als, found in greater concentrations in the Sahara, China and US

318 J. P. ENGELBRECHT ET AL.
FIG. 15. Secondary electron images from Baghdad (A–C) and Tikrit (D). Dark circles in the field are approximately 0.4 µm poresin the Nuclepore
©R membrane filters.
when compared with the Middle East sample sets. Al2O3, a ma-jor constituent of clay minerals and other silicates, was found tobe similar for most dusts. Sodium generally occurs as salt fromevaporated sea water as well as saline desert areas.
Electron MicroscopySEM provided chemical and morphological information
about individual particles collected on Nuclepore©R filters at
each of the 15 sites. Chemical compositions of the individualparticles were similar to chemical composition results from theTeflon
©R and quartz fiber filter samples collected in the ambientatmosphere at these sites. CCSEM provided chemical and mor-
phological analyses of approximately 1,000 particles per filtermeasured on a total of 243 Nuclepore
©R filters (Table 5).Figure 10A presents results of 3–10 compounded PM10
Nuclepore©R filters from each of the 15 sampling sites. Parti-
cles were classed into chemical ‘bins’, some of which wereinterpreted as minerals, based on XRD measurements of <38µm sieved soil samples (Engelbrecht et al., in press). In thisfashion, we interpreted Ca-Mg particles as dolomite, Ca-richas calcite, Si-Al-Mg rich as clay, Si-rich as quartz, and so on.The ‘bin’ with the highest mass fraction at all 15 sites is Si-Al-Mg (clay), varying from 27% for UAE to 59% for Tallil.Except for UAE and Al Asad, which have higher concentrations
CHARACTERIZING AEROSOLS FROM THE MIDDLE EAST—PART 1 319
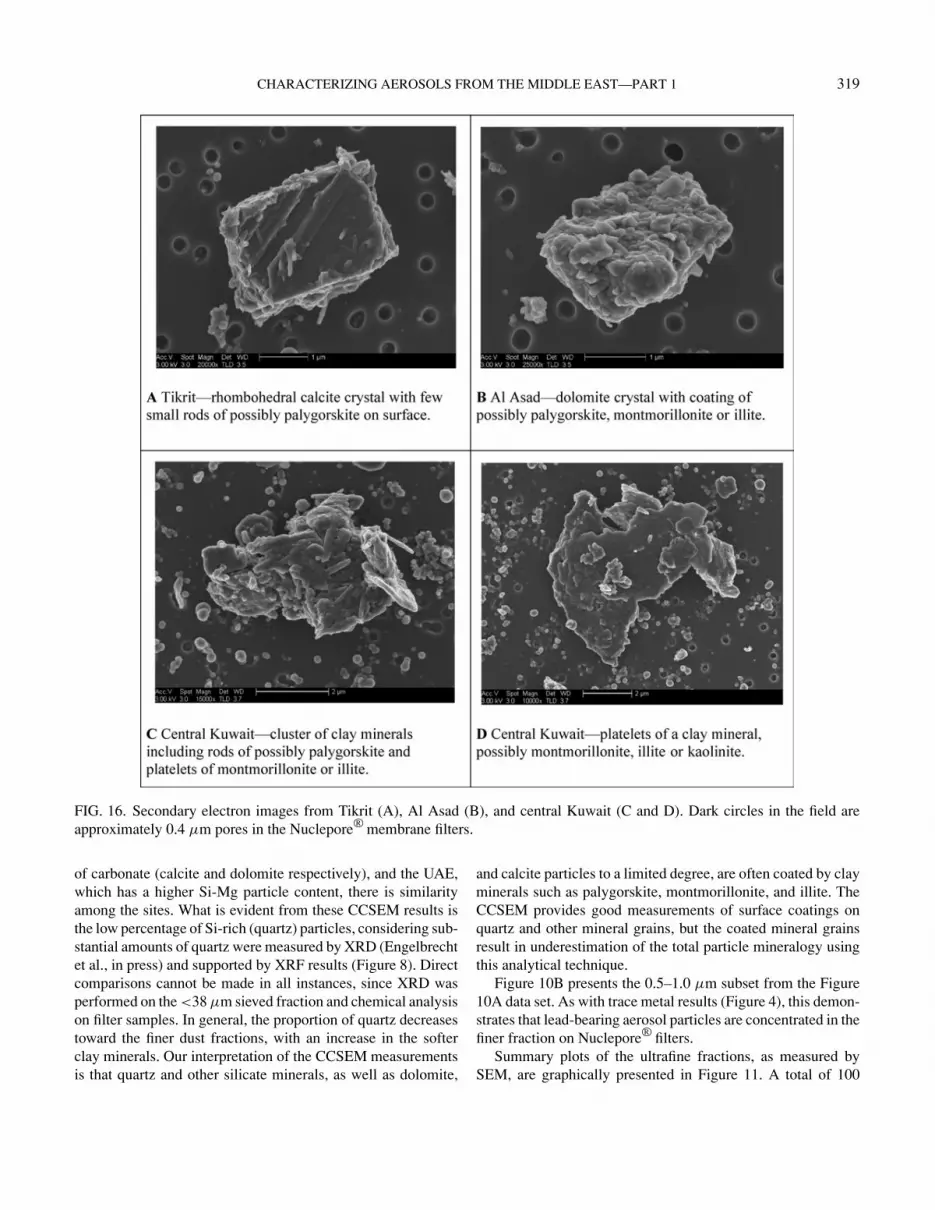
FIG. 16. Secondary electron images from Tikrit (A), Al Asad (B), and central Kuwait (C and D). Dark circles in the field areapproximately 0.4 µm pores in the Nuclepore
©R membrane filters.
of carbonate (calcite and dolomite respectively), and the UAE,which has a higher Si-Mg particle content, there is similarityamong the sites. What is evident from these CCSEM results isthe low percentage of Si-rich (quartz) particles, considering sub-stantial amounts of quartz were measured by XRD (Engelbrechtet al., in press) and supported by XRF results (Figure 8). Directcomparisons cannot be made in all instances, since XRD wasperformed on the <38 µm sieved fraction and chemical analysison filter samples. In general, the proportion of quartz decreasestoward the finer dust fractions, with an increase in the softerclay minerals. Our interpretation of the CCSEM measurementsis that quartz and other silicate minerals, as well as dolomite,
and calcite particles to a limited degree, are often coated by clayminerals such as palygorskite, montmorillonite, and illite. TheCCSEM provides good measurements of surface coatings onquartz and other mineral grains, but the coated mineral grainsresult in underestimation of the total particle mineralogy usingthis analytical technique.
Figure 10B presents the 0.5–1.0 µm subset from the Figure10A data set. As with trace metal results (Figure 4), this demon-strates that lead-bearing aerosol particles are concentrated in thefiner fraction on Nuclepore
©R filters.Summary plots of the ultrafine fractions, as measured by
SEM, are graphically presented in Figure 11. A total of 100

320 J. P. ENGELBRECHT ET AL.
FIG. 17. Secondary electron images and EDS spectra of two spherical ultrafine (approx. 0.2 µm diameter) particles on Nuclepore©R
filters: (A) carbon particle with sulfur from Southern Kuwait and (B) carbon particle with sodium and sulfur from Coastal Kuwait.Both particles may be from combustion of sulfur-rich oil, including diesel fuel. Dark circles in the field are approximately 0.4 µmpores in the Nuclepore
©R membrane filters.

CHARACTERIZING AEROSOLS FROM THE MIDDLE EAST—PART 1 321
FIG. 18. Secondary Electron Images and EDS spectra of two spheroids of ultrafine (approx. 0.5 µm diameter) particles onNuclepore
©R filters: (A) carbon particle with sulfur from Al Asad and (B) carbon particle from Tikrit in Iraq. Both particles maybe from the combustion of oil, including diesel fuel. Dark circles in the field are approximately 0.4 µm pores in the Nuclepore
©R
membrane filters.

322 J. P. ENGELBRECHT ET AL.
FIG. 19. Secondary electron images and EDS spectra of two spheroids of ultrafine (approx. 0.4 µm diameter) particles onNuclepore
©R filters: (A) carbon-sodium-sulfur particle from central Kuwait, (B) carbon particle composed of smaller carbonparticles from Taji, Iraq. Both particles may be from oil-combustion processes. Dark circles in the field are approximately0.4 µm pores in the Nuclepore
©R membrane filters.

CHARACTERIZING AEROSOLS FROM THE MIDDLE EAST—PART 1 323
FIG. 20. Particle-size distributions by mass percentage, as measured by CCSEM, of TSP samples collected on Nuclepore©R filters.
particles <0.5 µm in diameter were analyzed on Nuclepore©R
membrane filters: one PM2.5 filter from each of the 15 sites. Be-cause of the small particle sizes, 50 particles <0.2 µm from eachfilter were manually analyzed by SEM, and another 50 particles0.2–0.5 µm in diameter were analyzed by interactive CCSEM.The purpose was to establish if trace metals or particles of con-cern are concentrated in this size fraction. From particle-sizedistribution patterns (Figure 20), total mass in the ultrafine sizefraction was estimated to be far less than 1% of total mass onthe filters.
Chemistry and morphology of the ultrafines were found todiffer substantially from those of the coarser fractions. Theformer contains far less geological components (e.g. silicon,aluminum, iron, manganese, calcium, or magnesium) then thecoarser fractions. Ultrafines very often contain spheroidal par-ticles of carbon, together with sulfur, sodium, and chlorine(Figures 17–19) and, in a few instances, lead, bromine, andchlorine (Figure 13). The origin of the spheroids is uncertain,but it can be assumed from their carbon and sulfur contentthat many of these are from various oil, gasoline, and natural-gas combustion processes, including motor-vehicle emissions.Chromium-rich and vanadium-rich particles typical of igneousrocks from the Rift Valley region were analyzed in ultrafinesfrom Djibouti (Figure 11B). Trace amounts of nickel fromBagram, as well as titanium and nickel from Southern Kuwait,may be of geological origin. Lead measured in the Balad sampleis likely to be from lead smelters and gasoline vehicle emissions.
Lead on the Bagram filter is probably from gasoline vehicleemissions.
Transmission electron microscope measurements for air-borne asbestos were performed on one Nuclepore
©R filter fromeach site. No asbestos fibers were found using this method(Yamate et al., 1984).
Figures 12–19 are high-resolution secondary electron imagesof mineral grains from selected sampling sites. These imagesshow a variety of crystal forms, including dolomite and calcite,as well as aggregates and coatings of clay minerals. Although de-tailed clay mineral analysis was not performed on these samples,several findings regarding the clays of the Middle East (Kahlafet al., 1985; Cagatay, 1990; Al-Jaboury, 2006), as well as ourCCSEM and secondary electron images, are evidence for Mg-Al-Si particles being a clay phase. We interpret rods and fibersas palygorskite (Figures 15D and 16C) and the platelets as mont-morillonite or montmorillite mixed layers or kaolinite (Figures14C, 15B, and 16D).
A particle size distribution for each of the 15 sites was com-piled from the composite (1–3 filters) TSP Nuclepore
©R samples.All sites show a positive skewed distribution, and all exceptBaghdad have a distinct maximum in the 2.5–5.0 µm size range(Figure 20, Table 6). Distributions from the Djibouti, the UAE,Balad, Baghdad, and northern and coastal Kuwait samples havea slightly bimodal concentration, with a minor peak in the 10–15 µm size range. We ascribe these to wind-blown dust eventsproducing large particles.

324 J. P. ENGELBRECHT ET AL.
TABLE 6Particle-size distributions by mass percentage, as measured by computer-controlled scanning electron microscopy (CCSEM) on
Nuclepore©R filters.
Bin Size Site locality 0.5–1 µm 1–2.5 µm 2.5–5 µm 5–7.5 µm 7.5–10 µm 10–15 µm >15 µmSite No. Site ID % % % % % % %
1 Djibouti DJI LEM 1.2 18.6 36.2 16.1 9.5 11.2 7.32 Bagram, Afghanistan AFG BAG 0.9 16.1 42.1 32.6 5.2 3.1 0.03 Khowst, Afghanistan AFG SAL 1.8 19.8 47.8 18.6 8.1 3.9 0.04 Qatar QAT UDE 1.3 14.0 34.7 30.1 15.2 4.7 0.05 United Arab Emirates UAE DHA 0.8 10.4 28.6 26.2 14.8 16.7 2.46 Balad, Iraq IRQ ANA 1.9 21.2 50.5 18.6 3.5 4.4 0.07 Baghdad, Iraq IRQ VIC 0.6 10.3 27.0 28.0 15.9 18.1 0.08 Tallil, Iraq IRQ ADD 1.9 34.1 44.7 14.8 4.5 0.0 0.09 Tikrit, Iraq IRQ SPE 1.7 31.8 54.2 11.2 0.0 1.1 0.010 Taji, Iraq IRQ TAJ 0.6 14.6 56.5 22.3 5.1 1.0 0.011 Al Asad, Iraq IRQ ALA 2.0 18.6 39.4 22.8 12.4 4.7 0.012 Northern Kuwait KUW BUE 0.5 11.0 42.0 25.5 10.1 10.8 0.013 Central Kuwait KUW AAS 1.7 38.8 48.8 9.0 1.6 0.0 0.014 Coastal Kuwait KUW SHU 1.1 13.9 29.2 21.9 15.3 18.7 0.015 Southern Kuwait KUW ARI 1.0 17.4 33.6 22.2 16.2 9.7 0.0
It is of note that, except for small percentages in Djibouti andthe UAE samples, no particles were recorded in the >15 µmsize ‘bin’.
DISCUSSION AND CONCLUSIONSThis study characterized three main air-pollution sources: ge-
ological dust; smoke from burn pits; and until-now-unidentifiedlead-zinc smelters and battery-processing facilities. The EPMSPhas demonstrated the benefits of integrating the analytical resultsobtained from different measurement techniques into our under-standing of the relative contributions of mineral dusts and otheraerosols, as encountered at deployment locations within the USCentral Command’s area of responsibility. This study includescomparative analysis of TSP, PM10, and PM2.5 filter samplescollected over a period of 1 year. It also includes analysis andcomparison to 15 bulk samples from each of the military basesthroughout the Middle East (Engelbrecht et al., in press).
Aerosol characterization included chemical analysis by XRF,ICP-MS, ion chromatography, ICP-OES, and thermal opticaltransmission, mineral analysis by XRD, and individual particleanalysis by CCSEM. After validation, all analytical results werecompiled on spreadsheets (grouped by sampling site, analyticaltechnique, and chemical species) and posted on the password-protected EPMSP webpage maintained by the Desert ResearchInstitute.
Although only about 7% of the days during the 2006–2007year were sampled on Teflon
©R filters (same percentage for quartzfiber), background levels and areas of concern were identified.Therefore, statistics such as annual averages do not have thesame level of confidence as for IMPROVE and CSN monitoring
programs, where both Teflon©R and quartz fiber filters are sam-
pled on 1-in-3 or 1-in-6 day sampling schedule, giving 33% or16.7% of the days per year sampled.
Short-term dust events—exacerbated by dirt roads, agricul-tural activities, and disturbance of the desert surface by mo-torized vehicles—are largely responsible for the exceeding ofparticulate-matter annual exposure guidelines and standards(Table 4). The highest annual average for PM10 was recorded atTallil (303 µg/m3), followed by Tikrit and central Kuwait. Allsites exceed the USACHPPM 1-year air MEG value of 15 µg/m3
for PM2.5.By comparison, average PM10 and PM2.5 mass and chemi-
cal concentration levels from the Middle East deployment sitesare—except for a few substances such as nitrate, sodium, andrubidium—as many as 10 times greater than those from five ru-ral (IMPROVE) and five urban (CSN) sites in the southwesternUS.
In general, we do not consider dust from studied areas inthe Middle East to be out of the ordinary. Comparison of dustsamples from the 15 Middle East sites with dust from the US,Sahara, and China shows similar chemical and mineralogicalconstituents in most cases. Generally, all dust samples containmixtures of silicate minerals, carbonates, oxides, sulfates, andsalts in various proportions. Differences lie in the relative pro-portions of these minerals and chemical components in differ-ent soils. In comparison with the Sahara, China, US, and worlddusts, Middle East samples had lower proportions of SiO2 andhigher proportions of CaO and MgO. The last two componentsare contained in carbonates, such as calcite and dolomite in thesoil, more evident in Al Asad and the UAE. Fe2O3 and MnO

CHARACTERIZING AEROSOLS FROM THE MIDDLE EAST—PART 1 325
occur as iron and manganese oxides in greater concentrations inthe Sahara, China, and US dust, compared with the 15 MiddleEast sites.
Dust events subsequently result in short-term elevated levelsof soil-forming elements (Figure 7), including magnesium, alu-minum, silicon, potassium, calcium, titanium, vanadium, man-ganese, iron, rubidium, strontium, zirconium, and barium.
Events at Baghdad, Balad, and Taji not corresponding to duststorms resulted in elevated trace-metal concentrations at thesesites (Figures 4 and 6). The metals that vary simultaneously witheach other (Figure 5) include lead, arsenic, cadmium, antimony,and zinc—all concentrated in the PM2.5 size fraction. CCSEMresults (Figure 10B) also indicate that lead concentrated in thefine size fraction (0.5–1.0 µm).
In addition to the burn pits, a major potential source oflead and associated zinc, cadmium, arsenic, and antimony inthe Baghdad–Balad–Taji region are emissions from secondarylead smelters (http://www.cpa-iraq.org/business/industries/Battery%20Co.xls) and related battery-manufacturing facilitiesaffecting the population. As Iraq uses leaded gasoline, vehicleemissions are a contributing source of lead in the atmosphere.Lead from vehicles previously deposited on dirt roads is alsocontinually being re-suspended and may for many years there-after be a source of aerosol lead. Exploded ordnance also maybe a minor contributor of heavy metals in the air during events.Secondary lead-smelting facilities were also reported at Fallujah(http://minerals.usgs.gov/minerals/pubs/country/2001/izmyb01.pdf). Lead smelters have been found to be major sources oflead in Cairo’s ambient atmosphere (Abu-Allaban et al.,2007). Melting down of old circuit boards and other electroniccomponents for their metal content has been shown to exposecommunities to extremely high levels of dioxins and metalssuch as lead, cadmium, and mercury (Carroll & Essik, 2008).
Under fall-to-spring meteorological conditions, heavy-metalpollutants may be trapped within the boundary layer and affectmilitary bases at Baghdad, Balad, and Taji, as well as the Iraqipopulation living along at least a 75 km stretch of the TigrisRiver valley.
CCSEM results and secondary electron imagery (Figures 14–16) show that quartz and other silicate minerals and, to a lesserextent, dolomite and calcite particles are coated by a thin Si-Al-Mg layer, probably the clay minerals palygorskite, montmoril-lonite, and illite. Carbon chains (Figures 13A and 15C) are fromcombustion sources, possibly diesel vehicle emissions or burnpits.
Further research areas included looking for freshly fracturedshards of quartz. Several hundred SEM secondary electron im-ages of individual particles from all 15 sites provided no evi-dence of such freshly fractured quartz grains. In all instances,quartz grains had rounded edges and were generally coated byclay minerals and iron oxides.
Transmission electron microscope measurements for air-borne asbestos were performed on one Nuclepore
©R filter fromeach site. No asbestos fibers were found.
CCSEM analysis of several million individual particlesshowed not more than 2.5% carbon by mass on average at any ofthe sites, with the highest average carbon abundances measuredon PM2.5 in Bagram and Baghdad.
ENDNOTES1. US Environmental Protection Agency Quality Assurance
Guidance Document 2.12—Monitoring PM2.5 in Ambi-ent Air Using Designated Reference or Class I EquivalentMethods, November 1998.
2. National Institute for Occupational Safety and Health(NIOSH) Method 5040—Elemental Carbon (Diesel Par-ticulate), Issue 3 (interim), September 1999.
DECLARATION OF INTERESTThe authors report no conflicts of interest. The authors alone
are responsible for the content and writing of the paper.
ACKNOWLEDGEMENTSWe acknowledge contributions by the military public-health
soldiers, sailors, and airmen whose efforts were necessary tocomplete the Enhanced Particulate Matter Surveillance Program(EPMSP). The dedicated effort shown by all participating unitsin the field, who operated the sampling equipment and collectedfilter and grab samples, is greatly appreciated. We acknowl-edge major contributions from the two collaborating laborato-ries: RTI International, for the filter processing and chemicalanalysis; and RJ Lee Group Inc. (specifically Traci Lersch), forthe CCSEM and SEM individual particle analysis. Thanks arealso due to several researchers at DRI who contributed theirexpertise to the analyses and this report: Micha�l Skiba for theXRD analysis; Todd Caldwell for analysis of the soil samples;Steve Kohl for the analyses of the re-suspended filter samples,and Dave Campbell for compiling the IMPROVE, CSN, andstandards data, and map of the US sampling sites. Finally, thefollowing individuals deserve special recognition for their con-tributions: Greta Engelbrecht, for data validation, compilationof results, and preparing graphical representations; and JamesSheehy and John Kolivosky of USACHPPM, for their supportfrom the inception of the Enhanced Particulate Matter Surveil-lance Program to its completion. The project was funded underthe US Department of Defense contract number W9124R-05-C-0135/SUBCLIN 000101-ACRN-AB.
REFERENCESAbu-Allaban, M., Lowenthal, D. H., Gertler, A.W., and Labib, M.
(2007). Sources of PM10 and PM2.5 in Cairo’s ambient air. Env-iron. Monitor. Assess. 133: 417–425.
Al-Awadhi, J.M. (2005). Dust fallout characteristics in Kuwait: A casestudy. Kuwait J. Sci. Engin. 32:135–151.
Al-Juboury, A. I. (2006). Authigenic palygorskite in the MiddleMiocene rocks of Iraq: Environmental and geochemical indicators.Geophys. Res. Abstr. 8: 01584.

326 J. P. ENGELBRECHT ET AL.
Cagatay, M. N. (1990). Palygorskite in the Eocene rocks of theDammam Dome, Saudi Arabia. Clays Clay Min. 38: 299–307.
Carroll, C., and Essik, P. (2008). High-tech trash. Natl. Geograph. 213:64–81.
Clarke, F. W. (1916). The data of geochemistry. 3rd ed. United StatesGeological Survey, Washington, DC.
Engelbrecht, J. P., Swanepoel, L., Chow, J. C., Watson J. G., and Egami,R. T. (2001). PM2.5 and PM10 Concentrations from the QalabotjhaLow-Smoke Fuels Macro-Scale Experiment in South Africa. Envi-ron. Monitor. Assess. 69: 1–15.
Engelbrecht, J. P., McDonald, E. V., Gillies, J. A., and Gertler,A. W. (2008). Department of Defense Enhanced Particulate MatterSurveillance Program (EPMSP). Desert Research Institute. ReportContract Number: W9124R-05-C-0135/SUBCLIN 000101-ACRN-AB.
Engelbrecht, J. P., McDonald, E. V., Gillies, J. A., Jayanty, R. K. M.,Casuccio, G., and Gertler, A. W. Characterizing mineral dusts andother aerosols from the Middle East—Part 2: Grab samples and re-suspensions. Inhal. Toxicol. 21: 236-335.
Goudie, A. S. and Middleton, N. J. (2006). Desert dust in the globalsystem. Springer, Heidelberg.
Kahlaf, F. I., Al-Kadi, A., and Al-Saleh, S. (1985). Mineralogical com-position and potential sources of dust fallout deposits in Kuwait.Sediment. Geol. 42: 225–278.
Labban, R., Veranth, J. M., Chow, J. C., Engelbrecht, J. P., and Watson,J. G. (2004). Size and geographical variation in PM1, PM2.5, andPM10: Source profiles from soils in the western United States. WaterAir Soil Poll. 157: 13–31.
Yamate, G., Agarwal, S. C., and Gibbons, R. D. (1984). Methodologyfor the measurement of airborne asbestos by electron microscopy.EPA Contract No. 68-02-3266.

Copyright © 2022 FDOKUMEN