Multi-Frequency Multi-Scenario Millimeter Wave MIMO ... - arXiv

Exp Astron (2011) 29:207–225DOI 10.1007/s10686-011-9214-9
ORIGINAL ARTICLE
Characterization of the atmosphere above a sitefor millimeter wave astronomy
Francesco Tony Nasir · Franco Buffa ·Gian Luigi Deiana
Received: 28 June 2010 / Accepted: 5 January 2011 / Published online: 8 February 2011© Springer Science+Business Media B.V. 2011
Abstract The Sardinia Radio Telescope (SRT) is a challeging scientific projectmanaged by the National Institute for Astrophysics (INAF), it is being de-veloped at 30 km North of the city of Cagliari, Italy. The goal of the SRTproject is to build a general purpose, fully steerable, 64 m diameter radiotelescope, capable of operating with high efficiency in the centimeter andmillimeter frequency range (0.3–100 GHz). In portions of this frequency range,especially towards the high end, astronomical observations can be heavilydeteriorated by non-optimal atmospheric conditions, especially by water va-por content. The water molecule permanent electric dipole in fact, leads topressure broadened rotational transitions around the 22.23 GHz spectral line.Furthermore, water vapor’s continuum absorption and emission may influencehigher frequency observations too. To a lower degree, cloud liquid black bodyradiation can also affect centimeter and millimeter observations. In addition tothis, inhomogeneities in water vapor distributions can cause signal phase errorswhich introduce a great amount of uncertainty to VLBI mode observations.The Astronomical Observatory of Cagliari (OA-CA) has obtained historicaltimeseries of radiosonde profiles conducted at the airport of Cagliari. Throughthe radiosonde measurements and an appropriate radiative transfer model,
F. T. Nasir (B) · F. Buffa · G. L. DeianaOsservatorio Astronomico di Cagliari, Loc. Poggio dei Pini, Strada 54,Capoterra (CA) 09012, Italye-mail: [email protected]
F. Buffae-mail: [email protected]
G. L. Deianae-mail: [email protected]
208 Exp Astron (2011) 29:207–225
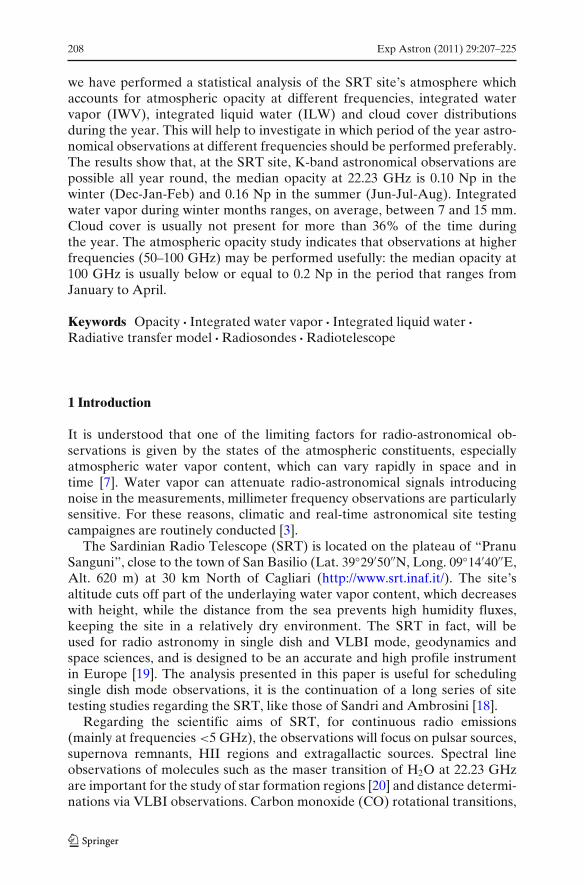
we have performed a statistical analysis of the SRT site’s atmosphere whichaccounts for atmospheric opacity at different frequencies, integrated watervapor (IWV), integrated liquid water (ILW) and cloud cover distributionsduring the year. This will help to investigate in which period of the year astro-nomical observations at different frequencies should be performed preferably.The results show that, at the SRT site, K-band astronomical observations arepossible all year round, the median opacity at 22.23 GHz is 0.10 Np in thewinter (Dec-Jan-Feb) and 0.16 Np in the summer (Jun-Jul-Aug). Integratedwater vapor during winter months ranges, on average, between 7 and 15 mm.Cloud cover is usually not present for more than 36% of the time duringthe year. The atmospheric opacity study indicates that observations at higherfrequencies (50–100 GHz) may be performed usefully: the median opacity at100 GHz is usually below or equal to 0.2 Np in the period that ranges fromJanuary to April.
Keywords Opacity · Integrated water vapor · Integrated liquid water ·Radiative transfer model · Radiosondes · Radiotelescope
1 Introduction
It is understood that one of the limiting factors for radio-astronomical ob-servations is given by the states of the atmospheric constituents, especiallyatmospheric water vapor content, which can vary rapidly in space and intime [7]. Water vapor can attenuate radio-astronomical signals introducingnoise in the measurements, millimeter frequency observations are particularlysensitive. For these reasons, climatic and real-time astronomical site testingcampaignes are routinely conducted [3].
The Sardinian Radio Telescope (SRT) is located on the plateau of “PranuSanguni”, close to the town of San Basilio (Lat. 39◦29′50′′N, Long. 09◦14′40′′E,Alt. 620 m) at 30 km North of Cagliari (http://www.srt.inaf.it/). The site’saltitude cuts off part of the underlaying water vapor content, which decreaseswith height, while the distance from the sea prevents high humidity fluxes,keeping the site in a relatively dry environment. The SRT in fact, will beused for radio astronomy in single dish and VLBI mode, geodynamics andspace sciences, and is designed to be an accurate and high profile instrumentin Europe [19]. The analysis presented in this paper is useful for schedulingsingle dish mode observations, it is the continuation of a long series of sitetesting studies regarding the SRT, like those of Sandri and Ambrosini [18].
Regarding the scientific aims of SRT, for continuous radio emissions(mainly at frequencies <5 GHz), the observations will focus on pulsar sources,supernova remnants, HII regions and extragallactic sources. Spectral lineobservations of molecules such as the maser transition of H2O at 22.23 GHzare important for the study of star formation regions [20] and distance determi-nations via VLBI observations. Carbon monoxide (CO) rotational transitions,

Exp Astron (2011) 29:207–225 209
around 115 GHz and at lower frequencies when red-shifted (≤100 GHz), areparticularly interesting because they represent an indirect way of inferring thehydrogen molecule (H2) distributions in space.
In this frequency range, atmospheric absorption increases steadily withfrequency, this is caused mainly by water vapor continuum absorption; thereasons for this effect are not well understood, the contribution of the far wingsof distant higher frequency lines could be a possible explanation [12]. Further-more, atmospheric opacity near 100 GHz (Fig. 1) is strongly enhanced by cloudliquid. A statistical analysis of water vapor, cloud liquid and opacity at differentfrequencies is useful for scheduling astronomical observations accordingly withthe degree of accuracy requested by the experiment. The optimal observingconditions are often indicated in scientific literature by tresholds of integratedwater vapor (IWV) and opacity values [12]. The present statistical-climaticstudy is part of a more comprehensive and ongoing site testing campaignperformed at the SRT site. Real time water vapor and opacity measurementsare recently being monitored through various instruments such as a profilingradiometer, a geodetic GPS and a surface weather station (http://laser3.oa-cagliari.inaf.it).
In the next section we give an overview of the instruments and the datawhich were used, while in Section 3 we show results and in Section 4, theconclusions are presented.
10-3
10-2
10-1
100
101
102
0 10 20 30 40 50 60 70 80 90 100 110 120 130 140
AT
MO
SP
HE
RIC
OP
AC
ITY
[Np]
FREQUENCY [GHz]
TOTH2O
O2
Mid-Latitude, Cloud Free, Standard Atmosphere
Simulated at Sea Level using Rosenkranz Model (1998)
Fig. 1 Atmosheric opacity as a function of frequency: the continuous line represents the totalopacity caused by the main atmospheric constituents, the dashed line represents the water vaporcontribution and the star-dotted line represents the oxygen contribution
210 Exp Astron (2011) 29:207–225
2 Instrumental and model data
2.1 Radiosondes
In atmospheric sciences, radiosonde observations (RAOBs) are usually con-sidered as the conventional reference for all the other techniques [4, 5, 7].Radiosondes measure preassure, temperature and relative humidity with highvertical resolution and they are launched at least once or twice a day. Goodestimates of IWV, usually expressed in mm, can be obtained by integratingdirectly the water vapor profile [16].
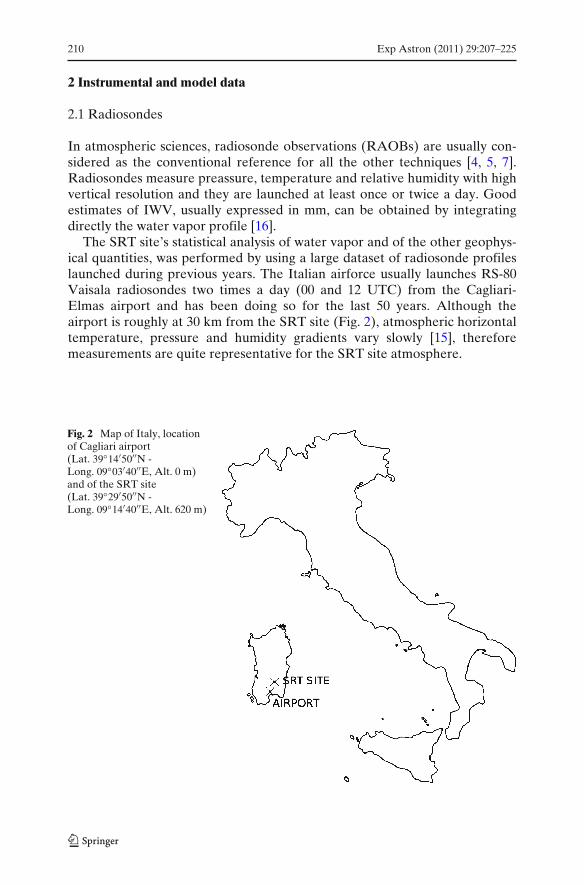
The SRT site’s statistical analysis of water vapor and of the other geophys-ical quantities, was performed by using a large dataset of radiosonde profileslaunched during previous years. The Italian airforce usually launches RS-80Vaisala radiosondes two times a day (00 and 12 UTC) from the Cagliari-Elmas airport and has been doing so for the last 50 years. Although theairport is roughly at 30 km from the SRT site (Fig. 2), atmospheric horizontaltemperature, pressure and humidity gradients vary slowly [15], thereforemeasurements are quite representative for the SRT site atmosphere.
Fig. 2 Map of Italy, locationof Cagliari airport(Lat. 39◦14′50′′N -Long. 09◦03′40′′E, Alt. 0 m)and of the SRT site(Lat. 39◦29′50′′N -Long. 09◦14′40′′E, Alt. 620 m)

Exp Astron (2011) 29:207–225 211
2.2 Cloud liquid model
Integrated liquid water (ILW) is usually measured in mm, it can be obtained byintegrating directly the vertical profiles of cloud liquid water content (LWC)[23]. Cloud liquid droplets can affect absorption and emission processes inthe centimeter and millimeter frequency range, they can also scatter radiation,nevertheless below 100 GHz scattering effects may be neglected [12].
Liquid water content (LWC) is not measured directly by radiosondes, forthis reason we used an empirical cloud liquid model taken from literature[13]. For each vertical level, LWC is obtained by inputing the correspondantradiosonde pressure, temperature and relative humidity measurement. Arelative humidity treshold is evaluated dynamically as a function of pressureat that level and at the surface, if the relative humidity is higher than thetreshold value for that level, condensation occurs and there is liquid water. Theactual value of LWC is then evaluated as a function of temperature; finally byintegrating numerically the LWC profile one can obtain ILW.
Cloud liquid is not easy to evaluate [6], empirical models retrive LWC withsome degree of uncertainty, nevertheless over a large dataset one can obtainstatistically significant values for ILW through which cloud liquid seasonaldistributions at a given site may be obtained.
2.3 Ground-based GPS receiver
A ground-based GPS receiver (Odessey Topcon) has been recently installedat the SRT site. The signal’s excess of optical path, caused by the refractivityof air (zenith total delay ZTD), is retrived from GPS data. The contributionto the delay caused by water vapor (zenith wet delay ZWD) is proportional toIWV through the following relationship [1]:
Z W D = a · IWV; (1)
where a depends on the mean atmospheric temperature but for most applica-tions can be regarded as nearly constant and approximately equal to 6.3 [8].
In order to prove that the airport radiosonde dataset is representativefor the SRT site’s atmosphere, we compared the airport radiosonde IWVestimates to the SRT site ones, the latter have been estimated with the GPSreceiver. Through this analysis we noticed two things: firstly that the datapoints are quite well correlated and are tightly scattered around the unit slopeline. This means that the SRT and the airport site’s atmosphere are usuallyvery similar, more over, the horizontal distance between the two sites is notclimatically relevant. Secondly, the offset in the scatter plots indicates that theairport IWV estimates are usually higher than the SRT ones, this is coherentwith the fact that the SRT site is at an altitude of 620 m while the airport is at
212 Exp Astron (2011) 29:207–225
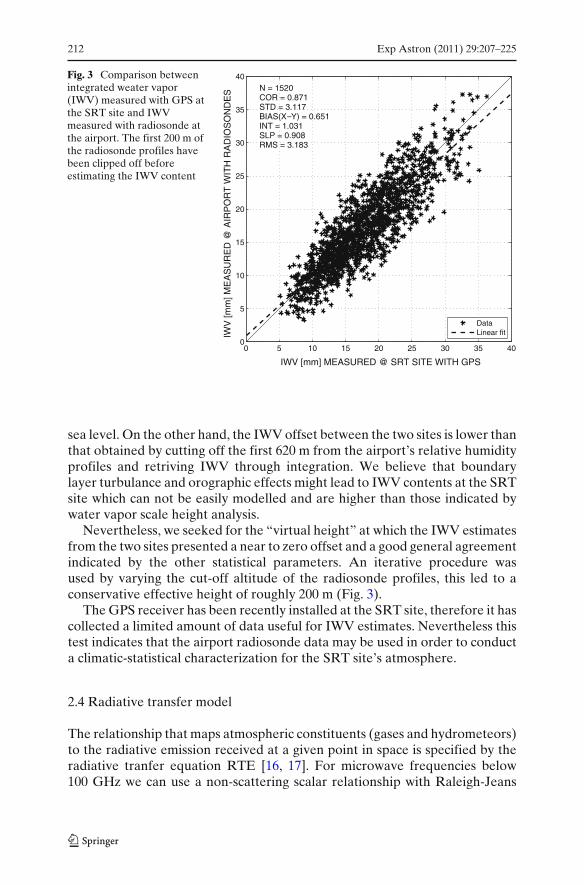
Fig. 3 Comparison betweenintegrated weater vapor(IWV) measured with GPS atthe SRT site and IWVmeasured with radiosonde atthe airport. The first 200 m ofthe radiosonde profiles havebeen clipped off beforeestimating the IWV content
0 5 10 15 20 25 30 35 400
5
10
15
20
25
30
35
40
IWV [mm] MEASURED @ SRT SITE WITH GPS
IWV
[mm
] ME
AS
UR
ED
@ A
IRP
OR
T W
ITH
RA
DIO
SO
ND
ES N = 1520
COR = 0.871STD = 3.117BIAS(X Y) = 0.651INT = 1.031SLP = 0.908RMS = 3.183
DataLinear fit
sea level. On the other hand, the IWV offset between the two sites is lower thanthat obtained by cutting off the first 620 m from the airport’s relative humidityprofiles and retriving IWV through integration. We believe that boundarylayer turbulance and orographic effects might lead to IWV contents at the SRTsite which can not be easily modelled and are higher than those indicated bywater vapor scale height analysis.
Nevertheless, we seeked for the “virtual height” at which the IWV estimatesfrom the two sites presented a near to zero offset and a good general agreementindicated by the other statistical parameters. An iterative procedure wasused by varying the cut-off altitude of the radiosonde profiles, this led to aconservative effective height of roughly 200 m (Fig. 3).
The GPS receiver has been recently installed at the SRT site, therefore it hascollected a limited amount of data useful for IWV estimates. Nevertheless thistest indicates that the airport radiosonde data may be used in order to conducta climatic-statistical characterization for the SRT site’s atmosphere.
2.4 Radiative transfer model
The relationship that maps atmospheric constituents (gases and hydrometeors)to the radiative emission received at a given point in space is specified by theradiative tranfer equation RTE [16, 17]. For microwave frequencies below100 GHz we can use a non-scattering scalar relationship with Raleigh-Jeans

Exp Astron (2011) 29:207–225 213
approximation, in this case radiative emission may be expressed in terms ofbrightness temperature Tb as [24]:
Tb (ν) = Tce−τν (0,∞) +∫ ∞
0αν(z)T(z)e− ∫ z
0 αν(z′)dz′dz; (2)
where αν is the absorption coefficient at a given frequency ν expressedin Np/m, it is a function of humidity, cloud liquid and other atmosphericconstituents, T is the physical temperature, Tc is the cosmic backgroundtemperature and
τν =∫ ∞
0αν(z)dz (3)
is the atmospheric opacity (integrated atmospheric absorption) evaluatedalong the path z. In general it is important to note that equation (2) yieldstwo cases:
– direct problem: given a set of atmospheric radiosonde profiles (e.g. relativehumidity, temperature, pressure and liquid water content) one wants toevaluate atmospheric emission and/or absorption.
– indirect problem: given a set of radiative measurements (e.g. radiometerTb measurements) we want to retrive atmospheric profiles such as tem-perature and relative humidity ones and/or integrated quantities such asIWV and ILW.
In this article we used the atmospheric radiative transfer simulator (ARTS)to simulate the SRT site’s atmospheric emission/absorption [2] through thedirect problem. In particular we simulated opacity at the frequencies of interestfor SRT by using the radiosonde dataset as input. In addition to this, cloudliquid water profiles were simulated with the empirical model described inSection 2.2 and fed into ARTS as input (Fig. 4). Although the radiativetransfer simulator can model scattering by hydrometeors we only consideredabsorption and emission of radiowaves due to cloud liquid, this is justifiedby the fact that only frequencies equal or lower than 100 GHZ are beingconsidered [6].
Fig. 4 Block diagramindicating the steps taken tocalculate IWV, ILW andopacity statistics through theempirical cloud liquid modeland the atmospheric radiativetransfer model

214 Exp Astron (2011) 29:207–225
3 Results and data analysis
The following quantities have been calculated by using radiosonde profiles, thedataset embraces nearly 50 years of measurements. Firstly, water vapor andcloud liquid statistics are shown, followed by opacity statistics at 22.23 and 100GHz. The effect of cloud liquid on the atmospheric absorption mechanisms isillustrated in scatter plots of clear sky opacity versus cloudy sky opacity at 22.23and at 100 GHz. Finally the information is sumerized in tables that account foreach month of the year at the possible SRT observing frequencies.
3.1 Integrated water vapor
In Fig. 5 we show the probability during the winter of finding IWV contentsbelow an arbitrary value. An indicative IWV content treshold, under whichvery good millimetric astronomical observations may be performed, is 10 mm[10]. Figure 5 shows that in the winter the SRT site has a 40–45% probabilityof having IWV values below that treshold.
In Fig. 6 we show the same physical quantity during the summer months, inthis case, there is less than 10% probability of observing IWV contents below10 mm. Furthermore in Fig. 7, IWV monthly statistics are presented in the
0 5 10 15 20 25 300
0.1
0.2
0.3
0.4
0.5
0.6
0.7
0.8
0.9
1
Integrated water vapor [mm]
Nor
mal
ized
Cum
ulat
ive
Dis
trib
utio
n F
unct
ion
Winter
Fig. 5 Normalized cumulative distribution function of IWV during the winter season (Dec-Jan-Feb) at the SRT site obtained through radiosonde launches performed at Cagliari airport

Exp Astron (2011) 29:207–225 215
0 5 10 15 20 25 300
0.1
0.2
0.3
0.4
0.5
0.6
0.7
0.8
0.9
1
Integrated water vapor [mm]
Nor
mal
ized
Cum
ulat
ive
Dis
trib
utio
n F
unct
ion
Summer
Fig. 6 Normalized cumulative distribution function of IWV during the summer season (Jun-Jul-Aug) at the SRT site obtained through radiosonde launches performed at Cagliari airport
Jan Feb Mar Apr May Jun Jul Aug Set Oct Nov Dec8
10
12
14
16
18
20
22
24
26
28
25th
, 50t
h, 7
5th
perc
entil
es fo
r IW
V [m
m]
Months
25th percentile50th percentile
75th percentile
Fig. 7 Monthly quartile plots for integrated water vapor at the SRT site

216 Exp Astron (2011) 29:207–225
Jan Feb Mar Apr May Jun Jul Aug Set Oct Nov Dec0
0.1
0.2
0.3
0.4
0.5
0.6
0.7
25th
, 50t
h, 7
5th
perc
entil
es fo
r IL
W [m
m]
Months
25th percentile50th percentile75th percentile
Fig. 8 Monthly quartile plots for integrated liquid water at the SRT site
form of quartile plots. From December to April there is a significant numberof IWV meausurements below or close to 10 mm.
3.2 Cloud liquid water
As will be shown in the next sections cloud liquid can influence the absorptionand emission properties of the atmosphere. In this section, statistics of inte-grated liquid water (ILW) content and cloud cover time are shown (Figs. 8, 9).In Fig. 8 it can be seen that ILW is highest during the summer and the firstmonths of autumn, in particular during June, September and October. Aconsistent number of cloudy events is characterized by ILW values below 0.6mm in the summer and below 0.2 mm in the winter. In Fig. 9 we can see thatduring the winter months clouds are present 40–45% of the time while in thesummer 20–25% of the time.
Although in the summer cloudy event are less probable (Fig. 9) they areusually characterized by high values of ILW (Fig. 8). In the winter instead,cloudy events are more probable nevertheless they are usually character-ized by lower values of ILW. Obviously both in the winter and in thesummer there can be some extremely bad weather events in which ILWvalues are much higher than those indicated by the 75th percentile curve inFig. 8.

Exp Astron (2011) 29:207–225 217
Jan Feb Mar Apr May Jun Jul Aug Set Oct Nov Dec0
5
10
15
20
25
30
35
40
45
50
Per
cent
of t
ime
with
clo
udy
sky
Months
Fig. 9 Percentage of time during each month, at the SRT site, characterized by the presence ofclouds
0 0.05 0.1 0.15 0.2 0.25 0.30
0.1
0.2
0.3
0.4
0.5
0.6
0.7
0.8
0.9
1
Opacity @ 22.23 GHz [Np]
Nor
mal
ized
Cum
ulat
ive
Dis
trib
utio
n F
unct
ion
Winter
Fig. 10 Normalized cumulative distribution function of the opacity at 22.23 GHz during the winterseason (Dec-Jan-Feb) at the SRT site obtained through radiosonde launches performed at Cagliariairport

218 Exp Astron (2011) 29:207–225
3.3 Atmospheric opacity at 22.23 and 100 GHz
Atmospheric opacity can be obtained through (3) and it can be though of asthe absorption coefficient at a given frequency integrated throughout all ofthe atmosphere in a particular direction (e.g., zenith direction). As mentionedearlier, the 22.23 GHz frequency is used to observe maser transitions of thewater molecule in space, it will be amongst the first frequencies to be observedwith the SRT. In Fig. 10 it can be seen that the 22.23 GHz opacity is lower than0.15 Np 90% of the time and it is lower than 0.1 Np 60% of the time. During thesummer months (Fig. 11), the opacity is lower than 0.15 Np roughly 40–45% ofthe time. Monthly quartiles for opacity at 22.23 GHz have been calculated andare shown in Fig. 12; the trend of the percentile curves is similar to that of thecurves in Fig. 7 due to the strong correlation between 22.23 GHz absorptionand atmospheric water vapor.
The same anaylisis has been performed for the 100 GHz frequency(Figs. 13, 14), important for carbon monoxide detection which in turn is usefulto infer distributions of the hydrogen molecule in space. As we know, theatmospheric opacity at this frequency is usually high due to atmospheric watervapor continuum absorption (Fig. 1) and cloud liquid water. In Fig. 13 it canbe seen that in the winter there is a 30–33% probability of finding 100 GHzopacity below 0.15 Np, this yelds for roughly 40 days of very good observations.
0 0.05 0.1 0.15 0.2 0.25 0.30
0.1
0.2
0.3
0.4
0.5
0.6
0.7
0.8
0.9
1
Opacity @ 22.23 GHz [Np]
Nor
mal
ized
Cum
ulat
ive
Dis
trib
utio
n F
unct
ion
Summer
Fig. 11 Normalized cumulative distribution function of the opacity at 22.23 GHz during thesummer season (Jun-Jul-Aug) at the SRT site obtained through radiosonde launches performedat Cagliari airport

Exp Astron (2011) 29:207–225 219
Jan Feb Mar Apr May Jun Jul Aug Set Oct Nov Dec0.06
0.08
0.1
0.12
0.14
0.16
0.18
0.2
0.22
0.24
25th
, 50t
h, 7
5th
perc
entil
es fo
r 22
.23
GH
Z o
paci
ty [N
p]
Months
25th percentile50th percentile75th percentile
Fig. 12 Monthly quartile plots for 22.23 GHz opacity at the SRT site
0 0.05 0.1 0.15 0.2 0.25 0.30
0.1
0.2
0.3
0.4
0.5
0.6
0.7
0.8
0.9
Opacity @ 100 GHz [Np]
Nor
mal
ized
Cum
ulat
ive
Dis
trib
utio
n F
unct
ion
Winter
Fig. 13 Normalized cumulative distribution function of the opacity at 100 GHz during the winterseason (Dec-Jan-Feb) at the SRT site obtained through radiosonde launches performed at Cagliariairport

220 Exp Astron (2011) 29:207–225
0 0.05 0.1 0.15 0.2 0.25 0.30
0.1
0.2
0.3
0.4
0.5
0.6
0.7
Opacity @ 100 GHz [Np]
Nor
mal
ized
Cum
ulat
ive
Dis
trib
utio
n F
unct
ion
Summer
Fig. 14 Normalized cumulative distribution function of the opacity at 100 GHz during the summerseason (Jun-Jul-Aug) at the SRT site obtained through radiosonde launches performed at Cagliariairport
Jan Feb Mar Apr May Jun Jul Aug Set Oct Nov Dec0.1
0.15
0.2
0.25
0.3
0.35
0.4
0.45
0.5
25th
, 50t
h, 7
5th
perc
entil
es fo
r 10
0 G
HZ
opa
city
[Np]
Months
25th percentile50th percentile75th percentile
Fig. 15 Monthly quartile plots for 100 GHz opacity at the SRT site

Exp Astron (2011) 29:207–225 221
During the summer, good observations at 100 GHz are less probable (Fig. 14).Monthly quartiles for 100 GHz opacity have also been calculated. As can beseen in Fig. 15, during the winter there is a significant number of datapointswhich remain under 0.2 Np. Under this treshold, it is still possible to performquite good astronomical observations at this frequency [9].
3.4 Differences betweeen clear and cloudy sky opacities
To illustrate the effect of cloud liquid on atmospheric opacity at differentfrequencies and therefore the importance of cloud liquid in the radiativetransfer mechanism, we have compared cloudy sky opacity to clear sky opacity.For each frequency, two simultaneous opacity datasets have been produced,the first of which takes into account cloud liquid while the second does not.The two datasets have been plotted one against the other in a scatter plot.As can be seen in Fig. 16, the effect of cloud liquid absorption will enhancethe overall absorption of the signals, in this case the linear fit represents theincrease of opacity in cloudy clonditions compared to clear sky conditions.The 22.23 GHz spectral line is a water molecule resonant frequency (Fig. 1),therefore its opacity is mainly affected by IWV content. If we take a tresholdof 0.2 Np, it can be seen that the average corresponding value of opacityin cloudy conditions indicated by the linear fit is 0.22. The average relativeerror commited if one were not to take into account cloud liquid would bearound 10%.
The same analysis is performed for the 100 GHz opacity (Fig. 17), in thiscase, opacity is largely affected by the cloud liquid presence. If as before, we
Fig. 16 Comparison between22.23 GHz clear sky opacityand 22.23 GHz cloudy skyopacity, data simulated byusing Cagliari airportradiosonde measurements,ARTS radiative transfermodel and cloud liquidempirical model
0.05 0.1 0.15 0.2 0.25 0.3 0.35 0.4 0.45 0.50.05
0.1
0.15
0.2
0.25
0.3
0.35
0.4
0.45
0.5
CLEAR SKY OPACITY @ 22.23 GHZ [Np]
CLO
UD
Y S
KY
OP
AC
ITY
@ 2
2.23
GH
Z [N
p]
N = 3073COR = 0.972STD = 0.017BIAS(X Y) = 0.015INT = 0.008SLP = 1.148RMS = 0.023
DataLinear fit

222 Exp Astron (2011) 29:207–225
Fig. 17 Comparison between100 GHz clear sky opacity and100 GHz cloudy sky opacity,data simulated by usingCagliari airport radiosondemeasurements, ARTSradiative transfer model andcloud liquid empirical model
0.2 0.4 0.6 0.8 1 1.2 1.4 1.6 1.8
0.2
0.4
0.6
0.8
1
1.2
1.4
1.6
1.8
CLEAR SKY OPACITY @ 100 GHZ [Np]
CLO
UD
Y S
KY
OP
AC
ITY
@ 1
00 G
HZ
[Np]
N = 3098COR = 0.714STD = 0.194BIAS(X Y) = 0.177INT = 0.118SLP = 2.037RMS = 0.263
DataLinear fit
take a clear sky value of 0.2 Np, the corresponding average cloudy sky opacitywill be 0.3 Np which yelds a 50% increase of the original value.
3.5 Monthly statistics for the other frequencies
In this section, we summerize the results including those regarding otherSRT observing frequencies which might be implemented in the future. For
Table 1 Monthly percentageprobability (January-June) ofvariables values being belowspecific treshold values: IWV< 10 mm, ILW = 0 mm (clearsky condition), atmosphericopacity τ < 0.15 Np atdifferent frequenciesexpressed in GHz
Quantity Jan Feb Mar Apr May Jun
IWV 45 49 43 30 10 5ILW 54 59 64 59 67 77τ (0.3) 100 100 100 100 100 100τ (1.4) 100 100 100 100 100 100τ (6.7) 100 100 100 100 100 100τ (10) 100 100 100 100 100 100τ (15) 100 100 100 100 100 100τ (18) 100 100 100 100 100 100τ (22) 94 94 92 86 70 59τ (22.12) 93 93 90 85 66 56τ (22.23) 91 91 89 82 63 51τ (23.69) 97 98 95 90 82 76τ (23.72) 97 98 95 91 83 77τ (23.87) 98 98 96 92 85 81τ (30) 100 100 100 99 96 97τ (42.82) 83 86 85 78 77 82τ (43.12) 81 85 83 76 75 80τ (88.63) 47 48 49 35 17 12τ (90.66) 46 47 48 34 17 11τ (100) 34 35 35 25 9 6

Exp Astron (2011) 29:207–225 223
Table 2 Monthly percentageprobability (July-December)of variables values beingbelow specific treshold values:IWV < 10 mm, ILW = 0 mm(clear sky condition),atmospheric opacity τ < 0.15Np at different frequenciesexpressed in GHz.
Quantity Jul Aug Sept Oct Nov Dec
IWV 4 2 4 5 17 32ILW 83 79 64 54 51 53τ (0.3) 100 100 100 100 100 100τ (1.4) 100 100 100 100 100 100τ (6.7) 100 100 100 100 100 100τ (10) 100 100 100 100 100 100τ (15) 100 100 100 100 100 100τ (18) 100 100 100 100 100 100τ (22) 49 38 40 48 74 87τ (22.12) 45 34 38 46 73 86τ (22.23) 40 31 36 42 71 84τ (23.69) 72 61 55 62 83 93τ (23.72) 73 62 56 62 83 93τ (23.87) 77 68 60 66 85 94τ (30) 97 97 91 94 97 99τ (42.82) 86 81 65 64 72 78τ (43.12) 84 77 62 61 69 75τ (88.63) 7 4 5 6 23 33τ (90.66) 7 4 4 6 22 33τ (100) 3 2 2 3 12 24
each quantity we indicate the monthly probability of finding values of thegeophysical quantities of interest below certain tresholds values (see Tables 1and 2). Treshold values have been taken from literature [10], neverthelessthey are indicative and may differ dipending on the accuracy requested by theexperiment. A 10 mm treshold value has been chosen for IWV, while for ILWwe indicate the probability of observing in clear sky conditions (ILW = 0).Furthermore, for the atmospheric opacity, the 0.15 treshold has been chosen,under which very good observing conditions may be expected.
3.6 Comparisons with other radiotelescope sites
Some preliminary comparisons have been performed between the SRT siteand other radiotelescope sites which are located in similar climatic regions andat similar altitudes. At 22.23 GHz it can be seen that the SRT site’s opacity islower than 0.15 Np 65% of the time, this is true also for the Effelsberg site.Cloud free skys at the SRT site are present on average 65% of the time whileat Effelsberg 55% of the time [14]. A similar comparison was possible betweenthe SRT site and the Medicina radiotelescope one (Bologna, Italy). It has beenshown that at Medicina there are roughly 60 days a year in which IWV <10 mmmaking this site potentially feasable for 3mm band observations [9]. At theSRT site it is easy to calculate that there are on average 75 days during the yearin which IWV <10 mm. In addition, it is also important to note that the SRTis a new radiotelescope with state of the art technology and is characterized byvery high gain and sensitivity when compared to other radiotelescopes aroundthe world [9], making it possible to collect weaker radioastronomical signals.There are good reasons to believe that SRT will become one of the most highlyperformant radiotelescopes in Europe.

224 Exp Astron (2011) 29:207–225
4 Conclusions
In the present paper we provide an overall view of some of the key geo-physical quantities that could influence the quality of millimeter astronomicalobservations performed with the Sardinia Radio Telescope (SRT) in singledish mode. In particular, the following quantities were investigated: integratedwater vapor content (IWV), integrated liquid water content (ILW), cloudcover and opacity at different frequencies. These quantities are analysed ina statistical sense, deriving average values and determining their variationsduring the year.
Our results for the SRT site can be summarized as follows:
– in the absence of in situ historical datasets, the Cagliari airport radiosondedataset (1960–2007) is representative and useful tool for the SRT site’satmospheric characterization.
– During the winter months, there is a 40–45% probability of finding IWV< 10 mm. Typical IWV winter values oscillate between 7 mm and 15 mm.
– The absence of cloud cover can be usually found 50% of the time in thewinter and 80% of the time during summer months, typical ILW contentvalues range between 0.2–0.7 mm.
– At 22.23 GHz, the opacity is lower than 0.15 Np 90% of the time duringwinter and 40% of the time during the summer, therefore astronomicalmaser observations at these frequencies may be performed throughout allof the year. At higher frequencies such as 100 GHz, the opacity in winteris lower than 0.15 Np 30–33% of the time, yelding for roughly 40 days ofvery good observing conditions.
– Cloud liquid is important for atmopspheric radiative transfer processes,especially at high window frequencies such as the 100 GHz one. If cloudliquid profiles are not input into the radiave transfer model, for opacityranges of 0.1–0.4 Np, it is possible to have percentage errors up to 50%.Thus, in order to correclty characterize a site at these frequencies, cloudliquid should be considered and correctly modelled.
– Opacity and water vapor statistics show that the SRT site is consistent withother European radioastronomical sites.
Acknowledgements The authors are grateful to Dr. Andrea Tarchi, to Dr. Alessandro Orfeiand to Dr. Alessandro Delitala for their useful suggestions. We are also thankful to Dr. MauroSorgente for his contributions to the data processing of the GPS receiver.
References
1. Bevis, M., Businger, S., Chiswell, S., Herring, T., Anthes, R., Richard, A., Rocken, C., Ware,R.H.: GPS meteorology: mapping zenith wet delays onto precipitable water. J. Appl. Meteorol.33, 379 (1994)
2. Buehler, S.A., Eriksson, P., Kuhn, T., Von Eneln, A., Verdes, C.: ARTS, the atmosphericradiative transfer simultor. J. Quant. Spectrosc. Radiat. Transfer 91(1), 65 (2005)

Exp Astron (2011) 29:207–225 225
3. Bustos, R., Delgado, G., Nyman, L., Radford, S.: 52 years of climatology data for the Chajnantorarea. ALMA Memo, 333 (2000)
4. Cimini, D., Westwater, E.R., Gasiewski, A.J., Klein, M., Leuski, V.Y., Liljegren, J.C.: Ground-based millimeter and submillimeter-wave observations of low vapor and liquid water contents.IEEE Trans. Geosci. Remote Sens. 45(7), 2169 (2007)
5. Cimini, D., Nasir, F., Westwater, E.R., Paine, V.H., Turner, D.D., Mlawer, E.J., Exner, M.L.,Cadeddu, M.P.: Comparison of ground-based millimeter-wave observations and simulations inthe artic winter. IEEE Trans. Geosci. Remote Sens. 47(9), 3098 (2009)
6. Mattioli, V., Basili, S., Bonafoni, P., Ciotti, Westwater, E.R.: Analysis and improvements ofcloud models for propagation studies. Radio Sci. 44 RS2005, 13 (2009)
7. Memmo, A., Fionda, E., Paolucci, T., Cimini, D., Ferretti, R., Bonafoni, S., Ciotti, P.: Com-parison of MM5 integrated water vapor with miceowave radiometer, GPS, and radiosondemeasurements. IEEE TGRS 43(5), 1050 (2005)
8. Mendes, V.B., Prates, D., Santos, L., Langley, R.B.: An evaluation of models for the determina-tion of mean weighed temperature of the atmosphere. In: Proc. of the 2000 National TechnicalMeeting, vol. 443. Institute of Navigation, USA (2000)
9. Orfei, A.: Indagine Sui Siti di Medicina e Noto per un Loro Utilizzo Nella Banda 90 GHz(3 mm). IRA Internal Report, IRA 393/06 (2006)
10. Orfei, A.: Performance Estimation at 90 GHz (3.3 mm) of the Medicina and Noto Sites. IRAInternal Report, IRA 418/08 (2008)
11. Parameswaran, K., Kristina, B.V.: Altitude profile of tropospheric water vapor at low altitude.J. Appl. Meteorol. 29, 665 (1990)
12. Petty, G.W.: A First Course in Atmospheric Radiation, 2nd edn, pp. 269. Sundog Publishing,Printed in the United States of America (2006)
13. Pulvirenti, L., Pierdicca, N., Marzano, F.S.: Simulating brightness temperatures in cloudyconditions over the Mediterranean Sea. In: Proc. of URSI GA 2005. New Delhi (2005)
14. Hansler, M.: Statistical summary of the tropospheric seeing at Effelsberg and development of atropospheric seeing generator for the SKA simulator. Max-Plank-Institute fur radioastronomie,Internal report (2006). Available at http://www.mpifr-bonn.mpg.de/staff/aroy/06henseler.pdf.Last visited 28 September 2010
15. Holton, J.R.: An Introduction to Dynamic Meteorology, 4th edn, pp. 300. Elsevier AcademicPress, Printed in the United States of America (2005)
16. Janssen, M.A.: Atmospheric Remote Sensing by Microwave Radiometry, pp. 180. Wiley seriesin remote sensing, Printed in United States of America (1992)
17. Rodgers, C.D.: Inverse Methods for Atmospheric Sounding: Theory and Practice, pp. 14.World Scientific Publishing Company, London (2000)
18. Sandri, M., Ambrosini, R.: Probabilita Cumulative e Serie Temporali di Opacita con Ra-diometro WVR da Cagliari per L’Anno 1999. IRA Internal Report, IRA 296/00 (1999)
19. Setti, G.: Synthetic history of the SRT project. Mem. Soc. Astron. Ital. 10, 16 (2006)20. Tarchi, A., Castangia, P., Henkel., C., Menten, K.M.: Hunting for H2 megamasers with the
SRT. Mem. Soc. Astron. Ital. 10, 120 (2006)21. Turner, D.D., Clough, A.S., Liljegren, J.C., Clothiaux, E.E., Cady-Pereira, K.E., Gaustad,
K.L.: Retriving liquid water path and precipitable water vapor from the atmopsheric radiationmeasurements (ARM) microwave radiometers. IEEE Trans. Geosci. Remote Sens. 45(11),3680 (2007)
22. Turner, D.D., Vogelmann, A.M., Austin, R.T., Barnard, J.C., Cady-Pereira, K.E., Chiu, J.C.,Clough, S.A., Flynn, C., Kahiyer, M.M., Liljegren, J., Johnson, K., Lin B., Long, B., MarshakA., Matrosov, S.Y., McFarlane, S.A. Miller, M., Min Q., Minnis, P., O’Hirok, W., Wang,Z., Wiscombe, W.: Thin liquid water clouds, their importance and our challange. Bull. Am.Meteorol. Soc. 88(2), 177 (2007)
23. Whiteman, D.N., Melfi, F.A.: Cloud liquid water, mean droplet radius, and number densitymeasurements using a Raman lidar. J. Geophys. Res. 104(D24), 31 (1999)
24. Wu, S.: Optimum frequencies of a passive microwave radiometer for tropospheric path-lengthcorrection. IEEE Trans. Geosci. Remote Sens. 27(2), 233 (1979)
Copyright © 2022 FDOKUMEN