Characterization and origin of EC and OC particulate matter near the Doñana National Park (SW Spain
11
Characterization and origin of EC and OC particulate matter near the Don ˜ana National Park (SW Spain) $ A.M. Sa ´ nchez de la Campa a,b, , C. Pio a , J.D. de la Rosa b , X. Querol c , A. Alastuey c , Y. Gonza ´ lez-Castanedo b a Department of Environment and Planning, University of Aveiro, Campus University of Santiago, 3810 Aveiro, Portugal b Associate Unit CSIC-University of Huelva ‘‘Atmospheric Pollution’’, University of Huelva, Campus El Carmen, E21071 Huelva, Spain c Institute of Earth Sciences ‘Jaume Almera’, CSIC, C/Lluis Sole i Sabaris s/n, 08028 Barcelona, Spain article info Article history: Received 4 November 2008 Received in revised form 5 May 2009 Accepted 8 May 2009 Available online 5 June 2009 Keywords: Particulate matter Don ˜ana National Park Organic carbon Elemental carbon Thermal–optical method abstract In the South of Spain, major industrial estates (e.g. Huelva) exist alongside ecologically interesting zones (e.g. Don ˜ana National Park). Between June 2005 and June 2006, PM10 and PM2.5 were measured, for total mass, organic carbon (OC) and elemental carbon (EC) chemical composition, at a station in an ecologically interesting area located near Don ˜ana National Park and an urban background area with industrial influence. The mean OC concentration is higher in the urban background (3.5 mgm 3 ) than in the rural monitoring station (2.8 mgm 3 ) as a consequence of local emissions (e.g. traffic). A total of 82% of TC is OC in the rural station, while the urban background station reveals 70% and 73% of TC in the PM10 and PM2.5 mass, respectively. The study of air-mass origin and characterization of carbonaceous species in the course of simultaneous sampling in rural and urban background monitoring stations differentiated three long- range air-mass transports: a North-African dust outbreak, Atlantic Advection and Continental (N–NW) episodes, the origins of the first and last of which are more heavily influenced by the anthropogenic emissions from industrial estates located around the city of Huelva (Punta del Sebo and Nuevo Puerto). Higher values were measured for OC and EC in the study area during the North-African dust outbreak, similar to those obtained during the Continental episode (N–NW), which was clearly influenced by industrial emissions, followed by the Atlantic Advection episodes. The comparison of carbon species with air-mass origin can help to discriminate the origin and source of particulate matter, as well as to determine the urban impact on rural areas. & 2009 Elsevier Inc. All rights reserved. 1. Introduction A considerable fraction of the atmospheric aerosol consists of carbonaceous material, which may influence the radiation budget by its light-absorption/scattering effect and its influence on cloud microphysics (Liousse et al., 1996; Seinfeld and Pandis, 1998; Lyamani et al., 2006). Moreover, this major component of atmospheric particulate matter probably plays an important role with regard to global climate change (Hitzenberger et al., 1999; Dan et al., 2004) and health effects (Lin and Tai, 2001; Na et al., 2004). One recent US time series study (Metzger et al., 2004) reported that the elemental carbon (EC) concentration in PM2.5 was significantly associated with hospital emergency department visits due to cardiovascular disease. Moreover, many aromatic compounds are suspected mutagens and carcinogens and some of them may also cause acute heath effects (Lighty et al., 2000). Particulate carbon can often be classified into three broad categories: (a) organic carbon (OC), a scattering material which contains carbon associated with hydrogen, (b) elemental carbon (EC) or black carbon (BC), a light-absorbing material with a ARTICLE IN PRESS Contents lists available at ScienceDirect journal homepage: www.elsevier.com/locate/envres Environmental Research 0013-9351/$ -see front matter & 2009 Elsevier Inc. All rights reserved. doi:10.1016/j.envres.2009.05.002 $ The funding sources supporting this work are: 1. Air Quality Control Project in the city of Huelva (2003–2006). Andalusian Autonomous Government. 2. Air Quality Control Project in Andalusia (2007–2008). Andalusian Autonomous Government. 3. Project CGL2005-05693-C03-01 run by the Spanish Ministry of Education and Science (MEC). 4. Project 2007-RNM 02729 run by the Andalusian Ministry of Innovation Science and Enterprise. 5. Project CS2007-0067 (GRACCIE) run by Spanish Ministry of Science and Innovation. Corresponding author at: Associate Unit CSIC-University of Huelva ‘‘Atmo- spheric Pollution’’, Universityof Huelva, Campus El Carmen, E21071 Huelva, Spain. Fax: +34 959 219810. E-mail address: [email protected] (A.M. Sa ´ nchez de la Campa). Environmental Research 109 (2009) 671–681
Transcript of Characterization and origin of EC and OC particulate matter near the Doñana National Park (SW Spain

ARTICLE IN PRESS
Environmental Research 109 (2009) 671–681
Contents lists available at ScienceDirect
Environmental Research
0013-93
doi:10.1
$The
1. Air
Aut
2. Air
Gov
3. Proj
Scie
4. Proj
and
5. Proj
Inno
� Corr
spheric
Fax: +34
E-m
journal homepage: www.elsevier.com/locate/envres
Characterization and origin of EC and OC particulate matter near the DonanaNational Park (SW Spain)$
A.M. Sanchez de la Campa a,b,�, C. Pio a, J.D. de la Rosa b, X. Querol c, A. Alastuey c, Y. Gonzalez-Castanedo b
a Department of Environment and Planning, University of Aveiro, Campus University of Santiago, 3810 Aveiro, Portugalb Associate Unit CSIC-University of Huelva ‘‘Atmospheric Pollution’’, University of Huelva, Campus El Carmen, E21071 Huelva, Spainc Institute of Earth Sciences ‘Jaume Almera’, CSIC, C/Lluis Sole i Sabaris s/n, 08028 Barcelona, Spain
a r t i c l e i n f o
Article history:
Received 4 November 2008
Received in revised form
5 May 2009
Accepted 8 May 2009Available online 5 June 2009
Keywords:
Particulate matter
Donana National Park
Organic carbon
Elemental carbon
Thermal–optical method
51/$ - see front matter & 2009 Elsevier Inc. A
016/j.envres.2009.05.002
funding sources supporting this work are:
Quality Control Project in the city of Huel
onomous Government.
Quality Control Project in Andalusia (2007–20
ernment.
ect CGL2005-05693-C03-01 run by the Spani
nce (MEC).
ect 2007-RNM 02729 run by the Andalusian M
Enterprise.
ect CS2007-0067 (GRACCIE) run by Spani
vation.
esponding author at: Associate Unit CSIC-U
Pollution’’, University of Huelva, Campus El Ca
959 219810.
ail address: [email protected] (A.M. Sanc
a b s t r a c t
In the South of Spain, major industrial estates (e.g. Huelva) exist alongside ecologically interesting zones
(e.g. Donana National Park). Between June 2005 and June 2006, PM10 and PM2.5 were measured, for
total mass, organic carbon (OC) and elemental carbon (EC) chemical composition, at a station in an
ecologically interesting area located near Donana National Park and an urban background area with
industrial influence. The mean OC concentration is higher in the urban background (3.5mg m�3) than in
the rural monitoring station (2.8mg m�3) as a consequence of local emissions (e.g. traffic). A total of 82%
of TC is OC in the rural station, while the urban background station reveals 70% and 73% of TC in the
PM10 and PM2.5 mass, respectively.
The study of air-mass origin and characterization of carbonaceous species in the course of
simultaneous sampling in rural and urban background monitoring stations differentiated three long-
range air-mass transports: a North-African dust outbreak, Atlantic Advection and Continental (N–NW)
episodes, the origins of the first and last of which are more heavily influenced by the anthropogenic
emissions from industrial estates located around the city of Huelva (Punta del Sebo and Nuevo Puerto).
Higher values were measured for OC and EC in the study area during the North-African dust outbreak,
similar to those obtained during the Continental episode (N–NW), which was clearly influenced by
industrial emissions, followed by the Atlantic Advection episodes. The comparison of carbon species
with air-mass origin can help to discriminate the origin and source of particulate matter, as well as to
determine the urban impact on rural areas.
& 2009 Elsevier Inc. All rights reserved.
ll rights reserved.
va (2003–2006). Andalusian
08). Andalusian Autonomous
sh Ministry of Education and
inistry of Innovation Science
sh Ministry of Science and
niversity of Huelva ‘‘Atmo-
rmen, E21071 Huelva, Spain.
hez de la Campa).
1. Introduction
A considerable fraction of the atmospheric aerosol consists ofcarbonaceous material, which may influence the radiation budgetby its light-absorption/scattering effect and its influence on cloudmicrophysics (Liousse et al., 1996; Seinfeld and Pandis, 1998;Lyamani et al., 2006). Moreover, this major component ofatmospheric particulate matter probably plays an important rolewith regard to global climate change (Hitzenberger et al., 1999;Dan et al., 2004) and health effects (Lin and Tai, 2001; Na et al.,2004). One recent US time series study (Metzger et al., 2004)reported that the elemental carbon (EC) concentration in PM2.5was significantly associated with hospital emergency departmentvisits due to cardiovascular disease. Moreover, many aromaticcompounds are suspected mutagens and carcinogens and some ofthem may also cause acute heath effects (Lighty et al., 2000).
Particulate carbon can often be classified into three broadcategories: (a) organic carbon (OC), a scattering material whichcontains carbon associated with hydrogen, (b) elemental carbon(EC) or black carbon (BC), a light-absorbing material with a

ARTICLE IN PRESS
A.M. Sanchez de la Campa et al. / Environmental Research 109 (2009) 671–681672
graphite-type crystalline structure and (c) carbonate carbon (CC;Johnson et al., 1981; Chow et al., 1993; Pio et al., 1994; Birch andCary, 1996; Schauer et al., 2003). EC is associated with thermalanalytical methods and the direct determination of carbon(Gelencser, 2004), while BC is frequently used for measurementsbased on optical methods (Goldberg, 1985).
The origin of OC can be both primary and secondary,associating itself with particulate organic compounds emitteddirectly into the atmosphere or formed by the condensation ofproducts generated via atmospheric photo-oxidation of volatileorganic species. In contrast, EC is exclusively of primary origin,and is formed only during thermal degradation of organicmaterial in the presence of a gas mixture containing oxygen(Hitzenberger, 1993). However, some organic compounds pyrolyzebefore they can evolve during the gas mixture segment of theanalysis (Schauer et al., 2003). The split between OC and EC israther arbitrary and has been a subject of controversy for the lastnumber of decades (Schmid et al., 2001).
Recently, Andreae and Gelencser (2006) reviewed the termi-nology of carbon species placing importance on the presence oflight-absorbing carbon that is not black (‘‘brown carbon’’). Inthermal methods, brown carbon influences the split betweenorganic carbon and elemental carbon and due to its light-absorption characteristics, leads to overestimations of BC con-centrations (Hitzenberger et al., 2008).
EC has a residence time of about 6 days and can be transportedhundreds or thousands of kilometers from its source area (Husainet al., 2007). For this reason, EC is also present in backgroundregions, although in lower concentrations, which were found to bebetween 0.5mg m�3 (Barrie, 1986) and 10 ng m�3 (Heintzenberg,1988) in the Arctic.
Usually, OC comprises 10–50% of the total aerosol massconcentration of atmospheric particulate matter in many regions
Table 1Details of site types, OC/EC ratio and technical analysis found in the literature.
Site type Fraction
PM
Reference City sampler
Rural PM10 Ho et al. (2006) Hong Kong
Hueglin et al. (2005) Payerne; Chaumon
PM2.5 Hueglin et al. (2005) Payerne
Rodrıguez (2002) Monagrega
Puxbaum et al. (2004) Vienna
Suburban PM10 Hueglin et al. (2005) Basel
PM2.5 Hueglin et al. (2005) Basel
Urban background PM10 Puxbaum et al. (2004) Streithofen
PM2.5 Puxbaum et al. (2004) Streithofen
Lonati et al. (2007) Milan
Urban PM10 Ye et al. (2007) Chongqing
Lin and Tai (2001) Kaohsiung
Viidanoja et al. (2002) Helsinki
Kim et al. (2000) Los Angeles
Harrison et al. (1997) Coimbra
Chan et al. (1997) Brisbane
Puxbaum et al. (2004) Vienna
PM2.5 Puxbaum et al. (2004) Viena
Fraser et al. (2002) Galveston
Kerbside PM10 Hueglin et al. (2005) Bem; Zurich-
Wiedikon; Basel
Yu et al. (2004) Hong Kong
PM2.5 Hueglin et al. (2005) Bem; Zurich-Wied
Rodrıguez (2002) Barcelona
Salma et al. (2004) Hungary
of the world (Seinfeld and Pandis, 1998). On the other hand, ECcomprises only a minor part of the aerosol mass. In the USA, ECrepresents less than 20% of the total aerosol mass concentration inurban areas (Hitzenberger, 1993) and 2–9% of the mass concen-tration of the atmospheric aerosol in rural sites (Shah et al., 1986;Malm et al., 1994). In urban background European cities, thecontribution of EC is 5–9% (PM2.5) and 1–6% (PM2.5–10), and thecontribution of particulate organic matter (OM) is 21–54%(PM2.5) and 10–27% (PM2.5–10; Sillanpaa et al., 2005). In theUnited Kingdom, organic mass accounted for about 22% of theaerosol mass (Jones and Harrison, 2005).
Carbonate carbon is present in low concentrations comparedwith organic and graphitic carbon (Finlayson-Pitts and Pitts,2000), comprising usually less than 5% of the total carbonparticulate in the aerosol mass (Appel et al., 1976; Ohta andOkita, 1984; Hamilton and Mansfield, 1991; Pio et al., 1994). Inurban areas, CC represents 1mg m�3, or 1% of the fine fraction andbetween 2% and 3% of the coarse fraction (Clark and Karani, 1992).
In the last decade, several works have shown the behavior ofcarbonaceous particles analyzed using several analytical methods,in rural and urban environments (see Table 1). The simultaneousstudy of carbonaceous particles in urban-industrial and ruralareas shows geochemical fluxes in carbon species in bothenvironments (e.g. Hueglin et al., 2005). The pattern of urban/rural concentration ratios (U/R) and the study of seasonal trendsfor carbon species can help us differentiate between localpolluting sources in areas of ecological interest. Study of thechemical composition of carbon species in both monitoringstations and air masses can help us in differentiating thecomposition of carbon species over long distances.
In this work, we have performed a characterization of OC andEC present in the PM10 and PM2.5 fraction samples in anecologically interesting zone (Donana National Park) and an
Num. of
values
OC/EC Instrument
1 3.84 TOR (termo optico reflactancia)
t 2 1.85; 2.00 VDI method
1 2.75 VDI method
1 11.00 Thermal–optical transmission (TOT) method
1.67 NDIR analyzer
1 1.89 VDI method
1 2.00 VDI method
1 2.20 Thermal manganese dioxide oxidation
method
1 1.72 Total carbon determined by a combustion
method with a NDIR analyzer; EC measured
by a thermal method
1 6.57 Thermal–optical transmission (TOT) method
9 1.72–8.73 CHN elemental analyzer
1 2.38 Thermal oxidation method without charring
correlation
1 3.23 Thermal–optical transmission (TOT) method
1 1.79 TOR (termo optico reflactancia)
1 2.75 Thermal–optical transmission (TOT) method
1 1.10 Modified Walkley-Black method
1 1.63 Total carbon determined by a combustion
method with a NDIR analyzer; EC measured
by a thermal method
1 1.21 NDIR analyzer
1 2.57 TOR (termo optico reflactancia)
3 1.14;
0.83; 1.75
VDI method
1 1.89 Thermal–optical transmission (TOT) method
ikon 2 1.29; 1.89 VDI method
1 2.67 Thermal–optical transmission (TOT) method
2 1.72; 2.08 Thermal–optical transmission (TOT) method

ARTICLE IN PRESS
A.M. Sanchez de la Campa et al. / Environmental Research 109 (2009) 671–681 673
urban background monitoring station (city of Huelva), over thecourse of a year (2/06/05–30/06/06). Most of the filters weresampled simultaneously. For several air-mass origins, we havequantified the carbon species contribution in each scenario inorder to improve knowledge of the origin, behavior, geochemicalfluxes and urban/rural ratios (U/R), of EC and OC in an ecologicallyinteresting area.
2. Methodology
2.1. Study area
The study area is situated near Donana National Park in The Gulf of Cadiz (SW
Spain), which is located in the southwestern corner of the autonomous region of
Andalusia, Spain. Donana National Park is located north of the Guadalquivir
Estuary and was declared a ‘‘World Reserve of the Biosphere’’ by UNESCO. It is one
of the most important wetland areas and a critical stopover for migrating birds in
Western Europe.
The study area is comprised of the coastal line from Huelva to Cadiz (Fig. 1).
Andalusia is the most populous region in Spain (8,039,399 inhabitants, accounting
for 18% of the Spanish population), and the second most extensive region
(87,268 km2, 17% of Spain). Its population density is 92 inha./km2. This region
serves as a transitional zone between the African and European continents from a
climatic perspective, with very dry summers (35 mm of rainfall as a mean for the
June–September period) and annual rainfall of 520 mm/yr. The predominant wind
directions are SW, NWN and NE (see rose diagram in Fig. 1 inset), which are heavily
influenced by synoptical conditions and breeze circulation.
Representative meteorological parameters (relative humidity, pressure, pre-
cipitation, temperature, wind direction and speed) for Huelva (Ronda Este) and El
Arenosillo monitoring station operated by the Spanish Meteorological Service
(AEMET from June 2005 to June 2006) are summarized in Table 2.
A rural and an urban background monitoring station situated in this region
have been used in the sampling of PM10 and PM2.5. The rural monitoring station is
located on the roof of a two-storey building in ‘‘El Arenosillo’’ Atmospheric
Sounding Station (37.11N, 6.71E), which belongs to INTA, the Department of Earth
Observation, Remote Sensing and Atmosphere, Spain, near the beach and Donana
National Park. This station belongs to the NASA’s AErosol RObotic NETwork
(AERONET). One of the main purposes of the AERONET Project is to measure
aerosol optical property by means of sunphotometry in order to characterize the
Earth’s global climate. Several optical studies of atmospheric particles have
revealed the importance of this monitoring station due to its strategic location,
because North-African dust outbreaks can directly impact El Arenosillo without
interference from other local or regional dust sources within the Iberian Peninsula
(Toledano et al., 2007). Multidisciplinary studies of aerosol physics and chemistry
have shown the impact of long-range transport pollutants in this region of the SW
Iberian Peninsula (Pey et al., 2008).
Fig. 1. Map of the study area showing El Arenosillo and the University Campus
monitoring stations and industrial sites near the city of Huelva. Wind rose diagram
for the period 2004–2006 recorded at El Arenosillo monitoring station.
In the city of Huelva, with an area of 149 km2 and 146,000 inhabitants, an
urban monitoring station was set up in the University Campus of El Carmen, 30 km
Northwest of El Arenosillo (Fig. 1). This station belongs to the Ministry of the
Environment of the Andalusian Autonomous Government, and can be considered a
representative urban background monitoring station in the city of Huelva. Around
the Estuary of the Odiel and Tinto rivers, there are two major industrial sites:
Punta del Sebo, constituted by phosphate processing plants and a Cu smelter, and
Nuevo Puerto (petrochemical refineries and Ti processing plant). Details of plant
activities have been described in Querol et al. (2002). One motorway and two
principal local roads cross the study area (Fig. 1).
Several works on the levels and chemical composition of PM10 and PM2.5 in
the province of Huelva have shown that industrial atmospheric emissions can
impact the city (Querol et al., 2002; Alastuey et al., 2006) and rural areas (Sanchez
de la Campa et al., 2007). The city of Huelva is characterized by high
concentrations of As, Cu, Zn, Se and phosphates in PM10 and PM2.5, essentially
derived from the copper smelter and phosphate factories located in Punta del Sebo
Industrial site (op. cit.; Fig. 1). Also, high levels of arsenic species (AsIII and AsV)
have been found in PM10 in Huelva. The origin of arsenic is industrial and mainly
derived from a nearby copper smelter (Oliveira et al., 2005; Sanchez-Rodas et al.,
2007). Occasionally, the emissions from the petrochemical refinery located 15 km
south of Huelva (Fig. 1) can also have an impact on the city.
2.2. Instrumentation for measurement of atmospheric particulate matter
The instrument used for the sampling of particulate matter in El Arenosillo
monitoring station was a high-volume PM10 Grasseby–Andersen (68 m3/h) from
2/06/05 to 27/12/05. In 2006, simultaneous samplings of PM10 and PM2.5 were
performed using MCV (Barcelona, Spain) high-volume samplers (CAVF-PM1025,
30 m3/h), equipped with MCV PM10 and PM2.5 inlets. The samplers were placed
on the roof of the Atmospheric Sounding Station, a building two storeys high.
A high-volume PM10 Grasseby–Andersen (68 m3/h) and a high-volume MCV-
CAVF-PM1025 (30 m3/h) equipped with MCV PM2.5 inlets were used in the
University Campus monitoring station.
Schleicher and Schuell QF20S quartz glass filters were used for all sampling. At
the two monitoring sites, one daily sample was collected every 8 days during the
study period (2nd June 2005–30th June 2006). After sampling, PM filters were
placed in a desiccator box for 24 h at 20 1C and 50% relative humidity with a
Sartorius LA130 S-F balance (0.1 mg sensitivity).
A total of 162 filters were sampled during the 1-year campaign, of which 66
were sampled in El Arenosillo rural station (45 and 21 in PM10 and PM2.5,
respectively), and 96 in the University Campus urban background (46 and 50 in
PM10 and PM2.5, respectively), and analyzed for total mass and several other
components, including OC and EC.
2.3. Carbon analysis
The carbon species were determined by a thermal–optical transmission
method (TOT; Pio et al., 1994), adapted from Huntzincker et al. (1982). The
method consists of a quartz tube with two heating zones, a LASER and a detector
for the LASER beam, and a CO2 analyzer. A circular section of the sampled quartz
filter 9 mm in diameter is placed vertically inside a quartz tube oven and heated to
600 1C in a nitrogen atmosphere to vaporize organic carbon. A second heating zone
is filled with cupric oxide and maintained at 650 1C during the entire analysis
process to guarantee the total oxidation of the volatilized carbon to CO2, which is
analyzed by NDIR. Controlled heating is used in steps to separate OC into four
fractions of increasing volatility of lower and higher molecular weight organics, as
follows: step 1 (Tr150 1C, OC1); step 2 (Tr150–350 1C, OC2); step 3 (Tr350–600 1
C, OC3). The fraction of pyrolized organic carbon (PC) is determined by
transmittance. OC is defined as OC1+OC2+OC3+PC, and particulate organic matter
is obtained by adding up the OC peaks and PC and multiplying the result by a
factor of 1.6 (Turpin et al., 2000). The water-soluble organic carbon (WSOC) can be
approximately estimated as the sum of the heavier molecular weight fraction
(OC3) plus pyrolized carbon (PC; Pio et al., 2008a). Elemental carbon is determined
by sequential heating at 850 1C in a nitrogen and air atmosphere. A LASER beam is
used to differentiate between OC and EC, based on filter light transmittance,
similar to other thermal–optical methods.
An external standard calibration of C was carried out by analyzing pre-heated
quartz fiber filters with known masses of potassium hydrogen phthalate added
from a standard solution prepared with double-deionized water. Unfortunately,
there is no perfect standard reference material for performing a calibration of EC.
However, this methodology has been tested with the NIST 8785 filter standard and
in a comparison with other thermal–optical methods, giving EC/OC ratios between
those obtained using the Interagency Monitoring of Protected Visual Environments
(IMPROVE) method and the National Institute of Occupational Safety and Health
(NIOSH) protocol (Schmid et al., 2001).
The detection limit for TC was calculated based on 10 blank filters, ranging
between 0.8 and 0.7mg per section of filter. The precision and the accuracy of the
TOT technique were better than 90%, and were evaluated after repeated analysis of
standards of known concentration.
ARTICLE IN PRESS
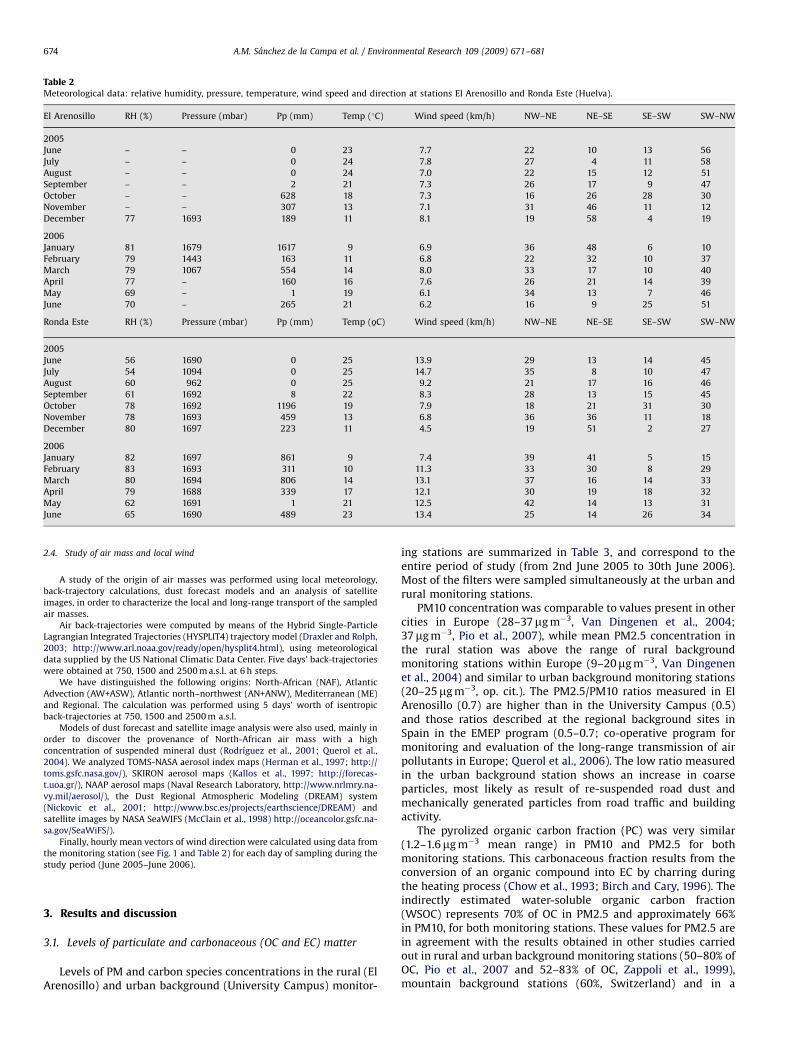
Table 2Meteorological data: relative humidity, pressure, temperature, wind speed and direction at stations El Arenosillo and Ronda Este (Huelva).
El Arenosillo RH (%) Pressure (mbar) Pp (mm) Temp (1C) Wind speed (km/h) NW–NE NE–SE SE–SW SW–NW
2005
June – – 0 23 7.7 22 10 13 56
July – – 0 24 7.8 27 4 11 58
August – – 0 24 7.0 22 15 12 51
September – – 2 21 7.3 26 17 9 47
October – – 628 18 7.3 16 26 28 30
November – – 307 13 7.1 31 46 11 12
December 77 1693 189 11 8.1 19 58 4 19
2006
January 81 1679 1617 9 6.9 36 48 6 10
February 79 1443 163 11 6.8 22 32 10 37
March 79 1067 554 14 8.0 33 17 10 40
April 77 – 160 16 7.6 26 21 14 39
May 69 – 1 19 6.1 34 13 7 46
June 70 – 265 21 6.2 16 9 25 51
Ronda Este RH (%) Pressure (mbar) Pp (mm) Temp (%oC) Wind speed (km/h) NW–NE NE–SE SE–SW SW–NW
2005
June 56 1690 0 25 13.9 29 13 14 45
July 54 1094 0 25 14.7 35 8 10 47
August 60 962 0 25 9.2 21 17 16 46
September 61 1692 8 22 8.3 28 13 15 45
October 78 1692 1196 19 7.9 18 21 31 30
November 78 1693 459 13 6.8 36 36 11 18
December 80 1697 223 11 4.5 19 51 2 27
2006
January 82 1697 861 9 7.4 39 41 5 15
February 83 1693 311 10 11.3 33 30 8 29
March 80 1694 806 14 13.1 37 16 14 33
April 79 1688 339 17 12.1 30 19 18 32
May 62 1691 1 21 12.5 42 14 13 31
June 65 1690 489 23 13.4 25 14 26 34
A.M. Sanchez de la Campa et al. / Environmental Research 109 (2009) 671–681674
2.4. Study of air mass and local wind
A study of the origin of air masses was performed using local meteorology,
back-trajectory calculations, dust forecast models and an analysis of satellite
images, in order to characterize the local and long-range transport of the sampled
air masses.
Air back-trajectories were computed by means of the Hybrid Single-Particle
Lagrangian Integrated Trajectories (HYSPLIT4) trajectory model (Draxler and Rolph,
2003; http://www.arl.noaa.gov/ready/open/hysplit4.html), using meteorological
data supplied by the US National Climatic Data Center. Five days’ back-trajectories
were obtained at 750, 1500 and 2500 m a.s.l. at 6 h steps.
We have distinguished the following origins: North-African (NAF), Atlantic
Advection (AW+ASW), Atlantic north–northwest (AN+ANW), Mediterranean (ME)
and Regional. The calculation was performed using 5 days’ worth of isentropic
back-trajectories at 750, 1500 and 2500 m a.s.l.
Models of dust forecast and satellite image analysis were also used, mainly in
order to discover the provenance of North-African air mass with a high
concentration of suspended mineral dust (Rodrıguez et al., 2001; Querol et al.,
2004). We analyzed TOMS-NASA aerosol index maps (Herman et al., 1997; http://
toms.gsfc.nasa.gov/), SKIRON aerosol maps (Kallos et al., 1997; http://forecas-
t.uoa.gr/), NAAP aerosol maps (Naval Research Laboratory, http://www.nrlmry.na-
vy.mil/aerosol/), the Dust Regional Atmospheric Modeling (DREAM) system
(Nickovic et al., 2001; http://www.bsc.es/projects/earthscience/DREAM) and
satellite images by NASA SeaWIFS (McClain et al., 1998) http://oceancolor.gsfc.na-
sa.gov/SeaWiFS/).
Finally, hourly mean vectors of wind direction were calculated using data from
the monitoring station (see Fig. 1 and Table 2) for each day of sampling during the
study period (June 2005–June 2006).
3. Results and discussion
3.1. Levels of particulate and carbonaceous (OC and EC) matter
Levels of PM and carbon species concentrations in the rural (ElArenosillo) and urban background (University Campus) monitor-
ing stations are summarized in Table 3, and correspond to theentire period of study (from 2nd June 2005 to 30th June 2006).Most of the filters were sampled simultaneously at the urban andrural monitoring stations.
PM10 concentration was comparable to values present in othercities in Europe (28–37mg m�3, Van Dingenen et al., 2004;37mg m�3, Pio et al., 2007), while mean PM2.5 concentration inthe rural station was above the range of rural backgroundmonitoring stations within Europe (9–20mg m�3, Van Dingenenet al., 2004) and similar to urban background monitoring stations(20–25mg m�3, op. cit.). The PM2.5/PM10 ratios measured in ElArenosillo (0.7) are higher than in the University Campus (0.5)and those ratios described at the regional background sites inSpain in the EMEP program (0.5–0.7; co-operative program formonitoring and evaluation of the long-range transmission of airpollutants in Europe; Querol et al., 2006). The low ratio measuredin the urban background station shows an increase in coarseparticles, most likely as result of re-suspended road dust andmechanically generated particles from road traffic and buildingactivity.
The pyrolized organic carbon fraction (PC) was very similar(1.2–1.6mg m�3 mean range) in PM10 and PM2.5 for bothmonitoring stations. This carbonaceous fraction results from theconversion of an organic compound into EC by charring duringthe heating process (Chow et al., 1993; Birch and Cary, 1996). Theindirectly estimated water-soluble organic carbon fraction(WSOC) represents 70% of OC in PM2.5 and approximately 66%in PM10, for both monitoring stations. These values for PM2.5 arein agreement with the results obtained in other studies carriedout in rural and urban background monitoring stations (50–80% ofOC, Pio et al., 2007 and 52–83% of OC, Zappoli et al., 1999),mountain background stations (60%, Switzerland) and in a
ARTICLE IN PRESS
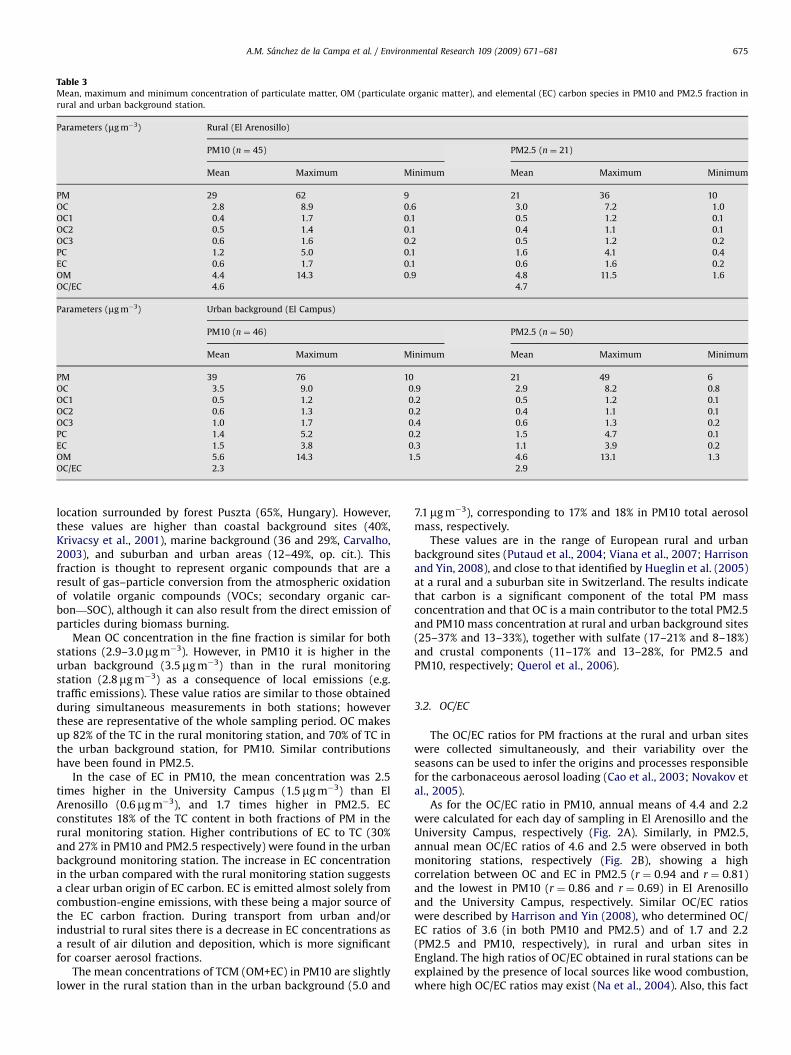
Table 3Mean, maximum and minimum concentration of particulate matter, OM (particulate organic matter), and elemental (EC) carbon species in PM10 and PM2.5 fraction in
rural and urban background station.
Parameters (mg m�3) Rural (El Arenosillo)
PM10 (n ¼ 45) PM2.5 (n ¼ 21)
Mean Maximum Minimum Mean Maximum Minimum
PM 29 62 9 21 36 10
OC 2.8 8.9 0.6 3.0 7.2 1.0
OC1 0.4 1.7 0.1 0.5 1.2 0.1
OC2 0.5 1.4 0.1 0.4 1.1 0.1
OC3 0.6 1.6 0.2 0.5 1.2 0.2
PC 1.2 5.0 0.1 1.6 4.1 0.4
EC 0.6 1.7 0.1 0.6 1.6 0.2
OM 4.4 14.3 0.9 4.8 11.5 1.6
OC/EC 4.6 4.7
Parameters (mg m�3) Urban background (El Campus)
PM10 (n ¼ 46) PM2.5 (n ¼ 50)
Mean Maximum Minimum Mean Maximum Minimum
PM 39 76 10 21 49 6
OC 3.5 9.0 0.9 2.9 8.2 0.8
OC1 0.5 1.2 0.2 0.5 1.2 0.1
OC2 0.6 1.3 0.2 0.4 1.1 0.1
OC3 1.0 1.7 0.4 0.6 1.3 0.2
PC 1.4 5.2 0.2 1.5 4.7 0.1
EC 1.5 3.8 0.3 1.1 3.9 0.2
OM 5.6 14.3 1.5 4.6 13.1 1.3
OC/EC 2.3 2.9
A.M. Sanchez de la Campa et al. / Environmental Research 109 (2009) 671–681 675
location surrounded by forest Puszta (65%, Hungary). However,these values are higher than coastal background sites (40%,Krivacsy et al., 2001), marine background (36 and 29%, Carvalho,2003), and suburban and urban areas (12–49%, op. cit.). Thisfraction is thought to represent organic compounds that are aresult of gas–particle conversion from the atmospheric oxidationof volatile organic compounds (VOCs; secondary organic car-bon—SOC), although it can also result from the direct emission ofparticles during biomass burning.
Mean OC concentration in the fine fraction is similar for bothstations (2.9–3.0mg m�3). However, in PM10 it is higher in theurban background (3.5mg m�3) than in the rural monitoringstation (2.8mg m�3) as a consequence of local emissions (e.g.traffic emissions). These value ratios are similar to those obtainedduring simultaneous measurements in both stations; howeverthese are representative of the whole sampling period. OC makesup 82% of the TC in the rural monitoring station, and 70% of TC inthe urban background station, for PM10. Similar contributionshave been found in PM2.5.
In the case of EC in PM10, the mean concentration was 2.5times higher in the University Campus (1.5mg m�3) than ElArenosillo (0.6mg m�3), and 1.7 times higher in PM2.5. ECconstitutes 18% of the TC content in both fractions of PM in therural monitoring station. Higher contributions of EC to TC (30%and 27% in PM10 and PM2.5 respectively) were found in the urbanbackground monitoring station. The increase in EC concentrationin the urban compared with the rural monitoring station suggestsa clear urban origin of EC carbon. EC is emitted almost solely fromcombustion-engine emissions, with these being a major source ofthe EC carbon fraction. During transport from urban and/orindustrial to rural sites there is a decrease in EC concentrations asa result of air dilution and deposition, which is more significantfor coarser aerosol fractions.
The mean concentrations of TCM (OM+EC) in PM10 are slightlylower in the rural station than in the urban background (5.0 and
7.1mg m�3), corresponding to 17% and 18% in PM10 total aerosolmass, respectively.
These values are in the range of European rural and urbanbackground sites (Putaud et al., 2004; Viana et al., 2007; Harrisonand Yin, 2008), and close to that identified by Hueglin et al. (2005)at a rural and a suburban site in Switzerland. The results indicatethat carbon is a significant component of the total PM massconcentration and that OC is a main contributor to the total PM2.5and PM10 mass concentration at rural and urban background sites(25–37% and 13–33%), together with sulfate (17–21% and 8–18%)and crustal components (11–17% and 13–28%, for PM2.5 andPM10, respectively; Querol et al., 2006).
3.2. OC/EC
The OC/EC ratios for PM fractions at the rural and urban siteswere collected simultaneously, and their variability over theseasons can be used to infer the origins and processes responsiblefor the carbonaceous aerosol loading (Cao et al., 2003; Novakov etal., 2005).
As for the OC/EC ratio in PM10, annual means of 4.4 and 2.2were calculated for each day of sampling in El Arenosillo and theUniversity Campus, respectively (Fig. 2A). Similarly, in PM2.5,annual mean OC/EC ratios of 4.6 and 2.5 were observed in bothmonitoring stations, respectively (Fig. 2B), showing a highcorrelation between OC and EC in PM2.5 (r ¼ 0.94 and r ¼ 0.81)and the lowest in PM10 (r ¼ 0.86 and r ¼ 0.69) in El Arenosilloand the University Campus, respectively. Similar OC/EC ratioswere described by Harrison and Yin (2008), who determined OC/EC ratios of 3.6 (in both PM10 and PM2.5) and of 1.7 and 2.2(PM2.5 and PM10, respectively), in rural and urban sites inEngland. The high ratios of OC/EC obtained in rural stations can beexplained by the presence of local sources like wood combustion,where high OC/EC ratios may exist (Na et al., 2004). Also, this fact

ARTICLE IN PRESS
Fig. 2. OC vs. EC concentration diagram in El Arenosillo and University Campus
monitoring station for PM10 (A) and PM2.5 (B).
Table 4Summary of OC, EC and OM (particulate organic matter) contribution in the PM
mass (expressed in %) at urban background and rural station. PM mass in mg m�3.
Warm season Cold season
Urban background
PM10 41 35
OC 7.3 11.4
EC 3.0 5.0
OM 11.7 18.2
PM2.5 22 19
OC 10.8 18.2
EC 3.5 6.3
OM 17.3 30.1
Rural
PM10 31 27
OC 7.9 11.7
EC 1.6 2.7
OM 12.7 18.7
PM2.5 19a 23a
OC 11.2a 17.5a
EC 2.4a 3.8a
OM 17.9a 27.9a
a Sampling period from 4 January to 21 June 2006.
A.M. Sanchez de la Campa et al. / Environmental Research 109 (2009) 671–681676
may indicate a contribution from secondary organic carbon sincethe El Arenosillo site is far from primary emission sources.
Mean OC/EC ratios for rural, urban and kerbside monitoringstations of selected references around the world (Table 1) havebeen compared with the ratios obtained from urban and ruralbackground monitoring stations in Huelva (Table 3). Although, inthis work we use the data in Table 1, it is known that there is highvariability in OC and EC concentrations when different analyticalmethods are used (Schmid et al., 2001).
The maximum EC and OC concentrations were recorded atChongqing, an urban monitoring station in China (Ye et al., 2007).Excluding this work, the concentrations of EC and OC are high inkerbside and urban monitoring stations. The lowest EC and OCconcentrations correspond to rural monitoring stations. Theannual mean OC/EC ratios obtained in El Arenosillo are slightlyhigher than those recorded for other rural sites in worldwideresearch (OC/EC ¼ 3.9), while in the University Campus they arelower than the mean urban OC/EC ratios (4.7). The high OC/ECratios in rural monitoring stations can be attributed to low EClevels found in these environments (Lonati et al., 2007) and thepresence of source emissions of carbonaceous aerosols containinga higher OC/EC ratio (e.g. biomass burning; Cachier et al., 1989;Park et al., 2003; Yang et al., 2005; Husain et al., 2007).
3.3. Spatial and temporal variation of carbonaceous aerosol in PM
Seasonal means (warm period—April–September and coldperiod—October–March) of carbonaceous species levels in PM10
and PM2.5 are shown in Table 4. Mean concentration ofparticulate matter (PM10 and PM2.5), concentrations ofcarbonaceous species (in %) and OM (organic matter) obtainedin this work have also been summarized.
Mean concentrations of PM10 and PM2.5 are higher during thewarm season (41mg PM10 m�3 and 22mg PM2.5 m�3) than thecold season (35mg PM10 m�3 and 19mg PM2.5 m�3) in the Uni-versity Campus monitoring station. The highest levels wereobtained in the coarse fraction, which are explained by the majorre-suspension of soil dust, due to the higher frequency of air-massimpact with dust derived from the Sahara–Sahel desert (Rodrı-guez et al., 2001; Sanchez de la Campa, 2004; Escudero et al.,2005). The increase in fine particles can be explained by highphotochemical activity during this season.
In the University Campus monitoring station, the contributionof carbon species (OC and EC) and OM to particulate matter ishigher in the fine fraction and mainly during the cold season,representing 18% (OC), 6% (EC) and 30% (OM) of total PM2.5 mass.In El Arenosillo monitoring station, the contributions of OC andOM are slightly lower (17 and 28%, respectively), than thoseshown in the University Campus, while EC contribution wasreduced to 4%. These values are similar to those determined inChina by Ye et al. (2007), and lower than the mean concentrationmeasured in rural and urban background monitoring stations inSwitzerland (5–10%, Hueglin et al., 2005).
The concentrations of OM obtained indicate that it is animportant component of PM10 and PM2.5 (maximum of 30% inthe cold period).
The OC/EC ratios are higher in PM2.5 and during the warmperiod, with higher values in the rural station compared with theurban background station. These values are within the range ofestimated emissions from the combustion of biomass (0.1–0.2,according to Novakov et al., 2000; Rau, 1989). The high OC/ECratio obtained in the warm period may be due, among otherfactors, to photochemical activity from the oxidation of volatileorganic compounds.
The seasonal distribution patterns of OC and EC levels at ElArenosillo and the University Campus monitoring stations areillustrated in Fig. 3. These graphics show how in both monitoringstations, the concentrations of OC and EC increase from thesummer to winter season, both for PM10 and for PM2.5, similar toother European rural and urban areas (Oliveira et al., 2007). The

ARTICLE IN PRESS
A.M. Sanchez de la Campa et al. / Environmental Research 109 (2009) 671–681 677
high concentration of carbonaceous aerosol has been interpretedas a result of the accumulation of emissions due to low mixingheight during the winter season, and the influence of increasedlocal sources from residential wood burning in rural areas(Oliveira et al., 2007).
Fig. 3. Seasonal variation for OC and EC in PM10 and P
Fig. 4. (A) Urban/rural (U/R) ratio of elemental and organic carbon. (B) The OC/E
3.4. Urban background impact of carbon species on the rural station
To determine the urban background impact on the ruralmonitoring station, we selected the filters sampled simulta-neously in rural and urban areas. This urban/rural (U/R) ratio of
M2.5 in El Arenosillo and the University Campus.
C ratio in rural and urban background for day simultaneous measurements.

ARTICLE IN PRESS
Table 5Numbers and frequency of sampling days characterized by air-mass origins.
PM PM10 PM2.5
ORIGIN Rural Urban Rural Urban
AN 5 4 3 6
ANW 4 7 1 9
AW 13 12 5 14
ASW 3 4 3 3
NAF 14 13 7 15
REG 3 3 1 2
EU 2 2 0 2
ME 1 1 1 1
Frequency of representative air masses (%) 87 87 90 90
Total number of filters 45 46 21 52
A.M. Sanchez de la Campa et al. / Environmental Research 109 (2009) 671–681678
the carbon species is shown in Fig. 4A, which displays a zig-zagpattern. The urban/rural EC concentration ratios (U/R) wereconsistently 41, between 1.5 (12/01/06) and 6.2 (27/12/05).Specifically, a ratio of 12.6 was obtained on 1/11/05, whose valueis interpreted as the result of poor dispersion of pollutants fromlocal emissions. The mean U/R contribution ratios were 1.6 and3.4 for OC and EC, respectively. The minimum U/R ratios havebeen interpreted as the impact of industrial and stationary localemissions from the city of Huelva on the rural station in ElArenosillo.
The OC/EC ratio in PM10 of filters sampled simultaneously inrural and urban background displays a generally similar shape,with differences more pronounced from January onwards (seeFig. 4B). Minimum OC/EC ratios were calculated in El Arenosillo(2.7) and the University Campus (1.4) background monitoringstations. The minimum OC/EC ratio in rural areas is similar to thevalue obtained during periods with strong pollution from woodburning in Portugal (2.6, Castro et al., 1999). On the other hand,the OC/EC ratio in large urban areas is higher than those obtainedin other urban OC/EC ratios in Europe (1.1, Castro et al., 1999; 1.0,Harrison et al., 2006; Harrison and Yin, 2008).
The minimum OC/EC of 1.1 (Castro et al., 1999) and 0.83 (Pio etal., 2008b) were used to calculate the mean concentrations ofsecondary OC for each filter in both monitoring stations (urbanand rural). Fig. 5 shows the secondary OC from rural vs. urbanstations, corroborating a linear relationship between bothparameters. This distribution underlines the importance of howexternal sources (e.g. regional transport of primary and secondarycomponents) can contribute in rural as well as urban monitoringstations. It is noteworthy that no significant impact of seasonalvariations was observed.
In order to evaluate the impact of emissions from industry andurban areas on rural areas, a study of air-mass origin and synopticscenarios vs. concentration of carbonaceous aerosol was per-formed in the sampling area.
Table 5 summarizes the air-mass origin characterized for allsampling days. Three main groups of air-mass origins have beendistinguished: (a) North-African dust outbreaks; (b) AtlanticAdvection and (c) Continental (North and Northwest). Thisorigin represents more than 87% of air-mass frequency.
Special attention is given to the characterization of air massesfrom the North (Continental) and Northern Africa, because anincrease in PM levels can occur as a result of industrial and trafficemissions and the high mineral load of Saharan air masses duringmovement northward over the Iberian Peninsula (Rodrıguez et al.,2001). The results are summarized in Table 6.
Fig. 5. Secondary OC urban vs. secondary OC
The hourly vector mean of the wind direction was plotted in arose wind diagram during the period in 2005–2006 for everysource mass origin, which was deduced from the HYSPLIT model(Fig. 6). This diagram shows a principal wind direction of SW forthe Atlantic Advection (AW+ASW) and North-African dust outbreakepisodes clearly coming from the Atlantic Ocean. The winddirections N and NW are important for the Continental airmasses (AN+ANW) in the rural monitoring station, and underwhich the emissions from Industrial Estates around Huelva canimpact on El Arenosillo. In this scenario, the carbonaceous speciesconcentrations are influenced by traffic and industrial emissionsfrom Punta del Sebo and Nuevo Puerto, reaching values of3.1mg m�3 of OC and 0.8mg m�3 of EC in the rural monitoringstation at El Arenosillo. In this, the concentrations of OC and EC inPM10 during North-African dust outbreak and Atlantic Advectionepisodes were 3.2 and 0.7mg m�3 and 2.0 and 0.4mg m�3,respectively. Consequently, under the influence of African dustoutbreak high concentrations of OC and EC have been recorded.Other authors have identified the presence of carbonaceouscomponents (1% of soot and 9% of other carbonaceous material ofmean composition by volume) in atmospheric particulate matterwhen dust plumes from the Sahara desert reached the Izanamonitoring station in the Canary Islands (Kandler et al., 2007).
In the urban monitoring station, the concentrations of OC andEC in PM10 during North-African dust outbreak and AtlanticAdvection episodes were 3.8 and 1.5mg m�3 and 2.6 and 1.3mgm�3, respectively. These values are higher than those described inthe rural monitoring station. Similar concentrations have beenobtained for the PM2.5 fraction, showing that the OC and ECcompounds are concentrated in the fine particles (Table 6).
rural in PM10 (A) and PM2.5 fraction (B).

ARTICLE IN PRESS
Table 6Mean concentration of TC, OC, EC, SOC (secondary organic carbon) and OC/EC ratio in PM10 and PM2.5 for each identified episode group in the sampling stations.
Origin NAF AW+ASW ANW+AN
PM PM10 PM2.5 PM10 PM2.5 PM10 PM2.5
Rural station
TC
Mean 3.9 3.7 2.4 2.3 3.9 5.5
Max 10.7 8.8 4.9 3.7 7.0 7.9
Min 1.7 1.4 0.6 1.4 1.1 2.8
OC
Mean 3.2 3.0 2.0 1.9 3.1 4.6
Max 8.9 7.2 4.3 3.3 5.8 6.5
Min 1.4 1.1 0. 6 1.0 0.9 2.2
EC
Mean 0.7 0.7 0.4 0.4 0.8 0.9
Max 1.7 1.6 0.7 0.7 1.5 1.4
Min 0.3 0.3 0.1 0.2 0.2 0.5
OC/EC
Mean 4.9 4.5 5.7 5.3 4.5 5.0
Max 7.5 6.1 9.4 7.1 7.3 5.9
Min 3.6 3.2 3.8 2.4 2.7 4.3
SOC
Mean 2.5 2.4 1.6 1.6 2.3 3.8
Max 7.0 5.9 3.6 2.9 4.7 5.3
Min 1.1 0.9 0.5 0.6 0.8 1.8
Urban background station
TC
Mean 5.3 4.7 4.0 2.9 5.6 4.4
Max 7.8 12.0 7.7 5.7 12.7 10.0
Min 3.4 1.8 1.7 1.2 1.3 1.2
OC
Mean 3.8 3.6 2.6 2.0 3.9 3.2
Max 6.4 8.2 4.8 3.7 9.0 6.8
Min 2.4 1.4 1.4 0.8 0.9 0.9
EC
Mean 1.5 1.1 1.3 0.8 1.7 1.2
Max 2.5 3.9 3.2 2.4 3.8 3.2
Min 0.9 0.4 0.3 0.2 0.3 0.2
OC/EC
Mean 2.6 3.7 2.6 2.9 2.6 2.7
Max 4.5 7.1 5.4 5.8 4.1 3.6
Min 1.5 2.1 1.4 1.2 1.7 1.6
SOC
Mean 2.1 2.7 1.3 1.3 2.1 2.3
Max 4.8 6.2 2.1 2.3 4.8 4.4
Min 0.9 1.0 0.7 0.5 0.6 0.5
Fig. 6. Hourly means of the wind direction have been plotted in rose wind diagram during the period 2005–2006 for every sources of mass origin, which have been deduced
from the HYSPLIT model.
A.M. Sanchez de la Campa et al. / Environmental Research 109 (2009) 671–681 679
4. Conclusions
In an ecologically interesting zone (near Donana National Park)and an urban background monitoring station (the city of Huelva),in SW Spain, carbon species (OC and EC) have been distinguished
in the fine and coarse size fraction. The aim of this study wasmainly to gain the impact of anthropogenic emission (industrialand urban) on the rural area.
Similar OC and SOC annual mean concentrations in PM2.5were obtained in both monitoring stations, and so these can be

ARTICLE IN PRESS
A.M. Sanchez de la Campa et al. / Environmental Research 109 (2009) 671–681680
considered representative levels of regional background in thestudy area. However, in the University Campus mean ECconcentration up to 2.5 times higher than in El Arenosillo wasobtained. Daily mean concentrations of carbon species in PM wereotherwise expressed in PM, with an increase from summer towinter.
High urban/rural ratios have shown industrial impact in theurban background monitoring station, and also in the ruralmonitoring station due to the impact of industrial and stationarylocal emissions. In addition to these results, the differentiation ofcarbonaceous species vs. air-mass episodes has shown high OCand EC values during the North-African dust outbreak comparedwith Atlantic Advection episodes. Concentrations of OC and ECduring the natural episodes of the North-African dust outbreak aresimilar to those in Continental (N–NW) episodes influenced byindustrial emissions. Therefore, the study of air masses is of greathelp in interpreting data related to chemical composition andespecially carbon species.
Acknowledgments
The authors acknowledge the financial support provided by theUniversity of Huelva during a postdoctoral fellowship. This workwas developed within the framework of project CGL2005-05693-C03-01 and was funded by the Spanish Ministry of Education andScience (MEC), and Project CS2007-0067 by the Spanish Ministryof Science and Innovation. We would like to thank the AndalusianAutonomous Government for financing this work (Project 2007-RNM 02729).
We would also like to thank the NOAA Air ResourcesLaboratory (ARL) for providing the HYSPLIT transport anddispersion model. Thanks also go to the NASA/Goddard SpaceFlight Center, Laboratory for Atmospheres, Greenbelt (MD, USA),the Atmospheric Modeling and Weather Forecasting Group fromthe University of Athens and the SeaWIFS Project on the NASAwebsite for the valuable information supplied by the TOMS andSKIRON aerosol maps and satellite images.
References
Alastuey, A., Querol, X., Plana, F., Viana, M., Sanchez de la Campa, A., Rosa, J., 2006.Identification and chemical characterization of industrial particulate mattersources in Southwest Spain. J. Air Waste Manage. Assoc. 56, 993–1006.
Andreae, M.O., Gelencser, A., 2006. Black carbon or brow carbon? The nature oflight-absorbing carbonaceous aerosols. Atmos. Chem. Phys. 6, 3131–3148.
Appel, B.R., Colony, P., Wesolowski, 1976. Analysis of carbonaceous material insouthern California atmospheric aerosols. Environ. Sci. Technol. 10, 359–363.
Barrie, L.A., 1986. Arctic air pollution: an overview of current knowledge. Atmos.Environ. 20, 643–663.
Birch, M.E., Cary, R.A., 1996. Elemental carbon-based method for monitoringoccupational expesures to particulate diesel exhaust. Aerosol Sci. Technol. 25,221–241.
Cachier, H., Bremond, M.P., Buat-Menard, P., 1989. Carbonaceous aerosols fromdifferent tropical biomass burning sources. Nature 340, 371–373.
Cao, J.J., Lee, S.C., Ho, K.F., Zou, S.C., Zhang, X.Y., Pan, J.G., 2003. Spatial and seasonaldistributions of atmospheric carbonaceous aerosols in Pearl River Delta Region,China. China Particuol. 1, 33–37.
Carvalho, A., 2003. Characterization of atmospheric carbonaceous aerosols:secondary and water soluble compounds. Ph.D. Thesis, University of Aveiro,Portugal, 219pp.
Castro, L.M., Pio, C.A., Harrison, R.M., Smith, D.J.T., 1999. Carbonaceous aerosol inurban and rural European atmospheres: estimation of secondary organiccarbon concentrations. Atmos. Environ. 33, 2771–2781.
Chan, Y.C., Simpson, R.W., Mctainsh, G.H., Vowles, P.D., Cohen, D.D., Bailey, G.M.,1997. Characterisation of chemical species in PM2.5 and PM10 aerosols inBrisbane, Australia. Atmos. Environ. 31, 3773–3785.
Clark, A.G., Karani, G.N., 1992. Characterisation of the carbonate content ofatmospheric aerosols. J. Atmos. Chem., 119–128.
Chow, J.C., Watson, J.G., Pritchett, L.C., Pierson, W.R., Frazier, C.A., Purcell, R.G., 1993.The DRI thermal/optical reflectance carbon analysis system: description,evaluation and application in US Air Quality Studies. Atmos. Environ. A 27,1185–1201.
Dan, M., Zhuang, G., Li, X., Tao, H., Zhuang, Y., 2004. The characteristics ofcarbonaceous species and their sources in PM2.5 in Beijing. Atmos. Environ. 38(21), 3443–3452.
Draxler, R.R., Rolph, G.D., 2003. HYSPLIT (HYbrid Single-Particle LagrangianIntegrated Trajectory) Model access via NOAA ARL READY Website (http://www.arl.noaa.gov/ready/hysplit4.html). MD. Silver Spring, MD.
Escudero, M., Castillo, S., Querol, X., Avila, A., Alarcon, M., Viana, M.M., Alastuey, A.,Cuevas, E., Rodrıguez, S., 2005. Wet and dry African dust episodes over easternSpain. J. Geophys. Res 110, D18S08.
Finlayson-Pitts, B.J., Pitts, J.N., 2000. In: Chemistry of the Upper and LowerAtmosphere: Theory, Experiments, and Applications. Academic Press, NewYork, 969pp.
Fraser, M.P., Yue, Z.W., Tropp, R.J., Kohl, S.D., Chow, J.C., 2002. Molecularcomposition of organic fine particulate matter in Houston, TX. Atmos. Environ.36, 5751–5758.
Gelencser, A., 2004. Carbonaceous Aerosol, Series Atmospheric and OceanographicSciences Library, vol. 30. Springer, Berlin, 350pp.
Goldberg, E.D., 1985. In: Black Carbon in the Environment. Wiley, New York, 198pp.Hamilton, R.S., Mansfield, T.A., 1991. Airborne particulate elemental carbon: its
sources, transport and contribution to dark smoke and soiling. Atmos. Environ.A—Gen. Top. 25 (3–4), 715–723.
Harrison, R.M., Deacon, A.R., Jones, M.R., Appleby, R.S., 1997. Sources and processesaffecting concentrations of PM10 and PM2.5 particulate matter in Birmingham,(UK). Atmos. Environ. 31, 4103–4117.
Harrison, R.M., Yin, Y., Tilling, R.M., Cai, X., Seakins, P.W., Hopkins, J.R., Lansley, D.L.,Lewis, A.C., Hunter, M.C., Heard, D.E., Carpenter, L.J, Creasey, D.J., Lee, J.D.,Pilling, M.J., Carslaw, N., Emmerson, K.M., Redington, A., Derwent, R.G., Ryall,D., Mills, G., Penkett, S.A., 2006. Measurement and modelling of air pollutionand atmospheric chemistry in the UK West Midlands conurbation: overview ofthe PUMA consortium project. Sci. Total Environ. 360, 5–25.
Harrison, R.M., Yin, J., 2008. Sources and processes affecting carbonaceous aerosolin central England. Atmos. Environ. 7, 1413–1423.
Heintzenberg, J., 1988. A processor-controlled multisample soot photometer.Aerosol Sci. Technol. 8, 227–233.
Herman, J.R., Bhartia, P.K., Torres, O., Hsu, C., Seftor, C., Celarier, E., 1997. Globaldistribution of UV-absorbing aerosols from Nimbus7/TOMS data. J. Geophys.Res. 201, 16911–16922.
Hitzenberger, R., 1993. Absorption coefficients and mass concentrations of theurban aerosol of Vienna, Austria, during the years 1985 and 1986. Water AirSoil Pollut. 71, 131–153.
Hitzenberger, R., Jennings, S.G., Larson, S.M., Dillner, A., Cachier, H., Galambos, Z.,Rouc, A., Spain, T.G., 1999. Intercomparison of measurement methods for blackcarbon aerosols. Atmos. Environ. 33, 2823–2833.
Hitzenberger, R., Wonaschutz, A., Bauer, H., Pouresmaeil, P., Klatzer, B., Caseiro, A.,Puxbaum, H., 2008. Measurements of black and brown carbon in atmosphericaerosols with the integrating sphere method. In: Proceedings of the NinthInternational Conference on Carbonaceous Particles in the Atmosphere, 12–14August 2008, Lawrence Berkeley National Laboratory Berkeley, California, USA.
Ho, K.F., Lee, S.C., Cao, J.J., Chow, J.C., Watson, J.G., Chan, C.K., 2006. Seasonalvariations and mass closure analysis of particulate matter in Hong Kong. Sci.Total Environ. 355 (1–3), 276–287.
Hueglin, C., Gehrig, R., Baltensperger, U., Gysel, M., Monn, C., Vonmont, H., 2005.Chemical characterisation of PM2.5, PM10 and coarse particles at urban, near-city and rural sites in Switzerland. Atmos. Environ. 39 (4), 637–651.
Huntzincker, J.J., Johnson, R.L., Shah, J.J., Cary, R.A., 1982. Analysis of organic andelemental carbon in ambient aerosols by a thermal–optical method. In: Wolff,G.T., Klimisch, R.L. (Eds.), Particulate Carbon: Atmospheric Life Cycle. PlenumPress, New York, pp. 79–88.
Husain, L., Dutkiewicz, V.A., Khan, A.J., Ghauri, B.M., 2007. Characterization ofcarbonaceous aerosols in urban air. Atmos. Environ. 41, 6872–6883.
Johnson, R.L., Shah, J.J., Cary, R.A., Huntzicker, J.J., 1981. Source/air qualityrelationships. In: Macias E.S., Hopke, P.K. (Eds.), Atmospheric Aerosols.American Chemical Society, Washington.
Jones, A.M., Harrison, R.M., 2005. Interpretation of particulate elemental andorganic carbon concentrations at rural, urban and kerbside sites. Atmos.Environ. 39, 7114–7126.
Kallos, G., Kotroni, V., Lagouvardos, K., 1997. The regional weather forecastingsystem SKIRON: an overview. In: Proceedings of the Symposium on RegionalWeather Prediction on Parallel computer Environments, University of Athens,Greece, pp. 109–122.
Kandler, K., Benker, N., Bundke, U., Cuevas, E., Ebert, M., Knippertz, M., Rodrıguez,S., Schutz, L., Weinbruch, S., 2007. Chemical composition and complexrefractive index of Saharan Mineral Dust at Izana, Tenerife (Spain) derived byelectron microscopy. Atmos. Environ. 41, 8058–8074.
Kim, Y.P., Moon, K.-C., Lee, J.H., 2000. Organic and elemental carbon in fineparticles at Kosan, Korea. Atmos. Environ. 34, 3309–3317.
Krivacsy, Z., Hoffer, A., Sarvari, Z., Temesi, D., Baltensperger, U., Nyeki, S.,Weingartner, E., Kleefeld, S., Jennings, S.G., 2001. Role of organic and blackcarbon in the chemical composition of atmospheric aerosol at Europeanbackground sites. Atmos. Environ. 35, 6231–6244.
Lighty, J.S., Veranth, J.M., Sarofirm, A.F., 2000. Combustion aerosols: factorsgoverning their size and composition and implications to human heath. J. AirWaste Manage. Assoc. 50, 1565–1618.
Lin, J.J., Tai, H.-S., 2001. Concentrations and distributions of carbonaceous speciesin ambient particles in Kaohsiung City, Taiwan. Atmos. Environ. 35 (15),2627–2636.

ARTICLE IN PRESS
A.M. Sanchez de la Campa et al. / Environmental Research 109 (2009) 671–681 681
Liousse, C., Penner, J.E., Chuang, C., Walton, J.J., Eddleman, H., Cachier, H., 1996. Aglobal three-dimensional model study of carbonaceous aerosols. J. Geophys.Res. D 101, 1925–1934.
Lonati, G., Ozgen, S., Giugliano, M., 2007. Primary and secondary carbonaceousspecies in PM2.5 samples in Milan (Italy). Atmos. Environ. 41 (22), 4599–4610.
Lyamani, H., Olmo, F.J., Alcantara, A., Alados-Arboledas, L., 2006. Atmosphericaerosols during the 2003 heat wave in southeastern Spain II: microphysicalcolumnar properties and radiative forcing. Atmos. Environ. 40, 6465–6476.
Malm, W.C., Sisler, J.F., Huffman, D., Eldred, R.A., Cahill, T., 1994. Spatial andseasonal trends in particle concentration and optical extinction in the UnitedStates. J. Geophys. Res. 99 (D1), 1347–1370.
McClain, C.R., Cleave, M.L., Feldman, G.C., Gregg, W.W., Hooker, S., Kuring, N., 1998.Science quality SeaWiFS data for global biosphere research. Sea Technol. 39(9),10–16.
Metzger, K.B., Tolbert, P.E., Klein, M., Peel, J.L., Flanders, W.D., Todd, K., Mulholland,J.A., Ryan, P.B., Frumkin, H., 2004. Ambient air pollution and cardiovascularemergency department visits. Epidemiology 15, 46–56.
Na, K., Sawant, A.A., Song, C., Cocker, D.R., 2004. Primary and secondarycarbonaceous species in the atmosphere of Western Riverside County,California. Atmos. Environ. 38 (9), 1345–1355.
Nickovic, S., Kallos, G., Papadopoulos, A., Kakaliagou, O., 2001. A model forprediction of desert dust cycle in the atmosphere. J. Geophys. Res. 106,18113–18129.
Novakov, T., Andreae, M.O., Gabriel, R., Kirchstetter, T.W., Mayol-Bracero, O.L.,Ramanathan, V., 2000. Origin of carbonaceous aerosols over the tropical IndianOcean: biomass burning or fossil fuels? Geophys. Res. Lett. 27, 4061–4064.
Novakov, T., Menon, S., Kirchstetter, T.W., Koch, D., Hansen, J.E., 2005. Aerosolorganic carbon to black carbon ratios: analysis of published data andimplications for climate forcing. J. Geophys. Res. 110, D21205.
Ohta, S., Okita, T., 1984. Measurements of particulate carbon in urban and marineair in Japanese areas. Atmos. Environ. 18, 2439–2445.
Oliveira, V., Gomez-Ariza, J.L., Sanchez-Rodas, D., 2005. Extraction procedures forchemical speciation of arsenic in atmospheric total suspended particles. Anal.Bioanal. Chem. 382, 335–340.
Oliveira, T., Pio, C., Alves, C., Silvestre, A., Evtyugina, M., Afonso, J., Caseiro, A.,Legrand, M., 2007. Air quality and organic compounds in aerosols from acoastal rural area in the Western Iberian Peninsula over a year long period:characterisation, loads and seasonal trends. Atmos. Environ. 41 (17),3631–3643.
Park, R.J., Jacob, D.J., Chin, M., Martin, R.V., 2003. Sources of carbonaceous aerosolsover the United States and implications for natural visibility. J. Geophys. Res.108, 4355.
Pey, J., Querol, X., Rosa, J., Gonzalez-Castanedo, Y., Alastuey, A., Gangoiti, G.,Sanchez de la Campa, A., Alados-Arboledas, L., Sorribas, M., Pio, C., Cachorro, V.,Pineiro, M., Lopez-Mahia, P., Garcıa-Gacio, D., 2008. Characterization of a longrange transport pollution episode affecting PM in SW Spain. J. Environ. Monit.10, 1158–1171.
Pio, C., Castro, L.M., Ramos, M.O., 1994. Differentiated determination of organic andelemental carbon in atmospheric aerosol particles by a thermal–opticalmethod. In: Angeletti, G., Restelli, G. (Eds.), Proceedings of the Sixth EuropeanSymposium on Physico-Chemical Behavior of Atmospheric Pollutants. ReportEUR 15609/2 EN, pp. 706–711.
Pio, C.A., Legrand, M., Oliveira, T., Afonso, J., Santos, C., Fialho, P., Barata, F.,Puxbaum, H., Sanchez-Ochoa, A., Kasper-Giebl, A., Gelencser, A., Preunkert, S.,Schock, M., 2007. Climatology of aerosol composition (organic versusinorganic) at non-urban areas on a west–east transect across Europe. J.Geophys. Res. 112, D23S02.
Pio, C.A., Alves, C.A., Oliveira, T., Afonso, J., Caseiro, A., Puxbaum, H., Kasper-Giebl,A., Legrand, M., Gelencser, A., 2008a. Chemical composition of atmosphericaerosols during the 2003 summer intense forest fire period. Atmos. Environ.42, 7530–7543.
Pio, C.A., Cerqueira, M., Nunes, T.V., Alves, C., Sanchez de la Campa, A., 2008b.Application of the minimum OC/EC ratio to the source apportionment oforganic carbon in PM2.5 and PM10 aerosols: evaluation of 15 years ofmeasurements in Europe. In: Proceedings of the Ninth International Con-ference on Carbonaceous Particles in the Atmosphere, 12–14 August 2008.Lawrence Berkeley National Laboratory Berkeley, California, USA.
Putaud, J.-P., Raes, F., Dingenen, R., Bruggemann, E., Facchini, M.-C., Decesari, S.,Fuzzi, S., Gehrig, R., Huglin, C., Laj, P., Lorbeer, G., Maenhaut, W., Mihalopoulos,N., Muller, K., Querol, X., Rodriguez, S., Schneider, J., Spindler, G., Brink, H.,Tørseth, K., Wiedensohler, A., 2004. A European aerosol phenomenology—2:chemical characteristics of particulate matter at kerbside, urban, rural andbackground sites in Europe. Atmos. Environ. 38, 2579–2595.
Puxbaum, H., Gomiscek, B., Kalina, M., Bauer, H., Salam, A., Stopper, S., Preining, O.,Hauck, H., 2004. A dual site study of PM2.5 and PM10 aerosol chemistry in thelarger region of Vienna, Austria. Atmos. Environ. 38 (24), 3949–3958.
Querol, X., Alastuey, A., Rosa, J., Sanchez-de-la-Campa, A., Plana, F., Ruiz, C.R., 2002.Source apportionment analysis of atmospheric particulates in an industrialisedurban site in southwestern Spain. Atmos. Environ. 36, 3113–3125.
Querol, X., Alastuey, A., Rodrıguez, S., Viana, M.M., Artinano, B., Salvador, P.,Mantilla, E., Garcıa do Santos, S., Fernandez Patier, R., Rosa, J., Sanchez de la
Campa, A., Menendez, M., Gil Ibarguichi, J.I., 2004. Levels of particulate matterin rural, urban and industrial sites in Spain. Sci. Total Environ. 334–335,359–376.
Querol, X., et al., 2006. Material Particulado en Espana: Niveles, Composicion yContribucion de Fuentes. CSIC y Ministerio de Medio Ambiente. N.I.P.O. 310-06-107-8, 41pp.
Rau, J.A., 1989. Composition and size distribution of residential wood smokeparticles. Aerosol Sci. Technol. 10, 181–192.
Rodrıguez, S., Querol, X., Alastuey, A., Kallos, G., Kakaliagou, O., 2001. Saharan dustcontributions to PM10 and TSP levels in Southern and Eastern Spain. Atmos.Environ. 35 (14), 2433–2447.
Rodrıguez, S., 2002. Sources and processes affecting levels and composition ofatmospheric particulate matter in the Western Mediterranean. Ph.D. Thesis,University Polytechnic of Cataluna, 226pp.
Salma, I., Chi, X., Maenhaut, W., 2004. Elemental and organic carbon in urbancanyon and background environments in Budapest, Hungary. Atmos. Environ.38, 27–36.
Sanchez de la Campa, A.M., 2004. Geochemistry of atmospheric particulate matterof Huelva, Southwest of Spain. Ph.D. Thesis, University of Huelva, pp. 1–283.
Sanchez de la Campa, A.M., Rosa, J., Querol, X., Alastuey, A., Mantilla, E., 2007.Geochemistry and origin of PM10 in the Huelva region, Southwestern Spain.Environ. Res. 103, 305–316.
Sanchez-Rodas, D., Sanchez de la Campa, A.M., Rosa, J.D., Oliveira, V., Gomez-Ariza,J.L., Querol, X., Alastuey, A., 2007. Arsenic speciation of atmospheric particulatematter (PM10) in an industrialised urban site in southwestern Spain. Chemo-sphere 66, 1485–1493.
Schauer, J.J., Mader, B.T., Deminter, J.T., Heidemann, G., Bae, M.S., Seinfeld, J.H.,Flagan, R.C., Cary, R.A., Smith, D., Huebert, B.J., Bertram, T., Howell, S., Kline, J.T.,Quinn, P., Bates, T., Turpin, B., Lim, H.J., Yu, J.Z., Yang, H., Keywood, M.D., 2003.ACE-Asia intercomparison of a thermal–optical method for the determinationof particle-phase organic and elemental carbon. Environ. Sci. Technol. 37,993–1001.
Schmid, H., Laskus, L., Abraham, H.J., Baltensperger, U., Lavanchy, V., Bizjak, M.,Burba, P., Cachier, H., Crow, D., Chow, J., Gnauk, T., Even, A., Brink, H.M., Giesen,K.-P., Hitzenberger, R., Hueglin, C., Maenhaut, W., Pio, C., Carvalho, A., Putaud,J.-P., Toom-Sauntry, D., Puxbaum, H., 2001. Results of the ‘‘carbon conference’’international aerosol carbon round robin test stage I. Atmos. Environ. 35,2111–2121.
Seinfeld, J.H., Pandis, S.N., 1998. In: Atmospheric Chemistry and Physics: From AirPollution to Climate Change. Wiley, New York.
Shah, J.J., Johnson, R.L., Heyerdahl, E.K., Huntzicker, J.J., 1986. J. Air Pollut. ControlAssoc. 36 (3), 254–257.
Sillanpaa, Saarikoski, S., Pennanen, A., Makkonen, U., Spolnik, Z., Grieken, R.,Koskentalo, T., Salonen, R.O., 2005. Chemical composition, mass size distribu-tion and source analysis of long-range transported wildfire smokes in Helsinki.Sci. Total Environ. 350, 119–135.
Turpin, B.J., Saxena, P., Andrews, E., 2000. Measuring and simulating particulateorganics in the atmosphere: problems and prospects. Atmos. Environ. 34,2983–3013.
Toledano, C., Cachorro, V.E., Berjon, A., Frutos, A.M., Sorribas, M., Morena, B.A.,Goloub, P., 2007. Aerosol optical depth and Angstrom exponent climatology atEl Arenosillo AERONET site (Huelva, Spain). Q. J. R. Meteorol. Soc. 133, 795–807.
Dingenen, R., Raes, F., Putaud, J.-P., Baltensperger, U., Charron, A., Facchini, M.C.,Decesari, S., Fuzzi, S., Gehrig, R., Hansson, H.-C., Harrison, R.M., Huglin, C.,Jones, A.M., Laj, P., Lorbeer, G., Maenhaut, W., Palmgren, F., Querol, X.,Rodriguez, S., Schneider, J., Brink, H., Tunved, P., Torseth, K., Wehner, B.,Weingartner, E., Wiedensohler, A., Wahlin, P., 2004. A European aerosolphenomenology—1: physical characteristics of particulate matter at kerbside,urban, rural and background sites in Europe. Atmos. Environ. 38, 2561–2577.
Viana, M., Maenhaut, W., Brink, H.M., Chi, X., Weijers, E., Querol, X., Alastuey, A.,Mikuska, P., Vecera, Z., 2007. Comparative analysis of organic and elementalcarbon concentrations in carbonaceous aerosols in three European cities.Atmos. Environ. 41, 5972–5983.
Viidanoja, J., Sillanpaa, M., Laakia, J., Kerminen, V., Hillamo, R., Aarnio, P.,Koskentalo, T., 2002. Organic and black carbon in PM2.5 and PM10: 1 year ofdata from an urban site in Helsinki, Finland. Atmos. Environ. 36, 3183–3193.
Yang, F., He, K.F., Ye, B., Chen, X., Chan, L., Cadle, S.H., Chan, T., Mulawa, P.A., 2005.One-year record of organic and elemental carbon in fine particles in downtownBeijing and Shanghai. Atmos. Chem. Phys. Discuss. 5, 217–241.
Ye, D., Zhao, Q., Jiang, C., Chen, J., Meng, X., 2007. Characteristics of elementalcarbon and organic carbon in PM10 during spring and autumn in Chongqing,China. China Particuol. 5, 255–260.
Yu, S., Dennis, R.L., Bhave, P.V., Eder, B.K., 2004. Primary and secondary organicaerosols over the United States: estimates on the basis of observed organiccarbon (OC) and elemental carbon (EC), and air quality modeled primary OC/EC ratios. Atmos. Environ. 38, 5257–5268.
Zappoli, S., Andracchio, A., Fuzzi, S., Facchini, M.C., Gelencser, A., Kiss, G., Krivacsy,Z., Molnar, A., Meszaros, E., Hansson, H.C., Rosman, K., Zebuhr, Y., 1999.Inorganic, organic and macromolecular components of fine aerosol in differentareas of Europe in relation to their water solubility. Atmos. Environ. 33,2733–2743.