PROVENTIL HFA- albuterol sulfate aerosol, metered - DailyMed
Atmospheric Environment 38 (2004) 3179–3189
ARTICLE IN PRESS
*Correspond
Department of
0509, USA. Te
E-mail addr
(L. Husain).
1352-2310/$ - se
doi:10.1016/j.at
Sources of fine particulate sulfate in New York
Vincent A. Dutkiewicza,b, Sumizah Qureshib, Adil R. Khana, Vincent Ferraroa,James Schwabc, Kenneth Demerjianc, Liaquat Husaina,b,*
aWadsworth Center, New York State Department of Health, Empire State Plaza, Albany, NY 12201-0509, USAbDepartment of Environmental Health and Toxicology, State University of New York at Albany, Albany, NY 12201-0509, USA
cAtmospheric Sciences Research Center, State University of New York, Albany, NY, USA
Abstract
Daily PM2.5 sulfate measurements are reported for July 2001 through June 2002 from three New York State sites that
were a part of the New York Supersite Program. The sampling sites were located at Queens, Pinnacle State Park,
and Whiteface Mountain. Quarterly mean sulfate concentrations at these sites were respectively; 5.05, 5.08, and 3.14 mg/m3 during July–September (QIII); 2.84, 2.26, and 1.40mg/m3 during October–December (QIV); 2.71, 2.39, and 1.55mg/m3 during January–March (QI); and 4.17, 4.52, and 2.15 mg/m3 during April–June (QII). Although the sites areseparated by several hundred kilometers and surrounded by highly varied population densities, their sulfate
concentrations have very similar patterns. These data show that sulfate concentrations over broad regions of the
Northeast are correlated. Backward air trajectories were used to evaluate the regional sources of sulfate impacting these
sites. The highest sulfate concentrations at all three sites were associated with air masses that pass through the Ohio
River Valley and the area around the Great Lakes Basin. Moderately high concentrations at Pinnacle and Queens were
also associated with air flow through the Mid-Atlantic states. In addition, we used air trajectories to estimate local
versus transported components. On an annual basis, 44–55% of the sulfate at Queens and 60% at Whiteface and
Pinnacle was transported.
r 2004 Elsevier Ltd. All rights reserved.
Keywords: Sulfate; Particulate matter; Aerosols; PM2.5; Source–receptor relationship
1. Introduction
There is a rising concern over the health impact of fine
particulate matter suspended in the air (e.g., Dockery
et al., 1993; Dockery and Pope, 1994; Gwynn et al.,
2000). Scientific and regulatory interest has focused on
particles smaller than 2.5 mm in diameter (PM2.5). In
addition to the direct health impacts mentioned above,
PM2.5 also impacts aerosol deposition patterns, visibi-
lity, and radiative transfer.
ing author. Wadsworth Center, New York State
Health, Empire State Plaza, Albany, NY 12201-
l.: +1-518-473-4854; fax: +1-518-473-2895.
ess: [email protected]
e front matter r 2004 Elsevier Ltd. All rights reserve
mosenv.2004.03.029
Most epidemiological studies of suspended particulate
matter (PM) have simply related aerosol mass or PM2.5
mass to some measure of human morbidity or mortality.
However, since PM is composed of varied materials with
diverse physicochemical characteristics, there is a need
to understand the composition of PM2.5 and its
precursors in varied population centers better and
establish source-receptor relations that can help guide
future regulatory decisions.
The PM2.5 Technology Assessment Characterization
Study New York (PMTACS-NY) is a part of the
USEPA Supersite Study program. The goals and
operational procedures may be found on the Web site
(http://www.asrc.cestm.albany.edu/pmtacsny/). The en-
hanced phase of the study was initiated with a month-
long intensive sampling program conducted on and
around the campus of Queens College, Queens, NY in
d.
ARTICLE IN PRESSV.A. Dutkiewicz et al. / Atmospheric Environment 38 (2004) 3179–31893180
July of 2001. Daily PM2.5 aerosols were collected at two
sites. At one of the sites there were co-located samplers
collecting 24 and 6h samples. In addition several
research-grade and commercial gas and aerosol instru-
ments were deployed which included several aerosol
instruments capable of collecting real-time sulfate and/or
nitrate concentrations (Drewnick et al., 2003, 20004a, b).
Results from this program are being published sepa-
rately. Daily sampling sites were established near the
Queens College campus and at two upwind rural sites in
the state. In this paper we present daily PM2.5 sulfate
measurements from these three sites spanning 1 year
(July 2001–June 2002). Using data from the two
up-wind rural sites and air trajectories we evaluate
the sources of the sulfate impacting the Metropolitan
New York area.
2. Methods
2.1. Sampling
The urban site was located in Queens, NY on the roof
of Public School 219 (Queens, or Q). The sampler was
10m above the ground which is 25m above mean sea
level. The site (latitude 40.736�N, longitude 73.823�E)
is adjacent to the campus of Queens College in a
neighborhood that is mainly residential/commercial.
There is a clear view of the Manhattan skyline from
the site. Based on 2000 census data, the population
density of Queens County is 52,800 people/km2. In
addition to normal urban street traffic there is a very
busy 6- to 8-lane interstate, I 495, that runs east and west
1.2 km north of the site and there are four additional 4-
to 6- lane highways within a radius of 5 km. The daily
PM2.5 samples (midnight–midnight, EST) were collected
from July 2001 through June 30, 2002 using a Rupprecht
& Patashnick ACCU sampler. The ACCU sampler is an
accessory on the Model 1400a particle mass analyzer.
After size separation, the air flow stream is split and
13.67 l/min (lpm) is sequentially drawn through 47-mm
2-mm pore size Zefluor filters. Air flow was controlled
with electronic mass-flow controllers to minimize the
errors in sampling volume, estimated at 72%. All airvolumes have been corrected to a temperature of 25�C
and a pressure of 1 atm. In addition to the Queens site
daily PM2.5 samples were also collected with ACCU
samplers at Pinnacle State Park in Steuben County
(Pinnacle, or P), and at Whiteface Mountain Lodge in
Essex County (Whiteface, or W). Pinnacle (42.091�N
and 77.210�E) is west and slightly north of New York
City at an elevation of 507m (see Fig. 5 for map with site
locations). The sampler was 5m above the ground. The
line of sight angle is 297� and the distance is 350 km.
Whiteface (44.393�N and 73.859�E) is almost due north
of New York City in the Adirondack Mountain region
of the state (Lodge elevation 600m) at a distance of
390 km. The sampler was located at ground level.
Whiteface is 390 km northeast of Pinnacle. The popula-
tion densities in Steuben and Essex Counties are 183.6,
and 55.9 people/km2, respectively, tiny compared
to the density in Queens. Because of the prevailing
westerly winds, all three sites are influenced by sulfate
transport from high SO2 emission sources in the
Midwest (Husain et al., 1998; Bari et al., 2003a, b).
Since Pinnacle and Whiteface have few nearby SO2emission sources, the data from these sites can be
expected to more accurately gauge transported sulfate
and help separate ‘‘local’’ versus transported compo-
nents at Queens.
2.2. Analysis
The aerosol samples were stored in sealed plastic Petri
dishes until analyzed. The entire filter was placed in 7ml
of distilled water and ultra-sonicated at 70�C for 90min.
One milliliter was removed for analysis of major anions
by ion chromatography (IC). The remaining solution
was stabilized against trace metal loss by addition of
nitric acid to a final concentration of 0.15%. A 1ml
aliquot was removed to determine soluble trace
metals by inductively coupled plasma mass-spec
analysis. The filter and the remaining 5ml were
digested in a microwave oven using hydrogen
peroxide, nitric acid, and hydrofluoric acid and
analyzed by inductively coupled plasma mass-spec
analysis for trace elements. We present the sulfate
results in this paper. The trace metal data will be
reported elsewhere.
After extraction, samples were kept refrigerated
until analyzed. The IC analysis was conducted
using a Dionex Model 500 composed of a high-pressure
pump, guard column, analytical column, anion
self-regenerating suppressor conductivity detector
(CD20), and auto-sampler and was equipped
with Peaknet software (Khwaja et al., 1999).
To maintain a high degree of linearity and thus limit
bias, the peak for sulfate was calibrated over the
range of 0.02–20mg/l, and any sample with
concentration above this range was diluted and
re-analyzed (usually 2–4� dilution). The analytical
column used was an Ion Pac AS4A (4� 250mm) andguard column AG4A (4� 50mm) with a 25-ml loop.A carbonate and bicarbonate eluent was used that
consisted of a mixture of 1.8mMNa2CO3 and
1.7mMNaHCO3, with a 1.6ml/min flow. The sulfate
retention time is 6.0min and the minimum reportable
level (MRL)was 0.10mg/l or 0.04mg/m3. At Pinnacleand Queens, all sulfate measurements were above the
MRL compared to 98% of the measurements at
Whiteface. Further details of the IC method may be
found in Khwaja et al. (1999).
ARTICLE IN PRESSV.A. Dutkiewicz et al. / Atmospheric Environment 38 (2004) 3179–3189 3181
3. Results
3.1. Trends and statistics for sulfate, July 1, 2001–June
30, 2002
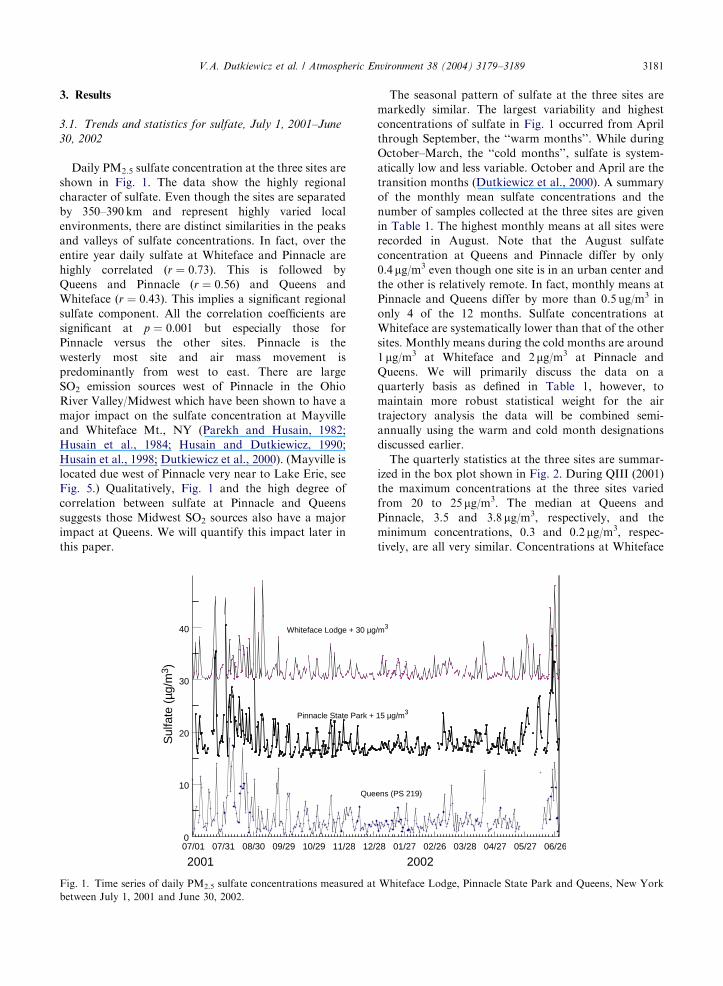
Daily PM2.5 sulfate concentration at the three sites are
shown in Fig. 1. The data show the highly regional
character of sulfate. Even though the sites are separated
by 350–390 km and represent highly varied local
environments, there are distinct similarities in the peaks
and valleys of sulfate concentrations. In fact, over the
entire year daily sulfate at Whiteface and Pinnacle are
highly correlated ðr ¼ 0:73Þ: This is followed by
Queens and Pinnacle ðr ¼ 0:56Þ and Queens and
Whiteface ðr ¼ 0:43Þ: This implies a significant regionalsulfate component. All the correlation coefficients are
significant at p ¼ 0:001 but especially those for
Pinnacle versus the other sites. Pinnacle is the
westerly most site and air mass movement is
predominantly from west to east. There are large
SO2 emission sources west of Pinnacle in the Ohio
River Valley/Midwest which have been shown to have a
major impact on the sulfate concentration at Mayville
and Whiteface Mt., NY (Parekh and Husain, 1982;
Husain et al., 1984; Husain and Dutkiewicz, 1990;
Husain et al., 1998; Dutkiewicz et al., 2000). (Mayville is
located due west of Pinnacle very near to Lake Erie, see
Fig. 5.) Qualitatively, Fig. 1 and the high degree of
correlation between sulfate at Pinnacle and Queens
suggests those Midwest SO2 sources also have a major
impact at Queens. We will quantify this impact later in
this paper.
07/01 07/31 08/30 09/29 10/29 11/28 12/
2001
0
10
20
30
40
Sul
fate
(µg
/m3 )
Whiteface Lodge + 30 µg
Pinnacle State Park +
Que
Fig. 1. Time series of daily PM2.5 sulfate concentrations measured at
between July 1, 2001 and June 30, 2002.
The seasonal pattern of sulfate at the three sites are
markedly similar. The largest variability and highest
concentrations of sulfate in Fig. 1 occurred from April
through September, the ‘‘warm months’’. While during
October–March, the ‘‘cold months’’, sulfate is system-
atically low and less variable. October and April are the
transition months (Dutkiewicz et al., 2000). A summary
of the monthly mean sulfate concentrations and the
number of samples collected at the three sites are given
in Table 1. The highest monthly means at all sites were
recorded in August. Note that the August sulfate
concentration at Queens and Pinnacle differ by only
0.4 mg/m3 even though one site is in an urban center andthe other is relatively remote. In fact, monthly means at
Pinnacle and Queens differ by more than 0.5 ug/m3 in
only 4 of the 12 months. Sulfate concentrations at
Whiteface are systematically lower than that of the other
sites. Monthly means during the cold months are around
1 mg/m3 at Whiteface and 2mg/m3 at Pinnacle andQueens. We will primarily discuss the data on a
quarterly basis as defined in Table 1, however, to
maintain more robust statistical weight for the air
trajectory analysis the data will be combined semi-
annually using the warm and cold month designations
discussed earlier.
The quarterly statistics at the three sites are summar-
ized in the box plot shown in Fig. 2. During QIII (2001)
the maximum concentrations at the three sites varied
from 20 to 25mg/m3. The median at Queens and
Pinnacle, 3.5 and 3.8mg/m3, respectively, and the
minimum concentrations, 0.3 and 0.2 mg/m3, respec-tively, are all very similar. Concentrations at Whiteface
28 01/27 02/26 03/28 04/27 05/27 06/26
2002
/m3
15 µg/m3
ens (PS 219)
Whiteface Lodge, Pinnacle State Park and Queens, New York
ARTICLE IN PRESS
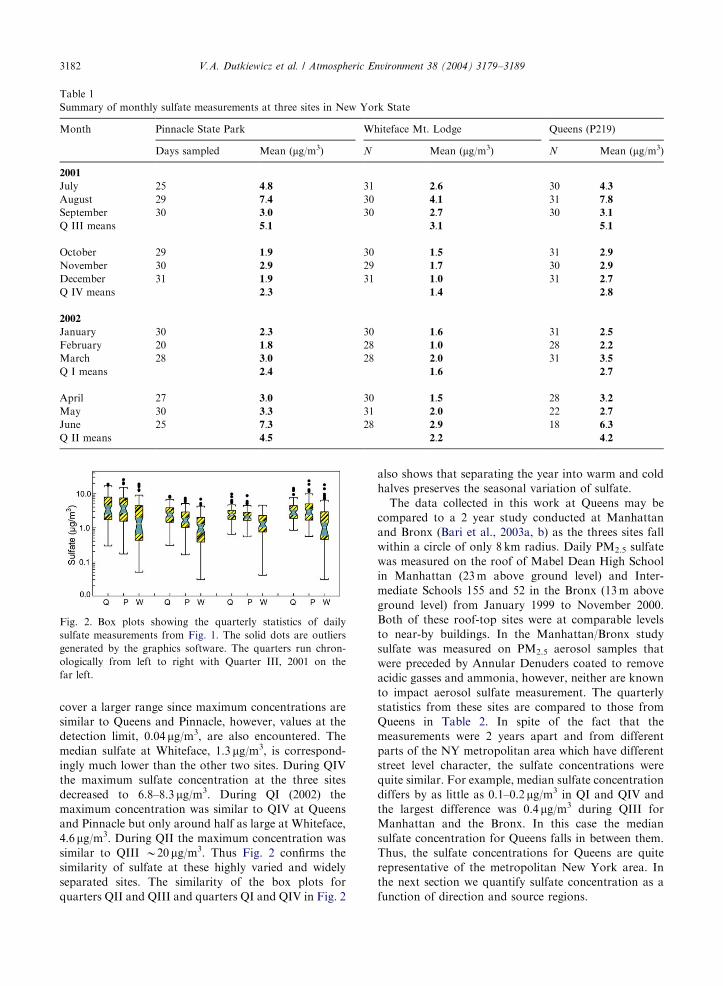
Table 1
Summary of monthly sulfate measurements at three sites in New York State
Month Pinnacle State Park Whiteface Mt. Lodge Queens (P219)
Days sampled Mean (mg/m3) N Mean (mg/m3) N Mean (mg/m3)
2001
July 25 4:8 31 2:6 30 4:3August 29 7:4 30 4:1 31 7:8September 30 3:0 30 2:7 30 3:1Q III means 5:1 3:1 5:1
October 29 1:9 30 1:5 31 2:9November 30 2:9 29 1:7 30 2:9December 31 1:9 31 1:0 31 2:7Q IV means 2:3 1:4 2:8
2002
January 30 2:3 30 1:6 31 2:5February 20 1:8 28 1:0 28 2:2March 28 3:0 28 2:0 31 3:5Q I means 2:4 1:6 2:7
April 27 3:0 30 1:5 28 3:2May 30 3:3 31 2:0 22 2:7June 25 7:3 28 2:9 18 6:3Q II means 4:5 2:2 4:2
Fig. 2. Box plots showing the quarterly statistics of daily
sulfate measurements from Fig. 1. The solid dots are outliers
generated by the graphics software. The quarters run chron-
ologically from left to right with Quarter III, 2001 on the
far left.
V.A. Dutkiewicz et al. / Atmospheric Environment 38 (2004) 3179–31893182
cover a larger range since maximum concentrations are
similar to Queens and Pinnacle, however, values at the
detection limit, 0.04 mg/m3, are also encountered. Themedian sulfate at Whiteface, 1.3 mg/m3, is correspond-ingly much lower than the other two sites. During QIV
the maximum sulfate concentration at the three sites
decreased to 6.8–8.3 mg/m3. During QI (2002) the
maximum concentration was similar to QIV at Queens
and Pinnacle but only around half as large at Whiteface,
4.6mg/m3. During QII the maximum concentration wassimilar to QIII B20mg/m3. Thus Fig. 2 confirms thesimilarity of sulfate at these highly varied and widely
separated sites. The similarity of the box plots for
quarters QII and QIII and quarters QI and QIV in Fig. 2
also shows that separating the year into warm and cold
halves preserves the seasonal variation of sulfate.
The data collected in this work at Queens may be
compared to a 2 year study conducted at Manhattan
and Bronx (Bari et al., 2003a, b) as the threes sites fall
within a circle of only 8 km radius. Daily PM2.5 sulfate
was measured on the roof of Mabel Dean High School
in Manhattan (23m above ground level) and Inter-
mediate Schools 155 and 52 in the Bronx (13m above
ground level) from January 1999 to November 2000.
Both of these roof-top sites were at comparable levels
to near-by buildings. In the Manhattan/Bronx study
sulfate was measured on PM2.5 aerosol samples that
were preceded by Annular Denuders coated to remove
acidic gasses and ammonia, however, neither are known
to impact aerosol sulfate measurement. The quarterly
statistics from these sites are compared to those from
Queens in Table 2. In spite of the fact that the
measurements were 2 years apart and from different
parts of the NY metropolitan area which have different
street level character, the sulfate concentrations were
quite similar. For example, median sulfate concentration
differs by as little as 0.1–0.2 mg/m3 in QI and QIV andthe largest difference was 0.4mg/m3 during QIII forManhattan and the Bronx. In this case the median
sulfate concentration for Queens falls in between them.
Thus, the sulfate concentrations for Queens are quite
representative of the metropolitan New York area. In
the next section we quantify sulfate concentration as a
function of direction and source regions.
ARTICLE IN PRESS
Table 2
Summary statistics for PM2.5 sulfate at selected sites in metropolitan NYa
Maximum 75% Median 25% Minimum Mean
Quarter I
Manh., 1999, 2000 9.5 4.1 2.9 1.9 0.6 3.2
Bronx, 99,00 7.8 3.7 2.7 1.7 1.8 3.0
Queens, 02 9.7 3.2 2.4 1.8 0.6 2.7
Quarter II
Manh., 99, 00 15.4 5.0 3.0 1.9 0.5 4.0
Bronx, 99,00 15.8 4.7 2.9 1.7 0.5 3.9
Queens, 02 14.2 4.4 2.9 2.0 0.8 3.9
Quarter III
Manh., 99, 00 24.1 7.5 3.7 1.9 0.3 5.5
Bronx, 00 13.9 6.3 3.3 1.8 0.4 4.7
Queens, 01 18.8 7.7 3.5 1.8 0.3 5.1
Quarter IV
Manh., 99, 9.7 3.8 2.2 1.6 0.6 2.9
Bronx, 00 8.7 3.6 2.2 1.4 0.2 2.7
Queens, 01 8.3 3.8 2.4 1.4 0.3 2.8
aQueens (this work), Manhattan and the Bronx (Bari et al., 2003a, b).
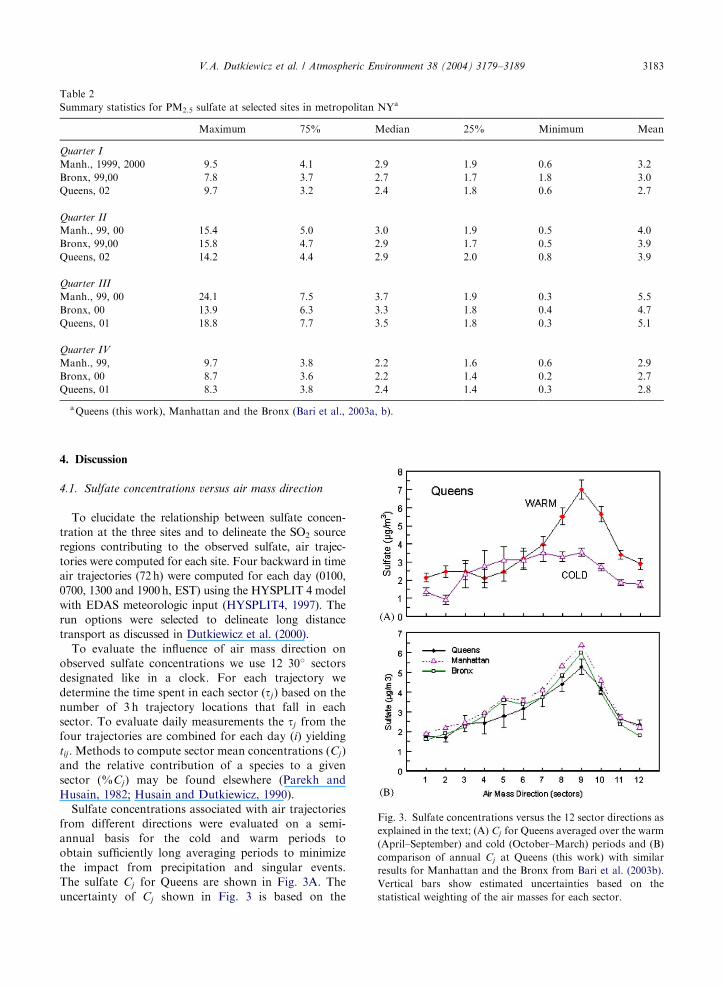
Fig. 3. Sulfate concentrations versus the 12 sector directions as
explained in the text; (A) Cj for Queens averaged over the warm
(April–September) and cold (October–March) periods and (B)
comparison of annual Cj at Queens (this work) with similar
results for Manhattan and the Bronx from Bari et al. (2003b).
Vertical bars show estimated uncertainties based on the
statistical weighting of the air masses for each sector.
V.A. Dutkiewicz et al. / Atmospheric Environment 38 (2004) 3179–3189 3183
4. Discussion
4.1. Sulfate concentrations versus air mass direction
To elucidate the relationship between sulfate concen-
tration at the three sites and to delineate the SO2 source
regions contributing to the observed sulfate, air trajec-
tories were computed for each site. Four backward in time
air trajectories (72h) were computed for each day (0100,
0700, 1300 and 1900h, EST) using the HYSPLIT 4 model
with EDAS meteorologic input (HYSPLIT4, 1997). The
run options were selected to delineate long distance
transport as discussed in Dutkiewicz et al. (2000).
To evaluate the influence of air mass direction on
observed sulfate concentrations we use 12 30� sectors
designated like in a clock. For each trajectory we
determine the time spent in each sector (tj) based on the
number of 3 h trajectory locations that fall in each
sector. To evaluate daily measurements the tj from the
four trajectories are combined for each day (i) yielding
tij :Methods to compute sector mean concentrations (Cj)
and the relative contribution of a species to a given
sector (%Cj) may be found elsewhere (Parekh and
Husain, 1982; Husain and Dutkiewicz, 1990).
Sulfate concentrations associated with air trajectories
from different directions were evaluated on a semi-
annual basis for the cold and warm periods to
obtain sufficiently long averaging periods to minimize
the impact from precipitation and singular events.
The sulfate Cj for Queens are shown in Fig. 3A. The
uncertainty of Cj shown in Fig. 3 is based on the
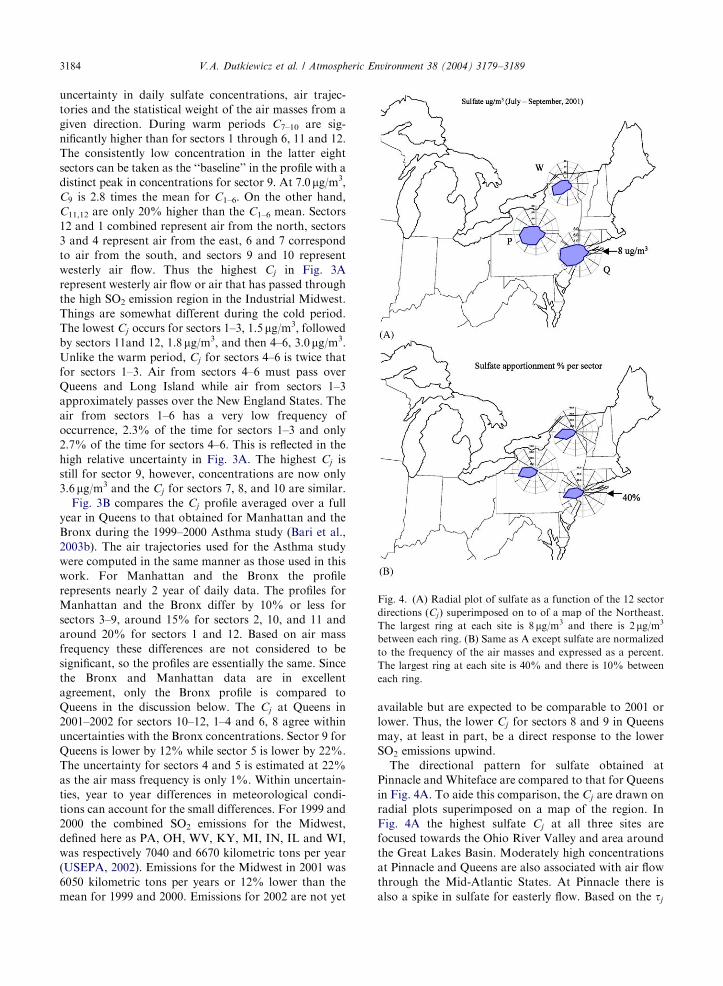
ARTICLE IN PRESS
Fig. 4. (A) Radial plot of sulfate as a function of the 12 sector
directions ðCjÞ superimposed on to of a map of the Northeast.The largest ring at each site is 8mg/m3 and there is 2 mg/m3
between each ring. (B) Same as A except sulfate are normalized
to the frequency of the air masses and expressed as a percent.
The largest ring at each site is 40% and there is 10% between
each ring.
V.A. Dutkiewicz et al. / Atmospheric Environment 38 (2004) 3179–31893184
uncertainty in daily sulfate concentrations, air trajec-
tories and the statistical weight of the air masses from a
given direction. During warm periods C7–10 are sig-
nificantly higher than for sectors 1 through 6, 11 and 12.
The consistently low concentration in the latter eight
sectors can be taken as the ‘‘baseline’’ in the profile with a
distinct peak in concentrations for sector 9. At 7.0mg/m3,C9 is 2.8 times the mean for C1–6. On the other hand,
C11,12 are only 20% higher than the C1–6 mean. Sectors
12 and 1 combined represent air from the north, sectors
3 and 4 represent air from the east, 6 and 7 correspond
to air from the south, and sectors 9 and 10 represent
westerly air flow. Thus the highest Cj in Fig. 3A
represent westerly air flow or air that has passed through
the high SO2 emission region in the Industrial Midwest.
Things are somewhat different during the cold period.
The lowest Cj occurs for sectors 1–3, 1.5mg/m3, followed
by sectors 11and 12, 1.8 mg/m3, and then 4–6, 3.0mg/m3.Unlike the warm period, Cj for sectors 4–6 is twice that
for sectors 1–3. Air from sectors 4–6 must pass over
Queens and Long Island while air from sectors 1–3
approximately passes over the New England States. The
air from sectors 1–6 has a very low frequency of
occurrence, 2.3% of the time for sectors 1–3 and only
2.7% of the time for sectors 4–6. This is reflected in the
high relative uncertainty in Fig. 3A. The highest Cj is
still for sector 9, however, concentrations are now only
3.6mg/m3 and the Cj for sectors 7, 8, and 10 are similar.
Fig. 3B compares the Cj profile averaged over a full
year in Queens to that obtained for Manhattan and the
Bronx during the 1999–2000 Asthma study (Bari et al.,
2003b). The air trajectories used for the Asthma study
were computed in the same manner as those used in this
work. For Manhattan and the Bronx the profile
represents nearly 2 year of daily data. The profiles for
Manhattan and the Bronx differ by 10% or less for
sectors 3–9, around 15% for sectors 2, 10, and 11 and
around 20% for sectors 1 and 12. Based on air mass
frequency these differences are not considered to be
significant, so the profiles are essentially the same. Since
the Bronx and Manhattan data are in excellent
agreement, only the Bronx profile is compared to
Queens in the discussion below. The Cj at Queens in
2001–2002 for sectors 10–12, 1–4 and 6, 8 agree within
uncertainties with the Bronx concentrations. Sector 9 for
Queens is lower by 12% while sector 5 is lower by 22%.
The uncertainty for sectors 4 and 5 is estimated at 22%
as the air mass frequency is only 1%. Within uncertain-
ties, year to year differences in meteorological condi-
tions can account for the small differences. For 1999 and
2000 the combined SO2 emissions for the Midwest,
defined here as PA, OH, WV, KY, MI, IN, IL and WI,
was respectively 7040 and 6670 kilometric tons per year
(USEPA, 2002). Emissions for the Midwest in 2001 was
6050 kilometric tons per years or 12% lower than the
mean for 1999 and 2000. Emissions for 2002 are not yet
available but are expected to be comparable to 2001 or
lower. Thus, the lower Cj for sectors 8 and 9 in Queens
may, at least in part, be a direct response to the lower
SO2 emissions upwind.
The directional pattern for sulfate obtained at
Pinnacle and Whiteface are compared to that for Queens
in Fig. 4A. To aide this comparison, the Cj are drawn on
radial plots superimposed on a map of the region. In
Fig. 4A the highest sulfate Cj at all three sites are
focused towards the Ohio River Valley and area around
the Great Lakes Basin. Moderately high concentrations
at Pinnacle and Queens are also associated with air flow
through the Mid-Atlantic States. At Pinnacle there is
also a spike in sulfate for easterly flow. Based on the tj
ARTICLE IN PRESSV.A. Dutkiewicz et al. / Atmospheric Environment 38 (2004) 3179–3189 3185
the uncertainty is around715%.The sulfate for easterlyair flow in the cold period was comparable to that for
northeasterly air flow so this spike may be an anomaly.
We will be able to further evaluate this as more data are
collected in the future.
4.2. Apportionment of sulfate source regions using air
trajectories
The impact of a source region on the sulfate at a
receptor depends on both the concentrations accumu-
lated by the air mass during transport and the frequency
of air masses. The former is represented by Cj evaluated
in Figs. 4A and the latter are the tj computed by the
trajectories. Air most frequently arrives from the west
and northwest and there is very low impact from the
southeast quadrant (sectors 4–6). By taking the product
of Cj and tj and normalizing by the sum of the product
over all sectors yields the percentage of sulfate impacting
from each sector. This is shown for the three sites in
Fig. 4B. At Queens 44% of the sulfate is associated with
westerly air flow, 25% with southwesterly, 19% with
northwesterly, and other directions have negligible
contributions. The results at Pinnacle are similar 42%
from the west, 26% for the southwest, 18% from the
northwest and very small components from the other
directions. The pattern at Whiteface is shifted towards
the southwest, 47% from the west, 37% from the
southwest, 12.9% from the northwest, and a very small
component from the other directions. Another differ-
ence between the sites is a somewhat larger southerly
components at Pinnacle, 6.8% compared to 4.4% at
Queens and Whiteface at 5.5%.
4.3. Evaluation of local versus transported components
at Queens
As discussed above it is clear that the highest sulfate
concentrations are associated with westerly air flow,
however, this does not differentiate the sulfate that is
transported from upwind sources from that produced
locally. At all three of the Metropolitan sites in Fig. 3B,
sectors 1–4 and 11 and 12 had similar concentrations,
mean 2.2mg/m3. Sectors 5 and 6 for Manhattan and theBronx are somewhat higher averaging 3.5 mg/m3 com-pared to 2.3mg/m3 for Queens. Assuming that sulfate atQueens is the simple sum of contributions transported
from distant sources and contributions from the
Metropolitan area, these components can be de-con-
voluted with the help of the air trajectories. The former
should show a strong dependence on direction while the
latter should be largely independent on direction. Based
on these assumptions Bari et al. (2003b) estimated local
and transported components for sulfate, sulfur dioxide
and PM2.5 from the Asthma study data collected in
Manhattan and the Bronx. The similarity of the baseline
concentration at the three Metropolitan sites in Fig. 3B,
supports the assumption that the baseline Cj represents
a homogenous local contribution. The local concentra-
tions were obtained by averaging Cj for sectors 12 and
1–4 (sectors 12–4). Note the lack of significant variation
of Cj over these sectors in Fig. 3A. As discussed by Bari
et al. (2003b) local as defined by this method is at least
the equivalent of 6 h mass transport as this could not be
resolved in our analysis. Since air mass speed based on
trajectories are 24–30 kmh�1, local, is at least of the
order of 160 km radius around the site. Also, this
approach cannot account for contributions from more
distant sources in the direction of sectors 12–4, so the
local sulfate concentration should be taken as an upper
value. On a semiannual basis the local component is
1.75 mg/m3 for the cold period and 2.4 mg/m3 during thewarm. These are almost identical to the values obtained
for 1999 in Manhattan (Bari et al., 2003b).
Evaluating local sulfate at Whiteface and Pinnacle
with this method is a bit more error-prone since there is
a low population and the lack of significant industry
around the sites. Thus, local sources may be small
individual point sources and the assumption of a
homogenous local baseline may not be as appropriate
as in a large metropolitan area. With this caution in
mind we have evaluated the baseline sulfate at Pinnacle
and Whiteface. This was very straight forward at
Whiteface as sectors 12–4 were low and of comparable
values during the warm and cold periods, 0.6 mg/m3.This was also true for Pinnacle during the cold period as
sectors 12–4 averaged only 0.8 mg/m3. This is in spite ofthe fact that there are significant SO2 emission point
sources (between 10,000 and 50,000 tons/year) within
125 km to the north around Rochester, NY and 210 km
to the north northwest around Buffalo, NY. Even
excluding sectors 3 and 4 the baseline for the warm
period is 0.8mg/m3, higher than the cold period, perhapsreflecting contributions from the SO2 emission sources
around Buffalo and Rochester. Unfortunately, air
trajectories from this direction occur infrequently so
the uncertainty for this number is very large. Taking into
account the lack of a seasonal variation at Whiteface, a
background for Pinnacle of 0.8 mg/m3 over both seasonsseems appropriate.
An alternate method to evaluate the local sulfate
component at a complex urban site like Queens is to
compare measurements to an upwind rural site. We
discussed earlier that the daily sulfate concentration at
the three sites are significantly correlated, however,
localized events like precipitation can blur the correla-
tion. Thus, in this case, a longer averaging time may be
helpful. There are total sulfate measurements made on a
weekly basis at various CASTNet sites around the
Northeastern US (Baumgardner et al., 1999). Table 3
lists the nearby CASTNet sites along with our site at
Mayville, NY. Locations are indicated in Fig. 5. The
ARTICLE IN PRESS
Table 3
Summary of selected sites in the Northeast and regression coefficients for weekly sulfate versus that at Pinnacle State Park
Site name Short name (site no.) Program Regression coefficients versus Pinnacle sulfatea
N Slope Intercept r2
Pennsylvania State University, PA PSU (106) CASTNetb 48 1.22 0.03 0.89
Kane Experimental Forrest, PA KEF (112) CASTNet 47 1.16 0.14 0.93
M.K.Goddard, PA MKG (113) CASTNet 47 1.14 0.10 0.85
Mayville, NY M NYSDOHc 43 1.07 �0.26 0.92
Queens, NY Q this work 45 0.87 0.84 0.81
Connecticut Hill, NY CTH (110) CASTNet 42 0.84 0.31 0.95
Washingtons Crossing, NJ WNJ (144) CASTNet 44 0.84 0.64 0.80
Claryville, NY CLV (175) CASTNet 47 0.78 0.46 0.85
Whiteface Mt. Lodge, NY W this work 45 0.67 �0.22 0.85
Lye Brook, VT LYE (145) CASTNet 45 0.60 0.43 0.82
aLinear regression between weekly sulfate concentrations (July 2001–June 2002) and that at Pinnacle. Some outliers were removed.b (Baumgardner et al., 1999) Data downloaded from web site http://www.epa.gov/castnet/data.cNew York State Department of Health (Husain et al., 1998).
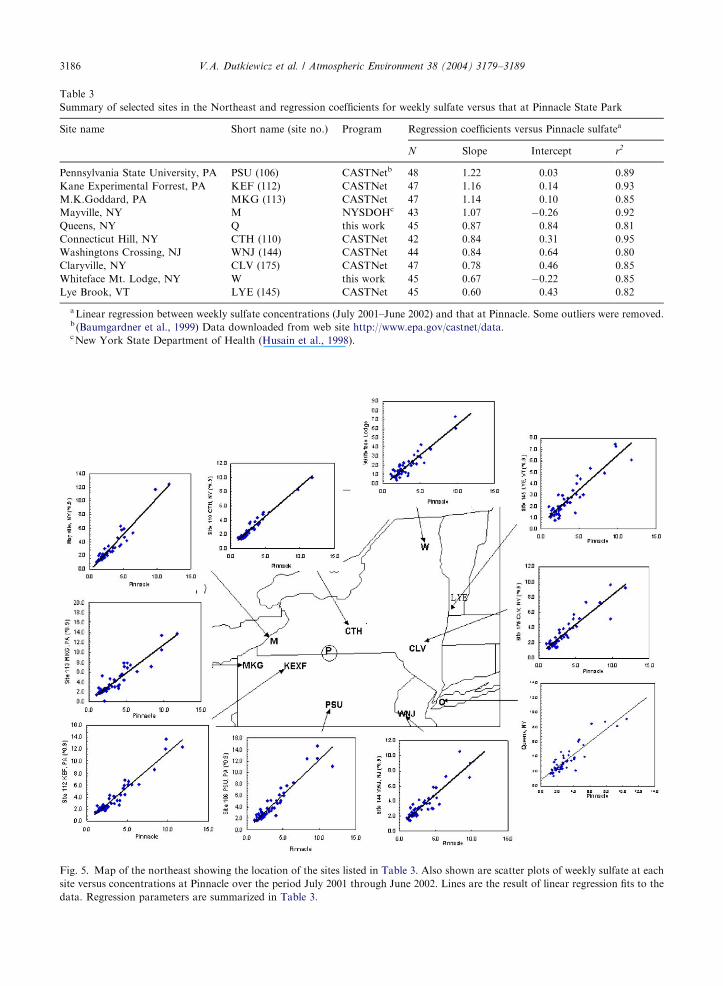
Fig. 5. Map of the northeast showing the location of the sites listed in Table 3. Also shown are scatter plots of weekly sulfate at each
site versus concentrations at Pinnacle over the period July 2001 through June 2002. Lines are the result of linear regression fits to the
data. Regression parameters are summarized in Table 3.
V.A. Dutkiewicz et al. / Atmospheric Environment 38 (2004) 3179–31893186
ARTICLE IN PRESS
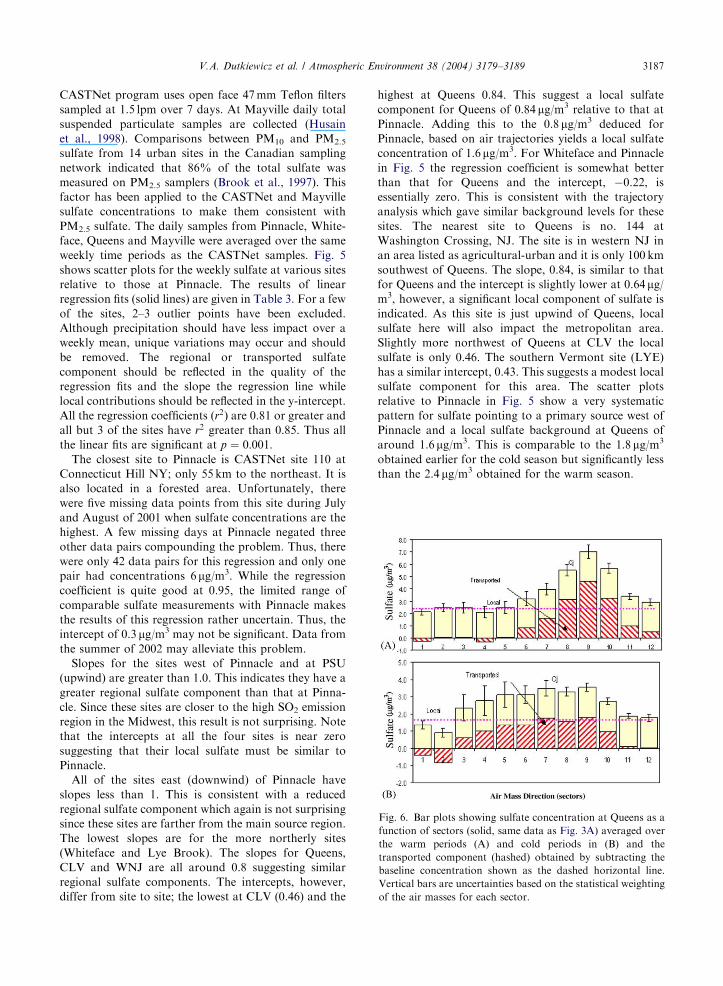
Fig. 6. Bar plots showing sulfate concentration at Queens as a
function of sectors (solid, same data as Fig. 3A) averaged over
the warm periods (A) and cold periods in (B) and the
transported component (hashed) obtained by subtracting the
baseline concentration shown as the dashed horizontal line.
Vertical bars are uncertainties based on the statistical weighting
of the air masses for each sector.
V.A. Dutkiewicz et al. / Atmospheric Environment 38 (2004) 3179–3189 3187
CASTNet program uses open face 47mm Teflon filters
sampled at 1.5 lpm over 7 days. At Mayville daily total
suspended particulate samples are collected (Husain
et al., 1998). Comparisons between PM10 and PM2.5
sulfate from 14 urban sites in the Canadian sampling
network indicated that 86% of the total sulfate was
measured on PM2.5 samplers (Brook et al., 1997). This
factor has been applied to the CASTNet and Mayville
sulfate concentrations to make them consistent with
PM2.5 sulfate. The daily samples from Pinnacle, White-
face, Queens and Mayville were averaged over the same
weekly time periods as the CASTNet samples. Fig. 5
shows scatter plots for the weekly sulfate at various sites
relative to those at Pinnacle. The results of linear
regression fits (solid lines) are given in Table 3. For a few
of the sites, 2–3 outlier points have been excluded.
Although precipitation should have less impact over a
weekly mean, unique variations may occur and should
be removed. The regional or transported sulfate
component should be reflected in the quality of the
regression fits and the slope the regression line while
local contributions should be reflected in the y-intercept.
All the regression coefficients ðr2Þ are 0.81 or greater andall but 3 of the sites have r2 greater than 0.85. Thus all
the linear fits are significant at p ¼ 0:001:The closest site to Pinnacle is CASTNet site 110 at
Connecticut Hill NY; only 55 km to the northeast. It is
also located in a forested area. Unfortunately, there
were five missing data points from this site during July
and August of 2001 when sulfate concentrations are the
highest. A few missing days at Pinnacle negated three
other data pairs compounding the problem. Thus, there
were only 42 data pairs for this regression and only one
pair had concentrations 6mg/m3. While the regressioncoefficient is quite good at 0.95, the limited range of
comparable sulfate measurements with Pinnacle makes
the results of this regression rather uncertain. Thus, the
intercept of 0.3 mg/m3 may not be significant. Data fromthe summer of 2002 may alleviate this problem.
Slopes for the sites west of Pinnacle and at PSU
(upwind) are greater than 1.0. This indicates they have a
greater regional sulfate component than that at Pinna-
cle. Since these sites are closer to the high SO2 emission
region in the Midwest, this result is not surprising. Note
that the intercepts at all the four sites is near zero
suggesting that their local sulfate must be similar to
Pinnacle.
All of the sites east (downwind) of Pinnacle have
slopes less than 1. This is consistent with a reduced
regional sulfate component which again is not surprising
since these sites are farther from the main source region.
The lowest slopes are for the more northerly sites
(Whiteface and Lye Brook). The slopes for Queens,
CLV and WNJ are all around 0.8 suggesting similar
regional sulfate components. The intercepts, however,
differ from site to site; the lowest at CLV (0.46) and the
highest at Queens 0.84. This suggest a local sulfate
component for Queens of 0.84 mg/m3 relative to that atPinnacle. Adding this to the 0.8mg/m3 deduced forPinnacle, based on air trajectories yields a local sulfate
concentration of 1.6mg/m3. For Whiteface and Pinnaclein Fig. 5 the regression coefficient is somewhat better
than that for Queens and the intercept, �0.22, isessentially zero. This is consistent with the trajectory
analysis which gave similar background levels for these
sites. The nearest site to Queens is no. 144 at
Washington Crossing, NJ. The site is in western NJ in
an area listed as agricultural-urban and it is only 100 km
southwest of Queens. The slope, 0.84, is similar to that
for Queens and the intercept is slightly lower at 0.64mg/m3, however, a significant local component of sulfate is
indicated. As this site is just upwind of Queens, local
sulfate here will also impact the metropolitan area.
Slightly more northwest of Queens at CLV the local
sulfate is only 0.46. The southern Vermont site (LYE)
has a similar intercept, 0.43. This suggests a modest local
sulfate component for this area. The scatter plots
relative to Pinnacle in Fig. 5 show a very systematic
pattern for sulfate pointing to a primary source west of
Pinnacle and a local sulfate background at Queens of
around 1.6mg/m3. This is comparable to the 1.8mg/m3
obtained earlier for the cold season but significantly less
than the 2.4 mg/m3 obtained for the warm season.
ARTICLE IN PRESSV.A. Dutkiewicz et al. / Atmospheric Environment 38 (2004) 3179–31893188
Fig. 6 shows Cj ; the local baseline based on airtrajectories, and the resultant transported sulfate ðTjÞ forQueens. During the cold period Tj ’s are less than the
local baseline value except for sector 9 which is 1.6
mg/m3. Fig. 6B also indicates the potential for small tomoderate transported components for sectors 7, 8 and
10, while the small positive differences for sectors 4–6
are within the uncertainties of Cj for those sectors and
are not considered significant. Integrating the shaded
bars and the baseline sulfate during the cold period
yields 39% of the sulfate as transported. Of this, 88% is
associated with sectors 8, 9, and 10. If 1.6 mg/m3 is usedfor the local sulfate the transported component is
increased to 44%.
For the warm period in Fig. 6 there is a large
transported component for sectors 8–10. The positive
difference for sector 7 is marginally significant. For
sector 9, the transported component represent 4.2 mg/m3
or a factor of 1.8 time the baseline. The Cj ’s for sectors 6
and 11 are essentially equal to the baseline value
suggesting negligible transported components. Integrat-
ing the shaded area in Fig. 6 for the warm period yields
48% transported. Once again, the sectors 8, 9,
and 10 contributed 87% of transported component.
If 1.6mg/m3 is used for the local sulfate, the
transported component is increased to 65%. On an
annual basis, the present data indicates that
between 44% and 55% of the sulfate at Queens is
transported. Bari et al. (2003b) obtained a 46% annual
average for Manhattan and the Bronx in 1999 and 40%
in 2000, in excellent agreement with the present results
from Queens. Transported sulfate at Whiteface and
Pinnacle are much larger, 72% and 62%, respectively,
integrated over the warm months and 49% and 60%
integrated over the cold. Thus, on an annual basis 60%
of the sulfate is transported at Whiteface and at
Pinnacle.
5. Summary and conclusions
Significant observations and conclusions based on the
first year of daily sulfate measurements at the three
New York Supersites are:
* Sulfate concentrations over broad regions in the
Northeast are highly correlated.* Day to day human activities do not appear to
contribute significantly to the PM2.5 sulfate since
sites with grossly different population densities can
have essentially the same concentrations.* Based on air trajectories and on an annual
basis at Queens, 44–55% of the SO42� is trans-
ported from distant sources. This value for
Pinnacle State Park and Whiteface Mountain
is 60%.
Acknowledgements
This work was supported in part by the New York
State Energy Research and Development Authority
(NYSERDA), contract no. 4918ERTERES99, the US
Environmental Protection Agency (EPA) cooperative
agreement no. R828060010 and New York State
Department of Environmental Conservation (NYS
DEC), contract no. C004210. Although the research
described in this article has been funded in part by the
US Environmental Protection Agency, it has not been
subjected to the Agency’s required peer and policy
review and therefore does not necessarily reflect the
views of the Agency and no official endorsement should
be inferred. The assistance of Pamela Kruger in data
reduction is gratefully acknowledged.
References
Bari, A., Ferraro, V., Wilson, L.R., Luttinger, D., Husain, L.,
2003a. Measurements of gaseous HONO, HNO3, SO2,
HCL, NH3, particulate sulfate and PM2.5 in New York,
NY. Atmospheric Environment 37, 2825–2835.
Bari, A., Dutkiewicz, V.A., Judd, C.D., Wilson, L.R.,
Luttinger, D., Husain, L., 2003b. Regional sources of
particulate sulfate, SO2, PM2.5, HCL, HNO3, HONO and
NH3 in New York, NY. Atmospheric Environment 37,
2837–2844.
Baumgardner, R.E., Isil, S.S., Bowser, J.J., Fitzgerald, K.M.,
1999. Measurements of rural sulfur dioxide and particulate
sulfate: analysis on CASTNet data, 1987 through 1996.
Journal of Air and Waste Management Association 49,
1266–1279.
Brook, J.R., Dann, T.F., Burnett, R.T., 1997. The relationship
among TSP, PM10, PM2.5, and inorganic constituents of
atmospheric particulate matter at Multiple Canadian Sites.
Journal of Air and Waste Management Association 47,
2–19.
Dockery, D.W., Pope III, C.A., 1994. Acute respiratory effects
of particulate air pollution. Annual Review of Public Health
15, 107–132.
Dockery, D.W., Pope III, C.A., Xu, X., Spengler, J.D., Ware,
J.H., Martha, E., Fay, M.E., Ferris Jr., B.G., Speitzer, F.E.,
1993. An association between air pollution and mortality in
six US cities. New England Journal of Medicine 329,
1753–1759.
Drewnick, F., Schwab, J.J., Hogrefe, O., Peters, S., Husain, L.,
Diamond, D., Weber, R., Demerjian, K.L., 2003. Inter-
comparison and evaluation of four semi-continuous PM2.5
sulfate instruments. Atmospheric Environment 37,
3335–3350.
Drewnick, F., Schwab, J.J., Jayne, J.T., Canagaratna, M.,
Worsnop, D.R., Demerjian, K.L., 2004a. Measurement of
ambient aerosol composition during the PMTACS-NY
2001 using as aerosol mass spectromoter, part I: mass
concentrations. Aerosol Science and Technology 38 (Suppl. 1),
92–103.
ARTICLE IN PRESSV.A. Dutkiewicz et al. / Atmospheric Environment 38 (2004) 3179–3189 3189
Drewnick, F., Jayne, J.T., Canagaratna, M., Worsnop, D.R.,
Demerjian, K.L., 2004b. Measurement of ambient aerosol
composition during the PMTACS-NY 2001 using as aero-
sol mass spectromoter, part II: chemically speciated
mass distributions. Aerosol Science and Technology 38
(Suppl. 1), 104–117.
Dutkiewicz, V.A., Das, M., Husain, L., 2000. The relationship
between regional SO2 emissions and downwind aerosol
sulfate concentrations in the Northeastern US. Atmospheric
Environment 34, 1821–1832.
Gwynn, C.R., Burnett, R.T., Thurston, G.D., 2000. A
time-series analysis of acidic particulate matter
and daily mortality and morbidity in the Buffalo,
New York, region. Environmental Health Perspectives
108, 125–133.
Husain, L., Dutkiewicz, V.A., 1990. A long-term (1975–1988)
study of atmospheric SO4: regional contributions and
concentration trends. Atmospheric Environment 24A,
1175–1187.
Husain, L., Webber, J.S., Canelli, E., Dutkiewicz, V.A.,
Halstead, J.A., 1984. Mn/V ratio as a tracer of aerosol
sulfate transport. Atmospheric Environment 18, 1059–1071.
Husain, L., Dutkiewicz, V.A., Das, M., 1998. Evidence for
decrease in atmospheric sulfur burden in the eastern United
States caused by reduction in SO2 emissions. Geophysics
Research Letters 25, 967–970.
HYSPLIT4 (Hybrid Single-Particle Langrangian Integrated
Trajectory) Model, 1997. Web address:http://www.
arl.noaa.gov/ready/hysplit4.html, NOAA Air Resources
Laboratory, Silver Spring, MD.
Khwaja, H.A., Khan, A.R., Qureshi, S., 1999. Ion chromato-
graphic determination of anions in environmental samples.
International Environmental Analytical Chemistry 75, 285–297.
Parekh, P.P., Husain, L., 1982. Ambient sulfate concentrations
and windflow patterns at Whiteface Mountain, New York.
Geophysics Research Letters 9, 79–82.
USEPA, 2002. Latest Findings on National Air Quality, 2001
status and trends, EPA 454/K-02-001.
Copyright © 2022 FDOKUMEN