Characteristics of Video Traffic from Videoconference Applications: From H.261 to H.264
11
Hindawi Publishing Corporation Journal of Computer Networks and Communications Volume 2013, Article ID 614157, 10 pages http://dx.doi.org/10.1155/2013/614157 Research Article Characteristics of Video Traffic from Videoconference Applications: From H.261 to H.264 S. Domoxoudis, 1 S. Kouremenos, 2 V. Loumos, 1 and A. Drigas 2 1 Multimedia Technology Laboratory, School of Electrical and Computer Engineering, National Technical University of Athens “NTUA”, Zographou 15780, Attiki, Greece 2 National Center for Scienti�c Research “�EM��R�T�S”, �nstitute of �nformatics and Telecommunications, Ag. Paraskevi 15310, Attiki, Greece Correspondence should be addressed to A. Drigas; [email protected] Received 10 September 2012; Accepted 4 December 2012 Academic Editor: Rui Zhang Copyright © 2013 S. Domoxoudis et al. is is an open access article distributed under the Creative Commons Attribution License, which permits unrestricted use, distribution, and reproduction in any medium, provided the original work is properly cited. is paper presents modelling results for H.26x video traffic generated by popular videoconference soware applications. e analysis of videoconference data, that were measured during realistic point-point videoconference sessions, led us to the general conclusion that the traffic can be distinguished into two categories: unconstrained and constrained. In the unconstrained traffic, there is a direct relation between the encoder and the form of the frequency histogram of the frame-size sequence. Moreover, for this type of traffic, strong correlations between successive video frames can be found. On the other hand, where bandwidth constraints are imposed during the encoding process, the generated traffic appears to exhibit similar characteristics for all the examined encoders with the very low autocorrelation values being the most notable one. On the basis of these results, this study proposes methods to calculate the parameters of a widely adopted autoregressive model for both types of traffic. 1. Introduction H.26x videoconference traffic is expected to account for large portions of the multimedia traffic in future heterogeneous networks (wire, wireless and satellite). e videoconference traffic models for these networks must cover a wide range of traffic types and characteristics because the type of the terminals will range from a single home or mobile user (low video bit rate), where constrained video traffic is mainly produced, to a terminal connected to a backbone network (high video bit rate), where the traffic is presented to be unconstrained. Partly due to the above reasons, the modelling and performance evaluation of videoconference traffic has been extensively studied in literature and a wide range of modelling methods exist. e results of relevant early studies [1–8] concerning the statistical analysis of variable bit rate video- conference streams being multiplexed in ATM networks, indicate that the histogram of the videoconference frame- size sequence exhibits an asymmetric bell shape and that the autocorrelation function decays approximately exponentially to zero. An important body of knowledge, in videoconference traffic modelling, is the approach in [5] where the DAR(1) [9] model was proposed. More explicitly, in this study, the authors noted that AR models of at least order two are required for a satisfactory modelling of the examined H.261 encoded traffic patterns. However, in the same study, the authors observed that a simple DAR(1) model, based on a discrete-time, discrete state Markov Chain performs bet- ter—with respect to queueing—than a simple AR(2) model. e results of this study are further veri�ed by similar studies of videoconference traffic modelling [7] and VBR video performance and simulation [6, 10]. In [11], Dr. Heyman proposed and evaluated the GBAR process, as an accurate and well-performed single-source videoconference traffic model. e DAR(1) and GBAR(1) models provide a basis for videoconference traffic modelling through the matching of basic statistical features of the sample traffic. On this basis and towards the modelling of videoconference traffic encoded by the Intra-H261 encoder of the ViC tool, the author in [12]
Transcript of Characteristics of Video Traffic from Videoconference Applications: From H.261 to H.264
Hindawi Publishing CorporationJournal of Computer Networks and CommunicationsVolume 2013 Article ID 614157 10 pageshttpdxdoiorg1011552013614157
Research ArticleCharacteristics of Video Traffic fromVideoconferenceApplications FromH261 to H264
S Domoxoudis1 S Kouremenos2 V Loumos1 and A Drigas2
1Multimedia Technology Laboratory School of Electrical and Computer EngineeringNational Technical University of Athens ldquoNTUArdquo Zographou 15780 Attiki Greece
2National Center for Scientic Research ldquoEMRTSrdquo nstitute of nformatics and TelecommunicationsAg Paraskevi 15310 Attiki Greece
Correspondence should be addressed to A Drigas driitdemokritosgr
Received 10 September 2012 Accepted 4 December 2012
Academic Editor Rui Zhang
Copyright copy 2013 S Domoxoudis et alis is an open access article distributed under the Creative CommonsAttribution Licensewhich permits unrestricted use distribution and reproduction in any medium provided the original work is properly cited
is paper presents modelling results for H26x video traffic generated by popular videoconference soware applications eanalysis of videoconference data that were measured during realistic point-point videoconference sessions led us to the generalconclusion that the traffic can be distinguished into two categories unconstrained and constrained In the unconstrained trafficthere is a direct relation between the encoder and the form of the frequency histogram of the frame-size sequence Moreoverfor this type of traffic strong correlations between successive video frames can be found On the other hand where bandwidthconstraints are imposed during the encoding process the generated traffic appears to exhibit similar characteristics for all theexamined encoders with the very low autocorrelation values being the most notable one On the basis of these results this studyproposes methods to calculate the parameters of a widely adopted autoregressive model for both types of traffic
1 Introduction
H26x videoconference traffic is expected to account for largeportions of the multimedia traffic in future heterogeneousnetworks (wire wireless and satellite) e videoconferencetraffic models for these networks must cover a wide rangeof traffic types and characteristics because the type of theterminals will range from a single home or mobile user (lowvideo bit rate) where constrained video traffic is mainlyproduced to a terminal connected to a backbone network(high video bit rate) where the traffic is presented to beunconstrained
Partly due to the above reasons the modelling andperformance evaluation of videoconference traffic has beenextensively studied in literature and awide range ofmodellingmethods exist e results of relevant early studies [1ndash8]concerning the statistical analysis of variable bit rate video-conference streams being multiplexed in ATM networksindicate that the histogram of the videoconference frame-size sequence exhibits an asymmetric bell shape and that the
autocorrelation function decays approximately exponentiallyto zero An important body of knowledge in videoconferencetraffic modelling is the approach in [5] where the DAR(1)[9] model was proposed More explicitly in this study theauthors noted that AR models of at least order two arerequired for a satisfactory modelling of the examined H261encoded traffic patterns However in the same study theauthors observed that a simple DAR(1) model based ona discrete-time discrete state Markov Chain performs bet-termdashwith respect to queueingmdashthan a simple AR(2) modele results of this study are further veried by similar studiesof videoconference traffic modelling [7] and VBR videoperformance and simulation [6 10] In [11] Dr Heymanproposed and evaluated theGBARprocess as an accurate andwell-performed single-source videoconference traffic model
e DAR(1) and GBAR(1) models provide a basis forvideoconference traffic modelling through the matching ofbasic statistical features of the sample trafficOn this basis andtowards the modelling of videoconference traffic encoded bythe Intra-H261 encoder of the ViC tool the author in [12]
2 Journal of Computer Networks and Communications
proposed a DAR(p) model using the Weibull instead of theGamma density for the t of the sample histogram In [13]the authors concluded that Long Range Dependence (LRD)has minimal impact on videoconference traffic modelling
Relevant newer studies of videoconference traffic mod-elling reinforce the general conclusions obtained by theabove earlier studies by evaluating and extending the existingmodels and also proposing new methods for successful andaccurate modelling [14ndash18] An extensive public availablelibrary of frame size traces of unconstrained and constrainedMPEG-4 H263 and H263+ offline encoded video waspresented in [19] along with a detailed statistical analysis ofthe generated traces In the same study the use of moviesas visual content led to frames generation with a Gamma-like frame-size sequence histogram (more complex when atarget rate was imposed) and an autocorrelation function thatquickly decayed to zero (a traffic model was not proposedthough in the certain study)
Of particular relevance to our work is the approachin [20] where an extensive study on multipoint videocon-ference traffic (H261-encoded) modelling techniques waspresented In this study the authors discussed methods forcorrectly matching the parameters of the modelling com-ponents to the measured H261-encoded data derived fromrealistic multipoint conferences (in ldquocontinuous presencerdquomode)
e above studies certainly constitute a valuable bodyof knowledge However most of the above studies exam-ine videoconference traffic traces compressed by encoders(mainly H261) that were operating in an unconstrainedmode and as a result produced traffic with similar charac-teristics (frame-size histogram of Gamma form and strongshort-term correlations) Today a large number of video-conference platforms exist the majority of them operatingover IP-based networking infrastructures and using practicalimplementations of the H261 [21] H263 [22 23] H263+[22 23] and H264 encoders [24] e above encodersoperate on sophisticated commercial soware packages thatare able of working in both unconstrained and constrainedmodes of operation In unconstrained VBR mode the videosystem operates independently of the network (ie usinga constant quantization scale throughout transmission) Inthe constrained mode the encoder has knowledge of thenetworking constraints (either imposed offline by the user oronline by an adaptive bandwidth adjustment mechanism ofthe encoder) and modulate its output in order to achieve themaximum video quality for the given content (by changingthe quantization scale skipping frames or combining mul-tiple frames into one) Furthermore most of the previousstudies have dealt with the H261-encoding of movies (likeStarwars) that exhibit abrupt scene changes However thetraffic patterns generated by differential coding algorithmsdepend strongly on the variation of the visual informationFor videoconference the use of a single-model based ona few physically meaningful parameters and applicable toa large number of sequences seems possible as the visualinformation is a typical head and shoulders content that doesnot contain abrupt scene changes and is consequently moreamenable to modelling Moreover an understanding of the
statistical nature of the constrained VBR sources is useful fordesigning call admission procedures Modelling constrainedVBR sources to the best knowledge of these authors is anopen area for study Our approach towards this direction wasto gather video data generated by constrained VBR encodersthat used a particular rate control algorithm to meet a prede-ned channel constraint and then model the resulting traceusing techniques similar to those used for unconstrainedVBR e difficulty with this approach is that the resultingmodel could not be used to understand the behaviour ofa constrained VBR source operating with a different ratecontrol algorithm or a different channel constraint Howevergiven that in constrained VBR the encoder is in the loop it ismore likely that network constraints are not violated and thatthe source operates closer to its maximum allowable trafficis may make constrained VBR traffic more amenable tomodelling than unconstrained VBR traffic e basic ideais that we can assume worst case sources (ie high motioncontents) operating close to the maximum capacity and thencharacterize these sources
Taking into account the above it is important to examinewhether the models established in literature are appropriatefor handling this contemporary setting in general It is amatter of question whether all coding strategies result in sig-nicantly different statistics for a xed or different sequenceAlong the above lines this study undertookmeasurements ofthe videoconference traffic encoded during realistic low andhigh motion head and shoulders experiments by a variety ofencoders of popular commercial soware modules operatingin both unconstrained and constrained modes Moreoverthe modelling proposal was validated with various tracesavailable in literature [19] (to be referred as ldquoTKN tracesrdquofrom now on)
e rest of the paper is structured as follows Section1 describes the experiment characteristics and presents therst-order statistical quantities of the measured data Section2 discusses appropriate methods for parameter assessmentof the encoded traffic Finally Section 3 culminates withconclusions and pointers to further research
2 The Experimental andMeasurementWork
e study reported in this paper employed measurements ofthe IP traffic generated by different videoconference encodersoperating in both unconstrained and constrained modesMore explicitly we measured the traffic generated by theH26x encoders (e NV NVDCT BVC and CellB encoders[25] were examined in [26] and it was found that theyresulted in similar traffic patterns with the H261 encoderHence the modelling proposal for H261 in the currentstudy is expected to be applicable for these encoders too)included in the following videoconference soware tools ViC(version v28ucl116) [27] VCONVpoint HD [28] PolycomPVX [29] France Telecom eConf 35 [30] and SorensonEnVision [31] ese are H261 H263 H263+ and H264In particular H264 was examined in [32] results of whichare also presented under the generic context of the currentstudy All traces examined are representative of the H26x
Journal of Computer Networks and Communications 3
family video systems Especially the ViC video system usesencoders implemented by the open H323 community [33]ese encoders are based on stable and open standards andas a consequence their examination is more probable to givereusable modelling results At this point we must note thatVCON Vpoint HD could not establish an H264 connectionwith Polycom PVX and vice versa is is due to the fact thatthe RTP payload format for the H264 has still some openissues (media unaware fragmentation) More explicitly theclients use different RTP payload types to communicate
For all the examined encoders compression is achievedby removing the spatial (intraframe) and the temporal (inter-frame) redundancy In intraframe coding a transform codingtechnique is applied at the image blocks while in interframecoding a temporal prediction is performed using motioncompensation or another technique en the difference orresidual quantity is transform coded Here we must note thatthe ViC H261 encoder [34 35] performs only intraframecoding oppositely to the H261 encoders of Vpoint eConfand EnVision where blocks are inter- or intracoded eabove encoding variations inuence the video bit rate per-formance of the encoders and as a consequence the statisticalcharacteristics of the generated traffic traces
At this point wemay discuss about the basic functionalityof the examined video systems which is a fundamental factorin the derived statistical features of the encoded traffic anda basic reason of the experimentsrsquo philosophy we followede rate control parameter (bandwidth and frame rate) sets atraffic policy that is an upper bound on the encoded trafficaccording to the userrsquos preference (obviously depending onhisher physical link) An encoderrsquos conformation to the ratecontrol of the system is commonly performed by reducingthe video quality (and consequently the frame size quantity)through the dynamicmodulation of the quantization level Inthe case of ViC a simplermethod is appliede video qualityremains invariant and a frame rate reduction is performedwhen the exhibited video bit rate tends to overcome thebandwidth bound In fact in ViC the video quality of aspecic encoder is a parameter determined a priori by theuser In the case of Vpoint Polycom eConf and EnVisionthe frame rate remains invariant and a video quality reductionis performed when the exhibited video bit rate tends toovercome the bandwidth bound is threshold can beset through the network setting of each client MoreoverVpoint utilizes adaptive bandwidth adjustment (ABA) ABAworks primarily by monitoring packet loss If the endpointdetects that packet loss exceeds a predened threshold itwill automatically drop to a lower conference data rate whileinstructing the other conference participantrsquos endpoint to dothe same
Two experimental cases were examined as presented inTable 1 (TKN traces are also included) Case 1 includedexperiments where the terminal clients were operating inunconstrainedmodewhile Case 2 covered constrained-modetrials In both Cases two ldquotalking-headsrdquo raw-format videocontents were imported in the video systems through aVirtual Camera tool [36] and then peer-to-peer sessions ofat least half an hour were employed in order to ensure asatisfactory trace length for statistical analysisese contents
were offline produced by a typical webcam in uncompressedRGB-24 format one with mild movement and no abruptscene changes ldquolistenerrdquo (to be referred as VC-L) and onewith higher motion activities and occasional zoomspanldquotalkerrdquo (VC-H) e video size was QCIF (176 times 144) inboth Cases and all scenarios (VC-H and VC-L) In Case 1 noconstraint was imposed either from a gatekeeper or from thesoware itself e target video bit rates that were imposed inCase 2 are shown in Table 1 In each case the UDP packetswere captured by a network sniffer and the collected datawere further postprocessed at the frame level (it is importantto note here that analysis at the MacroBlock (MB) as in[14] level has been examined and found to provide only atypical smoothing in the sample data We believe that theanalysis at the frame level is simpler and offers a realisticview of the traffic) by tracing a common packet timestampe produced frame-size sequences were used for furtherstatistical analysis
Specic parameters shown in Table 1 for the VC-Hand VC-L traces depend on the particular coding schemethe nature of the moving scene and the condence ofthe measured statistics Moreover traffic traces available inliterature where used for further validation Specically thetraces used were ldquooffice camrdquo and ldquolecture room camrdquo (fromthe TKN library) ese traces were offline H263 encoded ina constrained and unconstrained mode
Some primary conclusions as supported by the exper-imentsrsquo results (see Table 1) arise concerning the statis-tical trends of the encodersrsquo traffic patterns SpecicallyH263+ produces lower video bit rate than H263 and H261do is was expected since the earlier encoder versionshave improved compression algorithms than the prior ones(always with respect to the rate produced) Finally for allthe encoders the use of the VC-H content led to higher rateresults (as reasonable) Similar results were observed for themean frame size and variance quantities In all cases thevariance quantities of theVC-Hcontentwere higher than thatof VC-L with the exception of the ViC H263+ encoder (Case1mdashTraces 5 6) where the opposite phenomenon appeared
H264 and the encoders used for the production ofthe TKN traces tend to adjust their quality in a ldquogreedyrdquomanner so as to use up as much of the allowed bandwidthas possible At this point we must note that Trace 4 of Case2 is semiconstrained (ie the client did not always need theavailable network bandwidth) However this particular casecan be covered by the ldquoworst-caserdquo Case 2mdashTrace 3 wherethe target rate is reached (full-constrained traffic)
Taking into account the above context the followingquestions naturally arise
(i) What is the impact of the encodersrsquo differences on thegenerated videoconference traffic trends
(ii) Can a common model capture both types of trafficunconstrained and constrained
(iii) Are the traffic trends invariant of the constraint rateselected
4 Journal of Computer Networks and Communications
T 1 Statistical quantities of the sample frame-size sequences
Case 1 (Unconstrained)Trace Client Encoder Duration Content Target rate No frames Frame rate Rate Mean Variance1 ViC Intra H261 3600 VC-H 700 54006 15 111 921 2496702 VC-L 53937 15 63 527 1741303 H263 VC-H 54011 15 72 603 569814 VC-L 53453 15 54 457 245885 H263+ VC-H 53679 15 39 327 1677806 VC-L 53633 15 27 224 2052007 Vpoint H261 1800 VC-H 700 27275 15 365 3009 7312708 VC-L 27276 15 193 1592 3470809 eConf H263+ 3600 VC-H 444 96805 27 298 1387 38930010 VC-L 91710 25 130 640 14779011 TKN H263 2700 OFFICE 33825 13 91 904 10716012 3600 LECTURE 45459 13 62 618 136850
Case 2 (Constrained)1 Vpoint H261 3600 VC-H 155 49596 14 144 1306 487182 VC-L 50636 14 143 1275 292853 eConf H263+ 3600 VC-H 82 51331 14 84 733 82674 VC-L 48848 14 67 619 227585 EnVision H263 1800 VC-H 256 22501 13 239 2394 272756 TKN 2700 OFFICE 64 13800 5 64 1565 373167 3600 LECTURE 16788 5 64 1715 1055308 2700 OFFICE 256 13936 5 256 6200 4567909 3600 LECTURE 17707 5 256 6505 154050010 Vpoint H264 3600 VC-H 320 89911 24975 30092 1506 82011 VC-L 90001 25 30088 1504 23412 Polycom H264 3600 VC-H 320 107546 29874 34556 1446 1189613 VC-L 107515 29865 34562 1447 12833
(iv) How does the motion of the content inuence thegenerated trafficmdashfor each encodermdashand the param-eters of the proposed traffic model
(v) Can a common traffic model be applied for all theabove cases
e above questions pose the research subject which isthoroughly examined in the context to follow eir answerswill be given along with the respective analysis
3 Traffic Analysis andModelling Assessment
e measured traffic analysis for all experimental sets con-rms the general body of knowledge that literature hasformed concerning videoconference traffic Traffic analysiswas employed for all experimental cases More explicitly inall cases the frame-size sequence can be represented as a sta-tionary stochastic process with a frequency histogram of anapproximately bell-shaped (more narrow in the case ofH263H263+ and H264 encoding) Probability Distribution Func-tion (PDF) form see Figures 1(a)ndash1(c) and 2(a)ndash2(e) morecomplex in the TKN traces as their content (office and lecturecam) probably contained more scene changes than ourcontents VC-L and VC-H Examining more thoroughly thesample histograms we noted that the smoothed frame-size
frequency histograms of the H261 encoder have an almostsimilar bell-shape (see Figures 1(a) 1(b) 2(a) and 2(b)) whilea more narrow shape appears in the H263 H263+ andH264 histograms (Figures 1(c) and 2(b)ndash2(e)) e VC-Hfrequency frame-size histograms appeared to be more sym-metrically shaped than the correspondent VC-L histogramsis is reasonable as the rate of the H26x encoders dependson the activity of the scene increasing during active motion(VC-H) and decreasing during inactive periods (VC-L)
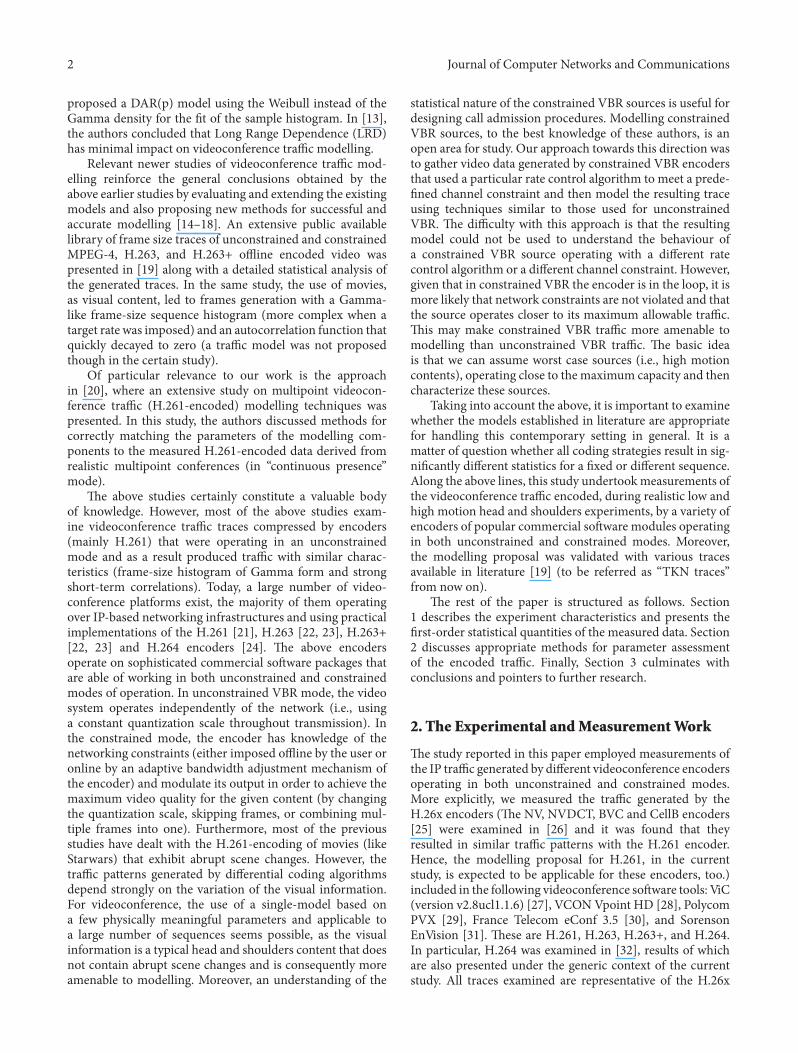
Furthermore the AutoCorrelation Function (ACF) of theunconstrained traffic (for all traces of Case 1) appeared tobe strongly correlated in the rst 100 lags (short-term) andslowly decaying to values near zero (see some indicativeFigures 3(a)ndash3(c) of the traces of Case 1) On the contrary theACFs of the constrained traffic (Case 2) decayed very quicklyto zero denoting the lack of short-term correlation (see Fig-ures 3(d) and 3(e)) is conclusion is very critical in queue-ing as the short-term correlation parameter has been foundto affect strongly buffer occupancy and overow probabilitiesfor videoconference traffic In fact to verify this assump-tion we measured the buffer occupancy of the constrainedtraces in queueing experiments of different traffic intensitiesBuffering was found to be very small at a percentage notaffecting queueing On this basis it is evident that for thepurpose ofmodelling of the two types of traffic not a common
Journal of Computer Networks and Communications 5
0 2000 4000 60000
2
4
6
Den
sity
Case 1-trace 7
0 02 04 06 08 10
01
02
03
04
05
06
07
08
09
1
Frame size
Den
sity
Sample
Gamma LogLogistic
Inverse Gamma
(a) Vpoint H261 VC-H
0 2000 4000 60000
02
04
06
08
1
Den
sity
Case 1-trace 9
0 02 04 06 08 10
01
02
03
04
05
06
07
08
09
1
Frame size
Den
sity
Sample
Gamma LogLogistic
Inverse Gamma
(b) eConf H263+ VC-H
0 2000 4000 60000
05
1
15
2
25
3
35
4
45
Den
sity
Case 1-trace 11
002 04 06 08 10
01
02
03
04
05
06
07
08
09
1
Frame size
Den
sity
Sample
Gamma LogLogistic
Inverse Gamma
(c) TKN H263 Office
F 1 Frame-size histograms versus moment t and the respective - Plots for unconstrained traces
model can be applied More explicitly a correlated model isneeded for the case of unconstrained traffic while a simplernoncorrelated model is enough for constrained traffic
e DAR model proposed in [5] has an exponentiallymatching autocorrelation and somatches the autocorrelationof the data over approximately hundred frame lags ismatch is more than enough for videoconference trafficengineering Consequently this model is a proper solutionfor the treatment of unconstrained traffic When using theDAR model it is sufficient to know the mean variance andthe autocorrelation decay rate of the source for admissioncontrol and traffic forecasts For the constrained traffictraces a simple random number generator based on the t ofthe sample frame-size histogram can be directly applied eDAR model with the autocorrelation decay rate value equalto zero can also be a solution is feature turns constrainedvideoconference traffic more amenable to traffic modellingthan its counterpart unconstrained as only two parametersare needed the mean and the variance of the sample
pecically as shown in [32] for the H264 traffic it canbe characterized as constrained and the generated traffic isuncorrelated and can be accurately represented by a119863119863119863119863119863119863119863queue
e rest of the paper discusses methods for correctlymatching the parameters of the modelling components tothe data and for combining these components into the DARmodel
31 Fitting of the Frame-Size Frequency Histograms of theTraces A variety of distributions was tested for tting thesample frame-size frequency histograms ese are the fol-lowing Gamma Inverse Gamma (or Pearson V) LoglogisticExtreme Value Inverse Gauss Weibull Exponential andLognormal e most dominant ones found to be the rstthree Even though the Inverse Gauss density performedsimilarly to the Gamma distribution it is not included inthe analysis to follow as the Gamma distribution is widelyadopted in literature Finally the Extreme Value distributionperformed in total worse than the other ones
For the purpose of tting the selected distributions den-sity to the sample frame-size sequence histogram althoughvarious full histogram-based methods (eg [20]) have beentried in literature as well as maximum likelihood estimations(MLE) we followed the approach of the simple momentsmatching method is method has the advantage of requir-ing only the sample mean frame size and variance quantitiesand not full histogram informationus taking into accountthat the sequence is stationarymdashand as a result the mean andthe variance values are almost the same for all the samplewindowsmdashit is evident that only a part of the sequence isneeded to calculate the corresponding density parametersFurthermore this method has the feature of capturing accu-rately the sample mean video bit rate a property that isnot ensured in the case of MLE or histogram-based modelsHowever in the cases of not satisfactory t by none of the
6 Journal of Computer Networks and Communications
Sample
LogLogisticGamma C-LVMAX
Inverse Gamma
0 1000 2000 30000
05
1
15
2
25
Den
sity
Case 2-trace 1
0
01
02
03
04
05
06
07
08
09
1
Frame size
Den
sity
0 02 04 06 08 1
(a) Vpoint H261 VC-H
0 1000 20000
1
2
3
4
5
6
7
8
Den
sity
Case 2-trace 3
0 02 04 06 08 10
01
02
03
04
05
06
07
08
09
1
Frame size
Den
sity
Sample
LogLogisticGamma C-LVMAX
Inverse Gamma
(b) eConf H263+ VC-H
0 2000 40006000 80000
02
04
06
08
1
12
14
Den
sity
Case 2-trace 8
0 02 04 06 08 10
01
02
03
04
05
06
07
08
09
1
Frame size
Den
sity
Sample LogLogisticGamma
C-LVMAX
(c) TKN H263 Office (256Kbitssec)
0 1000 2000 30000
05
1
15
2
25
3
35
4
45
Den
sity
Polycom-high motion (A)
Sample
Frame size
C-LVMAX
0 02 04 06 08 10
01
02
03
04
05
06
07
08
09
1
Sample
C-L
VM
AX
(d) Polycom H264 VC-H
0 1000 2000 30000
0002
0004
0006
0008
001
0012
Frame Size
Den
sity
VCON-high motion (A)
Sample
C-LVMAX
0 02 04 06 08 10
01
02
03
04
05
06
07
08
09
1
Sample
C-L
VM
AX
(e) VCON H264 VC-H
F 2 Frame-sie istorams ersus moment and C-V t and respectie - Plots for constrained traces
Journal of Computer Networks and Communications 7
0 100 200 300 400 5000
01
02
03
04
05
06
07
08
09
1
Lag
Au
toco
rrel
atio
n
Case 1-trace 7
(a) Vpoint H261 VC-H Unconst
0 100 200 300 400 5000
01
02
03
04
05
06
07
08
09
1
Lag
Au
toco
rrel
atio
n
Case 1-trace 9
(b) eConf H263+ VC-H Unconst
0 100 200 300 400 5000
01
02
03
04
05
06
07
08
09
1
Lag
Au
toco
rrel
atio
n
Case 1-trace 11
(c) TKN H263 Off Unconst
0 100 200 300 400 5000
01
02
03
04
05
06
07
08
09
1
Lag
Au
toco
rrel
atio
nCase 2-trace 1
(d) Vpoint H261 VC-H Const
0 100 200 300 400 5000
01
02
03
04
05
06
07
08
09
1
Lag
Au
toco
rrel
atio
n
Case 2-trace 7
(e) TKN H263 Office 64K Const
F 3 Autocorrelation graphs for unconstrained and constrained traces
8 Journal of Computer Networks and Communications
examined distributions (as in the case of the TKN traces) ahistogram-based method can be applied
If119898119898 is the mean 119907119907 the variance of the sample sequence 119904119904and 119898119898119897119897 the mean and 119907119907119897119897 the variance of the logarithm of thesample 119904119904 then the distribution functions and the correspond-ing parameters derived from the moments matching methodare given by the following equations for each distributioncorrespondingly (1) Gamma (2) Inverse Gamma and (3)Loglogistic
119891119891 (119909119909) =1
120573120573120573 (120572120572)10076531007653119909119909120573120573100766910076691205721205721205721
119890119890120572119909119909119909120573120573 (1)
where 120572120572 = 1198981198982119909119907119907 120573120573 = 119907119907119909119898119898 and 120573(120572120572) = 120572infin0 1199061199061205721205721205721119890119890120572119906119906119889119889119906119906
119891119891 (119909119909) =1
120573120573120573 (120572120572)sdot
119890119890120572120573120573119909119909119909
1007649100764911990911990911990912057312057310076651007665(1198861198861198861) (2)
where 119886119886 = 1198981198982119909119907119907 119886 2 and 120573120573 = 119898119898(1198981198982119909119907119907 119886 1)
119891119891 (119911119911) =119890119890[119911119911(1120572119911119911)120572119898119898119897119897]
119911119911(1 119886 119890119890119911119911)2 (3)
where 119911119911 = (119911119911(119909119909) 120572 119898119898119897119897)119909119911119911 119898119898119897119897 = 120124120124[119911119911(119904119904)] and 119911119911 =100352410035243120124120124[119911119911(119904119904)]119909120124120124
Given the dominance of the above distributions mod-elling analysis and evaluation will be presented for the abovethree densities e numerical results (densitiesrsquo parameters)from the application of the above parameters-matchingmethods appear in Table 2 e modelling evaluation ofthe above methods has been performed from the point ofqueueing As a consequence we thoroughly examined ts ofcumulative distributionsis was done as follows we plottedthe sample quantiles from the sample cumulative frequencyhistogram and the model quantiles from the cumulativedensity of the corresponding distribution e Q-Q plot ofthis method refers to cumulative distributions (probabilitiesof not exceeding a threshold)
Figures 1(a)ndash1(c) andFigures 2(a)ndash2(c) presentQ-Qplotsfor all traces of both Case 1 and 2 respectively e resultssuggest that for tting videoconference data the codingalgorithm used should be taken into consideration ereseems to be a relationship between the coding algorithms andthe characteristics of the generated traffic For instance forH261 in most cases the dominant distribution is Gamma(1) as can be veried from the Q-Q plots depicted in Figures1(a) and 1(b) and for H263 and H263+ the Loglogisticdensity (3) has a more ldquostablerdquo performance than the othertwo (Q-Q plots shown in Figures 1(c) and 2(c) e InverseGamma density (2) seems to be suitable for H263 traffic (seeFigure 1(c)) although it was outperformed by the Loglogisticdensity in some cases However as will be commented uponlater it did not provide a solution in all cases of constrainedtraffic
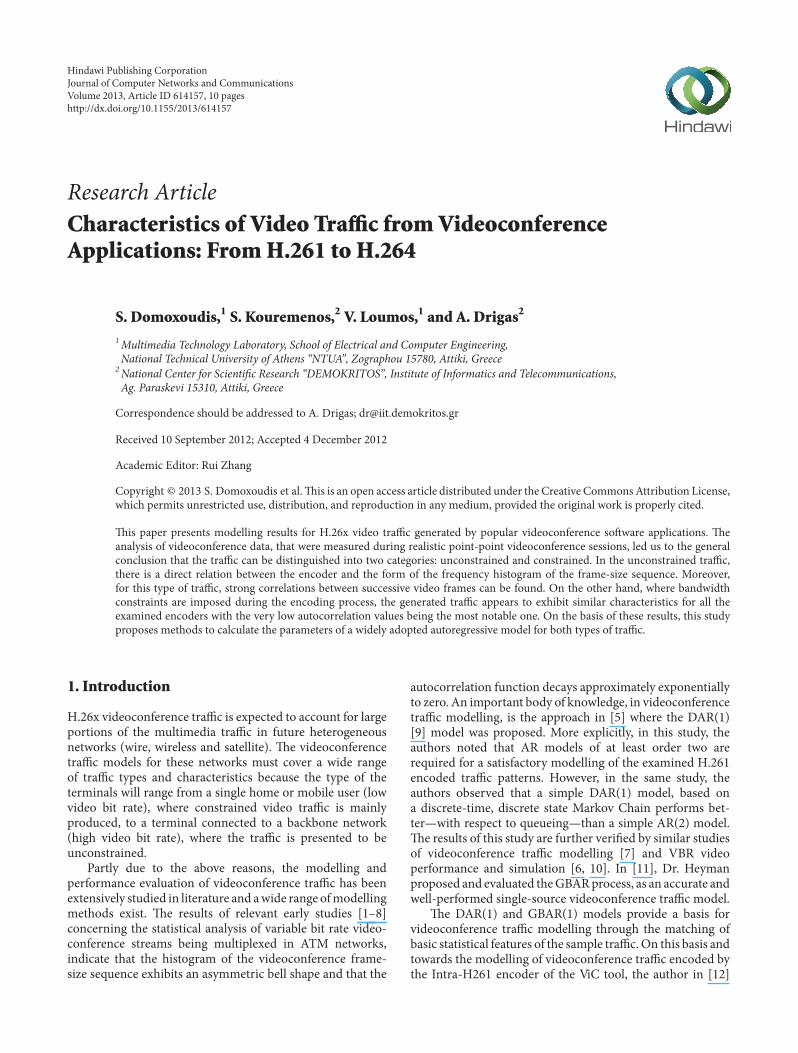
We must note that in Case 2 where a constrain wasimposed the moments matching method for calculatingthe distributionrsquos parameters did not always provide a goodt and performed as shown in Figures 2(a)ndash2(c) (inverse
Gamma and Loglogistic are depicted e Gamma den-sity provided similar t) To provide an acceptable t ahistogram-based method proposed for H261 encoded trafficin [20] known as C-LVMAX was used is method relatesthe peak of the histogramrsquos convolution to the location atwhich the Gamma density achieves its maximum and tothe value of this maximum e values of the shape andscale parameters of the Gamma density are derived from119886119886 = (21201241201241199091199092max119891119891
2max 119886 1)1199092 and 119887119887 = 1119909(2120124120124119909119909max119891119891
2max) where
119891119891max is the unique maximum of the histogramrsquos convolutiondensity at 119909119909max Numerical values for this t appear also inTable 2 (for Case 2 only) Figures 2(a)ndash2(c) show how thethree distributions t the empirical data using the method ofmoments (Inverse Gamma Loglogistic) and the C-LVMAXmethod (Gamma C-LVMAX) e Inverse Gamma densitycould not be calculated for all the constrained traces (Case2mdashTraces 5 6 8 9) due to processing limitations (for largea b parameters the factor (1119909120573120573)(1198861198861198861) in (2) is very smallnear zero and consequently its inverse quantity could notbe calculated (however the values of the parameters of theInverse Gamma density for Case 2mdashTraces 5 6 8 9 are givenin Table 2))
Summing up the above analysis it is evident that theGamma density is better for H261 unconstrained trafficthe Loglogistic for unconstrained H263 H263+ traffic andthe C-LVMAX method for all cases of constrained traffic(including H264 traffic as proposed in [32]) However if ageneric and simple model needed to be applied for all casesthen the most dominant would be the Loglogistic density
32 Calculation of the Autocorrelation Decay Rate of theFrame-Size Sequences At this point we may discuss aboutthe calculation of the autocorrelation decay rate of the frame-size sequence of the unconstrained traces (as denoted in theprevious sections constrained traffic appeared to be uncor-related and as a result the decay rate of its autocorrelationfunction can be set to zero) From the Figures 3(a)ndash3(d)it is observed that the ACF graphs of unconstrained trafficexhibit a reduced decay rate beyond the initial lags It isevident that unconstrained video sources have very highshort term correlation feature which cannot be ignored fortraffic engineering purposes is is a behaviour also notedin earlier studies [4]
To t the sample ACF we applied the model proposed in[20] that is based on a compound exponential t is modelts the autocorrelation function with a function equal to aweighted sum of two geometric terms
120588120588119896119896 = 1199081199081199081199081198961198961 119886 (1 120572 119908119908) 119908119908
1198961198962 (4)
where 1199081199081 1199081199082 are the decay rates with the property |1199081199082| lt|1199081199081| lt 1 is method was tested with a least squares tto the autocorrelation samples for the rst 100 since theautocorrelation decays exponentially up to a lag of 100 frames(short-termbehavior) or so and then decays less slowly (long-term behavior) is match is more than enough for trafficengineering as also noted in [37] What is notable is thatusing this model the autocorrelation parameter 120588120588 is chosennot at lag 1205721 as in DAR model For each encoder (in Case
Journal of Computer Networks and Communications 9
T 2 Parameter values of the modeling components
Trace Gamma Inverse gamma Loglogistic C-LVMAX Exponential120572120572 120573120573 120572120572 120573120573 119898119898119897119897 120590120590 120572120572 120573120573 119908119908 1205821205821 1205821205822
Case 1 (Unconstrained)1 33971 2711005 53971 40495 6648 03549 05057 09925 077572 15944 3304804 35944 1367 59603 04449 05575 09905 087093 63878 944476 83878 44571 63382 01909 04368 09915 075284 85059 537656 105059 43473 60789 01609 03083 09906 082695 06385 5126355 26385 5362591 55827 03051 00683 0992 055286 02454 9145151 22454 2794386 51082 0318 00454 0994 054937 123817 243024 143817 40266 79663 01661 05322 0991 081928 72998 2180509 92998 13211 73199 01695 06018 09935 087819 49385 2807675 69385 82341 71117 03038 05373 09932 0776210 27722 2308974 47722 24145 63161 03023 06022 09935 0805911 76226 1185656 96226 77929 67613 01533 07935 09785 0876912 2787 2215946 4787 23388 63424 0193 07793 0999 09316
Case 2 (Constrained)1 35017 372996 37017 47043 71602 00954 58689 23692172 554924 229723 574924 72016 71415 00752 91345 14552063 650183 112758 670183 48400 65901 00673 281127 2583964 168458 367556 188458 11050 63966 01456 27951 26186695 2100779 227889 2120779 1010500 84713 00388 2943836 1630246 656089 238487 676089 104220 73455 00845 245985 64227 278637 615424 298637 49496 74205 01407 1875797 971248 841382 736822 861382 527810 87237 00796 3196409 1963559 274707 2368108 294707 185210 87524 01455 2497543 277889
1) the parameter numerical values of the above t appear inTable 2
4 Conclusions
is paper proposed modelling methods for two types ofvideoconference traffic unconstrained and constrained eanalysis of extensive data that were gathered during experi-ments with popular videoconference terminals and differentencoding schemes as well as of traffic traces available inliterature suggested that while the unconstrained traffictraces exhibited high short-term correlations the constrainedcounterpart patterns appeared to be mostly uncorrelated ina percentage not affecting queueing
We used the measured data to develop statistical trafficmodels for unconstrained and constrained traffic esemodels were further validated with different videoconferencecontents (low motion and high motion TKN library) Dif-ferent statistical models for tting the empirical distribution(method of moments and C-LVMAX method) were exam-ined
For tting the videoconference data the coding algorithmused should be taken into consideration ere seems tobe a relationship between the coding algorithms and thecharacteristics of the generated traffic For instance forH261 in most cases the dominant distribution is Gammaand for H263 and H263+ Loglogistic has a more ldquostablerdquo
performance Moreover the Inverse Gamma density couldnot be calculated for all constrained traces due to processinglimitations is fact constitutes the Inverse Gamma densityas impractical as a generic model for H263 traffic
Regarding the unconstrained traces a careful but simplegeneralization of the DARmodel can simulate conservativelyand steadily themeasured videoconference data For the con-strained traces the traffic can be captured by the C-LVMAXmethod via a random number generator producing framesat a time interval equal to the sample On the other hand ifa moments matching method needed to be applied then theLoglogistic density is a direct solution Another interestingassumption is that the traffic trends remain invariant whena different network constrained is selected as evident fromthe TKN traces So the proposed model for the constrainedtraffic can be applied without taking into account the specicnetwork constraint
It is evident that if a generic and simple model neededto be applied for all cases of videoconference traffic then themost dominant would be the DAR model based on the t ofthe Loglogistic density with a decay rate properly assignedto the t of the sample ACF at the rst 100 lags (althougha 500 lags t would lead to a more conservative queueingperformance) for the case of unconstrained traffic and tozero for the constrained traffic
Future work includes the integration of the proposedmodels in dynamic traffic policy schemes in real diffservIP environments e study of semiconstrained traffic cases
10 Journal of Computer Networks and Communications
although their counterpart ldquoworst-caserdquo full-constrainedcases cover their traffic trends is of particular interest too
References
[1] B Maglaris D Anastassiou P Sen G Karlsson and J DRobbins ldquoPerformance models of statistical multiplexing inpacket video communicationsrdquo IEEE Transactions on Commu-nications vol 36 no 7 pp 834ndash843 1988
[2] R Kishimoto Y Ogata and F Inumara ldquoGeneration intervaldistribution characteristics of packetized variable rate videocoding data streams in an ATM networkrdquo IEEE Journal onSelected Areas in Communications vol 7 no 5 pp 833ndash8411989
[3] H S Chin JW Goodge R Griffiths andD J Parish ldquoStatisticsof video signals for viewphone-type picturesrdquo IEEE Journal onSelected Areas in Communications vol 7 no 5 pp 826ndash8321989
[4] M Nomura T Fujii and N Ohta ldquoBasic characteristics ofvariable rate video coding in ATM environmentrdquo IEEE Journalon Selected Areas in Communications vol 7 no 5 pp 752ndash7601989
[5] D P Heyman A Tabatabai and T V Lakshman ldquoStatisticalanalysis and simulation study of video teleconference traffic inATM networksrdquo IEEE Transactions on Circuits and Systems forVideo Technology vol 2 no 1 pp 49ndash59 1992
[6] D M Cohen and D P Heyman ldquoPerformance modeling ofvideo teleconferencing in ATM networksrdquo IEEE Transactionson Circuits and Systems for Video Technology vol 3 no 6 pp408ndash422 1993
[7] D Heyman and T V Lakshman ldquoModeling teleconferencetraffic from VBR video codersrdquo in Proceedings of the IEEEInternational Conference on Communications pp 1744ndash1748May 1994
[8] D M Lucantoni and M F Neuts ldquoMethods for performanceevaluation of VBR video traffic modelsrdquo IEEEACM Transac-tions on Networking vol 2 no 2 pp 176ndash180 1994
[9] P A Jacobs and P A W Lewis ldquoTime series generated bymixturesrdquo Journal of Time Series Analysis vol 4 no 1 pp19ndash36 1983
[10] A Elwalid D Heyman T V Lakshman D Mitra and AWeiss ldquoFundamental bounds and approximations for ATMmultiplexers with applications to video teleconferencingrdquo IEEEJournal on Selected Areas in Communications vol 13 no 6 pp1004ndash1016 1995
[11] D P Heyman ldquoe GBAR source model for VBR videoconfer-encesrdquo IEEEACMTransactions on Networking vol 5 no 4 pp554ndash560 1997
[12] R Bo ldquoModeling and simulation of broadband satellite net-worksmdashpart II traffic modelingrdquo IEEE Communications Mag-azine vol 37 no 7 pp 48ndash56 1999
[13] A Erramilli O Narayan and W Willinger ldquoExperimentalqueueing analysis with long-range dependent packet trafficrdquoIEEEACM Transactions on Networking vol 4 no 2 pp209ndash223 1996
[14] G Sisodia L Guan M Hedley and S De ldquoA new modelingapproach of H263+ VBR coded video sources in ATM net-worksrdquo Real-Time Imaging vol 6 no 5 pp 347ndash357 2000
[15] K Dolzer and W Payer ldquoOn aggregation strategies for multi-media trafficrdquo in Proceedings of the 1st Polish-German TeletrafficSymposium (PGTS rsquo00) Dresden Germany September 2000
[16] WC Poon andK T Lo ldquoA rened version ofMGinfin processesfor modelling VBR video trafficrdquo Computer Communicationsvol 24 no 11 pp 1105ndash1114 2001
[17] L Yan-ling W Peng and W Wei-ling ldquoA steady source modelfor VBR video conferencesrdquo in Proceedings of the InternationalConference on Information Technology Computers and Commu-nications Las Vegas Nev USA 2003
[18] A Lazaris P Koutsakis and M Paterakis ldquoA new model forvideo traffic originating from multiplexed MPEG-4 videocon-ference streamsrdquo Performance Evaluation vol 65 no 1 pp51ndash70 2007
[19] F H P Fitzek and M Reisslein ldquoMPEG-4 and H263 videotraces for network performance evaluationrdquo IEEE Network vol15 no 6 pp 40ndash54 2001
[20] C Skianis K Kontovasilis A Drigas and M Moatsos ldquoMea-surement and statistical analysis of asymmetric multipointvideoconference traffic in IP networksrdquo TelecommunicationSystems vol 23 no 1-2 pp 95ndash122 2003
[21] ITU Recommendation H261 Video Codec for AudiovisualServices at 64 Kbits 1993
[22] ITU Recommendation H263 Video Coding for Low Bit RateCommunication 2005
[23] H263 Standard Overview and TMS320C6x ImplementationWhite Paper httpwwwubvideocom
[24] ITU Recommendation H264 Advanced Video Coding forGeneric Audiovisual Services 2007
[25] R Frederick Experiences With Real-Time Soware Video Com-pression Xerox Parc 1994
[26] S Domoxoudis S Kouremenos V Loumos and A DrigasldquoMeasurement modelling and simulation of videoconferencetraffic from VBR video encodersrdquo in Proceedings of the 2ndInternationalWorking Conference on the PerformanceModellingand Evaluation of Heterogeneous Networks (HET-NETs rsquo04)Ilkley West Yorkshire UK July 2004
[27] e ViC Tool httpwww-micecsuclacukmultimedia so-warevic
[28] VCON Vpoint HD httpwwwvconcom[29] Polycom PVX httpwwwpolycomcom[30] France Telecom eConf httpwwwrdfrancetelecomcom[31] Sorenson EnVision httpwwwsorensonvrscom[32] S Domoxoudis S Kouremenos A Drigas and V Loumos
ldquoFrame-based modeling of H264 constrained videoconferencetraffic over an IP commercial platformrdquo in Proceedings of the2nd International IEEECreate-Net Conference on Testbeds andResearch Infrastructures for the Development of Networks andCommunities pp 216ndash221 Barcelona Spain March 2006
[33] OpenH323 Project httpopenh323org[34] S R McCanne ldquoScalable compression and transmission of
internet multicast videordquo Tech Rep UCBCSD-96-928 Com-puter Science Division (EECS) University of California Berke-ley Calif USA 1996 94720
[35] L D McMahan Video conferencing over an ATM network[thesis] California State University Northridge Calif USA1997
[36] MorningSound httpwwwsoundmorningcom[37] T V Lakshman A Ortega and A R Reibman ldquoVBR video
tradeoffs and potentialsrdquo Proceedings of the IEEE vol 86 no 5pp 952ndash972 1998
Impact Factor 173028 Days Fast Track Peer ReviewAll Subject Areas of ScienceSubmit at httpwwwtswjcom
Hindawi Publishing Corporation httpwwwhindawicom Volume 2013Hindawi Publishing Corporation httpwwwhindawicom Volume 2013
The Scientific World Journal
2 Journal of Computer Networks and Communications
proposed a DAR(p) model using the Weibull instead of theGamma density for the t of the sample histogram In [13]the authors concluded that Long Range Dependence (LRD)has minimal impact on videoconference traffic modelling
Relevant newer studies of videoconference traffic mod-elling reinforce the general conclusions obtained by theabove earlier studies by evaluating and extending the existingmodels and also proposing new methods for successful andaccurate modelling [14ndash18] An extensive public availablelibrary of frame size traces of unconstrained and constrainedMPEG-4 H263 and H263+ offline encoded video waspresented in [19] along with a detailed statistical analysis ofthe generated traces In the same study the use of moviesas visual content led to frames generation with a Gamma-like frame-size sequence histogram (more complex when atarget rate was imposed) and an autocorrelation function thatquickly decayed to zero (a traffic model was not proposedthough in the certain study)
Of particular relevance to our work is the approachin [20] where an extensive study on multipoint videocon-ference traffic (H261-encoded) modelling techniques waspresented In this study the authors discussed methods forcorrectly matching the parameters of the modelling com-ponents to the measured H261-encoded data derived fromrealistic multipoint conferences (in ldquocontinuous presencerdquomode)
e above studies certainly constitute a valuable bodyof knowledge However most of the above studies exam-ine videoconference traffic traces compressed by encoders(mainly H261) that were operating in an unconstrainedmode and as a result produced traffic with similar charac-teristics (frame-size histogram of Gamma form and strongshort-term correlations) Today a large number of video-conference platforms exist the majority of them operatingover IP-based networking infrastructures and using practicalimplementations of the H261 [21] H263 [22 23] H263+[22 23] and H264 encoders [24] e above encodersoperate on sophisticated commercial soware packages thatare able of working in both unconstrained and constrainedmodes of operation In unconstrained VBR mode the videosystem operates independently of the network (ie usinga constant quantization scale throughout transmission) Inthe constrained mode the encoder has knowledge of thenetworking constraints (either imposed offline by the user oronline by an adaptive bandwidth adjustment mechanism ofthe encoder) and modulate its output in order to achieve themaximum video quality for the given content (by changingthe quantization scale skipping frames or combining mul-tiple frames into one) Furthermore most of the previousstudies have dealt with the H261-encoding of movies (likeStarwars) that exhibit abrupt scene changes However thetraffic patterns generated by differential coding algorithmsdepend strongly on the variation of the visual informationFor videoconference the use of a single-model based ona few physically meaningful parameters and applicable toa large number of sequences seems possible as the visualinformation is a typical head and shoulders content that doesnot contain abrupt scene changes and is consequently moreamenable to modelling Moreover an understanding of the
statistical nature of the constrained VBR sources is useful fordesigning call admission procedures Modelling constrainedVBR sources to the best knowledge of these authors is anopen area for study Our approach towards this direction wasto gather video data generated by constrained VBR encodersthat used a particular rate control algorithm to meet a prede-ned channel constraint and then model the resulting traceusing techniques similar to those used for unconstrainedVBR e difficulty with this approach is that the resultingmodel could not be used to understand the behaviour ofa constrained VBR source operating with a different ratecontrol algorithm or a different channel constraint Howevergiven that in constrained VBR the encoder is in the loop it ismore likely that network constraints are not violated and thatthe source operates closer to its maximum allowable trafficis may make constrained VBR traffic more amenable tomodelling than unconstrained VBR traffic e basic ideais that we can assume worst case sources (ie high motioncontents) operating close to the maximum capacity and thencharacterize these sources
Taking into account the above it is important to examinewhether the models established in literature are appropriatefor handling this contemporary setting in general It is amatter of question whether all coding strategies result in sig-nicantly different statistics for a xed or different sequenceAlong the above lines this study undertookmeasurements ofthe videoconference traffic encoded during realistic low andhigh motion head and shoulders experiments by a variety ofencoders of popular commercial soware modules operatingin both unconstrained and constrained modes Moreoverthe modelling proposal was validated with various tracesavailable in literature [19] (to be referred as ldquoTKN tracesrdquofrom now on)
e rest of the paper is structured as follows Section1 describes the experiment characteristics and presents therst-order statistical quantities of the measured data Section2 discusses appropriate methods for parameter assessmentof the encoded traffic Finally Section 3 culminates withconclusions and pointers to further research
2 The Experimental andMeasurementWork
e study reported in this paper employed measurements ofthe IP traffic generated by different videoconference encodersoperating in both unconstrained and constrained modesMore explicitly we measured the traffic generated by theH26x encoders (e NV NVDCT BVC and CellB encoders[25] were examined in [26] and it was found that theyresulted in similar traffic patterns with the H261 encoderHence the modelling proposal for H261 in the currentstudy is expected to be applicable for these encoders too)included in the following videoconference soware tools ViC(version v28ucl116) [27] VCONVpoint HD [28] PolycomPVX [29] France Telecom eConf 35 [30] and SorensonEnVision [31] ese are H261 H263 H263+ and H264In particular H264 was examined in [32] results of whichare also presented under the generic context of the currentstudy All traces examined are representative of the H26x
Journal of Computer Networks and Communications 3
family video systems Especially the ViC video system usesencoders implemented by the open H323 community [33]ese encoders are based on stable and open standards andas a consequence their examination is more probable to givereusable modelling results At this point we must note thatVCON Vpoint HD could not establish an H264 connectionwith Polycom PVX and vice versa is is due to the fact thatthe RTP payload format for the H264 has still some openissues (media unaware fragmentation) More explicitly theclients use different RTP payload types to communicate
For all the examined encoders compression is achievedby removing the spatial (intraframe) and the temporal (inter-frame) redundancy In intraframe coding a transform codingtechnique is applied at the image blocks while in interframecoding a temporal prediction is performed using motioncompensation or another technique en the difference orresidual quantity is transform coded Here we must note thatthe ViC H261 encoder [34 35] performs only intraframecoding oppositely to the H261 encoders of Vpoint eConfand EnVision where blocks are inter- or intracoded eabove encoding variations inuence the video bit rate per-formance of the encoders and as a consequence the statisticalcharacteristics of the generated traffic traces
At this point wemay discuss about the basic functionalityof the examined video systems which is a fundamental factorin the derived statistical features of the encoded traffic anda basic reason of the experimentsrsquo philosophy we followede rate control parameter (bandwidth and frame rate) sets atraffic policy that is an upper bound on the encoded trafficaccording to the userrsquos preference (obviously depending onhisher physical link) An encoderrsquos conformation to the ratecontrol of the system is commonly performed by reducingthe video quality (and consequently the frame size quantity)through the dynamicmodulation of the quantization level Inthe case of ViC a simplermethod is appliede video qualityremains invariant and a frame rate reduction is performedwhen the exhibited video bit rate tends to overcome thebandwidth bound In fact in ViC the video quality of aspecic encoder is a parameter determined a priori by theuser In the case of Vpoint Polycom eConf and EnVisionthe frame rate remains invariant and a video quality reductionis performed when the exhibited video bit rate tends toovercome the bandwidth bound is threshold can beset through the network setting of each client MoreoverVpoint utilizes adaptive bandwidth adjustment (ABA) ABAworks primarily by monitoring packet loss If the endpointdetects that packet loss exceeds a predened threshold itwill automatically drop to a lower conference data rate whileinstructing the other conference participantrsquos endpoint to dothe same
Two experimental cases were examined as presented inTable 1 (TKN traces are also included) Case 1 includedexperiments where the terminal clients were operating inunconstrainedmodewhile Case 2 covered constrained-modetrials In both Cases two ldquotalking-headsrdquo raw-format videocontents were imported in the video systems through aVirtual Camera tool [36] and then peer-to-peer sessions ofat least half an hour were employed in order to ensure asatisfactory trace length for statistical analysisese contents
were offline produced by a typical webcam in uncompressedRGB-24 format one with mild movement and no abruptscene changes ldquolistenerrdquo (to be referred as VC-L) and onewith higher motion activities and occasional zoomspanldquotalkerrdquo (VC-H) e video size was QCIF (176 times 144) inboth Cases and all scenarios (VC-H and VC-L) In Case 1 noconstraint was imposed either from a gatekeeper or from thesoware itself e target video bit rates that were imposed inCase 2 are shown in Table 1 In each case the UDP packetswere captured by a network sniffer and the collected datawere further postprocessed at the frame level (it is importantto note here that analysis at the MacroBlock (MB) as in[14] level has been examined and found to provide only atypical smoothing in the sample data We believe that theanalysis at the frame level is simpler and offers a realisticview of the traffic) by tracing a common packet timestampe produced frame-size sequences were used for furtherstatistical analysis
Specic parameters shown in Table 1 for the VC-Hand VC-L traces depend on the particular coding schemethe nature of the moving scene and the condence ofthe measured statistics Moreover traffic traces available inliterature where used for further validation Specically thetraces used were ldquooffice camrdquo and ldquolecture room camrdquo (fromthe TKN library) ese traces were offline H263 encoded ina constrained and unconstrained mode
Some primary conclusions as supported by the exper-imentsrsquo results (see Table 1) arise concerning the statis-tical trends of the encodersrsquo traffic patterns SpecicallyH263+ produces lower video bit rate than H263 and H261do is was expected since the earlier encoder versionshave improved compression algorithms than the prior ones(always with respect to the rate produced) Finally for allthe encoders the use of the VC-H content led to higher rateresults (as reasonable) Similar results were observed for themean frame size and variance quantities In all cases thevariance quantities of theVC-Hcontentwere higher than thatof VC-L with the exception of the ViC H263+ encoder (Case1mdashTraces 5 6) where the opposite phenomenon appeared
H264 and the encoders used for the production ofthe TKN traces tend to adjust their quality in a ldquogreedyrdquomanner so as to use up as much of the allowed bandwidthas possible At this point we must note that Trace 4 of Case2 is semiconstrained (ie the client did not always need theavailable network bandwidth) However this particular casecan be covered by the ldquoworst-caserdquo Case 2mdashTrace 3 wherethe target rate is reached (full-constrained traffic)
Taking into account the above context the followingquestions naturally arise
(i) What is the impact of the encodersrsquo differences on thegenerated videoconference traffic trends
(ii) Can a common model capture both types of trafficunconstrained and constrained
(iii) Are the traffic trends invariant of the constraint rateselected
4 Journal of Computer Networks and Communications
T 1 Statistical quantities of the sample frame-size sequences
Case 1 (Unconstrained)Trace Client Encoder Duration Content Target rate No frames Frame rate Rate Mean Variance1 ViC Intra H261 3600 VC-H 700 54006 15 111 921 2496702 VC-L 53937 15 63 527 1741303 H263 VC-H 54011 15 72 603 569814 VC-L 53453 15 54 457 245885 H263+ VC-H 53679 15 39 327 1677806 VC-L 53633 15 27 224 2052007 Vpoint H261 1800 VC-H 700 27275 15 365 3009 7312708 VC-L 27276 15 193 1592 3470809 eConf H263+ 3600 VC-H 444 96805 27 298 1387 38930010 VC-L 91710 25 130 640 14779011 TKN H263 2700 OFFICE 33825 13 91 904 10716012 3600 LECTURE 45459 13 62 618 136850
Case 2 (Constrained)1 Vpoint H261 3600 VC-H 155 49596 14 144 1306 487182 VC-L 50636 14 143 1275 292853 eConf H263+ 3600 VC-H 82 51331 14 84 733 82674 VC-L 48848 14 67 619 227585 EnVision H263 1800 VC-H 256 22501 13 239 2394 272756 TKN 2700 OFFICE 64 13800 5 64 1565 373167 3600 LECTURE 16788 5 64 1715 1055308 2700 OFFICE 256 13936 5 256 6200 4567909 3600 LECTURE 17707 5 256 6505 154050010 Vpoint H264 3600 VC-H 320 89911 24975 30092 1506 82011 VC-L 90001 25 30088 1504 23412 Polycom H264 3600 VC-H 320 107546 29874 34556 1446 1189613 VC-L 107515 29865 34562 1447 12833
(iv) How does the motion of the content inuence thegenerated trafficmdashfor each encodermdashand the param-eters of the proposed traffic model
(v) Can a common traffic model be applied for all theabove cases
e above questions pose the research subject which isthoroughly examined in the context to follow eir answerswill be given along with the respective analysis
3 Traffic Analysis andModelling Assessment
e measured traffic analysis for all experimental sets con-rms the general body of knowledge that literature hasformed concerning videoconference traffic Traffic analysiswas employed for all experimental cases More explicitly inall cases the frame-size sequence can be represented as a sta-tionary stochastic process with a frequency histogram of anapproximately bell-shaped (more narrow in the case ofH263H263+ and H264 encoding) Probability Distribution Func-tion (PDF) form see Figures 1(a)ndash1(c) and 2(a)ndash2(e) morecomplex in the TKN traces as their content (office and lecturecam) probably contained more scene changes than ourcontents VC-L and VC-H Examining more thoroughly thesample histograms we noted that the smoothed frame-size
frequency histograms of the H261 encoder have an almostsimilar bell-shape (see Figures 1(a) 1(b) 2(a) and 2(b)) whilea more narrow shape appears in the H263 H263+ andH264 histograms (Figures 1(c) and 2(b)ndash2(e)) e VC-Hfrequency frame-size histograms appeared to be more sym-metrically shaped than the correspondent VC-L histogramsis is reasonable as the rate of the H26x encoders dependson the activity of the scene increasing during active motion(VC-H) and decreasing during inactive periods (VC-L)
Furthermore the AutoCorrelation Function (ACF) of theunconstrained traffic (for all traces of Case 1) appeared tobe strongly correlated in the rst 100 lags (short-term) andslowly decaying to values near zero (see some indicativeFigures 3(a)ndash3(c) of the traces of Case 1) On the contrary theACFs of the constrained traffic (Case 2) decayed very quicklyto zero denoting the lack of short-term correlation (see Fig-ures 3(d) and 3(e)) is conclusion is very critical in queue-ing as the short-term correlation parameter has been foundto affect strongly buffer occupancy and overow probabilitiesfor videoconference traffic In fact to verify this assump-tion we measured the buffer occupancy of the constrainedtraces in queueing experiments of different traffic intensitiesBuffering was found to be very small at a percentage notaffecting queueing On this basis it is evident that for thepurpose ofmodelling of the two types of traffic not a common
Journal of Computer Networks and Communications 5
0 2000 4000 60000
2
4
6
Den
sity
Case 1-trace 7
0 02 04 06 08 10
01
02
03
04
05
06
07
08
09
1
Frame size
Den
sity
Sample
Gamma LogLogistic
Inverse Gamma
(a) Vpoint H261 VC-H
0 2000 4000 60000
02
04
06
08
1
Den
sity
Case 1-trace 9
0 02 04 06 08 10
01
02
03
04
05
06
07
08
09
1
Frame size
Den
sity
Sample
Gamma LogLogistic
Inverse Gamma
(b) eConf H263+ VC-H
0 2000 4000 60000
05
1
15
2
25
3
35
4
45
Den
sity
Case 1-trace 11
002 04 06 08 10
01
02
03
04
05
06
07
08
09
1
Frame size
Den
sity
Sample
Gamma LogLogistic
Inverse Gamma
(c) TKN H263 Office
F 1 Frame-size histograms versus moment t and the respective - Plots for unconstrained traces
model can be applied More explicitly a correlated model isneeded for the case of unconstrained traffic while a simplernoncorrelated model is enough for constrained traffic
e DAR model proposed in [5] has an exponentiallymatching autocorrelation and somatches the autocorrelationof the data over approximately hundred frame lags ismatch is more than enough for videoconference trafficengineering Consequently this model is a proper solutionfor the treatment of unconstrained traffic When using theDAR model it is sufficient to know the mean variance andthe autocorrelation decay rate of the source for admissioncontrol and traffic forecasts For the constrained traffictraces a simple random number generator based on the t ofthe sample frame-size histogram can be directly applied eDAR model with the autocorrelation decay rate value equalto zero can also be a solution is feature turns constrainedvideoconference traffic more amenable to traffic modellingthan its counterpart unconstrained as only two parametersare needed the mean and the variance of the sample
pecically as shown in [32] for the H264 traffic it canbe characterized as constrained and the generated traffic isuncorrelated and can be accurately represented by a119863119863119863119863119863119863119863queue
e rest of the paper discusses methods for correctlymatching the parameters of the modelling components tothe data and for combining these components into the DARmodel
31 Fitting of the Frame-Size Frequency Histograms of theTraces A variety of distributions was tested for tting thesample frame-size frequency histograms ese are the fol-lowing Gamma Inverse Gamma (or Pearson V) LoglogisticExtreme Value Inverse Gauss Weibull Exponential andLognormal e most dominant ones found to be the rstthree Even though the Inverse Gauss density performedsimilarly to the Gamma distribution it is not included inthe analysis to follow as the Gamma distribution is widelyadopted in literature Finally the Extreme Value distributionperformed in total worse than the other ones
For the purpose of tting the selected distributions den-sity to the sample frame-size sequence histogram althoughvarious full histogram-based methods (eg [20]) have beentried in literature as well as maximum likelihood estimations(MLE) we followed the approach of the simple momentsmatching method is method has the advantage of requir-ing only the sample mean frame size and variance quantitiesand not full histogram informationus taking into accountthat the sequence is stationarymdashand as a result the mean andthe variance values are almost the same for all the samplewindowsmdashit is evident that only a part of the sequence isneeded to calculate the corresponding density parametersFurthermore this method has the feature of capturing accu-rately the sample mean video bit rate a property that isnot ensured in the case of MLE or histogram-based modelsHowever in the cases of not satisfactory t by none of the
6 Journal of Computer Networks and Communications
Sample
LogLogisticGamma C-LVMAX
Inverse Gamma
0 1000 2000 30000
05
1
15
2
25
Den
sity
Case 2-trace 1
0
01
02
03
04
05
06
07
08
09
1
Frame size
Den
sity
0 02 04 06 08 1
(a) Vpoint H261 VC-H
0 1000 20000
1
2
3
4
5
6
7
8
Den
sity
Case 2-trace 3
0 02 04 06 08 10
01
02
03
04
05
06
07
08
09
1
Frame size
Den
sity
Sample
LogLogisticGamma C-LVMAX
Inverse Gamma
(b) eConf H263+ VC-H
0 2000 40006000 80000
02
04
06
08
1
12
14
Den
sity
Case 2-trace 8
0 02 04 06 08 10
01
02
03
04
05
06
07
08
09
1
Frame size
Den
sity
Sample LogLogisticGamma
C-LVMAX
(c) TKN H263 Office (256Kbitssec)
0 1000 2000 30000
05
1
15
2
25
3
35
4
45
Den
sity
Polycom-high motion (A)
Sample
Frame size
C-LVMAX
0 02 04 06 08 10
01
02
03
04
05
06
07
08
09
1
Sample
C-L
VM
AX
(d) Polycom H264 VC-H
0 1000 2000 30000
0002
0004
0006
0008
001
0012
Frame Size
Den
sity
VCON-high motion (A)
Sample
C-LVMAX
0 02 04 06 08 10
01
02
03
04
05
06
07
08
09
1
Sample
C-L
VM
AX
(e) VCON H264 VC-H
F 2 Frame-sie istorams ersus moment and C-V t and respectie - Plots for constrained traces
Journal of Computer Networks and Communications 7
0 100 200 300 400 5000
01
02
03
04
05
06
07
08
09
1
Lag
Au
toco
rrel
atio
n
Case 1-trace 7
(a) Vpoint H261 VC-H Unconst
0 100 200 300 400 5000
01
02
03
04
05
06
07
08
09
1
Lag
Au
toco
rrel
atio
n
Case 1-trace 9
(b) eConf H263+ VC-H Unconst
0 100 200 300 400 5000
01
02
03
04
05
06
07
08
09
1
Lag
Au
toco
rrel
atio
n
Case 1-trace 11
(c) TKN H263 Off Unconst
0 100 200 300 400 5000
01
02
03
04
05
06
07
08
09
1
Lag
Au
toco
rrel
atio
nCase 2-trace 1
(d) Vpoint H261 VC-H Const
0 100 200 300 400 5000
01
02
03
04
05
06
07
08
09
1
Lag
Au
toco
rrel
atio
n
Case 2-trace 7
(e) TKN H263 Office 64K Const
F 3 Autocorrelation graphs for unconstrained and constrained traces
8 Journal of Computer Networks and Communications
examined distributions (as in the case of the TKN traces) ahistogram-based method can be applied
If119898119898 is the mean 119907119907 the variance of the sample sequence 119904119904and 119898119898119897119897 the mean and 119907119907119897119897 the variance of the logarithm of thesample 119904119904 then the distribution functions and the correspond-ing parameters derived from the moments matching methodare given by the following equations for each distributioncorrespondingly (1) Gamma (2) Inverse Gamma and (3)Loglogistic
119891119891 (119909119909) =1
120573120573120573 (120572120572)10076531007653119909119909120573120573100766910076691205721205721205721
119890119890120572119909119909119909120573120573 (1)
where 120572120572 = 1198981198982119909119907119907 120573120573 = 119907119907119909119898119898 and 120573(120572120572) = 120572infin0 1199061199061205721205721205721119890119890120572119906119906119889119889119906119906
119891119891 (119909119909) =1
120573120573120573 (120572120572)sdot
119890119890120572120573120573119909119909119909
1007649100764911990911990911990912057312057310076651007665(1198861198861198861) (2)
where 119886119886 = 1198981198982119909119907119907 119886 2 and 120573120573 = 119898119898(1198981198982119909119907119907 119886 1)
119891119891 (119911119911) =119890119890[119911119911(1120572119911119911)120572119898119898119897119897]
119911119911(1 119886 119890119890119911119911)2 (3)
where 119911119911 = (119911119911(119909119909) 120572 119898119898119897119897)119909119911119911 119898119898119897119897 = 120124120124[119911119911(119904119904)] and 119911119911 =100352410035243120124120124[119911119911(119904119904)]119909120124120124
Given the dominance of the above distributions mod-elling analysis and evaluation will be presented for the abovethree densities e numerical results (densitiesrsquo parameters)from the application of the above parameters-matchingmethods appear in Table 2 e modelling evaluation ofthe above methods has been performed from the point ofqueueing As a consequence we thoroughly examined ts ofcumulative distributionsis was done as follows we plottedthe sample quantiles from the sample cumulative frequencyhistogram and the model quantiles from the cumulativedensity of the corresponding distribution e Q-Q plot ofthis method refers to cumulative distributions (probabilitiesof not exceeding a threshold)
Figures 1(a)ndash1(c) andFigures 2(a)ndash2(c) presentQ-Qplotsfor all traces of both Case 1 and 2 respectively e resultssuggest that for tting videoconference data the codingalgorithm used should be taken into consideration ereseems to be a relationship between the coding algorithms andthe characteristics of the generated traffic For instance forH261 in most cases the dominant distribution is Gamma(1) as can be veried from the Q-Q plots depicted in Figures1(a) and 1(b) and for H263 and H263+ the Loglogisticdensity (3) has a more ldquostablerdquo performance than the othertwo (Q-Q plots shown in Figures 1(c) and 2(c) e InverseGamma density (2) seems to be suitable for H263 traffic (seeFigure 1(c)) although it was outperformed by the Loglogisticdensity in some cases However as will be commented uponlater it did not provide a solution in all cases of constrainedtraffic
We must note that in Case 2 where a constrain wasimposed the moments matching method for calculatingthe distributionrsquos parameters did not always provide a goodt and performed as shown in Figures 2(a)ndash2(c) (inverse
Gamma and Loglogistic are depicted e Gamma den-sity provided similar t) To provide an acceptable t ahistogram-based method proposed for H261 encoded trafficin [20] known as C-LVMAX was used is method relatesthe peak of the histogramrsquos convolution to the location atwhich the Gamma density achieves its maximum and tothe value of this maximum e values of the shape andscale parameters of the Gamma density are derived from119886119886 = (21201241201241199091199092max119891119891
2max 119886 1)1199092 and 119887119887 = 1119909(2120124120124119909119909max119891119891
2max) where
119891119891max is the unique maximum of the histogramrsquos convolutiondensity at 119909119909max Numerical values for this t appear also inTable 2 (for Case 2 only) Figures 2(a)ndash2(c) show how thethree distributions t the empirical data using the method ofmoments (Inverse Gamma Loglogistic) and the C-LVMAXmethod (Gamma C-LVMAX) e Inverse Gamma densitycould not be calculated for all the constrained traces (Case2mdashTraces 5 6 8 9) due to processing limitations (for largea b parameters the factor (1119909120573120573)(1198861198861198861) in (2) is very smallnear zero and consequently its inverse quantity could notbe calculated (however the values of the parameters of theInverse Gamma density for Case 2mdashTraces 5 6 8 9 are givenin Table 2))
Summing up the above analysis it is evident that theGamma density is better for H261 unconstrained trafficthe Loglogistic for unconstrained H263 H263+ traffic andthe C-LVMAX method for all cases of constrained traffic(including H264 traffic as proposed in [32]) However if ageneric and simple model needed to be applied for all casesthen the most dominant would be the Loglogistic density
32 Calculation of the Autocorrelation Decay Rate of theFrame-Size Sequences At this point we may discuss aboutthe calculation of the autocorrelation decay rate of the frame-size sequence of the unconstrained traces (as denoted in theprevious sections constrained traffic appeared to be uncor-related and as a result the decay rate of its autocorrelationfunction can be set to zero) From the Figures 3(a)ndash3(d)it is observed that the ACF graphs of unconstrained trafficexhibit a reduced decay rate beyond the initial lags It isevident that unconstrained video sources have very highshort term correlation feature which cannot be ignored fortraffic engineering purposes is is a behaviour also notedin earlier studies [4]
To t the sample ACF we applied the model proposed in[20] that is based on a compound exponential t is modelts the autocorrelation function with a function equal to aweighted sum of two geometric terms
120588120588119896119896 = 1199081199081199081199081198961198961 119886 (1 120572 119908119908) 119908119908
1198961198962 (4)
where 1199081199081 1199081199082 are the decay rates with the property |1199081199082| lt|1199081199081| lt 1 is method was tested with a least squares tto the autocorrelation samples for the rst 100 since theautocorrelation decays exponentially up to a lag of 100 frames(short-termbehavior) or so and then decays less slowly (long-term behavior) is match is more than enough for trafficengineering as also noted in [37] What is notable is thatusing this model the autocorrelation parameter 120588120588 is chosennot at lag 1205721 as in DAR model For each encoder (in Case
Journal of Computer Networks and Communications 9
T 2 Parameter values of the modeling components
Trace Gamma Inverse gamma Loglogistic C-LVMAX Exponential120572120572 120573120573 120572120572 120573120573 119898119898119897119897 120590120590 120572120572 120573120573 119908119908 1205821205821 1205821205822
Case 1 (Unconstrained)1 33971 2711005 53971 40495 6648 03549 05057 09925 077572 15944 3304804 35944 1367 59603 04449 05575 09905 087093 63878 944476 83878 44571 63382 01909 04368 09915 075284 85059 537656 105059 43473 60789 01609 03083 09906 082695 06385 5126355 26385 5362591 55827 03051 00683 0992 055286 02454 9145151 22454 2794386 51082 0318 00454 0994 054937 123817 243024 143817 40266 79663 01661 05322 0991 081928 72998 2180509 92998 13211 73199 01695 06018 09935 087819 49385 2807675 69385 82341 71117 03038 05373 09932 0776210 27722 2308974 47722 24145 63161 03023 06022 09935 0805911 76226 1185656 96226 77929 67613 01533 07935 09785 0876912 2787 2215946 4787 23388 63424 0193 07793 0999 09316
Case 2 (Constrained)1 35017 372996 37017 47043 71602 00954 58689 23692172 554924 229723 574924 72016 71415 00752 91345 14552063 650183 112758 670183 48400 65901 00673 281127 2583964 168458 367556 188458 11050 63966 01456 27951 26186695 2100779 227889 2120779 1010500 84713 00388 2943836 1630246 656089 238487 676089 104220 73455 00845 245985 64227 278637 615424 298637 49496 74205 01407 1875797 971248 841382 736822 861382 527810 87237 00796 3196409 1963559 274707 2368108 294707 185210 87524 01455 2497543 277889
1) the parameter numerical values of the above t appear inTable 2
4 Conclusions
is paper proposed modelling methods for two types ofvideoconference traffic unconstrained and constrained eanalysis of extensive data that were gathered during experi-ments with popular videoconference terminals and differentencoding schemes as well as of traffic traces available inliterature suggested that while the unconstrained traffictraces exhibited high short-term correlations the constrainedcounterpart patterns appeared to be mostly uncorrelated ina percentage not affecting queueing
We used the measured data to develop statistical trafficmodels for unconstrained and constrained traffic esemodels were further validated with different videoconferencecontents (low motion and high motion TKN library) Dif-ferent statistical models for tting the empirical distribution(method of moments and C-LVMAX method) were exam-ined
For tting the videoconference data the coding algorithmused should be taken into consideration ere seems tobe a relationship between the coding algorithms and thecharacteristics of the generated traffic For instance forH261 in most cases the dominant distribution is Gammaand for H263 and H263+ Loglogistic has a more ldquostablerdquo
performance Moreover the Inverse Gamma density couldnot be calculated for all constrained traces due to processinglimitations is fact constitutes the Inverse Gamma densityas impractical as a generic model for H263 traffic
Regarding the unconstrained traces a careful but simplegeneralization of the DARmodel can simulate conservativelyand steadily themeasured videoconference data For the con-strained traces the traffic can be captured by the C-LVMAXmethod via a random number generator producing framesat a time interval equal to the sample On the other hand ifa moments matching method needed to be applied then theLoglogistic density is a direct solution Another interestingassumption is that the traffic trends remain invariant whena different network constrained is selected as evident fromthe TKN traces So the proposed model for the constrainedtraffic can be applied without taking into account the specicnetwork constraint
It is evident that if a generic and simple model neededto be applied for all cases of videoconference traffic then themost dominant would be the DAR model based on the t ofthe Loglogistic density with a decay rate properly assignedto the t of the sample ACF at the rst 100 lags (althougha 500 lags t would lead to a more conservative queueingperformance) for the case of unconstrained traffic and tozero for the constrained traffic
Future work includes the integration of the proposedmodels in dynamic traffic policy schemes in real diffservIP environments e study of semiconstrained traffic cases
10 Journal of Computer Networks and Communications
although their counterpart ldquoworst-caserdquo full-constrainedcases cover their traffic trends is of particular interest too
References
[1] B Maglaris D Anastassiou P Sen G Karlsson and J DRobbins ldquoPerformance models of statistical multiplexing inpacket video communicationsrdquo IEEE Transactions on Commu-nications vol 36 no 7 pp 834ndash843 1988
[2] R Kishimoto Y Ogata and F Inumara ldquoGeneration intervaldistribution characteristics of packetized variable rate videocoding data streams in an ATM networkrdquo IEEE Journal onSelected Areas in Communications vol 7 no 5 pp 833ndash8411989
[3] H S Chin JW Goodge R Griffiths andD J Parish ldquoStatisticsof video signals for viewphone-type picturesrdquo IEEE Journal onSelected Areas in Communications vol 7 no 5 pp 826ndash8321989
[4] M Nomura T Fujii and N Ohta ldquoBasic characteristics ofvariable rate video coding in ATM environmentrdquo IEEE Journalon Selected Areas in Communications vol 7 no 5 pp 752ndash7601989
[5] D P Heyman A Tabatabai and T V Lakshman ldquoStatisticalanalysis and simulation study of video teleconference traffic inATM networksrdquo IEEE Transactions on Circuits and Systems forVideo Technology vol 2 no 1 pp 49ndash59 1992
[6] D M Cohen and D P Heyman ldquoPerformance modeling ofvideo teleconferencing in ATM networksrdquo IEEE Transactionson Circuits and Systems for Video Technology vol 3 no 6 pp408ndash422 1993
[7] D Heyman and T V Lakshman ldquoModeling teleconferencetraffic from VBR video codersrdquo in Proceedings of the IEEEInternational Conference on Communications pp 1744ndash1748May 1994
[8] D M Lucantoni and M F Neuts ldquoMethods for performanceevaluation of VBR video traffic modelsrdquo IEEEACM Transac-tions on Networking vol 2 no 2 pp 176ndash180 1994
[9] P A Jacobs and P A W Lewis ldquoTime series generated bymixturesrdquo Journal of Time Series Analysis vol 4 no 1 pp19ndash36 1983
[10] A Elwalid D Heyman T V Lakshman D Mitra and AWeiss ldquoFundamental bounds and approximations for ATMmultiplexers with applications to video teleconferencingrdquo IEEEJournal on Selected Areas in Communications vol 13 no 6 pp1004ndash1016 1995
[11] D P Heyman ldquoe GBAR source model for VBR videoconfer-encesrdquo IEEEACMTransactions on Networking vol 5 no 4 pp554ndash560 1997
[12] R Bo ldquoModeling and simulation of broadband satellite net-worksmdashpart II traffic modelingrdquo IEEE Communications Mag-azine vol 37 no 7 pp 48ndash56 1999
[13] A Erramilli O Narayan and W Willinger ldquoExperimentalqueueing analysis with long-range dependent packet trafficrdquoIEEEACM Transactions on Networking vol 4 no 2 pp209ndash223 1996
[14] G Sisodia L Guan M Hedley and S De ldquoA new modelingapproach of H263+ VBR coded video sources in ATM net-worksrdquo Real-Time Imaging vol 6 no 5 pp 347ndash357 2000
[15] K Dolzer and W Payer ldquoOn aggregation strategies for multi-media trafficrdquo in Proceedings of the 1st Polish-German TeletrafficSymposium (PGTS rsquo00) Dresden Germany September 2000
[16] WC Poon andK T Lo ldquoA rened version ofMGinfin processesfor modelling VBR video trafficrdquo Computer Communicationsvol 24 no 11 pp 1105ndash1114 2001
[17] L Yan-ling W Peng and W Wei-ling ldquoA steady source modelfor VBR video conferencesrdquo in Proceedings of the InternationalConference on Information Technology Computers and Commu-nications Las Vegas Nev USA 2003
[18] A Lazaris P Koutsakis and M Paterakis ldquoA new model forvideo traffic originating from multiplexed MPEG-4 videocon-ference streamsrdquo Performance Evaluation vol 65 no 1 pp51ndash70 2007
[19] F H P Fitzek and M Reisslein ldquoMPEG-4 and H263 videotraces for network performance evaluationrdquo IEEE Network vol15 no 6 pp 40ndash54 2001
[20] C Skianis K Kontovasilis A Drigas and M Moatsos ldquoMea-surement and statistical analysis of asymmetric multipointvideoconference traffic in IP networksrdquo TelecommunicationSystems vol 23 no 1-2 pp 95ndash122 2003
[21] ITU Recommendation H261 Video Codec for AudiovisualServices at 64 Kbits 1993
[22] ITU Recommendation H263 Video Coding for Low Bit RateCommunication 2005
[23] H263 Standard Overview and TMS320C6x ImplementationWhite Paper httpwwwubvideocom
[24] ITU Recommendation H264 Advanced Video Coding forGeneric Audiovisual Services 2007
[25] R Frederick Experiences With Real-Time Soware Video Com-pression Xerox Parc 1994
[26] S Domoxoudis S Kouremenos V Loumos and A DrigasldquoMeasurement modelling and simulation of videoconferencetraffic from VBR video encodersrdquo in Proceedings of the 2ndInternationalWorking Conference on the PerformanceModellingand Evaluation of Heterogeneous Networks (HET-NETs rsquo04)Ilkley West Yorkshire UK July 2004
[27] e ViC Tool httpwww-micecsuclacukmultimedia so-warevic
[28] VCON Vpoint HD httpwwwvconcom[29] Polycom PVX httpwwwpolycomcom[30] France Telecom eConf httpwwwrdfrancetelecomcom[31] Sorenson EnVision httpwwwsorensonvrscom[32] S Domoxoudis S Kouremenos A Drigas and V Loumos
ldquoFrame-based modeling of H264 constrained videoconferencetraffic over an IP commercial platformrdquo in Proceedings of the2nd International IEEECreate-Net Conference on Testbeds andResearch Infrastructures for the Development of Networks andCommunities pp 216ndash221 Barcelona Spain March 2006
[33] OpenH323 Project httpopenh323org[34] S R McCanne ldquoScalable compression and transmission of
internet multicast videordquo Tech Rep UCBCSD-96-928 Com-puter Science Division (EECS) University of California Berke-ley Calif USA 1996 94720
[35] L D McMahan Video conferencing over an ATM network[thesis] California State University Northridge Calif USA1997
[36] MorningSound httpwwwsoundmorningcom[37] T V Lakshman A Ortega and A R Reibman ldquoVBR video
tradeoffs and potentialsrdquo Proceedings of the IEEE vol 86 no 5pp 952ndash972 1998
Impact Factor 173028 Days Fast Track Peer ReviewAll Subject Areas of ScienceSubmit at httpwwwtswjcom
Hindawi Publishing Corporation httpwwwhindawicom Volume 2013Hindawi Publishing Corporation httpwwwhindawicom Volume 2013
The Scientific World Journal
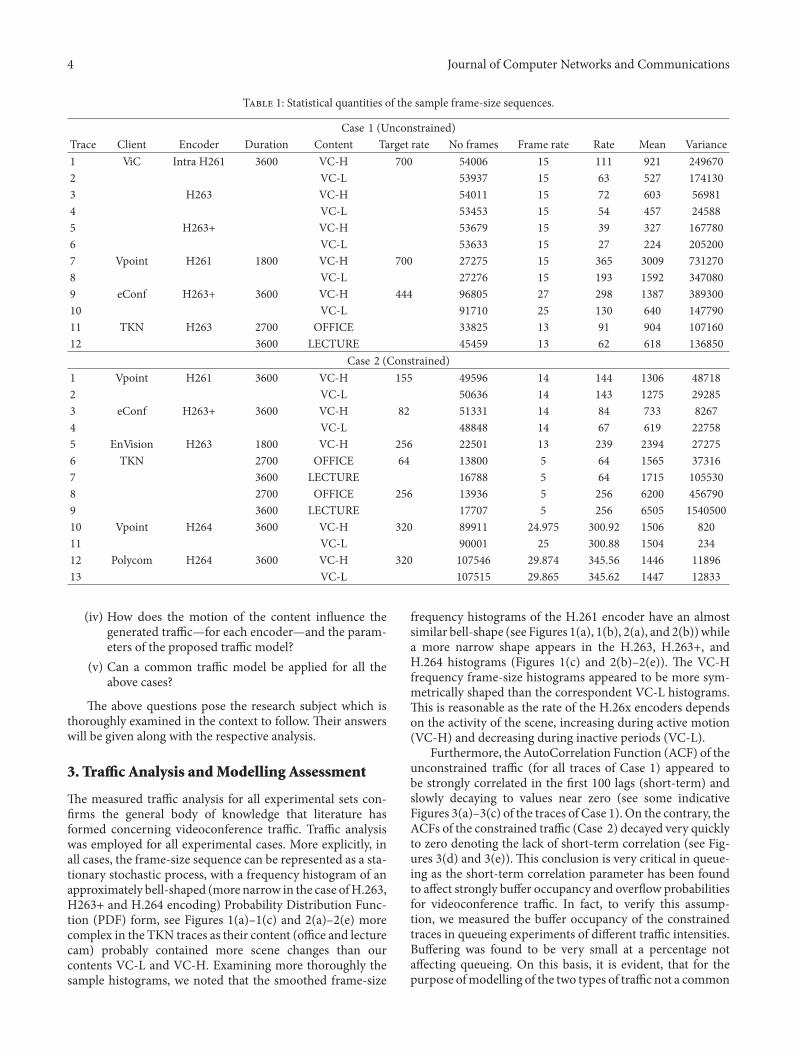
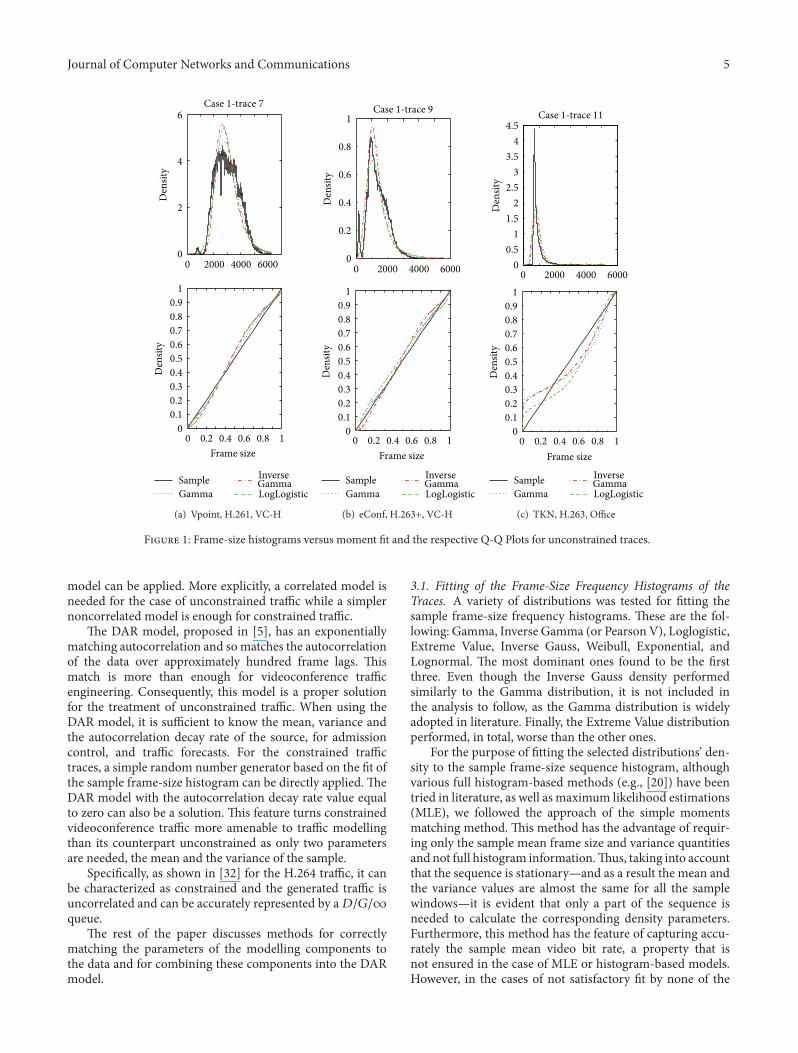
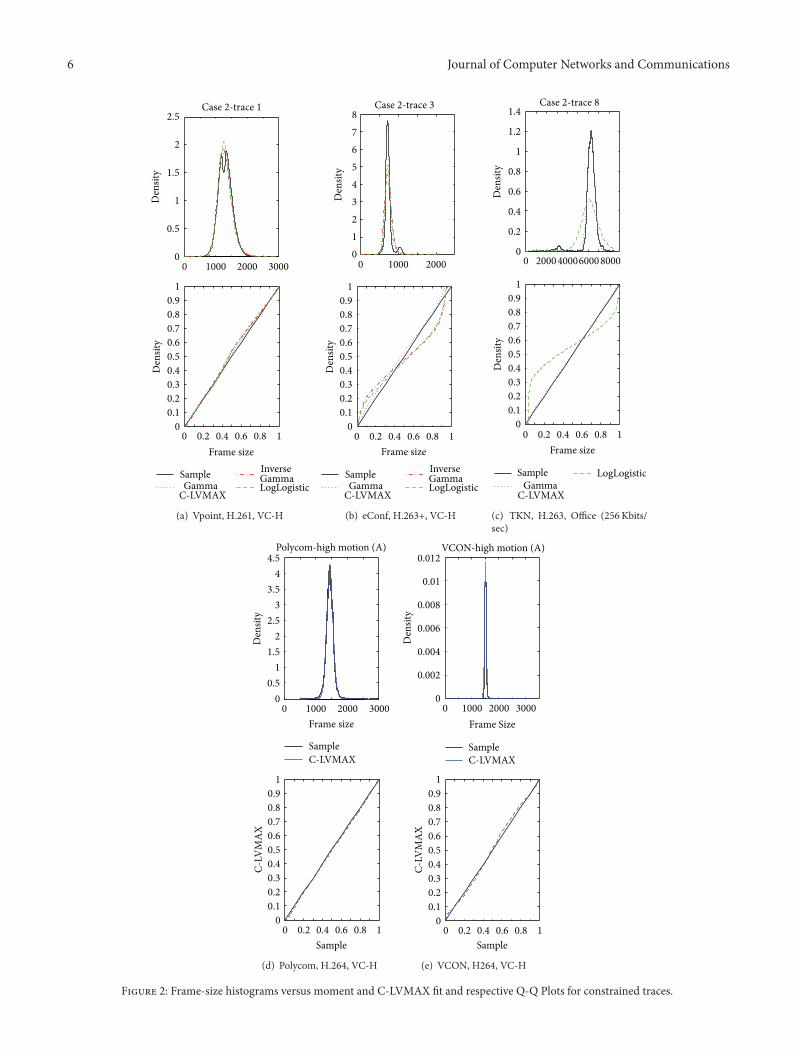
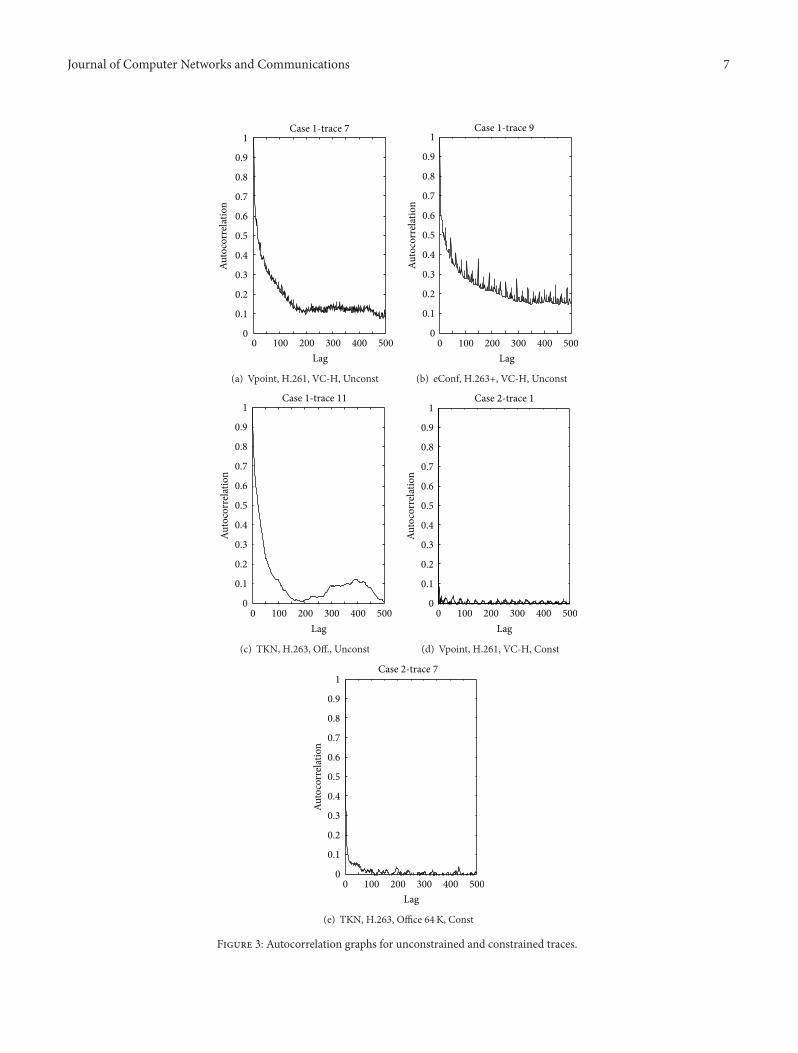
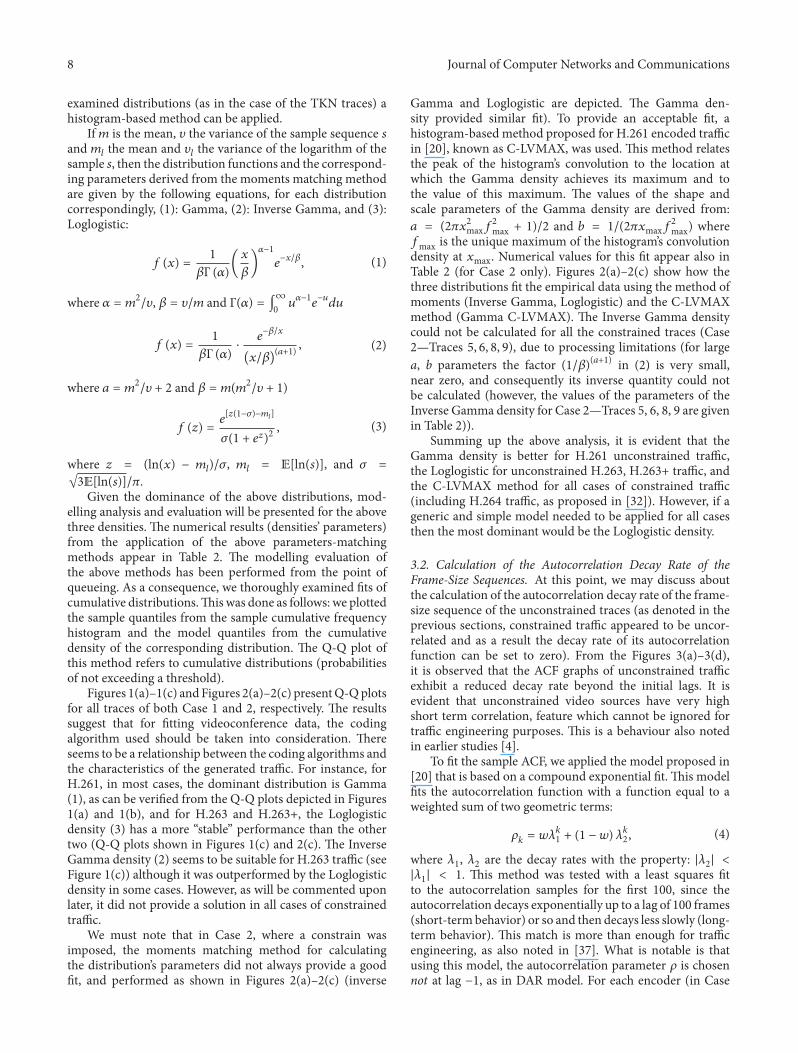
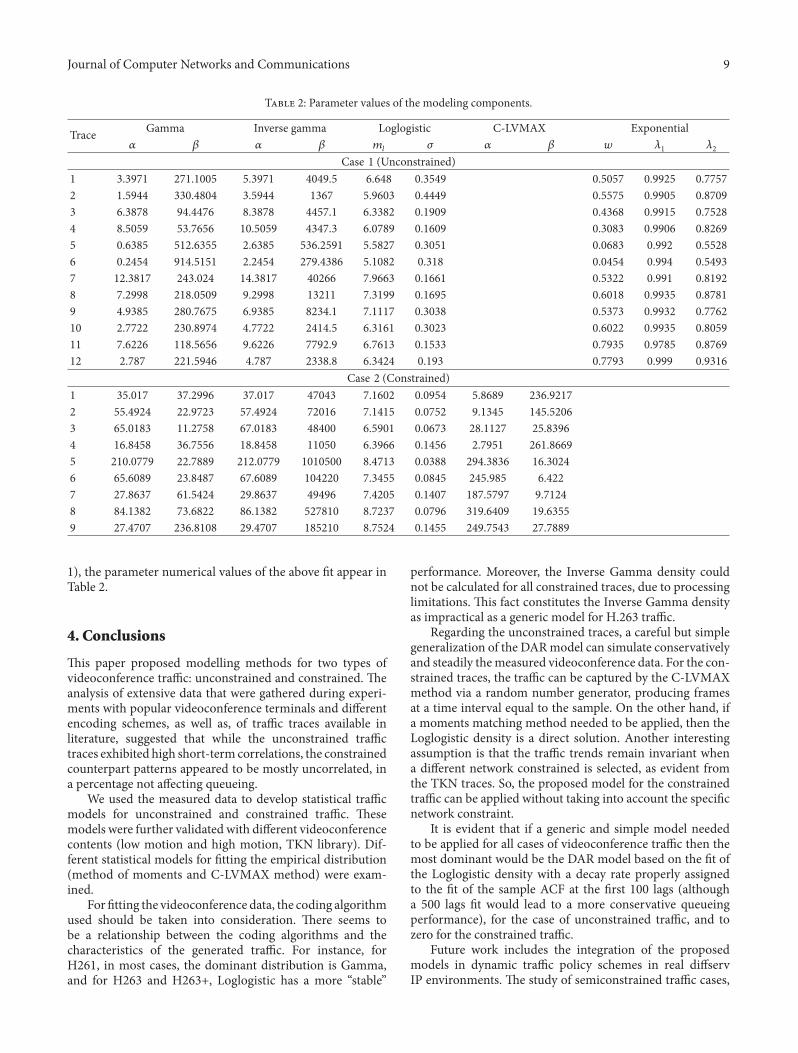
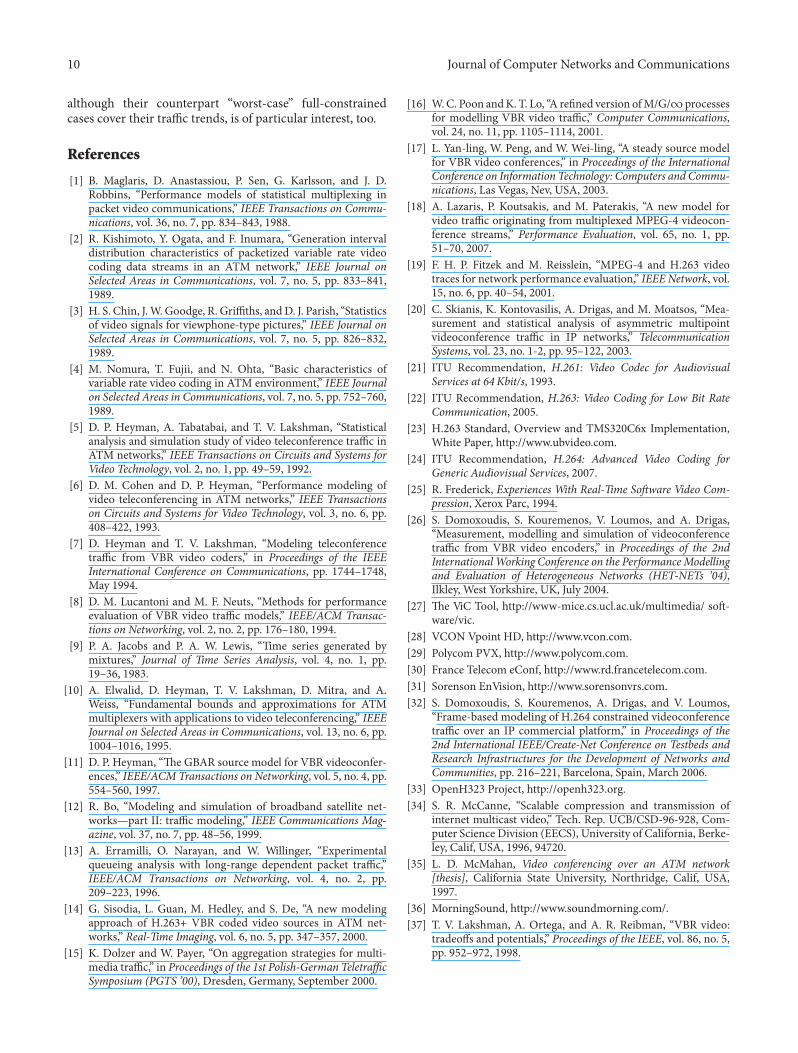

Impact Factor 173028 Days Fast Track Peer ReviewAll Subject Areas of ScienceSubmit at httpwwwtswjcom
Hindawi Publishing Corporation httpwwwhindawicom Volume 2013Hindawi Publishing Corporation httpwwwhindawicom Volume 2013
The Scientific World Journal