Primer Parcial – Primer Cuatrimestre 2014 Temas a desarrollar
Upload
independentCategory
view
1download
0
-- --
CHAPTER 1: INTRODUCTION
Why do performance analysis? There are two basic reasons:
[1] To improve productivity: more work is accomplished in the same amount of time.
[2] To add functionality: totally new functions will be performed that offer the potential for newproductivity gains or new revenue.
Productivity has two components:
[1] Comparisons of different configurations of an existing system doing an established set offunctions. Here are some illustrative examples:
• A file system is stored on a disk. Where should the files physically be located to provideacceptable access times for typical usage?
• An office contains three groups. Should there be one secretary per group, or a pool of threesecretaries for all the groups?
[2] Changing the configuration of an existing system doing an established set of functions toimprove performance. Here are some examples to illustrate this point:
• A computer system for program development is configured with one megabyte of memory.What information is needed to determine how much memory is really needed?
• A file system for billing inquiries is stored on two disk spindles. A single controller governsaccess to the two spindles. What information is needed to determine if a third disk spindle isneeded? What about adding another controller?
• An application program that generates management reports reads one file repeatedly. Whatinformation is needed to determine if this file should be replicated and stored on more thanone disk spindle, to improve performance?
• A packet switch has four communication links. Should there be a pool of buffers for allmessages on all links, or should buffers be dedicated to different types of packets (e.g.,control packets versus data packets, or so many buffers per line)
• A telephone switching system is controlled by a single processor. What information isneeded to determine if this processor should be replaced by a single faster processor, or twoprocessors of the same speed, in order to handle fifty per cent more telephone calls per hour?
Here are some examples of added functionality:
• An office already owns a computer controlled word processing system. What information is neededto determine if this system can support electronic mail?
• A bank wishes to install a network of automatic teller machines. What information is needed todetermine what type of computer will be needed to handle this work?
• A CATV franchise wishes to supply voice communications over TV channels not used forentertainment. What type of computer system will be needed to handle billing for this purpose?
Coupled with any performance analysis must be an economic analysis to quantify benefits and costs.All too often costs are ignored altogether, for a variety of reasons. If costs are ignored, then, de facto,costs are assumed negligible. However, costs are lost benefits. If costs are studied, then the outcomemust be worse than before the study, because now costs are not negligible. Costs quantify the benefitsof different alternatives, which is one aspect of decision making.
Remember, issues of computer performance evaluation cannot be answered absolutely. They must beaddressed relative to other factors, such as economic issues, political considerations, and many more.The aspects of performance dealt with here are still only a subset of all the factors that must be

-- --
2 PERFORMANCE ANALYSIS PRIMER CHAPTER 1
considered in evaluating a total system to determine if it is suitable for a given application.
Although we focus on performance analysis here, we can be more specific, and list some of these otherconsiderations:
• Economic: What is the cost to the user and the provider for a set of services?
• Marketing: What are the long term strategies or goals? What products attempt to meet those goals?
• Service: What service must be provided by the vendor, and by the purchaser? At what cost?
• Human engineering and psychological: What do human beings see and hear and feel when theyinteract with the system?
• Logical correctness and functionality: What functions should the system perform? How do weknow these functions are being correctly executed?
• Systems engineering: Should products be leased or purchased? From what vendors? Whathardware configuration is cost effective? What software configuration?
1.1 An Example
The figure below shows a representative hardware block diagram of a computer system.
Figure 1.1.Computer System Hardware Block Diagram
Operators at terminals spend some time reading, thinking and entering commands. The commands arefed into the computer system, and executed, and the cycle repeats itself. In order to say anything at allquantitative concerning performance, we must describe how the system works. The simplest script fordescribing this would be to have only one type of job done by every operator. The script that eachoperator would follow might be
• Read, think and enter a command
• Wait for the response to the command
The process then repeats itself, again and again and again. This is summarized in the flow chart below.We measure the average time to do each step. There are two entities, an operator (at a terminal) and acomputer system. The table below is a summary of what entities are needed at each step, and theaverage time per step:

-- --
CHAPTER 1 INTRODUCTION 3
Figure 1.2.Operator Interaction With Computer System Flow Chart
Table 1.1.Steps, Entities and Mean Time per Step_ _____________________________________________ ____________________________________________Step Operator Computer Time_ _____________________________________________ ____________________________________________
Read,Think,Type 1 0 Tthink
Wait for Response 0 1 Tsystem
The times that are tabulated are measured with no contention, i.e., with only one operator at oneterminal using the computer system. We will use the no contention measurements to extrapolate tosystem behavior with contention. But before doing so, we must take a diversion.
1.2 What Is a Resource?
The entities in the example above are concrete examples of what we call resources. In order tounderstand the performance of a computer or communication system, we must understand what state thesystem is in at any instant of time. It is often useful to summarize the system state by what jobs areholding what resources at each step of execution. What is a resource? A resource is anything thatcan block subsequent execution of a job. A job requires one or more resources at each stage ofexecution, and if it does not have them all, it is blocked from execution until the necessary resources areavailable. What are the resources in the previous example?
• Each operator is a resource
• Each terminal is a resource
• Each command is executed on a computer system, so the computer system is a resource
We could aggregate this set of resources in different ways. For example, in order for an operator tointeract with the system, an operator needs a terminal, so we might combine these two resources andtalk about operators and terminals interchangeably. We could disaggregate this set of resources indifferent ways. For example, we might look inside the computer system, and find a processor, memory,a disk controller handling one or more disk spindles, and so on, as well as operating system softwareand application programs, each of which might usefully be thought of as resources. Whateverdescription is most useful in a given situation will determine what level of aggregation anddisaggregation is needed.
The state of the system at any instant of time is given by the number of operators at terminals activelyreading, thinking, and typing, and hence holding a terminal resource, and the number of jobs inside thesystem in execution or waiting to be executed. More formally, Joperator denotes the number of operatorsreading, thinking and typing, while Jsystem denotes the number of jobs inside the system. Each of thesecan take on integer values ranging from zero to N , the total number of terminals with operators, butthere is a constraint that every job must be somewhere, either with an operator or inside the system, andhence

-- --
4 PERFORMANCE ANALYSIS PRIMER CHAPTER 1
Joperator + Jsystem = N
The state space Ω is given by all ordered pairs (Joperator ,Jsystem ) such that the total number of jobs equalsthe total number of active operators:
Ω = (Joperator ,Jsystem ) Joperator ,Jsystem =0,1,...,N ;Joperator + Jsystem =N
A useful picture of the system state is a queueing network block diagram. For our earlier example ofterminals connected to a single system this is shown in the figure below:
Figure 1.3.Queueing Network Block Diagram
We see two queues, represented by a box with an open left end. Resources are shown by circles orservers: each terminal is represented by a circle, while the system is represented by one circle. Jobscirculate from the terminals into the system and back again.
Both physical and logical resources are required at each stage of execution of computer programs, andwe must know these in order to say anything about performance. Resources can be
• Serially reusable--one job at a time can use a processor, a data link, a given secondary storagedevice, a protected file, a critical region of operating system code
• Shared concurrently--multiple buffers in an operating system allow different jobs to share the bufferresource concurrently
• Consumable--messages between software modules exemplify this resource type
In our previous example, the system is serially reusable, while the terminal resource can be thought of asshared concurrently: there is a pool of terminals, and we are not distinguishing anything about the workgoing on at each terminal (if we did, then each terminal would be a serially reusable resource). Becausethe notion of resource is essential to performance analysis, we will motivate this basic concept withadditional examples in later sections.
1.3 Resource Allocation Policy
The choice of policy or schedule for allocation of resources is central to performance evaluation. Wewill focus on a variety of policies to allocate resources throughout this book, because the central issue inmodern digital system design is the ability to allocate resource as demands change with time in a costeffective and flexible manner. Any scheduler will execute the highest priority job in the system at anyone time. An illustrative flow chart of a scheduler is shown on page seven.
The details of how to set the priorities will concern us throughout the rest of this book. Again, we onlyhave finite resources, due to economic concerns, that must be allocated amongst competing tasks inorder to meet diverse and perhaps conflicting goals.

-- --
CHAPTER 1 INTRODUCTION 5
Figure 1.4.Scheduler Flow Chart
1.4 Likelihoods and Statistics
One problem with characterizing performance of computer communication systems is their intrinsiccomplexity. Even if we could know the state of every logic gate, which could be billions upon billionsof states, what would we do with the information: it is simply too difficult to track and comprehend. Onthe one hand, for logically correct operation, we are interested in knowing all the states: is the system ina working state, or is it in an unacceptable state? On the other hand, for performance, we are notalways interested in all the states, but only the most likely that the system would be operating in.Statistics are a natural way of summarizing this type of complexity. Statistics allow us to quickly drawcause and effect inferences. Computer communications systems do not operate in a random manner,which is one aspect of statistics. Our purpose in using statistics is to study the most likely behavior,averaged over a suitably long time interval. Finally, how long is long? This is a relative notion: we areassuming that the measurements and statistics we gather stabilize, and are well characterized by anaverage value or mean. Transients will be ignored until later.
1.5 Performance Measures
Our intent is to focus on some of the many facets of what is called performance of a computer orcommunication system. This had its origin in voice telephony, determining how many voice telephonescould be connected to a switching system to provide acceptable service. The demands placed on suchsystems can generate traffic or congestion for different resources. We will refer to performanceinterchangeably with traffic handling characteristics of such systems from this point on.
Traffic handling measures are either quantitative or qualitative. Two types of measures arise: thoseoriented toward customers or users of the system, and those oriented toward the system as a whole.Each of these measures has its’ own costs.
1.5.1 Customer Oriented Goals, Inputs and Outputs >From the point of view of a customer or user ofa system, we might be interested in the time delay (both execution and waiting) for each step of eachjob: from arrival, to the initial wait for service, through service, and the final clean up prior tocompletion. Service might involve some work to set up a job (e.g., handle an appropriate interrupt of aprocessor), followed by execution of the job (e.g., processing followed by input/output to secondarystorage followed by processing and so forth), followed by clean up (e.g., handle an appropriate interruptof a processor). The time epochs of interest are the arrival or ready time of a job, the job completiontime, the desired completion time or due time or window or deadline.

-- --
6 PERFORMANCE ANALYSIS PRIMER CHAPTER 1
>From these statistics we could compute for each job its
• queueing or flow time--time from arrival until completion
• waiting or ready time--time to start processing less arrival time
• lateness--actual completion time minus desired completion time
• tardiness--maximum of zero and lateness
Can you think of any more? These are summarized in the figure below:
Figure 1.5.Illustrative Time Epochs for Processing a Job
For each measure or time interval, there would be a cost attached, which would reflect economic criteria.We could compute these for each step of each job submitted by each user. This can be quite complex,and instead we might compute a statistic, such as the average cost, averaged over all jobs by all usersover time.
1.5.2 System Oriented Goals, Inputs and Outputs >From the point of view of the system as a whole,we might wish to record over a given time interval
• The fraction of time each resource is busy doing work
• The mean throughput rate of executing jobs: the mean number of jobs executed in a given timeinterval
• The fraction of time two resources are simultaneously busy (in order to see how many steps arebeing executed concurrently)
In our previous example, we would be interested in
• The fraction of time each operator is reading, thinking and typing
• The fraction of time the system is busy executing work
• The mean throughput rate of executing jobs
• The fraction of time at least two operators are busy
• The fraction of time the system plus at least one operator is busy
For each resource, we could attach a cost for being idle, and compute the cost per resource for eachuser, or compute a statistic such as the average cost due to a resource being idle, averaged over all jobsand all users and over time.

-- --
CHAPTER 1 INTRODUCTION 7
1.6 An Example (Revisited)
Let’s calculate as many performance measures as possible for our previous example: operators atterminals only doing one type of job, reading and thinking and typing followed by waiting for aresponse for the system. We will compute these exactly for one operator using the system, and then usethis to bound performance with more than one operator, which is really the region of interest.
1.6.1 One Operator What is the response time for one operator? This is given by
mean response time for one terminal = Tresponse = Tsystem
The rate at which work is executed by the system is the reciprocal of the mean time to completely cyclethrough a job. There are only two steps, and hence the mean throughput rate is given by
mean throughput rate for one terminal =Tthink + Tsystem
1_ ____________
For example, if the mean time spent reading, thinking, and typing is fifteen seconds, while the meanresponse time is one second, then we see
mean response time for one terminal = Tsystem = 1 second
mean throughput rate for one terminal =Tthink + Tsystem
1_ ____________
=15 sec + 1 sec
1_ ____________ = 1 command every 16 seconds
What is the utilization of the operator, the fraction of time an operator is busy?
operator utilization =Tthink + Tsystem
Tthink_ ____________ =15 sec + 1 sec
15 sec_ ____________ =1615_ __
What is the utilization of the system, the fraction of time the system is busy?
system utilization =Tthink + Tsystem
Tsystem_ ____________ =15 sec + 1 sec
1 sec_ ____________ =151_ __
What is the fraction of time both the operator and the system are simultaneously busy? Zero!
1.6.2 Two Operators If two operators were using this system for command execution, what changes?The best the mean response time could ever be would be as if each operator were using the systemseparately. Hence, we see a lower bound on mean response time given by
mean response time with two terminals ≥ Tsystem = 1 sec
The worst the mean response time could ever be would be to have one operator submit a job andimmediately thereafter have the other job submitted, which gives us a upper bound on mean responsetime:
mean response time with two terminals ≤ 2Tsystem = 2 sec
If we summarize all this, we find
Tsystem ≤ Tresponse ≤ 2Tsystem two terminals
The definition of mean throughput rate is simply the rate at which each operator is doing work,multiplied by the total number of operators. Each operator spends some time reading, thinking, andtyping, and then waits for a response, so the mean throughput rate for each operator is
mean throughput rate per operator =Tthink + Tresponse
1_ _____________
The upper bound on mean response time gives us a lower bound on mean throughput rate:

-- --
8 PERFORMANCE ANALYSIS PRIMER CHAPTER 1
mean throughput rate per operator ≥Tthink + 2Tsystem
1_ _____________
The lower bound on mean response time gives us an upper bound on mean throughput rate:
mean throughput rate per operator ≤Tthink + Tsystem
1_ ____________
For the total system, with two operators we have twice the mean throughput rate of one operator:
λlower ≤ total system mean throughput rate ≤ λupper
λlower =Tthink + 2Tsystem
2_ _____________ = 2 commands every 17 seconds
λupper =Tthink + Tsystem
2_ ____________ = 2 commands every 16 seconds
What is the utilization of each operator? The fraction of time each operator is busy is the mean rateeach operator does work multiplied by the mean time spent reading, thinking and typing:
operator utilization = mean throughput rate per operator × Tthink
Since we have upper and lower bounds on mean throughput rate, we have upper and lower bounds onoperator utilization. What is the system utilization?
system utilization = total mean throughput rate × Tresponse
Since we have upper and lower bounds on mean throughput rate and response time, we have upper andlower bounds on system utilization.
What about bounding other measures of concurrency?
• The fraction of time both operators are busy reading, thinking and typing and the system is idle
• The fraction of time one operator is reading, thinking and typing and the other operator is waitingfor the system to respond
• The fraction of time both operators are waiting for the system to respond
EXERCISE: Explicitly calculate bounds on each of these measures.
1.6.3 N>2 Operators What happens if we increase the number of operators more and more? At somepoint the system will be completely busy doing work, and this will occur at
total mean throughput rate =Tsystem
1_ _____ = 1 command every second N →∞
This is a different upper bound from the upper bound on mean throughput rate we just found. Our firstupper bound was due to how the system was used by operators, while this upper bound is intrinsic tothe system. One way to measure this is to always have a command ready to be executed. Once acommand finishes execution, another command is immediately started in execution. Every system willhave a maximum rate at which it can execute jobs, and this is a key performance measure. We combineboth upper bounds in one expression:
mean throughput rate ≤ λupper = min Tsystem
1_ _____,Tthink + Tresponse
N_ _____________
As we vary the number of active operators or terminals, N =1,2.., the upper bound on mean throughputrate exhibits a breakpoint (denoted Nbreakpoint terminals or users) as a function of N , moving from anoperator limited regime to a system limited regime. The breakpoint marks that value of N for which thetwo upper bounds equal one another:

-- --
CHAPTER 1 INTRODUCTION 9
Tthink + Tsystem
Nbreakpoint_ ____________ =Tsystem
1_ _____ Nbreakpoint =Tsystem
Tthink + Tsystem_ ____________
Below this breakpoint, the terminals and operators cannot generate enough work to drive the system tocontinuously execute commands. Above this breakpoint, the system is continuously busy, and theoperators are experiencing delays. This suggests the notion of a bottleneck: a resource that iscompletely busy. The terminals and operators are a bottleneck, provided the number is less than thebreakpoint, and otherwise the system is a bottleneck. This breakpoint is a different measure ofconcurrency.
The mean response time is related to the mean throughput rate via the definition of mean throughputrate. A job is either with an operator (who is thinking) or inside the system (being executed):
total mean throughput rate =Tthink + Tresponse
N_ _____________
If we solve for the mean response time (which is a function of the number of terminals, among otherthings), we find
Tresponse =total mean throughput rate
N_ _______________________ − Tthink
On the one hand, the worst the mean response time could be is to be the last job to be done, after all theother operators submit jobs:
Tresponse ≤ NTsystem
This gives us a lower bound on mean throughput rate:
total mean throughput rate ≥Tthink + NTsystem
N_ _____________
On the other hand, the best the mean response time could be is to be equal to the response time for oneterminal:
Tresponse ≥ Tsystem
Since the mean throughput rate can be upper bounded by two different expressions, we have twopossible lower bounds on mean response time, and we will choose the larger of the two:
Tresponse ≥ max Tsystem ,NTsystem − Tthink
These upper and lower bounds on mean throughput rate are plotted in the figure below versus number ofactive operators. Figure 1.7 plots upper and lower bounds on mean response time versus number ofactive operators.
1.6.4 Stretching Factor Ideally, as we increase the number of terminals, the mean throughput rateincreases, while the mean response time stays low. Unfortunately, at some point the mean response timewill grow, and the mean throughput rate will saturate. This suggests writing the mean throughput rateas the product of two factors, one that is a dimensionless stretching factor and one that is the ideal meanthroughput rate, N times the mean throughput rate for one terminal:
mean throughput rate =Tthink + Tresponse
N_ _____________
= stretching f actor ×N mean throughput for N =1
mean throughput rate for N >1_ __________________________
By definition, we see
stretching f actor =mean throughput rate for N ≥1
N mean throughput rate for N =1_ _____________________________
The upper and lower bounds on mean throughput rate for the system give us upper and lower bounds onthe stretching factor:

-- --
10 PERFORMANCE ANALYSIS PRIMER CHAPTER 1
Figure 1.6.Upper and Lower Bounds on Mean Throughput Rate
Figure 1.7.Upper and Lower Bounds on Mean Response Time
stretching f actor ≥Tthink + NTsystem
NTsystem_ _____________
stretching f actor ≤ Tthink + Tsystem
NTsystem_ ____________
1N ≥ Nbreakpoint
N ≤ Nbreakpoint
The upper bound on stretching factor grows linearly with the number of active terminals, i.e., it stretchesproportional to N . Ideally, we want no stretching, i.e., a stretching factor of unity.
1.6.5 Additional Reading
[1] E.Arthurs, B.W.Stuck, Upper and Lower Bounds on Mean Throughput Rate and Mean Delay inQueueing Networks with Memory Constraints, Bell System Technical Journal, 62 (2), 541-581(1983).

-- --
CHAPTER 1 INTRODUCTION 11
[2] H.Hellerman, T.F.Conroy, Computer System Performance, McGraw Hill, NY, 1975.
1.7 The Two Fundamental Approaches to Achieving Desirable Performance
The previous example shows the following: there are only two fundamental approaches to achieve adesired level of performance in a computer communication system.
1.7.1 Execution Time Speeding up one or more steps of a job, or reducing the execution time of one ormore steps, is one way to impact performance. Recoding an application program, reducing the amountof disk input/output or terminal character input/output are examples of application program speedchanges. Replacing a processor with a faster processor, or a data link with a faster data link areexamples of hardware speed changes.
1.7.2 Concurrency and Parallelism At a given instant of time, there are a given number of jobs in thesystem that are partially executed, which are said to be concurrently in execution. In particular, acertain number of the jobs concurrently in execution can in fact be actively in execution, and these jobsare said to be executing in parallel. The greater the number of jobs actively in execution, the greater theimpact on performance. This will be the central theme for the remainder of the book. Note that theexecution time of each step of a job need not be reduced, so the total time to complete a job is thesame, but the total number of jobs per unit time that can be executed can be increased. A singleprocessor handling multiple terminals doing program development is an example of logically concurrentexecution of multiple jobs: at any instant of time, only one job is running on the processor, but there canbe many jobs partially executed in the system. An operating system that can support multiple diskspindles off multiple controllers doing independent parallel data transfers is an example of parallelismor physical simultaneous execution of multiple jobs.
1.8 Layered Models of Computer and Communication Systems
Layers accomplish two things:
• They allow us to deal with a subsystem internals in one way, and design this to meet a set of goals
• They allow us to deal with a subsystem externals (for handling input and output to other subsystems)in a different way from the internals and design this to meet a different set of goals
What layers and resources lie inside the box labeled system? One way to answer this is hierarchically,as a series of layers that are peeled away, with resources residing in each layer. Figure 1.8 shows anillustrative layered model of the computer system described earlier:
Figure 1.8.Layered Model of Computer System
In this model we see subsystems labeled
• Hardware--Terminals, processor, memory, input/output handlers, disk controller, disks, tape drives,printers and so forth
• Operating system--A set of programs that control the hardware and make use of it (i.e., the operatingsystem programs reside in secondary disk storage and in main memory and require processor time to

-- --
12 PERFORMANCE ANALYSIS PRIMER CHAPTER 1
run, and so forth)
• Application programs--A set of programs that make use of operating system functions to accomplisha specific application
What are the resources here? Examples might be
• Hardware resources--Processors, memory, disk controller, disk spindle, printer, input/output handler,terminal, cache, floating point accelerator, communications bus
• Operating system resources--Tables, files, events, signals, semaphores, messages, objects, processes,capabilities, pages, segments, partitions
• Application resources--Data base manager, application level transaction manager, communicationsmanager, front end terminal manager, compilers, editors, report generators
Ultimately a resource involves using up hardware, but remember that anything that can block executionof a job is a resource. Many viewpoints of the same thing are often useful here.
1.9 Layers and Performance
Each layer is a candidate for performance analysis. First, we might wish to speed up each:
• Hardware might be too slow for certain jobs and can be replaced with faster hardware with little orno changes to the operating system and application software
• Operating system software might be too slow for certain jobs, and might be changed to speed upcertain system calls that demand a lot of resources (either because they are called frequently orbecause they demand a lot or both)
• Application software might be too slow for certain jobs, and might be recoded to speed up certainareas, to take better advantage of the operating system and hardware
At present, application programs are typically done with serial flow of control, while operating systemprograms typically handle concurrent flow of control: to take better advantage of concurrency of thehardware and software resources, the application programs might be recoded to take better advantage ofthe operating system and hardware.
To improve performance, we might
• Keep the operating system and application software, and replace hardware with faster hardware
• Keep the operating system and hardware, and recode the application to take best advantage of theoperating system with its hardware
• Keep the application software and hardware, and change the operating system (adding more filespace, changing the scheduling algorithm, changing the buffering strategy)
We can aggregate and combine these different layers in talking about performance evaluation. At thehardware level, we might be interested in the maximum mean instruction execution rate, the memoryaccess time per word, and so forth. At the operating system level we might be interested in systemfunctions and time required to execute each on a given hardware configuration. At the application level,we might be interested in taking best advantage of operating system call implemented on a givenhardware configuration.
We have fixed the evaluation interface and the subsystems underneath it in describing performance.This structures our data analysis and allows us to quickly draw cause and effect inferences aboutperformance problems. There is also a need to evaluate each layer by itself, or to evaluate sets of layerstogether: this realm of testing and diagnostics is worthy of independent study by itself, and can be thesubject of more than one book. Here we are suggesting a methodology for representing total systemstate for different purposes: many such state representations are fruitful.

-- --
CHAPTER 1 INTRODUCTION 13
1.10 An Application Program Development View
The figure below shows a flow chart of the types of activities involved in application programdevelopment.
Figure 1.9.Application Program Development Flowchart
First, a program is entered into a computer system using an interactive editor. Next, the program isparsed to see if the syntax matches the rules of the language. If errors are reported, the program isrewritten, and parsed again, until the program successfully passes this stage. Next, machine code isgenerated, and this may produce a variety of new error messages that were not checked by the parser.The program is rewritten, and now this may introduce parsing errors. If the program successfully isparsed and generates executable code, we may wish to make use of optimizing features of the compiler(to reduce the amount of storage and execution time). Again, this step may generate a variety of errors,and cause the program to be rewritten. Finally, we have a program that passes all the rules of parsing,code generation, and optimization. We still might have to rewrite this program, because although it doeswhat we say, it might not do what we mean.
Figure 1.10 is a block diagram summarizing all of these actions.
Figure 1.10.Program Development Block Diagram
1.10.1 Steps and Resources We can construct a step resource table for each activity outlined above.
Table 1.2.Step/Resource Table_ _______________________________________________________ ______________________________________________________Step Programmer Processor TimeType Required Required Symbol Value_ _______________________________________________________ ______________________________________________________
Read, Think 1 0 Tthink 15 secEdit Code 0 1 Tedit 1 secParse Code 0 1 Tparse 1 secGenerate Code 0 1 Tgenerate 30 secOptimize Code 0 1 Toptimize 30 sec

-- --
14 PERFORMANCE ANALYSIS PRIMER CHAPTER 1
Illustrative values of time for each step are shown in the table. Note the great discrepancy between thetime required to handle simple edits and parsing versus to handle code generation and optimization. Tosimplify our analysis, we will aggregate together the steps for parsing, code generation and optimization.Together we call these steps compilation with a total mean time of Tcompile .
1.10.2 Resource Allocation We want to examine the consequences of different schedules or resourceallocation policies about performance measures. We will study
• Executing jobs in the order of submission
• Round robin quantum scheduling
1.10.3 Execution in Order of Arrival There are two different job types, edits and compilations. Wehave a total of N terminals, so the following cases might occur:
• There are no jobs in the system, and so once a job is submitted it immediately runs to completion
• Every other terminal has submitted a job, and we are the last in line.
For the first case, the mean queueing time is simply Tedit or Tgenerate or Toptimize , depending upon whattype of job was submitted. For the second case, the mean queueing time is as small as NTedit if all jobsare edits, or as big as NTgenerate if all jobs are compilations.
The variation in response time can be huge: if an edit command was last in line, and all the othercommands were compilations, a relatively quickly executing command would have to wait for manyvery long commands, and this might be unacceptable!
1.10.4 Execution via Quantum Round Robin Scheduling This schedule executes a job for a maximumamount of time called a quantum, and either the job finishes or it goes to the end of the queue where itwill get another shot, until eventually it finishes. This is shown in the queueing network block diagrambelow:
Figure 1.11.Round Robin Queueing Network Block Diagram
Let’s look at two cases, as before:
• There are no other jobs in the system, and provided nothing more arrives, a job will run until it isexecuted
• All the other terminals have submitted commands, and we are last in line
For the first case, the mean response time is Tedit or Tcompile , depending upon the command type. Forthe second case, caution is needed. If the quantum is set equal to Tedit , then if we have submitted anedit, it will complete at NTedit , even if all the other commands were compilations; each of the othercommands would only get one quantum of time. On the other hand, if the quantum is set to Tcompile ,then if we had an edit command and all the other commands were compilations we would wait for(N −1)Tcompile + Tedit for a response, much much greater than for our first choice of quantum.

-- --
CHAPTER 1 INTRODUCTION 15
1.10.5 Summary For this particular example, where we have a huge variation in the execution time ofjobs, with short jobs being much more urgent than long jobs, and where we do not know whether acommand will be short or long, quantum round robin scheduling with the quantum set at Tedit can offershort response to short commands, while long commands take a long time.
If we set the quantum to Tcompile , then we are executing jobs in order of arrival, and encounter hugevariations in response time.
Note that if all jobs took the same amount of time, then we would set the quantum equal to that amount,and execute jobs in order of arrival.
1.10.6 Additional Reading
[1] A.V.Aho, J.D.Ullman Principles of Compiler Design, Addison Wesley, Reading, Massachusetts,1977.
[2] L.Kleinrock, Queueing Systems, Volume II: Computer Applications, Wiley, NY, 1976.
1.11 Local Area Network Interfaces
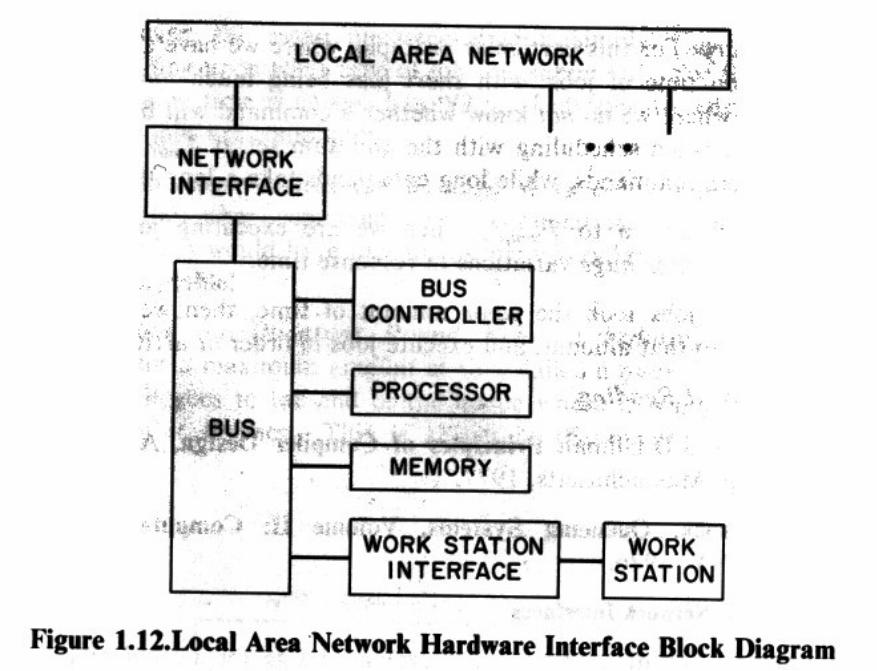
The hardware block diagram below shows one design for a local area network interface between a localarea network and a work station. The interface resources are a local bus that interconnects the workstation interface (called here the bus interface unit or BIU) to the network interface unit (NIU), a buscontroller to determine which device gains access to the bus, plus a local processor with memory forbuffering bursts of data (either from the work station to the network or vice versa).
Figure 1.12.Local Area Network Hardware Interface Block Diagram
The steps involved in transferring data from the work station out over the local area network aresummarized in the figure below.
The steps involved in data transfer are summarized in the table below:
Table 1.3.Work Station/Local Network Data Transfer_ ______________________________________________________________ _____________________________________________________________Step Resources Time
Number Bus Processor Memory NIU BIU Interval_ ______________________________________________________________ _____________________________________________________________WS->BIU 1 0 0 0 1 TWS →BIU
BIU->MEM 1 0 1 0 1 TBIU →MEM
Process 1 1 1 0 0 Tprocess
MEM->NIU 1 0 1 1 0 TMEM →NIU

-- --
16 PERFORMANCE ANALYSIS PRIMER CHAPTER 1
Figure 1.13.Work Station to Local Area Network Data Transfer
As is evident, more than one resource must be held at each step of execution of this type of job.
What is the maximum rate of executing network accesses?
• If the work station is completely busy transferring data to the bus interface unit, then
maximum mean throughput rate =TWS →BIU
1_ _______
• If memory is completely busy, then
maximum mean throughput rate =TBIU →MEM + TMEM →NIU
1_ ____________________
• If the processor is completely busy, then
maximum mean throughput rate =Tprocessor
1_ _______
• If the network is completely busy, then
maximum mean throughput rate =TMEM →NIU
1_ _________
The smallest of these, the one that becomes completely busy first, we call the bottleneck resource. Inany system, there will be some bottleneck; the design question is to choose where it should be, while theanalysis question is to find it.
1.12 A Communications System Example
A different type of layering model that is being widely used is the Open Systems Interconnection (OSI)architecture of the International Standards Organization, shown in the figure below.
In the figure, we show the seven layers of the model, plus an illustrative example of the flow of controland data to move a file from one system to another. The layers are as follows:
[1] Hardware level--Specifications of voltages, currents, media, waveforms, timing, and packaging.
[2] Frame or message level--Specifications of the meaning of each bit within a frame or packet ofbits, signifying either control (source and destination address, priority, error detecting orcorrecting code) and data.

-- --
CHAPTER 1 INTRODUCTION 17
Figure 1.14.Open Systems Interconnection Architecture
[3] Link level--Multiple transmitters and receivers send frames to one another over a logicalabstraction of a physical circuit called a virtual circuit.
[4] Transport level--Multiple transmitters and receivers send packets or frames to one another overone or more logical circuits.
[5] Session level--Controlling initiation, data transfer, and completion clean up of a communicationsession.
[6] Presentation level--Conversion of an application program protocol to a session level protocol.
[7] Application level--Description of application program behavior.
In the illustrative example, a file is transferred from one system to another as follows:
[1] An application program is accessed from a terminal to begin the process
[2] A chain of commands is retrieved from a local disk to control communication over a link
[3] Communications software controls initial access to the link and sends a request over the link tothe appropriate application in the other system
[4] The desired file is retrieved from secondary storage
[5] The file is transferred from one application to another via the link
[6] The application program notifies the operator the file has been retrieved
[7] The application program stores the file in local disk space
At each step, in order to say anything concerning performance, we would need to specify whatresources, software and hardware, are required for each step, for what time interval, along with a policyfor arbitrating contention for shared resources. Questions concerning the physical location of text anddata can only be answered by describing both the system operation and the staff or people operations.
What are the resources for this system?
[1] Hardware Level--Processor, memory, and bus time
[2] Frame or message level--Source and destination address tables
[3] Link level--Packet sequence numbers with associated priorities

-- --
18 PERFORMANCE ANALYSIS PRIMER CHAPTER 1
[4] Transport level--Network name tables, virtual circuit tables
[5] Session level--Number of sessions outstanding
[6] Presentation level--Table of each protocol conversion in progress
[7] Application level--Table of number of in progress communications
To be explicit, we suppose that there are two different computer systems, labeled A and B each withtheir own processor and disk for handling this scenario. The table below is a summary of the steps andresources required for the file transfer shown earlier:
Table 1.4.Step/Resource Summary_ _____________________________________________________________ ____________________________________________________________Step CPU A DISK A LINK CPU B DISK B Time_ _____________________________________________________________ ____________________________________________________________
Start 1 0 0 0 0 Tstart
Load 1 1 0 0 0 Tload
Request 1 0 1 1 0 Trequest
Retrieve 0 0 0 1 1 Tretrieve
Transmit 1 1 1 1 1 Ttransmit
Notify 1 0 0 0 0 Tnoti f y
Store 1 1 0 0 0 Tstore
What is the maximum mean throughput rate, denoted by λupper , of doing file transfers?
• If CPU A is a bottleneck, then the maximum mean throughput rate is given by
λupper =Tstart + Tload + Trequest + Ttransmit + Tnoti f y + Tstore
1_ _________________________________________
• If disk A is a bottleneck, then the maximum mean throughput rate is given by
λupper =Tload + Ttransmit + Tstore
1_ ___________________
• If the link is a bottleneck, then the maximum mean throughput rate is given by
λupper =Trequest + Ttransmit
1_ ______________
• If CPU B is a bottleneck, then the maximum mean throughput rate is given by
λupper =Trequest + Tretrieve + Ttransmit
1_ ______________________
• If disk B is a bottleneck, then the maximum mean throughput rate is given by
λupper =Tretrieve + Ttransmit
1_ ______________
Communication link data rates are only one component in controlling the maximum mean throughputrate: the processors and disks at either end can also be important.
EXERCISE: What happens if we have only one processor and one disk?
1.12.1 Additional Reading
[1] A.Tanenbaum, Computer Networks, pp.15-21, Prentice-Hall, Englewood Cliffs, New Jersey,1981.
[2] F.D.Smith, C.H.West, Technologies for Network Architecture and Implementation, IBMJ.Research and Development, 27 (1) 68-78 (1983).
1.13 Operating System Performance
An operating system is a set of logically concurrently executing programs. An operating system runs ona given hardware configuration and provides services to application programs.

-- --
CHAPTER 1 INTRODUCTION 19
1.13.1 Hardware Configuration We assume that the hardware configuration consists of one processorwith a fixed amount of memory, a set of terminals that are connected to the processor via a terminalhandler, and one disk. The disk is used for two purposes, to store programs and data that the programsaccess, and for holding programs that cannot be held in main memory, so called swapped programs.
Figure 1.15.Hardware Block Diagram
1.13.2 Application Programs The operating system hides the details of the hardware operations of theprocessor, disk input/output, terminal input/output, and memory administration or management, from theapplication programs, by presenting a set of interfaces called system calls that allow these programs tointeract without knowing the details of the system call implementation. The operating system schedulesor manages or administers the physical and logical resources, which is the crux of performance. Theprograms are virtual processors, and for short are called processes. Each process can be in thefollowing states: ready to run except that the processor is busy with higher priority work, idle, executingor running on the processor, blocked on terminal input/output (waiting for a terminal to respond),blocked on disk input/output (waiting for a disk to respond), or blocked on memory (waiting formemory to become available). This is summarized in Figure 1.17.
Figure 1.16.States of a Process
The operating system, as it schedules each step of each job, would migrate or move each program orprocess around, from one state to another, in the course of execution. The figure below shows one setof processes that might be managed by the operating system: For each state of a process, we can list

-- --
20 PERFORMANCE ANALYSIS PRIMER CHAPTER 1
Figure 1.17.Illustrative Set of Processes Managed by Operating System
the resources required:
Table 1.5.State/Resource Summary_ ________________________________________________________________ _______________________________________________________________State Processor Memory Disk Terminal Mean Time_ ________________________________________________________________ _______________________________________________________________
Idle 0 0 0 0 Tidle
Run 1 1 0 0 Tcpu
Blocked:On Disk I/O 0 1 1 0 Tdisk
On Terminal I/O 0 1 0 1 Tterm
On Memory 0 0 0 0 Tmemory
Different resources are held at different steps. Each job migrates through a network of queues, as shownin Figure 1.18.
Figure 1.18.Operating System Network of Queues
The resources of memory and processor time are allocated sequentially: a process must first be loadedinto memory, and holds this while waiting for the processor, or while waiting for input/output from the

-- --
CHAPTER 1 INTRODUCTION 21
disk.
Processes that are resident in main memory are candidates for being swapped to secondary disk storage.Processes that are swapped out of main memory are candidates for being loaded into main memory.
The policy for determining which processes are resident in main memory and which are not, and fordetermining which processes are executed by the processor and by the disk, are separate from thelogically correct execution of each step of each program.
The maximum mean throughput rate of executing processes can be limited by memory, diskinput/output, terminal input/output, or processor time. Suppose we gathered measurements on the totaltime the system processes were in each state over a given time interval.
• If memory is the bottleneck, then the time spent in the memory blocked state would be the greatest
• If the disk is the bottleneck, then the time spent in the disk blocked state would be the greatest
• If terminal handling is the bottleneck, then the time spent in the terminal blocked state would be thegreatest
• If the processor is the bottleneck, then the time spent in the processor running state would be thegreatest
EXERCISE: Suppose an operating system table contains a list of all active processes. What datashould be gathered to determine if this is limiting performance by simply being set too small?
1.13.3 Additional Reading
[1] A.L.Shaw, Principles of Operating Systems, Prentice-Hall, Englewood Cliffs, NJ, 1974
[2] D.M.Ritchie, K.Thompson, The UNIX TM * Time-Sharing System, Communications of the ACM,17 (7), 365-374 (1974).
[3] K.Thompson, UNIX Implementation, Bell System Technical Journal, 57 (6), 1931-1946 (1978).
[4] D.M.Ritchie, UNIX Retrospective, Bell System Technical Journal, 57 (6), 1947-1870 (1978).
1.14 Processor Design
Many actual processors are made up of networks of smaller processors, as shown in the figure below:
A processor might consist of an arithmetic logic unit, that has three types of memory connected to it:
• General register or so called scratch pad memory connected via a special dedicated bus
• Program counter processor connected via both a special dedicated bus to the processor and via ageneral purpose switch to cache memory
• Cache memory that is much higher speed memory than main memory for hiding recently usedsegments of text and data on the assumption that it is highly likely they will be executed in theimmediate future
The resources here are the arithmetic logic unit, the program counter and general registers, and cachememory, with the switch and switch controller necessary to allow communications between thesedifferent devices.
The flow chart below illustrates how the processor would execute an instruction.
The steps and resources required are summarized in the table below:
__________________
* UNIX is a trademark of Bell Laboratories

-- --
22 PERFORMANCE ANALYSIS PRIMER CHAPTER 1
Figure 1.19.Processor Block Diagram
Figure 1.20.Processor Instruction Execution Flow Chart
Table 1.6.Steps/Resource Summary_ ___________________________________________________________ __________________________________________________________Step PC ALU GR Cache Switch Time_ ___________________________________________________________ __________________________________________________________
Load PC 1 0 0 0 1 TPC
Fetch Instruction 0 1 1 0 1 Tf etch
Decode Instruction 1 1 1 1 0 Tdecode
Fetch Data 0 1 1 1 1 Tdata
Execute Instruction 1 1 1 1 1 Texecute
Store Results 0 1 1 1 1 Tstore
Each of these resources can execute at a maximum rate. The total system mean throughput rate is upperbounded by λupper : As we raise the number of executing programs, one resource will becomecompletely busy first, which will be called the bottleneck.
• If the program counter is a bottleneck, then the maximum mean throughput rate is

-- --
CHAPTER 1 INTRODUCTION 23
λupper =TPC + Tdecode +Texecute
1_ __________________
• If the ALU is a bottleneck, then the maximum mean throughput rate is
λupper =Tf etch + Tdecode + Tdata + Texecute + Tstore
1__________________________________
• The maximum rate at which the general registers can load and unload instructions is
λupper =Tf etch + Tdecode + Toperand + Texecute + Tstore
1_ ____________________________________
• The maximum rate at which the switch can transfer instructions is
λupper =TPC + Tf etch + Tdata + Texecute + Tstore
1_ _______________________________
Based on this analysis, we see that the bottleneck is the switch. This is because the switch is held forthe long time per instruction execution.
EXERCISE: What can be changed to move the bottleneck to the ALU?
1.14.1 Additional Reading
[1] G.Radin, The 801 Minicomputer, IBM J.Research and Development, 27 (3), 237-246 (1983)
[2] G.J.Myers, Advances in Computer Architecture, Second Edition, Wiley, NY, 1982.
[3] H.Lorin, Introduction to Computer Architecture and Organization, Wiley, NY, 1982.
1.15 Text Outline
The problems and chapters in the text are organized along the lines described in the preface.
1.15.1 Introductory Material First, we survey results from deterministic or static scheduling theory.All of the work that must be executed is present at an initial time; we wish to study differentconfigurations and schedules to see how long it takes to finish all the work. The intent is to get used tosystematically described computer communication system operation: for each step, what resources arerequired, for how long. This occurs in practice in telephone call processing, discrete manufacturing, anddata communications: a list of work is scanned at the start of a clock cycle and all the work must befinished before the clock begins its next cycle.
Following this, data analysis and simulation is surveyed. This is a mandatory step in verifying selfconsistency and having credibility in performance analysis. In order to summarize data with a model,measurements must be gathered, and evidence presented showing how well the data fits the model.Many would argue the issue of data interpretation is the crux of performance analysis.
Next, we study the long term time averaged behavior of systems that execute jobs requiring multipleresources at each step of execution. An example would be a job that requires both a processor and agiven amount of memory and a given set of files. Both the mean throughput and mean delay per job arestudied for different hardware and software configurations and for different scheduling policies. Theconcluding section reinforces this analysis with a series of examples drawn from office communicationsystems: case studies, starting from models of simple everyday situations and building up to morerealistic and complex situations.
1.15.2 Jackson Networks Next additional modeling assumptions or restrictions are made beyond justmeans or averages, which lead to so called Jackson queueing network models. These assumptions yieldsharper performance bounds on computer communication systems than mean values. Case studies arestudied, starting from the simple and proceeding to the more realistic and complicated. Each case isanalyzed first via mean values alone, and then refined using Jackson network models.

-- --
24 PERFORMANCE ANALYSIS PRIMER CHAPTER 1
1.15.3 Priority Scheduling In a computer communication system typically one resource is limiting themaximum mean throughput rate of completing work, and this is called the bottleneck. Here we study indetail how to effectively schedule work at the bottleneck resource in order to ameliorate delay, usingpriority arbitration. We will make much stronger assumptions about the system statistical behavior herethan we did in earlier sections, and we will display much greater variety and accuracy (not just meansbut variances and even statistical distributions) in the phenomena we will deal with.
1.16 Additional Reading
[1] D.Ferrari, Computer System Performance Evaluation, Prentice-Hall, Englewood Cliffs, N.J.,1978.
[2] U.Grenander, R.F.Tsao, Quantitative Methods for Evaluating Computer System Performance: AReview and Proposals, in Statistical Computer Performance Evaluation, W.Freiberger (editor),Academic Press, NY, 1972.
[3] H.Lorin, Parallelism in Hardware and Software, pp.3-44, Prentice-Hall, Englewood Cliffs, NJ,1972.
[4] M.Phister, Jr., Data Processing Technology and Economics, Second Edition, Digital Press,1979.

-- --
CHAPTER 1 INTRODUCTION 25
Problems
1) A data communications system consists of a single transmitter, a noisy link, and a single receiver.The transmitter sends ones and zeros (bits) over the link. Each bit is equally likely to be transmittedcorrectly a given fraction of time, 1−P , and to be incorrectly transmitted a given fraction of time P , dueto noise corrupting the transmission. The diagram below summarizes all this:
Figure 1.21.Bit Transmission Probabilities
Determine the data transmission rate, measured in successfully transmitted bits per second, of each ofthe following communications systems
A. A three hundred bit per second data link that requires retransmission of one bit in every tenthousand (P=0.0001) due to noise; repeat for retransmission of one bit in every one hundred due tonoise
B. A ninety six hundred bit per second data link that requires retransmission of one bit in every tenthousand due to noise; repeat for retransmission of one bit in every one hundred due to noise
C. A courier delivery service that takes a twenty four hundred foot magnetic tape containing sixteenhundred bits per inch of tape and will deliver it five thousand miles away in twenty four hours;repeat if the tape contains six thousand two hundred and fifty bits per inch
D. A courier delivery service that takes a one hundred megabyte magnetic disk pack and will deliverit five thousand miles away in twenty four hours; repeat for a five hundred megabyte magneticdisk pack
2)* Imagine you have trained your St.Bernard, Bernie, to carry a box of three floppy disks, eachcontaining a quarter of a million bytes. The dog can travel to your side, wherever you are, at eighteenkilometers per hour. For what range of distances does Bernie have a higher data rate than a twelvehundred bit per second noiseless data link? Repeat for the case where Bernie can carry a single tenmegabyte disk pack.
__________________
* A.S.Tanenbaum, Computer Networks, p.30, Prentice-Hall, Englewood Cliffs, NJ, 1981.

-- --
26 PERFORMANCE ANALYSIS PRIMER CHAPTER 1
3) A computer system consists of three identical processors, each processor being capable of executing aone second job in one second. The system must execute nine jobs, with the execution times for thesejobs as follows: (3, 2, 2, 4, 4, 2, 9, 4, 4).
A. If the jobs are selected for execution in the above order, how long does it take to completelyexecute all jobs?
B. Can you find an order of execution which reduces the time to completely execute all the jobs? Ifso, how long is it?
4) A computer system consists of a pipeline of N identical processors, with the input job stream goinginto the first processor, the output of the first processor feeding the input of the second processor, and soon:
1 2 3
Figure 1.22.Three Stage (N=3) Processor Pipeline
T (K ) denotes the time, which is constant, required to complete the Kth step of executing a job. Derivethe following results:
A)The time required to completely process one job, T 1:
T 1 =K =1ΣN
T (K )
B)The time required to completely process M jobs, TM :
TM =K =1ΣN
T (K ) + (M −1)K
max T (K ) = T 1 + (M −1)T max T max ≡K
max T (K )
C)The mean throughput rate of executing or processing M jobs in time TM :
mean throughput rate =TM
M_ ___
D)The long term time averaged mean throughput rate M →∞:
long term time averaged mean throughput rate ≡
M →∞lim mean throughput rate for M jobs =
TM
M_ ___
5) The figure below is a hardware block diagram of a multiple processor multiple memory computersystem: Two steps occur for each job:
[1] A processor executes code
[2] Data is fetched from memory
This is summarized in the table below:
Table 1.7.Job Step/Resource Summary_ __________________________________ _________________________________Step Processor Memory Time_ __________________________________ _________________________________1 1 0 Texecute
2 0 1 Tf etch

-- --
CHAPTER 1 INTRODUCTION 27
Figure 1.23.Multiple Processor Multiple Memory Hardware Block Diagram
The hardware configuration for this system consists of three processors and four memories.
A. Draw a queueing network block diagram of this system
B. A total of M jobs can be held in the system at any one time. Plot upper and lower bounds onmean throughput rate and mean delay versus M for Texecute =Tf etch =1
C. Repeat the above for Texecute =3Tf etch =1
D. What is the stretching factor for both cases?
6) The hardware configuration for a word processing system consists of four terminals, a centralprocessor, a disk controller, two disks, a high speed printer and a low speed printer. One terminal isdedicated to express or rush jobs, and uses the high speed printer. The other terminals are dedicated tonormal jobs, and use the low speed printer or, if available, the high speed printer.
A. What are the hardware resources in this system?
B. Make a flow chart for each step required for a normal job. Repeat for a rush job.
C. What are the resources required for each step of a normal job? A rush job?
D. With no contention, what is the mean time to execute a normal job? A rush job?
E. What is the maximum mean throughput rate to execute J normal jobs? J rush jobs?
F. Suppose there are only normal jobs. Plot upper and lower bounds on mean throughput rate andmean delay versus the total number of normal jobs. Repeat if there are only rush jobs.
G. Suppose we fix the mix or fraction of jobs of each type, rush and normal, that the system canexecute at any one time: Frush and Fnormal are the fraction of rush and normal jobs. If we submitJ total jobs and allow J →∞, what resource will become completely busy first?
H. Suppose jobs are executed either in order of arrival or with a quantum round robin scheduler.What are the ranges on mean response time and mean throughput rate for each schedule?
7) The hardware configuration for an order entry system consists of sixteen terminals, four clustercontrollers (one for each four terminals), a dedicated link to a computer, and a computer. The computerhardware configuration consists of a processor, memory, a disk controller, two disks connected to thedisk controller, a printer, and an interface to a data link to a second inventory control computer system.The system operates as follows:

-- --
28 PERFORMANCE ANALYSIS PRIMER CHAPTER 1
• Clerks enter orders at terminals and then wait for the system to respond
• The order is sent by the cluster controller over the data link to the computer
• The computer does some initial processing on the order, and if it is valid, stores it in the secondarydisk storage
• The computer returns control to the operator at the terminal
• At a later point in time, the orders stored in secondary disk storage are retrieved and sent over acommunications line to the inventory control system
Answer the following questions:
A. Make a flow chart of this job work flow
B. Make a table showing the resources required at each step of execution
C. If we ignore the last step of retrieving orders from disk and communicating them to an inventorycontrol system, what is the fastest rate at which orders can be executed?
8) We want to study electronic mail pending performance at the hardware level in more detail. Anoperator at a terminal submits a query, making use of the hardware configuration shown in Figure 1.24.
Figure 1.24.Hardware Block Diagram
The steps involved in mail query are as follows:
• The terminal controller seizes the switch and alerts the processor
• The processor transfers the query from the terminal via the terminal controller through the switch tomemory
• The processor executes the commands associated with mail pending on the data in memory via theswitch
• The processor seizes the switch and accesses the mail pending information which is stored onsecondary storage in a moving head disk
• The processor executes the code associated with this mail pending activity while holding the bus andmemory
• The terminal is notified of the mail pending by the processor seizing the switch and demanding theinformation be transferred from memory to the terminal controller

-- --
CHAPTER 1 INTRODUCTION 29
• The tape controller is seized by the processor via the bus in order to transfer information logging themail pending activity
• At a later point in time the processor will transfer data from the tape to memory via the switch
• The processor will generate a management report on mail activity and transfer this to the printer viathe switch from memory
Answer the following questions:
A. What are the hardware resources?
B. Make a table showing what resources are required at each step and for how long.
C. What is the maximum rate at which mail pending can be executed, assuming nothing else isexecuted?
9) We want to study electronic mail pending performance at a higher level in more detail. The stepsinvolved in checking to see if electronic mail is pending are summarized in the figure below.
Figure 1.25.Electronic Mail Pending Flow Chart
In words, these steps are:
[1] The terminal interacts with the input/output handling routines to generate operating systemactivity
[2] The operating system generates application program activity in turn
[3] The application program retrieves the mail pending from the data base manager

-- --
30 PERFORMANCE ANALYSIS PRIMER CHAPTER 1
[4] The operating system is fed the list of outstanding mail items
[5] The input/output handling routines generate the list of outstanding mail items on the terminal
Answer the following questions:
A. Make up a flow chart for mail pending.
B. The resources available here are hardware, operating system, data base management, andapplication. Verify that the table below is a candidate for showing the resources held at each step:
Table 1.8.Mail Pending Step Resource Summary_ _____________________________________________________________ ____________________________________________________________Step Resource Time
Number Hardware Op Sys Data Base Application Interval_ _____________________________________________________________ ____________________________________________________________1 1 0 0 0 Thardware
2 0 1 0 0 Top sys
3 0 0 0 1 Tapplic
4 0 0 1 0 Tdata base
5 0 0 0 1 Tapplic
6 0 1 0 0 Top sys
7 1 0 0 0 Thardware
C. What is the mean response time with only one terminal using the system? What is the meanthroughput rate with only one terminal using the system?
D. Assuming only mail pending queries are made, what is the maximum mean throughput rate forexecuting this command?


Copyright © 2022 FDOKUMEN