Chapter 4: Testing Hypotheses: Confounds and Controls
11
39 Part 1 / Philosophy of Science, Empiricism, and the Scientific Method Chapter 4: Testing Hypotheses: Confounds and Controls I n this chapter we will outline how we test the hypotheses which we generated from our theory. The scientific method requires that we test our theories by comparing what they predict we will observe to actual observations made in the real world. If our hypotheses are any good, they should predict what we actually see. Multiple Variables and Confounds It would make our life simpler if every effect variable had only one cause, and it covaried only with one other variable. Unfortunately, this is hardly ever the case. Virtually every communication variable we can think of is associated with a number of other variables either in causal relationships or in covariance relationships. For example, the amount of time we spend watching television is determined not only by our income, but also by our age, level of education, our interests, the num- ber of children we have, the variety of programming available to us, alternative ways of spending our leisure time and a host of other variables. Our level of public communication apprehension can be affected by age, training in public speaking, amount of experience in public communication, ego strength, status differences between ourselves and the audience, and many other factors. If we have a number of interrelated variables, then it becomes difficult to sort out how vari- ables affect each other. It’s far too easy to confuse one cause with another, or to attribute all change to a single cause when many causal factors are operating. Similarly, having multiple variables re- Chapter 4: Testing Hypotheses: Confounds and Controls
-
Upload
khangminh22 -
Category
Documents
-
view
0 -
download
0
Transcript of Chapter 4: Testing Hypotheses: Confounds and Controls

39 Part 1 / Philosophy of Science, Empiricism, and the Scientific Method
Chapter 4:
Testing Hypotheses:Confounds and Controls
In this chapter we will outline how we test the hypotheses which we generated from ourtheory. The scientific method requires that we test our theories by comparing what theypredict we will observe to actual observations made in the real world. If our hypotheses are any
good, they should predict what we actually see.
Multiple Variables and ConfoundsIt would make our life simpler if every effect variable had only one cause, and it covaried only
with one other variable. Unfortunately, this is hardly ever the case. Virtually every communicationvariable we can think of is associated with a number of other variables either in causal relationshipsor in covariance relationships. For example, the amount of time we spend watching television isdetermined not only by our income, but also by our age, level of education, our interests, the num-ber of children we have, the variety of programming available to us, alternative ways of spendingour leisure time and a host of other variables. Our level of public communication apprehension canbe affected by age, training in public speaking, amount of experience in public communication, egostrength, status differences between ourselves and the audience, and many other factors.
If we have a number of interrelated variables, then it becomes difficult to sort out how vari-ables affect each other. It’s far too easy to confuse one cause with another, or to attribute all changeto a single cause when many causal factors are operating. Similarly, having multiple variables re-
Chapter 4: Testing Hypotheses: Confounds and Controls

40 Part 1 / Philosophy of Science, Empiricism, and the Scientific Method
lated to each other obscures the nature of covariance relationships: if we observe covariance be-tween two variables, we must question whether they covary because of some real relationship be-tween the variables, or whether the covariance is merely due to the spurious effect of a third con-founding variable, as was illustrated in the previous chapter. Before we can establish that a relation-ship exists between two variables, we have to be able to sort out the effects of all the other variableswhich also may be related to the two.
The process of determining whether a relationship exists between two variables requires firstthat we establish covariance between two variables, as we discussed in the previous chapter. Inaddition to verifying that the two variables change in predictable, non-random patterns, we mustalso be able to discount any other variable or variables as sources of the change. To establish a truerelationship, we must be able to confidently state that we observed the relationship in the real worldunder conditions which eliminated the effects of any other variables.
For example, if we are interested in determining whether there is a real relationship betweenExposure to Movie Violence and the Number of Violent Acts committed by adolescents, then wemust observe these two variables covarying, while simultaneously eliminating the possibility thatthis covariance was produced by other factors. An example of a confounding factor for this relation-ship might be the adolescent’s Predisposition to Aggressive Behavior. Adolescents inclined towardaggression may choose to watch more violent movies than adolescents who are less aggressive, andthey may also be more strongly affected by violent images. In order to conduct a legitimate test ofthe hypothesis which links two variables, we must find ways of controlling for the effects of theconfounding variables.
Graphical examples of the problem are shown in Figures 4-1 and 4-2. In Figure 4-1, we see thatthere are two ways that a person’s Exposure to Movie Violence can covary with Number of Acts ofViolence comitted by that person. There is a direct causal relationship, with movie violence viewingcausing an increase in the number of acts of violence. This is the hypothesis that we’re interested intesting. In this hypothesis, Exposure to Movie Violence is the independent variable and Number ofActs of Violence is the dependent variable.
But there is also a spurious relationship between such Exposure and Violent acts, which isproduced by the confounding variable of Predisposition to Violence.
Chapter 4: Testing Hypotheses: Confounds and Controls

41 Part 1 / Philosophy of Science, Empiricism, and the Scientific Method
Adolescents who are generally more violent are also more likely to select violent movies forviewing. This produces a spurious covariance between the independent and dependent variables.
Since we are observing only the independent (Exposure) and dependent ( # of Acts of vio-lence) variables, we will overestimate the strength of relationship between them. If the true relation-ship is 5 units and the spurious relationship is also 5 units, we will conclude that the independentand dependent variables covary by 10 units. In truth, the real relationship is much smaller. If weignore the confounding variable, we will erroneously conclude that all change in Number of Acts ofViolence is due to the direct action of Exposure to Movie Violence. We erroneously conclude thatwe have strong support for our hypothesis.
Figure 4-2 illustrates an extreme way that an unobserved third variable can mislead us. Here,our original hypothesis is false—there is no relationship between Exposure to Movie Violence andNumber of Acts of Violence. All covariance between the two is the result of the confounding vari-able Predisposition to Violence. Since we observe only the exposure and the acts of violence vari-ables, it appears that they are covarying, so we will incorrectly conclude that we have a modestcausal relation ship between viewing and violence, when we should conclude that there is no rela-tionship.
We obviously must take steps to control all confounding variables, so that we can avoid mak-ing misestimates of the size of relationships, or even drawing the wrong conclusions from our ob-servations. If we do not do so, we risk lending the appearance of scientific truth to falsehoods.Failure to properly control for confounding variables is a common error found in poorly done sci-ence. Critical reading of popular press accounts of “dramatic scientific breakthroughs” often re-veals this error. As true scientists, you must always be skeptical of the results of any study. And thefirst thing you should speculate about when you read a scientific report (in the professional journalsas well as in the popular press) is the possible presence of confounding variables which may haveconfused the researcher’s results.
Chapter 4: Testing Hypotheses: Confounds and Controls

42 Part 1 / Philosophy of Science, Empiricism, and the Scientific Method
Controlling for Confounding VariablesWe’ll introduce another example to illustrate the process of determining what variables to
control, and how to control them. Let’s suppose that we are studying the development of children’slanguage. We know that the age of the child and a whole variety of family interaction variables willaffect both the child’s Vocabulary Size and the complexity of the child’s reasoning processes (whichwe’ll label Cognitive Complexity). However, we’re primarily interested in the relationship betweenCognitive Complexity and Vocabulary Size, and not in family interaction variables.
Identifying Control VariablesLet’s start with a very wide view, and consider the idea that any given variable could poten-
tially be included in our theory. We can first organize this universe of variables and reduce it enor-mously by classifying every variable into one of two categories: Relevant or Irrelevant to the phe-nomenon being investigated. This is the top stage illustrated in Figure 4-3.
The relevant variables are those which have already been shown to be important to understand-ing the phenomenon, or those for which a reasonable case can be made. For instance, if the research
Chapter 4: Testing Hypotheses: Confounds and Controls
43 Part 1 / Philosophy of Science, Empiricism, and the Scientific Method
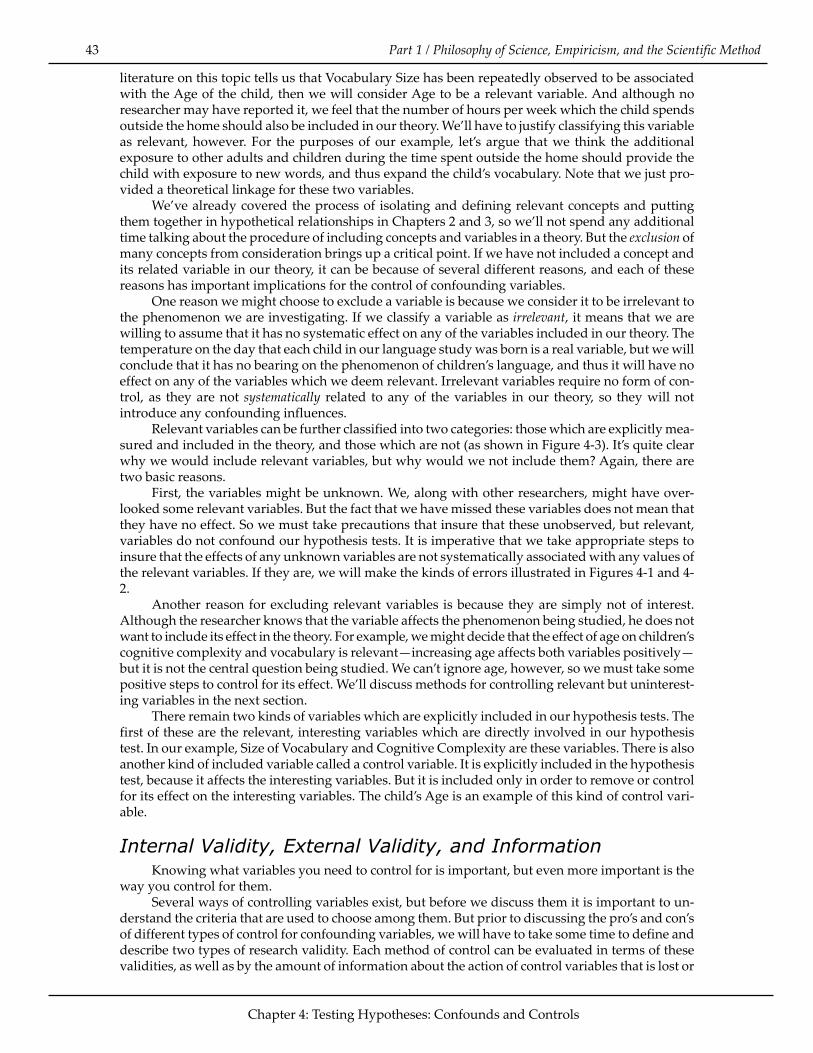
literature on this topic tells us that Vocabulary Size has been repeatedly observed to be associatedwith the Age of the child, then we will consider Age to be a relevant variable. And although noresearcher may have reported it, we feel that the number of hours per week which the child spendsoutside the home should also be included in our theory. We’ll have to justify classifying this variableas relevant, however. For the purposes of our example, let’s argue that we think the additionalexposure to other adults and children during the time spent outside the home should provide thechild with exposure to new words, and thus expand the child’s vocabulary. Note that we just pro-vided a theoretical linkage for these two variables.
We’ve already covered the process of isolating and defining relevant concepts and puttingthem together in hypothetical relationships in Chapters 2 and 3, so we’ll not spend any additionaltime talking about the procedure of including concepts and variables in a theory. But the exclusion ofmany concepts from consideration brings up a critical point. If we have not included a concept andits related variable in our theory, it can be because of several different reasons, and each of thesereasons has important implications for the control of confounding variables.
One reason we might choose to exclude a variable is because we consider it to be irrelevant tothe phenomenon we are investigating. If we classify a variable as irrelevant, it means that we arewilling to assume that it has no systematic effect on any of the variables included in our theory. Thetemperature on the day that each child in our language study was born is a real variable, but we willconclude that it has no bearing on the phenomenon of children’s language, and thus it will have noeffect on any of the variables which we deem relevant. Irrelevant variables require no form of con-trol, as they are not systematically related to any of the variables in our theory, so they will notintroduce any confounding influences.
Relevant variables can be further classified into two categories: those which are explicitly mea-sured and included in the theory, and those which are not (as shown in Figure 4-3). It’s quite clearwhy we would include relevant variables, but why would we not include them? Again, there aretwo basic reasons.
First, the variables might be unknown. We, along with other researchers, might have over-looked some relevant variables. But the fact that we have missed these variables does not mean thatthey have no effect. So we must take precautions that insure that these unobserved, but relevant,variables do not confound our hypothesis tests. It is imperative that we take appropriate steps toinsure that the effects of any unknown variables are not systematically associated with any values ofthe relevant variables. If they are, we will make the kinds of errors illustrated in Figures 4-1 and 4-2.
Another reason for excluding relevant variables is because they are simply not of interest.Although the researcher knows that the variable affects the phenomenon being studied, he does notwant to include its effect in the theory. For example, we might decide that the effect of age on children’scognitive complexity and vocabulary is relevant—increasing age affects both variables positively—but it is not the central question being studied. We can’t ignore age, however, so we must take somepositive steps to control for its effect. We’ll discuss methods for controlling relevant but uninterest-ing variables in the next section.
There remain two kinds of variables which are explicitly included in our hypothesis tests. Thefirst of these are the relevant, interesting variables which are directly involved in our hypothesistest. In our example, Size of Vocabulary and Cognitive Complexity are these variables. There is alsoanother kind of included variable called a control variable. It is explicitly included in the hypothesistest, because it affects the interesting variables. But it is included only in order to remove or controlfor its effect on the interesting variables. The child’s Age is an example of this kind of control vari-able.
Internal Validity, External Validity, and InformationKnowing what variables you need to control for is important, but even more important is the
way you control for them.Several ways of controlling variables exist, but before we discuss them it is important to un-
derstand the criteria that are used to choose among them. But prior to discussing the pro’s and con’sof different types of control for confounding variables, we will have to take some time to define anddescribe two types of research validity. Each method of control can be evaluated in terms of thesevalidities, as well as by the amount of information about the action of control variables that is lost or
Chapter 4: Testing Hypotheses: Confounds and Controls
44 Part 1 / Philosophy of Science, Empiricism, and the Scientific Method
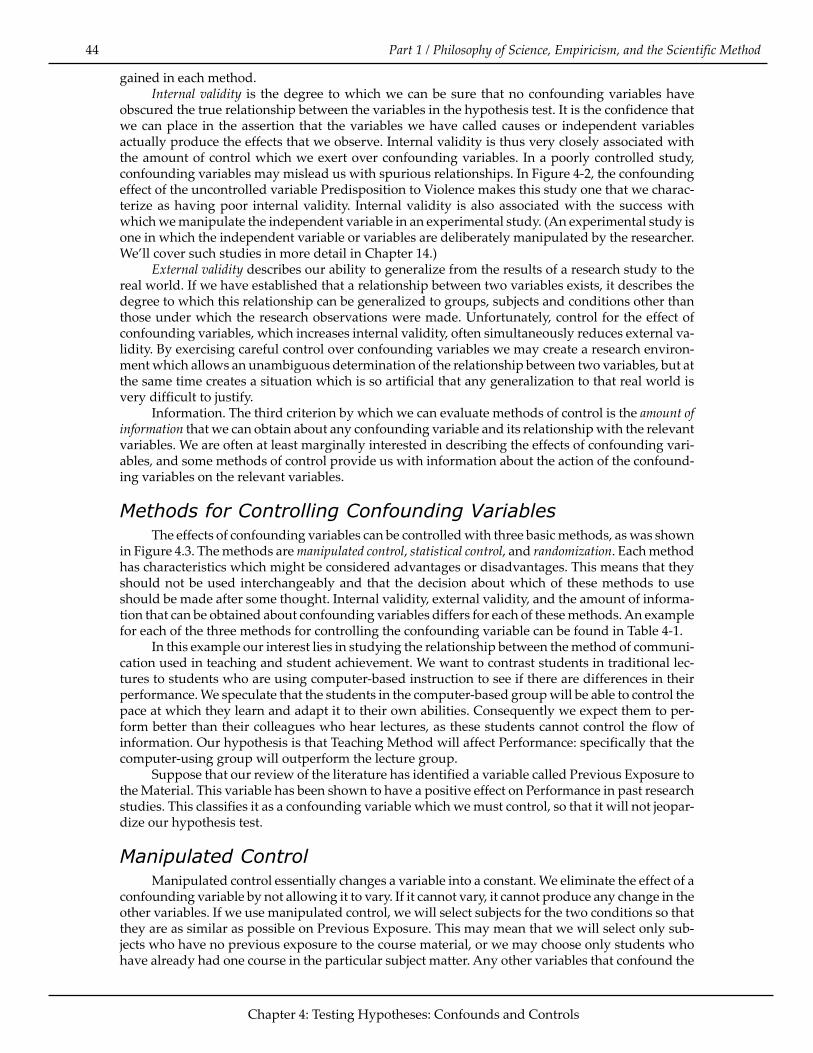
gained in each method.Internal validity is the degree to which we can be sure that no confounding variables have
obscured the true relationship between the variables in the hypothesis test. It is the confidence thatwe can place in the assertion that the variables we have called causes or independent variablesactually produce the effects that we observe. Internal validity is thus very closely associated withthe amount of control which we exert over confounding variables. In a poorly controlled study,confounding variables may mislead us with spurious relationships. In Figure 4-2, the confoundingeffect of the uncontrolled variable Predisposition to Violence makes this study one that we charac-terize as having poor internal validity. Internal validity is also associated with the success withwhich we manipulate the independent variable in an experimental study. (An experimental study isone in which the independent variable or variables are deliberately manipulated by the researcher.We’ll cover such studies in more detail in Chapter 14.)
External validity describes our ability to generalize from the results of a research study to thereal world. If we have established that a relationship between two variables exists, it describes thedegree to which this relationship can be generalized to groups, subjects and conditions other thanthose under which the research observations were made. Unfortunately, control for the effect ofconfounding variables, which increases internal validity, often simultaneously reduces external va-lidity. By exercising careful control over confounding variables we may create a research environ-ment which allows an unambiguous determination of the relationship between two variables, but atthe same time creates a situation which is so artificial that any generalization to that real world isvery difficult to justify.
Information. The third criterion by which we can evaluate methods of control is the amount ofinformation that we can obtain about any confounding variable and its relationship with the relevantvariables. We are often at least marginally interested in describing the effects of confounding vari-ables, and some methods of control provide us with information about the action of the confound-ing variables on the relevant variables.
Methods for Controlling Confounding VariablesThe effects of confounding variables can be controlled with three basic methods, as was shown
in Figure 4.3. The methods are manipulated control, statistical control, and randomization. Each methodhas characteristics which might be considered advantages or disadvantages. This means that theyshould not be used interchangeably and that the decision about which of these methods to useshould be made after some thought. Internal validity, external validity, and the amount of informa-tion that can be obtained about confounding variables differs for each of these methods. An examplefor each of the three methods for controlling the confounding variable can be found in Table 4-1.
In this example our interest lies in studying the relationship between the method of communi-cation used in teaching and student achievement. We want to contrast students in traditional lec-tures to students who are using computer-based instruction to see if there are differences in theirperformance. We speculate that the students in the computer-based group will be able to control thepace at which they learn and adapt it to their own abilities. Consequently we expect them to per-form better than their colleagues who hear lectures, as these students cannot control the flow ofinformation. Our hypothesis is that Teaching Method will affect Performance: specifically that thecomputer-using group will outperform the lecture group.
Suppose that our review of the literature has identified a variable called Previous Exposure tothe Material. This variable has been shown to have a positive effect on Performance in past researchstudies. This classifies it as a confounding variable which we must control, so that it will not jeopar-dize our hypothesis test.
Manipulated ControlManipulated control essentially changes a variable into a constant. We eliminate the effect of a
confounding variable by not allowing it to vary. If it cannot vary, it cannot produce any change in theother variables. If we use manipulated control, we will select subjects for the two conditions so thatthey are as similar as possible on Previous Exposure. This may mean that we will select only sub-jects who have no previous exposure to the course material, or we may choose only students whohave already had one course in the particular subject matter. Any other variables that confound the
Chapter 4: Testing Hypotheses: Confounds and Controls

45 Part 1 / Philosophy of Science, Empiricism, and the Scientific Method
hypothesis test can be treated in the same manner. If we can hold all confounding variables constant,we can be confident that any difference in Performance observed between the two groups is indeeddue to the different teaching methods, as it could not have been due to the other variables. Thisgives us high internal validity for the study.
We can exert manipulated control outside of a laboratory or experimental setting, too. Forexample, suppose that we are going to conduct a survey to determine whether there might be arelationship between the amount of information that a person recalls from Army recruiting com-mercials and his/her willingness to enlist. An obvious confounding variable in this relationship isage. This variable is probably related to recall of recruiting appeals because older audience mem-bers are less likely to watch such commercials (they are irrelevant to a senior citizen), so they will beless likely to remember information from them, as well as being less likely to enlist. Furthermore,younger viewers might be more willing to give up several years to serve in the Armed Forces, andthey may also pay more attention to the commercials. If these things happen, we will confuse theeffect of Age with the effect of the commercials. To prevent this, we might control the confoundingvariable Age by selecting only 17 to 19-year-olds to participate in our survey.
Another form of manipulated control is called matching subjects. Subjects are placed into re-search groups on the basis of equality on a number of characteristics, like age, sex, income, maritalstatus, or any other set of variables which we think might confound the hypothesis tests. This en-sures there are equal proportions of high and low income, married and unmarried, female and maleparticipants in all research groups. By forcing all groups to be identical on the matched characteris-tics, the effects of these variables are made constant in all research groups, and thus cannot con-found the relationship being tested.
Manipulated control favors internal validity. But as the number of variables that we controlincreases, external validity generally decreases. In the computer instruction example, if the Previ-ous Exposure variable is controlled at “one previous course” and we find positive results for com-puter-based instruction, we can’t say with any confidence that the same difference would exist forstudents with “no previous exposure” or “two previous courses”. We can’t generalize the results ofour research as widely, so external validity is reduced. Likewise, if we find certain advertising ap-peals to be associated with intention to enlist for 17 to 19-year olds, we can’t be sure that the sameappeals will stimulate enlistment among 21-year-olds.
Manipulated control prevents the controlled variables from having any effect on the depen-dent variable. As a consequence we will not find out what magnitude of effect (if any) these vari-ables will have on the dependent variable. We will not find out, for instance, whether previousexperience really affects academic performance in computer-based instruction. We have done theproper thing and controlled for it, since we suspected that it might confound our results, but wedon’t know whether or not it has an effect in the real world.
Statistical ControlWith this method of control, we build the confounding variable into the research design as an
additional measured variable, rather than forcing its value to be a constant. When we test the hy-pothesis, we do so with three (or more) variables, not two: the independent and dependent vari-ables, plus the confounding (or control) variable or variables. The effect of the control variable ismathematically removed from the effect of the independent variable, but the control variable isallowed to vary naturally. We do not hold it constant by deliberately setting its value, as we wouldwith manipulated control.
This process yields additional information about the relationship between the control variableand the other variables. In our computer-based instruction example, we could allow students toparticipate in our study without imposing any requirements about their Previous Exposure to thematerial we are going to teach. Rather than holding this variable constant at some chosen level, aswith manipulated control, we will measure Previous Exposure for each subject and use statisticalprocedures to estimate its effect on student performance, and then to remove this effect from theestimate of the effect of the independent variable.
Table 4-1 shows some hypothetical data from our teaching method example. Statistical controlallows us to determine whether a relationship exists between Teaching Method and Achievementby contrasting the two groups which have instructional methods in common (the two Computergroups) to the two other instructional method groups (the two Lecture groups). The data in Table 4-
Chapter 4: Testing Hypotheses: Confounds and Controls

46 Part 1 / Philosophy of Science, Empiricism, and the Scientific Method
1 show that students in the Computer groups outperform the students in the Lecture groups regard-less of the level of Previous Exposure. In other words, Teaching Method has an effect of its own on theAchievement of students. But we also see that the groups with “Some” Previous Exposure per-formed at a higher level than the two groups with no previous exposure, and that they do thisregardless of instructional method.
Statistical control thus provides us with information about the control variable. In this caseevidence about the relationship between the confounding variable of Previous Exposure and thedependent variable Performance is obtained by contrasting the two “None” groups to the two “Some”groups.
We can conclude that Previous Exposure (the control variable) is related to Performance (thedependent variable) and that the nature of the relationship is positive as higher levels of PreviousExposure are associated with higher levels of Performance. The size of the effect of Previous Expo-sure, which reflects the strength of the relationship, is the same as the effect size of Teaching Method.Computer groups scored 10% higher on exams than did lecture groups, regardless of PreviousExposure, and students with more Previous Exposure scored 10% higher than those with none,regardless of the Teaching Method.
If we used statistical control with our other example of research on reactions to recruitmentadvertising, we would ask audience members to state their age. The answers could then be used todetermine whether age is indeed related to recall of advertising themes and to the inclination toenlist as we suspected.
Chapter 4: Testing Hypotheses: Confounds and Controls
47 Part 1 / Philosophy of Science, Empiricism, and the Scientific Method
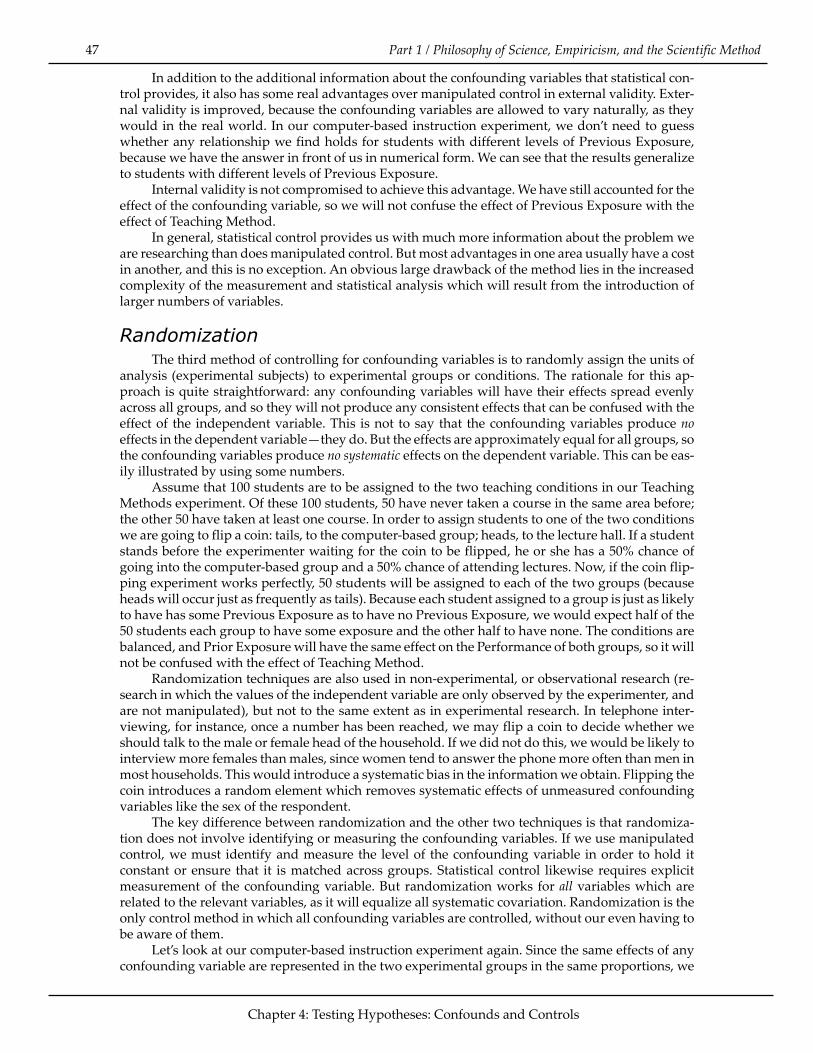
In addition to the additional information about the confounding variables that statistical con-trol provides, it also has some real advantages over manipulated control in external validity. Exter-nal validity is improved, because the confounding variables are allowed to vary naturally, as theywould in the real world. In our computer-based instruction experiment, we don’t need to guesswhether any relationship we find holds for students with different levels of Previous Exposure,because we have the answer in front of us in numerical form. We can see that the results generalizeto students with different levels of Previous Exposure.
Internal validity is not compromised to achieve this advantage. We have still accounted for theeffect of the confounding variable, so we will not confuse the effect of Previous Exposure with theeffect of Teaching Method.
In general, statistical control provides us with much more information about the problem weare researching than does manipulated control. But most advantages in one area usually have a costin another, and this is no exception. An obvious large drawback of the method lies in the increasedcomplexity of the measurement and statistical analysis which will result from the introduction oflarger numbers of variables.
RandomizationThe third method of controlling for confounding variables is to randomly assign the units of
analysis (experimental subjects) to experimental groups or conditions. The rationale for this ap-proach is quite straightforward: any confounding variables will have their effects spread evenlyacross all groups, and so they will not produce any consistent effects that can be confused with theeffect of the independent variable. This is not to say that the confounding variables produce noeffects in the dependent variable—they do. But the effects are approximately equal for all groups, sothe confounding variables produce no systematic effects on the dependent variable. This can be eas-ily illustrated by using some numbers.
Assume that 100 students are to be assigned to the two teaching conditions in our TeachingMethods experiment. Of these 100 students, 50 have never taken a course in the same area before;the other 50 have taken at least one course. In order to assign students to one of the two conditionswe are going to flip a coin: tails, to the computer-based group; heads, to the lecture hall. If a studentstands before the experimenter waiting for the coin to be flipped, he or she has a 50% chance ofgoing into the computer-based group and a 50% chance of attending lectures. Now, if the coin flip-ping experiment works perfectly, 50 students will be assigned to each of the two groups (becauseheads will occur just as frequently as tails). Because each student assigned to a group is just as likelyto have has some Previous Exposure as to have no Previous Exposure, we would expect half of the50 students each group to have some exposure and the other half to have none. The conditions arebalanced, and Prior Exposure will have the same effect on the Performance of both groups, so it willnot be confused with the effect of Teaching Method.
Randomization techniques are also used in non-experimental, or observational research (re-search in which the values of the independent variable are only observed by the experimenter, andare not manipulated), but not to the same extent as in experimental research. In telephone inter-viewing, for instance, once a number has been reached, we may flip a coin to decide whether weshould talk to the male or female head of the household. If we did not do this, we would be likely tointerview more females than males, since women tend to answer the phone more often than men inmost households. This would introduce a systematic bias in the information we obtain. Flipping thecoin introduces a random element which removes systematic effects of unmeasured confoundingvariables like the sex of the respondent.
The key difference between randomization and the other two techniques is that randomiza-tion does not involve identifying or measuring the confounding variables. If we use manipulatedcontrol, we must identify and measure the level of the confounding variable in order to hold itconstant or ensure that it is matched across groups. Statistical control likewise requires explicitmeasurement of the confounding variable. But randomization works for all variables which arerelated to the relevant variables, as it will equalize all systematic covariation. Randomization is theonly control method in which all confounding variables are controlled, without our even having tobe aware of them.
Let’s look at our computer-based instruction experiment again. Since the same effects of anyconfounding variable are represented in the two experimental groups in the same proportions, we
Chapter 4: Testing Hypotheses: Confounds and Controls

48 Part 1 / Philosophy of Science, Empiricism, and the Scientific Method
know that any effect of the confounding variables will be the same in both experimental conditions.Consequently, any difference in Performance observed between the two experimental groups is dueonly to differences in Teaching Method. Since half the students have some Previous Exposure, theywill score an average of 95 in the Computer group and 85 in the Lecture group. But half of each ofthese groups will also be made up of students with no Previous Exposure, who will score 85 and 75,respectively (10% lower, due to the effect of Previous Exposure). So the average score for the Com-puter group will be the average of 25 students who score 95 and 25 students who score 85, for anoverall average score of 90. The overall average score for the Lecture group will be the average of 25students who score 85 and another 25 who score 75, or 80, as illustrated in Table 4-1.
The major advantage of randomization is that we can assume that all confounding variableshave been controlled. Even if we fail to identify all the confounding variables, we will still controlfor their effects. As these confounding variables are allowed to vary naturally, as they would in thereal world, external validity is high for this method of control.
It might appear that randomization also results in high internal validity, but randomization isactually the weakest of the three control methods in this regard. This is the result of an assumptionthat we are forced to make. Since we don’t actually measure the confounding variables, we assumethat randomization produces identical effects from all confounding variables in all groups, and thatthis thus removes any systematic confounding effects of these variables.
But any random process will result in disproportionate outcomes occasionally. If we flip a coin100 times, we will not always see exactly 50 heads and 50 tails. Sometimes we will get 60 heads and40 tails, or even 70 tails and 30 heads. (We’ll cover this in more detail in the next chapter).
Consequently, we have no way of knowing with absolute certainty that the randomizationcontrol procedure has actually distributed identically the effects of all confounding variables. Weare trusting that it did, even though it might not have. By pure chance alone, the coin flip may haveplaced more students with Prior Exposure in the Computer group of our experiment, for example.If this happened, the confounding variable will exert a systematic influence on the dependent vari-able of Performance. This situation gives us a weaker confidence in the internal validity of ourresults. With manipulated control and statistical control, we can be completely confident that theeffects of the confounding variables have been distributed so that no systematic influence can occur,because we can measure the effects of the confounding variable directly. There is no chance in-volved.
A further disadvantage of randomization is that it produces very little information about theaction of any confounding variables. We assume that we have controlled for any effects of thesevariables, but we don’t know what the variables are, or the size of their effects, if, in fact, there areany. As we’ll see in Chapter 12, this lack of information makes our hypothesis test more difficult.The general problem is this: we assume that we’ve eliminated the systematic effects of the confound-ing variables by insuring that these effects are distributed across all values of the relevant variables.But we have not actually measured or removed these effects—the confounding variables will stillproduce change in the relevant variables. This makes it harder for us to observe the true covariancebetween the variables in the hypothesis test, since chance processes may not have distributed theeffects of the confounding variable equally, and the confounding effects may obscure the real effectsof the independent variable.
SummaryMost communication phenomena have more than one cause for any single effect. This means
that more than one cause variable is usually involved in determining the level of any dependent(effect) variable. However, we are usually interested in describing the effect of a single cause vari-able isolated from other confounding variables. If we blindly test for a relationship between a causeand an effect variable without controlling for the effects of the other cause variables which alsoaffect the dependent variable, we will probably reach the wrong conclusions about the nature andstrength of the true relationship. We must control for the effects of all variables which producechanges in the dependent variable before we can accurately describe the relationship between anyone of these variables and the dependent variable.
There are three methods to control for confounding cause variables. The researcher may mea-sure the levels of the confounding variables and design her research so that the confounding vari-ables are held constant. This is manipulated control. Alternatively, she might measure the variables
Chapter 4: Testing Hypotheses: Confounds and Controls

49 Part 1 / Philosophy of Science, Empiricism, and the Scientific Method
and use mathematical manipulations to remove their effects from her estimate of the true relation-ship between the independent variable and the dependent variable. This is statistical control. Finally,she might use research procedures to insure that the effects of all confounding variables are ran-domly distributed across all levels of the independent variable. This is randomization control.
Each of these control methods has advantages and disadvantages when we consider the inter-nal validity, external validity, and amount of information about the controlled variables that themethod produces.
Studies with high internal validity are those in which we can be sure that the true relationshipbetween the independent and dependent variables are not obscured by the confounding variables.Manipulated and statistical control give high internal validity, while randomization control is a bitweaker. However, it has a distinct advantage over the other methods because the confounding vari-ables do not have to described or measured.
Studies with high external validity are those in which the results can be correctly generalized tothe external world. Manipulated control is weak in external validity, while statistical control andrandomization control give good external validity.
Statistical control produces additional information about the size of the effects of the con-founding variables on the dependent variable. The other methods do not provide this information.
Balancing the various advantages and disadvantages of these three methods for controllingfor confounding variables means that the researcher must be very clear about the questions theresearch is to answer. Is internal validity more important than external validity? Can the confound-ing variables be identified and measured? Is information about the relationship between the con-founding variables and the dependent variable useful? Like most decisions, the choice of control isa trade-off, with costs and benefits associated with each method.
References and Additional Readings
Campbell, D.T. and Stanley, J.C. (1963). Experimental and quasi-experimental designs for research. Bos-ton: Houghton Mifflin.
Cook, T.D. and Campbell, D.T. (1979). QuasiExperimentation: Design and analysis issues for field set-tings. (Chapter 9, “The Conduct of Randomized Experiments”).
Kish, L. (1987). Statistical design for research. New York: Wiley. (Chapter 1, “Representation, Random-ization, and Realism”).
Chapter 4: Testing Hypotheses: Confounds and Controls