TESTING OXIDATIVE-STRESS HYPOTHESES GENERATED BY ...
155
TESTING OXIDATIVE-STRESS HYPOTHESES GENERATED BY SYSTEMS-BIOLOGY ASSAYS BY YUANYUAN LIU DISSERTATION Submitted in partial fulfillment of the requirements for the degree of Doctor of Philosophy in Microbiology in the Graduate College of the University of Illinois at Urbana-Champaign, 2013 Urbana, Illinois Doctoral Committee: Professor James A. Imlay, Chair Associate Professor Andrei Kuzminov Professor John E. Cronan Professor Peter A. Orlean
-
Upload
khangminh22 -
Category
Documents
-
view
0 -
download
0
Transcript of TESTING OXIDATIVE-STRESS HYPOTHESES GENERATED BY ...

TESTING OXIDATIVE-STRESS HYPOTHESES GENERATED BY SYSTEMS-BIOLOGY ASSAYS
BY
YUANYUAN LIU
DISSERTATION
Submitted in partial fulfillment of the requirements
for the degree of Doctor of Philosophy in Microbiology
in the Graduate College of the
University of Illinois at Urbana-Champaign, 2013
Urbana, Illinois
Doctoral Committee:
Professor James A. Imlay, Chair
Associate Professor Andrei Kuzminov
Professor John E. Cronan
Professor Peter A. Orlean

ii
ABSTRACT
Role of yaaA in hydrogen peroxide stress response in Escherichia coli
Hydrogen peroxide (H2O2) is commonly formed in microbial habitats by either
chemical oxidation processes or host defense responses. H2O2 can penetrate
cell membranes and damage key intracellular biomolecules, including DNA and
certain groups of iron-dependent enzymes. Bacteria defend themselves against
this H2O2 stress by inducing a set of genes that engages multiple defensive
strategies. In Escherichia coli, this defense is regulated by a transcriptional factor,
OxyR. A previous microarray study suggested that yaaA, an uncharacterized
gene found in many bacteria, was induced by H2O2 in Escherichia coli as part of
its OxyR regulon. Here I confirm that yaaA is a key element of H2O2 stress
response. In a catalase/peroxidase-deficient (Hpx-) background, yaaA deletion
mutants grew poorly, filamented extensively and lost substantial viability when
they were cultured in aerobic LB medium. The results from a thyA forward
mutagenesis assay and the growth defect of the yaaA deletion in DNA repair-
deficient background indicated that yaaA mutants accumulated high levels of
DNA damage. The growth defect of yaaA mutants was suppressed by either the
addition of iron chelators or by mutations that slow iron import, suggesting that
the DNA damage was caused by the Fenton reaction. Spin-trapping experiments
confirmed that Hpx- yaaA cells had a higher hydroxyl radical level than yaaA+
strains. EPR analysis showed that the proximate cause was an unusually high
level of intracellular unincorporated iron. These results demonstrate that during

iii
periods of H2O2 stress the induction of YaaA is a critical device to reduce
intracellular iron levels; it thereby attenuates the Fenton reaction and the DNA
damage that would otherwise result. The molecular mechanism of how YaaA
does it remains unknown.
Do antibiotics cause oxidative stress?
Since 2007, several studies have reported that classic bactericidal antibiotics
triggered the oxidation of an intracellular fluorescein probe, and this effect was
attributed to hydroxyl radicals. Therefore, investigators hypothesized that
different classes of antibiotics share a common bactericidal mechanism:
antibiotics stimulate the formation of superoxide and H2O2, which damage certain
iron-dependent enzymes, releasing iron to the cytosol. As a consequence, the
higher levels of H2O2 and free iron drive the Fenton reaction to generate hydroxyl
radicals which cause lethal DNA damage. If this model is true, then it might guide
new antibiotic therapies. Therefore, I evaluated its possibility by testing specific
steps of this hypothesis in Escherichia coli. I used three different antibiotics--
kanamycin, ampicillin and norfloxacin--all of which have been shown to increase
fluorescein-probe oxidation. However, contrary to the hypothesis, these
antibiotics neither induced the peroxide-responsive OxyR regulon, nor
accelerated endogenous H2O2 production. Furthermore, the metallo-enzymes
that are known to be sensitive to superoxide and H2O2 were not damaged, and
the level of intracellular free iron did not increase. Finally, the lethal effect of
antibiotic persisted in the absence of oxygen, whereas DNA repair mutants were
not hypersensitive, challenging the idea that toxicity arose from oxidative DNA

iv
lesions. Taken together, I conclude that bactericidal antibiotics did not generate
reactive oxygen species to kill bacteria.

v
To my family

vi
ACKNOWLEDGEMENTS
I would like to thank all my colleagues, friends, and family members for their help
and support in my graduate school years. I specially want to thank my advisor Dr.
James A. Imlay for his excellent guidance. He is a very good scientist as well as
a very good teacher. The work presented here would not have been possible
without his advice and help.
I would like to thank my thesis committee Dr. John E. Cronan, Dr. Andrei
Kuzminov, and Dr. Peter A. Orlean for providing me truly helpful insight into my
research directions.
I would like to thank Dr. Ian Gut for his kindly help in differential interference
contrast microscopy, and Dr. Mark Nilges for his help in electron paramagnetic
resonance spectroscopy studies. I would like to thank Sarah C. Bauer, who
discovered the phenotype of yaaA and started my first project.
I would like to thank all the people in Imlay lab: Dr. Adil Anjem, Dr. Mianzhi Gu,
Dr. Soojin Jang, Dr. Sergei Korshunov, Dr. Jia Liu, Dr. Zheng Lu, Dr. Lee
Macomber, Dr. Stefano Mancini, Dr. Surabhi Mishra, Dr. Fangfang Xu, Dr. Yuan
Sui, Kari Imlay, Maryam Khademian, Julia Martin, and Jason Sobota. They are
all smart, friendly, and wonderful people, who make my laboratory work an
enjoyable experience every day.
Finally, I would like to thank my family and friends for their love and support. I
appreciate Dylan Dodd’s for his help and support during my graduate school. His
companionship kept me positive and made my life pleasurable all these years.

vii
TABLE OF CONTENTS
CHAPTER ONE: INTRODUCTION ...................................................................... 1
1.1 Oxidative Stress ............................................................................................. 1
1.2 Damage Caused by Reactive Oxygen Species .............................................. 2 1.2.1 Damage of solvent exposed [4Fe-4S]2+ cluster containing enzymes ............................................................................................................ 3 1.2.2 Damage of mononuclear iron containing enzymes ................................... 4 1.2.3 Damage of DNA ....................................................................................... 5
1.3 Sources of Reactive Oxygen Species and Defense Systems in E. coli .......... 6 1.3.1 Endogenous ROS and basal defense systems ........................................ 6 1.3.2 Exogenous H2O2 and inducible OxyR response ....................................... 7 1.3.3 Redox-cycling drugs and SoxRS response ............................................ 10
1.4 Methods to Detect ROS Formation ............................................................... 13 1.4.1 Induction of stress-responsive regulon ................................................... 13 1.4.2 Detection of biomarkers of oxidative damage......................................... 14 1.4.3 Trapping of O2
- and hydroxyl radicals ..................................................... 16 1.4.4 Protection mediated by ROS quenching ................................................ 17 1.4.5 Chemiluminescent /fluorescent probes for ROS detection ..................... 18
1.5 Bactericidal Antibiotics and Oxidative Stress ................................................ 20 1.5.1 -lactams ................................................................................................ 21 1.5.2 Aminoglycosides .................................................................................... 22 1.5.3 Fluoroquinolones .................................................................................... 23 1.5.4 Hypothesis of antibiotic-mediated oxidative stress ................................. 25
1.6 Tables ........................................................................................................... 29
1.7 Figures.......................................................................................................... 31
1.8 References ................................................................................................... 33

viii
CHAPTER TWO: THE YAAA PROTEIN OF THE ESCHERICHIA COLI OXYR REGULON LESSENS HYDROGEN PEROXIDE TOXICITY BY DECREASING INTRACELLULAR UNINCORPORATED IRON CONCENTRATION ............................................................................................ 43
2.1 Introduction ................................................................................................... 43
2.2 Materials and Methods ................................................................................. 43 2.2.1 Reagents ................................................................................................ 43 2.2.2 Strain construction .................................................................................. 44 2.2.3 Plasmid construction .............................................................................. 44 2.2.4 Bacterial growth ...................................................................................... 45 2.2.5 Cell viability ............................................................................................ 46 2.2.6 Differential interference contrast (DIC) microscopy ................................ 46 2.2.7 thyA forward mutagenesis assay ............................................................ 47 2.2.8 H2O2 killing assay ................................................................................... 47 2.2.9 EPR spin trapping of hydroxyl radicals ................................................... 48 2.2.10 EPR measurement of intracellular unincorporated iron ........................ 48 2.2.11 -Galactosidase activity ....................................................................... 49 2.2.12 H2O2 measurement .............................................................................. 49 2.2.13 Visualization of protein carbonylation ................................................... 50 2.2.14 Rapid amplification of cDNA ends (5-RACE) ....................................... 50 2.2.15 Real-time PCR ..................................................................................... 51
2.3 Results.......................................................................................................... 52 2.3.1 The yaaA gene is induced by OxyR ....................................................... 52 2.3.2 Hpx- yaaA cells show a growth defect in LB during H2O2 stress ............ 53 2.3.3 Hpx- yaaA cells lose viability during H2O2 stress .................................... 54 2.3.4 yaaA mutants show higher levels of DNA damage and polypeptide damage during H2O2 stress ............................................................................. 55 2.3.5 The Fenton reaction causes injuries in yaaA mutants during H2O2 stress ............................................................................................................... 57 2.3.6 YaaA protects cells by attenuating the Fenton reaction ......................... 58 2.3.7 YaaA does not affect H2O2 levels ........................................................... 59 2.3.8 YaaA does not inhibit ferric iron reduction .............................................. 60 2.3.9 Hpx- yaaA mutants have higher unincorporated iron levels than the Hpx- parent strain ............................................................................................ 61 2.3.10 YaaA does not repress expression of iron importers ............................ 62 2.3.11 Hpx- mntH yaaA mutants show a strong growth defect in defined medium ........................................................................................................... 63 2.3.12 Regulation of YaaA .............................................................................. 64

ix
2.4 Discussion .................................................................................................... 65
2.5 Acknowledgments ........................................................................................ 68
2.6 Tables ........................................................................................................... 69
2.7 Figures.......................................................................................................... 72
2.8 References ................................................................................................... 90
CHAPTER THREE: CELL DEATH FROM ANTIBIOTICS WITHOUT THE INVOLVEMENT OF REACTIVE OXYGEN SPECIES ........................................ 94
3.1 Introduction ................................................................................................... 94
3.2 Materials and Methods ................................................................................. 95 3.2.1 Reagents ................................................................................................ 95 3.2.2 Strain construction .................................................................................. 96 3.2.3 Bacterial growth ...................................................................................... 97 3.2.4 Cell viability ............................................................................................ 98 3.2.5 O2 consumption ...................................................................................... 98 3.2.6 Real-time PCR ....................................................................................... 99 3.2.7 -Galactosidase activity ....................................................................... 100 3.2.8 H2O2 production measurement ............................................................. 100 3.2.9 Electron paramagnetic resonance (EPR) measurement of intracellular unincorporated iron .................................................................... 100 3.2.10 Enzyme assays .................................................................................. 101 3.2.11 H2O2 killing assay ............................................................................... 103 3.2.12 Hydroxyphenyl fluorescein (HPF) assay............................................. 103
3.3 Results........................................................................................................ 104 3.3.1 Antibiotic killing does not require oxygen ............................................. 104 3.3.2 H2O2-stressed mutants have similar sensitivity to ampicillin or kanamycin as wild type cells ......................................................................... 104 3.3.3 Antibiotic treatments did not accelerate the formation of hydrogen peroxide ........................................................................................................ 105 3.3.4 Antibiotic treatments did not increase the pool of unincorporated iron ................................................................................................................ 107 3.3.5 General DNA repair pathways had little effect upon antibiotic sensitivity ....................................................................................................... 108
3.4 Discussion .................................................................................................. 109

x
3.5 Acknowledgments ...................................................................................... 111
3.6 Tables ......................................................................................................... 112
3.7 Figures........................................................................................................ 113
3.8 References ................................................................................................. 128
CHAPTER FOUR: CONCLUSIONS ................................................................. 131
4.1 Conclusions from Current Work .................................................................. 131 4.1.1 YaaA plays a role in peroxide defense by controlling iron levels .......... 131 4.1.2 The lethal effect of classic bactericidal antibiotics does not involve oxidative stress ............................................................................................. 131
4.2 Possible Future Work ................................................................................. 132 4.2.1 What causes the growth defect of Hpx- yaaA mntH mutants in glucose defined medium? ............................................................................. 132 4.2.2 What genes are induced in yaaA mutants? .......................................... 134 4.2.3 What is the three-dimensional structure of YaaA? ............................... 134 4.2.4 Does YaaA bind iron? .......................................................................... 135 4.2.5 Are there any functionally critical residues in YaaA? ............................ 135 4.2.6 What percentage of the HPF is oxidized in antibiotic treated cells? ..... 136 4.2.7 Can KatG oxidize the HPF dye? ........................................................... 136
4.3 References ................................................................................................. 138
APPENDIX A: DELETION OF OXYS DOES NOT GENERATE A PHENOTYPE IN CATALASE/PEROXIDASE-DEFICIENT MUTANTS ............. 140
A.1 Material and Methods ................................................................................. 141 A.1.1 Strain construction ............................................................................... 141 A.1.2 Bacterial growth ................................................................................... 141
A.2 Table .......................................................................................................... 143
A.3 Figure ......................................................................................................... 144
A.4 References ................................................................................................. 145

1
CHAPTER ONE: INTRODUCTION
1.1 Oxidative Stress
During Earth’s early existence, the atmosphere was full of reducing volcanic
gases and had no free oxygen, and the ocean contained abundant dissolved
ferrous iron and sulfur species. Microbial life emerged and subsequently evolved
photosynthetic mechanisms for splitting water to produce oxygen. Despite the
presence of photosynthetic organisms, the Earth’s atmosphere remained
anaerobic for nearly two billion years until sufficient oxygen was produced to
titrate the ferrous iron and sulfur species in the ancient oceans (9,53). It then took
about another billion years for the oxygen level to slowly build up in the
atmosphere and reach the present-day concentration. The anaerobic earth
gradually turned into an aerobic world (Figure 1.1). During this period, microbial
organisms evolved mechanisms to exploit the metabolic potential of oxygen.
However, they also had to develop strategies to prevent its toxicity.
Molecular oxygen (O2) is a triplet species with two spin-aligned, unpaired
electrons (47,83). Because of this orbital structure, O2 can only accept one
electron at a time. The unpaired electrons of O2 allow it to rapidly react with
transition metals and organic radicals (47). Therefore, once aerobic
environments appeared, ancient free-radical-based catalytic mechanisms were
either dispensed with or were sequestered in the interiors of enzymes, where
oxygen could not penetrate.

2
Another threat comes from univalent electron transfer feature of oxygen.
Molecular oxygen can be partially reduced to superoxide (O2-), hydrogen
peroxide (H2O2) and hydroxyl radicals (HO) (Scheme 1.1) (47,48). These
oxygen derivatives, also called reactive oxygen species (ROS), are stronger
oxidants than oxygen itself, and therefore can react with certain biological
molecules of fundamental biochemical mechanisms and damage metabolic
pathways inherited from the ancient reducing world. As a result, living organisms
developed approaches to diminish ROS and thereby protect their vulnerable
targets.
Scheme 1.1 The redox states of oxygen with standard reduction potentials.
1.2 Damage Caused by Reactive Oxygen Species
Biochemical and physiological studies of O2- or H2O2 scavenging-deficient
mutants have identified some of the targets that O2- or H2O2 most readily reacts
with. In aerobic Escherichia coli cultures, both superoxide dismutase-deficient
mutants (SOD) and catalase/peroxidase-deficient mutants (Hpx-) demonstrate
growth defects, develop aromatic amino acid auxotrophy, and suffer high levels
of mutagenesis (13,93). These phenotypes are correlated with damage of iron-
dependent enzymes and damage of DNA (5,30,53,67,88,98).

3
1.2.1 Damage of solvent exposed [4Fe-4S]2+ cluster containing enzymes
Being small molecules, O2- and H2O2 can penetrate into the active sites of certain
iron-dependent enzymes and cause enzyme inactivation. Aconitase-class
dehydratases are one of the well-known targets for O2- and H2O2 (30,33,53,67).
This group of enzymes contain solvent-exposed, catalytically active [4Fe-4S]2+
clusters, which use an undercoordinated iron atom to bind substrate and catalyze
the reaction. A list of these enzymes includes: aconitase B, fumarase A and
fumarase B in tricarboxylic acid cycle (TCA cycle); 6-phosphogluconate
dehydratases (Edd) in the Entner-Doudoroff pathway; isopropylmalate isomerase
(IPMI) in leucine biosynthesis; dihydroxy-acid dehydratases in branched chain
amino acid synthesis; and L-serine deaminase in L-serine degradation
(12,33,34,53). During oxidative stress, O2- takes one electron from the [4Fe-4S]2+
clusters, is thereby reduced to H2O2 and leaves the active site; the unstable [4Fe-
4S]3+ state cluster then releases the catalytic iron in the ferrous form, resulting in
an inactive enzyme having a [3Fe-4S]+ cluster (30). H2O2, on the other hand,
extracts two electrons from the native cluster, probably through a ferryl-like
intermediate, and is reduced to H2O; the oxidized cluster releases a ferric iron to
generate the [3Fe-4S]+ form (53). In both cases, the enzyme is inactivated, and
an iron atom is released to the cytosol. The rate constants of inactivation by O2-
is about 106 M-1 s-1 (30,33,34), and the inactivation rate of H2O2 is 104 M-1 s-1 (53).
Hence, these solvent-exposed [4Fe-4S]2+ clusters are very susceptible to
oxidative stress. When the [4Fe-4S]2+ clusters are buried inside the enzymes, like
succinate dehydrogenase and NADH dehydrogenase, they are not vulnerable to
oxidative damage (53).

4
1.2.2 Damage of mononuclear iron containing enzymes
The mononuclear iron enzymes represent another group of targets for O2- and
H2O2. These enzymes catalyze diverse categories of reaction types, but they all
employ ferrous iron to stabilize an oxyanion intermediate during the reaction
(5,98). Several enzymes in this group already have been demonstrated to be
sensitive to both O2- and H2O2, including ribulose-5-phosphate 3-epimerase
(RPE) in the pentose phosphate pathway; peptide deformylase (PDF) that
removes the formyl group from the initiation methionine of nascent proteins;
threonine dehydrogenase (TDH) in threonine metabolism; cytosine deaminase
(CDA) in the pyrimidine salvage pathway; and 2-dehydro-3-
deoxyphosphoheptonate aldolase (DAHPC) in aromatic amino acid synthesis.
Over 100 enzymes in E. coli use transition metals (i.e. Mn2+, Zn2+, Co2+, Ni2+ and
Fe2+) as prosthetic groups, and a couple dozen of them are able to use ferrous
iron (57). However, the usage of ferrous iron is often under recognized due to
uses of aerobic purification process or assay conditions. Therefore, it is possible
that there are unrecognized enzymes that actually use ferrous iron in
physiological conditions, and might be vulnerable to oxidative stress (5). During
O2- stress, the solvent-exposed ferrous iron cofactor is oxidized to the ferric form
and then dissociates from the active site, while O2- is reduced to H2O2. The apo-
enzymes thus formed can be mis-metallated by other metals (i.e. Zn), and
eventually lose activity (Gu and Imlay, unpublished data). H2O2 oxidizes the
catalytic iron cofactor in a Fenton reaction (see below), producing a ferryl radical.
The ferryl radical can oxidize cysteine residues (if any) or other residues in the

5
active site. Oxidation of cysteine to sulfenic acids is reversible, while oxidation of
other amino acid residues can cause irreversible damage (5,98). In both cases,
the catalytic iron cofactor is oxidized to the ferric form and dissociates from the
active site, leaving an inactive enzyme (5,98). Similar to aconitase-type
dehydratases, the rate constants of inactivation of mononuclear iron enzymes is
also high, about 105 to 106 M-1 s-1 by O2- (Gu and Imlay, unpublished data) and
103 M-1 s-1 by H2O2 (5,98).
1.2.3 Damage of DNA
Both H2O2 stress and O2- stress can cause DNA damage. H2O2 reacts with
ferrous iron in the Fenton reaction (Scheme 1.2), generating a ferryl radical
intermediate (FeIV=O)2+, which ultimately decomposes to ferric iron and hydroxyl
radical (49,88). O2- indirectly increases Fenton-mediated hydroxyl radical
production by releasing iron atoms from sensitive enzymes (aconitase-class
dehydratases or mononuclear iron enzymes) (58,59). In vivo ferric iron can be
directly reduced back to the ferrous form by cysteine and FADH2. This
establishes a redox cycle pathway that drives the hydroxyl radical production
(87,111). Hydroxyl radical is an extremely strong oxidant (+2.33V). It reacts with
all types of macromolecules at close to the diffusion-limited rate (4). When
ferrous iron binds to DNA, a Fenton-mediated hydroxyl radical can be generated
on the surface of DNA, subsequently oxidizing nucleic acid bases or ribose
moieties, causing mutation and even cell death (49,88).
Fe2+ + H2O2 → (FeIV=O)2+ Fe3+ + OH- +HO
Scheme 1.2 The Fenton reaction

6
1.3 Sources of Reactive Oxygen Species and Defense Systems in E. coli
1.3.1 Endogenous ROS and basal defense systems
O2- and H2O2 are routinely generated as by-products of aerobic metabolism,
apparently when molecular oxygen steals electrons from certain reduced
biomolecules. As a triplet species, molecular oxygen can only accept one
electron at a time from strong univalent electron donors, including menaquinones
or reduced flavins of redox enzymes and generate O2- as the initial product
(65,74). If O2- obtain another electron from flavosemiquinone radicals before it
diffuses out of the active site, then H2O2 is formed (77,78). H2O2 can also be
produced when two O2- dismutate spontaneously or during reactions catalyzed
by superoxide dismutase. Moreover, H2O2 is a stoichiometric reaction product of
certain oxidases, such as L-aspartate oxidase (64,77) and copper-containing
amine oxidase (79). Fortunately, the flux of aspartate oxidase is restrained, and
only limited amounts of H2O2 are produced. In the case of copper-containing
amine oxidase, the periplasmic location of this enzyme lessens the likelihood of
H2O2 interacting with cellular biomolecules (15). As the result, the H2O2 generated
by these enzymes accounts for only a small proportion of total endogenous H2O2
production and thus is tolerated by the cell. Although the respiratory chain is the
major source of O2- in the periplasm, it is not the predominant source of
endogenous H2O2 (<20%) in E. coli (65). To date, no single enzyme has yet been
identified as the major ROS producer.
In wild-type log-phase growing E. coli, the rate of O2- formation inside the cells is
about 5 M/s in fully aerated medium, while the rate of H2O2 formation is about

7
15 M/s (48,93). Nevertheless, the potential toxicity of these ROS is diminished
by the high titers of the scavenging enzymes--superoxide dismutases, catalases,
and peroxidases. The levels of scavenging enzymes are sufficient to drive the
steady-state concentration of O2- to 0.1 nM and that of H2O2 to ~20 nM (50,94).
These concentrations are low enough to maintain function of vulnerable enzymes,
however, residual oxidative DNA damage still occurs. The evidence comes from
mutants deficient in both recombinational repair and base-excision repair
systems (recA xthA or polA recB strains). While these mutants grow well in the
absence of oxygen, they are inviable aerobically (17,48,51,82). Thus the basal
defenses of the scavenging enzymes and DNA repair system appear calibrated
to avoid problems from endogenous ROS in E. coli.
1.3.2 Exogenous H2O2 and inducible OxyR response
H2O2 can also come from exogenous sources. H2O2 forms at the interface
between aerobic and anaerobic habitats when oxygen reacts with metals and
thiols. H2O2 also accumulates in sterile lab medium (1-20 M) when O2 gets
electrons from flavin by photochemical mechanisms, or from glucose in the
presence of metals (48). Furthermore, H2O2 is generated by natural antimicrobial
systems because of its toxicity. Indeed, plants, amoebae, and mammals all
elaborate NADPH oxidase to kill invading bacteria. This enzyme transfers
electrons from NADPH to molecular oxygen, generating a mixture of O2- and
H2O2 in an effort to kill pathogens (10,36,76). Similarly, lactic acid bacteria
produce abundant H2O2 to suppress competitors (38,95,99).

8
Unlike O2-, which cannot cross membranes because it is an anion at
physiological pH, H2O2 penetrates membranes at a rate similar to that of water.
Therefore, when bacteria enter an environment that contains H2O2, they must
activate defensive responses—for example, the OxyR system in E. coli. OxyR is
a transcription factor that can sense as little as 0.1 M of intracellular H2O2 and
induce gene expression (7). An activated thiolate residue (Cys199) on the OxyR
protein is oxidized by H2O2 to a sulfenic acid, which then reacts with a second
thiol group (Cys208) nearby to form a stable disulfide bond. This locks OxyR in
an activated form (68,116). The activated OxyR protein directly stimulates
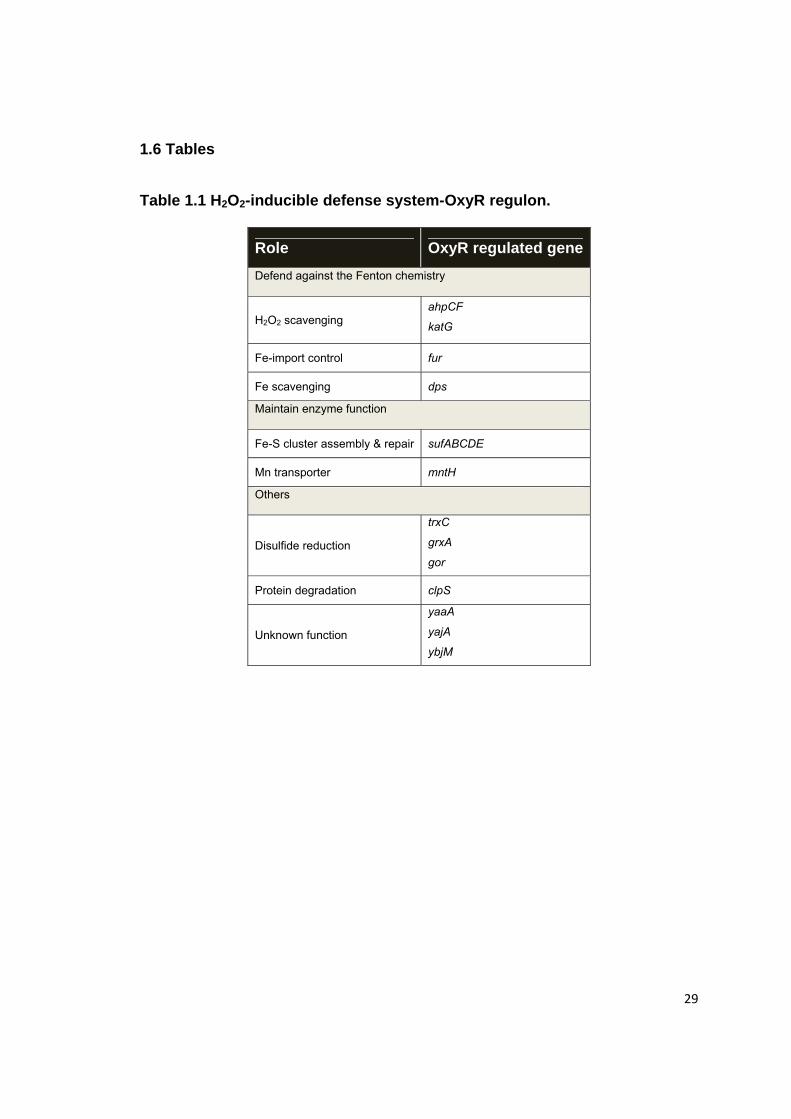
transcription of at least two dozen genes involved in defense (Table 1.1) (118).
These genes presumably represent a list of cellular strategies to minimize the
toxicity of H2O2. Since Fenton-generated hydroxyl radicals are the most deadly
factors during H2O2 stress, cells induce genes to prevent the Fenton reaction by
scavenging H2O2 and by diminishing the amount of intracellular iron. Catalase
(katG) and peroxidase (ahpCF) are induced to scavenge H2O2 (93). At the same
time, the Fur repressor is up-regulated to diminish iron import (105,117); whereas
Dps, a ferritin-like protein, is induced to sequester unincorporated iron
(39,45,88,115). Maintenance of H2O2-sensitive enzyme function is also an
important goal. A secondary Fe-S cluster assembly system encoded by the Suf
operon is induced by OxyR to replace the H2O2-sensitive housekeeping Isc
system (52,69,85). Suf induction is critical for both synthesis of de novo Fe-S
clusters and repair of damaged clusters during peroxide stress (52). The
induction of MntH, a manganese importer, enables manganese to replace

9
catalytic iron in mononuclear metalloenzymes which otherwise would be
inactivated by H2O2 (6,56,98). The significance of these adaptations has been
shown in catalase/peroxidase-deficient mutants (katG katE ahpCF triple mutant,
named Hpx-). During aerobic growth, these strains accumulate approximately 1
M H2O2, which is ~10 times over the concentration sufficient to induce the OxyR
regulon (7,94). Mutants having gene deletions (mutation of suf, mntH, dps or fur)
in the Hpx- background grow poorly in aerobic medium and the phenotypes are
correlated with their cellular function in H2O2 defense (6,52,88).
Thioredoxin C (trxC), glutaredoxin A (grxA), and glutathione reductase (gorA) are
also part of the OxyR regulon (118). The glutathione/glutaredoxin or thioredoxin
systems might be induced to repair oxidized cysteine residues. Although H2O2
efficiently oxidizes sulfhydryls on OxyR and Ahp peroxidase (>107 M-1 s-1) (7,90),
it is a relatively poor oxidant of typical cysteine residues (<60 M-1 s-1) (18,31,113).
Therefore, the importance of the glutathione/glutaredoxin or thioredoxin systems
to remove cysteine oxidation during peroxide stress is not clear. Indeed, deletion
of these genes did not exhibit growth defects in Hpx- cells (Imlay lab, unpublished
data). Interestingly, in many bacteria, glutaredoxin or thioredoxin is not part of the
H2O2-response system. In Streptomyces, the expression of thioredoxin is
activated by disulfide bond formation on an anti-sigma factor protein (48). These
suggest that OxyR in E. coli might also act as a sensor for disulfide stress, and
glutathione/glutaredoxin or thioredoxin are induced to reduce disulfide bonds (48).
OxyR also induces a specificity adapter for the ClpA-ClpP protease complex,
ClpS (yljA) (118). ClpS directs ClpAP towards aggregated proteins and N-end
10
rule substrates, facilitating their degradation (24,28). This might be important
during H2O2 stress because hydroxyl radicals can cause multiple types of protein
damage.
There are several members in the OxyR regulon with uncharacterized functions,
including YaaA, YaiA, and YbjM (118). Presumably, the function of these proteins
will fall into one of the defensive categories mentioned above. In principle, if
deletion of these genes in Hpx- background creates a phenotype, one can
characterize the gene function by establishing which type of H2O2-mediated
damage is worsened in the mutant.
1.3.3 Redox-cycling drugs and SoxRS response
Oxidative stress can also arise from redox-cycling drugs, such as phenazines,
viologens, and quinones. It is well known that both plants and microbes use
these small organic compounds to suppress the growth of their competitors. For
example, plumbagin and juglone are naturally synthesized quinones from plants
(42). They are effective herbicides that allow the producing plants to take over a
habitat. Phenazine is excreted by Pseudomonas spp. and a few other bacterial
genera, to allow the producing strains to outcompete with the resident microbes
(75). These redox-cycling compounds may have other functions (19). Some
studies suggest that they act as extracellular electron shuttles in biofilms,
delivering electrons to terminal oxidants that are not easily accessible (either
insoluble or diffusion-limited), such as iron mineral and molecular oxygen
(44,107,108). Since they can mediate the reduction of ferric iron to biologically
available ferrous iron, they may also contribute to iron acquisition (109).

11
Most studies have focused on the toxicity of these compounds. Redox-cycling
drugs are well known for poisoning cells by generating reactive oxygen species,
but their toxicity can also come from ROS-independent mechanisms. After the
drugs penetrate into the cell, they can undergo addition reactions with available
thiols, and form covalent adducts on proteins (11,81). More importantly, the
univalent redox activity of these drugs allows them to abstract an electron from
the reduced flavin or the metal center of redox enzymes. This action not only
directly inactivates aconitase-type Fe-S clusters dehydratases and NADPH-
reduced enzymes (42), it can also inactivate NADH dehydrogenase II and block
the cellular metabolism (46). The reduced drug is then re-oxidized by an oxidized
quinone pool. When terminal electron acceptors-such as molecular oxygen,
nitrate or fumarate-are available, the drug can undergo redox-cycling multiple
times, transfer electrons to terminal acceptors to produce water, nitrite or
succinate, respectively (42). The reduced drug is also able to directly transfer
electrons to oxygen. As a result, when molecular oxygen is present, the redox-
cycling reactions not only generate water, but also large amounts of O2- and
H2O2, leading to oxidative damage (42,75).
In E. coli, the SoxRS regulon mediates the response to redox-cycling compounds
and nitric oxide. The transcriptional factor SoxR has an exposed [2Fe-2S]+
cluster, which is oxidized to [2Fe-2S]2+ by univalent oxidants, such as redox-
cycling compounds. The oxidized cluster triggers a large conformational change
in the protein, shifting it to a transcriptionally active form (22,35). Nitric oxide can
also activate SoxR by direct nitrosylation of the [2Fe-2S]+ cluster, generating a

12
disrupted cluster with dinitrosyl-iron-dithiol complex (21). In E. coli, the activated
SoxR stimulates transcription of only one known gene, the transcriptional
activator SoxS. SoxS then activates about two dozen genes to protect the cell
(Table 1.2) (41,91,101).
Because redox-cycling drug can cause damage without the involvement of
reactive oxygen species, it is not surprising that the major members of the
SoxRS regulon are involved in controlling the intracellular concentration of redox-
cycling drug (42). OmpF antisense sRNA (micF) and lipopolysaccharide (LPS)
modification genes (waaY and waaZ) are induced to reduce drug entry by
changing the permeability of the cell envelope. Genes encoding drug efflux
pumps (acrAB and tolC), drug detoxification (nfsA, ygfZ and nfnB), and multiple
antibiotic resistance systems (marAB) are also up-regulated. Since redox-cycling
drugs can produce O2- in the presence of oxygen, SoxS also induces genes to
defend against potential O2- toxicity. Manganese-containing superoxide
dismutase (sodA) is up-regulated to scavenge O2-. The oxidant-resistant
dehydratase-isoforms, fumarase C (fumC) and aconitase A (acnA), and the [Fe-S]
cluster repair protein YggX are expressed to deal with the Fe-S cluster damage
(70,89,92,104). Fur repressor is induced to decrease iron import, and thereby
reduce its role in Fenton-mediated DNA damage; while endonuclease IV (nfo) is
induced to enhance the repair of oxidative DNA lesions. Furthermore, glucose-6-
phosphate dehydrogenase (zwf), flavodoxin NADP+ reductase (fpr), and
flavodoxins (fldA and fldB) are induced as well, likely to restore the NADPH pool
which may be exhausted by redox-cycling.

13
1.4 Methods to Detect ROS Formation
Because of their toxicity, reactive oxygen species produced by host cells are
widely believed to be correlated with various disease states, including
neurodegeneration, diabetes, atherosclerosis, and cancer (2). It is also argued
that ROS play a significant role in the aging process, though convincing evidence
to support this notion is not available.
One essential problem in evaluating the relationship of ROS with diseases and
aging is how to detect and measure ROS accurately. These molecules exhibit
very short half-lives which makes detection difficult. In general, there are five
approaches to detect ROS, which include: (a) monitoring induction of stress-
responsive regulons; (b) detecting biomarkers of oxidative damage; (c) detecting
O2- or hydroxyl radical by electron paramagnetic resonance (EPR) spin trapping;
(d) establishing a protective role of ROS quenchers; (e) measuring ROS by
chemiluminescent/fluorescent probes.
1.4.1 Induction of stress-responsive regulon
Activation of inducible stress response systems is a good indicator of oxidative
stress, as these regulons play a specific role in sensing stress at physiologically
relevant concentrations. The OxyR regulon is triggered by ~0.1 M H2O2 (7), and
therefore the induction of OxyR regulated genes gives an excellent readout for
physiological H2O2 stress. Gene expression can be measured by transcriptional-
lacZ fusions, real-time reverse transcription PCR (qRT-PCR), microarrays or
RNA-seq. However, the level of activation may vary between members under the
14
same conditions, and some members may have more than one regulator. For
example, dps is induced by OxyR as well as RpoS, while being repressed by
MntR (3,112). As a result, it is better to use experimental conditions in which
OxyR is the only activated regulator or to measure the expression of more than
one gene in the regulon.
In contrast to the OxyR regulon which responds to H2O2, the SoxRS system is
not directly triggered by O2-. Rather, SoxRS is induced by redox-cycling drugs,
which can occur even under anaerobic conditions (42). As a result, induction of
SoxRS regulated genes, such as superoxide dismutase (sodA), does not
necessarily correlate with O2- stress, and the data should be interpreted with
caution.
1.4.2 Detection of biomarkers of oxidative damage
ROS can react with biomolecules, generating unique and specific types of
damage. These scars can be used as evidence of oxidative damage. Activity of
ROS-sensitive enzymes as well as levels of oxidative protein damage and DNA
damage have all been utilized as biomarkers to indicate oxidative stress.
Damage of ROS-sensitive enzymes can be evaluated by enzyme assays. In
order to avoid variations between different samples, the actual enzyme activity is
normalized to the total enzyme activity (see below), and the fraction is compared
to that in the absence of oxidative stress. The damaged [3Fe-4S]+ clusters in
aconitase-class dehydratases can be repaired by incubation with ferrous iron and
dithiothreitol (DTT); if the Fe-S cluster is further degraded, it can be rebuilt by

15
addition of the IscS Fe-S cluster assembly system and cysteine to the repair
reaction (52,53). In this scenario, the activity observed post repair or post
rebuilding is defined as the total enzyme activity. Similarly, the total activity of
mononuclear iron enzymes is determined after remetallating the apo-enzymes
with ferrous iron under anaerobic conditions (5,98). However, there are factors
that limit the use of sensitive enzymes as ROS fingerprints: (a) a lot of these
enzymes require specific growth conditions for protein expression; (b) the
damage of their cofactors might due to reasons other than oxidative stress (i.e.
iron depletion).
Polypeptides can also be oxidized by hydroxyl radicals and undergo different
types of oxidative modifications, such as carbonylation, a product from direct
oxidation of amino-acid side chains. Carbonyl derivatives often serve as markers
of oxidative stress because of their chemical stability. However, they can be also
generated by protein glycation inside the cell. Therefore, the levels of carbonyl
groups in cellular proteins are not restricted to oxidative damage (43).
During oxidative stress, the most disease-related damage to cells is hydroxyl
radical-mediated DNA damage, which can cause spontaneous mutation or even
cell death. Hydroxyl radicals oxidize the first encountered nucleic acid base or
ribose moiety; the initial radical products then attack nearby bases, sugars or
cellular reductants, and eventually produce numerous stable end products after
series of reactions (23). The relative amounts of these end products are
determined by reaction conditions, such as redox environment, association of
transition metals with DNA, etc (23). Hence, it is not appropriate to rely on a

16
single product as an index of oxidative DNA damage. Such reliance is not very
sensitive, and can lead to false results. For example, 8-hydroxyguanine (8-OHdG)
is a common product of guanine in DNA oxidation. Because of its easy
measurement and strong mutagenicity, the level of 8-OHdG is often used as an
indicator of oxidative DNA damage. However, 8-OHdG is just one of the many
important products generated from oxidative DNA damage (23). Moreover, it can
also be formed during the process of DNA isolation and assay preparation, which
adds uncertainty and potential artifacts to the result (43). A better way to evaluate
DNA damage is to measure the mutation rate or cell viability, as they reveal the
overall effects of critical DNA damage that are most threatening and disease
related.
In general, there is no perfect biomarker for oxidative stress. The ones suggested
above can be used as a support of oxidative damage, but careful controls and
follow up experiments are required.
1.4.3 Trapping of O2- and hydroxyl radicals
Electron paramagnetic resonance (EPR) or electron spin resonance (ESR) is a
technique to detect species with unpaired electrons (paramagnetic species), like
flavin radicals, quinone radicals, O2- radicals and hydroxyl radials (29). In
biological systems, ROS exhibit even shorter lifetimes because of the various
antioxidant mechanisms. As a result, spin traps are employed to react with the
radicals produced in the cell. The reactions produce stable radical adducts, which
can be subsequently detected by EPR.

17
5,5-Dimethyl-1-pyrroline-N-oxide (DMPO) and 2,5,5-trimethyl-1-pyrroline-N-oxide
(TMPO) are commonly used for O2- detection in EPR spin trapping. However, the
rate constants of these spin traps with O2- are very slow (2-70 M-1s-1), making it
difficult to capture O2- before it is detoxified by scavenging enzymes or reductants
inside the cell (29).
DMPO, hydroxyl-2,2,6,6-tetramethylpiperidine-N-oxyl (TEMPO), -phenyl-N-tert-
butylnitrone (PBN) and-(4-pyridyl N-oxide)-N-tert-butylnitrone (POBN) are
widely used spin traps for hydroxyl radicals. Though the hydroxyl radical reacts
with these compounds rapidly (>109 M-1s-1) (29,43), it also reacts with many
biomolecules at diffusion limited rates (4). Furthermore, the spin trap-radical
adducts can be quickly removed by enzymes or reductants inside the cell (43).
Therefore, though EPR spin trapping can be used for O2- and hydroxyl radical
detection in vivo, it is only a qualitative method.
1.4.4 Protection mediated by ROS quenching
Iron chelators prevent the Fenton reaction by sequestering iron. However, it is
more complicated when it comes to a cellular system. Addition of iron chelator
can cause iron depletion, which represses the TCA cycle and the respiratory
chain, thereby altering cellular metabolism. Therefore, the protective effect of iron
chelators may merely arise from changes in metabolism and not be related to the
Fenton chemistry. Similar reasons apply to hydroxyl radical quenchers, which
may also have pleiotropic effects other than hydroxyl radical scavenging inside
the cells. As a result, protection from ROS quenchers is not sufficient to confirm

18
ROS production. In order to obtain meaningful results, it requires understanding
of the fundamental cellular physiology, careful data interpretation and more
important, followed up experiments.
1.4.5 Chemiluminescent /fluorescent probes for ROS detection
Chemiluminescent and fluorescent probes are very popular for reactive oxygen
species detection. Compared to other approaches, these dyes are sensitive,
convenient and inexpensive. Yet, caution must be taken when using these dyes,
because many of them are nonspecific and can give rise to artifacts. Listed below
are some examples of commonly used dyes.
Luminol and lucigenin (Figure 1.2A-B) are often employed for O2- detection.
However, neither compound directly reacts with O2-. Luminol must first undergo
one electron oxidation by peroxynitrite, hydroxyl radicals, or high-valent iron to
generate luminol radical. The resulting luminol radical then react with O2- to
produce a light emitting molecule. In the case of lucigenin, the dye must first be
reduced to lucigenin radical cation by the cellular reducing system (i.e. electron
transport chain), before it reacts with O2-. Unfortunately, both luminol radicals and
lucigenin radical cations are also able to react with oxygen to generate O2-,
leading to artificial elevated O2- production. Therefore, luminol and lucigenin are
not reliable probes for O2- detection (43). Actually, lucigenin is now suggested for
Cl- detection by Invitrogen.
Amplex Red is frequently used for H2O2 measurements. In the presence of
horseradish peroxidase, this dye is oxidized by H2O2 to produce a highly
fluorescent product, resorufin (Figure 1.2C). The assay is highly sensitive, and

19
can detect as little as 50 nM H2O2. However, this dye is not suitable for H2O2
detection inside the cell. In the presence of NADH and oxygen, the fluorescent
product resorufin can undergo redox cycling upon visible light irradiation,
generating O2- and H2O2. This gives self-amplification of fluorescence signal.
Therefore, Amplex Red is only a reliable method to measure extracellular H2O2
formation, such as to detect H2O2 released from the cell or in isolated
mitochondrial preparations (54,114).
Dichlorofluorescein diacetate (DCFH2-DA) is another commonly used probe for
H2O2 and oxidative stress detection (Figure 1.2D). This cell-permeable probe is
deacetylated by cellular esterases to dichlorofluorescin (DCFH2). The
nonfluorescent product DCFH2 does not react with O2- or H2O2 directly; instead, it
is oxidized by one electron oxidants to form an intermediate radical (DCF-).
These one electron oxidants include peroxyl, alkoxyl, peroxynitrite, carbonate
and hydroxyl radicals, as well as high valence iron center in redox enzymes (i.e.
peroxidase with H2O2), cytochrome c, chromium, pyocyanin, mitoxantrone, and
ametantrone. The intermediate radical DCF- rapidly reacts with O2 to form a
fluorescent product, as well as O2- and H2O2. This reaction establishes a redox
cycling pathway, which artificially amplifies the fluorescent signal. The DCF-
intermediate radical can also react with other cellular reductants (i.e. glutathione,
ascorbate, and NADH) to generate more free radicals, further complicating
interpretation of assay results. Therefore, DCFH2-DA is not a reliable probe for
intracellular ROS (20,43,55).

20
In summary, none of the ROS detection approaches is perfect and can serve as
a ‘gold standard’. Rather, each has specific advantages and disadvantages that
must be carefully considered. Measure the induction of stress response system
(a) and the biomarkers of oxidative damage (b), as well as EPR spin trapping for
O2- and hydroxyl radical formation (c) all can be used to detect ROS formation
inside the cell, though none of these is quantitative; whereas ROS quenchers
and ROS probes are only reliable in cell free systems. ROS detection requires a
complete understanding of the methods employed, careful design of controls,
cautious interpretation of the data, and follow-up experiments to confirm the
results.
1.5 Bactericidal Antibiotics and Oxidative Stress
The discovery and clinical application of antimicrobial reagents has provided the
greatest benefit to human health in the twentieth century. Most clinically used
antibiotics target one of three essential cellular processes: cell-wall assembly (i.e.
-lactams), protein synthesis (i.e. aminoglycosides), or nucleic acid metabolism
and repair (i.e. fluoroquinolones). However, recent reports have raised the
possibility that although these antibiotics block growth by directly inhibiting the
targets mentioned above, they may owe their lethal effects to the indirect creation
of reactive oxygen species which then damage bacterial DNA. In order to
evaluate the possibility of the oxidative stress hypothesis, it is important to
understand the mode of action of these antibiotics.

21
1.5.1 -lactams
In 1929, Scottish microbiologist Alexander Fleming discovered penicillin, the first
antibiotic in history. It is a -lactam antibiotic that specifically targets the bacterial
wall assembly system (114).
The rigid cell wall of bacteria is critical for maintaining cell shape and integrity, as
well as preventing cell lysis from the high internal osmotic pressure. All bacterial
cell walls have a common structural component, peptidoglycan (murein). It is a
polymer consisting of disaccharide subunits, substituted with tripeptide chains
with crosslinks, thereby establishing a rigid mesh-like network on the outside of
the plasma membrane. During bacterial growth and division, the cell wall is
constantly broken down, new peptidoglycan units inserted and then crosslinked
(63,86). -Lactam antibiotics target this cross-linking step. All -lactam drugs
contain a -lactam ring that has a reactive CO-N bond lying in the same position
as the one in the D-alanyl-D-alanine portion of the peptidoglycan unit. This D-
alanyl-D-alanine moiety is the substrate of penicillin-binding proteins (PBPs),
which include a host of related enzymes (transpeptidases, carboxypeptidases,
transglycosylase, and endopeptidases) involved in peptidoglycan cross-link
formation (63). As a result, -lactams act as substrate analogs of PBPs, inhibiting
their function by forming a covalent bond with the catalytic serine residue of the
enzyme active site. The action of -lactams disrupts the balance between cell
wall degradation and reproduction in growing cells, weakening cell wall structure,
and ultimately causing cytolysis due to osmotic pressure.

22
In recent years, the prevalence of bacterial resistance to -lactams has increased
considerably, leading to an enormous concern in the health care setting. One
major mechanism of -lactam resistance comes from -lactamases, which
hydrolyze the cyclic amide bond of the -lactam rings, thereby inactivating the
drug (63). Using an alternative PBP that is less reactive with -lactams also
represents a common strategy for -lactam resistance. In Gram-negative
bacteria (which have an outer membrane surrounding the peptidoglycan), porin
modification and induction of efflux pumps can minimize the concentration of -
lactam in the periplasm, and thereby also contributing to -lactam resistance (71).
1.5.2 Aminoglycosides
Aminoglycosides were first discovered in 1944. These amino-modified sugars are
positively charged at neutral pH because of the protonated amine groups. These
drugs bind electrostatically to the 16s rRNA, at the tRNA acceptor A site in the
30S ribosomal subunits. This binding interferes with the decoding process,
causing misreading and mistranslation, inhibiting protein synthesis, and
eventually leading to cell death (66,72).
The lethal activity of aminoglycosides is dependent upon transport across the
bacterial membrane, which can be summarized in three steps (100,102). (a) The
electrostatic binding of cationic drugs to anionic sites on the cell surface. This
step is rapid, reversible, concentration dependent, and energy-independent. (b)
Energy-dependent phase I. This is a slow step that requires a dose-dependent
threshold proton motive force. In this step, a small amount of drug enters the

23
cytoplasm, causing mistranslation and producing misfolded proteins.
Subsequently, some of the misread proteins are incorporated into the membrane,
increasing membrane permeability and triggering step (c)-energy-dependent
phase II. In step (c), large quantities of the drug gets into the cell, irreversibly
binding to ribosomes, inhibiting protein synthesis, and ultimately causing cell
death.
There are four major mechanisms of aminoglycoside resistance (72,102): (a)
inactivation of aminoglycosides by enzymatic modification, such as N-acetylation,
adenylylation or O-phosphorylation; (b) inhibiting the drug-target interaction by
16S rRNA methylation or ribosomal alteration; and minimizing intracellular
concentration of the drug by (c) reducing drug uptake or (d) increasing drug efflux.
Anaerobiosis is known to be intrinsically resistant to low doses of
aminoglycosides, because anaerobic fermentation usually generates a lower
proton motive force that impairs aminoglycoside uptake. The sensitivity can be
restored by using higher concentrations of aminoglycosides to reduce the
threshold proton motive force, or by supplying nitrate as an alternative respiratory
substrate to generate higher proton motive force under anaerobic conditions
(102).
1.5.3 Fluoroquinolones
The first quinolone, nalidixic acid, was discovered in 1962. Fluoroquinolones are
synthesized by substitution of a fluoride atom at position C-6 on nalidixic acid,
and this modification greatly improves the biological activity of the drug.
Additional structural modification further broadens the antibacterial spectrum,

24
making fluoroquinolones one of the most wildly used antibiotic agents in clinical
settings (26).
Quinolones inhibit two essential type II topoisomerases in bacterial: DNA gyrase
is their primary target in Gram-negative bacteria, while topoisomerase IV is the
one in Gram-positive bacteria (26,60).
During DNA replication, rapid rotation of the DNA at the replication fork
generates positive supercoils, which will block replication fork movement if they
accumulate. DNA gyrase acts in front of the replication fork to relieve positive
supercoils and introduce negative supercoils. Topoisomerase IV is involved in
decatenation of two daughter molecules after DNA replication. Both enzymes
induce transient staggered, single strand DNA breaks during their function, and
then reseal the phosphodiester bonds after strand passage (26,60).
Fluoroquinolones enter the cell by passive diffusion. These drugs then quickly
bind to type II topoisomerase-DNA complex and trap the enzymes on DNA. After
DNA cleavage occurs in the drug-enzyme-DNA complex, the 5’ ends of the
broken DNA are covalently attached to the enzyme, but re-ligation is inhibited by
the drug. This complex is called cleaved complex, which is reversible if quinolone
is removed and thus is not lethal by itself. At bacteriostatic concentrations, the
formation of cleaved complexes blocks the movement of replication forks,
induces SOS response and inhibits cell growth. But the broken DNA is locked in
the complexes, and the chromosome remains intact. However, at bactericidal
concentrations, the broken DNA ends are released from the cleaved complexes,

25
causing chromosome fragmentation and cell death. Depending on the drug
structure, lethal effects of fluoroquinolones can be oxygen dependent, protein
synthesis dependent, or both oxygen and protein synthesis independent
(25,26,60,73).
The mechanisms of resistance to quinolone come from three common antibiotic-
resistance strategies: (a) decrease the drug uptake by porin deletion to reduce
outer-membrane permeability; (b) increase the drug export by expression of
multidrug efflux pumps; (c) alter the drug targets by mutations in DNA gyrase and
topoisomerase IV (103).
1.5.4 Hypothesis of antibiotic-mediated oxidative stress
Unlike redox cycling drugs, the action of classic antibiotics does not produce O2-
or H2O2, and their bacterial resistance mechanisms do not involve defense
systems against oxidative stress. However, about ten years ago, several studies
reported that by using nitroblue tetrazolium reaction (NBT) and lucigenin,
intracellular O2- formation were detected after incubation with -lactams or
fluoroquinolones. This raised the possibility that oxidative stress could be
induced in antibiotic treated bacterial cells (1,8). A few years later, researchers
found that addition of glutathione or ascorbic acid, and overexpression of
superoxide dismutase prevented fluoroquinolone killing (37). Then several other
groups did systematic studies and reported that classic bactericidal antibiotics,
including aminoglycosides, -lactams, and fluoroquinolones, triggered oxidative
stress that led to cell death (16,27,32,61,62). In these later studies, E. coli cells
were treated with low doses of antibiotics in LB broth under aerobic conditions. A

26
redox sensitive, cell-penetrating fluorescent probe (hydroxyphenyl fluorescein,
HPF) gave higher fluorescent signals in antibiotic-treated cells, and this signal
was attributed to hydroxyl radicals. Iron chelators (dipyridyl or o-phenanthroline),
which suppress hydroxyl radical-generating Fenton reaction, and thiourea, a
potent quencher of hydroxyl radicals, improved the survival rate and decreased
the fluorescent signal. The SoxRS system but not the OxyR regulon was induced
after antibiotic treatment. Mutants in the tricarboxylic acid cycle (TCA) were more
resistant to antibiotics. NADH concentration greatly dropped upon antibiotic
exposure. Furthermore, DNA repair-deficient mutants (recA) were somewhat
more sensitive to low doses of antibiotics. Therefore, the authors proposed that
bactericidal antibiotics were able to cause oxidative damage, and that was a
common mechanism of their lethal effect. In this model, bactericidal antibiotics,
irrespective of their drug-targets, stimulate NADH consumption via the electron
transport chain. Hyperactivation of the electron transport chain accelerates
superoxide formation. Superoxide damages solvent exposed [Fe-S] cluster
containing enzymes, releasing iron into the cytoplasm, and driving hydroxyl
radical formation via the Fenton reaction. Then Fenton-mediated DNA damage
contributes to cell death. This scenario could explain the observed oxidation of
intracellular dyes, protection by scavengers and chelators, a requirement for
respiration, and the sensitivity of DNA-repair mutants.
This is a very exciting idea and quickly became highly cited work. These
approaches for ROS detection (using ROS scavenger or HPF probe) were also
widely used in various studies(14,40,80,84,97,106,110). If the hypothesis is true,

27
it could change our strategy for antimicrobial therapies. However, the available
data are suggestive but not conclusive. It is unclear how different drug-target
interactions stimulate metabolic feedback and NADH consumption. Though
aminoglycosides were suggested to stimulate reactive oxygen species formation
by triggering envelope stress response (62), there was no model for -lactams
and fluoroquinolones. Furthermore, there are no direct data about the respiration
rate, the levels of superoxide or hydrogen peroxide, the oxidant-sensitive enzyme
activities and the intracellular iron concentrations. Also, induction of the SoxRS
system but not the OxyR regulon makes one concerned about whether oxidative
stress really occurs, since activation of the SoxRS system is not directly
correlated with O2- stress (42). Adding iron chelators or thiourea to the cell may
alter cellular metabolism, and their protective effects may not be related to the
Fenton chemistry. At last, chemiluminescent or fluorescence probes were used in
these studies to detect ROS, which might raise some problems. For examples,
NBT and lucigenin were used in cell systems for O2- measurement in the first
studies (1,8). However, NBT is only designed for cell free systems, and lucigenin
is not a reliable probe for O2-. In the later studies, HPF probes were widely
applied for hydroxyl radical detection (16,27,32,61,62). Though HPF probes can
be oxidized in a Fenton system (96), there are no direct data showing that it is
specific for hydroxyl radicals inside the cell. HPF has a structure similar to
DCFH2-DA (Figure 1.2E); therefore, the oxidation of HPF may also be
complicated as that of DCFH2 inside a biological system, and the intensity of
fluorescence signals may not represent the level of hydroxyl radicals. Hence,

28
more work need to be done to evaluate this hypothesis and my second project is
to directly test the molecular mechanisms underlying this hypothesis.
29
1.6 Tables
Table 1.1 H2O2-inducible defense system-OxyR regulon.
Role OxyR regulated gene
Defend against the Fenton chemistry
H2O2 scavenging ahpCF
katG
Fe-import control fur
Fe scavenging dps
Maintain enzyme function
Fe-S cluster assembly & repair sufABCDE
Mn transporter mntH
Others
Disulfide reduction
trxC
grxA
gor
Protein degradation clpS
Unknown function
yaaA
yajA
ybjM

30
Table 1.2 Redox cycling drug-induced defense system-SoxRS regulon.
Role SoxS regulated gene
Control intracellular drug concentration
Cell envelop permeability
micF
waaY
waaZ
Drug efflux pumps acrAB
tolC
Drug detoxification
nfsA
ygfZ
nfnB
Multiple antibiotic resistance marAB
Reduce O2- damage
Scavenging O2- sodA
Fe-import control fur
DNA repair nfo
Fe-S cluster repair yggX
Oxidant-resistant dehydratases-isoform acnA
fumC
Restore NADPH pool
Restore NADPH pool
zwf
fpr
fldA
fldB

31
1.7 Figures
Figure 1.1 Life evolved in an anaerobic environment. (Adapted from Alberts, et al. Molecular Biology of the Cell, 4th edition, 2002)

32
Figure 1.2 Common ROS detection probes

33
1.8 References
1. Albesa, I., M. C. Becerra, P. C. Battan, and P. L. Paez. 2004. Oxidative stress involved in the antibacterial action of different antibiotics. Biochem. Biophys. Res. Commun. 317:605-609.
2. Alfadda, A. A. and R. M. Sallam. 2012. Reactive oxygen species in health and disease. J. Biomed. Biotechnol. 2012:936486.
3. Altuvia, S., M. Almiron, G. Huisman, R. Kolter, and G. Storz. 1994. The dps promoter is activated by OxyR during growth and by IHF and sigma S in stationary phase. Mol. Microbiol. 13:265-272.
4. Anbar, M. and P. Neta. 1967. A Compilation of Specific Biomolecular Rate Constants for the Reactions of Hydrated Electrons, Hydrogen Atoms and Hydroxyl Radicals with Inorganic and Organic Compounds in Aqueous Solutions. International Journal of Applied Radiation and Isotopes 18:493-523.
5. Anjem, A. and J. A. Imlay. 2012. Mononuclear iron enzymes are primary targets of hydrogen peroxide stress. J. Biol. Chem. 287:15544-15556.
6. Anjem, A., S. Varghese, and J. A. Imlay. 2009. Manganese import is a key element of the OxyR response to hydrogen peroxide in Escherichia coli. Mol. Microbiol. 72:844-858
7. Aslund, F., M. Zheng, J. Beckwith, and G. Storz. 1999. Regulation of the OxyR transcription factor by hydrogen peroxide and the cellular thiol-disulfide status. Proc. Natl. Acad. Sci. U. S. A. 96:6161-6165.
8. Becerra, M. C. and I. Albesa. 2002. Oxidative stress induced by ciprofloxacin in Staphylococcus aureus. Biochem. Biophys. Res. Commun. 297:1003-1007.
9. Bjerrum, C. J. and D. E. Canfield. 2002. Ocean productivity before about 1.9 Gyr ago limited by phosphorus adsorption onto iron oxides. Nature. 417:159-162.
10. Block, K. and Y. Gorin. 2012. Aiding and abetting roles of NOX oxidases in cellular transformation. Nat. Rev. Cancer. 12:627-637.
11. Bolton, J. L., M. A. Trush, T. M. Penning, G. Dryhurst, and T. J. Monks. 2000. Role of quinones in toxicology. Chem. Res. Toxicol. 13:135-160.
12. Burman, J. D., R. L. Harris, K. A. Hauton, D. M. Lawson, and R. G. Sawers. 2004. The iron-sulfur cluster in the L-serine dehydratase TdcG from Escherichia coli is required for enzyme activity. FEBS Lett. 576:442-444.
13. Carlioz, A. and D. Touati. 1986. Isolation of superoxide dismutase mutants in Escherichia coli: is superoxide dismutase necessary for aerobic life? EMBO J. 5:623-630.

34
14. Choung, Y. H., A. Taura, K. Pak, S. J. Choi, M. Masuda, and A. F. Ryan. 2009. Generation of highly-reactive oxygen species is closely related to hair cell damage in rat organ of Corti treated with gentamicin. Neuroscience. 161:214-226.
15. Cooper, R. A., P. F. Knowles, D. E. Brown, M. A. McGuirl, and D. M. Dooley. 1992. Evidence for copper and 3,4,6-trihydroxyphenylalanine quinone cofactors in an amine oxidase from the gram-negative bacterium Escherichia coli K-12. Biochem. J. 288:337-340.
16. Davies, B. W., M. A. Kohanski, L. A. Simmons, J. A. Winkler, J. J. Collins, and G. C. Walker. 2009. Hydroxyurea induces hydroxyl radical-mediated cell death in Escherichia coli. Mol. Cell. 36:845-860.
17. Demple, B., J. Halbrook, and S. Linn. 1983. Escherichia coli xth mutants are hypersensitive to hydrogen peroxide. J. Bacteriol. 153:1079-1082.
18. Denu, J. M. and K. G. Tanner. 1998. Specific and reversible inactivation of protein tyrosine phosphatases by hydrogen peroxide: evidence for a sulfenic acid intermediate and implications for redox regulation. Biochemistry. 37:5633-5642.
19. Dietrich, L. E., T. K. Teal, A. Price-Whelan, and D. K. Newman. 2008. Redox-active antibiotics control gene expression and community behavior in divergent bacteria. Science. 321:1203-1206.
20. Dikalov, S. I. and D. G. Harrison. 2012. Methods for Detection of Mitochondrial and Cellular Reactive Oxygen Species. Antioxid. Redox. Signal. Epub ahead of print.
21. Ding, H. and B. Demple. 2000. Direct nitric oxide signal transduction via nitrosylation of iron-sulfur centers in the SoxR transcription activator. Proc. Natl. Acad. Sci. U. S. A. 97:5146-5150.
22. Ding, H. and B. Demple. 1997. In vivo kinetics of a redox-regulated transcriptional switch. Proc. Natl. Acad. Sci. U. S. A. 94:8445-8449.
23. Dizdaroglu, M. and P. Jaruga. 2012. Mechanisms of free radical-induced damage to DNA. Free Radic. Res. 46:382-419.
24. Dougan, D. A., B. G. Reid, A. L. Horwich, and B. Bukau. 2002. ClpS, a substrate modulator of the ClpAP machine. Mol. Cell. 9:673-683.
25. Drlica, K., H. Hiasa, R. Kerns, M. Malik, A. Mustaev, and X. Zhao. 2009. Quinolones: action and resistance updated. Curr. Top. Med. Chem. 9:981-998.
26. Drlica, K., M. Malik, R. J. Kerns, and X. Zhao. 2008. Quinolone-mediated bacterial death. Antimicrob. Agents Chemother. 52:385-392.

35
27. Dwyer, D. J., M. A. Kohanski, B. Hayete, and J. J. Collins. 2007. Gyrase inhibitors induce an oxidative damage cellular death pathway in Escherichia coli. Mol. Syst. Biol. 3:91.
28. Erbse, A., R. Schmidt, T. Bornemann, J. Schneider-Mergener, A. Mogk, R. Zahn, D. A. Dougan, and B. Bukau. 2006. ClpS is an essential component of the N-end rule pathway in Escherichia coli. Nature. 439:753-756.
29. Finkelstein, E., G. M. Rosen, and E. J. Rauckman. 1980. Spin trapping of superoxide and hydroxyl radical: practical aspects. Arch. Biochem. Biophys. 200:1-16.
30. Flint, D. H., J. F. Tuminello, and M. H. Emptage. 1993. The inactivation of Fe-S cluster containing hydro-lyases by superoxide. J. Biol. Chem. 268:22369-22376.
31. Forman, H. J., J. M. Fukuto, and M. Torres. 2004. Redox signaling: thiol chemistry defines which reactive oxygen and nitrogen species can act as second messengers. Am. J. Physiol Cell Physiol. 287:C246-C256.
32. Foti, J. J., B. Devadoss, J. A. Winkler, J. J. Collins, and G. C. Walker. 2012. Oxidation of the guanine nucleotide pool underlies cell death by bactericidal antibiotics. Science. 336:315-319.
33. Gardner, P. R. and I. Fridovich. 1991. Superoxide sensitivity of the Escherichia coli 6-phosphogluconate dehydratase. J. Biol. Chem. 266:1478-1483.
34. Gardner, P. R. and I. Fridovich. 1991. Superoxide sensitivity of the Escherichia coli aconitase. J. Biol. Chem. 266:19328-19333.
35. Gaudu, P., N. Moon, and B. Weiss. 1997. Regulation of the soxRS oxidative stress regulon. Reversible oxidation of the Fe-S centers of SoxR in vivo. J. Biol. Chem. 272:5082-5086.
36. Glass, G. A., D. M. DeLisle, P. DeTogni, T. G. Gabig, B. H. Magee, M. Markert, and B. M. Babior. 1986. The respiratory burst oxidase of human neutrophils. Further studies of the purified enzyme. J. Biol. Chem. 261:13247-13251.
37. Goswami, M., S. H. Mangoli, and N. Jawali. 2006. Involvement of reactive oxygen species in the action of ciprofloxacin against Escherichia coli. Antimicrob. Agents Chemother. 50:949-954.
38. Gotz, F., B. Sedewitz, and E. F. Elstner. 1980. Oxygen utilization by Lactobacillus plantarum. I. Oxygen consuming reactions. Arch. Microbiol. 125:209-214.
39. Grant, R. A., D. J. Filman, S. E. Finkel, R. Kolter, and J. M. Hogle. 1998. The crystal structure of Dps, a ferritin homolog that binds and protects DNA. Nat. Struct. Biol. 5:294-303.

36
40. Grant, S. S., B. B. Kaufmann, N. S. Chand, N. Haseley, and D. T. Hung. 2012. Eradication of bacterial persisters with antibiotic-generated hydroxyl radicals. Proc. Natl. Acad. Sci. U. S. A. 109:12147-12152.
41. Greenberg, J. T., P. Monach, J. H. Chou, P. D. Josephy, and B. Demple. 1990. Positive control of a global antioxidant defense regulon activated by superoxide-generating agents in Escherichia coli. Proc. Natl. Acad. Sci. U. S. A. 87:6181-6185.
42. Gu, M. and J. A. Imlay. 2011. The SoxRS response of Escherichia coli is directly activated by redox-cycling drugs rather than by superoxide. Mol. Microbiol. 79:1136-1150.
43. Halliwell, B. and M. Whiteman. 2004. Measuring reactive species and oxidative damage in vivo and in cell culture: how should you do it and what do the results mean? Br. J. Pharmacol. 142:231-255.
44. Hernandez, M. E. and D. K. Newman. 2001. Extracellular electron transfer. Cell Mol. Life Sci. 58:1562-1571.
45. Ilari, A., P. Ceci, D. Ferrari, G. L. Rossi, and E. Chiancone. 2002. Iron incorporation into Escherichia coli Dps gives rise to a ferritin-like microcrystalline core. J. Biol. Chem. 277:37619-37623.
46. Imlay, J. and I. Fridovich. 1992. Exogenous quinones directly inhibit the respiratory NADH dehydrogenase in Escherichia coli. Arch. Biochem. Biophys. 296:337-346.
47. Imlay, J. A. 2003. Pathways of oxidative damage. Annu. Rev. Microbiol. 57:395-418.
48. Imlay, J. A. 2008. Cellular Defenses against Superoxide and Hydrogen Peroxide. Annu. Rev. Biochem. 77:755-776.
49. Imlay, J. A., S. M. Chin, and S. Linn. 1988. Toxic DNA damage by hydrogen peroxide through the Fenton reaction in vivo and in vitro. Science. 240:640-642.
50. Imlay, J. A. and I. Fridovich. 1991. Assay of metabolic superoxide production in Escherichia coli. J. Biol. Chem. 266:6957-6965.
51. Imlay, J. A. and S. Linn. 1986. Bimodal pattern of killing of DNA-repair-defective or anoxically grown Escherichia coli by hydrogen peroxide. J. Bacteriol. 166:519-527.
52. Jang, S. and J. A. Imlay. 2010. Hydrogen peroxide inactivates the Escherichia coli Isc iron-sulphur assembly system, and OxyR induces the Suf system to compensate. Mol. Microbiol. 78:1448-1467.
53. Jang, S. and J. A. Imlay. 2007. Micromolar intracellular hydrogen peroxide disrupts metabolism by damaging iron-sulfur enzymes. J. Biol. Chem. 282:929-937.

37
54. Kalyanaraman, B., V. rley-Usmar, K. J. Davies, P. A. Dennery, H. J. Forman, M. B. Grisham, G. E. Mann, K. Moore, L. J. Roberts, and H. Ischiropoulos. 2012. Measuring reactive oxygen and nitrogen species with fluorescent probes: challenges and limitations. Free Radic. Biol. Med. 52:1-6.
55. Karlsson, M., T. Kurz, U. T. Brunk, S. E. Nilsson, and C. I. Frennesson. 2010. What does the commonly used DCF test for oxidative stress really show? Biochem. J. 428:183-190.
56. Kehres, D. G., A. Janakiraman, J. M. Slauch, and M. E. Maguire. 2002. Regulation of Salmonella enterica serovar Typhimurium mntH transcription by H(2)O(2), Fe(2+), and Mn(2+). J. Bacteriol. 184:3151-3158.
57. Keseler, I. M., A. Mackie, M. Peralta-Gil, A. Santos-Zavaleta, S. Gama-Castro, C. Bonavides-Martinez, C. Fulcher, A. M. Huerta, A. Kothari, M. Krummenacker, M. Latendresse, L. Muniz-Rascado, Q. Ong, S. Paley, I. Schroder, A. G. Shearer, P. Subhraveti, M. Travers, D. Weerasinghe, V. Weiss, J. Collado-Vides, R. P. Gunsalus, I. Paulsen, and P. D. Karp. 2013. EcoCyc: fusing model organism databases with systems biology. Nucleic Acids Res. 41:D605-D612.
58. Keyer, K., A. S. Gort, and J. A. Imlay. 1995. Superoxide and the production of oxidative DNA damage. J. Bacteriol. 177:6782-6790.
59. Keyer, K. and J. A. Imlay. 1996. Superoxide accelerates DNA damage by elevating free-iron levels. Proc. Natl. Acad. Sci. U. S. A. 93:13635-13640.
60. Khodursky, A. B. and N. R. Cozzarelli. 1998. The mechanism of inhibition of topoisomerase IV by quinolone antibacterials. J. Biol. Chem. 273:27668-27677.
61. Kohanski, M. A., D. J. Dwyer, B. Hayete, C. A. Lawrence, and J. J. Collins. 2007. A common mechanism of cellular death induced by bactericidal antibiotics. Cell. 130:797-810.
62. Kohanski, M. A., D. J. Dwyer, J. Wierzbowski, G. Cottarel, and J. J. Collins. 2008. Mistranslation of membrane proteins and two-component system activation trigger antibiotic-mediated cell death. Cell. 135:679-690.
63. Kong, K. F., L. Schneper, and K. Mathee. 2010. Beta-lactam antibiotics: from antibiosis to resistance and bacteriology. APMIS. 118:1-36.
64. Korshunov, S. and J. A. Imlay. 2010. Two sources of endogenous hydrogen peroxide in Escherichia coli. Mol. Microbiol. 75:1389-1401.
65. Korshunov, S. and J. A. Imlay. 2006. Detection and quantification of superoxide formed within the periplasm of Escherichia coli. J. Bacteriol. 188:6326-6334.
66. Kotra, L. P., J. Haddad, and S. Mobashery. 2000. Aminoglycosides: perspectives on mechanisms of action and resistance and strategies to counter resistance. Antimicrob. Agents Chemother. 44:3249-3256.

38
67. Kuo, C. F., T. Mashino, and I. Fridovich. 1987. alpha, beta-Dihydroxyisovalerate dehydratase. A superoxide-sensitive enzyme. J. Biol. Chem. 262:4724-4727.
68. Lee, C., S. M. Lee, P. Mukhopadhyay, S. J. Kim, S. C. Lee, W. S. Ahn, M. H. Yu, G. Storz, and S. E. Ryu. 2004. Redox regulation of OxyR requires specific disulfide bond formation involving a rapid kinetic reaction path. Nat. Struct. Mol. Biol. 11:1179-1185.
69. Lee, J. H., W. S. Yeo, and J. H. Roe. 2004. Induction of the sufA operon encoding Fe-S assembly proteins by superoxide generators and hydrogen peroxide: involvement of OxyR, IHF and an unidentified oxidant-responsive factor. Mol. Microbiol. 51:1745-1755.
70. Liochev, S. I. and I. Fridovich. 1992. Fumarase C, the stable fumarase of Escherichia coli, is controlled by the soxRS regulon. Proc. Natl. Acad. Sci. U. S. A. 89:5892-5896.
71. Llarrull, L. I., S. A. Testero, J. F. Fisher, and S. Mobashery. 2010. The future of the beta-lactams. Curr. Opin. Microbiol. 13:551-557.
72. Magnet, S. and J. S. Blanchard. 2005. Molecular insights into aminoglycoside action and resistance. Chem. Rev. 105:477-498.
73. Malik, M., S. Hussain, and K. Drlica. 2007. Effect of anaerobic growth on quinolone lethality with Escherichia coli. Antimicrob. Agents Chemother. 51:28-34.
74. Massey, V. 1994. Activation of molecular oxygen by flavins and flavoproteins. J. Biol. Chem. 269:22459-22462.
75. Mavrodi, D. V., W. Blankenfeldt, and L. S. Thomashow. 2006. Phenazine compounds in fluorescent Pseudomonas spp. biosynthesis and regulation. Annu. Rev. Phytopathol. 44:417-445.
76. Mehdy, M. C. 1994. Active Oxygen Species in Plant Defense against Pathogens. Plant Physiol. 105:467-472.
77. Messner, K. R. and J. A. Imlay. 2002. Mechanism of superoxide and hydrogen peroxide formation by fumarate reductase, succinate dehydrogenase, and aspartate oxidase. J. Biol. Chem. 277:42563-42571.
78. Messner, K. R. and J. A. Imlay. 1999. The identification of primary sites of superoxide and hydrogen peroxide formation in the aerobic respiratory chain and sulfite reductase complex of Escherichia coli. J. Biol. Chem. 274:10119-10128.
79. Moenne-Loccoz, P., N. Nakamura, V. Steinebach, J. A. Duine, M. Mure, J. P. Klinman, and J. Sanders-Loehr. 1995. Characterization of the topa quinone cofactor in amine oxidase from Escherichia coli by resonance Raman spectroscopy. Biochemistry. 34:7020-7026.

39
80. Mols, M., K. R. van, C. C. van Melis, R. Moezelaar, and T. Abee. 2010. Analysis of acid-stressed Bacillus cereus reveals a major oxidative response and inactivation-associated radical formation. Environ. Microbiol. 12:873-885.
81. Monks, T. J. and D. C. Jones. 2002. The metabolism and toxicity of quinones, quinonimines, quinone methides, and quinone-thioethers. Curr. Drug Metab. 3:425-438.
82. Morimyo, M. 1982. Anaerobic incubation enhances the colony formation of a polA recB strain of Escherichia coli K-12. J. Bacteriol. 152:208-214.
83. Naqui, A., B. Chance, and E. Cadenas. 1986. Reactive oxygen intermediates in biochemistry. Annu. Rev. Biochem. 55:137-166.
84. Nguyen, D., A. Joshi-Datar, F. Lepine, E. Bauerle, O. Olakanmi, K. Beer, G. McKay, R. Siehnel, J. Schafhauser, Y. Wang, B. E. Britigan, and P. K. Singh. 2011. Active starvation responses mediate antibiotic tolerance in biofilms and nutrient-limited bacteria. Science. 334:982-986.
85. Outten, F. W., O. Djaman, and G. Storz. 2004. A suf operon requirement for Fe-S cluster assembly during iron starvation in Escherichia coli. Mol. Microbiol. 52:861-872.
86. Park, J. T. and T. Uehara. 2008. How bacteria consume their own exoskeletons (turnover and recycling of cell wall peptidoglycan). Microbiol. Mol. Biol. Rev. 72:211-227.
87. Park, S. and J. A. Imlay. 2003. High levels of intracellular cysteine promote oxidative DNA damage by driving the fenton reaction. J. Bacteriol. 185:1942-1950.
88. Park, S., X. You, and J. A. Imlay. 2005. Substantial DNA damage from submicromolar intracellular hydrogen peroxide detected in Hpx- mutants of Escherichia coli. Proc. Natl. Acad. Sci. U. S. A. 102:9317-9322.
89. Park, S. J. and R. P. Gunsalus. 1995. Oxygen, iron, carbon, and superoxide control of the fumarase fumA and fumC genes of Escherichia coli: role of the arcA, fnr, and soxR gene products. J. Bacteriol. 177:6255-6262.
90. Peskin, A. V., F. M. Low, L. N. Paton, G. J. Maghzal, M. B. Hampton, and C. C. Winterbourn. 2007. The high reactivity of peroxiredoxin 2 with H(2)O(2) is not reflected in its reaction with other oxidants and thiol reagents. J. Biol. Chem. 282:11885-11892.
91. Pomposiello, P. J., M. H. Bennik, and B. Demple. 2001. Genome-wide transcriptional profiling of the Escherichia coli responses to superoxide stress and sodium salicylate. J. Bacteriol. 183:3890-3902.
92. Pomposiello, P. J., A. Koutsolioutsou, D. Carrasco, and B. Demple. 2003. SoxRS-regulated expression and genetic analysis of the yggX gene of Escherichia coli. J. Bacteriol. 185:6624-6632.

40
93. Seaver, L. C. and J. A. Imlay. 2001. Alkyl hydroperoxide reductase is the primary scavenger of endogenous hydrogen peroxide in Escherichia coli. J. Bacteriol. 183:7173-7181.
94. Seaver, L. C. and J. A. Imlay. 2001. Hydrogen peroxide fluxes and compartmentalization inside growing Escherichia coli. J. Bacteriol. 183:7182-7189.
95. Seki, M., K. Iida, M. Saito, H. Nakayama, and S. Yoshida. 2004. Hydrogen peroxide production in Streptococcus pyogenes: involvement of lactate oxidase and coupling with aerobic utilization of lactate. J. Bacteriol. 186:2046-2051.
96. Setsukinai, K., Y. Urano, K. Kakinuma, H. J. Majima, and T. Nagano. 2003. Development of novel fluorescence probes that can reliably detect reactive oxygen species and distinguish specific species. J. Biol. Chem. 278:3170-3175.
97. Shatalin, K., E. Shatalina, A. Mironov, and E. Nudler. 2011. H2S: a universal defense against antibiotics in bacteria. Science. 334:986-990.
98. Sobota, J. M. and J. A. Imlay. 2011. Iron enzyme ribulose-5-phosphate 3-epimerase in Escherichia coli is rapidly damaged by hydrogen peroxide but can be protected by manganese. Proc. Natl. Acad. Sci. U. S. A. 108:5402-5407.
99. Spellerberg, B., D. R. Cundell, J. Sandros, B. J. Pearce, I. Idanpaan-Heikkila, C. Rosenow, and H. R. Masure. 1996. Pyruvate oxidase, as a determinant of virulence in Streptococcus pneumoniae. Mol. Microbiol. 19:803-813.
100. Taber, H. W., J. P. Mueller, P. F. Miller, and A. S. Arrow. 1987. Bacterial uptake of aminoglycoside antibiotics. Microbiol. Rev. 51:439-457.
101. Tsaneva, I. R. and B. Weiss. 1990. soxR, a locus governing a superoxide response regulon in Escherichia coli K-12. J. Bacteriol. 172:4197-4205.
102. Vakulenko, S. B. and S. Mobashery. 2003. Versatility of aminoglycosides and prospects for their future. Clin. Microbiol. Rev. 16:430-450.
103. van Hoek, A. H., D. Mevius, B. Guerra, P. Mullany, A. P. Roberts, and H. J. Aarts. 2011. Acquired antibiotic resistance genes: an overview. Front Microbiol. 2:203.
104. Varghese, S., Y. Tang, and J. A. Imlay. 2003. Contrasting sensitivities of Escherichia coli aconitases A and B to oxidation and iron depletion. J. Bacteriol. 185:221-230.
105. Varghese, S., A. Wu, S. Park, K. R. Imlay, and J. A. Imlay. 2007. Submicromolar hydrogen peroxide disrupts the ability of Fur protein to control free-iron levels in Escherichia coli. Mol. Microbiol. 64:822-830.

41
106. Wang, X., X. Zhao, M. Malik, and K. Drlica. 2010. Contribution of reactive oxygen species to pathways of quinolone-mediated bacterial cell death. J. Antimicrob. Chemother. 65:520-524.
107. Wang, Y., S. E. Kern, and D. K. Newman. 2010. Endogenous phenazine antibiotics promote anaerobic survival of Pseudomonas aeruginosa via extracellular electron transfer. J. Bacteriol. 192:365-369.
108. Wang, Y. and D. K. Newman. 2008. Redox reactions of phenazine antibiotics with ferric (hydr)oxides and molecular oxygen. Environ. Sci. Technol. 42:2380-2386.
109. Wang, Y., J. C. Wilks, T. Danhorn, I. Ramos, L. Croal, and D. K. Newman. 2011. Phenazine-1-carboxylic acid promotes bacterial biofilm development via ferrous iron acquisition. J. Bacteriol. 193:3606-3617.
110. Wang, Y., S. Yamamoto, A. Miyakawa, T. Sakurai, K. Ibaraki, and S. Terakawa. 2010. Intravital oxygen radical imaging in normal and ischemic rat cortex. Neurosurgery. 67:118-127.
111. Woodmansee, A. N. and J. A. Imlay. 2002. Reduced flavins promote oxidative DNA damage in non-respiring Escherichia coli by delivering electrons to intracellular free iron. J. Biol. Chem. 277:34055-34066.
112. Yamamoto, K., A. Ishihama, S. J. Busby, and D. C. Grainger. 2011. The Escherichia coli K-12 MntR miniregulon includes dps, which encodes the major stationary-phase DNA-binding protein. J. Bacteriol. 193:1477-1480.
113. Zaffagnini, M., L. Michelet, C. Marchand, F. Sparla, P. Decottignies, M. P. Le, M. Miginiac-Maslow, G. Noctor, P. Trost, and S. D. Lemaire. 2007. The thioredoxin-independent isoform of chloroplastic glyceraldehyde-3-phosphate dehydrogenase is selectively regulated by glutathionylation. FEBS J. 274:212-226.
114. Zhao, B., K. Ranguelova, J. Jiang, and R. P. Mason. 2011. Studies on the photosensitized reduction of resorufin and implications for the detection of oxidative stress with Amplex Red. Free Radic. Biol. Med. 51:153-159.
115. Zhao, G., P. Ceci, A. Ilari, L. Giangiacomo, T. M. Laue, E. Chiancone, and N. D. Chasteen. 2002. Iron and hydrogen peroxide detoxification properties of DNA-binding protein from starved cells. A ferritin-like DNA-binding protein of Escherichia coli. J. Biol. Chem. 277:27689-27696.
116. Zheng, M., F. Aslund, and G. Storz. 1998. Activation of the OxyR transcription factor by reversible disulfide bond formation. Science. 279:1718-1721.
117. Zheng, M., B. Doan, T. D. Schneider, and G. Storz. 1999. OxyR and SoxRS regulation of fur. J. Bacteriol. 181:4639-4643.

42
118. Zheng, M., X. Wang, L. J. Templeton, D. R. Smulski, R. A. LaRossa, and G. Storz. 2001. DNA microarray-mediated transcriptional profiling of the Escherichia coli response to hydrogen peroxide. J. Bacteriol. 183:4562-4570.

43
CHAPTER TWO: THE YAAA PROTEIN OF THE ESCHERICHIA
COLI OXYR REGULON LESSENS HYDROGEN PEROXIDE
TOXICITY BY DECREASING INTRACELLULAR
UNINCORPORATED IRON CONCENTRATION
2.1 Introduction
Microarray data from a previous study indicated that the peroxide responsive
OxyR regulon includes several genes whose roles are not obvious (40). One of
these, yaaA, is predicted to encode a 29.6 kDa cytoplasmic protein that belongs
to a protein family domain of unknown function (DUF328). Members of the
DUF328 family are found in 1, 392 species, including 1, 377 Bacteria and 15
Eukaryotes, but they are not found in Archea currently in Pfam database (8).
Since YaaA is conserved in a large number of bacteria, it appears that
maintaining this gene may provide these organisms with a selective advantage.
Exploring the function of YaaA may provide insight into the H2O2 defense
systems that are used by other organisms.
2.2 Materials and Methods
2.2.1 Reagents
-Mercaptoethanol, bovine liver catalase, chelex 100, L-cystine dihydrochloride,
deferoxamine mesylate (DFO), diethylenetriaminepentaacetic acid (DTPA), ferric
chloride, type II horseradish peroxidase, 30% hydrogen peroxide, -nitropheny--
D-galactopyranoside (ONPG), thiamine, and trimethoprim were purchased from
Sigma. Potassium cyanide and -(4-pyridyl-1-oxide)-N-tert-butylnitrone (4-POBN)

44
were from Aldrich. Hanks balanced salt solution without CaCl2, MgCl2, MgSO4,
and phenol red (HBSS) was obtained from GIBCO. Coomassie Protein Assay
Reagent and Albumin Standard were purchased from Thermo Scientific. Hy-
Case Amino and 2, 4-dinitrophenylhydrazine (DNPH) were from Fluka, and
Amplex Red was purchased from Molecular Probes. SuperScript II reverse
transcriptase was from Invitrogen. Standard reagents for RNA work and DNase I
were obtained from Ambion. iQTM SYBR Green Supermix was from BioRad, and
real-time PCR plates were purchased from Eppendorf.
2.2.2 Strain construction
The strains used in this study are listed in Table 2.1. Deletions were constructed
by the Red recombination deletion method (7) and were transferred to other
strains by P1 transduction (22). The antibiotic resistant cassettes were
subsequently removed by FLP-mediated excision (7). Gene fusions between
yaaA upstream region (-290 bp to -1 bp) and lacZ were created by standard
methods and integrated into the lambda phage attachment site (13), preserving
the wild-type yaaA locus at its native chromosomal locus.
2.2.3 Plasmid construction
The yaaA coding sequence was amplified by PCR from E. coli MG1655 genomic
DNA using the forward primer 5-TTTCAGAATTCTAAATTTCCTGCAAGGACTG-
3 and the reverse primer 5-GATCCTCTAGACAAACTTAACGCTGCTCGTA-3.
These oligonucleotide primers were designed to engineer EcoRI and XbaI sites
at the 5 and 3 ends of the gene, respectively. The PCR products were purified,
45
digested with EcoRI and XbaI and inserted into pWKS30 vector (34) so that yaaA
expression was controlled by the lac promoter. The correctness of the plasmid
construct was confirmed by sequencing; it successfully complemented the
phenotype of yaaA deletion in H2O2 stress cells without causing growth defect in
yaaA+ strains.
2.2.4 Bacterial growth
Complex growth medium was LB (10 g BactoTM tryptone, 5 g yeast extract, and
10 g NaCl per liter). Defined glucose/amino acids medium contained minimal A
salts (22), 0.2% glucose, 0.2% casamino acids, 0.5 mM tryptophan, 0.02%
MgSO47H2O, and 5 g/ml thiamine. When antibiotic selection was required,
media were supplemented with 100 g/ml ampicillin sodium salt, 20 g/ml
chloramphenicol, 30 g/ml kanamycin sulfate, 100 g/ml spectinomycin
dihydrochloride, or 12 g/ml tetracycline HCl.
Experimental protocols were designed to ensure that measurements were
performed upon exponentially growing cells. For growth studies, anaerobic
overnight cultures were diluted into anaerobic media and grown for 4 to 5
generations to early log phase (OD600nm of 0.15 to 0.20). The cultures were then
diluted into aerobic medium of the same composition to an OD600nm of 0.0005-
0.010. All cultures were grown at 37 C. Aerobic LB medium was made one day
previously and stored in the dark to avoid the photochemical generation of H2O2.
Aerobic defined medium was prepared immediately prior to use. Anaerobic
medium was transferred immediately after autoclaving to an anaerobic chamber

46
(Coy Laboratory Products), where it was stored under an atmosphere of 5%
CO2/10% H2/85% N2 for at least one day prior to use. When used, DFO was
made fresh and added into the media at a final concentration of 2 mM before
inoculation.
2.2.5 Cell viability
To determine cell viability, cell samples were collected at designated time points
and mixed with catalase (final 250 U/ml) to scavenge residual H2O2. Samples
were then serially diluted, mixed with top agar, and spread onto the surface of
anaerobic plates. Colony-forming unit (CFU) enumeration was performed after
24-48 h anaerobic incubation.
For co-culture experiments, anaerobic exponential-phase cells were mixed at 9:1
and 1:9 ratio of Hpx- yaaA+ (chloramphenicol sensitive) to Hpx- yaaA-
(chloramphenicol resistant) in aerobic LB. Mixed cultures were aerated by
vigorous shaking and viability was followed over time. The viability of Hpx- yaaA-
cells was determined by plating on LB + 20 g/ml chloramphenicol plates,
whereas the total viability of co-cultured cells was determined by plating on LB
plates.
2.2.6 Differential interference contrast (DIC) microscopy
Cultures were grown in anaerobic LB medium to exponential-phase before
dilution into aerobic LB medium to an OD600nm of 0.0005. They were then grown
for 5 hours. Images were captured by DIC as described by Gut, et. al (12).

47
2.2.7 thyA forward mutagenesis assay
In order to determine the frequency of mutagenesis, Thy- mutants were selected
using trimethoprim (22). Strains were transferred from anaerobic LB to aerobic
LB as described above. At designated intervals, aliquots were removed, mixed
with catalase to stop oxidative stress, and washed with minimal glucose/amino
acids medium at room temperature three times. The cells were placed in an
anaerobic chamber and diluted into minimal A salts. The number of viable cells
was determined by dilution and plating in 2 ml F-top agar containing 1 mg/ml
thymidine on defined glucose/amino acids plates. thyA mutants were selected for
by including 0.2 mg/ml trimethoprim in the F-top agar and CFU were determined
after anaerobic incubation at 37 °C for 48 h. For each experiment, a subset of the
trimethoprim-resistant colonies were tested and confirmed to be Thy- by
examining their growth on minimal glucose/amino acids plates with and without
thymidine supplementation.
2.2.8 H2O2 killing assay
Cells were grown in minimal A glucose medium containing 0.5 mM tryptophan,
phenylalanine, and tyrosine to an OD600nm of 0.15 as described above. The
cultures were then diluted to an OD600nm of 0.025 in the same medium and
incubated for 5 min with either 3.3 mM potassium cyanide (37) or with 0.5 mM
cystine (23). H2O2 (final 2.5 mM) was then added. At time points, aliquots were
removed, and catalase (final 2500 U/ml) was added in order to terminate the
H2O2 stress. After serial dilution, samples were mixed with top agar and spread

48
on minimal A defined medium plates. CFUs were determined after anaerobic
incubation at 37 °C for 48 h.
2.2.9 EPR spin trapping of hydroxyl radicals
Cells were cultured in aerobic LB as described above. The cells were then
harvested at an OD600nm of 0.2, when the growth of Hpx- yaaA cells arrested. The
cells were washed twice with 25 ml of ice-cold chelex-treated HBSS and
resuspended in 0.5 ml of ice-cold HBSS. The cell suspension was added to a
room temperature mixture (total volume 1 ml) containing 100 mM DTPA, 10 mM
4-POBN, 170 mM ethanol, 1 mM H2O2, and HBSS and incubated at room
temperature for 12 min. The spectra of POBN ethanol radical adducts were
measured by EPR at room temperature with the following settings: field center,
3,393 G; field sweep, 100 G; modulation frequency, 100 kHz; modulation
amplitude, 1 G; time constant, 0.064; receiver gain, 63,000; and power, 20 mW
(20). The final cell densities were equivalent in all samples (~20 OD600nm).
2.2.10 EPR measurement of intracellular unincorporated iron
The cells were cultured in 600-1000 ml of aerobic LB as described above. Cells
were centrifuged and resuspended at 100-fold higher cell density in LB medium
containing 10 mM DTPA (pH 7.0) and 20 mM DFO (pH 8.0). The suspension was
incubated at 37 C aerobically for 15 min. The purpose of the cell-impermeable
chelator, DTPA, was to block further iron import, while and the cell-penetrating
iron chelator, DFO, facilitated oxidation of unincorporated ferrous iron to EPR-
detectable ferric iron, as described previously (36). The cell pellet was washed
twice with 5 ml of ice-cold 20 mM TrisHCl (pH 7.4) and finally re-suspended in

49
200 l of ice-cold 20 mM TrisHCl-30% glycerol (pH 7.4). EPR analyses were
performed as described previously (20). EPR signals were measured at a
temperature of 15 K in a Varian Century E-112 X-band spectrophotometer
equipped with a Varian TE102 cavity and temperature controller, with the
following settings: field center, 1,570 G; field sweep, 400 G; modulation
frequency, 100 kHz; modulation amplitude, 12.5 G; time constant, 0.032; receiver
gain, 4,000; and power, 10 mW. The measured EPR signals were normalized by
cell density and converted to intracellular concentrations using the following
conversion: 1 ml of E. coli culture at OD600nm of 1 comprises 0.52 l of
intracellular volume (15).
2.2.11 -Galactosidase activity
Cell extracts were prepared in ice-cold 50 mM TrisHCl (pH 8.0) by passage
through a French pressure cell (SIM Aminco FA-003). Cell debris was removed
by centrifugation, and -galactosidase activity in the supernatant was measured
by standard procedures (22). Protein concentrations were determined by the
Bradford assay using bovine serum albumin as the standard.
2.2.12 H2O2 measurement
Cells were cultured in defined glucose/amino acids medium under anaerobic
conditions to log phase, and then they were diluted into aerobic medium to an
OD600nm of 0.005 and grown to an OD600nm of ~ 0.15. These cells were
centrifuged, suspended in fresh defined medium at an OD600nm of 0.020, and
incubated aerobically at 37 °C with vigorous aeration. At time points, cells were

50
removed by centrifugation, and H2O2 concentrations were measured in the
supernatants using the Amplex Red/horseradish peroxidase method (28) in a
Shimadzu RF Mini-150 fluorometer. The rate of H2O2 formation was normalized
by cell density and converted to intracellular concentrations using the following
conversion: 1 ml of E. coli culture at OD600nm of 1 comprises 0.52 l of
intracellular volume (15).
2.2.13 Visualization of protein carbonylation
Cells were cultured in aerobic LB as described above. Hpx- yaaA cells were
harvested by centrifugation at the beginning (0.2 OD600nm) and in the middle of
the growth lag (~0.25 OD600nm). Other strains were collected at an OD600nm of
~0.2. Cell pellets were washed with ice-cold 50 mM potassium phosphate buffer,
pH 7.0, and re-suspended in the same buffer with 5 mM DTPA, which prevents
further protein oxidation in cell extracts. After lysis in a French pressing cell,
cellular debris was removed by centrifugation, and protein concentrations in the
cell extracts were determined using the Bradford assay. All samples were then
diluted to the same protein concentration (6 mg/ml). Protein carbonyl groups
were derivatized with DNPH, and the adducts were visualized by western blotting
(anti-DNP) (2).
2.2.14 Rapid amplification of cDNA ends (5-RACE)
MG1655 cells and Hpx- cells were cultured in LB as described above and
harvested at an OD600nm of ~0.2. RNA was extracted by the hot phenol method.
Contaminating DNA was removed by DNase I digestion, and the DNA-free RNA
samples were converted to cDNA by SuperScript II Reverse Transcriptase

51
according to the manufacturer’s instructions. The 5-end of yaaA transcripts was
determined by FirstChoice RLM-RACE Kit (Applied Biosystems). The PCR
primers used were: yaaA outer 5-race, 5-CTCGTTCAGCTTGTTGGTGAT-3;
yaaA inner 5-race, 5-AGCCGGTGTAGACATCACCTTT-3. Thermal cycling was
performed for 35 cycles in 3 steps: 94 C for 30 s, 65 C for 30 s and 72 C for 1
min.
2.2.15 Real-time PCR
Cells were cultured in LB as described above. When cultures achieved an
OD600nm of ~0.2, they were treated with H2O2 (0, 0.25, 1, and 2 mM) for 10 min at
room temperature. mRNA was harvested and converted to cDNA as described
above. The following primers were used to analyze expression of yaaA and the
housekeeping gene gapA: yaaA forward, 5-GCTGTTAGACAATTCCCAGCAG-3;
yaaA reverse, 5-AAGCCGGTGTAGACATCACCTT-3; gapA forward, 5-
CGTTCTGGGCTACACCGAAGATGACG-3; gapA reverse, 5-
AACCGGTTTCGTTGTCGTACCAGGA-3. The 25 l real-time PCR mixture
contained 1 ng of cDNA, 12.5 l of SYBR Green Supermix, and 1.6 M of each
primer. Thermal cycling was performed in Mastercycler ep realplex (Eppendorf)
for 40 cycles in 3 steps: 95 C for 20 s, 55 C for 20 s and 68 C for 20 s.

52
2.3 Results
2.3.1 The yaaA gene is induced by OxyR
The yaaA gene is predicted to encode a 29.6 kDa conserved cytoplasmic protein
that belongs to family domain of unknown function DUF328 (8). YaaA does not
possess amino acid similarity to proteins that have defined function, and it does
not have any recognizable motifs. DNA microarray data from Zheng et al.
showed that yaaA was induced in wild-type E. coli cells in an OxyR-dependent
manner when 1 mM H2O2 was applied (40). Our analysis of the DNA sequence
upstream of yaaA revealed a potential OxyR binding site approximately 74 bp
upstream of the yaaA start codon (Figure 2.1). To verify these observations, we
constructed a yaaA-lacZ transcriptional fusion and measured the expression of
yaaA in different strains.
When transferred from anaerobic to aerobic conditions, the expression of yaaA
was not induced in wild-type cells (E. coli strain MG1655). However, in an
aerated catalase/peroxidase-deficient mutant (Hpx-), which accumulates ~1 M
endogenous H2O2 and in which the OxyR response is fully activated (3,28), the
expression of yaaA was induced 10-fold (Figure 2.2A). Induction did not occur if
an oxyR deletion was present (Figure 2.2B). Rapid amplification of cDNA ends
(5-RACE) revealed that the 5-end of yaaA transcripts were identical for both
wild-type cells and Hpx- cells, mapping to 22 bp upstream of the yaaA start
codon (Figure 2.1). When wild-type cells were transformed with the plasmid
pGSO58, which contains a mutated oxyR allele (A233V) that constitutively

53
expresses OxyR-regulated genes even in the absence of H2O2 stress (19), the
expression of yaaA was induced under both anaerobic (data not shown) and
aerobic conditions (Figure 2.2A). These results confirm that yaaA is a gene of the
OxyR regulon.
Interestingly, in ahp- (catalase-proficient) mutants that experience minor H2O2
stress (29), the expression of yaaA was at the basal level under aerobic
conditions (Figure 2.2A), even though katG, another member of OxyR regulon,
was strongly induced (data not shown). The result suggests either that the yaaA
promoter region has a lesser affinity for oxidized OxyR, or alternatively that a
modifying effect is imposed by another regulator that is affected by more-severe
H2O2 stress.
2.3.2 Hpx- yaaA cells show a growth defect in LB during H2O2 stress
Since yaaA was induced in Hpx- strains during aerobic culture, we constructed a
yaaA deletion in the catalase/peroxidase-deficient background (Hpx- yaaA). The
Hpx- yaaA cells grew normally under anaerobic conditions, but they stopped
growing about five generations after shift to aerobic conditions, lagging for
several hours before recovering (Figure 2.3A).
The aerobically grown Hpx- yaaA cultures filamented profusely (Figure 2.4). Both
anaerobic cultures and aerobic Hpx+ yaaA cultures appeared as normal unit-
sized cells (data not shown), confirming that H2O2 was needed to create this
phenotype. Filamentation is a hallmark of difficulty in DNA replication, and it

54
commonly results when chemical stress damages DNA but does not substantially
disrupt protein or membrane biogenesis.
A chromosomal insertion of the yaaA+ allele at the phage attachment site
suppressed the growth defect and the filamentation of Hpx- yaaA cells (data not
shown). Deletion of yaaJ, which terminates 70 bp upstream of yaaA, in the Hpx-
strain does not result in a growth defect during H2O2 stress (data not shown).
These results indicated that the growth defect of the Hpx- yaaA mutant was due
to the loss of YaaA function and that YaaA is involved in the cellular response to
H2O2 stress.
The yaaA expression was also strongly induced when Hpx- strains were aerated
in defined glucose medium (data not shown). However, in contrast to the results
in LB broth, the Hpx- yaaA mutant did not exhibit any phenotype in defined
glucose medium (data not shown). The growth defect reemerged when yeast
extract was added to the defined medium (see Discussion).
2.3.3 Hpx- yaaA cells lose viability during H2O2 stress
The viability of Hpx- yaaA strains and Hpx- parent strains were monitored upon
aeration (Figure 2.5). Samples were harvested at different time points and colony
forming units (CFUs) were determined by plating in LB top agar. After a brief lag,
the number of viable cells increased steadily in the Hpx- parent strain. In contrast,
the viable cell count of the Hpx- yaaA strain did not change during the first two
hours of aerobic culture, confirming that the increase in OD600nm was due to
filamentation rather than cell division. Approximately three hours after aeration,
55
concomitantly with the onset of the growth lag, the viability of the Hpx- yaaA
mutant decreased by one order of magnitude.
Ultimately, the number of viable cells began to increase again, albeit at a slower
rate than in the yaaA+ parent. This recovery was not due to suppressor mutations,
since the isolated outgrowers reproduced the same growth pattern when the
experiment was repeated. On the other hand, a lag resumed when the
outgrowing cells were centrifuged and then diluted into fresh aerobic medium,
which suggested that some of the outgrowth depended upon conditioning of the
medium. Sterile lab medium can accumulate 1-20 M H2O2 which causes a
temporary H2O2 stress at the beginning of culture. Although Hpx- strains lose
major H2O2 scavenging enzymes, they retain ~5% scavenging activity because
the cytochrome oxidases in the respiratory chain can use H2O2 as a weak
substrate (28) (Woodmansee and Imlay, unpublished data). Therefore, Hpx-
mutants can slowly degrade H2O2 and condition the medium. A similar recovery
has been observed in Hpx- strains that lack fur or dps, two other genes that are
critical during H2O2 stress (24,33).
2.3.4 yaaA mutants show higher levels of DNA damage and polypeptide
damage during H2O2 stress
Dysfunction of YaaA generates a phenotype in H2O2 stress cells, which provides
an opportunity to gain insight into the function of YaaA by identifying the cellular
injury that arrests the growth of Hpx- yaaA mutants.
H2O2 can directly inactivate enzymes that employ solvent-exposed iron atoms
either in Fe-S clusters or as mononuclear cofactors (17,30). Further, if H2O2

56
reacts with ferrous irons associated on DNA or proteins, the resulting hydroxyl
radicals will subsequently create DNA or polypeptide damage (2,14,24).
The filamentation and cell death of Hpx- yaaA strains suggested DNA damage.
Indeed, a thyA forward mutagenesis assay revealed that the mutation frequency
of aerobically grown Hpx- yaaA cells was 4-8 fold higher than that of the Hpx-
strain (Figure 2.6). The effect depended upon oxidative stress, since the yaaA
mutant in the wild-type (scavenger-proficient) background exhibited a mutation
frequency similar to that of the parent strain. The yaaA mutation did not sensitize
cells to UV radiation, an alternative source of DNA damage (data not shown).
In a scavenger-proficient background the yaaA mutation did create a growth
defect in recA56 strains (Figure 2.7A-B), which are defective in the repair of
oxidative DNA lesions (1). This defect was apparent, once again, only in LB
medium and only under aerobic conditions. The defect was blocked when
catalase was added to the medium (Figure 2.7C), which implied that the damage
was due to the trace H2O2 that is present in aerobic LB medium. A similar result
was obtained with polA1 mutants (Figure 2.8). The defect is transient due to the
decomposition of H2O2 by cellular enzymes. These data indicate that (a) YaaA
has a role independent of the DNA recombination pathway or the SOS response,
which are already absent from recA56 mutants, and (b) even very low levels of
H2O2 can cause debilitating DNA damage in the yaaA mutant. The data, however,
do not resolve whether YaaA has a role in preventing DNA damage or in
repairing it or both.

57
During H2O2 stress, the Fenton-mediated hydroxyl radicals can also damage
polypeptides and generate various oxidative modifications. One of these is
carbonyl adducts, which arise when hydroxyl radicals oxidize side chains of
amino acids. An ELISA-based carbonylation assay did not detect any difference
in the extent of protein carbonylation in Hpx- yaaA and Hpx- yaaA+ mutants when
they were grown in defined glucose medium (data not shown). However, when
they were cultured in aerobic LB medium, the Hpx- yaaA cells gradually
accumulated higher levels of protein carbonyls than did the Hpx- parent strain.
These modifications were apparent at the later time point that coincides with the
growth lag (Figure 2.9). While the most straightforward interpretation is that the
dysfunction of YaaA directly causes the higher carbonylation, it remains possible
that the carbonylation is an indirect consequence of the growth defect.
We also evaluated whether YaaA has a role in protecting mononuclear iron
containing enzymes or aconitase-class dehydratases from H2O2 stress. The
activities of ribulose-5-phosphate epimerase and isopropylmalate isomerase,
respectively, were compared in Hpx- and Hpx- yaaA mutants. Both enzymes
exhibited a reduction in activities relative to scavenger-proficient strains, but the
yaaA allele had no further impact (data not shown).
2.3.5 The Fenton reaction causes injuries in yaaA mutants during H2O2
stress
The preceding results suggested that yaaA might suppress cellular injuries that
arise from the Fenton reaction. Consistent with this idea, the growth defect of
Hpx- yaaA mutants was suppressed by conditions that diminish the amount of

58
intracellular iron. The exogenous addition of deferoxamine (DFO), a cell-
permeable iron chelator that blocks Fenton chemistry (14), eliminated the growth
lag (Figure 2.3B). A similar effect was obtained by a tonB mutation, which
diminishes iron import by the siderophore and ferric-citrate systems (35) (Figure
2.3B). Furthermore, DFO also eliminated the growth defect of recA yaaA mutants
(Figure 2.7D). These results confirm that the key injury in the yaaA mutant during
H2O2 stress is due to the Fenton reaction.
2.3.6 YaaA protects cells by attenuating the Fenton reaction
In principle YaaA might protect cells either by reducing Fenton-mediated hydroxyl
radical formation or by helping cells to tolerate the damage caused by hydroxyl
radicals. In order to distinguish between these possibilities, we employed
electron paramagnetic resonance spectroscopy (EPR) to evaluate the amount of
hydroxyl radicals formed in yaaA mutants.
Intracellular hydroxyl radicals were trapped by ethanol/POBN and detected at
room-temperature by EPR. Wild-type cells exhibited a vanishingly small signal
(data not shown), whereas the level of hydroxyl-radical formation was substantial
in Hpx- mutants, consistent with prior reports (24). In the early period after
aeration (before the growth lag), the Hpx- yaaA cells exhibited a signal similar to
that of Hpx- cells (data not shown). However, the signal continually increased in
the Hpx- yaaA cells, ultimately becoming about twice that of the Hpx- strain when
the growth arrested (Figure 2.10). Pretreatment with 2 mM dipyridyl (an iron
chelator) for 5 min eradicated the EPR signal (data not shown), confirming that it

59
represented hydroxyl radicals produced by the Fenton reaction. These results
indicated that YaaA protects cells by attenuating the Fenton reaction.
2.3.7 YaaA does not affect H2O2 levels
The ferric iron produced by the Fenton reaction (reaction 1) can be re-reduced by
cellular reductants (reaction 2), continuously driving the hydroxyl radical
formation as long as peroxide stress exists.
Fe2+ + H2O2 Fe3+ + OH- + HO (Reaction 1)
Fe3+ + red Fe2+ + ox (Reaction 2)
Both intracellular cysteine and reduced flavins have been shown to serve as the
predominant reductants in reaction 2, depending upon the growth conditions
(23,37). To minimize oxidative injuries, cells must control the levels of H2O2,
unincorporated iron, and cysteine/flavin. The spin-trapping data suggested that
YaaA suppresses the level of one of these reactants.
The rate of intracellular H2O2 formation depends upon the titers of autoxidizable
enzymes in the cell, and in Hpx- strains the steady-state level of H2O2 also
depends upon minor scavenging mechanisms. We sought to test whether YaaA
might affect either of these processes. Because H2O2 can diffuse across the
membrane, in a peroxide-scavenging deficient mutant (i.e. Hpx- strains), the
H2O2 concentration rapidly equilibrates between the cytoplasm and the external
medium. Therefore, co-cultured Hpx- strains experience equivalent intracellular
concentrations of H2O2, and a strain that efficiently scavenges H2O2 can
suppress the growth defects that would otherwise arise in a co-cultured strain

60
that cannot (29). To this end, we co-cultured Hpx- cells and Hpx- yaaA cells
together in LB medium under aerobic conditions, and analyzed the viability of the
two individual strains, which were distinguished upon plating by drug-resistance
markers. In mixed culture, the Hpx- yaaA strain continued to exhibit its full
aerobic viability defect, while the Hpx- strain did not. This result indicates that
YaaA does not alter the intracellular levels of H2O2 (data not shown).
In Hpx- strains, the rate of cellular H2O2 formation equals the rate of H2O2
releasing to external medium, which can be directly measured by Amplex Red.
These experiments were performed in glucose defined media, because yeast
extract in LB interferes with H2O2 measurements. In these conditions, the rate of
H2O2 accumulation was 11 1 nM/min for Hpx- strains, versus 11 0.3 nM/min
for Hpx- yaaA mutants (both at OD600 of 0.020). After normalizing to the
intracellular volume, the H2O2 accumulation rate was about 18 M/s for both Hpx-
and Hpx- yaaA strains, similar to what was previous reported (28). This result
further indicates that YaaA does not affect the rate of H2O2 accumulation.
2.3.8 YaaA does not inhibit ferric iron reduction
FADH2 and cysteine can each reduce ferric iron and drive the Fenton reaction
forward in vivo. Reduced free flavin concentrations are elevated by respiratory
blocks (i.e. cyanide treatment), through the action of an NADH-dependent flavin
reductase (Fre). Under these conditions H2O2 creates Fenton-driven DNA lesions
at a very high rate (37). However, in defined medium neither deletion nor
induction of the yaaA allele affected the rate at which cyanide/H2O2 killed cells
(data not shown). The same was true when cells were shifted from sulfate to

61
cystine medium (data not shown), a protocol that elevates intracellular cysteine
levels and similarly amplifies H2O2 sensitivity (23). These results suggest that
YaaA is unlikely to attenuate the Fenton reaction by inhibiting the rate of ferric
iron reduction (reaction 2).
2.3.9 Hpx- yaaA mutants have higher unincorporated iron levels than the
Hpx- parent strain
The rate of oxidative DNA damage is directly determined by the H2O2
concentration as well as the amount of unincorporated iron inside the cell (18,31).
To test whether or not YaaA controls iron levels, we measured intracellular
unincorporated iron by whole-cell EPR. Samples were cultured aerobically in LB
and collected at OD600nm of 0.1, 0.2 and 0.3; these time points represented Hpx-
yaaA cells prior to the growth lag, at its onset, and at its midpoint. The data
showed that deletion of yaaA in unstressed Hpx+ cells had no effect on the iron
levels (~ 65 M) (Figure 2.11A). The level of unincorporated iron in H2O2-
stressed Hpx- strains was substantially higher (150 M), an effect that may reflect
the oxidative degradation of Fe-S clusters. The key observation, however, was
that the Hpx- yaaA cells consistently accumulated two-fold higher levels of
unincorporated iron (300 M) by the beginning (0.2 OD600nm) of the growth lag
(Figure 2.11A). This result matches the two-fold effect of yaaA upon hydroxyl-
radical formation. The iron returned to Hpx- yaaA+ levels when yaaA was
expressed in trans on a plasmid (Figure 2.11B).

62
Induction of plasmid-borne yaaA anaerobically also protected recA56 against
H2O2 killing (Figure 2.12A), though it had no impact on the unincorporated iron
level in anaerobic cells (~310 M) (Figure 2.12B).
Hpx- yaaA cells do not show a growth defect compared to Hpx- parent strains in
defined medium during aerobic culture. Consistent with the growth curve results,
the EPR data showed that the level of intracellular free iron in Hpx- yaaA cells
was similar to that of Hpx- cells in defined medium, approximately 100 M for
both strains at 0.2 OD600nm (data not shown).
These results indicate that YaaA suppresses hydroxyl-radical formation, and thus
the rate of oxidative DNA damage by diminishing the amount of unincorporated
iron inside oxidatively stressed cells.
2.3.10 YaaA does not repress expression of iron importers
The factors controlling iron import, trafficking, and disposition within the cell are
largely mysterious. The best-understood facet of iron regulation is the
transcriptional control upon the synthesis of iron importers and of iron-containing
enzymes (4,21). The primary iron importers active in lab cultures of E. coli are
the ferric enterobactin uptake (Ent) system, the ferric citrate uptake (Fec) system,
and the ATP-dependent ferrous import (Feo) system. We observed that Hpx- fec
yaaA, Hpx- entA yaaA and Hpx- feo entA yaaA mutants all exhibited aerobic
growth defects compared to their yaaA+ counterpart strains (data not shown),
which implied that the yaaA phenotype did not depend on a specific iron importer.
However, all three systems are controlled at the transcriptional level by the Fur

63
repressor, and it seemed plausible that YaaA might perturb the function of this
regulator. More generally, in order to evaluate whether YaaA controls iron levels
by controlling transcription of the importer(s), we constructed feo entA
derivatives which rely upon the Fec system as the sole mechanism of iron uptake.
Using a fecA-lacZ transcriptional fusion integrated at the lambda attachment site,
we found that mutation of the yaaA allele had no impact upon fecA transcription
(Figure 2.13). Thus YaaA does not control the expression of iron importers. Other
possible points of iron control exist, such as influence on transporter activity.
2.3.11 Hpx- mntH yaaA mutants show a strong growth defect in defined
medium
YaaA may work with other proteins to control the iron level during peroxide stress.
Candidates for these proteins include the iron uptake regulator (Fur), iron
scavenging protein (Dps), and manganese transporter (MntH); all of them are
involved in iron homeostasis during the OxyR response. The yaaA deletion
exacerbated the growth defect and viability defects of Hpx- fur and Hpx- dps
strains in LB (Figure 2.14A-B), but not in defined medium (data not shown).
However, Hpx- mntH yaaA mutants showed a strong growth defect in both LB
and defined glucose medium (Figure 2.15). During H2O2 stress, manganese is
imported via MntH to replace the iron cofactor in certain peroxide-sensitive
enzymes (2,30). In defined medium, Hpx- mntH yaaA cells stopped growing
almost immediately after aeration, and supplementation with manganese had
little effect (Figure 2.15B-C). However, the number of viable cells remained
constant (Figure 2.15D), which suggested that this particular phenotype might be

64
caused by inhibition of metabolism instead of DNA damage. Collectively, these
data show that YaaA had functions independent of Fur, Dps and MntH.
Additional experiments revealed that Hpx- ftn and Hpx- bfr mutants grow as well
as Hpx- strains, indicating that under our conditions ferritin and bacterioferritin do
not play a key role during H2O2 stress and are not involved in the critical function
of YaaA (data not shown). Similarly, although FieF is suspected to act as an iron-
efflux system (9), an fieF deletion did not diminish the growth of an Hpx- strain,
and the further addition of a yaaA mutation recapitulated the Hpx- yaaA
phenotype (Figure 2.16).
2.3.12 Regulation of YaaA
To obtain further insight into the function of YaaA, we measured expression of a
yaaA-lacZ fusion under different conditions (Table 2.2). Though previous DNA
microarray data showed that yaaA was induced 4-fold by treatment with 1 mM
H2O2 in an oxyR strain (40), we did not observe induction using either -
galactosidase assay or real-time PCR measurements (data not shown). The
disagreement may due to different H2O2 concentrations used in experiments.
High level of H2O2 challenge may induce yaaA by other regulators, but under
physiological relevant H2O2 stress, OxyR is the sole transcriptional regulator of
yaaA.
The expression of yaaA was unaltered (< 2-fold induction/repression) under other
tested conditions. It did not respond to manganese availability; it was not induced

65
by redox-cycling drugs, which indicates that it is not regulated by SoxRS
(10,11,32); and it was not affected by Fur, IscR, Hfq, RpoS, or YaaA itself.
2.4 Discussion
In some natural environments bacteria must cope with extended periods of
exposure to low levels of H2O2, an experience that was recreated in this study
through the use of strains that lack H2O2 scavenging enzymes. The H2O2
concentration that accumulates in the cytoplasm of aerobic Hpx- mutants—
approximately 1 M—is expected to be reached in the cytoplasm of wild-type
cells when they enter environments that contain approximately 5 M H2O2 (29).
The primary effect of these doses upon E. coli is to block growth. The particular
damage mechanisms that have been identified thus far all appear to involve
Fenton-type reactions between iron and H2O2: the creation of DNA lesions and
the inactivation of mononuclear iron enzymes, of Fe-S dehydratases, of the Isc
Fe-S assembly system, and of the Fur repressor (2,2,14,16,17,30,33). The
second-order rate constants for these reactions are high—ca. 103-104 M-1 s-1—
which means that when H2O2 is 1 M they occur with half-times on a minutes
time scale. No other target molecules are known that react with H2O2 so readily,
and so it seems fitting that many of the genes controlled by OxyR serve to avoid
or to alleviate the damage done by Fenton reactions. YaaA now joins Dps (24,38)
and Fur (33) as mediators that minimize the amount of unincorporated iron inside
H2O2-stressed cells. Like Dps and Fur, YaaA has the effect of minimizing
damage both to DNA and to proteins. Like Dps—but unlike Fur—YaaA seems
not to play much of a role during routine growth; it is only during H2O2 stress,

66
when YaaA levels rise, that its influence is apparent. For this reason yaaA
mutants resemble dps mutants in that they do not exhibit unusual sensitivity in
experiments that involve a sudden bolus of H2O2—a period of OxyR regulon
expression is required for it to become functional. Indeed, mntH and suf mutants
only evince a phenotype during protracted, low-grade stress, too (2,16).
Little is known about the DUF328 family of proteins. They do not have
recognizable motifs or absolutely conserved residues, and no crystal structures
are available. YaaA homologues are found in only a few eukaryotes, all of which
are photosynthetic (four green algae and Ricinus communis). YaaA genes are
widely distributed among bacteria, including both anaerobes and aerobes. Their
presence in anaerobes does not necessarily indicate that they have a non-
oxidative-stress role, since even anaerobes are periodically exposed to
oxygenated waters and customarily encode antioxidant enzymes, including
scavengers of H2O2. A yaaA gene is identifiable in Lactobacillus gasseri, which
uses H2O2 as a chemical weapon to inhibit competitors; but we did not find any
homologue in Borrelia burgdorferi, a bacterium that seems not to have iron-
dependent enzymes or to import iron (26). Thus the circumstantial data are
broadly consistent with a role in iron metabolism and antioxidant activity.
The yaaA phenotype was pronounced in medium that included yeast extract.
EPR measurements show that E. coli generally contains higher levels (~3 fold) of
unincorporated iron when yeast extract is in the medium. This effect cannot be
achieved simply by adding high levels of iron to defined medium, which leads us
to suspect that a component of yeast extract makes iron more available for

67
import. Interestingly, yaaA was not as easily induced by H2O2 as was katG, as
katG was induced in ahp- mutants, while yaaA was not up-regulated in ahp-
mutant unless the cells were iron starved (Figure 2.17). We do not know whether
the mechanistic basis of this difference stems from a difference in OxyR affinity,
or from an unknown, iron related regulator—but the end effect resembles the
graded responses of members of the SOS regulon, some of which are turned on
rapidly, and others of which are activated later (25). Thus catalase synthesis
might comprise the first response to slight H2O2 stress, whereas alterations in
iron metabolism are engaged only if stress is severe.
All the data suggest that YaaA affects iron levels, so how does YaaA do that?
This question is challenging, because the details of iron metabolism remain foggy.
In principle, intracellular iron levels might be suppressed in a handful of ways: by
slowing iron import, speeding delivery to iron enzymes, sequestering iron in
storage proteins, preventing the leakage of iron from labile enzymes, or pumping
excess iron from the cell (Figure. 2.18). However, YaaA is not an integral
membrane protein, meaning that it could at best be an accessory to efflux; it was
effective no matter which iron import system was active; it did not seem to affect
the damage to aconitase-class dehydratases or mononuclear iron containing
enzymes; and it retained a phenotype whether or not cells contained Dps, the
primary iron-storage system during oxidative stress. Although one can contrive
arguments around these facts, they collectively hint that perhaps the remaining
option—that YaaA is somehow involved in iron trafficking—is the most likely one.
Pull-down experiments did not identify any convincing partner proteins (data not

68
shown). As our understanding of iron metabolism progresses, perhaps a specific
hypothesis for YaaA mechanism will become apparent, as will experimental
methods that would test it.
2.5 Acknowledgments
We thank Ian Gut (University of Illinois) for assistance with DIC microscopy,
Jason Sobota (University of Illinois) for assistance with the ribulose-5-phosphate
epimerase assay, and Mark Nilges (the Illinois EPR Research Center) for
assistance with EPR experiments.
This work was supported by GM049640 from the National Institutes of Health.

69
2.6 Tables
Table 2.1 Strains and plasmids used in this study.
Name Genotype/characteristics Source/Ref.
Strains
AA30 As LC106 plus mntH2::cat (2)
AL145 As LC106 plus (lacZ1::cat)1 att::[pSJ501:: yaaA-lacZ+]~cat This study
AL154 As AL157 plus (ahpC-ahpF) kan:: ahpF This study
AL157 As MG1655 plus (lacZ1::cat)1 att::[pSJ501:: yaaA-lacZ+]~cat This study
AL194 As LC106 plus (yaaA1::cat)1 fur::kan zbf-507::Tn10 This study
AL221 As LC106 plus (yaaA1::cat)1 mntH2::cat This study
AL223 As MG1655 plus recA56 srl300::Tn10 (yaaA1::cat)1 This study
AL245 As MG1655 plus (yaaA1::cat)1 This study
AL273 As LC106 plus (feoABC::cat)1 entA1::cat (lacZ1::cat)1
att::[pSJ501::fecA-lacZ+]~cat
This study
AL285 As LC106 plus (yaaA1::cat)1 ∆dps::cat This study
AL293 As AL273 plus (yaaA1::cat)1 This study
AL300 As AL145 plus (tonB1::cat)1feoABC::cat This study
AL302 As AL154 plus (tonB1::cat)1feoABC::cat This study
AL304 As 157 plus (tonB1::cat)1feoABC::cat This study
AL344 As AL145 plus oxyR::spec This study
AL435 As LC106 plus ∆fieF1::cat This study
AL437 As LC106 plus ∆(yaaA1::cat)1 ∆fieF1::cat This study
BW25113 lacIq rrnBT14 lacZWJ16 hsdR514 araBADAH33 rhaBADLD78 (7)
LC106 As MG1655 plus (ahpC-ahpF’) kan:: ahpF (katG17::Tn10)1
(katE12::Tn10)1
(27)
LEM17 As MG1655 plus recA56 srl300::Tn10 Lab stock

70
Table 2.1 (cont.)
MG1655 Wild type Lab Stock
SB53 As LC106 plus (yaaA1::cat)1 This study
SP66 As LC106 plus mhpC281::Tn10 lacY1 dps::cat (24)
Plasmid
pAH125 A plasmid for lacZ transcriptional fusion construction (13)
pCP20 Temperature-sensitive Flp expression plasmid (6)
pKD3 FRT-flanked cat (7)
pKD46 -Red recombinase expression plasmid (7)
pACYC184 Cmr Tetr (5)
pGSO58 oxyR A233V in pACYC184 (19)
pSJ501 pAH125 derivative with FRT-flanked cat (16)
pWKS30 Plac polylinker Ampr (34)
pWKyaaA pWKS30 containing yaaA insert This study

71
Table 2.2 Regulation of yaaA.
Test condition Mutants (media) Regulator Resulta
H2O2 stress Hpx- (LB and defined medium) OxyR Yes
Redox-cycling drug WT (LB + 200 M paraquat) SoxR No
Iron rich fur (LB) Fur No
Iron starved tonB feo (defined media + DFO) No
Mn rich mntR (LB) No
Mn starved mntH (defined media) No
Small RNA hfq (LB) Small RNAs No
Stationary phase WT (LB and defined media) RpoS No
iscR- iscR (LB) IscR No
Autoregulation Hpx- yaaA (LB) YaaA No
a Negative results are defined as less than 2-fold changes in the expression of
yaaA.

72
2.7 Figures
Figure 2.1 Genomic context of yaaA in E. coli. In E. coli, yaaA is located at
0.12 min and is flanked by two genes with undefined functions, yaaJ and yaaX.
The genomic context for yaaA is not conserved amongst bacteria that possess
this gene, and no obvious gene partners were found by computational analyses.
A computational search using an OxyR consensus sequence (39) identified one
potential OxyR-binding site (-74 bp to -38 bp), and 5-RACE analysis mapped the
5-end of yaaA transcripts to 22 bp upstream of the yaaA start codon. TSS,
transcriptional start site.

73
Figure 2.2 A transcriptional yaaA-lacZ fusion confirms that yaaA is part of
the OxyR regulon. (A) Cultures were grown in anaerobic or aerobic LB medium
for five generations before collection and β-galactosidase measurement (~0.2
OD600). WT, MG1655; Vector, empty vector control (pACYC184); pGSO58,
plasmid-borne mutant OxyR A233V that constitutively overexpresses OxyR
regulated genes; ahp- (AL154), NADH peroxidase mutant; Hpx- (AL145),
catalase/peroxidase-deficient mutant. (B) Because Hpx- oxyR mutants are lethal
aerobically, anaerobic exponential-phase cultures were harvested at ~0.2
OD600nm (-O2) or were aerated for 30 min before collection (+O2). During the
period of aeration, the cell densities of the Hpx- oxyR+ (AL145) and Hpx- oxyR-
(AL344) strains increased from ~0.2 OD600nm to ~0.35 OD600nm. In this and other
figures, the error bars represent the standard error of the mean.

74
Figure 2.3 The Hpx- yaaA strain exhibits a growth defect in aerobic LB
medium. Exponential-phase cultures in anaerobic LB medium were diluted into
aerobic LB medium at time zero, and optical density was monitored. (A) Wild
type cells (MG1655), black squares; yaaA (AL245), grey triangles; Hpx-
(catalase/peroxidase-deficient strain, LC106), grey diamonds; Hpx- yaaA (SB53),
black circles. (B) Hpx- yaaA cells with 2 mM DFO in media, open circles; Hpx-
tonB yaaA (AL179), stars.

75
Figure 2.4 The Hpx- yaaA cells exhibit a severe filamentous phenotype.
Exponentially growing cultures in anaerobic LB medium were diluted into aerobic
LB medium and were grown for 5 hours. Images were captured by differential
interference contrast microscopy (DIC) using a 40X oil-immersion objective.

76
Figure 2.5 The growth defect of the Hpx- yaaA mutant occurred
concomitantly with cell death. Exponentially growing cultures in anaerobic LB
medium were diluted into aerobic LB medium at time zero. (A) Optical density. (B)
Viable cell counts. Hpx- (LC106), grey diamonds; Hpx- yaaA (SB53), black circles.

77
Figure 2.6 Aerobic mutation frequencies are elevated in the Hpx- yaaA
mutant compared to its Hpx- parent strain. Exponentially growing cells in
anaerobic LB medium were diluted into aerobic LB medium, and the mutation
frequencies were measured at subsequent time points as described in Materials
and Methods. The zero time point was obtained immediately prior to aeration.
The mutant frequencies in Hpx+ strains (barely visible above) were about 0.5 to 1
mutants/106 cells.

78
Figure 2.7 Hpx+ recA yaaA mutants exhibited growth and viability defects.
Anaerobic exponential-phase cultures were diluted into aerobic LB medium at
time zero. (A, C, D) Optical density. The recA yaaA (AL223) mutants exhibited a
growth (A) and viability (B) defect that was suppressed by ~50 U/ml catalase (C)
or 2 mM DFO (D).

79
Figure 2.8 Hpx+ polA1 yaaA mutant exhibited growth and viability defects.
Exponentially growing cultures in anaerobic LB medium were diluted into aerobic
LB medium at time zero. (A) Optical density. (B) Viable cell counts. yaaA (AL245),
grey triangles; polA1 (AL410), black squares; polA1 yaaA (AL412), open squares.

80
Figure 2.9 Protein carbonylation in Hpx- yaaA cells. Cells were cultured in
aerobic LB medium as described in Materials and Methods. The Hpx- yaaA cells
were harvested at the beginning (0.2 OD600nm, 3 hours) and in the middle of the
growth lag (6 hours). Other strains were collected at ~0.2 OD600nm. Strains used:
WT (MG1655), Hpx- dps (SP66)--a positive control for carbonylation, Hpx-
(LC106), and Hpx- yaaA (SB53).

81
Figure 2.10 The Hpx- yaaA mutant exhibited higher levels of hydroxyl
radicals. Cells were cultured in aerobic LB as described before. They were
harvested at 0.2 OD600nm, which corresponded to the beginning of the growth lag
of Hpx- yaaA cells. The final cell densities were equivalent in all samples. The six
peaks represented the HO signal of Hpx- cells and Hpx- yaaA cells.

82
Figure 2.11 Levels of unincorporated iron are elevated in Hpx- yaaA cells.
The strains were cultured in aerobic LB medium, and intracellular unincorporated
iron was determined by whole-cell EPR analysis. Data are reported as the means
and SEM from at least 3 independent experiments. (A) Cells were harvested at
0.1, 0.2, and 0.3 OD600nm. (B) Cells were harvested at 0.2 OD600nm. pWKS30,
empty vector; pWKyaaA, a plasmid expressing yaaA under control of the lac
promoter.
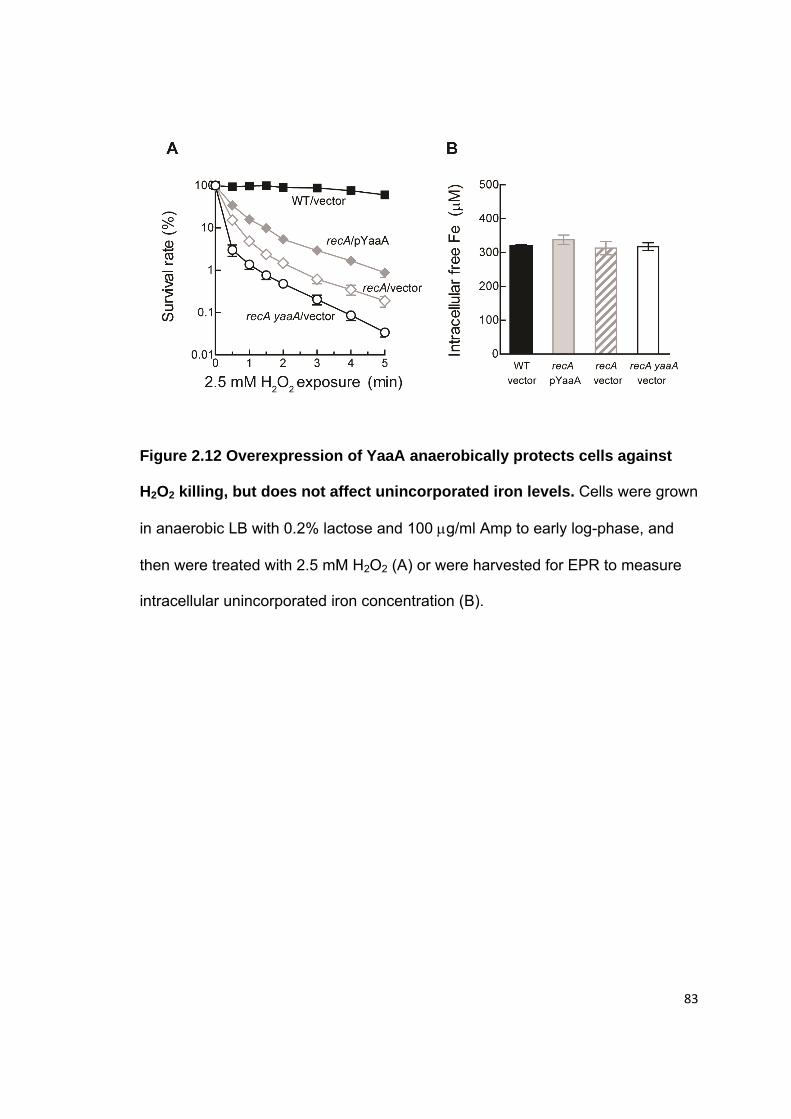
83
Figure 2.12 Overexpression of YaaA anaerobically protects cells against
H2O2 killing, but does not affect unincorporated iron levels. Cells were grown
in anaerobic LB with 0.2% lactose and 100 g/ml Amp to early log-phase, and
then were treated with 2.5 mM H2O2 (A) or were harvested for EPR to measure
intracellular unincorporated iron concentration (B).
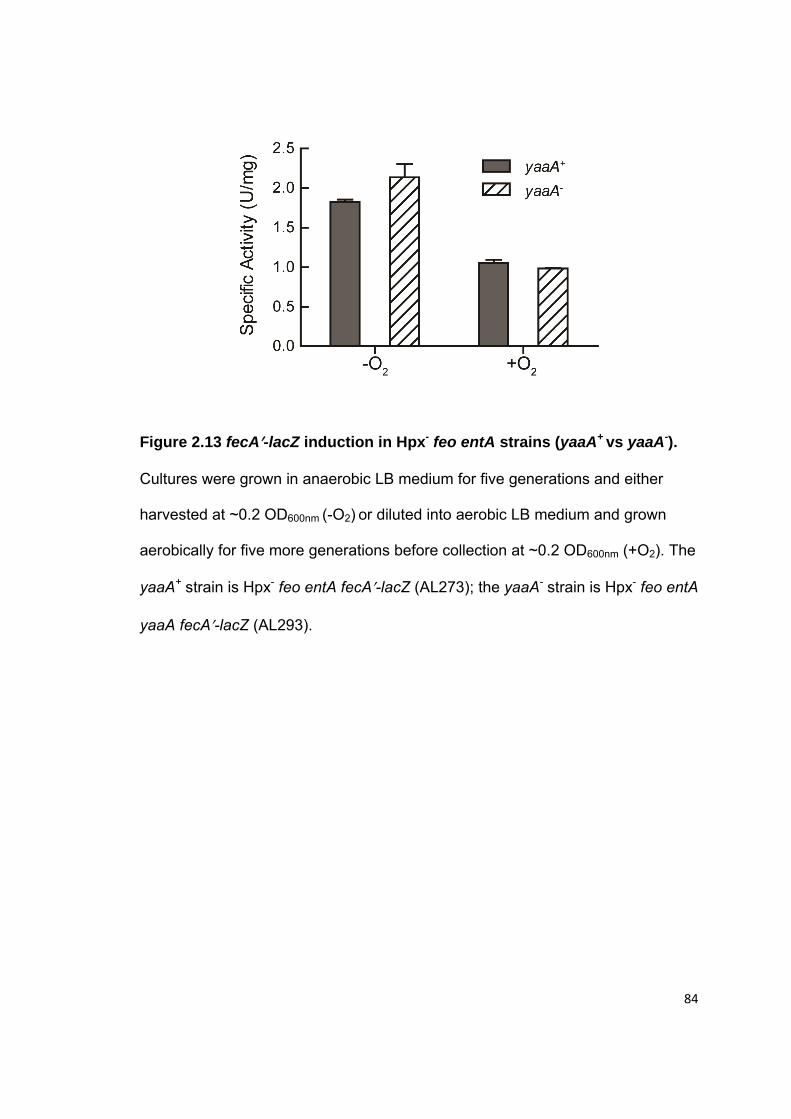
84
Figure 2.13 fecA-lacZ induction in Hpx- feo entA strains (yaaA+ vs yaaA-).
Cultures were grown in anaerobic LB medium for five generations and either
harvested at ~0.2 OD600nm (-O2) or diluted into aerobic LB medium and grown
aerobically for five more generations before collection at ~0.2 OD600nm (+O2). The
yaaA+ strain is Hpx- feo entA fecA-lacZ (AL273); the yaaA- strain is Hpx- feo entA
yaaA fecA-lacZ (AL293).

85
Figure 2.14 YaaA has functions independent of Fur and Dps. Exponential-
phase cultures in anaerobic LB medium were diluted into aerobic LB medium to
an OD600 of 0.005 at time zero, and cell viability was monitored. (A) Viable cell
counts for Hpx- fur yaaA cells. (B) Viable cell counts for Hpx- dps yaaA cells. To
reduce lethality, the inoculum was at a higher density than in the experiment of
Figure. 2.7.5.

86
Figure 2.15 Hpx- mntH yaaA cells exhibited growth defects in both LB and
defined glucose medium. Anaerobic exponential-phase cultures were diluted
into the same aerobic medium at time zero. Hpx- mntH yaaA had a growth defect
in both LB (A) and glucose defined medium with all amino acid supplement (B).
Adding MnCl2 (50 M) rescued Hpx- mntH cells, but had little effect on Hpx- mntH
yaaA mutants (C). (D) The growth defect in defined medium was bacteriostatic.
Strains used: Hpx- (LC106), grey diamonds; Hpx- mntH (AA30), grey triangles;
Hpx- yaaA (SB53), black circles; and Hpx- mntH yaaA (AL221), black squares.

87
Figure 2.16 YaaA has functions independent of FieF. Exponential-phase
cultures in anaerobic LB medium were diluted into aerobic LB medium to an
OD600 of 0.005 at time zero, and optical density was monitored. Hpx- (LC106),
grey diamonds; Hpx- fieF (AL435), open diamonds; Hpx- yaaA (SB53), black
circles, Hpx- fieF yaaA (AL437), open circles. The growth curves of the Hpx- yaaA
and Hpx- fieF yaaA strains are almost indistinguishable.
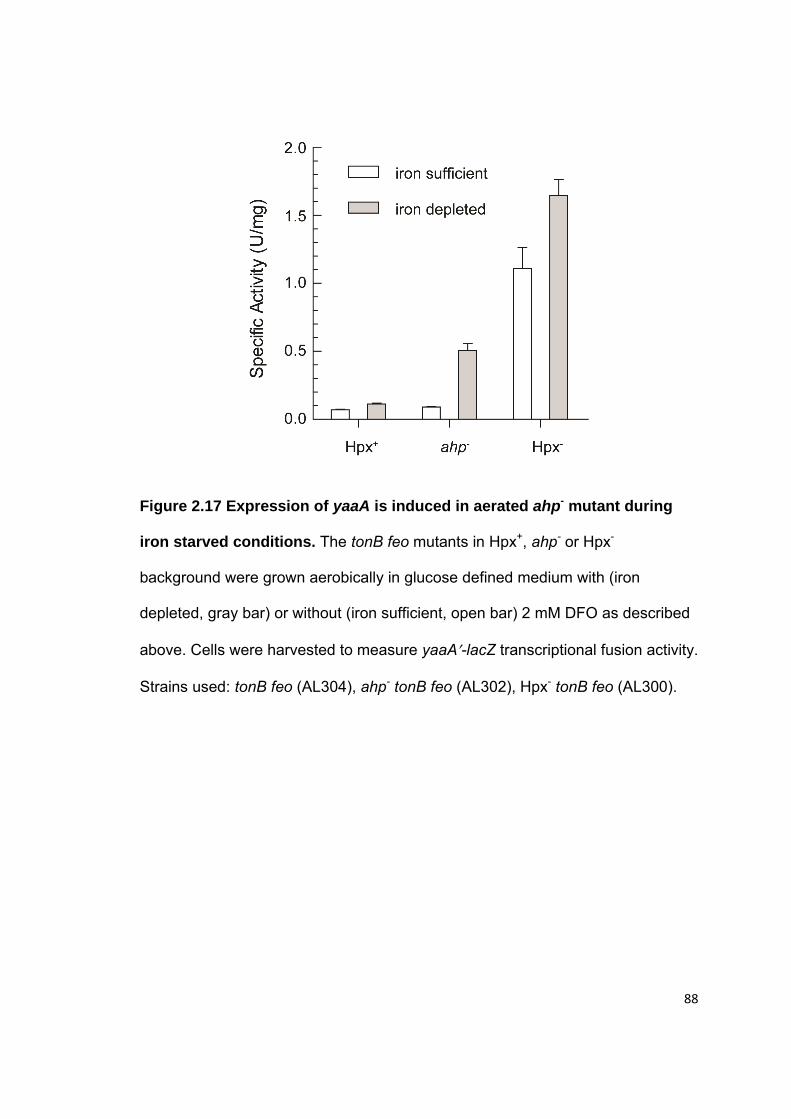
88
Figure 2.17 Expression of yaaA is induced in aerated ahp- mutant during
iron starved conditions. The tonB feo mutants in Hpx+, ahp- or Hpx-
background were grown aerobically in glucose defined medium with (iron
depleted, gray bar) or without (iron sufficient, open bar) 2 mM DFO as described
above. Cells were harvested to measure yaaA-lacZ transcriptional fusion activity.
Strains used: tonB feo (AL304), ahp- tonB feo (AL302), Hpx- tonB feo (AL300).

89
Figure 2.18 Potential mechanisms by which YaaA might diminish levels of
unincorporated iron. YaaA might slow down the increase of unincorporated
iron by (1) slowing iron import, (2) preventing the leakage of iron from H2O2-
damaged enzymes; or YaaA might accelerate the decrease of unincorporated
iron by (3) sequestering iron, (4) speeding iron delivery to target proteins, or (5)
increasing iron efflux.
90
2.8 References
1. Ananthaswamy, H. N. and A. Eisenstark. 1977. Repair of hydrogen peroxide-induced single-strand breaks in Escherichia coli deoxyribonucleic acid. J. Bacteriol. 130:187-191.
2. Anjem, A., S. Varghese, and J. A. Imlay. 2009. Manganese import is a key element of the OxyR response to hydrogen peroxide in Escherichia coli. Mol. Microbiol. 72:844-858
3. Aslund, F., M. Zheng, J. Beckwith, and G. Storz. 1999. Regulation of the OxyR transcription factor by hydrogen peroxide and the cellular thiol-disulfide status. Proc. Natl. Acad. Sci. U. S. A. 96:6161-6165.
4. Braun, V. 2003. Iron uptake by Escherichia coli. Front Biosci. 8:s1409-s1421.
5. Chang, A. C. and S. N. Cohen. 1978. Construction and characterization of amplifiable multicopy DNA cloning vehicles derived from the P15A cryptic miniplasmid. J. Bacteriol. 134:1141-1156.
6. Cherepanov, P. P. and W. Wackernagel. 1995. Gene disruption in Escherichia coli: TcR and KmR cassettes with the option of Flp-catalyzed excision of the antibiotic-resistance determinant. Gene. 158:9-14.
7. Datsenko, K. A. and B. L. Wanner. 2000. One-step inactivation of chromosomal genes in Escherichia coli K-12 using PCR products. Proc. Natl. Acad. Sci. U. S. A. 97:6640-6645.
8. Finn, R. D., J. Tate, J. Mistry, P. C. Coggill, S. J. Sammut, H. R. Hotz, G. Ceric, K. Forslund, S. R. Eddy, E. L. Sonnhammer, and A. Bateman. 2008. The Pfam protein families database. Nucleic Acids Res. 36:D281-D288.
9. Grass, G., M. Otto, B. Fricke, C. J. Haney, C. Rensing, D. H. Nies, and D. Munkelt. 2005. FieF (YiiP) from Escherichia coli mediates decreased cellular accumulation of iron and relieves iron stress. Arch. Microbiol. 183:9-18.
10. Greenberg, J. T., P. Monach, J. H. Chou, P. D. Josephy, and B. Demple. 1990. Positive control of a global antioxidant defense regulon activated by superoxide-generating agents in Escherichia coli. Proc. Natl. Acad. Sci. U. S. A. 87:6181-6185.
11. Gu, M. and J. A. Imlay. 2011. The SoxRS response of Escherichia coli is directly activated by redox-cycling drugs rather than by superoxide. Mol. Microbiol. 79:1136-1150.
12. Gut, I. M., A. M. Prouty, J. D. Ballard, W. A. van der Donk, and S. R. Blanke. 2008. Inhibition of Bacillus anthracis spore outgrowth by nisin. Antimicrob. Agents Chemother. 52:4281-4288.

91
13. Haldimann, A. and B. L. Wanner. 2001. Conditional-replication, integration, excision, and retrieval plasmid-host systems for gene structure-function studies of bacteria. J. Bacteriol. 183:6384-6393.
14. Imlay, J. A., S. M. Chin, and S. Linn. 1988. Toxic DNA damage by hydrogen peroxide through the Fenton reaction in vivo and in vitro. Science. 240:640-642.
15. Imlay, J. A. and I. Fridovich. 1991. Assay of metabolic superoxide production in Escherichia coli. J. Biol. Chem. 266:6957-6965.
16. Jang, S. and J. A. Imlay. 2010. Hydrogen peroxide inactivates the Escherichia coli Isc iron-sulphur assembly system, and OxyR induces the Suf system to compensate. Mol. Microbiol. 78:1448-1467.
17. Jang, S. and J. A. Imlay. 2007. Micromolar intracellular hydrogen peroxide disrupts metabolism by damaging iron-sulfur enzymes. J. Biol. Chem. 282:929-937.
18. Keyer, K. and J. A. Imlay. 1996. Superoxide accelerates DNA damage by elevating free-iron levels. Proc. Natl. Acad. Sci. U. S. A. 93:13635-13640.
19. Kullik, I., M. B. Toledano, L. A. Tartaglia, and G. Storz. 1995. Mutational analysis of the redox-sensitive transcriptional regulator OxyR: regions important for oxidation and transcriptional activation. J. Bacteriol. 177:1275-1284.
20. Macomber, L., C. Rensing, and J. A. Imlay. 2007. Intracellular copper does not catalyze the formation of oxidative DNA damage in Escherichia coli. J. Bacteriol. 189:1616-1626.
21. Masse, E., H. Salvail, G. Desnoyers, and M. Arguin. 2007. Small RNAs controlling iron metabolism. Curr. Opin. Microbiol. 10:140-145.
22. Miller, J. H. 1972. Experiments in molecular genetics. Cold Spring Harbor Laboratory, Cold Spring Harbor, NY.
23. Park, S. and J. A. Imlay. 2003. High levels of intracellular cysteine promote oxidative DNA damage by driving the fenton reaction. J. Bacteriol. 185:1942-1950.
24. Park, S., X. You, and J. A. Imlay. 2005. Substantial DNA damage from submicromolar intracellular hydrogen peroxide detected in Hpx- mutants of Escherichia coli. Proc. Natl. Acad. Sci. U. S. A. 102:9317-9322.
25. Patel, M., Q. Jiang, R. Woodgate, M. M. Cox, and M. F. Goodman. 2010. A new model for SOS-induced mutagenesis: how RecA protein activates DNA polymerase V. Crit Rev. Biochem. Mol. Biol. 45:171-184.
26. Posey, J. E. and F. C. Gherardini. 2000. Lack of a role for iron in the Lyme disease pathogen. Science. 288:1651-1653.

92
27. Seaver, L. C. and J. A. Imlay. 2004. Are respiratory enzymes the primary sources of intracellular hydrogen peroxide? J. Biol. Chem. 279:48742-48750.
28. Seaver, L. C. and J. A. Imlay. 2001. Alkyl hydroperoxide reductase is the primary scavenger of endogenous hydrogen peroxide in Escherichia coli. J. Bacteriol. 183:7173-7181.
29. Seaver, L. C. and J. A. Imlay. 2001. Hydrogen peroxide fluxes and compartmentalization inside growing Escherichia coli. J. Bacteriol. 183:7182-7189.
30. Sobota, J. M. and J. A. Imlay. 2011. Iron enzyme ribulose-5-phosphate 3-epimerase in Escherichia coli is rapidly damaged by hydrogen peroxide but can be protected by manganese. Proc. Natl. Acad. Sci. U. S. A. 108:5402-5407.
31. Touati, D., M. Jacques, B. Tardat, L. Bouchard, and S. Despied. 1995. Lethal oxidative damage and mutagenesis are generated by iron in delta fur mutants of Escherichia coli: protective role of superoxide dismutase. J. Bacteriol. 177:2305-2314.
32. Tsaneva, I. R. and B. Weiss. 1990. soxR, a locus governing a superoxide response regulon in Escherichia coli K-12. J. Bacteriol. 172:4197-4205.
33. Varghese, S., A. Wu, S. Park, K. R. Imlay, and J. A. Imlay. 2007. Submicromolar hydrogen peroxide disrupts the ability of Fur protein to control free-iron levels in Escherichia coli. Mol. Microbiol. 64:822-830.
34. Wang, R. F. and S. R. Kushner. 1991. Construction of versatile low-copy-number vectors for cloning, sequencing and gene expression in Escherichia coli. Gene. 100:195-199.
35. Wiener, M. C. 2005. TonB-dependent outer membrane transport: going for Baroque? Curr. Opin. Struct. Biol. 15:394-400.
36. Woodmansee, A. N. and J. A. Imlay. 2002. Quantitation of intracellular free iron by electron paramagnetic resonance spectroscopy. Methods Enzymol. 349:3-9.
37. Woodmansee, A. N. and J. A. Imlay. 2002. Reduced flavins promote oxidative DNA damage in non-respiring Escherichia coli by delivering electrons to intracellular free iron. J. Biol. Chem. 277:34055-34066.
38. Zhao, G., P. Ceci, A. Ilari, L. Giangiacomo, T. M. Laue, E. Chiancone, and N. D. Chasteen. 2002. Iron and hydrogen peroxide detoxification properties of DNA-binding protein from starved cells. A ferritin-like DNA-binding protein of Escherichia coli. J. Biol. Chem. 277:27689-27696.
39. Zheng, M., X. Wang, B. Doan, K. A. Lewis, T. D. Schneider, and G. Storz. 2001. Computation-directed identification of OxyR DNA binding sites in Escherichia coli. J. Bacteriol. 183:4571-4579.

93
40. Zheng, M., X. Wang, L. J. Templeton, D. R. Smulski, R. A. LaRossa, and G. Storz. 2001. DNA microarray-mediated transcriptional profiling of the Escherichia coli response to hydrogen peroxide. J. Bacteriol. 183:4562-4570.

94
CHAPTER THREE: CELL DEATH FROM ANTIBIOTICS WITHOUT
THE INVOLVEMENT OF REACTIVE OXYGEN SPECIES
3.1 Introduction
In last couple of decades the growing number of antibiotic-resistant pathogens
has urged efforts to further understand and improve the efficacy of the basic
antibiotic classes. The majority of antibiotics with clinical utility achieve their
bactericidal effects by inhibiting bacterial cell wall biosynthesis, protein translation
or DNA replication. However, within the past six years, observations from several
labs raised the possibility that these antibiotics, irrespective of drug targets, kill
bacteria by stimulating the formation of reactive oxygen species that
subsequently cause to DNA lesions and cell death.
The evidence supporting this proposal included the observation that cell-
penetrating fluorescent probes (hydroxyphenyl fluorescein, HPF) gave higher
fluorescent signals inside antibiotic-treated bacteria (5,8,9,19,20,36), and the
signals were ascribed to hydroxyl radicals. Furthermore, iron chelators
(8,9,19,32,33,36), which suppress hydroxyl-radical-generating Fenton chemistry,
and thiourea (5,9,11,19,32,33), a potential scavenger of hydroxyl radicals,
lessened toxicity. Mutations that diminish fluxes through the tricarboxylic acid
cycle (TCA cycle) were protective (8,19,20), suggesting a key role for respiration,
and DNA-repair mutants were somewhat sensitive (9,19). Systems analysis of
aminoglycoside-treated Escherichia coli by microarray suggested a model that
fits these data (20). It was postulated that interference with ribosome progression

95
would release incomplete polypeptides, some of which are translocated to the
cell membranes where they might trigger envelope stress. The Arc regulatory
system is perturbed, potentially accelerating respiration and thereby increasing
the flux of O2- and H2O2 into the cell interior. These two oxidants have known
sequelae that ultimately lead to DNA damage. Specifically, O2- and H2O2 damage
the Fe-S clusters of aconitase-class dehydratases (17,21), releasing iron atoms
and elevating the pool of intracellular unincorporated iron (18,22). This iron can
then react with H2O2 in the Fenton reaction, generating hydroxyl radicals that
either directly damage DNA (14) or indirectly oxidize the deoxynucleotide pool,
which is subsequently incorporated into DNA (35). This scenario could explain
the observed oxidation of intracellular dyes, protection by scavengers and
chelators, a requirement for respiration, and the sensitivity of DNA-repair mutants.
This model is plausible, and so we devised experiments to directly test the
molecular events that underpin it. The bacterial strain (Escherichia coli MG1655),
growth medium (LB), and antibiotic doses were chosen to match those of
previous studies (19). Kanamycin was used to target translation, ampicillin to
block cell-wall synthesis, and norfloxacin to disrupt DNA replication.
3.2 Materials and Methods
3.2.1 Reagents
-Mercaptoethanol, bovine liver catalase, diethylenetriaminepentaacetic acid
(DTPA), deferoxamine mesylate (DFO), dipyridyl, ferric chloride, type II
horseradish peroxidase, 30% hydrogen peroxide, -nitrophenyl -D-

96
galactopyranoside (ONPG), K3Fe(CN)3, thiourea, dithionite, 6-phosphogluconate,
lactate dehydrogenase, NADH, cysteine, Fe(NH4)2(SO4)26H2O, dithiothreitol
(DTT), L-malic acid disodium salt, citraconic acid, potassium D-gluconate,
ampicillin, kanamycin, and norfloxacin were purchased from Sigma. KNO3 and D-
glucose were obtained from Fisher ChemAlert Guide. Albumin standard and
Coomassie protein assay reagent were purchased from Thermo Scientific. 3-(p-
hydroxyphenyl) fluorescein (HPF), Amplex Red and SuperScript III Reverse
Transcriptase were purchased from Invitrogen. Standard reagents for RNA work
were obtained from Ambion. DNase I digestion is from Biolabs. iQTM SYBR
Green Supermix was from BioRad, and real-time PCR plates were purchased
from Eppendorf.
3.2.2 Strain construction
The strains used in this study are listed in Table 3.1; they are all congenic
derivatives of MG1655. Deletions were constructed by the Red recombination
deletion method (4), were transferred to other strains by P1 transduction, and
were confirmed by PCR and/or phenotype analyses (25). The antibiotic-
resistance cassettes were subsequently removed by FLP-mediated excision (4).
Gene fusions between the katG upstream region (-160 bp to +16 bp) and lacZ
were created by standard methods and integrated into the lambda phage
attachment site (12), preserving the wild-type katG gene at its native
chromosomal locus.

97
3.2.3 Bacterial growth
All cultures were grown in LB (10 g tryptone, 5 g yeast extract, and 10 g NaCl per
liter) except indicated. Experimental protocols were designed to ensure that
measurements were performed upon exponentially growing cells. Overnight
cultures were diluted into fresh media and grown for 5 generations to early log
phase (OD600nm of 0.10 to 0.20) before treatment with antibiotics. All cultures
were grown at 37 C in the dark. Aerobic LB medium was made one day
previously and stored in the dark to avoid the photochemical generation of H2O2.
Anaerobic medium was transferred immediately after autoclaving to an anaerobic
chamber (Coy Laboratory Products), where it was stored under an atmosphere of
5% CO2/10% H2/85% N2 for at least one day prior to use. Where indicated, 40
mM KNO3, 0.2% gluconate, or 0.2% glucose was included in the medium. When
used, dipyridyl was made fresh and added into the media at a final concentration
of 500 M before inoculation.
Defined glucose/amino acids medium contained minimal A salts (25), 0.2%
glucose, 0.2% Casamino Acids, 0.5 mM tryptophan, 0.02% MgSO47H2O, and 5
g/ml thiamine.
Most experiments included in this report employed fixed concentrations of
antibiotics (5 g/ml ampicillin, 250 ng/ml norfloxacin or 5 g/ml kanamycin)
designed to match doses used by other workers (19). However, a higher dose of
kanamycin (30 g/ml) was used in testing the effects of nitrate upon killing so that
the impact of nitrate was clear. In the Edd assay, a higher dose of kanamycin (20

98
g/ml) was used because supplementation with 0.2% gluconate decreased
sensitivity of the cells to kanamycin. The fur mutant was also more resistant to
kanamycin, and therefore 10 g/ml kanamycin was used to show the killing.
3.2.4 Cell viability
To determine cell viability, cultures were grown to 0.1-0.2 OD600nm (aerobic
cultures) or 0.05 OD600nm (anaerobic cultures) prior to the addition of antibiotics.
The lower density of anaerobic cultures ensured that they did not approach
stationary phase during antibiotic treatment. Cell samples were collected at
designated time points and washed twice with PBS (50 mM potassium
phosphate with 0.9% NaCl, pH 7.2) and then serially diluted, mixed with LB top
agar, and spread onto the surface of LB plates. Colonies were allowed to grow
aerobically (or anaerobically for anaerobic killing) for 24 h and plates that had
30~300 colonies were selected for counting. At least three replicates of the
survival-curve experiments were performed. Day-to-day variations in medium
composition shifted the curves slightly, but the sample-to-sample comparisons
cited in the text were invariable. Therefore, representative survival curves are
presented.
3.2.5 O2 consumption
Cells were cultured in LB and treated with antibiotics as described above. At
designated time points samples were collected and diluted in air-saturated LB to
0.05~0.15 OD600nm, and respiration was measured with a Digital Model 10 Clark-
type oxygen electrode (Rank Brothers Ltd) at 37 C. The machine was calibrated
with air-saturated LB medium and sodium dithionite.
99
3.2.6 Real-time PCR
Cells were cultured in LB as described above. For the H2O2 control, aliquots of
cultures were treated with 250 M H2O2 at room temperature for 10 min. RNA
was harvested by the hot phenol method and cleaned up using the RNeasy mini
Kit (Qiagen). The DNA-free RNA samples were generated by DNase I digestion
and converted to cDNA by SuperScript III Reverse Transcriptase. The following
primers were used to analyze expression of ahpC, katG, yaaA, and the
housekeeping gene gapA: ahpC forward, 5-GACCCGTAACTTCGACAACA-3;
ahpC reverse, 5-ATGCCTTCAGCGGTAACTTC-3; katG forward, 5-
TACTGGGTGCCAACTTCGAT-3; katG reverse, 5-
GGTCGCTTTCCACTCGTAAC-3; yaaA forward, 5-
GCTGTTAGACAATTCCCAGCAG-3; yaaA reverse, 5-
AAGCCGGTGTAGACATCACCTT-3; gapA forward, 5-
CGTTCTGGGCTACACCGAAGATGACG-3; gapA reverse, 5-
AACCGGTTTCGTTGTCGTACCAGGA-3. The 25 l real-time PCR mixture
contained 50 ng of cDNA, 12.5 l of SYBR Green Supermix, and 400 nM of
ahpC, gapA or yaaA primers, or 1 M of katG primers. Thermal cycling was
performed using a Mastercycler ep realplex (Eppendorf) for 40 cycles in 3 steps:
95 C for 20 s, 58 C for 20 s and 72 C for 20 s. Amplification efficiencies were
determined for each primer set (0.9 to 1.1) and were used in calculating the fold
change. The melting curves were checked for all samples at the end.

100
3.2.7 -Galactosidase activity
Samples were collected at designated time points, and cells were centrifuged,
washed and resuspended in ice-cold 50 mM TrisHCl (pH 8.0), followed by lysis
with a French pressure cell (SIM Aminco FA-003). Cell debris was removed by
centrifugation, and -galactosidase activity in the supernatant was measured by
standard procedures (25). Protein concentrations were determined by the
Bradford assay using bovine serum albumin as the standard.
3.2.8 H2O2 production measurement
The rate of H2O2 formation by antibiotic-treated cells was measured with Hpx-
(catalase/peroxidase-null) mutants as described (27). Anaerobic overnight
cultures of Hpx- cells were diluted and grown at least five generations in aerobic
LB broth to 0.1~0.2 OD600nm. They were then treated with antibiotics as described
above. At time points the cells were centrifuged, suspended in fresh
tryptone/NaCl (10 g tryptone and 10 g NaCl per liter) at an OD600nm of 0.05~0.1,
and incubated aerobically at 37 °C with vigorous aeration. At intervals, cells were
removed by centrifugation, and H2O2 concentrations were measured in the
supernatants using the Amplex Red/horseradish peroxidase assay (27) in a
Shimadzu RF Mini-150 fluorometer.
3.2.9 Electron paramagnetic resonance (EPR) measurement of intracellular
unincorporated iron
The pool of intracellular chelatable iron was quantified by established EPR
methods (34). The cells were cultured aerobically in 1 L of LB as described
above. At time points during antibiotic treatment, cells were centrifuged and
resuspended at 100-fold higher cell density in LB medium containing 10 mM

101
DTPA (pH 7.0) to block further iron import, and 20 mM DFO (pH 8.0) to facilitate
oxidation of intracellular unincorporated ferrous iron to EPR-detectable ferric iron.
The suspension was incubated at 37 C aerobically with shaking for 15 min. The
cell pellet was washed once with 5 ml of ice-cold 20 mM TrisHCl-10% glycerol
(pH 7.4) and finally re-suspended in 200 l of the same buffer before freezing.
The EPR analysis was performed as described previously (34). Different
concentrations of FeCl3 in 20 mM TrisHCl-10% glycerol-1 mM DFO (pH 7.4)
were used to make an EPR signal standard curve. The measured EPR signals
were normalized to cell density and converted to intracellular concentrations
using the following conversion: 1 ml of E. coli culture at OD600nm of 1 comprises
0.52 l of intracellular volume (15).
3.2.10 Enzyme assays
6-phosphogluconate dehydratase (Edd) assay
Cells were cultured in LB with 0.2% gluconate as described above. Overnight
cultures of SOD-deficient mutants were grown in anaerobic media to avoid the
selection of suppressor mutations; log-phase cells were then diluted and grown
in aerobic media for 3 hours (to 0.2 OD600) prior to harvesting. Samples were
collected at designated time points, washed with ice-cold 50 mM Tris-HCl (pH
7.65) buffer, and frozen at -80 C. Before the assay, the cell pellets were
resuspended in anaerobic ice-cold 50 mM Tris-HCl (pH 7.65) buffer, and cell
extracts were prepared by anaerobic sonication. The activity of Edd was
determined by incubating the cell lysate with 6-phosphogluconate for 2, 4, 6 and
8 min, then the amount of pyruvate produced was determined by monitoring

102
NADH consumption catalyzed by lactate dehydrogenase (16). In order to repair
the damaged Fe-S clusters, cell lysates were incubated with 0.5 mM
Fe(NH4)2(SO4)2 and 5 mM DTT at room temperature anaerobically for 45 min
before measuring the activity. Typically a minor fraction of the enzyme population
has [3Fe-4S] clusters that can be reactivated; this becomes the great majority
during oxidative stress (10). The addition of IscS protein and cysteine to the
repair reaction (16) did not further increase the activity, indicating that no
apoprotein was present.
Isopropylmalate isomerase (IPMI) assay and fumarase assay
Cells were cultured in minimal A defined medium with 0.2% glucose, and aerated
log-phase cells (0.1 to 0.2 OD600) were treated with 20 g/ml kanamycin, and
samples were collected at designated time points.
For the IPMI samples, the growth medium was supplemented with 0.5 mM each
of histidine, phenylalanine, tyrosine and tryptophan. Harvested samples were
washed with ice-cold 100 mM Tris-Cl (pH 7.6) buffer, and frozen at -80 C.
Before the assay, the cell pellets were resuspended in anaerobic ice-cold 100
mM Tris-Cl buffer (pH 7.6) with 2 mM EDTA, and cell extracts were prepared by
anaerobic sonication. The activity of IPMI was monitored at A235 by incubating
the cell lysate with 0.4 mM citraconate (17).
For fumarase assay, the growth medium was supplemented with 0.2% casamino
acides and 0.5 mM tryptophan. After harvest, samples were washed with ice-
cold 50 mM sodium phosphate buffer (pH 7.3), and frozen at -80 C. Before the

103
assay, the cell pellets were resuspended in anaerobic ice-cold sodium phosphate
buffer, and cell extracts were prepared by anaerobic sonication. The activity of
fumarase was monitored at A250nm by incubating the cell lysate with 50 mM
malate (17).
The damaged Fe-S clusters of IPMI and fumarase were repaired by incubation
with ferrous iron and DTT as described above.
3.2.11 H2O2 killing assay
At designed time points, cell samples were diluted to an OD600nm of 0.05 in fresh
LB and treated with 2.5 mM H2O2 at 37 °C. At intervals, aliquots were harvested
and immediately mixed with catalase (final concentration: 2500 U/ml) in order to
terminate H2O2 stress. Cells were serially diluted, mixed with top agar, and then
spread on LB plates. CFUs were determined after aerobic incubation at 37 °C for
24 h.
3.2.12 Hydroxyphenyl fluorescein (HPF) assay
One millimolar H2O2 was added into 0.1 M sodium phosphate buffer, pH 7.4,
containing 100 M Fe(NH4)2(SO4)2 and 10 M 3-(p-hydroxyphenyl) fluorescein
(HPF) (28). The resultant fluorescent signal was measured in a Shimadzu RF
Mini-150 fluorometer using 490/520 nm as excitation/emission wavelengths. To
scavenge the oxidant generated by the Fenton reaction, thiourea or ethanol was
added to the mixture before H2O2 was added. In other experiments, different
amounts of K3Fe(CN)3 were mixed with 10 M HPF in 0.1 M sodium phosphate
buffer, and the fluorescent signal was recorded after 20 min incubation. 100 M
H2O2 and 0.2 g/ml horseradish peroxidase (HRP) were mixed with 10 M HPF,

104
or 100 M H2O2 and 20 g/ml horseradish peroxidase (HRP) were mixed with 2
M HPF, and the fluorescent signal was monitored over time.
3.3 Results
3.3.1 Antibiotic killing does not require oxygen
Superoxide and hydrogen peroxide are generated inside cells when
flavoenzymes inadvertently transfer a fraction of their electron flux directly to
molecular oxygen (14,27). Thus neither of these reactive oxygen species can be
formed under anoxic conditions. We found, however, that ampicillin and
norfloxacin were as lethal to cells in an anaerobic chamber as to cells in air-
saturated medium (Figure 3.1A-B). Anoxia sharply diminished the toxicity of
kanamycin, but lethal activity was partially restored at high kanamycin doses
when nitrate was provided as an alternative respiratory substrate (Figure 3.1C).
This pattern mirrors the effects of oxygen and nitrate upon kanamycin import,
which is governed by the magnitude of the proton motive force (30,31). Thus
reactive oxygen species were not required for the lethal actions of kanamycin,
and they made no apparent contribution at all to the toxicity of ampicillin and
norfloxacin.
3.3.2 H2O2-stressed mutants have similar sensitivity to ampicillin or
kanamycin as wild type cells
Hydroxyl radicals are formed inside cells when ferrous iron transfers electrons to
H2O2, so hydroxyl-radical stress is greatest when either H2O2 or ferrous
concentrations are high. An E. coli mutant that lacks catalase and peroxidase
activities (denoted Hpx-) cannot scavenge H2O2 and more easily accumulates it

105
to toxic levels; resulting in substantial damage to proteins and DNA (2,17,26,29).
However, this mutant only showed increased sensitivity to norfloxacin, but not to
ampicillin or kanamycin (Figure 3.2). The elevated sensitivity to norfloxacin could
be due to antibiotic-mediated oxidative stress; yet it is also possible that with the
inhibitory effect of norfloxacin upon DNA metabolism merely exacerbates the pre-
existing DNA damage in the Hpx- mutants (7,26). To further test these
possibilities, we first sought to evaluate the levels of H2O2 production after
antibiotic incubation.
3.3.3 Antibiotic treatments did not accelerate the formation of hydrogen
peroxide
We directly tested the prediction that antibiotic treatment would augment
respiration and thereby increase O2- and H2O2 formation. The respiratory chain is
normally a minor source (< 20%) of these oxidants (27), so a very large flux
increase would be needed to substantially amplify total intracellular oxidant
production. However, measurements of oxygen consumption with a Clark-type
electrode showed that respiration slowly declined, rather than increased, when
cells were treated with kanamycin (Figure 3.3). This trend persisted throughout
the period during which the number of viable cells declined by > 99% (Figure
3.2B). Norfloxacin had little effect on respiration. Ampicillin transiently increased
respiration, perhaps by causing envelope damage that dissipated the
backpressure of the proton motive force, before cell lysis ended metabolism. In
no case did respiration accelerate enough to be a sufficient explanation for
toxicity.

106
E. coli has a transcription factor, OxyR, that is activated by H2O2 whenever its
levels approach the concentrations (0.5-1 M) sufficient to damage enzymes or
DNA (3). The OxyR regulon includes genes whose products assist in H2O2
scavenging (katG, ahpCF), free-iron control (dps, fur, yaaA), and enzyme
protection (mntH, sufABCDE) (14,23,37). When cells were treated with ampicillin
and norfloxacin, they accumulated lethal damage within one hour (Figure 3.1A-B);
however, real-time PCR analysis indicated that OxyR-controlled genes-katG,
ahpC, and yaaA-were not induced (Figure 3.4A). These antibiotic-treated cells
robustly activated katG, ahpC, and yaaA when exogenous H2O2 was added as a
control (Figure 3.4A). After one hour, kanamycin-treated cells failed to respond
even to authentic H2O2, perhaps because OxyR protein was depleted in these
translationally blocked cells (data not shown). This result was confirmed by
measurements of katG::lacZ expression (Figure 3.4B-C). Thus, lethal doses of
neither ampicillin nor norfloxacin create enough H2O2 stress to trigger the natural
H2O2 sensor within the cell.
The rate of intracellular H2O2 formation can be directly measured using
catalase/peroxidase-deficient mutants. Endogenous H2O2 rapidly diffuses from
these cells out into the growth medium, and the rate of its accumulation in the
medium can be quantified by direct assay (Figure 3.5) (27). When cells were
treated with lethal concentrations of kanamycin and ampicillin, H2O2 production
did not increase (Figure 3.6A-B). In norfloxacin-treated cells H2O2 formation
increased slightly (< 2-fold) after one hour but not at all within the first 30 min
when > 99% of cells accumulated lethal damage (Figure 3.6C and Figure 3.2C).

107
Therefore, the moderately increased of H2O2 generation in later time points was
not the primary bactericidal mechanism for norfloxacin. In contrast, when cells
were treated with a non-lethal dose of the redox-cycling drug, paraquat, H2O2
production was stimulated ~ 7-fold (Figure 3.6D).
Taken together, we conclude that these classic bactericidal antibiotics did not
promote H2O2 formation.
3.3.4 Antibiotic treatments did not increase the pool of unincorporated iron
There is one other way that hydroxyl-radical formation might be accelerated: by
increases in the amount of unincorporated iron. Iron can accumulate inside cells
under conditions of superoxide stress, due to the destruction of labile enzymic
Fe-S clusters (18,22), and this mechanism was postulated to occur during
antibiotic exposure (8,19). We monitored the status of 6-phosphogluconate
dehydratase, an aconitase-class Fe-S cluster containing enzyme that quickly
loses activity in superoxide-stressed cells (10). We observed that the overall
enzyme activity diminished during hours of antibiotic treatment, but the fraction of
enzymes with incomplete clusters did not significantly rise (Figure 3.7A-B). In
contrast, in control mutants that lack superoxide dismutase, the entire enzyme
population was inactive due to cluster damage (Figure 3.7C). Similarly, lethal
doses of kanamycin did not damage the Fe-S clusters in fumarase and isopropyl
isomerase (Figure 3.8), another two aconitase-class enzymes that are known to
be sensitive to oxidative stress (17).
Levels of intracellular unincorporated iron were directly imaged by whole-cell
electron paramagnetic resonance (EPR) spectroscopy (34). These levels did not

108
rise in kanamycin- or norfloxacin-treated cells (Figure 3.9A-B). (Levels could not
be measured after ampicillin treatment, because lysing cells could not be
concentrated for the measurement.) In contrast, free-iron levels were increased
4-fold in fur regulatory mutants that over-synthesize iron import systems (Figure
3.9C). Notably, while fur mutants were slightly more sensitive to ampicillin, they
were actually more resistant to kanamycin and norfloxacin (Figure 3.10). This
result, also observed by others (8), indicates that intracellular free-iron levels do
not correlate with antibiotic sensitivity.
3.3.5 General DNA repair pathways had little effect upon antibiotic
sensitivity
DNA is substantially damaged when hydroxyl radicals are rapidly formed inside
cells, and mutants that are deficient in the excision or recombinational repair of
oxidative DNA lesions are particularly vulnerable (14). The extreme sensitivity of
recA and polA mutants to exogenous H2O2 is illustrated in Figure 3.11A.
However, recA strains exhibited little or no hypersensitivity to killing doses of
kanamycin or ampicillin, suggesting that these antibiotics have little effect upon
the rate of DNA damage (Figure 3.11C-D). The recA mutants were
hypersensitive to norfloxacin (Figure 3.11E), as expected, since this antibiotic
directly introduces DNA strand breaks by interrupting the catalytic cycle of
topoisomerases. The polA mutants were actually more resistant to kanamycin
and ampicillin than were wild-type strains (Figure 3.11B), a phenomenon that
likely reflects the slower growth rate of this mutant strain. In sum, these data
indicate that, unlike H2O2 stress, these antibiotics do not introduce lethal damage
into the DNA of cells.

109
Other workers noted that lower doses (1-2 g/ml) of ampicillin slowly kill recA
mutants while being merely bacteriostatic to wild-type strains (9,19). We
reproduced that result (Figure 3.12A). However, this behavior also occurred
under anoxic conditions, when reactive oxygen species are non-existent (Figure
3.12B). The slight sensitivity of recA mutants may reflect defects in septation
from their innate replication problems. At higher doses of ampicillin, i.e., at doses
sufficient to kill wild-type bacteria, recombination proficiency had little or no
impact upon death rate (Figure 3.11C and 3.12A).
Collectively, these data indicate that the known mechanisms of oxidative stress
by reactive oxygen species were not involved in causing the death of antibiotic-
treated cells. Oxygen was dispensable for toxicity, and neither OxyR activity nor
direct measurements of H2O2 formation indicated that reactive oxygen species
were formed at accelerated rates. Further, no standard marker of oxidative
damage—enzyme damage, increases in free-iron levels, or hypersensitivity of
DNA-repair mutants—was detected.
3.4 Discussion
Fluorescein-based dyes such as HPF shows higher fluorescent signal within
antibiotic-treated cells than in control cells, and this fact has been regarded as
evidence that hydroxyl radicals are present (28). Indeed, thiourea, a presumptive
scavenger of hydroxyl radicals, diminished the antibiotic-augmented fluorescence
(5,19). However, we observed that although thiourea efficiently blocked dye
oxidation in a simple in vitro Fenton system, ethanol—another hydroxyl-radical
scavenger of similar efficiency (1)—failed to do so, even at far higher doses

110
(Figure 3.13A-B). This result implies that the dye was actually oxidized by the
high-valence iron (FeIV=O)2+ initially formed by the Fenton reaction, rather than
by the hydroxyl radical into which it decomposes; thiourea, a sulfur compound,
may have re-reduced the metal before it oxidized the dye. Indeed, the dye was
very rapidly oxidized by horseradish peroxidase (Figure 3.13C), which has an
analogous high-valence metal intermediate but does not release hydroxyl
radicals (13). The dye was even oxidized by ferricyanide, a ferric-iron chelate of
moderate oxidizing potential (+ 0.44 V) (Figure 3.13E). Finally, the fluorescence
of the oxidized dye product was itself quenched after the fact by addition of the
same doses of thiourea that were used in antibiotic studies (Figure 3.13D); this
effect cannot be due to hydroxyl-radical scavenging activity. Thus it is plausible
that fluorescein-based dyes are predominantly oxidized in vivo by oxidized
enzymic metal centers, which may be more prominent in antibiotic-treated cells
as metabolism fails. In any case, one must be cautious in interpreting the
oxidation of these dyes inside cells.
Finally, cell protection by either thiourea or iron chelators cannot be regarded as
diagnostic of lethal Fenton chemistry. Both agents suppressed antibiotic
sensitivity even under anaerobic conditions (Figure 3.14), when death occurs
through pathways that do not involve reactive oxygen species. We conjecture
that they did so by reducing growth and/or metabolic rates. In general, it is
unlikely that exogenous agents like thiourea could substantially diminish the
lifetimes of hydroxyl radicals in vivo, since these radicals already react at nearly
diffusion-limited rates with intracellular biomolecules that are collectively at molar

111
concentrations (6). Iron chelators have pleiotropic effects, including the
repression of TCA-cycle and respiratory enzymes (24), and may thereby diminish
the membrane potential that drives aminoglycoside uptake. Synthesis of these
enzymes is also repressed when cells are fed glucose, and this treatment
analogously diminished kanamycin sensitivity (Figure 3.15). Thus it is advisable
to follow up experiments that rely upon these agents with ones that employ more-
direct markers of oxidative stress.
We conclude that under our experimental conditions these major classes of
antibiotics did not exert their lethal actions through the known mechanisms of
oxidative stress. Of course, this does not preclude the possibility that antibiotics
trigger novel mechanisms of stress that do not involve the reactive oxygen
species that were tested here.
3.5 Acknowledgments
We thank Dan Hassett (University of Cincinnati) for helpful conversations about
this topic, and Jim Collins, Graham Walker, and members of their laboratories for
generously sharing ideas, unpublished data, and strains. We also thank Mark
Nilges of the Illinois EPR Research Center for assistance. This work was
supported by GM49060 from the National Institutes of Health.

112
3.6 Tables
Table 3.1 Strains used in this study.
Name Genotype/characteristics
AA16 As MG1655 plus gltA::cat~Tn10
AA98 As MG1655 plus icd1::cat
AL410 As MG1655 plus polA1~zih-102::Tn10
AL427 As MG1655 plus (ahpCF::cat)1 (katG17::Tn10)1 (katE12::Tn10)1
AL441 As MG1655 plus (lacZ1::cat)1 att::[pSJ501:: katG-lacZ+ cat+]
AL486 As MG1655 plus (recA774::kan)1
AL494 As MG1655 plus (ahpC-ahpF’) kan:: ahpF (katG17::Tn10)1 (katE12::Tn10)1 (lacZ1::cat)1
att::[pSJ501:: katG-lacZ+ cat+]
JEM913 As MG1655 plus (lacZ1::cat)1 (fur-731::kan)1
KI232 As MG1655 plus (sodB-kan)1-2 (sodA::cat)1
LEM17 As MG1655 plus recA56 srl300::Tn10
MG1655 Wild type
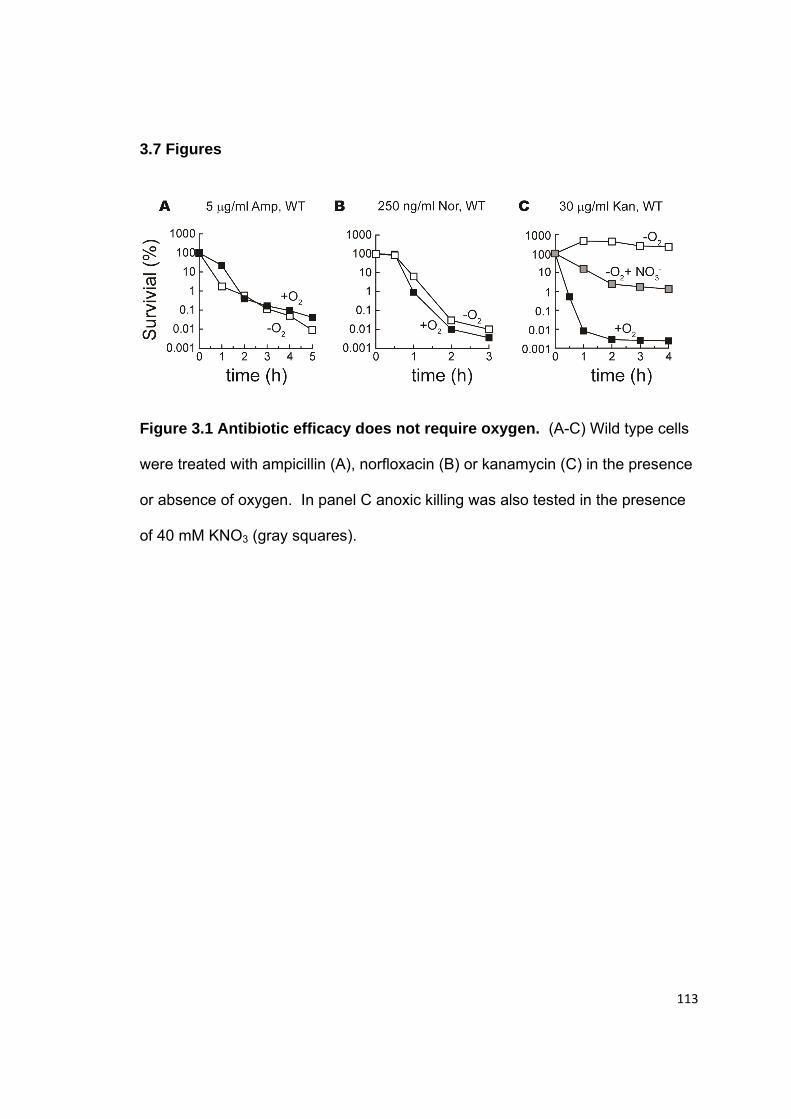
113
3.7 Figures
Figure 3.1 Antibiotic efficacy does not require oxygen. (A-C) Wild type cells
were treated with ampicillin (A), norfloxacin (B) or kanamycin (C) in the presence
or absence of oxygen. In panel C anoxic killing was also tested in the presence
of 40 mM KNO3 (gray squares).

114
Figure 3.2 Antibiotic efficacy does not require H2O2. Wild-type cells (solid
squares, MG1655) and congenic Hpx- cells (open diamonds, AL427) were
treated with antibiotics. (A-C) Cells were treated with one dose of antibiotics, and
viability was monitored overtime. (D-F) Cells were treated with different doses of
antibiotics for designated time period, and viable cells were determined.

115
Figure 3.3 O2 consumption rates were not substantially elevated by
antibiotic treatment. Oxygen consumption of wild type cells (MG1655) was
measured by a Clark-type electrode before and during exposure to 5 g/ml
kanamycin, 5 g/ml ampicillin, or 250 ng/ml norfloxacin. Respiration rates were
normalized to optical density.

116
Figure 3.4 The OxyR regulon was not induced by ampicillin (5 g/ml) or
norfloxacin (250 ng/ml). (A) mRNA was collected from naïve and antibiotic-
exposed cells (WT, MG1655), and the expression of OxyR-responsive genes
was quantified by RT-PCR. Signals were normalized to that of the housekeeping
gene gapA, and fold inductions were calculated. Where indicated, cultures were
additionally treated with exogenous H2O2 at room temperature for 10 min prior to
mRNA collection. (B-C) Expression of a katG::lacZ fusion was measured in
exponential-phase wild-type cells (AL441) before and after antibiotic incubations
(B). As a positive control, expression was measured in wild-type and Hpx- cells
(AL494) before (-O2) and after 1 hour aeration (+O2) (C).

117
Figure 3.5 Sample H2O2 production time course. Naïve and 1 h antibiotic-
treated Hpx- cells (AL427) were collected for H2O2 measurement. The redox-
cycling compound paraquat was included as a positive control. The suspension
of untreated Hpx- cells at 0.05 OD600nm excreted 16 nM H2O2/min into growth
medium (~10 M H2O2/s if normalized to cell volume).
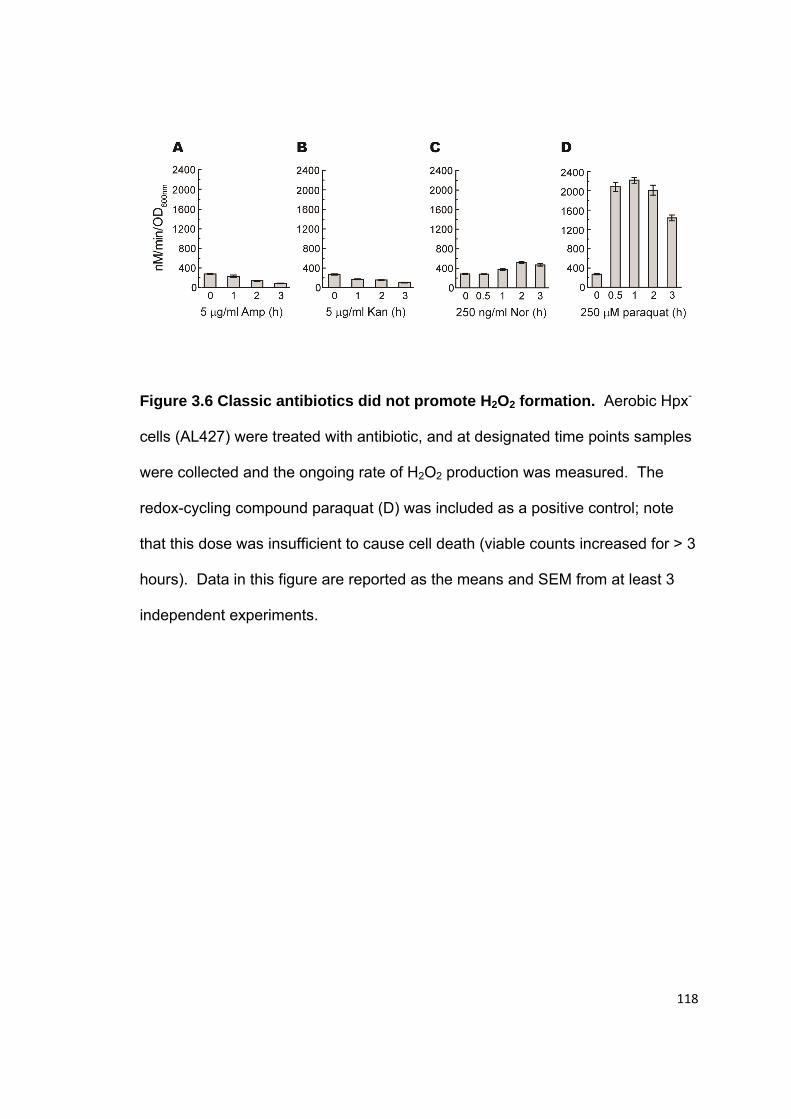
118
Figure 3.6 Classic antibiotics did not promote H2O2 formation. Aerobic Hpx-
cells (AL427) were treated with antibiotic, and at designated time points samples
were collected and the ongoing rate of H2O2 production was measured. The
redox-cycling compound paraquat (D) was included as a positive control; note
that this dose was insufficient to cause cell death (viable counts increased for > 3
hours). Data in this figure are reported as the means and SEM from at least 3
independent experiments.

119
Figure 3.7 The superoxide-sensitive enzyme Edd was not damaged by cell
exposure to kanamycin or norfloxacin. Cells growing in aerobic LB with 0.2%
gluconate were incubated with lethal doses of kanamycin (20 g/ml, A) or
norfloxacin (250 ng/ml, B), and Edd activity was measured before (open bar) and
after (closed bar) in vitro cluster repair with ferrous iron/DTT. Panel C represents
control data from an SOD-deficient strain (KI232). The star denotes < 4% normal
activity (the sensitivity of the assay).
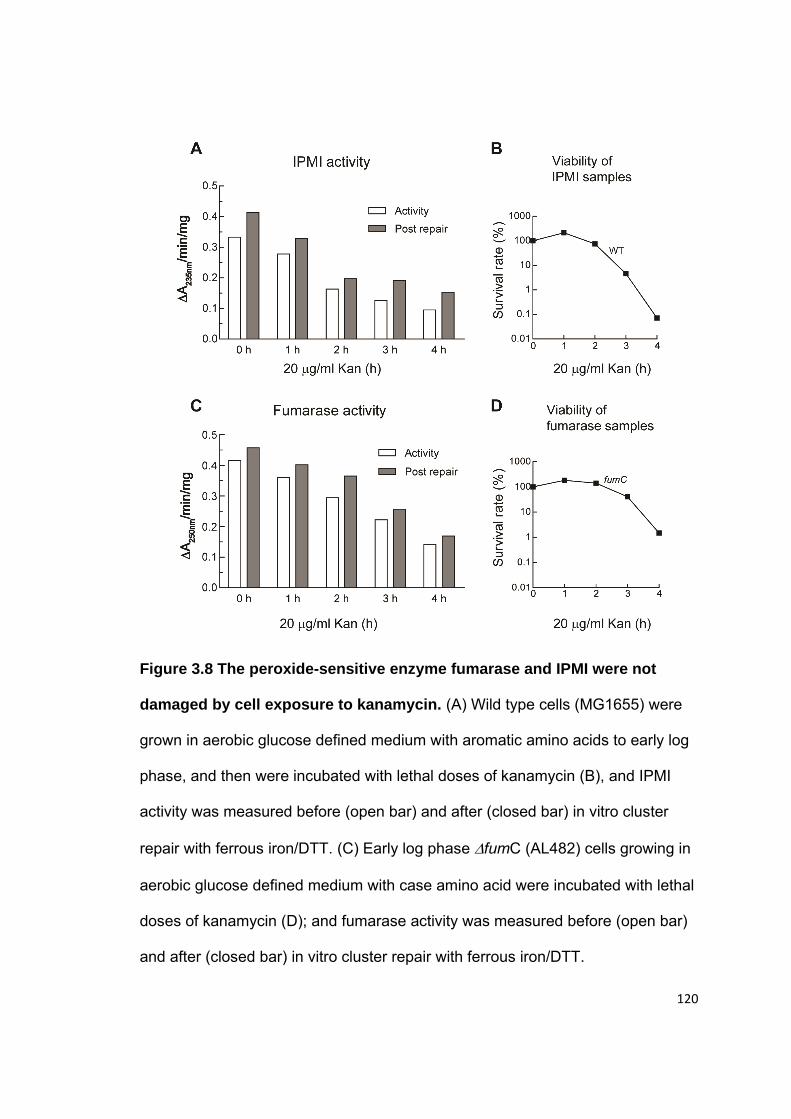
120
Figure 3.8 The peroxide-sensitive enzyme fumarase and IPMI were not
damaged by cell exposure to kanamycin. (A) Wild type cells (MG1655) were
grown in aerobic glucose defined medium with aromatic amino acids to early log
phase, and then were incubated with lethal doses of kanamycin (B), and IPMI
activity was measured before (open bar) and after (closed bar) in vitro cluster
repair with ferrous iron/DTT. (C) Early log phase fumC (AL482) cells growing in
aerobic glucose defined medium with case amino acid were incubated with lethal
doses of kanamycin (D); and fumarase activity was measured before (open bar)
and after (closed bar) in vitro cluster repair with ferrous iron/DTT.

121
Figure 3.9 Norfloxacin and kanamycin did not increase intracellular iron
levels. The levels of intracellular unincorporated iron were determined by whole-
cell EPR analysis before and during antibiotic exposure. Gray bars represent iron
levels in untreated cells at similar optical densities. (C) Levels of unincorporated
iron were measured in OD600nm of 0.15 untreated congenic wild type cells
(MG1655) and fur mutants (Jem913).

122
Figure 3.10 fur mutants were invariably more resistant to kanamycin and
norfloxacin. fur mutants were treated with ampicillin (A), kanamycin (B) or
norfloxacin (C).

123
Figure 3.11 DNA-repair mutants are not hypersensitive to antibiotic doses
that kill wild-type cells. (A) recA mutants and polA1 mutants are very sensitive
to H2O2 challenge. (B) Aerobic log-phase wild type cells and polA1 mutants were
treated with 100 ng/ml norfloxacin for 1 hour or with 5 g/ml ampicillin or 5 g/ml
kanamycin for 2 hours. The error bars represent the standard error of the mean
(SEM). (C-E) Wild-type cells (solid squares) and recA mutants (open circles)
were treated with the indicated doses of ampicillin (C) or kanamycin (D) for 2
hours, or norfloxacin (E) for one hour. Data in this figure are reported as the
means and SEM from at least 3 independent experiments. WT, MG1655; recA,
AL486; recA56, Lem17; polA1, AL410.

124
Figure 3.12 A recA mutant is slightly sensitive to doses of ampicillin that
are bacteriostatic to wild-type cells, under both aerobic and anaerobic
conditions. Aerobic (A) or anaerobic (B) exponential-phase wild type cells and
recA mutants were treated with 1, 1.5 and 2 g/ml Amp, and survival was
monitored over time. Data are representative of at least three independent
experiments.
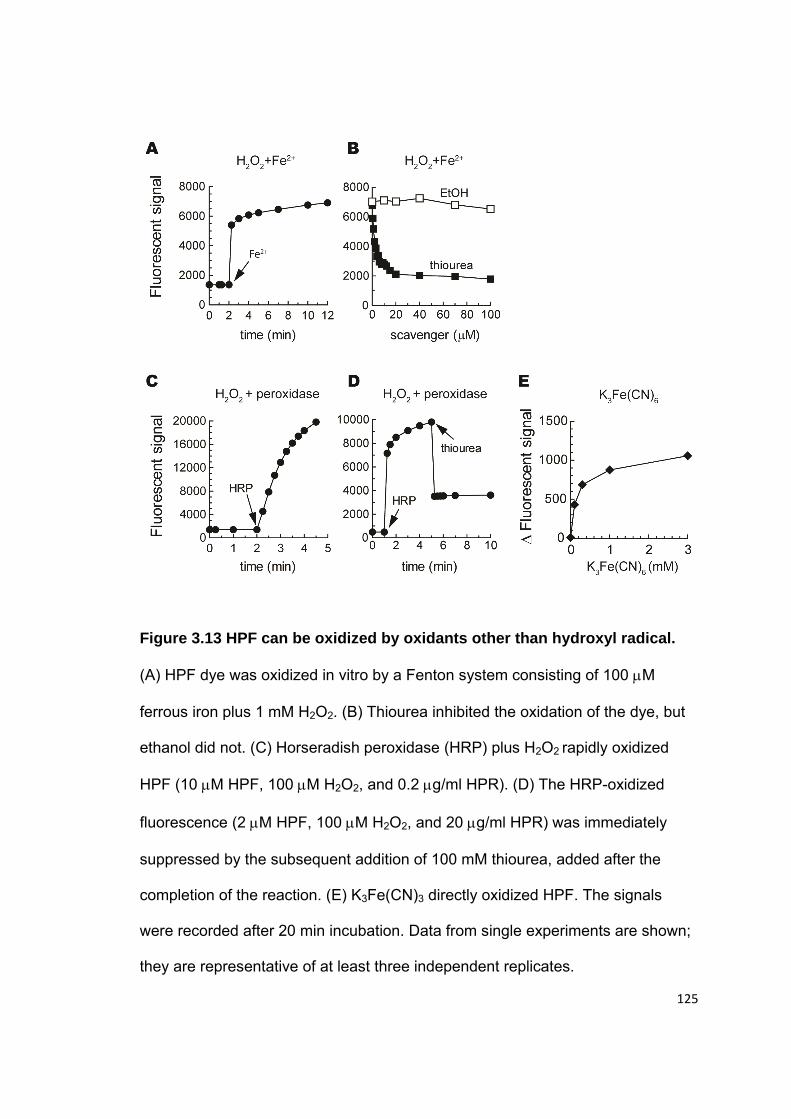
125
Figure 3.13 HPF can be oxidized by oxidants other than hydroxyl radical.
(A) HPF dye was oxidized in vitro by a Fenton system consisting of 100 M
ferrous iron plus 1 mM H2O2. (B) Thiourea inhibited the oxidation of the dye, but
ethanol did not. (C) Horseradish peroxidase (HRP) plus H2O2 rapidly oxidized
HPF (10 M HPF, 100 M H2O2, and 0.2 g/ml HPR). (D) The HRP-oxidized
fluorescence (2 M HPF, 100 M H2O2, and 20 g/ml HPR) was immediately
suppressed by the subsequent addition of 100 mM thiourea, added after the
completion of the reaction. (E) K3Fe(CN)3 directly oxidized HPF. The signals
were recorded after 20 min incubation. Data from single experiments are shown;
they are representative of at least three independent replicates.

126
Figure 3.14 The protective effects of thiourea and dipyridyl persist when
cells are treated with antibiotics in the absence of oxygen. (A) Exponential-
phase wild type cells were incubated with 150 mM thiourea and 5 g/ml ampicillin,
under both anoxic and aerated conditions. (B, C) Aerobic (B) or anaerobic (C)
wild-type cells were incubated with 5 g/ml ampicillin or 250 ng/ml norfloxacin.
Where indicated, 500 M dipyridyl (DP) was included. Thiourea and dipyridyl
concentrations matched those used in previous studies (19).

127
Figure 3.15 Diminution of TCA-cycle flux protects cells from kanamycin.
Wild-type cells and TCA-cycle mutants (gltA and icd, lacking citrate synthase
and isocitrate dehydrogenase, respectively) were treated with 5 g/ml kanamycin,
and survival was monitored over time. Where indicated, 0.2% glucose was
included in the LB medium. In response to glucose, the expression of TCA-cycle
enzymes is repressed. The results suggest that a shift towards fermentative
metabolism suppresses kanamycin toxicity.

128
3.8 References
1. Anbar, M. and P. Neta. 1967. A Compilation of Specific Biomolecular Rate Constants for the Reactions of Hydrated Electrons, Hydrogen Atoms and Hydroxyl Radicals with Inorganic and Organic Compounds in Aqueous Solutions. International Journal of Applied Radiation and Isotopes 18:493-523.
2. Anjem, A. and J. A. Imlay. 2012. Mononuclear iron enzymes are primary targets of hydrogen peroxide stress. J. Biol. Chem. 287:15544-15556.
3. Aslund, F., M. Zheng, J. Beckwith, and G. Storz. 1999. Regulation of the OxyR transcription factor by hydrogen peroxide and the cellular thiol-disulfide status. Proc. Natl. Acad. Sci. U. S. A. 96:6161-6165.
4. Datsenko, K. A. and B. L. Wanner. 2000. One-step inactivation of chromosomal genes in Escherichia coli K-12 using PCR products. Proc. Natl. Acad. Sci. U. S. A. 97:6640-6645.
5. Davies, B. W., M. A. Kohanski, L. A. Simmons, J. A. Winkler, J. J. Collins, and G. C. Walker. 2009. Hydroxyurea induces hydroxyl radical-mediated cell death in Escherichia coli. Mol. Cell. 36:845-860.
6. Davies, M. J. 2005. The oxidative environment and protein damage. Biochim. Biophys. Acta. 1703:93-109.
7. Drlica, K., H. Hiasa, R. Kerns, M. Malik, A. Mustaev, and X. Zhao. 2009. Quinolones: action and resistance updated. Curr. Top. Med. Chem. 9:981-998.
8. Dwyer, D. J., M. A. Kohanski, B. Hayete, and J. J. Collins. 2007. Gyrase inhibitors induce an oxidative damage cellular death pathway in Escherichia coli. Mol. Syst. Biol. 3:91.
9. Foti, J. J., B. Devadoss, J. A. Winkler, J. J. Collins, and G. C. Walker. 2012. Oxidation of the guanine nucleotide pool underlies cell death by bactericidal antibiotics. Science. 336:315-319.
10. Gardner, P. R. and I. Fridovich. 1991. Superoxide sensitivity of the Escherichia coli 6-phosphogluconate dehydratase. J. Biol. Chem. 266:1478-1483.
11. Grant, S. S., B. B. Kaufmann, N. S. Chand, N. Haseley, and D. T. Hung. 2012. Eradication of bacterial persisters with antibiotic-generated hydroxyl radicals. Proc. Natl. Acad. Sci. U. S. A. 109:12147-12152.
12. Haldimann, A. and B. L. Wanner. 2001. Conditional-replication, integration, excision, and retrieval plasmid-host systems for gene structure-function studies of bacteria. J. Bacteriol. 183:6384-6393.
129
13. Ikemura, K., M. Mukai, H. Shimada, T. Tsukihara, S. Yamaguchi, K. Shinzawa-Itoh, S. Yoshikawa, and T. Ogura. 2008. Red-excitation resonance Raman analysis of the nu(Fe=O) mode of ferryl-oxo hemoproteins. J. Am. Chem. Soc. 130:14384-14385.
14. Imlay, J. A. 2008. Cellular Defenses against Superoxide and Hydrogen Peroxide. Annu. Rev. Biochem. 77:755-776.
15. Imlay, J. A. and I. Fridovich. 1991. Assay of metabolic superoxide production in Escherichia coli. J. Biol. Chem. 266:6957-6965.
16. Jang, S. and J. A. Imlay. 2010. Hydrogen peroxide inactivates the Escherichia coli Isc iron-sulphur assembly system, and OxyR induces the Suf system to compensate. Mol. Microbiol. 78:1448-1467.
17. Jang, S. and J. A. Imlay. 2007. Micromolar intracellular hydrogen peroxide disrupts metabolism by damaging iron-sulfur enzymes. J. Biol. Chem. 282:929-937.
18. Keyer, K. and J. A. Imlay. 1996. Superoxide accelerates DNA damage by elevating free-iron levels. Proc. Natl. Acad. Sci. U. S. A. 93:13635-13640.
19. Kohanski, M. A., D. J. Dwyer, B. Hayete, C. A. Lawrence, and J. J. Collins. 2007. A common mechanism of cellular death induced by bactericidal antibiotics. Cell. 130:797-810.
20. Kohanski, M. A., D. J. Dwyer, J. Wierzbowski, G. Cottarel, and J. J. Collins. 2008. Mistranslation of membrane proteins and two-component system activation trigger antibiotic-mediated cell death. Cell. 135:679-690.
21. Kuo, C. F., T. Mashino, and I. Fridovich. 1987. alpha, beta-Dihydroxyisovalerate dehydratase. A superoxide-sensitive enzyme. J. Biol. Chem. 262:4724-4727.
22. Liochev, S. I. and I. Fridovich. 1994. The role of O2.- in the production of HO.: in
vitro and in vivo. Free Radic. Biol. Med. 16:29-33.
23. Liu, Y., S. C. Bauer, and J. A. Imlay. 2011. The YaaA protein of the Escherichia coli OxyR regulon lessens hydrogen peroxide toxicity by diminishing the amount of intracellular unincorporated iron. J. Bacteriol. 193:2186-2196.
24. Masse, E., C. K. Vanderpool, and S. Gottesman. 2005. Effect of RyhB small RNA on global iron use in Escherichia coli. J. Bacteriol. 187:6962-6971.
25. Miller, J. H. 1972. Experiments in molecular genetics. Cold Spring Harbor Laboratory, Cold Spring Harbor, NY.
26. Park, S., X. You, and J. A. Imlay. 2005. Substantial DNA damage from submicromolar intracellular hydrogen peroxide detected in Hpx- mutants of Escherichia coli. Proc. Natl. Acad. Sci. U. S. A. 102:9317-9322.

130
27. Seaver, L. C. and J. A. Imlay. 2004. Are respiratory enzymes the primary sources of intracellular hydrogen peroxide? J. Biol. Chem. 279:48742-48750.
28. Setsukinai, K., Y. Urano, K. Kakinuma, H. J. Majima, and T. Nagano. 2003. Development of novel fluorescence probes that can reliably detect reactive oxygen species and distinguish specific species. J. Biol. Chem. 278:3170-3175.
29. Sobota, J. M. and J. A. Imlay. 2011. Iron enzyme ribulose-5-phosphate 3-epimerase in Escherichia coli is rapidly damaged by hydrogen peroxide but can be protected by manganese. Proc. Natl. Acad. Sci. U. S. A. 108:5402-5407.
30. Taber, H. W., J. P. Mueller, P. F. Miller, and A. S. Arrow. 1987. Bacterial uptake of aminoglycoside antibiotics. Microbiol. Rev. 51:439-457.
31. Vakulenko, S. B. and S. Mobashery. 2003. Versatility of aminoglycosides and prospects for their future. Clin. Microbiol. Rev. 16:430-450.
32. Wang, X. and X. Zhao. 2009. Contribution of oxidative damage to antimicrobial lethality. Antimicrob. Agents Chemother. 53:1395-1402.
33. Wang, X., X. Zhao, M. Malik, and K. Drlica. 2010. Contribution of reactive oxygen species to pathways of quinolone-mediated bacterial cell death. J. Antimicrob. Chemother. 65:520-524.
34. Woodmansee, A. N. and J. A. Imlay. 2002. Quantitation of intracellular free iron by electron paramagnetic resonance spectroscopy. Methods Enzymol. 349:3-9.
35. Yamada, M., M. Shimizu, A. Katafuchi, P. Gruz, S. Fujii, Y. Usui, R. P. Fuchs, and T. Nohmi. 2012. Escherichia coli DNA polymerase III is responsible for the high level of spontaneous mutations in mutT strains. Mol. Microbiol. 86:1364-1375.
36. Yeom, J., J. A. Imlay, and W. Park. 2010. Iron homeostasis affects antibiotic-mediated cell death in Pseudomonas species. J. Biol. Chem. 285:22689-22695.
37. Zheng, M., X. Wang, L. J. Templeton, D. R. Smulski, R. A. LaRossa, and G. Storz. 2001. DNA microarray-mediated transcriptional profiling of the Escherichia coli response to hydrogen peroxide. J. Bacteriol. 183:4562-4570.

131
CHAPTER FOUR: CONCLUSIONS
4.1 Conclusions from Current Work
4.1.1 YaaA plays a role in peroxide defense by controlling iron levels
The unknown function gene, yaaA, is induced by H2O2 in an OxyR-dependent
manner (24), which suggests that it has functions important during cellular
response to peroxide stress. Indeed, deletion of yaaA caused a growth defect
during peroxide stress in rich medium, which was due to Fenton-mediated DNA
damage. YaaA did not prevent the Fenton reaction by limiting the levels of H2O2,
cysteine or reduced flavin; instead, it protected the cell by controlling iron
concentrations. YaaA had functions independent of other iron homeostasis
proteins--Fur and Dps--in the OxyR regulon, which implied that YaaA played a
role other than inhibiting iron uptake and scavenging iron. We hypothesize that
YaaA is involved in iron trafficking during peroxide stress, but its molecular
mechanism is still unknown.
4.1.2 The lethal effect of classic bactericidal antibiotics does not involve
oxidative stress
For the past six years, several studies raised the hypothesis that different classes
of antibiotics-- including -lactams, aminoglycosides, and fluoroquinolones--
shared a common bactericidal mechanism: they kill bacteria by stimulating the
production of reactive oxygen species (5,6,8,12,13). In the current study, the
proposed events underpinning this model were directly tested. However, in
contrast to the hypothesis, bactericidal antibiotics did not induce the native

132
peroxide defense system nor accelerate peroxide formation. Oxidative stress
sensitive enzymes were not damaged, and intracellular unincorporated iron level
did not increase. Oxidative DNA lesions were not important for their bactericidal
effects because the lethality of antibiotics persisted under anoxic conditions. In
addition, DNA repair systems had little effect on the toxicity of -lactams or
aminoglycosides. Taken together, we conclude that classical antibiotics did not
generate reactive oxygen species for their bactericidal effects.
4.2 Possible Future Work
4.2.1 What causes the growth defect of Hpx- yaaA mntH mutants in glucose
defined medium?
In LB medium, deletion of yaaA increased the level of unincorporated iron in
H2O2 stress cells, leading to hydroxyl radical-mediated DNA damage. However,
YaaA dysfunction had no impact on H2O2 stress cells growing in glucose defined
medium unless the manganese importer MntH was deleted.
In aerated glucose defined medium, the number of viable cells of Hpx- mntH
mutants kept increasing for three hours before growth arrested, while in the Hpx-
yaaA mntH strain, growth stopped immediately (Figure 2.15D). Because there
was no loss of viability, it was likely that the damage in yaaA mutants was due to
inhibition of metabolism, for example, poisoning H2O2 sensitive Fe-S cluster
containing enzymes or mononuclear iron enzymes.
The growth defect occurred even when all amino acids were provided (Figure
2.15B-D), which suggested that the damaged target was not in H2O2-sensitive

133
amino acid biosynthetic pathways. In other words, the sensitive target was not
isopropylmalate isomerase, dihydroxy acid dehydratases, or 2-dehydro-3-
deoxyphosphoheptonate aldolase.
When high levels of manganese were supplied in the medium, they suppressed
the growth defect of Hpx- mntH cells. We hypothesize this protective effect
occurs because there is enough manganese entering the cell through other metal
importers (i.e. FeoB, ZupT or NikD), replacing the ferrous iron cofactor in
mononuclear iron containing enzymes and restoring their activities (1,2,18).
However, adding manganese made little improvement to the growth of Hpx- yaaA
mntH mutants (Figure 2.15C). There are two possible explanations for this result:
1) the yaaA mutant needs more manganese than non-specific import mechanism
can provide; or 2) the damaged mononuclear enzymes cannot obtain
manganese because either the yaaA deletion causes a block in non-specific
manganese import or it disrupts the intracellular manganese delivery.
Our results show that YaaA controls iron homeostasis during peroxide stress,
and it may do so by acting as an iron chaperone. Therefore, it is possible that
YaaA might also participate in manganese trafficking, since iron and manganese
are very similar metals and they are often exchangeable in biological systems.
Indeed, many mononuclear metalloenzymes can use either iron or manganese to
catalyze their reactions (1,2,18). The only known exceptions in E. coli are
superoxide dismutases and class I ribonucleotide reductases, both of which have
isozymes specifically using iron or manganese (3,4,14,19,20,22,23). Therefore, it
is possible that YaaA can deliver both iron and manganese to the target enzymes,

134
and this becomes important in H2O2 stressed cells when manganese is depleted
(mntH mutant).
Most of the growth defects in oxidative stress do not appear until several
generation times after beginning aeration (2,16,18,21). We think this is because it
takes time to accumulate enough damage to overwhelm the repair systems and
stop growth. Hence the immediate growth defect of Hpx- yaaA mntH cells in
defined medium is unique. It suggests that not only is the target highly sensitive
but also the repair system fails rapidly. In order to identify the sensitive targets,
we can use different carbon sources (i.e. glycerol) to pinpoint the susceptible
metabolic pathways, and then screen for potential enzyme targets and the failing
repair systems. These data may provide some additional important information
about the function of YaaA.
4.2.2 What genes are induced in yaaA mutants?
Systems-biology assays are useful to generate new hypothesis that are
unexpected. Genome-wild microarray profiles or RNA-Seq (whole transcriptome
shotgun sequencing) of Hpx- yaaA strains and Hpx- yaaA mntH strains may
produce new hypotheses for YaaA function.
4.2.3 What is the three-dimensional structure of YaaA?
YaaA belongs to protein family domain of unknown function DUF328. This family
of proteins is found in over 1,300 bacterial species, but there is no recognizable
motif or available crystal structure (7). Therefore, solving the structure of YaaA
may provide some insight into the function of YaaA and this family of proteins.

135
Indeed, the molecular function of Dps remained mysterious until its crystal
structure revealed that it was a structural analogue of ferritin, and it actually
functioned in iron sequestration (9). If the crystal structure of YaaA resembles
structures of proteins with assigned functions, it could provide insight into the
function of YaaA. This work is underway in other group. Combined with the yaaA
phenotype and the three-dimensional structure, we may be able to identify the
key amino acid residues in YaaA protein.
4.2.4 Does YaaA bind iron?
If YaaA is an iron chaperone, YaaA should be able to bind iron, most likely in the
ferrous form (3). Usually, the interaction between ligands and proteins can be
detected by isothermal titration calorimetry (ITC). ITC is a technique used to
measure the heat released or consumed during the binding events. Theoretically,
it could be employed to detect the binding of iron to YaaA. However, the binding
of ferrous iron to proteins is usually rather weak, according to the Irving-Williams
series, and as a metal chaperone the binding of YaaA and iron would be more
exchange labile, and thus the interaction between YaaA and iron might be below
the detection limit of direct ITC measurement. Thus, a negative result would not
necessarily reject the possibility that YaaA is an iron chaperone.
4.2.5 Are there any functionally critical residues in YaaA?
Cysteine residues form the basis of conserved motifs in Fe-S cluster dependent
proteins; however, there is no conserved binding motif for ferrous iron, which
makes it impossible to predict whether YaaA binds iron by just looking at the
protein sequence. When we compared the protein sequences of DUF328, we

136
found no absolutely conserved residues. Most of the highly conserved residues
are tyrosine, phenylalanine and glycine residues, which are usually used for
structure reasons. There are also some positive charged and negative charged
residues that are relatively conserved. Mutation of conserved residues in YaaA
could alter the activity of YaaA, and in combination with the crystal structure, this
information will be useful to determine the function of YaaA.
4.2.6 What percentage of the HPF is oxidized in antibiotic treated cells?
Hydroxyphenyl fluorescein (HPF) has been widely used for hydroxyl radical
detection (5,6,10,12,13,15,17). As a cell permeable dye, the amount of HPF
inside the cell depends upon envelope permeability. Therefore, an increased
HPF fluorescent signal inside the cell can be caused in two ways: 1) oxidation of
HPF or 2) larger uptake of un-oxidized dye. Some antibiotics, such as
aminoglycosides, can increase membrane permeability during their action, which
might be the reason for higher HPF signal in antibiotic-treated cells. In order to
distinguish these two possibilities, it is necessary to determine what percentage
of HPF inside the cell is oxidized. One possible way to do that is to use
horseradish peroxidase/H2O2 or K3Fe(CN)6 to completely oxidize HPF in the cell
extract, and compare the ratio of fluorescence before and after oxidation.
4.2.7 Can KatG oxidize the HPF dye?
Although HPF is often used as a hydroxyl radical specific detection probe, my in
vitro studies showed that HPF can be oxidized by high-valent iron centers, such
as the ferryl radical intermediate in the Fenton reaction, or ferryl-porphyrin radical
(Compound I) intermediate of horseradish peroxidase during its catalytic cycle

137
(11). Thus, we hypothesize that HPF can be oxidized by heme prosthetic groups
in enzymes, if they are accessible.
There are several candidates in aerobic growing E. coli that might oxidize HPF,
including hydroperoxidase I (KatG) and cytochrome oxidases. KatG has both
catalase and peroxidase activity, which means that after it reduce one molecule
of H2O2, the oxidized enzyme intermediate (Compound I) can be re-reduced back
to the resting state by abstracting two electrons from a second H2O2 or an
organic compound. Actually, the organic substrate, o-dianisidine, is used in
hydroperoxidase I assay to measure KatG activity. Therefore, the oxidized KatG
intermediate may be able to abstract electrons from HPF and oxidize the dye to a
fluorescent form. To test this idea, one can measure the HPF fluorescent signal
in katG deletion mutants, wild type cells and cells overexpressing katG to see
whether there is correlation between the signal intensity and the amount of KatG.
Similar experiments can be used to determine whether cytochrome oxidase can
oxidize HPF. These high-valence iron centers may accumulate inside the cell
when metabolism is blocked, a situation occurring in antibiotic-treated cells.
These results might help to explain why the antibiotic treated cells show higher
HPF fluorescent signals. Because of its convenience, HPF is also widely
employed to detect oxidative stress in other scenarios. Therefore, it is important
to find out what this probe really reacts with inside the cell. Based on the results,
we might be able to find a condition under which the probe works more
specifically and provides valid results, or we might have to search for a new way
to detect ROS.

138
4.3 References
1. Anjem, A. and J. A. Imlay. 2012. Mononuclear iron enzymes are primary targets of hydrogen peroxide stress. J. Biol. Chem. 287:15544-15556.
2. Anjem, A., S. Varghese, and J. A. Imlay. 2009. Manganese import is a key element of the OxyR response to hydrogen peroxide in Escherichia coli. Mol. Microbiol. 72:844-858.
3. Cotruvo, J. A. and J. Stubbe. 2011. Class I ribonucleotide reductases: metallocofactor assembly and repair in vitro and in vivo. Annu. Rev. Biochem. 80:733-767.
4. Cotruvo, J. A., Jr. and J. Stubbe. 2012. Metallation and mismetallation of iron and manganese proteins in vitro and in vivo: the class I ribonucleotide reductases as a case study. Metallomics. 4:1020-1036.
5. Davies, B. W., M. A. Kohanski, L. A. Simmons, J. A. Winkler, J. J. Collins, and G. C. Walker. 2009. Hydroxyurea induces hydroxyl radical-mediated cell death in Escherichia coli. Mol. Cell. 36:845-860.
6. Dwyer, D. J., M. A. Kohanski, B. Hayete, and J. J. Collins. 2007. Gyrase inhibitors induce an oxidative damage cellular death pathway in Escherichia coli. Mol. Syst. Biol. 3:91.
7. Finn, R. D., J. Tate, J. Mistry, P. C. Coggill, S. J. Sammut, H. R. Hotz, G. Ceric, K. Forslund, S. R. Eddy, E. L. Sonnhammer, and A. Bateman. 2008. The Pfam protein families database. Nucleic Acids Res. 36:D281-D288.
8. Foti, J. J., B. Devadoss, J. A. Winkler, J. J. Collins, and G. C. Walker. 2012. Oxidation of the guanine nucleotide pool underlies cell death by bactericidal antibiotics. Science. 336:315-319.
9. Grant, R. A., D. J. Filman, S. E. Finkel, R. Kolter, and J. M. Hogle. 1998. The crystal structure of Dps, a ferritin homolog that binds and protects DNA. Nat. Struct. Biol. 5:294-303.
10. Grant, S. S., B. B. Kaufmann, N. S. Chand, N. Haseley, and D. T. Hung. 2012. Eradication of bacterial persisters with antibiotic-generated hydroxyl radicals. Proc. Natl. Acad. Sci. U. S. A. 109:12147-12152.
11. Hersleth, H. P., U. Ryde, P. Rydberg, C. H. Gorbitz, and K. K. Andersson. 2006. Structures of the high-valent metal-ion haem-oxygen intermediates in peroxidases, oxygenases and catalases. J. Inorg. Biochem. 100:460-476.
12. Kohanski, M. A., D. J. Dwyer, B. Hayete, C. A. Lawrence, and J. J. Collins. 2007. A common mechanism of cellular death induced by bactericidal antibiotics. Cell. 130:797-810.

139
13. Kohanski, M. A., D. J. Dwyer, J. Wierzbowski, G. Cottarel, and J. J. Collins. 2008. Mistranslation of membrane proteins and two-component system activation trigger antibiotic-mediated cell death. Cell. 135:679-690.
14. Martin, J. E. and J. A. Imlay. 2011. The alternative aerobic ribonucleotide reductase of Escherichia coli, NrdEF, is a manganese-dependent enzyme that enables cell replication during periods of iron starvation. Mol. Microbiol. 80:319-334.
15. Nguyen, D., A. Joshi-Datar, F. Lepine, E. Bauerle, O. Olakanmi, K. Beer, G. McKay, R. Siehnel, J. Schafhauser, Y. Wang, B. E. Britigan, and P. K. Singh. 2011. Active starvation responses mediate antibiotic tolerance in biofilms and nutrient-limited bacteria. Science. 334:982-986.
16. Park, S., X. You, and J. A. Imlay. 2005. Substantial DNA damage from submicromolar intracellular hydrogen peroxide detected in Hpx- mutants of Escherichia coli. Proc. Natl. Acad. Sci. U. S. A. 102:9317-9322.
17. Shatalin, K., E. Shatalina, A. Mironov, and E. Nudler. 2011. H2S: a universal defense against antibiotics in bacteria. Science. 334:986-990.
18. Sobota, J. M. and J. A. Imlay. 2011. Iron enzyme ribulose-5-phosphate 3-epimerase in Escherichia coli is rapidly damaged by hydrogen peroxide but can be protected by manganese. Proc. Natl. Acad. Sci. U. S. A. 108:5402-5407.
19. Stubbe, J. and J. A. Cotruvo, Jr. 2011. Control of metallation and active cofactor assembly in the class Ia and Ib ribonucleotide reductases: diiron or dimanganese? Curr. Opin. Chem. Biol. 15:284-290.
20. Vance, C. K. and A. F. Miller. 1998. Spectroscopic comparisons of the pH dependencies of Fe-substituted (Mn)superoxide dismutase and Fe-superoxide dismutase. Biochemistry. 37:5518-5527.
21. Varghese, S., A. Wu, S. Park, K. R. Imlay, and J. A. Imlay. 2007. Submicromolar hydrogen peroxide disrupts the ability of Fur protein to control free-iron levels in Escherichia coli. Mol. Microbiol. 64:822-830.
22. Whittaker, M. M. and J. W. Whittaker. 1997. Mutagenesis of a proton linkage pathway in Escherichia coli manganese superoxide dismutase. Biochemistry. 36:8923-8931.
23. Yost, F. J., Jr. and I. Fridovich. 1973. An iron-containing superoxide dismutase from Escherichia coli. J. Biol. Chem. 248:4905-4908.
24. Zheng, M., X. Wang, L. J. Templeton, D. R. Smulski, R. A. LaRossa, and G. Storz. 2001. DNA microarray-mediated transcriptional profiling of the Escherichia coli response to hydrogen peroxide. J. Bacteriol. 183:4562-4570.

140
APPENDIX A: DELETION OF OXYS DOES NOT GENERATE A
PHENOTYPE IN CATALASE/PEROXIDASE-DEFICIENT MUTANTS
During H2O2 stress, OxyR induces a 109 nucleotide, non-translated small RNA
oxyS (1). This small RNA is located 95 base pairs upstream of the oxyR gene,
and is divergently transcribed. In H2O2 stressed cells, oxyS is induced within 1
min; the number of its transcripts can reach to ~4,500 copies per cell; the oxyS
RNA is quite stable and it has a half-life of 12-30 min (1). The oxyS RNA
activates or represses the expression of about 40 genes, including the
transcriptional regulator, FhlA, and an alternative sigma factor, RpoS (1). FhlA is
a formate hydrogen lyase activator that controls genes required for formate
metabolism. The oxyS RNA directly binds to FhlA mRNA, interfering with
ribosome binding, reducing the translational level of FhlA (2,3). In the case of
RpoS, oxyS works with the RNA-binding protein Hfq, and negatively regulates
the translation of RpoS (7). A subset of the oxyS regulated genes are RpoS
dependent (i.e. dps), while the others are RpoS independent (1). The regulation
of FhlA and RpoS by oxyS suggests that oxyS might play a role in
communication between the H2O2-stress response and other regulatory networks.
Previous studies reported that oxyS protects cells against spontaneous
mutagenesis induced by alkylating chemicals (i.e. MNNG and ethyl
methanesulfonate) or H2O2. However, in these experiments, millimolar
concentrations of H2O2 were used (1). In order to study the function of oxyS
under physiological H2O2 stress, a gene deletion of oxyS was constructed in
141
catalase/peroxidase-deficient (Hpx-) mutants, and the resulting Hpx- oxyS strain
was screened for growth defects. However, Hpx- oxyS mutants exhibited similar
growth rates as compared to its Hpx- parent strain during H2O2 stress in both LB
and glucose defined medium (Figure A.1). We conclude that oxyS is not
important for H2O2-stress under the condition we tested.
A.1 Material and Methods
A.1.1 Strain construction
The strains used in this study are listed in Table A.1. Deletions were constructed
by the Red recombination deletion method (4) and were transferred to other
strains by P1 transduction (5). The antibiotic resistant cassettes were
subsequently removed by FLP-mediated excision (4).
A.1.2 Bacterial growth
Complex growth media was LB (10 g tryptone, 5 g yeast extract, and 10 g NaCl
per liter). Defined glucose/amino acids media contained minimal A salts (5), 0.2%
glucose, 0.02% MgSO47H2O, and 5 g/ml thiamine. When indicated, 0.2%
casamino acids and 0.5 mM tryptophan, or 0.5 mM of aromatic amino acids
(histidine, phenylalanine and tyrosine) were added. Experimental protocols were
designed to ensure that measurements were performed upon exponentially
growing cells. For growth studies, anaerobic overnight cultures were diluted into
anaerobic media and grown for 4 to 5 generations to early log phase (OD600nm of
0.15 to 0.20). The cultures were then diluted into aerobic medium of the same
composition to an OD600nm of 0.005. All cultures were grown at 37 C. Aerobic

142
defined medium was prepared immediately prior to use. Anaerobic medium was
transferred immediately after autoclaving to an anaerobic chamber (Coy
Laboratory Products), where it was stored under an atmosphere of 5% CO2/10%
H2/85% N2 for at least one day prior to use.

143
A.2 Table
Table A.1 Strains used in this study.
Name Genotype/characteristics Source/Ref.
AL107 As LC106 plus oxyS1::cat This study
AL110 As MG1655 plus oxyS1::cat This study
BW25113 lacIq rrnBT14 lacZWJ16 hsdR514 araBADAH33 rhaBADLD78 (4)
LC106 As MG1655 plus (ahpC-ahpF’) kan:: ahpF (katG17::Tn10)1
(katE12::Tn10)1
(6)
MG1655 Wild type Lab stock

144
A.3 Figure
Figure A.1 Deletion of small RNA oxyS did not introduce a growth defect in
H2O2 stressed cells. Anaerobic exponential-phase cultures were diluted into the
same aerobic medium at time zero. Hpx- oxyR mutants did not have growth
defect in LB (A), or glucose defined medium with all amino acid supplement (B)
or just aromatic amino acid supplement (C). Strains used: WT (MG1655), AL110
(oxyS), Hpx- (LC106), Hpx- oxyS (AL107).

145
A.4 References
1. Altuvia, S., D. Weinstein-Fischer, A. Zhang, L. Postow, and G. Storz. 1997. A small, stable RNA induced by oxidative stress: role as a pleiotropic regulator and antimutator. Cell. 90:43-53.
2. Altuvia, S., A. Zhang, L. Argaman, A. Tiwari, and G. Storz. 1998. The Escherichia coli OxyS regulatory RNA represses fhlA translation by blocking ribosome binding. EMBO J. 17:6069-6075.
3. Argaman, L. and S. Altuvia. 2000. fhlA repression by OxyS RNA: kissing complex formation at two sites results in a stable antisense-target RNA complex. J. Mol. Biol. 300:1101-1112.
4. Datsenko, K. A. and B. L. Wanner. 2000. One-step inactivation of chromosomal genes in Escherichia coli K-12 using PCR products. Proc. Natl. Acad. Sci. U. S. A. 97:6640-6645.
5. Miller, J. H. 1972. Experiments in molecular genetics. Cold Spring Harbor Laboratory, Cold Spring Harbor, NY.
6. Seaver, L. C. and J. A. Imlay. 2004. Are respiratory enzymes the primary sources of intracellular hydrogen peroxide? J. Biol. Chem. 279:48742-48750.
7. Zhang, A., S. Altuvia, A. Tiwari, L. Argaman, R. Hengge-Aronis, and G. Storz. 1998. The OxyS regulatory RNA represses rpoS translation and binds the Hfq (HF-I) protein. EMBO J. 17:6061-6068.