3 HYPOTHESES AND OBJECTIVES - University of Pretoria
101
39 3 HYPOTHESES AND OBJECTIVES 3.1 HYPOTHESES 1. Biscuits made of sorghum and bread wheat composited with Defatted Soy Flour (DSF) will have significantly improved nutritional value in terms of protein, lysine and indispensable amino acids and mineral content compared to unfortified biscuits. Defatted soy flour has a better nutrient composition with respect to protein, lysine and indispensable amino acids and minerals than sorghum and bread wheat (USDA 2008). 2. Fortified sorghum and bread wheat biscuits will have significantly higher levels of bioavailable protein and lysine compared to unfortified biscuits. Protein and lysine that are deficient in sorghum and bread wheat and are adversely affected when sorghum is processed (reviewed by Taylor and Belton 2002), will be increased by addition of DSF to the biscuits. 3. Soy fortified sorghum biscuits will have higher true protein digestibility and improve growth rate in rats compared to unfortified biscuits. The added soy proteins have an amino acid profile that is superior to sorghum protein amino acid profile and higher lysine content (USDA 2008). Complementing sorghum with legumes improves growth and apparent protein digestibility in rats (Nnam 2001) and increasing lysine content in rat diet increases growth (Ashley and Anderson 1975). 4. Sorghum flour can be used to make biscuits that are similar in texture and sensory properties to wheat-based biscuits. Wheat flour is the principal component of virtually all biscuits because when mixed with water it forms a unique visco-elastic dough (Kent and Evers 1994). However, good quality biscuits can be prepared using non-wheat flours because biscuits do not require high gluten flours. 5. Defatted soy flour fortified sorghum and bread wheat biscuits will be liked by school children over an extended period of time. Biscuits are popular snack foods among children (Sudha et al 2007) because they are sweet and sorghum and bread wheat are staples that African children are familiar with.
-
Upload
khangminh22 -
Category
Documents
-
view
1 -
download
0
Transcript of 3 HYPOTHESES AND OBJECTIVES - University of Pretoria

39
3 HYPOTHESES AND OBJECTIVES
3.1 HYPOTHESES
1. Biscuits made of sorghum and bread wheat composited with Defatted Soy Flour (DSF) will
have significantly improved nutritional value in terms of protein, lysine and indispensable
amino acids and mineral content compared to unfortified biscuits. Defatted soy flour has a
better nutrient composition with respect to protein, lysine and indispensable amino acids and
minerals than sorghum and bread wheat (USDA 2008).
2. Fortified sorghum and bread wheat biscuits will have significantly higher levels of
bioavailable protein and lysine compared to unfortified biscuits. Protein and lysine that are
deficient in sorghum and bread wheat and are adversely affected when sorghum is processed
(reviewed by Taylor and Belton 2002), will be increased by addition of DSF to the biscuits.
3. Soy fortified sorghum biscuits will have higher true protein digestibility and improve growth
rate in rats compared to unfortified biscuits. The added soy proteins have an amino acid
profile that is superior to sorghum protein amino acid profile and higher lysine content
(USDA 2008). Complementing sorghum with legumes improves growth and apparent protein
digestibility in rats (Nnam 2001) and increasing lysine content in rat diet increases growth
(Ashley and Anderson 1975).
4. Sorghum flour can be used to make biscuits that are similar in texture and sensory properties
to wheat-based biscuits. Wheat flour is the principal component of virtually all biscuits
because when mixed with water it forms a unique visco-elastic dough (Kent and Evers 1994).
However, good quality biscuits can be prepared using non-wheat flours because biscuits do
not require high gluten flours.
5. Defatted soy flour fortified sorghum and bread wheat biscuits will be liked by school children
over an extended period of time. Biscuits are popular snack foods among children (Sudha et
al 2007) because they are sweet and sorghum and bread wheat are staples that African
children are familiar with.

40
3.2 OBJECTIVES
1. To formulate, develop and standardise sorghum-soy and bread wheat-soy biscuit
formulae that include fortified levels of protein to meet half the Recommended
Dietary Allowance for 3 to 10 year old children according to Institute of Medicine,
Food and Nutrition Board (2005) and to double the lysine content.
2. To determine the effect of fortifying sorghum and bread wheat with defatted soy flour
on proximate composition, protein quality with reference to amino acid (lysine)
content and lysine availability and in vitro protein digestibility of biscuits.
3. To determine the effect of fortifying sorghum and bread wheat with soy on the
physical and sensory characteristics of biscuits.
4. To determine the effect of compositing sorghum and bread wheat on school children’s
overall liking and long term acceptability of biscuits.
5. To determine the protein nutritional quality and effect on growth of sorghum-soy
composite biscuits compared to unfortified sorghum biscuits using a rat bioassay.

41
4 RESEARCH
4.1 Effect of fortifying sorghum and bread wheat with soy protein on the nutritional
properties of biscuits

42
ABSTRACT
Protein Energy Malnutrition (PEM) is the most important nutritional problem among children
in developing countries. Biscuits are a useful supplementary food as they are ready-to-eat,
nutrient dense and have high acceptability. Biscuits were formulated and developed by
compositing sorghum and bread wheat flours with defatted soya flour at different ratios. To
establish the nutritional characteristics of biscuits, proximate composition, lysine and reactive
lysine contents and in vitro protein digestibility were determined. Compared to the 100%
cereal biscuits, sorghum-soy and bread wheat-soy 1:1 ratio composite biscuits had at least
double the protein, mineral and crude fibre contents. The lysine contents of the biscuits
increased by 500-700%. For the sorghum-soy biscuits in vitro protein digestibility increased
by 170% and Protein Digestibility Corrected Amino Acid Score was 8 times higher. Two
such biscuits of 28 g each could provide 50% of the recommended daily protein intake for 3
to 10 year olds. Hence, sorghum- and bread wheat-soy composite biscuits have considerable
potential as protein-rich supplementary foods to alleviate PEM in children.

43
4.1.1 INTRODUCTION
Protein Energy Malnutrition (PEM) is the most important nutritional problem facing children
in developing countries (Muller and Krawinkel 2005). Affected children have higher
susceptibility to infectious diseases, impaired physical and cognitive development and
increased mortality rates (Stipanuk 2006). Cereals such as sorghum, wheat and maize, which
are principal sources of protein and energy in their diet, are the most suitable vehicles for
delivering protein to prevent PEM (Bulusu et al 2007).
Sorghum [Sorghum bicolor (L) Moench], an indigenous African cereal, is unique because it
is a drought-tolerant staple food for over 500 million people living in arid and semi arid
tropics where maize cannot grow (Doggett 1988, ICRISAT 2009). Wheat, mainly hard, bread
type wheat is also another important cereal staple in the semi arid tropics of Africa, being
cultivated in some 33 countries (Taylor 2004). Like other cereals, sorghum and wheat have
poor protein quality because they are limiting in the indispensable amino acid lysine with
only approximately 2 g per 100 g protein (Taylor and Schussler 1986, Shewry 2009). Lysine
is further rendered unavailable to the body through thermal processing and storage following
the Maillard and other reactions because of its highly reactive ε-amino group (Erbersdobler
and Faist 2001). Additionally, the problem is compounded by the reduction in sorghum
protein digestibility on wet cooking (Duodu et al 2002), which is apparently unique to
sorghum. In a nutritional study MacLean et al (1981) demonstrated that nitrogen from a
sorghum diet did not support growth in 6 to 30 month old children because of poor absorption
and retention.
The protein quality of sorghum and bread wheat can be upgraded to meet human
physiological requirements by compositing with legume flours using the principle of
complementation (Young and Pellet 1994). Formulation of foods from low-lysine staples
fortified with legumes has been proposed as a most practical and sustainable approach to
improving the protein nutritional value of foods for young children in developing countries
(WHO/UNICEF 1998, FAO/WHO 1994). Soy bean (Glycine max L. Merr) typically contains
30 to 45% protein (Hammond et al 2003) and is a good source of all indespensable amino
acids (Karr-Lilienthal, Bauer, Zinn, Frazier, Parsons and Fahey 2006). Vasconcelos et al
(2001) established that the indispensable amino acid profile of soy beans was comparable to

44
the FAO/WHO/UNU (1985) reference pattern for children of 2 to 5 years and 10 to 12 years
and had an average lysine content of 7 g/100 g. Bodwell and Marable (1981) found 75 to
97% and 84 to 95% true nitrogen digestibilities of soy protein in adults and children,
respectively. The high lysine content and high digestibility of soy protein makes it a good
complement to sorghum and wheat.
Biscuits are the largest category of snack foods among baked products worldwide (Ait-
Ameur et al 2008). They offer a valuable vehicle of supplementation with protein because of
their popularity, relatively low cost, varied taste, ease of availability, high nutrient density
and long shelf-life (Sudha et al 2007). Soft wheat flours are normally used for biscuit
preparation, but they can be made from composites of wheat and other flours and non-wheat
flours (Dendy 1993). Studies on fortification of wheat biscuits with soy protein have been
conducted. For example, Mohsen, Fadel, Bekhit, Edris and Ahmed (2009), achieved a 12 to
20% increase in protein content by substituting wheat with 5 to 20% soy protein isolate.
Similarly, Singh, Singh and Chauhan (2000) and McWatters (1978) doubled protein content
in wheat biscuits by substituting 20 and 30%, respectively, wheat flour with defatted soy
flour (DSF). There are also reports of biscuits made using sorghum flour (Badi and Hoseney
1976) or pre-gelatinised sorghum flour dough (Dendy 1993). Findings of these two studies
showed that biscuits were gritty and fragile. However, grittiness could be reduced by an
increase of dough pH (Badi and Hoseney 1976) and fragility reduced by addition of wheat
flour (El Khalifa and El Tinay 2002) or reduced flour particle size (Leon-Chapa 1999).
The production of sorghum-legume composite biscuits has been reported by Hikeezi (1994)
who supplemented sorghum with peanut or sunflower flours raising the protein content to
16%. Mridula, Gupta and Manikantan (2007) showed that biscuits of acceptable quality can
be made using wheat-sorghum composites with 10 to 50% sorghum and 5% DSF. However,
soy complementation of sorghum only biscuits has not been reported. Therefore, the
objective of this study was to formulate, develop, and determine the nutritive value of biscuits
made from sorghum and bread wheat, cereals widely grown in the semi-arid tropics of Africa,
composited with DSF for use as a protein-rich supplementary food for PEM vulnerable
children.

45
4.1.2 MATERIALS AND METHODS
4.1.2.1 Biscuit ingredients
All ingredients used were commercially available and purchased in Pretoria, South Africa.
These were: Sorghum “Fine Mabele Meal” (roughly decorticated red, non tannin sorghum)
and white bread wheat flour “Golden Cloud” (Tiger Consumer Brands Ltd, Bryanston, South
Africa), pure white sugar “Selati” (TSB Sugar, Malelane, South Africa), defatted soy flour
“Toasted Flour” (Nedan Oil Mills Ltd, Potgietersrus, South Africa), sunflower oil “Sunfoil”
(Willowton Oil, Pietermaritzburg, South Africa), “Bokomo-Moirs” baking powder and
vanilla essence both from (Pioneer Foods Ltd, Cape Town, South Africa).
4.1.2.2 Biscuit formulation
Formulation of the biscuit was based on providing at least half the daily protein requirement
for school children aged between 3 and 10 years. The scoring pattern for 3 to 10 year olds is
recommended when judging protein quality for school children and adolescents (WHO
2007). The Acceptable Macronutrient Distribution Range (AMDR) for protein-energy for
prevention of chronic diseases such as PEM for this age group is 10 to 30 g protein per day
(Institute of Medicine, Food and Nutrition Board 2005). The study aimed at providing at least
half, 14 g of protein per day with 7 g provided in one 28 g weight biscuit, and to double the
lysine content in sorghum.
The 100% sorghum, 100% bread-wheat and 100% soy biscuits’ basic formulation comprised
225 g flour, 56 g sugar, 66 g sunflower oil and 13.5 g vanilla essence. Water was dependent
on the treatment and ranged from 10% (100% sorghum biscuits) to 30.7% (100% soy
biscuits) of total weight of ingredients, as was baking powder, 0.25 g in 100% bread wheat
biscuits to 1.5 g in the sorghum biscuits. The amounts added were based on results of
preceding experiments which revealed that substitution with DSF made doughs dry crumbly
and difficult to manage requiring more water. For the bread wheat biscuit dough,
incorporating the same amount of baking powder as sorghum made the dough pieces rise
excessively on baking due to the strength of the flour. In the various formulations, 28.6, 50,

46
Table 4.1.1 Formulation of the sorghum, bread wheat, soy and composite biscuit doughs
Ingredients
Sorghum: Soy Soy Wheat: Soy
100:0 71.4:28.6 50:50 28.6:71.4 100:0 100:0 71.4:28.6 50:50 28.6:71.4
Defatted Soy flour (g) 0 64 (14.9) 112.5(24.9) 161(33.1) 225(43.1) 0 64(14.2) 112.5(24.4) 161(33.2)
Sorghum flour (g) 225(55.9) 161(37.2) 112.5(24.9) 64(13.0) 0 0 0 0 0
Wheat flour (g) 0 0 0 0 0 225(53.4) 161(35.7) 112.5(24.4) 64(13.0)
Sugar (g) 56(13.9) 56 (13.0) 56(12.4) 56(11.5) 56(10.7) 56(13.3) 56(12.4) 56(12.1) 56(11.5)
Sunflower oil (g) 66(16.4) 66 (15.3) 66(14.6) 66(13.6) 66(12.6) 66(15.7) 66(14.6) 66(14.3) 66(13.6)
Baking powder (g) 1.5(0.4) 1.5(0.3) 1.5(0.3) 1.5(0.3) 1.5(0.3) 0.25(0.1) 0.5(0.1) 1(0.2) 1(0.2)
Vanilla essence (g) 13.5(3.4) 13.5 (3.1) 13.5(3.0) 13.5(2.8) 13.5(2.6) 13.5(3.2) 13.5(3.0) 13.5(3.0) 13.5(2.8)
Water (g) 40,80*(10.0) 70 (16.2) 90,180*(19.9) 125(25.7) 160(30.7) 60(14.3) 90(20.0) 100(21.6) 125(25.7)
Total dough weight (g) 402(100) 432(100) 452(100) 487(100) 522(100) 421(100) 451(100) 462(100) 487(100)
Figures in parentheses are percentages *Maximum particle size for sorghum flour reduced to 500 µm for sorghum: soy biscuits ratios 100:0 and 50:50 for consumer study and water content of
dough doubled to make it workable.

47
71.4 and 100% DSF replaced sorghum or bread wheat flours on a weight by weight basis
(Table 4.1.1). The proportions were based on a basic formulation in which a maximum of 161
g DSF (50 g protein/ 100 g) and 64 g cereal (12 g protein/100 g) in a 225 g composite could
produce 12 biscuits each containing approximately 7 g protein.
4.1.2.3 Biscuit preparation
The dry ingredients: flour, sugar and baking powder, were sieved into a mixing bowl and
mixed by hand for 3 minutes. Oil and water were added gradually and the mixture kneaded
for 2 minutes at medium speed in an electric mixer, to a firm dough. The dough was
manually sheeted on a steel tray to a height of 5 mm using a wooden rolling pin and cut into
circular shapes using a 6.3 cm diameter biscuit cutter. Aluminium foil was used to prevent
dough sticking to the rolling pin. The cut dough pieces were transferred onto a baking sheet
lined with aluminium foil. The biscuits were baked in a preheated air circulation oven at
180oC ± 2
oC for 20 ± 5 minutes and cooled for 30 minutes at ambient temperature. Biscuits
were vacuum packed in polyethylene bags and stored in a cold room at 10oC. Three batches
of 10 biscuits each were prepared for each experimental treatment. For chemical analyses,
biscuits were ground using a mortar and pestle to a particle size of ≤ 1 mm before storage.
The procedure for biscuit preparation is illustrated in Figure 4.1.1.

48
Figure 4.1.1 Flow diagram for preparation of soy fortified sorghum or bread wheat biscuits.
Sorghum or wheat flour or their
composites with defatted soy flour.
Mix all dry ingredients, 225 g flour,
56 g sugar and baking powder.
Transfer the cut dough pieces onto a
baking sheet lined with aluminium
foil.
Cover crumbly dough with aluminium
foil and sheet on a 5 mm height steel
tray. Cut into circular shapes with a
6.3 cm diameter biscuit cutter.
Gradually add 66 g sunflower oil,
13.5 g vanilla essence and water. Mix
at medium speed (2) for 3 minutes to
firm dough.
Sieve into mixing bowl and mix for 2
minutes in electric mixer.
Bake in a preheated oven at 180oC
for 20 ± 5 minutes. Remove from
oven and allow to cool on baking
tray for 30 minutes.

49
4.1.2.4 Proximate analyses
Moisture
Moisture content of biscuits and raw flour was determined by the one stage air oven
procedure (AACC International 2000) Method 44-15A. Samples of 3 g weight were dried at
130oC for 3 hours and moisture content was obtained by calculating loss in moisture as a
percentage of the original wet weight of the sample.
Ash
Ash mineral content was determined by the AACC International (2000) Method 08-01.
Samples were heated at 550oC for 5 hours or to constant weight. Ash content was obtained by
calculating the weight of the residue as a percentage of the original sample weight.
Oil
Oil content was determined by the soxhlet extraction method (AACC International 2000)
Method 30-25. Samples of 3 g were weighed into an extraction thimble and fat extracted for
1 hour using petroleum ether (40-60oC). The petroleum ether extract was dried in an oven at
103oC for 30 minutes. Total fat content was obtained by calculating weight of extract as a
percentage of the original sample weight.
Crude fibre
Crude fibre content was determined by the AACC International (2000) Method 32-10 using a
Fibertec apparatus (Tecator, Hoganas, Sweden). Defatted samples of 1 g weight were
digested using 0.127 M sulphuric acid and 0.313M sodium hydroxide solutions. The residue
was dried overnight in an oven at 105oC and ashed at 550
oC for 5 hours. Crude fibre content
was obtained by calculating weight loss on ignition of dried residue as a percentage of the
original sample weight.

50
Carbohydrate
Percentage of carbohydrate was calculated by difference by summing up the weight in grams
of determined values of protein, fat, ash, crude fibre and moisture from the total weight of the
food (FAO 2003).
Energy
Energy content was calculated using Atwater calorie conversion factors, based on
assumptions that each gram of carbohydrate, fat and protein will yield 17 kJ (4.0 kcal), 37 kJ
9.0 kcal and 17 kJ (4.0 kcal), respectively (FAO 2003). The values were expressed in kJ.
Protein content
Protein content (N x 6.25) was determined by Dumas combustion method AACC
International (2000) Method 46-30.
4.1.2.5 Protein quality analyses
Amino acid content
The content of lysine and other amino acids in the samples was determined using the Pico-
Tag method (Bidlingmeyer, Cohen and Tarvin 1984). Protein and peptides are hydrolyzed
with 6 M hydrochloric acid, pre-column derivatised and analysed using reverse phase HPLC.
Reactive Lysine
Reactive lysine content was determined using a rapid dye-binding lysine (DBL) method of
Kim, Kim, Ma and Chung (2007) using Crocein Orange G dye (70% dye content) (Fluka
grade 27965: Sigma-Aldrich, Buchs, Switzerland). The mass of sample weights for
treatments A and B were calculated depending on their protein content using the following
equation of Anyango (2009):

51
Treatment A: y= -0.026x + 0.784
Treatment B: y= -0.026x + 0.982
Where y= mass of sample weighed (g)
x= protein content (%) (wb)
Accurate amounts of the calculated mass for treatments A and B were weighed and reacted
with 5 ml 16% sodium acetate for 15 minutes. For the B samples, 0.2 ml propionic anhydride
was added to block the reactive ε-amino group of lysine. The 12 ml dye solution of Crocein
Orange G (70% dye content) used for dye-binding, was added to the samples which were
shaken for two hours, diluted and the absorbance measured at 482 nm. Reactive lysine (dye
bound lysine) was obtained by calculating the difference between (treatment B) the sample
treated with propionic anhydride to give histidine and arginine by blocking lysine and
(treatment A) the untreated sample with histidine, arginine and lysine.
In vitro protein digestibility
In vitro protein digestibility was determined by a pepsin digestion method based on that of
Hamaker et al (1986). Accurately weighed samples (200 mg) were digested with P7000-
100G porcine pepsin, activity 863 units/mg protein (Sigma-Aldrich, St. Louis, MO) for 2 h at
37oC. The supernatant was pipetted off using a Pasteur pipette, the residue washed and the
clear supernatant pipetted off again. Residues were dried overnight in an oven at 100oC.
Protein content in the dried residue was determined by the Dumas combustion method
(AACC International 2000) method 46-30. Digestibility was calculated by obtaining the
difference between total protein and residual protein and expressed as a percentage of the
total protein.
4.1.2.6 Statistical analyses
Three independent batches of biscuits were made and analyses were repeated three times. The
data generated included: (9 biscuits x 3 batches x 3 replicates) + (3 flours x 3 replicates x 3
repetitions) = 108 samples analyzed for each parameter. Data were analysed using one way
analysis of variance (ANOVA) and means compared using Fisher’s least significant
difference (LSD) test. The statistical program used was Statgraphics Centurion XV (Stat
Point, Herndon, VA).
52
4.1.3 RESULTS AND DISCUSSION
Ingredients that are locally available and sustainable were selected for biscuit preparation.
Red non-tannin sorghum, bread wheat and defatted soy flours and sunflower oil are readily
available on the South African market. DFS is one of the legume flours recommended by the
Codex Alimentarius Commission (FAO/WHO 1994) for use as a source of protein in foods
for young children. Complementing cereal and DSF, high temperature and low moisture
baking conditions, enhance the Maillard and other chemical reactions that affect protein
quality (Charissou et al 2007, Friedman 1996). It was therefore necessary to assess the
protein nutritional quality of the final baked products (biscuits).
4.1.3.1 Proximate composition
The proximate composition of biscuits and flours is shown in Table 4.2.2. Sorghum biscuits
had half the moisture content of wheat biscuits that had a range of 7.15 to 5.98%. The
hydrophobic nature of sorghum kafirins compared to hydrophilic wheat proteins (Duodu et al
2003) may explain this finding. Kafirins probably expelled water as the temperature
increased while wheat prolamins absorbed water (Belton et al 2006). The high moisture
content was probably due to damaged starch, high protein and pentosans in bread wheat
which absorb once, twice and ten times, their weights in water, respectively (Kent and Evers
1994).
Fortification with DSF ranging from 28.6 to 71.4% relative to cereal flour increased ash
(mineral) content of sorghum-and bread wheat-based biscuits by 50 to 136% and 200 to
520%, respectively compared to the 100% cereal biscuits. Similar results were reported by
Shrestha and Noomhorm (2002) when they compared total ash and acid insoluble ash
contents in wheat-soy composite flour biscuits and plain wheat biscuits. The increase in ash
content through complementation with DSF is because soy flour has a higher mineral content
than the two cereals (USDA 2008). Defatted soy flour contains high potassium, moderate
levels of calcium, phosphorus and magnesium and traces of selenium, manganese, copper,
iron, sodium and zinc.

53
Table 4.1.2 The effect of compositing sorghum and bread wheat with defatted soy flour on proximate composition (g/100 g)
Flour / Biscuits Moisture
Protein
(N x 6.25)
Fat
Ash
Crude fibre
Carbohydrate1
Energy2
(kJ/g 100 g)
Flour
Sorghum flour 11.8g±0.3 11.4
c±0.1 3.1
c±0.6 1.4
c±0.0 2.0
c±0.0 70.3
j±0.2 1504
b
Wheat flour 11.3g±0.2 13.4
d±0.0 1.4
b±0.1 0.7
b±0.0 0.2
a±0.0 73.2
k±0.1 1520
c
Soy flour 6.2de
±0.4 50.1l±0.1 0.5
a±0.0 6.2
k±0.1 7.5
j±0.1 29.5
b±0.1 1372
a
Sorghum /Soy biscuit
100:0 3.2a±0.4 9.2
a±0.1 21.0
e±0.3 1.4
c±0.0 1.7
b±0.4 63.5
i±0.4 2013
j
71.4: 28.6 4.9bc
±0.2 17.9e±0.4 20.5
e±0.1 2.1
e±0.1 2.8
d±0.1 51.8
g±0.4 1943
h
50:50 3.8ab
±0.6 24.7g±0.4 19.7
d±0.6 2.8
g±0.1 3.7
f±0.2 45.6
e±0.3 1924
gh
28.6:71.4 4.9bc
±0.2 30.7i±0.3 19.7
d±0.2 3.3
i±0.0 4.7
h±0.2 36.6
c±0.2 1873
ef
Wheat/ Soy biscuits
100:0 7.2ef±0.7 10.8
b±0.2 20.7
e±0.2 0.5
a±0.0 0.2
a ±0.0 60.6
h±0.4 1980
i
71.4: 28.6 7.4f±1.5 19.5
f±0.2 19.8
d±0.9 1.5
d±0.0 2.0
c±0.0 49.8
f±0.8 1910
g
50:50 6.4def
±0.4 25.8h±0.4 19.3
d±0.5 2.4
f±0.0 3.3
e±0.1 42.8
d±0.5 1880
f
28.6:71.4 6.0cd
±0.4 31.9j±0.2 19.4
d±0.1 3.1
h±0.0 4.4
g±0.2 35.2
b±0.3 1859
de
Soy biscuit 100% 4.6b±1.2 39.9
k±0.3 19.3
d±0.5 4.2
j±0.1 5.5
i±0.0 26.5
a±0.4 1842
d
Values are means ±standard deviations. Values in a column followed by different letter superscripts are significantly different at P≤0.05 as
assessed by Fisher’s least significant difference. 1Calculated as total carbohydrate by difference]. 100-(weight in grams [moisture + fat + protein + ash + fibre] in 100 g of food.
2Calculated using the following factors: protein 17 kJ/g, fat 37 kJ/g, and carbohydrates 17 kJ/g.

54
The fat content in sorghum and bread wheat biscuits increased 7 and 15 times, respectively
compared to their flours. The increase is due to inclusion of 20% sunflower oil to the biscuit
formulae. Consequently, there were no significant differences in fat content among the bread
wheat biscuits. However, there was a slight reduction, of 7% fat content in sorghum biscuits
as soy increased to 50 and 71.4% because the fat content was 6 times higher in sorghum than
the DSF. Fat is an important ingredient used to raise energy density in formulation of
Fortified Blended Foods for vulnerable populations (Hoppe, Anderson, Jacobsen, Molgaard,
Friis, Sangild and Michaelsen 2008, FAO/WHO1994). Fats that provide most of the energy
in the form of essential fatty acids such as sunflower oil used in this study are recommended
because they promote growth, cognitive development and immune function (Hoppe et al
2008). The oil content in the fortified biscuits of 20 to 21% in sorghum biscuits and 19 to
20% for bread wheat biscuits, was within the FAO/WHO (1994) recommended range of 10 to
25 g oil per 100 g of food for supplementary feeding of young children.
The carbohydrate content decreased substantially by 22 to 73% in both sorghum and bread
wheat biscuits, respectively compared to the 100% cereal biscuits as the level of DSF
increased from 28.6 to 71.4%. This decrease can be explained by the low carbohydrate
content of DFS (30%). Soy bean stores energy as approximately 20% oil and 9 % of
carbohydrate concentration is classified as fibre, while sorghum and wheat store 72 to 75%
energy as carbohydrate (starch) (USDA 2008). Compositing with soy diluted the
carbohydrate content of sorghum and bread wheat biscuits. It also increased their crude fibre
content threefold and twenty two fold, respectively. Some researchers have also reported
similar results when cereals were blended with legumes. For instance, Mohsen et al (2009)
found a decrease in carbohydrate content on addition of isolated soy protein to biscuits.
Kayitesi (2010) also reported reduction of carbohydrate content in sorghum porridge through
addition of marama bean, which is low in carbohydrate content. The FAO/WHO (1994)
Codex Committee recommends that foods for preschool children should contain no more than
5 g dietary fibre and other non-absorbable carbohydrates per 100 g of dry matter. The crude
fibre content of biscuits in this study which ranged from 2.8 to 4.7 g/100 g in sorghum-based
biscuits and 2 to 4.8 g/100 g in bread wheat-based biscuits was probably within the
recommended range. High fibre density has been reported to increase bulk and reduce protein
intake in diets for young children (Hofvander and Underwood 1987).

55
The energy density of biscuits in this study was enhanced by inclusion of fat in the
formulation. The fortified biscuits contained about 1873 to 1943 kJ and 1859 to 1910 kJ for
sorghum and bread wheat, respectively, which meet the recommended minimum value of
1,674 kJ/100 g (FAO/WHO 1994) for supplementary foods for young children. High dietary
energy is important for sparing protein for body building and repairing body tissues avoiding
diversion to provide energy (Stipanuk 2006). The FAO/WHO (1994) Codex Alimentarius
Commission recommended that protein-energy in foods for pre-school children should not be
less than 15%. Hence, two biscuits of 28 g would provide some 14% of the energy
requirements of a 5 to 7 year old child, which are approximately 7500 kJ (FAO/WHO/UNU
1985).
Incorporation of DSF in biscuits substantially increased the protein content of the biscuits.
Replacement of cereal flour with 28.6, 50 and 71.4% DSF increased protein content by 95,
168, and 234%, respectively, in sorghum-based biscuits and 81, 139 and 195%, respectively,
in bread wheat-based biscuits compared to the 100% cereal biscuits. The increase was due to
the high protein content of DSF flour (50 g/100 g flour). Several workers have reported
similar results on substituting cereal with legume flours. Bookwalter, Warner and Anderson
(1977) found increased quantities of protein in flour blends as toasted DSF increased and
sorghum reduced. Substitution of wheat with 30% (McWatters 1978) and 20% (Singh et al
2000) DSF achieved a 100 and a 115% increase in protein content, respectively. Similarly,
Taha, Majdi and Khalil (2006) realised a 36% increase in protein content in wheat biscuits
supplemented with 12% isolated soy protein. Likewise, Awadelkareem et al (2008) reported
that sorghum-soy composite meals had increased protein contents of 18 to 26% after adding
soy concentrate at between 4 to 12% levels.
According to the WHO (2007) Expert Consultation, the protein requirements of children aged
1 to 2 years, 3 to 10 years and 10 to 18 years, are 1.12 g/kg/day, 0.73 g/kg/day and 0.7
g/kg/day. Based on FAO (2004) weight for age values, the daily protein requirements for
these children translates to 12 to 13 g/day for 1 to 2 year olds, 11 to 22 g/day for 3 to 10 year
olds and 24 to 40 g/day for 10 to 18 year olds. The protein content of biscuits fortified with
24.6 to 71.4% DSF in this study was 18 to 31% for sorghum-based biscuits and 20 to 32% for
bread wheat-based biscuits. The biscuits with a 1:1 ratio of sorghum or bread wheat with soy
flour met the target of providing 7 g protein in 28 g biscuit weight. Consumption of 1, 2 and 3

56
biscuits would provide half the protein intake for children aged 1 to 2, 3 to 10, and 10 to 18
years, respectively (IOM 2005). Similarly, Mohsen et al (2009) reported that 100 g of wheat
biscuits supplemented with 20% isolated soy protein would provide half the recommended
daily requirement for protein according to WHO (2007).
4.1.3.2 Lysine and reactive lysine content
Compositing sorghum and bread wheat with DSF increased the lysine contents of biscuits
made from both cereals (Table 4.1.3). The protein lysine content in DSF, which was more
than three times that of sorghum and bread wheat flours, is related to the high levels of the
globulin fraction in soy bean, which is rich in lysine (Marcone and Kakuda 1999).
Consequently, protein lysine content of sorghum and bread wheat biscuits with DSF at levels
of 28.6, 50 and 71.4% increased by 186, 231 and 378% and 126, 152 and 165%, respectively
compared to the 100% cereal biscuits. Studies by a number of workers are in agreement with
the findings from this study. For example, Lindell and Walker (1984) achieved a 27%
increase in lysine content of sorghum and wheat flours used for the preparation of chapattis
by addition of DSF and it represented 77% of the WHO (2007) pattern. The improvement in
lysine content of the biscuits themselves was even more dramatic. At a 1:1 cereal to soy ratio,
there was 500 to 700% increase.
Compositing sorghum and bread wheat with DSF at levels of 28.6 to 71.4% increased
reactive lysine content in protein by 200 to 300% in sorghum biscuits and 4.5 to 9% in bread
wheat biscuits compared to the 100% cereal biscuits (Table 4.1.4). Reactive lysine is the
amount of lysine that can be absorbed in a structural form for potential use in body protein
synthesis (Hendricks, Moughan, Boer and Van der Poel 1994). Similar results were reported
by Bookwalter et al (1977) using 15% DSF to fortify sorghum meal.
It was also observed in this study that generally the increase of reactive lysine content in the
composite biscuits was not proportional to the increase in lysine and protein. This indicates
substantial loss of reactive lysine during baking when DFS flour increased. It is likely that the
Maillard reaction, enhanced by high soy protein, low moisture content and high baking
temperature caused these losses as was also observed by Villamiel (2006). Evidence of
Maillard reaction derivatives in soy-cereal composite products has been reported. Working on

57
Table 4.1.3 The effect of compositing sorghum and bread wheat with defatted soy flour on the lysine content of flours and biscuits (g/100 g
protein) and (g/100 g biscuits and flour)
Biscuit type Flour Sorghum or Wheat: Soy flour (%)
Cereal flour Soy flour 100:0 71.4: 28.6 50:50 28.6:71.4 0:100
Sorghum: Soy 2.98b±0.05
1 8.28
g ±0.39 1.37
a±0.12 3.93
c±0.38 4.54
d±0.38 4.78
d±0.26 5.13
d±0.03
(0.23b±0.01)
(4.15
g±0.20) (0.13
ab±0.01) (0.70
c±0.06)
(1.12
d±0.09) (1.47
e±0.07) (2.05
f±0.01)
Wheat: Soy 2.48b±0.00
2 8.28
f±0.39 1.86
a±0.19 4.20
c±0.17 4.69
d±0.19 4.92
de±0.09 5.13
e±0.03
(0.33b±0.00)
(4.15
g±0.20) (0.20
ab±0.0) (0.82
c±0.03) (1.21
d ±0.03) (1.57
e±0.04) (2.05
f±0.01)
Values are mean±SD. Values followed by different letter superscripts in a row are significantly different at P≤0.05 as assessed by Fisher’s least
significant difference.
Figures in parentheses are lysine content (g/100 g) biscuits or flour.
1Sorghum flour.
2Wheat flour.

58
Table 4.1.4 The effect of compositing sorghum and bread wheat with defatted soy flour on reactive lysine content of flours and biscuits (g/100
g protein)
Biscuit type Flour Sorghum or Wheat: Soy flour (%)
Cereal flour Soy flour 100:0 71.4: 28.6 50:50 28.6:71.4 0:100
Sorghum: Soy 1.46b±0.20
1 3.68
f±0.08 0.70
a±0.40 2.10
c±0.17 2.50
cd±0.44 2.83
de±0.07 3.01
e±0.13
(0.16a±0.02)
(1.85
f±0.04) (0.05
a±0.03) (0.30
b±0.03) (0.47
c±0.09) (0.72
d±0.01) (1.97
e±0.03)
Wheat: Soy 1.89a± 0.17
2 3.68
d ±0.08 2.25
b±0.05 2.29
b ±0.18 2.33
b±0.56 2.42
b±0.15 3.01
c±0.13
(0.27ab
±0.03)
(1.85f±0.04) (0.19
a±0.00) (0.35
b± 0.03) (0.52
c±0.11) (0.63
d±0.05) (1.97
e±0.03)
Values are mean±SD. Values followed by different letter superscripts in a row are significantly different at P≤0.05 as assessed by Fisher’s least
significant difference.
Figures in parentheses are reactive lysine content (g/100 g) biscuits and flour.
1Sorghum flour.
2Wheat flour.

59
baby cereals, Guerra-Hernandes and Carzo (1996) found higher furosine, levels of
1010 mg/100 g in soy fortified samples compared to 293 mg/100 g protein in
unfortified samples. It is also possible that the presence of DSF flour with higher
levels of reactive lysine in the flour mixtures increased losses of reactive lysine. This
suggests that losses are higher when the available lysine content in the proteins is
greater as was noted by Fernandes-Artigas et al (1999). The results in the present
study also agree with the findings of Horvatic and Eres (2002) who reported 27 to
47% loss of available lysine during production of dietetic biscuits.
The 100% bread wheat biscuit apparently had reactive lysine content 53% higher than
raw bread wheat flour. This inconsistency may be attributed partly to inefficiency of
the lysine dye binding method in determining the lysine damage in low lysine
products (Hendricks et al 1994). Equal amounts of Crocein Orange G dye are used for
both high protein foods such as legume-cereal complements and low protein
uncomplemented cereal foods, with lower values of histidine, arginine and lysine.
Excess dye in the reaction in low lysine foods may have caused an overestimation of
the reactive lysine content (Hurrell et al 1979). Similar findings were noted by
Anyango (2009) who reported inconsistent reactive lysine values in cooked pure
sorghum foods and their uncooked flours. It is also possible that a proportion of the
early Maillard products reverted back to lysine during acid hydrolysis of lysine
determination. A similar trend of results was observed by Rutherfurd and Moughan
(2007) who reported slightly higher reactive lysine content in dry cat food than lysine
content. The high moisture content in wheat biscuits may also have prevented lysine
reactivity and increased reactive lysine content (Hendricks et al 1994). A similar
observation was made by Bjorck, Noguchi, Asp, Cheftel and Dahlqvist (1983) who
postulated that high moisture spared lysine reactivity.
4.1.3.3 In vitro protein digestibility
Table 4.1.5 shows that compositing sorghum with DSF substantially increased in vitro
protein digestibility (IVPD) of biscuits compared to the 100% sorghum biscuit.
Replacement of sorghum flour with 28.6, 50, and 71.4% DSF increased IVPD by 148,
170 and 191%, respectively. The increase in digestibility could be attributed to

60
Table 4.1.5 The effect of compositing sorghum and bread wheat with soy on in vitro protein digestibility (%) of biscuits and flour
Biscuit type Flour Sorghum or Wheat: Soy composite
Cereal flour Soy flour 100:0 71.4: 28.6 50:50 28.6:71.4 0:100
Sorghum: Soy 56.0b±1.1
1 97.5
f ± 0.0 30.0
a±3.3 74.3
c±1.6 81.1
d ±2.3 87.3
e±3.5 88.1
e±3.7
Wheat: Soy 97.3cd
±1.52
97.5d ± 0.0 96.7
cd±1.5
95.5
cd ± 1.1 94.2
bc ±0.5 91.4
b±2.5 88.1
a±3.7
Values are mean±SD. Values followed by same letter superscripts in a row are not significantly different at P≤0.05 as assessed by Fisher’s least
significant difference.
1Sorghum flour.
2Wheat flour.

61
dilution of the less digestible sorghum kafirins with the more soluble soy bean
globulins. Improved digestibility suggests potentially improved protein absorption
and retention in humans. Similar results have been reported after complementing
cereals with DSF. For instance, Bookwalter et al (1987) found a 13% increase in
IVPD of sorghum grits on inclusion of 15% soy grits.
The 100% sorghum biscuit was 87% lower in IVPD compared to raw sorghum flour
with 56%. Duodu et al (2002) also reported large reductions in IVPD (96%) for red
non tannin sorghum after cooking. This may be explained by formation of high levels
of disulphide cross-linked kafirins (Hamaker et al 1986). It is also likely that an
exogenous factor such as the high amount of lipids in the biscuits resulted in
formation of protein-lipid complexes that were resistant to attack by enzymes as
described by Duodu et al (2002).
The bread wheat biscuits exhibited a slight reduction of 6% in IVPD when DSF
increased to 71.4% (Table 4.1.5). Heating wheat biscuit dough at high temperatures
for a prolonged period of time may have rendered the gluten less soluble and therefore
less accessible to proteolysis. The results in this study agree with the findings from
several other studies that demonstrate the behaviour of protein when subjected to heat.
For example, Weegels, de Groot, Verhoek and Hamer (1994) reported reduced
solubility of gluten proteins in urea and guanidine HCl when subjected to high
temperatures. They proposed that this could be a result of increased cross-linking of
proteins. Similarly, Erbersdobler and Faist (2001) linked Maillard reaction derivatives
to reduced digestibility when proteins are heated. The high oil content in biscuits
probably reduced the IVPD of soy flour. A similar study conducted by Taha and
Mohamed (2004) demonstrated that denaturing protein by heating at high
temperatures in the presence of oxidised oil caused lipid-protein complexes that
reduced in vitro protein digestibility of DSF.
The results from this study showed that IVPD of sorghum flour was half that of wheat
flour. Fortified sorghum biscuits were also 4 to 22% lower in IVPD than fortified
bread wheat biscuits with the same levels of DFS flour of 28.6 to 71.4% (Table 4.1.5).
This was due to higher IVPD of wheat than sorghum. Addition of soy in sorghum-soy

62
formulations may simply have compensated for decreased IVPD resulting from
cooking sorghum as was also observed by Bookwalter et al (1987). Studies that show
similar differences have been conducted by Mertz, Hassen, Cairns-Whittern, Kirleis,
Tu and Axtell (1984), who reported 86% IVPD for wheat, compared to 56% for
sorghum. MacLean et al (1981) reported 46% and 81% apparent digestibility for
sorghum and wheat, respectively in young children.
4.1.3.4 Amino acids
Tables 4.1.6 and 4.1.7 show that compositing sorghum and bread wheat with DSF
markedly improved the lysine scores of biscuits. Lysine contents of 100% cereal
biscuits were less than half the 48 and 52 mg/100 g protein requirement for 3 to 10
and 1 to 2 year old children, respectively (WHO 2007). However, on replacement of
28.6, 50 and 71.4% cereal flour with DSF, the lysine content of the biscuits improved
to 82, 95 and 100%, respectively in sorghum biscuits and 88, 98 and 107%,
respectively in wheat biscuits of the WHO (2007) requirement for 3 to 10 year olds.
Additionally, all the fortified products had amino acid scores above the 65%
minimum recommended by FAO/WHO (1994) for supplementary foods for young
children. The increase can be explained by the higher lysine contained in DSF (106%
of the recommended levels) for 3 to 10 year old children. Lindell and Walker (1984)
conducted a similar study in which red sorghum and wheat flours were fortified with
DSF in chapattis and obtained 75% of the WHO (2007) recommended level for
lysine. Similar results were reported by Asma, El Fadil and El Tinay (2006) who
found that supplementing sorghum meal with cowpea and pigeon pea improved the
lysine scores by 15 to 45%.
The amount of indispensable amino acids in biscuits increased when DSF was
replaced at 28.6 to 71.4% levels by 39 to 41% and 14 to 42% in sorghum and wheat
biscuits, respectively compared to the total recommended amount by WHO (2007) for
3 to 10 year olds of 293 mg/g (Table 4.1.7). Some researchers have reported improved
total indispensable amino acid content in legume fortified cereal products. For
example, Mosha and Vicent (2005) reported a 2.9 to 19.8% increase in total amino
acids of SUA-90 bean and peanut fortified supplementary foods. Similarly, Serna-

63
Table 4.1.6 The effect of compositing sorghum and bread wheat with defatted soy flour on amino acid composition of biscuits and flour
Indispensable amino acids
Dispensable amino acids
Hist Thr Val Meta Isoleu Leu Pheb Lys Asp Glu Ser Gly Arg Ala Pro Tyr
Flours
Soy flour 1.24c 0.31 2.29 0.69 2.19 3.51 2.33 0.23 4.15 8.18 2.28 2.03 3.57 2.13 2.52 1.79 24d; 1.5e 32; 1.3 46; 1.2 89; 3.7 44; 1.4 70;1.1. 50; 2.1 83; 1.7 83 163 46 41 71 43 30 36
Sorghum flour 0.23 0.31 0.55 0.18 0.44 1.41 0.55 4.15 0.49 2.08 0.46 0.34 0.41 1.00 0.91 0.42
20; 1.3 27; 1.1 48; 1.2 29; 1.1 39; 1.3 124; 2.0 85; 3.5 20; 0.4 43 183 41 30 36 88 80 37
Wheat flour 0.24 0.60 0.51 0.20 0.43 0.84 0.60 0.33 0.33 3.94 0.57 0.46 0.49 0.38 1.51 0.40
18; 1.1 23; 0.9 38; 1.0 42; 1.8 32; 1.0 63; 1.03 75; 1.8 25; 0.5 25 295 43 43 37 29 113 30
Sorghum/Soy biscuits
100:0 0.17 0.53 0.43 0.14 0.35 1.17 0.45 0.13 0.33 1.70 0.36 0.26 0.28 0.82 0.26 0.33
19; 1.2 21; 0.9 47; 1.2 28; 1.2 38; 1.2 127; 2.1 84; 2.1 14; 0.3 36 184 39 28 30 89 83 35
71.4:28.6 0.41 0.69 0.87 0.26 0.80 1.67 0.87 0.70 1.26 3.28 0.83 0.69 1.06 1.09 1.14 0.64
23; 1.4 22; 1.2 48; 1.2 45; 1.1 44; 1.4 93; 1.5 85; 2.1 39; 0.8 71 18 46 38 59 61 64 36
50:50 0.59 0.69 1.20 0.35 1.12 2.05 1.20 1.12 2.12 4.42 1.16 1.00 1.61 1.25 1.38 0.85
23; 1.5 28; 1.1 48; 1.2 58; 0.9 45; 1.5 83; 1.4 83; 2.0 45; 1.0 86 179 47 41 65 50 56 34 28.6:71.4 0.71 0.84 1.41 0.42 1.35 2.35 1.44 1.47 2.46 5.22 1.39 1.21 2.02 1.39 1.58 1.03
23; 1.5 27; 1.1 46; 1.2 71; 0.7 44; 1.4 76; 1.3 81; 2.0 48; 1.0 80 169 45 39 66 45 52 34
0:100 0.96 1.25 1.82 1.38 1.77 2.88 1.89 2.05 3.45 6.70 1.85 1.64 2.73 1.69 1.98 1.31
24; 1.5 31;1.9 46;1.1 89; 1.7 44; 1.4 72; 1.2 80; 2.0 51; 1.0 87 169 46 41 69 42 50 33
Wheat/Soy biscuits
100:0 0.19 0.16 0.41 0.15 0.35 0.67 0.45 0.20 0.26 3.18 0.42 0.35 0.39 0.31 1.16 0.29
18; 1.1 15; 0.6 38; 1.0 42; 1.7 33; 1.1 62; 1.0 64; 1.6 19; 0.4 245 295 39 32 36 29 107 27
71.4:28.6 0.43 0.48 0.87 0.28 0.81 1.39 0.92 0.82 1.17 4.34 0.88 0.75 1.14 0.75 1.43 0.62
22; 1.4 25; 1.0 45; 1.1 55; 1.4 42; 1.4 71; 1.2 79; 1.9 42; 0.9 60 223 45 38 59 39 74 32
50:50 0.58 0.70 1.16 0.37 1.12 1.86 1.23 1.21 1.80 5.04 1.19 1.03 1.64 1.04 1.59 0.85
23; 1.4 27; 1.1 45; 1,1 66; 1.6 43; 1.4 72; 1.2 81; 2.0 47; 1.0 70 195 46 40 64 40 62 33 28.6:71.4 0.74 0.95 1.45 0.45 1.41 2.30 1.50 1.57 2.59 5.76 1.47 1.29 2.10 1.31 1.73 1.05
23; 1.4 30; 1.2 46; 1.1 76; 0.9 44;1.4 72; 1.2 80; 1.9 49; 1.0 81 180 46 40 66 41 54 33
Reference patternf 16 25 40 24 31 61 41 48
a Methionine + cystine; b Phenylalanine + tyrosine; cAmino acid content (g/100 g, db); dAmino acid concentration (mg/g protein; rounded off to a whole number) eAmino acid score= mg amino acid in 1 g protein of test sample/ mg amino acid in requirement pattern (WHO 2007) for children 3-10 year. fPattern for amino acid
requirements for 3-10 year old children (WHO 2007).

64
Table 4.1.7 Indispensable amino acid composition (mg/g protein) of soy fortified sorghum and bread wheat biscuits compared with the pattern
for amino acid requirements (mg/g crude protein children 3-10 years (1-2 years)
Amino acid WHO reference
pattern1
Sorghum: Soy Soy Wheat: Soy
100:0 71.4:28.6 50:50 28.6:71.4 100:0 100:0 71.4:28.6 50:50 28.6:71.4
Lysine 48 (52) 14* 39 45 48 51 19* 42 47 49
Leucine 61 (63) 127 94 83 76 72 62 71 72 72
Phenylalanine +
tyrosine
41 (46) 84 85 83 80 81 64 69 81 80
Valine 40 (42) 47 48 48 46 46 38 45 45 46
Tryptophan3
6.6 (7.4) 12 28 40 52 68 14 30 41 53
Methionine +
Cysteine4
24 (26) 28 45 58 71 89 41 55 66 76
Threonine 25 (27) 21 30 28 27 31 15 25 27 30
Histidine 16 (18) 19 23 24 23 24 18 22 23 23
Isoleucine 31 (31) 38 44 45 44 44 33 42 43 44
Total 293 (312.4) 380 410 415 416 439 280 335 398 417
Lysine score (3-10)5
0.29 0.82 0.95 1.00 1.07 0.39 0.88 0.98 1.03
Lysine score (1-2) 0.26 0.76 0.87 0.92 0.99 0.36 0.81 0.90 0.95
PDCAAS (3-10)6
0.09 0.61 0.77 0.87 0.94 0.38 0.84 0.92 0.93
PDCAAS (1-2) 0.08 0.56 0.71 0.80 0.87 0.34 0.78 0.85 0.86 1Amino acid reference patterns for children 3-10 years and 1-2 years in parentheses (WHO, 2007); 3Tryptophan values calculated from USDA (2008) for sorghum, defatted soy flour and bread wheat; 4Cystine values calculated from USDA (2008); eLysine score= mg lysine in 1 g protein of test sample/ mg lysine in requirement pattern (WHO
2007) for children 3-10 year; 5Protein Digestibility Corrected Amino Acid Score (lysine score x IVPD); *=Most limiting amino acid.

65
Saldivar et al (1999) reported an increase in the number of indispensable amino acids
in bread fortified with DSF. The increase in indispensable amino acids may be linked
to the higher protein content from DSF with higher lysine and indispensable amino
acids (USDA 2008).
The dramatic improvement in protein digestibility and amino acid score also markedly
improved the Protein Digestibility Corrected Amino Acid Score (PDCAAS) in DSF
composite biscuits compared to 100% cereal biscuits (Table 4.1.7). Replacing
sorghum and bread wheat flours with DSF at 28.6 to 71.4% levels increased
PDCAAS by 7 to 10 times and 2 to 2.5 times, respectively in biscuits. The PDCAAS
is the internationally accepted measure of food protein quality and is used to assess
the protein quality of both dietary mixtures and individual protein food sources (WHO
2007).
4.1.4 CONCLUSIONS
Fortifying sorghum or bread wheat with DSF dramatically improves the protein
content and quality of biscuits. At a 1:1 cereal: DSF ratio, one and two biscuits of 28 g
provide 50% of the protein requirements for 1 to 2 and 3-10 and year old children,
respectively with greatly improved PDCAAS. Hence, composite sorghum or bread
wheat biscuits have considerable potential for use as protein and indispensable amino
acid-rich supplementary food in semi arid tropical countries to prevent PEM in school
and pre-school children.
It is recommended that further study be carried out to determine the protein nutritional
quality of biscuits using a small animal assay as this is the standard method of
determining protein nutritional quality in foods.

66
4.1.5 REFERENCES
AACC International. 2000. Approved Methods of the American Association of Cereal
Chemists, 10th Ed. Methods 10-50D, 44-15A, 46-30, 08-01,30-25 and 32-10. The
Association: St. Paul, MN.
Ait-Ameur, L., Rega, B., Giampaoli, P., Trystram, G., and Birlouez-Aragon, I. 2008. The fate
of furfural and other volatile markers during the baking process of a model cookie. Food
Chem. 111:758-763.
Anyango, J. 2009. Improvement in the protein quality of African sorghum foods through
compositing with cowpea. MSc Dissertation. University of Pretoria: Pretoria.
Asma, A. M., El Fadil, B., and El Tinay, A. H. 2006. Development of weaning food from
sorghum supplemented with legume and oil seeds. Food Nutr. Bull. 27:26-34.
Awadelkareem, A. M., Mustafa, A. I., and El Tinay, A. H. 2008. Protein mineral content and
amino acid profile of sorghum flour as influenced by soybean protein concentrate
supplementation. Pakistan J. Nutr. 7:475-479.
Badi, S. M., and Hoseney, R. C. 1976. Use of sorghum and pearl millet flours in cookies.
Cereal Chem. 53:733-738.
Belton, P. S., Delgadillo, I., Halford, N. G., and Shewry, P. R. 2006. Kafirin stracture and
functionality. J. Cereal Sci. 44:272-286.
Bidlingmeyer, B. A., Cohen, S. A., and Tarvin, T. L. 1984. Rapid analysis of amino acids
using pre-column derivatisation. J. Chromatogr. 336:93-104.
Bjorck, I., Noguchi, A., Asp, N., Cheftel, J., and Dahlqvist, A. 1983. Protein nutritional value
of a biscuit processed by extrusion cooking: Effects on available lysine. J. Sci. Food and
Agric. 31:488-492.

67
Bodwell, C. E., and Marable, N. L. 1981. Effectiveness of methods for evaluating the
nutritional quality of soy bean protein. J. Am. Oil Chem. Soc. 3:475-483.
Bookwalter, G. N., Kirleis, A. W., and Mertz E. T. 1987. In vitro digestibility of protein in
milled sorghum and other processed cereals with and without soy-fortification. J. Food Sci.
52:1577-1579.
Bookwalter, G. N., Warner, K., and Anderson, R. A. 1977. Fortification of dry-milled
sorghum with oilseed proteins. J. Food Sci. 42:969-97.
Bulusu, S., Laviolette, L., Mannar, V., and Reddy, V. 2007. Cereal fortification programmes
in developing countries. Pages 91-105 in: Issues in Complementary Feeding. C. Agostoni,
and O. Brunser, eds. Nestle Nutrition Workshop Series, Vol 60. Paediatric Programme,
Nestec Ltd: Basel
Charissou, A., Ait-Ameur, L., and Birloeuz-Aragon., I. 2007. Kinetics of formation of three
indicators of the Maillard reaction in model cookies: Influence of baking temperature and
type of sugar. J. Sci. Food Agric. 55:4532-4539.
Dendy, D. A. V. 1993. Drought and urbanization in Africa: The future of sorghum and millet.
Pages 299-317 in: Cereal Science and Technology: Impact on a Changing Africa. J. R. N.
Taylor, P. G. Randall, and J. H. Viljoen, eds. CSIR: Pretoria.
Doggett, H. 1988. Sorghum. 2nd
Ed. Longman Scientific and Technical: Harlow. Pp 260-
282.
Duodu, K. G., Taylor, J. R. N., Belton, P. S., and Hamaker, B. R. 2003. Factors affecting
sorghum protein digestibility. J. Cereal Sci. 38:117-131.
El-Khalifa, O. E., and El-Tinay, A. 2002. Effect of cystine on bakery products from wheat-
sorghum blends. Food Chem. 77:133-137.

68
Erbersdobler, H. F., and Faist, V. 2001. Metabolic transit of Amadori products. Nahrung, 45:
177-81.
FAO, 2003. Food Energy: Methods of Analysis and Conversion Factors. FAO Food and
Nutrition Paper 77. Food and Agriculture Organisation: Rome. Pp 18-37.
FAO. 2004. Human Energy Requirements: Report of the joint FAO/WHO/UNU Expert
Consultation Group. Food and Nutrition Technical Report Series 1. Food and Agriculture
Organization: Rome.
FAO/WHO. 1994. Codex Alimentarius: Foods for Special Dietary uses (including Foods for
Infants and Children). Joint FAO/WHO Food Standards Programme, Codex Alimentarious
Commission, Vol 4, 2nd
Ed. Food and Agriculture Organization: Rome.
Fernandes-Artigas P, Garcia-Villanova B and Guerra-Hernandez E. 1999. Blockage of
available lysine at different stages of infant cereal production. J. Sci. Food Agric., 7:851-854.
FAO/WHO/UNU. 1985. Energy and Protein Requirements. Report of Joint FAO/WHO/UNU
Expert Consultation. WHO Technical Report Series No. 724. World Health Organization.
Rome.
Friedman, M. 1996. Nutritional value of proteins from different food sources. A review. J.
Agric. Food Chem. 44:6-29.
Guerra-Hernandez, E., and Carzo, N. 1996. Furosine determination in baby cereals by ion-
pair reversed-phase liquid chromatography. J. Cereal Sci. 73:729-731.
Hamaker, B. R., Allen, W. K., Mertz, E. T., and Axtell, J. D. 1986. Effect of cooking on the
protein profiles and in vitro protein digestibility of sorghum and maize. J. Agric. Food Chem.
34:647-649.

69
Hammond, E, G., Murphy, P. A., and Johnson, L. A. 2003. Soy (soya) beans: Properties and
analysis. Pages 5379-5383 in: Encyclopaedia of Food Sciences and Nutrition. B. Caballero,
C. L. and Trugo, P. M, Finglas, eds. Elsevier Science: Oxford.
Hendricks, W. H., Moughan, P. J., Boer, H., and van der Poel, A. F. B. 1994. Effects of
extrusion on the dye-binding, fluorodinitrobenzene-reactive and total lysine content of
soyabean and peas. Animal Feed Sci. Techn. 48:99-109.
Hikeezi, D. 1994. Cookie making using dehulled high tannin sorghum supplemented with
peanut and/or sunflower flours. Master of Science thesis, Kansas State University:
Manhattan, KA.
Hofvander, Y., and Underwood, B. A. 1987. Processed supplementary foods for older infants
and young children, with special reference to developing countries. Food Nutr. Bull. 9:1-20.
Hoppe, C., Andersen, S. G., Jacobsen, S., Molgaard, C., Friis, H., Sangild P. T and
Michealsen, F. 2008. The use of whey or skimmed milk powder in fortified blended foods for
vulnerable groups. J. Nutr. 138:145S-161S.
Horvatic, M., and Eres, M. 2002. Protein nutrition quality during production and storage of
dietetic biscuits. J. Sci. Food Agric. 82:1617-1620.
Hurrell, R. F., Lerman, P., and Carpenter, K. J. 1979. Reactive lysine in foodstuffs as
measured by a rapid dye binding procedure. J. Food Sci. 44:1221-1231.
Institute of Medicine, Food and Nutrition Board. 2005. Dietary reference intakes for energy
carbohydrates, fibre, fat, fatty acids, cholesterol, protein and amino acids (macronutrients).
National Academies Press: Washington DC. Pp 589-768
International Crops Research Institute for the Semi Arid Tropics (ICRISAT). Crops:
Sorghum. 2009. www.icrisat.org/sorghum/sorghum.htm. Accessed November 2009.

70
Karr-Lilienthal, L. K., Bauer, L. L., Zinn, K. E., Frazier, R. L., Parsons, C. M., and Fahey, G.
C. 2006. Chemical composition and nutritional quality of soy bean meals prepared by
extruder/expeller processing for use in poultry diets. J. Agric. Food Chem. 54:8108-8114.
Kayitesi, E. 2010. Sensory and nutritional quality of marama-sorghum composite flours and
porridges. MSc Dissertation University of Pretoria: Pretoria.
Kent, N. L., and Evers, A. D. 1994. Technology of Cereals: An Introduction for Students of
Food Science and Agriculture. 4th
Ed. Elsevier Science: Oxford. Pp 78-190.
Kim, J. S., Kim, K. J., Ma, W. C. J., and Chung, H. Y. 2007. Development of a method to
quantify lysine in small amounts of rice grain. Korean J. Sanit. 22:75-84.
Leon-Chapa, M. 1999. Methods to improve and measure texture of sorghum cookies. M. S.
thesis, Texas A&M University, College Station, TX. Pp 126.
Lindell, M. J., and Walker, C. E. 1984. Soy enrichment of chapaties made from wheat and
nonwheat flours. Cereal Chem. 61:435-438.
MacLean W. C., De Romana., Placko R. P., and Graham G. G. 1981. Protein quality and
digestibility of sorghum in preschool children: Balance studies and plasma amino acids. J.
Nutr. 111:1928-1936.
Marcone, F. M., and Kakuda, Y. 1999. A comparative study of the functional properties of
amaranth and soy bean globulin. Nahrung 43:S368-373.
McWatters, K. H. 1978. Cookie baking properties of defatted peanut, soybean and field pea
flours. Cereal Chem. 55:853-863.
Mertz E. T., Hassen M. M., Cairns-Whittern C., Kirleis A, W, Tu L., and Axtell J. D. 1984.
Pepsin digestibility of proteins in sorghum and other major cereals. Proc. Natl. Acad Sci.
USA 81:1-2.

71
Mohsen, M. S., Fadel, H. H. M., Bekhit, M. A., Edris, A. E., and Ahmed, Y. S. 2009. Effect
of substitution of soy protein isolate on aroma volatiles, chemical composition and sensory
quality of wheat cookies. Int. J. Food Sci. Technol. 44:1705-1712.
Mosha, T. C. E., and Vicent, M. M. 2005. Nutritional quality, storage stability and
acceptability of home-processed ready-to-eat composite foods for rehabilitating
undernourished preschool children in low-income countries. J. Food Proc. Preserv. 29:331-
356.
Mridula, D., Gupta, R. K., and Manikantan, M. R. 2007. Effect of incorporation of sorghum
flour to wheat flour on quality of biscuits fortified with defatted soy flour. Am J. Food
Technol. 2:428-434.
Muller, O., and Krawinkel M. 2005. Malnutrition and health in developing countries. Can.
Med. Assoc. J. 173:279-286.
Rutherfurd, S. M., and Maughan, P. J. 2007. Development of a novel bioassay for
determining the available lysine contents of foods and feedstuffs. Nutr. Res. Rev. 20:3-16.
Serna Saldivar, S., and Rooney, L. W. 1995. Structure and chemistry of sorghum and millets.
Pages 69-124 in: Sorghum and millets: Chemistry and Technology. D. A. V. Dendy, ed.
American Association of Cereal Chemists: St. Paul’s MN.
Shewry, P. R. 2009. Wheat. J. Exp. Bot. 60:1537-1553.
Shrestha, A. K., and Noomhorm, A. 2002. Comparison of physico-chemical properties of
biscuits supplemented with soy and kinema flours. Int. J.Food Sci.Technol., 37: 162-164.
Singh, R., Singh, G., and Chauhan, G. S. 2000. Nutritional evaluation of soy fortified
biscuits. J.Food Sci.Technol. 37:162-164.

72
Stipanuk, M. H. 2006. Protein and amino acid requirements. Pages 419-448 in: Biochemical,
Physiological, Molecular Aspects of Human Nutrition. M. H Stipanuk, ed. Saunders Elsevier:
St. Louis, MO.
Sudha, M. L., Vetrimani, R., and Leelavathi, K. 2007. Influence of fibre from different
cereals on the rheological characteristics of wheat flour dough and on biscuit quality. Food
Chem. 100:1365-1370.
Taha, F. S., and Mohamed, S. S. 2004. Effect of different denaturation methods on lipid-
protein complex formation. Int. J.Food Sci.Technol. 37:99-104.
Taha, M. R., Majdi, A. A., and Khalil, I. E. 2006. Effect of chickpea, broad bean, or isolated
soy protein additions on the physicochemical and sensory properties of biscuits. J. Food Sci.
71:S438-S442.
Taylor, J. R. N., and Schüssler, L. 1986. The protein compositions of the different anatomical
parts of sorghum grain. J. Cereal Sci. 4:361-369.
Taylor, J. R. N. 2004. Grain production and consumption: Africa. Pages 70-78 in: Encyclopedia
of Grain Science. C. Wrigley, H. Corke, and C. E Walker eds. Elsevier Science: London.
USDA. 2008. National Nutrient Database for Standard Reference, Release 20.
www.nal.usda.gov/fnic/foodcomp/cgi-bin/list_nut_edit.pl. Accessed July 2009.
Villamiel, M. 2006. Nonenzymatic browning of cookies, crackers and biscuits. Pages 433-
470 in: Bakery products: Science and Technology. Y. H. Hui, ed. Blackwell Publishing:
Ames, IA.
Vasconcelos, I. M., Maia, A. A. B., Siebra, E. A., Oliveira, J. T. A., Carvalho. A. F. F. U.,
Melo, V. M. M., Carlini, C. R., and Castelar, L. I. 2001. Nutritional study of two Brazilian
soybean (Glycine max) cultivars differing in contents of antinutritional and toxic proteins. J.
Nutr. Biochem. 12:55-62.

73
Weegels, P. L., De Groot, A. M. G., Verhoek, J. A., and Hamer, R. J. 1994. Effects on gluten
of heating at different moisture contents. II. Changes in pyysico-chemical properties and
secondary structure. J. Cereal Sci. 19:39-47.
WHO/UNICEF. 1998. Complementary Feeding of Young Children in Developing Countries:
A Review of Current Scientific Knowledge. World Health Organization: Geneva,
Switzerland.
World Health Organization. 2007. Protein and Amino Acid Requirements in Human
Nutrition: Report of a Joint WHO/FAO/UNU Expert Consultation (2002). WHO Technical
report series No. 935. World Health Organization Press: Geneva.
Young, R. Y., and Pellet, L. P. 1994. Plant protein in relation to human protein and amino
acid nutrition. Am. J. Clin. Nutr. 59:1203S-1212S.
Young, V.R., and Pellet, P. L. 1985. Wheat proteins in relation to protein requirements and
availability of amino acids. Am. J. Clin. Nutr. 41:1077-1090.

74
4.2 Effects of compositing sorghum and bread wheat with soy on the sensory
characteristics and consumer acceptability of biscuits

75
ABSTRACT
Protein Energy Malnutrition (PEM) remains a major nutritional problem affecting children in
Africa. Sorghum biscuits with improved protein quality through complementation with
defatted soy flour could be effective in alleviating PEM. The aim of this study was to
evaluate the effect of compositing sorghum and bread wheat flours with soy on sensory
characteristics and acceptability of biscuits. Sorghum and bread wheat biscuits with ratios of
0, 28.6, 50 and 71.4% substituted with defatted soy flour were evaluated. Compositing
sorghum and bread wheat with defatted soy flour at 1:1 ratio reduced biscuit weight by 16 to
26%, and thickness by 11 to 28%, respectively, compared to 100% cereal biscuits because of
reduction in dry matter content. Spread factor increased by 7 to 32%. Biscuits were darker in
colour (reduced L* value) by 14 to 56% and hardness increased by 84% in sorghum biscuits.
Principal component analysis (PCA) for 26 attributes for biscuits rated by a descriptive
sensory panel revealed that 61% of the variation explained by the first principal component
was due to the type of cereals, sorghum or bread wheat, while an additional 33% (PC2) was
due to the concentration of soy in the biscuits. Positive hedonic scores for fortified sorghum
and bread wheat biscuits by 8 to 9 year olds were sustained above 80% through eight
consumption occasions. Sorghum and bread wheat biscuits fortified with defatted soy flour
have positive characteristics associated with biscuits such as crispy texture, roasted cereal
flavour, and improved spread factor and appear to retain high acceptance over time as a
protein rich supplementary food.

76
4.2.1 INTRODUCTION
Protein Energy Malnutrition (PEM) continues to be an important nutritional problem
affecting children in most developing countries (Muller and Krawinkel 2005). Sorghum is an
important staple food in the semi arid and arid tropics of Africa (ICRISAT 2009) as is hard
bread wheat that is cultivated in at least 33 African countries (Taylor 2004). Biscuits made
from sorghum or bread wheat fortified with defatted soy flour to improve the protein content
and quality could serve as a vehicle for protein to alleviate PEM among vulnerable children
in Africa. In Chapter 4.1, Section 4.1.2.2, biscuits were developed using sorghum and bread
wheat, substituted with 0, 28.6, 50, 71.4% and 100% defatted soy flour (DSF) to improve the
protein content and quality. At 1:1 DFS replacement level, two sorghum or bread wheat
biscuits of 28 g each could provide 50% of the daily protein requirement for 3 to 10 year old
children.
Soy proteins have functional properties such as water-holding, heat coagulability and
emulsifying capacities (Marcone and Kakuda 1999) that affect the quality of foods.
Therefore, substitution with soy protein (Vittadini and Vodovotz 2003) and thermal
processing, influence textural, physico-chemical and flavour characteristics of baked cereal
products, which are important for consumer acceptance (Sablani, Marcotte and Baik 1998).
Some studies have shown the effects of addition of soy proteins to food products. For
instance, Perez, Ribotta, Steffolani and Leon (2008) demonstrated that addition of soy protein
to wheat flour weakened dough by interacting with glutenin, which enhanced gluten
depolymerisation. Singh and Mohamed (2007) reported higher farinograph water absorption
in flours with 70% soy protein substitution compared to 100% cereal flour.
Thermal processing of soy proteins using dry heat has been shown to induce changes in
wheat biscuits that can be explained by the Maillard reaction, caramelisation and lipid
peroxidation (Mohsen et al 2009). These workers identified volatile compounds that included
pyrazines, associated with roasted flavours and aldehydes and ketones with the beany flavour,
which discourages consumption of soy beans (Boge, Boylston and Wilson 2009). Singh and
Mohamed (2007) noted that every increment in soy protein isolate resulted in darker top
colour of cookies. Sensory characterization is therefore necessary to identify both desirable
and undesirable characteristics related to biscuits that may influence consumer acceptability.

77
Food products developed specifically for children must be tested by children (Guinard 2001).
Methods used to measure food preference by children should be simple enough to be
understood, but robust enough to measure preference reliably (Leon et al 1999). An
acceptability study by Leon et al (1999) with 4 to 10 year old children of five biscuits
established that the products were discriminated more using hedonic categorization than
paired comparison and ranking by elimination. Additionally, children aged 8 to 9 years were
the most consistent. However, hedonic ratings do not always predict long term acceptability
(Goldman 1994), a factor that is important in introducing new food products. A consumer
exposure test of several days can be used to determine long term acceptance of new food
products (Wiejzen et al 2008).
Studies on soy fortified sorghum and wheat biscuits have only focused on nutritional quality
and consumer acceptability. There are no reported studies on comprehensive descriptive
sensory characterization of soy fortified sorghum and bread wheat biscuits using a trained
panel. There are also no reported studies using children in Africa to establish the long-term
acceptability of new foods by using the repeated exposure test. Therefore the objectives of
this study were to determine the effect of compositing sorghum and bread-wheat with soy on
the sensory characteristics of biscuits, to develop a lexicon for fortified sorghum and bread
wheat biscuits, to determine 8 to 9 year old children’s liking of sorghum-soy and bread
wheat-soy composite biscuits using hedonic categorization and to determine long term
acceptability using a repeated exposure test.
4.2.2 MATERIALS AND METHODS
4.2.2.1 Biscuit Sample Preparation
Sorghum and bread-wheat biscuits were prepared using the basic formulation and procedure
described in Chapter 4.1, Sections 4.1.2.2 and 4.1.2.3. After sheeting the dough, biscuits were
cut using a 4.5 cm diameter biscuit cutter for sensory evaluation and 6.3 cm for physical
evaluation. Measurements of weight, width and height were taken for physical evaluation
after baking and cooling biscuits at ambient temperature for 30 minutes. Biscuits were
vacuum packed and stored at 10oC until further analyses.

78
4.2.2.2 Physical evaluation
Biscuit width, thickness and spread factor were determined by the baking quality of cookie
flour method (AACC International 2000) Method 10-50D. Measurements were taken using a
vernier caliper. Six biscuits were placed edge to edge and the width measured. They were
rotated 90o and re-measured to obtain average width (W) in mm. The thickness (T) of biscuits
was measured after stacking six biscuits on top of one another, re-stacking in a different order
and re-measuring to get average thickness. These measurements were read to the nearest 0.5
mm. Spread factor (SF) was calculated as SF = W/T. Mean weight of six biscuits was also
noted. Volume was calculated as radius (r2) x (T) x 3.14 and density of biscuits was
calculated (mass/volume) and expressed as g per cm3.
4.2.2.3 Instrumental colour measurement
Colour of biscuit samples was measured using a CR210 Minolta chromameter (Model CR-
400, Osaka, Japan), and recorded using the L* a* b* colour system. The chromameter was
calibrated using a standard white plate (CIE L* = 97.58, a* = -0.17, b* = 1.88). Two readings
of the L* a* b* values were taken at two positions on the top sides of 3 randomly selected
biscuits from each treatment and the mean values recorded. The hue angle (tan-1
b*/a*) and
chroma [(a*)2 + (b*)
2]0.5
(McGuire 1992) were calculated.
4.2.2.4 Instrumental texture analyses
Texture analysis of biscuits made from sorghum and bread wheat flours composited with
DSF was performed using a TA-XT2 Texture Analyser (Stable Micro Systems, Godalming,
UK). The nine treatments of biscuits were measured for maximum force (“Hardness”) and
distance compressed before breaking (“Fracturability”) using a three point bend rig
attachment at a cross-head speed of 3.0 mm/ sec for a distance of 5 mm and load cell of 5 kg.
The temperature was 25oC and relative humidity 70%. The force and distance required to
break a single biscuit was recorded and the average value of 9 replicates is reported for each
treatment. Due to varying thickness among biscuit treatments, the fracture properties were
further determined according to the following expressions (ASTM International 2003,
Baltsavias and Jurgens 1997, Zoulias, Oreopoulou and Tzia 2002).

79
ζ = 3FL
2bh2
ε = 6hY
L2
Brittleness = ζ/ε
where ζ is the stress at midpoint (MPa), ε is the strain, F is the force at the beam centre (N), L
is the distance between supports or span length (mm), b is the biscuit width (mm), h is the
biscuit thickness (mm) and Y is the deformation/deflection at the beam centre under the load
(mm). Stress was expressed as kPa and strain as a percentage.
4.2.2.5 Descriptive Sensory Analysis
Recruitment and screening
The descriptive sensory panel comprised nine women and two men, aged between 20 and 41
years who were students of the University of Pretoria, South Africa. They were selected from
nineteen applicants after undergoing screening tests. Ethical approval to conduct the study
was granted by the University of Pretoria Ethics Committee of the Faculty of Agricultural
and Natural Sciences. Before engaging in the sensory exercise the panelists signed a consent
form informing them of the nature of the biscuit samples they would evaluate. Three types of
screening tests used in this study included the basic taste test as described by Lawless and
Heyman (1998), an aroma identification test and an excercise to describe differences in
attributes related to appearance, texture, odour and flavour among biscuits. The aroma
compounds used in the identification test were mushroom, smoked ham, vanilla, cheese,
onion, lime and strawberry, all on smelling strips. The five basic tastes, bitter, sweet, sour,
salt and umami were presented to panelists as taste solution impregnated filter papers of
different shapes. Panelists that could not identify bitterness, an attribute characteristic of
sorghum were eliminated. The biscuits used were digestive whole meal biscuits and Scottish
shortbread biscuits “Eet-Sum-More”, (Baker’s Biscuits, Rivonia, South Africa), Pyotts cream
crackers (National Brands, Bryanston, South Africa), and fruit and nut delights (Georgio’s
Biscuit Factory, Port Elizabeth, South Africa), all available on the South African market.

80
Panel training
Descriptive sensory profiling of the nine biscuit samples was performed using the generic
descriptive method described by Einstein (1991). The descriptive sensory panel was trained
in 10 sessions of 2 hours each per day over a three week period. During the training sessions,
the panelists were acquainted with the experimental biscuits and had to identify differences in
attributes related to appearance, texture, flavour and aftertaste. A written procedure and
practical demonstration on determining texture characteristics in biscuits as described by
Munoz, Szcesniak, Einstein and Schwartz (1992) was included. Reference samples, mainly
food items as shown in Table 4.2.1 were used to clarify the sensory attributes of biscuits
among panelists. Panelists also learnt how to use and evaluate samples using a computer
system and the computer software program (Compusense® Five release 4.6 [1986-2003]
Guelph, Ontario Canada). Following discussions, the panel generated and reached consensus
on 28 descriptors with definitions, reference standards to anchor the scale ends and the
sequence of descriptors on the ballot (Table 4.2.1).
Evaluation of biscuits
Evaluation of the biscuits was carried out over a period of three days in three sessions of 1.5
hours each a day following a randomized complete block design. During each session all nine
biscuits were randomly presented to each panelist. To avoid fatigue, panelists first evaluated
a set of 5 biscuits, followed by a 20 minute break before evaluating a second set of 4 biscuits.
Each sample was presented as ½ a biscuit in a transparent polyethylene zip-lock type bag of
100 mm x 80 mm, identified with random three digit codes. Panelists assessed the samples
seated in individual sensory booths under red light. Each panelist was also provided with a
glass of deionised water and raw carrot slices to cleanse the palate before and between tasting
of samples. Additionally, each panelist received written methodology of assessment and the
list of descriptors with definitions. Reference samples were availed to panelists throughout
the evaluation sessions. The sensory evaluation laboratory was maintained at a temperature of
200C. Using the 28 descriptors, each of the 9 biscuit samples was rated for appearance,
texture, flavour and aftertaste on 100-mm line scales (0-10). Responses were collected using
the Compusense software.

81
DSF (0%) DSF (28.6%) DSF (50%) DSF (71.4%)
A
B
D
C
Figure 4.2.1 Soy fortified sorghum and bread wheat biscuits. DSF= Defatted Soy Flour; A= bread-wheat biscuits; B= sorghum biscuits; C=
defatted soy flour 100% biscuits; D= visible white specks in sorghum biscuits.

82
Table 4.2.1 Descriptive sensory attributes used by the trained panel to evaluate fortified
biscuits
Sensory Attribute Definitions References to clarify and
anchor sensory attributes
Rating scale
Appearance
Surface colour
intensity
Colour intensity ranging
from light cream to dark
brown
Mantelli shortbread (light) =0.
Oreo chocolate biscuits (dark) =
10
Not dark = 0
Very dark = 10
Quantity of visible
white specks
Quantity of white specks
visible on the surface of a biscuit
No specks = 0
Moderate number of specks = 5 Many specks = 10
0= 5= 10=
No white specks =
10. Many white
specks = 10
Roughness of top
surface
Degree to which roughness
could be perceived on the top
surface of a biscuit
Bakers Scottish shortbread
(smooth) = 0.
Da Vinci’s cookies, fruit and nut
delight (rough) = 10
Not rough
(smooth) = 0
Very rough = 10
Evenness of surface Degree of evenness on top
surface
Bakers Scottish shortbread
(smooth) = 0.
Pyott’s cream cracker (uneven) =
10
Not uneven = 0
Very uneven = 10
Aroma/smell
Overall aroma
strength
Overall intensity of aroma of
the biscuit
No aroma = 0,
Intense aroma = 10
Baked biscuit aroma Intensity of aroma associated
with basic sugar biscuit
Marie biscuit = 5
Over-baked biscuit = 10
No baked aroma =
0, Intense baked
aroma = 10
Roasted cereal flour
aroma
Intensity of aroma associated
with cereal flour sufficiently
heated to caramelize some
sugars and starches
Uncooked cereal, maize,
sorghum or wheat flour = 0.
Oven roasted cereal, maize
sorghum or wheat (180oC for 10
minutes) = 10
No roasted cereal
flour aroma = 0.
Intense roasted
cereal flour aroma
= 10
Roasted soy bean aroma
Intensity of aroma associated with roasted soy bean.
Unroasted soy bean = 0 Oven roasted soy bean (180oC for
15 minutes) = 10.
No roasted soy bean aroma = 0
Intense roasted soy
bean aroma = 10
Heated oil aroma Intensity of aroma associated
with heated oil
Fresh sunflower oil = 0
Sunflower oil (heated 20 minutes
at 180oC) and cooled = 10
No heated oil
aroma = 0
Intense heated oil
aroma = 10

83
Table 4.2.1 continued
Sensory Attribute Definitions References to clarify and
anchor sensory attributes
Rating scale
Texture
Roughness Degree of abrasiveness of
products surface perceived
by the lips and tongue before
chewing.
Bakers Scottish shortbread
(smooth) = 0.
Da Vinci’s cookies, fruit and nut
delight (rough) = 10
Not rough
(smooth) = 0
Very rough = 10
Bumpy texture Overall amount of large
bumpy areas on surface
perceived by lips and tongue
Bakers Scottish shortbread
(smooth) = 0. Pyott’s cream
cracker (bumpy) = 10
Not bumpy = 0
Very bumpy = 10
Hardness Force required to compress a
biscuit between molar teeth
Mantelli shortbread (soft) = 0.
Oreo chocolate biscuits (hard) =
10
Not hard = 0
Very hard = 10
Crispness Force and sound with which the sample raptures
Mantelli shortbread (soft) = 0, Bakers ginger biscuits (crispy) =
10
Not crispy = 0 Very crispy = 10
Denseness Degree of compactness of
cross section of sample after
biting completely through.
Bakers ginger biscuits (not
dense) = 0. Bakers Scottish
shortbread (dense) = 10.
Not dense = 0
Very dense = 10
Dry Degree to which the sample feels dry or absorbs saliva in
mouth.
Mantelli shortbread (not dry) = 0. Pyott’s cream cracker (dry) = 10
Not dry (moist) = 0
Very dry = 10
Graininess Amount of small particles
perceived by the tongue
when the mass is gently
compressed between the
tongue and palate.
Bakers Scottish shortbread (not
grainy) = 0
Bakers digestive biscuits (grainy)
= 5
Not grainy = 0
Very grainy = 10
Coarseness Degree to which the mass
feels coarse or abrasive
during product mastication.
Bakers Scottish shortbread (not
coarse) = 0
Nice biscuits (coarse) = 10
Not coarse = 0
Very coarse = 10
Chewiness Number of chews (at 1
chew/sec) needed to masticate the sample to
consistency suitable for
swallowing.
Mantelli shortbread (not chewy)
= 0. Bakers digestive biscuits (chewy)
= 5
Not chewy = 0
Very chewy = 10
Flavour
Sweet Fundamental taste sensation
associated with sugars.
Spring water without sucrose (not
sweet) = 0
5% sucrose in spring water
(sweet) = 10
No sweet taste = 0
Intense sweet taste
= 10
Roasted soy bean
flavour
Intensity of flavour
associated with roasted soy
bean
Unroasted soy bean = 0
Oven roasted soy bean (180oC for
15 minutes) = 10
No roasted soy
bean flavour = 0
Intense roasted soy
bean flavour = 10

84
Table 4.2.1 continued
Sensory Attribute Definitions References to clarify and
anchor sensory attributes
Rating scale
Flavour
Roasted cereal
flavour
Intensity of flavour
associated with cereal flour
sufficiently heated to
caramelize some of the
starches and sugars
Uncooked cereal, maize,
sorghum or wheat flour = 0.
Oven roasted cereal, maize
sorghum or wheat (180oC for 10
minutes) = 10
No roasted cereal
flour flavour = 0.
Intense roasted
cereal flour
flavour = 10
Doughy flavour Intensity of flavour
associated with uncooked
dough
Bakers digestive biscuits (not
doughy) = 0
Uncooked dough (doughy) = 10
No doughy flavour
= 0. Intense
doughy flavour =
10
Heated oil flavour Intensity of flavour
associated with heated oil
Fresh sunflower oil = 0
Sunflower oil (heated 20 minutes
at 180oC) and cooled = 10
No heated oil
flavour = 0.
Intense heated oil
flavour = 10
Baked biscuit flavour Intensity of flavour
associated with basic sugar
biscuit
Marie biscuits = 5
Over-baked biscuit = 10
No baked flavour
= 0, Intense baked
flavour = 10
Aftertaste
Sweet aftertaste Fundamental taste sensation
associated with sugars.
Spring water without sucrose (not
sweet) = 0
5% sucrose in spring water
(sweet) = 10
No sweet taste = 0
Intense sweet taste
= 10
Gritty residue in mouth
Degree to which mouth contains small particles after
all of the sample has been
swallowed
Mantelli shortbread (not gritty) = 0.
Bakers digestive biscuits (gritty)
= 5
Not gritty = 0 Very gritty = 10
Roasted soy bean
flavour aftertaste
Intensity of flavour
associated with roasted soy
bean
Unroasted soy bean = 0
Oven roasted soy bean (180oC for
15 minutes) = 10
No roasted soy bean flavour = 0
Intense roasted soy
bean flavour = 10
Heated oil flavour Intensity of flavour
associated with heated oil
Fresh sunflower oil = 0
Sunflower oil (heated 20 minutes
at 180oC) and cooled = 10
No heated oil
flavour = 0
Intense heated oil
flavour = 10
[Bakers Scottish shortbread biscuits, “EET-SUM-MOR; Marie biscuit Bakers “Blue Label”; Bakers digestive
whole wheat biscuits; Bakers ginger biscuits (Bakers Biscuit, Rivonia, South Africa)]; Da Vinci’s cookies, fruit
and nut delight (Georgio Biscuit Factory, Port Elizabeth, South Africa); Pyott’s cream cracker (National Brands,
Bryanston, South Africa); Oreo chocolate sandwich cookies (Kraft Foods, Gallo Manor, South Africa);
Mantelli’s handmade shortbread rounds (Mantelli’s, Cape Town, South Africa).

85
4.2.2.6 Consumer acceptability
Biscuit sample preparation
Four variations of biscuits were used in this study. The different biscuits were prepared from:
100% sorghum, 100% wheat, 50% sorghum and 50% DSF, 50% wheat and 50% DSF flours.
The 100% wheat biscuit was the control. Selection of composited biscuits was based on
results obtained from Chapter 4.1, Section 4.1.3.1, that 1 biscuit of 28 g provided ≤ 7 g
protein and results from the descriptive sensory panel that inclusion of DFS should not
exceed 50% as higher levels imparted a detectable beany flavour to the biscuits. The basic
formulation and procedure described in Chapter 4.1, Sections 4.1.2.2 and 4.1.2.3 was used to
prepare biscuits. Sorghum flour was milled to a maximum 500 µm particle size to improve
the coarse and gritty texture and rough appearance of biscuits based on findings of sensory
characterization. The visual differences between biscuits made from re-milled and flour not
re-milled is shown in Figure 4.2.2. Reduced particle size increased the requirement for water
because of the higher absorption rates as a result of a larger surface area. Water was increased
to 80 ml and 180 ml/225 g flour for 100% sorghum and sorghum-soy composite biscuits,
respectively to make the dough workable (Chapter 4.1, Table 4.1.1). A 4.5 cm diameter
biscuit cutter was used to cut dough.
A B
Figure 4.2.2 Biscuits made using 100% sorghum flour. A= without re-milling. B= with re-
milling to maximum 500 µm particle size.
A B

86
Recruitment and screening
Consumers were 60 children (26 boys and 34 girls) who attended Zakhele Primary School in
Mamelodi near Pretoria, South Africa. The study was age specific so the screening selected
for 8 to 9 year old children who consumed biscuits and did not have allergies. Ethical
approval was granted by the University of Pretoria, Faculty of Agricultural and Natural
Sciences Ethics Committee. Policy guidelines by the Faculty of Education of the University
of Pretoria (Human-Vogel 2007) on the inclusion of minor children in research investigations
were observed. Permission to carry out the study was granted by the principal of Zakhele
Primary School. The childrens’ parents were informed about the purpose, procedures,
activities, risks and benefits of the study their children would be involved in, in a letter and
verbally by the School Principal. Only children who voluntarily consented and whose parents
signed the consent form allowing them to participate were included.
Orientation
A one hour orientation session was carried out on the first day of the 5 day study in the
school hall, during tea-break at 10:00. The purpose of orientation was to familiarize and teach
the children how to use the score card, a five point scale with stylized faces (Figure. 4.2.3).
The sitting arrangement was designed to divide the 60 children into 4 groups of 15 each.
Each group was allocated a red, yellow, green or blue colour. The children sat randomly at
one of 60 stations with set trays containing evaluation samples and name tags with the child’s
number and group colour.
Attribute
Rating 1 2 3 4 5
Dislike very much
Dislike a little Not sure Like a little Like very much
Figure 4.2.3 Five point facial scale used by school children for hedonic categorization of sorghum
and bread wheat biscuits

87
Two research assistants, from the University of Pretoria that can speak both English and the
mother tongue languages of the children were allocated to each group. It was explained to the
children that the faces meant that they liked very much, liked a little, were not sure, disliked a
little or disliked very much what they were eating. Two types of apples, one that children
generally liked (sweet, red) and one they generally did not like (sour, green) labeled with 3
digit blind codes were used as test examples. The children were instructed to remove the label
from the apple and place it above the face corresponding to how they felt about the apple they
had just tasted, with the liked apple’s label on a happy face and the disliked apple’s label on a
sad face. Bottled water to cleanse the pallet before and in between tasting was provided. The
session was conducted using both English and mother tongue languages. The children were
also informed that they could withdraw from the study at any point if they wanted to.
Procedure for evaluation
Evaluation of biscuits was carried out over a four day period in the children’s classrooms
with two groups in each class. Two half-hour evaluation sessions were conducted each day.
During the first session, the children were randomly presented with a set of the four types of
biscuits with three digit blinding codes on removable labels. Each ½ biscuit was in a
transparent polyethylene zip-lock type bag of 100 x 80 mm. The five point facial scale was
used for hedonic categorization. The children tasted each biscuit, starting from the biscuit on
the left to the right, removed the coding label and placed it on the score card A above the face
that corresponded with their feelings. The completed score card and the left over biscuits
were withdrawn. Each child was then provided with 2 whole biscuits of one of the four types
of biscuits, which was the test sample for the day and asked to eat and complete or eat as
much as they wished. Each of the groups received a different test biscuit. Immediately after
they finished consuming the biscuits, the left over test biscuits were withdrawn. The children
were then asked by the research assistants if they would like to eat the specific test biscuit
again the next day, to which they could answer yes, not sure or no. This was entered by the
research assistant into the B score card that had provision for this at the bottom and provided
with a second tray for the second session containing a new set of the four types of biscuits.
The children evaluated these using the same procedure and entered their responses on score
card B. The same procedure was repeated for four days at the same time, except that the test
biscuit was different for each group every day. At the end of the 4 days, each child had

88
evaluated all four types of test biscuits once and the set of four biscuits 8 times. On each of
the four days before the tests commenced, the procedure for evaluation was demonstrated to
the children by the research assistant. At the end of the study each child was rewarded with a
football, sweets and motivational cards. Additionally, the children were given a lesson on
sensory evaluation and the use of their five senses.
4.2.2.7 Statistical analysis
Data for physical and instrumental texture and colour measurements were analyzed by one
way analysis of variance (ANOVA). The statistical program used was Statgraphics Centurion
XV (Stat Point, Herndon, VA). The descriptive panels’ mean scores for sensory attributes
were determined by two-way analysis of variance ANOVA with samples as fixed effects and
panelists as random effects, using Statistica software Version 8.0 (Statsoft, Tulsa, OK).
Principal Component Analysis (PCA) of the significant sensory attributes from means across
panelists was performed using a correlation matrix with biscuit samples in rows and
descriptors in columns. Physical and instrumental texture and colour characteristic and
chemical properties (Chapter 4.1, Section 4.1.2.4) were included as supplementary variables
in PCA to establish their relationship with sensory attributes. The data for consumer
evaluation were analyzed using repeated measures analysis of variance (ANOVA). Means for
all analyses were compared using Fisher’s least significant difference (LSD). Box and
whisker plots were used to illustrate consumer hedonic score distributions for the biscuits.
4.2.3 RESULTS AND DISCUSSION
4.2.3.1 Physical Evaluation
In Chapter 4.1 Section 4.1.2.2 it was observed that sorghum and bread wheat doughs required
more water with increasing levels of DSF substitution between 28.6 and 71.4%. This may be
attributed to the ability of soy proteins to absorb high amounts of water. Similar results were
reported by Perez et al (2008) who attributed increased water absorptive properties of doughs
from gluten-soy bean blends to hydrophilic soy proteins.

89
Table 4.2.2 Effect of compositing sorghum and bread wheat with soy on the physical characteristics of the biscuits
Biscuit type Biscuit weight
(g)
Width
(mm)
Thickness
(mm)
Spread factor
Density
(g/cm3)
Sorghum /Soy biscuit
100:0 25.9e ±0.1 69.4
e ±0.7 8.3
d ±0.0 8.3
d± 0.1 0.81
71.4: 28.6 23.7d ±0.5 68.2
d ±0.3 7.7
bc ±0.2 8.9
e ±0.3 0.84
50:50 22.4c ±0.4 66.8
c ±0.3 7.5
bc ±0.1 8.9
e ±0.1 0.84
28.6:71.4 21.2b ±0.7 65.8
c ±0.9 7.4
b±0.1 8.9
e ±0.1 0.84
Wheat/ Soy biscuits
100:0 30.7g ±0.3 62.7
ab ±0.7 13.2
g±0.3 4.7
a ±0.1 0.74
71.4: 28.6 27.4f ±0.5 62.5
a ±0.2 11.6
f ±0.6 5.4
b ±0.3 0.77
50:50 24.2d ±0.7 63.5
ab ±0.3 10.3
e ±0.1 6.2
c ±0.1 0.74
28.6:71.4 21.2b± 0.5 63.6
b ±1.0 7.9
c ±0.3 8.1
d±0.4 0.84
Soy biscuit 100% 18.2a ±0.8 63.6
b±0.3 6.7
a ±0.1 9.1
f ±0.1 0.85
Values are means ±Standard deviations. Values in a column followed by different letter superscripts are significantly different at P≤0.05 as
assessed by Fisher’s least significant test.

90
Table 4.2.2 shows that increased substitution of sorghum and bread wheat flours with DSF
from 28.6 to 71.4% reduced weights of biscuits by 9 to 22% and 12 to 45%, respectively,
compared to the 100% cereal biscuits. The highest percentage (69%) weight loss was by the
100% soy biscuits. This may be explained by the high hydrophilicity of soy proteins
(Marcone and Kakuda 1999) which may have caused greater hydration of soy proteins that
made doughs dry and crumbly requiring more water to make them workable as DSF
increased (Chapter 4.1, Table 4.1.1). This may have resulted in a reduction of total solids in
such dough and the biscuits baked to lower weight because they had less dry matter. The
results in this study are similar to findings by Akubor and Ukwuru (2003) who reported a
reduction in weight of cassava-soy composite biscuits as DSF increased. It is also possible
that thermal processing increased hydrophobicity of soy proteins causing loss of high
amounts of water absorbed during dough mixing as DSF increased.
Compositing sorghum flour with 28.6 to 71.4% DSF reduced the width of sorghum biscuits
between 2% and 5.4% compared to the 100% sorghum biscuit, which had the highest overall
width (Table 4.2.2). It is possible that lateral expansion of biscuits was impeded by
denaturation of protein (Slade and Levine 1998) in DSF early in the baking process reducing
biscuit width. Similar results were reported by Maache-Rezzoug, Bouvier, Allaf and Patras
(1998) who studying biscuit dough rheology and biscuit quality, found that an increase in
protein tends to reduce the length of biscuits after baking. There was no consistent trend for
width of bread wheat biscuits.
Bread wheat biscuits had higher thickness than sorghum biscuits by between 2 and 78%. This
may partly be attributed to air which was trapped by the gluten structure developed during
mixing and kneading of the dough (Stauffer 2007) and raised biscuits during baking
increasing the thickness. Similar findings were reported by Singh and Mohammed (2007) for
reduced carbohydrate cookies with gluten-soy protein blends. Sheeting bread wheat dough
may also have increased elastic recovery of dough pieces because of gluten development
(Manohar and Rao 2002) and this may have reduced width and spread factor and increased
thickness as described by Slade and Levine (1994). Addition of soy flour diluted gluten
protein, reduced elasticity and thickness and increased the spread factor. It is also possible
that reduction in dry matter as DSF increased resulted in smaller biscuits that were less thick
and wide.

91
4.2.3.2 Instrumental texture analyses
Table 4.2.3 shows that replacement of 50% and 71.4% sorghum flour with DSF increased the
maximum stress of biscuits by between 38% and 83%, and the stress/strain ratio by 86%
and111% respectively, compared to the 100% sorghum biscuit. It is possible that increasing
maximum stress and stress/strain ratio of sorghum-DSF composite biscuits was due to
formation of relatively strong protein-protein interactions when DSF was thermally
processed. Similarly, Marcone and Kakuda (1999) reported increased aggregation of soy
bean globulin protein when it was heated. Maximum stress is an important index of biscuit
texture because it has been correlated with hardness of biscuits (Zoulias et al 2002). Biscuits
with high maximum stress values are hard, an unpleasant characteristic for biscuits. The
stress/strain ratio is important because it is indicative of brittleness (Jackson, Bourne and
Barnard 1996), a pleasant sensorial characteristic in biscuits.
Low hardness and high fracturability (strain) of 100% sorghum biscuits may be ascribed to
absence of gluten in sorghum flour. Gluten which is developed during dough mixing and
coagulated into a foam with a fibrelike network is responsible for the mechanical structure of
baked products (Goeseart, Brijs, Veraverbeke, Courtin, Grubruers and Delcour 2005).
Additionally, the high fibre content of 100% sorghum biscuits may have introduced coarse
particles which interfered with the homogeneity of doughs and biscuit structure, resulting in
lower stress and strain values. Saleem, Wildman, Huntley and Whitworth (2005) showed that
large inhomogeneities decreased stress and strain of semi-sweet biscuits. Similarly, Badi and
Hoseney (1976) reported high crumbliness and fragility of sorghum biscuits. Chiremba,
Taylor and Duodu (2009) also reported that fragility was more pronounced in wholemeal
sorghum biscuits with high bran content which were difficult to handle.
Table 4.2.3 shows that the 100% bread wheat biscuits were hard and the least fracturable of
all the biscuits. Substitution with 28.6% DSF reduced maximum stress by 20% but addition
of 50% and 71.4% DSF increased maximum stress by 34% to 194%, respectively. However,
fracture strain reduced by 13% to 195% when 28.6% to 71.4% DSF replaced bread wheat
flour. Brittleness substantially increased by 815% when 71.4% DSF replaced bread wheat
flour. Hardness in 100% bread wheat flour biscuits may be explained by the nature of the

92
Table 4.2.3: Effect of compositing sorghum and bread wheat with soy on stress and strain of biscuits
Biscuit type Fracturability
(mm)
Hardness
(N)
Stress
(kPa)
Strain
(%)
Stress/strain
(kPa)
Sorghum/Soy biscuit
100:0 0.63ab
±0.1 10.4a±2.0 163.3
a±0.02 3.56
ab±0.00 4.63
bc±0.9
71.4: 28.6 0.60a±0.1 12.3
a±3.0 154.9
a±0.02 2.86
a±0.00 5.60
c±1.4
50:50 0.70ab
±0.2 18.9ab
±5.0 226.8ab
±0.06 2.73a±0.00 8.62
d±3.1
28.6:71.4 0.63ab
±0.1 24.0ab
±6.5 299.3cd
±0.08 3.04a±0.01 9.80
d±2.1
Wheat/ Soy biscuits
100:0 2.03d±0.3 64.0
d±8.9 263.5
bc±0.04 16.65
f±0.02 1.59
a±0.2
71.4: 28.6 1.76cd
±0.2 40.7c±5.1 220.5
ab±0.03 14.74
e±0.03 1.54
ab±0.4
50:50 1.56c±0.2 53.2
c±8.7 353.4
d±0.06 12.59
d±0.01 2.85
ab±0.7
28.6:71.4 1.06b±0.2 65.5
cd±9.0 774.6
f±0.11 5.64
c±0.01 13.91
e±1.6
Soy biscuit 100% 1.06b±0.3 32.3
b±7.8 560.0
e±0.12 4.72
bc±0.02 12.41
e±4.2
Values are means ±Standard deviations. Values in a column followed by different letter superscripts are significantly different at P≤0.05 as
assessed by Fisher’s least significant test

93
bread wheat flour. Bread wheat has broken starch granules that absorb high amounts of water
during mixing (Kent and Evers 1994). It is possible that gluten in bread wheat flour, which is
an amorphous rubbery fluid during dough mixing (Hoseney, Zelezak and Lai 1986),
crosslinked to form a thermoset gel network. The gel retained water during baking and on
cooling to room temperature, existed as a hard thermoset matrix due to expansion of starch
granules (Slade and Levine 1994).
Increase in hardness and brittleness of bread wheat biscuits was probably because soy protein
that lacks the viscoelastic properties of bread wheat, disrupted the gluten network and formed
new interactions with wheat proteins that were weaker than 100% wheat flour gluten.
Similarly, Perez et al (2008) working on the effect of soy protein in soy-wheat flour
composite doughs, found that soy proteins in doughs were associated with wheat proteins
through physical interaction and covalent bonds increasing solubility of gluten proteins which
caused gluten depolymerization and network weakening. Additionally, soy protein has high
absorptive (Marcone and Kakuda 1999) properties and may have competed with wheat
proteins for water denying wheat proteins water for gluten development.
4.2.3.3 Instrumental colour evaluation
The biscuits became darker as DFS replaced sorghum and bread wheat in composite flours at
levels of 28.6 to 71.4% compared to the 100% cereal biscuits (Figure 4.2.1 and Table 4.2.4).
The L* (lightness) values decreased in sorghum and bread wheat biscuits by 3 to 14% and 41
to 65%, respectively as DFS increased. In bread wheat biscuits the a* (redness) values
increased by 81 to 100% and b* (Yellowness) values decreased by 57 to 163% compared to
the 100% bread wheat biscuit. The decrease in L* values may be an indication of higher
protein content in the biscuits with higher DSF, which may be involved in Maillard reaction
to generate the brown colour in biscuits.
Similar results were reported by Mohamed, Rayas-Duarte and Xu (2008) who found that
bread made using flours with high protein content had darker crusts compared to flours with
lower protein content. The dark colour of sorghum biscuits was partly because of red non
tannin sorghum. Dark colour of biscuits has been reported by several researchers working
with sorghum flours. For example, Chiremba et al (2009) found that wholemeal sorghum

94
Table 4.2.4 Effect of compositing sorghum and bread-wheat with defatted soy flour on the
instrumental colour parameters of biscuits
Biscuit type L* a* b* C*(chroma) h* (hue)
Sorghum/Soy biscuit
100:0 46.6e±1.1 13.0
c±0.4 7.1
bc±0.9 14.8
bc± 0.8 28.3
b ±3.2
71.4: 28.6 45.4de
±0.8 12.8c±0.1 8.6
c±0.5 15.5
bc± 0.4 34.1
d±1.4
50:50 43.6cd
±0.4 13.1c±0.2 8.7
c±0.2 15.8
bc± 0.5 33.7
cd ±0.6
28.6:71.4 40.8ab
±0.9 12.7bc
±0.3 6.6b±0.8 14.3
ab± 0.6 27.6
b ±2.5
Wheat/ Soy biscuits
100:0 69.0g±1.2 6.9
a±0.6 21.0
f±1.7 22.1
e ±1.6 71.7
f± 2.0
71.4: 28.6 48.9f±2.6 12.5
bc±0.5 13.4
e± 1.7 18.4
d±1.5 46.8
e± 3.2
50:50 44.2d±0.2 14.2
d±0.2 10.7
d±0.8 17.8
d± 0.6 37.1
d± 1.8
28.6:71.4 41.7bc
±1.2 13.8d±0.8 8.0
bc±1.0 15.9
bc± 0.7 30.1
bc± 2.6
Soy biscuit 100% 38.8a±0.3 12.1
b±0.0 4.9
a±0.2 13.1
a± 0.1 22.0
a±0.8
Values are means±Standard deviations. Values in a column followed by different letter
superscripts are significantly different at P≤0.05 as assessed by Fisher’s least significant test. 1L* = Lightness where “0” indicates darkness and “100” lightness.
2a* = Redness where positive a* = redness and negative a* = greenness
3b* = Yellowness where positive b* = yellowness and negative b* = blueness
biscuits had dark colour. Similarly, Mridula et al (2007) observed that increasing proportions
of sorghum in sorghum-wheat composite flour darkened biscuits, which resulted in decreased
L* values while a* values increased.
4.2.3.4 Descriptive Sensory Analysis
Analysis of variance F- values of the biscuits profile data of the 28 attributes scored by the
descriptive sensory panel showed significant differences (P≤0.05) between the biscuit types
for 26 attributes (Table 4.2.5). The data were further analyzed by principal component
analysis (PCA) to determine the systematic variation and underlying relationships among
physical, instrumental colour and texture and sensory attributes of the biscuits made from
composite flours of varying cereal-legume ratios. The first two principal components
explained 94% of the total variation (Figure 4.2.4). Figure 4.2.4a shows the first two principal

95
Table 4.2.5 Mean scores for sensory attributes of soy composited sorghum and wheat biscuits as evaluated by a trained descriptive sensory panel
(n=9)
Attributes
Sorghum biscuits Wheat biscuits Soy
biscuit Sample
effects
Panelist
effects Soy level (%)
Soy level (%)
0
28.6 50 71.4 0 28.6 50 71.4 100 F-values
1
Colour intensity 6.3ef±0.9 5.7cd±0.9 5.9de±1.1 6.8fg±0.8 0.5a±0.4 3.9b±1.4 5.4c±1.1 6.9gh±1.2 7.3h±1.5 130.1*** 3.64***
Visible white specks 8.6d±1.6 8.6d±0.7 8.3d±0.9 6.5c±1.1 0.2a±0.3 0.9b±1.3 0.7ab±0.7 0.9b±1.7 0.7ab±0.7 318.1*** 0.6ns
Roughness of surface 8.1c±1.7 8.0c±1.0 7.7c±0.9 5.3b±1.7 1.8a±1.3 1.6a±1.2 1.5a±1.1 1.9a±1.8 1.6a±1.4 134.4*** 1.2ns
Evenness of surface 1.5a±1.0 1.1a±0.8 1.3a±0.8 1.1a±1.1 8.0d±1.1 5.3c±2.3 4.4b± 2.1 1.7a± 1.6 1.1a±1.7 99.4*** 3.9***
Overall aroma strength 7.1b±1.1 6.6ab±1.5 7.2b±0.9 7.1b±1.0 6.4a±1.3 6.4a±1.2 6.8ab±1.0 7.2b±1.1 7.1b±1.2 6.9* 20.6***
Baked biscuit aroma 6.4d±1.1 5.9cd±0.8 6.0cd±1.1 6.0cd±1.2 4.2a±2.0 4.8ab±1.7 5.5bc±1.7 6.2cd±1.2 6.0cd±1.6 9.5*** 4.9***
Roasted cereal aroma 6.5e± 1.6 6.0e±1.0 6.1e±2.2 5.4de±2.1 2.5a±2.1 3.4ab±2.4 4.4bcd±2.3 4.7cd±2.5 4.1bc±2.7 16.9*** 7.5***
Roasted soy aroma 2.4b± 2.5 2.4b±2.2 3.1bc±2.6 4.2cd±2.5 0.4a±0.7 2.4b±2.2 4.1cd±2.7 5.1de±2.1 5.5e±2.3 2. 7*** 6.6***
Heated oil aroma 2.5bc±2.2 2.2b±1.8 2.4b±2.0 2.7bc±1.9 1.4a±1.3 2.2b±2.0 3.1bc±2.0 3.4cd±2.1 3.5d±1.8 9.2*** 16.6***
Roughness 6.7d±2.4 6.5cd±2.2 5.8c±2.3 4.2b±1.9 1.9a±1.1 1.7a±1.0 1.7a±1.0 1.9a±1.2 2.4a±1.5 44.5*** 1.2ns
Bumpy texture 2.0ab±1.5 1.4a±1.1 1.5a±1.1 1.6a±1.6 7.2d±1.8 5.1c±1.8 4.3c±2.3 2.6b±2.1 2.0ab±2.5 42.2*** 3.3***
Hard texture 3.8b±2.0 2.2a±1.3 2.6a±1.4 4.0b±1.6 4.6b±1.7 3.8b±1.6 5.6c±1.6 6.4c±1.5 6.0c±1.7 26 8*** 3.2***
Crispy texture 6.9f± 1.6 5.8e± 1.9 5.6de±1.6 6.1e± 1.1 3.8ab±1.5 3.1a± 1.7 4.9cd± 1.4 4.5bc± 1.9 4.6de± 1.7 16.8*** 2.1**
Dense texture 6.8d± 1.6 2.7a± 1.4 2.7a ±1.4 4.1b± 1.2 6.7d±1.5 6.8d± 0.9 6.3d± 0.9 6.3d± 0.9 5.3c± 1.5 84.1*** 6.7***
Values are means±standard deviations. Values in a row followed by different letter notations (a - h)
are significantly different at p ≤ 0.05 as
assessed by Fisher’s least significant test. 1Significant at *** p ≤ 0.001, **p ≤ 0.01, *p ≤ 0.05, ns, not significant.

96
Table 4.2.5 Continued.
Attributes
Sorghum biscuits Wheat biscuit Soy
biscuit Sample
effects
Panelists
effects Soy level (%) Soy level (%)
0 28.6 50 71.4 0 28.6 50 71.4 100 F-values1
Dry 7.0e ±1.1 6.6e ±1.3 6.3de±1.4 5.6cd±1.2 2.9a± 1.4 2.9a± 1.6 4.2b±1.5 4.3b±1.1 5.2c± 1.2 51 9*** 5.2***
Grainy 8.4d± 1.6 8.2d ±0.8 7.8d± 1.0 6.4c± 1.1 0.6a ±0.7 0.8a ±1.3 1.2ab±1.1 1.8b ±1.9 1.8b ±1.6 200.0*** 1.6*
Coarse 6.2e± 2.4 5.7
e ±2.0 5.9
e ±2.0 5.3
de±1.8 2.3
a± 1.6 2.5
ab±1.7 3.5
c ±1.8 3.5
bc±1.9 4.3
cd±1.6 25.4*** 5.6***
Chewy 7.5f± 1.0 6.9e± 1.1 6.5e± 1.0 5.6 d±1.2 3.5a± 1.7 3.7ab±2.0 4.5bc±1.4 4.7c±1.9 4.9cd±1.2 27.5*** 1.56*
Overall flavour strength 6.9b±1.0 6.4ab±1.0 6.7ab±1.1 6.6ab±1.0 6.5ab±1.0 6.3a±1.1 6.4ab±1.0 6.6ab±1.0 6.7ab±0.8 0.9ns 16.9***
Sweet flavor 7.0c ±0.9 6.6bc±1.0 6.7bc±1.0 6.3a ±1.0 7.1c± 0.9 6.5b ±1.2 6.5b ±1.1 6.3b ±1.1 5.6a± 1.0 11.9*** 14.3***
Baked biscuit flavour 5.7c±1.4 5.3bc±1.4 5.4bc±0.9 5.5bc±1.6 4.2a±2.0 4.8ab±1.3 5.4bc±1.3 5.7c±1.0 5.9c±1.7 5.3*** 6.7***
Roasted cereal flavour 6.3d ±1.4 6.0d±1.7 5.7d ±1.9 5.3cd±2.3 2.4a± 2.1 3.3ab±2.2 4.1b± 2.2 4.5bc±2.3 4.4bc±2.7 20.2*** 10.2***
Roasted soy flavour 1.4ab±1.7 1.6bc±1.8 2.6cd±2.5 3.8ef ±2.4 0.3a ±0.4 1.7bc±2.0 3.2de±2.3 4.2ef± 2.2 4.5f ±2.7 19.4*** 5.7***
Doughy flavor 0.6a ±1.0 0.5a ±0.6 0.5a± 0.6 0.7a ±0.8 6.9d± 2.3 3.6c±2.7 2.7b ±2.2 1.1a ±1.0 1.1a ±1.8 59.1*** 3.3***
Sweet aftertaste 5.9bc±1.6 5.7bc±1.6 5.7bc±1.4 5.6ab±1.5 6.4c ±1.5 5.6ab±1.9 5.6ab±1.7 5.4ab±1.8 4.7a ±1.4 8.5* 28***
Gritty residue in mouth 8.1e± 1.7 7.9 e±1.0 7.1d ±1.2 5.7c± 1.7 0.5a± 0.5 0.8ab±1.4 1.2b ±1.0 1.4b ±1.8 1.2b ±1.1 178*** 1.45*
Roasted soy aftertaste 1.0ab±1.1 1.6bc±1.9 2.1cd±2.2 3.4fg±2.1 0.2a± 0.3 1.4bc±1.9 2.5de±2.2 3.1ef±2.6 3.7g ±2.5 13.1*** 5.2***
Heated oil aftertaste 1.6ab±1.9 1.4a ± 1.4 1.8ab± 1.8 2.0ab±1.7 1.2a± 1.2 1.3a± 1.5 1.9ab±1.7 2.3b±
1.9
2.4b± 1.8 0.7ns 26.0***
Values are means±standard deviations. Values in a row followed by different letter notations (a - h)
are significantly different at p ≤ 0.05 1Significant at *** p ≤ 0.001, **p ≤ 0.01, *p ≤ 0.05, ns, not significant.

97
Wheat 100%
Wheat 71.4%
Wheat 50%
Wheat 28.6%
Soy 100%
Sorghum 28.6%
Sorghum 50%
-12 -10 -8 -6 -4 -2 0 2 4 6 8
Factor 1: 60.65%
-8
-6
-4
-2
0
2
4
6
8F
acto
r 2
: 3
2.9
9%
Wheat 100%
Wheat 71.4%
Wheat 50%
Wheat 28.6%
Soy 100%
Sorghum 28.6%
Sorghum 50%
Sorghum 71.4%
Sorghum 100%
Active
Suppl.
Bumpy T
Hard T
Dense T
Sweet F
Baked biscuit F
Doughy F
*L*
*a*
*b*
*Hardness
*Weight
*Moisture
-1.0 -0.5 0.0 0.5 1.0
Factor 1 : 60.65%
-1.0
-0.5
0.0
0.5
1.0
Fa
cto
r 2
: 3
2.9
9%
Bumpy T
Hard T
Dense T
Sweet F
Baked biscuit F
Doughy F
*L*
*a*
*b*
*Hardness
*Weight
*Moisture
Sweet AT
Fructurability
*Thickness
Uneven surface AP
Roast soy bean AT Roast soy bean FRoast soy bean A
*Fibre
Heated oil A*Protein
*S/F
Overall A
Baked biscuit A
Colour intensity
Rough APWhite specks
Gritty residueRough T
*Width Grainy textureChewy T
Coarse TRoast cereal A
Roast cereal FDry T
Crispy T
(b)
Figure 4.2.4 Principal component analysis (correlation matrix) of sorghum and bread wheat biscuits
composited with soy at levels of 0, 28.6, 50, 71.4 and 100%. (a) Plot of the first two principal component scores of the sorghum and bread wheat biscuits, (b) Plot of the first two principal
component loading projections of sensory attributes, A=aroma, T= texture. F= flavour, AP=
appearance, AT=aftertaste.
(a)

98
component scores of the sorghum and wheat biscuits. PC1 explained 61% of the total
variation and separated the biscuits based on their cereal component with the wheat biscuits
to the left and the sorghum biscuits to the right. PC2 accounted for 33% of the total variation
and separated soy and cereals, with high soy content biscuits at the top and high cereal
content biscuits at the bottom.
The attribute loadings for the first two principal components (Figure 4.2.4b), show the
relationship between the sensory attributes, physical, instrumental colour and texture
characteristics of the biscuits. The 100% DFS and sorghum and bread wheat biscuits
substituted with 71.4% DFS were associated with the roasted soy bean flavour, aroma and
aftertaste, baked biscuit flavour and aroma, heated oil aroma and overall aroma intensity
which were positively correlated and were also correlated with sensory colour intensity,
instrumental colour a* value, protein and crude fibre content. All these characteristics were
negatively correlated with sweet flavour and aftertaste, L* and b* colour values and
thickness.
Beany flavour is commonly associated with food legumes. In soy beans, enzymatic
breakdown by lipoxygenases or autoxidation of linoleic and linolenic acid produces
hydroperoxides such as ketones, aldehydes and alcohols that may be responsible for the
beany, grassy, painty, or cardboardy flavour which discourages soy consumption (Boge et al
2009). Examples of such compounds have been identified by some researchers in soy
products. For instance, Mohsen et al (2009) categorized furans identified in wheat biscuits
fortified with isolated soy protein as 2-ethyl-5methylfurans and 2-pentylfurans. 2-pentyl
furans were also identified in soy bean oil by Chang (1979). Sorghum biscuits with DSF
content above 50% had burnt flavour and odour notes described by panelists as baked biscuit.
It is possible that the high level of protein contributed by DSF readily reacted with sugar in
the Maillard reaction, hence the positive correlation with protein content and negative
correlation with sweet flavour and aftertaste in this study. Similarly, Mohsen et al (2009)
reported biscuit-like and burnt odour in biscuits when 2-ethyl-5-methylpyrazine increased
after substituting wheat with 20% soy protein isolate.
High intensity of browning was perceived in biscuits with high DSF and was positively
correlated with a* (redness) colour values and negatively correlated with L* (lightness) and

99
b* (yellowness) values. The dark colour on the surface of the biscuits may have been caused
by Maillard reaction that produces brown polymers, which contribute to the surface
colouration of biscuits (Manley 1991) as explained earlier. Additionally, 5-
hydroxymethylfurfural, a compound formed from degradation of the Amadori product
leading to formation of brown polymers, was identified in a model cookie/biscuit during
baking by Ait-Ameur, Rega, Giampaoli, Trystram and Birlouez-Aragon (2008). The sorghum
biscuits also scored high on sensory colour intensity (Table 4.2.5) because of red non-tannin
sorghum flour as already explained. Similarly, working on traditional African sorghum foods,
Anyango (2009) reported dark colour intensity of ugali, a stiff porridge made from red
sorghum flour.
The sorghum biscuits were characterized with rough appearance, gritty, grainy, coarse and
chewy texture, which were positively correlated with each other and also positively
correlated with roasted cereal flavour and aroma, crispy and dry textures and white specks.
These attributes were negatively correlated with moisture content, instrumental texture
(hardness and fracturability). The roasted cereal flavour and aroma associated with sorghum
biscuits with DSF replacement of 50% and below may be attributed to derivatives of the
Maillard reaction favoured by the high temperature and low moisture conditions of baking.
Similar findings were reported by Bredie, Mottram, Hassell and Guy (1998) who noted the
development of roasted/toasted flavour in thermally treated maize and wheat flours when
pyrazines increased.
The rough characteristics for sorghum biscuits may be due to the hard, corneous endosperm
cells of sorghum grain that remain intact during milling (Rooney and Miller 1982). After
baking, it might be a result of sorghum starch granules that are encapsulated by hydrophobic
cross-linked kafirins (Munck 1995), which do not absorb adequate water for expansion and
are perceived as gritty (Kebakile, Rooney, De Kock and Taylor 2008). Similar results have
been reported by researchers working on sorghum biscuits. For instance, Badi and Hoseney
(1976) reported that cookies from sorghum and pearl millet flours were mealy and gritty but
demonstrated that grittiness could be reduced by increasing dough pH using sodium
carbonate. Chiremba et al (2009) also reported that grittiness was more pronounced in
biscuits made from tannin sorghum than non-tannin sorghum flours. The white specks also
visible in Figure 4.2.1, which were positively correlated with the rough and coarse

100
characteristics, may have been contributed by the bran fragments that were not completely
milled. Kebakile et al (2008) also reported the presence of coloured specks in porridge made
using sorghum flour which they attributed to the pericarp of the sorghum kernel.
The sorghum biscuits were also associated with crispiness and dry texture which were
negatively correlated with instrumental texture characteristics of hardness and fracturability.
Fracturability, the panel’s descriptor for crispness was explained earlier. The dry texture may
be ascribed to the sorghum doughs absorbing the least amount of water compared to all other
composite doughs (Chapter 4.1, Table 4.4.1). This may be due to the hydrophobic nature of
kafirin proteins of the endosperm (Duodu et al 2003, Munck 1995), which probably expelled
most of the water as the temperature, increased during baking (Belton et al 2006).
Crispness in sorghum biscuits was negatively correlated with moisture content, while in
wheat biscuits moisture was negatively correlated with crisp texture. The sensory panel
scores (Table 4.2.5) also show that sorghum biscuits with lower moisture content were 123%
more crisp than wheat biscuits. The increase of crispness scores by 58% when bread wheat
was substituted with 50% DSF was probably due to dilution of gluten with soy protein hence
reduced water holding capacity, as explained earlier. Sensitivity of crispness to moisture has
been reported by researchers working on biscuits. Piazza and Masi (1997) using a trained
panel reported that the sensory scores of crispness decreased continuously as the moisture
content of cookies increased, similar to the findings of this study.
The bread wheat biscuits were described as doughy and dense, attributes that were positively
correlated with moisture content of the biscuits. The doughy texture was probably caused by
the damaged starch and high protein content of bread wheat absorbing high amounts of water
during dough mixing as described by Kent and Evers (1994). Retention of moisture during
baking, may have imparted the dense and doughy texture. These findings are in agreement
with Slade and Levine (1994), who reported that biscuits made from flours with increased
damaged starch baked to higher moisture content. The hard texture was probably due to the
stronger gluten of hard wheat flours, which impart toughness to biscuits (Hoseney 1994).

101
4.2.3.5 Consumer acceptability
Repeated measures analysis of variance, an application which simultaneously compares
repeated measurements on the same subjects revealed a significant effect for biscuits, day,
session, and session x group (Table 4.2.6). Table 4.2.7 shows that biscuits made from
sorghum substituted with 50% DSF and 100% bread wheat were slightly higher in overall
liking (5 to 6%) than the 100% sorghum biscuits when they were evaluated by 8 to 9 year old
school children. There was no difference in liking between 50% DSF substituted bread wheat
biscuits and 100% bread wheat, 100% sorghum and 50% DSF substituted sorghum biscuits.
This may be explained by the fact that the children were not familiar with sorghum as a basic
ingredient in biscuits as biscuits on the market are made using wheat flour. A study by Delk
and Vickers (2006) showed that children preferred refined wheat bread, which they were
more familiar with, to whole wheat bread. It is also likely that compositing with DSF
imparted positive characteristics that improved liking scores of 1:1 sorghum: DSF biscuits
compared to the 100% sorghum biscuits. Results from the descriptive sensory panel (Table
4.2.5) show that the 50% DSF substituted sorghum biscuits were less hard, dense and chewy
and more crisp than the 100% sorghum biscuits by 46, 151, 27 and 19%, respectively.
Figure 4.2.5 shows that all the biscuits had moderately high initial mean hedonic scores of
80% and above and these were sustained during the entire study period. This is an indication
that repeated exposure did not change the children’s liking of biscuits over time. A possible
explanation is that biscuits were made from staple foods, sorghum and bread wheat, which
have sustained acceptance. Findings from previous studies have demonstrated that time
preference curves for staple foods, which are moderately liked are flat because there is no
significant decrease following repeated servings (Hetherington, Pirie and Nabbs 2002). For
instance, a pioneer repeated exposure study conducted by Siegel and Pilgrim (1958) found
that palatability of staple foods such as dairy products, and bread did not change over time,
while foods that are not staples such as vegetables declined showing that staple foods are
more resistant to boredom than other foods. A similar study by Hetherington et al (2002)
confirmed that a staple food, bread and butter was tolerated well and there was no change in
liking over a 3 week exposure period compared to chocolate, a food that is not a staple that
declined in liking.

102
Table 4.2.6 Repeated Measures Analysis of Variance (ANOVA) of 8 to 9 year old children’s
ratings for sorghum and bread wheat biscuits composited with DSF
Source of variation Sums of
Squares
(SS)
Degrees of
freedom
(d.f)
Mean
squares
(MS)
F P
Group 53.71 3 17.90 0.99 ns*
Biscuit 16.09 3 5.36 3.35 <0.05
Biscuit/group 15.08 9 1.68 1.05 ns
Day 17.32 3 5.77 4.21 <0.01
Day/group 9.11 9 1.01 0.74 ns
Session 34.34 1 34.34 18.71 <0.001
Session/group 25.27 3 8.42 4.59 <0.01
Biscuit/day 7.06 9 0.78 0.69 ns
Biscuit/day/group 28.39 27 1.05 0.92 ns
Biscuit/session 0.39 3 0.13 0.10 ns
Biscuit/session/group 10.55 9 1.17 0.90 ns
Day/session 6.43 3 2.14 2.20 ns
Day/session/group 10.81 9 1.20 1.23 ns
Biscuit/day/session 4.33 9 0.48 0.46 ns
Biscuit/day/session/group 30.60 27 1.13 1.08 ns
*not significant.
Table 4.2.7 The effect of compositing sorghum and bread wheat with DSF on overall liking
of biscuits by 8 to 9 year old children
Biscuit type Hedonic score
Sorghum: (100) 4.03a ± 0.46
Sorghum: Soy (50:50) 4.28b ± 0.39
Wheat: (100) 4.23b ± 0.31
Wheat: Soy (50:50) 4.19ab
± 0.10
Values are mean±SD. Values followed by different letter superscripts in a column are
significantly different at P≤0.05 as assessed by Fisher’s least significant test. Overall liking
ratings 1= dislike very much, 2= dislike a little, 3= not sure, 4= like a little, 5= like very
much. Consumers n=60.

103
Figure 4.2.5 The effect of compositing sorghum and bread wheat with DSF on 8 to 9 year
old children’s (n=60) ratings of biscuits over time. Means and standard deviations: means in
all graphs are not significantly different at p≤0.05. The dark shaded area is the higher
percentile and represents the value above which 75% of the ratings fell. The light shaded area
is the lower percentile and represents the area where 25% of the ratings fell. The median is
the thin line between the two shaded areas where 50% of the values fell above and 50%
below. Hedonic rating scale, 1= dislike very much, 2= dislike a little, 3= not sure, 4= like a
little, 5= like very much.
a)Sorghum: (100) b) Sorghum: soy (50:50)
c) Wheat: (100) d) Wheat: soy (50:50)

104
It is also likely that the biscuits were sustainably liked by the children. A study by
Stubenitsky, Aaron, Catt and Mela (1999) demonstrated that consumer hedonic ratings for
pork sausages and milk chocolate snack bars did not show any change in preference and did
not decrease with time, suggesting a generally high and sustained consumer acceptance over
an extended period.
It is possible that initial hedonic ratings of the biscuits may have predicted long-term
acceptability of the biscuits. Similarly, Goldman (1994) conducted a repeated consumption
test of breakfast cereals and the hedonic scores were consistent over the 5 day test. Kramer,
Lesher and Meiselman (2001) also observed that for food items that were eaten repeatedly,
the difference between ratings for the first time the food was eaten was minimal compared to
subsequent ratings.
The distribution along the bar line of the graph explains agreement among consumers (Figure
4.2.5). The short distribution of scores along the bar graphs for this study is also an indication
that generally there was agreement among the children over the scores for all the biscuits and
the results obtained were generally consistent. These results agree with the findings of Leon
et al (1999) for a study using five varieties of biscuits dressed with different types of jams,
which showed that children aged 8 to 10 years are consistent when using hedonic
categorization to evaluate food samples. Additionally, most research protocols expose
children only once to a novel food given in small amounts which are not representative of the
product (Popper and Kroll 2003). In this study, children were exposed to the product nine
times including the test biscuit making it more repeatable and it is likely that the results are a
true reflection of the product’s potential.
Figure 4.2.6 shows that more than 80% of the children expressed the desire to consume all
the types of biscuits again. Similarly, consumers in a study by Chen, Weingartner and Brewer
(2003) expressed positive attitudes about soy foods after evaluating soy ingredient containing
cookies, indicating that they were not bored with the biscuits. Measuring desire to consume a
food again is a method of determining whether consumers are bored with a product
(Zandstra, Weegels, Van Spronsen and Klerk 2004).

105
Table 4.2.6 shows there was a significant (p= ≤0.001) session effect. This is because the first
session had higher scores than the second (data not shown). It may be that short lived fatigue
caused by the monotony and length of the experimental procedure caused the change because
the same biscuits were always rated higher the following day during the first session. In a
similar study, Sulmont-Rossé, Chabanet, Issanchou and Koster (2008) demonstrated that
repeated exposure can produce experimental boredom leading to low scores.
4.2.4 CONCLUSIONS
Compositing sorghum and bread wheat with defatted soy flour at 1:1 ratio imparts positive
characteristics associated with biscuits such as increased spread factor and crispy texture and
reduced hard, dense and chewy texture, but higher proportions of soy add the beany flavour.
Sorghum and bread wheat biscuits, made from staples that African children are familiar with,
fortified with defatted soy flour at a 1:1 ratio have a moderately high acceptability to 8 to 9
year old school children and may retain their acceptance over conditions of repeated use.
Hence, they have the potential to be protein rich supplementary foods to alleviate PEM
malnutrition in Africa.
Figure 4.2.6 The effect of compositing sorghum and bread wheat with DSF on
children’s (n=60) desire to consume biscuits again.

106
4.3.5 REFERENCES
AACC International. 2000. Approved Methods of the American Association of Cereal
Chemists, 10th Ed. Methods 10-50D. The Association: St. Paul, MN.
Ait-Ameur, L. A., Rega, B., Giampaoli, P., Trystram, G., and Birlouez-Aragon, I. 2008. The
fate of furfurals and other volatile markers during the baking process of a model cookie. Food
Chem. 111:758-763.
Akubor, P. I., and Ukwuru, M. U. 2003. Functional properties and biscuit making potential of
soybean and cassava flour blends. Plant Foods Hum. Nutr. 58:1-12.
Anyango, J. 2009. Improvement in the protein quality of African sorghum foods through
compositing with cowpea. MSc Dissertation. University of Pretoria: Pretoria.
ASTM International. 2003. Approved Standards of the American Society for Testing and
Materials. Designation: E 790 - 03. Standard test methods for flexural properties of
unreinforced and reinforced plastics and electrical insulation materials. ASTM international:
West Conshohocken, PA.
Awadelkareem, A. M, Mustafa, A. I., and El Tinay, A. H. 2008. Protein mineral content and
amino acid profile of sorghum flour as influenced by soybean protein concentrate
supplementation. Pakistan J. Nutr. 7:475-479.
Badi, S. M., and Hoseney, R. C. 1976. Use of sorghum and pearl millet flours in cookies.
Cereal Chem. 53:733-738.
Baltsavias, A., and Jurgens, A. 1997. Factors affecting fracture properties of short-dough
biscuits. J. Texture Stud. 28: 205-219.
Belton, P. S., Delgadillo, I., Halford, N. G., and Shewry, P. R. 2006. Kafirin stracture and
functionality. J. Cereal Sci. 44:272-286.
107
Boge, E. L., Boylston., T. D., and Wilson., L. A. 2009. Effect of cultivar and roasting method
on composition of roasted soy bean. J. Sci. Food Agric. 89:829-826.
Bookwalter, G. N., Kirleis, A. W., and Mertz E. T. 1987. In vitro digestibility of protein in
milled sorghum and other processed cereals with and without soy-fortification. J. Food Sci.
52: 1577-1579.
Bredie, W. L. P., Mottram, D. S., Hassell, G. M., and Guy, R. C. E. (1998). Sensory
characteristics of the aromas generated in extruded maize and wheat flour. J. Cereal Sci.
28:96-106.
Chandrashekar, A., and Kirleis, A. W. 1988. Influence of protein on starch gelatinization in
sorghum. Cereal Chem. 65:457-462.
Chang, S. 1979. Flavor and Flavor stability in foods. J. Am. Oil Chem. Soc. 56:908A-911A.
Chen, D. J., Weingartner, K., and Brewer, M.S. 2003. Consumer evaluation of soy ingredient
–containing cookies. J. Food Qual. 26:219-229.
Chiremba C., Taylor, J. R. N., and Duodu, K. G. 2009. Phenolic content, antioxidant activity
and consumer acceptability of sorghum cookies. Cereal Chem. 86:590-594.
Delk, J., and Vickers, Z. 2006. Determining a series of whole wheat difference thresholds for
use in a gradual adjustment intervention to improve children’s liking of whole-wheat bread
rolls. J. Sensory Stud. 22:639-652.
Duodu, K. G., Taylor, J. R. N., Belton, P. S., and Hamaker, B. R. 2003. Factors affecting
sorghum protein digestibility. J. Cereal Sci. 38:117-131.
Einstein, M. A. 1991. Descriptive techniques and their hybridization. Pages 317-338 in:
Sensory Science Theory and Applications in Foods. H. T. Lawless and B. P. Klein, eds.
Marcel Dekker: New York.

108
Goeseart, H., Brijs, K., Veraverbeke, W. S., Courtin, C. M., Grubruers, K., and Delcour, J. A.
2005. Wheat flour constituents: How they impact on bread quality and how to impact their
functionality. Trends Food Sci. Tech. 16:12-30.
Goldman, A. 1994. Predicting product performance in the market place by immediate- and
extended-use sensory testing. Food Technol. 48 (10):103-106.
Guinard, J. 2001. Sensory and consumer testing with children. Trends Food Sci. Technol.
11:263-273.
Hetherington, M.M., Pirie, L. M., and Nabbs, S. 2002. Stimulus satiation: Effects of repeated
exposure to foods on pleasantness and intake. Appetite 38:19-28.
Hoseney, R. C. 1994. Principles of Cereal Science and Technology. 2nd
Ed. American
Association of Cereal Chemists: St. Paul, MN. Pp 1-305.
Hoseney, R. C., Zelezak, K., and Lai, C. S. 1986. Wheat gluten: a glassy polymer. Cereal
Chem. 63:285-286.
Human-Vogel, S. 2007. Policy guidelines on the inclusion of minor children in research
investigations. Faculty of Education, University of Pretoria. www.up.za. Accessed July 2008.
International Crops Research Institute for the Semi Arid Tropics (ICRISAT). Crops:
Sorghum. 2009. www.icrisat.org/sorghum/sorghum.htm. Accessed November 2009.
Jackson, C. J., Bourne, M. C., and Barnard, J. 1996. Optimization of blanching for crispness
of banana chips using response surface methodology. J. Food Sci. 61:165-166.
Joint United Nations Programme on HIV/AIDS (UNAIDS) and World Health Organization
WHO. 2009. Aids Epidemic Update. www.unaids.org. Accessed June 2010.

109
Kebakile, M. M., Rooney L. W., De Kock, H. L., and Taylor, J. R. N. 2008. Effects of
sorghum type and milling process on the sensory characteristics of sorghum porridge. Cereal
Chem. 85: 307-313.
Kent, N. L., and Evers, A. D. 1994. Technology of Cereals: An introduction for students of
Food Science and Agriculture. 4th
Ed. Elsevier Science: Oxford. Pp 78-190.
Kramer, F. M., Lesher, L. L., and Meiselman, H. L. 2001. Monotony and choice: Repeated
serving of the same item to soldiers under field conditions. Appetite 36:239-240.
Lawless, K. B., and Heymann, H. 1998. Sensory Evaluation of Food: Principles and
Practices. Aspen Publishers: Gaithersburg, ML. Pp 39-49.
Leon, F., Couronne, T., Marcuz, M. C, Koster, E. P. 1999. Measuring food liking in children:
A comparison of non-verbal methods. Food Qual. Pref. 10:93-100.
Maache-Rezzoug, Z., Bouvier, J., Allaf, K., and Patras, C. 1998. Effect of principle
ingredients and rheological behavior of biscuit dough on quality of biscuits. J. Food Eng.
35:23-42.
Manley, D. 1991. Technology of Biscuits, Crackers and Cookies. 2nd
Ed. Ellis Harwood:
Chichester. Pp 118-132.
Manohar, R. S., and Rao, H. 2002. Interrelationships between rheological characteristics of
dough and quality of biscuits: Use of elastic recovery of dough to predict biscuit quality.
Food Res. Int. 35:807-813.
Marcone, F. M., and Kakuda, Y. 1999. A comparative study of the functional properties of
amaranth and soy bean globulin. Nahrung 43:S368-373.
McGiure, R. G. 1992. Reporting objective colour measurements. Horticultural. Sci. 27:1254-
1255.

110
McWatters, K. H. 1978. Cookie baking properties of defatted peanut, soybean and field pea
flours. Cereal Chem. 55:853-863.
Mohamed, A., Rayas-Duarte, P., and Xu, J. 2008. Hard red spring wheat /C-TRIM 20 bread:
formulation, processing and texture analysis. Food Chem. 107:516-524.
Mohsen, M. S., Fadel, H. H. M., Bekhit, M. A., Edris, A. E., and Ahmed, Y. S. 2009. Effect
of substitution of soy protein isolate on aroma volatiles, chemical composition and sensory
quality of wheat cookies. Int. J. Food Sci. Tech. 44:1705-1712.
Mridula, D., Gupta, R. K., and Manikantan. M. R. 2007. Effect of incorporation of sorghum
flour to wheat flour on quality of biscuits fortified with defatted soy flour. Am. J. Food
Technol. 2:428-434.
Muller, O., and Krawinkel, M. 2005. Malnutrition and health in developing countries. Can.
Med. Assoc. J. 173:279-286.
Munck, L. 1995. New milling technologies and products: Whole plant utilization by milling
and separation of the botanical and chemical components. Pages 186-193 in: Sorghum and
Millets: Chemistry and Technology. D. A. V. Dendy, ed. American. Association of Cereal
Chemists: St. Paul, MN.
Munoz, M. A., Szczesniak, A. S., Einstein, M.A., and Schwartz, N. O. 1992. The texture
profile. Pages 35-51 in: Manual for Descriptive Analysis Testing for Sensory Evaluation. R.
C. Hootman, ed. American Society of Materials and Testing Publication: Philadelphia, PA.
Perez, G., Ribotta, P. D., Steffolani, M. E., and Leon, A. E. 2008. Effect of soybean proteins
on gluten depolymerisation during mixing and resting. J. Sci. Food Agric. 88:455-463.
Piazza, L., and Masi, P. 1997. Development of crispness in cookies during cooking in an
industrial oven. Cereal Chem. 74:135-140.

111
Popper, R., and Kroll, J. J. 2003. Conducting sensory research with children. Food Technol.
57 (5):60-65.
Rooney, L. W., and Miller, F. R. 1982. Variation in the structure and kernel characteristics of
sorghum. Pages 143-162 in: Proceedings of the International Symposium on Sorghum Grain
Quality. L. W. Rooney and D. S. Murty, eds. ICRISAT: Pantacheru, A. P., India.
Sablani, S. S., Marcotte, M., and Baik, O. D. 1998. Modeling of simultaneous heat and water
transport in the baking process. Lebensm.Wiss. Technol. 31:201-209.
Saleem, Q., Wildman, R. D., Huntley, J. M., and Whitworth, M. B. 2005. Material properties
of semi-sweet biscuits for finite element modelling of biscuit cracking. J. Food Eng. 68:19-
32.
Siegel, P. S., and Pilgrim F. J. 1958. The effect of monotony on the acceptance of food. Am.
J. Psychol. 4:756-759.
Singh, M., and Mohamed, A. 2007. Influence of gluten-soy protein blends on the quality of
reduced carbohydrate cookies. Lebensm. Wiss. Technol. 40:353-360.
Slade, L., and Levine, H. 1994. Structure-function relationships of cookie and cracker
ingredients. Pages 227-252 in: The Science of Cookie and Cracker Production. H. Faridi, ed.
Chapman and Hall: New York.
Stauffer, C. E. 2007. Principles of dough formation. Pagesg 299-332 in: Technology of
Breadmaking, S. P. Cauvain, and L. S. Young, eds. Springer Science+Business Media, LLC:
New York.
Stubenitsky, K., Aaron, J. I., Catt, S. L., and Mela, D. J. 1999. Effect of information and
extended use on the acceptance of reduced-fat products. Food Qual. Pref. 10:367-376.
Sulmont-Rossé, C., Chabanet, C., Issanchou, S., and Koster, E.P. 2008. Impact of the arousal
potential of uncommon drinks on the repeated exposure effect. Food Qual. Pref. 19:412-420.
112
Taylor, J. R. N. 2004. Grain production and consumption: Africa. Pages 70-78 in: Encyclopedia
of Grain Science. C. Wrigley, H. Corke, and C. E Walker, eds. Elsevier Science: London.
Vittadini, E and Vodovotz, Y. 2003. Changes in the physicochemical properties of wheat-and
soy – containing breads during storage as studied by thermal analyses. J. Food Sci. 68:2022-
2029.
Wiejzen, P. L. G., Zanstra, E. H., Alfieri, C., and de Graaf, C. 2008. Effects of complexity
and intensity on sensory specific satiety and food acceptance after repeated exposure. Food
Qual. Pref. 19:349-359.
Zandstra, E. H., Weegels, M. F., Van Spronsen, A. A., and Klerk, M. 2004. Scoring or
boring? Predicting boredom through repeated in-home consumption. Food Qual. Pref.
15:549-557.
Zoulias, E. 1., Oreopoulou, V., and Tzia, C. 2002. Textural properties of low fat cookies
containing carbohydrate or protein-based fat replacers. J. Food Eng. 55:337-342.

113
4.3 Effect of compositing with soy on the protein nutritional quality of sorghum
biscuits determined by rat bioassay

114
ABSTRACT
This study was conducted to evaluate the protein nutritional quality of sorghum-soy
composite biscuits and their potential to support growth, compared to unfortified sorghum
biscuits. Three isonitrogenous diets of 8% protein made from the two types of sorghum
biscuits and casein as a reference were fed to male Sprague Dowley weanling rats. The
indices of protein quality determined were Protein Efficiency Ratio (PER), Food Efficiency
Ratio (FER), True and Apparent Protein Digestibility, Biological Value (BV), Net Protein
Utilization (NPU) and Protein Digestibility Corrected Amino Acid Score (PDCAAS). The
PER and FER for the fortified sorghum biscuit diet were the same as the casein diet and zero
for the 100% sorghum diet. Faecal bulk for the 100% sorghum diet was 1.5 times higher and
faecal protein 1.5 to 2.4 times higher than the fortified sorghum and casein diets. True
digestibility for all the diets was high, between 88 and 95%. BVs for 100% sorghum biscuit
were 15 to 20% higher than fortified sorghum and casein diets and NPU value was 16%
higher than fortified sorghum. Casein had PDCAAS of 1.0 and fortified sorghum biscuits
0.80 to 0.87, considered acceptable for pre-school and school children. The rat is a poor
model for determination of sorghum protein digestibility because it digests sorghum protein
very efficiently. It appears that 100% sorghum biscuits do not support growth in rats.
However, fortification with soy substantially improves PER of sorghum biscuits and by
extrapolation, could support growth of school age children if used as a supplementary food.

115
4.3.1 INTRODUCTION
The most serious deficiency diseases resulting from under-nutrition among children in
developing countries are the various forms of Protein Energy Malnutrition (PEM) (Walker,
1990, Muller and Krawinkel 2005). The Human Immunodeficiency Virus/Acquired Immune
Deficiency Syndrome (HIV/AIDS) epidemic has aggravated the situation in sub-Saharan
Africa, which accounts for 91% of new infections among children worldwide and has an
estimated 14.1 million AIDS orphans (Joint United Nations Programme on HIV/AIDS/
World Health Organization (UNAIDS/WHO) 2009). A dietary staple such as sorghum that is
readily available in sufficient quantities in the semi-arid and arid zones found in most of
Africa (ICRISAT 2009) could be used in protein-rich supplementary foods for children such
as sorghum-legume composite biscuits to help alleviate PEM.
In Chapter 4.1 Section 4.1.4 it was shown that substituting sorghum or bread wheat with 50%
defatted soy flour dramatically improved the protein quality of biscuits. For example,
compared to the 100% sorghum biscuits, the protein content and in vitro protein digestibility
were 168%, and 170% higher. Lysine and reactive lysine contents increased by 221% and
257% per 100 g protein compared to the 100% sorghum biscuit. However, it has been stated
that the most sensitive assessment of protein quality is achieved by clinical studies or animal
assays that measure growth or metabolic indicators (Boutrif 1991). The WHO (2007) has
given high priority to the use of animal models for protein quality research because animals
can be controlled more effectively than humans, over longer periods and results can be
extrapolated to human requirements. Additionally, the nitrogen balance method using animals
is necessary for predicting true digestibility of proteins in humans for use in computing the
Protein Digestibility Corrected Amino Acid Score (PDCAAS) (FAO/WHO 1991, WHO
2007).
Studies on sorghum protein quality have been conducted using in vivo assays in both humans
and animals and shown that the overall effect of cooking sorghum is reduction in digestibility
and enlargement of faecal volume. For example, a study by MacLean et al (1981)
demonstrated that cooked whole grain sorghum fed to preschool children did not support
growth, had apparent digestibility of 46% and gave stool weight 3 times higher than the
control casein diet. Eggum, Monowar, Bach Knudsen, Munck and Axtell (1983) using a rat

116
study also reported a reduction in true protein digestibility (TPD) and increase in biological
value (BV) of products made from cooked compared to uncooked sorghum foods. However,
high apparent protein digestibility of 81% and 74% were achieved when sorghum grain was
decorticated and extrusion cooked (MacLean, De Romana, Placko and Graham 1983) and
fermented (Graham, MacLean, Morales, Hamaker, Kirleis, Mertz and Axtell 1986),
respectively.
Studies have shown that the young rat is more efficient in digesting sorghum protein than
children. Evaluating the digestibility of sorghum proteins, Axtell et al (1981) showed that
whole grain sorghum had 80% digestibility in rats. Bach Knudsen, Kirleis, Eggum and
Munck (1988a) further established that white non-tannin sorghum had 60% higher true
digestibility than red tannin sorghum. Soy protein quality was also determined using a rat
bioassay by Vasconcelos et al (2001) who demonstrated that heat treatment inactivates
antinutrients in soy bean which had a true digestibility of 51 to 60% when raw and 78.3%
after cooking.
Notwithstanding possible drawbacks, it appears using a rat model is necessary to determine
the efficacy of the formulated soy fortified sorghum biscuits as protein supplements for
alleviate PEM. The objective of this study was therefore to determine the protein nutritional
quality and effect on growth of sorghum-soy composite biscuits compared to unfortified
sorghum biscuits using a rat bioassay.
4.3.2 MATERIALS AND METHODS
4.3.2.1 Biscuit Samples
Two types of sorghum biscuits were used in this study, one made of 100% sorghum and the
other with 50% defatted soy flour (DSF) substituting sorghum. Biscuits were prepared
according to the procedure described in Chapter 4.1, Sections 4.1.2.2 and 4.1.2.3, except that
the sorghum flour was milled to a particle size of not more than 500 µm using a laboratory
hammer mill (Falling Number 3100, Huddinge, Sweden). After preparation, biscuits were
stored at 10oC until required.

117
4.3.2.2 Diet preparation
The biscuit samples used for preparation of the diets were pulverized using a Waring
Commercial® laboratory blender (New Harford, CT), set at medium speed for 2 minutes.
Three isonitrogenous diets were prepared from the two types of sorghum biscuits and Animal
Nutrition Research Council Reference Casein (ANRC) casein (calcium caseinate, Fonterra,
Co-operative Group, New Zealand) to provide 8% crude protein in the final diet on a dry
weight basis. The percentages of ingredients in the diet formulation were calculated based on
the composition of the test protein (Table 4.3.1). The casein diet was the reference.
The biscuits and casein were incorporated into the basal diet (Table 4.3.2) at the expense of
corn starch-sucrose mixture of 1:1 ratio. The diets also contained 1% vitamin and 5% mineral
fortification mixes, both from ADVIT Animal Nutrition, Kempton Park, South Africa. A
protein-free diet was prepared in which the test food was replaced by the corn starch-sucrose
mixture in the basal diet. The purpose of the protein-free diet was to estimate the endogenous
nitrogen excretion by the rats. The oil content in all four diets was adjusted to 9% using
sunflower oil. Formulation of the diets is shown in Table 4.3.2.
Table 4.3.1 Proximate composition of the sorghum biscuits and reference casein (g/100 g)
Protein Fat Moisture Carbohydrates Ash
(minerals)
Crude
fibre
Casein 90.10 1.00 4.10 0.10 4.70 0.00
Sorghum :100 9.23 21.00 3.25 63.50 1.39 1.61
Sorghum-Soy:50:50 24.71 19.68 3.82 45.60 2.78 3.66

118
Table 4.3.2 Formulation of the four experimental diets (g/kg dry basis)
Diets
Ingredients Basal (protein-free) Casein (reference) Sorghum: soy (50:50) Sorghum: (100:0)
Casein1 0 90.0 0 0
Sorghum-soy biscuits 0 0 332.0 0
Sorghum biscuits 0 0 0 850.0
Sunflower oil2 90.0 90.0 90.0 90.0
Mineral mixture3
50.0 50.0 50.0 50.0
Vitamin mixture4
10.0 10.0 10.0 10.0
Cellulose powder5
10.0 10.0 10.0 0
Corn starch6 420.0 375.0 508.0 0
Sucrose 420.0 375.0 249.0 0
Total 1000 1000 1000 1000 1Casein – New Zealand Milk Products (Clover Fonterra, Johannesburg, South Africa);
2Sunflower oil “Sunfoil” (Willowton Oil,
Pietermaritzburg, South Africa); 3Mineral mixture and
4Vitamin mixture composition according to AOAC method 960.48 (ADVIT Animal
Nutrition S. A, BASF, Kempton Park, South Africa); 5Cellulose powder (W& R, Balston, England);
6Corn starch (Tongaat Hulett, Johannesburg,
South Africa).
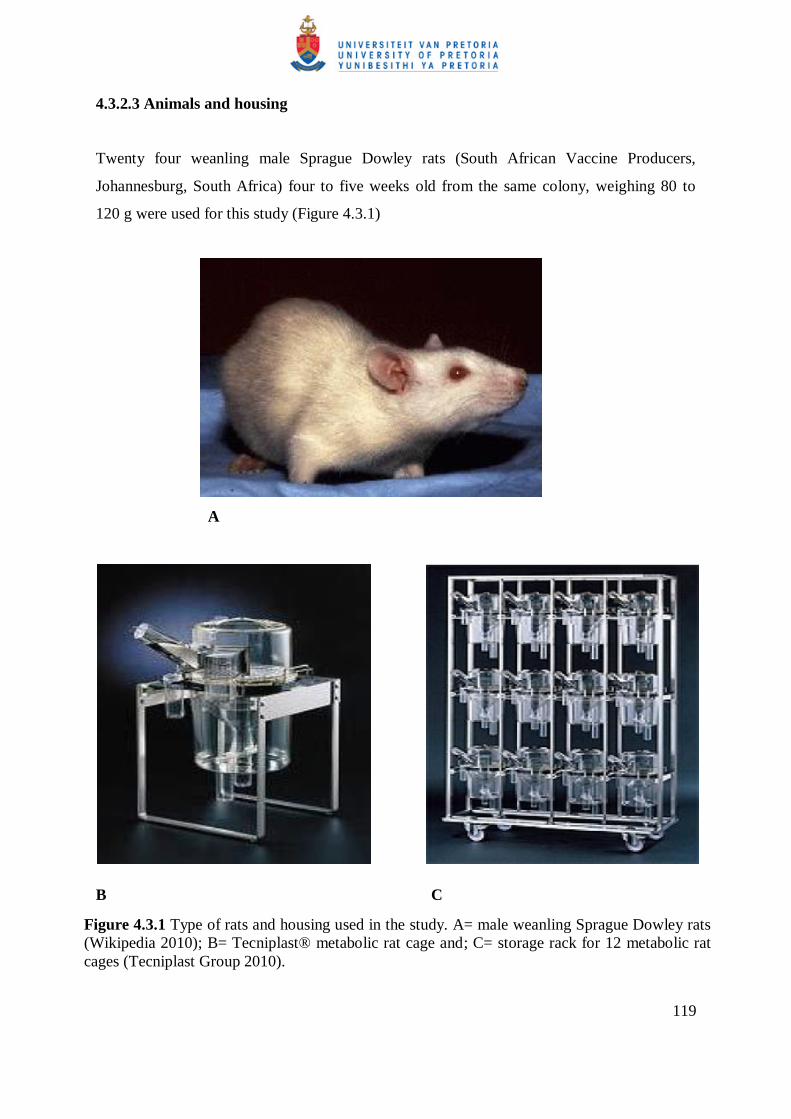
119
4.3.2.3 Animals and housing
Twenty four weanling male Sprague Dowley rats (South African Vaccine Producers,
Johannesburg, South Africa) four to five weeks old from the same colony, weighing 80 to
120 g were used for this study (Figure 4.3.1)
A
B C
The study was carried out at the Biomedical Research Centre, Onderstepoort, University of
Figure 4.3.1 Type of rats and housing used in the study. A= male weanling Sprague Dowley rats
(Wikipedia 2010); B= Tecniplast® metabolic rat cage and; C= storage rack for 12 metabolic rat
cages (Tecniplast Group 2010).

120
Pretoria, according to AOAC International (2000) method 960-48 with modifications.
Approval by the University of Pretoria Ethics Committee was granted for this study.
Maintenance of animals was conducted in accordance with the Guide for the Care and Use of
Laboratory Animals (National Research Council 1996). The animals were housed
individually in stainless steel metabolic cages (Tecniplast®, Tecniplast Group, Varese, Italy)
equipped to separate urine and faeces. The metabolic cages were stored on two racks each
holding 12 cages. Temperature was maintained at 21 to 24o
C with alternate periods of light
and dark of 12 hours and relative humidity between 40 to 70%. Figure 4.3.1 shows the type
of rat breed, metabolic unit and storage racks used in the study.
4.3.2.4 Growth study
On arrival, the animals were fed on standardized laboratory irradiated rat pellets (EPOL,
Pretoria, South Africa) for an acclimatization period of 3 days. After acclimatization, the
animals were randomly distributed into 4 groups of 6 rats each with the average weight of
rats in any one group on the first day of the assay not exceeding 5 g average weight of rats in
any other group. One group of rats was fed the protein-free diet, another, the casein, and the
third and fourth groups the 100% sorghum and sorghum-soy 50:50 diets, respectively (Table
4.3.2.) Food and sterilized water were provided ad libitum for the entire study period.
Records of food intake for each rat were maintained daily. Rats were weighed on alternate
days including the first and last days of the study.
The growth study lasted 28 days. Net Protein Ratio (NPR) was measured on the 10th
day of
the study. The rats fed the protein-free diet were euthanized on the 10th
day after the protein
digestibility and NPR studies due to their rapid weight loss and the remaining three groups of
rats at the end of the PER study by placing them in an inhalation chamber containing a high
dose of anaesthetic (isoflurane). NPR, PER and Feed Efficiency Ratio (FER) were calculated
according to FAO/WHO (1991). The PER and NPR in this study were computed for 5 days
(days 8 to 13 of the study) because the rats on the casein diet unexpectedly lost weight after
the 13th day.

121
4.3.2.5 Protein digestibility study
The protein digestibility study started on the 5th
day, days 5 to 9 of the growth study and
lasted 5 days. During the study, the food consumed was calculated from the food supplied
minus the weight of uneaten food daily. Faeces for each rat were collected into polyethylene
type paper bags daily, as was urine into plastic containers containing 1 ml 0.5 M sulphuric
acid. Faeces and urine were frozen at -20o C until required.
4.3.2.6 Computations
The following protein quality indices were calculated from the data collected (FAO/WHO
1991, WHO 2007):
Protein Efficiency Ratio (PER) = g of weight gain
g of protein consumed
Net Protein Retention Ratio =
g of weight gain + g of weight loss in protein free
diet
g of protein consumed
Food Efficiency Ratio = g of weight gain
g of food consumed
Apparent Protein (N) Digestibility (%) = I – F x 100
I
True Protein (N) Digestibility (%) = I – (F – F0) x 100
I
Apparent Protein (N) Biological value (%) = (I–F–U) x 100
I–F
True Protein (N) Biological Value (%) = I –(F – F0) – (U – U0) x 100
I – (F– F0)

122
Faecal Protein (%) = F–F0 x 100
I
Urine Protein (%) = U – U0 x 100
I
Protein (N) Balance = I –(F – F0) – (U – U0)
Apparent Net Protein (N) Utilization = % Apparent digestibility x % biological value
True Protein (N) Utilization = % True digestibility x % biological value
Where I = nitrogen intake of the test diet, F = faecal nitrogen loss on the test diet, F0 = faecal
nitrogen loss on a protein-free diet, U = urinary nitrogen and U0 = urinary nitrogen loss on
protein-free diet.
4.3.2.7 Chemical analyses
The total faeces from each rat were dried overnight at 100o
C in an air circulation oven,
weighed and pulverized using a laboratory blender. The pulverized faeces from six rats fed
the same diet were pooled. The urine samples from each rat were pooled and freeze dried.
Nitrogen in the faeces and urine was determined by Dumas combustion (AACC International,
2000) Method 46-30 and protein content (N x 6.25) calculated. The moisture content of the
food and faeces was determined by a one stage air oven procedure (AACC International
2000) Method 44-15A. Faecal and urine nitrogen of rats fed the protein-free diet was used to
calculate endogenous nitrogen loss. Six individual values per diet for true protein
digestibility (TD), biological value (BV) and net protein utilization (NPU) were computed
from nitrogen intake, faecal nitrogen, urinary nitrogen and endogenous fecal and urinary
nitrogen (FAO/WHO 1991). Apparent PD, BV and NPU were also computed excluding the
endogenous nitrogen.

123
4.3.2.8 Protein Digestibility Corrected Amino Acid Score (PDCAAS) determination
The PDCAAS is the official method for predicting protein quality for food based on human
amino acid requirements (WHO 2007). The parameters it takes into consideration critical to
quality evaluation of a protein source are indespensable amino acid profile of the test protein,
its digestibility and ability to supply the amino acid in sufficient quantity (WHO 2007). In
this study, amino acid composition data for the test products (100% sorghum and sorghum-
soy biscuits), previously reported in Chapter 4.1 and true digestibility values determined in
this investigation were used to compute the PDCAAS using the following equation (WHO
2007):
Amino acid score = mg of amino acid in 1 g test protein
mg of amino acid in requirement pattern (3-10 or 1-2 yr olds)
PDCAAS = True Digestibility x Lysine score (or the amino acid with the lowest ratio).
Amino acid scores for 9 indispensable amino acids, lysine, leucine, phenylalanine + tyrosine,
valine, tryptophan, methionine + cysteine, threonine, histidine and isoleucine, were computed
using a human pattern for amino acid requirements for preschool (1 to 2) and school age (3 to
10) years (WHO 2007) and a rat growth pattern of amino acid requirements National
Research Council (NRC) (NRC 1995) as the reference proteins. Indispensable amino acid
profiles were determined using the Pico-Tag method (Bidlingmeyer et al 1984) by acid
hydrolysis, separation and quantification by reverse phase HPLC (Chapter 4.1). Three sets of
PDCAAS values were computed.
4.3.2.9 Statistical analysis
Results were presented as mean values and standard deviations. Data was subjected to one-
way analysis of variance (ANOVA) using Statistica Software version 8.0 (Statsoft, Tulsa,
OK). Means were separated using Fisher’s Least Significant Difference test (LSD).

124
4.3.3 RESULTS AND DISCUSSION
4.3.3.1 Growth study
The animals arrived on 15 October 2009. They were fed on a laboratory diet for 7 days (15 to
21 October). On 22 October when the rats started feeding on the experimental diets, they
rapidly lost weight up to 28 October. The laboratory diet was restarted to rehabilitate the rats
on 28 October and was continued to 2 November 2009. As a result of the rehabilitation
period, when the PER and digestibility studies started on 2 November considered day 0, the
animals on the casein diet had approximately 15 g higher mean weight than the nearest two
groups. Protein content of urine and faeces for 7 to 11 November (days 5 to 9 of the study)
was used for the digestibility study).
The four groups of animals all lost weight again from 3 November, The protein-free diet fed
rats were euthanized on 11 November (day 10 of the PER study). The remaining three groups
fed on sorghum-soy, sorghum and casein diets, started gaining weight again on 10 November
but after 15 November (day 13), the casein diet fed rats started losing weight and this
continued until 30 November 2009 (day 28) the last day of the study. However, the sorghum-
soy diet fed rats steadily gained weight until day 28, while the sorghum diet fed rats did not
gain weight. Consequently, the PER was calculated using data from the 5 days, 10 to 15
November (days 8 to 13) when the casein diet fed rats gained weight.
The food and protein intake and rat growth data needed to determine PER and NPR are
shown in Table 4.3.3. The food intake of the protein-free diet was less than half of the other
two diets. The higher food intake for casein, sorghum-soy and sorghum biscuit diets may
have been influenced by the quality and type of protein. According to the National Research
Council (1995), low protein diets result in reduced food intake, and protein deficiency in
weanling rats causes reduced growth, muscular wasting, emaciation and death if sufficiently
severe. Previous studies have shown that low and/or imbalanced dietary protein suppresses
food intake. For instance, Mosha and Benink (2004) reported low intake by rats (5.21 g/ day)
for a 100% maize meal supplementary food compared to 11.43 g per day for a maize-bean-
sardine meal. Food intake influences both energy and protein intake which are critical for
growth.

125
Despite the problems with the unexpected loss in weight by the casein reference group, the
results nevertheless indicate that the rats fed the soy fortified sorghum biscuit diet gained the
same amount of weight as rats fed the reference diet, compared to the rats fed the 100%
sorghum biscuit diet which did not gain weight in 5 days (Table 4.3.3). Figure 4.3.2 shows
that during the 5 days used to compute PER, rats fed the casein diet had a mean weight gain
of 1.25 g, sorghum-soy 1.17 g, 100% sorghum 0.06 g and protein-free -3.80 g. The PER of
the sorghum-soy biscuit diet fed rats was also the same as the PER of the reference casein
compared to the 100% sorghum biscuit diet fed rats that had a zero value for PER. Table
4.3.3 and Figure 4.3.2 further show that during the last 20 days of the study, the sorghum-soy
diet fed rats gained 10% higher weight than their original weight compared to the sorghum
biscuit diet fed rats that did not gain any weight. It is possible that the increased growth rate
of the sorghum-soy diet fed rats may have been partly due to higher lysine content in the
legume protein.
In a similar study, Ashley and Anderson (1975) demonstrated that increasing the lysine
content of a wheat gluten diet for rats resulted in 56% higher growth rate than rats fed a pure
gluten diet. Mensa-Wilmot et al (2001) and Joseph and Swanson (1993) reported PER values
were 84 to 96% of a casein diet for maize-soybean-cowpea-peanut composite weaning foods
and relative PER values of up to 80% for bean-rice diets compared to 67% for rice a only
diet. Nnam (2001) demonstrated that rats fed a diet of sorghum flour substituted with 46%
bambara groundnut with 19% protein caused the same growth rate as rats fed a reference
casein diet.
Some earlier studies also showed that cereal only diets do not support growth. For example,
Mosha and Bennink (2004) showed that a maize meal only diet fed to rats caused weight loss.
Also, as stated, MacLean et al (1981) reported dramatic slowing of weight gain or weight loss
of approximately 5.9 g/kg body weight per day in children fed whole grain sorghum gruel
and ascribed it to inadequate quality and quantity of dietary protein similar to the findings in
this study. On the contrary, Kavithaparna, Geervani and Sumathi (1988) reported slight
increase of 0.25 kg in mean body weight for children fed on decorticated sorghum diets.
However, the higher energy and protein in the experimental diet compared to the pre-
experimental diet may have contributed to the weight increase due to the catch up growth
phenomenon for these children who were undernourished.

126
Table 4.3.3 Growth of rats, protein efficiency ratio (PER) and food efficiency ratio (FER) values for 100% sorghum and sorghum-soy biscuit
diets
Protein Quality Indices
Diet groups
Casein (reference)
Sorghum-soy Sorghum 100% (Basal) Protein-free
Food intake (g) 54.55b±8.35 48.53
b± 5.14 49.54
b± 1.88 24.57
a± 3.50
Protein intake (g) 4.36a±0.67 3.88
a±0.41 3.96
a±0.15 nd
Initial weight (g) 164.25b± 13.65 143.83
a±10.00 145.00
a±17.58 142.00
a± 8.60
Weight after 5 days (g) 170.50c ±15.06 149.67
b±9.20 145.33
b±18.20 123.00
a± 7.91
Weight gain after 5 days (g) 6.25c± 5.51 5.83
c±3.63 0.33
b±1.50 -19.00
a± 2.00
Weight after 20 days 143.25b±12.09 157.83
c±11.27 143.50
b±16.4 112.50
a±7.53
Weight gain after 20 days (g) -21.00a± 11.21 14.00
c±3.32 -1.50
b±3.21 -29.5±2.60**
PER 1.49b±0.23 1.49
b±0.21 0.08
a±0.37 nd
Corrected PER 2.50b± 0.00* 2.49
b±0.80 0.13
a±0.63 nd
Relative PER (%) 100.00b± 0.00* 99.79
b±12.42 5.17
a±25.26 nd
FER 0.12b±0.01 0.12
b±0.02 0
a±0 nd
NPR (%) 5.79 6.40 4.42 nd
Values are means±standard deviations for 6 rats fed for 5days. Values in a row followed by different letter superscripts are significantly different
at P≤0.05 as assessed by Fisher’s least significant difference; nd= not determined; *= values of 2.5 and 100% are assumed values for casein;
**=weight loss for protein-free diet fed rats for 9 days.

127
Figure 4.3.2 Average weight of the rats on the four diets for the 28 day period of the feeding
trial.
Table 4.3.3 also shows that the 50:50 sorghum: DFS diet had the highest NPR. However, the
NPRs of all three diets were quite similar, as a result of the large weight loss in the protein-
free group. In contrast to PER, NPR takes into account the weight loss of the rats ont he
protein-free diet (FAO/WHO 1991). The NPR of the 50:50 sorghum: DFS diet was slightly
higher than that of the casein diet because of the slightly, but not significantly, lower
protein/food intake of the former group.
The Food Efficiency Ratio (FER) for the sorghum-soy biscuit diet was equivalent (99.8%) to
the reference casein compared to the 100% sorghum biscuit diet that had a zero Food
Efficiency Ratio (Table 4.3.4). Mosha and Bennink (2004) also reported a negative food
efficiency ratio for a pure maize meal supplementary food product. A high Food Efficiency
Ratio is an important quality attribute for cereal-based supplementary foods of high dietary
bulk which may limit the quantity of food consumed by children (Lungqvist, Mellander and
Svanberg 1981) to meet their nutritional needs.

128
Table 4.3.4 Effect of consumption of 100% sorghum and sorghum-defatted soy flour biscuit diets on protein intake, output and retention of rats
for 5 days
Quality Indices
Diet groups
Casein (control) Sorghum-soy Pure sorghum Protein free
Food intake (g) 54.55b±8.35 48.53
b± 5.14 49.54
b± 1.88 24.57
a± 3.50
Protein intake (g) 4.36a±0.67 3.88
a±0.41 3.96
a±0.15 nd
Faecal excretion (g) 3.14b±0.37 2.89
b±0.32 4.70
c±0.57 1.62
a±0.26
Faecal protein output (g) 0.46b± 0.05 0.56
c± 0.06 0.72
d± 0.09 0.23
a± 0.04
Faecal protein (%) 5.25a±1.19 8.64
b±2.03 12.25
c±1.87 nd
Urine excretion (g) 20.00ab
±2.90 22.60b±2.97 16.00
ab±4.08 15.25
a±8.05
Urine protein output (g) 1.21b±0.17 1.29
b±0.17 0.68
a±0.71 0.72
a±0.42
Urine protein (%) 11.58b±5.04 14.92
b±4.81 -1.11
a±4.2 nd
Protein (N) Balance (g) 3.65a±0.74 2.98
a±0.52 3.52
a±0.24 nd
Values are means±standard deviations based on data for 6 rats. Values in a row followed by different letter superscripts are significantly
different at P≤0.05 as assessed by Fisher’s least significant difference. nd= not determined. Food and protein intake, and faecal excretion and
faecal protein output (dry basis). Urine excretion, and urine protein output (as is).

129
4.3.3.2 Digestibility study
Nitrogen excretion and retention
The faecal bulk for rats fed the 100% sorghum biscuit diet was 52% and 62% higher than for
the casein and sorghum-soy composite biscuit diets, respectively (Table 4.3.4). This may be
attributed to the formation of enzyme-resistant starch and unavailable kafirin during thermal
processing of sorghum. High stool volume for rats fed on a sorghum diet were reported by
Bach Knudsen et al (1988a) who recovered 26 to 74% of starch content of the diet fed to rats
in the faeces. MacLean et al (1981) also reported stool volumes 2.5 times higher than the
control for children fed on a sorghum diet and Kurien et al (1960) reported doubling of stool
weights when sorghum replaced rice in the diets of 10 to 15 year old boys.
The faecal nitrogen expressed as a percentage of nitrogen intake for rats fed the 100%
sorghum biscuit diet was some 54% and 17% higher than the casein and sorghum-soy
composite biscuit diets, respectively (Table 4.3.4). The higher faecal nitrogen content may be
accounted for by the unavailable sorghum endosperm proteins, the kafirins. Previous studies
have shown that thermal processing reduces protein digestibility of sorghum proteins. For
example, Hamaker et al (1986) attributed reduced digestibility of cooked sorghum proteins to
disulphide mediated polymerization making them less susceptible to attack by proteolytic
enzymes. Most faecal nitrogen is from undigested food, and the rest from cells shed from
intestinal mucosa and residues of digestive juices (Kavithaparna et al 1988).
The faecal nitrogen loss of rats fed the sorghum-soy biscuit diet was 37% higher than the loss
from rats fed the reference casein diet (Table 4.3.4). It is possible that the higher soy content
in this diet elicited nitrogen excretion from sources other than undigested soy protein. For
instance, Fairweather-Tait, Gee and Johnson (1983) comparing faecal nitrogen excretion
from rats fed a casein control diet and a bean diet attributed the higher nitrogen excretion of
the bean diet to increased microbial activity in the intestines, utilizing indigestible
carbohydrates and proteins from bean substrates. In a similar study, Bender and
Mohammadiha (1981) ascribed the increase to enhancement of mucosal cell turnover through
consumption of a bean diet. The results also show that the animals fed all the three diets were
in positive nitrogen balance.

130
Protein digestibility, bioavailability and net utilization
Table 4.3.5 shows that apparent and true protein digestibility of all the diets were high (82%
and above) with only slight differences between diets. The casein diet was higher than the
sorghum-soy and 100% sorghum biscuit diets by 5% and 9%, respectively. The 100%
workers concluded that sorghum is a poor source of dietary protein for infants and children.
Studies conducted by Kavithaparna et al (1988) reported apparent protein digestibility of 69%
and 66% for sorghum roti and cooked decorticated sorghum diets, respectively by preschool
children and Kurien et al (1960) found apparent digestibility of 54% for teenage boys
consuming a high sorghum diet.
The slightly higher protein digestibility of 4% for sorghum-soy diet compared to the 100%
sorghum biscuit diet may be due to replacement of the less digestible kafirins with the more
digestible soy proteins the globulins. Nnam (2001) similarly reported apparent protein
digestibility of 89% for sorghum substituted with 46% bambara ground nut fed to rats. The
true digestibility value of the sorghum-soy biscuit diet is comparable to results from two
studies by Mensa-Wilmot et al (2001) and Edem, Ayatse and Itam (2001) who reported 91%
true digestibility for cowpea-soy-maize weaning food and soy protein supplemented cassava
gari, respectively.
Table 4.3.5 Indices of protein quality for 100% sorghum and soy fortified sorghum biscuits
Protein quality indices
Diet groups
Casein (control)
Sorghum-soy Sorghum 100%
Apparent protein digestibility (%) 89.38c±1.55 85.38
b±2.45 81.94
a±1.76
True protein digestibility (%) 94.75c ±1.19 91.36
b± 2.04 87.75
a ±1.87
Apparent protein BV1 (%) 68.19
a±8.01 60.43
a±7.99 79.10
b±5.48
True protein BV (%) 89.51a±5.18 85.62
a±5.23 103.25
b±4.83
Apparent NPU2 (%) 61.00
ab±7.13 51.71
a±7.97 64.85
b±5.41
True NPU (%) 84.81ab
± 4.93 78.26a± 5.79 90.63
b± 5.52
Values are means±standard deviations for 6 rats fed for 5 days. Values in a row followed by
different letter superscripts are significantly different at P≤0.05 as assessed by Fisher’s least
significant difference. 1BV = Biological Value;
2NPU = Net Protein Utilization

131
The high BVs for the 100% sorghum biscuit diet may be explained by the fact that no dietary
nitrogen was excreted in the urine partly because microbial fermentation of uncooked starch
in the sorghum biscuits may have changed the routes of nitrogen excretion from urine to the
faeces (Bach Knudsen, Munck and Eggum 1988b). Sorghum starch granules are encapsulated
by hydrophobic cross-linked kafirins (Ezeogu et al 2008), which do not absorb adequate
water for expansion and probably remained uncooked in the biscuits. Beames and Eggum
(1981) who added raw potato starch to diets fed to rats reported increased BV and reduced
digestibility. These workers suggested that less nitrogen was secreted in the urine and more in
faeces due to fermentation of raw starch in the lower intestine and microflora obtain nitrogen
from urea diffusing from blood to the caecum and colon.
Bach Knudsen et al (1988a) and Bach Knudsen et al (1988b) who evaluated stiff porridges,
tuwo and ugali, made from tannin and non-tannin sorghum, respectively, using rat balance
studies attributed the lower digestibility and high biological value to the resistant starch-
kafirin complex formed due to thermal processing, that passes through the small intestine
without being hydrolyzed by endogenous enzymes. It is fermented by microorganisms in the
hindgut which utilize energy from resistant starch and nitrogen from kafirin. These workers
proposed that low true sorghum protein digestibility in man may be caused by this
phenomenon.
4.3.3.3 Protein Digestibility Corrected Amino Acid Score
Table 4.3.6 shows the quantities of the indispensable amino acids in the casein and
experimental food products relative to the WHO (2007) reference patterns for 3 to 10 and 1 to
2 year old children, and the National Research Council (1995) reference pattern for growing
rats. The PDCAAS index reflects the estimated ability for the food product to meet the
protein needs of an individual. The 3 to 10 year old amino acid scoring pattern is
recommended by WHO (2007) for judging protein quality for school children and
adolescents.
The casein diet had an amino acid pattern that is considered adequate for both preschool and
school children. Fortification of sorghum with 50% defatted soy flour improved the
PDCAAS by 248% compared to the unfortified biscuit and the most limiting indispensable

132
Table 4.3.6 Comparison of amino acid composition mg/g protein of diet protein sources with
WHO requirement pattern for preschool and school children and NRC recommended pattern
for rats
Amino acid
Diet protein sources
WHO2
WHO3
NRC4
Casein1
Sorghum: soy
Sorghum
Lysine 73 45 14 48 52 61
Leucine 92 83 127 61 63 71
Phenylalanine + tyrosine
102 83 84 41 46 68
Valine 64 48 47 40 42 49
Tryptophan
16 40 12 6.6 7.4 13
Methionine + Cysteine
33 58 28 24 26 65
Threonine 39 28 21 25 27 41
Histidine 33 24 19 16 18 19
Isoleucine 50 45 38 31 31 41
Total 502 415 380 293 312 430
True protein digestibility % 94.75 91.36 87.75
Lysine score (3-10 yrs) 1.52 0.95 0.29
PDCAAS5 (3-10 yrs)
1.0 0.87 0.26
Limiting AA (3-10 yrs) NIL Lysine Lysine
Lysine score (1-2 yrs) 1.40 0.87 0.26
PDCAAS (1-2 yrs) 1.0 0.80 0.24
Limiting AA (1-2 yrs) NIL Lysine Lysine
Lysine score (rat) 1.20 0.73 0.23
PDCAAS (rat) (1.0) 0.67 0.20
Limiting AA (rat) M+C6
Threonine Lysine
1Casein amino acid profile as determined for calcium caseinate of New Zealand Milk Board
(Rutherfurd and Moughan 1998). 2Amino acid reference pattern for children aged 3 to 10 years (WHO 2007).
3Amino acid reference pattern for children aged 1to 2 years (WHO 2007).
4National Research Council (NRC) amino acid reference pattern for rats (NRC 1995).
5Protein digestibility-corrected amino acid score (PDCAAS) based on lysine score even when
limiting amino acid is different. 6M+C= Methionine +Cysteine.

133
amino acid was lysine for both pre-school and school children. However, the PDCAAS for
the sorghum-soy diet was higher than the minimum score of 70% of casein as recommended
by FAO/WHO (1994) and (FAO/WHO 2009) Codex Alimentarius Committees. The 100%
sorghum biscuit diet was deficient of the indispensable amino acid lysine, required for school
and pre-school age children, and the PDCAAS was 161% and 192% lower than the
recommended minimum for school and preschool children, respectively (FAO/WHO 1994,
WHO 2007).
Several researchers have conducted similar studies on supplementary foods and used the
PDCAAS index to provide information about the complementation potential of processed
plant food protein sources. For instance, Kannan, Nielsen and Mason (2001) reported a 34%
increase in PDCAAS of a rice-bean infant weaning food compared to beans alone. Similarly,
Mensa-Wilmot et al (2001) reported acceptable PDCAAS values ranging between 0.72 and
0.82 for extruded cowpea-soy-maize foods for 2 to 5 year olds. Values ranging from 0.77 to
0.90 were reported by Mosha and Bennink (2004) for varying composites of rice, maize, bean
and sardine meals for preschool children.
According to the National Research Council (1995), growing rats have much higher
requirements for lysine, sulphur amino acids and all other indispensable amino acids than
school and preschool children (Table 4.3.6). Although the casein diet fully provided the
lysine requirements of the rat which may explain the high growth pattern of the casein fed
rats compared to the 100% sorghum biscuit diets, it was probably limiting in the sulphur
amino acids shown by the low PDCAAS of 0.47 based on the most limiting amino acids. Rats
require greater amounts of sulphured amino acids to sustain hair growth (Augustin and
Munoz 2006). The results also show that the indispensable amino acid pattern for the
sorghum-soy biscuit diet was utilized as well as the casein pattern in synthesis of body
proteins hence the comparable growth rate to casein. The sorghum-soy biscuit diet had a
value of 0.67 essentially meeting the minimum 0.70 recommended by FAO/WHO (1994).
The results in this study imply that since the amino acid requirements of the rat are much
higher than those of children, growth patterns observed in this study would probably be
higher in preschool and school children if they consumed the fortified sorghum biscuit.
Mosha and Bennink (2004) also suggested that a protein source that supports modest growth
in rats would support optimal growth in children.

134
4.3.4 CONCLUSIONS
Compositing sorghum with 50% defatted soy flour produces a protein that is similar to
animal protein in PER and has the potential for use in a protein supplement food for school
age children. It appears that the fortified sorghum biscuits could support growth in rats and
possibly children. The rat is a poor model for determination of sorghum protein digestibility
because it digests sorghum proteins very efficiently.
4.3.5 ACKNOWLEDGEMENTS
I gratefully acknowledge Dr. Tamsyn Pulker for organising and overseing the rat bioassay at
the Biomedical Research Centre, University of Pretoria, Onderstepoort, Ms Ilse Jansen Van
Rensburg also of the Biomedical Research Center, for technical assistance during the study
and Dr Janet Taylor of the Department of Food Science, University of Pretoria for guidance
on diet preparation for the study.

135
4.3.5 REFERENCES
AACC International. 2000. Approved Methods of the American Association of Cereal
Chemists, 10th Ed. Methods 46-30, 44-15. The Association: St. Paul, MN.
Augustin, M. O., and Munoz, V. A. 2006. Proteins and peptides in enteral nutrition. Nutr.
Hosp. 21:1-13.
Ashley, V. M., and Anderson, G. H. 1975. Food intake regulation in the weanling rat: Effects
of the most limiting essential amino acids of gluten, casein, and zein on the self-selection of
protein and energy. J. Nutr. 105:1405-1411.
AOAC International. 2000. Official Methods of Analysis. 17th
Ed. Method 960-48. The
Association: Washington, DC.
Axtell, J. D., Kirleis, A. W., Hassen, M. M., D’Croz-Mason, N., Mertz, E. T., and Munck, L.
1981. Digestibility of sorghum proteins. Proc. Natl. Acad. Sci. USA. 78:1333-1335.
Bach Knudsen, K. E., Kirleis, A. W., Eggum, B. O., and Munck, L. 1988a. Carbohydrate
composition and nutritional quality for rats of sorghum tô prepared from decorticated white
and whole grain red flour. J. Nutr. 118:588-597.
Bach Knudsen, K. E., Munck, L., and Eggum, B. O. 1988b. Effect of cooking, pH and
polyphenols on carbohydrate composition and nutrition quality of a sorghum (Sorghum
bicolor (L.) Moench) food, ugali. Br. J. Nutr. 59:31-47.
Beames, R. M., and Eggum, B. O. 1981. The effect of type and level of protein, fibre and
starch on nitrogen excretion patterns in rats. Br. J. Nutr. 46:301-313.
Bender, A. E., and Mohammadiha, H. 1981. Low digestibility of legume nitrogen. Proc. Nutr.
Soc. 40:66A.

136
Bidlingmeyer, B. A., Cohen, S. A., and Tarvin, T. L. 1984. Rapid analysis of amino acids
using pre-column derivatization. J. Chromatogr. 336:93-104.
Boutrif, E. 1991. Recent developments in protein quality. Food Nutr. Agric. 2:3.
Edem, D. O., Ayatse, J. O. I., and Itam, E. H. 2001. Effect of soy protein supplementation on
the nutritive value of “gari” (farina) from Manihot esculenta. Food Chem. 75:57-62.
Eggum, B. O., Monowar, L., Bach Knudsen, K. E., Munck, L., and Axtell, J. 1983.
Nutritional quality of sorghum and sorghum foods from Sudan. J. Cereal Sci. 1:127-137.
Joseph, E., and Swanson, B. G. 1993. Growth and nitrogen retention of rats fed bean
(Phaseolus vulgaris) and bean and rice diets. Food Res. Int. 26:261-269.
Erbersdobler, H. F., and Faist, V. 2001. Metabolic transit of Amadori products. Nahrung 45:
177-81.
Ezeogu, L. I., Duodu, K. G., Emmambux, M. N. and Taylor, J. R. N. 2008. Influence of
cooking conditions on the protein matrix of sorghum and maize endosperm flours. Cereal
Chem. 85:397-402.
Fairweather-Tait, S. J., Gee, J. M., and Johnson, I. T. 1983. The influence of cooked kidney
beans (Phaseolus vulgaris) on intestinal cell turnover and faecal nitrogen excretion in the rat.
Br. J. Nutr. 49:303-312.
FAO/WHO. 1991. Protein Quality Evaluation. The Report of the Joint FAO/WHO Expert
Consultation. Food and Nutrition Paper No. 51. Food and Agriculture Organization: Rome,
Italy.
FAO/WHO. 1994. Codex Alimentarious: Foods for Special Dietary Uses (including Foods
for Infants and Children). Joint FAO/WHO Food Standards Programme, Codex Alimentarius
Commission, Vol 4, 2nd
Ed. Food and Agriculture Organization: Rome.

137
FAO. 2009. State of Food Insecurity in the World: Economic crisis – Impacts and Lessons
Learned. Food and Agriculture Organization: Rome.
FAO/WHO. 2009. Codex Alimentarius: Foods for Special Dietary uses (Incuding Foods for
Infants and Young Children). Food and Agriculture Organization: Rome.
Graham, G. G., MacLean, W. C., Morale, E., Hamaker, B. R., Kirleis, A. W., Mertz, E. T.,
and Axtell, J. D. 1986. Digestibility and utilization of protein and energy from nasha, a
traditional fermented Sudanese weaning food. J. Nutr. 116:978-984.
Hamaker, B. R., Allen, W. K., Mertz, E. T., and Axtell, J. D. 1986. Effect of cooking on the
protein profiles and in vitro protein digestibility of sorghum and maize. J. Agric. Food Chem.
34:647-649.
International Crops Research Institute for the Semi Arid Tropics (ICRISAT). Crops:
Sorghum. 2009. www.icrisat.org/sorghum/sorghum.htm. Accessed November 2009.
Joint United Nations Programme on HIV/AIDS (UNAIDS) and World Health Organization
(WHO). (2009). Aids Epidemic Update. www.unaids.org. Accessed March 2010
Kannan, S., Nielsen, S. S., and Mason, A. C. 2001. Protein Digestibiltiy-Corrected Amino
Acid Scores of beans and bean-rice infant weaning food products. J. Agric. Food Chem.
49:5070-5074.
Kavithaparna, S., Geervani, P., and Sumathi, S. 1988. Digestibility and retention of proteins
of sorghum products by preschool children and adults. Nutr. Rep. Int. 38:1231-1238.
Kurien P. P., Narayaranao, M., Swaminathan, M., and Subramanyan V. 1960. The
metabolism of nitrogen, calcium and phosphorus in undernourished children; the effect of
partial or complete replacement of rice in poor vegetarian diets by kaffir corn (Sorghum
vulgare). Br. J. Nutr. 14:339-345.

138
Lungqvist, B. G., Mellander, O., and Svanberg, U. O. 1981. Dietary bulk as a limiting factor
for nutrient intake in preschool children: Problem description. J. Trop. Paed. 27:68-73.
MacLean W. C., De Romana., Placko R. P., and Graham G. G. 1981. Protein quality and
digestibility of sorghum in preschool children: Balance studies and plasma amino acids. J.
Nutr. 111:1928-1936.
MacLean, W. C., De Romana, G. L., Placko., and Graham, G. G. 1983. The effect of
decortication and extrusion on the digestibility of sorghum by preschool children. J. Nutr.
113:2171-2177.
Mensa-Wilmot, Y., Phillips, R. D., and Hargrove, J. L. 2001. Protein quality evaluation of
cowpea based extrusion cooked cereal/legume weaning mixtures. Nutr. Res. 21:849-857.
Mosha, T. C. E., and Benink, M. R. 2004. Protein quality of drum-processed cereal-bean-
sardine composite supplementary foods for pre-school age children. J. Sci. Food Agric.
84:1111-1118.
Muller, O., and Krawinkel M. 2005. Malnutrition and health in developing countries. Can.
Med. Assoc. J. 173:279-286.
National Research Council. 1995. Nutrient requirements of laboratory animals. National
Academy of Sciences Press: Washington. Pp 11-58.
National Research Council. 1996. Guide for the Care and Use of Laboratory Animals.
National Academy of Sciences Press: Washington, DC. Pp 9-137.
Nnam, N. M. 2001. Comparison of the protein nutritional value of food blends based on
sorghum, bambara groundnut and sweet potatoes. Int. J. Food Sci. Nutr. 52:25-29.
Rutherfurd, S. M., and Moughan, P. J. 1998. The digestible amino acid composition of
several milk proteins: Application of a new bioassay. J. Dairy Sci. 81:909-917.
139
Tecniplast Group. 2010. Metabolic cage for rats. Tecniplast Group: Varese, Italy.
www.tecniplast.it/metabolic. Accessed August 2010.
USDA. 2008. National Nutrient Database for Standard Reference, Release 20.
www.nal.usda.gov/fnic/foodcomp/cgi-bin/list_nut_edit.pl. Accessed July 2009.
Vasconcelos, I. M., Maia, A. A. B., Siebra, E. A., Oliveira, J. T. A., Carvalho. A. F. F. U.,
Melo, V. M. M., Carlini, C. R., and Castelar, L. I. 2001. Nutritional study of two Brazilian
soybean (Glycine max) cultivars differing in contents of antinutritional and toxic proteins. J.
Nutr. Biochem. 12:55-62.
Walker, A. F. 1990. The contribution of weaning foods to Protein-Energy Malnutrition. Nutr.
Res. Rev. 3:25-47.
WHO. 2007. Protein and Amino Acid Requirements in Human Nutrition: Report of a Joint
WHO/FAO/UNU Expert Consultation. WHO Technical Report Series No. 935. World Health
Organization: Geneva.
Wikipedia. 2010. Laboratory rat: Albino rat. www.en.wikipedia.org/wiki/Laboratory_rat.
Accessed August 2010.