University of Pretoria
333
University of Pretoria© An explication of the problems with apparel fit experienced by female Kenyan consumers in terms of their unique body shape characteristics Anne Mastamet-Mason Thesis PhD Cons Sc (Clothing Management) Study leader: Prof HM de Klerk (University of Pretoria) Co-study leader: Prof SP Ashdown (Cornell University) November 2008 © University of Pretoria
-
Upload
khangminh22 -
Category
Documents
-
view
0 -
download
0
Transcript of University of Pretoria

University of Pretoria©
An explication of the problems with apparel fit experienced by female Kenyan consumers in terms of their unique body shape characteristics
Anne Mastamet-Mason Thesis
PhD Cons Sc (Clothing Management)
Study leader: Prof HM de Klerk (University of Pretoria) Co-study leader: Prof SP Ashdown (Cornell University)
November 2008
©© UUnniivveerrssiittyy ooff PPrreettoorriiaa

University of Pretoria©
An explication of the problems with apparel fit experienced by female kenyan consumers in terms of their unique body shape characteristics
By
Anne Mastamet-Mason
Submitted in fulfilment of the requirements for the degree
Doctor of Philosophy
In the Faculty of Natural and Agricultural Sciences Department of Consumer Science
University of Pretoria
Study leader: Prof HM de Klerk (University of Pretoria) Co-study leader: Prof SP Ashdown (Cornell University)
November 2008

i
Declaration
I, Anne Mastamet-Mason, hereby declare that this thesis that I submit for a PhD degree in
Consumer Science at the University of Pretoria is my original work and has not previously
been submitted for a degree at any other University.
.....................................
Anne Mastamet-Mason

ii
Dedication
I hereby dedicate this thesis to my late grandmother Tabutany, who saw worthiness in me,
my source of inspiration for life; my aunt Mrs Esther Towett, for taking care of me after my
grandmother passed away; and my late loving daddy Kibunei Kipkoskei Mastamet, who
acknowledged worthiness and value in me, and invested in my education; Batiem Selly Serser for her prayers and finally, my beloved children, Kipng’eno, Chepkurui and
Kiprono, for allowing me to take up my studies.

iii
Acknowledgements
Glory goes to Jehovah God, the Creator of the universe and all that dwell in it. I owe Him all
that I am and ever hope to be (Psalm 103). A large number of people and organisations have
contributed in various ways to the completion of this doctoral thesis. My gratitude to them is
boundless. There would have been no thesis at all without them. I would like to acknowledge
and express my sincere gratitude publicly to them:
Professor Elmarie de Klerk, my Study leader, for her professional guidance, advice,
support and encouragement throughout the four years of my study. You were always
my friend and my mentor.
Professor Susan Ashdown, Co-study leader, for her professional guidance, advice and
encouragement.
My beloved children, Kipng’eno, Chepkurui and Kiprono, for allowing me to study, and
for their patience, love, moral support and belief in me throughout my studies. Though
it was difficult to let me go sometimes, we still agreed that I pursue the studies to the
end.
The German Academic Exchange Service, for their financial support through the four
years of my studies.
Moi University for granting me study leave for four years.
University of Pretoria, for the bursary granted in support of my data collection.
Jacqui Sommervile, research consultant, for her friendly advice regarding the
questionnaire, appropriate statistics and data analysis.
Dr G Crafford, statistician, for the advice regarding the questionnaire and appropriate
statistics applicable for my study.
Lorraine MacDuff, Ergonomic Technologies, for training and assisting me on issues
related to anthropometric measurements.
Trudie Erasmus, for editing and refining my photos and formatting my thesis.
Dr Anna-Mart Bonthuys for proofreading and editing my thesis.
Thea Tselepis, for her moral support.
All the staff members at the Department of Consumer Science, University of Pretoria,
for their support and encouragement.
My research assistant Chebet Keter for her help during my data collection.

iv
All the head teachers and staff members of high schools in Nairobi, Eldoret and
Kisumu, for allowing me to conduct my research in their respective schools.
My mother Tabsabei Mastamet and stepmother Sarah Mastamet for their loving
support and taking care of Kiprono, while I was studying.
My lovely brother Kiplang’at Bunei Mastamet and his wife Jane Bunei, for their sincere
love, support and kindness. You acted as parents to my children and me. You patiently
took up all my responsibilities and turned them into yours.
Mr Philip Arap Mason, for supporting and taking care of the children Kipng’eno and
Chepkurui while I was studying.
My sisters, Mrs Chepkorir Bett and Ms Bornice Nyaega and their families, for taking
care of Kiprono.
Dr Rose Otieno of Manchester Metropolitan University for inspiring me towards
research in sizing and fit. The clothing anthropometry course you taught me inspired
me to undertake this thesis.
Professor Priscilla Botha for teaching me research methods.
My friends Professor Ogembo Kachienga, Monicah Cheruiyot, Zakayo Cheruiyot, Dr
Chepkuto, Kamanda Mbuthia, Botai Ondego, Sang Mosonik, Dr Otieno Anyumba,
Daniel Goon, Rachel Karei, Zackayo Lang’at and many others, for their
encouragement and moral support.

v
List of Abbreviations
AATCC: Association of Textile Chemist and Colourist
AGOA: African Growth and Opportunity Act
ASTM: American Society for Testing and Materials
GOK: Government of Kenya
ISAK: International Society for Advancement of Kinanthropometry
ISO: International Organisation for Standardization
KEBS: Kenya Bureau of Standards
KEPZA: Kenya Export Processing Zone Authority
KNUT: Kenya National Union of Teachers
RATES: Regional Agricultural Trade Expansion Support Program
RMSS: Republic of South African Military Standards
UN: United Nations

vi
Abstract
An explication of the problems with apparel fit experienced by female Kenyan consumers in terms of their unique body shape characteristics
By
Anne Mastamet-Mason Study leader: Prof HM de Klerk Co-study leader: Prof SP Ashdown Department: Consumer Science
Degree: PhD in Consumer Science: Clothing Management
Problems related to apparel fit stem from a variety of factors, such as an outdated
anthropometric database from which sizing systems could be developed, lack of and/or
inadequate classified body forms, non-standardised communication of sizing and fit and non-
standardised fit quality management, amongst the clothing industries (Chun-Yoon & Jasper,
1996; Holzman, 1996; Winks, 1997; Desmarteau, 2000; Anderson, Brannon, Ulrich, Presley;
Woronka; Grasso & Stevenson, 2001; Ashdown, 2003; Simmons & Istook, 2004).
Anthropometric data in Kenya was taken in 1975 and the measurements were obtained from
girls and women of Kenya’s learning institutions and organisations (KEBS, 2001). The source
of the original data from which the size tables were derived is obscure, to authenticate the
quality of the techniques and instruments used for the data collection. Apparently, there is no
known research that has been carried out on clothing anthropometry, sizing (body
measurements) and fit (body shape) for women. In the absence of representative sizing
systems, wrong styles and sizes based on estimates and not on the actual sizes and body
shapes of women consumers in Kenya, contribute to fit problems. Consumers’ lack of
knowledge about size (body measurements) and fit (body shape) issues also contributes to
the disillusionment, confusion and inappropriate apparel selection. Consumers’ fit
preferences contribute to fit problems, if the available styles do not consider consumers’
body shapes, and even further, if the consumers are uninformed about their shapes and how
to dress accordingly.

vii
The aim of this research was therefore to identify and describe distinctive female body
shapes of career women in Kenya using body dimensions and photographs, to describe the
differences between the emerging distinctive body shapes (measurements and photographs)
and the Western distinctive shapes, and to finally describe and analyse implications for the fit
of apparel associated with the emerging distinctive body shapes of Kenya’s career women. It
also intended to assess and describe career women’s self-perceived fit issues with the
ready-made apparel in Kenya, to determine and describe Kenyan career women’s
knowledge about the communication of size (key body dimensions) and fit (body shapes),
and also to determine and describe career women’s fit preferences for differently fitted
apparel items in Kenya.
This research is descriptive as an attempt is made to describe and understand body
shape(s) and tendencies in consumers’ behaviour regarding fit issues. It is exploratory as it
aims to obtain insight into a relatively new area of study, namely identification of the most
prevalent (distinctive) body shape of Kenya’s career women, consumers’ perceived size and
fit issues, their knowledge about size and fit, and their fit preferences. Various theories were
consulted and adapted in this study, while practical training in anthropometry and
photography was undertaken to ensure that measurements and photographs were taken
accurately and reliably. Traditional anthropometric-related theories and standards of
obtaining body measurements were consulted and applied. Photography rules were set and
observed while photographing the women.
Phase one of the study focused on the variables in the body characteristics thought to be
appropriate for identifying and describing distinctive female body shapes. Phase two applied
the quantitative research that focused on the variables obtained from fit problems with
apparel, the communication of size and fit, and fit preferences. A structured questionnaire
was used to get the broader picture of the respondents’ perceived fit problems, their
knowledge about the communication of size and fit, as well as their fit preferences for
differently fitted apparel items. The questionnaire measured specific dimensions of fit
problems with apparel, the communication of size and fit, as well as fit preferences. The body
dimensions that were recorded, body evaluations, and the responses to the questionnaire
were coded, captured and analysed.
It is apparent from this study that the most dominant body shape is a curvy rectangular
shape that differs not only from the ideal (hourglass) body shape, but also from the Western
(USA) prevalent straight rectangular shape. The fit problems such as tight hips, crotch, bust

viii
and stomach experienced by Kenya’s career women are therefore inevitable, as confirmed
by the dissatisfaction with the unavailability of appropriate styles for their sizes and shapes.
It is clear that most Kenyan female consumers are familiar with the non-informative lettered
and numbered size labels, but unfamiliar with size label terms that represent established
body types. They understand neither the meanings of various size and fit descriptions, nor
their own key body dimensions; this leads to confusion as to where the cause of their
problems lies.
Apparently most Kenyan career women consumers prefer fitted and semi-fitted skirts and
jackets. In the absence of a distinctive body shape in Kenya, it is possible that the available
styles do not cater for their curvy rectangular body shape; hence, they experience fit
problems. Consumers’ lack of knowledge about body shape may also lead to inappropriate fit
preferences that do not take into account their distinctive body shape and its critical fit points.
This study makes certain recommendations to the ready-made apparel industry in Kenya and
foreign companies that export their apparel items to Kenya, government agencies such as
the Kenya Bureau of Standards, and to consumer-oriented organisations. The results
contribute to the body of knowledge regarding the theory of apparel size and fit, Ashdown’s
sizing systems theory, research methodology theory, and consumer education theory.

ix
Table of Contents
DECLARATION........................................................................................................................ i
DEDICATION .......................................................................................................................... ii
ACKNOWLEDGEMENTS ...................................................................................................... iii
LIST OF ABBREVIATIONS .................................................................................................... v
ABSTRACT............................................................................................................................ vi
LIST OF TABLES.................................................................................................................. xx
LIST OF FIGURES.............................................................................................................. xxii
LIST OF APPENDICES...................................................................................................... xxvi
1. AN OVERVIEW OF THE STUDY .............................................................................. 1
1.1 INTRODUCTION ....................................................................................................... 1
1.2 THEORETICAL BACKGROUND ............................................................................... 2
1.2.1 Overview of the ready-made apparel in Kenya .......................................................... 2
1.2.2 Female consumers and marketing issues ................................................................. 5
1.3 STATEMENT OF THE PROBLEM ............................................................................ 7
1.4 PRIMARY OBJECTIVES AND SUB-OBJECTIVES................................................. 10
1.5 EXPECTED SIGNIFICANCE OF THE STUDY........................................................ 11
1.5.1 Emerging distinctive female body shapes................................................................ 11
1.5.2 Career women’s perception regarding general fit problems with the ready-made
apparel in Kenya ...................................................................................................... 11
1.5.3 Consumers’ knowledge about the communication of size and fit ............................ 12

x
1.5.4 Consumers’ fit preferences ...................................................................................... 12
1.5.5 Contribution to existing theory ................................................................................. 12
1.6 STUDY OUTLINE .................................................................................................... 13
2. THEORETICAL FRAMEWORK FOR THE STUDY ................................................ 15
2.1 INTRODUCTION ..................................................................................................... 15
2.2. SIZING SYSTEMS ................................................................................................... 15
2.3 POPULATION MEASUREMENTS (SOURCES OF SIZING SYSTEMS) ................ 18
2.3.1 Traditional tailor or dressmaker’s measurements .................................................... 19
2.3.2 Anthropometry ......................................................................................................... 20
2.3.2.1 Developing sizing systems from anthropometric database...................................... 24
2.3.3 Three-dimensional body scanning ........................................................................... 25
2.4 DESIGN FEATURES ............................................................................................... 27
2.4.1 Functional features .................................................................................................. 29
2.4.2 Materials .................................................................................................................. 30
2.4.3 Production................................................................................................................ 31
2.4.3.1 Design creation stage (fashion illustration) .............................................................. 32
2.4.3.2 Pattern creation........................................................................................................ 32
2.4.3.3 Cutting room ............................................................................................................ 34
2.4.3.4 Assembly ................................................................................................................. 36
2.4.3.5 Pressing and finishing .............................................................................................. 36
2.4.4 Distribution ............................................................................................................... 37
2.4.5 Style choices ............................................................................................................ 38
2.5 FIT ISSUES ............................................................................................................. 39
2.5.1 Perception of fit ........................................................................................................ 40

xi
2.5.2 Objective measure of fit ........................................................................................... 41
2.5.3 Fit testing ................................................................................................................. 42
2.5.4 Wear testing ............................................................................................................. 43
2.6 COMMUNICATION OF SIZING AND FIT ................................................................ 44
2.6.1 Size labels’ quality and consumers’ apparel selection ............................................. 45
2.6.1.1 Uninformative size labels ......................................................................................... 46
2.6.1.2 Informative size labels (Figure 2.5) .......................................................................... 48
2.7 CONCLUSION AND IMPLICATIONS FOR THE STUDY ........................................ 50
2.7.1 Population measures ............................................................................................... 50
2.7.2 Design features ........................................................................................................ 50
2.7.3 Fit issues .................................................................................................................. 50
2.7.4 Communication of sizing and fit ............................................................................... 51
3. SPECIFIC SUPPORTING LITERATURE REVIEW AND CONCEPTUALISATION 53
3.1 INTRODUCTION ..................................................................................................... 53
3.1.1 The concept of fit ..................................................................................................... 53
3.2 BODY SHAPE.......................................................................................................... 55
3.2.1 Ideal body shape...................................................................................................... 56
3.2.2 Established body types in some selected countries ................................................ 60
3.2.2.1 Classification of body types in the United States of America ................................... 61
3.2.2.2 Classification of body types in the United Kingdom ................................................. 62
3.2.2.2 Classification of body types in the Republic of Germany ......................................... 62
3.2.3 Commonly used established body types ................................................................. 63
3.2.3.1 Triangle body shape ................................................................................................ 63
3.2.3.2 Inverted triangle body shape.................................................................................... 66

xii
3.2.3.3 Rectangle body shape ............................................................................................. 69
3.2.3.4 Hourglass body shape ............................................................................................. 71
3.2.3.5 Apple body shape .................................................................................................... 72
3.2.4 General factors critical to apparel’s fit (applicable to all body shapes) .................... 74
3.2.4.1 Posture..................................................................................................................... 74
3.2.4.2 Upper arm ................................................................................................................ 75
3.3 TECHNIQUES USED FOR THE CLASSIFICATION OF BODY SHAPES .............. 76
3.3.1 Key dimensions necessary for the development of body shape .............................. 77
3.3.2 Key physical characteristics of the body necessary for the development of body
shape ....................................................................................................................... 78
3.4 FACTORS EXTERNAL TO APPAREL MANUFACTURE THAT MAY CONTRIBUTE
TO POOR FIT OF READY-MADE APPAREL (FIGURE 3.23)................................. 81
3.4.1 Consumers’ fit preferences ...................................................................................... 83
3.4.2 Consumers’ preference for an ideal body shape ..................................................... 85
3.4.3 Knowledge about the communication of apparel sizing and fit ................................ 86
3.5 CONCLUSIONS....................................................................................................... 90
3.5.1 Female body shape classifications .......................................................................... 91
3.5.2 Consumers’ knowledge about size and fit communication systems ........................ 91
3.5.3 Fit preferences ......................................................................................................... 91
4. RESEARCH METHODOLOGY ............................................................................... 94
4.1 INTRODUCTION ..................................................................................................... 94
4.2 PRIMARY OBJECTIVES AND SUB-OBJECTIVES OF THE STUDY ..................... 97
4.3 RESEARCH STRATEGY CHOSEN FOR THIS STUDY ......................................... 98
4.4 CHOICE OF THE RESEARCH SAMPLE FOR THE STUDY .................................. 99

xiii
4.4.1 Units of analysis for the study .................................................................................. 99
4.4.2 Sample selection for the study ............................................................................... 100
4.4.3 Initial plan of sample selection for both phases of the study.................................. 101
4.4.4 Limitations of the predetermined sample while at grass-roots level ...................... 103
4.4.5 Emergence of qualitative (snowball) technique within quantitative (systematic
sampling) technique ............................................................................................... 103
4.5 CHOICE, DESCRIPTION AND APPLICATION OF THE DATA COLLECTION
TECHNIQUES ....................................................................................................... 105
4.5.1 Body dimensions and photographs for body shape classification (First phase of the
study – Objective 1) ............................................................................................... 105
4.5.1.1 Preparations for measuring and photographing exercises .................................... 106
4.5.2 Structured questionnaire (Second phase of the study – Objectives 2, 3 and 4) .... 115
4.6 DATA ANALYSIS ................................................................................................... 119
4.6.1 Data obtained from phase one............................................................................... 119
4.6.1.1 Data obtained from career female’s body dimensions ........................................... 119
4.6.1.2 Data obtained from the career female’s photographs ............................................ 121
4.6.2 Data obtained from the second phase of the study (Questionnaire – Objectives 4, 5
and 6)..................................................................................................................... 132
4.6.2.1 Explanations of statistical methods used for the second phase ............................ 135
4.6.2.2 Operationalisation for phase two data (Questionnaire).......................................... 137
4.7 QUALITY OF THE DATA ....................................................................................... 140
4.7.1 Validity and reliability of phase one data (body dimensions and photographs –
Objective 1) ............................................................................................................ 140
4.7.1.1 Body dimensions.................................................................................................... 140
4.7.1.2 Photography and sensory evaluation methods ...................................................... 140
4.7.2 Validity and reliability of phase two data (Questionnaire – Objectives 2, 3 and 4) 141

xiv
4.7.2.1 Reliability................................................................................................................ 141
4.7.2.2 Validity ................................................................................................................... 142
4.8 ETHICS AND POLITICS ........................................................................................ 142
4.8.1 Training .................................................................................................................. 143
4.8.2 Plagiarism .............................................................................................................. 143
4.8.3 Participants’ privacy ............................................................................................... 144
4.8.4 Accountability......................................................................................................... 144
5. DATA ANALYSIS AND DISCUSSION OF THE FINDINGS BASED ON PHASE ONE DATA ............................................................................................................ 145
5.1 INTRODUCTION ................................................................................................... 145
5.2 IDENTIFICATION AND DESCRIPTION OF DISTINCTIVE FEMALE BODY
SHAPE(S) OF CAREER WOMEN IN KENYA FROM BODY DIMENSIONS
(PRIMARY OBJECTIVE 1 (SUB-OBJECTIVE 1)) ................................................. 145
5.2.1 Identification of height, bust extension, buttock extension, thigh bulge and the arc
dimensions categories ........................................................................................... 145
5.2.2 Body shape identification ....................................................................................... 151
5.2.3 Height proportions.................................................................................................. 152
5.2.4 Summary of body shape identification from body dimensions (Primary objective 1
(Sub-objective 1))................................................................................................... 154
5.3 IDENTIFICATION AND DESCRIPTION OF THE DISTINCTIVE FEMALE BODY
SHAPE (S) OF PROFESSIONAL WOMEN IN KENYA FROM PHOTOGRAPHS
(OBJECTIVE 1 (SUB-OBJECTIVE 2))................................................................... 154
5.3.1 Body build/size categories (V4 on the body shape assessment scale) ................. 155
5.3.2 Bust/shoulder width versus hip width appearance, and waist size versus hip width
(V5 and V6 on the assessment scale) ................................................................... 157
5.3.3 Stomach and buttocks appearances (V7 and V8 on the body shape assessment
scale) ..................................................................................................................... 158

xv
5.3.4 Upper back curvature and the back waist curvature/shape (V9 and V10 on the body
shape assessment scale) ...................................................................................... 159
5.3.5 Thigh bulge, upper arm and shoulder categories (V11, V12 and V13 on the body
shape assessment scale) ...................................................................................... 161
5.3.6 Body shape form (variable 14 on the body shape assessment scale)................... 163
5.4 DESCRIBING ASSOCIATIONS BETWEEN THE DISTINCTIVE SHAPES
EMERGING FROM BODY DIMENSIONS AND THOSE EMERGING FROM THE
PHOTOGRAPHS OF THE CAREER WOMEN (OBJECTIVE 1 (SUB-OBJECTIVE
3))........................................................................................................................... 164
5.4.1 Comparing the characteristics of the distinctive body shape emerging from the body
dimensions and from the evaluations of the photographs ..................................... 164
5.4.2 Summary on the identification of body shapes through body dimensions as well as
evaluation of photographs...................................................................................... 166
5.5 DISTINGUISHING AND DESCRIBING DIFFERENCES BETWEEN THE
EMERGING DISTINCTIVE BODY SHAPES (FROM DIMENSIONS AND
PHOTOGRAPHS) AND THE WESTERN DISTINCTIVE BODY SHAPE (PRIMARY
OBJECTIVE 2) ....................................................................................................... 166
5.6 SCRUTINISING AND DESCRIBING FIT IMPLICATIONS ASSOCIATED WITH THE
EMERGING DISTINCTIVE RECTANGULAR BODY SHAPE OF CAREER WOMEN
(PRIMARY OBJECTIVE 3) .................................................................................... 170
5.6.1 Fit implications for apparel associated with the curvy female rectangular body shape
............................................................................................................................... 171
5.6.1.1 Fit implications associated with the size of the buttocks/derriere and the thighs ... 171
5.6.1.2 Fit implications associated with the large stomach size........................................ 172
5.6.1.3 Fit implications associated with the large bust ....................................................... 173
5.6.1.4 Fit implications associated with the rounded upper back, the hollow back waist and
the imbalanced back and front features ................................................................. 173
5.6.1.5 Fit implications associated with the large top arm ................................................. 174

xvi
5.7 CONCLUSIONS REGARDING FIT IMPLICATIONS ASSOCIATED WITH THE
CURVY RECTANGULAR BODY SHAPE .............................................................. 175
6. DATA ANALYSIS AND DISCUSSION OF THE FINDINGS BASED ON PHASE TWO DATA (QUESTIONNAIRE) .......................................................................... 177
6.1 INTRODUCTION ................................................................................................... 177
6.2 DEMOGRAPHIC ANALYSIS OF THE POPULATION (Questions 1 and 2) .......... 177
6.2.1 Age distribution (Question 1) ................................................................................. 177
6.2.2 Career women’s professional background in Home Science and/or Clothing and
Textiles (Question 2) .............................................................................................. 178
6.3 ANALYSIS AND INTERPRETATION OF THE RESEARCH OBJECTIVES 4, 5 AND
6 ............................................................................................................................. 178
6.3.1 Primary objective 4: To assess and describe career women’s self-perceived fit
issues with the ready-made apparel in Kenya (Questions 3, 4)............................. 178
6.3.1.1 Sub-objective 4.1: To investigate career women’s perception of fit with different
apparel categories that are sold in various retail stores in Kenya (Question 3 and 4)
............................................................................................................................... 178
6.3.1.2 Sub-objective 4.2: To describe fit problems that career women in Kenya encounter
regarding the specific critical fit points of different parts of their bodies (Question 22)
............................................................................................................................... 180
6.3.1.3 Sub-objective 4.3: To describe career women’s degree of satisfaction with the
process of finding appropriate ready-made apparel items in Kenya (Question 21) 184
6.3.1.4 Sub-objective 4.4: To explore career women’s self-perceived sources of fit problems
with apparel in Kenya (Question 20) ...................................................................... 185
6.3.2 Primary objective 5: To determine and describe Kenyan career women’s knowledge
about the communication of size (key body dimensions) and fit (body shapes) .... 186
6.3.2.1 Sub-Objective 5.1: To explore Kenyan career women’s knowledge about the
communication of size (Question 6, 13, 14, 15, 16, 17 and 18)............................. 186
6.3.2.2 Sub-objective 5.2: To explore Kenyan career women’s knowledge about the
communication of fit (Questions 5, 7, 8, 9, 10, 11 and 12) .................................... 193

xvii
6.3.3 Primary objective 6: To determine and describe how career women’s preferences
for differently fitted skirts and jackets may contribute to fit problems with apparel
(Question 19) ......................................................................................................... 200
6.4 OVERALL DISCUSSION OF THE RESEARCH OBJECTIVES............................. 202
6.4.1 Assessing and describing career women’s self-perceived fit issues with the ready-
made apparel in Kenya (Primary objective 4) ........................................................ 202
6.4.2 Determining and describing Kenyan career women’s knowledge about the
communication of size (key body dimensions) and fit (body shapes) (Primary
objective 5)............................................................................................................. 202
6.4.3 Determining and describing how career women’s fit preferences for differently fitted
skirts and jackets may contribute to fit problems in Kenya (Primary objective 6) .. 212
7. CONCLUSIONS, EVALUATIONS, CONTRIBUTIONS TO THEORY AND RECOMMENDATIONS ......................................................................................... 214
7.1 Introduction ............................................................................................................ 214
7.2 GENERAL CONCLUSIONS REGARDING PHASE ONE DATA ........................... 215
7.2.1 Conclusions regarding the distinctive female body shape of career women in Kenya
(Objective 1)........................................................................................................... 215
7.2.2 Conclusions regarding differences between the distinctive body shapes of Kenya’s
career women and the Western (American) distinctive body shapes (Objective 2)215
7.2.3 Conclusions regarding apparel fit problems associated with the distinctive body
shapes of Kenya’s career women (Objective 3) .................................................... 217
7.3 GENERAL CONCLUSIONS REGARDING PHASE TWO DATA........................... 218
7.3.1 Conclusions concerning career women’s self-perceived fit issues with the ready-
made apparel in Kenya (Objective 4)..................................................................... 218
7.3.2 Conclusions regarding Kenyan career women’s knowledge about the
communication of size (key body dimensions) and fit (body shapes) (Objective 5)220
7.3.3 Conclusions regarding Kenyan career women’s fit preferences for differently fitted
apparel items in Kenya (Objective 6) ..................................................................... 222
7.4 OVERALL CONCLUSION OF THE STUDY .......................................................... 223

xviii
7.4.1.1. Population measures and the distinctive body shape ............................................ 224
7.4.1.2. Design features and the distinctive body shape .................................................... 225
7.4.1.3. Fit issues and the distinctive body shape ............................................................. 225
7.4.1.4. Communication of sizing and fit, the distinctive body shape and the key body
dimensions ............................................................................................................ 227
7.4.2 Overall conclusions based on Consumers’ perspective regarding matters that could
affect apparel’s size and fit .................................................................................... 228
7.4.2.1 Consumer’s lack of knowledge about the communication of sizing and fit ............ 228
7.4.2.2 Consumers’ preference for an hourglass body shape ........................................... 229
7.4.2.3 Consumers’ fit preferences .................................................................................... 229
7.4.2.4 Consumers’ perceived fit problems........................................................................ 229
7.4.2.5. Consumer’s perceived sources of fit problems ...................................................... 231
7.5 EVALUATION OF THE STUDY ............................................................................. 231
7.5.1 Research strategy .................................................................................................. 231
7.5.1.1 Choice of the research sample for the study ......................................................... 233
7.5.1.2 The choice and application of the data collection techniques ................................ 233
7.5.1.3 Choice of statistical methods employed................................................................. 236
7.5.2 Quality of the data .................................................................................................. 237
7.5.2.1 Quality of phase one data (body dimensions and photographs)............................ 237
7.5.2.2 Quality of phase-two data (Questionnaire) ............................................................ 238
7.5.3 Achievement of the objectives of the study............................................................ 239
7.6 THE CONTRIBUTIONS OF THE STUDY TO EXISTING THEORY ...................... 239
7.6.1 The theory of fit ...................................................................................................... 240
7.6.2 Ashdown’s sizing systems theory .......................................................................... 240

xix
7.6.3 Theory of size labels .............................................................................................. 241
7.6.4 Research methodology theory ............................................................................... 242
7.6.5 Consumer education theory ................................................................................... 242
7.7 GENERAL RECOMMENDATIONS ....................................................................... 243
7.7.1 The ready-made apparel industry (manufacturers and retailers) ........................... 243
7.7.2 Government agencies and consumer-oriented organisations ............................... 245
7.8 LIMITATIONS OF THE STUDY AND SUGGESTIONS FOR FUTURE STUDIES 246
REFERENCES .................................................................................................................... 248

xx
List of Tables
TABLE 2.1: NUMERICAL SIZE LABELS .......................................................................... 47 TABLE 4.1: CRITERIA USED FOR SELECTING THE CAREER WOMEN .................... 100
TABLE 4.2: THE STRUCTURE OF THE QUESTIONNAIRE (SECOND PHASE) .......... 117
TABLE 4.3: OPERATIONALISATION OF PHASE ONE DATA IN TERMS OF PRIMARY
OBJECTIVES, SUB-OBJECTIVES AND STATISTICAL METHODS........... 132
TABLE 4.4: OPERATIONALISATION OF THE PHASE TWO DATA (QUESTIONNAIRE)
..................................................................................................................... 138
TABLE 5.1: PERCENTAGE DISTRIBUTIONS OF HEIGHT, BUST EXTENSION,
BUTTOCK EXTENSION AND THIGH BULGE CATEGORIES (n = 123) .... 146
TABLE 5.2: PERCENTAGE DISTRIBUTIONS OF THIGH BULGE, SHOULDER
CATEGORIES AND ARC AT KEY REGIONS (n = 123).............................. 149
TABLE 5.3: PERCENTAGE DISTRIBUTION OF BUST CUP CATEGORIES (n = 107). 150
TABLE 5.4: PERCENTAGE DISTRIBUTION OF BODY SHAPES (n = 123).................. 152
TABLE 5.5: PERCENTAGE DISTRIBUTION OF HEIGHT PROPORTIONS (n = 123) .. 153
TABLE 5.6: PERCENTAGE DISTRIBUTIONS OF BODY BUILD/SIZE CATEGORIES (n =
89) ................................................................................................................ 155
TABLE 5.7: BODY BUILD/SIZE AMONG DIFFERENT AGE GROUPS ......................... 156 TABLE 5.8: PERCENTAGE DISTRIBUTION OF THE BUST/SHOULDER AND WAIST
SIZE APPEARANCE VERSUS THE HIP WIDTH APPEARANCE (n = 89). 157
TABLE 5.9: PERCENTAGE DISTRIBUTION OF COMMON STOMACH AND BUTTOCKS
SHAPES (n = 89) ......................................................................................... 158
TABLE 5.10: PERCENTAGE DISTRIBUTION OF COMMON STOMACH SHAPES
ACCORDING TO AGE GROUPS (n = 89)................................................... 159 TABLE 5.11: PERCENTAGE DISTRIBUTION OF THE UPPER BACK AND THE BACK
WAIST CURVATURES (n = 89)................................................................... 160
TABLE 5.12: PERCENTAGE DISTRIBUTION OF THE UPPER BACK AND BACK WAIST
CURVATURES AMONG DIFFERENT AGE GROUPS (n = 89) .................. 161
TABLE 5.13: PERCENTAGE DISTRIBUTION OF THE UPPER ARM, THIGH BULGE AND
SHOULDER SHAPE CATEGORIES (n = 89) .............................................. 162
TABLE 5.14: PERCENTAGE DISTRIBUTIONS OF BODY SHAPE CATEGORIES (n = 89)
..................................................................................................................... 163

xxi
TABLE 5.15: DISTINCTIVE BODY FEATURES IDENTIFIED USING BODY DIMENSIONS
AND VISUAL EVALUATIONS OF PHOTOGRAPHS................................... 165
TABLE 6.1: FIT PROBLEMS ENCOUNTERED AT THE UPPER PART OF THE TORSO
..................................................................................................................... 181
TABLE 6.2: FIT PROBLEMS ENCOUNTERED AT THE LOWER TORSO .................... 182
TABLE 6.3: FIT PROBLEMS ENCOUNTERED AT THE ARMS..................................... 183 TABLE 6.4: APPROPRIATE APPAREL STYLES FOR DIFFERENT BODY SHAPES... 198

xxii
List of Figures
FIGURE 2.1: THEORETICAL FRAMEWORK ................................................................. 17
FIGURE 2.2: ANATOMICAL POINTS USED IN LOCATING BODY LANDMARKS ON
ANTERIOR POSITION............................................................................... 21
FIGURE 2.3: ANATOMICAL POINTS USED IN LOCATING BODY LANDMARKS ON
POSTERIOR POSITION............................................................................ 22
FIGURE 2.4: ANATOMICAL POINTS USED IN LOCATING BODY LANDMARKS ....... 23
FIGURE 2.5: INFORMATIVE SIZE LABELS ................................................................... 48
FIGURE 3.1: IDEAL BODY SHAPE ................................................................................ 57
FIGURE 3.2: HEIGHT PROPORTIONS .......................................................................... 58
FIGURE 3.3: TRIANGLE BODY SHAPE......................................................................... 63
FIGURE 3.4: STRAINED FABRIC CUPS ABOVE BROADEST BUTTOCK REGION ... 65
FIGURE 3.5: WRINKLES AROUND THE FULLEST PART OF THE THIGH/HIP ........... 65
FIGURE 3.6: NARROW SHOULDERS AND/ OR BUST................................................. 66
FIGURE 3.7: INVERTED TRIANGLE BODY SHAPE...................................................... 67
FIGURE 3.8: BUST CUP ................................................................................................ 67
FIGURE 3.9: WRINKLES AT BUST REGION DUE TO LARGE BUST........................... 68
FIGURE 3.10: APPAREL FORMS WRINKLES AT SHOULDER REGION ....................... 69
FIGURE 3.11: APPAREL FORMS FOLDS AT HIP/THIGH REGION................................ 69
FIGURE 3.12: RECTANGLE BODY SHAPE..................................................................... 70
FIGURE 3.13: APPAREL FORMS WRINKLES AT WAIST/MIDRIFF REGION ................ 71
FIGURE 3.14: HOURGLASS BODY SHAPE .................................................................... 72
FIGURE 3.15: APPAREL FORMS FOLDS AT WAIST/MIDRIFF REGION....................... 72
FIGURE 3.16: APPLE BODY SHAPE ............................................................................... 73
FIGURE 3.17: WRINKLES AT WAIST/MIDRIFF REGION DUE TO FULL STOMACH .... 74

xxiii
FIGURE 3.18: POSTURES ............................................................................................... 75
FIGURE 3.19: FIT PROBLEMS RELATED TO POSTURE............................................... 75
FIGURE 3.20: UPPER ARM SIZES AND FIT PROBLEMS............................................... 76
FIGURE 3.21: SIDE VIEW BODY SHAPE’S STRIKING CHARACTERISTICS ................ 80
FIGURE 3.22: DEGREE OF PELVIC TILT........................................................................ 81
FIGURE 3.23: APPAREL MANUFACTURE’S INTERNAL AND EXTERNAL FACTORS
THAT MAY CONTRIBUTE TO FIT PROBLEMS WITH APPAREL............ 82
FIGURE 3.24: SCHEMATIC FRAMEWORK ..................................................................... 92
FIGURE 4.1: RESEARCH FRAMEWORK AND PHASES FOR THE STUDY ................ 96
FIGURE 4.2: GEOGRAPHICAL AREAS COVERED FOR THE RESEARCH............... 101
FIGURE 4.3: LANDMARKS AND BODY DIMENSIONS OBTAINED FOR BODY SHAPE
IDENTIFICATION..................................................................................... 110
FIGURE 4.4: MEASURING INSTRUMENTS................................................................. 112
FIGURE 4.5: HEIGHT MEASUREMENTS USING STANDING ANTHROPOMETER .. 112
FIGURE 4.6: PHOTOGRAPHING STUDIO SET UP..................................................... 114
FIGURE 4.7: DIFFERENT VIEWS OF BODY SHAPES................................................ 115
FIGURE 4.8: ESTABLISHED BODY SHAPES IN WESTERN SOCIETY ..................... 123
FIGURE 4.9: UNREFINED PHOTOS ............................................................................ 124
FIGURE 4.10: EDGED PHOTOGRAPHS ....................................................................... 125
FIGURE 4.11: SILHOUETTES EXTRACTED BY IGRAFX DESIGNER 5 SOFTWARE . 126
FIGURE 5.1: BUST AND BUTTOCKS EXTENSIONS .................................................. 147
FIGURE 5.2: IDEAL BODY SHAPE’S HEIGHT PROPORTIONS ................................. 153
FIGURE 5.3: BODY BUILD/SIZE VERSUS AGE .......................................................... 156
FIGURE 5.4: PROFILE VIEW CHARACTERISTICS AMONG DIFFERENT AGE
GROUPS.................................................................................................. 161
FIGURE 5.5: EMERGING BODY SHAPES FROM THE DIMENSIONS AND
EVALUATIONS ........................................................................................ 164
FIGURE 5.6: CONPARISON OF DISTINTIVE FEMALE BODY SHAPES IN KENYA AND
UNITED STATES .................................................................................... 167

xxiv
FIGURE 5.7: AMERICA’S BODY SHAPES................................................................... 167
FIGURE 5.8: KENYA’S BODY SHAPES ...................................................................... 168
FIGURE 5.9: SIDE VIEW CHARACTERISTICS OF AN APPLE SHAPE ASSUMED TO
BE AN APPROXIMATE REPRESENTATION OF THE SIDE VIEW
CHARACTERISTICS OF THE RECTANGULAR BODY SHAPE............. 168
FIGURE 5.10: CURVY RECTANGULAR BODY SHAPE ................................................ 169
FIGURE 5.11: CURVY TRIANGULAR BODY SHAPE .................................................... 170
FIGURE 6.1: QUALITY OF APPAREL CATEGORIES.................................................. 179
FIGURE 6.2: FIT QUALITY OF READY-MADE APPAREL SOLD AT DIFFERENT
RETAIL STORES..................................................................................... 180
FIGURE 6.3: CAREER WOMEN’S SATISFACTION WITH THE PROCESS OF FINDING
APPROPRIATE READY-MADE APPAREL ............................................. 184
FIGURE 6.4: CAREER WOMEN’S PERCEIVED SOURCES OF FIT PROBLEMS ...... 185
FIGURE 6.5: FAMILIARITY WITH AND PERCEIVED EFFECTIVENESS OF SIZE
LABELS.................................................................................................... 186
FIGURE 6.6: CAREER WOMEN’S KNOWLEDGE ABOUT SIZE LABELS................... 187
FIGURE 6.7: SCATTER PLOT COMPARING REPORTED BUST DIMENSIONS WITH
OBTAINED BUST DIMENSIONS............................................................. 189
FIGURE 6.8: SCATTER PLOT COMPARING REPORTED WAIST DIMENSIONS AND
OBTAINED WAIST DIMENSIONS........................................................... 190
FIGURE 6.9: SCATTER PLOT COMPARING REPORTED HIP DIMENSIONS WITH
OBTAINED HIP DIMENSIONS ................................................................ 190
FIGURE 6.10: SCATTER PLOT COMPARING REPORTED JACKET SIZES (BUST) WITH
THE OBTAINED BUST DIMENSIONS IN SIZE DESIGNATION OF 12 TO
24 ............................................................................................................. 191
FIGURE 6.11: SCATTER PLOT COMPARING REPORTED JACKET SIZES (BUST) WITH
THE OBTAINED BUST DIMENSIONS IN SIZE DESIGNATION OF 32 TO
50 ............................................................................................................. 192

xxv
FIGURE 6.12: CAREER WOMEN’S FAMILIARITY WITH AND KNOWLEDGE ABOUT
TERMS THAT REPRESENT BODY/FIGURE SHAPES 193
FIGURE 6.13: CAREER WOMEN’S DESCRIPTION OF THE PREVALENT
ILLUSTRATED BODY SHAPES .............................................................. 195
FIGURE 6.14: CAREER WOMEN’S SELF-REPORTED BODY SHAPE VERSUS THEIR
ACTUAL FIGURES FROM MEASUREMENTS ....................................... 196
FIGURE 6.15: BODY SHAPE ASSESSMENT TECHNIQUES APPLIED BY KENYAN
CAREER WOMEN ................................................................................... 197
FIGURE 6.16: SELECTED STYLES FOR THE REPORTED OWN FIGURE TYPE....... 199
FIGURE 6.17: CAREER WOMEN’S PERCEIVED IDEAL BODY SHAPE VERSUS
REPORTED OWN BODY SHAPE ........................................................... 199
FIGURE 6.18: CAREER WOMEN’S FIT PREFERENCES FOR DIFFERENTLY FITTED
SKIRTS AND JACKETS........................................................................... 201
FIGURE 7.1: DISTINCTIVE FEMALE BODY SHAPES IN AMERICA AND KENYA ..... 216
FIGURE 7.2: SIDE VIEW CHARACTERISTICS OF AMERICA’S AND KENYA’S
DISTINCTIVE RECTANGULAR BODY SHAPES.................................... 217
FIGURE 7:3: FACTORS THAT MAY CONTRIBUTE TO WOMEN’S DISSATISFACTION
WITH THE FIT OF APPAREL.................................................................. 223

xxvi
List of Appendices
APPENDIX 1A: QUESTIONNAIRE.................................................................................... 271
APPENDIX 1B: INTRODUCTORY LETTER TO THE MINISTER OF EDUCATION ......... 281
APPENDIX 1C: RESEARCH PERMIT FROM KENYA’S MINISTRY OF EDUCATION .... 282
APPENDIX 1D: RESEARCH PERMIT FROM ELDORET MINISTRY OF EDUCATION
REGIONAL OFFICE................................................................................. 284
APPENDIX 1E: RESEARCH PERMIT FROM KISUMU MINISTRY OF EDUCATION
REGIONAL OFFICE................................................................................. 285
APPENDIX 2A: ORIGINAL SAMPLE PLAN ...................................................................... 286
APPENDIX 2B: LIST OF SCHOOLS AT GRASS ROOT LEVEL ...................................... 287
APPENDIX 2C: SAMPLING PLAN WHILE AT GRASS ROOT LEVEL, RESPONSES TO
THE QUESTIONNAIRE AND PARTICIPATION IN THE MEASUREMENT
AND PHOTOGRAPHIC EXERCISE ........................................................ 289
APPENDIX 3A: BODY MEASUREMENT FORM............................................................... 291
APPENDIX 3B: RULES OBSERVED WHILE TAKING BODY DIMENSIONS................... 294
APPENDIX 3C: ANTHROPOMETRIC QUALIFICATIONS OF THE RESEARCHER........ 298
APPENDIX 3D: BODY SHAPE ASSESSMENT SCALE.................................................... 299
APPENDIX 4A: KENYA BUREAU OF STANDARDS SIZES............................................. 302
APPENDIX 4B: KENYA BUREAU OF STANDARDS SIZE LABELS ................................ 304

1
Chapter 1
AN OVERVIEW OF THE STUDY
1.1 INTRODUCTION
Female body shapes and proportions vary and change over time and between populations,
as a result of nutritional changes, lifestyles, ethnicity, age, grooming and concepts of ideal
beauty such as breast enlargement within different cultures. These differences have an
impact on the fit of the constructed apparel, be it ready-made or custom-made (Hillestad,
1980:121; Winks, 1997; Ashdown, 1998; Simmons & Istook, 2003). Given that ready-made
apparel depends on an accurate estimate of the distribution of body shapes and sizes within
a target population, it becomes necessary for every country, and even regions within
countries, to establish their own sizing systems based on the target population (Ashdown,
2000; Simmons, Istook & Devarajan, 2004a; Devarajan & Istook, 2004; Honey & Olds, 2007).
The problem of fit with ready-made apparel has gained a lot of attention recently as
consumers’ demands for well-fitted apparel are increasing. Dissatisfaction with fit is one of
the most frequently stated problems with garment purchases. Women have been reported to
be the most dissatisfied consumers (DeLong, Ashdown, Butterfield & Turnbladh, 1993;
Otieno, Harrow & Lea-Greenwood, 2005; Alexander, Connell & Presley, 2005a). This has
been witnessed by the emergence of mass-customisation establishments, which have been
facilitated by the use of body scanners in the developed countries. Through body scan
technology, body dimensions and shapes can easily and rapidly be extracted from a
population and converted immediately into body form categories, size charts and patterns for
garment production (Ashdown, 1998; Simmons & Istook, 2003; Ulrich, Anderson-Connell &
Wu, 2003; Ashdown, Loker & Adelson, 2004; Fiore, Lee & Kunz, 2004). Due to costs and
technical requirements, body scan technology would not be feasible in a less developed
country.
African developing countries such as Kenya also face similar apparel fit problems, but sizing
issues are often overlooked or regarded as unimportant issues, finally giving rise to non-
standardised size ranges that do not conform to the recommendations given by standard
bodies (Chun-Yoon & Jasper, 1995; Faust, Carrier & Baptiste, 2006). A lack of basic design
technologies such as computer-aided design and pattern design systems, in most apparel
industries, are an indication of the ignorance about the importance of size and fit and a

2
reluctance to respond to consumer demands (Mason, 1998). The increase in the number of
working women in Kenya, as in most parts of the world, can contribute to a surge in fashion
interest. Regrettably, the ready-made apparel items available in Kenya are not satisfactory in
terms of fit.
1.2 THEORETICAL BACKGROUND 1.2.1 Overview of the ready-made apparel in Kenya Kenya’s ready-made apparel manufacturers fall into two major categories, namely, those that
manufacture on a large scale, usually referred to as the industry manufacturers (formal
sector), and those that manufacture in mass, but in smaller quantities, comprising tailors,
dressmakers, and home sewers (informal sector) (Ongile & McCormick, 1996:40; Mason,
1998:98). The few remaining large-scale manufacturers can further be split into those
producing for the local market, and those that produce purely for export (Ongile &
McCormick, 1996:40). Ready-made apparel is defined as apparel items produced in advance
using standardised measurements (recorded size charts) as well as established body shapes
for a specific market (Stone, 1999:179; Bye, LaBat & DeLong, 2006:66). The size charts are
compiled from measurements taken from a large population using various techniques that
would influence the quality of the size charts and consequently the fit of ready-made apparel
(Winks, 1997).
In Kenya, however, the sources of the size database are, unknown and/or outdated, as the
available anthropometric data was collected in 1975 (Kenya Bureau of Standards, KEBS,
2001- Appendix 4A). This information is ambiguous since the original source of the
anthropometric data mentioned is unknown. The size standards, do not give any breakdown
of body shapes or population representations of different sizes. Body dimension charts need
to be revised frequently to keep abreast with continuous biological changes that occur in
individuals and generations (Brunn, 1983; Winks, 1997; Le Pechoux & Ghosh, 2002:13;
Olds, 2003; Bye, LaBat & DeLong, 2006:66). It is assumed that the size charts used in
Kenya’s apparel industries, are borrowed or copied from foreign established charts. It has
been observed that existing size charts used by most manufacturers were copied or adapted
in the hope that they would also work for their target market (Winks, 1997; Zwane &
Magagula, 2006). However, since people’s shapes and sizes vary, adapted sizing systems
would result in ill-fitting apparel items.

3
Apparel production, trade, and consumption are currently undergoing dramatic upheavals in
Kenya. Domestic production of ready-made apparel for local consumption has declined
tremendously as the industry operates in an environment characterised by competition from
imports of new and second-hand apparel as well as counterfeit textile products (Mason
1998:96; Regional Agricultural Trade Expansion Support (RATES) Program, 2003:4).
Significant changes in the global regulatory environment affecting Kenya, including
preferential trade agreements with the European Union (the Cotonou Convention of 2000)
and the United States (the African Growth and Opportunity Act, passed by the United States
Congress in 2000), have resulted in tremendous growth in emerging export apparel
production just prior to the upcoming end of the Multi-fibre Agreement in 2005 (Omolo,
2006). The increasing importation of second-hand apparel, banned in Kenya until the 1990s,
has likewise profoundly affected production of, trade in, and consumption of apparel
(McCormick, Kimuya & Kinyanjui, 2001; KEPZA, 2005). Nevertheless, the textile industry
ranks first among Kenya’s manufacturing sectors in terms of both size and employment
(GOK, 2000; RATES, 2003:11). Existing apparel manufacturers produce various types of
apparel items, both for the local market and for export. Local apparel manufacturers supply
only 45% of the Kenyan textile market requirements, while imported new and second-hand
apparel accounts for about 37% of the market. The demand for textile products in the country
is estimated to be growing at 3.8% annually (Ministry of Trade and Industry in KEPZA,
2005:7).
The lack of competitiveness has been highlighted as a major obstacle for the growth in the
local apparel manufacturing industry (McCormick et al., 2001). Local ready-made apparel is
poor in terms of fit, design, materials and workmanship. These problems have been seen as
resulting from a lack of skilled personnel, outdated, under-utilised and insufficient machinery
to tackle specialised work and furthermore, unreliable body dimensions, and lack of
information about the uniquely Kenyan body shape, particularly for females. The latter aspect
forms the most important component determining the quality of apparel (Ongile &
McCormick, 1996:40-41; Mason, 1998:98). With the worldwide continuous increase in
international trade in apparel, Kenya – like many other countries – has also witnessed
enormous growth in ready-to-wear women’s apparel retailing. Many apparel retail stores
operating throughout the major cities and towns of the country, bear witness to this. Although
locally produced ready-made apparel in Kenya accounts for 45% of all ready-made apparel
supplied to the local market, this figure is likely to decline as consumers become more
exposed and critical to the way an apparel item fits. The sound traditional custom-made
apparel as well as the imported new and second-hand ready-made apparel are an indication
that consumers’ consumption pattern would soon lean more towards apparel items that are
likely to satisfy their needs (Ongile & McCormick, 1996:40; Mason, 1998).

4
The tailors/dressmakers and/or home sewers custom-tailor each apparel item to the personal
dimensions of the wearer. Within the custom-made sewing process, various measurements
of the body are directly taken and transposed to the relevant parts of the pattern, to be used
in cutting out apparel items (Tamburrino, 1992b). Within the custom-made tailoring, the
mastery of the unique relation of the body’s characteristics to the apparel produces apparel
items that would fit the three-dimensional body as plausibly as possible. However, some
“trying-on” and provisional adjustments are necessary with custom-made apparel, particularly
with elaborate styles, high quality and complex garments, which require a much closer fit
(Tamburrino, 1992b). According to Bye, LaBat and DeLong (2006), the tailor’s interaction
with the consumers as they are measured, facilitates a deeper understanding of the body
shapes’ components that need to be critically transformed into well-fitting apparel. Although
custom-made apparel is supposed to provide the best fit as opposed to all other types of
apparel items available in the market, regrettably, Mason (1998:137-138) reported that most
tailors/dressmakers in Nairobi-Kenya, have very low skills and work with inadequate tools
and machinery that may actually contribute to the poor fit. Linking the body’s proportions to
the fabrics and transposing them to three-dimensional apparel items could be a great
challenge to tailors with only the most basic or very scant skills.
Although some of the second-hand clothes have been used in their home country, the
apparel items may still be in a good condition and in most cases bear designer labels/names
such as Armani, DK, Calvin Klein and/or famous brands such as Levi, Lee, Brooks Brothers,
Marks and Spencer, Dorothy Perkins and many others. They are more often unique, made of
high quality fabrics and workmanship, and are usually sold at affordable prices (Ongile &
McCormick in McCormick & Pedersen, 1996:40; Hurreeram & Little, 2005; Mhango & Niehm,
2005). Some of the second-hand apparel bear self-descriptive labels, which act as a guide
during selection and hence contribute to the consumer’s satisfaction with the fit. All these
characteristics collectively render the second-hand clothes quite popular in Kenya’s market.
Regrettably however, the fit problems of the ready-made apparel are also experienced with
the popular custom-made as well as the second-hand clothing.
Ready-made apparel has over time almost replaced the custom-made apparel in most
developed countries, as it offers flexibility in terms of style variety, price competitiveness and
efficiency. Adams (1988) and Stone (1999:39) affirm that working class women’s apparel
consumption patterns differ from those of the non-employed, as the former group place
greater value on time-saving, convenience-shopping centres, place greater accent on
fashion, and take considerable interest in the flattering qualities of apparel and its suitability
for work or other occasions. However, there is an outcry worldwide about the bad fit of ready-
made apparel, particularly for women (Knight, 1994:15; Chun-Yoon & Jasper, 1996;

5
Ashdown, 1998). Finding ready-made apparel items of the correct size that fit well is often a
frustrating dilemma for many female consumers worldwide (DeLong, Ashdown, Butterfield &
Turnbladh, 1993; Otieno et al., 2005; Klepp & Storm-Mathisen, 2005:329).
The problem of fit with ready-made apparel has gained a lot of attention recently as the
consumers’ demands for better fitting apparel increases (Knight, 1994:15; Ashdown, 1998;
Shin & Istook, 2007). In an attempt to solve the sizing and fit problems associated with the
manufacture of apparel, the apparel industries in developed countries have introduced body
scanners and automated manufacturing systems. These have facilitated easy and faster
mass-customised apparel, with fewer sizing and fit problems. Although the quality of the
custom-made apparel surpasses that of the ready-made category, the traditional custom-
made tailoring tends to be expensive, time consuming and rigid in terms of quick response to
a busy consumer (Ashdown, 1998; Fralix, 2000; Ashdown, Loker & Adelson, 2004).
1.2.2 Female consumers and marketing issues
Due to women’s varied body shapes, their fashions not only offer a larger variety of styles
than men’s, but also change more rapidly. Unfortunately, women find it difficult to satisfy their
apparel needs and are more concerned with the social significance of apparel than men
(Hogge, Baer & Kang-Park, 1988; Goldsberry, Shim & Reich, 1996b; Delk & Casill, 1999;
Keiser & Garner, 2003:28-30). It has also been documented that size labels on women’s
apparel are not related to body dimensions, which has further contributed to frustration when
female consumers select their apparel items (Goldsberry et al., 1996b; Chun-Yoon & Jasper,
1996; Holzman, 1996; Winks, 1997; Faust et al., 2006).
The female labour force in Kenya has increased greatly with more education and affirmative
action taken by the government and non-governmental organisations to promote gender
equality in all sectors (GOK, 2000:24). Working woman are continuously exposed to fashion
and have the incentive, the opportunity and the means to respond to fashion’s appeal. Often
the better educated a woman becomes, the more willing she is to learn new things and to try
out new fashions (fashion leaders), which serves to accelerate fashion change (Stone,
1999:38; Keiser & Garner, 2003:28-30). Educated females are experienced with global
culture, more observant, more demanding and more confident in their taste and feel for
fashion (Stone, 1999:39; Marshal, Jackson, Stanley, Kefgen & Touchie-Specht, 2004:10).
Female executives in the corporate world wearing a size 14 and above mostly have good
fashion sense and want to look trendy, luxurious and unique in their selected apparel
(Solomon & Rabolt, 2004:159; Marshal et al., 2004:10; Klepp & Storm-Mathisen, 2005:333).

6
They are independent and cannot accept uncomfortable and constricting apparel just to
follow the dictates of some fashion authority (Klepp & Storm-Mathisen, 2005:333). Today’s
busy and active females have carefully defined preferences for fashions that suit their own
individual needs and comfort (Adams, 1988; Stone, 1999:41). However, a working woman
places greater value on fashionable, time-saving, convenient shopping outlets and takes
considerable interest in apparel's fit, its flattering qualities, durability and suitability for work
(Knight, 1994:15; Klepp & Storm-Mathisen, 2005:333). It is reasoned that career women in
Kenya as in many developing countries would spend their discretionary income on
fashionable apparel. Kenya’s local ready-made apparel is of poor quality in terms of
materials used, workmanship and fit (Mason, 1998:98). The imported apparel on the other
hand, could be appealing to the consumer in terms of visual appearance, quality, design,
variety and fabrics used, but the problem of fit still persists (Mason, 1998:99; De Klerk &
Tselepis, 2007). Inevitably, the female consumer is forced to have expensive alterations
done or simply wear apparel with unsatisfactory fit. The effects of a stunning design, striking
fabric and fine workmanship are destroyed if the finished apparel items do not fit the intended
wearer (Winks, 1997; Kwong, 2004).
A review of the literature indicates that problems related to apparel fit stem from a variety of
factors, such as an outdated anthropometric database from which sizing systems are
developed, a lack of classified body shapes, non-standardised communication of sizing and
fit and non-standardised fit quality management amongst the apparel industries (Salusso-
Deonier, 1989; Chun-Yoon & Jasper, 1996; Holzman, 1996; Winks, 1997; Desmarteau,
2000; Ashdown, 2000). Ashdown (2000) sees sizing systems as the focus point around
which all the other factors concerning sizing and fit revolve. She has identified the main
factors affecting sizing systems and consequently the fit of ready-made apparel to be the
population measurements (body dimensions), the design features (construction of the
apparel), the fit issues (fit quality management), and the communication of sizing and fit (size
labelling). These factors have been identified as issues that happen within the manufacturing
process and occur throughout the production of apparel, from the conception stage to the
dispatch stage. It has also been reasoned that fit problems could be attributed to factors
outside the apparel manufacture such as the consumers’ knowledge about size and fit and
their fit preferences (Mason, De Klerk, Sommervile & Ashdown, 2008).
A starting point for the assessment of apparel’s fit is studying the influencing fundamentals
underlying fit, and studying the influence that the body shapes have on the fit of apparel
(Salusso-Deonier, 1989; Gersak, 2002; Ashdown, Loker & Adelson, 2004; Kwong in Fan et
al., 2004). Body shape, being in a sense the apparel’s framework (Sallusso-Deonier, 2005),
will in one way or another affect all four factors highlighted in Ashdown’s (2000) model. For

7
example, firstly, body dimensions require measuring the body in a specific way that will
facilitate body shape classifications and accurate reflection of the three-dimensional body’s
characteristics when the apparel item is made. Secondly, the design features require that the
body’s framework (three-dimensional characteristics) be correctly interpreted to patterns for
the construction of well-/better-fitting apparel. In most developing countries and particularly in
Kenya, there is no known research on female body shapes or any related subject to support
the quality of apparel styles. Thirdly, the fit issues (fit quality management) require that fit
testing techniques, which are applied in the apparel industry, such as the use of fit models
and dress forms, should conform with the body shapes of the target market. In Kenya, most
of the personnel in the apparel industry are inadequately skilled to tackle fit issues and
seldom employ modern technologies or dress forms to test the fit of the prototype apparel
before even engaging fit models (McCormick, Kimuyu & Kinyanjui, 2002). In addition,
communication of sizing and fit requires that the measurements and body shapes indicated
on the size labels reflect the true picture of the target market (population). In Kenya, the
source of size systems are unknown while most size labels presented on apparel are
uninformative. Therefore this study is undertaken to evaluate apparel sizing and fit problems
in Kenya in respect of career women’s distinctive body shapes, and to assess career
women’s perceived fit problems, their knowledge about the communication of size and fit, as
well as their fit preferences.
1.3 STATEMENT OF THE PROBLEM According to KEBS (2001: Preface), anthropometric data in Kenya was taken in 1975 and
the measurements were obtained from girls and women of Kenya’s learning institutions and
organisations. However, the size ranges are not grouped into body shape categories. The
source of the original data from which the sizing systems were developed is unknown and
obscure, so the quality of the techniques and instruments used for the data collection cannot
be authenticated. The 1975 data would also be considered outdated and obsolete to cater for
dynamic body changes.
Not all body shapes are alike or perfect. Careful evaluation of different figures reveals that
most proportions, frameworks, contours and postures may symmetrically or asymmetrically
deviate from the so-called ideal figure. Age also affects the body’s proportions and hence the
need to understand the body proportions and the fit needs of different age groups of females.
Apparel has the potential to create a new and better perception of the body, even if it is not
considered ideal. The use of apparel therefore is to alter the perceived proportions of the
body, and to provide a sense of satisfaction to the individuals who do not fit the cultural

8
ideals of size and weight (Feather, Herr & Ford, 1996; Fiore & Kimle, 1997:331; Rasband &
Liechty, 2006:3, 5 & 19). A question may arise, namely: how would career women’s
distinctive body shapes contribute to the fit problems of the ready-made apparel in Kenya?
This constitutes the problem of this study. A pilot study in this regard was undertaken in
Kenya, with the aim to sort out the most distinctive body shape of career women in Kenya,
rather than simply categorising body shapes. It should be noted that it is possible to
classify/categorise shapes from a large and representative population such as the 12,000
(United States of America) or 11,000 (United Kingdom) body-scanned subjects (Devarajan &
Istook, 2004) in other studies. However, it would only be feasible to identify distinctive body
shapes from data collected from a small population. This study employed manual
anthropometric techniques of attaining body dimensions and was only carried out within two
urban regions of Kenya. Investigation was therefore undertaken to sort out only distinctive
body shapes emerging from the sample data. Accompanying body characteristics that
occurred repeatedly, and are critical to apparel’s fit, were described to establish how they
may contribute to the fit problems of ready-made apparel in Kenya.
Considering that the majority of female consumers are dissatisfied with the fit of female
ready-made apparel (Otieno et al., 2005; Klepp & Storm-Mathisen, 2005:329), most studies
carried out were done in developed countries (Kurt Salmon Associates, 1996; Otieno et al.,
2005; Zwane & Magagula, 2006; Shin & Istook, 2007) . However, little has been done in a
developing country such as Kenya. The question to ask would therefore be: what are the
perceptions of the career women in Kenya concerning the fit problems of ready-made
apparel in Kenya? As part of the problem statement, this study therefore assessed Kenya’s
career women’s perceptions of general fit problems that they encounter with ready-made
apparel.
Communication of sizing and fit involves informing the consumers how the apparel items
should fit in terms of size (key dimensions) and fit (body shape). Ready-made apparel items
contain a variety of labels/tags that express information to the consumers for estimating the
quality of apparel items in terms of size, fit and care. Although supplying size label/tags takes
place voluntarily, clearly and accurately written labels provide a means for the consumer to
learn about the apparel items (Mason et al., 2008). Labels aid the consumer in making
informed decisions about selecting and even caring for the apparel items. However, it has
been documented that size label/tags on women’s ready-made apparel are not correlated to
body dimensions – unlike in men’s apparel – thus contributing to the confusion and
frustration as female consumers select their apparel items in retail stores (Chun-Yoon &
Jasper, 1996; Holzman, 1996; Desmarteau, 2000). Most female sizes are not expressed as
body dimensions, but rather expressed as arbitrarily chosen numbers or letters that correlate

9
with sets of hidden body dimensions (Brown & Rice, 2001:147-148; Faust et al., 2006).
When body dimensions are not revealed to an ignorant consumer, the size designations are
meaningless, thus leaving the consumers to guess and assume what would fit appropriately.
Literature on this phenomenon is scarce, while no study has evaluated the consumer’s
knowledge about the communication of sizing and fit in Kenya. This therefore raises the
question: How does consumers’ knowledge about the communication of size and fit
contribute to the fit problems of ready-made apparel? As this comprises the problem
statement of this study, this study was also undertaken to determine career women’s
knowledge about the communication of size (key body dimensions) and fit (body shapes),
and how this may contribute to fit problems.
In a consumer market-driven society, the challenge to the apparel industries is not about
giving customers extra choices, but rather to contain consumers’ individual preferences.
Career women, in particular, expect to get what they want with minimal time and energy
committed to the apparel search (Kaiser & Garner, 2003:28-29). An individual’s fit preference
could be defined as the way that an individual consumer expects or would want the apparel
to fit the body correctly. Consumers become loyal to certain brands and stores that
repeatedly deliver satisfactory apparel items in terms of size, style and comfort within the
fashion trend of the time (Workman, 1991; Glock & Kunz, 1995:135). Consumers with
different orientations have different preferences and needs within specific social contexts. In
most developing countries such as Kenya, little research has been done, while no study has
assessed career women’s fit preferences. Hence, another research question emerging is:
how do career women’s fit preference for differently fitted apparel, contribute to the fit
problems of ready-made apparel in Kenya?
To focus properly on the problem under investigation, the following questions therefore
directed the investigation:
What are the career women’s distinctive body shapes in Kenya and how do they
differ from Western distinctive body shapes?
What fit implications are associated with Kenyan career women’s distinctive body
shapes?
What are the distinctive body proportion differences among different age groups of
Kenya’s career women?
What are the general fit problems that career women encounter with the ready-made
apparel in Kenya?

10
Do career women lack knowledge about the communication of size and fit, and how
does this contribute to the fit problems they experience with ready-made apparel in
Kenya?
What are the career women’s fit preferences for differently fitted apparel items and
how do these preferences contribute to the fit problems with ready-made apparel in
Kenya?
1.4 PRIMARY OBJECTIVES AND SUB-OBJECTIVES
Primary objective 1: To identify and describe distinctive female body shapes of career women in Kenya from body dimensions and photographs
Sub-objective 1.1: To identify and describe distinctive female body shapes of career
women in Kenya from the body dimensions
Sub-objective 1.2: To identify and describe distinctive female body shapes of career
women in Kenya from the photographs
Sub-objective 1.3: To establish and describe associations between distinctive shapes
emerging from body dimensions and those emerging from the
photographs of the career women
Primary objective 2: To distinguish and describe differences between the emerging
distinctive body shapes (from measurements and photographs) and the Western distinctive body shape
Primary objective 3: To scrutinise and describe the fit implications associated with
the emerging distinctive body shape of the career women Primary objective 4: To assess and describe career women’s self-perceived fit
issues with the ready-made apparel in Kenya Sub-objective 4.1: To investigate career women’s perception of fit with different
apparel categories that are sold in various retail stores in Kenya
Sub-objective 4.2: To describe fit problems that career women in Kenya encounter
regarding the specific critical fit points of different parts of their
bodies
Sub-objective 4.3: To describe career women’s degree of satisfaction with the

11
process of finding appropriate ready-made apparel items in Kenya
Sub-objective 4.4: To explore career women’s self-perceived sources of fit problems
with apparel in Kenya
Primary objective 5: To determine and describe Kenyan career women’s knowledge about the communication of size (key body dimensions) and fit (body shapes)
Sub-objective 5.1: To explore Kenyan career women’s knowledge about the
communication of size
Sub-objective 5.2: To explore Kenyan career women’s knowledge about the
communication of fit
Primary objective 6: To determine and describe how career women’s preferences for differently fitted skirts and jackets may contribute to fit problems with apparel
1.5 EXPECTED SIGNIFICANCE OF THE STUDY
1.5.1 Emerging distinctive female body shapes
In today’s competitive business environment, companies must ensure that they focus on
building the loyalty of and retaining their consumers by offering products and services that
fulfil their needs. It is important that the apparel manufacturers, retailers,
researchers/educators and government/public agencies in Kenya are aware of the emerging
distinctive female body shapes and the apparel’s fit implications associated therewith, so as
to develop strategies that would help to solve the problem and to promote the production of
well-fitting apparel items for the career women in Kenya. Understanding how the prevalent
body shape differs from the Western fit model enhances greater knowledge on style
selection, pattern development and fabric required for those specific body shapes.
1.5.2 Career women’s perception regarding general fit problems with the ready-made apparel in Kenya
Examining consumers’ perception of fit problems regarding ready-made apparel would
facilitate a deeper understanding of consumers’ satisfaction with the process of finding
apparel items in their appropriate sizes and styles, consumers’ fit problems encountered at

12
critical fit points of their bodies, as well as consumers’ perceived sources of those fit
problems. Being a new study in Kenya, this will highlight critical areas such as sizing systems
that need to be developed or modified to counteract the fit problems.
1.5.3 Consumers’ knowledge about the communication of size and fit
In the context of the United Nation’s consumer rights (1985), consumer education is valued
worldwide. The discipline of consumer science education in actual sense concerns itself with
responsible, informed consumer decision-making. Careers in the field of apparel and textiles
attempt to educate consumers and assist them with relevant product information to enable
them to make appropriate purchasing decisions. Consumers’ ignorance on the
communication of sizing and fit (terms used on size labels/tags and the meaning of symbols
on the labels) should be regarded as a matter of concern. An improved understanding of
consumers’ knowledge/ignorance about the communication of sizing and fit would be
valuable in terms of consumer education and facilitation, and would enlighten the apparel
industries for the supply of satisfactory apparel items affixed with durable, legible and
efficiently informative size labels/tags. 1.5.4 Consumers’ fit preferences
Understanding the fit preferences of female consumers and relating these preferences to the
body characteristics that determine the fit of an apparel item, would help apparel companies
to produce suitable and better-fitting apparel within consumers’ desired fit parameters. If
apparel manufacturers produce apparel without taking into account the link between the fit
preferences of the consumers and the body’s most common critical fit points in a target
population, the available products would be purchased based on availability rather than
desire – and hence, fit problems.
1.5.5 Contribution to existing theory
Considering that this research would be new in Kenya, and with the emergence of a distinct
female shape that differs from the Western prevalent one, it is hoped that all the information
gathered would be used as input units, for the development of a knowledge base that would
lead to better designing and better predicting the degree of fit, and ultimately to the
production of well-fitting apparel in Kenya and other African developing nations.
13
1.6 STUDY OUTLINE
This thesis is divided into seven chapters. This introductory Chapter 1 deals with
background information, statement of the problem, the expected significance of the study as
well as the study outline. Chapter 2 entails a literature review on the theoretical framework. It uses Ashdown’s (2000)
model as a launching point. Four main areas (population measurements, design features, fit
issues and the communication of size and fit) highlighted in the Ashdown (2000) model, are
addressed to facilitate a deeper understanding of issues revolving around the sizing systems,
which are key in the fit of ready-made apparel.
Chapter 3 examines specific supporting sources that are directly related to the phenomenon
of the study, which encompass female body shapes, consumers’ knowledge about size and
fit, and consumers’ fit preferences. Body shape characteristics, which are critical to the fit of
apparel, are addressed. The consumer’s knowledge about the communication of size and fit,
key dimensions, and the terms used on size labels/tags are also examined, as well as the
importance of consumers’ fit preferences. The chapter ends with a schematic conceptual
framework for the study. This was formulated to bring the various concepts of the
phenomenon concerned, to facilitate straightforward definitions and to direct the entire study.
It highlights each component that is vital in women’s varied body shapes in relation to the fit
of ready-made apparel, consumers’ knowledge about size and fit in relation to the selection
of better fitting ready-made apparel, and consumers’ fit preferences and how they relate to
the body shape’s critical fit points.
Chapter 4 explains the methodology used for the study as it gives an exposition of research
instruments employed for the study, such as the chosen research framework and the
research strategies employed, limitations encountered, and the measures that were taken to
ensure reliability and validity of the study while collecting data. It describes the choice and
application of data-collection methods used, which encompassed obtaining body dimensions
and photographs from career women dressed in minimal apparel items (leotards) and
administering questionnaires. Empirical body dimensions and photos were taken first (Phase
one), while the questionnaires were administered immediately, afterwards (Phase two). The
assignment of phases was for practical purposes and ease of presentation of the data. This
chapter also discusses the statistical analyses used, the quality of the study and how
research ethics were observed.
Chapter 5 presents the results and discussions of the phase one data that was collected

14
empirically through measuring and photographing women dressed in minimal apparel
(leotards). This was to address primary objectives 1, 2 and 3 of this study. It involved
identification of a distinctive female body shape and sorting out common body characteristics
critical to apparel’s fit from body dimensions and visually evaluated photographs of the
career women in Kenya. It was also concerned with assessing and describing apparel fit
implications associated with the Kenyan career women’s distinctive body shape.
Chapter 6 presents the results and discussions of the phase two data that was collected
using the questionnaires, mainly addressing primary objectives 4, 5 and 6 of this study.
These were to assess and describe career women’s perceived general fit problems,
knowledge about size and fit, as well as their fit preferences for differently fitted apparel
items.
Chapter 7 contains a summary of pertinent findings according to the primary objectives, an
evaluation and the limitations of the study, and how this research contributes further to
existing theory. Recommendations for future research are also discussed in this chapter.

15
Chapter 2
THEORETICAL FRAMEWORK FOR THE STUDY
2.1 INTRODUCTION
A review of the literature indicates that problems related to apparel fit stem from a variety of
factors, such as an outdated anthropometric database from which sizing systems could be
developed, lack of classified body shapes, non-standardised communication of sizing and fit,
non-standardised fit quality management and lack of agreement amongst the apparel
industries (Chun-Yoon & Jasper, 1996; Holzman, 1996; Winks, 1997; Desmarteau, 2000;
Loker et al., 2005). In an attempt to solve fitting problems, Ashdown developed a model of
the factors determining and influencing apparel’s fit. Ashdown (2000) sees sizing systems as
the focus around which all the factors concerning sizing and fit evolve. She has identified the
main factors affecting sizing systems and consequently the fit of ready-made apparel to be:
the population measurements (body dimensions), the design features (construction of the
apparel), the fit issues (fit quality management), and the communication of sizing and fit (size
labelling). These factors are presented in Figure 2.1 (as a Theoretical Framework).
2.2 SIZING SYSTEMS
A sizing system is the assignment of body dimensions and a group of body shapes
representing a market segment. The body dimensions and body shapes are presented in a
chart for the purposes of creating a set of ready-made apparel for a variety of people in the
target market (Winks, 1991:3; Ashdown, 2000; Keiser & Garner, 2003:30; Salusso-deonier,
2005; Petrova, 2007:57). Ready-made apparel is clothing developed in advance using size
tables and offered through retailers for potential customers to make selections (Loker et al.,
2005). A sizing system that sets out to satisfy its target market must be up to date, precise in
measurements and body shape classification (proportions), and must represent the
population that it was designed for (Salusso-Deonier, 1989; Schofield, Ashdown, Hethorn,
LaBat & Salusso, 2006). Sizing systems are designed to fit a segment of a population,
defined by demographic data (Ashdown, 2000; Petrova, 2007:57). Most regular sizing
systems in the apparel industry use the foundation size (sloper) derived from a fit model
whose shape and measurements do not represent a wide population of consumers within the

16
targeted market (Schofield & LaBat, 2005a; Schofield et al., 2006; Schofield, 2007:152).
Even though the sloper may have been created in a cut and fit that have proven successful
in the past, it could be argued that dynamic fashion changes would call for a different fit
philosophy in every foundation pattern at different times.
Fit is affected by grading since grading plays a key role in developing a range of apparel
sizes. However, existing grading practices have little basis in measurement information from
size charts, as they are not based on anthropometric research (Schofield & LaBat, 2005b).
Thus a base size sloper that is finally proportionally graded into many sizes leads to poor
fitting apparel, because the actual shapes and contours of individuals do not follow a similar
outline (Salusso-Deonier, 1989; Workman, 1991; Glock & Kunz, 1995:108; Keiser & Garner,
2003:251; Schofield et al., 2006). Notably fit and styling ease should be varied for different
body shapes, proportions and sizes – characteristics that are overlooked during grade rule
application to a base size.
According to Kenya’s sizing standards, anthropometric data was last collected in 1975.
Considering that these sizing systems are based on an outdated anthropometric database, it
is possible that sizing systems currently in use could be an alteration of the 1975 data, or
different industries might have individually made them. They could also have been borrowed
or copied from other countries. It has however been observed that sizing systems that are
currently being used in most developing countries are adaptations of the Western types
(Zwane & Magagula, 2006). When such adopted, modified or outdated sizing systems are
used, apparel's fit problems will persist because the sizing systems used would not reflect
the actual measurements and body shapes of the present Kenyan woman. Used as a point
of departure and as foundation for this chapter, is Ashdown’s (2000) model of sizing systems
in the apparel industry presented in Figure 2.1 below.

17
FIGURE 2.1: THEORETICAL FRAMEWORK (Sources: Ashdown, 2000; Ashdown in Ashdown, 2007:xix)
The framework (Figure 2.1) highlights four main factors (population measurements, design
features, fit issues and communication of sizing and fit) that are useful for addressing sizing
and fit problems. The model is complex and this study focuses mainly on female body
shapes, as they act as the apparel’s frame and could affect all the major issues highlighted in
Ashdown’s model regarding fit. This study also focuses on the communication of size and fit
from the viewpoint of the consumers’ knowledge and how consumers would prefer their
apparel items to fit their bodies.
The body shape, being a framework for apparel (Salluso-Deonier, 2005), will affect all four of
the major factors in Ashdown’s (2000) model, either directly or indirectly. Population
Traditional tailors’ measurements
Population’s
measures (1) 3-D Body Scanning
SIZING SYSTEMS
Fit issues (3)
Fit
Wear testing
Perception of fit
Subject Expert tester
Communication of sizing & fit (4)
Design
Features (2)
Functional needs
Distribution
Style choices
Size labeling Satisfaction/ Returns
Apparel Selection
Consumer
Objective measurement
of fit
Traditional Anthropometry
Materials
Production

18
measurements demand that the body dimensions should be obtained from the three-
dimensional body in an explicit way that will facilitate body shape classifications. Accurate
reflection of the three-dimensional body’s characteristics would be achieved when the
apparel has been made based on the elements of fit (grain, set, line, balance and ease) and
dressed on the body (Erwin, Kinchen & Peters, 1979). Design features necessitate that the
body’s framework (three-dimensional characteristics) are correctly interpreted to patterns for
the construction of well-fitting apparel. The fit issues which involve fit quality management
strategies call for certain fit testing techniques such as the use of fit models and dress forms.
The fit models and/or the dress forms used must correspond with the body shapes and sizes
of the target market. Communication of sizing and fit requires that the measurements and
body shapes indicated on the size labels reflect the true picture of the target market
(population).
2.3 POPULATION MEASUREMENTS (SOURCES OF SIZING SYSTEMS)
The dimensions of the human body underpin an effective sizing system and consequently
better-fitting apparel items. Sizing systems originate from people’s measurements and body
shapes (Bye, LaBat & DeLong, 2006:66; Petrova, 2007:56). Since the body shape is three-
dimensional, the measurements obtained from it must be accurately taken and must be
representative of the characteristics of body shape that are critical to the fit of apparel. This
would facilitate the production of apparel items that harmonise with the body shape. The
measurements and the varied body shapes can only be accurate, consistent and
representative if they are taken accurately by employing correct methods, instruments and
techniques (Ashdown, 2000; Simmons & Istook, 2003; Ashdown & Dunne, 2006). Ashdown’s
framework illustrates how the population measurements contribute to the effectiveness of
any sizing system. The measurements used should be current, accurate, consistent and
representative of the population for which the system is being developed (Kunik, 1984:12;
Winks, 1997; Ashdown, Loker & Adelson, 2004; Honey & Olds, 2007).
It has been observed that body shapes and proportions vary significantly from one country to
another, and to some extent also within one country (Bougourd, 2007:111). Updated and
current population measurements are therefore vital in most countries, in order to minimise
fitting problems related to ready-made apparel (Kunik, 1984:12; Winks, 1997; Ashdown et al.,
2004; Devarajan & Istook, 2004; Shin & Istook, 2007). In the event where anthropometric
data shows little relationship with the target markets’ existing measurements and proportions,
the existing systems should be modified to incorporate the differences in the critical fit points

19
as well as varied body proportions (Ashdown & Dunne, 2006; Zwane & Magagula, 2006;
Shin & Istook, 2007).
Body dimensions can be obtained accurately through recommended methods, namely, the
traditional (ordinary) tailor or dressmaker’s method, traditional anthropometry and the three-
dimensional body scanner. Once the measurements are obtained, they are transposed into
patterns, which are to be used for cutting out the apparel. If the measurements taken are
incorrect, the resulting apparel will contain fitting problems, no matter how accurate the other
processes of production may be (Ashdown, Lyman-Clarke, Smith & Loker, 2007:349). Winks
(1997) agrees that when apparel does not fit properly, the consumer is dissatisfied –
irrespective of the quality of the fabric, the workmanship or even the item’s fashionability. The
accuracy and the representativeness of a population’s body dimensions can be greatly
influenced by measuring methods or skills employed (Bye, LaBat & DeLong, 2006: 66).
Considering that the source of Kenya’s anthropometric database is unknown, the quality of
the measuring methods, techniques and instruments used cannot be guaranteed. This
means therefore that the skills used to create the data underlying sizing systems currently
used in Kenya remain unknown and questionable. However, discussed below are some of
the measuring techniques that are commonly applied.
2.3.1 Traditional tailor or dressmaker’s measurements
These measurements refer to body dimensions taken manually using a tape measure
(measuring tape). Measurements that are directly related to the item to be made often
determine the dimensions required (Cornell University, 2004). Although reliable
measurements may be obtained with experience, precision cannot be achieved. The tailor or
dressmaker (with reference to Kenya) takes body dimensions when the subject is dressed in
normal apparel and shoes. Most measurements are taken along the contours of the body
and not in straight lines between points, while landmarking is not done before the actual
taking of body dimensions. Often there is not much attentiveness by the tailor while taking
measurements, particularly to the body’s areas that would be critical to the apparel’s fit. The
subject’s movements while being measured would also affect measurements as a result of
shifts during the measuring process. Accuracy varies significantly with different professionals
in the tailoring and dressmaking fields. It depends entirely on the persons’ skills and the
experience they have, particularly in their ability to capture characteristics of varied body
shapes that are critical to apparel’s fit (Kunik, 1984:4; Ashdown, 2003; Yu, 2004:183-184;
Aldrich, 2007:3, 5, 22). In Kenya, it could be argued that each segment of the apparel
industry, both the formal and informal, uses its own style of obtaining body dimensions for
each specific apparel item. Non-standardised and/or inaccurate measuring techniques,

20
combined with the lack of skills and inappropriate tools, could result in unsatisfactory apparel
(Ongile & McCormick, 1992; Mason, 1998; McCormick et al., 2002)
2.3.2 Anthropometry
Anthropometry is defined as the study of human body dimensions (Pheasant, 1986; Carrol,
2002). The term anthropometry is derived from anthropos, meaning “human”, and metrikos,
meaning “measuring” (Roebuck, 1995:1). Quelet first used the term in 1870 with the aim of
obtaining the measurements of average man (Anthropometry, 2000:1). Anthropometry like
any other scientific path depends upon the adherence to particular rules of measurement as
determined by national and international bodies controlling standards. Standardised rules of
obtaining body measurements facilitate a comprehensive measuring of all the body parts
necessary for the fit of apparel items, which eventually must fit a three-dimensional body
shape from which the measurements were taken. Formal anthropometry studies specifically
for apparel design use apparatuses that have been designed to produce reliable and valid
measurements. Anthropometric apparatuses include the Anthropometer (Measuring stand)
consisting essentially of a rule, graduated in millimetres, vertically mounted and with a
moveable arm. It is used for measuring straight, linear distances. Other instruments are
callipers and calibrated measuring tapes, which measure linear depths and widths (Beazley,
1997:58; Bye, LaBat & DeLong, 2006:66).
Measurement errors could be reduced if the techniques of landmarking were well understood
and taken seriously. Landmarks are identifiable skeleton points that generally lie close to the
surface of the body, and are the points that identify the exact location of the measurement
sites (ISAK, 2001:21). Subjects should be landmarked prior to taking measurements. This is
to ensure conformity and consistency while taking body dimensions. Standardisation would
be achieved once the universal (landmark) points on the body were identified. When
correctly identified, landmarks reduce the viewer error, which is common with traditional
anthropometric studies (ISAK, 2001:21; Simmons & Istook, 2003). Errors common with
landmarks could be reduced and improved if the measurements are obtained by a well-
trained/professional anthropometrist, who understands the anatomy of a human body and
can link the anatomical terms with apparel design requirements. Understanding the cultural
beliefs of the target consumers could help to pinpoint sensitive issues that should be avoided
during a measurement exercise (Apeagyei, Otieno & Tyler, 2007; Mastamet-Mason, De Klerk
& Ashdown, 2008). Participants could be requested to wear minimal apparel – as minimal as
possible – to allow the natural contours of the body without constricting (e.g. body suits). The
instruments and tools must be arranged well in advance and in the sequence that the
measurements will be taken, in order to minimise the contact time with the participants

21
(Norton & Olds, 1996:29-30I; Winks, 1997; Beazley, 1997:64; ISAK, 2001:21; Simmons &
Istook, 2003:308; Ashdown & Dunne, 2006).
FIGURE 2.2: ANATOMICAL POINTS USED IN LOCATING BODY LANDMARKS ON ANTERIOR POSITION (Source: Simmons & Istook, 2003: 311)

22
FIGURE 2.3: ANATOMICAL POINTS USED IN LOCATING BODY LANDMARKS ON POSTERIOR POSITION (Source: Simmons & Istook, 2003: 312)

23
FIGURE 2.4: ANATOMICAL POINTS USED IN LOCATING BODY LANDMARKS (Source:
Simmons & Istook, 2003: 313)
Disadvantages with traditional anthropometry are linked to the measuring exercise being
tiring as well as the time taken to complete the exercise. Measuring methods require
palpitation or touching of the human body or bending of parts while trying to find appropriate
landmarks for the required measurements, thus violating the privacy of an individual (Winks,
1997; Simmons & Istook, 2003; Istook, Little, Hong & Plumlee, 2003). Although there are
limitations with traditional anthropometric measurements, they have however been used for
many studies and have produced reliable results before the emergence of body scan
technologies. To ensure the validity and reliability of traditional anthropometry, a thorough
preparation, particularly on landmarking (Figures 2.2, 2.3 and 2.4), is required before the

24
commencement of the measuring exercise. In Kenya, it can be argued that, since the
sources of the anthropometrical database are obscured, the information on this method of
attaining body dimensions is also flawed, thus creating a wide research gap on
anthropometric body dimensions. The fact that data collection was last done in 1975 (KEBS,
2001: Preface) could also suggest that instruments and techniques used then could by now
be outdated/obsolete and questionable in terms of validity and reliability. This study is
therefore designed to fill this gap by providing updated anthropometric data for the purposes
of identifying the prevalent body shapes of career females as a market segment in Kenya.
2.3.2.1 Developing sizing systems from anthropometric database A sizing system is a set of pre-determined body sizes and body shapes represented in size
charts, which should be accurate and up to date. Although the development of sizing
systems is beyond the scope of this study, it is recommended that sizing systems should be
revised at least every ten years to keep abreast with continuous biological changes that
occur from one generation to the next (Brunn, 1983; Olds, 2003). This could facilitate the
production of better-fitting apparel that would continuously satisfy the consumers. Chun-Yoon
and Jasper (1996) identified problems with fit as stemming from the use of obsolete
anthropometric data, faulty selection of key dimensions for the body shape classifications
and the subsequent developing of sizing systems.
According to Winks (1997), all body dimensions surveys conducted in countries such as the
UK, USA, and Germany, agree on the basic rule that a sizing system must be three-
dimensional in structure. The bust girth, hip girth and stature as the main control
measurements, as these are critical dimensions for the manufacture of body-fitting apparel.
The key dimensions should be convenient to measure, be an integral part of the apparel and
should have a high degree of correlation with other dimensions that are as important in
design and sizing (Robinette, 1986; Winks, 1997). According to Petrova (2007:66),
construction of any sizing system involves the assortment of control dimensions and
secondary dimensions with respect to garment type and corresponding body shapes in a
market, the choice of interval value between sizes, creating the minimum possible number of
sizes that could accommodate a large percentage of the population’s sizes and shapes, and
calculations of secondary dimensions. However, it is almost impossible to address the
consumer’s problems of fit, unless a set of accurate body dimensions as well as body shapes
are recognised and understood (Istook & Hwang, 2001; Loker et al., 2005).

25
The size standards available for Kenya’s females contain vague information, as the source of
the anthropometric database from which they were developed is obscure. The following
statement is quoted from the Kenya size standards:
“The body dimensions tabulated in this standard were obtained from girls and women in
Kenyan learning institutions and organizations” (KEBS, 2001: Preface).
The size standard however does not give any breakdown of body shapes or population
representations of different sizes. This may have contributed to the poor fit of Kenya’s locally
made apparel and hence the closing down of many apparel firms (McCormick et al., 2002;
RATES, 2003:58)
2.3.3 Three-dimensional body scanning
The development of the three-dimensional body scanning technology came as a result of the
desire in the apparel industry to provide apparel with a better fit to the customer at the
shortest time possible. It was also due to the fact that traditional anthropometric methods are
slow, time consuming and often not accurate. For the spatial analysis of clothing appearance
and fit, a three dimensional digitisation of the body shape and clothing surface is essential.
Variation in body size and shape can be accessed quantitatively and expressed by contour
maps or polygons (Yu, 2004:135). Body scanners facilitate the extraction of body dimensions
and body shapes within seconds and allow consistent body measurements and shapes
analysis that would encourage the production of mass-produced apparel that is customised
for fit (Istook, 2000; Simmons & Istook, 2003; Ashdown, 2003; Loker, 2007:246). There are
four main clothing applications of body scanning, which include: non-contact body
measurements for size survey, pattern generation for customisation, tailor made mannequin
for a target market and clothing fit evaluation of appearance such as drape, wrinkling and
bagging. Other than clothing it can also be used in the medical, fitness and dietetic fields.
However, main applicable result of three-dimensional body scanning technologies is the
point data cloud to be used for the generation for virtual or physical dress model, critical
landmarks and anthropometric data to guide the design and sizing of garments (Yu,
2004:135).
According to Yu (2004:135), non-contact body measurements and garment analysis systems
are available in four categories: one, two-dimensional systems, which include a “silhouetter”
developed to capture a two-dimensional photograph of a body contour with a background of
calibrated standard grid, the LASS system which requires that a person must stand as still as
possible when the strips of light are projected onto the body and measured by television

26
cameras, and the SYMCAD system, which requires that a person stands in the middle of the
boot dressed only in underwear while a digital camera captures the front and the profile
images of the silhouette (Gazzuolo, DeLong, Lohr, LaBat & Bye, 1992; Yu, 2004). The
second non-contact body measurements and garment analysis system is the structure light,
such as moiré topography and phase shift. Moiré topography is a contour mapping
technique, which involves positioning a grating close to an object and observing its shadow
on the object through the grating. Shadow and projection moiré techniques are applied to
obtain object’s measurements and form. In the shadow moiré technique, a linear grating is
placed close to the surface of the object to be evaluated. When a light source is illuminated
against the grating, grating’s shadow is emitted onto the object and a distorted shadowed
silhouette is formed as a result of the three-dimensional shape of the object (Yu, 2004:148).
Although its main purpose was for screening of spinal deformities of school children, Shadow
moiré topography has been used for research on the three-Dimensional analysis of
relationship between human body and apparel patterns. Some of the examples of the moiré
topography are: CubiCam, Nuoro Ailun and RSI – DigiScan. Phase shift involves shifting the
grating preset distances in the direction of varying phase, and capturing images at each
position. It uses a white light source to project a contour pattern on the surface of the object.
As irregularities in the shape of the target object distort the projected grating, the resulting
fringe patterns describe the surface contour. Examples of phase shift technologies are:
Textile and Technology Corporation (TC²) and Telmat – OptiFit (Hwang, 2001; Xu, et al.,
2002; Yu, 2004:150-153).
The third non-contact body measurements and garment analysis system is a laser scanner,
which project a line of laser light around the body. The laser line is reflected into cameras
located in each of the scan heads. Data is obtained using triangulation method in which a
strip of light is discharged from the laser diodes onto the surface of the scanned object and
then reviewed simultaneously from two locations, using an arrangement of mirrors. Viewed
from the angle, the laser stripe appears deformed on the object’s shape; sensors record the
deformations and create a digitised image of the subject. Examples of laser scan
technologies include: Cyberware, TecMath, Humano – Voxelan, Cubic and Polhemus –
FastScan (Paquette, 1996; Yu, 2004:154-157). The fourth technology being Infrared scanner
with infrared (IR) imaging sensor operates in the IR region of electromagnetic spectrum. A
lens attached to a detector converts the IR energy to an electrical signal. With an infrared
LED and a semiconductor position-sensing detector (PSD), triangulation is used for the
rapid, non-conduct measurements of three-dimensional shapes of target objects. It extracts
the three-dimensional shapes of human body by positioning multiple distance sensors
around the person being measured. Examples of infrared technologies include: Hamamatsu
and Hokuruku-Conusette (Crawford, 1998; Conusette, 1999; Yu, 2004:159).

27
As people change in shape due to diets and lifestyle, it becomes apparent that frequent data
collection is needed to keep abreast with these changes. The body scanner would be an
ideal instrument to use because it provides speed and consistent and accurate data to
redefine sizing systems so as to reflect the dynamic changes in body shapes and dimensions
(Ashdown, 2003). The disadvantages of body scan technology, compared to traditional
anthropometric measuring, are the costs involved and the technical skills required, which are
thought to be too advanced for a developing nation such as Kenya. Introducing such
technology needs a feasibility study regarding its acceptance and extensive training of
manpower to operate the machine. According to Ashdown and Dunne (2006), body scan
technology is expensive and requires high maintenance – costs that most retail operations
may not be ready to absorb.
Although the advantages of body scanners outweigh all other methods of obtaining body
dimensions, regrettably, a developing country such as Kenya may be reluctant to adopt the
new technology due to the high costs involved in terms of acquisition and maintenance, and
the technical and management skills required to operate it. It may also require a feasibility
study on consumers’ acceptance due to cultural differences. In this respect, therefore, this
study aims to come up with alternative functional, reliable and acceptable techniques such as
the traditional anthropometry and others, as recommended by Ashdown and Dunne
(2006:122).
2.4 DESIGN FEATURES
Design may be defined as the organisation of different elements (line, colour, texture, pattern
and silhouette), using principles of design (proportion, balance, emphasis, rhythm and
harmony) to create apparel items that are in harmony with body shapes and sizes, and are
aesthetically pleasing to the users. Design plays an important role in the aesthetics of
apparel. It describes how a textile product (an apparel item) satisfies the needs of the
customer in terms of appearance, fashion preferences, fit and styling.
Design features are those components that make up the product, and include: the number of
pieces used to make up the apparel, the apparel details used and the finishing applied,
resulting in a completed apparel item ready for use. This will require both design and
functional ease to create a specific style and to allow for body movements. The design
features chosen at this stage must correspond with the different body shapes and sizes
available in the market (Parker, Winters & Axelrod, 1988:9; Keiser & Garner, 2003:316).

28
Design involves the processing of an apparel item from the conception stage, which basically
takes into account the varied body shapes available and sizes. The designer begins from the
development stage consisting of design ideas presented in the form of designs on sketched
body shapes (production drawings/working drawings), which act as guiding tools for the
pattern maker and later, the apparel assembly (Burns & Bryant, 1997:169; Rosenau &
Wilson, 2001:136; Keiser & Garner, 2003: 238). In the process of producing well-fitting
apparel, the design features of the actual apparel play an important role, all the way from the
pattern maker to the finished product (Hudson, 1980:110; Desmarteau, 2000; Ashdown et
al., 2007:348).
The relationship between the design and the fit of apparel is complex, because each apparel
style has its own ease allowance and ideal relationship to the size and body shape. Each
apparel style allows a different range of variation in the bodies that it will fit in an acceptable
manner (Solinger, 1988:63; Beazley, 1998pt3: 67). It is generally reasoned that the more
style ease an apparel item has, the greater the range of body variations and sizes that the
apparel will fit. The look/appearance will vary according to the different body shapes beneath
the apparel item (Glock & Kunz, 1995:110). It has been observed that two people could
possess the same basic body dimensions, but would look totally different when dressed in
the same apparel item due to shape variations (Schofield & LaBat, 2005a; Schofield et al.,
2006).
Ease can be defined as the difference between the actual measured size of the body and the
measured size of the apparel as intended by the designer (Beazley, 1997, Part 3:67; Keiser
& Garner, 2003:316). The amount of ease required for comfort, movement and attractive
appearance depends on the manufacturer’s standards of fit, the apparel style, the fabric, the
size/body shape and the needs of the perceived consumer. These characteristics must
simultaneously be synchronised into overall suitable and accepted styles (Huck, Maganga &
Kim, 1996; DeLong et al., 1993). Wearing or comfort ease is an allowance given to provide
for flexing, reaching and movement of the body (Beazley, 1997:68; Keiser & Garner,
2003:316). Every apparel item must contain enough ease to enable the body to move
comfortably. This type of ease is provided, for example, at the chest to allow for moving and
breathing, the sleeves to allow for bending over and raising of arms, the hips to allow for
sitting and walking. Each apparel item thus has specific critical fit points based on the fit
points of the body. The generally accepted amount of wearing ease can be affected by
fashion trends, fabric characteristics and consumers’ fit preferences. However, apparel
should be designed to fit the intended consumer, irrespective of fashion and fabric behaviour,
but within the fit preference context of the consumers (DeLong et al., 1993; Brown & Rice,
2001:47).

29
Design ease, also referred to as styling ease, is the degree of closeness, looseness or
fullness of fit necessary for the style or silhouette (Glock & Kunz, 1995:154). It is the amount
added to the pattern during its creation to provide the look that the designer desires. In other
words, it is the details added to a basic pattern block to come up with a certain style. Some
styles are designed to fit the body very closely and others are intended to be slightly fitted or
loosely fitted (DeLong et al., 1993). Design features may limit or widen the range of
dimensions that can be fitted to a style. Structural seams and darts incorporated into the
design of apparel influence how the apparel will fit on the consumers’ varied body shapes
(Glock & Kunz, 1995:110; Ashdown, 2000). Fullness beyond wearing ease is created by
adding the flares, gathers, shirring, smocking, tucks or pleats. Use of these fullnesses
together with adjustable openings, can result in apparel that will fit a wider range of sizes,
although the appearances will vary according to the body shapes wearing it.
On the other hand, styles with narrower structured features such as the princess-lined
apparel, the midriff designs and tailored apparel will fit a limited number of people (Glock &
Kunz, 1995:111). For the success of an anthropometric survey used for mass-produced
apparel, Ashdown (2000) suggests that it would be practicable and economical to have a
reduced number of sizes for a population through the use of creative design or style features
that are suitable to varied body shapes, and also acceptable to the consumers. The level of
fit offered in those styles must be maintained following the fashion that the customers prefer.
The initial size charts used for the creation of patterns must at all times be representative of
the target consumers’ sizes and body shapes. This facilitates correct ease allowances to be
integrated into the patterns at the very early stage of development, for the production of well-
fitting apparel for the intended consumer. With the lack of classified body shapes and with
the unskilled manpower in Kenya’s apparel industry, it is possible that the concept of fit in
relation to design may not be well understood and interpreted appropriately; hence the
production of poorly fitting ready-made apparel.
2.4.1 Functional features
Functional features refer to the way the apparel will serve the customer or perform according
to his/her expectations. The fabric’s performance determines the standard it meets and how
it benefits the customer (Solinger, 1988:61). Functional performance refers to the apparel’s
utility in terms of correct fit and the comfort it provides to different body shapes as well as
sizes. It also refers to the apparel’s durability and its service for its intended purpose
(Kadolph, 1998:30). Providing good fit for the full range of the population with varied body
shapes is usually more vital for a functional apparel item, especially for protective apparel.
Lack of good fit could jeopardise the protection and comfort presented by the apparel and

30
thus the safety of the wearer (Huck et al., 1997). Work-related movement analysis is an
effective way of determining the design needs for specific functional apparels. The designers
must therefore evaluate the fit, performance, comfort and level of protection of a prototype
apparel item to various body shapes and sizes. The choices made in the design process of a
functional apparel item will significantly affect the fit, comfort and performance of the apparel
on the wearer (Ashdown, 2000; Kadolph, 1998:30).
Expectations for durability may differ, depending on whether the item is a high fashion
garment or just a basic product. Kadolph (1998:29) suggests that the durability and comfort
used in a product play a major role when designing functional apparel items. The
functionality of an apparel item is expected to serve the customer satisfactorily, even after
repeated washings and handling (Solomon & Rabolt, 2004:196; Ashdown et al, 2007:349).
Thus it is important that the manufacturer should estimate the degree of the apparel’s
serviceability for at least several washings after purchase (Solinger, 1988:66). The designer
and the manufacturer should take into account the consumers’ body shapes’ characteristics
that are critical to the apparel’s fit, the consumer’s expectations and the performance of a
particular apparel item. For example, special apparel items such as a raincoat meant to be
worn over several other apparel items, are expected to have a wider allowance than an
ordinary dress, although both garments will bear the same size code (Glock & Kunz,
2000:154). The lack of classified body shapes to act as design guides together with the low
levels of skills in Kenya’s apparel industry may be contributing factors to the poor fit of female
ready-made apparel in Kenya. The lack of quality raw materials among other elements,
coupled with poor production methods, could also contribute to fitting problems with apparel
in respect of its functional features (McCormick et al., 2001; RATES, 2003:58).
2.4.2 Materials For the purposes of this study, materials will be defined as piece goods and findings. Piece
goods are fabrics that are cut and assembled into apparel (Glock & Kunz, 1995:87). Findings
are all materials other than piece goods that are required to make an apparel item. Examples
of findings include: interlinings, trim, zippers, buttons, and thread (Glock & Kunz, 1995:87,
Keiser & Garner, 2003:274). Different body shapes and sizes would call for different
characteristics of specific materials that would be suitable and appropriate for them.
Material/fabric is one of the critical factors that affect apparel’s fit, and therefore
understanding fabric’s properties has a significant place in the addressing of size and fit
issues (Branson & Nam, 2007:264). Fabric’s properties such as its texture, hand-drape
ability, pattern and colour often influence and dictate style choices and the amount of ease

31
needed in the design process for different body shapes and sizes (Solinger, 1988:66;
Branson & Nam in Ashdown, 2007:266). The hand-drape ability of a fabric is an important
contributor to the satisfaction with the aesthetics and performance of the fabric (Solinger,
1988:66; Kadolph, 1998:29; Brown & Rice, 2001:187-189). Material properties affect the way
that an apparel item fits a person, and also impact on how many different people of diverse
shapes and sizes could be fitted with one size. Appropriate and consistent selections of
quality findings (trims) required to support and complete the apparel items are important for
the apparel’s quality and performance.
The amount of ease and the type of fabric used both interact to affect how appropriately a
garment will fit an individual (Keiser & Garner, 2003:274-276). Rigid fabrics require more
comfort ease than stretch fabrics; highly elastic fabrics may require negative comfort
allowances and therefore can be used to fit a wider population with varied sizes and shapes
(DeLong et al., 1993). The lack of knowledge about fabric characteristics on the part of the
pattern makers could contribute to fitting problems. The lack of a system of classified body
shapes as a design guide, combined with the poor skills and the poor quality of raw materials
available in Kenya, could also contribute to the production of apparel items with poor fit
(McCormick et al., 2002).
2.4.3 Production Apparel firms are organised in different ways, depending on the type of operation or product
line. However, there are certain basic steps involved in the production of any apparel item.
Collection of apparel items (product line) may be made from the original designs of a staff
designer, based on different body shapes and sizes of the target market. This is the case for
a company that produces highly priced, high-fashion apparel or designs that are adapted or
copied from original creations. In either case, the actual production does not begin until the
line is decided upon (Zangrillo, 1990:45; Glock & Kunz, 1995:156). Basic steps involved in
the manufacturing are listed and discussed in respect of their effect on the fit of apparel.
Some of these steps may overlap or may be performed simultaneously. The different
production stages presented here are:
design creation stage (fashion illustration)
pattern creation
cutting room
apparel assembly
pressing/finishing stage

32
2.4.3.1 Design creation stage (fashion illustration)
The design creation stage is a stage where the designer and design team generate ideas
and develop sketches for the new lines (styles), based fit model’s body type rather than on
varied body shapes and sizes prevailing in a target market. Decisions are based on fabrics,
recent sales activity of previous designs and knowledge about the consumer market to be
served in terms of body shapes, sizes, styles, colours and prices (Glock & Kunz, 1995:165).
The sketches must therefore contain clear and detailed information, particularly on the styles,
to be understood and interpreted by the pattern maker, and later also by the sample maker,
who must come up with an accurate, well-fitting sample (Brown, 1992:25: Keiser & Garner,
2003:173-177; Ashdown et al., 2007:350). Use of computer-aided design (CAD) increases
accuracy and efficiency. Fabrics are used as a source of design inspiration and as a guide in
the selection of suitable sizes, styles and colours (Zangrillo, 1990:45; Burns & Bryant,
1997:177).
2.4.3.2 Pattern creation
Critical to the development of an apparel pattern is the way in which the human body is
measured (as discussed in paragraph 2.3 above) and how those measurements are
interpreted. As was pointed out, the human body is three-dimensional while the
measurements obtained from it are one-dimensional. The flat pattern creation is two-
dimensional and must result in a three-dimensional garment to fit the three-dimensional body
shape (Davis, 1980:69). The successful translation of original designs into finished apparel
items is realised through the techniques of draping and/or flat pattern making by a skilled
pattern maker. Draping is the molding of fabric to the rounded dress-form figure, representing
the human figure, to produce a three-dimensional fabric pattern shape (Zangrillo, 1990:68;
Keiser & Garner, 2003:250). Although the art of draping would result in better-fitting apparel,
the dress form used for the production of the prototype does not represent the varied body
proportions of the different body shapes.
Flat pattern making is the drawing of a pattern on a flat surface to individual or standard
measurements in a given size, by applying the principles of drafting (MacDonald & Weibel,
1988:2; Keiser & Garner, 2003:250). Sample pattern makers convert designs into sample
patterns that, when the pieces are cut and sewn together, create a sample garment which
must fit a three-dimensional human figure. The pattern maker develops a pattern piece for
each part of the garment, making necessary changes in the company’s basic pattern (i.e. the
sloper or the basic block) which was created through drafting from body dimensions and
body shapes of the typical target customer (Brown, 1992:26; Brown & Rice, 2001:82). The
33
pattern maker must understand the characteristics of the body shapes, the fabrics to be
used, particularly their drape and stress characteristics, as these will determine the
effectiveness of the pattern. Knowledge about the exact amount of stretch of the fabric, in all
directions, is required so as to adjust the sloper for different body shapes and sizes
accordingly. Different sized bodies and different body shapes will exert pressure in different
areas, depending on how the bodies are shaped – and this must be understood well by the
pattern maker. Shrinkage characteristics should also be well understood and patterns should
be created to cater for it (Hudson, 1980:110; Solinger, 1988:55; Ashdown, 2000). The pattern
maker must also accurately assess, from the sketch, the overall silhouette desired, the
amount of ease and the designer’s desired proportions for the design detail, as well as the
shape of the intended customer (Burns & Bryant, 1997:178).
A sample maker following the specifications set by the company or the customer makes
prototype garments that reflect what is suitable to varied body shapes as well as the
consumers’ demand (Glock & Kunz, 1995:168; Rosenau & Wilson, 2001:184-187). The fit of
the company’s product is a way to achieve product differentiation. A fit model is used to
assess the fit, styling and overall look of the new prototype, but the problem lies in the fact
that the body shapes of the consumers differ from that of the fit model (Salusso-Deonier,
1989; Burns & Bryant, 1997:185; Schofield & LaBat, 2005c; Ashdown et al., 2007:353).
Grading as a major process of developing apparel in a range of sizes plays a significant role
in the way that an apparel item would fit the intended consumers’ sizes and body
proportions. Grading is defined as increasing and decreasing a base sized pattern into
subsequent larger or smaller sizes with similar outlines as the base pattern (Schofield &
LaBat, 2005b; Schofield, 2007:157). Production pattern pieces, which have been made in the
sample size and perfected on either fit model or dress stand, are then graded to create a set
of pattern pieces for each of the sizes listed on the apparel specifications sheet (Schofield,
2007:157). The pattern maker develops patterns for optimum fabric utilisation and ease of
assembly, and determines how each apparel item can be economically mass-manufactured,
while retaining the look that the designer intended. Existing grading practices have little basis
in measurement information from size charts, as the majority of grade rules applied are not
based on anthropometric research (Shofield & LaBat, 2005c). This suggests therefore that
the resulting apparel’s sizes and styles would contain fit problems as individuals’ proportions
differ. It has been observed that grade rules used by the industries are not standardised,
while body shapes do not change in the same way (linear pattern), and therefore consistent
incrementing or decreasing of sizes when grading, does not cater for the diverse body
shapes available in a market (Salusso-Deonier, 1989; Schofield & LaBat, 2005).

34
The lack of formal training in pattern making could also lead to fit problems as there would be
no coordination between body forms’ characteristics and the two-dimensional flat pattern
required to produce a well-fitting three-dimensional garment. If a base pattern has a fit
problem, whether in grain line, its balance or proportions, these problems are transferred to
new styles developed or graded from the same base pattern, and this leads to the production
of ill-fitting apparel (Hudson, 1980:111-113; Desmarteau, 2000). Grade rules used are
obtained from anthropometric data for that specific market (DeLong et al., 1993).
It may be argued that the lack of skilled personnel in Kenya’s apparel industry is a major
contributing factor to the fit problems experienced with ready-made apparel (Mason, 1998;
McCormick et al., 2002).
2.4.3.3 Cutting room
Marker making: A marker is a diagram of a precise arrangement of pattern pieces for the
sizes of a specific style that are to be cut for a single spread (Glock & Kunz, 1995:375).
Although body shapes and sizes do not directly influence marker making, pattern making, as
mentioned above, requires a thorough understanding of the characteristics of various body
shapes as well as sizes. Accurately prepared patterns would therefore influence the
arrangement of a marker. The marker indicates how all the pattern pieces of the apparel
items are to be arranged on the fabric to achieve the most economical and efficient layout. In
the process of producing the most efficient layout, the grain line and seam strength may be
affected, resulting in apparel items with poor fit (Hudson, 1980; Brown, 1992:28; Brown &
Rice, 2001:95; Ashdown et al., 2007:356). The use of computer-aided design to create
markers helps in achieving accuracy as well as speed and cost savings (Istook, 2000). In
Kenya however, the industry has not advanced to computer-aided design, and manual
operations could affect the fit of the final apparel item (Sasia, 1991; Ongile & McCormick,
1996:40; McCormick et al., 2001).
Spreading: Fabric spreading is the process of superimposing lengths of fabric on a
spreading table, cutting table or specially designed surface. Spreading may be done
manually or by computer-controlled machines (Glock & Kunz, 1995:381; Ashdown et al., in
Ashdown, 2007:358). Although varied body shapes do not directly influence this technique,
the way that the fabrics are spread would affect the fit of the final apparel worn by varied
body shapes and sizes. A spread should be as tension free as possible. Tension or tightness
of a spread is usually a major factor that affects apparel fit and quality because of the
reaction of the fabric (Hudson, 1980:120; Solinger, 1988:121; Brown & Rice, 2001:98). If
under too much tension during spreading, the fabric may stretch or elongate and later

35
contract in length, even before the apparel parts are assembled – leading to smaller sizes
than intended (Hudson, 1980; Solinger, 1988:121; Ashdown et al., 2007:360).
According to Hudson (1980:119), the spreading machine operator could affect fit by failing to
smooth out wrinkled cloth or to check cloth width or edge accurately. The use of modern
spreading equipment improves the overall quality of the product because it has a reliable
automatic edger, tension control and electronic width monitors. However, manual spreaders
without automatic devices are still largely used in the apparel industry (Brown, 1992:29). In
Kenya, most industries operate manually (Sasia, 1991; Ongile & McCormick, 1996:40), and
therefore accuracy may not be achieved – resulting in apparel items with poor fit.
Cutting: According to Glock and Kunz (1995:390), cutting is the reproduction process of
separating a spread into apparel parts that are the precise sizes and shapes of the pattern
pieces on a marker. Accurate, clean-cut, ravel-free pieces facilitate sewing and improve the
quality of garments. Accurately cut pieces are easy to align and position during sewing
operations. Inaccurate cutting will cause the operators to compensate by stretching or easing
to make the apparel parts the same length or size, resulting in puckered seams and hence,
apparel with poor fit (Solinger, 1988:128; Brown, 1992:29; Ashdown et al., 2007:360).
Although varied body shapes do not directly influence this part of the process, the way that
the patterns pieces are cut out, would affect the fit of the final apparel worn by the varied
body shapes and sizes.
Since all patterns are cut out simultaneously, if apparel pieces were cut inaccurately, they
would plague the entire assembly process. Mistakes made once would affect the entire line’s
sizes and styles. The type of cutting equipment and any lack of precision while cutting, may
also affect the size of the apparel items (Hudson, 1980:120; Ashdown et al., 2007:360). After
the apparel items are cut, the cut pieces are marked to enable operators to align seams,
details, and other pieces properly, to facilitate ease of constructing the pieces accurately. If
any information is missing, then some apparel items would not meet the size specifications
required and again, a problem with the fit would ensue. Computerised cutting systems
provide accuracy and efficiency. However, most apparel industries have not introduced
modern automatic cutters in their firms (Glock & Kunz, 1995:390).
In Kenya, most industries have the basic operator-controlled cutting blades that are
controlled manually. It is assumed that factors that may cause cutting inaccuracies include:
wide or vague lines on the marker, imprecise following of lines on the marker, variation in the
cutting pitch, allowing the fabric to bunch up or push ahead of the knife, using improper
equipment and incorrect cutting sequence, while apparel parts are being cut (Hudson,
1980:199-120; Glock & Kunz, 1995:391).

36
2.4.3.4 Assembly
Most factories produce apparel items on assembly lines (Brown, 1992:30). The cut pieces
are tied together into bundles with identification tickets attached. Each cut piece passes
through many hands in the assembly line, one step at a time. Due to varied skill levels and
moods of the operators, the resulting product could end up with substandard quality.
Subsequently, different specialised machines, if not controlled properly during the sewing
process, will also affect the size of the apparel. An over-locking machine, for example, if not
controlled, will trim the apparel excessively – thus affecting its size in the end. Hudson
(1980:120) argues that sewing operators could cause fit problems by overloading folders,
taking excessive trim and not matching guide points. Apparel sizes could also be affected
during the sewing process, due to the unique characteristics of the fabric, which may give,
stretch or undergo other changes. Puckering of seams also affects the fit of a garment, and
this may happen when the machine operators pull fabrics unevenly while sewing. It is also
difficult to inspect every apparel item against specifications at every stage of production. This
limitation allows fit problems to accumulate, having skipped previous inspections (Hudson,
1980:122). Although body shapes do not directly influence these techniques, the way that an
apparel item is assembled could affect the fit of the final product.
A wide variety of technologically advanced sewing machines, some of which are
computerised, help the operators to speedily and accurately perform the various steps in
assembling apparel. However, smaller industries may not be able to purchase such
automatic machines (Brown, 1992:30; Brown & Rice, 2001:101). The outdated machinery,
together with the unskilled personnel in Kenya’s apparel industries, could also be a cause of
poor fit (Sasia, 1991; Mason, 1998).
2.4.3.5 Pressing and finishing
At the pressing stage, shrinkage could occur due to numerous factors, some of which are in-
built in the structure, finishing or handling of the fabric. The problem may not be obvious until
the fabric is cut or apparel items are assembled. Shrinkage of any type is seldom consistent,
which makes it difficult to compensate for the changes into adapted pattern measurements
(Hudson, 1980; Brown & Rice, 2001:102). Snap-back type of shrinkage is one that occurs in
cutting and is common with knitted fabrics. This is due to fabric being subjected to too much
tension when being placed on the roll or the spread for cutting; in the end, undersized
garments are produced. When incompatible interlinings are used, different degrees of
shrinkages occur where apparel parts of different materials shrink at unequal amounts during
the wet ironing or pressing process, resulting in apparel items with varied dimensions. These

37
garments would be labelled with sizes that do not correspond to their physical dimensions.
Shrinkage control is critical to the satisfactory performance of apparel (Glock & Kunz,
1995:409). Although the varied body shapes and sizes of consumers do not directly influence
this part of the process, the way that the apparel reacts to pressing would affect the fit and
size of the final apparel worn by those varied body shapes and sizes.
It is assumed that quality control is done at almost all levels in Kenya’s apparel industry. With
inadequate equipment and low-level skilled personnel in Kenya’s apparel industries, it is also
possible that most of the inspections are done manually and some processes such as wet
processing may be skipped, due to ignorance and/or costs involved.
2.4.4 Distribution Distribution implies logistics, which encompasses the proper distribution and replacement of
raw materials and apparel, in servicing customers from the time that orders are received to
the delivery of the product to the retailer. Based on available body shapes and sizes in a
target market, it is possible to accurately distribute appropriate sizes and suitable styles.
Distribution basically involves the selection of the appropriate styles and the numbers of each
size to be sold at each store location, based on the consumers’ body shapes, sizes and the
size of the entire population (Glock & Kunz, 2000:108; Ashdown et al., 2007:368).
The classification of commodities and of the target markets’ body shapes and sizes would
determine the size range for a line, though determining the number of sizes to offer usually
entails complex work. If a firm targets women, for instance, it would probably offer apparel in
misses, juniors, women’s and half-sizes (Glock & Kunz, 1995:108). The apparel industry has
also developed a model stock plan which identifies the number of sizes, styles, and colours
that will be included in each product line, and establishes a percentage allocation for each.
This is designed to reflect the consumer order for each size, colour and style, and to present
a basis for a balanced stock in developing a line. With the use of quick response (QR)
deliveries and Electronic Data Interchange (EDI), the retailers and the apparel manufacturers
can offer their consumers a better selection of styles and sizes, as the inventories are
efficiently restocked with desired sizes and styles (Ashdown, 2000). The overall aim is to
offer correct and adequate – but not an unnecessary excess – in variety of sizes, styles and
colours to the intended consumers (Glock & Kunz, 1995:77; Keizer & Garner, 2003:412;
Ashdown et al., 2007:368).
The advantage of the optimised sizes is that the number of individuals who fit in each size
are more uniformly distributed across a range of sizes, and if each retailer has a precise

38
anthropometric database of their customers, it would be possible to work out the number of
different sizes essential to accommodate the population in that area. As the sizes are directly
based on data from an anthropometric database, such a forecast should be plausible
(Robinette, 1986; Ashdown, 1998; Ashdown et al., 2007:368). In cases where the categories
of body shapes are unknown, the apparel distributed would be based on estimates and these
would ultimately end up with fit problems. In Kenya, it may be argued that the lack of an
anthropometric database, and of classified body shapes, may be major contributing factors to
wrong distribution methods.
2.4.5 Style choices
The apparel silhouette is the outer shape of a garment; the shape and size of a silhouette is
the first thing seen when the garment is worn (Keiser & Garner, 2003:180). Lewis, 2007:319)
states that the body shape and the apparel silhouette worn become attached and united so
that the body shape beneath the apparel enhances the aesthetic appeal of that particular
apparel, while the apparel silhouette enhances the aesthetic appeal of the entire person.
Style details incorporated into design such as structural lines, control of fullness and the
creation of different silhouettes or shapes influence how the apparel will fit on the wearer.
The style features and the general structure of the apparel also influence the consumer’s
perceptions about the fit of that apparel (Ashdown, 2000). The structure of apparel
(silhouette) is an indicator of how closely an apparel item would conform to the body.
Generally, the closer the apparel silhouette conforms to body shape, the more limited the
apparel is in accommodating the proportions of varying body shapes (Glock & Kunz,
1995:110; Rasband & Liechty, 2006:3-5). Apparel components with limited fit points include
rigid apparel parts that do not readily expand or contract to accommodate different body
shapes and dimensions. These limited fit points would include: collar length, shoulder width,
waist length and hip circumference, depending on the style or design of the apparel.
However, these components can be modified to allow more variance in fit. Waistbands of
skirts, for example, could be in-built with sections of elastic and side tabs (Glock & Kunz,
1995:112).
Careful evaluation of different body shapes reveals that most proportions, frameworks,
contours and postures may symmetrically or asymmetrically deviate from the so-called ideal
figure (a comprehensive discussion on body shapes is given in Chapter 3 (paragraph 3.2).
Apparel styles have the potential to create a new and better perception of the body – even if
it is not considered to be ideal, to alter the perceived proportions of the body, and to provide
a sense of satisfaction to the individuals who do not fit the cultural ideals of size and weight
(Fiore & Kimle, 1997:331; Rasband & Liechty, 2006:3, 5 & 19). Ready-to-wear apparel

39
depends on an accurate estimate of the distribution of body shapes and sizes within a target
population. Therefore, it becomes necessary for every country, and even regions within
countries, to establish their own sizing systems, which can only be complete, if body shape
classifications are representative of the population that they were designed for (Simmons &
Istook, 2003; Shin & Istook, 2007; Honey & Olds, 2007). The styles to be produced would
then be based on an understanding of the different shapes available in a market place, rather
than being produced at random (Ashdown & Dunne, 2006; Shin & Istook, 2007).
Fashion being so dynamic, the type of fit that is fashionable could change from body-hugging
silhouette to loose, flowing styles within a short period of time. However, different groups in a
population will want different levels of fashion, style and fit. The challenge to the
manufacturer is to offer apparel that is suitable to the varied body shapes and sizes, and yet
in harmony with the customers’ desires (Hudson, 1980:109-110; Ashdown & Dunne, 2006).
Due to the lack of established body shapes as well as the lack of skilled manpower in
Kenya’s apparel industry, it is possible that the concept of fit in relation to style features may
not be well understood – and hence the production of poor-fitting ready-made apparel.
2.5 FIT ISSUES Fit is defined as the relationship between the apparel’s dimensions and the three-
dimensional human size and form/shape (Kadolph, 1998:550; Keiser & Garner, 2003:315;
Solomon & Rabolt, 2004:196). In other words, it is the apparel item’s silhouette and size
being right for the human’s body shape and dimensions. Fit issues would therefore be seen
as those measures carried out by the apparel industry to achieve well-fitting apparel for the
target market’s body shapes and sizes.
Solinger (1988:562) affirms that fit has two parameters, namely aesthetics and utility. The fit
measurements must consider the utility specifications for the styles (aesthetic), and both
must be suitable for different body shapes and sizes, and also acceptable to the consumers.
Although comfort is subjective to individual consumers’ expectations for each apparel item, fit
affects comfort as well as the durability of apparel in the sense that if an apparel item was
smaller than it should be either in parts or in the entire garment, the wearer’s movement is
restricted in the area of the problem (Rasband & Liechty, 2006:3-5). This therefore
necessitates that the crucial characteristics of different body shapes, such as the bust,
derriere, thighs, hips, shoulders and biceps, be well understood by the apparel producers.
Once the person is restricted, there is a feeling of discomfort resulting from the restrictions. A
tight-fitting apparel item would also tend to wrinkle and finally tear as a result of tension and

40
strain around the affected area. The debate on how well an apparel item fits would depend
on one’s judgement, perception of fit/comfort and the fashion at that point in time, and these
would vary according to the consumer, the designer and the pattern maker (Ashdown &
DeLong, 1995; Alexander et al., 2005a; Loker et al., 2005). It can be argued that, since each
industry uses self-made sizing systems and delivers differently fitting apparels, judgements
on the concept of fit would also differ. Brown and Rice (2001:154) argue that fit is evaluated
subjectively in terms of current fashions, cultural influences, body shapes, age, sex and
lifestyle (personal taste). Better-fitting apparel could be a close fit to one person and a loose
fit to another or on different occasions and depending on what is fashionable at that point in
time.
The concept of a good fit is subjective and dynamic, hence the need to address it at different
times and from different viewpoints, to come up with at least an acceptable and plausible fit
at that particular given time (Loker et al., 2006). It could be suggested that continuous pursuit
of quality management for each line production be carried out to ensure the production of
better fitting apparel that is suitable for varied body shapes and sizes within the fit
preferences of the consumers.
The fact that quality assurance is integrated within all the departments in most apparel
industries is an indication of commitment to quality. Random inspection on apparel defects
and sizes according to specifications does not, however, simply eliminate fit problems but
would detect a problem during the production process or at the final stage rather than
prevent it. Accurate sizing systems with categorised sizes and body shapes, and based on
correctly taken anthropometric data, are likely to prevent problems with the fit of apparel.
In Kenya, it is assumed that the concept of fit may be a new phenomenon, or it is taken as
something frivolous. With the lack of a classification of body shapes, together with the
inadequate equipment and low-level skilled personnel, specific strategies such as fit and
wear tests may be only rarely or minimally administered – resulting in poorly fitting ready-
made apparel. Although set standards of quality assurances may be observed in apparel
industries, the lack of sizing systems would still lead to the production of ill-fitting apparel –
even if all the quality measures were observed.
2.5.1 Perception of fit
Living in a consumer-driven era (Capraro, Broniarcczyk & Srivastava, 2003:164), companies
should aim at managing consumer satisfaction/dissatisfaction by producing products that are
tailored to the consumers’ fit preferences. According to Yu (2004:31), the definition of fit

41
depends on factors such as fashion culture, industrial norm and individual perceptions of fit.
These subjective definitions have however been reflected in the non-standardised philosophy
governing good fit. Although there is lack of agreement amongst the stakeholders on fit
(industry, retailers and consumers), consumers’ perceptions of fit should be taken as an
important element in addressing matters pertaining to fit for the purposes of supplying better-
fitting apparel to a population with varied body shapes and sizes (Keiser & Garner, 2003:29).
Istook (2002) argues that the personal preferences of each customer would govern their
perception of fit. The consumers’ previous encounter with the apparel shapes her perception
of fit (Ashdown, 2000). This could, of course, change with the fashion trend at that point in
time. Therefore, frequent checks on fit preferences could be tapped and translated into
desired and suitable apparel items to keep abreast with the dynamics of fashion. The
satisfaction offered by the apparel in terms of expected performance, may also contribute to
a consumer’s perception of fit.
In Kenya, no known research has been carried out on consumers’ perception of fit. The
conclusion drawn is that perception of fit may differ from person to person. It could also be
assumed that fit issues could be seen by the apparel industry as conformance to the
specifications that are used as quality assurance measures. The set standards are static
specifications that are applied repeatedly and therefore cannot address the consumers’ fit
preferences with the changing dynamics of fashion trends.
2.5.2 Objective measure of fit To judge the quality of the fit provided by a sizing system, one should rely for the assessment
of the fit of the apparel on the individuals for whom the system was designed. Unfortunately,
there is no reliability or validity in the responses given by the wearer, the designer or the
pattern maker, due to their varied judgements (Ashdown, 2003). The designer’s, pattern
maker’s and consumer’s concept of fit could vary a great deal, and therefore there could be
confusion concerning everyone’s perception of fit, which makes it difficult to be analysed
(Loker et al., 2006). The designer’s interest is to create a specific artistic look in relation to
the body of an ideal figure – a body shape and size that differ from those of the entire
population. The pattern maker/grader tries to maintain that look over a range of bodies, while
the consumers on the other hand, have their own judgements or preferences regarding fit
(Ashdown, 2000). Keiser and Garner (2003:29) are of the opinion that product developers
must find ways to gather information regarding consumers’ preferences in order to produce
apparel items that are satisfactory to consumers.

42
It is impossible to approach the consumer’s perception of good fit without a set of accurate
and comprehensive measurements and classified body shapes (Istook & Hwang, 2001:120;
Ashdown & Dunne, 2006). Consistent fit within a brand, based on accurate measurements
and body shapes, builds customers’ loyalty as they can rely on finding a good fit where they
have found it before (Glock & Kunz, 1995:107; Yu, 2004:31). Major obstacles in addressing
fit issues have been reported to be inadequate agreement among apparel professionals on
the parameters defining good fit, varied perceptions of good fit and lack of information about
which concepts of fit are important to the consumers (Ashdown, 1998; Ashdown, Loker &
Adelson, 2004; Yu, 2004:31).
Ashdown, Loker and Adelson (2004) report that objective measurements used for defining fit
have been developed. This includes comparing apparel measurements to the body
dimensions, particularly at standard, critical fit locations for different apparel items. Pressure
gauges could also be used to measure the actual amount of pressure generated on the body
by the apparel item (Ashdown, 1998). The critical fit points for different body shapes differ
and this calls for attention so as to assess the objective measuring of fit in different
consumers with varied body shapes and sizes. Interactions that occur in the complex system
of the dressed body could only be solved by the use of a body scanner (Ashdown, Loker &
Adelson, 2004). Unfortunately, not all the apparel industries, particularly in developing
countries such as Kenya, could employ such expensive technology, which makes fit issues
complex to deal with; hence, the continuous production of poor-fitting apparel items.
2.5.3 Fit testing Manufacturers should aim to consistently satisfy their consumers by producing apparel items
that are suitable to varied body shapes and sizes (Brown & Rice, 2001:154). As discussed
earlier, consistent quality of fit is pursued at every step of the apparel production process.
Prototypes are checked on models with measurements and body shapes that are conforming
to the desired body dimensions and form, but are not necessarily a representation of the
shape/dimensions of the entire population. The fit of the sample apparel is also checked on
the three-dimensional form (dress form), which is a replica of the so-called ideal body shape
(Glock & Kunz, 1995:165-166). Fit testing is crucial because it prevents unwanted returns by
the consumer, while it much improves apparel’s quality as it becomes the company’s norm.
Testing the apparel’s fit reveals key problems underlying the fit or the functionality of a
garment, which serves as an improvement tool for the consistent and continuous production
of better-fitting apparel. There are methods established to subjectively measure fit through
analysis by experts in the apparel profession who visually analyse the apparel’s fit on the
wearer. Using trained, professional panel members would avoid bias and perception error

43
during such a study, as the training helps them to develop a high degree of sensitivity to the
complexities of good fit. Data gathered from expert assessments are used to qualitatively
analyse the fit of the apparel and evaluate the accuracy of sizing systems and pattern
prototypes (Ashdown, 2000, Keiser & Garner, 2003:318-319).
Disadvantages observed in the use of live models are that they may gain or lose weight,
change proportions or become unavailable, making it difficult for a company to maintain
consistent fit – even when the company pro-actively maintains a current group of fit models
(Brown & Rice, 2001:155). In Kenya, it may be argued that apparel industries might be
ignorant of fitting tests. The lack of appropriate basic tools, such as dress forms for pattern
draping, could be an indication of ignorance or negligence. However, the apparel industries
countercheck apparel’s fit with the specifications written for a certain product, which is not
sufficient to capture the unique relationship between the body and apparel.
2.5.4 Wear testing
Wear testing is also necessary in order to address issues of durability and consistent fit of
the apparel item, even long after purchase. Although Solomon and Rabolt (2004:148) argue
that apparel must imperceptibly reconcile body changes that occur over time and encourage
comfort without looking age-specific, the performance and fit of apparel still change over
time. This poses a challenge for manufacturers to provide apparel that continues to fit after
wear and care. Brown and Rice (2001:52-54) state that consumers cannot accurately
evaluate apparel’s functional performance at the point of sale, but may estimate some
features of functional performance, such as comfort or freedom of movement, by trying on
the apparel. Care labels represent an implied warranty by the manufacturer that the apparel
will retain its shape and appearance if laundering care instructions were carried out
appropriately. Based on design, material, workmanship and information given on the labels,
consumers should be able to predict the functional performance of apparel, especially if they
had prior experience with similar apparel items (Brown & Rice, 2001:147-148; Keiser &
Garner, 2003:333).
It could be argued that customers’ satisfaction extends beyond the fit observed in a retail
environment, to also include the performance of the apparel long after purchase and even
after repeated washings. Wearing and caring for the apparel under normal circumstances
without change, helps determine how the interaction between the body shape and the
apparel (design, material and construction) affects its performance overall (Brown, 1992:18).
Wear tests also occur uncontrollably under different circumstances, and although the reports
could be subjective, the wearer’s results regarding the behaviour of a garment under actual

44
wearing conditions could be useful for addressing fit problems resulting from wearing and
handling of the apparel long after purchase. Unfortunately, reports from the subjects are
hardly ever received (Ashdown, 2000). Ashdown (2000) is of the opinion that wear tests
should be done on subjects that are identified by the company, to wear an apparel item over
a period of time, while it is subjected to recommended cleaning methods, normal handling,
and wearing. The processes can be monitored and studied, and any changes that might
occur over time would be used to address the problem and could eventually lead to the
production of enduringly better fitting apparel (Ashdown, 2000; Cornell University, 2003).
Some manufacturers and few retailers perform extensive lab tests or a day’s tests on apparel
that they produce to ensure that quality is maintained. Lab testing or a day’s testing could be
simple or complicated, with equipment ranging from home washing machines and dryers to
more sophisticated computer-integrated instrumentation. However, many manufacturers do
not carry out any tests on the apparel they sell, and if they ever perform the tests, they
seldom inform the consumers about the results (Brown, 1992:18). In Kenya, no known
wearing tests are carried out. It is assumed that the industry is ignorant or generally negligent
in this regard.
2.6 COMMUNICATION OF SIZING AND FIT Istook (2002:65) explains the importance of communicating how each apparel item was
designed to fit, by the manufacturer to their consumers. This communication is an
indispensable step to meet the fit expectations of consumers. Ready-to-wear apparel
contains a variety of labels and tags that express information to the consumers for estimating
the quality of an apparel item in terms of size, fit and care. According to Brown (1992:45),
apparel labels must be permanent and must remain legible throughout the useful life of the
garment, as this would act as a future reference for a similar size and fit. It would also
continuously guide the consumers in caring processes that would facilitate consistent fit even
after long use. According to Chun-Yoon and Jasper (1996:89), a size label is a tool for
communicating sizes and body types to the consumers and to assist them in choosing
apparel that fits their body shapes and sizes appropriately. Glock and Kunz (1995:108) state
that size labels are supposed to indicate dimensions and to describe the body shapes that
the apparel was designed to fit. They should indicate whether the person is tall with
large/small bust and large/small hips, short with large/small bust and large/small hips, or
regular (medium height) with large/small bust and large/small hips. These indicators of fit
would provide a foundation for judging the suitability of apparel in selecting for a particular
body type and size. Unfortunately, female consumers often get frustrated and confused as
45
they flip through several assortments of styles and sizes trying to get an apparel item that fits
correctly (Chun-Yoon & Jasper, 1996; Ashdown, 1998).
Reasons for the variations that exist between apparel that has been sized with the same
codes within one company or between different companies could be traced to the use of
obsolete and/or wrong measurements. Most databases were taken many years ago and do
not reflect the dimensions of the present female body shapes (Brunn, 1983; Olds, 2003). The
methods of obtaining body dimensions are inappropriate and most apparel industries do not
adhere to the suggested (voluntary) standard sizes (Faust et al., 2006). Most sizing systems
available do not include classification of body shapes, which is the core component of a
successful sizing system (Chun-Yoon & Jasper, 1996; Istook & Hwang, 2001). The pattern
development, grading, fabric spreading, cutting and assembling procedures employed by
different manufactures are inconsistent (Hudson, 1980:112; Solinger, 1988:128; Brown,
1992:29; Glock & Kunz, 1995:390). Failure of quality control measures right from the size
charts/tables through various apparel production processes could easily permit errors to slip
through from one section of apparel processing to the other.
The factors determining apparel’s fit are also not clearly defined, thereby enabling
manufacturers and retailers to use size labels as competitive advantage and as a marketing
gimmick (Ashdown & DeLong, 1995; Glock & Kunz, 1995:111). For example, apparel of
different brands and styles, as well as apparel items of the same brands, may be labelled
with the same size but could fit differently (LaBat & DeLong, 1990; Workman & Lentz, 2000;
Brown & Rice, 2001). Size labels keep from larger to smaller sizes as a result of “vanity
sizing”. These psychological sizing systems are best described as lying labels as they
portray a smaller size on the face of the label and yet the measurements of the garment, fit a
large sized person. Thus, a woman whose measurements are normally within a size 14
range, could wear an apparel item sized 12 or even size 10 (Tamburrino, 1992a & 1992b;
Ashdown & DeLong, 1995; Glock & Kunz, 1995:111; Keiser & Garner, 2003:304; Faust et al.,
2006).
2.6.1 Size labels’ quality and consumers’ apparel selection Size labels for women’s apparel lack the correlation that men’s size labels have to their
actual body dimensions, leaving manufacturers to develop their own sizing systems, which
are confusing and frustrating to the women consumers as they look for apparel that fits
(Workman, 1991; Holzman, 1996). Although size labels are not obligatory (Keiser & Garner,
2003:336; Faust et al., 2006), the way they are presented to the consumers plays a major
role in their apparel selection exercise. Ironically, an apparel item bearing a mandatory care

46
label also bears a size label with flawed information. Care labels represent an implied
guarantee by the manufacturer that the apparel will perform exactly as stated, and yet the
information on the non-instructive size labels is vague and obscure.
Informative (self-explanatory) size-labelling that relates directly to body dimensions
contributes to consumer satisfaction (Chun-Yoon & Jasper, 1995; Holzman, 1996). Most
women sizes are not expressed as body dimensions, but rather expressed as arbitrarily
chosen numbers or letters that correlate with sets of unrevealed body dimensions (Brown &
Rice, 2001:147-148; Faust et al., 2006). Unfortunately, when body dimensions are not
revealed to uninformed consumers, the size designations are almost meaningless, thus
leaving the consumers to guess and assume what would fit appropriately. These
uninformative labels would contribute consumer frustration in their humiliating experience of
apparel selection.
2.6.1.1 Uninformative size labels
The uninformative size labels have been described as tacit, implicit or inferred (Mason et al.,
2008), because only individual manufactures and retailers know the meaning. The meaning
of the numbers indicated and exactly how large, medium or small a person should be, is kept
a secret by individual manufacturers/retailers. As in the case of numerical labels (Table 2.1),
different manufacturers whose aim is to maximise profits, would actually keep the key
measurements concealed. To an uninformed consumer, these would actually be seen as
meaningless labels, as they cannot link the letters or the numbers indicated on a size label to
the body shapes and dimensions used for the construction of that particular apparel item
(Brown, 1992:55; Mason et al., 2008).
Numbered size labels, for example, size 16 or size 34, is the most common method of sizing
for the majority of mass-produced apparel, particularly on moderately priced and even on
expensive apparel (Workman & Lentz, 2000). However, consumers often find it difficult to link
the number to their own measurements, as they do not understand what constitutes those
numbers (Chun- Yoon & Jasper, 1995; Workman & Lentz, 2000). The information on the size
labels is not adequate enough and not sized according to body dimensions to assist the
consumer in finding the correct size and style (Chun-Yoon & Jasper, 1995; Faust et al.,
2006). Uninformed consumers may not be able to interpret odd numbers such as sizes 9 and
11 or even numbers such as sizes 10 and 12, or even the larger numbers such as 38 and 40.
The efforts of retailers and apparel manufacturers to reduce stock units have been reflected
in the move to double sizing or collapsing sizes. For example, combining sizes in juniors and
misses, such as sizes 9 and 10, could be confusing and frustrating during apparel selection.

47
Research shows that differences in body contours exist between people of the same
measurements and more so between different categories of people (Zwane & Magagula,
2006; Shin & Istook, 2007). Therefore, if sizes are combined it could end up confusing the
customers even more, because neither misses nor junior female consumers would then be
fitted well (Kunik, 1984:16; Winks, 1997; Ashdown, 1998).
TABLE 2.1: NUMERICAL SIZE LABELS
Sizes indicated as numbers and presented on the apparel’s label sometimes singly or accompanied by key dimensions
Numbered sizes -examples Numbered sizes - examples
Numbered sizes (odd numbers) Half sizes
8, 10, 12, 14, 16, 18, 20, 22, 24, 26, 28 ----------
36, 38, 40, 42, 44, 46, 48, 50, 52, 54, 56 ----------
13, 15, 17, 19, 21, 23, 25, 27 ----------
8½, 10½ , 12½ , 14½, 16½, 18½, 20½ ----------
Lettered size labels are particularly uninformative systems and are also known as average
sizing. Examples are: S = Small, M = Medium, L = Large and XL = Extra Large, and
sometimes XXL = XX-Large and XXXL = XXX-Large for yet larger sizes and XS = Extra
Small. These size indications reduce the possibilities for excellent fit, because they result in
collapsing size categories to a small number of size divisions. In the lettered sizing, as in
other sizing systems, there is little standardisation from brand to brand and no consistent
correlation to the body dimensions – making it more confusing and exasperating to the
consumer (Hudson, 1980:116). Although lettered sizing is popular in loose-fitted apparel,
some retailers use them on woven apparel with a closer fit. Nonetheless, consumers cannot
find an accurate fit within S, M, L and XL as easily as they can within the numbered sizes
developed from anthropometric data of the targeted population. People’s sizes vary between
regions, different ethnicities and even within a region or ethnic group. A small size in one
region would be a larger size in another region – thus the need to have accurate data of each
region or ethnic group (Shin & Istook, 2007). In a case like Kenya, where information on
sizing systems is inconsistent and confusing and no known anthropometric database exists,
the question arises of which labels are to be used. As was mentioned earlier, the size
standards records (KEBS, 2001:7) indicate that the anthropometric data available was
collected in 1975. The sources of the original data are not available to verify the reliability of
the records. The one-size-fits-all label type of sizing is also an attempt by manufacturers and retailers to
further collapse sizing by providing apparel that has the ability to stretch and to fit many body
shapes and sizes (Abend, 1993; Brown & Rice, 2001:148). It can be argued that one-size-
fits-all apparel cannot accurately fit body shapes of extreme sizes. The stretch characteristic

48
of a fabric has a certain percentage of elasticity (stretchability), which may either be too little
for the largest size or too much for the smallest size. Design ease provided for this kind of
sizing has its limitations within each body build/size and cannot be suitable for the entire
range of varied body builds and sizes. 2.6.1.2 Informative size labels (Figure 2.5) A size label that shows or tells the consumer how the apparel should fit is referred to as an
informative/self-descriptive/instructive label. Informative (self-descriptive) size labelling that
relates directly to body dimensions contributes to consumer satisfaction, while apparel
manufacturers enjoy profits (Chun-Yoon & Jasper, 1995; Holzman, 1996). Since sizing and
size labelling are often used by the manufacturers/retailers as a marketing tool, it is important
to have accurate information. Brown and Rice (2001:147) argue that instructive or self-
explanatory size labelling (Figure 2.5) that directly indicates the body type and relates to the
body measurement, is beneficial not only to the consumer, but also to the companies aiming
at satisfying and retaining their customers. Chun-Yoon and Jasper (1995) confirm that
consumers prefer the wordless pictogram label, which is self-explanatory as it indicates
measurements essential to the fit of a particular apparel item on a little sketch or diagram of
the human body. Pictograms are particularly useful for international trade because they
overcome language barriers and are easy to understand at a glance by the consumers
(Brown & Rice, 2001:147/148). The efficient apparel selection that an informative size label
allows will not only ensure customers’ emotional well-being as well as manageable
wardrobes, but also growth in manufacturers’ and retailers’ business.
INFORMATIVE/SELF-DESCRIPTIVE SIZE LABELS Pictogram with key dimensions Wordless pictogram Code and key dimensions
FIGURE 2.5: INFORMATIVE SIZE LABELS
Wordless pictogram (without supportive written key dimensions): With an increase in
international trade in apparel, difficulty of communicating sizes of imported/exported apparel
becomes an issue (Brown & Rice, 2001:147-148). Methods of sizing differ between different
Size 24
Waist - 96 cm Hips - 124 cm Length - 104 cm
Size code-14 Bust – 92 cm Hip - 97 cm Length - 96 cm
Size 24

49
manufacturers within countries and between different parts of the world. This means that
different countries could have different sizing techniques and codes to communicate sizes.
Pictograms therefore have proven to overcome the language barriers (Chun-Yoon & Jasper,
1995). The body dimension critical to the fit of a particular apparel item is indicated on an
illustration of a human figure. The illustrated human figure enables a consumer at a glance to
estimate the fit of the apparel, thus providing meaningful information about sizes and easing
apparel selection (Mason et al., 2008). Unfortunately, the imported and the local ready-made
apparel in the Kenyan market, continues to use tacit size labels with very little, insufficient
and hidden meaning; thus their entire purpose of size communication fails.
Pictogram supported with written key dimensions: This size label is considered to be
effective and its strength is enhanced by the use of a wordless pictogram, indicating specific
parts/regions of the body that are accompanied by body dimensions. It may be argued that
this system would be strongly effective within a country where there is an updated
anthropometric database. In countries where the data is obsolete, it would be more valuable
to provide all the necessary information on the apparel labels to facilitate some close
estimation of key body dimensions by the consumers, in order to ease the apparel selection
exercise (Mason et al., 2008).
Size code and the key body dimensions: This system could be very effective in a country
where there is an updated anthropometric database. The size code given is accompanied by
measurements of the key dimensions, making it easier for the consumers to predict how the
apparel would fit, and thus easing the process of apparel selection. This therefore demands
that all the necessary information be given on the apparel label, with the presence or
absence of updated anthropometric data.
Although providing size labels is voluntary, Istook (2002:65) explains the importance of
communicating how each apparel item was designed to fit, by the manufacturer to their
consumers. This communication is an indispensable step to meet the fit expectations of the
consumers. In Kenya, size labels presented on either imported or local apparel are flawed
and in most cases the uninformative types. Uninformed consumers may not comprehend
what the codes mean and therefore may not find it useful enough during apparel selection.

50
2.7 CONCLUSION AND IMPLICATIONS FOR THE STUDY
After going through each concept presented in Ashdown’s model and other supportive
literature, the following conclusions based on the main concepts highlighted throughout this
chapter, are hereby given.
2.7.1 Population measures
The foundation of any successful sizing system should reflect accurate dimensions and body
shapes of a studied population. The body dimensions of a population must be accurately
taken, using recommended techniques and instruments. This means that outdated,
borrowed/copied size data cannot be used or improved without an accurate, up-to-date and
representative anthropometric database for a target market. Kenya’s sizing standards are
outdated, while the anthropometric database from which they were developed is obscure.
There is no classification of body shapes to act as design guide for the purposes of
producing better-fitting apparel.
2.7.2 Design features
The lack of classified body shapes could mean a lack of design guides for the production of
better-fitting apparel. The low-level skills of personnel in the apparel industry are likely to lead
to the production of poor-fitting ready-made apparel. Personnel with low-level skills are also
likely to face many challenges in translating the different body shapes into suitable styles and
sizes. Kenya’s lack of classified body shapes together with the lack of skills in the apparel
industry’s personnel could be viewed as contributing factors to the poor fit of ready-made
apparel in Kenya.
2.7.3 Fit issues
The lack of standardised agreement on the concept of fit amongst different stakeholders
(designer, pattern maker and the consumer) could contribute to fitting problems because fit
quality standards based on representative body shapes would vary from one manufacturer to
another. In Kenya, research on the perception of fit by the apparel industry and by the
consumers, is not readily available. The industry, however, lacks adequate and modern
technology necessary for improving the fit of apparel.
51
2.7.4 Communication of sizing and fit
The lack of adequate information on the size labels leads to consumers’ confusion and
frustration as they select ready-made apparel items. Informative size labels based on
accurately taken anthropometric data should inform the consumer about the dimensions
used, and which body shape the apparel will fit best. The sizes and body shapes indicated
on a size label must reflect the dimensions and body shapes of the target market. Obsolete
sizing systems and the lack of a body shape classification systems in Kenya could be major
contributing factors to the poor fit of the ready-made apparel. The uninformative size labels
presented on women’s ready-made apparel are most probably not well understood by the
consumers, and hence they select inappropriate apparel items.
Based on the above conclusions and for the purposes of this study, sizing systems are
therefore defined as the classified dimensions and body shapes, based on a target
population (market) for the construction of ready-made apparel for that specific market. It is
further reasoned that a sizing system would not be complete and successful, if the
dimensions and body shapes represented are not communicated effectively and
appropriately to the consumers. The consumers as the receivers should also be acquainted
with size and fit issues, to understand their own body shapes as well as their key dimensions
necessary for a specific apparel item. This enables a link between the information given on
the labels to the consumers’ body shapes, dimensions and proportions. All these aspects
could collectively result in easy and successful apparel selection as well as satisfactory
apparel items for the consumers, while the retailers/manufacturers enjoy profits.
The situation in Kenya regarding sizing and fit seems to be worse than in most developed
countries where studies have been carried out. According to Kenya Bureau of Standards’
records (KEBS, 2001: Preface), anthropometric data was collected in 1975; the original
database from which the size charts were established is unknown and obscure. This
suggests, therefore, that the data available is flawed and obsolete as there is no known
evidence to guarantee the quality of the sizing systems currently in use. The size charts
available do not include body shapes, which should form the core component of a successful
sizing system. The consumers do not understand the tacit size labels used on Kenya’s
ready-made apparel and this has an influence on their choice of appropriate apparel styles
and sizes. Ignorant consumers could make wrong apparel choices and at the same time get
frustrated as they flip through several apparel assortments, guessing and estimating what
would fit their bodies and sizes appropriately. The lack of research carried out on sizing and
fit issues or on any related subject in Kenya, highlights the deficiency that needs to be
addressed. Considering the novelty of the concept of sizing based on consumers’ varied

52
body shapes, consumers’ knowledge about size and fit, their perceptions regarding general
fit problems and their fit preferences, this study may provide reference data on apparel sizing
and fit issues in Kenya. As the focus of this study, these issues are addressed in Chapter 3.

53
Chapter 3
SPECIFIC SUPPORTING LITERATURE REVIEW AND CONCEPTUALISATION
Considering that this study is new in Kenya, this chapter provides a review of specific
literature addressing the female’s body shape identification and body characteristics that are
critical to the fit of apparel, and how they (shape and body characteristics) may contribute to
fit problems. It also focuses on the female consumers’ knowledge/ignorance about the
communication of sizing and fit, as this would determine the success or failure of her
selection of appropriate apparel in a retail environment. Although every consumer’s fit
preference is a subjective matter and varies from one person to the next, understanding
consumers’ fit preferences could allow the tapping and translation of the consumers’ required
degree of fit, into apparel styles and sizes that should be suitable for the different body
shapes and sizes within specific markets (Keiser & Garner, 2003:29; Ashdown & Dunne,
2006).
3.1 INTRODUCTION 3.1.1 The concept of fit Beautiful and well-fitted apparel is not only attractive, but also enhances the appearance of
the wearer, because apparel is an extension of the self. Apparel that is too large gets in
one’s way, creating a comical appearance, whereas too small apparel restricts movement,
and appears immodest and odious (Rasband, 1994:8; Rasband & Liechty, 2006:5-6). In
either case, poorly-fitted apparel distracts attention, emphasises body shape problems and
undermines the confidence of the wearer (Zangrillo, 1990:4; Fiore & Kimle, 1997:176). A
well-fitting garment hides a body shape problem and directs the attention away from the
problem area – thereby contributing to the psychological and social well-being of the wearer
(Farmer & Gotwals, 1982:3). Pleasing apparel leads to the customer’s loyalty to the store
that continues to satisfy her needs, and hence profit to the manufacturer/retailer (Hudson,
1980:112; Rasband, 1994:19; Bougourd, 2007:108). In Kenya, with regards to sizing and fit,
it is likely that, if the customer identifies a retailer that stocks satisfactory apparel in terms of
fashion and better fit, it is possible that she will develop a loyalty to the store and perhaps tell
others about it.

54
Fit refers to how well the apparel conforms to the three-dimensional body in a comfortable
and flattering manner. It is determined by proportional relationships between the dimensions
and the body shape used in a firm’s sizing system (Ashdown & DeLong, 1995; Glock & Kunz,
1995:110; Fiore & Kimle, 1997:175; Brown & Rice, 2001:153). Fit is an important part of both
the aesthetic and the performance features of apparel (Yu in Fan et al., 2004:31; Bougourd,
2007:108). It is crucial to consumer satisfaction, as it influences the attractiveness as well as
the comfort of an apparel item; thus it is one of the attributes that an individual evaluates
when trying on apparel items (Kadolph, 1998:27-28). However, Brown and Rice (2001:153)
argue that it is often easier for consumers to find colours, prices and styles they like, than to
get better-fitting apparel. This implies that attaining the correct fit is a very exigent task in the
apparel industry. This also confirms that apparel sizing and fit are difficult concepts to
research and analyse as the relationship between the body and apparel is complex and often
ambiguous (Loker, Ashdown & Schoenfelder, 2005). Examining the body shape and its
components requires knowledge of the elements of fit and how they interact with the body’s
physical features to produce aesthetically pleasing and better-fitting apparel.
Apparel is the product of a design process and the fabric’s properties, and its quality is
measured by its drape-ability, appearance and comfort on the body shape. The body shape
functions as a framework for the apparel (Salluso-Deonier, 2005), and the fabric’s properties
and the apparel’s style must be in harmony to produce aesthetically pleasing, comfortable
and well-fitting apparel. However, the effects of a stunning design, gorgeous fabric and
exquisite workmanship are destroyed if the finished apparel does not fit the intended wearer
(Winks, 1997; Brown & Rice 2001:153). The elements of fit, which encompass grain, set,
line, balance and ease (Erwin et al., 1979), contribute to both the appearance and the
comfort of the apparel. They are used as appraisal gauges for the quality of the apparel’s fit.
The correct grain of the fabric contributes to the correct hang of the garment in harmony with
the size and body shape, while the set is the apparel’s smoothness without undesirable
wrinkles or folds. It results from correct body dimensions and body shape proportions that
are translated into the three-dimensional apparel style. The style must harmonise with the
size and the body shape that the apparel is designed for. Correct body dimensions and the
alignment of the apparel’s structural lines in accordance with the natural lines of the body
shape, characterise the line as an element of design. The balance is achieved through
correct body dimensions and correctly translated body proportions used to create the apparel
silhouette’s equilibrium on the right and left halves of back, front and profile characteristics of
the body shape. The ease involves the use of correct body dimensions and the amount of
ease allowed into a pattern for the purposes of wearing and styling/design. The functional
ease allowed must be in a harmonious relation to the body shape, size and proportions to

55
provide comfortable apparel items without wrinkles or creases. The design ease allowed
should result in suitable styles that must also be suitable for the various body shapes and
sizes (Erwin et al., 1979; Brown & Rice, 2001:153). The comfort of an apparel item is
attributed to its wearing/functional ease and styling/design ease. The wearing ease allows for
flexing and movement without restriction or straining in any way. It is judged on both tactile
and visual responses (Kadolph, 1998:30; Ashdown & DeLong, 1995; Glock & Kunz,
1995:111). The comfort provided by the amount of ease allowed, differs with differently fitted
apparel (such as the three basic types of fit: close fit, relaxed or semi-fitted, and looser to
very loose fit), the body shape and the end-use of the apparel.
All the aforementioned elements of fit work simultaneously to produce aesthetically appealing
apparel that is comfortable and well-fitted to various body shapes. The lack of any of these
attributes contributes to apparel fitting problems, which could be seen as too tight, or too
loose a fit. It could also contribute to a lack of symmetry in the apparel item, sagginess in
parts such as pockets, bulginess in linings, seams that pucker, wrinkles and/or any other
undesirable fabric behaviour in the finished apparel (Hudson, 1980:110; Brown & Rice,
2001:157; Rasband & Liechty, 2006:29, 194, 324). With low-level skilled personnel in
Kenya’s apparel industry, it is possible that the factors contributing to apparel’s fit quality (the
elements of fit) are not well understood, and hence the production of poor-fitting ready-made
apparel. Since body shape plays a major role in apparel’s fit quality, an overview of body
shape is hereby given to provide a deeper understanding of the body’s physical properties,
such as proportions, postures, shapes and sizes, and how they could influence the fit of
apparel.
3.2 BODY SHAPE
For the purposes of this study, the body is described as a three-dimensional human
structure, which Salusso-Deonier (2005) describes as a framework for proportioning apparel.
It is usually discussed in terms of shape, contours and postures (Davis, 1980:73; Liechty et
al., 1992:33-35; Rasband, 1994:15; Marshal et al., 2004:137). People’s shapes and
proportions change over time as a result of changes in nutrition, lifestyle, ethnicity, age,
grooming and concepts of ideal beauty (Winks, 1997; Ashdown, 1998; Shin & Istook, 2007;
Bougourd, 2007:108). It has been observed that body shapes vary not only from country to
country but also from region to region within countries (Winks, 1997; Yu in Fan et al.,
2004:185; Zwane & Magagula, 2006). Chun-Yoon and Jasper (1996) identify one of the
fitting problems as a lack of appropriate sizes to accommodate the full range of variation in
body shape that exists in the current population. Ready-to-wear apparel depends on an

56
accurate estimate of the distribution of body shape and sizes within a target population
(Salusso-Deonier, Delong, Martin & Krohn, 1985; Yu in Fan et al., 2004:185). The adequacy
of a standard sizing system depends on both database and body shape classification
methods (Ashdown, Loker & Adelson, 2004). An anthropometric database must be classified
such that the majority of the sample is accommodated by a minimum number of size
categories, yet it should integrate the variation in body shapes within the population that the
sizing system is expected to serve (Workman, 1991; Ashdown, 1998; Loker et al., 2005).
Differences in body shape arise from variations in body type, posture and body size
(Salusso-Deonier, 2005). According to DeLong (1987:38, 42), the weight distribution on the
body frame constitutes the shape of the body. The body can be considered to be a vertical
graduation of size, with the upper section containing more details than the lower section. As
a visual structure, the body is made up of visual units that can only be clearly distinguished
when viewed from the front, back (silhouette) and side (profile) (DeLong, 1987:38-42;
Salusso-Deonier, 1989). Apparel sizing relies therefore upon an understanding of body
shape variation in terms of dimensions and shape that should be translated into three-
dimensional apparel, which should fit a shape appropriately. However, many apparel
designers tend to build their products around conventional (fit model/ideal shape) consumers
with well-proportioned body features. In doing so, they neglect many important body shapes
that exist in the market place (Bougourd, 2007:108).
3.2.1 Ideal body shape
Although the ideal shape varies, and is bound to change due to the whims of fashion and
within different cultures (Rasband & Liechty, 2006:23-30), most studies define the ideal figure
(Figure 3.1) as a perfect human structure, and a well-balanced shape, which is usually used
as a standard figure and/or a fit model (Armstrong, 1995:33). The perfect body is assumed to
provide a silhouette that will fulfil everyone’s desired image of perfection, but in reality it
denies the consumers the opportunity to see themselves sensibly (Lewis, 2007:319). To
facilitate an in-depth understanding of aesthetically appealing apparel, insight into and
knowledge about the ideal figure’s proportional relationships of body components become
important. This will provide some form of standard in examining the proportions of any other
body shape that may differ from it, and hence in the making of apparel that is suitable and
pleasing to different body shapes – even if they are not ideal. Proportion, or the relationship
of one segment of the body to another, is used to describe the ideal body shape (LaBat &
DeLong, 1990; Rasband & Liechty, 2006:23-30).

57
The bust, waist and hip positions are in relation to the total height of the figure. The height of
an average (ideal) shape is divided into four equal parts (Lyle & Brinkley, 1983:63;
Armstrong, 1995:33). Hips serve as the mid-point of the total body height, where the
waistline is the mid-point between the hipline and the underarm. Knees serve as the mid-
point between the hips and the floor line. If any of the figure’s four length points are not
equally distributed as in the ideal figure, then the body shape could be described as high-
waisted, high-hip, short-waisted or low-hip, depending on where these points fall within the
height of the figure (Figure 3.2) (Lyle & Brinkley, 1983: 63). The height proportions could
also influence the design values applied to an apparel pattern at specific height fit points
such as the hips, waist and the bust. The height proportions can be obtained more accurately
through body dimensions and to some extent, through visual analysis.
Typically, the ideal figure shows the following characteristics:
It has just enough weight covering the bone and hollows of the body softly and
smoothly.
Its body mass is distributed evenly from the centre core of the body or the spine, as the
body is viewed from back, front and side.
The bust balances the buttocks as the body is viewed in profile.
It is similar in width in the shoulders and hips, with medium bust, small waist, flat to
slightly curved abdomen, moderately curved buttocks and slim thighs.
It is a well-balanced figure with no exaggeration on any part of the body
(bust/shoulders and hips/buttocks measures the same or are closely similar, with a
waist of about 26 centimetres (cm) or 10 inches smaller than the hips.
FIGURE 3.1: IDEAL BODY SHAPE

58
SHORT-WAISTED AVERAGE (IDEAL) SHAPE LONG-WAISTED
BUST Bustline is above the bustline of the ideal figure.
Bustline is midway between shoulders and waistline.
Bustline is below the bustline of the ideal figure.
WAIST Waistline is above the waistline of the ideal figure.
Waistline is midway between the bustline and the hipline.
Waistline is below the waistline of the ideal figure.
HIPS Hipline is above the hipline of the ideal figure or above the mid-point of the figure’s height.
Hipline is the mid-point of the total figure’s height.
Hipline is below the hipline of the ideal figure or below the mid-point of the figure’s height.
FIGURE 3.2: HEIGHT PROPORTIONS (Adapted from: Lyle & Brinkley, 1983:63)
With non-standardised height proportions among body shapes, ready-made apparel is bound
to contain fit problems around the waistline. The fit problems arising as a result of non-
proportional height distributions could be high or low waist, and problems of too tight fit.
Currently, media and apparel companies worldwide use a well proportioned but relatively
slim body shape for their fashion shows and catwalks. This is viewed in Western society as
ideal (Yu, 2004:33; Zwane & Magagula, 2006). Most apparel industries and apparel
designers use the slim figure described as perfect, for wear-testing sample apparel items
(Brown & Rice, 2001:154; Yu, 2004:33; Loker et al., 2005). The heavier or the plus-figures
are left out without representation (Glock & Kunz, 1995:166; Bougourd, 2007:108). It may be
argued that the criteria used for selecting the ideal figure by the industry are unknown and
biased. It should be noted that live models are trained professionals whose bodies, in most
cases, have been moulded, groomed and guided by accepted concepts of ideal beauty –
characteristics which most consumers lack, but crave to possess. This implies that the fit of
the apparel available in the marketplace are only suitable for the fit model and not for the
entire target market. Salusso-Deonier (1989) states that accuracy, and consequently quality,
of apparel can only be attained through dress forms, fit models and sizing systems that
represent the target population’s sizes and body shapes.

59
In contrast to the Western viewpoint, the ideal body shape in Africa (black race) varies with
different cultures. Roach & Eicher (1973:101-102) describes the Ghanaian female ideal body
shape as consisting of egg-shaped ovals right from the head through to the legs. The head-
top to the chin forms an egg shape, while the neck consists of wrinkles. The torso must also
contain two oval shapes above and below the waist. The thighs to the knees form another
oval, while the knees to the ankle form another. A figure with a prominent hipline, narrow
waistline with medium breasts (pear shape) is considered beautiful and desirable in Kenya,
as expressed in most love songs. However, due to culture transfers, online
marketing/website cat walks, movie stars and imports of different styles and designs to the
country, mostly through second-hand apparel (Mason, 1998:100; McCormick et al., 2001 &
2002), the Western slim hourglass ideal figure is becoming part of what the acceptable body
shape should look like. This is even further enhanced by sporting, the wellness and fitness
industry in which most working-class women participate (Rudd & Lennon, 2000). Most
women, on realising that certain styles are not available in their sizes, tend to indulge in
dieting and weight loss activities in the hope of attaining their perceived ideal body (LaBat &
DeLong, 1990:43). Not all the women in weight loss exercises attain the ideal bodies they
crave. DeLong (1987:38, 42) states that body shape is determined by the body framework,
and not by exercises or dieting. The apparel industry must therefore produce apparel items
that have a better fit for all kinds of body shapes and sizes within their target market.
The ideal body shape is a base from which most apparel patterns and ready-made apparel
are designed (Bougourd in Ashdown, 2007:108). This ensures that ready-made apparel
items fit only body shapes and sizes that are similar to those of the ideal figure. However,
because there are many body shapes whose proportions and dimensions deviate from those
of the ideal, ready-made apparel will not fit many bodies as properly as the ideal body shape
(Schofield & LaBat, 2005b). With the lack of classified body shapes in Kenya, it is impractical
to discuss the ideal body shape. However, since most sizing systems used in developing
countries are adaptations of the Western systems (Zwane & Magagula, 2006), it is also
possible that the ready-made apparel items are designed on the basis of the Western ideal
body shape’s characteristics.
According to Bougourd (2007:131-132), a fashion model form is built according to the style
dimensions that women should possess, rather than to their true dimensions and shapes. In
most cases, the dimensions used are based on fit models that possess rare body
proportions. Using these dress forms therefore cannot produce better-fitting apparel to a
population of varied body shapes. The lack of classified body shapes in Kenya’s apparel
industry could be viewed as a factor affecting the production of well-fitted apparel (Mason,
1998; McCormick et al., 2002). Apparel samples produced need to be tested, not only on

60
dress forms made from a current, accurate and representative sizing system, but also on live
fit models whose dimensions and body proportions represent the range of sizes and
proportions of the population (market). This would guarantee that the fit is correct on both
stationary and moving body shapes before mass production and dispatch of the apparel
items. The use of inadequate and outdated equipment/machinery in Kenya is still a major
challenge to the apparel industry (Sasia, 1991; Mason, 1998; McCormick et al., 2002).
3.2.2 Established body types in some selected countries
Body shapes differ from one country to the next and even from region to region within
countries (Winks 1997; Shin & Istook, 2007). Differences in body shape arise from variation
in body type, proportions, posture and body size (Fiore & Kimle, 1997:331; Bourgourd,
2007:120). To facilitate an in-depth understanding of the characteristics of established body
types, an ideal body shape becomes a basis from which to address the other shapes. The
symmetrical deviations from those of the ideal body shape, which occur identically on both
sides of the body, are noticeable from the front or back and side views of the body. Examples
include broad or narrow shoulders, broad or narrow upper back, small or wide waist, large or
small hips, full or small bust, high hips or low hips, large or flat buttocks and protruding or flat
abdomen (Rasband & Liechty, 2006:29-30). Finding that symmetrical and uniform deviations
occur repeatedly on different body shapes, facilitates the development of preliminary
subgroups/patterns of weight distribution (categories) referred to as body shape, which are
useful in the construction of well-fitting apparel (design guidelines), as well as in the selection
of appropriate and suitable sizes and styles by informed consumers.
Rudd and Lennon (1994:163) refer to body shape as the size, shape or weight distribution of
the various body parts. A well-proportioned body has a “pleasing” relationship between its
various parts as well as in the entire body conformation (Armstrong 1995:33; Yu, 2004:33).
However, few individuals have perfect body proportions in terms of the Western ideal body
shape. A person’s body size and shape could be proportional, if the individual parts were
balanced with the application of elements and principles of apparel design (Zangrillo, 1990:5;
Rasband, 1994:12). The emphasis in categorising/classifying body shape is to produce
apparel items that can alter the perceived proportions of the body, and to provide a sense of
aesthetic appeal as well as satisfaction to the individuals who do not necessarily fit the
cultural ideals of size, weight and shape (Fiore & Kimle, 1997:331). The success of ready-to-
wear apparel depends on an accurate estimate of the distribution of body shapes and sizes
within the target population (Ashdown, 1998). Body classification based on a target market
ensures that consumers within that market would be able to purchase apparel with a better fit
(Chun-Yoon & Jasper, 1993; Loker et al., 2005). Most developed countries have classified

61
women’s shapes to ease the apparel selection crisis experienced within retail environments
and to provide better-fitting apparel. Unfortunately, developing countries such as Kenya have
no classification of body shapes. It is assumed that the apparel designs in Kenya are based
on Western established body shapes, and hence all the fit problems with the ready-made
apparel available.
3.2.2.1 Classification of body types in the United States of America
In the USA, for example, apparel is made for various body types. The following examples
have been compiled from: Readers’ Digest (1988:46-47), Winks (1991:63), Glock and Kunz
(1995:108), Burns and Bryant (1997:110), Kaiser and Garner (2006:304-307).
Women’s sizes: These are made for the adult shape of average to above-average height
(5’5” – five foot five inches – to above 5’6”), with fuller and more mature in girth and weight
distribution than the misses’ category. Women’s sizes are denoted with size codes such as
14W (W = Women) as the beginning size up to 24W or above, depending on
retailers’/manufacturers’ target market.
Women’s petites: This category is designed to reflect a shorter figure of larger girth, with a
fuller torso, shorter sleeves and larger waist in proportion to the bust than in the women’s
category. They are denoted with size codes such as 14WP up to 20WP or more, as the
starting and end sizes for this category. They are also denoted with size codes such as 38 up
to size 50 or above, depending on the target consumers.
Misses: This category is made for the mature youthful figure of average build. Size codes
such as 2 are used as a starting size, while size 20 is used as the last size code in this
category and only even numbers are used.
Misses-petites: This category is made for the mature youthful figure of average build, but of
shorter height under 5’4”. Size codes such as 2P (P = Petites) to 20P are used to reflect
dimensions similar to those of the misses, except that they are shorter, which is denoted by
the letter P.
Juniors: This category is made for women with average height of about 5’6”. This type of
figure has a shorter torso and less mature development than the misses’ categories. It is
usually labelled with odd-numbered size codes starting from size 3 or 5 up to 17. The
numbering of the sizes varies from one manufacturer/retailer to another, depending on the
target market.
62
Half- sizes: These are made for the full-bodied shape of shorter height (less than 5’4”) but
with a larger waist and shorter back-waist length than for the misses’ sizes.
3.2.2.2 Classification of body types in the United Kingdom In England, the apparel council measured 4,349 women between the ages of 18 and 70. The
council defined three body shapes by height and bust development. Short: Body shape with
height less than 155cm, Average: Body shape with a height of between 155 cm and 162.5
cm, and Tall: Body shape with a height of 165 cm and over.
The bust types were divided into six categories, namely (Kemsley, 1957:14):
Extra large bust: Body shape with bust measuring 4” more than the hips
Large bust: Body shape with bust measuring 2” more than the hips
Full bust: Body shape with bust measuring the same as the hips
Medium bust: Body shape with bust measuring 2” less than hips
Small bust: Body shape with bust measuring 4” less than hips
Very small bust: Body shape with bust measuring 6” less than hips
3.2.2.3 Classification of body types in the Republic of Germany
Germany conducted surveys in 1983 and 1994 respectively. Body size tables for women’s
outerwear provided nine body size groups in three (3) height groups and narrow (slim),
normal, and heavy/strong (broad) hips for each of the height groups (160, 168 and 176 cm).
The values of the primary control dimension, bust girth, were set down using “standard”
preferred numbers with fixed inter-size intervals, and the hip values were obtained
incrementally reducing drop values (Winks, 1991:51; DOB-Verband, 1994:6-7).
Sheldon (1940) in Salusso-Deonier et al. (1991) is accredited with originating somatotyping.
Somatotyping is defined as a system of classifying human physical types and body shapes
by their natural, genetically predetermined body build, appearance and temperament.
Sheldon and colleagues classified over 10,000 nude male students into 76 commonly
occurring body types. However, Salusso-Deonier (1989) argue that most studies have
focused only on the stereotypical versions of the three body types characterised by extreme
development of either long, slender bones (commonly known as ectomorphs), muscle/bone
bulk (commonly known as mesomorphs), or fat accumulation (usually referred to as
endomorphs).
Although the established body shapes from the selected countries do not exhaustively

63
describe the various characteristics of the body that are critical to the fit of ready-made
apparel, they do provide some guidelines that are useful for designing and distributing
apparel to the marketplace. If informative size labels were presented in a country with
established body shapes, the informed consumers (in size and fit issues) would be able to
select appropriate apparel items that are suitable for their body shapes as well as their sizes.
Kenya lacks representative size tables as well as classified body shapes to guarantee the
production and distribution of appropriate apparel styles. Body shapes classifications based
on a target market, ensure that consumers within that market would purchase apparel with a
better fit (Chun-Yoon & Jasper, 1993; Loker et al., 2005).
3.2.3 Commonly used established body types
It has been observed that there are more than five typical patterns of weight distributions.
However, presented in Figures 3.3, 3.7, 3.12, 3.14 and 3.16 are the five prevalent
categorised body shapes common within the regular-sized and the plus-sized body shapes.
The descriptions provided are based on different authors’ views as well as the researcher’s
observations of photographs taken in the field, particularly on the characteristics of profile
views. They have been summarised and were compiled from: Harper and Lewis (1983:29,
31); Salusso-Deonier (1989:373); Zangrillo (1990); Rasband (1994:12-13); Armstrong
(1995:33); Spillane (1995:33); Fiore and Kimle (1997); Kuma (1999:65-68); Connell et al.
(2003); Simmons, Istook and Devarajan (2004a); Devarajan and Istook (2004), Rasband and
Liechty (2006:23-29); Zwane and Magagula (2006); Connell et al. (2006) and the
researcher’s observations in the field.
3.2.3.1 Triangle body shape
FIGURE 3.3: TRIANGLE BODY SHAPE
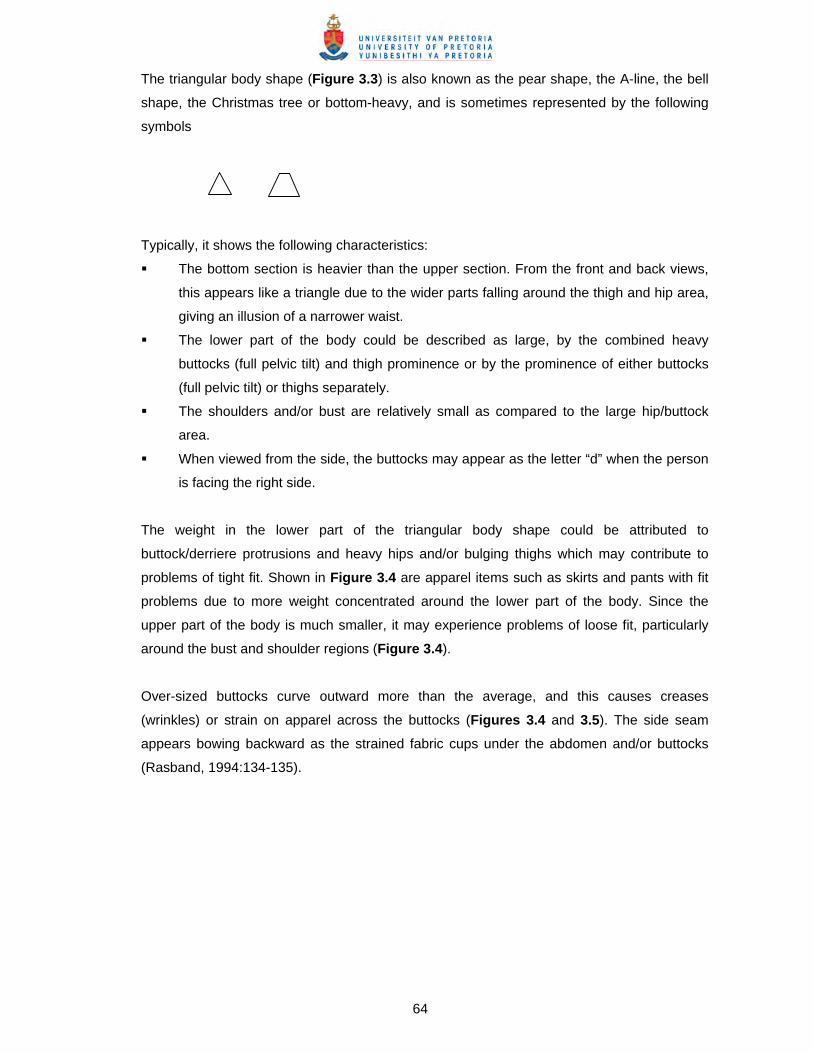
64
The triangular body shape (Figure 3.3) is also known as the pear shape, the A-line, the bell
shape, the Christmas tree or bottom-heavy, and is sometimes represented by the following
symbols
Typically, it shows the following characteristics:
The bottom section is heavier than the upper section. From the front and back views,
this appears like a triangle due to the wider parts falling around the thigh and hip area,
giving an illusion of a narrower waist.
The lower part of the body could be described as large, by the combined heavy
buttocks (full pelvic tilt) and thigh prominence or by the prominence of either buttocks
(full pelvic tilt) or thighs separately.
The shoulders and/or bust are relatively small as compared to the large hip/buttock
area.
When viewed from the side, the buttocks may appear as the letter “d” when the person
is facing the right side.
The weight in the lower part of the triangular body shape could be attributed to
buttock/derriere protrusions and heavy hips and/or bulging thighs which may contribute to
problems of tight fit. Shown in Figure 3.4 are apparel items such as skirts and pants with fit
problems due to more weight concentrated around the lower part of the body. Since the
upper part of the body is much smaller, it may experience problems of loose fit, particularly
around the bust and shoulder regions (Figure 3.4).
Over-sized buttocks curve outward more than the average, and this causes creases
(wrinkles) or strain on apparel across the buttocks (Figures 3.4 and 3.5). The side seam
appears bowing backward as the strained fabric cups under the abdomen and/or buttocks
(Rasband, 1994:134-135).

65
FIGURE 3.4: STRAINED FABRIC CUPS ABOVE BROADEST BUTTOCK REGION (Sources: Rasband, 1994:134; Rasband & Liechty, 2006:324)
Heavy/bulging thighs may be positioned and/or shaped differently, thus affecting the fit of the
apparel, either vertically or horizontally. They affect the way that pants and skirts fit. If thighs
are fuller or heavier than for the average body shape, pants or skirts with a close fit are likely to form wrinkles at the affected region (Figure 3.5).
Heavy thighs Heavy thighs Broadest part of the hip is
situated high Broadest part of the
hip/buttock is situated low
FIGURE 3.5: WRINKLES AROUND THE FULLEST PART OF THE THIGH/HIP (Sources: Rasband, 1994:130,138; Rasband & Liechty, 2006:324)
The position of the fullest part of the thigh is critical in designing patterns and particularly
when curving skirt or pants patterns around the hip/bulge area. The shaping of fitted
skirts/trousers, will call for more attention to each critical fit point of the hipline and the fullest
part of the hip separately. In cases where the latter has been ignored, the resulting apparel
forms wrinkles around that part, or uncalled-for “pockets” may form above the hipline
(Rasband, 1994:138-140; Rasband & Liechty, 2006:340).
Fit problems may result from the narrow upper part of the body, that is from narrow/small
shoulders and/or bust. The apparel item worn by such a body shape would indicate folds

66
forming on the garment as a result of excess fabric in the area where the body is
narrow/small (Figure 3.6).
FIGURE 3.6: NARROW SHOULDERS AND/ OR BUST
(Source: Rasband, 1994:66, 68)
3.2.3.2 Inverted triangle body shape
The inverted triangular figure (Figure 3.7) is also referred to as the barrel, wedge, V-shape
or top-heavy, and is represented by the following symbol:
Typically, it shows the following characteristics:
Heavy upper torso translating into a short, wide waist and wide-shouldered form, with
relatively narrow hips.
When viewed from the side, the shape may appear as the letter “P” at the bustline if
the width prominence is attributed to the size of the breasts.
Width prominence may be attributed largely to prominence of bust and shoulders
combined or to the prominence of either bust or shoulders separately. In either case,
the width prominence concentrates on the upper part of the body.
It may be assumed that this kind of shape, when viewed from the side, may also bear a
moderate to full pelvic tilt, a characteristic of protruding buttocks – and therefore may appear
like the letter “P” (bust) at the upper part and the letter “d” (buttocks) on the lower part.

67
FIGURE 3.7: INVERTED TRIANGLE BODY SHAPE The weight in the upper part of the inverted triangular body shape could be due to bust
protrusion, broad shoulders and/or shoulder blades region, which may contribute to problems
of tight fit. Shown in Figure 3.9 are apparel items such as blouses and jackets with fit
problems resulting from more weight concentrated on the upper part of the body and
particularly in the bust region. The lower part of the body may experience loose fit problems,
particularly around the hips and thigh regions (Figure 3.11).
A Small bust (almost flat)
B Average bust, with little protrusion
C Full bust, but slightly out of proportion
D Full bust, extremely out of proportion
FIGURE 3.8: BUST CUP (Adapted from: Solinger (1988:77); Spillane (1995:84))
Figure 3.8 shows that busts vary anatomically with respect to the horizontal protrusion which
they are comprised of, and the vertical droop, nipple position and bust shape denoted by AA,
A, B, C, D, DD cup sizes (Solinger, 1988:76; Spillane, 1995:84). Bust cup size is determined
by the difference between over-bust girth (chest girth) and the under-bust girth (Beazley,
1997:282). The under-bust is not necessarily parallel to the horizontal because it depends on
the torso’s back and side curvatures (Solinger, 1988:77; Spillane, 1995:84). The different

68
protrusions/droops (Figure 3.8) can only be noticed in a profile view and could be clarified
with the use of dimensions. The trick lies in the fact that bust dimensions obtained from two
people may be similar, and yet their shapes and proportions may be totally different, resulting
in dissimilar looks in the same apparel item (Schofield & LaBat, 2005a; Schoefield, et al.,
2006).
A person’s back width (over the shoulder blades) and/or under-arm area, for example, could
be broader with small breasts, while another person’s body shape may be characterised by
large breasts and a narrower back width (over the shoulder blades) and/or under-arm area.
In such circumstances, the two people would have the same circumferential dimensions, yet
different shapes. Bust has been identified as the key dimension representing the upper part
of the body; its size and shape plays an important role in determining the correct bra size,
and subsequently, well-fitted apparel without wrinkles (Figure 3.9) or folds resulting from too
large or too small bust size and shape.
FIGURE 3.9: WRINKLES AT BUST REGION DUE TO LARGE BUST (Source: Rasband, 1994:86; Rasband & Liechty, 2006:194)
Shoulders act as the hanger for the apparel, and as a pivot point which facilitates an
aesthetic appearance, as the apparel drapes gracefully on the body. The size of the
shoulders in relation to other parts of the body and how they are shaped will affect the fit of
the apparel. If the size and the shape of the shoulders on apparel items are wrong for the
size of the body’s shoulders, as in the case of barrel- or pear-shaped bodies, then the
apparel item would fold, sag (collapse) or wrinkle as a result of narrow, sloping or squared
and broad shoulders respectively, as shown in Figure 3.10 (Bray, 1978:28-30; Rasband,
1994:68-72).

69
FIGURE 3.10: APPAREL FORMS WRINKLES AT SHOULDER REGION
(Source: Rasband, 1994:66, 68)
Fit problems resulting from the narrow lower part of the inverted triangular body shape may
be due to narrow hips or flat buttock and/or thighs. The apparel item worn by such a body
shape would indicate folds forming on the garment as a result of excess fabric around the
area where the body is narrow (Figure 3.11).
FIGURE 3.11: APPAREL FORMS FOLDS AT HIP/THIGH REGION
(Source: Rasband, 1994:66 & 68)
3.2.3.3 Rectangle body shape
The rectangular shape (Figure 3.12) is sometimes also called the box shape, square,
straight, block, tubular, oblong, angular, figure 11, figure H and figure 1. It is sometimes
represented by the following symbols:

70
Typically, it shows the following characteristics:
Full and firm, evenly packed figure.
Broad all round and straight up and down.
The shoulder-/bust line width equals that of the hips/buttocks, with no visible waistline.
This kind of figure may have a flat bust or buttocks, or a full bust appearing like the letter “P”,
or protruding buttocks and/or abdomen, depending on the pelvic tilt of the individual; this is
only observable through the profile view which might show a shape with the stomach
appearing like the letter “b” or the letter “D” at the front, and the buttocks appearing like the
letter “d” at the lower back.
FIGURE 3.12: RECTANGLE BODY SHAPE
The weight in the upper and lower parts of the rectangular body shape is distributed evenly
without a waist indentation. This could be attributed to a large stomach/waist (Figure 3.13).
Apparel items such as skirts, pants, blouses, jackets and dresses would have a tight fit
around the stomach region.

71
FIGURE 3.13: APPAREL FORMS WRINKLES AT WAIST/MIDRIFF REGION (Source: Rasband, 1994:66, 68)
3.2.3.4 Hourglass body shape
This shape (Figure 3.14) is also called the rectangular “8”, figure X or “curvy” and is
presented by the following symbol:
Typically, this shape shows the following characteristics:
The shoulders and the hips are aligned, with a visibly indented waistline.
Most evenly proportioned within the plus sizes.
Has more weight and flesh covering the bone and hollows than the ideal body shape.
Viewed from the side, this shape may appear with bust prominence like the letter “p” at the
top and large buttocks appearing like the letter “d” at the bottom or just moderate buttocks
but with heavy thighs.

72
FIGURE 3.14: HOURGLASS BODY SHAPE
The weights in the upper and lower parts of the rectangular body shape are distributed
evenly with a noticeable waist indentation. The lower part of the body’s weight could be
attributed to large hips/derriere and/or thighs. Large bust and shoulders could characterise
the upper part of the body’s weight. Fit problems encountered by such a body shape could
be attributed mostly to the narrow waistline. However, the heavy parts on the upper and
lower body sections may also contribute to the tight fit of apparel items around the heavy
parts as already seen in Figures 3.5, 3.9 and 3.10. Apparel items such as skirts, pants,
blouses, jackets and dresses would have a loose fit around the stomach region (Figure 3.15).
FIGURE 3.15: APPAREL FORMS FOLDS AT WAIST/MIDRIFF REGION
(Source: Rasband, 1994:66, 68)
3.2.3.5 Apple body shape
This figure (Figure 3.16) is sometimes referred to as circular, oval, egg, ball or round, and is
represented by the following symbols:

73
Typically, this shape shows the following characteristics:
Has curves, and carries weight from shoulders to hips.
The front, back and side views of this type of figure present a rounded torso with round
shoulders, waistline, bust and buttocks.
No waist indentation as the upper torso connects to the lower torso with an almost
continuous same circumference.
The waist may be bigger than the bust and the hips. When this is the case, this sort of
shape is referred to as a diamond shape because of the bulging waistline.
FIGURE 3.16: APPLE BODY SHAPE
The weights on the upper and lower parts of the rectangular body shape are distributed
evenly, with large stomach protrusion. The whole framework of the body is filled up with
muscle and fat and thus may cause problems of tight fit throughout the body. However, most
weight concentration is usually around the stomach region, causing the fit problem (Figure 3.17). This kind of body shape may also experience tight fit problems throughout the entire
body due to roundness of the entire body shape. The size of the body could be more critical
for this body shape than its contours.

74
FIGURE 3.17: WRINKLES AT WAIST/MIDRIFF REGION DUE TO FULL STOMACH (Source: Rasband, 1994:66, 68)
3.2.4 General factors critical to apparel’s fit (applicable to all body shapes) 3.2.4.1 Posture
Although fit implications of each body shape have been discussed under each body shape,
there are some fit problems caused by the body’s posture in general and by the upper arm of
the body, which cannot be confined to any specific body shape. Posture refers to the
alignment of body parts and the manner in which the frame is carried (Liechty et al.,
1992:37). A correct posture assumes a balanced alignment of all the body parts over each
other and could influence the physical attractiveness of apparel items (Rasband, 1994:13).
Rasband and Liechty (2006:29) state that excessively incorrect posture could be termed as a
figure variation as it would cause fit problems with any apparel (Figure 3.18). It has also
been reported that posture has a direct bearing on physical health and on how one visualises
oneself. An overly erect posture, for example, may indirectly feel over-confident and
arrogant, while a slumped posture tends to express fatigue and unpleasantness (Rasband,
1994:13; Rasband & Liechty, 2006:29).

75
Correct posture, with balanced
pelvis
Overly erect back, with balanced
pelvis
Rounded upper back and shoulders with a forward head
and a balanced pelvis
Swayed back with forward pelvic tilt
Slumped posture, with forward pelvic
tilt and a pronounced
stomach
Rounded shoulders, forward head and backward
pelvic tilt
FIGURE 3.18: POSTURES
(Sources: Reader’s Digest, 1988:82-83; Liechty, Pottberg & Rasband,
1992:37-38; Rasband, 1994:78, 79, 122, 124, 134)
Stretched/wrinkled apparel as a result
of rounded upper back Folds/excess fabric on the apparel
as a result of erect upper posture/shallow back
Folds/excess fabric around the derriere as a result of a swayed front and a
backward pelvic tilt FIGURE 3.19: FIT PROBLEMS RELATED TO POSTURE
(Source: Rasband, 1994:78-79)
3.2.4.2 Upper arm
Arm contours or the upper arm shape is important to all the apparel items with sleeves. The
size of the arms (Figure 3.20) varies from thin (bony with little flesh), average (softly curved
without excess flesh or muscle development), to full (heavy/fatty or masculine curves). An
apparel item showing wrinkles or folds around the upper arm region is an indication that the
contours of the wearer are either full/fatty/heavy masculine, or excessively thin (Rasband,
1994:106-108).

76
Slender biceps Medium biceps Large biceps Wrinkles forming on the
sleeve around the top arm as a result of large biceps
FIGURE 3.20: UPPER ARM SIZES AND FIT PROBLEMS
In Kenya, no research is available on body shapes. According to the KEBS (2001), the size
tables meant for female apparel are presented with size codes and accompanying
dimensions, but without any indication of body shapes. Since body shape acts as a design
guideline for apparel manufacture, established body shapes would therefore facilitate ease of
manufacturing as well as distributing suitable styles to a marketplace from which the body
shape categories were developed.
It may also be argued that the lack of classified body shapes in Kenya is an indication of
consumers’ ignorance on size and fit issues with apparel, such as important parts of the body
that are critical to the fit of the apparel. Since a classified body shape structure is the
foundation from which fit-related problems are addressed, the lack of classified body shapes
would therefore contribute to fit problems with apparel. Low-level skilled labour together with
obsolete and inaccurate sizing systems (particularly on body shapes) – or a complete lack
thereof – in Kenya, would be viewed as major contributing factors to the fit problems with
apparel in Kenya.
3.3 TECHNIQUES USED FOR THE CLASSIFICATION OF BODY SHAPES
It is important for any country and/or apparel industry aspiring to satisfy their consumers with
better-fitting apparel, to consider different techniques of classifying body shapes. Being a
guideline for the designing and production of suitable and well-fitting apparel styles, body
shape identification becomes critical in a country where there is such a lack of classified
body shapes as in Kenya. Examining different techniques used for the development of
classified body shapes could facilitate a deeper knowledge of the critical issues required to
identify and isolate only the significant body characteristics that are critical to the fit of
apparel.

77
3.3.1 Key dimensions necessary for the development of body shape
Body measuring techniques have been in use for many studies and have proved to produce
reliable results when the recommended instruments and standards are applied. Different
body measurements techniques were described in Chapter 2 (paragraph 2.3). Successful
body shape classification depends on the correct selection of the key dimensions (Chun-
Yoon & Jasper, 1996). Key dimensions, also referred to as control dimensions, are the
combination of those dimensions most closely related to other body dimensions (DOB,
1994:6; Robinette, 1986:573; Winks, 1997:24). O’Brien and Shelton (in Winks, 1997:14)
stated that the success of body shape classification relies on special selection of the key
body dimensions. In classifying variations in body builds, O’Brien and Shelton selected a pair
of key dimensions, which they found to have low correlation between vertical and horizontal
body dimensions. Stature was selected as the index of vertical dimensions because it was
closely related to most vertical dimensions measured. Weight was selected as the index for
horizontal, because it was highly correlated with most trunk circumference dimensions
(O’Brien & Shelton, 1941 in Salusso-Deonier et al., 1985).
Kemsley (1957:56) also stated that a key dimension must be a good predictor of other
related body dimensions, which are a collection of all the dimensions of all the body units
covered by an apparel item. Kemsley (1957:70) selected the key dimensions by a correlation
analysis within an anthropometric data set. He discovered that height and weight had the
highest multiple correlation coefficients. However, bust and hip were selected because these
two dimensions offered flexibility for varying relationships between upper and lower parts of
the body. Key dimensions must be convenient to measure, must have a high degree of
correlation with other dimensions important in design and sizing, but they should not be
highly correlated with each other, and they should form an integral part of the apparel
(McConville, Tebbetts & Churchill, 1979 cited by Chun-Yoon & Jasper, 1996:90).
Ashdown (1998) developed an optimised sizing system, which uses as many body
dimensions as needed to account for the variability in the population. These sizing systems,
according to Ashdown (1998:324), would potentially fit the population better than sizing
systems that are currently based on one or two dimensions only. However, this complex
method is not possible in countries without advanced technologies to facilitate easy grading.
Ashdown (1998:336) confirmed this by saying, “If it were still the case that most grading was
done by hand, this complexity of grading would be extremely labour intensive and therefore
not worth any gains in the fit of sizes generated.”
Devarajan and Istook (2004:7) in their study, selected bust, waist, hips, high hip, abdomen

78
and stomach based on the literature review and their professional expertise of more than
thirty years in the field of apparel. This was used for the purposes of developing the software
Female Identification Technique (FFIT©) for classifications of body shapes from body
scanned and body dimensions data.
Most sizing systems developed in most countries vary in the body dimensions chosen to
divide the population, but the basic structure of most sizing systems remains the same. Most
have classified body shapes by height and drop value (the difference between the hip
circumference and the bust circumference), so as to ease the problem of fit (Chun-Yoon &
Jasper, 1993; Winks, 1997; Yu, 2004:185; Petrova, 2007:64).
Describing body shape with the use of body dimensions alone, cannot give a true
representation of the proportions of the body. Body characteristics such as buttock
prominence and breast protrusion cannot be exhaustively explained in terms of the
dimensions taken around the most prominent protrusion of the breast or around the fullest
part of the hip (McConville et al. in Simmons & Istook, 2003:309). The circumference
dimensions obtained are one-dimensional and do not isolate contours and protrusions along
the circumferential measurement. The depth/size of the protruding body characteristics such
as the buttocks, the breasts and stomach, can only be understood through visual analysis of
silhouette and profile images/photographs. Thus the body dimensions necessary for the
development of body shape could be enhanced by critically evaluating body shape images.
3.3.2 Key physical characteristics of the body necessary for the development of body shape
Although body scan technology has demonstrated a high reliability in capturing three-
dimensional body shape, its use in developing countries, as mentioned earlier, may not be
practical in terms of the cost and technical skills involved. Detailed information on body
scanning has been given in Chapter 2 (paragraph 2.3.3). Salusso-Deonier (1989:373)
stresses the importance of different body shape views from all angles as opposed to the
usual front-view line drawings. She noted that this format precludes viewing the three-
dimensional form, which allows artistic interpretation of variation in real humans’ body
shapes. For the purposes of this study, this demanded that images of female shapes be
captured using the recommended techniques and modern technology. Since body scanning
is impossible in a developing country such as Kenya, photography would be an alternative
method as suggested by Ashdown and Dunne (2006). Though photography has been
scantily used for the purpose of classifying body types, it has however produced reliable
results (Douty, 1968 in Simmons, Istook & Devarajan, 2004a; Salusso-Deonier, Markee &

79
Pedersen, 1991; Kuma, 1999:39; Anderson et al., 2001:7).
Photography is the art of capturing images using either an ordinary camera filled with a film,
or a digital camera. Other than describing body shape with the use of dimensions alone, in-
depth descriptions can be enriched by the use of visual sensory evaluation of stimulus
materials. This implies that human figures are photographed (stimulus material) for this
purpose. Sensory evaluation as a method allows for the systematic, subjective evaluation of
a product. It uses perception psychology to measure, understand and define the visual
relationships of varied human body shape characteristics/variables that impact on a person’s
shape, such as the body’s size, contours and proportions (Gazzuolo, DeLong, Lohr, LaBat &
Bye, 1992; Bye & DeLong, 1994:1-3; DeLong, 1998:26-27; Istook et al., 2003). This calls for
consistency and reliability when photographing. An explanation of measures that were taken
to ensure reliability and validity of photography are explained in Chapter 4 (paragraph 4.6.1.1).
Although the body shapes already discussed in paragraph 3.2.3 above are prevalent, it may
be argued that the African female’s body shape may differ from those already mentioned
above, due to differences/changes in nutrition, lifestyle, ethnicity, age, grooming and
concepts of ideal beauty within different cultural contexts. Most of the established figures
appear to have been classified on the basis of front/back silhouette characteristics only,
omitting the profile characteristics, which are critically essential to the fit of apparel. From the
descriptions given under each shape, it appears that judgements have been based on
dimensions and/or two-dimensional points of view, which are also clearly demonstrated by
the two-dimensional symbols attached to each body shape. Another example is the
assumption of evenly distributed weight on the back and front parts of the body, derived from
circumferential dimensions rather than the visual, physical configurations of the various body
components as they appear. However, it may be reasoned that the weight/size distribution of
body components are not balanced or standardised, even amongst shapes of women
assumed or thought to fall within the same category (Kwong, 2004; Zwane & Magagula,
2006). Most established body shape classifications have not incorporated striking side view
characteristics (Figures 3.21 and 3.22).

80
Proportional Full large
buttocks “d” Protruding
stomach “b” below waistline
Full bust “P” All rounded “0” Full bust extending to full
stomach “D” and protruding buttocks “d”
Full buttocks
“d” with heavy thighs
Full bust “P” with full
buttocks “d” and heavy
thighs
Full buttocks “d” with
protruding stomach below
waist “b”
Full bust “P”, protruding
stomach below waist “b” and
full buttocks “d”
Full bust “P”, full stomach above and
below waist “B”
Full stomach above and
below waist “B” and flat buttocks
FIGURE 3.21: SIDE VIEW BODY SHAPE’S STRIKING CHARACTERISTICS
Salusso-Deonier (1989) is of the opinion that it is important to view the body from all angles
as opposed to the usual front-view line drawings. She noted that this format precludes
viewing the three-dimensional form, which allows artistic interpretation of real human
variations. She identified a key component of posture as pelvic tilt, which is only observable
through profile analysis. The pelvis serves as a balancing point for posture and it results from
the angle of the juncture between the spine and the pelvis. It is both inherited and influenced
by posture and muscle development. Figure 3.22 presents three different pelvic tilts
identified and analysed by Salusso-Deonier (1989). However, the direction of the pelvis was
not indicated, whether forward or backward; this could have facilitated a deeper
understanding of the relationship between the pelvic position, the buttocks size/prominence,
the back curvature and the posture generally (Figure 3.18). Backward pelvis is likely to result
in a forward-headed body shape and flat buttocks, while a forward pelvic tilt results in a
slumped posture, large buttocks and hollow back (Rasband, 1994:78-79).

81
1. Slight pelvic tilt
Yields little curvature in lower back as well as flat buttocks
2. Moderate pelvic tilt
Yields medium lower back curvature and slightly rounded
buttocks
3. Full pelvic tilt
Yields deep curvature and very rounded buttocks
FIGURE 3.22: DEGREE OF PELVIC TILT
(Source: Salusso-Deonier, 1989:373)
From the discussions of the different body shapes, it is clear that a critical evaluation of the
body’s characteristics that influence the fit of apparel items should be understood and
categorised from all the views so as to facilitate the production of well-fitting or better-fitting
apparel. However, consumers’ ignorance about issues that relate to the fit of ready-made
apparel items could also lead to inappropriate selection of ready-made apparel, even if the
available merchandise were well made for different body shapes in a market. Consumers
need to know their own body shapes as well as their key dimensions to be able to identify
well-fitting or better-fitting apparel. They need to understand how their body shapes deviate
from those of the ideal, so that they may appreciate their own body shapes and dress
appropriately. As discussed in Chapter 2, Ashdown (2000) has given a breakdown of all the
possible factors that may contribute to the fit of ready-made apparel. All these factors are
related to the manufacture of the apparel and they happen throughout the production
processes, from the design stage through to dispatch (Hudson, 1980; Salusso-Deonier,
1989).
3.4 FACTORS EXTERNAL TO APPAREL MANUFACTURE THAT MAY CONTRIBUTE TO POOR FIT OF READY-MADE APPAREL (FIGURE 3.23)
The magnitude of the problem of consumers’ dissatisfaction with fit is an extreme challenge
to both the retailers and the manufacturers of women’s ready-made apparel. From the
consumer's point of view, finding an apparel item that fits correctly can be time consuming
and frustrating (Chun-Yoon & Jasper, 1996; Ashdown, 1998). Factors that are not linked to
apparel production processes, but may contribute directly or indirectly to the fit of ready-

82
made apparel, are treated as factors external to apparel manufacture. They are the
consumers’ behaviours as they interact with the apparel in and outside a retail environment.
Consumers’ perceived satisfaction with the fit of a garment depends on physical comfort,
psychological comfort as well as appearance (aesthetics).
FIGURE 3.23: APPAREL MANUFACTURE’S INTERNAL AND EXTERNAL FACTORS
THAT MAY CONTRIBUTE TO FIT PROBLEMS WITH APPAREL (Based on: Hudson, 1980: 111-114; Solinger, 1988:37, 66, Salusso-Deonier,
1989; Glock & Kunz, 1995:98-111; Chun-Yoon & Jasper, 1996; Winks, 1997;
Ashdown, 2000; Anderson et al., 2001; Brown & Rice, 2001:154-156;
Alexander, 2005a).
In a country such as Kenya, where little is known concerning apparel sizing and fit, the
ignorance of both retailers and consumers about sizing and fit issues may also be a major
POOR FIT OF READY-MADE APPAREL
FACTORS INTERNAL TO APPAREL MANUFACTURE (Ashdown (2000)
model, covered in Chapter 2))
FACTORS EXTERNAL TO APPAREL MANUFACTURE
(Consumers’ interaction behaviors with apparel)
Apparel production (4) 1 Poor pattern design 2 Poor marker making and
fabric spread 3 Wrong pattern (apparel)
cutting 4 Inaccurate apparel
assembling 5 Improper apparel finishing
(Ashdown (2000) model, covered in Chapter 2) Consumers’ fit preferences (6)
1 Expected benefits from the apparel 2 Body cathexis
Fit quality management strategies (3) 1 Non-adherence to product specifications 2 Non-devotion to allowable tolerances 3 Imprecise fit tests measurements Non-conforming fit models (Ideal) and subjective fit judgments Non-conforming dress forms
4 Overlooked wear tests measurements (Ashdown (2000) model, covered in Chapter 2)
Resources (1) 1 Unskilled personnel 2 Inadequate / outdated
equipment 3 Poor raw materials
(Ashdown (2000) model, covered in Chapter 2)
Sizing systems (2) 1 Inaccurate and obsolete body
dimensions 2 Inaccurate and non-
representative classified body shape (varied body shape)
3 Incorrect size labelling (inadequate and non-explanatory information, vanity labels and non-standardized
(Ashdown (2000) model, covered in Chapter 2)
Knowledge of sizing and fit issues (5) 1 Consumer’s lack of knowledge on different
size codes (meaning of different size codes)
2 Consumer’s lack of knowledge on established as well as own body types
3 Retail personnel’s ignorance on sizing and fit issues
4 Inadequate dressing room facilities in retail

83
contributing factor for consumers’ inappropriate selection of apparel items, and hence the fit
problems they experience. Figure 3.23 depicts possible internal and external factors in the
manufacture of apparel that may contribute to fit problems. Since the factors internal to
apparel manufacture were already discussed in Chapter 2, only factors external to apparel
manufacture will be examined.
3.4.1 Consumers’ fit preferences
For the purposes of this study, fit preference will be defined as the consumers’ desired
apparel fit. In a consumer market-driven society, the challenge to the apparel industries is not
about giving consumers extra choices, but rather to contain consumers’ preferences (Chun,
2007:221). Professional women, in particular, expect to get what they want with minimal time
and energy spent on the apparel search (Kaiser & Garner, 2003:28-29). Consumers become
loyal to certain brands and stores that repeatedly deliver satisfactory apparel in terms of size
and style within the fashion trend of the time (Workman, 1991; Glock & Kunz, 1995:135).
Consumers with different orientations have different preferences and needs within a specific
social context. Apparel manufacturers must therefore gather information regarding the fit
preferences of specific groups of people so as to be able to cater for their needs (Ashdown &
Dunne, 2006). There are various reasons for a preference for certain fitted apparel. Closely
fitted or body-hugging apparel may be preferred to emphasise certain body shape
characteristics such as broad hips, large breasts or narrow waistline, while loosely fitted
apparel may be worn to camouflage certain unpleasing body features. There are apparel
benefits that consumers may achieve from differently fitted apparel.
Apparel benefits (expectations), according to Anderson et al. (2001), are the outcomes that a
certain product may provide for the consumers. Differences exist within cultures as well as
between cultures. Socio-cultural differences affecting aesthetic preference include
geographic locations, ethnicity, religion, and sexual orientation (Fiore & Kimle, 1997:86).
These differences often lead to divergence in aesthetic preference and consumer behaviour
(Morris, 1993; Feather et al., 1996; Marshal et al., 2004:94).
Apparel manufacturers should tap into consumers’ thoughts, beliefs and feelings pertaining
to their fit preferences, so as to translate these into preferred apparel, which are also suitable
for the different body shapes available within a market at a particular point in time (Keiser &
Garner, 2003:29; Ashdown & Dunne, 2006; Lewis, 2007:310-311). Fiore and Kimle (1997:80)
state that consumers’ selection of a product strengthens, or gives credibility to, the situation,
as selection shows acceptance or approval of the ideas that must be in harmony with
different body shapes and sizes of the consumers. If consumers’ fit preferences were

84
incorporated into different styles suitable for the established body shapes, there would be
satisfying, better-fitting apparel within the fit preference context. According to Shim and
Bickle (1994), the most common apparel benefits sought by females are said to be the
following:
Self-improvement: Human beings have the desire to beautify their bodies, either by
enhancing existing attractive characteristics or camouflaging unsatisfactory ones.
Beauty enrichment could be attained from make-up and apparel’s qualities of the
structural composition, such as the colour, texture, pattern, fabric and the silhouette
(shape) or style (Spillane, 1995:91; Romano, 2000:11-14, 23-24).
Sex appeal: Physical attractiveness affects a person’s well-being, as people are
judged based on their appearance. Apparel designed to almost expose some sensual
parts of a woman’s body, for example, could be seen as or may be used for sex appeal
(Stone, 1999:51; Romano, 2000:59). In cases where the characteristics of the natural
physical body are not attractive enough, they are transformed to achieve standards of
ideal beauty through the invented grooming techniques such as make-up, fitness and
varied apparel styles, even if they could not meet the standards before.
Social status/prestige: This may be achieved by wearing apparel for self-expression
and to create individual effect. Combining various fashion components, dressing
expensively and/or imitating the famous people in a way, could be seen as prestigious.
Branded apparel may also be seen as a form of status (Stone, 1999:51, 60-61).
However, a consumer whose body shape’s characteristics does not meet those of the
standard ideal body shape, would only attain prestigious status if the apparel styles
selected are suitable and flattering for their kind of body shape (Fiore & Kimle,
1997:331).
Body shape flaw compensation: Consumers with unattractive physical features (body
cathexis), may also have special aesthetic preferences and functional needs for
apparel products. Although the body shape may not be perceived as ideal, consumers
with this kind of body are usually interested in an aesthetic appeal that would
camouflage and enhance their appearance (Zangrillo, 1990:4; Rasband, 1994:12;
Spillane, 1995:22-44; Romano, 2000:24-56).
Fashion leader: This would entail taking the lead in purchasing new fashion on the
market. According to Stone (1999:60), a fashion leader is a person constantly seeking
individuality, an individual constantly daring to be different. Since appearance is
culturally constructed, an individual’s expectations of what is beautiful are most likely to
be influenced by her culture’s ideal figure (Roach & Eicher, 1973:95).
In Kenya, however, there is no available research on consumers’ fit preferences or
expectations. It is assumed that people’s body shape characteristics, culture and the fashion

85
trend are likely to influence the consumers’ fit preferences. Considering that there are no
classified body shapes in Kenya, it may be assumed that consumers’ choices are made on
the basis of the Western ideal body shape characteristics. Although body cathexis is not the
focus of this study, it is imperative to bring forth the underlying factors for a satisfactory
image, which could then be translated into appropriate apparel that can provide all the
benefits expected by the consumers.
3.4.2 Consumers’ preference for an ideal body shape
Consumers may have troublesome physical features, which may affect their aesthetic
preferences and functional needs for apparel products (Schofield et al., 2006). A consumer
whose body shape does not conform to the ideal figure’s size and proportions would choose
apparel close to her size from the available apparel, even if it is not suitable to her body
proportions. Sizing systems used in the apparel industry are based on an ideal body shape,
which ready-made apparel manufacturers usually interpret as the characteristics of that ideal
figure (Morris, Cooper & Cooper, 1989; Salusso-Deonier, 1989; Zwane & Magagula, 2006).
Consumers judge the reinforcement effect of apparel on their own bodies and make
assumptions about the effect, based upon the images in promotional media. When the
apparel does not fit as it did on the model, the consumer may perceive the cause as being
related to her body rather than to the apparel. She forgets that the interaction of the apparel
on her shape differs from that on the model or the ideal figure. All this, results in negative
feelings (body cathexis) towards her own body shape rather than to the apparel (LaBat &
DeLong 1990; Fiore & Kimle, 1997:30; Yu. 2004:33).
Body cathexis is an evaluative dimension of body image. It is defined as positive and/or
negative feelings towards one’s body (LaBat & DeLong, 1990:43). Body image is a mental
perception of one’s body and may influence one’s general desire for apparel and even one’s
self-confidence (Fiore & Kimle, 1997:92). How people experience their bodies affects their
pursuit of beauty and, consequently, their desire for products and services to enhance their
bodies (Domzal & Kerman, 1993). Rudd and Lennon (1994:167) observe that it might be
impossible for many women, particularly those with large bones, to attain the ideal body
shape. In this case, the apparel industry should ensure that apparel is available that is
suitable for these people.
The negative feeling towards the self could be aggravated even further, if each time a
woman goes shopping, she does not get suitable and better-fitting apparel. It becomes worse
if the apparel industry does not respond to her needs, by providing fashionable or attractive
apparel to fit her body. In a study correlating body cathexis and satisfaction with the fit of

86
ready-made apparel, Shim and Kotsiopulos (1990) observed that petite women were less
satisfied with their bodies, and most dissatisfied with the fit of apparel, compared to average-
/medium-sized women. Large-sized women have also been reported to be less satisfied with
the sizing and fit of apparel (Salusso-Deonier et al., 1985). Understanding how cultural
standards impart body image and body esteem would also influence apparel-sizing and fit
decisions for a specific market (Salusso-Deonier, 2005). Research on consumers’
satisfaction with their self-images is not readily available in Kenya. Body cathexis is an
important factor, but it is beyond the scope of this study.
3.4.3 Knowledge about the communication of apparel sizing and fit According to Shani, Sena and Olin (2003), knowledge is viewed as a socially constructed
phenomenon within the context of collective learning cycles in any environment. It may be
seen as the cognitive comprehension capacities of people, the accumulation of facts and the
ability to see functional relationships between them. Knowledge requires assumptions,
interpretations and rules. True knowledge is being able to take the interpreted information
and understand the relationships in a social context (Shani et al., 2003). Since there is no
literature on consumers’ knowledge pertaining to apparel sizing and fit, literature that would
provide supportive theory for this specific topic, would be on consumer socialisation and
product-related consumer socialisation.
Consumer socialisation and product-related consumer socialisation are important for the
professional women consumers to enable them to make informed and responsible
purchasing decisions regarding the selection of well-fitting apparel. Their selections will
depend on their previous experiences with the apparel items, the support they get from the
retail environment, their education level and personal fit preferences and expectations.
These factors will influence the apparel evaluation in terms of size, style, functional,
performance, and care attributes. All these facts are supposed to be communicated
effectively through an apparel label/tag (Mason et al., 2008). It would enhance consumer
satisfaction if they could receive quality products repeatedly that meet their needs (Reid &
Brown, 1996). Consumer socialisation is defined as the process by which people acquire
skills and knowledge relevant to their functioning as consumers in a market place (Hawkins
et al., 2001:212). Consumer socialisation is both directly and indirectly related to
consumption. The first is concerned with the acquisition of skills and knowledge relevant to
budgeting, pricing and brand attitudes. The latter is concerned with underlying motivations
that stimulate an individual to seek further detailed information and to purchase the products,
even though he/she has not been exposed to them before (Sciffman & Kanuk, 2000:346-
351). The latter is significant for this study, because when the consumer encounters

87
physically attractive apparel, purchases could only be made once the apparel’s label/tag has
been consulted, and the apparel item tried on to check the size, style and perhaps fibre
content and care instructions. When the consumers can establish and understand their sizes
and body shapes, their decision-making behaviour will be simplified because they would
already understand how apparel that is labelled in a specific way would fit. A lack of
knowledge will therefore lead to inappropriate apparel selection, and hence fit problems.
Aspects of size presented on a size label are those factors pertaining to the body dimensions
that are necessary for the production of a specific apparel item. Those key dimensions that
are critical to the fit of a specific apparel item, and were used for its construction, should be
presented on a size label/tag. The waistline, the hipline and the length of a skirt, for example,
are the key dimensions required on skirts’ size labels, while the bust measurement is an
important key dimension for an apparel item covering the top part of the body. Critical
aspects of fit are mainly the characteristics of the body, the apparel silhouette and how they
relate to each other harmoniously, resulting in what DeLong (1998:27) refers to as apparel-
body-construct. The styles produced in an apparel industry should be based on the common
body shapes found in a target market. The label/tag attached to an apparel item should
therefore indicate the body shape, which it should fit.
The body as a pre-existing physical structure may be used as a basis for the visual
presentation of apparel. The interrelationship between body and an apparel item creates the
integrated body-apparel silhouette, which either accentuates or de-emphasises
characteristics of the body, as may be desired (Davis, 1980:73; Salusso-Deonier, 1989;
Keiser & Garner, 2003:315). A consumer who is well informed on issues pertaining to the
apparel’s sizing and fit and the body shape’s characteristics would be able to successfully
select a pleasing apparel item. Retailers who are devoted to satisfying their consumers
should provide information on how each size is classified (in other words, the key
dimensions). They should also provide instructions on how to take specific body dimensions
for specific apparel items, and how to evaluate and identify different body shapes. Ashdown
and Dunne (2006) observed that consumers’ self-dimensions were more accurate when
instructions and illustrations showing how to take those dimensions, were given.
Literature on size and fit issues tailored specifically for the consumers’ use, are available in
the form of textbooks, magazines, brochures and as electronic versions online. Most of these
books and magazines have been written in the developed countries and are tailored for the
Western body shapes and sizes as well as for a light skin. The consumers in the developing
countries could hardly access them. It may be argued that even if those books were available
in the marketplaces of developing nations, the principles laid down would not be fully

88
applicable for dark-skinned persons who have very different body shapes, sizes and builds.
In such cases, therefore, the retailers and perhaps the researchers/scientists are responsible
for the lack of the necessary information reaching to the consumers. On the basis of the
United Nations’ consumer rights (1985), consumer education is valued worldwide, and not
confined to developed nations only. The discipline of consumer science actually concerns
itself with responsible, informed consumer decision-making; thus professionals in the field of
apparel and textiles attempt to educate consumers and assist them with relevant product
information to enable them to make appropriate purchasing decisions. Consumer education
on size and fit issues in Kenya is not happening.
Consumers’ ignorance about the communication of sizing and fit, and the terms used on size
labels, means that some education in this regard is necessary. Consumers’ knowledge on
how to link size label information to their own shapes and dimensions could be regarded as a
matter of concern. It would be pointless to sell apparel that the consumers cannot relate to
their own body dimensions and proportions. Women’s apparel lacks the kind of correlation
that men’s sizes have; most women sizes are not expressed as body dimensions, but rather
as arbitrarily chosen numbers or letters that correlate with sets of unrevealed body
dimensions (Holzman, 1996; Workman & Lentz, 2000; Brown & Rice, 2001:147-148; Faust et
al., 2006). There is flawed communication amongst the stakeholders, on problems related to
the communication of size and fit of apparel, right from the dressing rooms of the retail
environment through to the manufacturers (Ashdown, 2000). Although size labels are not
obligatory (Keiser, 2003:336; Faust et al., 2006), the way they are presented to the
consumers plays a major role in the apparel selection exercise. As mentioned earlier,
informative (self-descriptive) size labelling that relates directly to body dimensions would
contribute to consumer satisfaction (Chun-Yoon & Jasper, 1995; Holzman, 1996).
Professional women in particular expect to get what they want with minimal time and energy
spent in the apparel search (Kaiser & Garner, 2003:28-29). Uninformative labels would make
their frustration and humiliating experience during apparel selection worse. On the other
hand, presenting informative size labels to the informed consumers would make their apparel
search easier and provide satisfactory, better-fitting apparel. According to KEBS (2001:7-9),
the size designation of each apparel item should be indicated clearly, in plain and legible
form on a label or a swing ticket. In contrast to this, the sizes presented on the ready-made
apparel in Kenya are uninformative. It seems that retailers/manufacturers generally do not
disseminate the correct information pertaining to body shapes and/or sizes to their clients
(Faust et al., 2006). An improved understanding of the consumer's knowledge/ignorance on
the communication of sizing and fit would be valuable in terms of consumer education and
facilitation, and will enlighten the apparel industries to supply satisfactory apparel items

89
affixed with durable, legible and informative size labels/tags. Size communication systems
have been discussed in detail in Chapter 2 (paragraph 2.6). Any sales transaction is a dyadic interaction between a consumer and a salesperson and is
an important determinant of the consumer’s overall satisfaction with a service (Solomon,
Surprenant, Czepiel & Gutman, 1985). Sales people in a retail store often influence sales
(Reynolds & Arnolds, 2000; Regan & Llamas, 2002). Knowledge has been cited as one of
the key dimensions of service quality (Kim & Lennon, 2005). It is assumed that the retail
personnel, particularly in developing countries, lack knowledge on sizing and fit issues. They
might not know the correct key body dimensions necessary for specific apparel items, nor the
varied body shapes available in the market. Unskilled personnel would not sufficiently guide
the consumers to search for better-fitting and more flattering apparel items. In actual sense,
sales persons should have knowledge on which styles, and from which company, an apparel
item would accommodate variations in size and shape.
Consumers’ satisfaction with apparel depends on its aesthetic appeal, which is attributed to
the interaction between the body and the apparel. Consumers judge the apparel’s appeal, as
it interacts with their bodies. It is therefore important to have fitting room facilities that are well
equipped with full-length mirrors, adequate ventilation and lighting, to facilitate a thorough
evaluation of the apparel before the consumers make a purchase. A lack of fitting room
facilities in a retail store could also be viewed as a contributing factor to problems with
apparel fit. A customer who does not properly evaluate an apparel item before purchasing it,
could discover fit problems later at home. The solution to this problem could be to educate
the consumers and the retail personnel on sizing and fit issues, thus enabling them to
recognise varied shapes and to identify the key dimensions necessary for every apparel item
and size. They should also be able to practically and accurately take those key body
measurements for different apparel items, and be competent in the use of the principles and
elements of design, so as to guide consumers while selecting styles and sizes for the varied
body shapes. The importance of fitting room facilities and after-sales service could also be
emphasised, along with accurate sizing systems (Zangrillo, 1990:21; Rasband, 1994:58).
In Kenya, one can assume that most consumers and apparel sales assistants are
uninformed on apparel sizing issues, particularly on the key dimensions necessary for
identifying a size, taking body measurements and correlating them to the sizes of apparel.
One may also assume that they are uninformed about the various body shapes, principles
and elements of design that are used to flatter the different body shapes. Most retailers have
very small and congested dressing rooms, not conducive for trying on and evaluating an
apparel item’s fit before making any purchasing decisions. It is important that consumers’

90
knowledge about sizing and fit issues should be addressed alongside body shapes
classification to facilitate a base from where to address the fit problems.
Size chart (measurement table) can only be effective if it is applicable to the people for whom
it is designed (Winks, 1991; Shin & Istook, 2007). Fitted apparel, irrespective of fabric and
style, usually ends up in the closet unworn, being altered or even given away. This causes
loss and disappointment to the consumers. The success of well-made apparel could only be
achieved, if the consumers are able to efficiently and effectively select apparel items without
undergoing the exasperating exercise of trial and error in the retail environment. This implies
that those dimensions and body shapes used during the construction of apparel must be true
representations of the dimensions and the body shapes of the target consumers. Those
dimensions and body shapes must also be communicated effectively to the consumers who
in turn should be able to interpret and link them to their own sizes and body proportions.
In Kenya, however, there are no classified body shapes to act as design guidelines. The
sources of the size standards are also flawed and thus cannot guarantee the quality of
ready-made apparel. Communication of sizing and fit through size labels is also flawed and
is uninformative, making it difficult for the consumers to use effectively. Ignorant consumers
in the market place would not find them useful, as they would continue to guess and estimate
how an apparel item would fit their sizes and body proportions. Size labelling is a tool for
communicating sizes and body types to the consumers and to assist them in choosing
apparel that would fit their body shape and size appropriately. Such labels are supposed to
indicate dimensions and to describe the body shape that the apparel was designed to fit
(Glock & Kunz, 1995:108; Chun-Yoon & Jasper, 1996:89). Furthermore, labels should
indicate whether the person is tall with large/small bust and large/small hips, short with
large/small bust and large/small hips, or regular (medium height) with large/small bust and
large/small hips. These fit indicators provide a foundation of judging the suitability of an
apparel selection for a particular body type and size. Non-instructive size labels become
almost meaningless to uninformed consumers on size and fit issues.
3.5 CONCLUSIONS
From the literature review, it is clear that consumers in various parts of the world, particularly
women, encounter problems with the fit of ready-made apparel. The implications these
problems have on the clothing industry are also costly and burdensome. Based on the
literature review covered in Chapters 2 and 3, the following conclusions in relation to the
focus of this study are hereby given:

91
3.5.1 Female body shape classifications
Based on the literature about the female body shape, it is evident that:
The lack of varied body shape representation in a sizing system is one of the
contributing factors to the fit problems experienced with apparel.
Female body shape identification forms the basis of developing a successful sizing
system. The success of any body shape categorisation depends on the correct
classification techniques being applied, the selection of the key dimensions, which
must be taken accurately, and/or evaluating photographs/images.
An understanding of different body shape characteristics or components that are
critical for the production of apparel patterns, could lead to an understanding of the
theoretical issues concerning female body shapes, and hence to the manufacturing of
better-fitting apparel for the various body shapes.
3.5.2 Consumers’ knowledge about size and fit communication systems
Regarding consumers’ knowledge about size and fit communication systems, it is evident
that:
Consumers’ lack of knowledge about the codes and contents of different size labels,
can lead to inappropriate apparel selection and hence fit problems.
Uninformative size codes are not instructive enough to guide the consumers while
selecting appropriate sizes and styles.
Informative size labels can only be effective if the consumers are able to link their own
key dimensions and shapes accurately to the information provided on the size labels.
Recognising consumers’ lack of knowledge on sizing and fit issues from the
consumers’ point of view, will allow researchers and apparel manufacturers to
understand fit problems in the light of a lack of knowledge. Based on this
understanding, measures can be devised to educate the consumers. Consumers
potentially have much to gain from well-orchestrated consumer education efforts that
are jointly endorsed by concerned parties at both the micro- (apparel
manufacturers/retailers) and the macro-levels (governmental agencies and private
consumer-oriented organisations).
3.5.3 Fit preferences
Concerning consumers’ fit preferences, it is clear that:
Consumers’ fit preferences that do not harmonise with their critical fit points can
contribute to fit problems, hence the need to educate the consumers on the elements

92
and principles of design to provide them with knowledge regarding the selection of
suitable apparel for specific body shapes and sizes.
Understanding the fit preferences of female consumers can help apparel companies to
realistically produce suitable and better-fitting apparel within the consumers’ desired fit.
If apparel manufacturers produce apparel without taking into account the fit
preferences of the consumers, the available products could be purchased based on
availability rather than on what the consumers desire.
All the information gathered based on the above conclusions, can in the end be used as
input units for the development of a knowledge base that can lead to practical designing,
predicting the degree of fit, and ultimately the production of better-fitting apparel in Kenya.
This will enhance customer satisfaction and increase financial gains for the apparel industry
(LaBat 1989; Gersak, 2002).
Based on these conclusions, schematic framework (Figure 3.24) was developed.
FIGURE 3.24: SCHEMATIC FRAMEWORK
Body shape categories (Objective 1, 2 and 3)
Body shapes’ classification techniques
Body images/photographs
Size labels
Uninformative
Numerical code Lettered code
Informative
Wordless Pictograms Code and key dimensions Wordless pictogram +
dimensions
Sizing issues Fit issues
Established body shape terms
Junior misses, misses-petites, women’s, women’s-
petites
Consumers’ fit preferences
Fitted (skirt, jacket/blouse) Semi-fitted (skirt, jacket/blouse) Loosely fitted (skirt, jacket/blouse)
(Objective 6)
FIT OF THE READY-MADE APPAREL
Consumer’s knowledge on size and fit communication
systems (Objective 5)
Body dimensions
Perceived fit problems
Body shapes’ critical fit points (upper torso, lower torso and the arm)
Satisfaction with ready-made apparel (apparel search, available styles and sizes)
Perceived sources of fit problems (apparel industry and own body shape)
(Objective 4)
Consumers’ knowledge on their own body shapes and own key body
dimensions

93
The framework (Figure 3.24) includes the objectives of this study and have been
conceptualised from the theoretical definitions within the literature covered in Chapters 2
and 3 of this study. The dimensions and concepts presented play important roles in the fit of
ready-made apparel.
Strategies to address the above-mentioned problems of this study are discussed in Chapter 4.

94
Chapter 4
RESEARCH METHODOLOGY 4.1 INTRODUCTION
The purpose of any research undertaking is to explore and describe phenomena leading to
the generation of applicable results (Neumann, 2000:21). The research question in this study
addresses an everyday problem in World 1 (W1), where people’s knowledge has been
acquired through experience and learned through tradition. World 2 (W2), being the world of
science, tries to use the phenomena of W1 as objects of research and attempts to
investigate these in a systematic and methodological way. Research methodology refers to
the methods, techniques and procedures used to implement the research design. This
process enables the scientist to examine the phenomena in the most accurate manner and
make truthful (epistemological) judgements about them (Babbie & Mouton, 2001:10-11).
World 3 (W3) is the world of meta-science where the development of academic disciplines
stems from. This discipline takes W2 (the world of science) as the object of investigation and
reflects thereupon (Mouton, 1996:8-9). Thus empirical, scientific inquiry begins with a
movement from W1 to W2 (Mouton, 1996:64).
For the purposes of reliability and validity of the study, the methods, techniques and
procedures must be carefully chosen. However, the choice of the research instruments and
techniques would depend on the nature of the research problem statement, the research
objective, the expectations of the researcher, and to a certain extent the resources available
(Morse in Schurink, 1998:253; Babbie & Mouton, 2001:XXV). From the review of the
literature, the conclusions given in Chapter 3 and the schematic framework (Figure 3.24) of
the main concepts of this study, it is clear that all the aspects mentioned have implications for
the choice of the research strategy, data collection methods and statistical analyses used in
this study. In order to obtain results that are reliable and valid, this chapter gives an
exposition of the aspects employed for this study. They are:
The chosen research framework and the research questions, which are stated as the
primary objectives and sub-objectives for this study.
The research strategies that are employed under two phases in the study, are
o the samples chosen for the study,
o the choice, description and application of data-collection methods for phases one

95
and two of the study,
o analysis of data for phases one and two of the study,
o the quality of the study, and
o how the research ethics were observed.
Figure 4.1 on the next page, outlines the research framework, phases and objectives of this
study.

96
QQUUAANNTTIITTAATTIIVVEE DDAATTAA ((BBOODDYY SSHHAAPPEE CCLLAASSSSIIFFIICCAATTIIOONN)) TTHHRROOUUGGHH BBOODDYY DDIIMMEENNSSIIOONNSS AANNDD PPHHOOTTOOGGRRAAPPHHSS ((OObbjjeeccttiivveess 11,, 22 aanndd 33))
Career women’s body dimensions
Career women’s body images/Photographs
PP HH A
A SS EE
OONN
EE
1. Top part of the body (the shoulder slope, the bust, the waist, the sleeve length and upper arm (biceps), bust extension and the arc measurements of both front and back body at bust, and both front and back waist arc measurements).
2. Lower part of the body (the hip, the broadest hip region, the thigh, the arc measurements at the waist, hip, and the buttock extension)
1. Front view’s areas for scrutiny: whole body, shoulder, bust, top arm, waist, hip sizes and the thighs
2. Side view’s areas for scrutiny: bust prominence, back curvature, stomach prominence, pelvic tilts/buttocks and thigh bulge and height proportions
3. Back view’s areas for scrutiny: whole body, shoulder, waist, hip sizes, top arm and thighs
QQUUAANNTTIITTAATTIIVVEE DDAATTAA,, TTHHRROOUUGGHH QQUUEESSTTIIOONNNNAAIIRREE ((OObbjjeeccttiivveess 44,, 55 aanndd 66))
Career women’s general fit problems with ready-made apparel (Objective 4)
Career women’s knowledge about size and fit issues (Objective 5)
Career women’s fit preferences (Objective 6)
PP HH A
A SS EE
TTWW
OO
1. Fit perception of different apparel categories 2. Fit problems at specific critical fit points (neck,
bust, shoulders/shoulder blades, nape to waist, waist, armcye, upper arms, abdomen, hips/buttocks, thighs and crotch line)
3. Satisfaction with the fit of ready-made apparel 4. Perceived source of fit problems
1. Communication of fit issues (Junior Females, Females petites, Misses, Misses-petites and linking to their own body shape)
2. Communication of sizing issues (meaning of size codes and linking to their own dimensions)
Fit preference for differently fitted apparel items 1. Fitted jackets and skirts 2. Semi-fitted jackets and skirts 3. Loosely fitted jackets and skirts TT HH
EE FF
II TT OO
FF FF EE
MMAA
LL EE’’ SS
RREE A
A DD Y
Y --MM
AADD
EE AA
PP PP AA
RREE L
L
FIGURE 4.1: RESEARCH FRAMEWORK AND PHASES FOR THE STUDY

97
From the research framework and research phases (Figure 4.1, previous page), the
following research questions directed the investigation:
What are the distinctive body shapes of career women in Kenya and how do they differ
from the Western distinctive body shapes?
What implications for the fit of apparel are associated with Kenyan career women’s
distinctive body shapes?
What are the distinctive differences in body proportions among the different age
groups of Kenya’s career women?
What are the general fit problems that career women encounter with the ready-made
apparel in Kenya?
Do career women lack knowledge about the communication of size and fit, and how
does this contribute to their fit problems with ready-made apparel in Kenya?
What are the career women’s fit preferences for differently fitted apparel items and
how do these contribute to the fit problems of ready-made apparel in Kenya?
4.2 PRIMARY OBJECTIVES AND SUB-OBJECTIVES OF THE STUDY Primary objective 1: To identify and describe distinctive female body shapes of
career women in Kenya from body dimensions and photographs
Sub-objective 1.1: To identify and describe distinctive female body shapes of career
women in Kenya from the body dimensions Sub-objective 1.2: To identify and describe distinctive female body shapes of career
women in Kenya from the photographs
Sub-objective 1.3: To establish and describe associations between distinctive shapes
emerging from body dimensions and those emerging from the
photographs of the career women
Primary objective 2: To distinguish and describe differences between the emerging distinctive body shapes (from measurements and photographs) and the Western distinctive body shape
Primary objective 3: To scrutinise and describe the fit implications associated with
the emerging distinctive body shape of the career women Primary objective 4: To assess and describe career women’s self-perceived fit

98
issues with the ready-made apparel in Kenya Sub-objective 4.1: To investigate career women’s perception of fit with different
apparel categories that are sold in various retail stores in Kenya
Sub-objective 4.2: To describe fit problems that career women in Kenya encounter
regarding the specific critical fit points of different parts of their
bodies
Sub-objective 4.3: To describe career women’s degree of satisfaction with the
process of finding appropriate ready-made apparel items in Kenya
Sub-objective 4.4: To explore career women’s self-perceived sources of fit problems
with apparel in Kenya
Primary objective 5: To determine and describe Kenyan career women’s knowledge about the communication of size (key body dimensions) and fit (body shapes)
Sub-objective 5.1: To explore Kenyan career women’s knowledge about the
communication of size
Sub-objective 5.2: To explore Kenyan career women’s knowledge about the
communication of fit
Primary objective 6: To determine and describe how career women’s preferences for differently fitted skirts and jackets may contribute to fit problems with apparel
4.3 RESEARCH STRATEGY CHOSEN FOR THIS STUDY This study is exploratory and descriptive in nature. Fit problems with ready-made apparel
associated with career women’ distinctive body shapes, career women’s knowledge about
the communication of size and fit as well as career women’s fit preferences have not been
addressed in Kenya. Considering that these issues are new in Kenya, an exploratory study
was carried out in order to obtain an insight into a relatively new area of study (Babbie &
Mouton 2001:80). According to Miles and Huberman (1994:23), no research study can claim
inductive purity, because all research begins to a certain extent with existing knowledge and
builds on previous research. This study initially followed a deductive route, starting with an
abstract idea, obtained from a thorough review of the literature covered in Chapters 1, 2 and
3. From this, some guiding principles could be extracted for the quantitative research

99
approach used (Neumann, 2000:132).
Although data collection occurred simultaneously from the participants, this research is
divided into two phases for practical purposes and ease of presentation (Figure 4.1). In the
first phase of the study, the career women were measured and photographed for the
purposes of sorting out and identifying their distinct body shapes. The second phase was to
determine by means of a structured questionnaire, general problems that career women
experienced with the fit of ready-made apparel, their knowledge about size and fit, and their
fit preferences.
Based on the research problem statement, and the primary objectives and sub-objectives
formulated for this study, a quantitative research style was selected as the most suitable
paradigm. In quantitative research, the process of measurement begins after the research
question has been formulated, the variables identified and the units of analysis determined.
This is done to develop clear definitions and create measures that will yield precise and
accurate findings (Neumann 2000:132). In order to gain a broad understanding of the stated
phenomenological issues of this study, an extensive literature search was done, as clearly
indicated in Chapters 2 and 3. This study primarily followed a deductive route by starting
with an abstract idea as stated in Chapter 1, followed by measurement procedures with
concrete indicators, and ending with empirical data (precise numerical information) that
represents the abstract ideas, as presented in Chapters 5 and 6 of this study. The
measurement techniques that were used, were precise, linking the relevant concepts with the
data and predicting what the data would be (Neumann, 2000:158). This study was cross-
sectional, implying that it was undertaken at a specific point in time and not over a long
period.
4.4 CHOICE OF THE RESEARCH SAMPLE FOR THE STUDY 4.4.1 Units of analysis for the study
The units of analysis for this study (in both phases) were female urban high-school teachers
between the ages of 25 and 55 from three major cities (Nairobi, Kisumu and Eldoret) situated
in the central and western regions of Kenya (Figure 4.2). They were used to represent urban
career women in Kenya. The decision to use urban high-school teachers was taken because
the teaching profession in Kenya has the highest percentage of female employees (KNUT,
2001:1). Considering the time constraints, these groups of women had the advantage of time
and financial savings, as they would be exposed simultaneously to the same stimulus

100
material and measured at the same time, at their respective schools (Delport in De Vos,
2002:175).
For the purposes of this study, a career female is described as a woman whose growth in
height is completed (International Standards Organization (ISO)/TR 10652, 1990:32), and
who is pursuing a certain profession as a means of earning an income (Callahan, 1988:31).
Career women are exposed to fashion, and have got the means and the incentive to respond
to fashionable apparel, but are also critical regarding the way that apparel items fit (Stone,
1999:39; Klepp & Storm-Mathisen, 2005:329). Women in the teaching profession also fall
within a wider age bracket suitable for the study. It is assumed that females attain their
profession by the age of 25, while retirement age in Kenya is 55. There are enough urban
high schools in the two regions, to obtain the sample from. Given that this study was
undertaken in two regions of Kenya (Figure 4.2), the findings of this study shall not be
generalised to the entire population of career women in Kenya, but rather to the career
women of the two regions only. The following criteria (Table 4.1) were used to select the
respondents for participation in this study.
TABLE 4.1: CRITERIA USED FOR SELECTING THE CAREER WOMEN
CCRRIITTEERRIIOONN JJUUSSTTIIFFIICCAATTIIOONN Respondents had to be females. Females’ ready-made apparel offers a variety of styles and
changes fast (Hogge et al., 1988), whilst their body shapes are also varied and dynamic.
They had to be between the ages of 25 and 55. It is assumed that females attain their profession by the age of 25. In Kenya, retirement age is 55.
They had to be employed in a full-time or part-time profession of teaching.
Involvement in activities that save time (wasted in shopping and apparel selection and trials) is greater for a woman in a profession than unemployed females (Stone, 1999:38). Female professionals would have the income to spend on apparel.
They had to have a post-school education with a diploma or a degree certificate.
The more educated a woman, the more she is exposed to and willing to try out new fashion, and the more critical she would be about the fit of her apparel (Stone 1999:36-37).
4.4.2 Sample selection for the study
Kenya as a country covers a large geographical area. It was not possible to study the whole
area within the time constraints at the time of research. The study was therefore limited to
two geographical regions situated at the western region (comprising Kisumu and Eldoret),
and the central region (comprising Nairobi city) of Kenya (Figure 4.2). The sample size was
predetermined before the fieldwork commenced; however, while in the field, unanticipated
problems arose which demanded that the initial plan be revised.

101
FIGURE 4.2: GEOGRAPHICAL AREAS COVERED FOR THE RESEARCH 4.4.3 Initial plan of sample selection for both phases of the study Two samples were to be drawn from the two regions of study (one sample from each region).
There are 41 urban high schools in the western region (Kisumu has 20 and Eldoret has 21
AREAS OF STUDY
1. KISUMU AND ELDORET (WESTERN REGION)
2. NAIROBI (CENTRAL)
MAP OF KENYA
KISUMU
ELDORET
NAIROBI

102
schools), with a total population of 1083 female teachers. There are 35 urban schools in the
central region (Nairobi), both private and government schools, with a population of 1052
female teachers. Both regions together yielded 2132 (1083+1052) female teachers. The
entire population sample was selected using the probability sampling technique (Appendix 2A) for the purposes of addressing all the objectives of the study, involving empirical body
measuring (phase one), photographing (phase one), and the use of questionnaires (phase
two). This method was chosen because in the probability sampling technique, all the
elements in the population would have an equal (or unequal and subsequently weighted)
chance of selection, as it avoids any conscious or unconscious bias on the part of the
researcher in the selection of elements. There is also an excellent chance that the sample
selected will closely represent the population of all elements. Although they may not be
perfectly representative in all respects, controlled methods permit the researcher to estimate
the degree of expected error (Kerlinger, 1986:110-111; Bailey, 1994:90; Babbie & Mouton,
2001:201-202; Strydom & Venter in De Vos, 2002:205). Prior to the fieldwork, a list of
schools had been obtained from municipal education offices in both regions of study.
Systematic sampling methods were applied for each region.
In the Kisumu region with 20 schools, the ninth number was randomly picked as a starting
number. Thereafter, every third school was picked from the list, making a total of 6 schools to
be studied. The list of names of the teachers from the selected schools was to be obtained
from the respective schools, to facilitate further selection of participants, using the same
procedure of every third person on the list, after the first number had been determined by
flipping a coin (heads – odd number, and tails – even number). A total of 76 female teachers
were thus randomly selected from this region to participate in the study.
In the Eldoret region with 21 schools, the fifth number was randomly picked as a starting
number. Thereafter, every third school was picked from the list, making a total of 6 schools to
be studied. The list of names of the teachers from the selected schools was to be obtained
from the respective schools, to facilitate further selection of participants using the same
procedure of every third person on the list. The first number was determined by flipping a
coin (heads – odd number, and tails – even number). A total of 74 female teachers were thus
randomly selected from this region to participate in the study.
In the Nairobi region with 35 schools, the 15th number was randomly picked as a starting
number (point). Thereafter, every third school was picked from the list, making a total of 12
schools to be studied. The list of names of the teachers from the selected schools was to be
obtained from the respective schools, to facilitate the further selection of participants, using
the same procedure of every third person on the list after the first number had been

103
determined by flipping a coin (heads – odd number, and tails – even number). A total of 151
female teachers from this region were thus randomly selected from this region to participate
in the study. The two cities of Kisumu and Eldoret had a total population of 150 teachers to
be studied; this figure added to 151 from the Nairobi region brought the total to 301 female
teachers for the whole study.
4.4.4 Limitations of the predetermined sample while at grass-roots level
When planning to carry out the study in both government and private schools, certain
problems were overlooked. In the field, some of the head teachers (gatekeepers) of the
private schools refused us access to their schools and demanded a research permit from the
Ministry of Education (Appendix 1C, 1D and 1E). Strydom (in De Vos, 2002:283), cautions
that in some cases, gatekeepers and other sensitive obstacles might prevent one from
gaining access to the field. Neumann (2000:352) also warns that bargains and promises of
entry may not remain stable over time and may require that the researcher return later for re-
negotiations. It was decided to eliminate all the private schools in both the regions, because
time and limited finances could not facilitate any further trial and error. The number of private
schools is lower than the number of public schools, but the wages of the female staff
members in both private and public schools are the same, thereby ensuring that the results
of the study would not be significantly affected. This decision demanded that a research
permit and new lists of only government schools be sought from the Ministry of Education’s
Headquarters, as well as offices within the two regions that had been identified for the study.
The research permits (Appendix 1C, 1D and 1E) were granted and the new lists of female
teachers were obtained for re-sampling purposes. Babbie and Mouton (2001:299, 310) state
that most field research offers no fixed rule in methodology or ethics to follow, because
sometimes, sampling criteria emerge from the fieldwork. Although the new lists represented
fewer schools, the original predetermined sample sizes of 151 and 150 participants from
different regions respectively, were maintained. Systematic sampling techniques as planned
earlier remained in force, and the procedure followed was sustained (Appendix 2C).
4.4.5 Emergence of qualitative (snowball) technique within quantitative (systematic sampling) technique
Socio-cultural differences that often lead to divergence in perceptions, beliefs and behaviour,
include geographic location, ethnicity, religion, and sexual orientation (Fiore & Kimle,
1997:86; Marshal et al., 2004:94). Considering the nature of the study – taking body
dimensions and photographing female career women while dressed in minimal apparel – is a
delicate matter, as also observed by Apeagyei, Otieno and Tyler (2007). It required caution,

104
patience and a deep understanding of the participants’ cultural and religious beliefs, even
before negotiating with them.
The researcher, after seeking permission from the head teachers (gatekeepers),
comprehensively explained the objectives and the importance of the study to the staff
members (the potential participants of the study). The researcher then requested them to
volunteer at their own discretion. As soon as agreements were made, those who were willing
to participate in both phases of the study, were requested to decide on a suitable date and
time for the measurements, photographs and completing the questionnaires. Initially, all the
sampled participants were positive and agreed unanimously to participate in both phases of
the study. Later on, the majority agreed to complete the questionnaire, but declined to be
measured and photographed.
According to Hammersley and Atkinson (1995:55), it is imprudent to allow one’s strategy to
be led entirely by one’s own prepositions concerning what is, and is not accessible. Although
participants had refused to participate in both phases of the study (measurements and
photographing exercises, and completing the questionnaire), a re-negotiation process was
still achievable, as recommended by Neumann (2000:352). A new approach was devised
and reached with caution and patience. Having interacted with the teachers, the researcher
identified skilled and influential (vocal) members with apparel and textiles skills, to be used
as pioneers, negotiators/recruiters and persuaders of other participants. The vocal members
convinced a few other members, who then in turn identified others for the exercise. This
recruiting exercise went on until there were no further participants willing to participate from
each school. This ended up with an emergence of snowball sampling techniques within the
initial (already) systematically sampled groups in different schools. Out of the 301
participants identified for the original study sample as initially pre-determined by the
researcher and the statistician, only 123 participants’ body dimensions and only 89
participants’ photographs were taken (Appendix 2C) from the snowball-sampled group
(phase one). This agrees with what Babbie and Mouton (2001:310) reported that in an
interpretive research design, two types of sampling are commonly found: one where the
researcher sets up sampling before commencing with the fieldwork, and the other where
sampling criteria emerge from the fieldwork.
Neumann (2000:349) asserts that the steps of the field project are not completely
programmed but rather serve as an estimated guide or road map. As a re-entry strategy, the
researcher and the research assistant were forced to develop stronger trust and rapport with
the participants by providing their own photographs that were taken while dressed in body
suits and without any masks on their faces. The purpose and importance of the study were

105
once again comprehensively explained to all the willing participants (snowballed sampled
group). Some apparel items with fit problems were used to demonstrate how the body shape
influences the fit of apparel, to drive the point home. Neumann (2000:352) reports that the
researcher has to continuously negotiate and explain the research objectives of the study
time and again in the field.
4.5 CHOICE, DESCRIPTION AND APPLICATION OF THE DATA COLLECTION
TECHNIQUES
As reported earlier, data collection occurred simultaneously from all the participants. The
presentations of two phases are given here for practical purposes and ease of data reporting
and management. Data collection was done from two groups sampled through the
systematic technique and the emerged snowball technique. Not all of the snowball-sampled
participants were measured and photographed. There were some participants who were only
measured, and others were measured and photographed (Appendix 2C). The measuring
and photographing exercises were however performed before the structured questionnaires
were administered.
4.5.1 Body dimensions and photographs for body shape classification (First phase of the study – Objective 1)
To address objective 1 of this study, which is to identify and describe distinctive female body
shapes of career women in Kenya, it involved taking the body dimensions as well as
photographs of career women from the snowball-sampled groups only. Out of the 301
participants identified for the original study sample as initially pre-determined by the
researcher and the statistician, only 123 participants’ body dimensions and only 89
participants’ photographs were taken from the snowball-sampled group. It was observed that
the majority of the women who appeared older were adamant to be measured and
photographed, although their shape differences were not conspicuous.
Body shape identification is the backbone behind the development of apparel sizing and
ultimately, well-fitting apparel. As discussed earlier, most female sizing systems currently in
use are based on the ideal Western figure that has well-proportioned body components, and
in any case on an outdated database (Simmons & Istook, 2003; Newcomb & Istook, 2004;
Devarajan & Istook, 2004). Although shapes have been classified in most developed
countries to solve the problem of fit, African shapes with reference to Kenya, however, have
not been considered. The dimensions of body components can only be extracted from the

106
human shape through measurements and images, which are only obtainable through body-
scan technologies and/or photographs with the use of recommended instruments and
techniques.
For the purposes of identifying the distinct body shapes of the career women in Kenya,
traditional anthropometrical techniques of obtaining body dimensions were employed in this
study. Anthropometry has been applied in many studies, while photography (somatography)
has been used scantily, but has produced reliable results (Gazzuolo et al., 1992; Douty,
1968; Salusso-Deonier, Markee & Pedersen, 1991; Kuma, 1999:39; Anderson et al., 2001:7).
It may be argued that in describing body shapes, measurements alone would not be
exhaustive enough to give true representations of the proportions of the body. Profile
characteristics such as pelvic tilt (buttock prominence), stomach protrusion, back curvature
and breast protrusion can only be understood through visual analysis of the body’s silhouette
and profile. Based on this understanding, and on a thorough study of the literature on
traditional anthropometry, somatography and body shape classifications, a comprehensive
body measurement form, a body shape assessment training manual and a body shape
assessment scale were compiled.
Important key body dimensions necessary for the identifying of body shape, and that are
critical to apparel’s fit, were included in the body measurement form (Appendix 3A), while
the characteristics of body shape that are critical to fit were included in the body shape
assessment training manual as well as the body shape assessment scale (Appendix 3D).
To obtain the body dimensions as well as the images, the empirical/practical study was
carried out as follows.
4.5.1.1 Preparations for measuring and photographing exercises Prior to taking the measurements and the photographs, the subjects were informed about the
apparel items to be used, the measurements to be taken and the different views required for
the images. To be efficient and effective in the exercise, the subjects were provided with and
requested to wear body suits (leotards) with minimal thickness and that follow the natural
contours of the body without constriction – as recommended by ISAK (2001:5). This was to
ensure uniformity amongst all the participants. The researcher provided all the body suits
that were the same in colour and thickness. Due to a shortage in ready-made leotards in the
recommended colour and style, and within the available finances and time constraints, the
researcher made only 20 body suits for all the participants. They were dry-cleaned after each
use or before the next participant’s use. The size description system used for assigning sizes
to the body suits was the lettered type of Small (S), Medium (M), Large (L) and Extra Large

107
(XL). The measurements used for the production of the body suits were based on the
Kenyan size standards (Appendix 4A). The Small (S) size category comprised size 8 and 10
measurements; the Medium (M) size category comprised size 12 and 14 body dimensions;
the Large (L) category comprised size 16 and 18 body dimensions; while the Extra Large
(XL) category comprised sizes 20 and 22 measurements.
Taking body dimensions: Dimensions from the human body form the foundation for well-
fitting apparel. The body dimensions taken accurately, by employing the correct methods,
instruments and techniques, can yield accurate and representative results (Ashdown, 2000;
Simmons & Istook, 2003; Bye, LaBat & DeLong, 2006:66). It is not practical to use body
scanners in developing countries due to its costs and the technical skills required, even
though it promises better results (see Chapter 2, paragraph 2.3.3). The use of traditional
anthropometry in conjunction with specific successful tailoring techniques of taking body
dimensions (stipulated in most sizing standards) was deemed appropriate for this study as
they offered alternative methods. Since these techniques are standardised and have been
used in many studies, reliability and validity were ensured (Winks, 1997; Beazley, 1998;
Simmons & Istook, 2003; Bye, LaBat & DeLong, 2006:66).
Body shape scrutiny is the foundation from which the development of apparel sizing stems.
Distinctive characteristics of the body, which are critical to the fit of apparel, are considered in
body shape identification. In this regard, more dimensions were required than just the basic
key body dimensions (i.e. height, bust, waist and hips), which alone cannot exhaustively
describe body shapes in terms of specific characteristics (such as pelvic tilt/buttock
protrusion, back curvature, shoulder slope, and the protrusion of stomach and breasts).
After having reviewed the literature on apparel anthropometry and having considered all the
characteristics of the body’s front, back and side views, the body measurement form was
developed (Appendix 3A) to guide and ease the measuring exercise. The body
measurement form contained the dimensions of the upper and lower parts of the body that
were carefully selected to improve the quality of the sorting and identification of the different
body shapes. The body measurement form was designed in such a way that it would
promote quick measuring. Height and vertical measurements were grouped and arranged in
the order of their occurrence, from the top to the lower part of the body. All the horizontal
(girth) measurements and all the width and length measurements were also grouped and
arranged in the order of their occurrence, from the right to the left part of the body.
The landmarks and measurements for both the upper and the lower parts of the body
(Figure 4.3) were obtained through standardised techniques, as stipulated in ISO-8559-89;

108
Beazley (1996); ASTM-D 5219-99; ISAK (2001); and Simmons and Istook (2003) (Appendix 3B). The landmarks identified were:
The neck/nape (7th cervical vertebra): The subject assumed a relaxed position with
hands hanging by the sides and the head in the Frankfort plane position. The landmark
was obtained by bending the neck forward (lowering the chin) to locate it, as it pops
out when the head is lowered. This position was marked with the circular hole on the
sticker, being placed on the centre (RMSS, 1994; Beazley, 1996). This landmark
guided the calculation of the shoulder slope, which was obtained by subtracting the
shoulder to ground measurement from the nape to ground measurement.
The shoulder point (Acromion): The subject assumed a relaxed position with hands
hanging by the sides and the head in the Frankfort plane position. Acromio-clavicular
joint positions on both right and left sides were determined by palpating along the
spine of the scapula to the corner of the acromion. Marking was applied with the
stickers’ central holes placed at the mid-points of the acromions (ISAK, 2001:29;
McConville, in Simmons & Istook, 2003). The shoulder landmark guided the calculation
of the shoulder slope. It was also one of the points used to obtain the side seam line
(profile trunk line).
The armpit (axilla) level: The subject’s hands were raised and the head in the
Frankfort plane position. Landmarks were placed with the stickers’ central holes at the
mid-points of the hollow armpit regions. This landmark guided the bust extension
measurement and the bust measurement. It was also one of the points used to obtain
the side seam line (profile trunk line).
The upper arm/bicep point: The subject assumed a relaxed position with arms
hanging by the sides. The site is located at the mid-point of the straight line joining the
Acromiale and Radiale, perpendicular to the long axis of the arm, also appearing as
the fullest part of the bicep region. This landmark guided the upper arm circumferential
measurements.
The breast tips/bust level: The subject assumed a relaxed position with hands
hanging by the sides and the head in the Frankfort plane position. Marking was then
applied with the stickers’ central holes placed at the breast tips. This landmark guided
the bust extension measurement and the bust circumference measurement.
The waist (natural indentation): The subject assumed a relaxed standing position
with the arms folded across the thorax and the head in the Frankfort plane position.
The landmarks were placed with the stickers’ central holes at the mid-points of the
natural waist indentation at the sides. Subjects with waistlines difficult to identify in a
relaxed standing position, were requested to bend sideways in order to facilitate the
locating of the waistline. This landmark served as a guide for measuring waist

109
circumferences, waist height and was one of the points used to obtain the side seam
line (profile trunk line) (ISAK, 2006:87).
The hip (trochanterion): The subject assumed a relaxed standing position, with the
arms folded across the thorax and the head in the Frankfort plane position. The site
was identified by palpating the lateral aspect of the gluteal muscle, with the heal of the
hand up, until the superior surface of the hip bone (trochanter) could be felt when
strong downward pressure was applied. For subjects with thick adipose tissue over the
hipbone it was difficult to locate it. However, it helped to request, while supporting the
left side of the subject’s pelvis that the subject lift up her right leg as the palpation
continued. This landmark served as a guide for measuring hip/buttock circumferences
at the level of their greatest posterior protuberance, and was one of the points used to
obtain the side seam line (profile trunk line) (ISAK, 2006:87).
The thigh bulge point (almost at gluteal furrow point): With the subject assuming a
relaxed standing position, the arms folded across the thorax and the head in the
Frankfort plane position, the landmark was located at the broadest (bulging) part of the
thigh. This landmark served as a guide for measuring the lower hip circumference
(appearing broadest), and as one of the points used to obtain the side seam line
(profile trunk line) (ISAK, 2001:87). It also guided the calculation of the thigh bulge,
which was obtained by subtracting the hip circumference from the lower hip
circumference (hip appearing broadest).
Knee level (tibiale laterale): With the subject assuming a relaxed standing position
and with the arms hanging by the sides or folded across the trunk and the head in the
Frankfort plane position, the site was identified by palpating to locate the lateral
condyle of the femur and the antero-lateral portion of the lateral border of the head of
the tibia. Although it is a difficult site to locate, the subject was requested to flex and
extend the knee several times to ensure that the correct point has been located;
alternatively, the subject could bend the knee slightly to define the crease line; the mid-
part on the side was then identified and landmarked (RMSS, 1994; ISAK, 2001:46).
This landmark served as one of the points used to obtain the side seam line (profile
trunk line).
The ankle (malleolus): The subject assumed a relaxed standing position, arms
hanging by the sides or folded across the trunk, and the head in the Frankfort plane
position. The lower edge of the tibial bone was located and landmarked. This landmark
served as one of the points used to obtain the side seam line (profile trunk line).
Trunk line (side seam): With the subject assuming a relaxed standing position, the
ear’s hole served as the head’s landmark, while the shoulder, armpit, natural waist
indentation, hip (trochanterion), knee (tibiale laterale) and the ankle (malleous) served
as landmarks for the lower part of the body.

110
FIGURE 4.3: LANDMARKS AND BODY DIMENSIONS OBTAINED FOR BODY SHAPE IDENTIFICATION
Instruments used for measuring: Apparel anthropometry studies specifically use apparatus
that have been developed to produce reliable and valid measurements. An anthropometer
(measuring stand), consisting basically of a graduated rule in millimetres, that is vertically
mounted and has a moveable arm, is used for measuring straight linear distances, while
callipers are used to measure linear depths and widths. Calibrated measuring tapes are used
to measure depths and widths (Beazley, 1997:58; Ashdown, 2000).
According to Morse (in Schurink, 1998:253), the nature of the research problem statement
and the resources available determine to a certain extent the data-collection methods to be
used in a study. For the purposes of this study and due to the available resources, the
researcher consulted professional anthropometrists from the company Ergotech in South
Africa for training on how to take body dimensions professionally, and on suitable
instruments to be used. The Ergotech Company is well known for their anthropometric
surveys. In this regard, Ergotech’s measuring techniques and the instruments that they use
were considered reliable and valid. To further enhance reliability when taking body
dimensions, the researcher underwent a one-week training on anthropometry as a level 1
Kinathropometrist, offered by the International Society for Advancement of
Kinanthropometry, ISAK (Appendix 3C). Based on the expertise and experience of Ergotech

111
South Africa, the researcher’s training with ISAK and a thorough review of the literature, the
decision was made to use specific instruments for this study (Figure 4.4). The techniques of
taking body dimensions of ISO (1989), ASTM (1999), Beazley (1996) and Simmons and
Istook (2003) were also consulted before that decision was taken.
Due to limited funds available and the unavailability of an anthropometer, the researcher
opted to use an improvised standing anthropometer, with approximate resemblance to a real
anthropometer. It basically consists of a measuring stand of a graduated rule in centimetres
and millimetres. It contains two parallel metal bars held at right angles from the base and has
rods mounted at right angles on the fittings that slide/move along one of the vertical primary
rods, as shown in Figure 4.4. It was designed according to the specified measurements of
an ordinary anthropometer. After it was assembled, it was subjected to critical testing for
accuracy and reliability. The improvised standing anthropometer was used for measuring all
the straight vertical linear distances as shown in Figure 4.5. A stature meter was used
interchangeably with the anthropometer for the height measurements. All the contour
measurements were measured using a 200 cm long dressmaker’s metal tape to avoid
stretching and tear during the exercise. A set square was used for locating the trunk line on
the side, while a segmometer was also used interchangeably with the metal or fibre glass
tape to measure widths (Figure 4.4). All these instruments were used after consultation with
an anthropometrist and anthropometry books and standards such as the Republic of South
African Military Standards (RMSS) (1994), Norton and Olds (1996) and ISAK (2001).
Other tools necessary for the body dimensions exercise included landmarkers; these were
white stickers with a circular hole in the middle. They were placed on the relevant positions of
the body and body suits (leotards) to signify the landmarks (Beazley, 1996). Elastic tapes
were used for locating the natural waist indentation. Hair clips were required to hold hair
away during measuring of the subjects. Body suits were provided in standardised sizes and
brassières were provided whenever necessary. The measuring area was prepared well in
advance for convenience and speed of handling equipment, and to reduce the fatigue of both
the subject and the measurer. A table on the right-hand side of the measurer had all the
equipment and tools arranged according to the sequence of the measurements given on the
body measurement form.

112
Improvised standing anthropometer Metal measuring tape Segmometer
FIGURE 4.4: MEASURING INSTRUMENTS
Stature, nape and waist heights from
the ground Shoulder, waist, hip and knee
heights from the ground Hip, thigh, Knee and calf heights
from the ground
FIGURE 4.5: HEIGHT MEASUREMENTS USING STANDING ANTHROPOMETER
Actual body measuring: It has been observed that a person’s measurements (dimensions)
can only be accurate and representative if they are taken accurately by employing the correct
methods, instruments and techniques (Ashdown, 2000; Simmons & Istook, 2003; Bye, LaBat
& DeLong, 2006:66). However, accuracy could be improved if the subjects were landmarked

113
prior to taking the measurements. This ensures conformity and consistency (Simmons &
Istook, 2003). Since a landmarking exercise requires palpitation, touching and sometimes
bending of limbs to determine the appropriate positions for taking the measurements,
participants’ privacy is violated in the process (Simmons & Istook, 2003; Istook et al., 2003).
Having observed the resistance of the career women to participate in the exercise, it was
necessary to continue with negotiations throughout the practice, as recommended by
Neumann (2000:352). Most of the participants preferred as little contact as possible and this
demanded that the landmarking positions planned earlier be adjusted to include only the
most important points. The procedure used for landmarking followed the standardised
methods stipulated in Beazley (1996), ISAK (2001) and Simmons and Istook (2003).
The researcher took all measurements and called them out loudly to her research assistant
for recording. To confirm that the measurements were correctly recorded, the research
assistant also loudly repeated what she had heard. The research assistant was also skilled in
apparel design, and had been trained prior to the fieldwork. She also assisted with the
aligning of the metal tape measure at the back of the subjects when circumferential
measurements were taken, and thus acted as a mirror for the measurer where she could not
see or reach.
Photographing: Based on the study of somatography (Salusso-Deonier et al., 1991;
Gazzuolo et al., 1992; Kuma, 1999) and the concept of imagery with the body-scan
technologies, it was decided to use photography for this study as an alternative method to
body scans technologies. Female participants were photographed using standardised
methods while dressed in minimal apparel (body suits/leotards) and assuming different
positions/views (front, back and side/profile). The different views would facilitate accurate
judgements on body units/components that are critical to the fit of apparel. Those
components within the body would then be visually analysed and categorised to facilitate the
production of ready-made apparel with a better fit.
In order to achieve consistency and reliability when photographing, all sets of photographs
were taken from the same distance, with subjects and the photographer taking the same
postures and positions. Six-meter guiding grid paper was mounted on the wall and extended
to the forefront on the floor. The extended section on the floor had two sets of footprints
marked on it. The first set was close to the wall and indicated the subject’s position, while the
second set was further away from the wall and indicated the photographer’s position. The
grid paper was divided up into 15 cm squares with a bold line down the centre, which served
as a balancing point when photographing. The background (grid paper) was to standardise
all the photos taken and to allow ease of judgement concerning each shape later in the
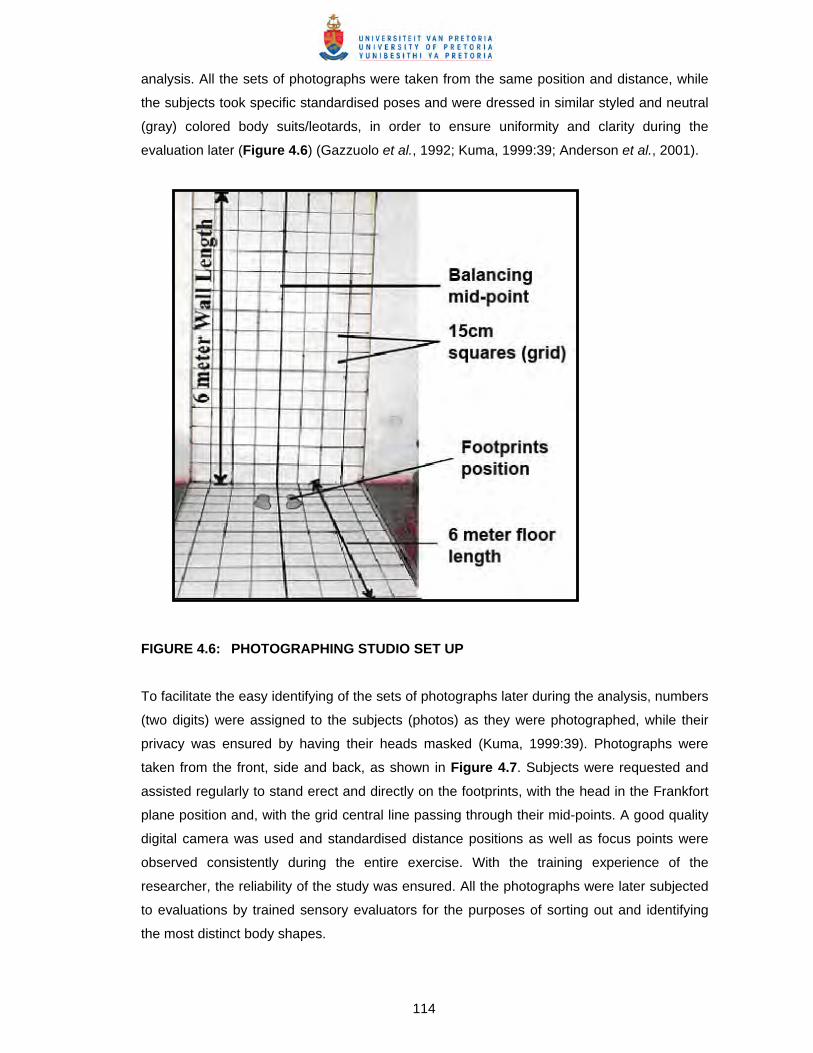
114
analysis. All the sets of photographs were taken from the same position and distance, while
the subjects took specific standardised poses and were dressed in similar styled and neutral
(gray) colored body suits/leotards, in order to ensure uniformity and clarity during the
evaluation later (Figure 4.6) (Gazzuolo et al., 1992; Kuma, 1999:39; Anderson et al., 2001).
FIGURE 4.6: PHOTOGRAPHING STUDIO SET UP
To facilitate the easy identifying of the sets of photographs later during the analysis, numbers
(two digits) were assigned to the subjects (photos) as they were photographed, while their
privacy was ensured by having their heads masked (Kuma, 1999:39). Photographs were
taken from the front, side and back, as shown in Figure 4.7. Subjects were requested and
assisted regularly to stand erect and directly on the footprints, with the head in the Frankfort
plane position and, with the grid central line passing through their mid-points. A good quality
digital camera was used and standardised distance positions as well as focus points were
observed consistently during the entire exercise. With the training experience of the
researcher, the reliability of the study was ensured. All the photographs were later subjected
to evaluations by trained sensory evaluators for the purposes of sorting out and identifying
the most distinct body shapes.

115
Front view Side view Back view
FIGURE 4.7: DIFFERENT VIEWS OF BODY SHAPES 4.5.2 Structured questionnaire (Second phase of the study – Objectives 2, 3 and 4)
For the second phase of the study, a structured questionnaire (Appendix 1A) was used to
address Objectives 4, 5 and 6. Other researchers have successfully used structured
questionnaires to measure fit problems, fit preferences as well as preferences for instructive
size labels (Objectives 4, 5 and 6) (LaBat, 1989; Chun-Yoon & Jasper, 1995; Anderson et al.,
2001; Otieno et al., 2005). Alexander, Connell and Ulrich (2005) also tested consumers’
knowledge about their key body dimensions, which are necessary for identifying the correct
apparel sizes. Since testing of career women’s knowledge about the meaning of the
communication of size and fit (Objective 5) is a new venture, the use of structured questions
was also deemed appropriate to address the problem.
The questionnaire was compiled after studying literature on fit problems with apparel
regarding sizing systems (size tables and the female body shapes), the communication of
size and fit (size labels), and career women’s fit preferences. Dimensions that would
influence such fit problems were identified from all the areas studied, as presented in a
schematic framework in Chapter 3 (Figure 3.24) of this study.
The questionnaire’s top page had the University of Pretoria’s logo (letterhead) and an
introductory letter stating the purpose of the research, giving an assurance of anonymity, an
appeal for participation in the study and acknowledgement for participation (Delport in De

116
Vos, 2002:170). The questionnaire was scrutinised by the researcher’s study leader, the co-
study leader, the statistician and the subject specialist lecturers at the Department of
Consumer Science, University of Pretoria (peer evaluation). This was done to determine the
clarity of the questions used and whether the intended meanings were clear. Suggestions
that arose were used to adapt and revise the questionnaire. The corrected questionnaire was
then pilot-tested (First pilot test) on twenty third-year students enrolled for Apparel
Management at the University of Pretoria, for further refinements (e.g. the time it takes to
complete) and to improve the reliability of the questionnaire.
The questionnaire was developed to get information from career women about a variety of
aspects related to the stated objectives of the study. These included asking the career
women about their satisfaction/dissatisfaction with the ready-made apparel available in the
market place, testing their knowledge about the meanings of the size codes presented on the
size labels/tags attached to the ready-made apparel, and about their own key dimensions as
well as their own body shapes (communication of size and fit). It also questioned the career
women on their fit preferences for differently fitted skirts and jackets. The questionnaire
contained questions that were randomly arranged, but were originally derived from different
sections, using different indicators as shown in Table 4.2.

117
TABLE 4.2: THE STRUCTURE OF THE QUESTIONNAIRE (SECOND PHASE)
SSEECCTTIIOONN AASSPPEECCTTSS MMEEAASSUURREEDD QQUUEESSTTIIOONN NNUUMMBBEERRIINNGG
TTYYPPEE OOFF SSCCAALLEESS
Age Question 1 Nominal (Reporting) 11.. DDeemmooggrraapphhiiccss
Background profession of the participants Question 2 Nominal (Yes or No)
Rating fit quality of different categories of ready-made apparel sold in Kenya
Question 3 Five point Likert-type scale
Rating fit quality of ready-made apparel sold in different retail stores in Kenya
Question 4 Five point Likert-type scale
Career women’s fit problems at critical fit points Question 22 Nominal (Yes or No)
Career women’s satisfaction with ready-made apparel
Question 21 Five point Likert-type scale
22.. CCaarreeeerr wwoommeenn’’ss ppeerrcceeiivveedd ffiitt pprroobblleemmss
Perceived sources of fit problems Question 20 Five point Likert-type scale
Knowledge about reported own key dimensions Question 6 Nominal (Reporting)
Knowledge about reported own sizes Questions 13 & 14 Nominal (Yes or No)
Familiarity with size labels Question 15 Nominal (Yes or No)
Knowledge about the meaning of size labels Questions 16 & 17 Nominal (Yes or No)
SSiizziinngg iissssuueess ((KKeeyy bbooddyy
ddiimmeennssiioonnss))
Effectiveness of size labels Question 18 Nominal (Yes or No)
Familiarity with body shape terms presented on the label/tag
Question 5 Nominal (Yes or No)
Knowledge about the meaning of body shape terms presented on the label/tag
Question 5 Nominal (Reporting)
Knowledge about sketched body shapes Questions 7 & 8 Nominal (Reporting)
Knowledge about reported own body shape Question 7 Nominal (Yes or No)
Techniques applied to establish own body shape Question 9 Nominal (Yes or No)
Knowledge about style selection for the reported own body shape
Question 12 Nominal (Yes or No )
Preferred ideal body shape Question 10 Nominal (Yes or No)
33 .. CC
aa rree ee
rr ww
oo mmee nn
’’ ss kk
nn ooww
ll eedd gg
ee aa bb
oo uutt cc
oo mmmm
uu nnii cc
aa ttii oo
nn oo ff
ss ii
zz iinn gg
&& ff ii
tt
FFiitt iissssuueess ((bbooddyy sshhaappee))
Knowledge about own body proportions compared to those of the ideal
Question 11 Nominal (Yes or No)
44.. FFiitt pprreeffeerreenncceess Fit preferences for differently fitted Jackets & skirts (fitted, semi-fitted & loosely fitted)
Question 19 Five point Likert-type scale
The questionnaire contained 22 questions, which were randomised to avoid biased
responses as a result of closely related questions, and the explanatory sketches. Clear
instructions were given for each question. Most questions were closed-ended, except where
the respondents were required to self-report their year of birth (question 1), their key
dimensions (question 6) and where they were required to give a brief description of the terms
that represent different body shapes on size labels/tags (question 5), and to give a brief
explanation of the sketched body shapes (questions 7 and 8). The closed-ended questions
were specifically used because they are easier and quicker for the respondents to answer,
as the response choices provided could clarify the meaning of the questions for them, while
data-analysis is also easier. It is easy to code and analyse statistically and it permits easy
comparison of different responses (Neumann, 2000:260-261). Varied scales were used to
provide more flexibility in the design of items while making the questionnaire generally
interesting. The reported answers permitted respondents to express themselves without any

118
restriction. This enhanced the exploration of career women’s knowledge about size and fit
issues. Closed-ended questions were applied where a number of possible responses were
reasonably obvious, with the predetermined response options in place.
For the purposes of data management and presentation of the results, all the questions had
been pre-coded in advance. Although the questions were randomised in the questionnaire,
the questions were derived from the four sections given below:
Demographic information was to address factors such as the consumer’s age,
background and profession, as these might influence the purchasing decisions of the
career women.
Career women were asked to determine the fit quality of different apparel categories
and apparel items that are sold in different retail stores. This was also to try and
identify approximately where fit problems lie in Kenya’s ready-made apparel, to
evaluate career women’s awareness of the critical fit points of their upper and lower
torsos, to assess career women’s satisfaction with the fit of the ready-made apparel
and to explore career women’s perceived sources of fit problems.
Career women’s knowledge about the communication of sizing and fit was tested to
establish whether they were knowledgeable about the meaning of the size codes, the
body shape terms presented on size labels/tags and about their key dimensions – all
necessary for identifying their own sizes and body shapes.
Career women’s fit preferences were used to determine how the career women would
prefer their skirts and jackets to fit their bodies. Questions were asked to determine
how they would prefer differently fitted skirts and jackets (from fitted, semi-fitted to
loosely fitted). This was to determine whether the career women’s fit preferences were
within the available styles and sizes in relation to their critical fit points (as their needs
would affect the fit of the apparel if not in harmony with the critical fit points), and
whether these needs are being catered for.
While in the field (in Kenya), the questionnaire was further pilot-tested (Second pilot test) on
10 career women between 28 and 40 years . This was purposely done to determine whether
items were worded properly and specifically for the target people. A research assistant, who
had knowledge about apparel and experience in textiles, was chosen and trained how to
handle participants and administer the questionnaire. Both the researcher and the research
assistant administered the questionnaires to a group of career women in one sitting, ensuring
that no discussion took place between respondents. Any problems/questions that arose, as
the respondents completed the questionnaire, were clarified and answered (Bless & Higson-
Smith, 2000: 108-110). This method of data collection had the advantage of time- and cost-
effectiveness, because the groups of respondents were handled at the same time, and

119
exposed simultaneously to the same stimulus material (Delport in De Vos, 2002:175). Three
hundred and one (301) questionnaires were administered, but only 201 (67%) were returned
and could be used. Although all the questionnaires were administered, about 50% of the
questions in 100 questionnaires were left blank, thereby forcing the researcher to consider
them spoilt and not include them in the data analysis.
Mouton (1996:107) refers to the recording of data as a form of quality assurance prior to the
fieldwork. Therefore, the questionnaire (Appendix 1A) was divided into two sections for the
purposes of edge coding. The larger section was to be used by the respondents, while the
smaller sections contained numerical coding in the margins for official use (Babbie & Mouton,
2001:415-416).
4.6 DATA ANALYSIS 4.6.1 Data obtained from phase one
4.6.1.1 Data obtained from career female’s body dimensions The researcher ensured that the body dimension forms were all available and complete
without any missing data (Neumann, 2000:419). Mouton (1996:107) refers to the recording of
data as a form of quality assurance; thus prior to the fieldwork, the body dimension form was
divided into two sections for the purposes of edge coding. Larger sections contained the list
of body dimensions to be obtained, while the smaller sections contained numerical coding in
the margins for official use (Appendix 3A). On the official sections of the body measurement
form, blank spaces were left to facilitate the eventual data entry and computing (Babbie &
Mouton, 2001:415-416).
The captured data was compared with every completed body measurement form to ensure
that the information of each measurement form was correctly captured. Mistakes and errors
that emerged were managed and cleaned up (Babbie & Mouton, 2001:41). After the data
cleaning and management were done, the useful data was statistically analysed using
appropriate statistical methods. Statistics used were descriptive methods that integrated
simple percentiles to combinations of uni-variate and bi-variate. Un-ivariate analysis refers to
the analysis of one variable at a time. Example is a frequency/percentage table (Bryman &
Bell, 2007:357). Bi-variate analysis is concerned with the analysis of two variables at a time
in order to uncover whether or not the two variables are related (Bryman & Bell, 2007:360).
These analyses were employed for the purposes of dividing the study population into

120
subgroups. The data was normalised, giving ranges of two standard deviations either side of
the mean value, which covered 95% of the population where applicable. This removed the
extreme dimensions in a range, which could cause distortion. The mean values ± the
standard deviations (SD) facilitated the classification of height groups (short, medium and
tall), and the body shape categories of distinct characteristics (small, medium and large). The
medium categories were classified by “Mean ± SD”. Values above the “Mean ± SD”, were
classified as large, whereas values below the “Mean ± SD" were classified as small. Beazley
(1998:269) and Gupta and Gangadhar (2004) applied descriptive statistical techniques in
their studies. Chi-square tests and Pearson’s correlation coefficient were also used for
hypothesis testing and for the correlation of measurements.
A literature search was done to identify descriptive parameters to define the five prevalent
shapes (hourglass, triangle, inverted triangle, apple and rectangular), for the purposes of
setting up standards within the maximum and minimum dimensions of the drop values. The
drop values used were the difference between the bust and the hip dimensions and the
difference between the bust and waist dimensions. Since the five main body shapes only
served as guide for the purposes of identifying the body shapes in this study, it was not
possible to classify body shapes using the concept of “Mean ± SD”, because the rule allows
classification into only three categories (small, medium and large). However, Shin and Istook
(2007) report that the waist measurement for the rectangular shape is nine inches (23 cm)
less than the bust. Rasband and Liechty (2006:25-26) state that the waist of an hourglass
body shape measures more than 10 inches (25 cm) less than the hip or the bust. Using the
range (maximum and minimum) dimensions of the drop values within the context of the
anthropometric data of this study, in combination with the recommendations of Shin and
Istook (2007) and Rasband and Liechty (2006), it was possible to identify the different body
shapes of this study.
To process the data in a logical and direct meaningful manner, the first printouts were
converted from a random order to a grouped height order, as body height has been reported
as one of the control dimensions for most apparel (Winks, 1997; Gupta & Gangadhar, 2004).
The data was then re-arranged into the different body shapes within the range of drop
values. The drop values of the bust and the hips facilitated the identification of triangle and
inverted triangle body shapes, while the remaining body shapes (rectangle, hourglass and
the apple) were identified by the drop values of bust and waist dimensions (the difference
between the bust and the waist dimensions). Hip-bust drop values were used to establish the
sizes of the hips and bust in relation to each other for the purposes of sorting out the inverted
triangle shapes and the triangle shapes respectively. Drop values or key dimensions are
considered to be the best predictors of all the other body dimensions and have been widely

121
used for body shape classifications (Winks, 1991:74; Gupta & Gangadhar, 2004; LePechoux
& Ghosh, 2002:20).
The descriptive statistics: Descriptive statistics describe basic features of the data,
providing simple summaries about the sample and the measurements (Kranzler, 2007:48).
They provide a powerful summary that enables comparison across different variables
(Trochim, 2005:212:212). It uses the range value to measure the dispersion of variables. The
mean value measures the central tendency, and the standard deviation summarises the
dispersion by calculating the amount of deviation from the mean value (Bryman & Cramer,
1997:80; Bryman & Bell, 2007:357). The standard deviation used in conjunction with the
mean, reflects the degree to which the values in a distribution differ from the mean, and
summarises the amount of dispersion in a distribution (Bryman & Cramer, 1997:85). Height,
for example, can be summarised/categorised into different groups based on the means,
standard deviations and the range values obtained from the height dimensions. The
population can be classified into: Short = < (Mean ± SD), Medium = (Mean ± SD), and Tall =
> (Mean ± SD) – as done by Winks (1991), Beazley (1998); and Gupta and Gangadhar
(2004) in their studies.
4.6.1.2 Data obtained from the career female’s photographs Development of female body shape assessment formula
Body shape analysis is the theoretical underpinning for the development of apparel sizing
systems (Connell et al., 2006). In order to identify and sort the most distinctive body shapes
from the sample data, digital photographs served as stimulus material to allow for analysing
and sorting them by a trained panel of evaluators. This was done through visual sensory
evaluations done in five different steps. Sensory evaluation is the assessment using human
good judgement with the sensitivity of human senses. It implies the evaluation of selected
characteristics of a product under controlled conditions by a panel of judges (ASTM, 1981:3;
Leibowitz & Post, 1982:4; Lyon, Menneer, McEwan, Metheringaham & Lallemand, 2000:1).
The use of panelists as measuring devices is perceived to be similar to the use of any
scientific strategy to bring out the dimensions of specific subjects under investigation (ASTM,
1981:3; Leibowitz & Post, 1982:9).
The testing methods of evaluation are based on the concept of difference threshold, which is
the least amount of stimulus change that is detectable to human assessment (Ashdown &
DeLong, 1995). A stimulus is defined as any chemical or physical activator, which causes a
response in a receptor (ASTM, 1968:7). An effective stimulus produces a sensation, the

122
dimensions of which are quality, intensity, and extension – among others. For this particular
study, the difference threshold implied the differences in size and shape of the body shapes’
components that appeared different from the characteristics of the Western established
female body shapes. Visual sensory evaluation provided an orderly framework to evaluate
perceived physical characteristics within different body shapes. In order to ensure the utmost
validity and reliability of this method of study, the quality of the evaluators, the assessment
procedure, assessments scaling as well as methods of analysis were carefully considered.
The following steps were carried out to ensure that the outcome of this study, which involved
categorising preliminary subgroups with similar body shape characteristics, were reliable and
valid. In order to ease and make the evaluation process easy and faster, the first three
preliminary steps were done entirely by the researcher with assistance from computer
technical assistant. This was done to make the images simple and as clear as possible to
facilitate ease and quick assessments later by the trained professional evaluators.
First step (preliminary - done by the researcher): There is no known research that has
been carried out on Kenya’s female body shapes. Therefore, this being a virgin study on
female body shapes, the researcher subjected all the photographs to a thorough scrutiny by
examining and studying each body shape’s components from the front, back and – more
critically –the side view. Using the Western established body shapes (Figure 4.8) as point of
departure and as a launching ground for this study (Rasband & Liechty, 2006:25), the
researcher and the study leaders were able to identify a distinct (rectangular) body shape
(Figure 5.5 in Chapter 5) appearing to contain a long torso and strong features – and to take
note of those characteristics that differ from the Western established body shapes. The body
shapes provided were compiled, based on descriptions as well as illustrations found in:
Harper and Lewis (1983: 29, 31); Salusso-Deonier (1989:373); Zangrillo (1990); Rasband
(1994:12-13); Armstrong (1995:33); Spillane (1995:33); Fiore and Kimle (1997); Kuma
(1999:65-68); Connell et al. (2003); Simmons, Istook and Devarajan (2004a); Devarajan and
Istook (2004), and Rasband and Liechty (2006:23-29).

123
Triangular shape (front view)
Triangular shape (side view)
Inverted triangle (front view)
Inverted triangle (front view)
Rectangular shape (front view)
Rectangular shape (side view)
Hourglass shape (front view) Hourglass shape (side view) Apple (front view) Apple (side view) FIGURE 4.8: ESTABLISHED BODY SHAPES IN WESTERN SOCIETY Body characteristics that were uncommon for the Western established rectangular shapes,
were the thigh bulge that seemed to be situated at approximately two inches below the
normal hipline (trochanterion position), the strong (rounded) upper shoulder blades and
strong buttocks, contributing to a deep hollowed back waist. The stomachs appeared like a
strong block extending from just below the bust to below the waistline, down to the crotch line
region at the front (Figure 4.9).

124
Body shape 1 front view Body shape 1 side view Body shape 2 front view Body shape 2 side view
Body shape 3 front view Body shape 3 side view Body shape 4 front view Body shape 4 side view
FIGURE 4.9: UNREFINED PHOTOS
Second step (preliminary - done by the researcher): From the raw photographs, it was
almost impossible to extract all the details as exhaustively as possible. The researcher, with
the help of the computer Microsoft Office photo editor, was able to get the photographs
edged, as shown in Figure 4.9. This permitted a clear outline of the body for more additional
scrutiny. From the negatives and the edged shapes, pronounced details such as a stomach
shape from just below the waistline (appearing as the letter “b”), to another shape with more
weight concentrated below the waistline (and appearing more like the letter “D”), and to
shapes where the weight extended from above and below the waistline to the crotch at the
centre front. The back shape became clearly outlined, ranging from a less hollow waist to a
sharp deep hollow at the back waist (lordosis), depending on how rounded the upper

125
shoulder blades and the depth of the buttocks were (appearing like the letter “d” when they
conspicuously protrude beyond the rest of the body).
Body shape 1, front view.
Rectangular shape, no waist indentation and a noticeably
moderate thigh bulge
Body shape 1, side view. Rounded upper back, hollow waist, “d” buttocks and “D”
stomach
Body shape 2, front view. Rectangular shape, little waist indentation and a noticeably
moderate thigh bulge
Body shape 2, side view. Less rounded upper back, hollow waist, “d” buttocks and “D”
stomach
Body shape 3 front view. Rectangular shape, no waist indentation and a noticeably
moderate thigh bulge
Body shape 3 side view. Rounded upper back, less
hollow waist, “d” buttocks and extreme “D” stomach
Body shape 4 front view. Rectangular shape, no waist indentation and a noticeably
moderate thigh bulge
Body shape 4 side view. More rounded upper back,
hollow waist, “d” buttocks and extreme “D” stomach
FIGURE 4.10: EDGED PHOTOGRAPHS
Third step (preliminary - done by the researcher with assistance from computer
technical assistant): The IGRAFX Designer 5 software was used to extract only the
important characteristics that were identified in the first and the second steps above. This
decision was reached for the purposes of developing preliminary subgroups with similar
characteristics. With the help of an expert in computer apparel/pattern design, each
individual picture was copied into Adobe Photoshop CS. The resolution was increased to 762

126
pixels per square inch and the pictures were saved as *.bmp (bitmap) files so as to improve
the quality and to make them manageable while being manipulated when drawing and
extracting specific characteristics. With the use of IGRAFX Designer 5 software, the software
scale was set to 1cm = 5 cm, and 1cm by 1cm grid-lines were drawn over the blank page.
This page was saved as a template. The pictures were then imported individually onto the
blank template in IGRAFX Designer 5 and saved as *.dsf (designer) files. The picture size
was then reduced and the pictures were manipulated by means of rotation so that the grid-
lines on the template and the grid-lines on the pictures matched perfectly.
With the use of the dimension tool in IGRAFX Designer 5 software, the measurements
between specific points that were predetermined by the researcher were drawn in. White
lines were used in drawing and marking specific points because the background was dark,
and thus a lighter colour was used for visibility reasons. All the markings and drawings made
were scaled as shown in Figure 4.11, to assist in the proportional comparisons and
assessments to be made later. The picture was then manipulated by means of rotation back
to its original position. The picture and all the measurements were selected and then re-
exported and saved as a *.jpg (jpeg) file. The compound line tool in IGRAFX Designer 5
software was used to make the silhouette outline. The designer technician used the picture
with the measurements and drew the silhouette over it, and then extracted that silhouette to
an open space on a blank page template as shown on Figure 4.11. This was then exported
and saved as a *.jpg (jpeg) file. These steps were done on all the pictures’ views of back,
front and side. Once all the pictures were completed, the *.jpg (jpeg) files were then re-
inserted into Microsoft Word 2003 for accessibility and presentation in a versatile format.
FIGURE 4.11: SILHOUETTES EXTRACTED BY IGRAFX DESIGNER 5 SOFTWARE

127
From Photoshop, it was easy to evaluate each shape (photo) and assign it to one of the five
prevalent body shape categories (rectangle, hourglass, triangle, apple and inverted triangle).
The researcher prepared a comprehensive training manual and a body shape assessment
scoring sheet/scale to enhance trustworthiness and reliability of this study (evaluations of the
photographs). It was reasoned that accuracy in evaluations could be achieved if there were
some form of agreement between different evaluators and if they worked according to a
uniform method of assessment. Standardisation would be achieved once the universal body
shapes’ characteristics were identified and well understood. The development of the training
manual was therefore necessary to facilitate some form of uniformity and standardisation
between different evaluators in their assessments of the body shapes. According to Fan (in
Fan et al., 2004:28), assessors who do subjective assessments may have different internal
assessment scales to rate an observation; therefore, it is vital to train them so as to bring
each member of the panel as near to the same, standard scale as possible. Based on a
thorough literature search and the outcomes of the preliminary preceding steps of the female
body shape assessment formula, it became possible to develop a comprehensive training
manual for the purposes of developing an assessment scale (Appendix 3D).
Evaluating females’ body shapes by professional evaluators
Slater (1997) highlights that in subjective assessment, results could be affected by factors
such as the subject’s personality, skills, state of mind and health. In order to ensure utmost
validity and reliability of this method of study, the quality of the evaluators, the assessment
procedure, the assessment scaling and the analysis methods were carefully considered. It
has been pointed out that using trained professional assessors ensures that the differences
perceived are smaller (Slater, 1997). An expert panel in a testing atmosphere works as a
sensitive test instrument, capable of providing valid and reliable responses to the sensations
being studied (ASTM, 1981:5). This implies that well-trained professional evaluators would
give more reliable judgements.
Three judges are recommended for reliability in any subjective assessments only, if visual
parameters are established and clearly defined for the judges (AATCC, 1999; Fan & Liu,
2000: Lyman-Clarke, Ashdown, Loker, Lewis & Schoenfielder, 2005). The training and the
subsequently developed assessment scale, in this case, set out clearly defined body
characteristics, which served as visual parameters. In this study, two professionals in the
field of apparel design and manufacture were believed to be experts and qualified enough for
the assessment of the body shapes in this study. Their professional experience ranged from
14 to 25 years of field experience, respectively. However, as both evaluators were experts in
apparel design and manufacture, which involves an understanding of the human figure and

128
translating it into apparel, each evaluator independently studied the training manual and
practised with similar stimulus material (sample photos). This helped them to understand the
clearly defined visual parameters necessary for the assessment of the images. The
professional evaluators later met to resolve any misunderstanding arising from the training
manual and to develop an assessment scale sheet (scoring sheet). This provided a
standardised and sequential way of assessing and recording evaluations of the photos.
Development of an assessment scale/sheet: According to Trochim (2005:49),
measurement is a process of observing and recording the observations that are collected as
correctly and precisely as possible. However, the measurements must be both reliable and
valid. Having consulted the comprehensive training manual and the literature on female body
shape scales (Armstrong, 1995; Rasband & Liechty, 2006:19-30; Connell et al., 2006:80-94),
the two professional raters in collaboration with the researcher, developed the assessment
scale (Appendix 3D). It has been reported that an assessment scale – like any other
measuring instrument – should be devised very carefully, ensuring that all the important
elements of the study are well covered to ensure its reliability (Fan in Fan et al., 2004:28).
The assessment scale/scoring sheet covered all the areas of the female body shapes’
characteristics that were deemed critical to the fit of ready-made apparel (all that emerged in
the preceding steps).
For the purposes of inter-rater reliability, and due to uncertainty in deriving a valid scale, the
researcher and the evaluators decided to use ordinal measurements for all the items where
attributes such as small, medium and large were assigned points according to the order of
their sizes. A point system was used (1 = small, 2 = medium, 3 = large and 4 = extra large).
In cases where assessors were unable to differentiate between two attributes (choices given
in the assessment form), they could select an adjacent choice, which is still close to the
actual choice. If evaluators were to differ in agreement between attributes (choices given),
they would do so because adjacent choices are not far from each other (Connell et al., 2006;
Fan in Fan et al., 2004:28-30).
Evaluation of female body shapes using the assessment scale: With the use of the
evaluation guiding principles highlighted in the training manual and the assessment scale,
the two trained professional experts evaluated all 89 sets of photos within 7 to 14 days. The
data was analysed and inter-rater reliability tests were performed using Kappa statistics, to
estimate the degree of consistent agreement between the two raters. After inter-rater
reliability tests and data analysis had been done, it was observed that the degree of
consistent agreement between the evaluators had Kappa values that ranged from 0.2 to 0.9.
Landis and Koch (1977) suggest that Kappa values of 0.00 reflect poor agreement, 0.01-0.20

129
slight agreement, 0.21-0.40 fair agreement, 0.41-0.60 moderate agreement, 0.61-0.80
substantial agreement, and 0.81-1.00 almost perfect agreement. In this study, it was decided
to use a Kappa value of 0.75 as the cut-off point for acceptable agreement. This implied that
all the evaluations with Kappa values of > 0.75 were accepted, while evaluated attributes
with < 0.75 agreement were rejected on condition that they were to be further subjected to a
professional group of experts’ evaluations for a final decision. The group of experts
comprised three professionals who are experts in apparel design-related careers. Their
respective professional experience in the field of apparel design ranged from 10 to 20 years,
which ensured the reliability of their judgements.
Before the professional group of experts evaluated the photographs, they underwent one
day’s training on female body shapes evaluation techniques, using the comprehensive
training manual and the assessment scale/scoring sheet. During the training session, they
used similar stimulus material (sample photos) for practice. The training was to ensure that
they fully understood the sensory tests that they had to perform, and that they were familiar
with the specific knowledge required to actually perform the tests correctly. The training was
also aimed at improving their ability to recognise and identify the sensory attributes within the
body shapes, thus determining a level of consistency in evaluating visual differences which
may have escaped the first two expert evaluators (ASTM, 1981:18; Leibowtz & Post, 1982:3,
Bye & DeLong, 1994:5; Lyon et al., 2000).
The attributes that emerged with poor inter-rater reliability and were further subjected to the
professional group of experts for re-evaluation, were: the overall body shape’s identity, the
bust size/shape, the back curvature, both the hollow waist region and the rounded upper
section of the body, the shoulder slope and the two stomach shapes (“D” and “b”). Where
there was no agreement at all, all the members resolved the conflicting ratings and final
decisions were made. The bust shape/size and the stance of the figures proved difficult to
assess for all the members, and therefore it was decided to eliminate them from the study to
avoid biased results. The technique of using a professional group of experts for the
assessments and identifying of body shape and body characteristics has been applied in
similar studies such as the ones by Kuma, (1999); Lyman-Clarke et al. (2005) and Connell
et al. (2006:85-86).
Data analyses from the assessment scale: The scoring sheet had two sections to be used
by the evaluators and an official section with blank spaces corresponding to numerical
variables in the margins to facilitate the eventual ease of data entry and processing by the
computer (Babbie & Mouton, 2001:415-416). Scores obtained from the judges’ ratings were
entered in the corresponding blank spaces provided in the official section. The captured data
130
was compared with every completed assessment scale form to ensure that the information of
each questionnaire was correctly captured. Mistakes and errors that emerged were managed
and cleaned up (Babbie & Mouton, 2001:410-412; Trochim, 2005:211).
Quantifying the qualitative data from the scoring sheet, the last question in the assessment
scale/scoring sheet was semi-structured with pre-formulated questions that would summarise
the whole assessment scale. The panellists defined visual parameters of size and form for
the different females’ figures, measured their physical properties and assigned each body
shape to a category, based on the five prevalent body shapes (hourglass, rectangle, apple,
inverted triangle and triangle) obtained from the literature. The assignments were done in a
qualitative sense through verbal descriptions, incorporating profile characteristics that were
common among the photos. These were used later to facilitate comparison between the
distinct body shapes emerging from the sample data and the prevalent Western body
shapes. The stimulus materials (photographs in different views), already pre-coded using
two-digit numbers, were described in terms of the body’s characteristics critical to apparel’s
fit. Although data analysis is a challenge in the qualitative paradigm, the last question of the
assessment scale was a summary of the preceding questions, and therefore categorising the
descriptions was made easy based on the previous existing terms within the scale. These
descriptions were edited and encoded so as to eliminate any errors before placing them into
meaningful categories, to facilitate easy tabulation and interpretation while computing.
The inter-rater reliability tests were performed to establish the degree of consistency of
agreement between the two evaluators, and so to measure or assess the reliability and
trustworthiness of the study. The value of a reliability estimate should indicate the proportion
of variability in the measure attributable to the true score. A reliability score of 0.5 would
indicate that about half of the variance of the observed score is attributable to truth and half
is attributable to error (Trochim, 2005:62). According to Rust (2001), using percentages
between judges is not the best method, as it allows some agreement to occur by chance,
and if the numbers of categories were fewer, it would even make reliability appear better than
it really was. Therefore the Kappa coefficient of agreement between the two raters was
calculated as recommended by Rust (2001), to determine the reliability or consistency of
agreement between the raters. The results showed Kappa values that ranged from 0.24795
to 0.9460, indicating very poor to very strong inter-rater reliability between the two raters
(Landis & Koch, 1977). Significance tests with Kappa (p < 0.0001) suggested that there was
no complete disagreement between the two evaluators. As earlier discussed, where the
inter-rater reliability was below the Kappa value of 0.75, the researcher decided to subject
them to the professional group of experts’ evaluations.

131
The Kappa statistics: Kappa measures the percentage of data values in the main diagonal
of the table and then adjusts these values for the amount of agreement that could be
expected due to chance alone (Landis & Koch, 1977; Simon, 2005). It provides a measure of
inter-rater reliability by focusing on the diagonal variables in a table to see whether it contains
more counts than is expected by chance (Dixon, 1992:286). It compares the agreement
against that which might be expected by chance. Kappa can be thought of as the chance
minus the corrected proportional agreement, and its possible values range from +1.00
(perfect agreement) via 0.00 (no agreement above that expected by chance) to –1.00
(complete disagreement) (Chuang, 2001). Reliability with Kappa statistics is essentially the
extent of the agreement between repeated measurements, and validity is the extent to which
a method of measurement provides a true assessment of that which it purports to measure.
The following formula was used in this study. Statistical significance associations of Kappa is
based on a zero (complete disagreement between the two evaluators), thus there is high or
significant correlation when the p-value ≤ 0.05.
Kappa = (O – C) . (1 – C) O = Observed agreement, C = Chance agreement
Operationalisation for phase one
The central concepts on the identification of body shape were expressed in the research
framework, and the theoretical definitions for the concepts concerning females’ body shapes
and apparel fit implications were given in Chapters 2 and 3. The concepts related to the
identification of body shape were also indicated clearly on the body measurement form, the
photographing guidelines (Figure 4.6) and the body shape assessment scale. Theoretical
clarity and descriptions of the relevant concepts help to facilitate the development of
measures or activities that allow the researcher to observe the construct empirically
(Neumann, 2000:160; Babbie & Mouton, 2001:128).
It was also important to assess the pattern of prominent body shapes’ characteristics, such
as the rounded upper back, hollow back waist and the stomach shape between different age
groups (Objective 3). Chi-square tests and Fisher’s exact statistical testing of hypotheses
were performed; where the null hypothesis (Ho) states that there is no significant association
between prominent body characteristics and age group (young adults of 25–32 years,
middle-aged 33–40 years, and mature 41 and above). The alternative hypothesis (Ha) states
that there is a significant association between prominent body characteristics and age group
(young adults, middle-aged and the mature). Acceptance of the alternative hypothesis would

132
indicate that prominent body shapes’ characteristics among different age groups differ and
hence their apparel fit needs would also differ.
Table 4.3 on the next page indicates how the primary objectives and successive sub-
objectives for phase one were operationalised.
TABLE 4.3: OPERATIONALISATION OF PHASE ONE DATA IN TERMS OF PRIMARY OBJECTIVES, SUB-OBJECTIVES AND STATISTICAL METHODS
Primary objective 1 To identify and describe distinctive female body shapes of career women in Kenya from body dimensions and photographs
Sub-objectives Null Hypothesis Statistical analyses
1.1 To identify and describe distinctive female body shapes of career women in Kenya from the body dimensions
There will be no significant association between bust size from bust extensions’ dimensions and cup sizes.
Descriptive statistics, uni-variate, bi-variate, means, standard deviations, and range values. Hypothesis testing was not possible due to sparse cells in some categories; therefore, descriptive methods (frequencies and percentages) were used.
1.2 To identify and describe distinctive female body shapes of career female in Kenya from photographs
There will be no significant associations between one evaluator’s assessment concerning body shapes and body characteristics, and the other evaluator’s assessments of body shapes and body characteristics. There will be no significant associations between the distinctive body features and the age group of the career women.
Trained experts’ sensory (visual) analyses, inter-rater reliability using Kappa statistics. Professional group of experts’ evaluations were used where the Kappa value was < 0.75. Hypothesis testing was done at a 5% level of significance.
1.3 To establish and describe associations between the distinctive shapes emerging from body dimensions and those emerging from the photographs of the career women
There will be no significant associations between the distinct body shapes emerging from body dimensions and those emerging from the photographs.
Hypothesis testing was not possible due to sparse cells in some categories; therefore, descriptive methods (frequencies and percentages) were used.
Primary objective 2 To distinguish and describe differences between the emerging distinctive body shapes (from measurements and photographs) and the Western distinctive body shape. Statistical analyses Descriptive methods (frequencies and percentages) Primary objective 3 To scrutinise and describe the implications for apparel’s fit associated with the emerging distinctive body shape of the career women Statistical analyses Descriptive methods (frequencies and percentages)
4.6.2 Data obtained from the second phase of the study (Questionnaire – Objectives
4, 5 and 6)
The researcher ensured that the questionnaire transcripts were all available and usable, as
suggested by Neumann (2000:419). The questionnaires were coded manually and the data

133
was then electronically entered and captured at the Department of Statistics, University of
Pretoria.
The captured data was compared with every completed questionnaire to ensure that the
information of each questionnaire was correctly captured. Mistakes and errors that emerged
were managed and cleaned up. Babbie and Mouton (2001:417) state that “no matter how or
how carefully the data has been entered, some errors are inevitable”. Although efforts were
made to avoid errors arising from the data, it was not possible to eliminate them completely.
All the coded data was entered into the computer. This enabled the researcher and the
statistician to pinpoint errors and eliminate them. Most of the errors found were as a result of
incorrect coding and incorrect reading of written codes on the questionnaires. Babbie and
Mouton (2001:417) highlight two possible types of cleaning that may be undertaken, namely
possible-code cleaning and contingency cleaning. For this particular study, both cleaning
methods were applied.
Possible-code cleaning: Question 5 needed two answers (Appendix 1A). Participants
were asked to report whether the terms provided (junior, junior-petite, women’s, women’s
petites and misses) were familiar to them, and they had to give an answer in one section and
to give the meanings of the terms in the adjacent section. The variables for this question
were the familiarity of terms, which was coded with 1, and the meaning of the size label
terms, which were coded with 1 (for correct answer) and 2 (for incorrect answer). The third
option of “none of the above is familiar” was coded with 3. The three different codings got
mixed up, with 3, 2 and 1 entered in the wrong places. The distribution of responses to each
item in the data was examined, the problem identified and the necessary corrections were
made.
Contingency cleaning: Question 1 (Appendix 1A). The year of birth was to be coded as it
was reported. The study was limited to career women aged between 25 (career starting
point) and 55 (age of retirement). Out of 201 questionnaires administered, the following years
of birth emerged from the data, 1982 (23 years), 1985 (20 years), 0 years and 1987 (18
years). Considering the age limits set for the study and having conducted the research, there
was nobody among the participants who appeared under-age or over-age within the set
limits of this study. It was assumed that respondents did not want to disclose their ages. In
this case, all the affected ages were excluded from the study because age, as demographic
factor in this study was not the main focus of the study, therefore it was reasoned that it
would not significantly affect the results. There were other cases where age was left blank
completely, so these were treated as blank also. All the necessary changes were made and
data that was not applicable for the present study was ignored.

134
Data management is important because it is done to enable the researcher to organise and
bring meaning to large amounts of data (Bailey, 1994:339; Miles & Huberman, 1994: 428-
430). It becomes pointless if one cannot understand the data presented, thus the necessity
to actually simplify and refine the information by summarising the data into few, but
holistically legible/interpretable categories (Babbie & Mouton, 2001:428). Collapsing or
combining categories that have a very close denotation when interpreted, could achieve
more legible and interpretable presentations. If the information to be reported does not
essentially require precise difference between two terms that have very close connotation
such as “very good” and “good”, it would be wise to combine the two terms for the purposes
of simplifying the presentation further (Babbie & Mouton, 2001:430). The terms used in this
study with close connotation and where it was felt that their precise differences did not matter
in the presentation, were combined. Those terms included: “excellent” and “good” in
questions 3 and 4 of the questionnaire, “extremely effective” and “effective” in question 18 of
the questionnaire, “more often” and “often” in question 19 of the questionnaire, “strongly
agree” and “agree” in question 20 of the questionnaire, and “most frequent” and “frequent “ in
question 21 of the questionnaire. The initial five-point scales were then collapsed into four-
point scales after the related variables were combined.
Babbie and Mouton (2001:429) suggest that it would be advisable to give respondents the
option of saying, “don’t know” or “no opinion”. However, in cases where knowledge was
being tested as in questions 5-8, 11-14, 16 and 17 of the questionnaire, the option of “don’t
know” was provided, but some respondents decided to leave the question unanswered. In
such cases, the researcher decided to combine all the “don’t know” options together with the
blanks and they were all treated as “don’t know”. The reduction and streamlining of the data
were done for the purposes of greater clarity. To facilitate meaningful conclusions, brief and
precise, systematic presentations of legible and essential data that represents only the
objectives and concepts of this study, were used. All the necessary changes were made
while data that was deemed not applicable for the present study was ignored. Nonetheless,
detailed raw data and tables of the entire questionnaire are available as hard and soft copies
in the researcher’s data files, while electronic versions are also available in the database of
the Department of Statistics, University of Pretoria.
After data cleaning and management were done, the data was statistically analysed, using
appropriate statistical methods. Descriptive statistics (frequency distributions) were used to
describe basic patterns and the relationships among variables. They were used to
summarise and organise sets of sample observations for easier comprehension. Pearson’s
correlation coefficient was used to establish meaningful associations between variables such
as reported body key dimensions with the actual measurements obtained from the

135
participants. Chi-square and Fisher’s exact tests were used interchangeably to investigate
significant associations between two categorical variables.
4.6.2.1 Explanations of statistical methods used for the second phase
The choice of statistical measures in a given circumstance depends on the number of
variables involved, the measurement scales used and the nature of the relationships
between variables (Agburu, 2001:85). The ultimate goal of most statistical tests is to evaluate
the observed relationships by comparing them to the maximum imaginable relationship
between those specific variables – comparing what is common in those variables to what
potentially could have been common if the variables were perfectly related (Mamahlodi,
2006). In this study, the SAS statistical program, which calculates exact probabilities for each
statistic, was used for all the statistical analyses carried out. The exact probabilities can be
directly compared to the 0.05 cut-off value, with a p-value ≤ 0.05 indicating statistical
significance.
The statistical significance of a result is the probability that the observed relationship (e.g.,
between variables) or a difference (e.g., between means) in a sample occurred by pure
chance ("luck of the draw"), and that in the population from which the sample was drawn, no
such relationship or difference exists. In other words, stating the statistical significance of a
result tells us something about the degree to which the result is "true" (in the sense of being
"representative of the population") (Babbie & Mouton, 2001:487). The value of the p-value
represents a decreasing index of the reliability of a result; the higher the p-value, the less we
can believe that the observed relationship between variables in the sample is a reliable
indicator of the relationship between the respective variables in the population. A p-value of
0.05 is customarily treated as a "border-line acceptable" error level (Ryan, 2005). Due to the
exact probabilities calculated by the SAS computer program, it was not necessary to
determine critical values for the statistics (Chi-square, Pearson’s correlation coefficient and
Kappa) applied in this study. However, brief explanations on how each of the statistical
methods brings about the results, are given below.
Chi-Square statistics: A Chi-square (X2) test is used to investigate whether distributions of
categorical variables differ from one another as it compares the tallies or counts of
categorical responses between two (or more) independent groups. It evaluates the
significance of the discrepancy between the observed and expected results in research, and
it assumes that the participants were randomly selected and that the expected frequencies
are not very low. Chi-square tests can only be used on actual numbers and not on
percentages, proportions or means. There are several types of Chi-square tests, depending

136
on the way the data was collected and the hypothesis being tested. However, it analyses
responses based on nominal (Yes or No responses) or categorical (Likert-type scales)
questions, and it was tested at the 5% level of significance in the case of this study (Warrack,
2000; Babbie & Mouton, 2001:481; Ryan, 2005).
Calculation of Chi-square (X2) used the following formula for this study:
X2 = Σ[(O – E – 0.5)2/E]
O = Observed responses E = Expected responses
The Fisher’s exact test: This test is an extension of the Chi-square test, and may be used
when the numbers of responses in some categories are low, particularly when the expected
number of responses is not more than 5 – as required by the Chi-square test. It is tested at
the 5% level of significance (Agburu, 2001:140).
Pearson’s correlation coefficient: The correlation coefficient is a numerical measure of the
degree or extent of relationship between variables (Agburu, 2001:149, 153). The coefficient
of correlation, r (product moment correlation coefficient) ranges from –1.00 (perfect negative
correlation) through 0.00 (no correlation) to +1.00 (perfect positive correlation) (Wegner,
1998:311-312). In this study, it implied relationships between the measured key dimensions
of the career women and the self-reported key dimensions. These were considered as
having good correlation when the correlation value was greater than 0.6, which is above the
mid-point between 0.00 (no correlation) and +1.00 (perfect positive correlation). Testing the
significance of a correlation is actually testing whether the real correlation is at zero or not.
When at zero, it means that there is absolutely no correlation between two variables. The
following formula was used for this study:
r = NΣXY – (ΣX)(ΣY) . √NΣX2 – (ΣX)2 x √NΣY2 – (ΣY)2
N = Number of paired (obtained and reported measurements) ΣX = sum of all the obtained measurements ΣY = sum of all the reported measurements

137
4.6.2.2 Operationalisation for phase two data (Questionnaire)
The central concepts were expressed in the research problem and the research framework.
Theoretical definitions for the concepts concerning the fit problems that career women are
experiencing with ready-made apparel, their knowledge about the communication of size
(body dimensions) and fit (body shape), and their fit preferences for differently fitted jackets
and skirts, were given in Chapters 1, 2 and 3. As was mentioned, theoretical definitions and
descriptions of relevant concepts help to facilitate the development of measures or activities
that allow the researcher to observe the construct empirically (Neumann, 2000:160; Babbie &
Mouton, 2001:128).
To determine the general fit problems encountered by career women with ready-made
apparel (Objectives 1 and 4), it was necessary to investigate their perceptions of fit with
different apparel categories and apparel sold in varied retails stores in Kenya. It was also
important to examine the body shape characteristics (of the distinctive body shapes that
emerged from phase one), and to compare these with the career women’s reported frequent
fit problems at critical fit points and also with their fit preferences. Statistical testing of
hypotheses were performed; where the null hypothesis (Ho) is that there will be no significant
associations between the fit of different ready-made apparel categories (imported, second
hand and local). The alternative hypothesis (Ha) stated that there would be a significant
association between the fit of different ready-made apparel categories (imported, second
hand and local). Acceptance of the alternative hypothesis would indicate that the ready-made
apparel categories in Kenya have similar fit problems, and therefore that fit problems could
be addressed from a collective point of view, rather than addressing specific categories
differently. Another null hypothesis (Ho) to be addressed is that there would be no significant
association between career women’s fit problems at critical fit points and the emerging
distinct body shape characteristics that are critical to the fit of apparel. The alternative
hypothesis (Ha) states that there would be a significant association between the career
women’s fit problems at critical fit points and the emerging distinctive body shapes’
characteristics that are critical to the fit of apparel. Acceptance of the alternative hypothesis
would indicate that the fit problems that the career women frequently encounter could be due
to their body shape characteristics deviating from the characteristics of the so-called fit
model/ideal shape.
To determine career women’s lack of knowledge about the communication of size and fit
(Objective 5), it was important to compare the knowledge of those consumers who had
professional backgrounds of Home Science or Clothing and Textiles, to those without any
such professional background. This required the testing of statistical hypotheses, where the

138
null hypothesis (Ho) was that there would be no significant association between professional
backgrounds in Home Science/Clothing and Textiles and knowledge about the
communication of size and fit. The alternative hypothesis (Ha) states that there would be a
significant association between professional backgrounds in Home Science/Clothing and
Textiles and knowledge about the communication of size and fit. Acceptance of the
alternative hypothesis would indicate that educating career women on the communication of
size and fit would be valuable in their selection of ready-made apparel that would be better
fitting and appropriate for their varied body shapes and sizes.
To be able to determine career women’s fit preferences for differently fitted apparel
(Objective 6), it was necessary to examine consumers’ fit preferences among different age
groups (young, middle-aged and mature). To establish whether different age groups would
require differently fitted apparel items, the null hypothesis (Ho) was that there would be no
significant association between the different age groups and their fit preferences for
differently fitted apparel items. The alternative hypothesis (Ha) is that there would be a
significant association between age group and fit preferences for differently fitted apparel
items. Acceptance of the alternative hypothesis would indicate that different age groups
require differently fitted apparel items and therefore, the apparel industries as well as the
retailers should cater for these different needs.
Table 4.4 on the following page, indicates which objectives were used to test the
hypotheses. Specific questions related to different sub-problems are also indicated, as well
as the types of statistical measures used for the analysis.
TABLE 4.4: OPERATIONALISATION OF THE PHASE TWO DATA (QUESTIONNAIRE)
Primary objective 4 To assess the general fit problems that career women encounter with the ready-made apparel in Kenya
Sub-objectives Null Hypothesis Statistical analyses
4.1 To investigate career women’s perception of fit with different apparel categories that are sold in varied retails stores in Kenya (Questions 3 and 4)
There will be no significant associations between the career women’s perceived fit of ready-made apparel categories that are sold in different retail stores.
Hypothesis testing was not possible due to sparse cells in some categories; therefore, descriptive methods (frequencies and percentages) were applied.
4.2 To describe fit problems that career women in Kenya encounter regarding specific critical fit points of different parts of their bodies (Question 22)
There will be no significant associations between the reported fit problems and the critical fit points of different parts of career women’s bodies.
Chi-square and Fisher’s exact test. Fisher’s exact test was used where the Chi-square statistical test could not be applied, and descriptive methods were also used where statistical analysis was not possible due to sparse cells in some categories. Hypothesis testing was done at a 5% level of significance.

139
4.3 To describe career women’s satisfaction with the process of finding appropriate ready-made apparel items in Kenya (Question 21)
There will be no significant associations between career women’s satisfaction with ready-made apparel selection, the way most apparel fit their sizes and the shapes and availability of latest fashion in their sizes.
Hypothesis testing was not possible due to sparse cells in some categories, therefore descriptive methods (frequencies and percentages) were used.
4.4 To explore career women’s perceptions concerning the sources of fit problems in Kenya (Question 19)
There will be no significant association between career women’s perceptions concerning their body shape as the source of fit problems and their perception concerning the apparel industry as the source of the fit problems.
Chi-square and Fisher’s exact test: Fisher’s exact test was used where the Chi-square statistical test could not be applied. Hypothesis testing was done at a 5% level of significance.
Primary objective 5 To determine and describe Kenyan career women’s knowledge about the communication of size (key body dimensions) and fit (body shapes) Sub-objectives Hypothesis Statistical analyses
5.1 To explore Kenyan career women’s knowledge about the communication of size (Questions 6, 13, 14, 15, 16, 17 and 18)
There will be no significant associations between the home science profession and knowledge of size (labels and key body dimensions. There will be no significant associations between age group, knowledge about and familiarity with size labels.
Chi-square and Fisher’s exact test: Fisher’s exact test was used where the Chi-square statistical test could not be applied, and descriptive methods were also used where statistical analysing was not possible due to sparse cells in some categories. Hypothesis testing was done at a 5% level of significance.
5.2 To explore Kenyan career women’s knowledge about the communication of fit concepts (Questions, 5, 7, 8, 9, 10, 11, 12)
There will be no significant associations between the home science profession and knowledge about fit concepts (labels and body). There will be no significant associations between age group, knowledge about familiarity with size labels.
Chi-square and Fisher’s exact test and Pearson’s correlation coefficient: Fisher’s exact test was used where the Chi-square statistical test could not be applied, and descriptive methods were also used where statistical analysing was not possible due to sparse cells in some categories. Hypothesis testing was done at a 5% level of significance.
Primary objective 6 To determine and describe career women’s fit preferences for differently fitted apparel items in Kenya Sub-objectives Hypothesis Statistical analyses
6.1 To assess and describe career women’s preferences for differently fitted skirts in Kenya (Question 19)
There will be no significant associations between age group and fit preference for differently fitted skirts. There will be no significant associations between career women’s critical fit points and their fit preferences for differently fitted skirts.
Chi-square and Fisher’s exact test: Fisher’s exact test was used where the Chi-square statistical test could not be applied, and descriptive methods were also used where statistical analysing was not possible due to sparse cells in some categories. Hypothesis testing was done at a 5% level of significance.
6.2 To assess and describe career women’s preferences for differently fitted jackets in Kenya (Question 19)
There will be no significant associations between age group and fit preferences for differently fitted jackets. There will be no significant associations between career women’s critical fit points and their fit preferences for differently fitted jackets.
Chi-square and Fisher’s exact test: Fisher’s exact test was used where the Chi-square statistical test could not be applied, and descriptive methods were also used where statistical analysing was not possible due to sparse cells in some categories. Hypothesis testing was done at a 5% level of significance.

140
4.7 QUALITY OF THE DATA 4.7.1 Validity and reliability of phase one data (body dimensions and photographs –
Objective 1)
4.7.1.1 Body dimensions
While preparing for the field study, the researcher consulted professional anthropometrists,
from the Company of Ergotech-South Africa, for training in body measuring techniques,
particularly in identifying and locating landmarks on the body, and how to take the
measurements accurately. The training was based on the standardised anthropometric
measuring techniques, using appropriate (recommended) measuring instruments (Beazley,
1996; ISO, 1990; RMSS, 1994).
The researcher underwent further training in the form of an Anthropometry Accreditation
Course (AAC) – level one (Appendix 3C). The course consisted of both theory and practical
sessions on landmarking and measuring the human body. The techniques used were based
on the International Standards for Anthropometric Assessment (ISAK, 2001). The
measurements that were taken were carefully prepared (after consultation with professionals
in the field of apparel – study leaders and Ergotech experts), consulting different literature
and different anthropometric standards. Traditional anthropometry together with specific
tailoring techniques of taking body dimensions have been used in many studies (stipulated in
most sizing standards), and also ensured reliability and validity of this study (Winks, 1997;
Beazley, 1998; Simmons & Istook, 2003). The same approach was adopted in this study,
which strengthened its reliability and validity.
4.7.1.2 Photography and sensory evaluation methods
Before commencement of the fieldwork, the researcher underwent photography training,
which was administered by a professional photographer. The objectivity and trustworthiness
of this study were enhanced by purposefully sampling (negotiations) techniques used while
selecting the samples for obtaining measurements and photographs. Selecting, training, and
screening the judges for evaluating body shapes based on their professional skills and long-
term service also ensured trustworthiness of the outcome. Using a comprehensive training
manual and an assessment scale, which was subjected to an inter-rater reliability test, further
enhanced the reliability of this study as recommended by Trochim (2005:62).
The standardised photographing studio with a predetermined distance and various guiding

141
points, the standardised photographing techniques with the predetermined, standardised
focus point, the position, the dress code and postures of the subjects while being
photographed and the positioning of the camera, also enhanced the reliability of the
photographs.
Inter-subjectivity of phase one data: Objectivity regarding the qualitative approach refers
more to the generation of truthful and credible inter-subjectivity than the control over external
variables (Babbie & Mouton, 2001:273; Fouché in De Vos, 2002:274). The researcher is
central to the research process, and in being responsible for the collection of primary data
(through taking body dimensions and photographs), is in a sense the primary research
instrument; the researcher therefore developed a strong rapport and relationship of trust with
the participants. This was done to gain access to them, and to avoid making biased
descriptions and interpretations later on. The challenges encountered in the field, as stated
earlier, enabled the researcher to be more vigilant and attentive to the sensitive techniques
of approach, and to develop more versatile techniques that were suitable to every group of
people approached for the study.
Triangulation of phase one data: The researcher and trained assistants used different
methods of data collection (taking body dimensions and photographing for the purposes of
identifying distinct body shapes from the sample data). Body measurement techniques
alongside photography, involved the use of standardised measuring instruments and
standardised photographing techniques. Both the techniques were aimed at distinguishing
the most prevalent female body shapes more exhaustively as opposed to using only one
technique. The use of a digital camera to capture images of different views and the different
measuring instruments also facilitated accurate capturing of data in this study.
4.7.2 Validity and reliability of phase two data (Questionnaire – Objectives 2, 3 and 4) 4.7.2.1 Reliability
Pilot-testing was carried out on professional experts and some career women in South Africa
and then adjustments were made from the responses. Another pilot study was conducted in
Kenya, on a convenient sample of career women, to further determine the clarity of
instructions, items, language, and the time taken to complete the exercise. This facilitated
further corrections and adjustment of items accordingly, before the actual field events. The
group that the questionnaire was pilot-tested on, for example, did not understand the term
“custom-made”, thus it was translated to a Kiswahili (Kenya’s national language) term of
equivalent meaning (“Fundi”). This was provided in brackets next to the term “custom-made”,

142
as suggested by Neumann (2000:138-141).
4.7.2.2 Validity
In order to ensure that the measurements accurately reflected the concepts they intended to
measure (measurement validity), the following different types of validity were observed in the
questionnaire instrument for the purposes of Objectives 4, 5 and 6:
Face validity: The instruments were subjected to the scrutiny of members of the scientific
community (study leaders, experts in the apparel profession, and the statistician).
Questionnaires were also subjected to a group of career women as a pilot test, to ensure that
the measurement items, actually measured what they purported to measure. For this study,
only those items were used that measured fit problems of females’ ready-made apparel
(Mouton, 1996:111; Delport in De Vos, 2002:167).
Content validity: Measures used in ensuring content validity represented all the concepts in
the conceptual framework presented in Chapter 3 (Figure 3.24). The contents were
specified in a construct definition, while sampling was done from all areas of the definitions,
and then indicators were developed from all the parts of the definitions, as recommended by
Neumann (2000:142-143) and Babbie and Mouton (2001:122-123).
Criterion validity: Due to the lack of standardised criteria to measure the construct validity
accurately and to compare with measurements for this study, the researcher selected the
experts in the apparel profession with specific skills and knowledge (characteristics related to
the phenomenon in question), and predicted how they would score (very high or very low)
versus the construct (Neumann, 2000:144).
Construct validity: To determine the degree to which the instruments used for this study
successfully measured the theoretical construct that they intended to measure, definitions
with clearly specified conceptual boundaries were provided (Figure 3.24 and Table 4.1) to
isolate the convergent validity. This implies that multiple measurements of the same
construct are related, or operate in similar ways (mutually exclusive and exhaustive attributes
(Mouton, 1996:111; Neumann, 2000:144; Delport in De Vos, 2002:167-168).
4.8 ETHICS AND POLITICS
Based on the scientific epistemology, a research project must be as accurate and truthful as

143
possible (Bless & Higson-Smith, 2000:11). However, because scientific research is a source
of power, it could easily be abused (Neumann, 2000; 443). The process and results of the
research require strict ethical choices and careful thought on the part of a social researcher
(Babbie & Mouton, 2001:256; Apeagyei et al., 2007). For the purposes of this study, the
researcher observed the following measures:
4.8.1 Training
The researcher underwent training on research methodology, for the purposes of preparation
of the research proposal, data collection and presenting of the results. Since the researcher
was still inexperienced, the preparation of the research proposal, data collection instruments
and analyses and presentation of the data were supervised by two senior research
professionals as well as experts in the field of apparel design and manufacture (study leader
and core study leaders). In preparation for the data collection, the researcher underwent
anthropometry and photographic training sessions to equip her with the necessary
knowledge and skills to photograph and take body measurements. This ensured that the
research project that was undertaken, was professionally conducted – as highlighted by
Neumann (2000:444) and Babbie and Mouton (2001:5).
4.8.2 Plagiarism
The researcher did not under any circumstances indulge in scientific misconduct such as
plagiarism or fraud regarding other people’s work. The procedures laid down for citation and
quoting other people’s words have been observed carefully, and the authors of referenced
literature were acknowledged throughout the research process (Neumann, 2000:445).
4.8.3 Participants’ privacy All the participants involved were consulted and comprehensive explanations of the
objectives of the study were given during the negotiation stage. Hygiene and health issues
were observed so as not to violate the participants during this study. A strong rapport was
also established with the participants before commencing the activity and throughout the
measurement and photographing exercises. Participants’ faces were masked to ensure that
their privacy was not violated. Their rights were fully respected and their permission obtained
whenever necessary. Permission to take their photos and measurements were obtained
before the research commenced (Bless & Higson-Smith, 2000:12; Babbie & Mouton,
2001:522; Apeagyei et al., 2007).

144
The leotards/body suits that were used by the participants while being measured were
laundered after each use and sealed in plastic papers before re-issuing to the next persons.
In cases where a participant demanded total hygiene, the researcher provided a new leotard.
The researcher washed her hands after every measurement to ensure hygiene for the next
participant as well as for herself.
4.8.4 Accountability The results of the study will be made available to the scrutiny of the scientific community and
thereafter will be disseminated for public use. Since the researcher is accountable to both a
sponsor and her employer, the researcher will provide copies of the thesis to them too, as
recommended by Babbie and Mouton (2001:526-527).
Data analyses and discussions of the findings of this study are presented in Chapters 5 and
6.

145
Chapter 5
DATA ANALYSIS AND DISCUSSION OF THE FINDINGS BASED ON PHASE ONE DATA (BODY DIMENSIONS AND PHOTOGRAPHS)
5.1 INTRODUCTION
This study employed manual anthropometric techniques of obtaining body dimensions as the
cheapest method available at the time, and because the aim was to identify only a distinctive
body shape from the data collected from a small population. This chapter presents the
results, discussions and interpretations according to the primary objectives 1, 2 and 3 of this
study.
The body measurements in this study were taken from 123 career women aged between 25
and 55 years. The specific body measurements that were taken for this study have been
explained in chapter 4 paragraph 4.5.1.1 and shown in Figure 4.3, while rules that were
observed during the measuring process is also provided as an attached appendix at the end
of this thesis (Appendix 3B). 5.2 IDENTIFICATION AND DESCRIPTION OF DISTINCTIVE FEMALE BODY
SHAPE(S) OF CAREER WOMEN IN KENYA FROM BODY DIMENSIONS (PRIMARY OBJECTIVE 1 (SUB-OBJECTIVE 1))
Body dimensions have been viewed as the key players in the development of effective sizing
systems, and must reflect the height, sizes and body shape proportions of a target population
for better-fitting apparel (Beazley, 1998; Gupta & Gangadhar, 2004). Presented in Table 5.1
are the means, range values (maximum and minimum) and standard deviations calculated
for the purposes of identifying height and other body characteristics (Tables 5.1 and 5.2) that
may affect the fit of apparel. It should be noted that the classifications made in this study
were done within the context of the anthropometric data of this study.
5.2.1 Identification of height, bust extension, buttock extension, thigh bulge and the
arc dimensions categories The distributions of measurements for variables used in this study which includes; height,
bust extension, buttock extension, bust extension, thigh bulge and arc measures, were

146
summarized by use of the calculated central tendencies (mean values), dispersion (range
values) and the degrees of dispersions (standard deviation) (Tables 5.1 and 5.2). The
variables were placed into different categories as reflected by the degree of deviation (SD)
from the mean value. The standard deviation reflected the degree to which the values in a
distribution deviated from the arithmetic mean. Standard deviation is usually presented in
tandem with the mean (MMeeaann ±± SSDD)), because it is difficult to determine it’s meaning in the
absence of the mean (Bryman & Cramer, 1997:80-85).
TABLE 5.1: PERCENTAGE DISTRIBUTIONS OF HEIGHT, BUST EXTENSION,
BUTTOCK EXTENSION AND THIGH BULGE CATEGORIES (n = 123)
HEIGHT
Univariate analysis of height dimensions Mean SD Maximum Minimum
161.6 cm 5.6 cm 176.0 cm 148.0 cm
HHeeiigghhtt CCaatteeggoorriieess MMeeaann ±± SSDD CCoouunntt ((%%))
Short 148.8 cm to < 156.0 12 (10%)
Medium ≥ 156.0 cm to ≤ 167.6 cm 93 (75%)
Tall >167.6 cm to 176.0 cm (Max*) 18 (15%)
BUST EXTENSION Univariate analysis of bust extension Mean SD Maximum Minimum
16.0 cm 3.0 cm 23.0 cm 10.0 cm
BBuusstt eexxtteennssiioonn CCaatteeggoorriieess MMeeaann ±± SSDD CCoouunntt ((%%))
Small/flat 10.0cm (Min*) to < 13 cm 1 (0.8%)
Medium ≥ 13.0 cm to ≤ 19.0 cm) 24 (19.6%)
Large > 19.0 cm to ≤ 23.0cm (Max*) 98 (79.6%)
BUTTOCK EXTENSION Univariate analysis of buttock extension Mean SD Maximum Minimum
16.0 cm 3.0 cm 23.0 cm 9.0 cm
Buttock extension categories MMeeaann ±± SSDD CCoouunntt ((%%))
Small/flat 9.0 cm (Min*) to < 13 cm 3 (2%)
Medium ≥ 13.0 cm to ≤ 19.0 cm 36 (29%)
Large > 19.0 cm to ≤ 23.0cm (Max*) 84 (69%)
* Min = Minimum range value; Max = Maximum range value
Height: It has been reported as one of the critical dimensions when designing and
distributing apparel items to the correct marketplaces (Winks, 1997; Beazley, 1998; Gupta &
Gangadhar, 2004; Chun, 2007). The population in this study was classified into the three
different height groups, while body characteristics such as the bust, the buttocks, the thigh
bulge, shoulders and the body balance were each also classified into three categories on the
basis of how the range values deviated from the standard deviation (Table 5.1).

147
The different height categories were obtained by calculating the degree to which the values
in a distribution deviated from the arithmetic mean. Short category was arrived at by sorting
out all the values that fell below (<) the (Mean ± SD); the medium category was obtained by
identifying all the values that were equal (=) to the (Mean ± SD) and the tall category was
achieved by sorting out all the values that fell above (>) the (Mean ± SD) (Table 5.1) (Bryman
& Cramer, 1997:80-85; Gupta & Gangadhar, 2004). This classification technique was applied
in Beazley’s (1998) and Gupta and Gangadhar’s (2004) studies. Results about Height
categories (Table 5.1) show that the majority (75%) of the participants were in the medium
height category. It is important that the apparel industry take note of this percentage when
deciding on relative quantities in the different size/height categories in the design and
manufacture of ready-made apparel.
Bust and buttocks extensions: Circumferential dimensions such as the bust and the hips
are one-dimensional in character, and therefore it is difficult to assess the extent of the
protrusion of these features (bust/breasts and buttocks/derriere) from the measurements.
Therefore, bust and buttock depth dimensions were deemed necessary in this study to
determine the extension of the breasts size as well as the buttocks/derriere, respectively.
The prominence (degrees of extension) of the bust and the buttocks is known to affect the fit
of apparel at the bust and hip regions (Rasband & Liechty, 2006:194, 324).
FIGURE 5.1: BUST AND BUTTOCKS EXTENSIONS
The trunk line/side seam line (Figure 5.1) must be identified before commencing the
measurement exercise (also refer to Chapter 4, paragraph 4.5.1.1 and Figure 4.3). The
bust and the buttock extension measurements were taken with a segmometer instrument
(Figure 4.4) from the trunk line to the breast tips and the edge of the buttocks respectively.
Sliding callipers can also be used to obtain the same measurement.

148
The different bust and buttock extension categories were obtained by calculating the degree
to which the values in a distribution differ from the arithmetic mean. Small bust/buttock
extension = < (Mean ± SD); Medium bust/buttock extension category = (Mean ± SD) and the
large bust/buttock extension = > (Mean ± SD) ((Table 5.1) (Bryman & Cramer). The results
regarding buttock extension and thigh bulge categories in Table 5.1 also demonstrate that
the majority of the participants had a large bust (81%) and large buttocks (69%). The large
buttocks have fit implications around the hip, thigh and crotch line, while the large bust could
affect the fit of the garment around the bust region.
Thighs: Heavy or bulging thighs may be positioned and/or shaped differently, thus affecting
the fit of the apparel item either vertically or horizontally. If the thighs are fuller or thinner than
average, pants/skirts with a close fit will tend to either sag (form folds) as a result of very
loose fit, or will form wrinkles as a result of a tight fit (Rasband & Liechty, 2006:340). To
determine the thigh bulge dimension, the subjects were measured on two positions of the hip
region: one was taken at the normal hip position (trochanterion region) and the second hip
dimension was obtained at a position of approximately 10 cm below the normal hipline
(Figure 4.3).
The thigh bulge (Table 5.2) was determined by subtracting the hip circumference dimension
at the normal (trochantrion region) position from the measurement over (circumference) the
broadest region of the hips (highest thigh position) at approximately 10 cm below the normal
hip position. The different categories (Table 5.2) were obtained by calculating the degree to
which the values in the distribution differed from the arithmetic mean. In this study, small
thigh bulge = < (Mean ± SD); Medium thigh bulge = (Mean ± SD) and the large thigh bulge =
> (Mean ± SD) (Table 5.2) (Bryman & Cramer).
Shoulders: Shoulders act as the apparel’s “hanger", facilitating an aesthetic appearance as
the apparel drapes gracefully over the body. The size of the shoulders in relation to other
parts of the body, and their shape, will affect the fit of the apparel (Rasband, 1994:68-72).
The shoulder slope dimension was obtained by subtracting the shoulder height (shoulder to
ground) dimension from the nape to ground dimension.
The different shoulder categories were obtained by calculating the degree to which the
values in the distribution differed from the arithmetic mean. In this study, slopped shoulders =
< (Mean ±± SSDD));; normally shaped shoulders = (Mean ±± SSDD)) aanndd the squared shoulders = >
(Mean ±± SSDD)).. Results about shoulder shape categories (Table 5.2) clearly show that the
majority (67%) of the participants’ shoulders were normally shaped, which indicates that they
may possibly experience minimal shoulder fit problems

149
TABLE 5.2: PERCENTAGE DISTRIBUTIONS OF THIGH BULGE, SHOULDER CATEGORIES AND ARC AT KEY REGIONS (N = 123)
THIGH BULGE Univariate analysis of thigh bulge Mean SD Maximum Minimum
2.5 cm 2.0cm 6.0 cm 0.0 cm
Thigh bulge categories MMeeaann ±± SSDD CCoouunntt ((%%))
Small thigh bulge < 1.0 cm 1 (0.8%)
Medium thigh bulge ≥1.0 cm to ≤ 5.0 cm 102 (83%)
Large thigh bulge > 5.0 cm to ≤ 6.0 cm (Max*) 20 (16.2%)
SHOULDERS Univariate analysis of shoulder drop/shape Mean SD Maximum Minimum
3.5 cm 1.5 cm 7.0 cm 0.0 cm
Shoulder shape categories MMeeaann ±± SSDD CCoouunntt ((%%))
Squared < 3.5 cm 18 (14%) Normal ≥ 3.5 cm to ≤ 5.5 cm 81 (67%) Sloped > 5.5 cm to 7.0 cm (Max*) 24 (19%)
BALANCE/ARC Univariate analysis of arc dimensions MMeeaann SSDD MMaaxxiimmuumm MMiinniimmuumm
Front bust arc subtract back arc 8.0 cm 3.5 cm 22.0 cm 2.0 cm
Front waist arc subtract back waist arc 2.0 cm 3.0 cm 17.0 cm 0.0 cm
Back hip arc subtract front hip arc 9.0 cm 4 cm 28. 0 cm 0.0 cm
AArrcc ddiimmeennssiioonnss ccaatteeggoorriieess MMeeaann ±± SSDD CCoouunntt ((%%))
Small front bust 2.0 cm to < 4.5 cm 22 (17%)
Medium front bust ≥ 4.5 cm to ≤ 11.5 cm 81 (67%) BBuusstt lliinnee aarrccss
Large front bust > 11.5 cm to ≤ 22.0 cm (Max*) 20 (16%)
Small front waist < 0 cm (Min*) 2 (1.6%)
Medium front waist ≥ 0 cm to ≤ 5 cm 112 (91.1%) WWaaiissttlliinnee aarrccss
Large front waist > 5 cm to ≤ 17 cm (Max*) 9 (7.3%)
Small back 0 to < 5.0 cm 11 (9%)
Medium back ≥ 5 cm to ≤ 13.0 cm 103 (82%) HHiipplliinnee aarrccss
Large back > 13.0 cm to ≤ 28.0 cm (Max*) 11 (9%)
* Min = Minimum range value; Max = Maximum range value
Results regarding thigh bulge in Table 5.2 indicate that the majority (85%) of the participants
had moderately large thighs, which could result with fit problem around the hip, thigh and
crotch line.
Balance: A correct posture assumes a balanced alignment of all the parts of the body (back
and front) over each other, and could influence the physical attractiveness of apparel
(Rasband, 1994:13). The trunk line/side seam, also known as the balancing line, must be
identified before commencing the exercise (refer to Chapter 4, paragraph 4.5.1.1 and
Figure 4.3). Arc dimensions (measurements taken from the right-side trunk line to the left-

150
side trunk line, either at the front or the back) were taken at the key regions (bust, waist and
hip), to establish whether the postures/body shapes were balanced at these regions.
Ashdown, Choi, Milke and Raymond (2004) warn that body shapes with excessive lordosis
(swayback) or excessive kyphosis (hump back) cannot achieve the balanced side profile
view. Excessive fat deposits on any part of the body could also cause body imbalance. The
front part, for example, could contain more fat deposits than the back region, causing the
figure to assume a backward stance in an attempt to counteract the weight balance.
As for all the other body characteristics, the different arc categories were obtained by calculating the degree to which the values in the distribution deviated from the arithmetic
mean. Small arc = < (Mean ±± SSDD));; medium arc = (Mean ±± SSDD)) aanndd the large arc = > (Mean ±±
SSDD)).. Results about body’s balance categories at key body regions (Table 5.2): indicate that
the front bust (65%) and front waist (92.5%) arcs were moderately larger than the back arc at
the bust line and waistline regions, with strong correlations (r = 0.86) of both the back and
front arc dimensions at the bust line and the waistline back and front arc dimensions (r =
0.94). The back hip arc was moderately (82%) larger than the front hip arc, with also strong
correlations (r = 0.82) between the back arc and front arc measurements at hip regions. The
large upper torso’s front bust and waist imply that apparel worn by a woman with such shape
characteristics is likely to pull towards the front making the side seam skewed. At the hip
region, the apparel is likely to pull towards the back, thereby making the side seam skewed
towards the back. Statistically, the three back arc dimensions and the front arc dimension
showed no significant (0.0001< 0.05) associations.
TABLE 5.3: PERCENTAGE DISTRIBUTION OF BUST CUP CATEGORIES (n = 107)
CCuupp ccaatteeggoorriieess SSttaannddaarrddss wwiitthhiinn rraannggee vvaalluueess CCoouunntt ((%%))
A 0 to < 5.0 cm 0 (0%)
B ≥ 5.0 cm to < 7.0 cm 1 (1%)
C ≥ 7.0 cm to < 9.0 cm 6 (6%)
D ≥ 9.0 cm to < 11.0 cm 36 (33%)
DD ≥ 11.0 cm to < 14.0 cm 42 (39%)
E and above ≥ 14.0 cm to ≤ 28 cm 23 (21%)
Bust cup (Table 5.3): Cup size and brassière size are determined by the size of the breasts.
The dimension determining cup size is obtained by subtracting the under-bust dimension
from the bust circumference dimension at the fullest part (Solinger, 1988:77; Spillane,
1995:85). In this study, the differences between the under-bust dimension and the bust
dimension ranged from 5.00 cm to 28.00 cm. The cup sizes (Table 5.3) were then
categorised according to standards given by Spillane (1995:85), but within the range values
obtained by subtracting the under-bust dimension.

151
The results presented in Table 5.3 show that participants with cup size DD (39%) and above
(21%) were in the majority (60%), followed by participants with cup size D (33%).
Participants with cup size C and B were least represented. These figures may suggest that
Kenya’s career women experience tight fit problems at the bust region. Comparisons were
made between bust depth and cup size to determine whether they would yield similar results.
From the bust extension, there were 81% participants with large busts, while 60% of the
participants had cup size DD and above. However, both the techniques of identifying bust
size indicated that the majority of the participants had large bust sizes.
5.2.2 Body shape identification
Body shapes have in the past been classified into the prevalent five figure types (hourglass,
triangle, rectangular, apple and inverted triangle) by drop values. A drop value is the
difference between the hip circumference and the bust circumference or the difference
between the bust and the waist (Chun-Yoon & Jasper, 1993; Winks, 1997; Beazley, 1998;
Gupta & Gangadhar, 2004; Yu, 2004:185). In this study, the different body shapes were
defined based on the key dimensions: bust for the upper torso, waist for both upper and
lower torso, and the hip for the lower torso. However, since body shapes and proportions
vary with different countries and even regions within countries (Zwane & Magagula, 2006;
Shin & Istook, 2007; Honey & Olds, 2007), it was necessary to understand the parameters
from the literature that define and describe the five prevalent body shapes (hourglass,
triangle, rectangular, apple and inverted triangle). The identified descriptions were then used
to determine standards within the maximum and minimum (range values) dimensions of the
drop values calculated (Table 5.4) for the purpose of identification of the distinctive body
shape(s) of this study.
Specific drop values used for the categorisation of body shapes in this study are given in
(Table 5.4). Shin and Istook (2007) reported that the rectangular shape’s waist measures
nine inches (23 cm) less than the bust. Rasband and Liechty (2006:25-26) state that the
waist of the hourglass body shape measures over 10 inches (25 cm) less than the hip or the
bust. Using the range (maximum and minimum) dimensions of the drop values, in
combination with Shin and Istook’s (2007) and Rasband and Liechty’s (2006)
recommendations, it was possible to identify the different body shapes as presented in Table 5.4.

152
TABLE 5.4: PERCENTAGE DISTRIBUTION OF BODY SHAPES (n = 123)
BBOODDYY SSHHAAPPEE CATEGORIES Triangular and inverted triangle body shape categories
1st step: Triangle and Inverted triangle depend on bust and hip relationship and are opposite each other. Once these two body shapes were sorted out, they were not subjected further to waist and bust relationship
Univariate analysis of drop values Mean SD Maximum Minimum
Hip subtract the bust 5.6 cm 8.8 cm 26.0 cm -8.0 cm
Mean (5.6) +SD (8.8) = ≥ 14.0 cm to ≤ 26.0 cm (Max*) Triangle (Large hips)
Mean (5.6) - SD (8.8) = -8.0 cm (Min*) to > 3.2 cm
Inverted triangle (large bust)
2 (1.5%)
Apple, Rectangular and Hourglass shape
2nd step: Apple, Rectangular and Hourglass shape rely on bust and waist relationship, Rectangular = Waist 23.00cm less than the bust (Shin & Istook, 2007), Hourglass = waist 25 cm less than the bust (Rasband & Liechty, 2006). Categories were guided by the standards within the range values
Univariate analysis of Bust subtract the waist drop values 6.0 cm 13.0 cm 36.0 cm -13.0 cm
SSttaannddaarrddss wwiitthhiinn tthhee mmaaxxiimmuumm aanndd mmiinniimmuumm ddiimmeennssiioonnss ooff tthhee ddrroopp vvaalluueess BBooddyy sshhaappee CCoouunntt ((%%))
-13.0 cm (Min*) to ≤ 4.7 cm Apple (Large waist) 2 (1.5%)
> 23.0 cm to 36.0 cm (Max*) Hourglass (Narrow waist) 2 (1.5%)
> 4.7 cm to ≤ 23.0 cm Rectangular/
Straight (Average waist) 93 (74%)
* Min = Minimum range value; Max = Maximum range value
Table 5.4 clearly portrays that the rectangular body shape was the most (74%) prevalent
body shape in the sample, followed by the triangle body shape (21.5%). The other body
shapes (apple, hourglass and the inverted triangle) had the least representation of 1.5%
each. Since most ready-made apparel is manufactured based on the hourglass body shape
proportions, Kenya’s career women are therefore likely to experience fit problems with ready-
made apparel.
5.2.3 Height proportions
The ideal shape (fit model) used as a design base by the apparel industry has a well-
proportioned/well-balanced body, both horizontally and vertically. Although height proportions
are used mostly by artists and illustrators, imbalanced height proportions could also lead to fit
problems. Figure 5.2 illustrates height proportions in relation to the full height (Lyle &
Brinkley, 1983:63; Le Pechoux & Ghosh, 2002:4).

153
FIGURE 5.2: IDEAL BODY SHAPE’S HEIGHT PROPORTIONS
(Adapted from: Lyle & Brinkley, 1983:63)
Using the height proportional relationship concept from Lyle and Brinkley (1983:63) and Le
Pechoux and Ghosh (2002:4), the results of the height proportions of this study are
presented in Table 5.5.
TABLE 5.5: PERCENTAGE DISTRIBUTION OF HEIGHT PROPORTIONS (n = 123)
HHeeiigghhtt pprrooppoorrttiioonnss EExxaacctt ccoouunntt ((%%)) AAbboovvee ccoouunntt ((%%)) BBeellooww ccoouunntt ((%%)) Under-bust height (¾ height) 0 0 123 (100%)
Waist height (⅝ height) 0 103 (84%) 20 (16%)
Hip height (½ height) 6 (5%) 102 (83%) 15 (12%)
Knee height (¼ height) 0 123 (100%) 0
The results presented in Table 5.5 above indicate that all (100%) the participants’ bust height
dimensions were below the ¾ standard of the ideal figure’s normal bust position. This may
therefore affect the size of the armhole, as well as the dart positions and style lines of a
foundation pattern. The majority (84%) of the participants’ waist heights were above the ⅝
height standard of the ideal figure’s normal waist position, while only 16% of the participants’
waist heights were below the ideal figure’s waist position. This means that the majority of the
participants’ waistlines were situated higher than the ideal body’s normal position, which may
require re-identification of the waist dart positions and style lines in a base pattern.
Concerning the hip height, the results also indicate that the majority (83%) of the participants’
hip height dimensions were above the ½ standard (ideal figure’s) height position, while only
12% had hip heights below the standard. Only 5% of the participants had hip heights at
Bust line is midway between shoulders and waistline (¾ of the full height)
Waistline is midway between the bust line and the hipline (⅝ of the full height from the apex of the head to the ground).
Hipline is the mid-point of the total figure’s height (½ full height dimensions from the apex of the head to the ground).
Knee line is the mid-point between the hipline and the ground (¼ of the human’s full height from the apex of the head to the ground).

154
exactly ½ the standard height position of the ideal figure. This implies that the majority of the
participants had their hiplines situated above the ideal figure’s normal position, a typical
characteristic of a Western rectangular shape (Rasband & Liechty, 2006:25). However, this
could affect the style lines and side seam shaping in a foundation pattern. Concerning the
knee height, all (100%) the participants’ knee heights were above the standard ¼ heights,
indicating that the majority of the participants’ lower parts of their legs were longer than the
ideal figure’s normal position. The knee height position does not affect the fit of an apparel
item, but could be used as a style guide point. It should be noted that these calculations were
based on the exact standards stated above, and no tolerance allowance was provided.
5.2.4 Summary of body shape identification from body dimensions (Primary objective 1 (Sub-objective 1))
In summary, this study found that the majority of the participants were of medium height
(75%) and had a distinctive rectangular body shape (74%). Participants with a triangle/pear
body shape were the second most common type (20.5%) although they were less
represented. Other characteristics that prevailed with the distinct body shapes (rectangular
and triangle), were the large buttocks (69%), large thigh bulge (85%), large bust as indicated
by the bust extension (81%), and large cup size (60%). The body shape was also
characterised by a larger front arc at the bust and waistline regions, whereas the back arc
dimension was large at the hip region. The body shape’s height proportions showed that
waistline, hip-line and knees were higher than the normal, ideal figure’s height positions,
whereas the bust line was situated below the normal height position.
5.3 IDENTIFICATION AND DESCRIPTION OF THE DISTINCTIVE FEMALE BODY SHAPE (S) OF PROFESSIONAL WOMEN IN KENYA FROM PHOTOGRAPHS (OBJECTIVE 1 (SUB-OBJECTIVE 2))
Photographs were taken from 89 career women within the ages of 25-55. Their ages were
categorised into three groups namely: young adults aged between 25 and 32 years, a middle
group aged between 33 and 40 years, and mature group aged 41 years and above. The
middle-aged (33–40) were highly (43%) represented, while the young adults (25–32) were
the secondly (32%) represented. The mature group (41 years and above) had the lowest
(25%) representation. All the digital images were transferred to the computer for the
purposes of cleaning, refining and organising them for evaluations.
In this study, it was decided that a Kappa statistic of 0.75 was the cut-off point for acceptable

155
agreement between the two trained professional evaluators. This implied that all the
evaluations with the Kappa statistic of ≥ 0.75, and significant (p ≤ 0.05) agreements between
the two evaluators, were accepted, while evaluated attributes with Kappa < 0.75 were
rejected, but were further subjected to a group of professional expert evaluators to assess
and to reach consensus on a given characteristic for final decisions. The categories of body
features and body shape identified are presented according to the sequence of the body
shape assessment scale (Appendix 3D).
5.3.1 Body build/size categories (V4 on the body shape assessment scale)
Participants were grouped into visual size categories, as body size plays an important role in
the designing and distribution of ready-made apparel to the correct marketplaces (Winks,
1997). Presented in Table 5.6 are the body build/size categories that emerged from the
evaluations of the sample data. The results indicate that there were almost equal
representations of each body build. Forty one per cent of the participants appeared to be of
medium size, 33% of the participants appeared slender, while 26% appeared to be large in
size. The inter-rater reliability between the two evaluators was good, as indicated by the
Kappa statistic of 0.86. Statistically, there was significant (p > 0.0001) agreement between
the two evaluators.
TABLE 5.6: PERCENTAGE DISTRIBUTIONS OF BODY BUILD/SIZE CATEGORIES (n = 89)
VViissuuaall bbooddyy ssiizzee//bbuuiilldd ccaatteeggoorriieess
EEvvaalluuaattoorr 11 CCoouunntt ((%%))
EEvvaalluuaattoorr 22 CCoouunntt ((%%)) AAvveerraaggee ((%%)) IInntteerr--rraatteerr
rreelliiaabbiilliittyy pp
Slender group (small size) 29 (33%) 30 (34%) 33%
Average (medium size) 34 (38%) 38 (43% 41%
Large group (plus size) 26 (29%) 21 (23%) 26%
0.86 0.0001*
* Statistically significant (p ≤ 0.05)
Body build/size among different age groups: Comparisons were made between the
different age groups and the body build/sizes to determine whether there were any significant
associations between body build/sizes and age.
The results are presented in Table 5.7, show that the majority (63%) of the young adults (25-
32) were in the smaller sized group, while 55% of the middle-aged group (33-40) appeared to
be of medium built. Fifty two per cent and 43% of the mature group (41+) appeared to be of
large and medium build, respectively. Statistically there was significant (p > 0.0001)
agreement between the two evaluators. These results may possibly suggest that as females
mature, their weight tends to increase much more than in young adults (Figure 5.3).

156
TABLE 5.7: BODY BUILD/SIZE AMONG DIFFERENT AGE GROUPS
SSmmaallll ((%%)) MMeeddiiuumm ((%%)) LLaarrggee ((%%))
AAGG
EE (( YY
EE AA R
R SS ))
EE vv aa
ll uuaa tt
oo rr
11
EE vv aa
ll uuaa tt
oo rr
22
AAvv ee
rr aagg ee
(( %%
))
pp
EE vv aa
ll uuaa tt
oo rr
11
EE vv aa
ll uuaa tt
oo rr
22
AAvv ee
rr aagg ee
(( %%
))
pp
EE vv aa
ll uuaa tt
oo rr
11
EE vv aa
ll uuaa tt
oo rr
22
AAvv ee
rr aagg ee
(( %%
))
pp
25-3
2 (n
=
29)
61 64 63 % 28 25 26% 11 11 11%
33-4
0 (n
=
38)
17 17 17% 0.0001* 48 62 55% 0.0001* 34 21 28% 0.0001*
41 +
(n
= 22
)
5 5 5% 41 45 43% 54 50 52%
*Statistically significant (p ≤ 0.05)
Young
Middle-aged Young /smaller body build Middle-aged /medium to fuller body build
Middle-aged
Older Middle-aged /medium to fuller body build Older /fuller body build
FIGURE 5.3: BODY BUILD/SIZE VERSUS AGE

157
5.3.2 Bust/shoulder width versus hip width appearance, and waist size versus hip width (V5 and V6 on the assessment scale)
When using body dimensions, body shape classifications are based on a derived parameter
drop value (Winks, 1997; Beazley, 1998; Gupta & Gangadhar, 2004). However, visual
analysis does not use the drop values as in the case of dimensions, but uses visual analysis
to provide an estimate of how the bust/shoulder and waist sizes compare to each other. The
two attributes were subjected to a group of professional expert evaluations because inter-
rater reliability was below the Kappa statistic of ≥ 0.75 (0.66 and 0.68). The results are
presented in Table 5.8. TABLE 5.8: PERCENTAGE DISTRIBUTION OF THE BUST/SHOULDER AND WAIST
SIZE APPEARANCE VERSUS THE HIP WIDTH APPEARANCE (n = 89)
CCaatteeggoorriieess EEvvaalluuaattiioonnss bbyy aa ggrroouupp ooff pprrooffeessssiioonnaall eexxppeerrttss ((%%)) PPoossssiibbllee bbooddyy sshhaappee
Narrow 12 (13%) Triangle/Pear
Similar 74 (83%)* Rectangular, Hourglass or Apple
BBuu ss
tt // ss hh
oo uull dd
ee rr
ss iizz ee
vv ee
rr ssuu ss
hhii pp
ss ii
zz ee
Wider 3 (3%) Inverted triangle/Barrel
Narrow 8 (11%) Hourglass
Similar 62 (84%) Rectangular
WWaa ii
ss tt ss
ii zzee
vv eerr ss
uu ss hh
ii pp
ss iizz ee
Wider 4(5%) Apple * Subjected to waist size versus hip size
Table 5.8 clearly demonstrates that 83% of the participants’ bust/shoulder sizes appeared
similar in width to their hip sizes, suggesting the possibility of rectangular, apple or hourglass
body shapes. Participants with bust/shoulders appearing narrower than the hips were 13%
(this could suggest the possibility of pear/triangular shapes). The least represented group
(6%) were those with busts appearing wider than the hip size, suggesting a possible inverted
triangular/barrel shape. At this stage, it was unclear as to whether the majority of the
participants could possibly be identified with the rectangular, hourglass, or apple body shape.
To isolate the rectangular shape from the hourglass and the apple body shapes, the waist
thickness was further compared to the hip width appearance (V6 on the body shape assessment scale) – only on the 74 (83%) participants with waist size similar to bust size.
The results indicate that the majority of the participants with waist size appearing similar to
the hip size were 84% (signifying a possible rectangular body shape). The participants
whose waist size appeared narrower than the hip size were 11% (indicating a possibility of
an hourglass body shape). Participants whose waist size appeared wider than their hip size

158
were 5% (suggesting a possible apple shape). This indicates that the majority of the
participants had a rectangular body shape.
5.3.3 Stomach and buttocks appearances (V7 and V8 on the body shape assessment scale)
Stomach size and shape plays an important role in the design of apparel items. Its size,
shape and position would affect the fit of the apparel item around the waist region. Its size
could also affect the crotch line as well as the hang of apparel (Rasband, 1994:66, 68).
Buttocks size and shape is also an important body characteristic that affects the fit of apparel
around the hip region, the crotch line and even the drape (Rasband & Liechty, 2006:324).
Results of visual stomach and buttocks shape evaluations are presented in Table 5.9.
TABLE 5.9: PERCENTAGE DISTRIBUTION OF COMMON STOMACH AND BUTTOCKS SHAPES (n = 89)
CCaatteeggoorriieess EEvvaalluuaattoorr 11 AAvveerraaggee ((%%))
EEvvaalluuaattoorr 22 AAvveerraaggee ((%%)) AAvveerraaggee ((%%)) pp IInntteerr--rraatteerr
rreelliiaabbiilliittyy
“D” 65 (73%) 59 (66%) 70%
“b” 15 (17%) 19 (21%) 19%
VV ii ss
uu aall ss
hh aapp ee
ooff
tt hhee
ss ttoo mm
aa cchh
Flat 9 (8%) 11 (13%) 11%
0.0001* 0.81
“d” (large) 81 (91%) 81 (91.5%) 91%
No “d”(Average 8 (9%) 8 (8.5%) 9%
VV ii ss
uu aall ss
hh aapp ee
ooff
tt hhee
bb uutt tt o
o cckk ss
Flat 0 (0%) 0 (0%) 0 (0%)
0.0001* 0.94
*Statistically significant (p ≤ 0.05)
The stomach “D” shape is defined from the body’s profile view, where the front part of the
body is characterised by an extension of fullness appearing like a letter “D” from below the
bust line extending down to the crotch line. Stomach “b” shape is defined from the body’s
profile view, where the stomach’s fullness (roundness) begins below the waistline, appearing
like a letter “b”. Table 5.9 clearly depicts that the majority (70%) of the participants had
stomach protrusions appearing similar to the letter “D”. The inter-rater reliability for these
evaluations was good, as indicated by a Kappa statistic of 0.81. Statistically there was
significant (p > 0.0001) agreement between the two evaluators. Participants with stomach
protrusions appearing similar to the letter “b” and flat were only 19% and 11% respectively.
The results suggest that Kenya’s career women are likely to experience tight fit problems
with ready-made apparel along their front torsos.

159
The buttocks’ “d” shape is defined from the body’s profile view, with the buttock distinction or
conspicuity that appears like the letter “d” as it stands out or extends at the lower back
section. Table 5.9 clearly shows that the majority (91%) of the participants appeared to have
large buttocks appearing like the letter “d”. Participants whose buttocks did not appear like
the letter “d” were 9%, while none of the participants appeared to have flat buttocks. The
inter-rater reliability for the evaluations was good, as indicated by a Kappa statistic of 0.94,
while there was significant (p > 0.0001) agreement between the two evaluators. The results
suggest that Kenya’s career women are likely to experience tight fit problems around the hip
and the crotch lines of apparel.
Stomach shape among different age groups: Comparisons were made between the
different age groups and the stomach prominence to determine whether there were any
associations between stomach shapes and the different age groups. The “b” stomach
shapes were combined with flat stomach shapes, because from Table 5.9, the “b” and flat
stomach shapes were least represented (30%). They were also grouped together because
they appeared similar. The results are presented in Table 5.10.
TABLE 5.10: PERCENTAGE DISTRIBUTION OF COMMON STOMACH SHAPES ACCORDING TO AGE GROUPS (n = 89)
AAggee ((yyeeaarrss)) SSttoommaacchh ““DD”” sshhaappee AAvveerraaggeedd ((%%))
SSttoommaacchh ““bb”” aanndd ffllaatt sshhaappee AAvveerraaggeedd ((%%))
pp
25-32 (n = 29) 50 % 50%
33-40 (n = 38) 91% 9%
41 + (n = 22) 93% 7%
0.0001*
* Statistically significant (p ≤ 0.05)
Table 5.10 shows that the majority (93%) of the mature age group and the majority (91%) of
the middle-aged group had stomach protrusions that appeared like the letter “D”, while only
50% of the young adults had stomach protrusions appearing like the letter “D”. Among the
young adults, 50% had stomach protrusions appearing like the letter “b”. Statistically, there
were significant (0.0001 ≤ 0.05) associations between age group and the presence of the
stomach shape “D”. It is possible that the mature females’ fat deposits tend to spread all over
the front torso much more than in the younger group, as shown in Figure 5.4.
5.3.4 Upper back curvature and the back waist curvature/shape (V9 and V10 on the
body shape assessment scale)
Upper back and the back waist curvatures are important characteristics that would affect the
fit of apparel items around the shoulder blades, the midriff region at the back as well as the

160
balance of an apparel item from the profile view. Inter-rater reliability for these two variables
between the two evaluators was lower (0.69 and 0.68) than the Kappa statistic of 0.75, and
therefore, they were subjected to a group of professionals’ expert assessment. The results
are presented in Table 5.11.
TABLE 5.11: PERCENTAGE DISTRIBUTION OF THE UPPER BACK AND THE BACK WAIST CURVATURES (n = 89)
TThhrreeee eexxppeerrtt eevvaalluuaattoorrss CCaatteeggoorriieess
FFrreeqquueennccyy PPeerrcceennttaaggee ((%%))
Fully rounded upper back 70 79%
Moderately rounded upper back 13 15%
UUpp pp
ee rr
bb aacc kk
ss hh
aa ppee
cc uurr vv
aa ttuu rr
ee
Straight upper back 6 6%
Deep hollow waist 67 75%
Moderately hollow waist 19 21%
BBaa cc
kk ww
aa iiss tt
cc uu
rr vvaa tt
uu rree
Straight/flat/non-hollow waist 3 4%
Table 5.11 above shows that the majority (79%) of the participants appeared to have a fully
rounded upper back, while the moderately rounded upper backs and flat backs were least
represented. It is also apparent that the majority (75%) of the participants had a deep hollow
back waist, while participants with a moderate hollow back waist and a straight back waist
were least represented. It appears that the pronounced rounded upper back and the large
buttocks (Table 5.9) result in the deep hollow back waistline. However, a consumer with the
rounded upper back in combination with a hollow waistline is likely to experience tight fit
problems at the shoulder blade region and loose fit (sagginess) around the waistline. The
balance of the apparel is also likely to be affected as a result of this body configuration.
Upper back and back waist curvatures among different age groups (Table 5.12):
Comparisons of the upper back and the back waist curvatures were made between the
different age groups to determine whether there were any significant associations between
the upper back and back waist curvatures among the different age groups. The results are
represented in Table 5.12.
The results (Table 5.12) show that there were more (59%) of the young adults (25-32) with
fully rounded upper back, followed by the middle-aged (33-40) group (53%) with fully
rounded upper backs, and only 34% in the mature group had rounded upper backs.
However, more (55%) of the mature (41+) and about half (47%) of the middle-aged (33-40)
groups had moderately rounded upper backs, while only few (38%) of the young adults (25-
32) had moderately rounded upper backs. From these results, it may be reasoned that as the

161
females get older, the upper back possibly tends to fill up with fat deposits or the muscles
slacken, making the shape at the back appear moderately rounded or flat (Figure 5.4).
Younger Older
Rounded upper back and a less pronounced “D”-shaped stomach
Rounded upper back and a more pronounced “D”-shaped stomach
FIGURE 5.4: PROFILE VIEW CHARACTERISTICS AMONG DIFFERENT AGE GROUPS TABLE 5.12: PERCENTAGE DISTRIBUTION OF THE UPPER BACK AND BACK WAIST
CURVATURES AMONG DIFFERENT AGE GROUPS (n = 89)
AAggee ggrroouuppss ((yyeeaarrss)) CCaatteeggoorriieess 2255--3322 ((nn == 2299)) 3333--4400 ((nn == 3388)) 4411 ++ ((nn ==2222))
Fully rounded upper back 59% 53% 34%
Moderately rounded upper back 38% 47% 55%
UUpp pp
ee rr
bb aacc kk
cc uu
rr vvaa tt
uu rree
Flat upper back 3% 0% 11%
Deep hollow waist 46% 48% 39%
Moderately hollow waist 46% 45% 48%
BBaa cc
kk ww
aa iiss tt
cc uu
rr vvaa tt
uu rree
Flat waist/non-hollow 8% 7% 13%
Regarding the back waist curvature, it is clear that there was almost equal representation
among the middle-aged (48%), the young adults (46%) and the mature group (39%)
concerning the deep hollow back waist region. Approximately the same balanced percentage
distribution pattern was also observed with the mature group (48%), the young adults (46%)
and the middle-aged group (45%), regarding a moderately hollow back waist region.
5.3.5 Thigh bulge, upper arm and shoulder categories (V11, V12 and V13 on the body shape assessment scale)
Thigh size/bulge is an important characteristic that would affect the fit of apparel at different
points of the hipline region (Rasband & Liechty, 2006:324). Shoulder shape, size or its
direction is also an important characteristic that would affect the drape and fit of apparel.
Inter-rater reliability for these two variables (0.62 each) was below the Kappa statistic of 0.75
– hence the need to subject the participants’ images to a group of expert evaluators. Upper

162
arm size affects the fit of apparel items at the sleeve’s upper arm or at the crown region
(Rasband, 1994:106-108), thus the need to understand consumers’ upper arm sizes. The
results of the thigh bulge, shoulder and upper arm categories are presented in Table 5.13.
TABLE 5.13: PERCENTAGE DISTRIBUTION OF THE UPPER ARM, THIGH BULGE AND SHOULDER SHAPE CATEGORIES (n = 89)
CCaatteeggoorriieess EEvvaalluuaattoorr 11 AAvveerraaggee ((%%))
EEvvaalluuaattoorr 22 AAvveerraaggee ((%%))
AAvveerraaggee ffrroomm aa ggrroouupp ooff
pprrooffeessssiioonnaall eexxppeerrtt eevvaalluuaattoorrss
((%%))
PP IInntteerr--rraatteerr rreelliiaabbiilliittyy
Thin 0 (0%) 1 (0%) 0%
Average 38 (43%) 34 (38%) 41%
UUpp pp
ee rr aa
rr mm ss
ii zzee
Full 51 (57%) 54 (61%) 59%
0.0001* 0.86
Large - - 38 (43%)
Moderate - - 30 (33%)
TT hhii gg
hh bb uu
ll ggee
Flat - - 21 (24%)
Three expert evaluators
Normal - - 52 (58%)
Squared 22 (25%)
SS hh oo
uu lldd ee
rr ss ss
hh aapp ee
Sloped - - 15 (17%)
Three expert evaluators
*Statistically significant (p ≤ 0.05); (-) not applicable
Table 5.13 indicates that the majority (59%) of the participants had full biceps/upper arms,
while participants with moderate/average biceps/top arm were 41%. No participants had thin
upper arms. The inter-rater reliability for the evaluations was good, as indicated by a Kappa
statistic of 0.86. Statistically there was significant (p > 0.0001) agreement between the two
evaluators. This implies that Kenya’s career women are likely to encounter tight fit problems
around the biceps region. Concerning the thigh bulge, it is clear that the largest group (43%) of the participants had
large thigh bulges, while 33% participants appeared to have moderate thigh bulges. Only
24% of the participants had flat thighs. Large thigh bulges in combination with large buttocks
would exaggerate fit problems around the hip and crotch line of apparel. Regarding the

163
shoulder shape, the majority (58%) of the participants had normal shoulder shapes. Only
25% and 17% had squared and sloped shoulders respectively. These results suggest that
Kenya’s career women are likely to encounter minimal shoulder fit problems.
5.3.6 Body shape form (variable 14 on the body shape assessment scale)
Body shape form has been seen as a solution to the fit problems of ready-made apparel
(Simmons, Istook & Devarajan, 2004a; Simmons, Istook & Devarajan, 2004b; Connell et al.,
2006). On the body shape assessment scale, the last question required a holistic (profile and
silhouette) description of the body shape and possibly a category within the five prevalent
types (hourglass, rectangle, triangle, apple and inverted triangle) to be assigned to each
shape evaluated. The inter-rater reliability from the two expert evaluators for this variable
was a Kappa statistic of 0.42 – below the 0.75 cut-off point. Therefore it was subjected to a
group of professionals’ expert evaluations. The results are presented in Table 5.14.
TABLE 5.14: PERCENTAGE DISTRIBUTIONS OF BODY SHAPE CATEGORIES (n = 89)
BBooddyy sshhaappee ccaatteeggoorriieess FFrreeqquueennccyy PPeerrcceennttaaggee ((%%))
Rectangular/straight 62 70%
Pear / triangle 12 13%
Hourglass 8 9%
Barrel / inverted triangle 3 3.5%
Apple 4 4.5%
It is clear from Table 5.14 that the majority (70%) of participants appeared to have a
rectangular body shape, while participants who appeared to have a pear body shape were
13%. The rest of the body shapes were hardly represented. The predominant body shape
that emerged from the evaluations was the rectangular body shape. Although the
pear/triangle body shape was less represented in this study, it emerged as the second most
distinctive body shape. Considering that ready-made apparel designs are based on the
hourglass body shape, Kenya’s career women with their rectangular shape are therefore
likely to encounter fit problems.

164
5.4 DESCRIBING ASSOCIATIONS BETWEEN THE DISTINCTIVE SHAPES EMERGING FROM BODY DIMENSIONS AND THOSE EMERGING FROM THE PHOTOGRAPHS OF THE CAREER WOMEN (OBJECTIVE 1 (SUB-OBJECTIVE 3))
Figure 5.5 represents the results of the comparisons of the distinctive body shapes obtained
from the body dimensions and those obtained from the photographs, calculated as
percentages.
0
20
40
60
80
Perc
enta
ge (%
)
Emerging body shapes
Shape from measurements (n =123)
74 21.5 1.5 1.5 1.5
Shape from photographs (n =89)
70 13 9 4.5 3.5
Rectangle
Triangle Hourglass
Apple Inverted triangle
FIGURE 5.5: EMERGING BODY SHAPES FROM THE DIMENSIONS AND EVALUATIONS
Figure 5.5 above indicates that the rectangular body shape was the most distinct body
shape emerging from both the dimensions (74%) and the evaluations of the photographs
(70%). The second most distinct body shape emerging from both the dimensions (21.5%)
and the evaluations of the photographs (13%) was the triangle body shape – although the
percentage representation differs. The rest of the body shapes were least represented.
5.4.1 Comparing the characteristics of the distinctive body shape emerging from the body dimensions and from the evaluations of the photographs
Considering that body dimensions are one-dimensional elements, it would not be possible to
isolate contours and precisely locate the positions of body characteristics such as buttocks
and bust contours along circumferential dimensions. Images taken from different angles
facilitate comprehensive scrutiny on the size/depth of any contours and any outlines that
appear on the body. It is therefore possible to segregate body characteristics with the use of
two body shape identification techniques, namely using body dimensions and evaluations of

165
photographs. Characteristics that were identified using both techniques are presented in
Table 5.15. Characteristics that were not possible to identify concurrently using both
techniques were: the bust and the height proportions (identified through body dimensions),
the body builds, stomach, upper back curvature, back waist curvature and the top arm
(identified through visual evaluations of the photographs).
TABLE 5.15: DISTINCTIVE BODY FEATURES IDENTIFIED USING BODY DIMENSIONS
AND VISUAL EVALUATIONS OF PHOTOGRAPHS
BBooddyy sshhaappee’’ss ffeeaattuurreess CCaatteeggoorryy BBooddyy ddiimmeennssiioonnss ((%%))
((nn == 112233)) VViissuuaall eevvaalluuaattiioonnss ((%%))
((nn == 8899)) DDiiffffeerreenncceess ((%%))
Small 0% 24% 24%
Moderate 85% 33% 52% TThhiigghh bbuullggee
Large 15% 43% 28%
“d” (large) 69 91 22%
Moderate 29 9 22% BBuuttttoocckkss
Flat 0 3 3%
Normal 67 58 9
Squared 14 25 11 SShhoouullddeerr
Sloped 19 17 2
PPrrooffiillee vviieeww bbaallaannccee
Front upper torso 100 88 12
Table 5.15 indicates that the majority of the participants had a moderately large thigh bulge,
85% from the body dimensions and 52% from visual evaluations of photographs. It was also
clear that large buttocks recorded high percentages of 91% from visual evaluations and 69%
from body dimensions. Shoulder shape categories maintained almost equal percentage
scores, with the normal category taking the lead (67% participants from the body dimensions
and 58% from the visual evaluations). Regarding the arc dimensions, the majority of the
participants’ front bust and stomach arcs were larger than the back (back width) and waist
arcs from both the body dimensions (100%) and the visual evaluations of photographs
(88%).
From these results, it is also clear that both techniques produced significant results, although
there were distinct percentage differences on some of the characteristics. The percentages
ranged from 2, which was the lowest, to 52 being the highest. The differences may have
been caused by varying sample sizes used for body dimensions (n = 123) and photographs
(n = 89). It should be noted that visual analysis provides estimates of sizes, while the actual
measurements give exact dimensions.

166
5.4.2 Summary on the identification of body shapes through body dimensions as well as evaluation of photographs
The study demonstrated that the prevalent body shape that emerged from the body
dimensions and evaluation of the photographs was the rectangular body shape, which is
typified by medium height, large buttocks, large thighs and large stomachs appearing like the
letter “D”. It is further characterised by a rounded upper back and a hollow back waist
(lordosis curve) – making the shape appear imbalanced from the side view (Figure 5.10).
However, more of the mature females appeared larger (Figure 5.3), with protruding
stomachs (“D”), and a moderately rounded upper back (Figure 5.4). The majority of the
younger females appeared smaller, with fully rounded upper backs and half of them had “D”-
shaped stomachs, while the other half had “b”-shaped stomachs (Figures 5.3 and 5.4).
The results from both the body dimensions and the evaluations of the photographs further
demonstrate that both techniques when combined yield even better results which can
address apparel fit problems more closely. However, it is almost impossible to identify all the
body shape characteristics using one method only. Considering that body scan technology is
not popular in developing countries due to its cost and the technology involved (Xu et al.,
2002; Ashdown & Dunne, 2006), it may be reasoned that in the meantime, both the body
shape identification techniques (from the dimensions as well as visual evaluations of
photographs) could be used simultaneously to produce reasonably reliable results.
5.5 DISTINGUISHING AND DESCRIBING DIFFERENCES BETWEEN THE EMERGING DISTINCTIVE BODY SHAPES (FROM DIMENSIONS AND PHOTOGRAPHS) AND THE WESTERN DISTINCTIVE BODY SHAPE (PRIMARY OBJECTIVE 2)
The rectangular body shape is the prevalent female body shape among Kenyan career
women. This finding is consistent with Istook’s (2005) study in the United States of America.
Figures 5.6, 5.7, 5.8, 5.9 and 5.10 compare the body shapes that emerged from this study
with similar data from the USA. It should be noted that this study used only three basic
dimensions (bust, waist and hips) for defining body shape, while the FFIT© software used by
Devarajan and Istook (2004) to classify America’s female shapes, used six dimensions (bust,
waist, hips, high hip, abdomen and stomach). Based on the differences in classification
techniques applied in the two studies and the different sample sizes, it would be unrealistic to
make any conclusive comparisons.

167
FIGURE 5.6: COMPARISON OF DISTINCTIVE FEMALE BODY SHAPES IN KENYA AND THE UNITED STATES OF AMERICA
True Hourglass Bottom hourglass Triangle Rectangle Spoon Apple
FIGURE 5.7: AMERICA’S BODY SHAPES (Simmons, Istook and Devarajan, 2004b)
The results of this study (Figure 5.6) show that the rectangular body shape is the strikingly
distinctive body shape found in both America and Kenya. In contrast, the triangle body shape
is the second most common body shape occurring in Kenya’s career women, while
America’s second most distinctive body shape is the spoon shape, which did not feature at
all in this study.
0
10
20
30
40
50
60
70
80
Per
cent
age
(%)
Kenya's versus USA female body shapes
Kenya (n = 123) 74 21.5 1.5 1.5 1.5
USA (n =6,300) 46 2 8 0 14 21 5 4
Rectangle Triangle Hourglass AppleInverted triangle
SpoonTop
hourglassBottom
hourglass

168
Hourglass Triangle Rectangle Inverted triangle Apple
FIGURE 5.8: KENYA’S BODY SHAPES (Source: Present study)
The Western rectangular body shape, according to Rasband and Liechty (2006:25), has a
strong ribcage and upper hip tapering a little towards the waist, or sometimes not tapering at
all. The shoulder width appears similar to the hip measurement, with very little waist
indentation. Waist circumference measures 9 inches (23 cm) less than the hip or bust
circumference (Shin & Istook, 2007), the bust is small and there is no thigh bulge. The side
view characteristics mentioned are the large stomach and a more flat back curvature: right
from the upper back to the buttocks appears like the apple body shape’s profile (Figure 5.9).
Rasband and Liechty report that once a rectangular shape attains more weight, it results in
an apple shape (Rasband & Liechty, 2006:25-26).
FIGURE 5.9: SIDE VIEW CHARACTERISTICS OF AN APPLE SHAPE ASSUMED TO BE AN APPROXIMATE REPRESENTATION OF THE SIDE VIEW CHARACTERISTICS OF THE RECTANGULAR BODY SHAPE (Source: Simmons, Istook & Devarajan, 2004b)

169
In this study (Figure 5.10), the emerging rectangular front view shape is characterised by a
shoulder width that is similar to the width of the hips, and a small waist indentation of less
than 9 inches (23 cm). The thighs on the side bulge out beyond the hip width and are full at
the inside (crotch), in contrast to the Western body shape. A rounded upper back
characterises the profile view, with more roundness concentrated just below the shoulder line
and the chest. The back curvature tapers narrowly towards the waistline and abruptly meets
the full buttock contour, resulting in a deep hollow waist region (lordosis curve). The front
side of the profile view is characterised by a high abdominal contour that begins to protrude
just below the bust line. It begins to curve round almost instantly, and increases as it leads
down to the crotch at the centre of the body, resulting in a “D” appearance. A brief
description of this kind of body shape would be a curvy, rectangular female body shape.
Front view Profile view
FIGURE 5.10: CURVY RECTANGULAR BODY SHAPE
The second most prevalent shape in this study (Figure 5.11) is the triangular body shape,
which differs from the second most prevalent spoon body shape of America. As mentioned
earlier, it would be unrealistic to make conclusive comparisons because of the different sizes
of population samples, techniques used to obtain body dimensions and methods of
identifying body shapes by the two studies.

170
Front view Profile view
FIGURE 5.11: CURVY TRIANGULAR BODY SHAPE
Although the triangular body shape was less (21.5%) represented in this study (Figure 5.11),
the emerging triangular front view shape is characterised by narrow shoulders and hips. The
shoulder, bust width and waistline region appear to be similar in width. The body immediately
curves outward from the waistline downward to the hip line and further to the thigh region.
The thighs on the side bulge out beyond the hip width and are full at the inside. A rounded
upper back characterises the profile view, with more roundness concentrated just below the
shoulder line and the chest. The back curvature tapers down narrowly towards the waistline
and abruptly meets the full buttock contour, resulting in a deep hollow waist region (lordosis
curve). The front profile view is characterised by a low abdominal contour that begins to
protrude just below the waistline, curving round instantly and increasing as it leads down to
the crotch at the centre of the body. A brief description of this kind of body shape would be a
curvy, triangular female body shape.
5.6 SCRUTINISING AND DESCRIBING FIT IMPLICATIONS ASSOCIATED WITH THE EMERGING DISTINCTIVE RECTANGULAR BODY SHAPE OF CAREER WOMEN (PRIMARY OBJECTIVE 3)
Ready-made apparel items are designed based on the Western hourglass body shape that is
viewed as the ideal shape (Ashdown & Dunne, 2006; Shin & Istook, 2007). Most sizing
systems used in developing countries are just adaptations of the Western sizing systems
(Zwane & Magagula, 2006). The latest anthropometric data collected in the USA (2003) as
well as the United Kingdom has not been analysed and implemented by apparel industries
as sizing systems (Devarajan & Istook, 2004; Newcomb & Istook, 2004b; Simmons, Istook &

171
Devarajan, 2004a; Istook, 2005). This then calls attention to the Western sizing systems that
are currently in use to facilitate comprehensive comparisons with the findings of this study.
Newcomb and Istook (2004a) confirmed that junior and misses standards were based on the
hourglass body shape, which is viewed as an ideal shape – a phenomenon that is supported
by various studies (Zwane & Magagula, 2006; Pisut & Connell, 2007). Therefore, it is
appropriate that the rectangular body shape found to be prevalent in this study, be compared
to the hourglass body shape (fit model) in order to facilitate a deeper understanding of the fit
problems experienced by Kenya’s career women.
5.6.1 Fit implications for apparel associated with the curvy female rectangular body shape
The study revealed that critical fit points of the distinct rectangular body shape of the career
women in Kenya deviate from the fit points of the well-proportioned fit model’s
characteristics. The varied critical fit points common to the distinct body shape of this study,
are the large buttocks, the thighs, the curvy back profile shape, the large stomach,
unproportional key height points (bust, waist, hip and knee) and the large, low bust. The fit
implications of these critical fit points associated with the rectangular distinctive body shape
of this study are discussed below.
5.6.1.1 Fit implications associated with the size of the buttocks/derriere and the thighs
The buttocks and thighs are situated around the hip region and therefore influence the
circumferential dimensions around the hipline. These may have similar or closely related fit
implications for the apparel. Although the hipline (trochanterion) was positioned above the
normal hipline (½ height) for most participants (Table 5.5), nonetheless, it is a typical
characteristic of a Western rectangular shape. The broadest hip position (thigh bulge)
situated at approximately 10 cm below the normal hipline, could possibly affect the fit of an
apparel item more than the high hip position.
The buttocks/derriere: The findings of this study indicated that there were 91% and 69% of
the participants with large buttocks according to visual evaluations and body dimensions,
respectively. This suggests that the majority of the participants are likely to experience tight
fit problems around the hip region and the crotch line. Over-sized buttocks that curve
outwards more than the ideal shape’s buttocks, can cause fit problems around the buttocks,
hip and crotch lines. The fabric width, and the length or the curved shaping in an apparel
item may not be sufficient enough to accommodate the fullness of the buttocks comfortably
and attractively. The fabric is likely to be strained and pulled tight across the buttocks,

172
causing the side seam to bow backward at the hipline level, while the skirt hemline is likely to
pull up at the back and hang down longer at the front. The shallow area above the buttocks
may cause excess fabric to form layers of folds as the apparel item rides up (Rasband,
1994:134-135; Rasband & Liechty, 2006:314, 324, 336). This may result in tight diagonal
ripples forming towards the buttock curve on skirts, and towards the crotch on pants. The
waistband may be pulled down at the back for pants, and may generally affect the length of
the skirt.
The bulging thighs: In this study there were 76% career women with large thighs, as judged
from the visual evaluations. This suggests that the heavy thighs (inside and outside) could
have fit implications due to the size and position in comparison with the ideal shape’s size
and position. Heavy/bulging thighs positioned lower than the normal position of the ideal
shape will affect the way that pants and skirts fit. There will be less fabric width to go round
the thighs, leading to tight horizontal ripples or folds forming round the upper thigh just below
the hipline. There will be horizontal ripples radiating from the crotch line towards the outside
thigh and the fabric may “cup” under the thighs and the buttocks. Skirts’ hemlines will tend to
pull on the sides (Rasband & Liechty, 2006: 340).
All the participants’ knee height positions were above the normal position (¼ height) of the
ideal figure (Table 5.5). Although there is a disparity with the ideal shape’s height
proportions, fit problems are unlikely to occur but may only affect style line position (shaping).
5.6.1.2 Fit implications associated with the large stomach size
The study indicated that the majority (70%) of the Kenyan career women had a high
abdomen, appearing like the letter “D” from the visual evaluations. This suggests that the
stomach protrusion exceeds the shape of the ideal shape. Apparel made on the basis of the
ideal shape’s proportions will therefore have less fabric length and width or even insufficient
curved shaping to fit comfortably and nicely over the abdomen. In skirts and dresses, tight
horizontal folds are likely to form above the abdomen as the apparel item rides up. The side
seams will tend to bow forward between the hip and the waist, while angled ripples may also
form towards the stomach curve. With fitted skirts or dresses, the hemline may be pulled up
in front, causing a “poke out” at the centre. On pants, wrinkles may form between the crotch
and abdomen. The crotch seam is likely to be pulled up uncomfortably and to cut tightly
through the body (Rasband & Liechty, 2006:206, 296, 304; Reader’s Digest, 2002:53).
Most (84%) of the participants’ waist height positions were above the normal position (⅝
height) (Table 5.5). A dress made on the basis of the ideal shape’s height proportions is

173
likely to fit tightly at the midriff region, as style lines and darts positions would not be in
harmony with the shape underneath the dress.
5.6.1.3 Fit implications associated with the large bust
In this study, there were 81% participants with large busts and 60% with cup “DD” and above
brassieres’ categories. This indicates that the majority of Kenya’s career women have a large
bust, which implies that they are likely to experience fit problems with apparel designs that
have been based on the ideal shape. According to Rasband and Liechty (2006:194), the
ideal shape’s bust cup is “B”, and the participants’ bust sizes (DD) as observed in this study
were much larger than the ideal shape’s size. An apparel item based on the ideal shape’s
cup size “B” would therefore contain too little fabric and curved shaping to accommodate the
larger bust. This may result in wrinkles forming around the bust line between the armhole
and the bust tip, or radiating from the bust tip to the armhole and the waist. The bodice side
seam may bow forward, while the waistline may pull up at the centre front (Rasband,
1994:86; Rasband & Liechty, 2006:194, 198).
The bust line height positions of all the participants were below the normal position (¾
height) (Table 5.5). A dress made on the basis of the ideal shape’s height proportions will
likely fit tightly at the armhole region and the bust region, as the positions of the darts and
style lines would not be in harmony with the positions of the bust lines and breasts of the
wearer. It should be noted that no tolerance allowances were given above or below the
standards used. If tolerance allowances were given, fewer fit problems would be predicted,
as more shapes would be accommodated within the allowed tolerances.
5.6.1.4 Fit implications associated with the rounded upper back, the hollow back waist and the imbalanced back and front features
The results of this study showed that 79% and 75% of the sample of Kenyan career women
had a fully rounded upper back and a deep hollow back waist, respectively. This suggests
that the majority of the participants are likely to experience fit problems with ready-made
apparel designed on the basis of the ideal shape. The entire back curvature would affect the
fit of an apparel item if the body shape differs from the back curvature of the ideal shape.
The rounded upper back: The upper back part of the body shape curves outward more
than the ideal shape does. Apparel items designed for the ideal shape will therefore have too
little fabric for the length or for the curved shaping in the upper back area to contain the
fullness. Consequently, the apparel may pull tight in the upper back area; diagonal wrinkles

174
may also form between the neck and armhole, while the waist at the centre back may pull
upwards.
The hollow waist: The back curvature tapers sharply to a hollow section at the waist region
– more than for the ideal shape. Apparel items meant for the ideal shape will therefore have
excess fabric length and curved shaping in the lower back waist area. The apparel is
therefore likely to sag, forming vertical folds just below the shoulder blades region (Readers’
Digest, 2002:50; Rasband & Liechty, 2006:154).
Balanced postures: This refers to the alignment of the different parts of the body and the
manner in which the frame is carried (Liechty et al., 1992:37). A correct posture assumes a
balanced alignment of all the body parts over each other and could influence the physical
attractiveness of apparel items (Rasband, 1994:13). Excessively incorrect posture or non-
proportional body characteristics could be termed as a figure variation as it would cause fit
problems (Rasband & Liechty, 2006:29). It was observed in this study that the career
women’s front upper torsos (profile view) were larger than the back upper torso. This means
that the side seams of the ready-made apparel are likely to pull forward to accommodate the
excess fullness at the front. The lower torso from the hipline is imbalanced with all the
participants’ back arc being larger than the front. This implies that the apparel item’s side
seam is likely to pull towards the back to contain the extra width at the lower back.
5.6.1.5 Fit implications associated with the large top arm
The findings of this study demonstrated that the majority of the Kenyan career women in the
sample had large top arms as identified by the visual analysis. This suggests that the
majority of the career women are likely to experience fit problems with the sleeves of ready-
made apparel items. The top arm muscle of these women is larger or carries more weight
than the top arm of the ideal shape. This means that sleeves may not contain adequate
fabric to fit comfortably and attractively around the biceps region, resulting in horizontal
ripples or wrinkles forming around the upper part of the arm. The front and back armhole
may pull towards the arm, while a short sleeve hemline may tend to poke out in the middle
(Rasband, 1994:106-108).

175
5.7 CONCLUSIONS REGARDING FIT IMPLICATIONS ASSOCIATED WITH THE CURVY RECTANGULAR BODY SHAPE
Considering that ready-made apparel items are designed based on the ideal (hourglass)
body shape (Loker et al., 2005; Zwane & Magagula, 2006; Shin & Istook, 2007), career
women in Kenya with the rectangular body shape are likely to be dissatisfied with the fit of
ready-made apparel. This is because their body shapes differ not only from the Western
ideal shape, but also from the Western rectangular shape. The following fit problems may be
expected to be experienced by a woman with a curvy rectangular shape:
Tight fit at the hip region, crotch line and thighs, which may lead to wrinkles and ripples
forming around the affected area. The apparel item could tend to poke out at either
center back or front due to the tight fit.
Tight fit at the waistline that could lead to wrinkles on the waist region, apparel riding
up, and inappropriate style and dart positions due to a waistline that is higher than
normal (⅝ height) or larger than average. Apparel items such as blouses and jackets
are likely to sag loosely, forming vertical folds at the back waist region due to the
hollow waistline
Tight bust line, tight armhole and tight pull in the upper back area, which could result in
diagonal wrinkles forming between the neck and armhole region (bust region and
shoulder blades) due to the large bust, rounded upper back and lower bust line
position than the normal (¾ height) position.
Tight upper arm could result in apparel with horizontal ripples or wrinkles forming
around the upper part of the sleeve.
The knee height position above the normal height position (¼ height) may result in
pants’ style lines (shaping) being inappropriately positioned, and apparel could be tight
around the knee region.
Having looked at the critical fit points and scrutinised the fit implications associated with the
curvy rectangular shape, it has become clear that it would be unrealistic for apparel
industries to continue manufacturing styles that are suitable for the hourglass body shape (fit
model), and expect to fit the curvy rectangular shape appropriately. The quality of apparel in
respect of its fit can only be determined collectively, through dress forms, fit models and
sizing systems, which all have to represent the target population’s sizes and body shapes
(Salusso-Deonier, 1989; Ashdown, Loker & Adelson, 2004; Bougourd in Ashdown, 2007:130,
133).

176
Data analysis and discussion of the findings based on phase two (questionnaire) data, are
presented in Chapter 6.

177
Chapter 6 DATA ANALYSIS AND DISCUSSION OF THE FINDINGS BASED ON PHASE TWO DATA
(QUESTIONNAIRE) 6.1 INTRODUCTION
The focus of this chapter is the statistical analyses of data, interpretation of the results and
the discussion of the findings obtained from evaluating primary objectives 4, 5 and 6 of this
study. In presenting the results, interpretations and discussion of the findings, this chapter
attempts to direct the attention to the stated research objectives and the concomitant sub-
objectives, where applicable.
6.2 DEMOGRAPHIC ANALYSIS OF THE POPULATION (Questions 1 and 2)
The analysis of the demographics of the population served as background for the
examination and interpretation of the findings. The demographic information gathered from a
group of career women in Kenya consisted of their ages and professional backgrounds, as
presented below. These women were questioned about their perception of general fit
problems with ready-made apparel, their knowledge about the communication of size (key
dimensions) and fit (body shapes), and their preferences for differently fitted jackets and
skirts in Kenya.
6.2.1 Age distribution (Question 1)
There were 201 respondents who completed the questionnaire. Their ages were categorised
into three groups, namely: young adults aged between 25 and 32 years, a middle group aged
between 33 and 40 years, and a mature group aged 41 years and above. The middle-aged
(33-40) group had the highest representation (43%), while the young adult group (25-32)
represented 33%. The mature (41+) group had the lowest representation (24%). The majority
of the respondents were middle-aged women, and therefore likely to be more aware of the
dynamics of fashion and more familiar with and critical about the fit of apparel items.

178
6.2.2 Career women’s professional background in Home Science and/or Clothing and Textiles (Question 2)
The data on the career women’s professional backgrounds in the fields of Home Science
and/or Clothing and Textiles, which are thought to adequately equip individuals with skills in
size and fit issues, indicates a balanced distribution between the numbers of respondents.
There were 54% (n =107) with professional backgrounds in Home Science and/or Clothing
and Textiles, and 46% (n = 91) without a professional background in Home Science and/or
Clothing and Textiles. The assumption made here is that respondents with a professional
background in Home Science and/or Clothing and Textiles would be more knowledgeable in
size and fit issues and therefore more likely to experience fewer fit problems, as opposed to
the respondents without a professional background in Home Science and/or Clothing and
Textiles. It was also assumed that respondents without a professional background in Home
Science and/or Clothing and Textiles were uninformed about size and fit issues and so more
likely to encounter problems while making apparel selection in terms of styles and sizes.
6.3 ANALYSIS AND INTERPRETATION OF THE RESEARCH OBJECTIVES 4, 5 AND
6 Note: Primary objectives 1, 2 and 3 were presented and discussed in Chapter 5. Therefore
the order of the objectives in this chapter will not necessarily be in line with their sequence in
the chapter. Considering that this chapter deals with Objectives 4, 5 and 6 only, they are
presented in the order in which they occur throughout this study.
6.3.1 Primary objective 4: To assess and describe career women’s self-perceived fit issues with the ready-made apparel in Kenya (Questions 3, 4)
6.3.1.1 Sub-objective 4.1: To investigate career women’s perception of fit with different
apparel categories that are sold in various retail stores in Kenya (Question 3
and 4)
Questions 3 and 4 measured career women’s perception of fit with the ready-made apparel
from different sources and the ready-made apparel sold through different retail stores. The
investigation was to highlight which ready-made apparel categories were perceived to have
major fit problems, and to pinpoint which retail stores were perceived to sell apparel with
good fit. The results analysed are presented in Figures 6.1 and 6.2 below.

179
010
2030
40
5060
70
80
Perc
enta
ge (%
)
Fit quality of apparel categories
Good fit 78 72 65 30
Fair fit 20 24 31 44
Poor fit 2 4 4 26
Imported (n = 197)
Custom-made (n = 199)
Second-hand (n =194) Local (n = 195)
FIGURE 6.1: QUALITY OF APPAREL CATEGORIES
In Figure 6.1 above it is clear that the imported, custom-made and second-hand apparel
categories are perceived to have the best fit, as indicated by 78%, 72%, and 65% responses,
respectively. Responses concerning good fit in the local ready-made apparel category
counted for 30%, which is far below the imported custom-made and imported second-hand
categories. On fair fit of the ready-made apparel, imported new scored 20%, custom-made
24%, imported second-hand 31%, while the majority (44%) of the respondents maintained a
fair fit view on local ready-made apparel. The majority (26%) of the respondents reported that
the local ready-made apparel category had poor fit, which is a sharp contrast to the imported
new with a score of 2%, and the custom-made and imported second-hand with responses of
4% each. These results imply that Kenya’s career women perceive imported new, custom-
made and imported second-hand ready-made apparel categories as having better fit than the
local ready-made apparel.
The results regarding apparel categories that are sold in various retail stores (Figure 6.2),
indicate that apparel sold in the boutiques, chain stores and second-hand stores had good fit,
as reflected by 84%, 70% and 66% responses respectively. Apparel sold in market stalls
recorded responses of 52%, trade fairs 47%, supermarkets 46%, and factory outlets with the
lowest 22%. Regarding fair fit, factory outlets and supermarkets scored 46% and 42%
responses, respectively, while market stalls recorded 36%, trade fairs 33% and second-hand
stores 29%. Boutiques and chain stores had responses of 15% and 11% respectively.

180
0
1 0
2 0
3 0
4 0
5 0
6 0
7 0
8 0
9 0
1 0 0
Per
cen
tag
e (%
)
F it o f a ppa r e l sold in d if fe r e nt r e ta il stor e s
unde cide d 0 .5 1 9 1 6 1 8 3 2 0Poor f it 0 .5 0 4 6 2 9 1 2Fa ir f it 1 5 1 1 2 9 3 6 3 3 4 2 4 6Good f it 8 4 7 0 6 6 5 2 4 7 4 6 2 2
Bout ique Cha in Se cond Ma r k e t Tr a de Supe r Fa ctor y
Boutiques (n = 196), Chain = Chain stores (n = 180), Second = Second-hand stores (n = 193), Market = Market stalls (n = 190), Trade = Trade fairs (n = 184), Super = Supermarkets (n = 198), Factory = Factory outlets (n = 173)
FIGURE 6.2: FIT QUALITY OF READY-MADE APPAREL SOLD AT DIFFERENT RETAIL
STORES
As for poor fit, Figure 6.2 further show that factory outlets had 12%, supermarkets 9%, and
the rest of the retail stores had responses of between 2% and 6% each. The inference is
that, according to Kenya’s career women, factory outlets sell ready-made apparel with poor
fit, while boutiques, chain stores and second-hand stores sell apparel items with good fit.
6.3.1.2 Sub-objective 4.2: To describe fit problems that career women in Kenya
encounter regarding the specific critical fit points of different parts of their bodies (Question 22)
Question 22 solicited career women’s responses on how they experience fit problems at their
critical fit points. For the purposes of data management and presentation, the body was split
into the upper and the lower torso and the arms. Tables 6.1, 6.2 and 6.3 present the fit
problems encountered at the upper and lower torso and the arms.
Form Table 6.1, it is clear that Kenya’s career women experienced fit problems (too tight or
too loose) – as indicated by percentage responses that range from 58% to 65% – on all the
critical fit points of the upper torso. Regarding problems of tight fit, the bust region had the
highest number of reports, with 37% of the responses. As far as problems of loose fit are

181
concerned, the neckline region had the highest number of responses (43%). For the
problems of length, the highest (41%) number of responses were reports of
normal/acceptable fit.
TABLE 6.1: FIT PROBLEMS ENCOUNTERED AT THE UPPER PART OF THE TORSO
FFiitt PPooiinntt FFiitt pprroobblleemm FFrreeqquueennccyy PPeerrcceennttaaggee
Tight 29 15
Loose Fit problems
87 43 58
Neckline
Normal/acceptable 85 42
Tight 50 25 Loose
Fit problems 71 35
60 Shoulders
Normal/acceptable 80 40
Tight 53 27
Loose Fit problems
69 34 61
Back width
Normal/acceptable 79 39
Tight 75 37
Loose Fit problems
56 28 65
Bust
Normal/acceptable 70 35
Short 64 32
Long Fit problems
54 27 59 Bodice back, nape to
waist Normal/acceptable 83 41
Short 60 30
Long Fit problems
58 29 59 Bodice front, neck to
waist Normal/acceptable 83 41
The inference that may be drawn from the results presented in Table 6.1, here is that most
Kenyan career women experienced fit problems with the widths of ready-made apparel, that
were reported as either too tight or too loose. On average, 61% of the Kenyan career women
reported problems with fit, which is more than the 39% that reported acceptable fit. However,
loose fit problems reported at the upper torso particularly around the back width, shoulders
and neckline, indicate that most of the participants’ upper body’s characteristics deviate from
what the industry use as a base pattern. This confirms the critical fit points of the curvy
rectangular body shape’s upper torso observed in Chapter 5 (paragraph 5.6). Common
body characteristics that could accelerate fit problems within the upper torso of the curvy
rectangular shape include the rounded upper back, the large bust, and the large and high
stomach that is positioned above the ideal figure’s normal waist position.
The lower torso’s critical fit points (Table 6.2) were more prominent than those of the upper
torso. This could have contributed to fewer respondents (26%) reporting problems with tight
fit than those (35%) reporting problems of loose fit with the upper torso’s critical fit points. As
in the case of the stated width fit problems, it is also obvious that more Kenyan career

182
women (59%) encountered problems with length (too short or too long), than those who felt
that the lengths were acceptable (fine). As observed in Chapter 5 (paragraph 5.2), the
majority of the respondents (74%) were in the medium height category, and the majority
(84%) had waist lines positioned higher than the ideal figure’s normal waist position (⅝
height) (Table 5.5). These could have contributed to the more (41%) responses of
acceptable length than the reported shorter (31%) or longer (28%) length fitting problems.
TABLE 6.2: FIT PROBLEMS ENCOUNTERED AT THE LOWER TORSO
FFiitt PPooiinntt FFiitt pprroobblleemm FFrreeqquueennccyy PPeerrcceennttaaggee
Tight 60 30
Loose Fit problems
89 44 74 Waist
Normal/acceptable 52 26
Tight 87 43
Loose Fit problems
46 23 66 Stomach
Normal/acceptable 68 34
Tight 109 54
Loose Fit problems
49 25 79 Hip
Normal/acceptable 43 21
Tight 78 39
Loose Fit problems
42 21 60 Crotch
Normal/acceptable 81 40
Tight 86 43
Loose Fit problems
49 24 67 Buttocks
Normal/acceptable 66 33
Tight 87 43
Loose Fit problems
46 23 66 Thighs
Normal/acceptable 68 34
Short 60 30
Long Fit problems
62 31 61 Skirt length
Normal/acceptable 79 39
Short 55 28
Long Fit problems
71 35 63 Pants Length
Normal/acceptable 75 37
In Table 6.2 above it is clear that Kenyan career women experience more (67%) fit problems
(tight or loose fit) on average, at the lower torso, than acceptable fit (33%). As for problems
with tight fit at the lower torso, the hip region had the highest number of responses (54%),
followed by the stomach and thigh regions, with equal (43%) responses each. The waist
region scored the highest (44%) number of responses for problems with loose fit. For length
problems, there were almost equal representations on the reported longer skirts and pants’
lengths (31% and 35%) and the reported shorter skirts and pants’ lengths (30% and 28%),
which may imply that Kenya’s career women experienced fewer fit problems with length.

183
As in the case of the upper torso, it is also clear that more (69%) Kenyan career women
experience fit problems at their lower torsos’ critical fit points than are satisfied with a normal
or acceptable fit (31%). It is further confirmed that Kenyan career women experience more
(69%) fit problems with the lower torso’s critical fit points than (61%) they experience at the
upper torso. However, among the reported fit problems, generally Kenyan career women
experienced more tight fit problems with the lower torso (42%) than with their upper torso
(26%). These results confirm the critical fit points of the curvy rectangular body shape’s lower
torso that were observed in Chapter 5 (paragraph 5.6). Common body characteristics that
could accelerate fit problems within the lower torso region of the curvy rectangular shape
include the large buttocks, the large thighs and the large stomach that is positioned above
the ideal figure’s normal waist position. These characteristics were more prominent than the
upper torso’s characteristics, which may further confirm the more tight fit problems reported
at the lower torso than at the upper torso.
It is also apparent that there were more (62%) length problems experienced with the lower
torso than the reported acceptable lengths (38%). However, there were almost equal
representations on the reported short (30%), longer (31%) and acceptable (38%) skirts’ and
pants’ lengths, which may confirm that the majority of the respondents (Table 5.2) were in
the medium height category and therefore they were likely to experience fewer length
problems. Length is also dictated by fashion trends, and thus length preference could vary
with different consumers.
TABLE 6.3: FIT PROBLEMS ENCOUNTERED AT THE ARMS
Fit Point Fit problem Frequency Percentage
Tight 67 33
Loose Fit problems
57 28 61 Armscye
(armhole) Normal/acceptable 77 39
Tight 83 41
Loose Fit problems
50 25 66
Upper arm
Normal/acceptable 68 34
Tight 61 30
Loose Fit problems
49 24 54
Elbow
Normal/acceptable 91 46
Tight 44 22
Loose Fit problems
61 30 52
Below elbow
Normal/acceptable 96 48
Short 65 32
Long Fit problems
59 29 61
Sleeve length
Normal/acceptable 77 39

184
In Table 6.3 it is evident that more Kenyan career women (59%), on average, experience
problems (tight or loose) with the arms’ critical fit points than those who do not experience fit
problems (41%). However, 41% of the Kenyan career women reported experiencing
problems of tight fit at their upper arm, which confirms the findings observed in Chapter 5
(Table 5.13) that the majority (59%) of the respondents had full/large biceps regions. The
Kenyan career women also reported experiencing more (61%) problems with the length of
sleeves than those who expressed satisfaction with acceptable length (39%). This could
possibly be attributed to pattern grading processes in the apparel industry, which assume
that the larger the size, the longer the sleeves (Loker et al., 2005; Schofield in Ashdown,
2007:180-188).
6.3.1.3 Sub-objective 4.3: To describe career women’s degree of satisfaction with the
process of finding appropriate ready-made apparel items in Kenya (Question 21)
Question 21 was used to determine consumers’ satisfaction with the process of finding
apparel that fit well, in terms of the search process, the availability of suitable styles and
appropriate sizes, and the availability of fashionable apparel items in appropriate sizes and
styles for the consumers’ body sizes and shapes. The results are presented in Figure 6.3.
0
10
20
30
40
50
60
Perc
enta
ge (%
)
Consumers' satisfaction with the ready-made apparel (n = 200)
Frequent 56 36 26
Less frequent 35 57 50
Never 7.5 6 21
Undecided 1.5 1 3
Problems getting right sizes Satisfied with fit Latest fashion
available
FIGURE 6.3: CAREER WOMEN’S SATISFACTION WITH THE PROCESS OF FINDING
APPROPRIATE READY-MADE APPAREL The results (Figure 6.3) indicate that 91% (56% - frequent + 35% - less frequently)

185
respondents experienced problems getting the right sizes and styles that fit their shapes and
sizes appropriately. Respondents who reported that the latest fashions were less frequently
available in their sizes were 71% (50% - less frequently available + 21% - never available).
Respondents who were less satisfied with the way most ready-made apparel fit their sizes
and their body shapes were 63% (57% - less frequently satisfied + 6% - never satisfied). This
implies that Kenyan career women were not satisfied with the fit and availability of the latest
fashions. Their dissatisfaction with the fit of ready-made apparel was confirmed by 65% (on
average) reporting fit problems experienced at their bodies’ critical fit points (Tables 6.1 and
6.2). The fit implications associated with the distinct curvy rectangular shape of the Kenyan
career women such as tight fit around the hipline, bust line and stomach region (Chapter 5
(paragraph 5.5 and 5.6), may also confirm career women’s dissatisfaction with the fit of
ready-made apparel.
6.3.1.4 Sub-objective 4.4: To explore career women’s self-perceived sources of fit problems with apparel in Kenya (Question 20)
Question 20 asked whether the career women felt that the apparel industry or their body
shapes were the sources of the fit problems they encountered. The results are presented in
Figure 6.4 below.
0
10
20
30
40
50
60
70
80
90
Perc
enta
ge (%
)
Perceived source of fit problems
Agree 89 78
Disagree 10 22
Undecided 1 0
Apparel industry (n=199) Own body shape (n=200)
FIGURE 6.4: CAREER WOMEN’S PERCEIVED SOURCES OF FIT PROBLEMS

186
As Figure 6.4 shows, respondents chose both the options of the apparel industry and own
body shapes as sources of fit problems. Eighty nine per cent identified the apparel industry,
and 78% identified their own body shapes as the source of fit problems. Statistically, there
were significant (0.002 < 0.05) associations between body shape and the apparel industry as
perceived sources of fit problems. This may suggest a possibility that career women in
Kenya were confused regarding the sources of the fit problems they were experiencing with
apparel.
6.3.2 Primary objective 5: To determine and describe Kenyan career women’s knowledge about the communication of size (key body dimensions) and fit (body shapes)
6.3.2.1 Sub-Objective 5.1: To explore Kenyan career women’s knowledge about the
communication of size (Question 6, 13, 14, 15, 16, 17 and 18)
Familiarity with and perceived effectiveness of the size labels: Question 15 was used to
determine from the career women’s viewpoints, which size labels (size description systems)
among the provided types, were familiar to them, while question 18 attempted to ascertain
career women’s perceptions regarding the effectiveness of size labels. The results in this
regard are presented in Figure 6.5.
01 02 03 04 05 06 07 08 09 0
1 0 0
Per
cen
tag
e (%
)
Size la be l's fa m ilia r ity a nd e f fe ct iv e ne ss ( n = 2 0 1 )
Fa m ilia r la be l 9 8 9 8 .5 9 5 3 5 7 3Non- fa m ilia r 2 1 .5 5 6 5 9 3 9 7Ef fe ct iv e la be ls 4 9 6 0 4 4 9 9 9 9 9 8I ne f fe ct iv e la be ls 5 1 4 0 5 6 1 1 2
XL 8 to 2 4 3 2 to 5 0 Code + Pict + Wor dle ss
XL = Extra large lettered label, 8 to 20 = Numbered size codes, 32 to 50 = Numbered (inches) size codes, Code + = Numbered size code and key dimensions, Pict + = Pictogram and key dimensions, Wordless = wordless pictogram (illustrated body shape) FIGURE 6.5: FAMILIARITY WITH AND PERCEIVED EFFECTIVENESS OF SIZE LABELS

187
It is clear from Figure 6.5 that informative size labels, which comprise a code and
measurements, pictogram and measurements, or the wordless pictogram, were less familiar
size labels to the Kenyan career women, as indicated by 35%, 7% and 3% responses
respectively. However, these informative labels scored 98.5% on average, as effective size
labels. As for the uninformative size labels, comprising numbered (8-24), lettered (S-XL) and
numbered (32-50) labels, they were the most familiar size labels, with 98.5%, 98% and 95%
responses respectively. The uninformative labels on average were ranked as effective by
only 51% responses, which is far lower than the responses on informative size labels.
It appears from the results that familiarity with and perceived effectiveness of size labels are
two separate issues that seem to have no association with each other. There were no
significant (0.21 > 0.05) associations between the women’s familiarity with size label terms
and their knowledge in this regard. This possibly suggests that their familiarity with size
labels did not guarantee appropriate and informed apparel selection, as the size labels’
meanings were not understood by the consumers.
Career women’s knowledge about size labels: Questions 16 and 17 were used to
examine the career women’s knowledge about the size labels used on women’s ready-made
apparel. Respondents were supposed to give a correct interpretation of a given size in terms
of the key dimension it represents in a given apparel item. The results are presented in
Figure 6.6.
0
10
20
30
40
50
60
70
80
90
Perc
enta
ge (%
)
Consumers' knowledge on the meaning of size labels (n = 201)
Answered incorrectly 86.5 76.5 75 75 72 76 77 77
Answered correctly 13.5 23.5 25 25 28 24 23 23
Jackt size 16
Jackt size 42
Jackt size XL
Pant size 16
Pant size 42
Pant size XL
Skirt size 16
Skirt size 42
Jacket = Jacket FIGURE 6.6: CAREER WOMEN’S KNOWLEDGE ABOUT SIZE LABELS

188
The results show that the majority of the respondents described the different size labels that
are used on jackets, pants and skirts, incorrectly. The scores on incorrect descriptions of the
different labels ranged from 72% to 86.5%, while scores on correct description of the size
labels ranged from 13.5% to 28%, which is a sharp contrast. An average of 77% respondents
described different size labels incorrectly. This suggests that Kenya’s career women lack
knowledge about the meaning of size labels.
It was assumed that the older the consumers become, the more experienced and
knowledgeable they become, in terms of size labels and appropriate apparel selection.
Apparently, there was no significant (0.21 > 0.05) association between the different age
groups of the respondents and their knowledge about size labels. It is also likely that
consumers’ long experience with size labels does not necessarily guarantee certain
knowledge about size labels. Ignorant consumers end up getting frustrated and confused as
they flip through several assortments of styles and sizes in a retail environment without any
guiding base, as they do not understand the meaning of the size codes presented to them.
Comparisons were made on the interpretation of the size codes on the size labels between
professionals in Home Science/Clothing and the non-professionals, to establish whether their
level of knowledge differed in this regard. There were significant (0.0136 < 0.05) associations
between the knowledge of the professionals in Home Sciences and the size labels’ contents.
The professional Home Scientists scored higher on correct descriptions of size codes and
size labels’ contents than the non-professionals in Home Science. It seems therefore that
formal information on size and fit can equip learners with knowledge regarding the sizing of
apparel.
Career women’s knowledge on their key dimensions: Question 6 asked the respondents
for their key dimensions of bust, waist and hip, and these were compared with the actual
measurements (obtained from them). The aim was to establish whether the career women
were informed about their key dimensions, which are so necessary for identifying correct
sizes. The results are presented in Figures 6.7, 6.8 and 6.9.
Figure 6.7 indicates a generally linear relationship between the bust dimensions reported
and those measured. However, there are outlying individuals outside the general trend. This
illustrates that the reported bust dimensions had a moderate relationship with the obtained
bust dimension as indicated by the coefficient of correlation (r = 0.55). Statistically, this
relationship was significant (0.0001< 0.05).

189
Actual bust dimensions versus reported bust dimensions
75
85
95
105
115
125
135
75 85 95 105 115 125 135
Actual bust dimensions
Rep
orte
d bu
st d
imen
sion
s
FIGURE 6.7: SCATTER PLOT COMPARING REPORTED BUST DIMENSIONS WITH OBTAINED BUST DIMENSIONS
The nature of the relationship shown in Figure 6.7 show that there were a few respondents
who accurately reported their bust dimensions; therefore one could say that Kenya’s career
women were partially knowledgeable about their bust dimensions.
Figure 6.8 clearly shows that there is a generally linear relationship between the reported
waist dimension and the actual waist dimension. However, there are more outlying
individuals in this instance. The career women’s reported waist measurement and their
actual waist dimension indicated a partial relationship (r = 0.52). Statistically, there was a
significant (0.0001 < 0.05) relationship between the reported waist dimensions and the actual
waist dimensions – suggesting that the career women were also moderately knowledgeable
about their waist dimensions, as for their bust dimensions.
(r = 0.55, p < 0.0001)

190
Reported waist dimensions versus actual waist dimensions (n = 123)
60
70
80
90
100
110
120
130
60 70 80 90 100 110 120 130
Actual waist dimensions
Rep
orte
d w
iast
dim
ensi
ons
FIGURE 6.8: SCATTER PLOT COMPARING REPORTED WAIST DIMENSIONS AND
OBTAINED WAIST DIMENSIONS
Reported hip dimensions versus measured hip dimensions (n = 123)
80
90
100
110
120
130
140
150
80 90 100 110 120 130 140 150
Actual hip dimensions
Rep
orte
d hi
p di
men
sion
s
FIGURE 6.9: SCATTER PLOT COMPARING REPORTED HIP DIMENSIONS WITH
OBTAINED HIP DIMENSIONS Figure 6.9 above indicates a generally linear relationship between the reported and the
measured hip dimensions. However, there are a few outlying individuals outside the general
trend. This illustrates that the reported hip dimensions had a strong relationship with the
obtained hip dimension, as indicated by the coefficient of correlation (r = 0.68). Statistically,
there was a significant (0.0001 < 0.05) relationship between the reported hip dimension and
the actual (obtained) hip dimension. The majority of the career women reported their hip
(r = 0.53, p > 0.001)
(r = 0.52, p > 0.0001)

191
dimensions more accurately than their bust and waist dimensions; hence they were more
knowledgeable about their hip measurements.
Career women’s knowledge about their sizes: Questions 13 and 14 solicited responses
concerning career women’s own sizes, expressed in even numbers 8 to 24 and 32 to 50,
respectively. The actual key dimensions of the bust, the waist and the hips obtained from
respondents were used to compare with their reported sizes (bust and hips). The reported
sizes were converted to bust, waist and hip measurements according to Kenyan size
standards (Appendix 4A), to facilitate comparisons with the corresponding actual body
dimensions for the reported sizes. For the purposes of brevity, examples of visual
representation of correlations between reported sizes in designations of even numbers (8 to
24) and in designations of even numbers (32 to 50) are presented in Figures 6.10 and 6.11.
Reported jacket sizes versus actual bust dimensions in sizes designation (12 -24) (n = 123)
75
85
95
105
115
125
75 85 95 105 115 125
Actual bust dimensions
Rep
orte
d ja
cket
siz
es
FIGURE 6.10: SCATTER PLOT COMPARING REPORTED JACKET SIZES (BUST) WITH
THE OBTAINED BUST DIMENSIONS IN SIZE DESIGNATION OF 12 TO 24 Figure 6.10 shows a generally linear relationship between reported jacket sizes and the
measured (actual) bust dimensions, although there are some outlying individuals outside the
general trend. This illustrates that the reported jacket size had a moderate relationship with
the obtained bust dimension, as indicated by the coefficient of correlation (r = 0.53).
Statistically, there was a significant (0.0001 < 0.05) relationship between the reported jacket
sizes and the obtained bust dimensions. As in the case of the reported jacket sizes in size
designation of even numbers (12-24), the other reported apparel sizes maintained a similar
pattern of linear relationship with some outlying individuals outside the general trend line
(r = 0.68, p < 0.0001)

192
Reported jacket sizes versus obtained bust dimensins in sizes designation (32-50)
75
85
95
105
115
125
75 85 95 105 115 125
Obtained bust dimensions
Rep
orte
d ja
cket
siz
es
(Figure 6.10). There were moderate relationships between the reported apparel sizes and
the obtained (actual) dimensions of bust and hip: reported dress sizes (bust) (r = 0.51, p >
0.001), reported skirt size (hip) (r = 0.58, p > 0.0001), and the reported trousers size (hip) (r =
0.56, p > 0.0001). Statistically, the relationships were significant (p < 0.005). The inference
that can be drawn is that Kenya’s career women were moderately knowledgeable about their
sizes, designated in even numbers 12 to 24.
An example of the visual representation of the correlations between the reported sizes in
designations of even numbers (32 to 50) is presented in Figure 6.11.
FIGURE 6.11: SCATTER PLOT COMPARING REPORTED JACKET SIZES (BUST) WITH THE OBTAINED BUST DIMENSIONS IN SIZE DESIGNATION OF 32 TO 50
Figure 6.11 demonstrates that, although there is a generally linear relationship between
reported the jacket sizes and the measured (actual) bust dimensions, there are more outlying
individuals outside the general trend. This illustrates that the reported jacket size had a poor
relationship with the obtained bust dimension, as indicated by the coefficient of correlation (r
= 0.32). Statistically, there was a significant (0.0033 < 0.05) relationship between the
reported jacket size and the obtained bust dimensions. As in the case of the reported jacket
in size designation of even numbers (32-50), all the other reported apparel sizes had
similarly poor relationships between the reported apparel size (bust or hip) and the obtained
dimensions (bust or hip): reported dress sizes (bust) (r = 0.32, p > 0.0041), reported skirt size
(r = 0.32, p > 0.0033)

193
(hip) (r = 0.44, p > .0001), and the reported trousers size (hip) (r = 0.45, p > 0.001).
Statistically, there were significant relationships between the reported sizes and the obtained
measurements. It appears that Kenya’s career women were moderately knowledgeable
about their sizes designated with even numbers 12 to 24, but were poorly knowledgeable
about their sizes designated with even numbers 32 to 50.
6.3.2.2 Sub-objective 5.2: To explore Kenyan career women’s knowledge about the communication of fit (Questions 5, 7, 8, 9, 10, 11 and 12)
The meaning of the terms used on size labels to represent established body shapes has
been explained in chapter 3 (paragraph 3.2.2.1). Question 5 had two sections. Section one
was used to determine whether the career women were familiar with the terms used on size
labels to represent established body shapes, while the second section was to examine
whether the respondents understood the meaning of those terms. Answers were accepted as
correct based on a brief description of the height, approximate age and body width
characteristics according to the literature (Chapter 3 (paragraph 3.2.2.1)). The results on
both the respondents’ familiarity with and their knowledge about the terms used on size
labels are presented in Figures 6.12.
0102030405060708090
100
Perc
enta
ge (%
)
Carreer women's familiarity with and knowledge about terms used to represent body shapes (n = 201)
Unfamiliar terms 79 76 73 61 56
Familiar terms 29 24 27 39 44
Incorrectly described 97 99 97 96 100
Correctly described 3 1 3 4 0
Women's-petite Misses Misses-
petite Women's Junior
FIGURE 6.12: CAREER WOMEN’S FAMILIARITY WITH AND KNOWLEDGE ABOUT TERMS THAT REPRESENT BODY/FIGURE SHAPES
Regarding the respondents’ familiarity with the terms that represent body shapes, the results

194
show that women’s-petites, misses and misses-petites were reported as unfamiliar by 79%,
76% and 73% responses, respectively, while women’s and junior labels were reported as
unfamiliar by 61% and 56% respondents, respectively. On average, all the terms were
reported as unfamiliar by 69% responses, which is in sharp contrast to the terms reported as
familiar (31%). Therefore, this suggests that terms used on size labels to indicate different
body shapes were less familiar to Kenya’s career women.
As for the respondents’ knowledge about the terms that represent body shapes (Figure 6.12), it is clear that 100% and 99% of the respondents, respectively, described junior and
misses labels incorrectly. Misses-petites and women’s petites were each incorrectly
described by 97% of the respondents, while 96% respondents incorrectly described the
women’s label. On average, 98% respondents incorrectly described all the terms, suggesting
a high level of ignorance/lack of knowledge about body shape terms represented on size
labels. There was a statistically significant (0.0001 < 0.05) association between consumers’
familiarity with the size label terms (representing body shapes) and their knowledge. The
nature of the association was that consumers scored higher on the familiar terms than on the
unfamiliar terms. There was no statistically significant (0.63 > 0.05) association between their
familiarity with size label terms and a professional background in Home Science/Clothing and
Textiles, but statistically significant (0.02 < 0.05) associations were found between their
knowledge and their professional background. Respondents with a Home Science/Clothing
and Textiles professional background had higher scores on description of some familiar
terms than those without such a professional background. The deduction could be made that
a professional background in Home Science/Clothing and Textiles could possibly influence
consumers’ knowledge about the terms used on size labels to represent body shapes.
It was assumed that older career women would be more knowledgeable about body shape
terms than the younger women. There was no statistically significant (0.42 > 0.05)
association between career women’s age and their knowledge about size label terms used to
describe body shapes. This may suggest that the longer experience of the older group does
not guarantee knowledge about the size label terms.
Career women’s knowledge about illustrated body shapes: Question 8 was used to
determine whether the career women could physically identify and describe the different
illustrated figures within the five prevalent established body types (Triangle, Inverted triangle,
Apple, Rectangle and Hourglass). Figure 6.13 below presents the results.

195
0
10
20
30
40
50
60
70
Perc
enta
ge (%
)
Consumers knowledge about illustrated body shapes (n = 201)
Incorrect description 67 67 65 59 50
Correct description 33 33 35 41 50
Pear Barrel Apple Rectangle Hourglass
FIGURE 6.13: CAREER WOMEN’S DESCRIPTION OF THE PREVALENT ILLUSTRATED
BODY SHAPES
Figure 6.13 shows that the pear and barrel body shapes were both incorrectly described by
67% of the respondents, while 65%, 59% and 50% of the respondents respectively,
described the apple, rectangle and hourglass body shapes incorrectly. On average, the
majority (62%) of the respondents described all the body shapes incorrectly. As in the case
of size label terms that represent body shapes (Figure 6.13), Kenyan career women were
also ignorant of the five prevalent body shapes.
Career women’s knowledge about their own body shapes: Question 7 was used to
determine whether the career women’s self-reported own body shapes were the true
representation of their body shapes. Illustrations of different figures were presented for them
to select one that they felt was an approximate representation of their own body shapes. To
authenticate their knowledge, the self-reported body shapes were compared with their actual
figure types that emerged from the measurements and photographs.
The results presented in Figure 6.14 indicate that respondents with a rectangular body
shape were 74%, while only 14% of the respondents reported the rectangle body shape as
their own. From the measurements, there were 21.5% Triangular body shapes, but 24% of
the respondents self-reported the pear body shape as their own. Respondents with apple,
hourglass and inverted triangular body shapes from the body measurements were least
represented (1.5%).

196
0
10
20
30
40
50
60
70
80
Perc
enta
ge (%
)
Body shape from measurements versus self-reported body shape
Body shape from themeasurements (n = 123)
74 21.5 1.5 1.5 1.5
Participants' self-reported bodyshape (n = 183)
14 24 16 37 9
Rectangle Triangle Apple Hourglass Inverted triangle
FIGURE 6.14: CAREER WOMEN’S SELF-REPORTED BODY SHAPE VERSUS THEIR ACTUAL FIGURES FROM MEASUREMENTS
From Table 6.14, it also shows that 37% of the respondents self-reported the hourglass body
shape as their own, which is a higher percentage than the other self-reported shapes, which
scored between 9% and 24%. Again, it is clear that the Kenyan career women were not only
uninformed about the different body shapes (Figures 6.12 and 6.13), but were also
uninformed and unrealistic about their own body shapes. The majority of them gave the
impression that they perceive their shapes as the hourglass body shape.
Career women’s application of body shape assessment techniques: Question 9 was
used to further explore whether the consumers’ knowledge about their own figures had been
enhanced by self-evaluative techniques learnt through reading, observing or any other
medium.
Shown in Figure 6.15 the results depicts that, except for the use of a mirror (64%) and the
key dimensions (50%) as reported body shape assessment techniques applied by the
respondents, all the rest of the techniques were least applied by the majority of the
respondents. On average, 74% of the respondents did not apply self-evaluation techniques
to determine their body shape.

197
0
10
20
30
40
50
60
70
80
90
100
Perc
enta
ge (%
)
Body shape assessment techniques applied by career women (n = 198)
Not applied 94 94 94 94 76 50 36
Applied 6 6 6 6 24 50 64
Trace Told Yard Photos Comp Measure Mirror
Trace = Tracing body outline against the wall, Told = told by friends, Yard = use of yardstick, photos = use of
photographs, Comp = Comparing with established illustrations, Measure = use of key body dimensions, and Mirror
= use of mirror in minimal apparel
FIGURE 6.15: BODY SHAPE ASSESSMENT TECHNIQUES APPLIED BY KENYAN
CAREER WOMEN
The results (Figure 6.15) is evident that the majority of Kenyan career women apply
inadequate body shape assessment techniques. These findings therefore confirm the
participants’ ignorance about the prevalent rectangular body shape, or their own shapes as
observed in this study (Figures 6.13 and 6.14).
Career women’s knowledge about appropriate styles for their perceived own body
shapes: Question 12 was used to further establish career women’s knowledge of their own
body shapes. The question asked respondents to select appropriate styles for their perceived
own body shapes from different styles that were provided. Answers given were accepted as
correct if the respondents chose styles corresponding to each body shape as given in Table 6.4. The styles assigned to each body shape underwent the professional experts’ scrutiny.

198
TABLE 6.4: APPROPRIATE APPAREL STYLES FOR DIFFERENT BODY SHAPES
1
2
3
4
5
J A C K E T S
Triangle (Pear) Hourglass
Apple Hourglass Rectangular Inverted triangle
Inverted triangle
1
2
3
4
5
S K I R T S
Triangle (Pear) Hourglass
Apple
Hourglass Triangle (Pear)
Inverted triangle Rectangular
Inverted triangle Rectangular Hourglass
Inverted triangle Apple
1
2
3
4
5
P A N T S
Rectangular Inverted triangle
Apple Triangle (Pear)
Triangle (Pear) Hourglass
Rectangular Inverted triangle Hourglass
Results on selected styles are presented in Figure 6.16 below. It is clear from the results
presented in Figure 6.16, that 63%, 58% and 56% of the respondents selected inappropriate
styles for their self-reported rectangular, pear and apple body shapes, respectively. Forty-
nine per cent and 47% of the respondents selected inappropriate styles for their self-reported
hourglass and barrel body shapes. On average, 54% of the respondents selected incorrect
styles for their reported (perceived) body shapes. As was shown in Figures 5.2 in Chapter 5
and 6.14, the most prevalent body shape in this study was rectangular (74%); however, only
37% of the respondents were able to select appropriate styles for this figure. Therefore it is
once again observed that Kenyan career women were ignorant and unrealistic about their
body shapes (Figures 6.13), but were also ignorant and unrealistic about suitable styles for
their perceived body shape as well as their actual body shape.

199
0
10
20
30
40
50
60
70
Perc
enta
ge (%
)
Consumers' selected styles for self-reported body shape (n = 180)
Inappropriate styles 63 58 56 49 47
Appropriate styles 37 42 44 51 53
Rectangle Triangle Apple Hourglass Inverted triangle
FIGURE 6.16: SELECTED STYLES FOR THE REPORTED OWN FIGURE TYPE
Career women’s perceived ideal body shape: Question 10 was used to determine the
career women’s perceived ideal body shape and to find out whether they considered their
own body shapes as ideal. The results are presented in Figure 6.17.
0
10
20
30
40
50
60
70
80
Perc
enta
ge (%
)
Ideal body shape versus self-reported body shape
Ideal shape (n = 200) 76 14.5 8 0 1.5
Self-reported shape (n =183) 37.5 24 15.5 14 9
Hourglass Triangle Inverted triangle Rectangle Apple
FIGURE 6.17: CAREER WOMEN’S PERCEIVED IDEAL BODY SHAPE VERSUS REPORTED OWN BODY SHAPE
The results indicate that 76% respondents reported the hourglass body shape as their ideal
shape. However, 37.5% respondents also reported the hourglass body shape as their own

200
shape. Only 14.5% respondents reported the triangular shape as their ideal shape, while
24% reported the triangular body shape as their own body shape. Eight per cent of the
respondents reported the inverted triangle body shape as the ideal shape, and 15.5%
selected the inverted triangle body shape as their own shape. There were 1.5% respondents
selecting the apple as the ideal shape, but 9% respondents selected the apple as their own
shape. Kenyan career women were therefore not only unrealistic about their own body
shapes, but they also did not perceive their own shapes as the ideal body. This could
possibly indicate that Kenyan career women were dissatisfied with their own shapes (body
cathexis). If apparel styles selected were not providing the expected appearance on one’s
body shape, as observed with the perceived ideal shape, it may generate a negative feeling
towards one’s body rather than to the apparel. Ultimately, one’s body is blamed for the poor
fit of the apparel.
6.3.3 Primary objective 6: To determine and describe how career women’s preferences for differently fitted skirts and jackets may contribute to fit problems with apparel (Question 19)
Question 19 was used to explore the Kenyan career women’s fit preferences for differently
fitted apparel items (skirts and jackets), and to compare their fit preferences with the critical
fit points of their distinctive rectangular body shape (Chapter 5 (Figure 5.10)), as well as
their selected styles (Figure 6.16), in order to establish how their fit preferences could
contribute to the fit problems they were experiencing.
The results are presented in Figure 6.18, which clearly demonstrate that the majority of the
Kenyan career women preferred to wear fitted and semi-fitted skirts and jackets often, and
sometimes to work. Contrary to their preferences for the fitted and the semi-fitted skirts and
jackets, the majority of the respondents prefer never to wear loose fitting skirts and jackets to
work. This suggests that the majority of Kenya’s career women prefer fitted and semi-fitted
skirts while they least prefer loosely fitted skirts to work.
The fit preferences for differently fitted skirts and jackets were examined among different age
groups of the career women. Statistically there were no significant associations between age
and the fit preferences for fitted skirts (0.0652 > 0.05), semi-fitted skirts (0.8966 > 0.05) or
loosely fitted skirts (0.9817 > 0.05). This may possibly imply that a fit preference for
differently fitted skirts is not influenced by the age of the consumers.

201
0
10
20
30
40
50
60
70
80
90
100
Percentage (%)
Consumers' fit preferences
Undecided 2 1 2 4 11 10 Never 9 12 13 9 45 33 Sometimes 23 36 33 33 25 32 Often 66 51 52 54 19 25
Fitted skirt (n = 173)
Fitted jacket (n = 166)
Semi-fitted skirt (n =168)
Semi-fitted jacket (n = 166)
Loosely fitted skirt (n = 152)
Loosely fitted jacket (n = 167)
FIGURE 6.18: CAREER WOMEN’S FIT PREFERENCES FOR DIFFERENTLY FITTED
SKIRTS AND JACKETS
There were also no significant associations between age and fit preferences for fitted jackets
(0.0652 > 0.05) or semi-fitted jackets (0.1445 > 0.05). There was a tendency (p < 0.1) of
association between fit preferences for fitted jackets and the younger age group. There were
significant (0.0247 < 0.05) associations between the mature age group and the fit preference
for loosely fitted jackets. This may suggest that some of the older women prefer loosely fitted
jackets, while the younger age group prefers the jackets with a tighter fit. Comfortable
apparel items are possibly more important to the older group, while stylish fashion and not
necessarily comfort could be a driving force for the younger group.
Kenyan career women’s fit preference versus the critical fit points for their distinctive
rectangular body and chosen styles: It is clear that Kenyan career women prefer to wear
fitted and semi-fitted skirts and jackets to work (Figures 6.18). The critical fit points for the
rectangular body shape deviate from those for the so-called ideal body shape. As observed
in Chapter 5, the majority of the participants had large thighs (76%), large buttocks (91%)
and large stomachs (70%), a fully rounded upper back (70%) and a large bust (60%). Where
body shape characteristics are not considered in the manufacturing of ready-made apparel, a

202
person with such prominent critical fit points is likely to experience tight fit problems around
those prominent body features. If the majority of the available designs were based on the
understanding of the curvy rectangular body shape, fitted skirts and jackets would be made
to cater for their preferred apparel. Where no body shape characteristics are considered in
the manufacturing of ready-made apparel, the curvy rectangular body shape could be
accommodated more comfortably and pleasingly by loosely fitted apparel, as it contains
enough ease of design (style) and wearing (comfort). In such instances, the fit problems
encountered could be ascribed to inappropriate fit preferences that do not take into account
consumers’ body shapes and the critical fit points associated with those shapes.
Statistically, there were significant (0.048 < 0.05) associations between the fit preferences for
a fitted skirt and the acceptable fit at the stomach region, and significant (0.0208 < 0.05)
associations between the fit preferences for a semi-fitted skirt and the fit problem of tightness
experienced at the thigh region. Respondents who reported having acceptable fit at the
stomach region preferred a fitted skirt, while those with fit problems of tightness at the thigh
region preferred a semi-fitted skirt. There were significant (0.0011 < 0.05) associations
between the fit preferences for a semi-fitted jacket and the fit problem of tightness
experienced over the bust region. Respondents who reported fit problems of tightness over
the bust region preferred a semi-fitted jacket. These results may suggest that the comfort
required around the stomach, the thighs and the bust regions could determine the degree of
ease/comfort necessary in the skirts and jackets for some Kenyan career women.
6.4 OVERALL DISCUSSION OF THE RESEARCH OBJECTIVES
6.4.1 Assessing and describing career women’s self-perceived fit issues with the ready-made apparel in Kenya (Primary objective 4)
The highly rated quality of imported new (78%), custom-made (72%) and imported second-
hand (65%) ready-made apparel in terms of good fit, may be explained in terms of appealing
characteristics compounded in imported apparel such as a variety of styles, good
workmanship, quality fabrics and brand names (Mason, 1998:90; McCormick et al., 2002),
rather than in stipulations of excellent fit. The consumers’ “ego” associated with imported
apparel could also be seen as an issue affecting their purchasing of imported new and used
apparel as opposed to the local apparel, which recorded highest poor fit responses and the
lowest good fit responses (Li & Gallup, 1995; Hansen, 1999:359; Mhango & Niehm, 2005).
By virtue of imported and sometimes branded labels attached to the apparel, consumers may
not even reflect on any of the other necessary considerations such as fit, before purchasing

203
the apparel item (Agbonifoh & Elimimian, 1999). De Klerk and Tselepis (2007) observed that
consumers may use extrinsic aspects to select apparel items that would not necessarily
satisfy their fit needs but that would rather satisfy their emotional needs.
The good fit of custom-made apparel could be ascribed to the fact that tailors gain
experience through constant interaction with the body shapes and dimensions of their
consumers. Tailors’ frequent interaction with and observations of different body shapes and
dimensions facilitate a continuous learning process, enabling them to make better-fitting
apparel. Kenya’s locally made apparel was ranked last in terms of good fit and recorded the
highest poor fit (26%) responses, higher than all the other categories. The poor fit could be
ascribed to poorly skilled personnel in the apparel industry, inadequate and outdated
machinery and lack of quality raw materials in Kenya’s apparel industries, as observed by
Mason (1998) and McCormick et al. (2001). Other reasons could also be the
unrepresentative sizing systems in terms of the body shapes and dimensions of the current
population (Zwane & Magagula, 2006; Shin & Istook, 2007; Honey & Olds, 2007).
As for the fit of imported apparel, new and ready-made imported apparel items are sold in
boutiques and chain stores, which respectively scored 84% and 70% responses on good fit.
The second-hand stores recorded 66% responses on good fit, as they sell imported
exclusive, second-hand, ready-made apparel. Although apparel items available in boutiques
and second-hand stores may be limited in varied sizes, they do offer unique and good-quality
apparel in terms of materials/workmanship (Mhango & Niehm, 2005). In addition to offering
unique and good-quality apparel, chain stores ensure customer satisfaction, as highlighted
by Otieno et al. (2005).
Market stalls were ranked fourth, with 52% responses, while supermarkets and trade fairs
were ranked fifth and sixth with 47% and 46% responses respectively. It should be noted that
the market stalls, supermarkets and trade fairs sell mixed apparel merchandise, ranging from
local ready-made, imported new and imported second-hand apparel. The quality of the
apparel varies from fair to poor, depending on the categories available in each case. Most of
these stores have inadequate fitting rooms and therefore the consumers cannot adequately
assess the fit of apparel items before purchasing. All these factors explain the quality of
apparel sold. A factory outlet, which was ranked last (22%), sells locally made apparel items
of poor quality. According to Rasband (2001a:8), the apparel merchandise in a factory outlet
is cheap and is usually made of low-grade materials and shows poor workmanship.
Contrary to the Kenyan career women’s perceived good fit of the imported new and second-
hand ready-made apparel, as well as of the ready-made apparel items sold in boutiques,

204
chain stores and second-hand stores, they expressed dissatisfaction with the way that ready-
made apparel items fit their critical fit points. On average, the majority (65%) of the career
women in the sample reported more problems with either tight or loose fit than they reported
an acceptable fit (35%) at the various fit points of the upper and the lower torsos.
Considering that most ready-made apparel items are based on the hourglass body shape,
which is considered ideal in the apparel industry (Newcomb & Istook, 2004a & 2004b; Zwane
& Magagula, 2006), such fit problems are inevitable because Kenya’s distinctive body shape
is a curvy rectangle type (Chapter 5, paragraph 5.2.3.2), with body characteristics that do
not match those of the well-proportioned ideal body shape. Therefore, apparel items
produced with grading based on standard linear surface increments (Schoefield & LaBat,
2005a & 2005b) would not fit these career women’s distinctive shape with their unique
features. Regarding fit problems with length, it is also apparent that more of the Kenyan
career women (61%) encountered length-fitting problems (reported too short or too long),
than those who felt that the lengths were acceptable (39%). As in the case of width
problems, the length problem points in most cases to the linear proportional grading theory
that underlie most pattern development systems, and have been cited as the major
contributing factor to length fit problems (Bye & Delong, 1994; Loker et al., 2005; Schofield,
2007 in Ashdown, 2007:180, 188).
Finding apparel items that fit well can be time-consuming and frustrating, particularly to
female consumers who often have to try on several assortments before finding one item that
fits (Ashdown, 1998; Workman & Lentz, 2000). When the respondents were asked whether
they were generally satisfied with the fit of ready-made apparel (Figure 6.3), 75% of the
career women expressed dissatisfaction with the fit of ready-made apparel – generally in
terms of the search process, the available styles and the latest fashion in appropriate styles
and sizes. These results concur with the findings of Kurt Salmon Associates (1996) in the
United States of America and Otieno et al. (2005) in the United Kingdom, that over 50%
female consumers were dissatisfied with the fit of ready-made apparel. The dissatisfaction
with ready-made apparel may be due to frustrations and confusions encountered during a
search for apparel. Female consumers flip through several assortments of styles and sizes
trying to get apparel items that may fit correctly (Ashdown, 1998; Workman & Lentz, 2000;
Otieno et al., 2005). Frustration in their search for apparel are thought to be brought about by
non-standardised sizes between styles, designers and manufacturers that employ different
body measurement techniques, marketing gimmicks and varied quality control practices
(Hudson, 1980; LaBat & DeLong, 1990; Solomon & Rabolt, 2004:10-11). The different size
codes are also not instructive enough to guide the consumers while selecting apparel, but
are rather confusing as many size codes do not directly relate to female body dimensions
(Workman, 1991; Chun-Yoon & Jasper, 1995 & 1996; Holzman, 1996). In this study, the

205
group of career women also lacked knowledge about the meaning of the terms used on size
labels (Figures 6.6 & 6.10), which could actually serve as useful guides in the selection of
apparel.
Inadequate understanding, worsened by confusion, could result in apparel items failing to
meet the specific needs of the consumer (Mitchell & Papavassiliou, 1999). Experienced
consumers are adept at forming choice-sets. Experience helps to make potential consumers
selectively observant. Kenya’s career women’s perceptions concerning the sources of the fit
problems they are experiencing (Figure 6.4), demonstrated that the majority of them felt that
both the apparel industry (89%) and their body shapes (78%) were the sources of fit
problems.
Informed consumers with adequate knowledge about the products they buy, have a better
chance to locate the locus of the cause of the problem and perhaps link the apparel
manufacture with the fit problems. Because of the Kenyan career women’s lack of knowledge
about size (77%) and fit (98%) issues (Figures 6.6 and 6.12), they may be confused
concerning the source of fit problems common to the ready-made apparel, and hence
attribute the locus of the problem externally by blaming the industry or internally by blaming
their own bodies (Weiner, 1986). However, if the consumers blamed their bodies for the fit
problems, they would negatively direct their disappointing experience encountered with
apparel to their bodies, rather than to the apparel items, as stated by LaBat (1990), Fiore and
Kimle (1997:30) and Yu , 2004:33). In cases where the consumers blame their bodies for fit
problems, they would probably experience their bodies negatively, while they suffer financial
loss and exploitation by the industry. They would also possibly develop emotional distress
resulting from the continuous purchasing of substandard apparel items. Mitchell and
Papavassiliou (1999) observed that inadequate, ambiguous, conflicting and misleading
information often lead to consumers’ confusion, whereas confusion can affect both their
rights and the quality of their decisions. Confused consumers are less able to process
information and are more vulnerable to making less than optimally appropriate choices in
apparel styles and sizes. Ultimately, they end up with inappropriately fitting apparel.
6.4.2 Determining and describing Kenyan career women’s knowledge about the
communication of size (key body dimensions) and fit (body shapes) (Primary objective 5)
A size label is supposed to communicate size to the consumers, with clearly indicated body
dimensions, as it is a manufacturer-to-consumer communication channel to enable
consumers to make efficient purchase decisions (Chun in Ashdown, 2007:220). Misleading

206
information often leads to consumers’ confusion, and confusion can affect the quality of
consumers’ decisions (Mitchell & Papavassiliou, 1999; Mason, De Klerk, Sommervile &
Ashdown, 2008). It was therefore necessary to explore which size labels were familiar to the
group of Kenyan career women to establish whether the information displayed on size labels
was useful enough to the consumers. The findings of this study (Figure 6.5) indicate that
uninformative/tacit labels were on average familiar to the majority (97%) of these women, but
were ranked as effective by only 51% of the respondents. The informative labels were much
less familiar (7%), but overwhelmingly, 99% respondents ranked them as effective. It
appears that Kenya’s apparel industries continue to use the tacit labels contrary to KEBS
(2001:8)/Appendix 4B recommendations, and regardless of the inadequacy of the
information to guide consumers in their selecting and purchasing of ready-made apparel. A
size label is supposed to communicate sizes and body types to the consumers, with clearly
indicated body dimensions and a description of the body type that the apparel item was
designed to fit (KEBS, 2001:8; Faust et al., 2006). It should specify whether the person is tall
with large/small bust and large/small hips, short with large/small bust and large/small hips, or
regular (medium height) with large/small bust and large/small hips (Glock & Kunz, 1995:108;
Chun-Yoon & Jasper, 1995; Chun-Yoon & Jasper, 1996).
With the majority of the career women in the group ranking the informative labels as
effective, this validates that each apparel item should bear a label that is well understood by
the consumers and that will require minimal explanation to the consumers – regardless of the
price, type of apparel or even the manufacturer. The Kenyan career women’s preference for
informative size labels affirms the findings of Chun-Yoon and Jasper’s (1995) study that the
majority of consumers prefer the wordless pictogram, which is self-explanatory. These
findings also support the recommendations by KEBS (2001:7) and Faust et al. (2006) that
size labels should be adequate, legible and durable to serve as future reference for the
consumers.
It was necessary to gauge whether career women’s knowledge concerning different labels
was adequate to provide for an informed and appropriate apparel selection. However, the
results (Figure 6.6) clearly demonstrated that career women lacked knowledge about size
labels, with the majority of them (77%) giving incorrect meanings for the size codes and size
contents. This highlights the fact that the size labels that are familiar to the Kenyan career
women were not instructive enough to provide useful guidance for them when selecting
appropriate apparel sizes.
Workman (1991), Desmarteau (2000) and Brown and Rice (2001:147-148) underline the
importance of consumers’ knowing their own key dimensions, and also which body

207
dimensions are necessary for the selection of specific apparel items. It was clear (Figures 6.7, 6.8 and 6.9) that the Kenyan career women in the group were only partially
knowledgeable about their bust and waist dimensions, but they were more knowledgeable
about their hip dimensions. These findings concur with Alexander, Connell and Ulrich’s
(2005) findings (in the United States of America) that women understood their hip
measurement better than their bust and waist dimensions. An observation from this study
(Chapter 5 (Table 5.9)) was that the majority (91%) of the respondents had large buttocks,
which are directly related to the hip dimensions. Problems with a tight fit over the hips (54%),
the buttocks (43%) and the thighs (43%), were reported (Table 6.2) – again confirming that
these regions may call for closer attention.
A consumer with a prominent hip region is most likely to experience problems of tight fit,
which may aggravate her desire to understand the measurements associated with it. Chun
(in Ashdown, 2007:226) emphasises that consumers have to know their body dimensions to
identify their apparel size and to be able to make appropriate size and style selections.
Accurate knowledge about one’s body dimensions can also facilitate a thorough and
accurate assessment of apparel sizes. If size labels were informative (self-explanatory) it
would be easy for the consumers to compare the information provided on them with their
own key dimensions. Uninformative labels combined with consumers’ ignorance about the
meanings attached to the labels can contribute to consumers’ confusion and inappropriate
apparel selection. In the event that the consumers understand the meaning of the codes
used on size labels and their contents, their knowledge about the key body dimensions
becomes useful for the selection of appropriate styles and sizes (Mason et al., 2008).
Participants’ knowledge about their sizes in different size designations (Figures 6.10 and
6.11) indicated that Kenya’s career women were moderately knowledgeable about their sizes
designated with numbers 8 to 24, but were poorly knowledgeable about sizes designated
with the even numbers 32 to 50. These findings substantiate Yoon and Radwin’s (1994)
results that consumers’ estimations of their body sizes were not accurate. Zwane and
Magagula (2006) report that most developing countries in Africa use adapted versions of the
British sizing systems that cannot reflect the true picture of the intended consumers in
developing countries.
It has also been observed that the lack of standardisation in sizing systems occurs not only
with apparel of different brands and styles, but also within apparel items of the same
numbered sizes within the same brands and styles (LaBat & DeLong, 1990; Workman &
Lentz, 2000; Brown & Rice, 2001), resulting in what Keiser and Garner (2003:304) refer to as
size migration, where one consumer fits into a range of three or more different sizes.
Depending on the cut of the apparel items or the manufacturer’s sizes, a consumer’s size

208
keeps migrating between smaller and larger sizes. A practical example of such a migrating
size is in vanity sizing with large dimensions being reflected in a smaller size designation
(Tamburrino, 1992a & 1992b; Ashdown & DeLong, 1995; Glock & Kunz, 1995:111; Keiser &
Garner, 2003:304; Faust et al., 2006; Shin & Istook, 2007). Because of the non-standardised
sizing systems used by apparel industries, it may be difficult to draw conclusions from the
consumers’ reported sizes, as it is not possible to isolate sizing systems that are currently
being used in Kenya.
Body shape acts as a framework for apparel, and a size label is suppose to communicate
sizes and body types to the consumers, with clearly indicated body dimensions and a
description of the body type that the apparel item was designed to fit (Faust et al., 2006).
Although manufacturers/retailers hardly include body shape as a communication of fit, it was
deemed necessary in this study to determine whether terms used on size labels to represent
body shapes, were familiar and comprehensible to Kenya’s career women. As in the case of
familiarity with effective (informative) labels, the findings on body shape terms represented
on size labels (Figure 6.12) demonstrated that the majority (69%) of the respondents were
unfamiliar with female body shape terms that are represented on size labels/tags. One could
speculate that apparel industries in Kenya are neglecting the recommendation by KEBS
(2001:7)/Appendix 4B, to use instructive labels. This is consistent with the study of Faust et
al. (2006), carried out in Canada. A lack of these terms on size labels/tags therefore would
mean inappropriate apparel selection by the consumers, as they have nothing to guide them
or to refer to (Mason et al., 2008). A size label should not only indicate key dimensions but
also a description of the body type that the apparel item has been designed for (Glock &
Kunz, 1995:108; Chun-Yoon & Jasper, 1995). It is also obvious from the results (Figure 6.12) that almost all the respondents (98%) could not describe the size label terms
representing female body shapes. Consumers’ lack of knowledge about the terms
representing female body shapes suggests that the consumers were uninformed about the
important terms which could indicate to them the suitability of apparel items for different body
shapes (Brown, 1992:54-55; Glock & Kunz, 1995:110; Brown & Rice, 2001:146; Faust et al.,
2006; Chun in Ashdown, 2007:226).
Consumers have to know the various body shapes to ease their search for appropriate styles
suitable for different body shapes. When career women were asked to describe the five
prevalent body shapes presented as illustrations (Figure 6.13), 66% of the respondents, on
average, were unable to describe the shapes correctly. This suggests that Kenya’s career
women were ignorant about the established body shapes. However, correct descriptions of
the hourglass figure scored 50%. This could be due to the hourglass body shape being a
household name in fashion marketing. The ideal figure, which is basically a slim hourglass

209
body shape, is featured in all fashion magazines, modelling and catwalk scenarios, making it
popular and a regular shape in the daily lives of the consumers (Ashdown & DeLong,
1995:48; Yu in Fan et al., 2004).
Since a body shape is a framework for proportioning apparel, it must be well understood by
users in terms of their body proportions. For an apparel item to attain a good fit, the body and
the apparel selected must be in a harmonious relationship. A consumer without knowledge
could assume that all people have bodies similar to that of the fit model or to their perceived
ideal shape (Mason et al., 2008). These assumptions could lead to them purchasing apparel
suitable for the fit model or the perceived ideal shape, rather than based on their own shape.
A consumer who is ignorant about the elements of good fit is also likely to select apparel
based on other factors such as colour, style and current fashion, leading to physically
attractive apparel as it is displayed in the retail environment, and a disappointing look when
worn on the actual body. Knowledge about the different body shapes would facilitate
comparison of the proportions between different body shapes, and would ultimately ease
apparel selection. When one compares the group of consumers’ perceived (self-reported)
body shapes with their identified body shapes, it is apparent (Figure 6.14) that they do not
perceive their own body shapes realistically – possibly due to a confusion regarding different
body shapes. The state of confusion and unrealistic self-identity could possibly be the cause
of their inappropriate apparel selection (Mason et al., 2008).
The self-reported hourglass body shape by the majority of the respondents could have been
attributed to its fame in the fashion world and in the marketing of fashion (Ashdown &
DeLong, 1995:48; Yu in Fan et al., 2004). In the Alexander, Connell & Ulrich (2005) study
done in the USA, about 50% of the women self-reported their body shapes as an hourglass,
and yet the majority of them had rectangular figures. It may be reasoned that continuous
apparel production and promotions based on the ideal hourglass body shape continue to
deprive the consumers of their true identity. Persistent advertisements based on the
hourglass shape deny consumers a chance to see themselves more realistically – and hence
they dress inappropriately. A basic knowledge about the elements and principles of design
applicable to the various body shapes would enable consumers to select more suitable styles
and sizes of apparel.
As in the case of the key dimensions necessary for identifying appropriate size, consumers
must also be able to identify their body shapes accurately in order to select suitable apparel
items. There are several ways that consumers could acquire knowledge about their body
shapes. Keen retailers, through magazines and marketing pamphlets, could sensitise their
clients by providing information on different ways to establish their own figure types. It is

210
believed that, if a consumer could apply several techniques for the assessment of her own
body shape, then her chances of selecting appropriate apparel would be high. The
application of several techniques enhances a deeper understanding of one’s body shape and
of how the body’s proportions relate to one another (Lyle & Brinkley, 1983:58-60; Reader’s
Digest, 1988: 46-47, 82-83; Liechty et al., 1992:33-38).
Respondents were asked to report the body shapes assessment techniques that they had
applied, to establish whether their knowledge about their own body’s shapes had been
enhanced by self-evaluative techniques learnt through reading, observations or any other
medium. It is believed that when individuals are more informed about self-assessment
techniques to determine body shape, they will be more accurate in identifying their own body
shapes – and hence be more skilled to select appropriate and suitable apparel items. Apart
from the use of a mirror for the assessment of the body shape by the majority (64%) of the
respondents, other methods of body shape evaluation have been scantily used, as confirmed
in this study (Figure 6.15). The use of a mirror alone is inadequate to facilitate a
comprehensive assessment and a deeper understanding of the characteristics of one’s body
and the proportions that contribute to the actual body shape. More than seven evaluation
techniques have been reported to enhance a thorough knowledge about body shapes and
hence, skills in appropriate selection of ready-to-wear apparel. For example, tracing the body
outline against the wall; using a yardstick to compare hips, bust and shoulders; dressing in
minimal clothing and assessing the shape using a long mirror; studying photos taken in
minimal apparel; comparing the body shape with established types; and asking
friends/experts to analyse your shape (Lyle & Brinkley, 1983:58-60; Reader’s Digest,
1988:46-47, 82-83; Liechty et al., 1992:33-38; Rasband, 2001b: 20-23, 31-32;). These
findings showed that Kenya’s career women hardly apply any body shape evaluation
techniques for the assessment of their own body shapes, and confirms their ignorance about
their own body shapes (Figure 6.14) – hence their selection of inappropriate apparel.
Inappropriate apparel styles distract attention, emphasise a figure problem and undermine
the confidence of the wearer. A well-fitted style hides a body shape’s problems, and directs
attention away from the problem areas, thus contributing to the psychological and social well-
being of the wearer (Rasband & Liechty, 2006: 8). Apparel styles should alter the negatively
perceived proportions of the body and provide a sense of satisfaction to individuals who do
not fit within the cultural ideals of size and weight (Fiore & Kimle, 1997:331). When
consumers understand the different body shapes, their own body shapes and the elements
and principles of design appropriate for the different shapes, they would wear satisfactory
apparel styles. In this study, respondents were asked to select appropriate styles from
different styles that were provided based on the five prevalent body shapes (hourglass,

211
apple, triangle, rectangle and inverted triangle). It was reasoned that if the respondents were
able to select appropriate styles for their reported body shapes from the three categories
provided (jackets, skirts and trousers), it would also be possible that they were
knowledgeable concerning their own body shapes and the appropriate selection of well-fitting
apparel styles. The findings of this study (Figure 6.16) illustrate that 54% respondents were
not knowledgeable about the appropriate selection of suitable apparel styles for their self-
reported body shapes. Only 37% of the respondents were able to select appropriate styles
for the distinct rectangular shape that emerged in this study. As in the case of knowledge
about the illustrated prevalent body shapes, Kenya’s career women were not only ignorant
about their own body shapes, but also about suitable styles for their body shapes – and
therefore, they would likely experience fit problems with apparel.
The physical structure of the ideal body shape may be quite familiar to most consumers, but
they may not understand what characterises the ideal shape and how their own shapes
deviate from it. Consumers’ lack of knowledge about the various body shapes and about
their own body shape, as observed in this study, may highlight their inability to comprehend
proportional comparisons between the ideal body shape and any other shape. The
consumers assume that the commonly presented ideal shape represents all the other
shapes, and therefore they perceive it as the only perfect one. This has an implication with
the fit of apparel because a consumer will purchase apparel items that are suitable for their
perceived ideal body shape rather than for their own shape. In this study (Figure 6.17), the
results indicated that the majority (76%) of this group of Kenyan career women perceived the
hourglass body shape as an ideal figure, but they did not perceive their self-reported body
shapes or their distinct rectangular shape (from dimensions and photos) as the ideal body
shape. The perception of the hourglass shape as the ideal shape may be attributed to the
fact that the current marketing of fashion uses it for advertisements. This, according to Fiore
and Kimle (1997:3), provides a symbol of expectation for women and has negative
implications, as the women purchase apparel items that would look attractive on the ideal
body shape – but looks disappointing on their own body shapes. When a woman tries to
dress her body with the available apparel items, the comparison to the ideal is inevitable, and
this signals to the woman that something is wrong with her body, rather than with the apparel
itself. This may undermine the confidence of the wearer and cause unnecessary emotional
suffering for an individual.

212
6.4.3 Determining and describing how career women’s fit preferences for differently fitted skirts and jackets may contribute to fit problems in Kenya (Primary objective 6)
Fit preference is subjective and varies from one person to another. The comfort or ease that
a person requires in an apparel item depends on the physical characteristics of that
individual’s body (critical fit points) as well as internal influences such as personal
preferences, expectations and the look that that individual desires (Alexander, Connell &
Presley, 2005). Kenya’s career women’s preferences for differently fitted skirts and jackets
(Figure 6.18) indicate that the majority of the respondents prefer fitted and semi-fitted skirts
and jackets, while they least prefer loosely fitted skirts and jackets. An observation made in
this study (Chapter 5)) indicates that large buttocks, stomachs, thighs and bust characterise
the distinct rectangular shape. The loose fit problems experienced around the shoulders, the
back width and neck line regions also highlights that the upper torsos of the career women in
Kenya were smaller than the base pattern used in the apparel industry. These characteristics
deviate from the characteristics of the so-called ideal shape that is used for pattern design
and apparel creation. Consumers with these prominent body characteristics and wearing
fitted or semi-fitted skirts and jackets are likely to experience problems with tight fit at the
area of prominence. The consumer’s preferred needs regarding fit would be catered for If the
available designs were based on the prominent characteristics of this specific body type
(curvy rectangular body shape). In the absence of the distinctive body shape as a design
guide, the curvy rectangular body shape could be accommodated more comfortably and
pleasingly by loosely fitted apparel as they contain enough wearing (comfort) and design
(style) ease. It is possible that consumers’ fit preferences are dictated by fashion trends
rather than their knowledge about appropriate apparel styles for their shapes and their critical
fit points. In such instances, fit problems encountered could be ascribed to consumers’
inappropriate fit preferences that do not take into account their body shapes and the critical
fit points associated with their shapes.
The body’s size and shape and the perceived needs of the consumer determine appropriate
apparel styles and sizing in terms of the fabric’s properties, the amount of ease required for
comfort, movement and an attractive appearance (Huck, et al., 1997; DeLong et al., 1993).
The fit preferences of the consumers must therefore be synchronised into overall suitable
and accepted styles. Regarding the chosen styles, the majority (63%) of the respondents
were unable to select suitable styles for the distinctive rectangular body shape, but about half
(51%) of them were able to select styles for their perceived body shape (hourglass). These
findings may suggest that fit problems encountered by the Kenyan career women could be
ascribed to their fit preferences that do not take into account their body’s actual

213
characteristics. Considering that consumers were able to select suitable apparel for the
hourglass shape (fit model), it reveals that Kenya’s career women’s fit preferences could be
influenced by fashion trends rather than by the comfort needed from fashionable apparel.
Internal influences such as fashion trends, expectations and the look that one desires also
influence consumers’ fit preferences (Alexander, Connell & Presley, 2005). Physical
(aesthetic) characteristics or the emotional experience that the consumers expect or get from
purchasing certain apparel may also contribute to their preference for a certain degree of fit
in specific apparel rather than considering the body’s actual characteristics (Pisut & Connell,
2007; De Klerk & Tselepis, 2007). It should be recognised that body-hugging apparel items
were in fashion at the time of data collection and are still currently in fashion. In this respect,
problems encountered at critical fit points could be attributed to consumers’ inappropriate fit
preferences that do not take their critical fit points into consideration. Consumers’ ignorance
on the appropriate degree of fit required in different apparel styles, and the basic elements
and principles of design applicable for different body shapes, could also lead to inappropriate
fit preferences and consequently, fit problems.

214
Chapter 7
CONCLUSIONS, EVALUATIONS, CONTRIBUTIONS TO THEORY AND RECOMMENDATIONS
7.1 INTRODUCTION
The aim of this research was two-fold. The first phase had three objectives (1, 2 and 3) with
the aim of:
Identifying and describing distinctive female body shapes of career women in Kenya,
using body dimensions and photographs;
Describing the differences between the emerging distinctive body shapes (from
measurements and photographs) and the Western distinctive shapes; and
Describing and analysing the fit implications associated with the emerging distinctive
body shapes of Kenya’s career women.
The second aim (phase two) entailed three objectives (4, 5 and 6) aimed at:
Assessing and describing career women’s self-perceived fit issues with the ready-
made apparel in Kenya;
Determining and describing Kenyan career women’s knowledge about the
communication of size (key body dimensions) and fit (body shapes); and
Determining and describing career women’s fit preferences for differently fitted apparel
items in Kenya.
A quantitative approach was used throughout the study. In the first phase, a body
measurement form was used to record the body measurements obtained from the
participants. An assessment scale was also used to record visual assessment data from the
photographs. For the second phase, a structured questionnaire was used to collect data for
the purposes of assessing and describing perceptions regarding general fit problems with the
ready-made apparel in Kenya, determining and describing career women’s knowledge about
the communication of size (key body dimensions) and fit (body shapes), and describing
career women’s fit preferences for differently fitted apparel items in Kenya.

215
7.2 GENERAL CONCLUSIONS REGARDING PHASE ONE DATA
7.2.1 Conclusions regarding the distinctive female body shape of career women in Kenya (Objective 1)
It can be concluded that the most dominant body shape that emerged from this study is a
curvy rectangular shape. Although the most prevalent body shape in Western society is also
rectangular, Kenya’s rectangular body shape differs significantly from the Western shape.
The Western rectangular shape is nearly straight when viewed from the side, front and back.
Contrary to the Western body shape, Kenya’s rectangular shape is curvier, particularly from
the side view, with large buttocks (“d”) and a rounded upper back region, giving rise to a well-
defined hollow back waist region. The front is typified by a well-pronounced stomach, similar
to the letter “D” (Figure 5.5). As observed in this study, the round upper back regions tend to
become less pronounced, while the stomach gets more rounded (“D”), as the female matures
(Figures 5.3 and 5.4 in Chapter 5). The rounded upper back and the “D” stomach shape
were significant with the older women, while the well-defined hollow waists were not
significant in or confined to any specific age group only.
7.2.2 Conclusions regarding differences between the distinctive body shapes of
Kenya’s career women and the Western (American) distinctive body shapes (Objective 2)
In conclusion, it is clear that the rectangular body shape is the most prevalent body shape,
both in this study and in the United States of America. The second most prevalent shape in
this study is the triangular shape, which differs from the American second most prevalent
spoon shape (Figure 7.1). As discussed earlier, in Chapter 5 (paragraph 5.5), this study
used only three measurements (bust, waist and hips) for defining body shape, while
America’s classified female shapes used six measurements (bust, waist, hips, high hip,
abdomen and stomach), hence a comparison cannot be done on all aspects. However, as
seen in Figure 7.1, the American rectangular shape appears straight, all the way from the
shoulders to the hip line. The distance between the hip and waistline appears shorter, with
no clearly defined hipline or waist indentation. Kenya’s rectangular shape –contrary to the
American shape – appears curvier, particularly around the hip and thigh areas. The waist to
hipline distance appears longer, with a well-defined thigh bulge. It should be noted (Figure 7.1) that the American figures are standing with the legs apart; thus the appearance of the
hip outline shape is not realistic. Since the second most distinctive body shape in America
differs from Kenya’s second most distinctive body shape, critical comparisons will not be

216
made, although from the pictures given (Figure 7.1), one could say that both body shapes
(Spoon & Triangle) have wider hips than bust and shoulders.
America’s distinctive female body shapes Kenya’s distinctive female body shapes
(Source: Simmons et al., 2004)
(Source: Present study)
Rectangular body shape (46%)
Spoon body shape (21%) Rectangular body shape (74%)
Triangular body shape (21.5%)
FIGURE 7.1: DISTINCTIVE FEMALE BODY SHAPES IN AMERICA AND KENYA
A side view characteristic found with the American distinctive rectangular body shape is the
large stomach, which could be “D”-, “B”- or “b”-shaped, as observed by Connell et al. (2006).
It is also characterised by flat back curvature, right from the upper back to the buttocks,
appearing like an apple body shape’s profile view (Figure 7.2) (Simmons et al., 2004).
Rasband and Liechty (2006:25-26) report that once a rectangular shape attains more weight,
it results in an apple shape (Rasband & Liechty, 2006:25-26). The front view of Kenya’s
distinctive rectangular shape is characterised by a similar width over hips and shoulders, with
a small waist indentation. The thighs bulges out on the side beyond the hip width and are full
on the inside (at the crotch), in contrast to the Western body shape. A rounded upper back
characterises the profile view, with more roundness concentrated just below the shoulder line
and the chest. The back curvature tapers narrowly towards the waistline and abruptly meets
the full buttock contour, resulting in a deep hollow waist region. The front view in profile is
characterised by a high abdominal contour that begins to protrude just below the bust line. It
begins to curve round almost immediately and increases as it leads down to the crotch at the
centre of the body, resulting in a “D” appearance (Figure 7.2).

217
America’s rectangular body shape’s side view
characteristics
Kenya’s rectangular body shape’s side view
characteristics
Smooth and gently curved back, almost straight with
less rounded upper back and gently curved buttocks.
The front is characterised by a “D”-shaped stomach.
Curved back straight with rounded upper back,
hollow waistline and rounded buttocks (“d”-shaped).
The front is characterised by “D”-shaped stomach.
FIGURE 7.2: SIDE VIEW CHARACTERISTICS OF AMERICA’S AND KENYA’S DISTINCTIVE RECTANGULAR BODY SHAPES
7.2.3 Conclusions regarding apparel fit problems associated with the distinctive body shapes of Kenya’s career women (Objective 3)
Apparel based on the hourglass body shape as a fit model used for the production of ready-
made apparel (Alexander et al., 2005; Zwane & Magagula, 2006), makes fit problems such
as tight hips, crotch, bust and stomach experienced by Kenya’s career women, inevitable. A
curvy rectangular body shape with well-pronounced body characteristics such as large
buttocks, rounded upper back, hollow waistline and “D”-shaped stomach, is likely to
experience fit problems around these regions.
As predicted in Chapter 5 (paragraph 5.6), major fit problems that could be expected to be
experienced by a woman with a curvy rectangular shape could include tight fit at the hip
region, crotch line and thighs, which may lead to wrinkles and ripples forming around the
affected area, a tight fit at the waistline that could lead to wrinkles around the waist region,
apparel riding up, and inappropriate style and dart positions due to a large stomach (“D”),
tight bust line, tight armholes and tight pull in the upper back area. Diagonal wrinkles may
also form around the prominent regions of the body.

218
In confirmation of the predicted fit problems, the Kenyan career women expressed
dissatisfaction with the way that ready-made apparel items fit their critical fit points. The
majority of the career women reported fit problems more than they reported acceptable fit at
the various fit points of the upper and the lower torsos. There were problems of tight fit
reported at the lower torso’s critical fit points (hip/buttocks and thigh regions), and also
problems of tight fit reported at the bust line region, which integrates fit problems around the
rounded upper back and the large bust. With the confirmation of the predicted fit problems, it
becomes apparent that it would be unrealistic for apparel industries to continue
manufacturing styles and sizes that are suitable for the hourglass body shape (fit model), and
expect to fit the curvy rectangular shape appropriately. Having observed the differences
between both the distinctive rectangular shapes (America’s and Kenya’s), it also became
obvious that the body shapes indeed do differ, and that there is a need to evaluate and
understand body shapes of different market segments rather than make-do with estimates.
The quality of apparel regarding its fit, can only be attained collectively, through dress forms,
fit models and sizing systems, which must represent the target population’s sizes and body
shapes (Salusso-Deonier, 1989; Ashdown et al., 2004).
It can be concluded that the apparel industry’s ignorance about the distinctive body shape’s
characteristics would lead to inappropriate design features and inappropriate fit quality
strategies employed in the industry. The body shape serves as a design guide for the
production of suitable styles, using appropriate fabrics and suitable sewing techniques and
notions. Understanding the prevalent body shape and body features of a population in a
specific market, could serve as a guide to the apparel industry’s designs, fit models and
dress forms for fit-testing strategies, and for distributing correct sizes and styles accurately to
the marketplaces. The Western view of the hourglass body shape as ideal shape or
representing all body shapes, can lead to designing and distribution of apparel that will not fit
the consumers appropriately.
7.3 GENERAL CONCLUSIONS REGARDING PHASE TWO DATA
7.3.1 Conclusions concerning career women’s self-perceived fit issues with the
ready-made apparel in Kenya (Objective 4)
Kenya’s career women consumers expressed dissatisfaction with the unavailability of
appropriate styles for their sizes and shapes. The critical fit points of Kenya’s career
women’s curvy rectangular bodies (buttocks, thighs, upper back, hollow waist, stomach, bust
and non-proportional height positions) deviate significantly from the so-called ideal figure’s

219
(hourglass) body characteristics. Consumers’ dissatisfaction with the fit of ready-made
apparel is further confirmed by the many reported fit problems encountered at the different
critical fit points of the consumers’ bodies. The reported problems of tight fit at the hip/thighs,
buttocks, upper arm and bust regions also confirm the prominent buttocks, thighs, bust,
upper arm and the rounded upper back regions that are common to the distinctive shape in
this study. Since most of the ready-made apparel items are based on the “perfect”
(hourglass) figure, the fit problems encountered by Kenya’s career women are inevitable on
a body shape with features that do not match the proportions of the ideal figure.
Dissatisfaction with the fit of apparel could also be attributed to frustrations encountered
during an apparel search. Inadequate information given on Kenyan garment labels would
likely contribute to consumers’ frustrating dilemma during apparel selection. Women
consumers in Kenya lack knowledge about the meaning of tacit labels and cannot
comprehend and link the meaning of the labels to the given size codes and their own
measurements. Although Kenya’s career women perceive the fit of imported, custom-made
and second-hand ready-made apparel categories as good, the actual fit of imported, custom-
made and second-hand apparel could be worse than reported, as confirmed by their
expressed dissatisfaction with the unavailability of appropriate styles and sizes. The personal
attention and fitting processes involved while garments are constructed may result in women
perceiving the fit of custom-made apparel as better. Extrinsic features such as emotional
satisfaction, rather than the intrinsic (fit) aspects of apparel, may contribute to the positive
perception of fit with both imported and second-hand apparel – rather than its actual fit (De
Klerk & Tselepis, 2007). Kenya’s career women’s “ego” drive towards the imported apparel
could be the main reason behind the perceived good fit (Agbonifoh & Elimimian, 1999;
Hansen, 1999:359; Mhango & Niehm, 2005). In practice, the lack of a representative
anthropometric database (size tables and body shapes), and the unrepresentative and
uninformative communication of size and fit are the major sources of fit problems (Salusso-
Deornier, 1989; Ashdown, 2000).
Significantly, Kenya’s career women perceive both their body shapes and the apparel
industry as the source of the fit problems, thereby confirming their state of confusion.
Confusion regarding the source of the fit problems could attribute the locus of the problem
externally by blaming the apparel industry, and internally by blaming their bodies in a
negative way (Weiner 1986). Consumers, who are equipped with adequate knowledge about
the products they are buying, are likely to link the cause of the problem to the manufacturer.
Confused and unskilled consumers are less able to process information and are more
vulnerable to making less than optimum apparel style and size choices.

220
7.3.2 Conclusions regarding Kenyan career women’s knowledge about the communication of size (key body dimensions) and fit (body shapes) (Objective 5)
Although Kenya’s career women preferred informative size labels, it can be concluded from
this research that Kenya’s career women lack knowledge about the meanings of various size
descriptions that are familiar to them. They are partially knowledgeable about their bust and
waist dimensions, but are more knowledgeable about their hip dimensions. Problems with
tight fit reported at the regions of the hips, the buttocks and the thighs of the consumers,
confirm that these regions are calling for closer attention. A consumer with a prominent hip
region is likely to experience problems with tight fit, which may aggravate her desire to
understand the dimensions around it. Various factors may contribute to consumers’ problems
with regard to the fit of their clothes and to their problems regarding the finding of suitable
sizes that fit their bodies. According to Ashdown (2000), these factors may be the
population’s measurements, the design features, the fit issues and the communication of
sizing and fit – in other words, the information that is communicated to consumers and that
they can interpret and use as knowledge when purchasing apparel items. In the case of the
Kenyan consumer of female apparel, the lack of knowledge (which implies that there is no
meaningful communication between the apparel industry and the consumer), is probably an
important contributing factor to her problems with getting the right size and her dissatisfaction
with the fit of apparel.
Familiar size labels showed no significant associations with consumers’ knowledge about the
meaning of size labels and the age (experience) of the consumers. Being familiar with, and
long experience of size labels or apparel selection, and being knowledgeable about size
codes, are clearly different concepts, implying that being exposed to information in the
consumer socialisation process does not automatically result in an informed consumer who
has the knowledge needed when trying to make informed decisions. With this, it can be
concluded that getting information and being familiar with the way that it is presented, do not
automatically mean correct interpretation of the information, to the extent that it can be
viewed as meaningful knowledge that can successfully be applied in a decision-making
situation. It can also be concluded that, although they prefer the more informative and
descriptive size labels, female Kenyan apparel consumers are familiar with most of the non-
informative descriptive size labels that are currently used to indicate the sizes of most female
apparel items.
As in the case of tacit labels, the apparel industries in Kenya are neglecting the
recommendations by KEBS (2001:7) to use instructive labels. The lack of body shape terms

221
on size labels/tags would mean inappropriate apparel selection by the consumers, as they
have nothing to guide them. A size label should not only indicate key dimensions but also
describe the body type that the apparel item was designed for (Glock & Kunz, 1995:108;
Chun-Yoon & Jasper, 1995). Although manufacturers/retailers hardly include body shape as
a communication of fit, size label terms that represent body shapes were not familiar or
comprehensible to Kenya’s career women. This means that career women in Kenya cannot
relate their own shapes to the available ready-made apparel styles. Unawareness of their
own shapes could possibly indicate ignorance about the basic elements and principles of
design, which would be useful in the selection of appropriate apparel styles. Kenya’s career
women’s preference for the hourglass body shape is also a signal that they view their shapes
unrealistically – and hence their inappropriate apparel selection. Consumers who are
knowledgeable about their own body shapes and skilled in the application of the basic
elements and principles of design, are likely to make effective selection of appropriate
apparel items, while they would also express satisfaction with their body shapes. Presenting
uninformative size labels to ignorant consumers on size and fit may create a state of
confusion regarding the sources of fit problems and maintain their lack of skills to tackle the
problems. However, if size labels were informative, then women would possibly measure
themselves more carefully and perhaps get to internalise their key dimensions and
understand their shapes. There was a significant relationship between consumers’
professional background and their familiarity with size labels and knowledge about the
meaning of body shape terms. Some of the terms used to represent body shape on the size
labels were familiar to professional home scientists who also understood the terms. It must
therefore be appreciated that formal education on size and fit issues could equip learners
with useful knowledge.
A consumer’s knowledge plays, from an expectancy disconfirmation point of view, an
important role in the expectations that the consumer forms about a product, in this case
apparel products. Knowledge also plays an important role when the consumer has to
evaluate the apparel item at the point of purchase, and again when she wears the garment
and has to decide whether she is satisfied or dissatisfied, and where the cause of the
problem lies. A consumer with inadequate knowledge, in this case inadequate knowledge
about sizing and fit, would not be able to make informed decisions regarding the size and fit
of a garment – thus she stands a better chance to make the wrong choice. Without adequate
knowledge of her own body measurements, knowledge of how a garment is sized, and an
understanding of the meaning of the terms used on the size label, the consumer would also
not be able to know why a garment does not fit properly and would therefore be unable to
correct the problem in future purchases.

222
Oumlil, Williams and Oumlil (2000) underline the need for, and the value of, consumer
education, and state that it can become an effective and viable tool through which marketing
strategies can be implemented, to the extent that it can become a form of self-promotion and
advertising. Professional background in Home Science had significant associations with
consumers’ knowledge on size labels and terms that represent body shape, signifying that
formal education on size and fit could equip learners with useful knowledge. As suggested by
Oumlil et al. (2000), education should be part of any company or retailer’s competitive
strategy, with the advantage that it would help to obtain, and keep, satisfied customers,
would contribute to a favourable attitude formed amongst the consumers and would help to
reduce confrontations between customers and apparel suppliers.
7.3.3 Conclusions regarding Kenyan career women’s fit preferences for differently fitted apparel items in Kenya (Objective 6)
With reference to the fit preferences of Kenya’s career women, it may be concluded that they
prefer fitted and semi-fitted skirts and jackets. The predominant rectangular body shape of
the Kenyan career women can be fitted comfortably and appealingly with more fitted apparel,
if the majority of the available designs were based on this specific body type. The curvy
rectangular body shape’s prominent characteristics such as the large buttocks, the rounded
upper back, hollow waistline, large upper arms and large bust should therefore be well
understood by the apparel industry so as to cater for their preferred needs. It is also possible
that consumers’ fit preferences are dictated by fashion trends rather than by a knowledge of
the appropriate apparel styles for their shapes or their critical fit points. Where no body shape
considerations are considered while manufacturing ready-made apparel, the curvy
rectangular body shape could be accommodated more comfortably and pleasingly by loosely
fitted apparel as it contains enough wearing (comfort) and design (style) ease. Significantly,
those who reported acceptable fit at the stomach region preferred fitted skirts, while those
who reported tight fit at the thigh and bust regions preferred semi-fitted skirts and jackets,
respectively. This may indicate that comfort required around the stomach, bust and thigh
regions could determine the degree of ease necessary in skirt and jacket for some career
women in Kenya. Fit problems encountered could therefore be ascribed to the unavailability
of appropriate styles designed for the curvy rectangular shape, and inappropriate fit
preferences that do not take into account consumers’ curvy rectangular body shape and its
critical fit points.

223
7.4 OVERALL CONCLUSION OF THE STUDY
The given framework (Figure 7.3) will be used to direct the overall conclusions drawn from
this study.
FIGURE 7:3: FACTORS THAT MAY CONTRIBUTE TO WOMEN’S DISSATISFACTION
WITH THE FIT OF APPAREL
The framework (Figure 7.3) was developed with the theory (Ashdown, 2000), the objectives
and the findings of the study in mind, and it serves as a means to understand the various
Body shape categories Hourglass, Triangle, Apple, Inverted triangle,
Rectangle, Spoon, Top hourglass, Bottom hourglass and others (e.g. curvy rectangular
shape of this study) (Design features (2) and Fit issues (3))
Body shapes’ classification techniques
(Population measures (1))
Body images/photographs
(Population measures (1))
Size labels
Uninformative
Numerical code Lettered code
Informative
Wordless Pictograms Code and key dimensions Wordless pictogram + dimensions
Sizing issues Fit issues
Established body shape terms
Junior misses, misses-petites, women’s, and women’s-petites
Consumers’ fit preferences
Fitted (skirt, jacket/blouse) Semi-fitted (skirt, jacket/blouse) Loosely fitted (skirt, jacket/blouse)
FIT PROBLEMS WITH THE READY-MADE APPAREL
Consumer’s knowledge about size and fit
(Communication of sizing and fit (4))
Body dimensions (Population measures
(1))
Perceived fit problems
Body shapes’ critical fit points (upper torso, lower torso and the arm)
Satisfaction with ready-made apparel (apparel search, available styles and sizes)
Perceived sources of fit problems (apparel industry and own body shape)
Consumers’ knowledge about their own body
shapes and own key body dimensions
Hourglass body shape (Idealized body shape) (Design features (2) and fit issues (3))
Consumer’s fit preference for Hourglass-idealized
body shape)

224
factors that contribute to women’s dissatisfaction with the fit of apparel in Kenya and other
parts of the world. These overall conclusions will revolve around Ashdown’s (2000) model
which includes four major factors, namely, population measures, design features, fit issues
and communication of size and fit. Overall conclusions will also include consumers’
perspective on matters that could affect apparel’s size and fit, such as knowledge about
communication of size and fit, preference for an hourglass body shape, fit preferences and
perceived fit problems.
After the overall conclusions, it will be followed by an evaluation of the limitations and
success of the quantitative research style, data collection methods, sample selection, data
analysis, the quality of the study and the achievement of the objectives. The study’s
contribution to the existing theory is also discussed, while recommendations are made to the
apparel industry (manufacturers and retailers), the government and the consumers.
7.4.1. Overall conclusions based on Ashdown’s (2000) four major factors revolving
around sizing systems 7.4.1.1. Population measures and the distinctive body shape
Population measurements as one of the four major components of Ashdown’s (2000) model
demand that the body dimensions should be obtained from the three-dimensional body in an
explicit way that will facilitate body shape classifications. Accurate reflection of the three-
dimensional body’s characteristics would be achieved when the apparel has been made
based on all the elements of fit (grain, set, line, balance and ease) and dressed on the body
(Erwin et al., 1979). It can be concluded that Kenya’s apparel industry, as well as foreign
companies that export their apparel merchandise to Kenya, do not understand Kenya’s
distinctive curvy rectangular female body shape, nor its representative body measurements. Most sizing systems available in Kenya do not include a classification of body shapes, which
is the core component of a successful sizing system (Chun-Yoon & Jasper, 1996; Istook &
Hwang, 2001). According to Kenya’s sizing standards (KEBS, 2001), anthropometric data
was last collected in 1975, which means it is outdated. Zwane and Magula (2006) report that
most apparel industries in developing countries actually adapt western sizing systems
without considering variability of body shapes and sizes that exist in their markets. Fit
problem in Swaziland has also been found to be as a result of mismatch between the actual
measurements of Swazi women and the key dimensions of existing size charts. As observed
in this study, Swaziland women’s body shapes also do not conform to the Western idealized
hourglass body shape and measurements (Zwane & Magula, 2006).

225
A sizing system entails the assignment of body dimensions to a group of body shapes
representing a market segment (Ashdown, 2000; Keiser & Garner, 2003:30; Salusso-
Deonier, 2005; Petrova, 2007:57). It has been reported that a sizing system that sets out to
satisfy its target market must be up to date, precise in its measurements and body shape
classification (proportions) and must represent the population it was designed for (Salusso-
Deonier, 1989; Delk & Casill, 1999; Schofield, et al., 2006). Apparently, size and fit problems
is an international outcry. Studies carried out in developed countries (USA, UK and Canada)
also indicate that sizing systems used are as old as the 1940s’ and 1950s’. Although national
anthropometric surveys have been carried out recently in most of these developing countries,
most apparel industries are still reluctant to implement the data as sizing systems and hence
persistent fit problems (Newcomb & Istook, 2004a; Otieno, et al., 2005; Ashdown & Dunne,
2006; Faust et al., 2006; Shin & Istook, 2007).
7.4.1.2. Design features and the distinctive body shape
Design features, being the second most important factor highlighted in Ashdown’s (2000)
model, necessitate that the body’s framework (three-dimensional characteristics) be rightfully
translated into patterns for the construction of well-fitting apparel. Lewis (2007:319) states
that the body shape and the apparel silhouette worn become attached and united so that the
body shape beneath the apparel enhances the aesthetic appeal of that particular apparel,
while the apparel silhouette enhances the aesthetic appeal of the entire person. Considering
that the body measurement tables in Kenya are based on an outdated anthropometric
database in combination with a lack of classified body shapes, it is possible that sizing
systems currently in use could be an adaptation of the 1975 data, borrowed or adapted from
other countries. This means that apparel items available in the Kenyan markets are based on
estimations rather than on facts. Body shape terms represented on the size labels are not
familiar to Kenya’s consumers, clearly indicating that size labels attached to the garments
before being dispatched, do not indicate the body shape of the intended consumers. Without
body shape as a design guide, it is possible that the styles produced are based on
approximations and arbitrary distributions to the market place, thus confirming consumers’
dissatisfaction with the fit of ready-made apparel.
Apparel is the product of a design process and the fabric’s properties, and its quality is
measured by its appearance and comfort on the body shape. The body shape functions as a
frame for the apparel (Salluso-Deonier, 2005), and the fabric’s properties and the apparel’s
style must be in harmony to produce aesthetically pleasing, comfortable and well-fitting
apparel. Currently, media and apparel companies worldwide use a well proportioned but
relatively slim hourglass body shape for their fashion shows and catwalks (Brown & Rice,

226
2001:154; Yu, 2004:33; Loker et al., 2005). This is viewed in Western society as ideal (Yu,
2004:33; Zwane & Magagula, 2006; Pisut & Connell, 2007). Armstrong, (1995:33) define the
ideal figure female body structure with well-balanced features. The perfect body is assumed
to provide a silhouette that will fulfil everyone’s desired image of perfection, but in reality it
denies the consumers with diverse body shapes and sizes, the opportunity to see and
understand their body structures sensibly (Lewis, 2007:319). Apparel designed, modelled
and sized according to this idealized body shape would certainly not fit consumers with
varied body shapes and sizes. As earlier mentioned the reluctance by most apparel
industries to implement anthropometric data into useful sizing systems, size and fit problems
inevitably continues to bother consumers irrespective of regions and countries.
7.4.1.3. Fit issues and the distinctive body shape
The fit issues being the third important part of Ashdown’s (2000) model involve fit quality
management strategies that call for certain fit testing techniques such as the use of fit
models and dress forms. Fit is the apparel’s silhouette and size, and these have to be right
for the humans’ body shapes and dimensions (Kadolph, 1998:550; Keiser & Garner,
2003:315; Solomon & Rabolt, 2004:196). Therefore, the fit models and/or the dress forms
used for fit testing must conform to the body characteristics of the distinctive figures and
sizes of the target market. It may be concluded therefore that, without representative body
measurements or an identified body shape, it would be almost impossible to formulate and
administer fit quality strategies.
Representative anthropometric data and identification of distinctive body shapes of any
specific target market form the foundation of the successful production and distribution of
ready-made apparel. Understanding prominent body characteristics of a prevalent body
shape plays an important role in the production and distribution of appropriate and correct
numbers of apparel styles and sizes to a specific marketplace. The body shape serves as a
design guide for the pattern development and consequently, well fitting apparel. It is
therefore critical to analyse and understand the body proportions of the dominant shape in
any country rather than the assumptions that all shapes are ideal (Hourglass), as these
determine the overall design values that can be incorporated into garment production, the
development and implementation of quality assurance measures right from illustration stage
(style decision), pattern creation, fabric selection and dispatch.

227
7.4.1.4. Communication of sizing and fit, the distinctive body shape and the key body dimensions
Communication of sizing and fit, being the fourth important factor in Ashdown’s (2000)
model, requires that measurements and body shapes indicated on the size labels reflect the
true picture of the target market (population). The garments made in the industry require that
body measurements be translated from a body measurement table into patterns, and finally
into garments. Size labels are attached to the garments whilst in the assembly process. The
information given on the labels must therefore reflect the correct original dimensions and
body shape that they purport to represent. Failing this, the apparel item will land on
consumers whose dimensions and body shapes differ – hence, fit problems.
It can be concluded that uninformative size labels are presented on Kenya’s ready-made
apparel – labels that are not instructive and cannot be useful during garment selection.
Although Kenya’s female consumers prefer the more informative, descriptive size labels, the
uninformative size labels are familiar to them. Istook (2002:65) highlights the importance for
manufacturers to communicate to their consumers, how each apparel item was designed to
fit. This communication is an indispensable step in meeting the fit expectations of
consumers. Misleading information often leads to consumers’ confusion, which can affect the
quality of consumers’ purchase decisions (Mitchell & Papavassiliou, 1999). Continuous
presentation of the uninformative labels in Kenya may be viewed as deliberate refusal by the
apparel industry to adhere to the recommendations by KEBS (2001:7). Also observed in
Canada (Faust et al., 2006), USA (Newcomb & Istook, 2005; Shin & Istook, 2007) and
Swaziland (Zwane & Magagula, 2006), apparel industries do not adhere to measurements
assigned to the recommended size codes.
The lack of body shape terms on size labels/tags would mean inappropriate apparel
selection by the consumers, as they have nothing to guide them. A size label should not only
indicate the key dimensions but also a description of the body type that the apparel item was
designed for (Glock & Kunz, 1995:108; Chun-Yoon & Jasper, 1995). Consumers have a right
to clear and understandable information regarding the product that they are buying, and this
should appear on the product itself. It is therefore advisable for the apparel retailers to clearly
indicate the body dimensions and body shapes of their target consumers and to ensure that
size labels attached to the garments are communicating the correct information effectively. In
other words, there must be a plausible relationship between anthropometric data, the size
charts and the sizes presented on the apparel. Informative size labels based on
representative anthropometric data inform the consumer about the dimensions used, and
about the body shape that the apparel will fit best. In conclusion therefore, obsolete sizing

228
systems and ignorance about the prevalent body shape in Kenya are leading to the use of
vague size labels that do not only confuse the consumers, but also do not represent their
true measurements and body shapes.
Variations that exist between apparel sized with the same codes from one company or
different companies could be traced to the use of obsolete and/or wrong measurements,
either initiated by the manufacturer or the retailer. Methods of obtaining body dimensions are
not standardised amongst stakeholders (manufacturers and retailers), thereby creating
leeway for most apparel industries (manufacturer/retailer) not to adhere to the suggested
(voluntary) standard size communication systems (Faust et al., 2006). The pattern
development, grading, fabric spreading, cutting and assembling procedures employed by
different manufactures are inconsistent, resulting in confusing sizing systems in the
marketplace (Hudson, 1980:112; Solinger, 1988:128; Brown, 1992:29; Glock & Kunz,
1995:390). Failure of quality control measures due to lack of guidance provided by
representative size tables and body shapes could easily permit errors to slip through from
one section of apparel processing to the other, ending up in consumers’ hands in a retail
environment.
It is clearly the responsibility of the retailer and the manufacturer collectively to work together
in ensuring that body shapes and body dimensions used in the construction of the apparel,
are effectively communicated through size labels to the consumers. Retailers are direct
customers of the manufacturers, as they provide size and style specifications to the
manufacturers. Manufacturers have the responsibility of producing the apparel as per these
specifications. Since retailers are the order initiators, they are required to give size and style
specifications based on accurate shapes and sizes of the target market.
7.4.2 Overall conclusions based on Consumers’ perspective regarding matters
that could affect apparel’s size and fit
7.4.2.1 Consumer’s lack of knowledge about the communication of sizing and fit
It can be concluded from this research that female Kenyan apparel consumers lack
knowledge of their own and different body shapes, the meanings of various size descriptions
used on labels, and also lack knowledge of their own key body dimensions which serve as
indicators of appropriate sizes. Various factors may contribute to consumers’ problems with
regard to the fit of their clothes and to their problems regarding the finding of suitable sizes
that fit their bodies. According to Ashdown (2000), one of the factors affecting size and fit is
the communication of sizing and fit – in other words, the information that is communicated to

229
consumers that they can interpret and use as knowledge when purchasing apparel items.
Workman (1991), Desmarteau (2000) and Brown and Rice (2001) underline the importance
of consumers’ knowledge of their own measurements, and of which body measurements are
necessary when choosing certain garments. In the case of the Kenyan female apparel
consumer, the lack of knowledge (which implies that there is no meaningful communication
between the apparel industry and the consumer) is probably an important contributing factor
to her problems with getting the right size and also her dissatisfaction with the fit of clothes.
7.4.2.2 Consumers’ preference for an hourglass body shape The body, as frame structure for proportioning apparel, must be well understood by the user
in terms of shape and proportions. A consumer without knowledge could assume that all
people have bodies similar to that of the fit model or to that of the perceived ideal shape.
Career women consumers in Kenya perceive the hourglass body shape as ideal, and as a
reflection of their own body shapes; therefore they select apparel styles that are suitable for
the hourglass body shape. They are not only uninformed about their own and others shapes,
but are also unrealistic about their own shapes. Unrealistic perception of the self could lead
to purchasing apparel suitable for the fit model or for the perceived ideal shape – rather than
for the own actual body shape. Consumers who are unaware about the different body
shapes are likely to also be ignorant about the elements of good fit, and hence will select
apparel based on other factors such as colour, style and current fashion, eventually
purchasing apparel with fit problems. Knowledge about the different body shapes facilitates a
comparison of the proportions between different body shapes, which ultimately eases
apparel selection.
7.4.2.3 Consumers’ fit preferences
The study has shown that Kenya’s career women prefer fitted and semi-fitted skirts and
jackets. This could be influenced by fashion trends rather than the comfort needed from
fashionable apparel, as confirmed by the selection of styles that are suitable for the
hourglass shape (fit model) rather than for their actual shapes. Physical (aesthetic)
characteristics or emotional experience that the consumers expect or get from purchasing
certain apparel may also contribute to a preference for a certain degree of fit in specific
apparel (Pisut & Connell, 2007; De Klerk & Tselepis, 2007). If the available designs were
based on the curvy rectangular body shape’s prominent characteristics, the consumer’s
preferred fit needs would be catered for. In this respect, problems encountered at the critical
fit points would be attributed to inappropriate fit preferences that do not consider the
distinctive body shape’s critical fit points. Consumers’ lack of knowledge about the

230
appropriate degree of fit required in any apparel style, and the basic elements and principles
of design applicable for different body shapes could also lead to inappropriate fit preferences
– and consequently, fit problems.
7.4.2.4 Consumers’ perceived fit problems
It may be concluded that Kenyan career women perceived fit of the imported new and
second-hand ready-made apparel as good, although they are generally dissatisfied with the
way the ready-made apparel items fit their critical fit points. The Majority of the career
women, however, report more problems with either tight or loose fit than they report
acceptable fit at the various fit points of the upper and the lower torsos. Consumers’
dissatisfaction confirms the fact that the distinctive Kenyan female body shape (curvy
rectangle) in deed differs, not only from the idealised ideal hourglass figure, but also the
western rectangle figure (Newcomb & Istook, 2004a & 2004b; Zwane & Magagula, 2006). As
reported by Kurt Salmon Associates (1996) in the United States of America, Otieno et al.
(2005) in the United Kingdom and Faust et al. (2006) in Canada, it appears therefore that
consumers’ dissatisfaction with apparel’s fit is becoming a global problem.
As observed through out this study, fit problems arise from:
Lack of distinctive body shape and body dimensions necessary for designing and
distributing appropriate styles and sizes to a specific market from which the shapes
and sizes were obtained
Use of uninformative size labels presented on garments, which are not understood and
not preferred by the consumers
Consumers’ lack of knowledge – not only about the size codes, but also about their
dimensions and body shapes, and therefore they will make the inappropriate apparel
selection
Inappropriate style choices based on the perceived ideal figure rather than on the
actual body shape
Consumers’ lack of knowledge about the appropriate degree of fit required in any
apparel style, and about the basic elements and principles of design applicable for
different body shapes, and their inappropriate fit preferences that do not consider a
distinctive body shape’s critical fit points

231
7.4.2.5. Consumer’s perceived sources of fit problems Kenya’s career women are confused about the source of fit problems, so they attribute the
locus of the problem externally by blaming the apparel industry, and internally by blaming
their bodies in a negative way (Weiner, 1986). Informed consumers with adequate
knowledge about the products they buy are likely to link the cause of the problem to the
manufacturer. Confused consumers are less able to process information and are more
vulnerable to making less than optimum apparel style and size choices. As female
consumers continuously purchase substandard apparel fostered by their state of confusion,
they could get emotionally distressed, incur financial losses and be exploited by the apparel
industry (Mitchell & Papavassiliou, 1999). A consumer who believes that the manufacturer or
retailer is responsible for the fit problem would probably direct negative emotions to the
apparel industry. This also has negative consequences for the manufacturer because the
consumer would probably engage in negative post-purchase complaint behaviour, such as
boycotting the retailer, switching to another brand and even telling friends (Laufer, 2002).
7.5 EVALUATION OF THE STUDY
Evaluation is necessary for the purposes of follow-up and could serve as a guideline for
similar future studies. This study is hereby evaluated in terms of the quantitative research
style (sample selection, data collection and data analysis), the quality of the data and the
achievement of the objectives.
7.5.1 Research strategy Phase one: Generally speaking, this study was exploratory and descriptive in nature
because researching body shape, size and fit issues is new in Kenya. In quantitative
research, reliability is exceedingly important, objective facts are measured with the emphasis
placed on certain variables. The research has to be value-free, independent of the context
and the researcher has to be detached, thus enhancing the objectivity of the study. In this
phase of the study, the aim was to identify and describe Kenya’s career women’s distinctive
body shapes from body dimensions and photographs, distinguishing how they differ from the
Western distinctive body shapes, and to analyse the fit problems associated with those
shapes.
This part of the study focused on the variables contained in the body dimensions form
(Appendix 3A), and the body assessment scale (Appendix 3D), for purposes of identifying

232
and describing a distinctive Kenyan career women’s body shape. According to Neumann
(2000:126), variables are central to quantitative research; these variables were identified in
the literature (anthropometric studies, standards and body shape assessment training
manual), and measured by using relative dimensions and indicators presented in the body
dimensional form and body shape assessment scales. The quantitative research style
ensured that the researcher was objective when analysing the distinctive body shape and
distinct body features. The body dimensions, according to the body measurement form, were
much more than required for identification of the body shape. It took a long time to obtain
accurate measurements – exhausting the participants as well as the measurer. It would be
recommended that photographs be taken first as a prerequisite step for the key body
dimensions. A thorough scrutiny of the photographs will serve as a guide for the necessary
elements required for the study. Expert evaluators could be involved in the decision-making
process of identifying and sorting out only the essential key dimensions.
Phase two: The second phase of the study employed a quantitative research style, focusing
on the variables obtained from the fit problems of apparel, the communication of size and fit,
and fit preferences. A structured questionnaire was used to get the broader picture of the
respondents’ perceived fit problems, their knowledge about the communication of size and
fit, as well as their fit preferences for differently fitted apparel items. The questionnaire
measured specific dimensions of apparel fit problems, communication of size and fit, as well
as fit preferences, as explained in the literature review (Chapters 2 and 3), and clearly
indicated in a schematic framework (Figure 3.24). The questionnaire measured objective
aspects, for instance, rating the fit of different apparel categories in Kenya, reporting fit
problems experienced at critical fit points of the body, and reporting the meaning of size
codes. Questions relating to consumers’ knowledge about terms used on size labels,
representing different body shapes, and consumers’ fit preferences for differently fitted skirts
and jackets were asked. This part of the study focused on the variables obtained from
apparel’s fit problems, the communication of size and fit and fit preferences. According to
Neumann (2000:126), variables are central to quantitative research, which were identified in
the literature (Ashdown’s model (Figure 2.1) and the schematic framework (Figure 3.24)).
These variables were measured by using relative dimensions and indicators and were
presented in a language that was more comprehensible to the respondents.
Being an exploratory study, a structured self-administered questionnaire was the best option
as respondents could complete it without any outside influence. The researcher and/or
research assistant could solve unclear issues arising from the questionnaire. Although the
researcher and the assistant were available, some of the questions were left unanswered.
The respondents felt that some questions were too long. This method can be time-

233
consuming to initiate, but meaningful information can be acquired from many respondents in
a relatively shorter time if the questionnaire is much shorter.
7.5.1.1 Choice of the research sample for the study
Initially, probability-sampling techniques were used for both phases of the study, but due to
the sensitive nature of phase one data, non-probability sampling (snowball technique)
emerged within the already probability-sampled group (see paragraph 4.5.5).
Phase one: Although it is recommended that the sample size for a quantitative research
study should be representative of the entire population (Mouton, 1996:136; Wimmer &
Domnick, 2000: 94), non-probability sampling techniques could be used in a preliminary or
pilot study. In such instance the results cannot be generalised to a larger population, but
should rather be viewed as indicative of the specific group tested (Wimmer & Domnick,
2000:82-83). Although the intended sample size for phase one was 301, 123 and 89
participants were measured and photographed respectively. The smaller number of
participants in this study can be attributed to the sensitive nature of obtaining body
dimensions and photographs from women who are almost nude. These smaller numbers
were reached through persistent negotiations and persuading the participants (see Chapter 4, paragraph 4.4.5.). The snowball sampling method applied was considered to be
adequate. Non-probability sampling techniques will still be applicable for any follow-up
studies of this nature, since taking body measurements and photographs are manually
executed and remain sensitive. Given adequate time, skills, funds and the use of body scan
technology, it is possible that probability-sampling techniques could be applied with a larger
sample. A feasibility study on the acceptance of body scan technology should be carried out
while socio-cultural issues of the target market need to be understood and considered (Fiore
& Kimle, 1997:86; Marshal et al., 2004:94).
Phase two: The second phase of this study, which involved the use of a questionnaire, had
201 (67% of the initial 301 sample size) respondents. The sample size was selected using
probability sampling techniques and hence was thought to be adequate for data analysis.
7.5.1.2 The choice and application of the data collection techniques Since willing respondents increase the reliability of the study, as observed by Mouton
(1996:145), no respondents were forced to take part in the study. A research permit from
Kenya’s Ministry of Education was shown to the gatekeepers (Head teachers) as well as the
participants at every school visited. The researcher further explained the aim and importance

234
of the study to the gatekeepers as well as the participants before commencing the fieldwork.
Appropriate ethical measures were taken to ensure that participants’ rights were not violated
in any manner.
Phase one: Before the research commenced, the researcher consulted professional
anthropometrists from the Company of Ergonomic Technologies (Ergotech), South Africa, for
training in body measuring techniques, particularly in identifying and locating landmarks on
the body, and how to take the measurements accurately. The training was based on the
standardised anthropometric measuring techniques using appropriate, recommended
measuring instruments (Beazley, 1996; ISO, 1990; RMSS, 1994-Ergotech). The researcher
completed an Anthropometry Accreditation Course (AAC) – level one (Appendix 3C). The
course consisted of both theory and practical sessions on landmarking and measuring the
human body. The techniques used were based on the International Standards for
Anthropometric Assessment (ISAK, 2001). The measurements selected for the study were
carefully prepared (after consultation with various professionals in the field of apparel,
namely study leaders and Ergotech experts, and consulting relevant literature and different
anthropometric standards). Traditional anthropometric measurements have been used in
many studies (as stipulated in most sizing standards), ensuring reliability and validity of the
studies (Winks, 1997; Beazley, 1998; Simmons & Istook, 2003). The same approach was
adopted in this study, strengthening its reliability and validity. Instruments that were used,
such as the standing anthropometer, underwent quality testing and were recommended by
the anthropometrist.
A specific literature search on anthropometric studies and female body shapes was done.
This enabled the researcher to develop a comprehensive body measurement form and body
shape assessment scale for the purposes of data collection. As stated earlier, it was difficult
to take body dimensions and photographs of career women in minimal clothing. In their
reluctance to participate in the study, they cited cultural and religious beliefs as their main
concern. Continuous persuasion, negotiations and even the use of incentives were
sometimes used to convince participants to participate in the exercise. The body dimensions
form, and the policies laid down for the purposes of photographing, were subjected to
rigorous scrutiny by both study leaders before the fieldwork commenced. That enhanced the
reliability and validity of the study. The body shape assessment scale was also developed
based on a thorough literature review and after scrutinising the photographs. It was peer-
reviewed by professional experts in the field of apparel design to ensure that evaluations
made on the body shapes were valid and reliable.

235
Before commencement of the fieldwork, the researcher also underwent photography training,
which was administered by a professional photographer. To obtain reliable photographs for
the purposes of identifying and describing the distinctive body shapes of the Kenyan career
women, participants were photographed using standardised methods while dressed in
minimal apparel (body suits/leotards), and assuming/taking different positions/views (front,
back and side/profile). The use of an assessment scale with well-defined variables (body
shapes and distinct features) facilitated proficient judgements on the overall body shape and
body units/components that are critical to the fit of apparel (Gazzuolo et al., 1992; Kuma,
1999:39; Anderson et al., 2001; Ashdown, Loker & Adelson, 2004). It was very difficult to
keep the participants still in their posture while photographing, which forced the
researcher/photographer to operate between focusing the camera and helping the
participants to keep them motionless before photographing them. These movements could
be reduced with automated photographing, if a studio setting was stationed with all the
equipment placed in a booth. The body dimensions obtained and the evaluations made with
the use of the body shape assessment scale were seen as relevant and reliable. All the body
dimensions that were taken were recorded, while trained professional experts guided by the
body shape assessment scale, adequately did the evaluations of the photographs. Phase two: Theoretical clarity and descriptions of relevant aspects that were identified
through the literature search, helped to recognise appropriate measures to facilitate the
development of a comprehensive questionnaire covering all concepts of the study. Some
questions that had previously been used in related research were adapted in this study.
Questions that aimed at measuring consumers’ satisfaction with fit had been used by LaBat
(1989), Kurt Salmon Associates (1996) and Otieno et al. (2005). Measurement of consumers’
fit preferences and self-reporting of key body dimensions had been used by Anderson et al.
(2001) and Alexander et al. (2005). The questionnaire’s top page had the University of
Pretoria’s logo (letterhead) and an introductory letter stating the purpose of the research,
giving an assurance of anonymity, an appeal to participate in the study and an
acknowledgement of participation.
Before the research commenced, the questionnaire had been scrutinised by the researcher’s
study-leader, the co-study leader, a statistician and the subject specialised lecturers at the
Department of Consumer Science, University of Pretoria (peer evaluation). The
questionnaire was also pilot-tested on twenty third-year students enrolled for Apparel
Management at the University of Pretoria, and while in the field (in Kenya), the questionnaire
was further pilot-tested on 10 career women to enhance its quality and reliability. Except for
two questions (questions 11 and 22) that were answered poorly, the questions were all
relevant. The participants reported that the two questions were too long. The theory

236
(literature) used helped the researcher to understand and describe the emerging distinct
body shapes and certain characteristics emerging from the objectives highlighted in the
questionnaire.
7.5.1.3 Choice of statistical methods employed
The data was analysed using acknowledged statistical tests that were chosen after
examining the body dimensions obtained, the body shape assessment scale and the
questionnaire. The number of variables involved the measurement scales that were used,
and the nature of relations between variables (Agburu, 2001:85). Statistics were used to
investigate whether distributions of categorical variables differed from one another. The
statistical analysis of data, a characteristic of quantitative research, was adequate for the
study. In some cases, hypotheses were tested, while in others, hypotheses could not be
tested due to the fact that there were sparse cells in some categories (Chapter 4, paragraph 4.6 (Tables 4.3 and 4.4)). Hypothesis testing was done at the 5% level of significance. The
statistical methods used and the boundaries set at the 5% level of significance by specific
statistical tests, helped the researcher to determine when the results were statistically
significant. The research problem was solved when logical deductions, derived from the
theory, were linked to concrete evidence obtained from the results.
Phase one: The selection of appropriate drop values (from the body dimensions) and the
statistical methods used for identification of the body shapes were based on a thorough
literature review, and hence considered reliable, as they had been applied in other similar
studies (Beazley, 1997; Winks, 1997; Gupta & Gagandhar, 2004). The body dimensions
were summarised by the use of descriptive statistics, thereby enabling comparison across
the variables (Trochim, 2005:212). Range values measured the dispersion of variables, while
the mean values measured the central tendencies of variables. The standard deviation used
in conjunction with the mean value reflected the degree to which the values in a distribution
differed from the mean, thereby facilitating categorisation of variables such as large bust,
medium bust and small bust or short, medium and tall (Bryman & Cramer, 1997:85; Bryman
& Bell, 2007:359-360). The distinctive curvy rectangular shape emerged from the study as
the dominant body shape, as it had the highest representation from the measurements (74%)
and photographs (70%).
Assessments from the trained professional evaluators were also subjected to inter-rater
reliability tests (Kappa), for the purposes of analysing the strength of agreement between
different evaluators. This was to further enhance the reliability of this study (Ashdown &
DeLong, 1995; Landis & Koch, 1977). Statistical analysis of the body measurements

237
alongside expert evaluations of the photographs produced almost identical results, which
enhanced the triangulation of phase one data, and ensured that the results were reliable.
Phase two: The approach of the study was judged successful because the researcher
conducted a thorough literature search on specific concepts of the study that guided the
researcher to make logical deductions and develop appropriate measurement scales. The
first step was to define the concepts that were to be measured, and then potential scale
items were created to determine indicators around the fit of apparel, knowledge about the
communication of size and fit, and fit preferences. The questionnaire measurement scales
included nominal (yes or no) type questions and categorical (Likert-type) scales that directed
the decision to use specific statistical methods. Chi-Square statistics were used to
investigate the disparity of categorical variables between two independent groups, such as
comparing size and fit knowledge between Home Science professionals and non-
professionals. Pearson’s correlation coefficient was used to measure the degree or extent of
relationship between variables such as consumers’ self-reported key body dimensions
versus their actual key dimensions.
7.5.2 Quality of the data 7.5.2.1 Quality of phase one data (body dimensions and photographs)
As part of preparation for the research, the researcher consulted a professional
anthropometrist, undertook training in anthropometric studies and did a short course in
photography. Instruments used for obtaining measurements and techniques recommended
by international standards were observed, as discussed in Chapter 4 (paragraph 4.5.1.1).
Standardised photographing setting and guiding principles were also observed, as explained
in Chapter 4 (Paragraph 4.5.1.1 (Figure 4.6).
The researcher also selected and screened the professional evaluators for the purposes of
evaluating the body shapes based on their long-term professional skills and experience,
thereby ensuring the trustworthiness of the outcome of the study. A comprehensive training
manual and assessment scale were compiled based on an extensive literature search, and a
thorough study and scrutinising of field photos. The training manual and assessment scale
were tested and subjected to experts’ assessment prior to their implementation in this study.
Statistical analysis of body measurements alongside expert evaluations of photographs
produced almost identical results, thus enhancing the triangulation of phase one data.

238
7.5.2.2 Quality of phase-two data (Questionnaire) Validity: In order to ensure that each measurement accurately reflected the concept it
intended to measure (measurement validity), the following different types of validity were
observed in the questionnaire instrument:
Face validity: The instruments were pre-tested by a group of experts and were also
pilot-tested on third-year apparel design students and a small group of career women
in Kenya. This was to ensure that the measurement instruments actually measured
what they purported to measure. Only instruments purporting to measure fit issues of
women’s ready-made apparel, the communication of sizing and fit, and fit preferences
were used.
Content validity: To ensure content validity, all the concepts presented in the
conceptual framework (Figure 3.24) were specified in a construct definition. This
facilitated the development of indicators (questions and statements) from all the parts
of the definitions (relating to the objectives of the study), as recommended by
Neumann (2000:142-143) and Babbie and Mouton (2001: 122-123).
Criterion validity: Being the pilot study, there was no standardised criterion known to
measure the construct validity accurately, to permit comparison with the
measurements for this study. However, some of the questions that had been used
successfully in related studies were adapted for this study.
Construct validity: To determine the degree to which instruments used for this study,
successfully measured the theoretical construct they were intended to measure,
definitions with clearly specified conceptual boundaries were provided (Figure 3.24
and Table 4.1), in order to isolate the convergent validity. Evidence obtained from the
results that link to the theory indicates the degree to which the instruments were
successful.
Reliability: According to Neumann (2000:164), reliability is an indicator of dependability or
consistency. It indicates the likelihood that a given measurement technique will repeatedly
yield the same description of a given phenomenon (Mouton, 1996:144). In this study, the
following strategies were applied to ensure reliability:
The questions used in the questionnaire were predominantly closed questions. Some
of them had been previously used in related studies.
The questionnaire was pre-tested by a group of experts and pilot-tested on career
women.
A research permit from Kenya’s Ministry of Education was obtained (Appendix 1C,
while the questionnaire’s top page had the University of Pretoria’s logo (letterhead)
239
and an introductory letter stating the purpose of the research.
Well-established methods of data collection were used and standard statistical coding
methods were also applied.
Hypothesis testing was done at the 5% level of significance.
A non-probability sampling technique (snowball) was used in this study. It used a
smaller sample size, but this technique is acceptable in this case because it is a
preliminary study and Kenya’s career women were difficult to access due to the
sensitive nature of the study (Chapter 4, paragraph 4.4.2). The results therefore are
indicative of Kenya’s career women in the western (Eldoret and Kisumu) and central
(Nairobi) regions.
7.5.3 Achievement of the objectives of the study
In order to solve the research problem stated in Chapter 1, primary objectives and sub-
objectives were set for the study. Each primary objective and concomitant sub-objectives
were addressed in the body dimensions form, the body shape assessment scale and the
questionnaire used in the study. The results indicate that valuable data related to the primary
objectives and sub-objectives was collected. The data enabled the researcher to interpret the
results and draw conclusions related to the different objectives. The results, their
interpretation and eventually the conclusions drawn also made it possible to make
recommendations to the apparel industry as the manufacturers and marketers of ready-made
apparel, and to governmental agencies and private consumer-oriented organisations as
service providers (consumer rights activists), so as to serve effectively the needs of the
career women segment in Kenya.
From the discussion and interpretation of the results, general conclusions and overall
conclusions (Figure 7.3), it is evident that the researcher successfully achieved the primary
objectives and sub-objectives stated. Information that was obtained from the results can
contribute to the existing theory on issues around apparel sizing and fit, the relevant research
methodology and consumer education theory.
7.6 THE CONTRIBUTIONS OF THE STUDY TO EXISTING THEORY
The value of the quantitative research style used in this study is that it enables the
researcher to quantify the data and to link the data to the specific concepts used in the study.
The value of research can be increased when the results are meaningfully linked to the

240
concepts of the established theory related to the research. The findings of this study can
contribute to theory in the following fields:
the theory of fit
Ashdown’s sizing systems theory
the theory of size labels
research methodology theory
consumer education theory
7.6.1 The theory of fit
Dissatisfaction with apparel’s fit is one of the most frequently stated problems with garment
purchases. Women have been reported to be the most dissatisfied consumers (DeLong et
al., 1993; Otieno et al., 2005; Alexander et al., 2005). Body shape is a framework for
proportioning apparel (Salusso-Deonier, 2005). This study confirms that different markets
have different body shapes and unique characteristics that affect the fit of apparel. Therefore,
researchers and apparel manufacturers – upon understanding prevalent and unique body
characteristics – should develop sizing systems that can address the fit problems of different
markets.
Issues of pattern and garment alterations could improve as design values required for
different body shapes are developed. It would, for example, enable manufacturers to
understand and identify the underlying factors between the standard (hourglass) body
shape’s hip or buttocks size and the prevalent body shape in any market environment. Also,
relating fit models and dress stands to the dominant body shape in a specific market and
ensuring that fit tests are carried out, would be a vast improvement.
7.6.2 Ashdown’s sizing systems theory
Ashdown (2000) sees sizing systems as the focus around which all the other factors
concerning sizing and fit evolve. She has identified the main factors affecting sizing systems
and consequently the fit of ready-made apparel to be: the population measurements (body
measurements), the design features (construction of the apparel), the fit issues (fit quality
management), and the communication of sizing and fit (size labelling). This study has
identified specifically body shape as another important component affecting fit. The body
shape should stand out as one of the major factors revolving around sizing systems, in the
same way that population measurements stand out. It could also feature under population
measures, pointing out both the body measurements and body shape as the core

241
components. As mentioned throughout this study, population measurements, as one of the
factors highlighted in Ashdown’s (2000) model, require that the three-dimensional body
(shape) be accurately measured for the purposes of developing size tables and classification
of body shapes, which must serve as guides for design, pattern and apparel development.
The design features being the second most important aspect in Ashdown’s (2000) model
involve using the body shape for design, style development and correct distribution of styles
to the correct market. The fit, as a third important factor, demands that the body shape
characteristics are understood for the purposes of formulating quality assurance strategies,
such as identifying fit models representing prevalent shapes in a market, identifying
appropriate dress forms for fit testing and draping. Communication of sizing and fit being the
fourth component in Ashdown’s (2000) model, it demands that the sizes and body shapes
communicated should represent the actual measurements and the body shapes.
7.6.3 Theory of size labels
Chun-Yoon and Jasper (1996) and Glock and Kunz (1995) state that a size label is a tool
that should not only indicate the dimensions it was sized for, but should also describe the
body type that the garment was designed for. This study realised that familiar information on
size labels were tacit and less preferred by consumers as a means of size communication.
For the female Kenyan apparel consumer, being familiar with something and having
knowledge about something are clearly two different things. The implication is that being
exposed to information in the consumer socialisation process does not automatically result in
an informed consumer with the knowledge that is needed when trying to make informed
decisions.
Consumers have a right to clear and understandable information regarding what they are
buying, and preferably such information should appear on the product itself. It is therefore not
only about who is to be blamed for consumers’ lack of knowledge about important sizing and
fit issues or their misinterpretation of current labelling systems, but also what the types of
size labels are presenting to the consumer. Consumers prefer instructive size labels, but
ironically, existing sizing systems are not only non-standardised and vague, but also do not
make sense to the consumers. The addition to this theory is to highlight that size labels,
whether informative or non-informative, first must be representative of the target market, and
secondly, should be understood by the consumers. The apparel industries in any
marketplace should focus not only on presenting consumers with information, but on
assisting them to understand the information, and providing them with the skills to utilise the
information.

242
7.6.4 Research methodology theory
In this study, body assessments were done through visual sensory evaluations done in five
different steps. Sensory evaluation is the assessment using a human’s good judgement or
the sensitivity of human senses, which implies the evaluation of selected characteristics of a
product under controlled conditions by a panel of judges (ASTM, 1981:3; Leibowitz & Post
1982:4; Lyon, Menneer, McEwan, Metheringaham & Lallemand, 2000:1). In this regard, this
study has contributed to the existing sensory evaluation theory in that the techniques devised
in this study provided an orderly framework to evaluate perceived physical characteristics
within different body shapes.
From the raw photographs, it was almost impossible to extract all the details as exhaustively
as possible, and therefore the researcher formulated unique methods that eased the process
of evaluation. Microsoft Office tools photo editor made it possible to get an edged shape
(Figure 4.10 in Chapter 4) from the photo negatives (obtained by right-clicking on an icon in
a left-hand corner of the photo). The resulting body shapes and body features had clearer
outlines, which permitted more auxiliary scrutiny. The IGRAFX Designer 5 software was used
to extract only the pre-determined/-identified and important characteristics from the photos,
making the assessment of the photos even clearer.
The body shape identification technique, using both body measurements and assessments
of photos, can be viewed as more reliable, as it enhances the triangulation of the study.
Anthropometric studies uses standardised methods and instruments, which can sometimes
be unavailable due to various reasons. This study used an improvised and quality-tested,
standing anthropometer for all the height measurements (Figures 4.4 and 4.5). The
photographing studio setting (paragraph 4.6), and the rules set for the photographing were
uniquely designed for this study. Obtaining bust extension and buttocks extension
measurements, for example, were exceptional for this study.
7.6.5 Consumer education theory
According to Yeatts et al. (1992), in order to use a product effectively, consumers must have
knowledge of the products and the intent to use them. Apparel marketers and public agency
directors can educate career women in the areas of sizing and fit so that they could select
appropriately fitting apparel items. Career women consumers in particular, would have
potentially much to gain from well-orchestrated consumer education efforts jointly endorsed
by all the concerned parties (apparel marketers, government agencies as well as consumer-
oriented organisations). Consumer education programmes can provide significant benefits,

243
including identification of market information, complaint and consumer redress procedures,
and understanding a more technology-based consumer environment (Oumlil & Williams,
2000).
It was evident in this study that the career women in the group lacked knowledge about size
and fit. Skills in identifying body shapes, size labels’ contents as well as key dimensions to
identify a size would help consumers to be perceptive about size and fit issues and hence
save time spent on apparel selection. Loker et al. (2005) observed that participants were
able to give accurate dimensions when instructions on how to take body measurements were
given as opposed to when instructions were not provided. Consumer education and
counselling programmes may also include information about and referral services for
wardrobe planning, wardrobe management and strategies for dressing different female body
shapes. Advantages of viewing consumer education as part of a competitive strategy has
been seen to help retailers obtain and keep satisfied customers, contribute to the favourable
attitude formed among consumers toward a product or company, and to help reduce
confrontations with consumer advocates.
7.7 GENERAL RECOMMENDATIONS Although the conclusions made in this study cannot be generalised to a broad population,
certain recommendations can be made at this stage to:
the ready-made apparel marketers (industry) in Kenya and the foreign companies that
export their apparel items to Kenya
government agencies such as the Kenya Bureau of Standards as well as consumer-
oriented organisations
7.7.1 The ready-made apparel industry (manufacturers and retailers)
Apparel designers must distinguish how the Kenyan career women’s curvy rectangular
shape differs from the Western rectangular body shape, and furthermore, how it deviates
from the so-called ideal (hourglass) body shape. Understanding the underlying differences in
body shape could help designers to translate the distinct body characteristics of the curvy
rectangular shape into better-fitting apparel items for the Kenyan career women. Fit models
as well as dress forms chosen for fit testing and modelling in the apparel industry, should
reflect the characteristics of the prevalent curvy rectangular shape. It could also be
recommended that apparel manufacturers adjust their current sizing systems to cater for the
Kenyan career women’s distinctive curvy rectangular body shape, rather than continue with

244
the production of inappropriate apparel meant for the ideal (hourglass) shape. Although this
was a study in Kenya, it may be reasoned that most developing African nations lack a
classification of their body shapes and therefore experience challenges with apparel fit. A
country such as South Africa with people of diverse cultures also needs to follow the
example set out in this study.
It is further recommended that apparel industries in Kenya and other developing nations
ensure that their sizing systems are representative of their target populations’ sizes and body
shapes. This could be updated through collecting anthropometric data from their target
markets, or adapting their existing size systems to suit their consumers’ sizes and body
shapes. They should also ensure that size labels used are in accordance with consumers’
preferences and the recommendations by KEBS (2001)/Appendix 4B, and Faust et al.
(2006). Since retailers and manufacturers use size labels for product differentiation,
consumers should therefore be educated on what size labels presented on their apparel
mean and how the size labels relate to their body dimensions and shapes.
Communication to the consumer through labelling should contain sizing and fit information
that is clear, informative and understandable – information that is currently not given through
the non-informative, lettered and numbered size codes in use. This means that the consumer
should be able to easily identify the size of the garment. It could include size symbols, such
as the pictogram, that would quickly communicate to the consumer the key body dimensions
that the garment was designed to fit. Secondly, keeping women consumers’ lack of
knowledge regarding their own key body dimensions in mind, retailers and companies would
benefit by also providing their customers with the skills to utilise the information. In addition to
understanding the sizing code on the label, apparel consumers should know which body
dimensions are used to size a garment, and also how to determine their own body
dimensions, in order to make an appropriate size choice. This would call for a creative, but
not impossible, joint attempt by retailers and their consumer advisors – an initiative that could
not only benefit the apparel consumer, but also the specific company and/or retailer, and
ultimately the industry as a whole.
Although this was a case of the Kenyan female apparel consumer’s lack of knowledge
regarding important sizing and fit issues, concern about female consumers’ many problems
regarding the fit of their clothes is not restricted to Kenya, while the plea that the apparel
industry should at least try to address some of these problems (amongst which, the
communication of sizing through informative size labels), is a worldwide phenomenon.

245
Confusion can affect both consumers’ rights and the quality of consumers’ decisions.
Confused consumers are less able to process information and hence more vulnerable to
making less than optimum choices. Therefore, marketers within the apparel sector need to
identify the effects associated with confusion, consumer reaction to confusion and how
marketing issues could be used to counteract this. Consumers who are knowledgeable about
size and fit would therefore be able to select well-fitting apparel and would be able to identify
the sources of fit problems, and act accordingly. Therefore, it is recommended that consumer
education on size and fit be used as part of apparel industries’ promotional strategies to win
and retain consumers, while the consumers become equipped with knowledge.
While the apparel industry is expected to produce apparel within the consumers’ fit
preferences, the consumers on the other hand should be equipped with skills essential for
dressing appropriately. It is acknowledged that fit preference is subjective and varies from
one person to another. It is also sometimes influenced by internal factors such as personal
preferences, expectations and the fashion trend (Alexander et al., 2005). However, the
comfort or ease that a person requires in an apparel item depends mainly on that individual’s
body’s physical characteristics (critical fit points). Apparel designers must therefore
incorporate consumers’ fit preferences within their designs, and that could result in
appropriate fashionable styles for the curvy rectangular Kenyan body shape that was
identified, or any other prevalent shape identified in any market environment. Since comfort
is one of the attributes of fit, fabric stretch characteristics could be incorporated into the
consumers’ preferred fitted skirts and jackets to provide comfort, while the closer fit required
by the consumers could still be maintained.
Since the majority of apparel industries use the hourglass shape for marketing purposes
(LaBat & DeLong, 1990; Fiore & Kimle, 1997:30; Alexander & Connell, 2005), it could be
recommended that more realistic expectations of the consumers in any market be taken into
consideration, by presenting models with the predominant body shape in a full range of the
sizes available within the target market.
7.7.2 Government agencies and consumer-oriented organisations
To serve effectively the needs of the career women segment, governmental agencies and
private consumer-oriented organisations such as service providers must understand the
barriers that prevent the consumers from exercising their rights. Being a pilot study in Kenya,
this research project highlights many other areas of potential study. It would be
recommended to the Kenyan government (Kenya Bureau of Standards) that a national
anthropometric survey be carried out. Alternatively, anthropometric surveys could be carried

246
out on a small-scale basis, covering specific market regions for the purposes of establishing
representative sizing systems (size tables as well as body shape categories) applicable to
those regions. Kenya’s Bureau of Standards needs to adjust their current sizing systems to
cater for the curvy rectangular body shape.
The advantages of consumer education as part of a competitive strategy are perceived to
help obtain and keep satisfied customers, to contribute to the favourable attitude formed
among consumers toward a product or company, and to help reduce confrontations with
consumer advocates. Consumer education and counselling programmes that should also
include information and referral services need to be developed to equip the consumers with
the appropriate knowledge that could help them make informed purchasing decisions.
It has been observed that knowledgeable consumers are adept at forming choice-sets (De
Klerk & Tselepis, 2007). Skills in decoding size labels and the key dimensions in order to
identify a size would help consumers in selecting apparel with the correct size and fit. Loker
et al. (2005) observed that participants were able to give accurate dimensions when
instructions were given on how to take measurements, as opposed to when instructions were
not provided. Through counselling and educating consumers on the meaning of the different
size codes, and identifying their key dimensions and own body shapes, consumers would be
able to link different size codes to their measurements and shapes, and finally select
appropriate apparel styles and sizes.
Consumer education and counselling programmes may also include information and referral
services such as wardrobe planning and management strategies that give instructions on
appropriate dressing for different body shapes. Issues such as body cathexis/self-esteem
could also be incorporated into the education programmes to help the consumers appreciate
their shapes/images, and to dress accordingly.
7.8 LIMITATIONS OF THE STUDY AND SUGGESTIONS FOR FUTURE STUDIES
It should be noted that there are certain limitations to this research that also provide a basis
for further research. Studying apparel’s size and fit problems as regards the female body
shape is a new phenomenon in Kenya. The most striking limitation of this study was access
to the participants. The sensitive nature of measuring and photographing women in minimal
clothing demands understanding their culture and beliefs. It also requires sufficient financial
means to give the participants incentives, a longer time for negotiations (persuasion) and a
more versatile studio setting. However, if sensitising programmes were administered ahead

247
of time and alongside with the use of modern and efficient technology, more participants
would likely participate.
The results on the distinctive body shape (phase one) were based on only 123 measured
and 89 photographed career women of only two regions of Kenya. It is suggested that similar
research be conducted on a larger sample, and perhaps using modern technology such as
body scanners. The results on the questionnaire (phase two) were only based on the
opinions of the high school female teachers within two regions of Kenya, assumed to
represent career women in Kenya. Again, it is suggested that similar research be conducted
in all the regions and with a more representative sample.
Finally, the aim of this study was to identify the distinctive female body shape of Kenyan
career women and to analyse apparel’s fit problems associated with it. It was also to assess
career women’s perceptions regarding general fit problems with the ready-made apparel,
explore their knowledge about the communication of size and fit and to determine their fit
preferences for differently fitted apparel. These factors were used to establish how they could
contribute to fit problems of the ready-made apparel in Kenya. In spite of the limitations
mentioned, and possibilities for improvement of the methodology, the results of this study
should be used as a pilot study to improve the size and fit of apparel in Kenya as well as
other developing African countries.

248
References
ABEND, J. 1993. Our fits over fit (apparel sizing). Bobbin, 34(11): 78-81.
ADAMS, M.J. 1988. Large size and growing. Store, 70: 11-26.
AGBONIFOH, B.A. & ELIMIMIAN, J.U. 1999. Attitudes of developing countries towards
‘country-of-origin’ products in an era of multiple brands. Journal of International Consumer
Marketing, 11(4): 97-116.
AGBURU, J.I. 2001. Modern research methodology. Makurdi: The Solid Printing and
Publishing Company.
ALEXANDER, M., CONNELL, L.J. & PRESLEY, A.B. 2005a. Clothing fit preferences of
young female adult consumers. International Journal of Clothing Science and Technology,
17(1): 52-64.
ALEXANDER, M., CONNELL, L. J. & ULRICH, P.V. 2005b. Evaluating women’s self-report
of body shape and measurements. International Apparel Association, Inc. ITAA Proceedings,
# 62-www.ITAAonline.org (accessed on 15th June, 2006).
AMERICAN SOCIETY FOR TESTING AND MATERIALS (ASTM). 1968. Manual on
sensory testing methods. STP 434. Philadelphia, PA.
AMERICAN SOCIETY FOR TESTING AND MATERIALS (ASTM). 1981. Guidelines for the
selection and training of sensory panel members. STP 758. Philadelphia. American National
Standards Institute.
AMERICAN SOCIETY FOR TESTING AND MATERIALS (ASTM). 1999. Standard
terminology relating to body dimensions for apparel sizing. D 5219-99. New York: American
National Standards Institute.
ANDERSON, L.J., BRANNON, E.L., ULRICH, P.V., PRESLEY, A.B., WARONKA, D.,
GRASSO, M. & STEVENSON, D. 2001. Understanding fitting preferences of female

249
consumers: development of an expert system to enhance accurate sizing selection. National
Textile Center Annual Report, 198-A08.
ANTHROPOMETRY 2000. [Online] Available: www.sameint.it/dietosys/dietsenglbor
o/bro03.htm [2004, April 24].
APEAGYEI, P.R., OTIENO, R. & TYLER, D. 2007. Ethical practice and methodological
considerations in researching body cathexis for fashion products. Journal of Fashion
Marketing, 11(3): 332-348.
ARMSTRONG, H.L. 1995. Pattern making for fashion design. 2nd ed. New York: Harper
Collins.
ASHDOWN, S.P. 1998. An investigation of the structure of sizing systems: a comparison of
three multidimensional optimized sizing systems generated from anthropometric data with
the ASTM standard D5585-94. International Journal of Clothing Science and Technology,
10(5): 324-341.
ASHDOWN, S.P. 2000. Introduction to sizing and fit research. RESEARCH FIT. 2000. The
fit symposium. [Online] Available: http://car.clemson.edu/fit2000/ [2004, March 06].
ASHDOWN, S.P. 2003. The three-dimensional scanner: ready-to-wear. [Online] Available:
http://www.explore.cornell.edu/scene.cfm?scene=The%203d%20body%scanner [2004,
March 06].
ASHDOWN, S.P. & DELONG, M. 1995. Perception testing of apparel ease variation.
Applied Ergonomics, 26(1): 47-54.
ASHDOWN S.P & DUNNE, L. 2006. A study of automated custom fit: Readiness of the
technology for the apparel industry. Clothing and Textiles Research Journal, 24 (2): 121-
136.
ASHDOWN, S.P., CHOI, M.S., MILKE, E. & RAYMOND, D. 2004. Automated side seam
placement from 3-D body scan data. [Online] Available: www.ITAAonline.org [2006, June
15].

250
ASHDOWN, S.P., CHOI, M.S., MILKE, E. & RAYMOND, D. 2008. Automated side seam
placement from 3-D body scan data. International Journal of Clothing Science and
Technology, 20(4), 199-213
ASHDOWN, S.P., LOKER, S. & ADELSON, C. 2004. Use of body scan data to design
sizing systems based on target markets. [Online] Available
http://www.cornell.edu/units/txa/research/ntc/S01-CR01-03.pdf. [2005, Jan. 12].
ASHDOWN, S.P., LYMAN-CLARKE, L.M., SMITH, J. & LOKER, S. 2007. Production
systems, garment specification and sizing. In: ASHDOWN, S.P. 2007. (Ed.). Sizing in
clothing: developing effective sizing systems for ready-to-wear clothing. New York:
Woodhead Publishing.
ASSOCIATION OF TEXTILE CHEMIST AND COLOURIST (AATCC). 1999. Wrinkle
recovery of fabrics: Appearance method. AATCC 128.
BABBIE, E. & MOUTON, J. 2001. The practice of social research. Cape Town. Oxford
University Press.
BAILEY, K.D. 1994. Methods of social research. New York. Free Press.
BEAZLEY, A. 1996. Size and fit: procedures in undertaking a survey of body
measurements. Part 1. Journal of Fashion Marketing and Management, 2(1): 55-85.
BEAZLEY, A. 1997. Size and fit: formulation of body measurement tables and sizing
systems. Part 2. Journal of Fashion Marketing and Management, 2(3): 260-284.
BEAZLEY, A. 1998. Size and fit: the development of size charts for clothing. Part 3.
Journal of Fashion Marketing and Management, 3(1): 66-84.
BLESS, C. & HIGSON-SMITH, C.H. 2000. Fundamentals of social research methods. 3rd
ed. Cape Town: Jutta Education.
BOUGOURD, J. 2007. Sizing systems, fit models and target markets. In: ASHDOWN, S.P.
(Ed.). Sizing in clothing: developing effective sizing systems for ready-to-wear clothing. New
York: Woodhead Publishing.
BRANSON, D.H. & NAM, J. 2007. Materials and sizing. In: ASHDOWN, S.P. (Ed.). Sizing
251
in clothing developing effective sizing systems for ready-to-wear clothing. New York:
Woodhead Publishing.
BRAY, N. 1978. Dress fitting: basic principles and practice. London: Granada.
BROWN, P. 1992. Ready-to-wear apparel analysis. New York: Macmillan.
BROWN, P. & RICE, J. 2001. Ready-to-wear analysis. New York: Prentice-Hall.
BRUNN, G.W. 1983. The shape of your customer. Bobbin, 25 (3): 96-100.
BRYMAN, A. & BELL, E. 2007. Business research methods. 2nd ed. New York.: Oxford
University Press.
BRYMAN, A. & CRAMER, D. 1997. Quantitative Data Analysis for Social Scientists.
London: Routledge.
BURNS, L.D. & BRYANT, N.O. 1997. The business of fashion designing, manufacturing
and marketing. New York: Fairchild Publications.
BYE, E., LABAT, K.L. & DELONG, M.R. 2006. Analysis of body measurement systems for
apparel. Clothing and Textiles Research Journal, 24(2): 66-79.
BYE, E.K. & DELONG, M.R. 1987. A visual sensory evaluation of the results of two pattern
grading methods. Clothing and Textiles Research Journal, 12(4): 1-3.
BYE, E.K. & DELONG, M.R. 1994. A visual sensory evaluation of the results of two pattern
grading methods. Clothing and Textiles Research Journal, 12(4): 1-7.
CALLAHAN, J.C. 1988. Ethical issues in professional life. 1st ed. New York: Oxford
University Press.
CAPRARO, A.L., BRONIARCCZYK, S. & SRIVASTAVA, R.K. 2003. Factors influencing the
likelihood of customer defection: the role of consumer knowledge. Journal of Academy of
Marketing Science, 31(2): 162-176.
CARROL, R.T. 2002. Anthropometry. [Online] Available:
http://www.skepdic.com/anthropo.html. [2004, March 06].

252
CASSIDY, C.M. 1991. The good body, when big is better. Medical Anthropology, 13(3):
181-213.
CASSIL, N. & DRAKE, M.F. 1987. Apparel selection criteria related to female consumers’
lifestyle. Clothing and Textile Research Journal, 6(1): 20-28.
CHUANG, J.H. 2001. Agreement between Categorical Measurements: Kappa Statistics
Online] Available: http://www.dmi.columbia.edu/homepages/chuangj/kappa. [2006, Nov.
06].
CHUN, J. 2007. Communication of sizing and fit. In: ASHDOWN, S.P. (Ed.). Sizing in
clothing: developing effective sizing systems for ready-to-wear clothing. New York:
Woodhead Publishing.
CHUN-YOON, J. & JASPER, C.R. 1993. Garment-sizing systems. An international
comparison. International Journal of Clothing Science and Technology, 5(5): 28-37.
CHUN-YOON, J. & JASPER, C.R. 1995. Consumer preference for size description systems
of men’s and women’s apparel. The Journal of Consumer Affairs, 29(2): 429-441.
CHUN-YOON, J. & JASPER, C.R. 1996. Key dimensions of women’s ready-to-wear
apparel: developing a consumer size-labelling system. Clothing and Textiles Research
Journal, 14(1): 89-95.
CONNELL, L.J, ULRICH, P.V., KNOX, A., HUTTON, G., BRUNER, D. & ASHDOWN, S.
2003. Body scan analysis for fit models based on body shape and posture analysis.
National Textile Centre Annual Report: S01-AC27.
CONNELL, L.J, ULRICH, P.V., BRANNON, E.L., ALEXANDER, M. & PRESLEY, A.B. 2006.
Body shape assessment scale: Instrument development for analysing female figures.
Clothing and Textile Research Journal, 24: 80-95.
CORNELL UNIVERSITY. 2003. Communication of size and fit. [Online] Available:
www.explore.cornell.edu/scene.cfm?scene [2003, April 23].
DAANEN, H.A.M. & REFFELTRATH, P.A. 2007. Function, fit and Sizing. In: ASHDOWN,
S.P. 2007. (Ed.). Sizing in clothing: developing effective sizing systems for ready-to-wear
clothing. New York: Woodhead Publishing.

253
DAVIS, M.L. 1980. Visual design in dress. Englewood Cliffs: Prentice-Hall.
DE KLERK, H.M. & TSELEPIS, T. 2007. The early-adolescent female clothing consumer
expectations, evaluations and satisfaction with fit as part of the appreciation of clothing
quality. Journal of Fashion Marketing, 11(3): 413-428.
DELK, A.E. & CASILL, N.L. 1999. Jeans sizing problems and recommendations. Apparel
Manufacture, 1: 18-23.
DELONG, M., ASHDOWN, S., BUTTERFIELD, L. & TURNBLADH, K.F. 1993. Data
specifications needed for apparel production using computers. Clothing Textile Research
Journal, 11(4): 1-7.
DELONG, M.R. 1987. The way we look: a framework for visual analysis of dress. Ames, IA:
Iowa State Press.
DELONG, M.R. 1998. The way we look: a framework for visual analysis of dress. 2nd ed.
New York: Fairchild Publications.
DELPORT, C.S.L. 2002. Quantitative data collection methods. In: DE VOS, A.S. 2002.
(Eds.). Research at grass roots. 2nd ed. Pretoria: Van Schaik.
DESMARTEAU, K. 2000. Let the fit revolution begin. Bobbin, 42(2): 42-56.
DEVARAJAN, P. & ISTOOK, K. 2004. Validation of female figure identification technique
(FFIT) for apparel software. Journal of Textile and Apparel, Technology and Management,
4(1): 1-23.
DHOLAKIA, R.R. 1999. Going shopping: key determinants of shopping behaviors and
motivations. International Journal of Retail and Distribution Management, 27(4): 154-165.
DIXON, J.W. 1992. BMDP statistical software manual. Los Angeles: University of California
Press.
DOB-Verband SIZE CHARTS. 1994. Body dimensions charts, market share charts and
garment construction dimensions for ladies’ outerwear. Bonn: Dob-Verband.

254
DOMZAL, T.J. & KERMAN, J.B. 1993. Variations on the pursuit of beauty: towards a
corporal theory of the body. Psychology and Marketing, 10(6): 495-511.
DOUTY, H. 1968. Silhouette photography for the study of visual somatometry and body
image. Proceedings of National Textile and Clothing Meeting. Minneapolis. 64-72.
ERWIN, M., KINCHEN, L. & PETERS, K. 1979. Clothing for moderns. 6th ed. New Jersey,
Englewood cliffs: Prentice-Hall.
FAN, J. 2004. Perception of body appearance and its relation to clothing. In: Fan, J., Yu, W.
& Hunter, L. 2004. (Eds.). Clothing appearance and fit: science and technology. New York:
Woodhead Publishing.
FAN, J. & LIU, F. 2000. Objective evaluation of garment seams using 3-D laser scanning
technology. Textile Research Journal, 70(11): 1025-1030.
FARMER, B.M. & GOTWALS, L.M. 1982. Concepts of fit: an individualized approach to
pattern design. New York: Macmillan.
FAUST, M.E, CARRIER, S. & BAPTISTE, P. 2006. Variations in Canadian women’s ready-
to-wear standard sizes. Journal of Fashion Marketing and Management, 10(1):71-83.
FEATHER, B.L., HERR, D.G. & FORD, S. 1996. Black and white female athlete’s
perceptions of their bodies and garment fit. Clothing and Textile Research Journal, 15(2):
125-128.
FENNER, A. & BRUNS, S. 1988. Dress smart: a guide to effective personal packaging.
New York: Fairchild Publications.
FIORE, A.M. & KIMLE, P.A. 1997. Understanding aesthetics for the merchandising and
design professional. New York: Fairchild.
FIORE, A.M., LEE, S. & KUNZ, G. 2004. Individual differences, motivations, and willingness
to use mass customization options for fashion products. European Journal of Marketing,
38(7): 835-849.
FOUCHÉ, C.B. 2002. Research strategies. In: DE VOS, A.S. 2002. (Eds.). Research at
grass roots. 2nd ed. Pretoria: Van Schaik.

255
FRALIX, M.T. 2000. From mass-production to mass-customization. Journal of Textile and
Apparel, Technology and Management, 1(2): 1-7.
GAZZUOLO, E., DELONG, M., LOHR, S., LABAT, K. & BYE, E. 1992. Predicting garment
pattern dimensions from photographic and anthropometric data. Applied Ergonomics, 23(3):
161-171.
GERSAK, J. 2002. Development of the system for qualitative prediction of garments
appearance quality. International Journal of Clothing Science and Technology, 14(3/4): 169-
180.
GLOCK, R.E. & KUNZ, G.I. 1995. Apparel manufacturing, sewn product analysis. New
York: Prentice-Hall.
GLOCK, R.E. & KUNZ, G.I. 2000. Apparel manufacturing: sewn product analysis. 3rd ed.
Upper Saddle River: Prentice-Hall.
GOLDSBERRY, E., SHIM, S. & REICH, N. 1996a. Women 55 and older, current body
measurements as contrasted to the PS 42-70 Data. Part 1. Clothing and Textile Research
Journal, 14(2): 108-119.
GOLDSBERRY, E., SHIM, S. & REICH, N. 1996b. Women 55 and older: Part II. Overall
satisfaction and dissatisfaction with fit of ready-to-wear. Clothing and Textile Research
Journal, 14(2): 121-132.
GOLDSMITH, R. & HETMWYER, J. 1991. Social values and fashion leadership. Clothing
and Textile Research Journal, 10(1): 37-45.
GOVERNMENT OF KENYA (GOK). 1999. The revitalization of the cotton industry.
Sessional paper No 1, Nairobi: Government Printer.
GOVERNMENT OF KENYA (GOK). 2000. Trade liberalization and textile industry in Kenya.
Sessional paper No 2, Nairobi: Government Printer.
GREEF, M. 2002. Information collection: interviewing. In: DE VOS, A.S. 2002 (Eds.).
Research at grass roots. 2nd ed. Pretoria: Van Schaik.

256
GREEN, M.E. 1981. An application of U.S. Army women’s anthropometric data to the
derivation of hypothetical/tariffing systems. Clothing Research Journal, 9: 16-32.
GUPTA, D. & GANGADHAR, B.R. 2004. A statistical model for developing body size charts
for garments. International Journal of Clothing Science and Technology, 16(5): 458-469.
HAMMERSLEY, M. & ATKINSON, P. 1995. Ethnography: principles in practice. 2nd ed.
New York: Routledge.
HANSEN, K.T. 1999. Second-hand clothing encounters in Zambia: Global discourses,
western commodities, and local histories. Journal of the international African Institute, 69(3):
343-365.
HAWKINS, DI., BEST, R.J. & CONEY, K.A. 2001. Consumer behaviour. Implications for
marketing strategy. 6th ed. Boston: Irwin.
HARPER, A. & LEWIS, G. 1983. The big beautiful book: glamour for the fuller-figure
woman. New York: Holt, Rinehart & Winston.
HILLESTAD, R. 1980. The underlying structure of appearance. Dress, 6: 117-125.
HOGGE, V.E., BAER, M. & KANG-PARK, J. 1988. Clothing for the elderly men: a
comparison of preferences, perceived availability and fitting problems. Clothing and Textile
Research Journal, 6(4): 47-53.
HOLZMAN, D.C. 1996. Fewer sizes fit all (women’s garments). Technology Review, 99(1):
19.
HONEY, F. & OLDS, T. 2007. The standard Australia sizing system: quantifying the
mismatch, Journal of Fashion Marketing, 11(3): 320-331.
HORN, M.J. & GRUEL, L.M. 1981. The second skin. 3rd ed. Boston: Houghton Mifflin.
HUCK, J., MAGANGA, O. & KIM, Y. 1997. Protective overalls: evaluation of garment design
and fit. International Journal of Clothing Science and Technology, 9 (1): 45-61.
HUDSON, P.B. 1980. The role of fit and fashion apparel quality. Bobbin, 108-122.

257
HURREERAM, D.K. & LITTLE, D. 2004. International apparel trade and developing
economies. International Journal of Social Economics, 31(1/2): 131-142.
HWANG, J. & ISTOOK, C. 2001. Body measurement terminology used in the apparel
industry. In proceedings of the Korean society of clothing and textiles – international Textile
and Apparel Association Joint World Conference, Seoul, South Korea, June 2001. [Online]
Available: http://www.tx.ncsu.edu/3bodyscan/pdf_docs/su_itaa_kst_paper.pdf [2004, April
23].
ILA, L. 2005. Knowledge management for Chinese medicines: a conceptual model.
Information Management and Computer Security, 13(3): 244-255.
INTERNATIONAL ORGANISATION FOR STANDARDIZATION (ISO). 1989. Garment
construction and anthropometric surveys: body dimensions. Reference No 8559-1989.
Geneva: International Organization for Standardization.
INTERNATIONAL ORGANISATION FOR STANDARDIZATION (ISO). 1990. Standard
sizing for clothes. Reference No ISO/TR, 10653. Geneva: International Organization for
Standardization (ISO).
KINANTHROPOMETRY. 2001. International standards for anthropometric assessment
(ISAK). Sydney.
ISTOOK, C.L, LITTLE, T., HONG, H. & PLUMLEE, T. 2003. Automated garment
development from body scan data. National Textile Centre Annual Report: NTC Project S00-
NS15.
ISTOOK, C.L. 2000. Rapid prototyping in the textile and apparel industry: A pilot project.
Journal of Textile and Apparel Technology and Management, 1(1): 1-14.
ISTOOK, C.L. 2002. Enabling mass customization: computer-driven alteration methods.
International Journal of Clothing and Technology, 14(1): 61-76.
ISTOOK, C.L. 2005. Initial analysis of size USA data for development of new sizing systems
for the U.S. female population. International Apparel Association, Inc. ITAA Proceedings, #
62-www.ITAAonline.org [2007, June 15].

258
ISTOOK, C.L. & HWANG, 2001. Body scanning systems with application to the apparel
industry. Journal of Fashion Marketing and Management, 5(2): 120-132.
ISTOOK, C.L., SIMMONS, K.P. & DEVARAJAN, P. 2002. Female figure identification
technique (FFIT) for apparel. Journal of Textile and Apparel, Technology and Management,
4(1): 1-16.
JACOBY, J. 1977. Information load and decision quality: some contested issues. Journal of
Marketing research, 66 (11): 569-573.
KADOLPH, S.J. 1998. Quality assurance for textiles and apparel. New York: Fairchild
Publications.
KEISER, S.J. & GARNER, M. B. 2003. Beyond Design: the synergy of apparel product
development. New York: Fairchild.
KEMSLEY, W.F. 1957. Women’s measurements and sizes. London: HMSO.
KENYA BUREAU OF STANDARDS (KEBS). 2001. Draft Kenya standard specification for
size designation for women and girls’ clothing. Nairobi: Kenya Bureau of Standards (KEBS).
KENYA EXPORT PROCESSING ZONE AUTHORITY (KEPZA). 2005a. Kenya’s apparel
and textile industry. [Online] Available: http://www.epzkenya.com/news. [2006, April 23].
KENYA EXPORT PROCESSING ZONE AUTHORITY (KEPZA). 2005b. Annual report
2004. Nairobi: KEPZA.
KERLINGER, F.N. 1986. Foundations of behavioural research. 3rd ed. Fort Worth:
Harcourt.
KIM, H.S. 2005. Consumer profiles of apparel product involvement and values. Journal of
Fashion Marketing and Management, 9(2): 207-220.
KIM, M. & LENNON, S.J. 2005. The effects of customer’s dress on sales person’s service in
large-sized clothing specialty stores. Clothing and Textiles Research Journal, 23(2): 78-87.

259
KLEPP, I.G. & STORM-MATHISEN, A. 2005. Reading fashion as age: teenage girls’ and
grown women’s accounts of clothing as body and social status. Fashion Theory, 9(3): 323-
342.
KNIGHT, A.L. 1994. The market feasibility of body scanning and size prediction
technologies at retail. M.Sc. thesis. Carolina: University of North.
KUMA, M.A. 1999. Design guideline for selected plus-sized professional black South
African women. M.Sc. thesis. Pretoria: Tshwane University of Technology.
KUNIK, P. 1984. Sizing pattern construction and grading for women and children’s
garments. London: Philip Kunik.
KURT SALMON ASSOCIATES (KSA). 1996. Consumer pulse. Kurt Salmon Associates
(KSA) Annual Consumer.
KRANZLER, J.H. 2007. The statistics for the terrified. New Jersey: Pearson Prentice-Hall.
KWONG, M.Y. 2004. Garment design for individual fit. In FAN, J., YU, W. & HUNTER, L.
2004. (Eds.). Clothing appearance and technology. New York: The Textile Institute,
Woodhead Publishing.
LABAT, K., SALUSSO, C. & RHEE, J. 2007. Home sewers’ satisfaction with fit of apparel
patterns. Journal of Fashion Marketing, 11(3): 439-440.
LABAT, K.L. 1989. Improving garment fit: a challenge for industry. (Paper presented at the
American Society of Quality Congress Transactions, Toronto). Unpublished.
LABAT, K.L. 2007. Sizing standardization. In: ASHDOWN, S.P. 2007. (Ed.). Sizing in
clothing developing effective sizing systems for ready-to-wear clothing. New York:
Woodhead Publishing.
LABAT, K.L. & DELONG, M.R. 1990. Body cathexis and satisfaction with fit of apparel.
Clothing and Textile Research Journal, 8(2): 43-48.
LANDIS, J.R. & KOCH, G.G. 1977. The measurement of observer agreement for categorical
data. Biometrics, 33, 159-174.

260
LAUFER, D. 2002. Are antecedents of consumer dissatisfaction and consumer attributions
for product failures universal? Advances in Consumer Research, 29:312-317.
LE PECHOUX, B. & GHOSH, T.K. 2002. Standard Sizing and fit testing applied to women’s
hosiery in textile institute. The Textile Institute. Apparel sizing and fit. Textile Progress, 32
(1): 1-59.
LEBOW, J. 1985. National retail merchant will tackle sizing problems. Women’s wear Daily,
pp.12.
LEIBOWITZ, H.W. & POST, R.B. 1982. Capabilities and limitations of the human being as a
sensor, selected sensory methods: problems and approaches to measuring hedonics. In:
KUZNICK, J.T., JOHNSON, R.A. & RUTKIEWIC, A.F. (Eds.). Selected sensory methods:
problems and approaches to measuring hedonics. American Society for Testing and
Materials. STP 773. Philadelphia: ASTM.
LENNON, S.J. 1988. Physical attractiveness, age and body type. Home Economics
Research Journal, 16(3): 195-204.
LENNON, S.J. 1990. Effects of clothing attractiveness on perceptions. Home Economics
Research Journal, 18(4): 302-310.
LENNON, S.J. 1992. Categorization as a function of body type. Clothing and Textiles
Research Journal, 10(2): 18-23.
LENNON, S.J. 1997. Physical attractiveness, age and body type: further evidence. Clothing
and Textile Research Journal, 15(1): 60-64.
LEWIS, V.D. 2007. Sizing and clothing aesthetics. In: ASHDOWN, S.P. 2007. (Ed.).
Sizing in clothing developing effective sizing systems for ready-to-wear clothing. New York:
Woodhead Publishing.
LI, D. & GALLUP, A.M. 1995. In search of the Chinese consumer. China Business Review,
22(5): 19-22.
LIECHTY, E.G., POTTBERG, D.N. & RASBAND, J.A. 1992. Fitting and pattern alteration: a
multi-method approach. New York: Fairchild Publications.

261
LOKER, S. 2007. Mass customization and sizing. In: ASHDOWN, S.P. 2007. (Ed.).
Sizing in clothing: developing effective sizing systems for ready-to-wear clothing. New York:
Woodhead Publishing.
LOKER, S., ASHDOWN, S. & SCHOENFELDER, K. 2005. Size-specific analysis of body
scan data to improve apparel fit. Journal of Textile and Apparel, Technology and
Management, 4 (3): 1-15.
LOUDON, D.L. & DELLA BITTA, A.J. 1993. Consumer behaviour: concepts and
applications. 4th ed. New York: McGraw-Hill.
LYLE, D.S. & BRINKLEY, J. 1983. Contemporary clothing. Glencoe: Mission Hills.
LYMAN-CLARKE, L., ASHDOWN, S., LOKER, S., LEWIS, V. & SCHOENFIELDER, K.
2005. A comparison of visual analysis rating systems (abstract), in Proceedings of the 62nd
Annual Meeting of the International Textile and Apparel Association, Alexandria, Virginia.
International Textile and Apparel Association, Monument, Colorado, Res-564. [Online]
Available: http://www.ITAAonline.org [2006, April 23].
LYON, D.H., MENNEER, J.L., MCEWAN, J.A., METHERINGAHAM, T.L.C. & LALLEMAND,
M. 2000. Guidelines for the selection and training of assessors for descriptive sensory
analysis. Hungary: Campden & Chorleywood Magyarorszag.
MACDONALD, N.M & WEIBEL, R.E. 1988. Principles of flat pattern design. London / New
York: Prentice-Hall.
MAMAHLODI, M. 2006. What is Chi-Square Statistics? [Online] Available:
http:cnx.org/context/m13487/latest/. [2006, April 23].
MARSHALL, S.G, JACKSON, H.O, STANLEY, M.S, KEFGEN, M. & TOUCHIE-SPECHT, P.
2004. Individuality in clothing selection and personal appearance. 6th ed. New Jersey:
Pearson Education.
MASON, A.M. 1998. Constraints affecting the growth of the “Jua Kali” clothing
manufacturers in Nairobi-Kenya. M.Sc. thesis. Manchester: Manchester Metropolitan
University.

262
MASON, A.M., De Klerk, H.M., SOMMERVILE, J. & ASHDOWN, S. 2008. Consumers’
knowledge on size and fit issues: A solution to successful apparel selection in developing
countries. International Journal of Consumer Studies,32 :276-284.
MASTNAK, R. 2001. 3-D scanning and the apparel industry in North America: a new
business paradigm. [Online] Available http://www.techexange.com. [2004, March 06].
McCONVILLE, J, TEBBETTS, I. & CHURCHILL, T. 1979. Analysis of body size
measurements for U.S navy women’s clothing and pattern design. Naval-Cloth Textile
Research Facility.
McCORMICK, D.P., KIMUYA, P. & KINYANJUI, M. 2001. Kenya’s garment industry: An
institutional view of medium and large firms. IDS working paper 531. Institute of Development
Studies (IDS). University of Nairobi.
McCORMICK, D.P, KIMUYU, P. & KINYANJUI, M. 2002. Weaving through reforms:
Nairobi’s small garment producers in a liberalized economy. Paper presented at the east
African workshop on business systems in Africa, organized collaboratively by the Institute for
Development Studies IDS – University of Nairobi and the Center for Development Research
(CDR), Copenhagen, Denmark.
MCKINNON, L. & ISTOOK, C. 1999. How current sizing systems miss the mark (a pilot
study). Annual meeting. International Textile and Apparel Association.
MCKINNON, L. & ISTOOK, C. 2001. Comparative analysis of the image twin system and
the 3T6 body scanner. Journal of Textile and Apparel, Technology and Management, 1(2):
1-7.
MEILGARD, M., CIVILLE, G.V. & CARR, B.T. 1987. Sensory evaluation techniques. Incl.
Boea Raton, Florida: CRC Press.
MHANGO, M.W. & NEIHM, L.S. 2005. The second-hand clothing distribution channel.
Journal of Fashion Marketing and Management, 9(3): 342-356.
MILES, M.B, & HUBERMAN, A.M. 1994. Qualitative Data Analysis. 2nd ed. Newbury Park,
CA: Sage.

263
MITCHELL, V. & PAPAVASSILIOU, V. 1999. Marketing causes and implications of
consumer confusion. Journal of Product & Brand Management, 8 (4): 319-39.
MORRIS, A., COOPER, T. & COOPER, P. 1989. The changing shape of fashion models.
International Journal of Eating Disorders, 8: 593-596.
MORRIS, E. 1993. The difference in black and white. American Demographics, January:
44-49.
MOUTON, J. 1996. Understanding social research. Pretoria: Van Schaik.
MOUTON, J. 2001. How to succeed in your master’s and doctoral studies. Pretoria: Van
Schaik.
NEUMAN, W.L. 2000. Social research methods. 4th ed. Boston: Allyn & Bacon.
NEWCOMB, B. & ISTOOK, C. 2004a. A case for the revision of U.S. sizing standards.
Journal of Apparel, Technology, and Management, 4(1): 1-6.
NEWCOMB, B. & ISTOOK, C. 2004b. A case for the revision of U.S. sizing standards
(abstract), in Proceedings of the 61st Annual Meeting of the International Textile and Apparel
Association, Alexandria, Virginia, USA, 2004, International Textile and Apparel Association,
Monument, Colorado, Res-564.
NEWCOMB, B. & ISTOOK, C. 2005. Hispanic women: body shapes and sizing (abstract), in
Proceedings of the 62nd Annual Meeting of the International Textile and Apparel Association,
Alexandria, Virginia, USA, 2005, International Textile and Apparel Association, Monument,
Colorado, Res-564.
NORTON, K. & OLDS, T. 1996. Anthropometrica. A textbook of body measurements for
sports and health courses. Sydney: University of Wales Press.
O’Brien, R. & Shelton, W. 1941. Women’s measurements for garment and pattern
construction. Miscellaneous Publication No 454. Washington, D.C. U.S. Government Printing
Office.
ODONGO, P. 2001. Female teacher and challenges. Kenya National Union of Teachers
Annual Report. Nairobi: KNUT.

264
OLDS, T. 2003. Kinanthreport. Newsletter of the International Society for Advancement of
Kinathropometry. XV1: 1 January 2003. [Online] Available
http://www.isakonline.com/pages/publications.html [2004, March 06].
OMOLO, J.O. 2006. The textiles and clothing industry in Kenya. In: Jauch, H. & Traub-Merz
(Eds.). The future of the textile and clothing industry in Sub-Saharan Africa. Bonn. Friedrich-
Ebet-Stiftung.
ONGILE, G. & McCORMICK, D. 1996. Barriers to small firm growth: Evidence from
Nairobi’s garment industry. In McCORMICK, D. & PEDERSEN, P.O. 1996. (Eds.). Small
enterprises: flexibility and networking in African Context. Nairobi: Longhorn Kenya.
OTIENO, R., HARROW, C. & LEA-GREENWOOD, G. 2005. The unhappy shopper, a retail
experience: exploring fashion, fit and affordability. International Journal of Retail and
Distribution Management, 33(4): 298-309.
OUMLIL, A.B., WILLIAMS, A.J. & OUMLIL, L. 2000. Consumer education programs for
mature consumers. Journal of Service Marketing, 14 (3): 232-243.
PARKER, S., WINTERS, A. & AXELROD, I. 1988. Fashion buying and merchandising.
New York: Fairchild Publications.
PETROVA, A. 2007. Creating sizing systems. In: ASHDOWN, S.P. (Ed.). Sizing in
clothing: developing effective sizing systems for ready-to-wear clothing. New York:
Woodhead Publishing.
PHEASANT, P. 1986. Body space: anthropometry, ergonomics and design. London:
Taylor & Francis.
PISUT, G. & CONNELL, L.J. 2007. Fit preferences of female consumers in USA. Journal of
Fashion Marketing and Management, 11(3): 366-379.
POGGENPOEL, M. 1998. Data analysis in qualitative research. In: DE VOS, A.S. (Ed.).
STRYDOM, H., FOUCHÉ, C.B., POGGENPOEL, M., SCHURINK, E. & SCHURINK, W.
Research at grass roots. A primer for catering professions. Pretoria: Van Schaik.
RABON, L.C. 1996. Custom fit comes of age. Bobbin, 37(12): 42-46.

265
RASBAND, J. 1994. Fabulous fit. New York: Fairchild Publications.
RASBAND, J. 1996. Wardrobe strategies for women. New York: Fairchild Publications.
RASBAND, J. 2001a. Art in everyday dress: in clothing design, selection and coordination.
Sine locum: Conselle Institute of Image Management.
RASBAND, J. 2001b. Smart shopping. Sine locum: Conselle Institute of Image
Management.
RASBAND, J. & LIECHTY, E. 2006. Fabulous Fit. 2nd ed. New York: Fairchild Publications.
READER’S DIGEST. 1988. Complete guide to sewing. New York: The Reader’s Digest
Association.
READER’S DIGEST. 2002. New complete guide to sewing: step-by-step techniques for
making clothes and home accessories. New York: The Reader’s Digest Association.
REGAN, P. & LLAMAS, V. 2002. Customer service as a function of shopper’s attire.
Psychological Reports, 90, 203-204.
REID, R. & BROWN, S. 1996. I hate shopping! An introspective perspective. International
Journal of Retail and Distribution Management, 24(4):4-16.
REGIONAL AGRICULTURAL TRADE EXPANSION SUPPORT PROGRAM (RATES). 2003.
Cotton-textile and apparel value chain report for Kenya. Nairobi: The RATES center.
REPUBLIC OF SOUTH AFRICA. [RMSS]. 1994. Republic of South African Military
Standards. RSA-MIL-STD-127, 1(4): 1-264.
REYNOLDS, K. & ARNOLD, M. 2000. Customer loyalty to the salespersons and the store.
Examining relationships of customers in an upscale retail context. Journal of Personal Selling
and Sales Management, 20(2): 89-98.
ROACH, M.E. & EICHER, J.B. 1973. The visible self: perspectives on dress. Englewood
Cliffs: Prentice-Hall.

266
ROACH, M.E. & EICHER, J.B. 1992. Dress identity. Clothing and Textile Research
Journal, 4(10): 1-8.
ROBINETTE, K.M. 1986. Anthropometric methods for improving protection. Performance of
Protective Clothing: ASTM STP 900.
ROEBUCK, J.A. 1995. Anthropometric methods: designing to fit the human body. Santa
Monica, CA: Human Factors and Ergonomics Society.
ROEBUCK, J.A., KROEMER, K.H. & THOMSON, W.G. 1975. Engineering anthropometry
methods. New York: Wiley.
ROMANO, C. 2000. Plan your wardrobe. London: Struik Publishers.
ROSENAU, J.R. & WILSON, D.L. 2001. Apparel merchandising. New York: Fairchild
Publications.
ROSNOW, R.L. & ROSENTHAL, R. 1996. Beginning behavioral research: a conceptual
primer. New Jersey: Prentice-Hall International.
RUDD, N.A. & LENNON, S.J. 1994. Aesthetics of the body and social identity. International
Textile and Apparel Association. Special Publication, No. 7: 163-175.
RUDD, N.A. & LENNON, S.J. 2000. Body image and appearance – management:
behaviours in college women. Clothing and Textiles Research Journal, 18(3): 152-161.
RUST, R. 2001. Inter-rater reliability. Journal of Consumer psychology, 10(1 & 2), 71-73.
RYAN, J. 2005. The Chi Square Statistic. [Online] Available:
http://math.hws.edu/javamath/ryan/ChiSquare.html. . [2006, Dec. 12].
SALUSSO-DEONIER, C. 2005. The body as a framework for apparel. [Online] Available:
http://www.wsu.edu:8080/salusso/BODY/contents.html. [2005, Jan. 20].
SALUSSO-DEONIER, C.J. 1982. A method for classifying adult female body form variation
in relation to U.S. standard for apparel sizing. Unpublished doctoral dissertation. University of
Minnesota, St Paul.

267
SALUSSO-DEONIER, C.J. 1985. A multivariate method of classifying adult female body
form for women’s apparel. Clothing and Textiles Research Journal, 4(1): 38-45.
SALUSSO-DEONIER, C.J. 1989. Gaining a competitive edge with top quality sizing. Paper
presented at the American Society of Quality Congress Transactions. Toronto: 371-378.
SALUSSO-DEONIER, C.J., MARKEE, N.L & PEDERSEN, E.L. 1991. Developing realistic
stimuli for assessing observer’s perceptions of male and female body types: Perceptual and
Motor Skills, 72: 603-610.
SASIA, J.O. 1991. The textile industry in Kenya. Senior policy seminar on industrial public
enterprise reform for profitability. Kenya institute of management government investment
division (GID). Economic development institute of the World Bank.
SCIFFMAN, L.G & KANUK, L. 2000. Consumer behavior. 7th ed. New York: Prentice-Hall.
SCHOFIELD, N.A. 2007. Pattern Grading. In: ASHDOWN, S.P. (Ed.). Sizing in clothing
developing effective sizing systems for ready-to-wear clothing. New York: Woodhead
Publishing.
SCHOFIELD, N.A. & LABAT, K.L. 2005a. Defining and testing the assumptions used in
current apparel grading practice. Clothing and Textiles Research Journal, 23(3): 135-150.
SCHOFIELD, N.A. & LABAT, K.L. 2005b. Examining the use of grades in sizing women’s
clothing (Abstract), in Proceedings of the 62nd Annual Meeting of the International Textile and
Apparel Association, Alexandria, Virginia, USA, 2005, International Textile and Apparel
Association, Monument, Colorado, Res-564.
SCHOFIELD, N.A. & LABAT, K.L. 2005c. Exploring the relationships of grading, sizing and
anthropometric data. Clothing and Textiles Research Journal, 23(1): 13-27.
SCHOFIELD, N.A., ASHDOWN, S.P., HETHORN, J., LABAT, K. & SALUSSO, C. 2006.
Improving pant fit for women 55 and older through an exploration of two pants shapes.
International Textile and Apparel Association, 24(2): 147-160.
SCHURINK, E.M. 1998. Deciding to use a qualitative research approach. In: DE VOS, A.S.
(Ed.). STRYDOM, H., FOUCHÉ, C.B., POGGENPOEL, M., SCHURINK, E. & SCHURINK,
W. Research at grassroots. A primer for the caring professions. Pretoria: Van Schaik.

268
SHANI, A.B., SENA, J.A. & OLIN, T. 2003. Knowledge management and new product
development: a study of two companies. European Journal of Innovation Management,
6(3):137-149.
SHIM, S. & BICKLE, C.M. 1994. Benefit segments of the female apparel market:
Psychographics, shopping orientations, and demographics. Clothing and Textiles Research
Journal, 2: 1-12.
SHIM, S. & KOTSIOPULOS, A. 1991. Big and tall men as apparel shoppers: Consumer
characteristics and shopping behaviour. Clothing and Textile Research Journal, 9(2): 16-22.
SHIN, S.H. & ISTOOK, C.L. 2007. The importance of understanding the shape of diverse
ethnic female consumers for developing jeans sizing systems. International Journal of
Consumer Studies, 31: 135-143.
SLATER, K. 1998. Subjective textile testing. Journal of Textile Institute, 88 part 1(2): 79-91.
SIMMONS, K., ISTOOK, C.L. & DEVARAJAN, P. 2004a. Female figure identification
technique (FFIT) for apparel. Part 1: describing female shapes. Journal of Textile and
Apparel, Technology and Management, 4(1): 1-16.
SIMMONS, K., ISTOOK, C.L. & DEVARAJAN, P. 2004b. Female figure identification
technique (FFIT) for apparel. Part 2: development of shape sorting software. Journal of
Textile and Apparel, Technology and Management, 4(1): 1-15.
SIMMONS, K.P. & ISTOOK, C.L. 2003. Body measurement techniques, comparing 3-D
body-scanning and anthropometric methods for apparel applications. Journal of Fashion
Marketing and Management, 7(3): 306-332.
SIMON S. 2005. What is a Kappa coefficient? (Cohen's Kappa). [Online] Available:
http://www.childrensmercy.org/stats/definations/kappa.htm. [2006, Sept. 20].
SOLINGER, J. 1988. Apparel manufacturing handbook. Analysis, principles and practice.
2nd ed. New York: Bobbin Blenheim.
SOLOMON M.R. & RABOLT, N.J. 2004. Consumer behaviour in fashion. New York:
Pearson Education.

269
SOLOMON, M.R., SURPRENANT, C., CZEPIEL, J.A. & GUTMAN, E.G. 1985. A role theory
Perspective dyadic interactions: The service encounter. Journal of Marketing, 49(4): 99-111.
SPILLANE, M. 1995. Bigger ideas from colour me beautiful. London: Judy Piatkus.
STONE, E. 1999. The dynamics of fashion. New York: Fairchild Publications.
STRYDOM, H. 2002. Information collection: participant observation. In: DE VOS, A.S.
(Eds.). Research at grass roots. 2nd ed. Pretoria: Van Schaik.
STRYDOM, H. & DELPORT, C.S.L. 2002. Sampling and pilot study in qualitative research. In: DE VOS, A.S. (Eds.). Research at grass roots. 2nd ed. Pretoria: Van Schaik. STRYDOM, H. & VENTER, L. 2002. Sampling and sampling methods. In De Vos, AS. (Eds.). Research at grass roots. 2nd ed. Pretoria: Van Schaik.
SUMMERS, T.A., BELLEAU, B.D. & WOZNIAK, P.J. 1992. Fashion and shopping
perceptions, demographics and store patronage. Clothing and Textiles Research Journal,
11(1): 83-91.
TAMBURRINO, N. 1992a. Apparel sizing issues: part 1. Bobbin, 33(8): 44-59.
TAMBURRINO, N. 1992b. Apparel sizing issues, part II, Bobbin, May: 55-60.
ULRICH, P.V., ANDERSON-CONNELL, L.J. & WU, W. 2003. Consumer co-design of
apparel for mass customization. Journal of Fashion Marketing and Management, 8(4): 398-
412.
UNITED NATIONS (UN). 1985. Guidelines for consumer protection. Geneva.
WARRACK, K. 2000. Study guide for statistics for management and economics. 5th ed.
Duxbury: Brooks/Cole.
WEGNER, T. 1998. Applied business statistics. Methods and applications. Landsdowne:
Juta.
WEINER, B. 1986. An atributional theory of motivation and emotion. New York: Springer-
Verlag.
WEINER, B. 2000. Atributional thought about consumer behavior. Journal of Consumer

270
research, 27: 382-387.
WINKS, J.M. 1991. The development of standard sizing systems for clothes. Masters
Dissertation. Port Elizabeth, South Africa: Port Elizabeth University.
WINKS, J.M. 1997. Clothing sizing, international standardization. The Textile Institute,
London: Redwood Books.
WORKMAN, J.E. 1991. Body measurement specification for fit models as a factor in
clothing size variation. Clothing and Textiles Research Journal, 10(1): 31-36.
WORKMAN, J.E. & LENTZ, E.S. 2000. Measurement specifications for manufacturers’
prototype bodies. Clothing and Textiles Research Journal, 18(4): 251-529.
XU, B., HUANG, Y., YU, W. & CHEN, T. 2002. Body scanning and modeling for custom fit
garments. Journal of Textile and Apparel, Technology and Management, 2(2): 1-11.
YEATTS, D.E., CROW, T. & POLTS, E. 1992. Service use among low-income minority
elderly: strategies for overcoming barriers, The Gerontologist, 32 (1): 24-32.
YOON, J.S. & RADWIN, R.G. 1994. The accuracy of consumer-made body measurements
for mail order clothing. Human Factors, 36 (3): 557-568.
YU, W. 2004. Subjective assessment of clothing. In Fan, J., YU, W. & Hunter, L. (Eds.).
Clothing appearance and fit: science and technology. New York: Woodhead Publishing.
ZANGRILLO, F.L. 1990. Fashion design for the plus-size. New York: Fairchild Publishers.
ZWANE, P.E & MAGAGULA, N. 2006. Pattern design for women with disproportionate
figure: A case study for Zwaziland. International Journal of Consumer Studies, 31:283-287.

271
Appendix 1A QUESTIONNAIRE
Pretoria 0002 Republic of South Africa
http://www.up.ac.za Natural and Agricultural Sciences Official use only
REGION V1 1
Respondent number 2-4
Dear participants, My name is Anne Mastamet Mason from Moi University Eldoret and currently undertaking PhD studies at University of Pretoria, Republic of South Africa. As part of my studies, I’m required to carry out research on a specific field. My research topic is to examine problems encountered by professional females with regards to size and fit of both local and imported ready-made apparel, which are sold in Kenya. Findings of this study are hoped, to be used in address sizing and fit issues of the ready made garments in Kenya. I therefore request you to fill in the questionnaire as freely and honestly, as possible. There are no right or wrong answers for all the questions provided. All answers that you provide will be treated as confidential without exposing anyone’s names. Thank you for your participation.
Please answer the questions provided by marking “X” against appropriate answers
1. Please indicate the year of your birth 19____________________ V3 5-6
2.
Have you ever done Home Science or Clothing and Textiles course, either in high school or as a profession? Please mark with an “X”
X
1 Yes
2 No V4 7
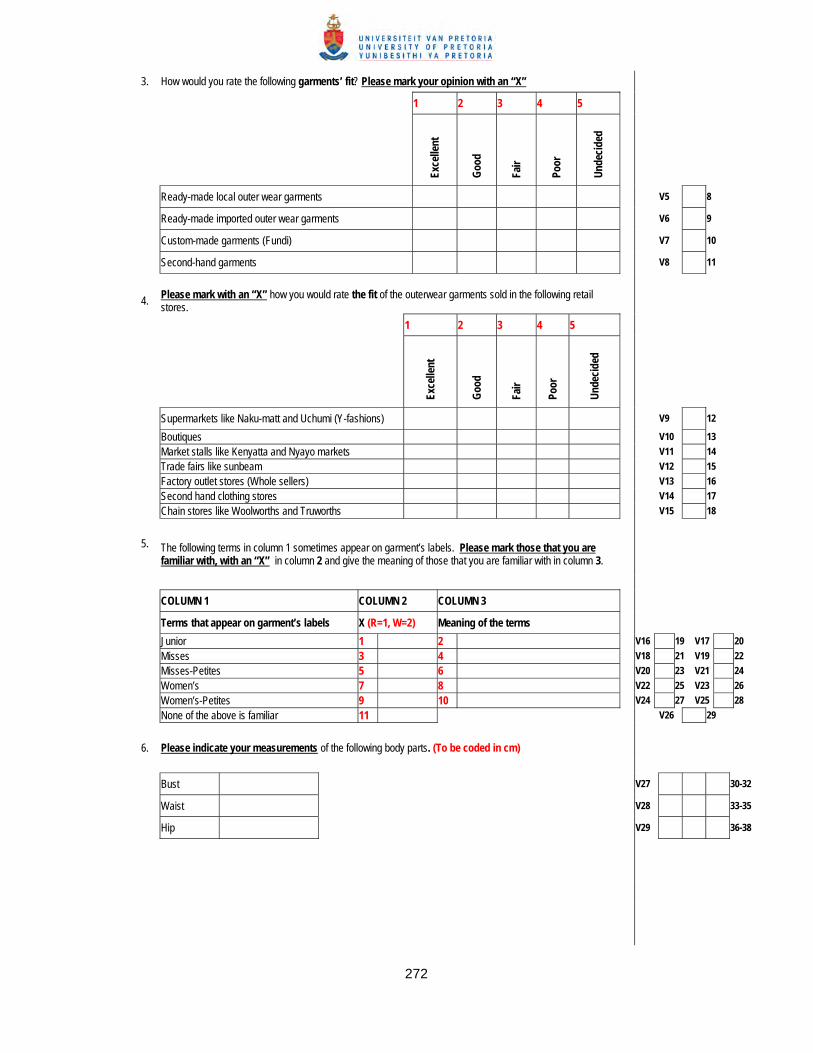
272
3. How would you rate the following garments’ fit? Please mark your opinion with an “X”
1 2 3 4 5
Exce
llent
Goo
d
Fair
Poor
Und
ecid
ed
Ready-made local outer wear garments V5 8
Ready-made imported outer wear garments V6 9
Custom-made garments (Fundi) V7 10
Second-hand garments V8 11
4. Please mark with an “X” how you would rate the fit of the outerwear garments sold in the following retail stores.
1 2 3 4 5
Exce
llent
Goo
d
Fair
Poor
Und
ecid
ed
Supermarkets like Naku-matt and Uchumi (Y-fashions) V9 12
Boutiques V10 13
Market stalls like Kenyatta and Nyayo markets V11 14
Trade fairs like sunbeam V12 15
Factory outlet stores (Whole sellers) V13 16
Second hand clothing stores V14 17
Chain stores like Woolworths and Truworths V15 18
5.
The following terms in column 1 sometimes appear on garment’s labels. Please mark those that you are familiar with, with an “X” in column 2 and give the meaning of those that you are familiar with in column 3.
COLUMN 1 COLUMN 2 COLUMN 3
Terms that appear on garment’s labels X (R=1, W=2) Meaning of the terms
Junior 1 2 V16 19 V17 20
Misses 3 4 V18 21 V19 22
Misses-Petites 5 6 V20 23 V21 24
Women’s 7 8 V22 25 V23 26
Women’s-Petites 9 10 V24 27 V25 28
None of the above is familiar 11 V26 29
6. Please indicate your measurements of the following body parts. (To be coded in cm)
Bust V27 30-32
Waist V28 33-35
Hip V29 36-38

273
7. Examine the given figure types, and then mark “X” in the boxes below, against a figure type that approximately describes your own figure.
1 2 3 4 5 V30 39
8. Please name the five figure types provided in question 7 above, using not more than three words.
Naming of the figure types (R=1, W=2)
Figure 1 V31 40
Figure 2 V32 41
Figure 3 V33 42
Figure 4 V34 43
Figure 5 V35 44
9. Which of the following factors have you applied, to establish your figure type? You may choose more than one. Please indicate with an “X”
X (1)
Having my figure traced while standing against the wall for analysis V36 45
Studying my figure in a mirror’s reflection whenever I have minimal clothing on V37 46
Having my body measurements taken frequently V38 47
Scrutinizing my photographs which, I have taken in closely fitted garments V39 48
Comparing my shape with those of the established figures V40 49
Using yard stick to compare my shoulders & hips, determining direction the yardstick assumes V41 50
None of the above applies V42 51
Other, specify V43 52-53

274
10. Which of the figure types shown below, do you consider as an ideal figure in your own opinion? Please mark with an “X” in the boxes provided below each figure type.
1 2 3 4 5 V44 54
11. How do your proportions compare to your chosen ideal figure? Please mark “X” against each of the following body characteristics which would best describe your own body proportions in comparison to those of your chosen ideal figure.
SHOULDERS X
1 Narrow (smaller)
2 Broader (wider)
3 Similar V45 55
WAIST X
1 Small
2 Large
3 Similar V46 56
BUST X
4 Extra small
1 Small
2 Large
5 Extra large
3 Similar V47 57
HIP SIZE X
4 Extra narrow
1 Narrow
2 Wide
5 Extra wide
3 Similar V48 58

275
12. Please choose one style from each of the following categories (jackets, skirts and pants), which you think is suitable for your figure type. Please mark with an “X” in the boxes below each style
Jackets
1 2 3 4 5 V49 59
Skirts
1 2 3 4 5 V50 60
Pants
1 2 3 4 5 V51 61
13. Please indicate with an “X” your usual size in the following garment items. (To be coded in actual sizes)
SIZES
8 10 12 14 16 18 20 22 24 Other, specify
Jacket/blouse V52 62-63
Skirt V53 64-65
Trousers V54 66-67
Dress V55 68-69
14. Please indicate with an “X” your usual size in the following garment items. (To be coded in actual sizes)
SIZES
32 34 36 38 40 42 44 46 48 Other, specify
Jacket/blouse V56 70-71
Skirt V57 72-73
Trousers V58 74-75
Dress V59 76-77

276
15. The following size description systems (labels) sometimes appear on women’s outerwear garments. Please mark “X” against those size description systems (labels) that are commonly used on outerwear ready-made apparel
X (1)
Letter coded labels such as, small (S), medium (M), large (L) Example
V60 78
Numbered coded labels such as, 14, 16, 18, 20, 22, 24, ____ Example
V61 79
Numbered coded labels such as, 36, 38, 40, 42, 44, 46, 48, 50, ____ Example
V62 80
Size code and important measurements Example
V63 81
Illustrated figure, size code and measurements of some important body parts of a specific garment Example
V64 82
Illustrated figure, size code and measurements indicated on the figure Example
V65 83
XL
16
42
Size code-14 Bust 92 cm Hip 97 cm Length 96 cm
Size 24 Waist - 96 cm Hips - 124 cm Length - 124 cm
Size 24

277
16. Please mark “X” on column 3, against only one appropriate measurement, presented in column 2, which are used to determine size description systems given in column 1.
Column 1 (Size description systems)
Column 2 (Meaning)(Right = 1, Wrong = 2)
Column 3 (X)
Shoulder measurements 2
Size 16 on a jacket
Bust measurements 1 V66 84
Waist measurements 2
Size 16 on a pair of trousers
Hip measurements 1 V67 85
Shoulder measurements 2
Size 42 on a jacket
Bust measurements 1 V68 86
Length measurements 2
Size 42 on a pair of trousers
Hip measurements 1 V69 87
Bust measurements 2
Extra large size on a blouse
The size of the body 1 V70 88
Hip measurements 2
Extra large size on a pair of trousers
The size of the body 1 V71 89
17. Please mark “X” on column 3, against only one appropriate answer in column 2, for the questions given in column 1.
Column 1
Column 2 Right = 1, Wrong = 2)
Column 3 (X)
16 inches (41 cm) shoulders 2
What does a number 16 on a Jacket indicate? 40 inches (102 cm) bust 1 V72 90
26 inches (66 cm) waist 2
What does a number 16 on a Skirt indicate? 44 inches (112 cm) hips 1 V73 91
18 inches (46 cm) shoulders 2
What does a number 42 on a Jacket indicate? 40 inches (102 cm) bust 1 V74 92
42 inches (107 cm) waist 2
What dos a number 42 on a Skirt indicate?
44 inches (112 cm) hips 1 V75 93
16
16
42
42
XL
XL

278
18. How would you rate the following size description systems’ effectiveness in terms of guiding you to select well-fitting outerwear garments? Please mark your answer with an “X”.
1 2 3 4 5
Extr
emel
y ef
fect
ive
Effe
ctiv
e
Inef
fect
ive
Extr
emel
y in
effe
ctiv
e
Und
ecid
ed
Letter coded labels such as, small (S), medium (M), large (L) Example
V76 94
Numbered coded labels such as, 14, 16, 18, 20, 22, 24, ____ Example
V77 95
Numbered coded labels such as, 36, 38, 40, 42, 44, 46, 48, 50, ____ Example
V78 96
Size code and important measurements Example
V79 97
Illustrated figure, size code and measurements of some important body parts of a specific garment Example
V80 98
Illustrated figure, size code and measurements indicated on the figure Example
V81 99
Size code-14 Bust 92 cm Hip 97 cm Length 96 cm
Size 24 Waist - 96 cm Hips - 124 cm Length - 124 cm
Size 24
XL
16
42

279
19. Please rate the following statements regarding your preference on differently fitted garment items. Please mark your answer with an “X”.
Mor
e of
ten
Ofte
n
Som
etim
es
Nev
er
Und
ecid
ed
JACKET
I prefer to wear a fitted jacket to work V82 100
I prefer to wear a semi fitted jacket to work V83 101
I prefer to wear a loose fitting jacket to work V84 102
SKIRT
I prefer to wear a fitted skirt to work V85 103
I prefer to wear a semi fitted skirt to work V86 104
I prefer to wear a loose fitting skirt to work V87 105
20. Please respond to the following statements in relation to fit problems common with ready-made garments. Please mark with an “X”.
Stro
ngly
A
gree
Agr
ee
Dis
agre
e
Stro
ngly
D
isag
ree
Und
ecid
ed
I never find well fitting garments, because my body in proportionally unbalanced (some parts are too small and others are to big e.g. my hips are too big for my waistline.
V88 106
I never find well fitting garments because the sizes available in the market has problems (e.g. none fit both my waist and my hips comfortably without adjustments like elastic in waistline)
V89 107
21. Please indicate with an “X”, how frequently you experience the following fitting problems with ready-made garments.
Mos
t Fr
eque
nt
Freq
uent
Less
Fr
eque
nt
Nev
er
Und
ecid
ed
I have problems purchasing outer-wear garments that fit my figure/size type well
V90 108
I am satisfied with the way most of my garments fit my figure/size type
V91 109
The latest fashions are available in my size V92 110

280
22. Please mark “X” in column 3, against only one fit problem in column 2, which you commonly experience with the ready-made garments at specific locations, presented in column 1.
COLUMN 1 (Garment locations)
COLUMN 2 (Fit problems) (R=1, W=2)
COLUMN 3 (X)
Too tight 1
Neckline
Too loose 2 V93 111
Too tight 1
Shoulders
Too lose 2 V94 112
Too tight 1
Back width (Shoulder blades)
Too loose 2 V95 113
Too tight 1
Bust
Too loose 2 V96 114
Too short 1
Nape to waist
Too long 2 V97 115
Too short 1
Front neck to waist
Too long 2 V98 116
Too tight 1
Armscye (Armhole)
Too loose 2 V99 117
Too tight 1
Upper arms
Too loose 2 V100 118
Too tight 1
Elbow
Too loose 2 V101 119
Too tight 1
Lower arm
Too loose 2 V102 120
Too short 1
Sleeve length
Too long 2 V103 121
Too tight 1
Waist
Too loose 2 V104 122
Too tight 1
Abdomen
Too loose 2 V105 123
Too tight 1
Hip
Too loose 2 V106 124
Too short (tight) 1
Crotch line
Too loose (long) 2 V107 125
Too tight 1
Buttock
Too loose 2 V108 126
Too tight 1
Thigh
Too loose 2 V109 127
Too short 1
Skirt length
Too long 2 V110 128
Too short 1
Trousers length
Too long 2 V111 129

281
Appendix 1B INTRODUCTORY LETTER TO THE MINISTER OF EDUCATION

282
Appendix 1C RESEARCH PERMIT FROM KENYA’S MINISTRY OF EDUCATION

283

284
Appendix 1D RESEARCH PERMIT FROM ELDORET MINISTRY OF EDUCATION REGIONAL OFFICE

285
Appendix 1E RESEARCH PERMIT FROM KISUMU MINISTRY OF EDUCATION REGIONAL OFFICE

286
Appendix 2A ORIGINAL SAMPLE PLAN
Region 1- Western (Eldoret and Kisumu) = 302 Eldoret: start school 5, every 3rd
school Kisumu: Start school 9,
every 3rd school
Region 2 (Nairobi) = 346 Start school 15, every 3rd school
School F total Sample School F total Sample School F total Sample
1 1 24 12 1 40 20 odd/even flip a coin 2 2 2 3 3 3 4 4 24 12 4 26 13 odd/even flip a coin 5* 24 12 5 5 6 6 6 7 7 7 36 13 every third starting with 15 8 28 14 8 8 9 9* 28 14 9 10 10 10 42 14 every third starting with 4 11 26 13 11 11 12 12 28 14 12 13 13 13 30 10 every third starting with 6 14 26 13 14 14 15 15 23 11 15* 26 13 odd/even flip a coin 16 16 16 17 24 12 17 17 18 18 27 13 18 23 11 odd/even flip a coin 19 19 19 20 20 10 20 20 21 Totals 154 76 21 28 14 odd/even flip a coin Totals 148 74 22
23 24 26 13 odd/even flip a coin 25
Western =302, 150 in every 2. Odd or even numbers on female staff list-flip a coin to determine which to choose.
26 27 22 11 odd/even flip a coin 28
29 30 24 8 every third starting with 8 31 32 33 23 11 odd/even flip a coin 34 35 Total 151

287
Appendix 2B LIST OF SCHOOLS AT GRASS ROOT LEVEL
NEW LIST OF SCHOOLS: REGION 1,WESTERN-ELDORET SCHOOL NUMBER OF FEMALE TEACHERS 1 Chebisaas High School 25 2 Moi Girls High School 35 3 Hill School 25 4 Kapsoya Secondary School 18 5 Wareng Secondary School 23 6 Sixty-Four Secondary School 24 7 Uasin Gishu High School 28 8 Umoja Secondary School 20 9 Cheplaskei Secondary School 20 10 Kapsaos Secondary School 18 11 G. K Magereza Secondary School 24 Total 260
NEW LIST OF SCHOOLS: REGION 1,WESTERN-KISUMU SCHOOL NUMBER OF FEMALE TEACHERS 1 Bar Union Secondary School 24 2 Xaverian Secondary School 18 3 Dago Thim Mixed Secondary School 24 4 Kisumu Day Secondary School 25 5 Dr Aloo Gumbi Mixed Secondary School 28 6 Joel Omino Mixed Secondary School 26 7 Kisumu Girls Secondary School 30 8 Joyland Special Secondary School 23 9 Nyamasaria Mixed Secondary School 24 10 Kisumu Boys Secondary School 28 11 Obwolo Mixed Secondary School 26 12 St Theresa’s Kibuye Girls Secondary School 27 13 Ogada Mixed Secondary school 27 Total 330

288
NEW LIST OF SCHOOLS: REGION 2, CENTRAL-NAIROBI SCHOOL NUMBER OF FEMALE TEACHERS 1 Kenya High Girls School 32 2 Upper Hill Secondary School 25 3 State House Girls High School 27 4 Ngara Girls High School 24 5 Nairobi Boys High School 23 6 Pumwani Secondary School 18 7 Moi Nairobi Girls High School 30 8 Pangani Girls High School 28 9 Precious Blood Girls High School 27 10 Huruma Girls Secondary 26 11 Jamhuri High school 10 12 Ofafa Jericho Secondary School 16 13 Embakasi Secondary School 22 14 Buruburu Girls Secondary School 10 15 St Georges Girls Secondary School 30 16 Aquinas Secondary School 25 17 Alliance Boys High School 20 18 Alliance Girls High School 32 19 St Theresa’s Boys Secondary School 24 20 St Theresa’s girls Secondary School 16 21 Lenana Boys High School 26 22 Dagoretti High School 23 23 Moi Forces Academy School 28 24 Starehe Boys High School 21 Total 563

289
Appendix 2C SAMPLING PLAN WHILE AT GRASS ROOT LEVEL, RESPONSES TO THE
QUESTIONNAIRE AND PARTICIPATION IN THE MEASUREMENT AND PHOTOGRAPHIC EXERCISE
REGION 1 – ELDORET
List
of t
he S
choo
ls
Num
ber o
f fem
ale
teac
hers
in a
ll th
e sc
hool
s
Num
ber o
f fem
ale
teac
hers
from
the
sam
pled
sch
ools
Dis
trib
uted
qu
estio
nnai
res
Fille
d /r
ecei
ved
ques
tionn
aire
Phot
ogra
phs
Mea
sure
men
ts
1 25
2* 5 35 35 18 12 7 9
3 25
4 18
5** starting point) 1 23 23 12 11 6 8
6 24
7* 2 28 28 14 8 4 7
8 20
9* 3 20 20 10 7 4 5
10 18
11* 4 24 24 12 8 4 5
Total 260 130 66 46 (69.7%- responses)
25 (37.9%-participants)
34 (51.5%- participants
REGION 1 – KISUMU
List
of t
he S
choo
ls
Num
ber o
f fem
ale
teac
hers
in a
ll th
e sc
hool
s
Num
ber o
f fem
ale
teac
hers
in
sam
pled
sch
ools
Dis
trib
uted
qu
estio
nnai
res
Fille
d qu
estio
nnai
res
Phot
ogra
phs
Mea
sure
men
ts
1 24
2**(starting point) 1 18 18 10 6 3 5
3 24
4* 2 25 25 15 9 6 9
5 28
6* 3 26 26 16 9 2 7
7 30
8* 4 23 23 13 7 5 6
9 24
10* 5 28 28 17 8 4 8
11 26
12* 6 27 27 16 8 5 7
13 27
Total 330 147 87 47 (54%- responses)
25 (28.7% participants)
42 (48.3% participants)

290
REGION 2 – NAIROBI
List
of t
he S
choo
ls
Num
ber o
f fem
ale
teac
hers
in a
ll th
e sc
hool
s
Num
ber o
f fem
ale
teac
hers
in
sam
pled
sch
ools
Dis
trib
uted
qu
estio
nnai
res
Fille
d qu
estio
nnai
res
Phot
ogra
phs
Mea
sure
men
ts
1 32
2*6 25 25 14 9 4 5
3 27
4* 7 24 24 13 8 3 4
5 23
6* 8 18 18 11 8 0 3
7 30
8* 9 28 28 17 11 4 5
9 27
10* 10 26 26 15 11 5 4
11 10
12* 11 16 16 9 7 4 4
13 22
14* 12 10 10 6 6 0 0
15 30
16** starting point 1 25 25 14 10 4 4
17 20
18* 2 32 32 18 13 4 4
19 24
20 * 3 16 16 9 7 3 5
21 26
22* 4 23 23 13 9 3 4
23 28
24* 5 21 21 11 9 5 5
563 264 150 108 (72%-response 39 (26% -participan 47 (31%-participan

291
Appendix 3A BODY MEASUREMENT FORM
OFFICIAL USE ONLY
REGION V1 1
SUBJECT NUMBER V2 2-4
MEASUREMENTS TO BE RECORDED N CENTIMETRES CM
A. VERTICAL MEASUREMENTS
1 Height (Stature) V3 3-7
2 Nape to ground (Cervical height standing) V4 8-10
3 Shoulder (acromion) to ground V5 11-13
4 Chest girth level to ground V6 14-16
5 Bust level to ground V7 17-19
6 Under bust level to ground V8 20-22
7 Natural waist to ground V9 23-25
8 Lower waist to ground V10 26-28
9 Upper hip to ground V11 29-31
10 Hip to ground V12 32-34
11 Largest thigh level to ground V13 35-37
12 Inside leg to ground V14 38-40
13 Knee height (midpatella) V15 41-43
14 Largest (widest) calf level to ground V16 44-46
15 Nape to natural waist the back V17 47-49
16 Scye depth (front) V18 50-52
17 Scye depth (back) V19 53-55
18 Nape to bust point at the front V20 56-58
19 Nape to natural waist at the front through bust point V21 59-61
20 Crutch length V22 62-64
21 Body rise V23 65-67
22 Centre back waist (natural) to hip V24 68-70
23 Under arm land mark (side seam) to the waist V25 71-73
24 Under arm land mark (side seam) to the floor V26 74-76
25 Outside leg from the waist to hip on the side seam V27 77-79
26 Outside leg from the waist to knee on the side seam V28 80-82
27 Outside leg from the waist to ankle on the side seaam V29 83-85
28 Outside leg from the waist to the floor on the side seam V30 86-88

292
MEASUREMENTS TO BE RECORDED N CENTIMETRES CM
B. GIRTH AND ARC MEASUREMENTS
29 Neck base girth V31 89-91
30 Armscye circumference V32 92-94
31 Upper arm girth at the largest part V33 95-97
32 Wrist girth V34 98-100
33 Back chest arc (from right to the left side seams) V35 101-103
34 Front chest arc (from right side to the left side seams) V36 104-106
35 Upper chest girth V37 107-109
36 Back bust level arc (from right to the left side seams) V38 110-112
37 front bust level arc (from right to the left side seams) V39 113-115
38 Bust girth at fullest part V40 116-118
39 Back under bust arc (from right to the left side seams) V41 119-121
40 Front under bust arc (from right to the left side seams) V42 122-124
41 Under bust girth V43 125-127
42 Back natural waist arc (from right to the left side seams) V44 128-130
43 Front natural waist arc (from right to the left side seams V45 131-133
44 Natural waist girth V46 134-136
45 Back lower waist (omphalion) arc (from right to the left side seams) V47 137-139
46 Front lower waist (omphalion) arc (from right to the left side seams) V48 140-142
47 Lower waist (omphalion) girth V49 143-145
48 Back upper hip level arc (from right side seam to left side seam) V50 146-148
49 Front upper hip level arc (from right side seam to left side seam) V51 149-151
50 Upper hip girth at 10cm below natural waist V52 152-154
51 Back upper hip level arc (from right to the left side seams) V53 155-157
52 Front upper hip level arc (from right to the left side seams) V54 158-160
53 Hip grith (normal) V55 161-163
54 Hip girth (broadest point) V56 164-166
55 Upper thigh girth at the widest part V57 167-169
56 Knee girth V58 170-172
57 Calf girth V59 173-175
58 Ankle girth V60 176-178

293
MEASUREMENTS TO BE RECORDED N CENTIMETRES CM
C. WIDTH AND LENGHT MEASUREMENTS
59 Across back shoulders V61 179-182
60 Back width (cross back at mid way between nape and scye level) V62 183-184
61 Shoulder length V63 185-187
62 Across front shoulders (from right to left acromions) V64 188-200
63 Cross chest at the front at mid way between neck base and scye level V65 201-203
64 Width of bust prominence (from right to the left bust tips) V66 204-206
65 Side seam to the bust point taken from the side (bust extension) V67 207-209
66 Side seam to the hip prominence measured from the side (Waist to flat back
ground surface measured at 90 degrees from the background) (buttock extension)
V68 210-212
67 Nape to wrist (7th cervical to wrist) V69 213-215
68 Inside arm length (under arm to the wrist) V70 216-218
69 Shoulder (acromion to wrist) V71 219-221
70 Shoulder slope V72 222-224

294
Appendix 3B RULES OBSERVED WHILE TAKING BODY DIMENSIONS
The subjects must stand erect with the head in Frankfort plane
A. HEIGHT AND VERTICAL MEASUREMENTS
Type of measurement Instruments (equipment and tools to be used)
Method of taking measurements (Technique) Reference
1 Height (stature) Improvised anthropometer and Stature metre interchangeably
The measurement was taken on the vertical distance from a standing surface to the top of the head. The subjects stood erect with the head in Frankfort plane. The heels were together with the weight distributed equally on both feet
RMSS, 1994; Beazley, 1996
2 Nape to ground (Cervical height standing)
Improvised anthropometer The measurement was taken on vertical distance from a standing surface to the 7th cervical landmark. The subjects stood erect with the heads in Frankfort plane measured from the back of the subject.
RMSS, 1994; Beazley, 1996
3 Shoulder to ground
Improvised anthropometer The measurement was taken on vertical distance between a standing surface and the cervical landmark (acromion) on the spine at the base of the neck. The subjects stood erect with the heads in the Frankfort plane measured from the back of the subjects
Beazley, 1996
4 Natural waist to ground
Elastic on the natural waist indentation, the adjustable metal tape and
The measurement was taken on vertical distance between a standing surface and the landmark on the natural waist. The subjects stood erect with heads in the Frankfort plane measured from the back of the subject.
Beazley, 1996
5 Hip to ground (Trochanterion height)
Improvised anthropometer The measurement was taken on vertical distance between a standing surface and the right thigh. The subjects stood erect looking straight ahead. The heels were together with weight distributed equally on both feet.
RMSS, 1994
6 Inside leg to ground
Improvised anthropometer The measurement was taken when the subject was in a relaxed position with legs slightly apart. Then measurements were taken from the crotch to the soles of the feet.
ASTM-D 5219, 1994
7 Knee height (Midpatella)
Improvised arnthropometer The measurement was taken on vertical distance between a standing surface and midpatella landmark at the centre of the right knee. The subjects stood erect with the heels together and the weight distributed equally on both feet
RMSS, 1994).
8 Nape to natural waist (Cervical to natural waist at the back)
Metal tape measure The measurement was taken on distance from the 7th cervical vertebra, the tape measure was placed vertically down the back to the waist at the natural indentation level while the subjects stood erect
RMSS, 1994; Beazley, 1996.
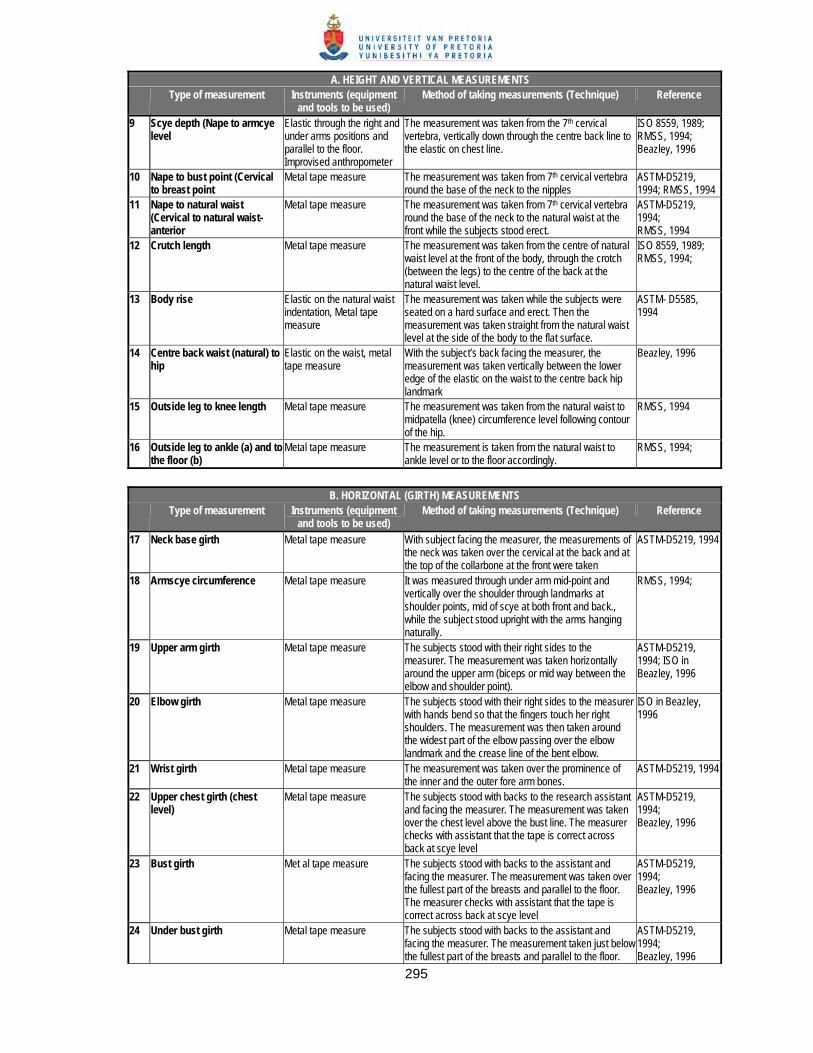
295
A. HEIGHT AND VERTICAL MEASUREMENTS Type of measurement Instruments (equipment
and tools to be used) Method of taking measurements (Technique) Reference
9 Scye depth (Nape to armcye level
Elastic through the right and under arms positions and parallel to the floor. Improvised anthropometer
The measurement was taken from the 7th cervical vertebra, vertically down through the centre back line to the elastic on chest line.
ISO 8559, 1989; RMSS, 1994; Beazley, 1996
10 Nape to bust point (Cervical to breast point
Metal tape measure The measurement was taken from 7th cervical vertebra round the base of the neck to the nipples
ASTM-D5219, 1994; RMSS, 1994
11 Nape to natural waist (Cervical to natural waist-anterior
Metal tape measure The measurement was taken from 7th cervical vertebra round the base of the neck to the natural waist at the front while the subjects stood erect.
ASTM-D5219, 1994; RMSS, 1994
12 Crutch length Metal tape measure The measurement was taken from the centre of natural waist level at the front of the body, through the crotch (between the legs) to the centre of the back at the natural waist level.
ISO 8559, 1989; RMSS, 1994;
13 Body rise Elastic on the natural waist indentation, Metal tape measure
The measurement was taken while the subjects were seated on a hard surface and erect. Then the measurement was taken straight from the natural waist level at the side of the body to the flat surface.
ASTM- D5585, 1994
14 Centre back waist (natural) to hip
Elastic on the waist, metal tape measure
With the subject’s back facing the measurer, the measurement was taken vertically between the lower edge of the elastic on the waist to the centre back hip landmark
Beazley, 1996
15 Outside leg to knee length Metal tape measure The measurement was taken from the natural waist to midpatella (knee) circumference level following contour of the hip.
RMSS, 1994
16 Outside leg to ankle (a) and to the floor (b)
Metal tape measure The measurement is taken from the natural waist to ankle level or to the floor accordingly.
RMSS, 1994;
B. HORIZONTAL (GIRTH) MEASUREMENTS
Type of measurement Instruments (equipment and tools to be used)
Method of taking measurements (Technique) Reference
17 Neck base girth Metal tape measure With subject facing the measurer, the measurements of the neck was taken over the cervical at the back and at the top of the collarbone at the front were taken
ASTM-D5219, 1994
18 Armscye circumference Metal tape measure It was measured through under arm mid-point and vertically over the shoulder through landmarks at shoulder points, mid of scye at both front and back., while the subject stood upright with the arms hanging naturally.
RMSS, 1994;
19 Upper arm girth Metal tape measure The subjects stood with their right sides to the measurer. The measurement was taken horizontally around the upper arm (biceps or mid way between the elbow and shoulder point).
ASTM-D5219, 1994; ISO in Beazley, 1996
20 Elbow girth Metal tape measure The subjects stood with their right sides to the measurer with hands bend so that the fingers touch her right shoulders. The measurement was then taken around the widest part of the elbow passing over the elbow landmark and the crease line of the bent elbow.
ISO in Beazley, 1996
21 Wrist girth Metal tape measure The measurement was taken over the prominence of the inner and the outer fore arm bones.
ASTM-D5219, 1994
22 Upper chest girth (chest level)
Metal tape measure The subjects stood with backs to the research assistant and facing the measurer. The measurement was taken over the chest level above the bust line. The measurer checks with assistant that the tape is correct across back at scye level
ASTM-D5219, 1994; Beazley, 1996
23 Bust girth Met al tape measure The subjects stood with backs to the assistant and facing the measurer. The measurement was taken over the fullest part of the breasts and parallel to the floor. The measurer checks with assistant that the tape is correct across back at scye level
ASTM-D5219, 1994; Beazley, 1996
24 Under bust girth Metal tape measure The subjects stood with backs to the assistant and facing the measurer. The measurement taken just below the fullest part of the breasts and parallel to the floor.
ASTM-D5219, 1994; Beazley, 1996

296
B. HORIZONTAL (GIRTH) MEASUREMENTS Type of measurement Instruments (equipment
and tools to be used) Method of taking measurements (Technique) Reference
The measurer checks with assistant that the tape is correctly placed at the back.
25 Natural waist girth Metal tape measure and elastic for locating the waist indentation
The measurer confirms the waist indentation as the elastic sits comfortably in natural waist positions. This area is located between the lowest rib and hip also identified by bending the body to the side. Subject stood with backs facing the assistant. The metal tape measure is held round the waist level firmly but not tightly. The measurer checks with assistant that the correct back waist level are maintained.
ISO8559, 1989 ASTM-D5219, 1994
26 Lower waist (omphalion) girth Metal tape measure
The measurement was taken round the body at level of omphalion (belly button).
RMSS, 1994;
27 Upper hip girth at 10cm below natural waist
Metal tape measure The measurement was taken round the body at 10 cm below the natural waistline. The measurer checks that the tape remains in proper level at the back through the help of the assistant
Beazley, 1996; RMSS, 1994;
28 Hip girth Metal tape measure This part is located at approximately, 10cm below the upper hip level. Also located as the fullest part of the buttocks. With the subject facing the measurer, the tape measure was held firmly over the hip level landmarks ensuring that it was also correctly placed at the back with the help of an assistant.
Beazley, 1996; RMSS, 1994;
29 Upper thigh girth Metal tape measure The measurement was taken around the thickest part of the right upper thigh at gluteal (buttock) crease point
RMSS, 1994; Beazley, 1996; Gordon et al., in Simmons and Istook, 2003
30 Mid-thigh girth Metal tape measure The measurement was taken at midway between the hip level and knee while the subjects stood upright.
RMSS, 1994
31 Knee girth Metal tape measure With the legs straight, the circumference of the knee over the kneecap (Patella) and parallel to the floor was taken.
ASTM-D5219, 1994
32 Calf girth Metal tape measure The subjects stood facing the measurer with legs slightly apart. The measurement was taken horizontally around the thickest part of right calf
ISO8559, in Beazley, 1996
33 Ankle girth Metal tape measure The subjects stood facing the measurer with her legs slightly apart. The measurement was taken around the widest part of the right ankle passing over the ankle landmark
ISO8559, in Beazley, 1996
C. WIDTH AND LENGTH MEASUREMENTS
Type of measurement Instruments (equipment and tools to be used)
Method of taking measurements (Technique) Reference
34 34. Across back shoulders Metal tape and segmometer interchangeably
The subjects stood upright and straight with backs to the measurer. The measurement was taken between the left and right shoulder (acromion) landmarks.
ISO8559, 1989
35 35. Back width (cross back at mid way between nape and scye level
Metal tape and segmometer interchangeably
With the subject’s back facing the measurer, the measurement was taken between left and right landmarks placed midway shoulder and scye level.
ASTM-D5219, 1994; Beazley, 1996
36 Buttock extension Metal tape measure With the subjects looking straight ahead and shoulders relaxed, the measurement was taken from the side at the hip joint to the end of buttock extension
37 Shoulder length Metal tape measure With the subjects looking straight ahead and shoulders relaxed, the measurement was taken from the base neck landmark to the landmark at the shoulder point (acromion)
RMSS, 1994
38 Across front shoulders Metal tape and segmometer interchangeably
With the subject facing the measurer, the measurement was taken horizontally between left and right shoulder landmarks.
Beazley, 1996

297
C. WIDTH AND LENGTH MEASUREMENTS Type of measurement Instruments (equipment
and tools to be used) Method of taking measurements (Technique) Reference
39 Bust extension Metal tape With the subjects looking straight ahead and one arm stretched forward, the measurement was taken from the side seam to the breast tip
40 Cross chest at the front at mid way between neck base and scye level
Metal tape and segmometer interchangeably
With the subject facing the measurer, the measurement was taken from left and right landmarks in between the shoulder points and scye level.
Beazley, 1996
41 Width of bust prominence Metal tape and segmometer interchangeably
With the subject facing the measurer, the measurement was taken horizontally from left and right most prominent parts of the breasts (nipples).
ASTM-D5219, RMSS, 1994
42 7th cervical to wrist (nape to wrist)
Metal tape measure Subject stoodd with right sides to the measurer with arms bent at 90 degrees at the elbow. Measurement was taken from the 7th cervical land mark over the shoulder (acromion) landmark to the wrist land mark
RMSS, 1994
43 Inside arm length Metal /Fibre glass tape measure
This measurement was taken between the mid axilla fold (ampit) to the distal end of the stylion landmark at the wrist. The subject stood erect with arms rested against the body
RMSS, 1994
44 Shoulder to wrist Metal/Fibre glass tape measure
Subjects stood with right sides to the measurer with arms bent at the elbow. Measurement was taken from the shoulder point (acromion landmark) through the elbow to the wrist land mark
RMSS, 1994 ISO8559,

298
Appendix 3C ANTHROPOMETRIC QUALIFICATIONS OF THE RESEARCHER

299
Appendix 3D BODY SHAPE ASSESSMENT SCALE
Officeial use only REGION V1 1 Photograph code V2 2-3 Panellist code V3 4-5 The body shape appear to fit into which group? (Please mark one) X Slender group (small size) 1 Average (medium size) 2 Large group (plus size) 3 V4 6 Study the following Front, Side(profile) and Back views of each of the provided photographs
and mark with an “X” a statement that best describes the part-to-part proportions of the body shape
PART-TO PART EVALUATION Shoulders/bust appear-----------------------------------(please mark one) X Narrower than the hips 1 Same width as the hips 2 Wider than the hips 3 V5 7 The waist appear--------------------------------------------please mark one) X Narrower than the hips 1 Same width as the hips 2 Wider than the hips 3 V6 8

300
Study the following Front, Side(profile) and Back views of each of the provided photographs
and mark with an “X” a statement that best describes the part-to-whole proportions of the body shape
PART-TO WHOLE EVALUATION Stomach(abdomen) appear-----------------------------------------------------------------------(please
mark one)
X No fullness looks straight or flat 1 Fullness (‘b’) below waist 2 Fullness (‘D’) extending from the bust line to the crotch level 3 V7 9 Derriere (Seat/Buttocks) appear-----------------------------------------------------------------(please
mark one)
X Flat with very small or no fullness at all 1 Average protrusion with moderate rounded shape 2 Full protrusion extending (‘d”) larger fullness extension 3 V8 10 Upper back appear--------------------------------------------------------------------------(please mark one) X Straight upper back (Flat) 1 Moderately rounded upper back 2 Fully rounded upper back 3 V9 11 Thighs bulge appear-----------------------------------------------------------------------(please mark one) X Small bulge (flat) no thigh bulge or same as hip 1 Average bulge (large bulge extending moderately beyond the hip) 2 Large bulge (extends excessively beyond the hip) 3 V10 12 Top arms (biceps) appear---------------------------------------------------------------(please mark one) X Thin (bony) with little flesh) 1 Average with softly curved shape. No excess flesh 2 Full with heavy upper arms or muscular curves 3 V11 13 Shoulders appear----------------------------------------------------------------------------(please mark one) X Squared 1 Normal 2 Sloping 3 V12 14

301
Using your own words, please assign the shape a name/category that would holistically
describe the central features critical to the garment’s fit when viewed from the front, side and back (For example, Hourglass with “D”, “b” front, “d” back, rounded upper back and hollow back waist.
V13 15 V14 16 V15 17 V16 18 V17 19 V18 20 V19 21 V20 22 V21 23 V22 24

302
Appendix 4A KENYA BUREAU OF STANDARDS SIZES
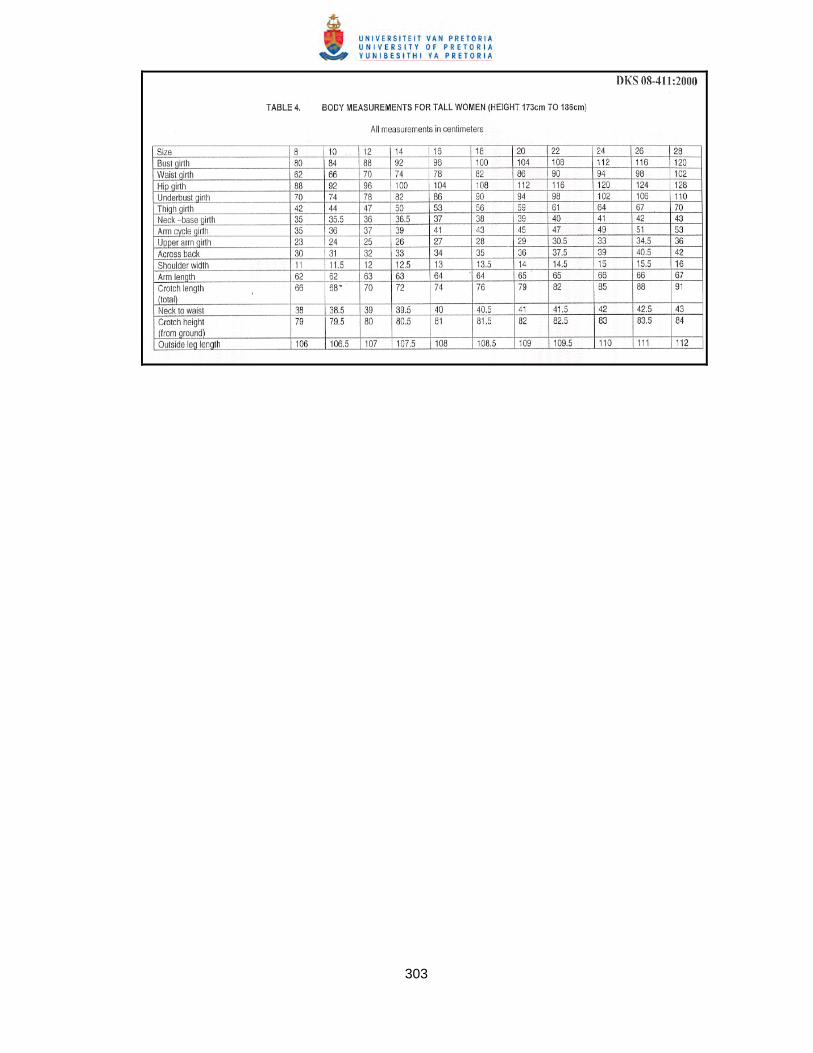
303

304
Appendix 4B KENYA BUREAU OF STANDARDS SIZE LABELS

305