BPJ 420 Final Project Report - University of Pretoria
82
BPJ 420 Final Project Report Non-returnable bottle loss reduction on a packaging line at South African Breweries, Rosslyn. D. du Plessis 11101866
-
Upload
khangminh22 -
Category
Documents
-
view
2 -
download
0
Transcript of BPJ 420 Final Project Report - University of Pretoria

BPJ 420 Final Project Report
Non-returnable bottle loss reduction on a
packaging line at South African Breweries,
Rosslyn.
D. du Plessis 11101866

i
Executive Summary
The South African Breweries (SAB) is a leading local company that successfully competes on a global platform. To retain their positive position, SAB identifies and improves areas in which they are falling short of world-class manufacturing status. In order to benchmark their performance, metrics are established. An area that the Rosslyn Brewery identified as an opportunity for improvement is variable costs. A large contributor to variable costs is non-returnable bottles (NRB), which is the main focus of this project.
The purpose of the document is to outline the project aimed at improving the non-returnable bottle loss at the SAB, Rosslyn brewery, so that the performance metrics can be met in this regard. The project is structured according to the DMAIC problem solving approach. The document provides a thorough definition of the project; an overview of the relevant literature gives a context to the problem and describes applicable industrial engineering mechanisms used in solving the problem. Data is analysed to determine the magnitude of the problem and to decide which areas should be focussed on. Discussions on these focus areas reveal factors contributing to bottle loss in each focus area. Each problem is addressed and a variety of solutions are suggested. The suggested solutions are evaluated and a summary of the short-term and long-term solutions as well as the financial benefit and validation of these solutions is given. Recommendations for the implementation, support and maintenance of the change involved in implementing the solutions is also provided within the document.
The successful completion of the project according to this document will ultimately aid SAB to decrease their variable costs and become more profitable. In essence, it will help SAB align itself with the company’s vision to strive for operational excellence though continuous improvement.

ii
Contents
1.1 Introduction & Background ................................................................................................. 1
1.1.1 The Beer Industry ......................................................................................................... 1
1.1.2 The South African Breweries ........................................................................................ 1
1.1.3 The Rosslyn Brewery .................................................................................................... 1
1.1.4 World Class Manufacturing .......................................................................................... 1
1.1.5 The Problem Statement ................................................................................................. 2
1.2 Project Scope ....................................................................................................................... 3
1.2.1 Product .......................................................................................................................... 3
1.2.2 Process .......................................................................................................................... 3
1.2.3 Exclusions ..................................................................................................................... 4
1.3 Rationale .............................................................................................................................. 4
1.3.1 Performance Target ....................................................................................................... 4
1.4 Project Aim .......................................................................................................................... 5
1.5 Project Approach and Deliverables ..................................................................................... 5
1.5.1 Define ............................................................................................................................ 5
1.5.2 Measure ......................................................................................................................... 5
1.5.3 Analyse ......................................................................................................................... 6
1.5.4 Improve ......................................................................................................................... 6
1.5.5 Control .......................................................................................................................... 6
1.6 Problem Context .................................................................................................................. 6
1.6.1 The SABMiller Manufacturing Way ............................................................................ 6
1.6.2 Benchmarking ............................................................................................................... 8
1.6.3 Performance Metrics ..................................................................................................... 8
1.6.4 Organisational Design ................................................................................................... 8

iii
1.6.5 Low Level Process Analysis ......................................................................................... 8
1.6.5.1 Raw Material Acquisition ...................................................................................... 9
1.6.5.2 De-Palletiser ........................................................................................................... 9
1.6.5.3 Rinsers.................................................................................................................. 10
1.6.5.4 Filler ..................................................................................................................... 10
1.6.5.5 Pasteuriser ............................................................................................................ 10
1.6.5.6 Labellers and Taptones ........................................................................................ 10
1.6.5.7 Shrink-wrapper, Tray-packer and Palletiser ........................................................ 11
2.1 Literature Review............................................................................................................... 12
2.1.1 Introduction ................................................................................................................. 12
2.1.2 Define, Measure, Analyses, Improve and Control (DMAIC) ..................................... 12
2.1.2.1 Define ................................................................................................................... 13
2.1.2.2 Measure ................................................................................................................ 13
2.1.2.3 Analyse ................................................................................................................ 13
2.1.2.4 Improve ................................................................................................................ 13
2.1.2.5 Control ................................................................................................................. 14
2.1.3 The Six Step Problem Solving Approach ................................................................... 14
2.1.4 Statistical Process Control .......................................................................................... 14
2.1.4.1 Control Charts ...................................................................................................... 15
2.1.4.2 The Control Chart for Individual Measurement .................................................. 15
2.1.4.3 Run rules .............................................................................................................. 16
2.1.4.4 Performance and Capability Studies .................................................................... 16
2.1.5 Pareto Chart ................................................................................................................ 18
2.1.6 Cause-and-Effect Diagram.......................................................................................... 18
2.1.7 One Point Lessons (OPL) ........................................................................................... 18

iv
2.1.8 Decision between Alternative Solutions ..................................................................... 19
2.1.8.1 Cost-benefit analysis ............................................................................................ 19
2.1.8.2 Weighted-Sum Method (WSM) ........................................................................... 19
2.1.8.3 Analytical Hierarchy Process (AHP) ................................................................... 19
2.2 Data Analysis ..................................................................................................................... 20
2.2.1 Capability and Performance Study Based on X and MR Control Charts ................... 20
2.2.2 Pareto Chart ................................................................................................................ 23
2.2.3 Focus Areas ................................................................................................................. 24
3.1 Measurement System ......................................................................................................... 25
3.1.1 Measurement System Analysis ................................................................................... 25
3.1.2 Measurement System Improvement ........................................................................... 25
3.1.2.1 Short Interval Control (SIC) ................................................................................ 25
3.1.2.2 Rejects Monitoring............................................................................................... 26
3.1.2.3 Cullet Tracking .................................................................................................... 26
3.1.2.4 Measurement System Considerations .................................................................. 27
3.2 Conveyers .......................................................................................................................... 29
3.2.1 Conveyer Analysis ...................................................................................................... 29
3.2.2 Conveyer Improvements ............................................................................................. 30
3.2.2.1 Conveyer Design .................................................................................................. 30
3.2.2.2 Conveyer Guide Rails .......................................................................................... 31
3.2.2.3 PLC System Optimisation and Conveyer Maintenance....................................... 32
3.2.2.4 Bottle Loss Awareness ......................................................................................... 33
3.3 Pasteuriser .......................................................................................................................... 34
3.3.1 Pasteuriser Analysis .................................................................................................... 34
3.3.2 Pasteuriser Improvements ........................................................................................... 34

v
3.3.2.1 An Additional Operator ....................................................................................... 34
3.3.2.2 New Flatbed Conveyer Pasteuriser ...................................................................... 35
3.3.2.3 Flash Pasteurisation ............................................................................................. 37
3.4 Filler and Crowner ............................................................................................................. 38
3.4.1 Filler and Crowner Analysis ....................................................................................... 38
3.4.2 Filler and Crowner Improvements .............................................................................. 38
3.4.2.1 Incorrect Fill Heights ........................................................................................... 38
3.4.2.2 Burst Bottles within the Filler .............................................................................. 39
3.4.2.3 Crowner................................................................................................................ 39
3.5 Labellers ............................................................................................................................. 39
3.5.1 Labellers Analysis ....................................................................................................... 39
3.5.2 Labellers Improvements.............................................................................................. 40
3.5.2.1 Historical Data ..................................................................................................... 40
3.5.2.2 Control Charts ...................................................................................................... 42
3.5.2.2 Fill Rejects and Missing Cap ............................................................................... 42
3.5.2.3 Rejects Line ......................................................................................................... 42
3.6 De-palletiser ....................................................................................................................... 43
3.6.1 De-palletiser Analysis ................................................................................................. 43
3.6.2 De-Palletiser Improvements ........................................................................................ 45
3.6.2.1 Man ...................................................................................................................... 45
3.6.2.2 Machine................................................................................................................ 45
3.6.2.3 Measurement ........................................................................................................ 46
3.6.2.4 Method ................................................................................................................. 46
3.6.2.5 Material ................................................................................................................ 46
4.1 Recommendations for Implementing, Support and Maintenance of Solution ................... 48

vi
4.1.1 Plan ............................................................................................................................. 48
4.1.2 Do ................................................................................................................................ 48
4.1.3 Check .......................................................................................................................... 48
4.1.4 Act ............................................................................................................................... 48
4.2 Change Management ......................................................................................................... 50
4.2.1 Eight Steps to Create a Lasting Transformation ......................................................... 50
4.2.1.1 Establish a Sense of Urgency ............................................................................... 50
4.2.1.2 Form a Powerful Guiding Coalition .................................................................... 50
4.2.1.3 Create a Vision ..................................................................................................... 50
4.2.1.4 Communicate the Vision...................................................................................... 50
4.2.1.5 Empower Others to Act on the Vision ................................................................. 51
4.2.1.6 Plan for and Create Short-Term Wins ................................................................. 51
4.2.1.7 Consolidate Improvements and Produce Still More Change ............................... 51
4.2.1.8 Institutionalize New Approaches ......................................................................... 51
4.3. Solution Validation ........................................................................................................... 51
4.3.1 Financial Benefit ......................................................................................................... 51
4.4 Conclusion ......................................................................................................................... 53
References ................................................................................................................................ 54
Appendix A: A Drawing of the Line ...................................................................................... 57
Appendix B: Initial Historical Data ......................................................................................... 58
Appendix C: The Process of Compiling the Control Charts.................................................... 59
Appendix D: Spreadsheet for the Future Monitoring and Control of NRB Bottle Loss ......... 60
Appendix E: Labeller Counter Recording Sheet ..................................................................... 61
Appendix F: Rejects Data ........................................................................................................ 62
Appendix G: One Point Lessons .............................................................................................. 63

vii
Appendix H: Signed Industry Sponsor Form .......................................................................... 64
List of Figures
Figure 1: A High-Level Process Map of Line 2 ........................................................................ 3
Figure 2: A Histogram Ranking International Breweries According to the Percentage of NRB Bottle Loss in 2014 (Source: Koch 2014).................................................................................. 7
Figure 3: SAB's Three Tier Team Structure (Source: Koch 2013) ............................................ 9
Figure 4: A Tunnel Pasteuriser (Source: Gericke 2014) .......................................................... 10
Figure 5: Identification of the Different Parts of the NRB Beer Bottle (Source: The Institute of Brewing and Distilling 2008) .............................................................................................. 11
Figure 6: The Six Step Problem Solving Approach (Source: SAB) ........................................ 14
Figure 7: Process Improvement Using the Control Chart (Source: Montgomery 2009:186) .. 15
Figure 8: A Table from the Book, Process Capability Indices (Source: Kotz & Johnson 1993:42) ................................................................................................................................... 18
Figure 9: MR Control Chart for the Percentage of Bottle Loss each Week ............................ 20
Figure 10: X Control Chart for the Percentage of Bottle Loss each Week .............................. 21
Figure 11: Pareto Chart ............................................................................................................ 24
Figure 12: A Pie Graph Showing the Percentage of Cullet Found in Each Process Area ....... 27
Figure 13: A Top View of a Series of Conveyers after the Labeller ....................................... 29
Figure 14: Fallen Bottles on a Collection Tray ........................................................................ 29
Figure 15: An Excess of Foaming Lubrication and Cullet under a Conveyer ......................... 30
Figure 16: Lubrication Ducts ................................................................................................... 30
Figure 17: A Section of Conveyer in Process Area 5 that can be Redesigned ........................ 31
Figure 18: UHMW Conveyer Guide Rails .............................................................................. 32
Figure 19: The Pasteuriser Infeed ............................................................................................ 34

viii
Figure 20: The Krones' Flatbed Conveyer Pasteuriser (Source: Krones 2013) ....................... 35
Figure 21: A Flash Pasteuriser (Source: Gunn) ....................................................................... 37
Figure 22: A Labeller Machine in Operation ........................................................................... 40
Figure 23: A Cullet Bin for the Underfill and Missing Cap Rejects ....................................... 40
Figure 24: Large Post-Labeller Mass Flow Conveyers ........................................................... 40
Figure 25: A Pie Graph Indicating the Percentage of Rejects at each Inspection Area ........... 40
Figure 26: A Bar Graph Showing the Average Number of Rejects per Week for each Labeller per Category of Reject ............................................................................................................. 41
Figure 27: A Deshrouded Pallet of Bottles on Wooden Layer Boards .................................... 43
Figure 28: The De-palletiser Machine ..................................................................................... 43
Figure 29: The HMI of the De-palletiser Machine .................................................................. 46
Figure 30: Comparison of the Masonite Layer Boards (Left) and Plastic Layer Boards (Right) on the Bulk-Infeed Conveyer ................................................................................................... 47
Figure 31: Summary of Short-Term and Long-Term Solutions to the Bottle Loss Problem .. 49
List of Tables
Table 1: A List of Abbreviations ............................................................................................... 9
Table 2: The Number of Bottles per Pallet and the Price per Bottle for each Brand ................. 9
Table 3: Equations for Performance and Capability Indices ................................................... 17
Table 4: Performance and Capability Estimates ...................................................................... 22
Table 5: A Table Showing the Bottle Loss Reduction and Financial Benefit that can be Realised According to the Pareto Principle ............................................................................. 52

ix
List of Abbreviations
Table 1: A List of Abbreviations
Abbreviation Description AHP Analytical Hierarchy Process DMAIC Define, Measure, Analyse, Improve and Control DPR Daily Production Report GDP Gross Domestic Product KPI Key Performance Indicator tLtB The Lower the Better MARR Minimum Acceptable Rate of Return MR Moving Range MSA Measurement System Analysis NPV Net Present Value NRB Non-Returnable Bottles PDCA Plan, Do, Check and Act PFBI Post-Filler Bottle Inspector PIMS Process input monitoring sheet PLC Programmable Logic Controller POMS Process output monitoring sheet SAB South African Breweries SIC Short Interval Control SPC Statistical Process Control UHMW Ultra-High-Molecular-Weight Polyethylene UP University of Pretoria USA United States of America WSM Weighted Sum Method σ/sigma Standard Deviation

1
CHAPTER 1: DEFINE
1.1 Introduction & Background
1.1.1 The Beer Industry
Beer is currently the most consumed alcoholic beverage in the world, and is the most popular drink after water and tea (Nelson 2005:1). Despite the ever-present economic pressures experienced by South African citizens, the growth rate in beer, both in volume and value terms continues to increase. The South African Breweries (SAB) accounts for 79% of the total volume of the beer sold within South Africa (Euromonitor 2014).
1.1.2 The South African Breweries
SAB was founded in 1985 and is South Africa’s premium brewer and leading distributer of beer and soft drinks (SAB 2015). The company is a subsidiary of SABMiller plc, one of the world’s largest brewers by volume with operations in 75 countries around the world. SAB operates seven breweries and 40 depots in South Africa with an annual brewing capacity of 3.1 billion litres (SAB 2015). The company’s full brand portfolio includes ten beers and five flavoured alcoholic beverages. This portfolio contains five of the country’s six most popular beer brands; namely, Carling Black Label, Hansa Pilsner, Castle Lager, Castle Lite and Castle Milk Stout. SAB is a huge contributor to South Africa’s Gross Domestic Product (GDP) and supports employment on a number of different levels. The company employs almost 9400 people and supports over 37 000 jobs at SAB’s first round of suppliers (SAB 2015). SAB’s vision is “To be the most admired company in South Africa; a partner of choice, an investment of choice and an employer of choice (SAB 2015).” Supported by their values, SAB strives for excellence in all the aspects of their business.
1.1.3 The Rosslyn Brewery
Located in the north of Pretoria, the SAB Rosslyn Brewery is Gauteng’s largest brewery. The Rosslyn Brewery aims to be the most admired world class manufacturing brewery in SABMiller. The brewery consists of two main departments, namely brewing and packaging. These two departments are supported by eight ancillary departments. The packaging department comprises of five lines; one of which is dedicated to producing 330ml and 340ml non-returnable (NRB) bottles.
1.1.4 World Class Manufacturing
The concept of world-class manufacturing was first introduced in the United States of America (USA) in 1980. It refers to the process of continual and rapid improvement in all

2
facets of the manufacturing environment. The idea behind world-class manufacturing is that continual improvement in areas such as customer service, lead time, cost, quality and flexibility can be simultaneously obtained through the simplification of production (Lee 2004). World-class manufacturing mandates both simplification and direct actions. Schonberger (1986:3) states that the main directives according to world-class manufacturing ideologies are, “do it, judge it, measure it, diagnose it, fix it, and manage it on the factory floor.” In order to achieve these directives, work methods as well as the work culture needs to be changed.
In support of their vision, SAB aspires to the goals outlined by world-class manufacturing principles (Macmillan 2004). This means that, in order to compete on a global level, it is critical for SAB to continuously improve in vital factors such as the reduction in costs. To do this, SAB has identified a set of operational performance targets to aid in reaching their objectives. As a world-class manufacturer, performance metrics aid to show how the product or service is currently performing, how much improvement is occurring, what problems to attack next and what the likely causes of the problems may be. Performance measurement is crucial for benchmarking as well as adjusting behaviour (Macmillan: 2004).
One of the main performance targets at SAB Rosslyn is variable costs. Variable costs are the costs of the raw materials required for production. The aim is to reduce variable costs to an acceptable level; the actual target value for variable costs is withheld due to a non-disclosure agreement. The variables identified, determining variable costs on the non-returnable bottle line are bottles, beer, crowns, labels and glue. Each variable has a target cost calculated according to the level of production output of the line. If these performance targets are not met SAB might fall short of their vision to be the most admired company in South Africa and fail to reach their world class manufacturing objectives.
1.1.5 The Problem Statement
The problem identified at the SAB, Rosslyn Brewery, which is the focus of this project, is the loss of non-returnable bottles on line 2. Line 2 is a packaging line dedicated to produce 330ml and 340ml NRB bottles. Bottle loss is measured as the quantity of bottles sent to the line from the warehouse (raw materials department) less the quantity of packaged bottles that leave the line at the palletiser. Non-returnable bottles are a major contributor to variable costs. Currently, the line is not reaching its performance targets related to variable costs, especially with regards to bottles.

3
1.2 Project Scope
1.2.1 Product
Line 2 is a multi-pack line; implying that the line is able to package a variety of different brands of beer. Currently, the line is packaging six brands of beer. The scope will include all the brands produced by the line except Peroni. The brands of beer that will be analysed are; Hansa Pilsner, Castle lager, Castle Lite, Castle Milk Stout and Carling Black Label.
1.2.2 Process
Figure 1 identifies the process flow of line 2 as well as the specific process areas included within the scope of the project. A drawing of the line has been provided in Appendix A. The specific process areas have been marked out on this drawing.
Figure 1: A High-Level Process Map of Line 2
Palletiser
De-palletiser
Rinser Rinser
Filler
Pasteuriser
Labeller 1 Labeller 2
Taptone 1 Taptone 2
Shrink-wrapper
Tray-packer
Raw Materials

4
1.2.3 Exclusions
The following are not included in the scope of the project: The other variables on the line (beer, crowns, labels and glue) as well as the supply
interfaces with these variables Warehouse operations (this includes the transportation and storage of the raw material
bottles and the finished goods packaged beer) Analysis of bottle loss of Peroni bottles as well as analysis of the Carton-erector
(Jones) machine used to package Peroni into 4-packs Analysis of the material and design of the glass beer bottles supplied by Consol
1.3 Rationale
Reducing bottle loss will decrease unnecessarily high variable costs and consequently aid SAB Rosslyn to reach the budget objectives, which stems from the company’s vision to continuously improve and strive for excellence in all aspects of their business. This project will aid in increasing the overall profitability of the company. The solutions for the reduction of bottle loss will also help the line to run at a higher efficiency.
Reducing bottle loss will aid in reducing the volume of broken glass (cullet) found on the factory floor. Cullet causes many problems. Broken or burst bottles interfere with the optimal operational capability of the machines. Cullet is also an important safety issue and it requires additional resources to clear away.
The solutions identified in this project can also be applied to three of the other lines at SAB, Rosslyn. These lines package the 750ml returnable ‘quart’ bottles and also experience an unacceptably large quantity of bottle loss.
1.3.1 Performance Target
The performance target for non-returnable bottle loss on line 2 at SAB, Rosslyn is 0.45% of the total output number of bottles. The following equation presents the metric in mathematical terms.
In 2014, the figure for bottle loss was 0.97%. This reveals that the line lost more than double the allowed number of bottles, indicating the severity of the bottle loss problem.

5
1.4 Project Aim
The aim of the project is to reduce bottle loss. The goal is to assist line 2 to reach the stated performance target. The purpose of the project is to identify the causes of bottle loss on the line and come up with feasible solutions in order to reduce the quantity of bottles lost on the line.
1.5 Project Approach and Deliverables
A structured problem solving approach provides a means to achieve the aim of the project. The Define, Measure, Analyse, Improve and Control (DMAIC) structure, which will be detailed at a later stage, is used as the project approach. The following deliverables can be expected from each step of the systematic project-orientated DMAIC cycle. Each deliverable corresponds directly to satisfying the aim of the project.
1.5.1 Define
Analyse the packaging process and measurement system of line 2
Identify project stakeholders Problem statement Project scope High-level process map Rationale/motivation for the project Project aim Problem context Project charter/plan
1.5.2 Measure
Analyse data in order to recognise the main areas of bottle loss on the line and investigate the capability of the line to determine whether the performance target for bottle loss is reasonable. Identify a new acceptable bottle loss target if the line is not capable of reaching its performance target.
Low level process map Literature study Initial data Process performance analysis (Control charts) Process capability studies (Control charts)

6
Pareto chart Revised project charter/plan
1.5.3 Analyse
Determine the areas on which to focus and identify the main causes of bottle loss in these areas.
List of root causes/areas on which to focus Measurement system analysis Identification of common causes and assignable causes (Control charts) Ishikawa diagrams
1.5.4 Improve
Find alternative feasible solutions to reduce bottle loss so that an acceptable target is reached. Evaluate the solutions and come up with the solution or set of solutions that will be most beneficial for the company
Identification of possible feasible solutions Impact evaluation of identified solutions (based on financial, operational etc.) Decision between alternative solutions (based on impact)
1.5.5 Control
Make recommendations concerning the implementation and sustainability of the solutions.
Proposed solution (Final Report) List of recommendations for implementing, support and maintenance of solution
1.6 Problem Context
1.6.1 The SABMiller Manufacturing Way
The SABMiller manufacturing way can be described as a philosophy outlined by a set of principles governing operations in order to aid SABMiller to reach operational excellence. One of these principles, “operational excellence is entirely dependent upon a resolute process of continuous improvement” implies that the pursuit of operational excellence is a never ending journey for all employees of the company (Koch 2013). To fulfil this principle, a structured and systemic approach to management of assets/plant, practice, process and performance is put into action by SAB. Koch (2013) mentions another important principle of

7
SABMiller that is appropriate in the context of the problem, “performance is measured against internal and external benchmarks.” The company believes that internal benchmarking facilitates self-analysis and provides a clear view of current capabilities. Benchmarking and continuous measurement is a key driver for sustainability (Koch 2013).
To enable these principles, work practices are developed. Work practices refer to systems, methods and techniques that have proven effective in delivering operational excellence (Koch 2013). Performance measurement and control is one such work practice. The purpose of performance measurement and control is to provide employees with the necessary information to manage and control their performance in line with organisational objectives (Koch 2013). This can be achieved through the application of short interval control (SIC). SIC can be defined as, “quick and focused reviews of performance data during the shift that can enable immediate corrections and small-scale fixes which result in significant improvements in performance”. A key objective of SIC is to reduce time-to-detect and time-to-correct (Koch 2013).
Focused improvement is another work practice that is relevant to the project. Koch (2013) defines ‘Focused Improvement’ as, “ensuring improvement in the organisation's main performance areas by concentrating on the variability, major wastes and other problem areas.” The implication of focused improvement is a structured, data driven approach to improvement by establishing systems to monitor and analyse loss and waste. This project can be defined as a focused improvement project that is in line with the philosophy of SABMiller’s Manufacturing Way.
Figure 2: A Histogram Ranking International Breweries According to the Percentage of NRB Bottle Loss in2014 (Source: Koch 2014)

8
1.6.2 Benchmarking
The global manufacturing way key performance indicator (KPI) process creates a common approach to defining and reporting on KPIs to enable benchmarking. The global KPIs are limited to a select number of measures spread across the most important manufacturing drivers namely, sustainability, quality, delivery (service) and cost (Koch 2013). Container loss as a percentage is one of these measures under the cost category. The SABMiller Beer KPI Summary Report (Koch 2014) gives the result of the performance of the company in relation to breweries all over the world. Figure 2 shows that the SAB Rosslyn Brewery ranked only 35th with respect to NRB bottle loss in 2014 with a bottle loss percentage of 0.97%.
1.6.3 Performance Metrics
The selection of performance metrics is crucial as the measures of performance used have a major impact on business activities (Kerssens-Von Drongelen & Cook 1997). Bond (1999) states that it is important that performance measures support behaviour that is in the organisation’s best interest. Dysfunctional conduct may result from unsuitable measures. Specific internal performance measures at operational level should be based on an improvement of past performance rather than an unrealistic external benchmark. It is important to set realistic targets of which the owners of the performance metrics involved have the capacity to manage and influence the outcome (Perrin 1998). Unrealistic targets could make the company complacent to the high expectations required. It could also drive inappropriate behaviours such as reporting false information.
1.6.4 Organisational Design
SAB’s organisational design aids in realising the principles that drive operational excellence and continuos improvement to make the company a world class manufacturer. Figure 3 shows the three tier approach which helps the organisation to clearly define accountability for responsabilities, ensure appropriate focus the on short term operational agenda whilst maintaining systemic and strategic focus and improve communication (Koch 2013). All three tiers are involved in achieving KPIs, from the operator at level 1 to the plant manager at level 4. Each person has a specific role and dedicated responsibilities towards reaching the level of performance required by the company.
1.6.5 Low Level Process Analysis
In order to find effective solutions to the problem at hand, it is important to fully understand the process so that the aspects of the process that are not performing to standard can be identified and rectified.

9
1.6.5.1 Raw Material Acquisition The raw material department orders NRB bottles on a weekly basis from Consol, the only supplier of NRB bottles to the SAB Rosslyn Brewery. These bottles are delivered daily on pallets. Each pallet contains six layers of bottles with Masonite layer boards between each layer. Each pallet of bottles is wrapped in plastic when delivered. Due to insufficient space in the raw materials warehouse, the pallets of bottles stand outside before they are moved by forklifts to the bulk-infeed conveyer. Table 1 shows the number of bottles per pallet as well as the price per bottle per brand.
Table 2: The Number of Bottles per Pallet and the Price per Bottle for each Brand
Brand Bottles/Pallet Bottle Price (Each)
Castle Lager 2112 0,86 Castle Lite 2112 1,03 Hansa Pilsner 2112 1,05 Carling Black Label 2112 1,00 Castle Milk Stout 1998 1,01
1.6.5.2 De-Palletiser The pallets of bottles move slowly along the bulk infeed conveyer. An operator known as a plastic cutter de-shrouds the pallets of bottles (removes the plastic). At the end of the bulk-infeed conveyer is a hoist which forms part of the de-palletiser machine. The hoist lifts the pallet of bottles while the top layer gets swept off the layer board onto a conveyer. The layer board above the next layer of bottles is then removed mechanically and placed upon a pile. The conveyer after the de-palletiser machine consists of a series of slight bends so the bottles move in the right direction. The bottles are separated into two single lanes before they reach
Figure 3: SAB's Three Tier Team Structure (Source: Koch 2013)

10
the rinsers. The conveyers have side guides set to hold the bottles at the right pressure on the conveyer. The conveyers are constantly lubricated with a soapy solution to ensure that the bottles can move easily along the conveyers.
1.6.5.3 Rinsers Before each rinser is a twister which inverts the bottles before they are rinsed. The bottles are rinsed with water at a high pressure to remove any unwanted particles that may reside in the bottles. The bottles are then sent through a twister again so they are the right way up before the filler.
1.6.5.4 Filler A rotary filler fills the NRB bottles with beer once triple evacuation has purged the air out of the bottles. Filling occurs when the pressure in the bottle is equal to that of the filler bowl pressure. The bottles are filled to an optimised height to ensure that beer loss does not occur. The filling process area also includes the crowner machine. The crowner twists crowns (bottle caps) onto the end of each filled bottle to seal the bottle. Once the bottles are filled and sealed, a post-filler bottle inspector (PFBI) ensures that the bottles do not have missing caps and are adequately filled.
1.6.5.5 Pasteuriser After another series of conveyers, the bottles enter a tunnel pasteuriser. The tunnel pasteuriser heats the filled bottles up to a high temperature in order to kill any micro-organisms or enzymes that may be present in the beer. The type of pasteuriser on line 2 is a walking beam pasteuriser. The pasteuriser comprises of the following stages shown in figure 4.
1.6.5.6 Labellers and Taptones After the pasteuriser, the bottles are once again separated into two streams and sent via conveyers to the labelling machines. The labelling machines use glue to stick paper labels
1. Infeed 2. Heating Zones 3. Super Heat and Pasteurization
Zones 4. Cooling Zones 5. Discharge
Figure 4: A Tunnel Pasteuriser (Source: Gericke 2014)
2
3
4
5
1

11
onto the front, back and neck of each bottle. The labelling machine has an inspector to automatically check if the labels are present, skew and have the correct orientation. Bottles with label rejects are separated onto a rejects line. The labeller operators wash off the labels from these bottles and put the bottles back onto the line before the labeller machine. The labeller bottle inspector can also check for underfills or whether the caps have been put onto the bottles correctly. If bottles are found to have these specific faults, they are kicked off the line into a cullet bin. The taptone is the final bottle inspector that checks that the bottles are sealed.
1.6.5.7 Shrink-wrapper, Tray-packer and Palletiser The shrink-wrapper groups the bottles into 6-packs and covers them in plastic. The tray-packer consists of a carton-erector which folds beer boxes and then puts four 6-packs into each box. The groups of 24 bottles are now known as cases. The palletiser arranges the cases of bottles onto pallets using a robotic arm and then wraps each finished goods NRB beer bottle pallet in plastic.
Figure 5: Identification of the Different Parts of the NRB Beer Bottle (Source: The Institute of
Brewing and Distilling 2008)

12
CHAPTER 2: MEASURE
2.1 Literature Review
2.1.1 Introduction
In order to gain further information about the environment of the problem as well as the techniques that can help to generate a solution to the problem, a literature review was conducted on the topic. The literature review aids in finding the best practices applicable to the problem area as well as expands on the mechanisms used by other similar enterprises in pursuit of a solution to related problems. The literature review used the following resources:
SAB’s web page on the internet gave a thorough background, which served as a starting point for identifying the stakeholders in the project. Regarding the context of the problem, the share drive at the SAB Rosslyn Brewery provides the applicable information. Presentations on the philosophy of the company were found, which gave a background and rationale for the project. Some data used within the project was also obtained from the share drive. Google scholar was used with the following search terms; ‘world class manufacturing’ and ‘performance metrics and behaviour’ to provide a basis of these concepts in the report. To give a more technical low-level process map of the bottle filling process, information was obtained through observation of the line as well as conversing with the operators of line 2.
Two textbooks namely, Introduction to Statistical Quality Control (Montgomery 2011) and Operations and Supply Chain Management (Chase & Jacobs 2011) were used to explain the industrial engineering techniques applied in the approach to find a solution to the problem. Articles from google scholar on statistical process control (SPC) were consulted too. These articles showed how the use of SPC helped similar manufacturing companies solve problems in the past.
Lastly, the IEEE Explore and Scopus databases on the University of Pretoria (UP) library website were utilized with the phrases, ‘the beer industry’, ‘bottle loss,’ ‘bottle filling,’ ‘beer bottles,’ ’brewery and sustainability,’ ‘beer packaging line and optimisation.’ Not one article could be found where a similar enterprise solved a similar problem but all relevant articles found served as a basis to generate feasible solutions.
2.1.2 Define, Measure, Analyses, Improve and Control (DMAIC)
The DMAIC is a structured, systematic, and project-orientated approach to solving problems with the help of six sigma techniques. The underlying concept of the DMAIC cycle is continuous improvement also known as kaizen (Chase & Jacobs 2011:328). DMAIC identifies key requirements, deliverables, tasks, and standard tools that can be utilized when

13
dealing with a problem. The DMAIC technique was chosen as the structure for the project as it is in line with the word-class manufacturing principles that the company strives to achieve.
Six sigma incorporates the DMAIC structure to not only help reduce defects and decrease variability but also to provide a business focus that helps a company concentrate on producing near-perfect products through operational excellence (Staff 2013). Six sigma has helped many companies achieve significantly more profit and higher levels of customer satisfaction. One such company, General Electric attained savings of $1 billion over a two year period through training their employees on six sigma devices, methodologies and practices (Klefsjo et al 2001).
2.1.2.1 Define The main goal of the define step is to recognise the project opportunity (Montgomery 2009:49) as well as the value of undertaking such a project for all the stakeholders involved. The define step of DMAIC structure comprises of a project charter consisting of a description of the project, the project’s scope, the metric that will be used to measure success and the activities and deliverables that will be satisfied upon successful completion of the project (Montgomery 2009:49). A high level process map also contributes towards the define step to give a simple overview of the process and key process elements. Process mapping is an important tool to help understand the process as well as reveal factors of the process that were not entirely evident (Montgomery 2009:50).
2.1.2.2 Measure The objective of the measure step is to study the present state of the process (Montgomery 2009:51). During this step it is important to determine how the process is measured as well as analyse this measurement system. Data is collected and used as the basis for defining the baseline performance of the process. The data collected can be displayed in a many different ways such as with control charts or Pareto Charts.
2.1.2.3 Analyse The objective of the analyse step is to determine the cause-and-effect associations in the process using data acquired during the measure step (Montgomery 2009:52). This aids in identifying variables that are most likely to cause process variation. These causes are separated into common and assignable causes in order to recognise which causes of variation can easily be rectified. Control charts and capability studies aids in determining both process performance and process capability. A cause-and-effect diagram (Ishikawa Diagram) can also be used to display the information gained in this step effectively.
2.1.2.4 Improve The improve step focuses on using creative thinking about the relevant changes that can be made to the process in order to improve performance (Montgomery 2009:53). The objectives of this step will be to develop a solution to the problem and to experimentally test the

14
solution (Montgomery 2009:53). A cost-benefit analysis can be used to determine if the chosen solution will be economically viable for the company.
2.1.2.5 Control The purpose of the control step is to confirm that all the work on the project has been completed and to hand over the improved process to the relevant stakeholders (Montgomery 2009:54). A process control plan must be established to ensure that the solutions are sustainable. A process control plan contains tools that must be put into place to ensure that the variance of the process remains within an acceptable range.
2.1.3 The Six Step Problem Solving Approach
The six step problem solving approach is a methodical structure to help direct focussed improvement projects. This approach is used in all focussed improvement projects undertaken at the South African Breweries. Focussed improvement projects such as, reducing the beer loss by focussing on the filler machine at unit 12, SAB Alrode brewery, have been successful though implementing this technique. The six step problem solving approach is a slight variation of the DMAIC structure and is outlined in figure 6 below to show that all components are covered by the DMAIC structure used in this project. The DMAIC structure was chosen as the approach for this project as it incorporates a wider range of industrial engineering tools that are excluded from the six step problem solving approach.
2.1.4 Statistical Process Control
Statistical process control (SPC) is a set of practices that are used in conjunction with old quality tools. SPC is valuable in achieving process stability and improving performance by
Figure 6: The Six Step Problem Solving Approach (Source: SAB)

15
decreasing variability (Montgomery 2009:180). SPC is based on a comprehensive set of fundamental principles that are simple and easy-to-use although they have a substantial impact when applied to a process. Kaoru Ishikawa contends that, “95% of a company’s problems can be solved using these tools (SRC 2001)”. The proper implementation of SPC aids in forming an environment in which all individuals in the company seek continuous improvement in productivity (Montgomery 2009:180). SPC is used in conjunction with the DMAIC structure predominantly during the measure and analyse stages.
2.1.4.1 Control Charts Control-charts are one of the statistical process control practices deployed in manufacturing environments. Developed by Walter A. Stewhart, they are a graphical representation of a quality characteristic versus the sample number or time. A centre line drawn on the chart represents the average value of the quality characteristic corresponding to the in-control state. Two more horizontal lines are drawn onto a control chart to show the upper and lower control limits. If all the points fall within these limits, the process is said to be in-control. If points fall out of these limits, assignable causes should be identified. Negative assignable causes are causes of variation that can be rectified without reengineering the process. Another important feature of a control chart is to measure the current performance of a process as well as to determine the potential capability of the process. This done by calculating performance indicators using the statistics determined from the control charts.
2.1.4.2 The Control Chart for Individual Measurement If a situation occurs where the sample size used for process monitoring is an individual unit, then the control chart for individual measurement is used. There could be many reasons for a single sample size such as; testing samples of multiple observations could be too expensive,
Figure 7: Process Improvement Using the Control Chart (Source: Montgomery 2009:186)

16
inconvenient or impossible (Anjard 1992). The individual control chart uses the moving range between two successive observations to estimate the process variability (Montgomery 2009:260). The moving range (MR) control chart is analysed using a set of run rules to determine the best performance in order to calculate applicable limits for the X control chart which shows the actual value of the observation. The upper and lower control limits are usually set at 3σ above and below the centre line (average of the observations for the X-chart), where σ is the standard deviation; thus the concept of six-sigma is realised. It is recommended that a sample size of m = 100 is necessary for the X-chart with three-sigma limits to perform on average as if the in-control parameters were known (Saleh, Mahmoud, Keefe & Woodall 2015).
Escalante-Vázquez (2007) reported on an application of individuals control chart in the beer industry. The author developed pilot cases to explore the best statistical process analysis tools that can be applied in specific processes at the brewery. After analysing historical data on a quality characteristic, an assessment of the stability of the characteristic was introduced into the measurement system of the brewery. This included X and MR charts that are able to identify out-of-control instances so that the relevant people can make the necessary amendments as quickly as possible in order to restore process stability. This concept is known as short interval control (SIC) and will be incorporated into the project as a tool for continuously monitoring the process and rapidly rectifying out of control instances.
2.1.4.3 Run rules The run rules are rules for detecting out-of-control or non-random conditions on control charts. The following regular run rules were used to analysis the control charts within this project. The colours given are a key used to indicate which run rule was identified on the analysis of the control charts done in the measure step of the project.
One or more point outside either control limit – Yellow Two-out-of-three points beyond 2σ warning limits - Green Eight consecutive points on either side of the centre line –Purple Other non-normal trends or patterns Stratification (Points hugging the centre line) Mixing (Few points in the ± 1σ area)
2.1.4.4 Performance and Capability Studies The control charts provide information useful to estimate the capability of the process (Montgomery 2009:233). From the individual observations, the central tendency (average) of the data and the overall, long-term process standard deviation can be calculated. These statistics represent the actual performance of the process. Using the above run rules to exclude out of control periods, the best points can be selected to represent the inherent best performance of the process. Once the best points have been selected, the target value (average

17
of the best-points), and short-term, inherent standard deviation can be calculated. The target value and short-term, inherent standard deviation are the statistics representing the potential performance of the process. The following symbols are used to represent the applicable statistics:
The following equation is used to calculate the short-term, inherent standard deviation:
Where:
Using the above statistics, it is possible to calculate a process performance and capability indices. These indices offer a convenient, simple, quantitative way to represent the performance and capability of the process. The following table shows the equations used to calculate the indices. One-sided indices are used, as in the case of bottle loss, only an upper spec limit is provided considering that the company would like to reduce bottle loss to as low as possible. Table 3: Equations for Performance and Capability Indices
Process Off-Target Process On-Target
Total Variation
Minimal Variation
The Cp index, or process capability ratio is important as it is a measure of the ability of the process to manufacture a product that meets the stipulations (Montgomery 2009:353). The book, Process Capability Indices (Kotz & Johnson 1993:42), discusses how to interpret the process capability ratio once it is calculated. Figure 8 is an excerpt from the book presenting a table used to show different Cp indices and the corresponding proportion of non-conforming items. From this figure it can be seen that small values of Cp are a negative sign, although large values of Cp do not guarantee acceptability (Kotz & Johnson 1993:43).

18
2.1.5 Pareto Chart
A Pareto Chart helps to classify a problem into the comparative contributions of its components (Chase & Jacobs 2011:329). It is able to graphically show the main contributing factors to the problem and therefore help to determine which areas to focus on. The Pareto chart is centred on the ‘80:20’ theory which maintains that 80% of the problem is a result of only 20% of the causes.
2.1.6 Cause-and-Effect Diagram
The cause-and-effect diagram (Ishikawa or fishbone diagram) is an easy to use graphical method for sorting and relating aspects that contribute to a given situation (Chase & Jacobs 2011:329). The diagram classifies the causes of a problem into one of the five Ms of manufacturing. These 5Ms are man, method, material, machine and measurement. The purpose of a cause-and-effect diagram is to visually manage and categorize all the causes of the problem within the process. Its function is to recognize all the factors that are causing an undesired outcome for improvement action (SRC 2001). It is an effective troubleshooting aid that also serves as a team-experience when constructing.
2.1.7 One Point Lessons (OPL)
An OPL is a simple lesson written and illustrated on a single piece of paper that takes less than 15 minutes to teach. The person who made the OPL should teach it to an operator (usually on the factory floor) and then it is that operator’s responsibility to teach it to the operator on the next shift and so on. In this way, the operator is seeing, hearing and teaching which causes the information to be retained better. Once the operators on all the shifts have been taught the lesson, the last operator must teach the person who compiled the OPL to check that the correct information was relayed. The OPL is then displayed on a board in the specific process area to continuously remind the operators on the concept. The OPL is a powerful tool, frequently implemented by SAB, used to educate operators and improve product service or quality. There are three types of OPLs, basic knowledge which conveys information on practices that the operator should already know, improvement cases which describes the approach to improve a specific practice and trouble cases which teaches how to prevent the reoccurrence of a problem or what to do in the event of a problem. OPLs aim to achieve a single standard of work across all operators and shifts.
Figure 8: A Table from the Book, Process Capability Indices (Source: Kotz & Johnson 1993:42)

19
2.1.8 Decision between Alternative Solutions
Depending on the nature of the solution, it may be necessary to choose between alternative solutions or decide whether a combination of the solutions identified could be most beneficial to the company. Pohekar and Ramachandran (2004) state the basis of various multi-criteria decision making techniques that can be employed during sustainable energy planning. These decision making techniques can be applied to any complex management problems to help choose an alternative that bests suits the company’s standards.
2.1.8.1 Cost-benefit analysis One simple technique governing the expenditure of capital is cost-benefit analysis. This method uses the principles of engineering economy to decide whether the investment of capital into a project will reap the required returns. The net present value (NPV) method ranks alternatives according to the highest net-present value, taking into account the initial investments, the cost-savings (cost-benefit) as well as the minimum acceptable rate of return (MARR) value. The NPV represents the value that would be added to the value of the firm if an alternative is selected. The more positive the NPV, the more attractive the investment would be.
2.1.8.2 Weighted-Sum Method (WSM) If there are M alternatives and N criteria, then the best alternative is the one that satisfies the following expression:
Where:
2.1.8.3 Analytical Hierarchy Process (AHP) The essence of AHP is to decompose the problem into a hierarchy with the objective at the top, the criteria and sub-criteria on the subsequent levels and the alternatives at the bottom. Elements at a certain hierarchy-level are assessed to determine their relative importance with respect to the element at the next higher level and are given a weight value. Both quantifiable and non-quantifiable factors can be weighted. To obtain the best alternative, a weight coefficient is calculated for each alternative. This is done by multiplying each alternative’s weight by the criteria at the next higher level until the top of the hierarchy is reached and adding it to the weight coefficient for that specific alterative. The alternative with the highest weight coefficient is the best alternative.

20
2.2 Data Analysis
2.2.1 Capability and Performance Study Based on X and MR Control Charts
The historical data collected quantifies the bottle loss problem for line 2. The data was collected from the financial reports of the packaging department. These reports show the amount of each variable ordered each week. The target value of variable usage is also shown on the financial reports. From this data, it was possible to calculate the output number of bottles as well as the bottle loss percentage for the week. The data collected and the relevant calculated information can be found in Appendix B.
A few problems were encountered during the collection of this data. Firstly, some data was missing regarding the actual number of bottles used in a week. Also, two of the weeks showed that more packaged bottles were removed from the line than bottles sent to the line from the raw materials department, which is impossible. The reason for the inaccuracy of the data could be that some information was unavailable when the weekly report was generated. Consequently, three of the data points were excluded from the analysis.
The weekly bottle loss percentage was plotted onto X and MR control charts. The sample size for the data collected was n = 1 as the data becomes available relatively slowly (once a week). Although the data collected was discrete, attribute data, as both the number of bottles lost as well as the sample size could be counted, a variable control chart was used as it was assumed that the normal approximation is still valid. According to Wheeler (1996), attribute data can be plotted on X and MR charts as the only difference between X and MR charts and an np-chart is the method used to compute the distance from the centre line to the control limits. The X and MR charts use empirical limits rather than theoretical limits. It is usually easier to work with empirical limits as they are always valid compared to theoretical limits where the conditions of the distribution of the data must first be verified for the model to be applicable (Wheeler 1996).
The following MR chart was obtained to show the variability of the current performance of the process. The process of compiling the control charts can be found in Appendix C.
Figure 9: MR Control Chart for the Percentage of Bottle Loss each Week

21
The chart was analysed according to the run rules and the best points with the least variability were chosen to calculate the limits of a preliminary X chart. The preliminary X chart was also analysed according to the run rules and the best points were selected to calculate the statistics representing the potential best performance of the process. The best points were chosen according to ‘the lower the better (tLtB)’ target value as in this case it is ideal to minimise the quantity of bottles lost. The following X chart shown in figure 10 is obtained when the individual observations were plotted.
Figure 10: X Control Chart for the Percentage of Bottle Loss each Week
The X chart shows that the process is in a general out-of-control state as it fluctuates excessively about the centre line. This means that the causes of bottle loss are inherent in the process and are not due to operational reasons. The out-of-control nature of the graph shows that no significant improvement effort has been conducted as of yet to help curb the problem.
Although the current process is tumultuous, four trends have been identified. Firstly, the fifth week of July shows an accentuated increase in the bottle loss percentage. The second and third trends can be seen as periods of a general decrease in the bottle loss percentage and are indicated on the above X chart by orange circles and ticks. These two periods were chosen as the points representing the best performance of the process and were used to calculate X̅0. Lastly, the graph indicates that the average bottle loss percentage increased substantially during January and February this year. The bottle loss percentage changed from an average of 0,95% to 1,40% from trend period two to trend period three.
The above analysis of the X chart shows that assignable causes exist which increase bottle loss from X̅0 = 0,99%, the average of the best points to X̅Ac = 1,44%, the average of trends one and four. It also shows that the best performance of the process is inherent and therefore the process is capable of reaching an average of X̅0 = 0,99%. This average is the processes theoretical best performance and will be used as the ‘target value’ to calculate the capability indices of the process.
The next step was to conduct performance and capability studies. Table 4 gives the statistics that were obtained as the current performance and potential capability estimates for the process.

22
Table 4: Performance and Capability Estimates
Average Standard Deviation
Current Process Performance
μ = X̅ = average of all the values =1,1230
σ = s = overall variation = 0,2994
Future Process Capability
μ0 = X̅0 = average of the best values = 0,9891
σ̂ = smallest variation = MR̅0/d2 = (0,198)/(1,128) = 0,1754
The following indices were calculated:
A negative value shows that the current performance is so low that even the average is outside of the spec limit. The process is not conforming to specifications. To determine the potential impact of an improvement, the Pp index is calculated to show the performance of the process if the process runs on target considering the best inherent average and with total variation.
Even if the process runs on target, the process will still not conform to specifications. A negative value shows that the average will still be out of the spec limit. To determine the potential impact of an improvement, the Cpk index is calculated to show the performance of the process if the process runs off-target but with minimum variation.
23
Even if the process has a smallest possible variation, it will still not conform to specifications. A negative value shows that the average will still be out of a spec limit. To determine the potential impact of an improvement, the Cp index is calculated to show the performance of the process if the process runs on-target with minimum variation.
The results of the performance and capability studies show that there are inherent problems within the process that cannot be fixed by merely rectifying a few assignable causes. The process is not capable of reaching its target of 0,45% bottle loss without re-engineering the process.
2.2.2 Pareto Chart
In order to tackle the bottle loss problem, a daily bottle loss sheet was implemented to try and ascertain in which process area the most bottles are going lost. The excel spreadsheet is to be filled in daily by the shift team leader and reported on in the morning meeting with the line manager. The spreadsheet gives the percentage bottle loss in each process area according to the output number of bottles. The data for the spreadsheet can be acquired from the line during the daily cut-off procedure.
Unfortunately, this is a newly implemented sheet therefore it is not filled in correctly on most days. The data is mostly inaccurate due to the wrong procedures being followed. The relevance and importance of the information is not understood by the operators and the team leaders therefore it is either filled in carelessly or not at all. Due to the nature of the spreadsheet, missing information causes the calculations to be wrong and causes skew data for that day as well as the next day (continuous counters are used on some of the machines). Although these problems are present, usable data could be acquired for a few days between the months of March and May 2015.

24
Figure 11 shows the process areas which are the most problematic with regards to bottle loss on line 2. As can be seen on the graph, the majority of the bottle loss can be accredited to the area between the pasteuriser and the labellers. The bottle loss in this area is calculated by subtracting the labeller production (before labeller rejects) from the PFBI throughput (after filler rejects); therefore the area contains both the pasteuriser machine and all the conveyers between the PFBI and the labellers. The next area with a high bottle loss percentage is the filler to the pasteuriser. This may be due to the fact that many bottles burst due to the variations of pressure in the filling process.
2.2.3 Focus Areas
From the Pareto Chart it can be seen that the main focus areas of the project will be the pasteuriser, filler and labellers. These process areas contribute the most to bottle loss along the line. The de-palletiser area will also be analysed as there are a few reasons for bottle loss in this area that are clearly evident. The Pareto principle does not apply because 80% of the problem is not accredited to 20% of the process areas. This could be accredited to the measurement system and the conveyer system also having large parts to play in the loss of bottles along the line. Analysis of only the machines along the line will not be sufficient to curb the bottle loss problem.
37,78% 26,67%
17,04% 8,89% 5,19% 4,44%
0,00%10,00%20,00%30,00%40,00%50,00%60,00%70,00%80,00%90,00%
100,00%
Perc
enta
ge
A Pareto Chart Showing the Relative Percentage of Contribution to the Bottle Loss Problem in each Process Area
Figure 11: Pareto Chart

25
CHAPTER 3: ANALYZE AND IMPROVE
3.1 Measurement System
3.1.1 Measurement System Analysis
Many of the problems of bottle loss along the entire line can be attributed to a weak measurement system. Also, without proper measurement procedures, the problem cannot be correctly rectified. At the moment, the line is using the data acquired from the financial reports which retrieves the quantity of bottles ordered weekly from the raw materials department. This data tells the line how many bottles they are using in a week and whether they are reaching their target. There is no way for the line to ascertain whether this information is correct. The line cannot guarantee that they are receiving the correct quantity of bottles from Consol or from the raw materials department. The line needs to implement or reinforce specific measurement procedures in order to count the bottle throughput as well as the number of rejects at each machine. These figures would give a clearer view on the bottle usage as well as bottle loss.
The crucial points of measurement used to calculate the bottle throughput and bottle loss on the line are the de-palletiser bottle count and the palletiser bottle count. Both these machines show an accurate bottle count on a Human-Machine Interface (HMI) screen; consequently this data is readily available and simply needs to be recorded accurately by the right people and at the same time each day. The areas of concern regarding bottle rejects are the filler, laellers and taptones as inspections occur at these machines and therefore the rejects are measured at these points too. The above machines will be the focus points when developing an improved measurement system for the line.
3.1.2 Measurement System Improvement
3.1.2.1 Short Interval Control (SIC) The starting point of a measurement system that can be used to investigate the bottle loss problem and respond quickly to out of control situations is daily short interval control (SIC). It is recommended that control charts for the future monitoring and controlling of the variable can be used as SIC. These will be implemented in the following manner:
Daily, the line manager will acquire the output number of bottles from the daily production report (DPR) and the input number of bottles from the de-palletiser operator. The de-palletiser operator from the night shift records the bottle continuous counter at the close of his shift at 06:00am in the morning on a de-palletiser counter sheet. From this information, a daily bottle loss figure (number of bottles lost) as well as a bottle loss percentage can be

26
calculated. The bottle loss percentage is the variable of interest. This figure will be entered into an excel spreadsheet which will plot it onto an X and an MR chart. If the data point lies outside a control limit, the line manager can consult with the team leader during the morning meeting on this matter. The team leader can report to the line manager on whether the number of rejects at the filler, labeller or taptone were unusually high or if a problem occurred that can be accredited to an assignable cause (such as a problem with a specific machine or conveyer). The information on the assignable cause must be recorded to check whether the problem persists and a longer term solution should be implemented.
A suggested line manager’s short interval control NRB bottle loss spreadsheet can be found in Appendix D. The spreadsheet is computerised so that the data can be entered straight onto the computer daily and the points will show graphically. The control limits on this spreadsheet are calculated according to the historical data from the line and not the performance target. This is due to the fact that the line is not yet capable of reaching the target due to inherent problems present in the process. The new target value is 1% bottle loss. If improvement occurs, a new average can be calculated and the control limits can be rectified.
3.1.2.2 Rejects Monitoring It is important to accurately account for the number of bottles that get rejected from the line to determine the extent of the rejects in relation to the bottle loss problem. A solution for this is to implement sheets that can be filled in by the labeller and filler operators each shift. The team leader will then retrieve the sheets daily from the line and enter it into a spreadsheet on the computer. This information can then be used as short-interval control to monitor the performance of the machines. If rejects are unnecessarily high on a particular day, an analysis of the causes of these rejects must be done. An example of the sheet that was developed for the labeller operators to fill in can be found in Appendix E.
3.1.2.3 Cullet Tracking One of the easiest ways to measure the bottle loss along the line is to monitor the amount of cullet (broken glass) found in each process area. Cullet is an indication of how many bottles break in each process area. Cullet is cleaned and removed from the line by a third-party company called Ecowise. The cullet should be collected into small cullet bins, weighed and recorded by the Ecowise staff before it is transferred into the big cullet bins.
An activity was conducted by Consol (the suppliers of the NRB bottles to SAB) to track the amount of cullet in each process area. This activity was only implemented over 2 weeks. The results were consolidated into a pie graph shown in figure 12. As can be seen on the graph, the labellers’ checkmats are the process areas from which the most cullet was obtained. Labeller 1 checkmat contributed 20% of the line’s total cullet while labeller 2 checkmat contributed 17% of the line’s total cullet. This is because in the checkmats’ area, the defective bottles get rejected off the line. The process in which this occurs causes the bottles

27
to get “kicked” off the line into a bin which smashes the bottles and therefore produces a lot of cullet.
If this activity becomes implemented into the daily operations of the line, more accurate data can be obtained that can be used to identify problematic process areas.
3.1.2.4 Measurement System Considerations Process improvement requires accurate and precise measurement techniques (Cagnazzo, Sibalija & Majstorovic 2009:270). An important consideration when analysing a measurement system is that every measurement contains an error or bias. The following mathematical expression defines this concept (Cagnazzo et al 2009:270):
Therefore it is important to understand and manage measurement error to ensure that it remains below an acceptable level. Cagnazzo et al (2009:270) state that, “The accuracy of a measurement system will have a direct influence on the right judgment of a product and process quality.” A measurement system unable of detecting process variation can never be relied upon to make a decision on process adjustment. For this reason, measurement system analysis (MSA) should be conducted. MSA defines data quality and error in terms of, ‘bias’, ‘repeatability’, reproducibility’, ‘linearity’, and ‘stability’. The following topics give an overview of how MSA can be conducted at SAB with respect to the bottle loss measurement system.
5% 4%
3%
11%
7%
20% 10%
12%
17%
7%
2% 2%
Cullet Rinser
Filler
Pasturiser Infeed
Pasturiser Discharge
Labeller 1 Glideliner
Labeller 1 Checkmat
Labeller 1 Taptone
Labeller 2 Glideliner
Labeller 2 Checkmat
Labeller 2 Taptone
Kister
Traypacker
Figure 12: A Pie Graph Showing the Percentage of Cullet Found in Each Process Area

28
Bias Bias is also referred to as accuracy and is a measure of the distance between the average value of the measurement and the true value of the measurement (MoreSteam). There can be two reasons for bias, instrument bias or operator bias. In order to measure bias, the same reading should be taken between 10 and 30 times and an average should be found. The average should then be compared to a reference standard. The bias is the difference between the average of the readings and the reference standard (Cagnazzo et al 2009:277).
Repeatability and Reproducibility Repeatability evaluates whether the same result can be obtained under the same conditions (instrument variability). Reproducibility assesses whether different operators can measure the same sample with the same measurement device and get the same result (operator variability). A process known as ‘Gage R&R’ is used to test repeatability and reproducibility. This process uses control charts to calculate a sigma score which indicates whether the measurement system can be accepted as a basis for decision making considering these factors (Cagnazzo et al 2009:282).
Linearity Linearity is a measure of the consistency of the bias across the range of the measurement device (MoreSteam). It is important that the photocells that count the bottle throughput at each machine is able to accurately count the bottles at any speed at which the line runs.
Stability Stability refers to the capacity of the measurement system to produce the same values over time when measuring the same samples (MoreSteam). It is imperative that the measurement system is stable (bias, repeatability and reproducibility are under control) and no inherent causes of variation exist. In order to test stability, the company can conduct random tests at any time to assess whether the operator follows the correct procedures with regards to the measurement system as well as to test whether the photocells are correctly counting a known amount of bottles. In essence, SAB must ensure that all employees are aware of the importance of an accurate measurement system. The operators, team leaders and unit manager must be trained on the new measurement system implementations and old procedures must be reinforced. Also, it is vital that the measurement instruments (particularly the photocells and HMI screens) are in proper working condition. Maintenance and testing of these instruments must be regularly conducted.

29
3.2 Conveyers
3.2.1 Conveyer Analysis
From the de-palletiser to the palletiser, bottles are transferred between the various machines by slat conveyers. The design of the conveyer system can have a direct effect on the bottle breakages and thus bottle loss (Lowe & Elkin 1986). Sharp corners may cause the bottles to be displaced from their natural position, in effect making the bottles tip and fall over. Fallen bottles on the conveyer increase the pressure of the bottle stream which causes the bottles to pop out of the stream and fall off the conveyer. This leads to bottle breakages. The pressure of the bottle stream must be carefully controlled as, if the pressure is too high (conveyer guide-rails may be set too narrow), the bottles can press against each other causing them to fracture or smash. It is important to note that bottle fractures may not be noticed as soon as they happen, but when the bottles reach the filler, the displaced air in the bottle causes the fractured bottles to burst. At various stages along the line, when the bottles enter single lanes, the conveyer is angled so that fallen and broken bottles gravitate to the edge and fall out onto a tray (figure 14). This minimises the conveyer pressure.
The slat conveyers are made of stainless steel. High foaming detergent lubricants are used to help loosen the dirt on the bottles until the bottles are rinsed. From then on, natural non-foaming lubricants are used to avoid contamination of the beer bottles (Lowe & Elkin 1986). Lubricants ensure the smooth flow of the bottle stream. The bottle speed on main stretches is reduced by using multiple width conveyers, condensing to a single line at the infeed of the various machines (Lowe & Elkin 1986). Programmable logic controller (PLC) control systems are used to control the speed, stop and start and lubrication of the conveyers along the line. Feather switches connected to the PLC system are able to detect when the conveyer is full and therefore reduce the speed of the conveyer or stop the conveyer if a blockage has occurred further up the line. Accumulation
zones are provided to smooth out the supply and demand situations when one of the machines has stopped.
Figure 13: A Top View of a Series of Conveyers after the Labeller
Figure 14: Fallen Bottles on a Collection Tray

30
3.2.2 Conveyer Improvements
3.2.2.1 Conveyer Design A drawing of the line has been provided in Appendix A. The specific process areas have been marked out on this drawing. It can be seen that some process areas include a larger area of conveyers than others. It can also be seen on the drawing that there are areas of conveyers with sharp bends which is problematic for the smooth flow of bottles. The conveyer design in process areas 1 (post de-palletiser), 4 (pre-pasteuriser) and 5 (post labellers) could be redesigned to eliminate some of the sharp corners and to shorten the length of the conveyers so the bottles can travel a more direct path to the next machine.
There are many issues that arise when suggesting conveyer redesign as a solution to the bottle loss problem. Firstly, there are specific reasons for the original conveyer design. The reasons are as follows:
In process area 1, the bottles are discharged by the de-palletiser onto the conveyer system. The conveyer system is designed in this area so that there is enough length of conveyer to gradually constrict the wide pallet of bottles into a narrower path until eventually the bottle stream enters a single lane so that they can be individually rinsed by the rinsers. A more appropriate solution would be to look at the width of guide rails to control the bottle pressure so that fewer bottles pop out when the conveyer does have to turn.
In process area 4, the length of the conveyers is used to gradually increase the gradient of the bottle flow so that they can reach the entrance of the pasteuriser.
Process area 5 contains large mass flow conveyers. Figure 17 below shows these conveyers. The reason for this section of conveyer is to accumulate bottles so that
Figure 16: Lubrication Ducts Figure 15: An Excess of Foaming Lubrication and Cullet under a Conveyer

31
production flow is not interrupted as the surge of bottles dispelled by the labellers cannot be handled by the shrink wrapper.
Secondly, a redesign of the conveyers would be a capital intensive solution that may not have a big impact when implemented. There are many other solutions that must first be considered before this one. These solutions will be investigated further in following topics.
3.2.2.2 Conveyer Guide Rails Conveyer Guide Rail Width Through observations of the flow of bottles, two portions of the conveyer have been identified having bottles frequently popping out and falling off the conveyer due to too much bottle pressure as the guiderail width is set too narrow. One portion is in process area 1 (post de-palletiser) once the bottle stream makes the first turn. The second portion is in process area 6 just before the bottles enter the shrink wrapper. An additional portion of conveyer, where the bottles enter a single lane before the rinsers has been identified as having the guiderails set too wide (measured at 85mm). The optimum width of a single lane conveyer guiderail is the bottle diameter plus an additional 3mm. The diameter of the largest bottle, the Castle Lager bottle, is 61.7mm. Therefore, the guiderails at this section of conveyer must be set to approximately 65mm. A simple solution exists where the conveyer guide rails can be adjusted to allow the bottles to follow their natural path. If the guiderails are set to the optimum width, the pressure or impact on the bottles will occur at their strongest part. This solution requires no capital input as the guide rails along the line are fully adjustable, but could reduce the bottle loss; by approximately 200 bottles a day. In order to implement the solution, the conveyer numbers must be identified and the work instructions must be added to the maintenance schedule. Maintenance on the line happens every week and therefore production does not have to be stopped specifically to implement this solution.
Figure 17: A Section of Conveyer in Process Area 5 that can be Redesigned

32
In process area 1, this solution has already been implemented. The de-palletiser operator was consulted with regards to the impact of this solution. He stated that considerably fewer bottles were popping out and falling off the conveyer due to the bottle pressure. The noise and displacement of the bottles once they enter a single lane also decreased. The operator was asked to check that the guiderails do not cause any more bottle loss problems in this area. The operator was also urged to return fallen bottles to a place on the conveyer where the bottle pressure is not too high.
Conveyer Guide Rail Material The guide rail material used along line 2 at the SAB Roslsyn plant is stainless steel. The glass to metal contact is problematic along the line as many bottle fractures occur when bottles hit against or are pushed up against the conveyer guide rails. Despite this, it is common industry practice to use stainless steel guide rails as it can be cleaned easily, it meets regulatory requirements in the food and beverage industry with regards to hygiene and sanitation and it is used to support the conveyer belts. Due to these reasons, it would be infeasible to suggest a rubber material that can cover the guide rails to reduce glass to metal contact.
Most conveyer companies, who offer conveyers to glass bottling plants, offer either stainless steel or natural ultra-high-molecular-weight polyethylene (UHMW) guide rails. UHMW has a slight advantage over stainless steel as it offers high wear and abrasion resistance, low coefficient of friction, resistance to a very wide range of chemicals and a reasonable temperature resistance (Claremont Polymer Shapes). A suggestion for the implementation of a new guide rail material would not be to replace all the existing guide rails along the line with UHMW as this would be too costly to the company and not make a great impact with regards to bottle loss. The company should rather replace the guiderails with new UHMW guide rails when it becomes necessary to
replace the existing guide rails as a result of wear and tear.
3.2.2.3 PLC System Optimisation and Conveyer Maintenance A bottle line with its many machines joined by conveyers tends to be difficult to keep in constant flow to optimise efficiency (Lowe & Elkin 1986). The total line control philosophy, aided by the use of PLC systems is important in adjusting conveyer and machine speeds. The PLC system must be carefully programmed and set so that it works on an optimal level.
Figure 18: UHMW Conveyer Guide Rails (source: Claremont Polymer Shapes)

33
Maintenance of this system and the ancillary equipment (motors, sensors and conveyers) must be performed to ensure that it is in proper working condition at all times and it does not contribute to the bottle loss problem. The maintenance planner has been made aware of this and a weekly maintenance schedule has been created to improve the condition of the conveyer system and PLC systems.
The operators must also monitor the conveyers in their specific process areas carefully. If the line stops because of a blockage at one of the machines further along the line, it is imperative that the conveyers stop running and the lubrication ducts stop discharging lubrication onto the conveyers. If this does not happen, the operator must report this as a problem immediately and the appropriate actions to rectify this can be added to the maintenance instructions. These actions include checking whether the feather switch, which is responsible for detecting when the line is full, is in proper working condition. A conveyer that continues to run once the line has stopped causes the bottles to constantly hit against one another which could result in bottle fractures.
Transfer conveyers are points on the conveyer system which cause many problems. Bottles could be displaced and fall over due the heights of the conveyer slats being misaligned. It is easy to recognise and fix this problem quickly. One such problem was rectified on one of the transfer conveyers before the pasteuriser (conveyer 2ES07-M1). The slats were misaligned due to cullet under the wear strip. If problems like these are recognised and fixed quickly, fewer bottles will be lost due to trivial reasons.
3.2.2.4 Bottle Loss Awareness In order to implement sustainable solutions with regards to the bottle loss problem, it is important that all operators and staff working on line 2 are aware of the problem and consciously make an effort to rectify it through good work practices on a daily basis. The operators need to know the magnitude of the problem and the loss the company is facing with regards to variable costs if improvement does not occur. The operators should not be complacent or careless about bottle loss along the line even though the problem has become a normal occurrence. In conjunction with the solutions, it is the responsibility of the team leaders to constantly remind their team of the problem and ways in which the team can contribute to rectifying it. A poster has been put up in the line’s pre-shift meeting room making the employees aware of the focused improvement project that is currently underway and prompting them to act in accordance with the proposed solutions: The ways in which the operators can help reduce bottle loss include but are not limited to:
Lifting any fallen bottles on the conveyers Removing cullet from the conveyers Reporting a problem such as an excessive amount of fallen or broken bottles, a
conveyer to the team leader timeously

34
Reporting to the team leader if an unusual amount of rejects occur during the shift
3.3 Pasteuriser
3.3.1 Pasteuriser Analysis
There is no specific operator that is in charge of the pasteuriser process area. The filler operator usually oversees the pasteuriser activities. As mentioned earlier, a walking beam tunnel pasteuriser is used on line 2. The walking-beam system is not the optimal system to move NRB bottles through the pasteuriser because the NRB bottles have a smaller base than the returnable quart bottles and therefore can fall over easily while being lifted and displaced along the walking beam slats in the pasteuriser. A higher bottle pressure within the pasteuriser can cause bottles to either fracture along the inner walls of the pasteuriser or hit against each other and fracture. Consequently, it is also important that fallen bottles do not enter the pasteuriser as this causes an increased bottle pressure. A major problem can also be seen at a brand changeover. The end of a bottle stream needs to be pushed through the pasteuriser by an operator as there is no bottle pressure to do this. As a result, many bottles fall over and smash. Fallen bottles can be seen leaving the pasteuriser therefore increasing the pressure on the post-pasteuriser conveyers which causes many bottles to pop out and smash on the floor.
3.3.2 Pasteuriser Improvements
3.3.2.1 An Additional Operator A possible solution to the problems surrounding the pasteuriser could be an additional operator dedicated to the pasteuriser who would oversee the pasteuriser and the network of conveyers before and after the pasteuriser. The operator would ensure fallen bottles do not enter the pasteuriser as well as oversee a brand change. This operator will also monitor the network of pre and post-pasteuriser conveyers to lift fallen bottles.
Figure 19: The Pasteuriser Infeed

35
The exact impact of the solution cannot be measured although reducing fallen bottles that enter the pasteuriser should greatly reduce the quantity of bottle loss in this process area as this is currently the main cause of bottle loss in this area. An accurate cost-benefit analysis cannot be performed for this solution as the cost to the company of an additional operator is classified information. If this solution is to be considered, a more thorough investigation needs to be performed.
3.3.2.2 New Flatbed Conveyer Pasteuriser The cost-benefit analysis of purchasing a new pasteuriser that uses a flatbed conveyer as a transport system rather than a walking beam transport system will be analysed as a possible solution to the bottle loss problem. The ‘Krones’ brand offers high quality pasteurisers with a variety of benefits. A new flatbed conveyer will offer the following advantages to the SAB Rosslyn Brewery (Krones 2013):
Conveyer belts are made of durable materials and low on maintenance and wear Narrow transfer areas at the container infeed and discharge points ensure a
streamlined product flow Containers which have been left behind are automatically pushed back onto the
conveyer belt by the optional Rotary Sweeper, allowing fully automatic operation of the pasteuriser (no additional operator required)
Smooth and safe pasteuriser operation even with increased probability of broken glass
Parameters The following parameters will be used to determine the cost-benefit of purchasing a new flatbed conveyer:
The MARR value – 20% The Marr value is often broken up into the sum of the following components:
Figure 20: The Krones' Flatbed Conveyer Pasteuriser (Source: Krones 2013)

36
o Interest rate – 9.5% (Standard Bank 2015) o Inflation rate – 4.6% (Trading Economics 2015) o The risk of the particular venture – Estimated at 5.9%
The cost of the new Krones pasteuriser - $100 000 (Alibaba 2015) The useful life of a pasteuriser – 15 years (Inland Revenue 2015) The current exchange rate - $1 = R13.92 (XE 2015) The average cost of one bottle – R0,99 (table 2) Average daily bottle production output – 80 000 bottles Resulting bottle loss percentage decrease – 0.408%
According to the Pareto principle, a new pasteuriser will decrease the bottle loss between the pasteuriser and the labellers by 80% from 0.51% to 0.102%. This is a saving of 0.408% which translates to an annual saving of 0.408% × 52weeks × 6 days a week × 80 000 bottles a day = 101 837 bottles a year
Calculation The net present value (NPV) method is used to determine whether the investment should be made.
A negative NPV suggests that the investment into a new flatbed conveyer pasteuriser should not be made. SAB, Roslyn will lose R920 623.52 if the investment is made. An alternative to buying a new flatbed conveyer pasteuriser is to retrofit a new belt conveyer system into the existing pasteuriser. The Krones brand offers a stainless steel conveyer known at the ‘Ironman Belt’ which offers extremely long service life low wear due to minimum friction. (Krones 2013).
P = R1 392 000
A = R100 819
n = 1 n = 15
i = 20%

37
3.3.2.3 Flash Pasteurisation There are currently many new innovations with regards to pasteurisation methods. This is due to the numerous problems connected to tunnel pasteurisations. These problems are (Jonas 2009):
Under pasteurisation which happens unknowingly due to failures in the heating controls, product advancing too quickly through the heating and holding zones or faulty spray water distribution
Over pasteurisation (product remains for too long in the pasteuriser) due to a blockage further along the line, causing the taste of the beer to be affected
High water consumption Waste of heat energy Beer and bottle waste due to bottles breaking as a result of the conveyer system Beer and bottle waste due to burst bottles as a result of thermal shock
For this reason many breweries are using flash pasteurisation as an alternative to tunnel pasteurisation. Flash pasteurisation happens prior to filling the beer into containers as opposed to after as with tunnel pasteurisation (Gunn). Flash pasteurisation of beer uses a two or three stage plate heat exchanger with hot water as the heat exchange medium. This allows the use of controlled beer flow and thin film heat transfer which ensures that the beer is evenly heated (Gunn). The thin film permits rapid heating to high temperatures and a short holding time followed by rapid cooling. This pasteurisation system accomplishes an economical and microbially stable fill without impacting the beer or beverage colour and flavour profiles (Gunn).
Implementing flash pasteurisation on line 2 at the Rosslyn Brewery would be a long-term solution to all the tunnel pasteurisation problems mentioned above. It would also greatly reduce the bottle loss associated with the pasteuriser. There are many operations that would change as a result of using flash pasteurisation. The entire line flow will need to be redesigned. The flash pasteuriser itself as well as the redesign of the line would require a large capital investment and stop production for an extended period of time. The extent of the cost to the company to implement this solution cannot be determined at this point. Employees will also need to be trained on the practices associated with flash pasteurisation. The biggest inhibiter for implementing flash pasteurisation is that the filling process needs to be well-
Figure 21: A Flash Pasteuriser (Source: Gunn)

38
controlled and completely sterile so that new organisms are not reintroduced to the beer before it is packaged.
3.4 Filler and Crowner
3.4.1 Filler and Crowner Analysis
Causes of bottle loss at the filler and crowner can be attributed to incorrect fill height, burst bottles within the filler, missing crowns, damaged and skew crowns causing the bottles to be sealed incorrectly or the crowner damaging crowns and bottles.
Often, problems arising from the filler and crowner machines are only realised further down the line at the labellers and taptones where thorough bottle inspection occurs. If problems at the filler and crowner are rectified, the rejects at the labellers and taptones can be significantly reduced.
3.4.2 Filler and Crowner Improvements
3.4.2.1 Incorrect Fill Heights The main process inputs having an effect on the fill height have been identified and actions have been suggested by packaging experts on how to monitor these inputs so that fill height defects can be reduced. The process inputs are: Solenoids Poor preventative maintenance of the solenoids causes oil leaks and air leaks to occur (Marais 2012). Weekly maintenance schedules should be followed correctly so that leaks can be identified and rectified. Solenoids are also damaged during hygiene practices (Marais 2012). Proper hygiene practices must be followed so that water does not reach the electrical components. Valves Filler operators must perform hourly checks on the valve pressure to check that leaking valves do not contribute to incorrect fill heights (Marais 2012). There is a process input monitoring sheet (PIMS) and process output monitoring sheet (POMS) located at the filler that must be filled in diligently by the filler operator. This sheet is a form of SIC that will indicate if leaks are present in any of the valves. Star Wheels Star wheels are brand specific and must be changed during a brand changeover (Marais 2012). Sometimes, the incorrect star wheels are used which causes fill height variation. Quick changeover documents must be retrained so that operators can select the correct star wheel.

39
Star wheels can be colour coded for a fool proof method of selecting the correct star wheel for the brand (Marais 2012). Worn or back lashed star wheels also occur as there are no clear standards on the preventative maintenance schedule for this (Marais 2012). The maintenance planner must add instructions to the weekly maintenance schedules so that the technicians know to check for worn or back lashed star wheels and change the star wheels if necessary.
3.4.2.2 Burst Bottles within the Filler Burst bottles within the filler are mainly caused by slight bottle fractures that occur before the bottles reach the filler. The solutions to the problems of the conveyer system (section 3.2.2) and the de-palletiser machine improvements (section 3.6.2) will help reduce fractured bottles that reach the filler and therefore decrease the number of bottles bursting within the filler.
3.4.2.3 Crowner A thorough analysis of the crowner machine has not been done; therefore no solution has yet been identified to reduce the number of missing, damaged or skew crowns as well as the number of bottles damaged by the crowner. A deeper investigation is required into the crowner and the unit manager, team leader and filler operator can be consulted as to possible solutions regarding these problems.
3.5 Labellers
3.5.1 Labellers Analysis
Labeller rejects are the main cause for bottle loss at the labellers. The rejects from the labellers can go one of two ways:
1. If there is a fill reject or a missing cap, the rejects are kicked off the line with a mechanical arm into a cullet bin (figure 23). There is no way to check these rejects were indeed defective.
2. Skew or missing labels on the back, neck or body of the bottle or labels with the incorrect orientation are sent on a separate rejects line. The labeller operators then retrieve these bottles from the line, manually wash off the incorrectly stuck labels and place the bottles back on the line before the labeller. Problems can occur here because the rejects line is sensitive to fallen bottles or cullet. These single lane conveyers are not cleaned often enough and bottles that are separated onto this line often fall and break. They are also not subject to a high level of control like the main line conveyers. Another problem is the handling of the rejects bottles by the operators. The bottles must be washed carefully so they don’t hit against one another and break.

40
There are large mass flow conveyers (figure 24) after the labellers that are relatively inaccessible and are a cause of bottle loss in this area. Cullet from previous broken bottles gets in the way of the optimum working of these conveyers and must be cleared quickly. Fallen bottles should be lifted swiftly before they cause a problem to the adjacent bottles. The conveyer speed must be controlled carefully to ensure that bottle do not hit against each other and fracture. The bottles at this point are full and the impact of a full bottle is harder than the impact of an empty bottle. These large mass conveyer problems add significantly to the bottle loss in this process area although the solutions to these problems can be found under section 3.2.2.
3.5.2 Labellers Improvements
3.5.2.1 Historical Data Although a proper measurement system has not yet been installed on line two for bottle loss, the team leaders still fill in a form on a daily basis called the ‘31/5’. Applicable information can be obtained from previous 31/5 spreadsheets that can be used during this focused improvement project. This excel spreadsheet is used during the morning meeting by the team leader to report to the line manager on the downtime of the line, the machine and factory efficiencies of the line, the amount of beer used as well and the number of rejects at the various machines. The rejects data was retrieved from the 31/5’s and analysed to give an indication of the classification of the rejects. The raw historical data can be found in Appendix F. The values in this data are given per week. It must be taken into account that in some weeks not all 7 days are used for production.
Figure 23: A Cullet Bin for the Underfill and Missing Cap Rejects
Figure 22: A Labeller Machine in Operation
Figure 24: Large Post-Labeller Mass Flow Conveyers

41
Figure 25 shows that most of the rejects can be attributed to the post-filler bottle inspector (PFBI) which is in line with the Pareto Chart analysis of the bottle loss which can be seen in figure 11. The next largest percentage of rejects is found at labeller 1. Figure 26 classifies the
0
500
1000
1500
2000
2500
Body LabelPresence
ShoulderLabel
Presence
Back LabelPresence
Underfills Orientation
Num
ber o
f Rej
ects
Rejects Category
Average Number of Rejects per Week for each Labeller per Category
Labeller 1
Labeller 2
Figure 26: A Bar Graph Showing the Average Number of Rejects per Week for each Labeller per Category of Reject
46%
33%
18%
2% 1%
Classification of Rejects
PFBI
Labeller 1
Labeller 2
Taptone 1
Taptone 2
Figure 25: A Pie Graph Showing the Percentage of Rejects in each Inspection Area

42
labeller rejects into categories. Unfortunately not all the information provided by the labeller machines are recorded on the 31/5 therefore a new labeller rejects recording form is suggested in section 3.1.2.2.
3.5.2.2 Control Charts Control charts can be implemented as short-interval control to monitor the number of labeller rejects each shift. A separate control chart must be implemented for each labeller machine in order to see which labeller causes the most problems. More time for preventative maintenance can be spent on the problematic labeller. Information from the Labeller Rejects Recording Form found in Appendix E can be used as input into the control charts. The analysis of labeller rejects data can be performed as well as performance and capability studies so that appropriate target value and control limits can be calculated for the data. This has not been done yet as verification of the system that checks the bottles must first be completed before a correct target value for rejects can be calculated.
3.5.2.2 Fill Rejects and Missing Cap To check if the correct bottles are being rejected off the line (smashed into a cullet bin); the settings on the labeller checkmat (post-labeller inspector) must be verified. This can be done by making ‘GO’ and ‘NO-GO’ bottles that are clearly recognisable as test bottles. The GO bottles are filled just above the fill height limit and the NO-GO bottles just below the fill height limit. They are then sent through the labeller machine. At the labeller checkmat, if the GO bottle is rejected or if the NO-GO bottle is allowed through, the labeller technician must be called to correct the settings. The GO and NO-GO tests must be performed at least three times per shift. Another option to verify the validity of the rejects is by not smashing these rejects but rather sending them onto a separate rejects line for manual inspection. This solution should only be implemented if the rejects count remains high after performing the GO and NO-GO test explained above. A separate rejects line will be labour intensive and the labeller operators may not have time to manually check every bottle as they have many other activities to perform during their shift.
3.5.2.3 Rejects Line The rejects line must be cleaned and cleared at least four times per shift. Due to the fact that this rejects line is not subjected to a high level of control, it is necessary to frequently clear away the cullet that can cause more bottles to fall and break. Checks can be done by the team leader to ensure that the labeller operators are performing their duties with regards to the rejects line. Handling of the skew or missing label rejects must be done carefully by the labeller operators so that the bottles do not break. Bottles that break while carrying them to the washing bay or

43
while washing can be a safety hazard as well as add to bottle loss. The labeller operators must be reminded to handle these reject bottles with care as every bottle lost contributes to the bottle loss problem.
3.6 De-palletiser
3.6.1 De-palletiser Analysis
A cause-and-effect diagram has been constructed to report on the causes of bottle loss in the de-palletiser area.
Figure 27: A Deshrouded Pallet of Bottles on Wooden Layer Boards
Figure 28: The De-palletiser Machine

44
Causes of Bottle Loss at
the De-palletiser
Man
1. The plastic cutter operator allows bottles to fall when cutting the plastic off the pallet of bottles
2. The plastic cutter does not remove bottles on the edge of the layer boards, so the bottles fall off when the bulk-in feed conveyer moves
3. The de-palletiser operator does not lift fallen bottles quickly
Machine 1. The bulk-in feed conveyer has a jerky start and stop
Material Method Measurement
1. The first point of measurement is only after the bottles enter a single lane. The number of bottles that enter the line are not counted from the bulk-infeed conveyer but only from just before the rinsers (using a photocell sensor). There is no way to calculate bottle loss from the bulk-infeed conveyer, de-palletiser machine and conveyers before the rinsers.
2. The conveyer guide-rails are not set at an optimum position (bottle stream pressure too high on these conveyers)
1. Pallets where a lot of bottles have already fallen off the layer boards before the plastic is cut must be sent back to the raw materials department
1. The side-guides on the transfer conveyer at the de-palletiser discharge must be covered by a rubber type of material to avoid glass to metal contact
3. Conveyer speed and lubrication must be controlled correctly. All relevant equipment must be properly maintained.
2. Masonite layer boards get wet and lose their firmness, causing bottles to fall off as well as problems with the de-palletiser machine

45
3.6.2 De-Palletiser Improvements
3.6.2.1 Man Fallen Bottles When Removing the Plastic from a Pallet The plastic must be removed carefully from a pallet of bottles. The plastic operator must not allow any bottles to fall when taking off the plastic. This is a simple concept and ties in with change management and awareness for the bottle loss problem in section 3.2.2.4.
One Point Lesson - Bottles on the Edge of a Pallet After removing the plastic from the pallets, the plastic operator must remove any bottles balancing on the edges of the layer boards. The full base of each bottle must be on the layer board before the bulk-in feed conveyer moves. This will ensure that the bottles do not fall off the pallets and break while the bulk-infeed conveyer is moving. The plastic operator must then return the bottles onto the line after the de-palletiser machine. In order to remind the plastic operator of these practices, a one point lesson (OPL) was made. The OPL named, ‘removing bottles on the edge’ can be found in Appendix G.
Lift Fallen Bottles Quickly The de-palletiser operator must lift fallen bottles quickly. The bottle stream pressure on the post de-palletiser conveyers is high as a wide pallet of bottles must be constricted to a single lane of bottles. This accentuates the problem of fallen bottles; therefore the de-palletiser operator must be especially vigilant and lift the fallen bottles so that bottles are not compressed against one another or the guide rails causing them to pop up, burst or fracture. This solution ties in with awareness for the bottle loss problem in section 3.2.2.4.
3.6.2.2 Machine Bulk-Infeed Conveyer The plastic cutter operator highlighted the problem of the jerky start and stop of the bulk-infeed conveyer. The problem was conveyed to the maintenance planner and added to the maintenance schedule. The maintenance schedule instructed the maintenance technicians to inspect this section of conveyer for worn sprockets. The solution has not yet been completed therefore the impact of this particular solution has not yet been realised. The OPL named ‘Bottles on the Edge of a Pallet’ explained in section 3.6.2.1 above will also decrease the amount of bottles that fall off the pallets when the bulk-infeed conveyer starts or stops although this is not a fool proof solution to the problem. The conveyer must be inspected by experts so that the problem does not persist.
Conveyer Guide Rail Width This topic has been addressed in section 3.2.2.2 above.
Conveyer Maintenance This topic has been addressed in section 3.2.2.3 above.

46
3.6.2.3 Measurement Measurement between Bulk-Infeed Conveyer and Rinsers The HMI of the de-palletiser machine shows how many pallets are deposited onto the line per shift. The amount of pallets is not captured or used at the moment. This information coupled with the number of bottles per pallet (table 2) can be used to calculate the difference between the bottles deposited onto the line and the number of bottles counted by the photocell situated just before the rinsers. The capturing of this data on a daily basis will help to identify how many bottles are lost in this area (process area 1). This data can be captured by the de-palletiser operator on the de-palletiser counter sheet used during the daily short interval control.
3.6.2.4 Method One Point Lesson - Fallen Bottles When Removing the Plastic from a Pallet Before the plastic is removed from a pallet of bottles, the plastic operator should inspect the pallet. If the pallet of bottles is damaged in any way or an excessive amount of bottles have fallen or broken, send the pallet back to raw materials and notify the team leader. In order to remind the plastic operator of these practices, a one point lesson (OPL) was made. The OPL named, ‘sending pallets of bottles back to raw materials’ can be found in Appendix G.
3.6.2.5 Material Conveyer Guide Rail Material This problem has been addressed in section 3.2.2.2 above.
New Layer Board Material There are many problems caused by the Masonite layer boards between the pallets of bottles. Once the pallets of bottles are delivered by Consol, they are stored outside as there is insufficient space in the raw materials warehouse to store the amount of bottles necessary to keep the line running. In the rainy season, the Masonite layer boards between the bottles get
Figure 29: The HMI of the De-palletiser Machine

47
wet and lose their firmness or warp, causing the bottles to fall off the side of the pallet. It also causes problems with the de-palletiser machine, resulting in downtime and the lines efficiency rating to decrease.
A new layer board material has been suggested by Mario Botha, the unit manager for line 2. A trial has been conducted on line 2 to check if the de-palletiser machine is compatible with plastic layer boards instead of Masonite layer boards. The trial consisted of running 76 pallets consisting of 532 plastic layer boards. The trial was successful and the only problem experienced with the new layer board material was that on 12 occasions (2.2% of the trial) the plastic layer board was swept onto the line along with the pallet of bottles. The suggestion to rectify this problem was to add layer board grippers onto the de-palletiser machine so that the plastic layer boards can be remain behind while a layer of bottles is being swept onto the line. No comment was made with regards to the bottle loss during the plastic layer board trial. Unfortunately, plastic layer boards will increase the price of the raw material bottles and therefore the solution must first be accepted by the bottle supplier, Consol as well as higher management at SAB before it can be implemented. Although the layer board are reused, the price of a plastic layer board is nearly three times more expensive than the Masonite boards.
The unit manager believes that a new layer board material will have a large seasonal impact with regards to the bottle loss problem. Between 1500 and 2000 bottles a week can be saved during the summer season when it rains frequently.
Figure 30: Comparison of the Masonite Layer Boards (Left) and Plastic Layer Boards (Right) on the Bulk-InfeedConveyer

48
CHAPTER 4: CONTROL
4.1 Recommendations for Implementing, Support and Maintenance of Solution
The following steps should be followed and implemented in order to ensure that the solution is successful and warrants continuous improvement to help reduce bottle loss on the line.
4.1.1 Plan
An action plan is written up in the form of a hierarchy to mark the way forward with respect to the solution. The plan consists of the short-term and long-term activities that need to be done in order to ensure that the solution continues to be feasible. The hierarchy can be found in figure 31 on the following page. The short-term activities can be implemented immediately. The long-term solutions need to undergo a more thorough investigation before they are sent to higher level management for acceptance. Some long-term solutions are suggestions that do not constitute the preferred solution. The explanation of the solutions in the previous chapter contains the evaluation if the solution against the relevant criteria.
4.1.2 Do
The first 30 days of the implementation of the solution is essential. The plan must be followed diligently and short interval control of the plan is important to assess of everything is running smoothly.
4.1.3 Check
Once the solution is implemented data must be gathered to check that the solution is indeed showing results. With the help of the improved measurement system recommended within the solutions, the solutions can be verified once implemented.
4.1.4 Act
If the process has improved, documentation must be drawn up to systemise the changes. If the process has not yet been improved, step 4 should be revisited in order to find new process improvements that could work.
The PDCA loop can be repeated numerous times until the process has shown significant improvement and the problem is rectified to a sufficient level, i.e. the target for bottle loss has been reached.
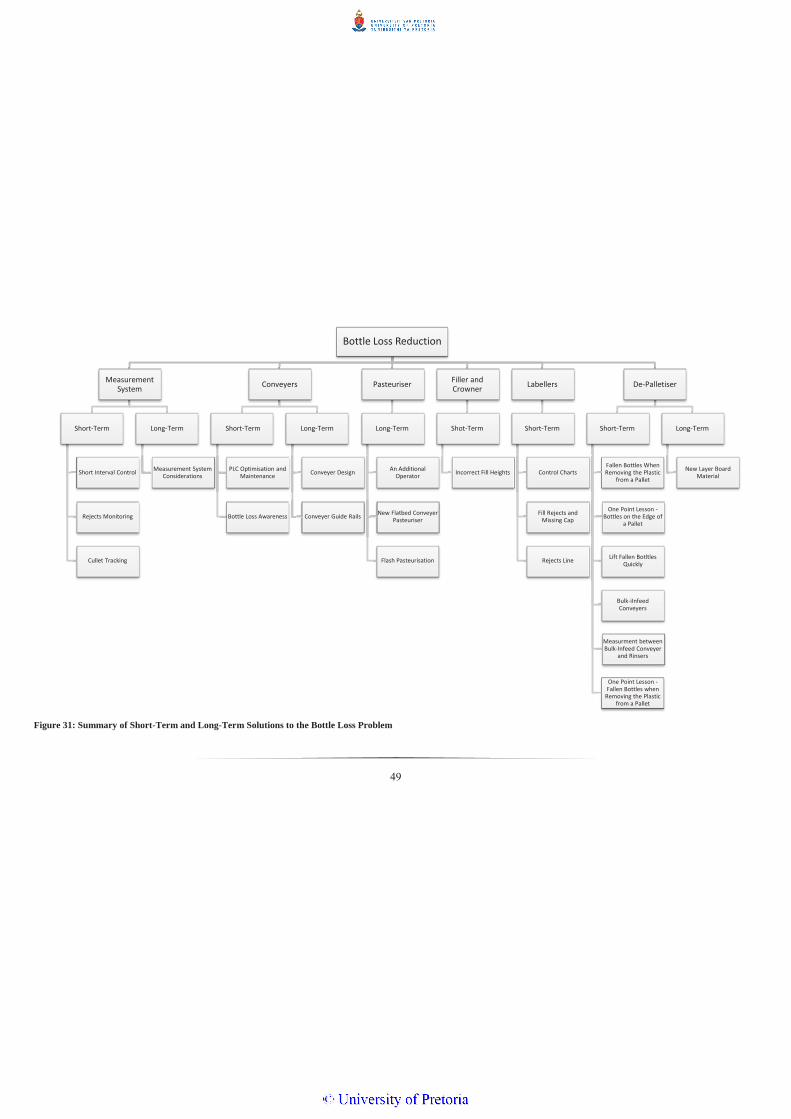
49
Figure 31: Summary of Short-Term and Long-Term Solutions to the Bottle Loss Problem
Bottle Loss Reduction
Measurement System
Short-Term
Short Interval Control
Rejects Monitoring
Cullet Tracking
Long-Term
Measurement System Considerations
Conveyers
Short-Term
PLC Optimisation and Maintenance
Bottle Loss Awareness
Long-Term
Conveyer Design
Conveyer Guide Rails
Pasteuriser
Long-Term
An Additional Operator
New Flatbed Conveyer Pasteuriser
Flash Pasteurisation
Filler and Crowner
Shot-Term
Incorrect Fill Heights
Labellers
Short-Term
Control Charts
Fill Rejects and Missing Cap
Rejects Line
De-Palletiser
Short-Term
Fallen Bottles When Removing the Plastic
from a Pallet
One Point Lesson - Bottles on the Edge of
a Pallet
Lift Fallen Botltles Quickly
Bulk-iInfeed Conveyers
Measurment between Bulk-Infeed Conveyer
and Rinsers
One Point Lesson - Fallen Bottles when
Removing the Plastic from a Pallet
Long-Term
New Layer Board Material

50
4.2 Change Management
4.2.1 Eight Steps to Create a Lasting Transformation
It is important to manage the necessary change so that the solutions are sustainable in reaching the aim of the project. Kotter (1995) states that, “the change process goes through a series of phases that, in total, usually require a considerable length of time.” Kotter believes that there are 8 steps that are able to transform the organisation in the desirable way. The 8 steps will be explained briefly below.
4.2.1.1 Establish a Sense of Urgency It is important for a leader to be defined that leads the change effort by creating awareness of the plight of the current state and highlighting the need to change. A leader of change for the bottle loss problem has already been identified as the unit manager of line 2, Mario Botha. A sense of urgency to change is created when 75% of the company’s management is convinced that business-as-usual is unacceptable (Kotter 1995).
4.2.1.2 Form a Powerful Guiding Coalition Once a leader has been established, the nest step is to gather a group of between 5 and 15 people that are committed to the transformation (Kotter 1995). As the transformation propagates this guiding coalition can grow to up to 50 people. This coalition can consist of any level of employee so that a broad view of the problems and opportunities can be identified. Teamwork is important in creating a sustainable transformation (Kotter 1995). With regards to the bottle loss problem, teamwork between the suppliers, management, team leaders and operators is imperative to facilitate change.
4.2.1.3 Create a Vision A vision clarifies the direction in which the organisation needs to move (Kotter 1995). It is a clear and compelling message that can be communicated in less than 5 minutes. Without a sound vision, a change effort can easily disintegrate into a list of confusing and incompatible projects that take the organisation in the wrong direction or nowhere at all (Kotter 1995). During this step, strategies are also formulated for achieving the vision.
4.2.1.4 Communicate the Vision Credible communication is needed to win the hearts and minds of the employees (Kotter 1995). All existing communication channels should be used to relay the vision and the desired behaviour needed to achieve the vision (Kotter 1995). Both visual and verbal communication has been suggested within the solutions to the bottle loss problem. It is important to remember that communication is conveyed through both words and deeds.

51
4.2.1.5 Empower Others to Act on the Vision Employees should be empowered to try new approaches, to cultivate new ideas and to become leaders (Kotter 1995). Frequent discussions during team meetings will help to accomplish this at SAB Rosslyn. Renewal requires the removal of obstacles that undermine the vision. This can involve changing systems or structures that hinder the vision. Compensation or performance-appraisal systems can help when the obstacle is a person (Kotter 1995).
4.2.1.6 Plan for and Create Short-Term Wins Change efforts will not have momentum if there are no short-term goals to meet and celebrate (Kotter 1995). Managers must actively look for ways to obtain clear short-term performance improvements. Employees that are involved in these improvements must be recognised and rewarded (Kotter 1995). If the bottle loss percentage decreases slightly, this information must be shared and celebrated throughout the whole of line 2. This step collaborates with step 1 to maintain a high level of urgency.
4.2.1.7 Consolidate Improvements and Produce Still More Change The change must be embedded in the culture of the organisation before it can be considered a successful change. Instead of declaring a victory, the leaders of change must use the short-term wins to tackle even bigger challenges (Kotter 1995). The process needs to be continuously reinvigorated with new projects, themes and change agents (Kotter 1995). This step can take between 5 and 10 years in a big organisation.
4.2.1.8 Institutionalize New Approaches New behaviours must be rooted in the shared values of the organisation. This is done by making an effort to show employees how the new behaviours have helped to improve performance (Kotter 1995). It can also be achieved by making sure that the next generation of top-management encompasses the new approach (Kotter 1995).
4.3. Solution Validation
4.3.1 Financial Benefit
Using the current process performance mean and future process capability mean, it is possible to determine the financial impact of merely rectifying the assignable causes without reengineering the process. The short-term solutions shown in figure 31 will rectify the assignable causes which will cause the bottle loss percentage to be reduced from 1.44% to 0.99%. Using 80 000 bottles as the average daily output number of bottles and R0.99 as the average price of one bottle (across all brands produced on line 2), the following financial benefit will be realised by the SAB, Rosslyn Brewery:

52
Current financial impact of bottle loss:
After implementing short-term solutions:
This translates into a daily saving of R356.40 a day. Although this does not sound like a substantial saving, the brewery will be able to save R111 196.80 a year by merely rectifying the assignable causes on the line.
It was found that the line is incapable of reaching its performance target of 0.45% bottle loss although; the inherent problems with regards to bottle loss can be rectified by re-engineering the process. Re-engineering the process involves implementing the suggested long-term solutions. Further analysis of the long term solutions is required before the exact impact of these solutions can be calculated.
The Pareto principle can give an indication of the bottle loss percentage reduction that can be realised in each process area and the financial benefit if all the solutions are implemented.
Table 5: A Table Showing the Bottle Loss Reduction and Financial Benefit that can be Realised According to the Pareto Principle
Process Area Current Bottle
Loss Percentage
Current Financial Impact
(per day)
After an 80% reduction in bottle loss
Future Financial Impact
(per day)
Possible Saving
(per day)
Pasteuriser 0.51% R403.92 0.102% R80.78 R323.14 Filler and Crowner
0.36% R285.12 0.072% R57.02 R228.10
Labellers 0.23% R182.16 0.046% R36.43 R145.73
It can be seen that the aim of the project to reduce bottle loss and therefore help the line to reach budget objectives can be achieved through the implementation of the given solutions. The purpose of the project was to identify the causes of bottle loss on the line and come up with feasible solutions in order to reduce the quantity of bottles lost on the line which has been successfully completed through the deliverables of this project.

53
4.4 Conclusion
In order to be a world-class manufacturing company, continuous improvement in all areas of business must occur. One of the key performance areas of any company is cost. To be more profitable, the SAB Rosslyn Brewery must reduce its costs to an acceptable level according to the performance targets set. The problem of bottle loss is causing unnecessarily high variable costs for the SAB Roslyn Brewery and impacting on the optimal performance of the NRB bottle line. For this reason, a focussed improvement project has been established to help the line reduce its bottle loss to an acceptable level.
The DMAIC methodology was used in conjunction with statistical process control methods in order to approach the problem in a logical, structured way and to facilitate effective solution generation. The problem was defined with emphasis on the scope and rationale behind the project. The project aim and deliverables were clearly stated. Data was analysed, showing the magnitude of the problem. It could be seen that the performance target set by the company was unreasonable. Future monitoring of the problem will be based on the previous best performance of the line with respect to bottle loss rather than the target value given. A Pareto Chart showed the focus areas that were investigated further in the project. A brief analysis and observations of each of these focus areas revealed the problems causing the bottle loss in each area. Each problem was addressed and potential solutions rectifying the assignable and non-assignable causes were provided. The solutions were divided into short-term and long-term solutions and the financial benefit of the solutions was calculated. Recommendations for the implementation, support and maintenance of the change involved in implementing the solutions was also provided.
Although reducing bottle loss seems like a small aspect when compared to the magnitude of the business operations at SAB, it is an important step in ensuring that SAB aligns itself with its vision to strive for operational excellence as well as world-class manufacturing principles of continuous improvement.

54
References
ALIBABA, 2015. Beer Pasteurizer [online]. Available from: http://www.alibaba.com/showroom/beer-pasteurizer.html [Accessed 27 September 2015].
ANJARD, R. P., 1992. SPC Chart Selection Process. Microelectron Reliab, vol. 35, no. 11, pp. 1445-1447.
BOND, T. C., 1999. The Role of performance Measurement in Continuous Improvement. International Journal of Operations & Production Management, vol 19, no. 12, pp. 1318-1334.
CAGNAZZO, L., SIBALIJA, T. & MAJSTOROVIC, V., 2009. The Measurement System Analysis as a Performance Improvement Catalyst: A Case Study. Springer Berlin Heidelberg.
CLAREMONT POLYMER SHAPES. Conveyer Guide Rail [online]. Back2Front. Available From: http://www.claremontpolymer.com/030~Parts/070~Guide_Rail/ [Accessed 30 August 2015].
ESCALANTE-VAZQUEZ E. J., 2007. SPC Study of a Brewing Process. Journal of Applied Statistics, vol. 34, no. 8, pp. 973-984.
EUROMONITOR INTERNATIONAL., 2014. Beer in South Africa [online]. Available from: http://www.euromonitor.com/beer-in-south-africa/report [Accessed: 29 April 2015].
GERICKE, C. G., 2014. Pasteurisation. The SAB Rosslyn Brewery, Shared Drive.
GUNN, J. Flash Pasteurization Theory & Practice [online]. IDD Process and Packaging Inc. Available from:http://www.iddeas.com/documents/FlashPasteurizationTheoryandPractice.pdf [Accessed 30 August 2015].
INLAND REVENUE, 2015. General depreciation rates [online]. Available from: http://www.ird.govt.nz/resources/6/5/6576ff004ba3cf748844bd9ef8e4b077/ir265.pdf [Accessed 28 September 2015].
JACOBS, F.R. & CHASE, R.B., 2011. Operations and Supply Chain Management. 13th ed. New York: McGraw-Hill/Irwin.
JONAS, P., 2009. Modelling and Control of Tunnel Pasteurizers. Dissertation. Czech Technical University in Prague.
KERSSENS-VAN DRONGELEN, I. C. & COOK, A., 1997. Design principles for the development of measurement systems for research and development processes. R&D Management, vol. 27, no. 4, pp. 345-357.

55
KLEFSJO, B., WIKLUND H. & EDGEMAN R. L., Six Sigma Seen as a Methodology for Total Quality Management. Measuring Business Excellence, vol. 5, no. 1, pp. 31-35.
KOCH, E., 2013. The SABMiller Manufacturing Way. The SAB Rosslyn Brewery, Shared Drive. Version 2.1. Full Version.
KOCH, E., 2014. SABMiller Beer KPI Summary Report. The SAB Rosslyn Brewery, Shared Drive.
KOTTER J. P., 1995. Leading Change: Why Transformation Efforts Fail. Harvard Business Review, pp. 59-67.
KOTZ, S., & JOHNSON, N. L.,1993. Process Capability Indices. London: Chapman & Hall.
KRONES, 2013. Pasteurising with the highest efficiency [online]. Germany, Krones LinaFlex. Available from: http://www.krones.com/downloads/linaflex_en.pdf [Accessed 27 September 2015].
LEE, P., 2004. Where do we go from here? World class manufacturing. Manufacturing Engineer, vol. 83, no. 2, pp. 30-33.
LOWE, C. M. & ELKIN, W. I., 1986. Beer Packaging in Glass and Recent Developments. J. Inst. Brew, vol. 92, pp. 517-528.
MARAIS, L. D., 2012. DMAIC 6 Sigma of fill height optimisation of line 8 at SAB Alrode. Dissertation, (B.Eng.). University of Pretoria.
MONTGOMERY, D. C., 2009. Introduction to Statistical Quality Control. 6th ed. United States of America: John Wiley & Sons, Inc.
MORESTEAM. Measurement System Analysis (MSA) [online]. Available from: https://www.moresteam.com/toolbox/measurement-system-analysis.cfm [Accessed 27 August 2015].
NELSON, M., 2005. The Barbarian’s Beverage: A History of Beer in Ancient Europe. Oxon: Routledge.
PERRIN, B., Effective Use and Misuse of Performance Measurement. American Journal of Evaluation, vol. 19, no. 3, pp. 367-379.
POHEKAR S. D. & RAMACHANDRAN M., 2004. Application of multi-criteria decision making to sustainable energy planning - A review. Renewable and Sustainable Energy Reviews, vol. 8, pp. 365–381.

56
SAB. WCM Foundational Practices Part II, 6 Step Focused Improvement. The SAB Rosslyn Brewery, Shared Drive.
SALEH, N. A., MAHMOUD, M. A., KEEFE, M. J., & WOODALL, W. H., 2015. The Difficulty in Designing Stewhart and X Control Charts with Estimated Parameters. Journal of Quality Technology, vol. 47, no. 2, pp. 127-138.
SCHONBERGER, R. J., 1886. World Class Manufacturing, The Lessons of Simplicity Applied. New York: The Free Press.
STAFF, M., 2013. Six Sigma: Where it all Began [online]. Manufacturing Digital. Available from: http://www.sixsigmamindpro.com/scholarship-info/ManufacturingDigitalOct2013.pdf [Accessed 16 May 2015].
STANDARD BANK, 2015. Interest rates [online]. Available from: http://www.standardbank.co.za/standardbank/Personal/Fees,-rates-&-prices/Interest-rates [Accessed 27 September 2015].
SYSTEM RELIABILITY CENTER, 2001. Quality Tools, The Basic Seven. Rome.
THE INSTITUTE OF BREWING AND DISTILLING, 2008. Institute of Brewing and Distilling General Certificate in Beer Packaging (GCP) Section 4 NRB Specialist Section – Non-returnable Bottles (NRB) and Packaging Materials.
THE SOUTH AFRICAN BREWERIES, 2015. Overview [online]. Available from: http://www.sab.co.za/sablimited/content/en/sab-overview [Accessed: 29 April 2015].
TRADING ECONOMICS, 2015. South Africa Inflation Rate [online]. Available from: http://www.tradingeconomics.com/south-africa/inflation-cpi [Accessed 27 September 2015].
WHEELER, D. J., 1996. What About Charts for Count Data? [online]. SPC Press Inc. Available from: http://www.qualitydigest.com/jul/spctool.html [Accessed 13 May 2015].
XE, 2015. XE Currency Converter [online]. Available from: http://www.xe.com/currencyconverter/convert/?Amount=1&From=USD&To=ZAR [Accessed 27 September 2015].

57
Appendix A: A Drawing of the Line

1
2
3 4
5 6
7
8
Key
1 – De-palletiser
2 – Rinsers
3 – Filler and crowner
4 – Pasturiser
5 – Labellers
6 – Kister
7 – Traypacker
8 – Palletiser

58
Appendix B: Initial Historical Data

Year Month Week Input Target Output Variance Bottle Loss Target1 6 075 536 6 055 491 6 028 241 47 295 0,785 0,0452 4 815 424 4 774 633 4 753 147 62 277 1,310 0,0454 4 806 242 4 773 083 4 751 604 54 638 1,150 0,0451 4 324 974 4 308 881 4 289 491 35 483 0,827 0,0452 2 455 620 2 448 649 2 437 630 17 990 0,738 0,0453 4 508 396 4 465 014 4 444 921 63 475 1,428 0,0453 5 947 872 5 937 512 5 910 793 37 079 0,627 0,0454 3 595 110 3 565 910 3 549 863 45 247 1,275 0,0455 2 814 397 2 779 588 2 767 080 47 317 1,710 0,0451 6 212 942 6 190 955 6 163 096 49 846 0,809 0,0452 4 609 344 4 570 844 4 550 275 59 069 1,298 0,0453 7 001 632 6 963 774 6 932 437 69 195 0,998 0,0454 4 671 744 4 643 976 4 623 078 48 666 1,053 0,0451 5 170 616 5 156 121 5 132 918 37 698 0,734 0,0452 5 630 064 5 612 753 5 587 496 42 568 0,762 0,0453 4 580 868 4 542 529 4 522 088 58 780 1,300 0,0454 9 447 175 9 394 216 9 351 942 95 233 1,018 0,0451 3 396 136 3 377 241 3 362 043 34 093 1,014 0,0452 6 435 264 6 406 880 6 378 049 57 215 0,897 0,0453 5 536 293 5 486 113 5 461 425 74 868 1,371 0,0454 6 181 902 6 154 567 6 126 871 55 031 0,898 0,0455 4 281 132 4 237 632 4 218 563 62 569 1,483 0,0451 7 453 248 7 393 456 7 360 185 93 063 1,264 0,0452 4 565 111 4 523 578 4 503 222 61 889 1,374 0,0453 6 280 008 6 256 526 6 228 372 51 636 0,829 0,0454 6 058 593 6 019 286 5 992 199 66 394 1,108 0,0451 5 349 757 5 344 081 5 320 033 29 724 0,559 0,0452 5 673 900 5 625 023 5 599 710 74 190 1,325 0,0453 4 076 160 4 064 485 4 046 195 29 965 0,741 0,0454 2 248 506 2 235 366 2 225 307 23 199 1,043 0,0455 2 354 098 2 339 151 2 328 625 25 473 1,094 0,0451 4 594 478 4 572 658 4 552 081 42 397 0,931 0,0452 3 299 797 3 275 132 3 260 394 39 403 1,209 0,0453 3 950 257 3 916 683 3 899 058 51 199 1,313 0,0454 3 638 975 3 606 023 3 589 796 49 179 1,370 0,0451 3 780 576 3 738 162 3 721 340 59 236 1,592 0,0452 1 604 608 1 589 465 1 582 312 22 296 1,409 0,0453 3 501 696 3 451 180 3 435 650 66 046 1,922 0,0451 3 634 254 3 606 073 3 589 846 44 408 1,237 0,0452 2 245 056 2 228 760 2 218 731 26 325 1,187 0,0453 1 412 928 1 405 448 1 399 123 13 805 0,987 0,0454 1 632 576 1 620 684 1 613 391 19 185 1,189 0,045
A Table Showing the Data Aqcuired from the Weekly Variables Finance Report and the Relevant Calculated Information Obtained from the Data
2014
2015
May
June
August
September
October
November
December
January
March
February
July

59
Appendix C: The Process of Compiling the Control Charts

USL = 0,45 LSL = Type of Spec: tStB Contested? Uncontested
MonthWeek 1 2 4 1 2 3 3 4 5 1 2 3 4 1 2 3 4 1 2 3 4 5 1 2 3 4 1 2 3 4 5 1 2 3 4 1 2 3 1 2 3 4X = 0,78 1,31 1,15 0,83 0,74 1,43 0,63 1,27 1,71 0,81 1,30 1,00 1,05 0,73 0,76 1,30 1,02 1,01 0,90 1,37 0,90 1,48 1,26 1,37 0,83 1,11 0,56 1,32 0,74 1,04 1,09 0,93 1,21 1,31 1,37 1,59 1,41 1,92 1,24 1,19 0,99 1,19MR = 0,53 0,16 0,32 0,09 0,69 0,80 0,65 0,44 0,90 0,49 0,30 0,05 0,32 0,03 0,54 0,28 0,00 0,12 0,47 0,47 0,59 0,22 0,11 0,55 0,28 0,55 0,77 0,58 0,30 0,05 0,16 0,28 0,10 0,06 0,22 0,18 0,51 0,69 0,05 0,20 0,20
MR = 0,349 UCLMR = +3σLMR = D4MR UWLMR = +2σLMR = MR + 2/3(UCLMR – MR )= (3,267)(0,349) = 0,349 + 2/3 (1,1393 - 0,499)= =
LCLMR = -3σLMR = - D3MR LWLMR = –2σLMR = MR – 2/3(MR – LCLMR)= - (0)(0,349) = 0,349 - 2/3 (0,349 - 0)= =
MonthWeek 1 2 4 1 2 3 3 4 5 1 2 3 4 1 2 3 4 1 2 3 4 5 1 2 3 4 1 2 3 4 5 1 2 3 4 1 2 3 1 2 3 4Chosen Points 0,5 0,2 0,3 0,1 0,3 0,1 0,3 0 0,5 0,3 0 0,1 0,3 0,1 0,2 0,3 0,1 0,1 0,2 0,2 0,1 0,2 0,2
March
Capability and Performance Study Based on X and MR Charts
1,1393
0
0,7759
0,1163
September October November December January FebruaryMay June July August
MarchOctober November December January FebruaryMay June July August September
0
0,2
0,4
0,6
0,8
1
1,2
1 2 4 1 2 3 3 4 5 1 2 3 4 1 2 3 4 1 2 3 4 5 1 2 3 4 1 2 3 4 5 1 2 3 4 1 2 3 1 2 3 4
May June July August September October November December January February March
MR Chart
MR =
UCL
UWL
Centre Line
LWL
LCL

X = 1,123 UCLX = +3σLX = X + A2MR0 UWLX = +2σLX = X + 2/3(UCLX –X )MR0 = 0,198 = 1,123 + (2,66)(0,198) = 1,123 +2/3 (1,6493 - 1,123)
= =
LCLX = -3σLX = X - A2MR0 LWLX = –2σLX = X – 2/3(X – LCLX)= 1,123 - (2,66)(0,198) = 1,123 - 2/3(1,123 - 0,5967)= =
MonthWeek 1 2 4 1 2 3 3 4 5 1 2 3 4 1 2 3 4 1 2 3 4 5 1 2 3 4 1 2 3 4 5 1 2 3 4 1 2 3 1 2 3 4Chosen Points 0,81 1,30 1,00 1,05 0,73 0,76 1,30 1,02 1,01 0,90 1,37 0,90 0,83 1,11 0,56 1,32 0,74 1,04 1,09 0,93
Estimate statistics representing the actual performance of the processActual central tendency: Overall, long term stdev:μ = X = 1,123 s = stdev(all the values)=
Estimate the statistics representing the potential performance of the processDetermine μ 0, the targe value: Short term, inherent stdev: μ0 = X0 = σ̑ = MR0/d2
= (0,198)/(1,128) =
OctoberOctober November December January February
1,6493 1,4739
May June July August September
0,1754
0,9891
0,299
0,5967 0,7722
0,00
0,50
1,00
1,50
2,00
2,50
1 2 4 1 2 3 3 4 5 1 2 3 4 1 2 3 4 1 2 3 4 5 1 2 3 4 1 2 3 4 5 1 2 3 4 1 2 3 1 2 3 4
May June July August September October November December January February March
X Chart
X =
UCL
UWL
Centre Line
LWL
LCL

60
Appendix D: Spreadsheet for the Future Monitoring and Control of NRB Bottle Loss

USL = 0,45 LSL = Type of Spec: tStB Contested? Uncontested
MonthWeek X =MR =
Actual central tendency: Overall, long term stdev:μ = X = s = stdev(all the values)=
μ0 = X0 = MR0 =
UCLR = D4MR0 LCLR = D3MR0 UWLR = MR0 + 2σR LWLR = MR0 – 2σR
= (3,267)(0,198) = (0)(0,198) = 0,198 + 2/3(0,646-0,198) = 0,198 - 2/3(0,198 - 0)= = = =
UCLX = X0 + A2MR0 LCLX = X0 – A2MR0 UWLX = X + 2σX LWLX = X – 2σX
= 0,989 + (2,66)(0,198) = 0,989 - (2,66)(0,198) = 0,989 + 2/3(1,515 - 0,989) = 0,989 - 2/3(0,989 - 0,463)= = = =
Control Limits for the Future Monitoring and Control of the Variable
0,463
0,497
1,340
0,066
0,6381,515
0,989 0,198
0,646 0,000
CONTROL LIMITS FOR THE FUTURE MONITORING AND CONTROLLING OF THE BOTTLE LOSS PERCENTAGE
#DIV/0!
Estimate statistics representing the actual performance of the process
#DIV/0!
0
0,1
0,2
0,3
0,4
0,5
0,6
0,7
MR Chart
MR =
UCL
UWL
Centre Line
LWL
LCL
0,00
0,20
0,40
0,60
0,80
1,00
1,20
1,40
1,60
X Chart
X =
UCL
UWL
Centre Line
LWL
LCL

61
Appendix E: Labeller Counter Recording Sheet

Labeller: 1 / 2 Date: M/S Operator: A/S Operator: N/S Operator:
Counter
Total production
Total rejection
Body label (presence)
Body label slanted (angle)
Shoulder label (presence)
Shoulder label slanted (angle)
Back label (presence)
Back label slanted (angle)
Underfills
Orientation
Cap
Taptone Throughput
Taptone - Rej 1
Labeller: 1 / 2 Date: M/S Operator: A/S Operator: N/S Operator:
Counter
Total production
Total rejection
Body label (presence)
Body label slanted (angle)
Shoulder label (presence)
Shoulder label slanted (angle)
Back label (presence)
Back label slanted (angle)
Underfills
Orientation
Cap
Taptone - Throughput
Taptone - Rej 1
Ref No: D.PK.R.024Version: AAIssued: 6 Nov 14Revised: 6 Dec 14
Production (22:00 -06:00) (Cut-off)
THE SOUTH AFRICAN BREWERIESROSSLYN BREWERY - LINE 2
05:45 Production (22:00 -06:00) (Cut-off)05:45 13:45 Production
(06:00 - 14:00) 21:45
LABELLER COUNTER RECORDING SHEET
05:45
Production (14:00-22:00)
05:45 13:45 Production (06:00 - 14:00) 21:45 Production
(14:00-22:00)

62
Appendix F: Rejects Data

DECJUL Wk 1 JUL Wk 2 JUL Wk 3 JUL Wk 4 JUL Wk 5 AUG Wk 1 AUG Wk 3 AUG Wk 4 SEP Wk 1 SEP Wk 2 SEP Wk 3 OCT Wk 1 OCT Wk 2 OCT Wk 3 OCT Wk 4 OCT Wk 5 NOV Wk 1 NOV Wk 2 NOV Wk 3 DEC Wk 1
Total Total Total Total Total Total Total Total Total Total Total Total Total Total Total Total Total Total Total TotalPFBI
Throughput [Containers Inspected] 3699605 3283924 3656700 3072578 3072578 3764662 1772911 2810681 4755245 5158196 4087428 5150978 5426481 6382412 5805519 6364357 6039819 1561561 1841148 6025806Underfills [Lowfills found] 4593 3682 3965 4998 4998 4823 1100 3274 3009 4845 5252 4237 3658 5344 4857 5654 3524 629 805 3038Missing caps [found] 2479 2064 2260 2390 2390 3520 1365 1426 4972 2570 2817 5874 6617 5686 6894 11261 5772 1676 2007 5856Burst related rejects 864 754 1137 537 537 785 762 19861 158606 3135 1110 2825 972 124027 35326 21913 33515 5114 5129 694TOTAL REJECTS 7936 6500 7362 7925 7925 9128 3227 24561 166587 10550 9179 12936 11247 135057 47077 38828 42811 7419 7941 9588
Labeller 1Throughput [Total Production] 1820736 1762213 2100194 2357644 2357644 2201541 949092 1251593 28196809 2464912 1914137 2548005 2925607 3304387 2817245 3166837 3002623 648818 963955 3065320Total rejection 17029 19451 14708 15886 15886 16123 5929 12813 210469 11794 21862 20635 23831 19682 23325 18631 17237 2447 3604 13716Body label (presence) 1228 1325 861 1287 1287 1236 477 727 17448 745 1655 1337 2148 3036 1700 2268 1749 69 156 1548Body label slanted (angle) 0 0 0 0 0 0 0 0 0 0 0 0 0 0 0 0 0 0 0 0Shoulder label (presence) 4408 5230 1693 4751 4751 2744 2001 4577 58278 3177 5339 5038 6312 3126 5274 2547 3517 501 627 1233Shoulder label slanted (angle) 0 0 0 0 0 0 0 0 0 0 0 0 0 0 0 0 0 0 0 0Back label (presence) 922 2321 701 3464 3464 1654 495 1066 23371 1270 2598 4247 2328 936 4529 1636 1613 247 282 908Back label slanted (angle) 0 0 0 0 0 0 0 0 0 0 0 0 0 0 0 0 0 0 0 0Underfills [Lowfills found] 3509 3363 3381 1992 1992 3612 1175 1218 41151 3729 4196 6973 5462 3414 7141 4020 4020 624 978 3886Orientation 1366 780 803 1213 1213 1166 371 667 13793 556 15854 815 825 32438 1209 1086 1357 306 551 1006Cap 0 0 0 0 0 0 0 0 0 0 0 0 0 0 0 0 0 0 0 0TOTAL REJECTS 11433 13019 7439 12707 12707 10412 4519 8255 154041 9477 29642 18410 17075 42950 19853 11557 12256 1747 2594 8581
Labeller 2Throughput [Total Production] 1919473 1809270 1966329 1058632 1058632 1834515 1824681 1237546 5067293 2303797 1719733 2307361 2705543 3116987 2523813 2993724 2804516 591172 877237 2880337Total rejection 15844 17508 9255 10661 10661 18364 7453 13393 18984 14951 17012 18187 16122 8703 19206 15089 15551 1730 3510 8067Body label (presence) 1606 2201 876 1199 1199 2314 1241 1190 2318 1420 1784 1385 37488 1538 1482 1382 1899 104 226 1055Body label slanted (angle) 0 0 0 0 0 0 0 0 0 0 0 0 0 0 0 0 0 0 0 0Shoulder label (presence) 2335 3442 1298 3704 3704 3785 980 4459 4371 2572 3053 3120 2627 2346 3387 4558 2662 183 394 2391Shoulder label slanted (angle) 0 0 0 0 0 0 0 0 0 0 0 0 0 0 0 0 0 0 0 0Back label (presence) 2735 1474 1215 2017 2017 2566 1380 628 2601 2065 1352 1882 1691 1231 2006 2285 1917 86 432 1270Back label slanted (angle) 0 0 0 0 0 0 0 0 0 0 0 0 0 0 0 0 0 0 0 0Underfills [Lowfills found] 3345 4675 1652 1537 1537 2875 1326 2487 3424 3095 3855 4252 2892 1637 4433 4840 2067 796 1212 1288Orientation 2039 2413 441 1339 1339 901 165 2208 2088 1943 2451 458 1234 418 495 944 767 246 289 668Cap 0 0 0 0 0 0 0 0 0 0 0 0 0 0 0 0 0 0 0 0TOTAL REJECTS 12060 14205 5482 9796 9796 12441 5092 10972 14802 11095 12495 11097 45932 7170 11803 14009 9312 1415 2553 6672
Taptone 1Throughput [Taptone pass] 1800593 1692092 2082852 2343998 2343998 2185404 944218 1238607 5774502 2451750 1892791 2528075 2819838 3284285 2794384 3147956 2984721 646500 959377 3049659Rejects [Taptone fail] 800 1080 1199 1021 1021 2541 269 499 3127 856 540 2172 1646 3150 2329 2118 2048 314 634 1973TOTAL REJECTS 800 1080 1199 1021 1021 2541 269 499 3127 856 540 2172 1646 3150 2329 2118 2048 314 634 1973
Taptone 2Throughput [Taptone pass] 1902706 1790983 1956763 1047691 1047691 1816034 817761 1223926 2456856 2289362 1703003 2288426 2688397 3106989 2503684 2978531 2788425 589204 873087 2870990Rejects [Taptone fail] 477 506 614 523 523 406 70 224 868 536 344 619 745 687 705 1394 2476 281 539 436TOTAL REJECTS 477 506 614 523 523 406 70 224 868 536 344 619 745 687 705 1394 2476 281 539 436
TOTAL REJECTS 32706 35310 22096 31972 31972 34928 13177 44511 339425 32514 52200 45234 76645 189014 81767 67906 68903 11176 14261 27250
AUG OCT NOVRejects
JUL SEP

63
Appendix G: One Point Lessons

No. 1
Are
a
P Q C D S M
Date Executed
Teacher
Co. number
Student
Co. number
Act
ual R
esul
tsONE POINT LESSON
Them
eC
lass
ifica
tion
REMOVING BOTTLES ON THE EDGE
De-palletiser bulk in-feed conveyers
Sam Ditalame Stefan Mare Denver
PeriannanLine 2 - Plastic Cutters Danielle du
Plssis
Date of Preparation
Team leaders Prepared ByOperators
2015-01-13
Basic Knowledge
Trouble Cases
Improvement Cases
After removing the plastic from the pallets, remove any bottles balancing on the edges of the layer boards. This will ensure that the bottles do not fall off the pallets and break while the bulk in-feed conveyer is moving. Return the bottles onto the line after the de-palletiser machine.
The full base of each bottle must be on the layer board
before the bulk-in feed conveyer moves

No. 2
Are
a
P Q C D S M
Date Executed
Teacher
Co. number
Student
Co. number
Sam Ditalame Stefan Mare Denver
PeriannanLine 2 - Plastic Cutters Danielle du
Plssis
Date of Preparation
Team leaders Prepared ByOperators
2015-01-13
Act
ual R
esul
tsONE POINT LESSON
Them
eC
lass
ifica
tion
SENDING PALLETS OF BOTTLES BACK TO RAW MATERIALS
De-palletiser bulk in-feed conveyers
Basic Knowledge
Trouble Cases
Improvement Cases
Before the plastic is removed from a pallet of bottles, inspect the pallet. If the pallet of bottles is damaged in any way or an excessive amount of bottles have fallen or broken, send the pallet back to raw materials and notify the team leader.
Do not remove the plastic from a pallet of bottles if it looks like this! Send the pallet back to raw
materials and notify the team leader.