Assemblages of animals around urban structures: testing hypotheses of patterns in sediments under...
12
Assemblages of animals around urban structures: testing hypotheses of patterns in sediments under boat-mooring pontoons M. Lindegarth * Centre for Research on Ecological Impacts of Coastal Cities, Marine Ecology Laboratories, A11, University of Sydney, NSW 2006, Australia Received 15 May 1999; received in revised form 1 December 1999; accepted 21 January 2000 Abstract Assemblages of animals in soft-sediments were studied in relation to pontoons for mooring private boats in two estuaries near Sydney, Australia. Based on previously observed patterns around other types of artificial structures, it was predicted that assemblages of animals under pontoons would be dierent from those in similar areas away from pontoons. Hypotheses about overall dierences in average abundance and composition between sites with and without pontoons were tested, as were hypotheses about variable dierences among and within estuaries. Analyses revealed that there were fewer crustaceans under pontoons in one estuary. The most conspicuous patterns related to pontoons were, however, dierences in variability among sites with pontoons compared to sites without pontoons. Dierences in spatial variability were found for the overall multivariate structure using Bray–Curtis dissim- ilarities and for abundances of most major taxa. Total abundance was approximately 60 times more variable among sites without pontoons and number of taxa were seven times more variable among sites with pontoons. Such patterns indicate that impacts of pontoons occur at some sites but not at others. This may be explained by intrinsic dierences among sites or by dierences in practices for maintenance. Predictions from these two contrasting models need to be tested in order to achieve ecient management of this type of structure. # 2001 Elsevier Science Ltd. All rights reserved. Keywords: Benthos; Environmental impact; Urban structure; Variability; Recreational waters; Australia Marine Environmental Research 51 (2001) 289–300 www.elsevier.com/locate/marenvrev 0141-1136/01/$ - see front matter # 2001 Elsevier Science Ltd. All rights reserved. PII: S0141-1136(00)00030-1 * Present address: Tja¨rno¨ Marine Biological Laboratory, S-452 96 Stro¨mstad, Sweden. Tel.: +61-2- 9351-4933; fax: +61-2-9351-6713. E-mail address: [email protected] (M. Lindegarth).
Transcript of Assemblages of animals around urban structures: testing hypotheses of patterns in sediments under...
Assemblages of animals around urbanstructures: testing hypotheses of patterns insediments under boat-mooring pontoons
M. Lindegarth *
Centre for Research on Ecological Impacts of Coastal Cities, Marine Ecology Laboratories, A11,
University of Sydney, NSW 2006, Australia
Received 15 May 1999; received in revised form 1 December 1999; accepted 21 January 2000
Abstract
Assemblages of animals in soft-sediments were studied in relation to pontoons for mooringprivate boats in two estuaries near Sydney, Australia. Based on previously observed patternsaround other types of arti®cial structures, it was predicted that assemblages of animals under
pontoons would be di�erent from those in similar areas away from pontoons. Hypothesesabout overall di�erences in average abundance and composition between sites with andwithout pontoons were tested, as were hypotheses about variable di�erences among and
within estuaries. Analyses revealed that there were fewer crustaceans under pontoons in oneestuary. The most conspicuous patterns related to pontoons were, however, di�erences invariability among sites with pontoons compared to sites without pontoons. Di�erences inspatial variability were found for the overall multivariate structure using Bray±Curtis dissim-
ilarities and for abundances of most major taxa. Total abundance was approximately 60 timesmore variable among sites without pontoons and number of taxa were seven times morevariable among sites with pontoons. Such patterns indicate that impacts of pontoons occur at
some sites but not at others. This may be explained by intrinsic di�erences among sites or bydi�erences in practices for maintenance. Predictions from these two contrasting models needto be tested in order to achieve e�cient management of this type of structure. # 2001 Elsevier
Science Ltd. All rights reserved.
Keywords: Benthos; Environmental impact; Urban structure; Variability; Recreational waters; Australia
Marine Environmental Research 51 (2001) 289±300
www.elsevier.com/locate/marenvrev
0141-1136/01/$ - see front matter # 2001 Elsevier Science Ltd. All rights reserved.
PI I : S0141-1136(00 )00030 -1
* Present address: TjaÈ rnoÈ Marine Biological Laboratory, S-452 96 StroÈ mstad, Sweden. Tel.: +61-2-
9351-4933; fax: +61-2-9351-6713.
E-mail address: [email protected] (M. Lindegarth).
1. Introduction
Human engineering and construction have locally modi®ed and destroyed sub-stantial portions of coastal and estuarine habitats around the world. In urbanizedparts of the estuaries around Sydney (Australia), virtually all of the intertidalshoreline is modi®ed and many di�erent structures have been added to these envir-onments (Centre for Research on Ecological Impacts of Coastal Cities, unpublisheddata). Many of these structures have been installed to facilitate commercial andrecreational boating. For example, piers, jetties, pilings and pontoons have becomenumerous components of many waterways around Sydney. Arti®cial structures havebeen found to a�ect biota in several ways. Changes in local hydrodynamic condi-tions may alter rates at which nutrients, organic material, larvae and spores(Fairweather, 1991) are transported, in addition to altering rates of sedimentationand erosion (e.g. Brown & McLachlan, 1990). Assemblages of animals on arti®cialstructures are often very di�erent from those of surrounding natural, rocky reefs(Butler & Connolly, 1996; Glasby, 1999). Thus, introduction of arti®cial structuresmay change local diversity of epibiota (Connell & Glasby, 1999; Karlson, 1978).Pontoons for mooring private boats are particular types of arti®cial structures(made of ®breglass or concrete and approximately 4�4 m). They are usuallyanchored to the bottom with a few pilings and connected to the shore with a walk-way. The pontoons are kept in the water during all seasons and are seldom cleanedfrom epibiota (T. Glasby, personal communication). Although little is known aboutpotential impacts of pontoons on surrounding benthic assemblages, regulatoryauthorities encourage the use of pontoons because they are believed not to sig-ni®cantly obstruct ¯ow of water and passage of ®sh (Anon., 1992). Because of theirincreasing use in estuaries around Sydney it is important to assess the potentiale�ects of pontoons on biota.In this study, I assess e�ects of these arti®cial structures on surrounding, benthic,
subtidal assemblages. It may be hypothesized that pontoons, like other arti®cialstructures, increase the levels of shading (Burdick & Short, 1999; Nelson &Mapstone,1998), sedimentation of detritus (Weston, 1990), abundance of predators by attracting®sh (Davis, Van Blaircom & Dayton, 1982) and levels of physical disturbancethrough the associated boating activities. If these or any other process have persistente�ects, it can be predicted that assemblages of animals in sediments under pontoonswill be di�erent from those in sites without pontoons. This is the general hypothesistested in this experiment. Furthermore, abundances of organisms and compositionof benthic assemblages, intensity of human disturbance and environmental conditionsoften vary among places (e.g. Gray & Christie, 1983; Morrisey, Howitt, Underwood& Stark, 1992). Therefore, I also tested hypotheses about di�erences in e�ectsamong places. This was done at two di�erent spatial scales. First, if pontoons causeimpacts in some estuaries but not in others, I predicted that di�erences betweenassemblages under pontoons and not under pontoons would not be the same in twolocations in separate estuaries. Second, if the impact of pontoons varied at a smallerspatial scale, I predicted that the variability among sites within locations would bedi�erent for sites with pontoons compared to those without pontoons.
290 M. Lindegarth /Marine Environmental Research 51 (2001) 289±300
2. Materials and methods
2.1. Sampling design and practical procedures
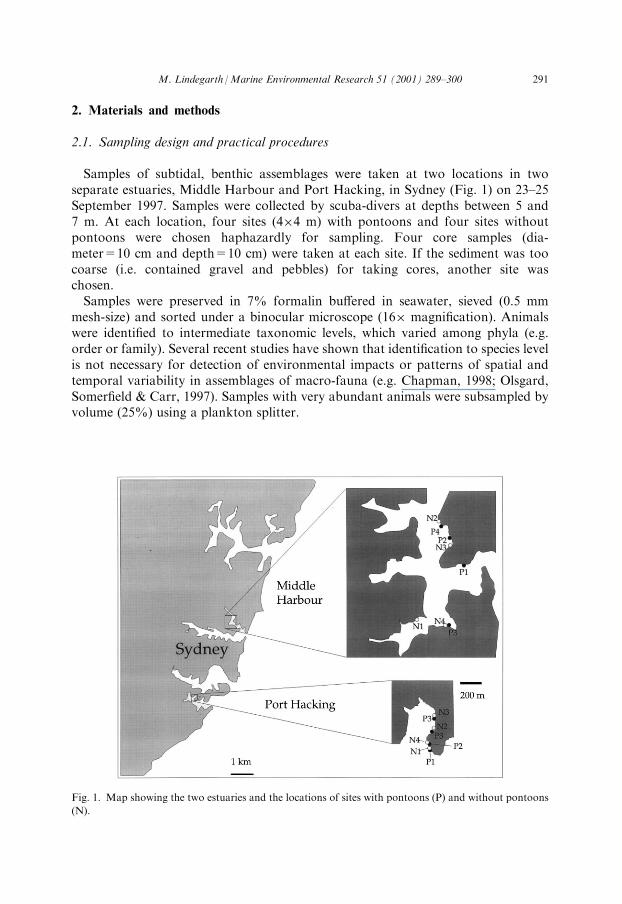
Samples of subtidal, benthic assemblages were taken at two locations in twoseparate estuaries, Middle Harbour and Port Hacking, in Sydney (Fig. 1) on 23±25September 1997. Samples were collected by scuba-divers at depths between 5 and7 m. At each location, four sites (4�4 m) with pontoons and four sites withoutpontoons were chosen haphazardly for sampling. Four core samples (dia-meter=10 cm and depth=10 cm) were taken at each site. If the sediment was toocoarse (i.e. contained gravel and pebbles) for taking cores, another site waschosen.Samples were preserved in 7% formalin bu�ered in seawater, sieved (0.5 mm
mesh-size) and sorted under a binocular microscope (16� magni®cation). Animalswere identi®ed to intermediate taxonomic levels, which varied among phyla (e.g.order or family). Several recent studies have shown that identi®cation to species levelis not necessary for detection of environmental impacts or patterns of spatial andtemporal variability in assemblages of macro-fauna (e.g. Chapman, 1998; Olsgard,Somer®eld & Carr, 1997). Samples with very abundant animals were subsampled byvolume (25%) using a plankton splitter.
Fig. 1. Map showing the two estuaries and the locations of sites with pontoons (P) and without pontoons
(N).
M. Lindegarth /Marine Environmental Research 51 (2001) 289±300 291
2.2. Analytical techniques
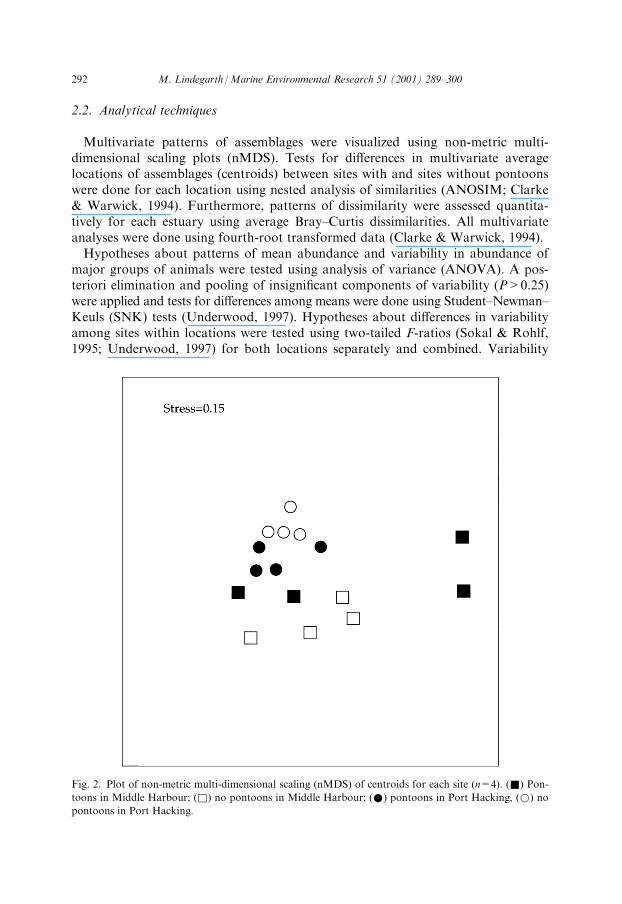
Multivariate patterns of assemblages were visualized using non-metric multi-dimensional scaling plots (nMDS). Tests for di�erences in multivariate averagelocations of assemblages (centroids) between sites with and sites without pontoonswere done for each location using nested analysis of similarities (ANOSIM; Clarke& Warwick, 1994). Furthermore, patterns of dissimilarity were assessed quantita-tively for each estuary using average Bray±Curtis dissimilarities. All multivariateanalyses were done using fourth-root transformed data (Clarke & Warwick, 1994).Hypotheses about patterns of mean abundance and variability in abundance of
major groups of animals were tested using analysis of variance (ANOVA). A pos-teriori elimination and pooling of insigni®cant components of variability (P>0.25)were applied and tests for di�erences among means were done using Student±Newman±Keuls (SNK) tests (Underwood, 1997). Hypotheses about di�erences in variabilityamong sites within locations were tested using two-tailed F-ratios (Sokal & Rohlf,1995; Underwood, 1997) for both locations separately and combined. Variability
Fig. 2. Plot of non-metric multi-dimensional scaling (nMDS) of centroids for each site (n=4). (&) Pon-
toons in Middle Harbour; (&) no pontoons in Middle Harbour; (*) pontoons in Port Hacking, (*) no
pontoons in Port Hacking.
292 M. Lindegarth /Marine Environmental Research 51 (2001) 289±300
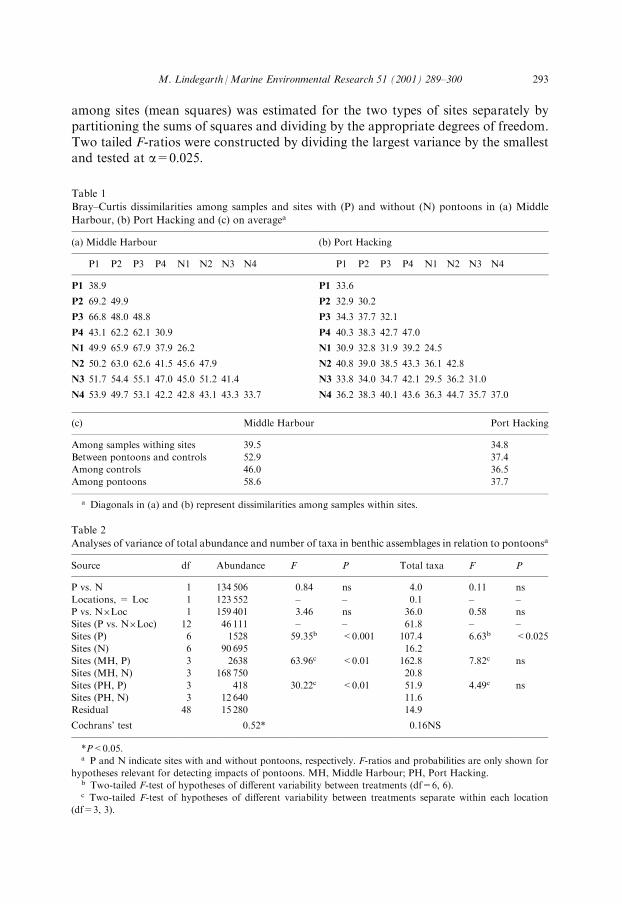
among sites (mean squares) was estimated for the two types of sites separately bypartitioning the sums of squares and dividing by the appropriate degrees of freedom.Two tailed F-ratios were constructed by dividing the largest variance by the smallestand tested at a=0.025.
Table 1
Bray±Curtis dissimilarities among samples and sites with (P) and without (N) pontoons in (a) Middle
Harbour, (b) Port Hacking and (c) on averagea
(a) Middle Harbour (b) Port Hacking
P1 P2 P3 P4 N1 N2 N3 N4 P1 P2 P3 P4 N1 N2 N3 N4
P1 38.9 P1 33.6
P2 69.2 49.9 P2 32.9 30.2
P3 66.8 48.0 48.8 P3 34.3 37.7 32.1
P4 43.1 62.2 62.1 30.9 P4 40.3 38.3 42.7 47.0
N1 49.9 65.9 67.9 37.9 26.2 N1 30.9 32.8 31.9 39.2 24.5
N2 50.2 63.0 62.6 41.5 45.6 47.9 N2 40.8 39.0 38.5 43.3 36.1 42.8
N3 51.7 54.4 55.1 47.0 45.0 51.2 41.4 N3 33.8 34.0 34.7 42.1 29.5 36.2 31.0
N4 53.9 49.7 53.1 42.2 42.8 43.1 43.3 33.7 N4 36.2 38.3 40.1 43.6 36.3 44.7 35.7 37.0
(c) Middle Harbour Port Hacking
Among samples withing sites 39.5 34.8
Between pontoons and controls 52.9 37.4
Among controls 46.0 36.5
Among pontoons 58.6 37.7
a Diagonals in (a) and (b) represent dissimilarities among samples within sites.
Table 2
Analyses of variance of total abundance and number of taxa in benthic assemblages in relation to pontoonsa
Source df Abundance F P Total taxa F P
P vs. N 1 134 506 0.84 ns 4.0 0.11 ns
Locations, = Loc 1 123 552 ± ± 0.1 ± ±
P vs. N�Loc 1 159 401 3.46 ns 36.0 0.58 ns
Sites (P vs. N�Loc) 12 46 111 ± ± 61.8 ± ±
Sites (P) 6 1528 59.35b <0.001 107.4 6.63b <0.025
Sites (N) 6 90 695 16.2
Sites (MH, P) 3 2638 63.96c <0.01 162.8 7.82c ns
Sites (MH, N) 3 168 750 20.8
Sites (PH, P) 3 418 30.22c <0.01 51.9 4.49c ns
Sites (PH, N) 3 12 640 11.6
Residual 48 15 280 14.9
Cochrans' test 0.52* 0.16NS
*P<0.05.a P and N indicate sites with and without pontoons, respectively. F-ratios and probabilities are only shown for
hypotheses relevant for detecting impacts of pontoons. MH, Middle Harbour; PH, Port Hacking.b Two-tailed F-test of hypotheses of di�erent variability between treatments (df=6, 6).c Two-tailed F-test of hypotheses of di�erent variability between treatments separate within each location
(df=3, 3).
M. Lindegarth /Marine Environmental Research 51 (2001) 289±300 293

3. Results
3.1. General observations
Approximately 12,500 individuals belonging to 55 taxa were identi®ed in thisexperiment. Forty per cent of the animals were crustaceans (mainly tanaids, amphi-pods, ostracods, anthurids and copepods). Thirty-®ve per cent were polychaetes(mainly spionids, syllids, cirratulids, ophelids and capitellids). Finally, oligochaetes,nemerteans and molluscs accounted for 18, 5 and 2% of the animals, respectively.
Fig. 3. Mean number of (a) total individuals and (b) number of taxa per core in Middle Harbour and
Port Hacking (mean�S.E., n=4). Shaded bars represent sites with pontoons.
294 M. Lindegarth /Marine Environmental Research 51 (2001) 289±300
3.2. Patterns of assemblages
nMDS plot suggested that assemblages in sites without pontoons were di�erentbetween the two locations (Fig. 2). Centroids of assemblages at sites with pontoons were,however, not signi®cantly di�erent from sites without pontoons using nested ANO-SIM (Middle Harbour:R=0.125, P=0.29 and Port HackingR=0.042, P=0.46).Consequently, Bray±Curtis dissimilarities between pairs of sites with and withoutpontoons were not larger than dissimilarities among sites of the same type (Table 1).The nMDS (Fig. 2) and Bray±Curtis dissimilarities (Table 1) suggest that the
assemblages were more variable among sites with pontoons than among sites withoutpontoons. Dissimilarities among sites with pontoons were substantially larger thanamong sites without pontoons in Middle Harbour (Table 1). Although, the patternswere less pronounced, the ranks of average dissimilarities were similar in Port Hacking.
3.3. Univariate patterns
Number of individuals and number of taxa were not di�erent between sites withor without pontoons in Middle Harbour or Port Hacking (P>0.05 for `P vs. N' and`Pvs. N � Loc' in Table 2). The abundance and number of taxa varied among sites(Fig. 3a,b). The variability in total abundance was signi®cantly larger among siteswithout pontoons than among sites with pontoons (Table 2). The patterns were sig-ni®cant and consistent in Middle Harbour and Port Hacking. The two-tailed F-ratiosindicate that variability in total number of individuals among sites without pontoonswere 64 and 30 times larger than among sites with pontoons for the two locations,respectively (Table 2). The number of taxa, on the other hand, was overall signi®cantlymore variable among sites with pontoons than among sites without pontoons (Table 2).
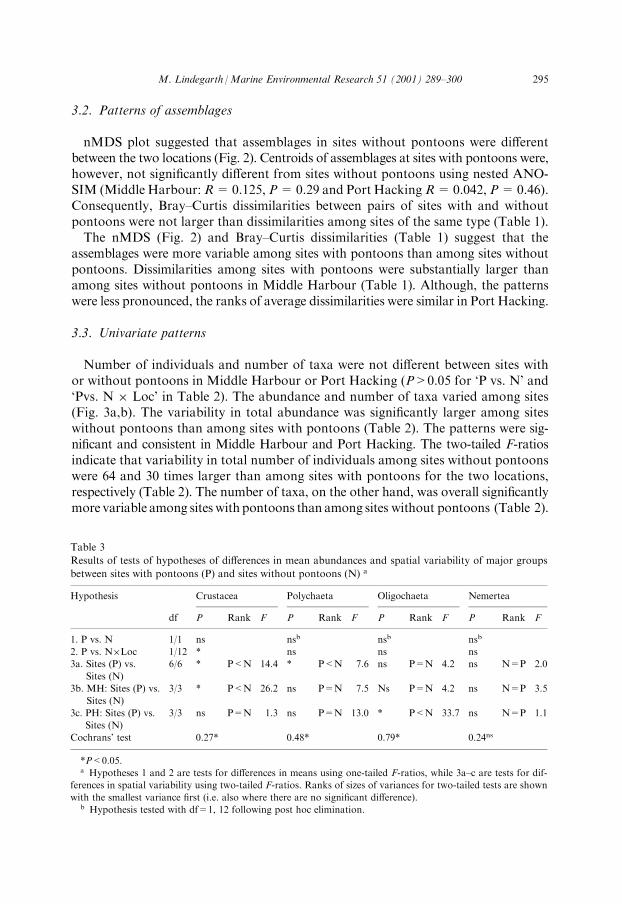
Table 3
Results of tests of hypotheses of di�erences in mean abundances and spatial variability of major groups
between sites with pontoons (P) and sites without pontoons (N) a
Hypothesis Crustacea Polychaeta Oligochaeta Nemertea
df P Rank F P Rank F P Rank F P Rank F
1. P vs. N 1/1 ns nsb nsb nsb
2. P vs. N�Loc 1/12 * ns ns ns
3a. Sites (P) vs.
Sites (N)
6/6 * P<N 14.4 * P<N 7.6 ns P=N 4.2 ns N=P 2.0
3b. MH: Sites (P) vs.
Sites (N)
3/3 * P<N 26.2 ns P=N 7.5 Ns P=N 4.2 ns N=P 3.5
3c. PH: Sites (P) vs.
Sites (N)
3/3 ns P=N 1.3 ns P=N 13.0 * P<N 33.7 ns N=P 1.1
Cochrans' test 0.27* 0.48* 0.79* 0.24ns
*P<0.05.a Hypotheses 1 and 2 are tests for di�erences in means using one-tailed F-ratios, while 3a±c are tests for dif-
ferences in spatial variability using two-tailed F-ratios. Ranks of sizes of variances for two-tailed tests are shown
with the smallest variance ®rst (i.e. also where there are no signi®cant di�erence).b Hypothesis tested with df=1, 12 following post hoc elimination.
M. Lindegarth /Marine Environmental Research 51 (2001) 289±300 295
Again patterns were consistent among locations. Variability in number of taxa waseight and four times larger among pontoons in Middle Harbour and Port Hacking,respectively, but these were not separately signi®cantly di�erent (Table 2).Analyses of the numbers of individuals of the most abundant groups revealed the
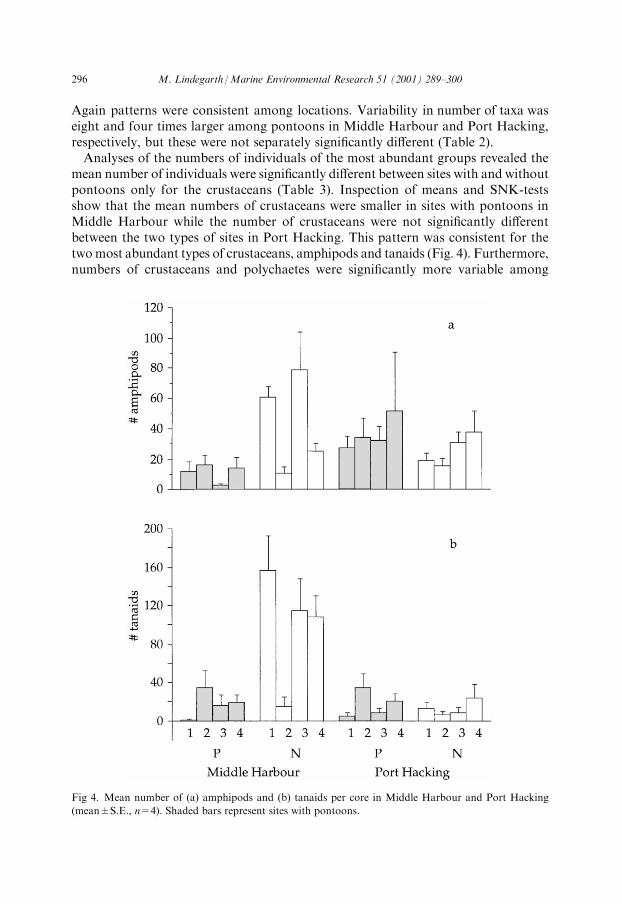
mean number of individuals were signi®cantly di�erent between sites with and withoutpontoons only for the crustaceans (Table 3). Inspection of means and SNK-testsshow that the mean numbers of crustaceans were smaller in sites with pontoons inMiddle Harbour while the number of crustaceans were not signi®cantly di�erentbetween the two types of sites in Port Hacking. This pattern was consistent for thetwomost abundant types of crustaceans, amphipods and tanaids (Fig. 4). Furthermore,numbers of crustaceans and polychaetes were signi®cantly more variable among
Fig 4. Mean number of (a) amphipods and (b) tanaids per core in Middle Harbour and Port Hacking
(mean�S.E., n=4). Shaded bars represent sites with pontoons.
296 M. Lindegarth /Marine Environmental Research 51 (2001) 289±300

sites without pontoons compared to sites with pontoons (Table 3). Variability wasnot signi®cantly di�erent between the two types of sites for the other major groups,oligochaetes and nemerteans (Table 3). It is, however, noteworthy that patterns ofvariability in Middle Harbour and Port Hacking were qualitatively similar for all ofthese groups. Variability was consistently larger among sites without pontoons forcrustaceans, polychaetes and oligochaetes. For nemerteans, in contrast, variabilitywas consistently larger among sites with pontoons (Table 3).Cochran's statistic was used to test for heterogeneous variances. Variances were
signi®cantly heterogeneous for some variables (Tables 2 and 3) and transformationsdid not generally remove heterogeneity. Heterogeneous variances can be proble-matic because the type 1 error may be larger than the speci®ed a (typically 0.05).ANOVA is, however, generally considered to be robust to such violations, especiallyin large experiments (i.e. total df>30, Underwood, 1997). To facilitate coherentinterpretation, all analyses were therefore done on untransformed data.
4. Discussion
4.1. Patterns of assemblages under pontoons
Two types of predictions about multi- and univariate patterns were tested in thisstudy. First it was predicted that macrofauna would, on average, di�er between siteswith and sites without pontoons. Such patterns were shown by abundances of crus-taceans in Middle Harbour. There were more crustaceans at sites without pontoons.Second it was predicted that variability among sites would be di�erent among siteswith and without pontoons. Bray±Curtis dissimilarities and number of taxa weremore variable among sites with pontoons in Middle Harbour. These patterns coin-cided with a decreased number of taxa at some sites with pontoons (Fig. 3b). Incontrast, the total number of individuals, crustaceans, polychaetes and oligochaeteswere less variable among sites with pontoons in at least one of the estuaries.The relative sizes of variances among sites with and among sites without pontoons
were qualitatively similar in Middle Harbour and Port Hacking for all of the sevenvariables investigated. The probability for this to happen by chance is less than onein one hundred (P= 0.57). This conclusion is not a�ected by the fact that somevariables showed heterogeneous variances. Conclusions about the ecological sig-ni®cance of observed patterns must be based also on the magnitude and consistencyof the observed patterns (e.g. Underwood, 1997; Weinberg, Caswell & Whitlatch,1986). Furthermore, mensurative experiments like these are primarily exploratory.Manipulative experiments and additional observations must be done to understandthe causes and generality of the observed patterns.
4.2. Causes of patterns
The magnitude of di�erences and the qualitatively consistent patterns of varia-bility in the two estuaries suggest that pontoons may have e�ects on various groups
M. Lindegarth /Marine Environmental Research 51 (2001) 289±300 297
of benthicmacro-fauna, but that e�ects di�er among sites. Two generalmodelsmay beproposed to explain the observed di�erences in variability: (1) pontoons cause impactsat some sites; and (2) some types of pontoons, or practices associated with their use,cause impacts while others do not. No attempts were made in this preliminary study tocharacterize sites or pontoons quantitatively. Because this study has identi®ed patternsin assemblages that are correlated with the presence of pontoons, it is now appropriateto develop speci®c models that can explain the observed patterns. For example,abundance and composition of assemblages of benthic animals vary in time and space,irrespective of whether they are disturbed by human activities or not (e.g. Morrisey etal., 1992; Thrush, 1991). Because di�erent species of animals are likely to respond dif-ferently to various types of disturbances (e.g. Jones & Kaly, 1996; Keough & Quinn,1991), it follows that impacts of a uniform disturbance are likely to di�er among places(Loehle, 1991). These results suggest that changes in variability may be powerful fordetecting environmental impacts under such conditions (Underwood, 1989, 1994;Warwick & Clarke, 1993 but see Chapman, Underwood & Skilleter, 1995).
4.3. Implications for management
Studies to detect potential environmental impacts are often preoccupied with testsof hypotheses about e�ects on average conditions. Because of natural variabilitysuch tests may be very insensitive (Glasby & Underwood, 1998; Peterson, 1993) andimpacts may actually occur only at some sites. For example, results here indicatethat in Middle Harbour the numbers of taxa were roughly 50% smaller in two siteswith pontoons (Fig. 3b) and abundances of crustaceans were several times larger insome sites without pontoons than at all sites with pontoons (Fig. 4). Thus, thesepatterns indicate substantial impacts in some sites, but because of large naturalvariability, changes in overall means are practically impossible to detect.E�cient managerial actions to avoid or mitigate impacts of pontoons on benthic
assemblages can only be designed if it is known whether some sites are particularlysensitive to these disturbances or if certain maintenance procedures are particularlydisturbing. If di�erences are mainly due to intrinsic di�erences among sites, morespeci®c criteria for selecting sites for installation of new pontoons appears to be themost e�cient measure to counteract these sorts of impacts. On the other hand, ifimpacts di�er because some procedures of maintenance are more environmentallydisturbing, these need to be identi®ed so that they can be eliminated. For purposesof management it appears that being able to distinguish between these two generalmodels is of fundamental importance.
Acknowledgements
The Centre for Research on Ecological Impacts of Coastal Cities and this workwas supported by an ARC Special Research Centre Grant. I thank A. J. Underwoodand T. Glasby for comments on earlier drafts of this work. P. Barnes, J. Cunning-ham and J. Harris assisted with ®eldwork and sorting.
298 M. Lindegarth /Marine Environmental Research 51 (2001) 289±300
References
Anon. (1992). Estuary management manual. New South Wales Government
Brown, A. C., & McLachlan, A. (1990). Ecology of sandy shores. Amsterdam: Elsevier Science Publishing
Company.
Burdick, D. M., & Short, F. T. (1999). The e�ects of boat docks on eelgrass beds in coastal waters of
Massachusetts. Env. Manage., 23, 231±240.
Butler, A. J., & Connolly, R. M. (1996). Development and long term dynamics of a fouling assemblage of
sessile invertebrates. Biofouling, 9, 187±209.
Chapman, M. G. (1998). Relationships between spatial patterns of benthic assemblages in a mangrove
forest using di�erent levels of taxonomic resolution. Mar. Ecol. Prog. Ser., 162, 71±78.
Chapman, M. G., Underwood, A. J., & Skilleter, G. A. (1995). Variability at di�erent spatial scales
between a subtidal assemblage exposed to the discharge of sewage and two control assemblages. J. Exp.
Mar. Biol. Ecol., 189, 1±2.
Clarke, K. R., & Warwick, R. M. (1994). Change in marine communities: an approach to statistical analysis
and interpretation. UK: Natural Environment Research Council.
Connell, S. D., & Glasby, T. M. (1999). Do urban structures in¯uence local abundance and diversity of
subtidal epibiota A case study from Sydney Harbour, Australia? Mar. Env. Res., 47, 373±387.
Davis, N., VanBlaircom, G. R., & Dayton, P. K. (1982). Man-made structures on marine sediments:
e�ects on adjacent benthic communities. Mar. Biol., 70, 294±303.
Fairweather, P. G. (1991). Implications of `supply-side' ecology for environmental assessment and man-
agement. Trends. Ecol. Evol., 6, 60±63.
Glasby, T. M. (1999). Di�erences between subtidal epibiota on pier pilings and rocky reefs at marinas in
Sydney, Australia. Estuar. Coast. Mar. Sci., 48, 281±290.
Glasby, T. M., & Underwood, A. J. (1998). Determining positions for control locations in environmental
studies of estuarine marinas. Mar. Ecol. Prog. Ser., 171, 1±14.
Gray, J. S., & Christie, H. (1983). Predicting long-term changes in marine benthic communities. Mar.
Ecol. Prog. Ser., 13, 87±94.
Jones, G. P., & Kaly, U. L. (1996). Criteria for selecting marine organisms in biomonitoring studies. In
R. J. Schmitt, & C. Osenberg, Detecting ecological impacts: concepts and applications in coastal habitats
(pp. 29±48). San Diego: Academic Press.
Karlson, R. (1978). Predation and space utilization patterns in a marine epifaunal community. J. Exp.
Mar. Biol. Ecol., 31, 225±239.
Keough, M. J., & Quinn, G. P. (1991). Causality and the choice of measurements for detecting impacts in
marine environments. Aust. J. Mar. Freshwater Res., 42, 539±554.
Loehle, C. (1991). Managing and monitoring ecosystems in the face of heterogeneity. In J. Kolasa, & S. T.
Pickett, Ecological heterogeneity (pp. 144±159). New York: Springer-Verlag.
Morrisey, D. J., Howitt, L., Underwood, A. J., & Stark, J. S. (1992). Spatial variation in soft-sediment
benthos. Mar. Ecol. Prog. Ser., 81, 197±204.
Nelson, V. M., & Mapstone, B. D. (1998). A review of environmental impact monitoring of pontoon instal-
lations in the Great Barrier Reef Marine Park. Technical Report No. 13. Townsville: CRC Reef
Research Centre
Olsgard, F., Somer®eld, P. J., & Carr, M. R. (1997). Relationships between taxonomic resolution and
data transformations in analyses along an established pollution gradient. Mar. Ecol. Prog. Ser., 149,
173±181.
Peterson, C. H. (1993). Improvement of environmental impact analysis by application of principles
derived from manipulative ecology: lessons from coastal marine case histories. Aust. J. Ecol., 18, 21±
52.
Sokal, R. R., & Rohlf, F. J. (1995). Biometry. New York: Freeman and Company.
Thrush, S. F. (1991). Spatial patterns in soft-bottom communities. Trends. Ecol. Evol., 6, 75±79.
Underwood, A. J. (1989). The analysis of stress in natural populations. Biol. J. Linn. Soc., 37, 51±78.
Underwood, A. J. (1994). Spatial and temporal problems with monitoring. In P. Calow, & G. E. Petts,
The rivers handbook (pp. 101±123). Oxford: Blackwell Scienti®c Publications.
M. Lindegarth /Marine Environmental Research 51 (2001) 289±300 299

Underwood, A. J. (1997). Experiments in ecology Ð their logical design and interpretation using analysis of
variance. Cambridge: Cambridge University Press.
Warwick, R. M., & Clarke, K. R. (1993). Increased variability as a symptom of stress in marine commu-
nities. J. Exp. Mar. Biol. Ecol., 172, 215±226.
Weinberg, J. R., Caswell, H., & Whitlatch, R. B. (1986). Demographic importance of ecological interac-
tions: how much do statistics tell us? Mar. Biol., 93, 305±310.
Weston, D. P. (1990). Quantitative examination of macrobenthic community changes along an organic
enrichment gradient. Mar. Ecol. Prog. Ser., 61, 233±244.
300 M. Lindegarth /Marine Environmental Research 51 (2001) 289±300