Testing Repeated Measures Hypotheses When Covariance Matrices are Heterogeneous: Revisiting the...
23
s 1 Testing Repeated Measures Effect Testing Repeated Measures Hypotheses When Covariance Matrices Are Heterogeneous: Revisiting The Robustness of the Welch-James Test Again by H.J. Keselman 1 University of Manitoba James Algina University of Florida Rand R. Wilcox University of Southern California and Rhonda K. Kowalchuk University of Manitoba Authors Note: The research reported in this paper was supported by the National Science and Engineering Research Council of Canada and the Social Sciences and Humanities Research Council of Canada.
-
Upload
independent -
Category
Documents
-
view
0 -
download
0
Transcript of Testing Repeated Measures Hypotheses When Covariance Matrices are Heterogeneous: Revisiting the...

s 1Testing Repeated Measures Effect
Testing Repeated Measures Hypotheses When Covariance Matrices Are Heterogeneous:
Revisiting The Robustness of the Welch-James Test Again
by
H.J. Keselman1
University of Manitoba
James Algina
University of Florida
Rand R. Wilcox
University of Southern California
and
Rhonda K. Kowalchuk
University of Manitoba
Authors Note: The research reported in this paper was supported by the National
Science and Engineering Research Council of Canada and the Social Sciences and
Humanities Research Council of Canada.

s 2Testing Repeated Measures Effect
Abstract
The Welch (1947, 1951)-James (1951, 1954) and Improved General
Approximation (Huynh, 1978) tests were examined in between-subjects within-‚
subjects repeated measures designs for their rates of Type I error when data were
nonnormal, nonspherical and heterogeneous, when group sizes were unequal as well. The
tests were computed with either least squares or robust estimators of central tendency and
variability and assessed with critical values that were obtained either theoretically or
through a bootsrapping method. Prior findings indicated that one could only obtain a
robust test of the interaction effect with the Welch-James procedure when sample sizes
were very large. Our results indicate that a robust test of the interaction effect can be
obtained with reasonable sample sizes when the Welch-James test is computed with
trimmed means and Winsorized covariance matrices.

s 3Testing Repeated Measures Effect
Testing Repeated Measures Hypotheses When Covariance Matrices Are Heterogeneous:
Revisiting The Robustness of the Welch-James Test Again
Algina and Keselman (1997) recommended that researchers use the Welch (1947,
1951)-James (1951, 1954) (WJ) multivariate procedure to test main and interaction effect
hypotheses in between within-subjects repeated measures designs when data are‚
nonnormal and do not conform to the multisample sphericity assumptions, particularly
when the design is unbalanced (i.e., between-subjects group sizes are unequal). They also
noted that the sample size recommendations given by Keselman, Carriere and Lix (1993)
to achieve robustness to assumption violations hold for the larger repeated measures
designs they investigated (i.e., 6 4 and 6 8) when examining the main effect, but‚ ‚
needed to be much larger for the interaction test than the values suggested by Keselman
et al. Indeed, according to Algina and Keselman, the sample size required to achieve a
robust test of the interaction effect might be much larger (e.g., > 300) than researchers are
likely to have available to them. Accordingly, they recommended that Huynh's (1978)
Improved General Approximation (IGA) test could be applied in situations where the WJ
test could not.
Subsequently, Keselman, Kowalchuk, Algina, Lix, and Wilcox (in press)
demonstrated that in 3 4 and 3 8 designs one could obtain a robust main and‚ ‚
interaction test of repeated measures hypotheses with the WJ test, as well as the IGA test,
with much smaller sample sizes (e.g., 60) when robust measures of central tendency and
variability were substituted for the usual least squares estimators in these test statistics.
For the designs they investigated, these authors also found that rates of Type I error were
frequently conservative when the critical values for these robust statistics were obtained
through a bootstrapping method. However, since these tests tend to have larger
interaction rates of error in the larger designs investigated by Algina and Keselman
(1997), obtaining critical values through bootstrapping methods might prove beneficial
when effects are examined in larger designs.
s 4Testing Repeated Measures Effect
Therefore, the focus of our investigation was to compare the IGA and WJ tests
when they were each based on either least squares or robust estimators of central
tendency and variability and when critical values were based on theoretical values or
through a bootstrapping method. Specifically, we intended to see whether the results
reported by Keselman et al. (in press) would hold for the 6 4 and 6 8 repeated‚ ‚
measures designs investigated by Algina and Keselman (1997). It is important to check
the robustness of these procedures, and most particularly the WJ test, because Algina and
Keselman found the more powerful WJ test required very large sample sizes to provide a
robust test of the interaction effect, sample sizes not likely to be available to researchers
in a typical investigation.
Test Statistics
The simplest of the higher-order repeated measures designs involves a single
between-subjects factor and a single within-subjects factor, in which subjects (i 1, œ á
, n , n N) are selected randomly for each level of the between-subjects factor (j 1, j jD œ œ
á œ , J) and observed and measured under all levels of the within-subjects factor (k 1,
á , K). In this design, the repeated measures data are modeled by assuming that the
random vectors (Y Y Y ) are normal and independently distributedYij ij ij2 ijkœ "wá
within each level j, with common mean vector and where we allow , j j .. D Dj j jÁ w Á w
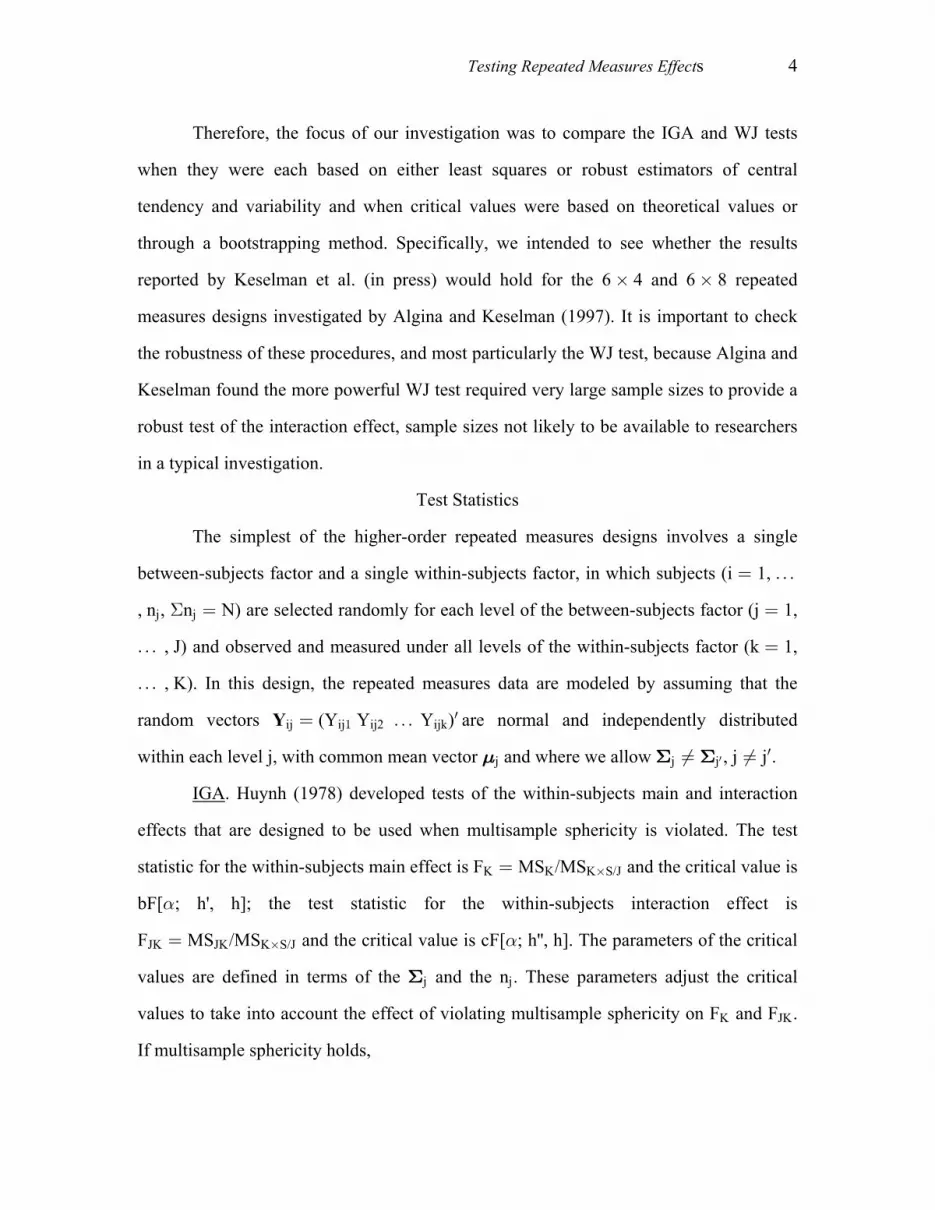
IGA. Huynh (1978) developed tests of the within-subjects main and interaction
effects that are designed to be used when multisample sphericity is violated. The test
statistic for the within-subjects main effect is and the critical value isFK K K S/Jœ MS /MS ‚
bF[ ; h', h]; the test statistic for the within-subjects interaction effect is!
FJK JK K S/Jœ MS /MS ‚ and the critical value is cF[ ; h'', h]. The parameters of the critical!
values are defined in terms of the and the n . These parameters adjust the criticalDj j
values to take into account the effect of violating multisample sphericity on F and F .K JK
If multisample sphericity holds,

s 5Testing Repeated Measures Effect
bF[ ; h', h] F [ ; (K 1), (N J)(K 1)] and! !œ
cF[ ; h'', h] F [ ; (J 1)(K 1), (N J)(K 1)]. (1)! !œ
Estimates of the parameters (c, b, h, h and h ), and the correction due to Lecoutrew ww
(1991), are presented in Algina (1994) and Keselman and Algina (1996). A SAS/IML
(SAS Institute, 1989) program is also available for computing this test in any repeated
measures design (see Algina, 1997).
WJ. Suppose that we wish to test the hypothesis:
H : = (2)0 C 0.
where = ( , , ) , = ( , , ) , j = 1, , J, and is a full rank contrast. . . .1 J j j1 jKw w w wá á á. . C
matrix of dimension r JK. Then an approximate df multivariate Welch (Welch, 1947,‚
1951)-James (James, 1951, 1954)-type statistic according to Johansen (1980) and
Keselman et al. (1993) is
T = ( ) ( ) ( ) , (3)WJ C Y C S C C Y w w "
where = ( , , ) , with E ( ) = , and the sample covariance matrix of is =Y Y Y Y Y S á
w w1 J
w .
diag( /n , , /n ), where is the sample variance-covariance matrix of the j-thS S S1 1 J J já
grouping factor. T /c is distributed, approximately, as an F variable with df f = r, andWJ 1
f = r(r + 2)/(3A), and c is given by r 2A 6A /(r 2), with2
A = [tr { ( ) } { tr ( ( ) )} ] / (n 1) . (4)12
j 1
Jj j j!
œ
w w " # w w " #S C CS C C Q S C CS C C Q
The matrix is a block diagonal matrix of dimension JK JK, corresponding to the j-thQj ‚
group. The (s,t)-th block of = if s = t = j and is otherwise. In order to obtain theQ I 0j K K‚

s 6Testing Repeated Measures Effect
main and interaction tests with the WJ procedure let be a [(K 1) K] contrastCK 1w ‚
matrix and let be similarly defined. A test of the main effect can be obtained byCJ 1
letting , where is the (j 1) unit vector and denotes the KroneckerC 1 C 1œ Œ ‚ ŒJ K 1 J
product. The contrast matrix for a test of the interaction effect is . LixC C Cœ ŒJ 1 K 1
and Keselman (1995) present a SAS/IML (SAS Institute, 1989) program that can be used
to compute the WJ test for any repeated measures design that does not contain
quantitative covariates nor has missing values.
Robust Estimation
While a wide range of robust estimators have been proposed in the literature (see
Gross, 1976), the trimmed mean and Winsorized (co)variance are intuitively appealing
because of their computational simplicity and good theoretical properties (Wilcox, 1995a,
1998). The standard error of the trimmed mean is less affected by departures from
normality than the usual mean because extreme observations, that is, observations in the
tails of a distribution, are censored or removed. Furthermore, as Gross (1976) noted, “the
Winsorized variance is a consistent estimator of the variance of the corresponding
trimmed mean" (p. 410). In computing the Winsorized (co)variance, the most extreme
observations are replaced with less extreme values in the distribution of scores.
The first step in computing robust estimators within the context of repeated
measures designs is to Winsorize the observations. For our design, WinsorizationJ K‚
must be performed for every level of the two factors. That is, for fixed and , Winsorizej k
the observations , i 1, , n and repeat this process for Yijk œ á j j 1, , J and k 1, œ á œ
á œ , K Let g [ n ] be the desired amount of trimming where [ n ] is the greatest. j j# # 4
integer less than or equal to n ; we shall set .2. The Winsorized values are given by # #j œ
X if if
if .
ijk g jk ijk g jk
ijk g jk ijk g
g g
œ ] ] Ÿ ]
œ ] ] ] ]
œ ] ] ]
( 1) ( 1)
( 1) (n )
(n ) i (n )
4 4
4 4
4 4
45
45 45 45
4
4 4

s 7Testing Repeated Measures Effect
A choice for the amount of trimming, must be made. Efficiency (achieving a#,
relatively small standard error) is one approach to this problem. If is too small,#
efficiency can be poor when sampling from a heavy-tailed distribution. If is too large,#
efficiency is poor when sampling from a normal distribution. A good compromise is
# œ .2 because efficiency is good when sampling from a normal distribution and little
power is lost as compared with using means ( 0) (e.g., Rosenberger & Gasko, 1983;# œ
Wilcox, 1995). In terms of computing confidence intervals and controlling Type I error
probabilities, theory tells us that problems associated with means decrease as the amount
of trimming increases (Wilcox, 1994a, 1994b). The improvement can be substantial as #
increases from 0 to .2, but for .2 the benefits of trimming are less dramatic versus#
using .2. Huber (1981) argues that in practice, using .1 is “dangerous.” One# #œ
reason is that with the mean we run the risk of relatively high standard errors, and thus
low power. Of course, situations arise where .2 yields a smaller standard error versus#
# #œ œ.2, but the improvement is typically small. In contrast, using .2 offers a
substantial improvement over .1 or 0 in many cases. For these reasons, .2 is assumed# œ
henceforth when referring to the trimmed mean.
Now, for every j there is a K K Winsorized covariance matrix that must be‚
estimated. The estimated Winsorized covariance between the th and th levels of them l
within-subjects factor is, for fixed j, estimated with
s476 œ1
n 14 (Y Y )(Y Y ), (5)
_ _!3œ"
8
347 Þ47 346 Þ46
4
where Y Y /n , is the Winsorized sample mean for the th level of the between-_Þ47 347 4
3œ ! j
subjects factor and the th level of the within-subjects factor. For fixed , letm j
S S4 476 4[ [œ ‚(s ). That is, estimates the K K Winsorized covariance matrix for the thj
level of factor J.

s 8Testing Repeated Measures Effect
In our study therefore, we applied the robust estimators to the IGA and WJ
procedures. For example, with the WJ procedure hypotheses about the repeated measures
main and interaction effects can now be expressed as
H : , (6)! >C 0. œ
where is a vector of population means. Let .> trimmed
S S S[ œ â diag[(n 1) /[h (h 1)] (n 1) /[h (h 1)]] be a block diagonal4 [ 4 4 [1 J J JJ
matrix, where h . For each and , let Y be the trimmed mean based on_
4 >45œ 8 14 42 j k
Y , , Y . That is,145 8 45á4
Y (7)_>45 œ
"8 14 42 Y ,!
3œ1 "
8 1
3 44
4 4
( ) k
where Y(1) (2) ( )45 45 8 45 4Ÿ Ÿ á ŸY Y are the n values in the th treatment group written4
jk
in ascending order.
Accordingly, the WJ statistic is
T = ( ) ( ) ( ) , (8)WJ> C Y C S C C Y > [ >
w w "
where = ( , , ) and A is now defined asY Y Y>
áw w>
w11 JKt
A [tr { ( ) } +{ tr ( ( ) )} ] / (h 1) . (9)œ 12
1!j
jœ
Nw w " # w w " #
4 4S C CS C C Q S C CS C C Q[ [ [ [
Bootstrapping
Rather than approximate the null distribution of IGA and T with an F> >WJ
distribution, a percentile-t bootstrap estimate of the critical value can be used instead.
That is, Westfall and Young's (1993) results suggest that Type I error control could be

s 9Testing Repeated Measures Effect
improved by combining bootstrap methods with methods based on trimmed means. The
asymptotic results provided by Hall and Padmanabhan (1992) support this conjecture and
the results of Wilcox (1997a) provide empirical support. Additional asymptotic results
supporting the use of the percentile- bootstrap stem from general conditions where it ist
second-order accurate, as opposed to only first-order accurate as is obtained with
standard asymptotic methods (see, e.g., Hall, 1986). Roughly, this means that when the
goal is to have the probability of a Type I error equal alpha, its error in achieving this
goal goes to zero at the rate 1/n, in contrast to standard asymptotic methods where the
error goes to zero at the rate of 1/(n) "# Þ
For a fixed value of randomly sample, with replacement, n rows of4 4
observations from the matrix
Ô ×Õ Ø
Y , , Y
Y , , Y
1 1 1
1
4 4O
8 4 8 O
á
ãá
Þ
4 4j
Label the results
Ô ×Õ Ø
Y , , Y
Y , , Y.
‡ ‡4 4O
‡ ‡8 4 8 O
1 1 1
1
á
ãá
4 4j
Next, set C Y Y . That is, shift the bootstrap samples so that, in effect, the345 >45‡345œ
bootstrap sample is obtained from a distribution for which the null hypothesis of equal
trimmed means is true. Next compute T (or IGA ), the value of the statistic T (or‡> > >WJ
*WJ
IGA ) (based on the C values). Repeat this process times yielding T , 1 , , .> 345‡,B B, œ á
Let T T be the values written in ascending order and set‡ ‡ ‡F(1) (2) ( )Ÿ X Ÿ á Ÿ B
[ (1 ) ]. Then an estimate of an appropriate critical value is T . That is, reject7 œ ! B ‡(m)
the null hypothesis if T (or IGA ) T . Wilcox (1997a) suggests setting at 599.WJ (m)> >‡ B
Results from Hall (1986) suggest that it may be advantageous to chose such that 1B !

s 10Testing Repeated Measures Effect
is a multiple of ( 1) . B -1 (For more details about the percentile-t bootstrap method, see
Efron & Tibshirani, 1993.)
Methods of the Simulation
The IGA and WJ approaches for testing repeated measures main and interaction
effect hypotheses were examined under many of the conditions investigated by Algina
and Keselman (1997). As indicated, the purpose of the present investigation was to
determine whether one could obtain robust tests of the main, and particularly the
interaction effect, in 6 4 and 6 8 repeated measures designs, when using the WJ and‚ ‚
IGA tests with robust estimators (with either theoretical or bootstapped critical values)
for sample sizes that researchers could realistically obtain in applied research settings.
For unbalanced designs containing one between-subjects and one within-subjects
factor, there were three and six and four and eight levels of these factors, respectively.
Like Algina and Keselman (1997), we varied selected combinations of five factors which
included: (a) the shape of the population distributionn from which data were obtained, (b)
the degree of sample size imbalance, (c) the degree of covariance heterogeneity across
the between-subjects grouping variable, (d) the value of nonsphericity, and (e) the value
of the minimum group size in relation to the number of repeated measurements minus
one n /t.(min)
Rates of Type I error were collected when the simulated data were obtained from
multivariate normal or multivariate nonnormal distributions. The algorithm for
generating the multivariate normal data can be found in Keselman et al. (1993). The
nonnormal distribution was a multivariate lognormal distribution with marginal
distributions based on Y exp(X ) (i 1, , n ) where X is distributed as N(0,ijk ijk j ijkœ œ á
.25); this distribution has skewness ( ) and kurtosis ( ) values of 1.75 and 5.90,# #1 2
respectively. The procedure for generating the multivariate lognormal data is based on
Johnson, Ramberg, and Wang (1982) and is presented in Algina and Oshima (1994, pp.

s 11Testing Repeated Measures Effect
154-155). Lognormal data were centered around the appropriate mean before between-
group heteroscedasticity was created. When least squares methods were used, the data
were centered around the population expected values; when trimmed mean methods were
used the data were centered around theoretically determined population trimmed means
based on 20% symmetric trimming (See Wilcox, 1997b, p. 19). This particular type of
nonnormal distribution was selected since applied data, particularly in the behavioral
sciences, typically have skewed distributions (Micceri, 1989; Wilcox, 1994b).
Furthermore, Sawilowsky and Blair (1992) found in their Monte Carlo investigation of
the two independent sample t test that only distributions with extreme degrees of
skewness (e.g., 1.64) affected Type I error control. In addition, Algina and Oshima#1 œ
(1995) found that tests for mean equality are affected when distributions are lognormal
and homogeneity assumptions are not satisfied. Thus, we felt that our approach to
modeling skewed data would adequately reflect conditions in which the tests might not
perform optimally.
The test statistics were investigated when the number of observations across
groups were unequal. According to the results presented by Keselman et al. (1998),
repeated measures designs with unequal group sizes are very common. Total sample size
was based on the findings provided by Wilcox (1995b) and Algina and Keselman (1997).
First, Wilcox recommends that groups should contain at least 20 observations when data
are to be trimmed. Second, we wanted to obtain a robust test of the interaction effect (the
main effect as well) with sample sizes that were considerably smaller than those
necessary to achieve robustness with least squares estimators as reported by Algina and
Keselman. For various values of N, both a moderate and substantial degree of group size
inequality were typically investigated. (See Table 1 for an enumeration of the sample
sizes used in our study.)

s 12Testing Repeated Measures Effect
Unequal between-subjects covariance matrices were investigated. In particular,
the matrices were multiples of one another, namely , and orD D D D1 2 3 23 35œ œ"
D D D D1 2 3 25 59œ œ" , and . These degrees and type of covariance heterogeneity were
selected because Keselman and Keselman (1990) found that, of the conditions they
investigated, they resulted in the greatest discrepancies between the empirical and
nominal rates of Type I error and, therefore, were conditions under which the effects of
covariance heterogeneity could readily be examined; furthermore, these same conditions
were investigated by Algina and Keselman (1997). The unequal covariance matrices
were always negatively paired with the groups sizes, because this combination typically
results in liberal rates of Type I error.
Another issue considered in the current investigation was nonsphericity. In our
investigation the sphericity index was set at 0.75 or 0.57. When 1.0, sphericity is% %œ œ
satisfied and for the J K design the lower bound of 1/(K 1). The covariance‚ œ %
matrices for each value of investigated can be found in Keselman and Keselman (1990).%
Type I error rates were estimated with 1,000 replications per investigated
condition. (The reader should remember that for each iteration of the 1000 replications
599 bootstrap samples were generated.)
Results
Like Algina and Keselman (1997), we evaluated the particular conditions under
which a test was insensitive to assumption violations using Bradley's (1978) liberal
criterion of robustness. According to this criterion, in order for a test to be considered
robust, its empirical rate of Type I error ( ) must be contained in the interval 0.5! !s
Ÿ Ÿs! !1.5 . Therefore, for the five percent level of significance used in this study, a
test was considered robust in a particular condition if its empirical rate of Type I error fell
within the interval .025 .075. Correspondingly, a test was considered to beŸ Ÿs!
nonrobust if, for a particular condition, its Type I error rate was not contained in this

s 13Testing Repeated Measures Effect
interval. In the tables, boldfaced entries are used to denote these latter values. We chose
this criterion since we feel that it provides a reasonable standard by which to judge
robustness. That is, in our opinion, applied researchers should be comfortable working
with a procedure that controls the rate of Type I error within these bounds, if the
procedure limits the rate across a wide range of assumption violation conditions.
Nonetheless, there is no one universal standard by which tests are judged to be robust, so
different interpretations of the results are possible.
Our first step was to see whether the Type I error rates for the IGA and WJ
procedures were better controlled when critical values were determined through our
bootstrapping method. Our analysis indicated that though main effect rates of error were
generally similar to the rates when critical values were theoretically determined, the rates
for the interaction effect (particularly for WJ) were generally conservative compared to
those found when critical values were determined in the usual manner. Accordingly, we
do not table nor discuss further results based on bootstapping.
Main Effect
Table 1 contains empirical rates of Type I error for the WJ and IGA tests when
they were based on least squares (LS) and robust estimators (RE) of central tendency and
variability. Most evident from Table 1 is that all rates were well controlled. However,
though no single rate exceeded Bradley's (1978) criterion, the WJ(RE) rates were, with
two exceptions, below the nominal .05 level of statistical significance while the WJ(LS)
rates were, with three exceptions, above the .05 value.
Interaction Effect
Table 2 also contains empirical rates of Type I error for the WJ and IGA tests
when they were based on least squares (LS) and robust estimators (RE) of central
tendency and variability, however, these rates pertain to the test of the interaction effect.
The WJ(LS) rates were, not surprisingly, liberal with two exceptions, attaining values as
large as 17%. These results were expected because Algina and Keselman (1997) have

s 14Testing Repeated Measures Effect
shown that sample sizes need to be substantially larger (N 300) in order to obtain a
robust test of the inteaction effect when data are nonspherical, heterogeneous, and
nonnormal when group sizes are unequal. On the other hand, the WJ(RE) rates, with two
exceptions (8.8% and 7.90%), were very well controlled, resulting in nonliberal rates that
ranged from 3.6% to 7.1%. The two liberal values suggest that trimming with a sample
size of less than 22 [2 (20, 30, 47) and 2 (12, 18, 28)] in large designs can lead to‚ ‚
problems whereas a minor increase to 22 [2 (22, 33, 51)] does not. IGA values, both‚
IGA(LS) and IGA(RE), were always well controlled.
Discussion
The purpose of our investigation was to determine whether one could, with
sample sizes substantially smaller than those recommended by Algina and Keselman
(1997), obtain a robust test of repeated measures main and interaction effects in 6 4‚
and 6 8 designs when using trimmed means and Winsorized covariance matrices with‚
the Welch (1947, 1951)-James (1951, 1954) test. To this end, like Algina and Keselman,
we varied the distributional form of the data, the degree of nonsphericity, the extent of
covariance heterogeneity, the ratio of the minimum sample size to the number of repeated
measurements (minus 1) and the degree of sample size imbalance.
Our results replicated the findings of Algina and Keselman (1997) and as well
offered researchers a more viable alternative for testing effects in repeated measures
designs. First, like Algina and Keselman, we found that the WJ and IGA tests were able
to provide robust tests of the main effect when based on least squares estimators with
relatively modest sample sizes. That is, according to Keselman et al. (1993) and Algina
and Keselman, in order to obtain a robust WJ test, the ratio of the smallest group size
[n ] to the number of repeated measurements minus one [(K 1)] could beÐ738Ñ
approximately 2 to 1 (the n /t ratio ranged from 1.33 to 2.00 in the two studies) when(min)
testing the main effect for normally distributed data. For nonnormal data, the ratio is
approximately 5 to 1 (the n /t ratio ranged from 1.33 to 4.67 in the two studies).(min)

s 15Testing Repeated Measures Effect
However, to obtain a robust test of the interaction effect, this ratio has to be much larger,
either approximately 5 to 1 (the n /t ratio ranged from 3.33 to 4.86 in the two studies)(min)
when data are normally distributed or as large as approximately 14 to 1 (the n /t ratio(min)
ranged from 6.57 to 14 in the two studies) for nonnormally distributed data.
On the other hand, our results indicate that researchers can now obtain a robust
test of effects, main as well as interaction, with the WJ test when the test is based onboth
robust estimators of central tendency and variability, namely, trimmed means and
Winsorized covariance matrices, with reasonably sized samples (n 22). The readerÐ738Ñ œ
should remember that for the WJ test based on robust estimators the size of the smallest
sample is most crucial in determining whether the procedure will be robust. Our results
suggest in larger designs (6 8) that the smallest of the group sizes should contain 22‚
subjects and for smaller designs (i.e., 6 4) this value can be even smaller (14). It is‚
important to note that our data tables are incomplete, incomplete from the perspective
that not all combinations of conditions were examined (e.g., 3 8; LN; ,‚ œD D1 23"
D D3 253œ œ; .57). We purposively chose not to examine all combinations of the%
investigated variables because previous findings (Algina & Keselman, 1997; Keselman et
al., 1993) indicate that rates of error tend to be more discrepant from the level of
significance for larger designs, larger disparities between covariance matrices, and larger
values of nonsphericity. That is, the results were satisfactory with more extreme
combinations of conditions (e.g., 6 8; LN; , and ; .57).‚ œ œ œD D D D1 2 3 25 59" %
Having no less than 22 observations in a group is a larger size than what
Keselman et al. (1993) and Algina and Keselman (1997) report as necessary to obtain a
robust main effect test with least squares means. However, when designing a research
investigation researchers will choose a sample size that would guard against biases due to
their data not conforming to derivational assumptions across all effects to be investigated,
that is, for both interaction effects as well as main effects. Accordingly, if robust

s 16Testing Repeated Measures Effect
measures of location and variability are to be used, the minimum sample size per group
based upon our findings and those suggested by Wilcox (1995b) should be 22.
To conclude, it is also important to note that Huynh's (1978) IGA test was found
to be robust with both least squares and robust estimators, a finding that is consistent with
other results (see Algina & Keselman, 1997; Keselman et al., in press). Accordingly, it is
a viable alternative to the analysis of effects in repeated measures designs. Nonetheless,
we continue to recommend WJ since Algina and Keselman (1998) found that it was
typically substantially more powerful to detect repeated measures effects compared to the
IGA procedure.
As a postscript the reader should know that testing hypotheses with
heterogeneous test statistics with robust estimators has been demonstrated to be a viable
approach to data analysis in many other contexts (see e.g., Keselman, Kowalchuk & Lix,
1998; Lix & Keselman, 1998; Wilcox, Keselman, & Kowalchuk,1998)

s 17Testing Repeated Measures Effect
References
Algina, J. (1994). Some alternative approximate tests for a split plot design.
Multivariate Behavioral Research 29, , 365-384.
Algina, J. (1997). Generalization of Improved General Approximation tests to split-
plot designs with multiple between-subjects factors and/or multiple within-subjects
factors. , , 243-252.British Journal of Mathematical and Statistical Psychology 50
Algina, J., & Keselman, H. J. (1997). Testing repeated measures hypotheses when
covariances are heterogeneous: Revisiting the robustness of the Welch-James test.
Multivariate Behavioral Research 32, , 255-274..
Algina, J., & Keselman, H. J. (1998). A power comparison of the Welch-James and
Improved General Approximation tests in the split-plot design. Journal of Educational
and Behavioral Statistics 23, , 152-169.
Algina, J., & Oshima, T. C. (1994). Type I error rates for Huynh's general
approximation and improved general approximation tests. British Journal of
Mathematical and Statistical Psychology 47, , 151-165.
Algina, J., & Oshima, T. C. (1995). An Improved General Approximation test for the
main effect in a split plot design. British Journal of Mathematical and Statistical
Psychology 48, , 149-160.
Bradley, J.V. (1978). Robustness? British Journal of Mathematical and Statistical
Psychology 31, , 144-152.
Efron, B., & Tibshirani, R. J. (1993). . New York:An introduction to the bootstrap
Chapman & Hall.
Gross, A. M. (1976). Confidence interval robustness with long tailed symmetric
distributions. , , 409-416.Journal of the American Statistical Association 71
Hall, P. (1986). On the number of bootstrap simulations required to construct a
confidence interval. , , 1431-1452.Annals of Statistics 14

s 18Testing Repeated Measures Effect
Hall, P., & Padmanabhan, A. R. (1992). On the bootstrap and the trimmed mean.
Journal of Multivariate Analysis 41, , 132-153.
Huber, P.J. (1981). . New York: Wiley.Robust statistics
Huynh, H. (1978). Some approximate tests for repeated measurement designs.
Psychometrika 43, , 161-175.
James, G. S. (1951). The comparison of several groups of observations when the
ratios of the population variances are unknown. , , 324-329.Biometrika 38
James, G. S. (1954). Tests of linear hypotheses in univariate and multivariate analysis
when the ratios of the population variances are unknown. , , 19-43.Biometrika 41
Johansen, S. (1980). The Welch-James approximation of the distribution of the
residual sum of squares in weighted linear regression. , , 85-92. Biometrika 67
Johnson, M. F., Ramberg, J. S., & Wang, C. (1982). The Johnson translation system
in Monte Carlo studies. , ,Communications in Statistics-Simulation and Computation 11
521-525.
Keselman, H. J., & Algina, J. (1996). The analysis of higher-order repeated measures
designs. In , ed. B. Thompson,Advances in Social Science Methodology, Volume 4
Greenwich, Conneticuit: JAI Press, (pp. 45-70).
Keselman, H. J., Carriere, K. C., & Lix, L. M. (1993). Testing repeated measures
hypotheses when covariance matrices are heterogeneous. Journal of Educational
Statistics 18, , 305-319.
Keselman, H. J., Huberty, C. J., Lix, L. M., Olejnik, S., Cribbie, R. A., Donahue, B.,
Kowalchuk, R. K., Lowman, L. L., Petoskey, M. D., Keselman, J. C., & Levin, J. R.
(1998). Statistical practices of Educational Researchers: An analysis of their ANOVA,
MANOVA and ANCOVA analyses. , , 350-386.Review of Educational Research 68(3)
Keselman, H. J., Kowalchuk, R. K., & Lix, L. M. (1998). Robust nonorthogonal
analyses revisited: An update based on trimmed means. , , 145-163.Psychometrika 63
s 19Testing Repeated Measures Effect
Keselman, H.J., Kowalchuk, R.K., Algina, J., Lix, L.M., & Wilcox, R.R. (in press).
Testing treatment effects in repeated measures designs: Trimmed means and
bootstrapping. .British Journal of Mathematical and Statistical Psychology
Keselman, J.C., & Keselman, H.J. (1990). Analysing unbalanced repeated measures
designs. , , 265-282.British Journal of Mathematical and Statistical Psychology 43
Lecoutre, B. (1991). A correction for the approximate test in repeated measures%µ
designs with two or more independent groups. , , 371-Journal of Educational Statistics 16
372.
Lix, L. M., & Keselman, H. J. (1995). Approximate degrees of freedom tests: A
unified perspective on testing for mean equality. , , 547-560.Psychological Bulletin 117
Lix, L. M., & Keselman, H. J. (1998). To trim or not to trim: Tests of location
equality under heteroscedasticity and nonnormality. Educational and Psychological
Measurement 58, , 409-429.
Micceri, T. (1989). The unicorn, the normal curve, and other improbable creatures.
Psychological Bulletin 105, , 156-166.
Rosenberger, J. L., & Gasko, M. (1983). Comparing location estimators: Trimmed
means, medians, and trimean. In D. Hoaglin, F. Mosteller & J. Tukey (Eds.)
Understanding robust and exploratory data analysis, pp. 297-336. New York: Wiley.
SAS Institute. (1989). . Cary,SAS/IML sowtware: Usage and reference, Version 6
NC: Author.
Sawilowsky, S.S., & Blair, R.C. (1992). A more realistic look at the robustness and
Type II error probabilities of the test to departures from population normality.>
Psychological Bulletin 111, , 352-360.
Welch, B. L. (1947). The generalization of Students' problems when several different
population variances are involved. , , 28-35.Biometrika 34
Welch, B. L. (1951). On the comparison of several mean values: An alternative
approach. , , 330-336.Biometrika 38

s 20Testing Repeated Measures Effect
Westfall, P. H., & Young, S. S. (1993). . NewResampling-based multiple testing
York: Wiley.
Wilcox, R. R. (1994a). A one-way random effects model for trimmed means.
Psychometrika 59, , 289-306.
Wilcox, R. R. (1994b). Some results on the Tukey-McLaughlin and Yuen methods
for trimmed means when distributions are skewed. , , 259-273.Biometrical Journal 36
Wilcox, R. R. (1995a). ANOVA: A paradigm for low power and misleading
measures of effect size? , , 51-77.Review of Educational Research 65(1)
Wilcox, R. R. (1995b). Three multiple comparison procedures for trimmed means.
Biometrical Journal 37, , 643-656.
Wilcox, R. R. (1997a). Pairwise comparisons using trimmed means or M-estimators
when working with dependent groups. , , 677-688.Biometrical Journal 39
Wilcox, R. R. (1997b). . NewIntroduction to robust estimation and hypothesis testing
York: Academic Press.
Wilcox, R.R. (1998). The goals and strategies of robust methods. British Journal of
Mathematical and Statistical Psychology 51, , 1-39.
Wilcox, R. R., Keselman, H. J., & Kowalchuk, R. K. (1998). Can tests for treatment
group equality be improved?: The bootstrap and trimmed means conjecture. British
Journal of Mathematical and Statistical Psychology 51, , 123-134.

Table 1. Empirical Rates of Type I Error (Main Effect)
Pop Design nj n(min)/t Ej (,) WJ(LS) WJ(RE) IGA(LS) IGA(RE)
N 6 x 4 2 x (12, 15, 18) 4.00 5:3:1 (.75) 5.60 5.20 5.20 5.60
N 6 x 4 2 x (12, 18, 28) 4.00 5:3:1 (.75) 5.20 4.00 5.10 5.20
N 6 x 4 2 x (12, 18, 28) 4.00 9:5:1 (.75) 4.70 4.00 5.90 4.90
N 6 x 4 2 x (12, 18, 28) 4.00 9:5:1 (.57) 4.70 4.50 5.50 5.20
N 6 x 8 2 x (20, 30, 47) 2.86 5:3:1(.75) 6.10 4.40 5.70 4.50
N 6 x 8 2 x (22, 33, 51) 3.14 5:3:1 (.75) 4.00 2.90 5.20 4.40
N 6 x 8 2 x (22, 33, 51) 3.14 9:5:1 (.75) 6.40 5.40 6.40 6.40
N 6 x 8 2 x (22, 33, 51) 3.14 9:5:1 (.57) 5.10 2.90 4.60 4.20
LN 3 x 8 32, 48, 74 4.57 5:3:1 (.75) 6.40 4.00 4.30 5.70
LN 3 x 8 32, 48, 74 4.57 5:3:1 (.57) 6.90 3.00 3.50 4.40
LN 6 x 4 2 x (12, 18, 28) 4.00 5:3:1 (.75) 5.10 3.60 5.20 4.60
LN 6 x 4 2 x (12, 18, 28) 4.00 9:5:1 (.75) 5.10 3.80 3.60 3.40
LN 6 x 4 2 x (12, 18, 28) 4.00 9:5:1 (.57) 5.80 3.50 5.70 4.70
LN 6 x 4 2 x (14, 21, 33) 4.67 9:5:1 (.57) 6.20 4.00 5.20 3.90
LN 6 x 8 2 x (20, 30, 47) 2.86 5:3:1 (.75) 5 80 2.70 5.60 3.70
LN 6 x 8 2 x (22, 33, 51) 3.14 9:5:1 (.75) 7.20 4.70 5.90 6.00
LN 6 x 8 2 x (22, 33, 51) 3.14 9:5:1 (.57) 5.80 3.20 4.00 3.00
LN 6 x 8 2 x (32, 48, 74) 4.57 5:3:1 (.75) 5.90 3.60 4.70 5.00
LN 6 x 8 2 x (32, 48, 74) 4.57 9:5:1 (.75) 6.80 3.50 3.60 4.10
LN 6 x 8 2 x (32, 48, 74) 4.57 9:5:1 (.57) 7.10 3.70 5.00 4.90
Note: Pop-Population shape (N-Normal, LN-Lognormal); LS-Least squares; RE- Robust estimators.

Table 2. Empirical Rates of Type I Error (Interaction Effect)
Pop Design nj n(min)/t Ej (,) WJ(LS) WJ(RE) IGA(LS) IGA(RE)
N 6 x 4 2 x (12, 15, 18) 4.00 5:3:1 (.75) 8.30 5.70 4.80 3.40
N 6 x 4 2 x (12, 18, 28) 4.00 5:3:1 (.75) 6.40 5.70 4.10 4.30
N 6 x 4 2 x (12, 18, 28) 4.00 9:5:1 (.75) 7.70 6.40 4.90 5.20
N 6 x 4 2 x (12, 18, 28) 4.00 9:5:1 (.57) 7.50 7.10 5.20 4.50
N 6 x 8 2 x (20, 30, 47) 2.86 5:3:1(.75) 11.00 8.80 4.40 3.40
N 6 x 8 2 x (22, 33, 51) 3.14 5:3:1 (.75) 9.90 6.30 4.10 2.90
N 6 x 8 2 x (22, 33, 51) 3.14 9:5:1 (.75) 10.30 6.60 5.40 4.10
N 6 x 8 2 x (22, 33, 51) 3.14 9:5:1 (.57) 10.10 7.00 3.90 2.70
LN 3 x 8 32, 48, 74 4.57 5:3:1 (.75) 6.70 4.30 5.10 5.70
LN 3 x 8 32, 48, 74 4.57 5:3:1 (.57) 9.20 4.10 4.10 3.00
LN 6 x 4 2 x (12, 18, 28) 4.00 5:3:1 (.75) 7.50 4.60 3.30 3.40
LN 6 x 4 2 x (12, 18, 28) 4.00 9:5:1 (.75) 10.20 5.40 3.70 2.90
LN 6 x 4 2 x (12, 18, 28) 4.00 9:5:1 (.57) 12.10 7.90 4.30 5.00
LN 6 x 4 2 x (14, 21, 33) 4.67 9:5:1 (.57) 10.10 6.50 4.50 4.00
LN 6 x 8 2 x (20, 30, 47) 2.86 5:3:1 (.75) 16.10 6.10 3.10 2.40
LN 6 x 8 2 x (22, 33, 51) 3.14 9:5:1 (.75) 15.00 5.50 4.10 3.40
LN 6 x 8 2 x (22, 33, 51) 3.14 9:5:1 (.57) 17.30 6.40 2.10 3.10
LN 6 x 8 2 x (32, 48, 74) 4.57 5:3:1 (.75) 9.90 4.10 4.00 4.50
LN 6 x 8 2 x (32, 48, 74) 4.57 9:5:1 (.75) 9.30 3.60 2.60 2.90
LN 6 x 8 2 x (32, 48, 74) 4.57 9:5:1 (.57) 14.00 4.60 3.90 3.70
Note:Pop-Population shape (N-Normal, LN-Lognormal); LS-Least squares; RE- Robust estimators.