Evaluation of the Fetal Heart at 14 – 18 Weeks Gestation in ...
1
Technology-task coupling: Exploring social media use and managerial perceptions of e-government
Mary K. Feeney Associate Professor School of Public Affairs Arizona State University 411 Central Ave Phoenix, AZ. 85004 [email protected]
Eric W. Welch Professor School of Public Affairs Arizona State University 411 Central Ave Phoenix, AZ. 85004 [email protected]

2
Technology-task coupling: Exploring social media use and managerial perceptions of e-government Abstract: Social media comprises a set of new technologies that enable richer data exchange in
highly decentralized, dynamic, and loosely structured, versatile virtual environments. Social
media technology is expected to enhance participation, learning, and knowledge production in
government settings, aligning traditional structural and authority boundaries while also
challenging them. We examine the extent to which local governments in the U.S. are coupling
social media technology with two types of participative tasks: collaborative work inside the
organization and participative interaction with external stakeholders. We also explore how these
two technology-task couples are associated with perceptions of the positive and negative
outcomes of technology use. We use survey data from five departments – community
development, finance, police, mayor’s office and parks and recreation – in 500 U.S. cities.
Respondents were asked to identify the social media technologies that they use and the kinds of
activities for which each identified technology is used, resulting in a set of technology-task
couples. Findings show that social media and their use for specific tasks have limited impact on
either positive or negative perceived outcomes. These non-findings may demonstrate that the
implementation cost of the technologies outweighs the benefits they realize; that the technology-
task application substitutes for traditional approaches to the same task, but no effect is incurred;
or that these technologies are relatively new to local governments and efforts to effectively
utilize them for internal work tasks and external engagement are in their infancy.
Keywords: Social Media, local government, technology, management
3
Technology-task coupling: Exploring social media use and managerial perceptions of e-government
Introduction
Social media tools, online tools that are designed for interaction between two or more
parties, are pervasive in modern society, from the driver on a cell phone to the student texting in
class, from the Facebook updates at a political event to the Twitter messages that follow a
terrorist attack. Rich and poor, young and old, and everyone in between use social media tools.
Some people jump at the opportunity to utilize these technologies, with their promise of speed,
efficiency, clarity, and the ability to connect more of us across space and time. Others are more
hesitant to adopt social media tools, worried about the Whale and the Reactor (Winner, 1989),
the dangers of technology, the threat that technology will further divide people and eliminate
face-to-face interactions, and electronic activity is a surrender of privacy. Some adopters use
these new tools for purposes of communicating with their friends, others are integrating social
media into the work place, private companies like Amazon and Google are using it to track and
anticipate consumer needs, and still others are seeking to engage stakeholders or clients to
disseminate information, integrate feedback into decision making, and invigorate democratic
processes.
We are facing a new age of technology with the promise of Web 2.0 technologies, and
many of the fears associated with the use of technology in governments are similar to the fears
articulated when we shifted from pen and paper to computer, from filing cabinet to digital
databases, from stopping in to talk to a government official to calling on the phone to eventually
sending an email. Governments adopting technological changes can enable residents to submit
service claims via 311 (a non-emergency hot-line or online service now available in many major
US cities), pay parking tickets online, reserve park facilities online, renew a driver’s license

4
online, and more. While there are some uniform changes that are occurring with technology
adoption, technology adopters are embedded in different social and work contexts in which
technology use is explored and adapted. And while there are always challenges when shifting to
new technologies, Web 2.0 is somewhat different in that it enables a significant change in the
potential interactivity schemas with which people work.
The promises of new technologies including social media are well-recognized -
increasing cost effectiveness of services, improving service delivery, and increasing participation
of external groups (Mergel 2010). Nevertheless there are potential limitations of new media, for
example distracting researchers from work, threatening privacy, raising expectations beyond
what is possible, or increasing management complexity (Author Cite). Social media comes with
additional challenges including managing interactions, privacy, security, data management,
accessibility and inclusion, and general governance issues (Bertot, Jaeger, & Hansen 2012). The
interactive nature of social media, and that it often takes place on third party platforms, increases
the challenges facing the appropriate use and management of these technologies. Social media
comprises a set of new technologies—including Twitter and Facebook, but others as well — that
enable richer data exchange in highly decentralized, dynamic, and loosely structured, versatile
virtual environments (Parameswaran & Whinston, 2007). Social media technology is expected to
generate ‘‘cultures of participation’’ marked by collaborative production in ways that enhance
participation, learning, and knowledge production (Fischer, 2009; Fischer & Ostwald, 2002;
Hagel, Seely Brown, & Davison, 2009). In some cases the use of social media technologies may
align with traditional structural and authority boundaries, in other cases they may challenge
them.

5
A good deal of current research in the e-government and information and
communications technology (ICT) literatures has focused on how many technologies
governments are using, the adoption of website and intranets, the prevalence of Facebook and
Twitter accounts and how those accounts are being used, and the prevalence of e-services and if
those services are reducing costs and improving service delivery. While the prevalence of ICTs
is an important component of understanding their use, it tells us little about how these
technologies are changing the ways in which local government officials are working and how
local government managers perceive the outcomes of these technologies. This research is
interested in understanding what social media and interactive technologies local governments are
using, how governments and managers are using those technologies, and how managers perceive
the outcomes of those technology-task couplings. Specifically, are managers using ICTs and
social media to improve internal work efficiencies? Are they using these technologies to enhance
participation and communication with external actors? We examine the extent to which local
U.S. governments are coupling social media technology with two types of participative tasks:
collaborative work inside the organization and participative interaction with external
stakeholders. We also explore how these different types of technology-task couples are
associated with manager perceptions of the positive and negative outcomes of ICTs.
We take advantage of survey data examining the use of technology in five departments –
community development, finance, police, mayor’s office and parks and recreation – in municipal
governments that range in population from 25,000 to 250,000. The survey asked a set of
questions where respondents identified the types of social media technologies that they use and
then how they use each technology. We then match these responses on technology type and
technology use to crease “technology-task couples”. We then investigate how these technology-

6
task couples are related to perceived outcomes, while controlling for organizational context and
environment. Findings show that social media and their use for specific tasks have very limited
impact on either positive or negative perceived outcomes. These non-findings may demonstrate
that the implementation cost of the technologies outweighs the benefits they realize; that the
technology-task application substitutes for traditional approaches to the same task, but is
unrelated to perceptions of the effectiveness of those technologies; or that these technologies are
relatively new to local governments and efforts to effectively utilize them are in their infancy.
Literature and Hypotheses
Socio-technical systems theory recognizes that the development, adoption, adaptation of
technology by organizations happens within a social context. The theory notes that it is
impossible to consider technology without considering the human dimension; that the technical
system and the social system are fundamentally intertwined (Kling & Scacchi 1982; Trist &
Bamforth 1951; Bostrom & Heinen 1977). The social system is concerned with the attributes of
people including skills, values, and attitudes, while the technical system considers the tasks,
technologies, and processes that manipulate inputs to form outputs (Bostrom & Heinen 1977).
Although this prior work is well-known, most studies have either primarily considered the
technical dimensions of social media or they have considered the use of the technology to be a
discrete phenomenon, divorced from the various ways in which organizations may use
technology (Kaplan and Haenlein 2010; Kietzmann et al. 2011; Kietzmann et al. 2012). But we
contend that social media technology is malleable and government managers and employees
make decisions about how they prefer to employ it for work purposes. There is a human-
technology interface that needs to be better integrated into our understanding of e-government.

7
Social media technologies are primarily defined by their interactive nature (Bertot et al.
2012). Whether we are considering web-based interactive technologies such as blogs and wikis,
tools for sharing information and files like YouTube and Flickr, interactive communication tools
such as text messaging, Googletalk, or WhatsApp, or social networking tools like Facebook,
these tools are interactive (Hansen et al 2011) and share the characteristic of being designed to
enable users to communicate with one another or the broader community (Porter 2008). They are
“social” in that they occur in a social environment and everyday users interact with one another
to develop content (Porter 2008). Unlike previous technologies adopted by governments, social
media bring the added challenge of managing, responding to, and working with the interactive
and user-generated nature of the tools (Bertot et al 2012).
Government agencies have been consistently challenged by the fact that they are
designed as institutions to effectively address categorically defined issues, but are not well
designed to address cross-cutting, complex problems that require multiple sources of expertise
and input (Provan & Kenis 2008). Bureaus are often siloed in ways that constrain collaboration
across offices. Additionally, observers have often lamented that the bureaucracy is insufficiently
democratic; citizens and stakeholder organizations that make up civil society are perceived to
have inadequate access to decision making and are ineffectively informed about the inner
workings, decisions, and decision outcomes of government (Dunleavy et al., 2006; Evans & Yen
2006). This general nature of government makes it ill-equipped to respond to the changing nature
of communication and interaction that social media tools bring.
On the other hand, social media and other interactive technologies are often viewed as
means by which actors can span institutional boundaries and engage people with different
experiences, perspectives, and professions in ways that address modern problems. With social

8
media technologies at their disposal, public managers and employees have the opportunity to
interact with citizens and external stakeholders or work collaboratively on internal government
projects, in new ways. Research indicates that there are a number of opportunities for social
media to be used in government including creating records and disseminating information and
communicating with the public and increasingly governments are acknowledging the ways that
social media technologies can enable them to reach more individuals, disseminate information,
engage the public, and increase participatory decision-making (Hanson 2008; Jaeger et al 2010;
Snyder 2009; Wyld 2008). Of course, there are challenges with using social medial technologies
to engage the public, including a lack of access for people with limited technological means
(Bertot et al 2010l Jaeger et al 2009).
There is a push for governments to adopt more social media tools, with the promise of
increasing efficiency, participation, and transparency. In some cases, this push is from private
actors (e.g. Google America), in other cases from citizens who want more data about what
government is doing and a more interactive experience with their government. There are
increasing calls for the use of social media to address national and local priorities (Pirolli et al.
2010). Bertot and colleagues (2010) contend that social media tools can enable increased
democratic participation and engagement, co-production (governments and public working
together to improve service delivery and quality), and crowdsourcing solutions to public
problems. But there is less discussion of the real or potential negative outcomes of these
technologies. Additionally, while the use of social media is increasing at the federal level (Bertot
et al 2010; Bertot et al. 2012), there has been little investigation of social media tools at the
municipal level, both what social media tools managers are using and how they are using them.
Thus, our first research question is what social media technologies are being used by municipal
9
departments/managers? Second, how are managers/departments coupling technologies with
tasks? Specifically, are municipal managers/departments using social media technologies for
internal work collaborations, to facilitate participation with external stakeholders, or both?
Our second research interest is how using these social media technologies for particular
tasks (technology-task couplings) are or are not related to perceived outcomes of the
technologies. While there is a great deal of rhetoric about the ways in which social media can
help to improve government efficiencies, effectiveness, and communication (Hoover 2012; Finn
2014), we know little about variation among social media tools, or how some tools might be
better suited for some work activities and not others. Moreover, we do not know how the use of
social media tools shapes municipal managers perceptions of technology outcomes. As
previously noted, it is not clear that public managers perceive new technologies as improving
government outcomes (AUTHOR CITE). Simply employing a new technology does not
necessarily lead to a ‘good’ outcome. In fact, technology use could result in negative outcomes.
It is possible that social media technologies make it easier for government to communicate with
citizens and residents, enable agencies to share information and deliver services more effectively
than ever before, and provide services that are accessible to all citizens. Some argue that social
media will enable the public to better communicate and interact with government, others hope
that it will make government transparent, while others envision a more open, efficient
government system (Bertot et al. 2010; Bertot et al. 2012; Mergel 2010, 2011).
While there is much promise from technology, there remain challenges and threats,
including citizens’ concerns about privacy and security and government managers’ concerns
about increasing workloads. Social media use in government requires management. And while
communicating with the public can be faster through social media, when all government

10
employees are using social media, an organization might have trouble managing communications
or ensuring that all communications are truthful, consistent, and accurate. For example, one
manager in our study notes “The anonymous blogs and forums have a detrimental effect on local
government and generally discourage local governments from getting into social networking and
other forms of web based communication. There really is no incentive to make more [social
media] available.” Another respondent writes that, “Utilizing social media to increase and
improve our city's meaningful interaction with the public is challenging when also needing to
comply with state laws regarding public access and records.” And still others note that adopting
social media can be costly, requiring technical and financial resources, and that these are new
tasks for many organizations. For example, one manager reports, “Social media networks are
becoming an increasingly important tool to communicate with and market to our users. This is
uncharted territory for a public agency.”
While there is research investigating public demands for social media and public
perceptions of technology use in government, there is little research focusing on the managerial
perspective. This research is primarily concerned with social media use from the perspective of
municipal government managers. How do government managers perceive technology adoption?
How do they use social media in their workplaces? What are the positive and negative outcomes
of these uses? We expect that using social media tools, and using social media for particular
tasks (technology-task coupling) will be significantly related to managers’ perceptions of
technology outcomes.
Hypothesis 1: Social media use will be significantly related to perceptions of e-government outcomes. Specifically, we expect that when social media tools are used for work
collaborations, managers will report increased positive perceptions of the outcomes of

11
social media tools. The logic here being that these technologies will increase work
efficiencies and communications to improve productivity.
Hypotheses 1.a: Technology-task coupling for work coordination activities will be positively related to perceptions of e-government outcomes.
In contrast, we expect that when social media tools are used for interacting with
the public, there will be increased negative perceptions of technology outcomes.
Hypothesis 1.b: Technology-task coupling to facilitate participation with the public will be negatively related to perceptions e-government outcomes.
Data and Models
We use data from a 2012 national survey of local government managers. The survey was
administered to 2500 managers in 500 randomly selected local governments with citizen
populations ranging from 25,000 to 250,000. The breakdown of cities by population is highly
skewed to smaller cities (50%), with only 16% of cities having a population of 100,000-250,000.
The sample included a census of the larger communities (100,000-250,000) and a proportional
sample for smaller cities (25,000-100,000).1 The benefit of this design is that it captures both
small and medium sized cities in the US, whereas much of the research on technology in
government focuses on large municipalities alone (one exception is Brudney and Seldon 1995).
The final dataset is weighted to account for the proportional sample.
For each city, we surveyed five lead managers from the following departments: general
city management, community development, finance, police, and parks and recreation. After
removing bad addresses and individuals who were no longer working in the position the sample
was reduced to 2,428. The final response rate was 34.8%, or 845 respondents, as calculated by
the American Association for Public Opinion Research response rate calculator2. Those 845
12
respondents came from 429 cities from around the U.S.3 Thus the unit of analysis is the
individual.
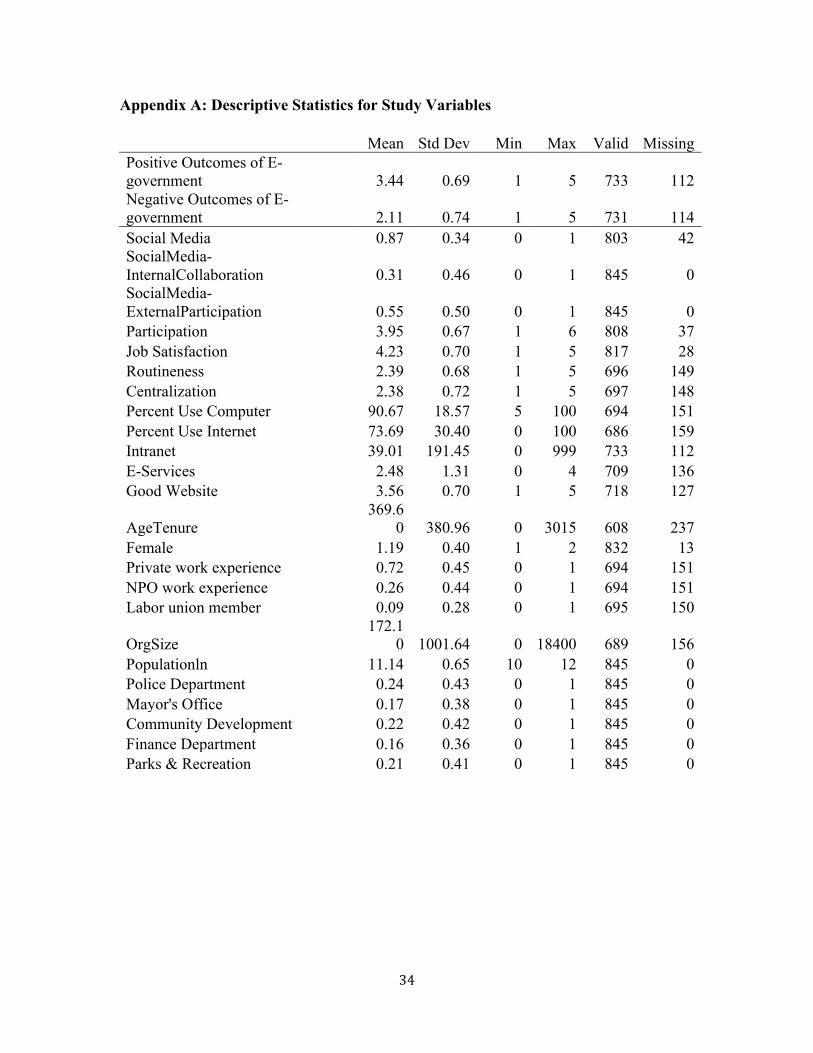
Dependent variables. Two dependent variables capture perceptions of positive and
negative outcomes of information and communication technologies. We asked respondents to
indicate the extent to which electronic information and communication technologies lead to 15
possible outcomes (see Table 1).
[Insert Table 1 about here]
Positive Outcomes is the average of responses from 10 items that indicated positive
outcomes. The Cronbach’s alpha for Positive Outcomes is .874. Negative Outcomes is the
average of the following five items that specified negative outcomes: Increase uncertainty for my
organization; Distort political information and facts; Undermine democratic practices; Reduce
clarity about what citizens want; and Increase conflict with citizens. The Cronbach’s alpha for
Negative Outcomes is .766. While Positive and Negative Outcomes are not exact opposites, they
are slightly correlated at the 0.01 level (2-tailed) = -.178.
Independent variables. We are interested in how local U.S. governments are coupling
social media technology with two types of participative tasks: collaborative work inside the
organization and participative interaction with external stakeholders. We explore these
relationships with three primary independent variables: Social Media, which indicates if the
respondent uses social media, and two technology-task couples: SocialMedia-
InternalCollaboration, and SocialMedia-ExternalParticipation. These items draw from a set
of survey questions that were designed as follows. Respondents were told “For the purposes of
this survey, social media is defined as having the characteristic of being social and interactive in
nature – allowing, but not requiring, two-way information exchange between individuals or

13
groups, such as between individual public employees and citizen. Examples of commonly used
social media tools include: blogs, Facebook, Twitter, YouTube, etc.” They were then asked: To
the best of your knowledge: does your organization use social media for any purpose? [Response
categories: Yes, no, don’t know]. This item is the basis for the binary variable, Social Media, to
which 684 individuals indicated “yes” (84.9%) and 122 indicated “no” (14.4%). We also include
dummy variables for each of the social media tools.
For the technology-task couple items, respondents were asked, “Please indicate which of
the following 10 social media tools your organization uses for any purpose: Facebook; Twitter;
YouTube; LinkedIn; GovLoop; Skype; Flickr; Google Talk, Blackberry Messenger, MSN, or
other instant messaging tools; MySpace; and Google Docs”. For each technology identified the
respondent was asked: “For what purposes does your organization use the types of tools that you
named? (1) To enable internal collaboration on work tasks and (2) To enable or facilitate
participation by citizens or external stakeholders”. SocialMedia-InternalCollaboration
indicates if the respondent uses any of the 10 technologies “To enable internal collaboration on
work tasks.” SocialMedia-ExternalParticipation is coded one if the respondent uses any of the
10 social media technologies “To enable or facilitate participation by citizens or external
stakeholders”. Among the 684 who use social media, 258 (37.8%) use it to facilitate participation
with external stakeholders, 57 (8.4%) use social media for internal collaboration, and 193
(28.3%) use social media for both purposes. SocialMedia-InternalCollaboration and
SocialMedia-ExternalParticipation are not mutually exclusive and are positively correlated
(Pearson Correlation .309**, Sig. (2-tailed .000)).
We include control variables for organizational culture and technology capacity and
individual, department, and city characteristics. Four variables capture the organizational culture
14
and the respondent’s perceptions of the organization. Participation is a measure of the
frequency with which external actors participate in organization’s decision-making and policy
making. Respondents were asked: Over the last year, how often did the following citizens and
stakeholder groups participate in your organization's decision and policy making? (1=don’t
know, 2=never, 3=rarely, 4=sometimes, 5=often, 6=very often): Individual citizens,
Neighborhood associations, Federal government agencies/employees/officials, News media,
Interest groups, Urban civic groups, Religious groups, Consultants or paid experts, Professional
associations, Internal department staff, Other city departments, Mayor’s office, Governor’s
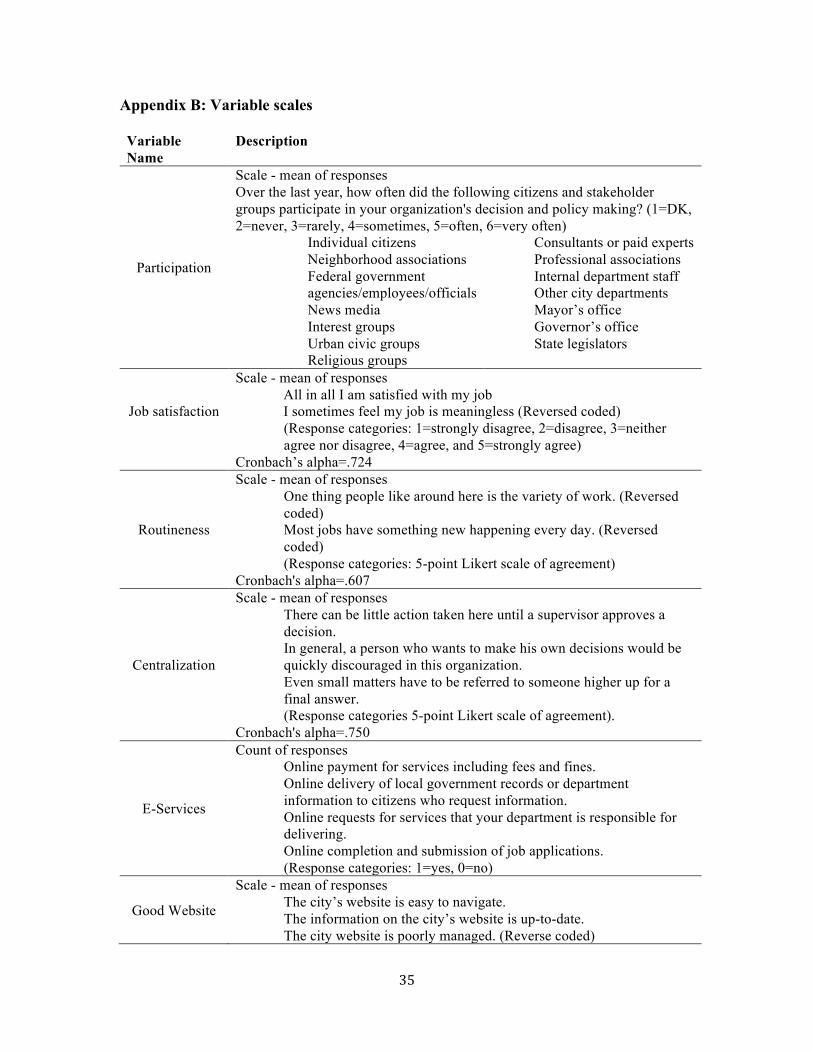
office, and State legislators. Participation is the average of responses to the 14 items.
Job Satisfaction indicates the respondent’s satisfaction with the job and is the average of
two questionnaire items: (1) All in all I am satisfied with my job and (2) I sometimes feel my job
is meaningless (R). The Cronbach’s alpha is .724. Routineness is a scale that captures the level
of routines in the work environment. It is the average of responses to two items: (1) One thing
people like around here is the variety of work (Reversed coded) and (2) Most jobs have
something new happening every day (Reversed coded) (Response categories 5-point Likert scale
of agreement). The Cronbach’s alpha for Routineness is .607. Centralization is an average of
responses to the following three questionnaire items: (1) There can be little action taken here
until a supervisor approves a decision; (2) In general, a person who wants to make his own
decisions would be quickly discouraged in this agency; and (3) Even small matters have to be
referred to someone higher up for a final answer. The Cronbach's alpha for Centralization is
.750.
We include five variables as measures of the organization’s technology capacity. Percent
Use Computer indicates responses to the question: Approximately what proportion of the
15
employees in your department use a computer for their work? Percent Use Internet is responses
to the questionnaire item: Approximately what proportion of the employees in your department
use the Internet for their work? Intranet is a binary variable coded “1” if the respondent
responded yes to the following question: Does your local government or department have an
Intranet (a web server accessible only to local government employees)? E-Services is a count
variable ranging from 0 to 4 which indicates if the department offers the following e-services: (1)
Online payment for services including fees and fines; (2) Online delivery of local government
records or department information to citizens who request information; (3) Online requests for
services that your department is responsible for delivering; and (4) Online completion and
submission of job applications. Good Website is a scale that captures the respondent’s
perceptions about the quality of the city’s website. Good Website is the average of responses
from the following five questionnaire items: (1) The city’s website is easy to navigate; (2) The
information on the city’s website is up-to-date; (3) The city website is poorly managed (Reverse
coded); (4) Residents and citizens tell me our website is very useful; and (5) Citizens and
residents complain about our website (Reverse coded). Response categories are 1=strongly
disagree, 2=disagree, 3=neither agree nor disagree, 4=agree, and 5=strongly agree. The
Cronbach’s Alpha is .833.
We control for the following individual characteristics: age, job tenure, gender, and
previous work experience. AgeTenure is an interaction variable created from a continuous
variable indicating age (range 23 to 77) and tenure in the current position (range 1 to 45).
Female is coded 2 if female and 1 if male. Previous work experience is captured by two binary
variables, Private work experience and NPO work experience, which are coded 1 if the
respondent had previous work experience in the private sector and 0 if not, and 1 if the
16
respondent had previous work experience in the nonprofit sector and 0 if not, respectively.
Labor union is a binary variable coded 1 if the respondent is the member of a labor union.
We also control for department and city characteristics, since previous research indicates
that technology adoption in municipal governments is related to city size and other
characteristics (Moon 2002). OrgSize is a continuous variable indicating the about how many
full-time employees work in the respondent’s department. Populationln is the natural log of the
city’s population. Five binary variables indicate the respondent’s department of employment:
Mayor’s Office, Community Development, Finance, Parks & Recreation, and Police. The
descriptive statistics for all study variables and variable scales are listed in Appendix A and B,
respectively.
Analysis and Results
In this study, 84.9% of respondents report using social media in the workplace, indicating
widespread overall use of these technologies in municipal governments. There is significant
variation of social media use by department of employment (Pearson Chi-Square, 18.197,
Asymp. Sig. 2-sided .001). The least frequent use of social media is among respondents working
in departments of community development (78%) as compared to 79.7% of those working in
finance departments, 85.3% of respondents in police departments, 88.5% of those working
departments of parks and recreation, and 93% of those working in mayor’s offices.
Table 2 reports the types of technologies used by respondent organizations. The most
common technology used in municipal governments is Facebook (91%). Nearly three-quarters of
respondents report using Twitter. The least commonly used technologies are GovLoop (5%) and
MySpace (8%). While many of the respondents report using social media, these data tell us little
17
about how managers use those technologies, or if they use them for internal work coordination or
interactions with citizens and external stakeholders.
The right side columns of Table 2 show the technology-task coupling for each type of
social media technology. For example, the columns labeled “used to enable internal collaboration
on work tasks” show the number of individuals who report using each technology for work
collaboration and that count as a percentage of total users of the specific technology. Three-
quarters of respondents who use email report using it for internal collaboration on work tasks.
More than half of users report that they use instant messaging tools such as Google Talk,
Blackberry Messenger, or MSN (54%) and Google Docs (56%) to enable internal collaboration
on work tasks. Interestingly, although GovLoop is not widely used in the full sample (5%),
among those who do use GovLoop, 37% report using it for collaboration on work tasks. And
while a large percentage of respondents report using Twitter (71%) and YouTube (50%), only
10% of those users report using those tools for collaboration on work tasks.
The far right columns of Table 2 show the percent of technology users that use each
technology to enable or facilitate participation by citizens or external stakeholders. Not
surprisingly, Facebook (67%) and Twitter (58%) are the most frequently used technologies to
enable or facilitate participation by citizens or external stakeholders. Around one third of users of
Linked In, MySpace, and Flickr report using those technologies to enable or facilitate
participation by citizens or external stakeholders. Thus we see that while 84.9% of respondents
report using social media in the workplace, they are using different technologies for particular
purposes.
[Insert Table 2 about here]
18
Having noted the distribution of technology use among respondents, and that technology
use is coupled with internal collaboration on work tasks and participation by citizens or external
stakeholders, we now look at how these technology-task couples are related to perceptions of the
positive and negative outcomes of e-government activities. We assess these perceptions in
models that separately predict perceptions of positive outcomes and perceptions of negative
outcomes, since it is possible for respondents to hold both perceptions simultaneously. Just as job
dissatisfaction is not the opposite of job satisfaction (Herzberg 1987), we contend that negative
and positive outcomes of government technology use are mutually exclusive but not necessarily
opposites. The opposite of positive outcomes is no outcomes; the opposite of negative outcomes
is no outcomes. One might believe that there are positive and negative outcomes from social
media use, or simply perceive positive or negative outcomes alone. Similarly, we expect that the
predictors of positive outcomes and negative outcomes may not be the same. Thus, we ran a
series of OLS regression models to test the relationships between social media technology use,
technology-task couplings, and the perceptions of positive outcomes and negative e-government
outcomes. First we ran a models investigating whether the use of social media is related to
perceived positive and negative outcomes (table 3). Second, we ran models that focus on each of
the two technology-task coupling independent variables of interest: Social Media-Internal
Collaboration, and Social Media-External Participation (table 4). The technology-task coupling
models presented in table 4 are limited to respondents who indicated that they use social media
(n=684).
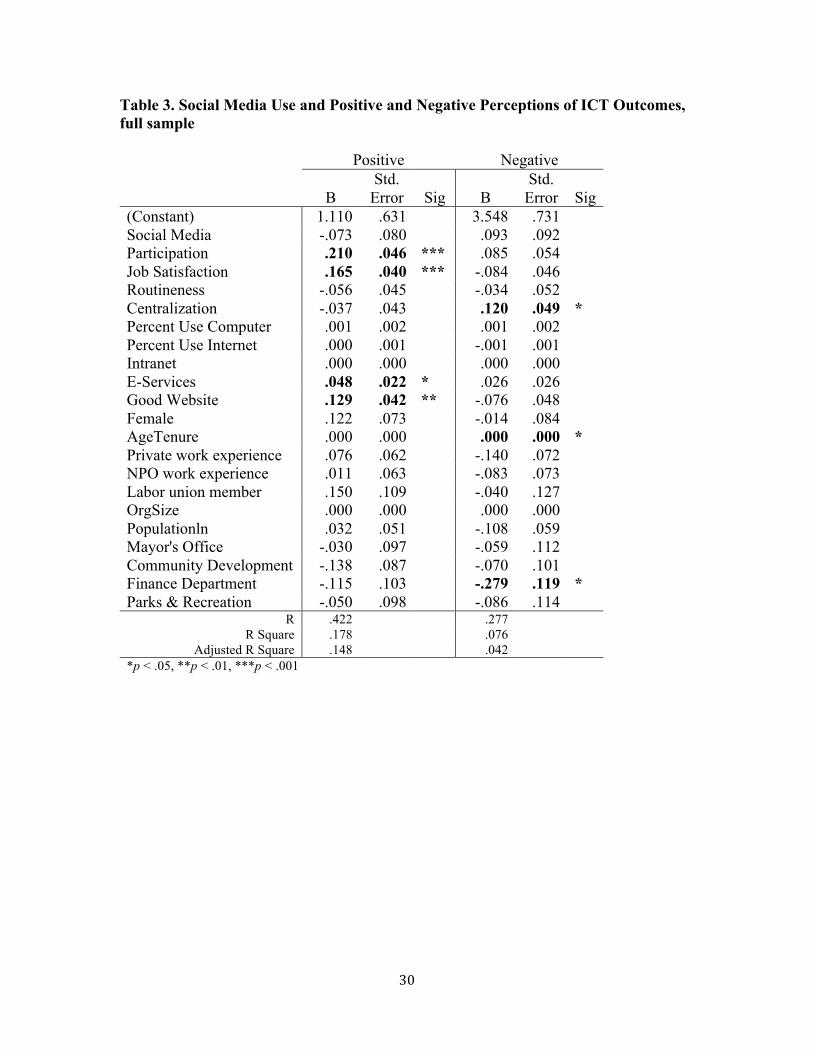
[Insert Table 3 about here]
In our initial models investigating social media use and positive and negative perceptions
of e-government outcomes, we operationalized social media use as a dummy variable indicating
19
social media use (=1), or not (=0) (see Table 3). The results in Table 3 indicate that overall social
media use is not significantly related to perceptions of e-government outcomes. We then reran
the models with each of the social media technologies specified (Table 4).
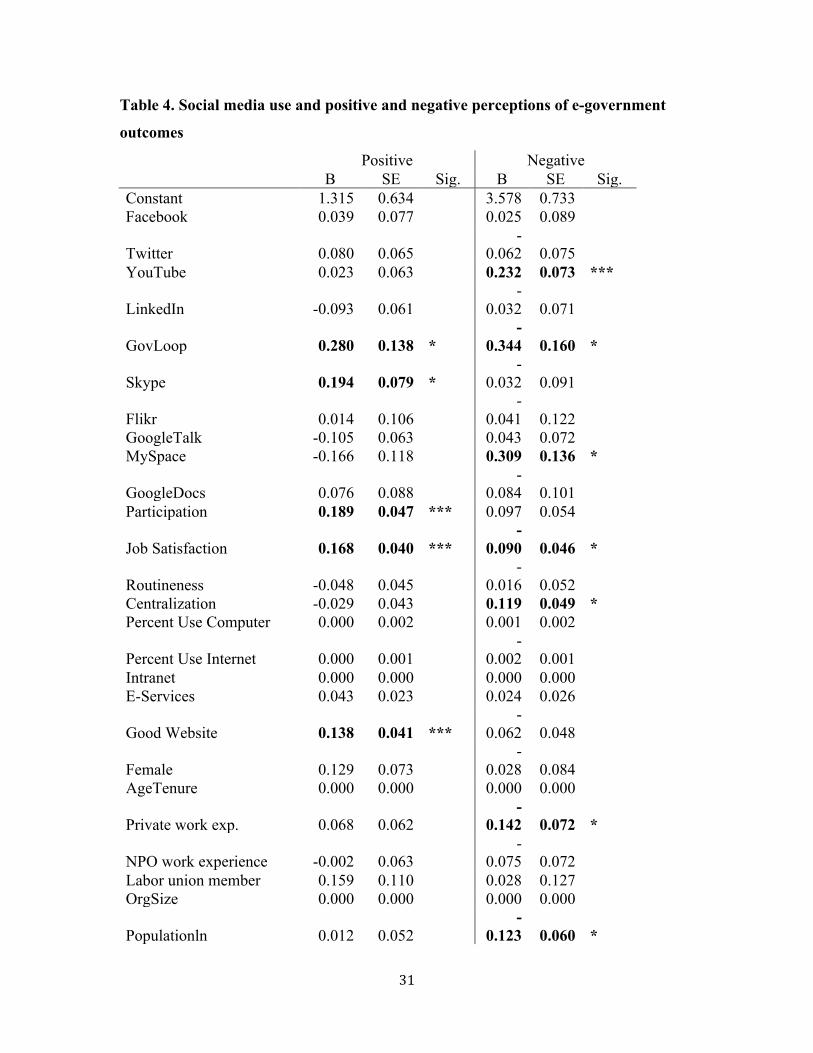
[Insert Table 4 about here]
Table 4 indicates that use of certain types of social media is significantly related to
reporting positive perceptions of the outcomes of ICTs and e-government initiatives in local
government. Specifically, respondents who report using Skype and GovLoop report increased
positive perceptions of e-government outcomes. Skype enables two-way interactions via phone
calls, instant messaging, and video conferencing. GovLoop is an online community, developed
by and for the government community, where over 100,000 public sector professionals can
connect to collaborate, solve problems, learn from one another, and share knowledge. GovLoop
users also report a significant decrease in negative perceptions. GovLoop use, though not wide
spread, is significantly related to both increased positive perceptions and decreased negative
perceptions. The results also show that respondents who report using YouTube and MySpace at
work report increased negative outcomes.
The results in Table 4 also indicate that organizational factors, including culture and
technology capacity, also differently predict perceptions of positive outcomes and negative
outcomes. Job satisfaction is positively related to reporting positive e-government outcomes. Job
satisfaction is also related to decreases in negative outcomes. Respondents who report more
frequent interactions with the public also report more positive perceptions, as do those who
report having a good department website. Specifically, respondents working in organizations that
have good websites report more positive perceptions of e-government. Thus, positive perceptions
of e-government are related to the use of some social media, job satisfaction, interacting with the
20
public, and reporting positive perceptions of the department website (which may be an indicator
of department technology capacity).
In comparison, perceptions that e-government results in negative outcomes are related to
organization centralization, private sector work experience, and population. Respondents
working in more centralized organizations report more negative outcomes from e-government,
possibly because centralized organizations make decisions about e-government initiatives
without engaging individual managers in technology adoption. Respondents who have private
sector work experience report lower negative views of e-government outcomes, as do
respondents working in larger cities.
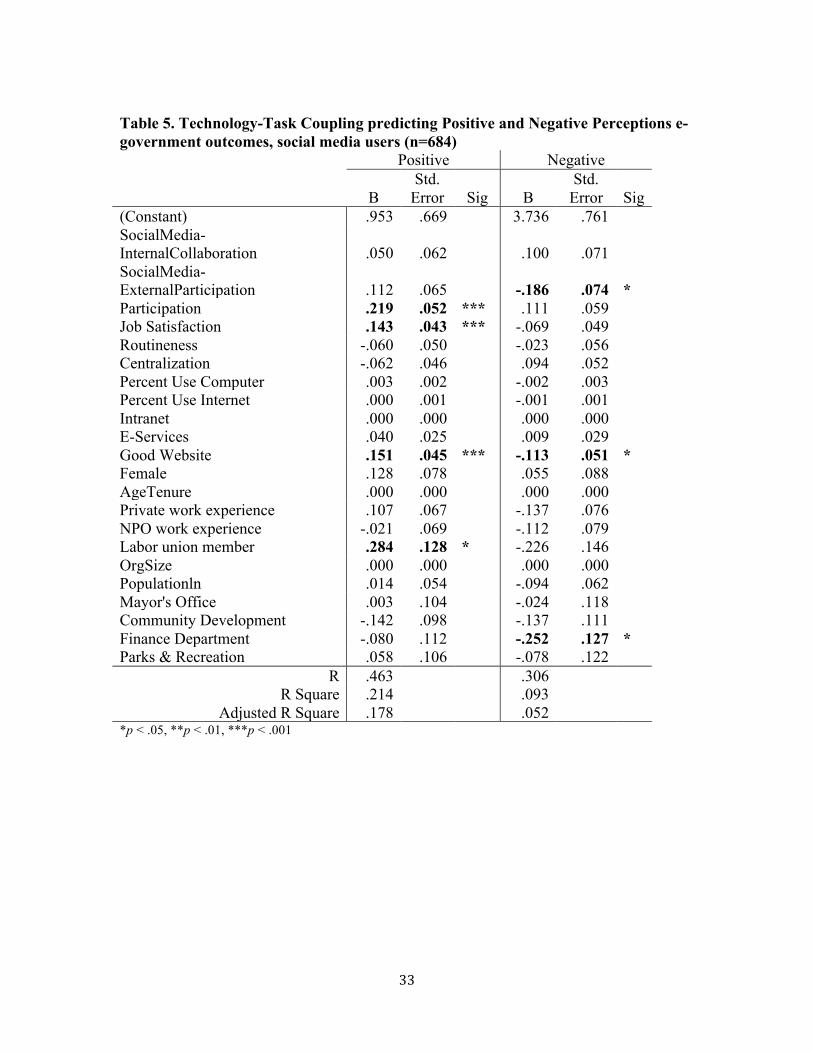
Table 5 shows the results from the two models predicting the relationship between
technology-task coupling and e-government outcomes. Among those who use social media, we
find that the purpose of the technology use is not related to positive perceptions about e-
government. In fact, among social media users, we see that job satisfaction, frequency of
participation with the public, and e-services are positive predictors of perceiving e-government
outcomes as being good for the community and for government. But technology-task coupling,
the purpose for which local government managements use social media is not related to positive
perceptions of e-government.
[Insert Table 5 about here]
We do find that the technology-task coupling of, SocialMedia-ExternalParticipation, is
significantly related to reporting negative e-government outcomes. Municipal managers who
report using social media to enable or facilitate participation by citizens or external stakeholders
report fewer negative outcomes from e-government. In contrast, those who are not using social
media for participatory purposes report increased negative outcomes from e-government. This
21
finding indicates that social media use, especially when used to connect with the public, might
help to reduce negative perceptions of the threats associated with these technologies. Though it
may also be true that those who have negative perceptions of e-government initiatives choose not
to adopt these technologies, while those who adopt social media technologies to engage the
public are simply more inclined to perceive positive outcomes of these technologies. On the
other hand, it might be that managers using social media to interact with the public are simply
less aware of the threats of social media use. Of course, we may see changes in these views over
time, as government managers develop mechanisms for using social media while addressing the
possible threats and negative outcomes of their use, and of course, as more managers become
familiar with social media technologies which are increasingly pervasive in the U.S.
Having a good website is a consistent predictor of both positive and negative perceptions
of e-government outcomes. Respondents who report that their department has a good website,
e.g. technology capacity, report increased positive perceptions and decreased negative
perceptions of e-government outcomes.
Respondents who work in finance departments report significantly lower negative
perceptions of e-government as compared to those working in police departments. This might be
explained by the fact that significantly more respondents in police departments (85.3%) use
social media as compared to those in finance departments (79.7%) (Pearson Chi-Square 18.197,
Asymp sig. (2-sided) .001). It is possible that because police departments use these technologies
more frequently they are more aware of the potential negative outcomes of their use – or have
experienced those negative outcomes first hand. Additionally, the report of negative outcomes
might be because of the type of information and communications that social media can enable
for police departments as compared to finance departments. One can certainly imagine a plethora

22
of possible uses of interactive technologies for police departments, from text message public
safety warnings, to interactive community discussions online, or two-way communications about
crime. In comparison, the use of two-way communications and social media for finance
departments are more likely to include input on budget decisions or question and answer sessions
with regards to public data. The threats associated with the former might exceed those of the
latter.
Before turning to a discussion of our findings, it is important to note the limitations of
this research. First, we are limited by the data, which are drawn from a single cross-sectional
study. Second, the survey was administered to high-level managers, so we cannot say that these
results reflect the perceptions and experiences of others in the organizations. Additionally, it is
possible that these managers do not have an accurate understanding of technology use in their
organizations. While this might be a weakness of the study, it is also important to note that if
high-level managers are unaware of the technology use in the organization, it is hard to know the
effectiveness (or widespread use) of such technology. In our view, effective technology will be
used seamlessly in an organization and not by a single Chief Information Officer or information
technology specialist. And finally, the measures in this study are limited in that they capture
respondent perceptions and in some cases are crude approximations for technology use. Despite
these data limitations, we believe this research remains important to our understanding of social
media use in local governments.
Discussion
Our findings point to some important issues. First, we see that social media is being used
in local governments in a variety of ways and for a variety of purposes (Hypotheses 1). As noted
23
in Table 1, the most widely used tools, Facebook and Twitter, are most commonly used for
facilitating participation by citizens and external stakeholders. Meanwhile social tools such as
instant messaging programs, GovLoop, and GoogleDocs are more widely used for internal
collaboration on work tasks. These findings reinforce the importance of understanding that social
media are not just used for “social” purposes or necessarily in citizen-oriented ways (e.g. for
participatory purposes). In fact, they may play important roles in internal government work
coordination and task completion – combatting the presumption that social media is not really
used by government and is just a Facebook or Twitter icon posted on a webpage. It will be
important that e-government researchers begin to differentiate between social media technologies
that serve different purposes for managers, other government agencies and workers, clients,
citizens, and other stakeholders. Additionally, we find that there remains ample opportunity to
increase the use of social media technologies for internal work collaborations. For example,
around half of respondents using instant messaging tools and GoogleDocs use them for internal
collaboration on work tasks, how might the remainder of these users better utilize these tools in
the work place? And what about the hundred or more respondents who do not use social media
tools at work?
Second, our results indicate that, as of 2012, social media use in municipal governments
is excessively hyped. A great deal of energy has gone into touting the promise of these tools, but
our research finds little effect on perceived outcomes for managers at the local level (although
there are limitations with our measures and analysis). While we find that the use of social media
for internal work and external participation is not significantly related to reporting positive
outcomes from e-government technologies, we note that it is too early to say that social media
cannot have these types of effects. Social media remains relatively new in the public sector work
24
place, and efforts to use social media to its full advantage on internal work tasks and external
engagement are in their infancy. We can easily imagine public sector workers in the near future
having high-speed intranet systems that better enable instant messaging to coordinate activities
or electronic bulletin boards for coordinating meetings or collaborating on policy documents and
initiatives. There needs to be much better research in this area to understand how technologies
are being employed, by whom and to what advantage…and disadvantage.
Finally, our findings could indicate hidden costs and benefits from social media
technologies. For example, positive and negative outcomes can occur at the same time, social
media could make it easier to communicate with the public, but at the same time make it more
complicated to manage the communications or weigh and align the interests of multiple
stakeholders. Positive and negative outcomes might also be trade-offs. With increased speed and
efficiency (a positive), there is less face-to-face interaction (a negative). Where there is less
travel time, there might be more work time. Social media use may be employed in a manner that
washes out the promised advantages – resulting in more time-consuming work, instead of
efficiencies. At the same time, social media may be costly and time consuming to adopt, but
once the start-up costs are complete, there may be exponential benefits reaped. With social media
technology use is just beginning in municipal governments, it seems many are still in the high
cost stage – wondering if the high cost will result in efficiencies and working to balance the
demands of adopting new technologies while still providing face-to-face services. Future
research should look at the complex relationships of positive and negative outcomes from social
media technologies and their effects on managerial work life, service delivery, and interactions
with the public. We expect that just as these technologies move quickly, so too will managers’
perceptions of their costs and benefits.
25
References Bertot, J. C., Jaeger, P.T., & Grimes, J. M. (2010). Using ICTs to create a culture of
transparency: E-government and social media as openness and anti-corruption tools for societies Government Information Quarterly 27(3), 264–271.
Bertot, J. C., Jaeger, P.T., & Hansen, D. (2012). The impact of polices on government
social media usage: Issues, challenges, and recommendations. Government Information Quarterly, 29(1): 30–40.
Bostrom, R. P., & Heinen, J. S. (1977). MIS problems and failures: A socio-technical
perspective. Part I: The causes. MIS Quarterly, 1(3), 17-32. Brudney, J. L., & Selden, S. C. (1995). The adoption of innovation by smaller local
governments: The case of computer technology. The American Review of Public Administration, 25(1), 71−86.
Dunleavy, P., Lelen, M., Bastow, S., & Tinkler, J. (2006). New Public Management Is
Dead—Long Live Digital-Era Governance. Journal of Public Administration Research & Theory 16(3), 467-494.
Evans, D., & Yen, DC. (2006). E-Government: Evolving relationship of citizens and government, domestic, and international development. Government Information Quarterly 23(2), 207-235.
AUTHOR CITE Finn, Christina. 2014. Government departments urged to use social media and
communicate online. Thejournal.ie. March 28. Accessed April 20, 2014 at http://www.informationweek.com/applications/top-14-government-social-media-initiatives/d/d-id/1102918
Fischer, G. (2009). End-User Development and Meta-design: Foundations for Cultures of
Participation Lecture Notes in Computer Science, 2009, Volume 5435, 3-14, DOI: 10.1007/978-3-642-00427-8_1
Fischer, G., & Ostwald, J. (2002). Seeding, evolutionary growth, and reseeding:
Enriching participatory design with informed participation. Proceedings of PDC 2002, 135-143. Palo Alto, CA: CPSR.
Hagel, S. B., & Davison. (2009). Measuring the forces of long-term change: The 2009
Shift Index. Deloitte Center for the Edge. Hanson, E.C. 2008. The information revolution and world politics. Lanham, MD:
Rowman & Littlefield.
26
Hansen, D.L., Shneiderman, B., & Smith, M.A. (2011). Analyzing social media networks with NodeXL: Insights from a connected world. Burlington, MA: Morgan Kaufmann.
Herzberg, FI. (1987). One more time: How do you motivate employees? Harvard
Business Review, Sep/Oct87, Vol. 65 Issue 5, 109-120. Hoover, J. N. (2012). Top 14 Government Social Media Initiatives. Information Week.
February 17. Accessed April 20, 2014 at http://www.informationweek.com/applications/top-14-government-social-media-initiatives/d/d-id/1102918
Jaeger, P. T., Bertot, J. C., & Shuler, J. A.. (2010). The Federal Depository Library
Program (FDLP), Academic Libraries, and Access to Government Information. The Journal of Academic Librarianship, 36(6): 469–478.
Kling, R. & Scacchi, W. (1982). The web of computing: Computer technology as social
organization. Advances in Computers 21, 1-90. Landsbergen, D. (2010). Government as part of the revolution: Using social media to
achieve public goals. Electronic Journal of e-Government, 8(2), 135-147.
Mergel, I. (2010). Government 2.0 Revisited: Social media strategies in the public sector. PA Times, American Society for Public Administration, 33(3), 7-10.
Mergel, I. (2011). The use of social media to dissolve knowledge silos in government in
The Future of Public Administration around the World: The Minnowbrook Perspective.
Moon, M. J. (2002). The evolution of e-government among municipalities: Rhetoric or
reality? Public Administration Review, 62(4), 424-433. AUTHOR CITE Parameswaran, M., & Whinston, A.B. (2007). Social computing: An overview.
Communications of the Association for Information Systems, 19, 762-780. Pirolli, P., Preece, J., & Shneiderman, B. (2010). Cyberinfrastructure for social action on
national priorities. Computer, 43 (11):20–21. Porter, J. (2008). Designing for the social web. New Riders Press, Thousand Oaks, CA. Snyder, C. (2009). Government agencies make friends with new media. Wired, 25 March,
D. 2008. The blogging revolution: Government in the age of Web 2.0. IBM Center for the Business of Government, Washington DC.
27
Trist, E. L., & Bamforth, K. W. (1951). Some Social and Psychological Consequences of the Longwall Method of Coal-Getting: An Examination of the Psychological Situation and Defences of a Work Group in Relation to the Social Structure and Technological Content of the Work System. Human Relations 4, 3-38.
AUTHOR CITE Winner, L. (1989). The whale and the reactor: A search for limits in an age of high
technology. University of Chicago Press; 1st edition. Wyld, D. (2008). The blogging revolution: Government in the age of Web 2.0. IBM
Center for the Business of Government, Washington DC.

28
Tables Table 1: Questionnaire items for outcomes of Information and Communication Technologies
In your opinion, to what extent do electronic information and communication technologies
lead to the following outcomes? Positive Outcomes
Improve governmental decision-making Lead to better policies Revitalize public debate Improve information dissemination to external stakeholders and citizens Increase opportunity to interact and collaborate with other government officials Increase access to government services Enable feedback on service quality Increase certainty about the importance of the work I do Enhance citizen trust of government Improve efficiency and lower costs of the department
Negative Outcomes Increased uncertainty for my organization Distort political information and facts Undermine democratic practices Reduced clarity about what citizens want Increase conflict with citizens
Response categories were 1=To a very small extent, 2=To a small extent, 3=Somewhat, 4=To a great extent, and 5=To a very great extent

29
Table 2: Types of technologies used by organizations and purposes of technology use
Use by the organization
Used to enable internal
collaboration on work tasks
Used to enable or facilitate
participation by citizens or
external stakeholders
Count
Valid % Count
% of
users Count
% of
users
Facebook 616 91% 75 12% 410 67% Twitter 466 71% 45 10% 270 58% YouTube 308 50% 32 10% 118 38% LinkedIn 255 41% 46 18% 77 30% Gov Loop 31 5% 11 37% 6 18% Skype 131 22% 39 30% 35 26% Flickr 63 11% 5 8% 23 37% Google Talk, Blackberry Messenger, MSN, or other instant messaging tools 268 44% 145 54% 69 26% MySpace 49 8% 9 18% 15 31% Google Docs 98 17% 54 56% 21 22% Note: Among all respondents to study (n=845)
30
Table 3. Social Media Use and Positive and Negative Perceptions of ICT Outcomes, full sample
Positive Negative
B Std.
Error Sig B Std.
Error Sig (Constant) 1.110 .631
3.548 .731
Social Media -.073 .080
.093 .092 Participation .210 .046 *** .085 .054 Job Satisfaction .165 .040 *** -.084 .046 Routineness -.056 .045
-.034 .052
Centralization -.037 .043
.120 .049 * Percent Use Computer .001 .002
.001 .002
Percent Use Internet .000 .001
-.001 .001 Intranet .000 .000
.000 .000
E-Services .048 .022 * .026 .026 Good Website .129 .042 ** -.076 .048 Female .122 .073
-.014 .084
AgeTenure .000 .000
.000 .000 * Private work experience .076 .062
-.140 .072
NPO work experience .011 .063
-.083 .073 Labor union member .150 .109
-.040 .127
OrgSize .000 .000
.000 .000 Populationln .032 .051
-.108 .059
Mayor's Office -.030 .097
-.059 .112 Community Development -.138 .087
-.070 .101
Finance Department -.115 .103
-.279 .119 * Parks & Recreation -.050 .098
-.086 .114
R .422
.277 R Square .178
.076
Adjusted R Square .148
.042 *p < .05, **p < .01, ***p < .001
31
Table 4. Social media use and positive and negative perceptions of e-government
outcomes
Positive Negative
B SE Sig. B SE Sig. Constant 1.315 0.634 3.578 0.733
Facebook 0.039 0.077
0.025 0.089
Twitter 0.080 0.065
-0.062 0.075
YouTube 0.023 0.063
0.232 0.073 ***
LinkedIn -0.093 0.061
-0.032 0.071
GovLoop 0.280 0.138 *
-0.344 0.160 *
Skype 0.194 0.079 * -
0.032 0.091
Flikr 0.014 0.106
-0.041 0.122
GoogleTalk -0.105 0.063
0.043 0.072 MySpace -0.166 0.118
0.309 0.136 *
GoogleDocs 0.076 0.088
-0.084 0.101
Participation 0.189 0.047 *** 0.097 0.054
Job Satisfaction 0.168 0.040 *** -
0.090 0.046 *
Routineness -0.048 0.045
-0.016 0.052
Centralization -0.029 0.043
0.119 0.049 * Percent Use Computer 0.000 0.002
0.001 0.002
Percent Use Internet 0.000 0.001
-0.002 0.001
Intranet 0.000 0.000
0.000 0.000 E-Services 0.043 0.023
0.024 0.026
Good Website 0.138 0.041 ***
-0.062 0.048
Female 0.129 0.073
-0.028 0.084
AgeTenure 0.000 0.000
0.000 0.000
Private work exp. 0.068 0.062
-0.142 0.072 *
NPO work experience -0.002 0.063
-0.075 0.072
Labor union member 0.159 0.110
0.028 0.127 OrgSize 0.000 0.000
0.000 0.000
Populationln 0.012 0.052
-0.123 0.060 *

32
Mayor's Office -0.110 0.099
-0.007 0.115
Community Dvlp -0.148 0.088
0.004 0.102
Finance Department -0.160 0.105
-0.220 0.121
Parks & Recreation -0.106 0.099
-0.029 0.115
R 0.454
0.332 R Square 0.206
0.110
Adjusted R Square 0.164
0.062 *p < .05, **p < .01, ***p < .001
33
Table 5. Technology-Task Coupling predicting Positive and Negative Perceptions e-government outcomes, social media users (n=684)
Positive Negative
B Std.
Error Sig B Std.
Error Sig (Constant) .953 .669
3.736 .761
SocialMedia-InternalCollaboration .050 .062
.100 .071
SocialMedia-ExternalParticipation .112 .065
-.186 .074 *
Participation .219 .052 *** .111 .059 Job Satisfaction .143 .043 *** -.069 .049 Routineness -.060 .050
-.023 .056
Centralization -.062 .046
.094 .052 Percent Use Computer .003 .002
-.002 .003
Percent Use Internet .000 .001
-.001 .001 Intranet .000 .000
.000 .000
E-Services .040 .025
.009 .029 Good Website .151 .045 *** -.113 .051 *
Female .128 .078
.055 .088 AgeTenure .000 .000
.000 .000
Private work experience .107 .067
-.137 .076 NPO work experience -.021 .069
-.112 .079
Labor union member .284 .128 * -.226 .146 OrgSize .000 .000
.000 .000
Populationln .014 .054
-.094 .062 Mayor's Office .003 .104
-.024 .118
Community Development -.142 .098
-.137 .111 Finance Department -.080 .112
-.252 .127 *
Parks & Recreation .058 .106
-.078 .122 R .463 .306
R Square .214
.093 Adjusted R Square .178
.052
*p < .05, **p < .01, ***p < .001
34
Appendix A: Descriptive Statistics for Study Variables Mean Std Dev Min Max Valid Missing Positive Outcomes of E-government 3.44 0.69 1 5 733 112 Negative Outcomes of E-government 2.11 0.74 1 5 731 114 Social Media 0.87 0.34 0 1 803 42 SocialMedia-InternalCollaboration 0.31 0.46 0 1 845 0 SocialMedia-ExternalParticipation 0.55 0.50 0 1 845 0 Participation 3.95 0.67 1 6 808 37 Job Satisfaction 4.23 0.70 1 5 817 28 Routineness 2.39 0.68 1 5 696 149 Centralization 2.38 0.72 1 5 697 148 Percent Use Computer 90.67 18.57 5 100 694 151 Percent Use Internet 73.69 30.40 0 100 686 159 Intranet 39.01 191.45 0 999 733 112 E-Services 2.48 1.31 0 4 709 136 Good Website 3.56 0.70 1 5 718 127
AgeTenure 369.6
0 380.96 0 3015 608 237 Female 1.19 0.40 1 2 832 13 Private work experience 0.72 0.45 0 1 694 151 NPO work experience 0.26 0.44 0 1 694 151 Labor union member 0.09 0.28 0 1 695 150
OrgSize 172.1
0 1001.64 0 18400 689 156 Populationln 11.14 0.65 10 12 845 0 Police Department 0.24 0.43 0 1 845 0 Mayor's Office 0.17 0.38 0 1 845 0 Community Development 0.22 0.42 0 1 845 0 Finance Department 0.16 0.36 0 1 845 0 Parks & Recreation 0.21 0.41 0 1 845 0
35
Appendix B: Variable scales Variable Name
Description
Participation
Scale - mean of responses Over the last year, how often did the following citizens and stakeholder groups participate in your organization's decision and policy making? (1=DK, 2=never, 3=rarely, 4=sometimes, 5=often, 6=very often)
Individual citizens Neighborhood associations Federal government agencies/employees/officials News media Interest groups Urban civic groups Religious groups
Consultants or paid experts Professional associations Internal department staff Other city departments Mayor’s office Governor’s office State legislators
Job satisfaction
Scale - mean of responses All in all I am satisfied with my job I sometimes feel my job is meaningless (Reversed coded)
(Response categories: 1=strongly disagree, 2=disagree, 3=neither agree nor disagree, 4=agree, and 5=strongly agree)
Cronbach’s alpha=.724
Routineness
Scale - mean of responses One thing people like around here is the variety of work. (Reversed coded) Most jobs have something new happening every day. (Reversed coded) (Response categories: 5-point Likert scale of agreement)
Cronbach's alpha=.607
Centralization
Scale - mean of responses There can be little action taken here until a supervisor approves a decision. In general, a person who wants to make his own decisions would be quickly discouraged in this organization. Even small matters have to be referred to someone higher up for a final answer. (Response categories 5-point Likert scale of agreement).
Cronbach's alpha=.750
E-Services
Count of responses Online payment for services including fees and fines. Online delivery of local government records or department information to citizens who request information. Online requests for services that your department is responsible for delivering. Online completion and submission of job applications. (Response categories: 1=yes, 0=no)
Good Website
Scale - mean of responses The city’s website is easy to navigate. The information on the city’s website is up-to-date. The city website is poorly managed. (Reverse coded)

36
Residents and citizens tell me our website is very useful. Citizens and residents complain about our website. (Reverse coded) (Response categories: 5-point Likert scale of agreement.)
The Cronbach’s alpha=.833
37
Footnotes
1 The census of cities with a population 100K-250K resulted in 184 cities. For the remaining 316 cities, a
proportional sample with 59% of the sample was drawn from 25K-50K, 28% from 50-75K, and 13% from
cities 75K-100K. Among all respondents, 37.8% are from smaller towns with a population less than 49,999
and 19% are in cities with a population from 50,000 to 74,999.
2 American Association for Public Opinion Research. AAPOR Outcome Rate Calculator. Version 3.1
November, 2010. Accessed Jan 26, 2014 at
http://www.aapor.org/Response_Rates_An_Overview1.htm#.UuXWRRZ6jw4
3 One respondent from 167 cities, two from 146 cities, three respondents from 83 cities, four respondents from 28 cities, and all five individuals from five cities responded.
Copyright © 2022 FDOKUMEN