G-III Apparel Group Inc. — Full Version - Ivo Welch
34
G-III Apparel Group Inc. — Full Version http://welch.som.yale.edu/ 0 Original Version: September 14, 1997 (Last Changes: December 3, 2004). This case has been authored and is copyrighted (1997) by Ivo Welch (professor of finance at the Yale School of Man- agement). Please bring all mistakes in this case to the attention of the author. The fee to use this case is $3 for each case = student. (This is less than the fee as that charged by shorter HBS cases). Please send a check to Prof. Ivo Welch, 46 Hillhouse Avenue, Box 208200, New Haven CT 06520-8200, indicating on the check the university, instructor, class, and time-period. Please check the latest case version for address changes. My intent is to make collection as easy on the instructor (and copy shop) as possible: please send the check within 3 months of copying. When all sections of a course have less then 10 students, to avoid nuisance charges, such courses are exempt from case fees. If the above fees or procedure presents hardship, please inform the author at [email protected]: I am flexible. Teachers who use the case in class, but do not include it in a course package (so that most students copy the case from the WWW without paying the case fee) forfeit my permission to use this case and are in violation of copyright. Most of the information in this case has been obtained from public sources, first and fore- most the IPO prospectus of G-III, the industry reports provided by the Department of Com- merce, and the data bases of Compustat, CRSP, and SDC. More IPO information is available at http://www.iporesources.org/. Alan Feller (CFO and COO of G-III) and Aron Goldfarb (founder of G-III), and Richard White (Oppenheimer) graciously provided additional insights. Boris Grin- berg added assistance, and Antonio Bernardo, Jos van Bommel, Francesca Cornelli, Jay Ritter, and Mike Vetsuypens added helpful comments. Most of all, the author thanks his mother, Char- lotte Welch—who owns and runs a beautiful mid-sized clothes-store, Come Prima by Charlotte Welch, in Fulda, Germany—for explaining the apparel business and using the store to finance his education. 1
-
Upload
khangminh22 -
Category
Documents
-
view
1 -
download
0
Transcript of G-III Apparel Group Inc. — Full Version - Ivo Welch
G-III Apparel Group Inc. — Full Version
http://welch.som.yale.edu/
0Original Version: September 14, 1997 (Last Changes: December 3, 2004). This case has beenauthored and is copyrighted (1997) by Ivo Welch (professor of finance at the Yale School of Man-agement). Please bring all mistakes in this case to the attention of the author.The fee to use this case is $3 for each case = student. (This is less than the fee as that charged byshorter HBS cases). Please send a check to Prof. Ivo Welch, 46 Hillhouse Avenue, Box 208200, NewHaven CT 06520-8200, indicating on the check the university, instructor, class, and time-period.Please check the latest case version for address changes. My intent is to make collection as easyon the instructor (and copy shop) as possible: please send the check within 3 months of copying.When all sections of a course have less then 10 students, to avoid nuisance charges, such coursesare exempt from case fees. If the above fees or procedure presents hardship, please inform theauthor at [email protected]: I am flexible. Teachers who use the case in class, but do not includeit in a course package (so that most students copy the case from the WWW without paying the casefee) forfeit my permission to use this case and are in violation of copyright.Most of the information in this case has been obtained from public sources, first and fore-most the IPO prospectus of G-III, the industry reports provided by the Department of Com-merce, and the data bases of Compustat, CRSP, and SDC. More IPO information is available athttp://www.iporesources.org/. Alan Feller (CFO and COO of G-III) and Aron Goldfarb (founderof G-III), and Richard White (Oppenheimer) graciously provided additional insights. Boris Grin-berg added assistance, and Antonio Bernardo, Jos van Bommel, Francesca Cornelli, Jay Ritter,and Mike Vetsuypens added helpful comments. Most of all, the author thanks his mother, Char-lotte Welch—who owns and runs a beautiful mid-sized clothes-store, Come Prima by CharlotteWelch, in Fulda, Germany—for explaining the apparel business and using the store to finance hiseducation.
1
I Introduction
In late 1989, Clive How was managing the portfolios of high-net worth individu-als. A number of his clients had read about unusually high IPO returns, and hadrequested a substantial part of their assets to be invested in new firms. Clive agreedwith this strategy, believing that new firms were one of the few opportunities wherean intelligent portfolio manager could outperform. After all, new firms were not yetwidely followed by analysts and other investors. While scouting for good opportu-nities, he had stumbled into a road show of the G-III Apparel Company. G-III (pro-nounced “gee-three”) was a leading producer of leather apparel, and was proposingan IPO for early December. Clive believed that, like smart portfolio managers, smartcompany management would always outperform. G-III seemed to be an interestingopportunity, so Clive decided to evaluate it as a potential investment.
II The Industry
G-III’s business was not easy to classify. G-III’s main input, leather, was also usedby shoe, luggage, handbag, glove and fashion accessory manufacturers, as well asthe upholstery business.
G-III’s main output, clothes, competed in the apparel industry, which was other-wise dominated by textile based companies. Nevertheless, G-III clearly considereditself an apparel company, not a leather company.
A The Input: Leather (SIC Code 31 +)
Inputs: Cattlehides were considered to be a byproduct of meat production: therewere 35 million commercial slaughters in 1989 (from a stock of about 100 millioncattle), despite a continued decline in the demand for red meat. The U.S. exportedabout 23 million hides, with South Korea absorbing close to half, Japan close to aquarter, and Taiwan close to a tenth of the U.S. exports.
Unfortunately, leather production was notoriously difficult to estimate, evenyears after production had taken place. Exhibit 1 describes the trends published inthe 1990 industrial outlook (U.S. Department of Commerce). It indicated that totalleather shipments and products had risen from $7.92B in 1987 to about $8.5B in1988 to an estimated $8.6B in 1989. These figures represented about 14 millioncattlehide equivalents (with cowhides accounting for 80–85 percent of the total).After adjusting for inflation, leather shipments and products did not increase from1987 to 1988 and declined about 1.6% from 1988 to 1989. Thus, following realgrowth rates of 4% for the 1986–1987 period, 1989 leather shipments appeared to
2
be disappointingly low, and substantially underperforming the 4.1% that the U.S.industrial outlook had predicted at the beginning of 1989. However, the outlookpredicted a 3% increase for 1990.
Foreign demand had put significant price pressures on cattlehides, with priceshaving risen about 17% per year since 1985 to reach about 91 cents per pound inthe beginning of 1989. Although hide prices dropped about 5% in the first halfof 1989, low levels of slaughter and good foreign demand were likely to keep hideprices constant or even increase it. Even during the hide price drop, though, finishedleather prices had remained constant.
Over the last 5 years, G-III had paid approximately $1 to $1.30 per square footfor leather hides, which accounted for 90% of G-III’s raw material costs.
B The Output: Apparel (SIC Code 23)
Apparel is one of the largest sectors of the U.S. economy, employing close to amillion people in 1989. Unlike leather which had underperformed its expectationsin the last 12 months, apparel enjoyed an unexpected surge. This growth came asconsumers enjoyed increased disposable income, which they had used to replenishtheir wardrobes after years of diminished spending (in effect shifting consumptionfrom durables into apparel). Growth rates were expected to reach about 3% (real)in 1989, following less than 1% in 1988. Producers had been partly to blame forthe 1988 showing, having misread the fashion interests of their consumers. (Again,Exhibit 1 displays recent trends in the apparel industry.)
C Leather Apparel (SIC Code 2386)
Leather apparel represented only about 2.5% of total leather industry shipments.(For comparison, more than 50% went to footwear, 25% to leather tanning and fin-ishing, 10% to luggage, and 5% to handbags.) But unlike other leather businesses,reflecting recent strong demand in the apparel business, leather apparel had en-joyed a very good 1989 sofar. Leather continued to be a hot fashion item, and asa result, the leather apparel industry was on the path of beating its beginning-of-1989 growth projection of 1.4% for an expected 1989-total of 4.0%. Looking further,1989–1990 growth projections were a relatively rosy 3.5%.
U.S. employment in the leather apparel business had increased 30% in 1987, 10%in 1988, and about 5% (est) in 1989. But like most apparel and leather, the leatherapparel business was labor intensive, and U.S. wages were about $8.34 per hour. As aresult, all trends pointed towards more foreign production. The U.S. exported about$40 million, but imported just slightly under $1B. Imports accounted for about 80%
3
of the U.S. market. South Korea was by far the principal supplier of leather apparelto the U.S. market, supplying nearly three-quarters of the value of U.S. imports.
Still, the apparel market was multilateral: over one-quarter of U.S. outputs wereexported (primarily to Japan, France, and Italy), representing about one-quarter ofthe market, and U.S. apparel exports had increased by 85% in 1988.
Leather apparel was expected to grow by about 4% (real) in 1989. In general,the long-term outlook was for continued growth (due to the current wealth and agetrends in the U.S. population).
III The Company
A The Business
G-III produced a wide range of leather apparel, primarily moderately-priced women’swear: coats, jackets, pants, and skirts. Although some product was produced underprivate label, most product was sold under G-III’s own brand names: G-III, Siena,and Cayenne. The G-III women’s division sold items from $40–$300 (retail price),Siena sold items between $260 and $1,800, the new Cayenne division sold itemsbetween $100 and $500, and a recent push into men’s wear under the G-III labelsold items with prices between $150 and $500. Most of G-III’s sales were to chains,both general stores (such as Dillards, The May Company and Sears Roebuck) andspecialty chains (The Limited [20% of sales], and Wilson’s House of Suede [8% ofsales, down from 15% two years earlier]),1 and sold under G-III’s brand names. Asis common in the high-volume apparel business, the company was not focused ondesign choices, but followed the styles of the rest of the industry or the specificsample designs provided by its customers. The company also had just begun toexport, primarily to Canada, and expected foreign sales to be a growth venue.
One third of G-III’s production was from the company’s New York City factories,the other two-thirds from independent contractors, primarily in Korea. New Yorkproduction allowed the company to test trends, to react to changes, or to fill suddendemand, on short notice. Korean production allowed the company to produce itemsat lower cost, despite the 6% U.S. import duty on its Korean products. One buyingagent in Korea provided 40–50% of all purchases (varying each year). Similarly,40% of its U.S. leather were obtained from one vendor (Henry Sokol Leather Co).However, the tannery and manufacturing of leather apparel was fiercely competitive,and any business relationship could easily be replaced with another if necessary.The company did not sell product on consignment and generally did not accept
1Wilson’s was both a producer of leather goods (and thus a competitor of G-III) and a customer.
4

returns (except when defective). Orders tended to be placed on short notice, andsales could not be easily predicted from the firms backlog.
The company employed 235 people, of which 134 worked in design and manu-facturing, 64 in warehouse facilities, and 11 in sales. 157 employees were coveredby union agreements, but employee relationships had historically been cordial. Thecompany paid about $500,000 in annual rent for its offices, warehouses, show-rooms, and other facilities.
G-III was generally predicted to capture about 10% of 1989 industry sales, upfrom only 2% in 1985, in an industry that grew at a 15% annual rate. From 1986 to1989, the company’s net sales had grown at a compound annual rate of 68%.
G-III depended heavily on the maintenance or increase of consumer demand forleather wearing apparel, and that demand had been favorably affected in the mid-1980s when technological changes in leather tanning techniques increased the colorand texture alternatives of leather garments. These new leather finishing technolo-gies allowed jackets made from inexpensive skins to feel as luxurious as jacketscosting as much as three to five times a decade earlier. “Bomber jackets,” one ofG-III’s main product lines, which used to cost roughly $600 could now be producedand sold for $100–$200. The attractiveness of G-III as an investment would de-pend heavily on G-III’s ability to continue the growth and profitability of the recentpast. But in the apparel business, in particular, the high levels of return on equityshown did not usually persist for long even in advanced technological enterprises.Still, G-III believed its quality, broad selection and ability to quickly adjust output tochanging styles were important to its success. Its customer orientation had servedit well in the past. In addition, G-III was one of the largest independent wholesalemanufacturers of leather apparel in the United States. Its relative size in a frag-mented industry was important to retailers, and should be an advantage if G-IIIwere to seek acquisitions. Despite its size, the company had had practically nopress coverage, and was known primarily to fashion insiders. As is common in theapparel business, most of G-III’s sales and profits were in the first and last fiscalquarters.
B The Company and Its Management
G-III was founded in 1974 by Aron Goldfarb. Aron Goldfarb was a Polish Jew whohad survived the Holocaust and moved to the U.S. in 1956.2 He had worked hisway up in the New York fashion district, eventually founding a company namedG&N (Goldfarb and Novak), in which he learned how to manufacture and marketleather apparel. After he separated from Mr. Novak, Aron Goldfarb founded his own
2In 1994, the U.S. Holocaust Memorial Museum (Washington) published a book about AronGoldfarb’s life, entitled “Maybe you will survive.”
5
company, G-III, the “III” denoting himself and his two sons. By 1989, the 66-year-oldAron Goldfarb remained chairman of the board, but his son, Morris Goldfarb hadtaken over the day-to-day management as president and chief executive officer. Theremaining management team were mostly in their forties, veterans of the apparelbusiness, but not indispensable to the operations. The management structure ofG-III is listed in Exhibit 2.
The relative importance of the Goldfarb’s was reflected in their salaries. Morrisdrew $443,000 per annum, Aron drew $380,000. Three other officers drew between$100,000 and $160,000 per year from 1988–1989. Post-IPO, Morris and Aron’ssalaries were slated to increase to between $500,000 and $650,000 after the of-fering, plus a performance bonus of 5% of pre-tax profits in excess of $1 million,plus some options and life insurance.
Before the offering, Aron Goldfarb held 1,579,111 shares, equivalent to 34.0%of the company; Morris held 2,378,666 shares, or 51.2%. Together, the executiveofficers and directors owned 91.9% of all shares. The offering contemplated to sell2 million shares at $13 each (the preliminary prospectus indicated a price rangeof $13-$16), of which 500,000 shares were sold by Aron and the rest were newlyissued, for a total of 6,144,144 shares. Other insiders retained their holdings, andthe customary Rule 1443 lockup prevented the sale of 3,904,444 shares. Ninetydays after the offering, 466,666 shares could be sold, subject to agreements withthe underwriters. The insiders agreed to additional selling restrictions for the first180 dates after the offering, basically excluding any inside sales. The companyhad also instituted a stock option plan, in which key employees, consultants, anddirectors would receive warrants with an exercise price within 10% of the firm’svalue.
IV The Initial Public Offering
A The IPO Prospectus
Exhibits 3–5 contain the first three text pages of the IPO prospectus. (Pages 1 and2 of the IPO prospectus show fashion models wearing G-III leather fashions.) G-III’sprospectus format was mostly boilerplate, the first page describing the offering,the second page the company, the third page the financials. (The full G-III IPOprospectus is available at http://welch.som.yale.edu/.)
3Restricted shares may not be sold under Rule 144, unless they have been fully paid for andheld for 2 years. Thereafter, the amount of shares that may be sold depends on trading volumeand market value.
6

B Other Information from the Financial Statements
Aside from Exhibit 5, the prominently displayed financial summary (on page 4 ofthe IPO prospectus) and the cash flow statement deep in the prospectus, there wereconsiderable financial details. Among the more noteworthy tidbits were the follow-ing: G-III had $18.8 million in short term debt, and $3.5 million in long term debt. Itanticipated that the proceeds of the offering would be used to reduce these figuresto $4.9 million and $1.5 million, respectively. G-III had recently violated some of itscovenants for its mortgage/lease (noted in footnote F13). However, it had obtaineda waiver from their creditors for these violations from July 1988 through July 1989.(G-III was still in non-compliance at the time of the IPO, but renegotiating a newwaiver.) G-III’s did not purchase, but leased its space. Leases were guaranteed byprincipal, and so not reported as current obligations, but long-term obligations. Thecompany had never paid dividends and had no plans to pay dividends in the nearfuture. The company had some dealings with other corporations fully or partiallycontrolled by some its directors or the Goldfarbs, but these were disclosed in theprospectus which stated that all such transactions were made at terms at least asgood if not better than those obtainable from outside parties. Finally, the com-pany had recently managed to reduce its pension expense from $171,000 in (fiscalyear) 1987 to $46,000 in 1988 to $55,000 in 1989. (The 1987 drop was accom-plished through the termination of two noncontributory plans in August 1987. Thecompany had contributed $125,000 to this plan in July 1987. The remaining pen-sion plan was a multi-employer plan, covered by a collective bargaining agreementand not administered by G-III.) Pension expense to G-III’s pension plan was $8,600and $17,500 in the three months period ending October 1988 and October 1989,respectively.
C The Underwriter Syndicate
In May 1988, the Equity Securities Trading Co had performed a limited IPO, andas a result had received a warrant for 20,000 shares at a price of $7.20, expiringon May 5, 1993. Basically, G-III had merged into Ante Corp., a very small publiclytraded vehicle, which had not been large enough to be listed on a prominent ex-change. In the end, this neither helped nor hurt G-III’s “real” IPO, but left it with 46other holders of record and 195 beneficial holders of common stock even beforethe IPO.
The proposed general IPO was handled by Richard White on behalf of Oppen-heimer. A private attorney in the law firm of Bell, Kalnick, Klee & Green hadintroduced Richard White after finding out of Morris Goldfarb’s interest to go pub-lic. In exchange, the law firm received a finder’s fee. Oppenheimer ranked some-where between 15 and 20 in terms of underwritten IPO’s, competing for the G-III
7
IPOs with the likes of Bear Sterns, Ladenburg, or even Lehman, Paine-Webber,Dean-Witter, and Prudential. In G-III’s case, the presence of an apparel analyst(Dennis Rosenberg) was an advantage.
The IPO process began in late August/early September and culminated in theoffering in December. G-III had changed auditors on July 31, 1989 from McMichaelto Grant Thornton, who had audited the financial statements for the three yearsprior to the offering. The selection of a more well-known auditor was not unusualin preparation of an initial public offering, and McMichael had confirmed that itwas in agreement with the new auditors’ assessments.
As lawyers, Oppenheimer had retained Morgan, Lewis & Bockius of New YorkCity, G-III had retained Fulbright Jaworski & Reavis McGrath. The company hadrenamed itself (dropping its prior name “Ante Corp”), consolidated its subsidiaries(G-III Leather Fashions and Siena Leather), and incorporated in Delaware priorto the offering (previously, Minnesota). The company was slated to begin tradingon NASDAQ/NMS under the symbol GIII immediately after the IPO.
Oppenheimer conducted road shows in New York, Boston, Minneapolis, Chicago,Los Angeles, San Francisco, Zürich, Paris, and London. Attending institutional in-vestors appeared to be quite receptive to the offering. (The firm or the underwritershad no intrinsic preference in favor of either institutional or individual investors.)The formal book-building process began about 2 weeks before the offering. Theprospectus stated that Oppenheimer had agreed to underwrite 612,500 shares it-self; 20 underwriters, including almost all the tier-1 underwriters, had agreed tounderwrite 35,000 shares each; 10 underwriters had agreed to underwrite 25,000shares; and 25 underwriters had agreed to underwrite 17,500 shares each.
A Note on Syndication: The real IPO process is more intricate, mostly due to his-torical (and perhaps archaic) conventions. Underwriting and selling are two differentactivities. In IPOs of the size of G-III, the lead underwriter sells almost all the shareshimself. Historically, underwriters had different and unique investor networks andthus a syndicate had more placing ability than an individual Investment bank. Today,however, practically all investment banks share the same institutional clients, andthus there is little need for an underwriter to ask fellow syndicate members to helpsell shares. One disadvantage of sharing distribution is that lead underwriters wishto avoid investors’ “flipping” of shares into the aftermarket immediately after theoffering. Controlling such flipping is more difficult when shares are placed by otherbrokers. Still, syndicate participants may, on occasion, receive some IPO shares toplace, say, 3,500 shares if they underwrite 35,000 shares.
The main reason underwriters give for the presence of a syndicate today is “sharedliability.” If investors in the offering later sue the company and its experts, under-writer liability is distributed according to their participation in the syndicate. In ex-change for their syndicate participation, non-lead underwriters receive 20%4 of the
4Oppenheimer would receive 20% as a management fee, the brokers distributing the shareswould receive the remaining 60%. Because most brokers would end up being Oppenheimer bro-kers, Oppenheimer would in turn recapture some of these commissions.
8
7% fee ($0.91 per share) paid by the issuer. However, underwriter expenses (attor-neys, travel, entertainment, stabilization costs) are allocated to the same 20%, and, inofferings of the size of G-III, syndicate underwriters receive close to nothing. In ef-fect, investment banks consider selling shares (for commissions) to be the profitablecomponent, and underwriting to be the unprofitable liability component. Receivingprimarily liability and practically no compensation, why underwriters would agree toparticipate in a syndicate? The main reason for participating in another underwriter’soffering is reciprocity—in exchange for their participation, Oppenheimer would par-ticipate as a syndicate member in the future IPOs of these underwriters. Thus, syn-dicates are de facto a complicated mechanism to share liability risk. (In larger initialpublic offerings, however, syndicate participation can become profitable.)
In G-III’s case, the underwriter discount was $0.91 per share, and underwritersagreed to sell to other dealers at no greater a discount than $0.53, who in turn couldsell at a discount no greater than $0.10. In addition, the underwriters received a 30-day overallotment option to purchase 300,000 shares, exercisable at $12.09. Theseshares had to be bought from Morris Goldfarb, and had to be distributed amongthe underwriter syndicate in the same fraction that the original shares were allo-cated. Further, underwriters were allowed to exercise the option only to cover over-allotments made in connection with the offering. G-III indemnified the underwritersagainst liabilities, losses and expenses under the 1933 Act, but it was understoodby all participants that such indemnification would provide only limited protectionto the underwriter. G-III also agreed to sell five-year warrants to purchase 200,000shares at a price of $15.60 for $200,000. These warrants were not transferable andnot exercisable for one year. Finally, the underwriters agreed not to have intent tomake sales to discretionary accounts in excess of 5% of the total numbers of sharesof stock offered.5
D Use of Proceeds and Risks
Of the 1.5 million primary shares sold, most were slated to facilitate the company’soperational growth (necessary additions to working capital, financing of inventoryand accounts receivable). In addition, the company planned to repay a $2 millionnote to its bank. (The note was guaranteed by the Goldfarbs.)
The prospectus specifically mentioned the following risk factors:
• Reliance on Foreign Manufacturers.• Dependence on Key Personnel.• Dependence on Key Customers.• The Nature of the Apparel Business.• Seasonality.
5The underwriter for a previous offering had also received a warrant for 20,000 shares, 4 yearsfrom April 1989, at strike price of $7.20, for $100.
9
• Control by the Goldfarbs.• Future share sales.• Lack of significant trading, causing NASDAQ to drop G-III.• Uncertainty about the right offering price.
V Pricing The Offering
The most important issue-at-hand was determining the appropriate pricing of theIPO.
A Comparable Apparel IPOs
G-III’s prime competitors were Winlet, Andrew Mark, Mirage, and US CooperSportswear. Unfortunately, none of these were traded on a public exchange, andno information as to their sales, etc., was available. (G-III believes itself to be thelargest leather outerwear producer, but with no public information from their com-petitors, this could neither be confirmed nor dispelled.)
The first critical choice that both G-III and potential buyers would have to make iswho to choose as “comparable companies” (comps). There are a number of sourcesfor this type of information that are accessible to industry analysts, for example
Compustat Issued by Standard&Poor’s, Compustat contains annual and quar-terly financial information gathered from annual and quarterly financials on alarge range of companies.
CRSP Issued by the University of Chicago, CRSP contains stock price and relatedinformation (dividends, splits, delistings), etc.
SDC Issued by Securities Data Corp, SDC offers a data base of recent issuingactivity, gather from public registration filings with the SEC.
Searches for comparables are usually done by trying to find firms in the sameindustry (SIC code, i.e., “Standard Industry Classification”) with similar size charac-teristics as the firm in question. A first search on Compustat listed a number ofpotential comp candidates, printed in Exhibit 6.
Securities Data Corp offered its own—and different set—of potential compa-rable companies from its IPO data base. Firms in the SDC database with same SICindustry code as G-III are listed in 7.
With such a large set of possible comparables, an analyst was sent to look overthe comparable firms and came up with the analysis in Exhibit 8.
10
Selecting a large number of comparables would mean compromising by compar-ing apples and oranges; i.e., it might end up benchmarking G-III against a “liturgicalvesture clothes” producer. A small number of comparables would mean a very un-reliable estimate for an appropriate valuation of a company like G-III. The analyst’sdetailed business descriptions of these companies made it clear that the original listhad yielded more unsuitable than suitable comparables. It is ironic that in the end,even in such an established large industry as apparel, comparables were difficult tofind. In fact, the IPO may well have transformed G-III to become the only publiclytraded outerwear manufacturer in the U.S.
Having selected six comparables—Yes Clothing, Oshkosh, Benetton, Leg-ends, Mayfair and Gitano—some new new dilemmas arose. Although there werenow 6 comparables, only Yes Clothing had done an IPO recently. Gitano’s andLegends’ IPOs had occurred about a year ago. (See Exhibit 9.)
Further, Mayfair had recently been taken over and Benetton was an Italiancompany, clearly operating in a different environment and its financial data wouldhave been hard to interpret. Even though the comp firms were publicly traded,information was still difficult to come by! The problem now was that there were toofew, not too many comparables!
The aforementioned Compustat data base, Exhibit 10 displays the publicly ac-cessible financial information on the comparables.
Analysts typically value firms in two ways. (The two are typically seen as com-plementary.) The first way is to project free cash flows for a “net present value”analysis. The second way is to compute ratios on everything in sight in order to“benchmark” the IPO to its public comparables. (It is common in the industry tocompute such ratios based on projected, next-year’s financials, not historical finan-cials.) Some such ratios are computed in Exhibit 11. Typically, the combination ofmultiple techniques is hoped to help analysts “triangulate” on the appropriate firmvalue.
VI The Context
With most of G-III’s comparables not having executed their own IPOs within thelast three months, an analysis of general IPO market conditions seemed wise. Ex-hibit 12 displays the number of IPOs and the dollar amount raised in the market forsmall firm-commitment initial public offerings (i.e., those offerings raising no morethan $50 million). The exhibit also provides the dollar amount that was raised byentrepreneurs cashing out (“secondary shares”). By historical standards, 1989 hadnot been a very active issuing year, although there had been even “dryer” periodsin the early eighties.
11
One well-known reason for these fluctuations in IPO activity was the variationin the overall stock market. For example, right after the crash of 1987, there werealmost no offerings at all. Still, important questions remained: Would an IPO gathera better price in a hot-issue market, than in a cold-issue market? Would an IPO’safter-market performance be better if the IPO was completed in a hot-issue or acold-issue market? The answers to these questions seemed to be important to G-III,because investors in late 1989 would presumably be more eager to buy G-III sharesif recent IPOs had been “good buys.” Indeed, if other IPOs had displayed greatreturns, G-III might even be able to increase its offering or price. Yet, if IPOs in thedays, weeks, or months before the offering had displayed poor returns, investorsmight not take to the G-III offering, even if it was solid.
Exhibit 13 shows the stock market environment in which small companies oper-ated. The exhibit describes the returns gathered by small firms (with less than $1Bat the start of the month), categorized into those firms which had conducted an IPOwithin the most recent 3 years and those firms which had not. While Exhibit 13 an-swers the question of how “young firms” (IPOs) had fared in recent months, it doesnot answer whether IPOs that had gone public in hot-issue markets performed anydifferently. Exhibit 14 displays, by issuing month, some basic information aboutsmall IPOs (where small means less than $50 million dollar being raised). (Natu-rally, long-run pricing information for offerings in 1988 and 1989 was incompleteand thus truncated.) This information could potentially shed some light on thegeneral condition of the IPO market.
12

VII The Questions
Clive would now have to make some decisions:
1. How sound was G-III’s business? Was it suitable for an IPO?
2. How good was G-III’s management? How suitable was G-III’s management?How trustworthy was G-III’s management?
3. Why had G-III opted for an IPO rather than searching for alternative forms ofcapital?
4. Was the money raised in the offering put to good purpose?
5. How sophisticated had G-III dealt with its financial situation? What situationwas G-III in pre-IPO? Why had it chosen to list on NASDAQ/NMS?
6. Who is Oppenheimer? What was the role of Oppenheimer in the process? WasOppenheimer’s role commensurate with its fees?
7. Was $13 an appropriate price for G-III? What was the intrinsic value of a shareof G-III?
8. How would picking the wrong comparables influence estimates?
9. How hot would demand for shares be?
10. Should an investor purchase G-III in the IPO or in the after-market?
11. How long should an investor hold onto G-III?
12. Did G-III display good timing ability?
13. How would institutions react? What would institutional participation meanfor G-III and its stockholders?
14. Would G-III come back to raise more money soon? Would it matter?
15. What skeletons could potentially hide in the closet?
16. What had Clive forgotten to check into?
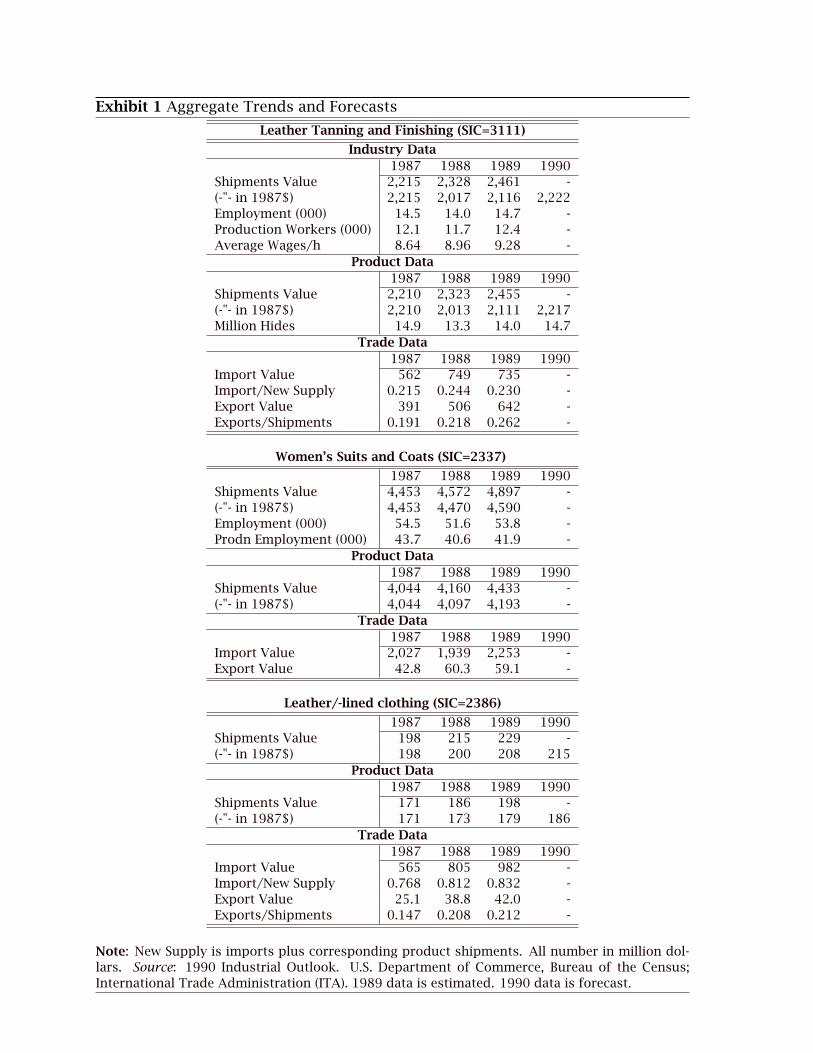
Exhibit 1 Aggregate Trends and Forecasts
Leather Tanning and Finishing (SIC=3111)
Industry Data1987 1988 1989 1990
Shipments Value 2,215 2,328 2,461 -(-"- in 1987$) 2,215 2,017 2,116 2,222Employment (000) 14.5 14.0 14.7 -Production Workers (000) 12.1 11.7 12.4 -Average Wages/h 8.64 8.96 9.28 -
Product Data1987 1988 1989 1990
Shipments Value 2,210 2,323 2,455 -(-"- in 1987$) 2,210 2,013 2,111 2,217Million Hides 14.9 13.3 14.0 14.7
Trade Data1987 1988 1989 1990
Import Value 562 749 735 -Import/New Supply 0.215 0.244 0.230 -Export Value 391 506 642 -Exports/Shipments 0.191 0.218 0.262 -
Women’s Suits and Coats (SIC=2337)
1987 1988 1989 1990Shipments Value 4,453 4,572 4,897 -(-"- in 1987$) 4,453 4,470 4,590 -Employment (000) 54.5 51.6 53.8 -Prodn Employment (000) 43.7 40.6 41.9 -
Product Data1987 1988 1989 1990
Shipments Value 4,044 4,160 4,433 -(-"- in 1987$) 4,044 4,097 4,193 -
Trade Data1987 1988 1989 1990
Import Value 2,027 1,939 2,253 -Export Value 42.8 60.3 59.1 -
Leather/-lined clothing (SIC=2386)
1987 1988 1989 1990Shipments Value 198 215 229 -(-"- in 1987$) 198 200 208 215
Product Data1987 1988 1989 1990
Shipments Value 171 186 198 -(-"- in 1987$) 171 173 179 186
Trade Data1987 1988 1989 1990
Import Value 565 805 982 -Import/New Supply 0.768 0.812 0.832 -Export Value 25.1 38.8 42.0 -Exports/Shipments 0.147 0.208 0.212 -
Note: New Supply is imports plus corresponding product shipments. All number in million dol-lars. Source: 1990 Industrial Outlook. U.S. Department of Commerce, Bureau of the Census;International Trade Administration (ITA). 1989 data is estimated. 1990 data is forecast.
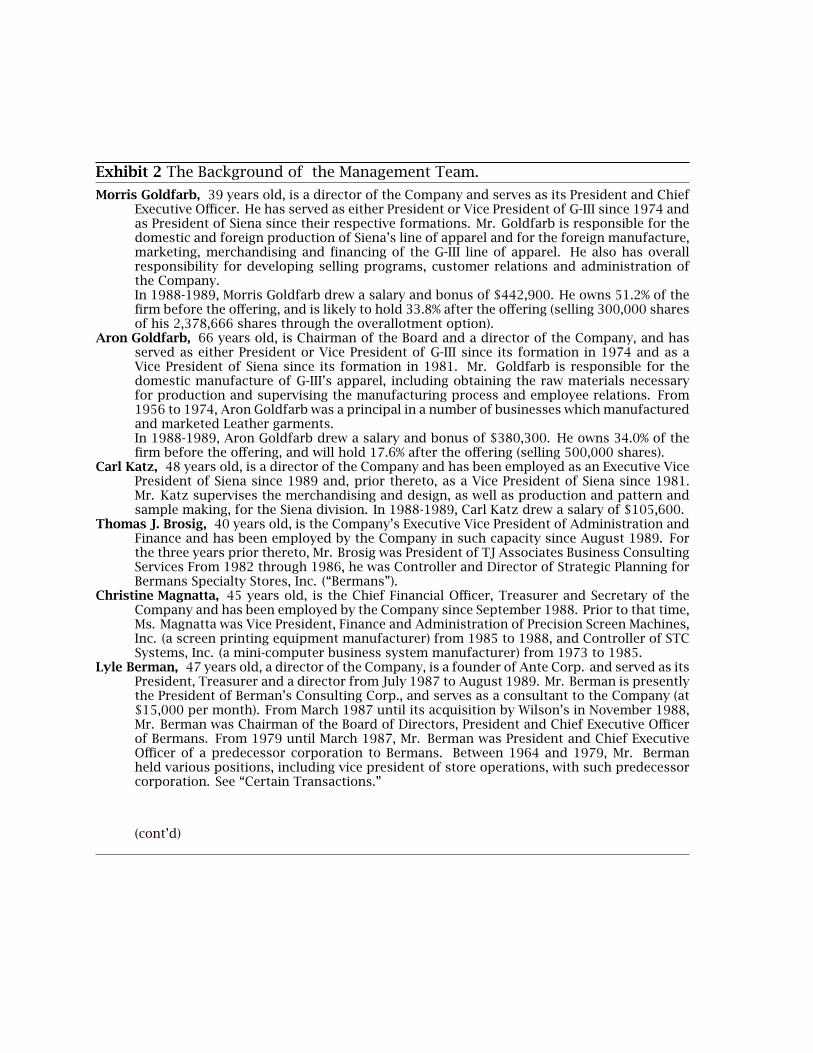
Exhibit 2 The Background of the Management Team.
Morris Goldfarb, 39 years old, is a director of the Company and serves as its President and ChiefExecutive Officer. He has served as either President or Vice President of G-III since 1974 andas President of Siena since their respective formations. Mr. Goldfarb is responsible for thedomestic and foreign production of Siena’s line of apparel and for the foreign manufacture,marketing, merchandising and financing of the G-III line of apparel. He also has overallresponsibility for developing selling programs, customer relations and administration ofthe Company.In 1988-1989, Morris Goldfarb drew a salary and bonus of $442,900. He owns 51.2% of thefirm before the offering, and is likely to hold 33.8% after the offering (selling 300,000 sharesof his 2,378,666 shares through the overallotment option).
Aron Goldfarb, 66 years old, is Chairman of the Board and a director of the Company, and hasserved as either President or Vice President of G-III since its formation in 1974 and as aVice President of Siena since its formation in 1981. Mr. Goldfarb is responsible for thedomestic manufacture of G-III’s apparel, including obtaining the raw materials necessaryfor production and supervising the manufacturing process and employee relations. From1956 to 1974, Aron Goldfarb was a principal in a number of businesses which manufacturedand marketed Leather garments.In 1988-1989, Aron Goldfarb drew a salary and bonus of $380,300. He owns 34.0% of thefirm before the offering, and will hold 17.6% after the offering (selling 500,000 shares).
Carl Katz, 48 years old, is a director of the Company and has been employed as an Executive VicePresident of Siena since 1989 and, prior thereto, as a Vice President of Siena since 1981.Mr. Katz supervises the merchandising and design, as well as production and pattern andsample making, for the Siena division. In 1988-1989, Carl Katz drew a salary of $105,600.
Thomas J. Brosig, 40 years old, is the Company’s Executive Vice President of Administration andFinance and has been employed by the Company in such capacity since August 1989. Forthe three years prior thereto, Mr. Brosig was President of TJ Associates Business ConsultingServices From 1982 through 1986, he was Controller and Director of Strategic Planning forBermans Specialty Stores, Inc. (“Bermans”).
Christine Magnatta, 45 years old, is the Chief Financial Officer, Treasurer and Secretary of theCompany and has been employed by the Company since September 1988. Prior to that time,Ms. Magnatta was Vice President, Finance and Administration of Precision Screen Machines,Inc. (a screen printing equipment manufacturer) from 1985 to 1988, and Controller of STCSystems, Inc. (a mini-computer business system manufacturer) from 1973 to 1985.
Lyle Berman, 47 years old, a director of the Company, is a founder of Ante Corp. and served as itsPresident, Treasurer and a director from July 1987 to August 1989. Mr. Berman is presentlythe President of Berman’s Consulting Corp., and serves as a consultant to the Company (at$15,000 per month). From March 1987 until its acquisition by Wilson’s in November 1988,Mr. Berman was Chairman of the Board of Directors, President and Chief Executive Officerof Bermans. From 1979 until March 1987, Mr. Berman was President and Chief ExecutiveOfficer of a predecessor corporation to Bermans. Between 1964 and 1979, Mr. Bermanheld various positions, including vice president of store operations, with such predecessorcorporation. See “Certain Transactions.”
(cont’d)
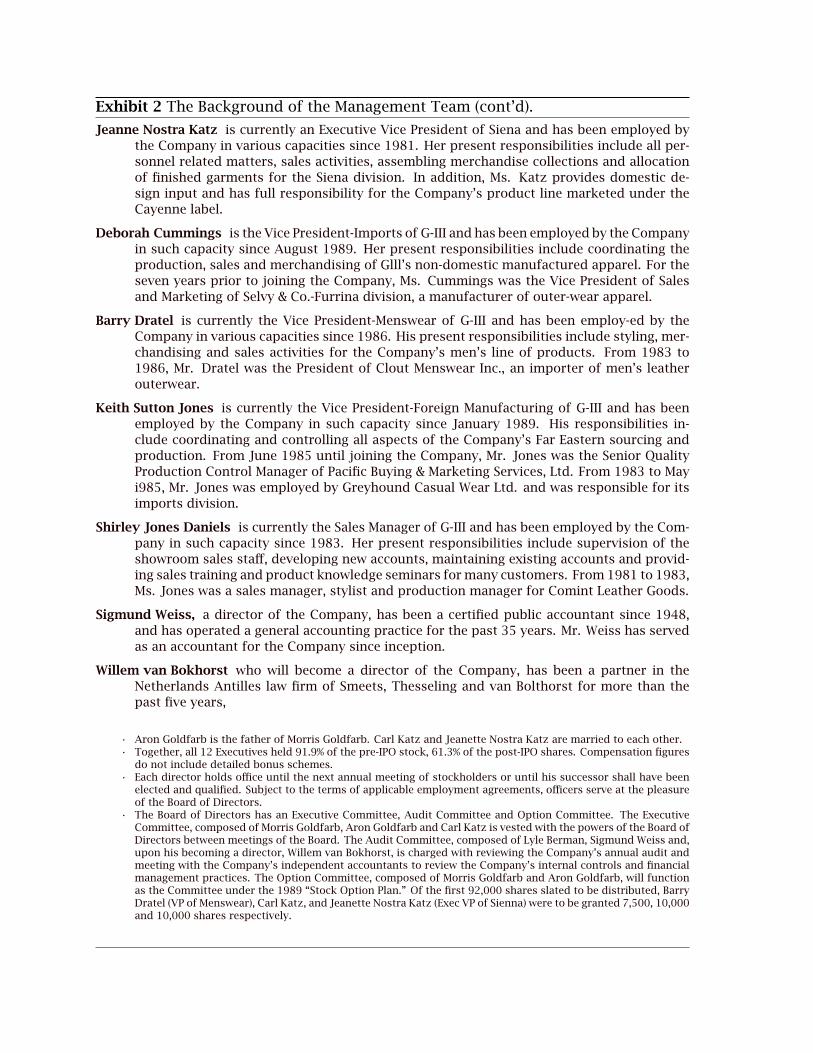
Exhibit 2 The Background of the Management Team (cont’d).
Jeanne Nostra Katz is currently an Executive Vice President of Siena and has been employed bythe Company in various capacities since 1981. Her present responsibilities include all per-sonnel related matters, sales activities, assembling merchandise collections and allocationof finished garments for the Siena division. In addition, Ms. Katz provides domestic de-sign input and has full responsibility for the Company’s product line marketed under theCayenne label.
Deborah Cummings is the Vice President-Imports of G-III and has been employed by the Companyin such capacity since August 1989. Her present responsibilities include coordinating theproduction, sales and merchandising of Glll’s non-domestic manufactured apparel. For theseven years prior to joining the Company, Ms. Cummings was the Vice President of Salesand Marketing of Selvy & Co.-Furrina division, a manufacturer of outer-wear apparel.
Barry Dratel is currently the Vice President-Menswear of G-III and has been employ-ed by theCompany in various capacities since 1986. His present responsibilities include styling, mer-chandising and sales activities for the Company’s men’s line of products. From 1983 to1986, Mr. Dratel was the President of Clout Menswear Inc., an importer of men’s leatherouterwear.
Keith Sutton Jones is currently the Vice President-Foreign Manufacturing of G-III and has beenemployed by the Company in such capacity since January 1989. His responsibilities in-clude coordinating and controlling all aspects of the Company’s Far Eastern sourcing andproduction. From June 1985 until joining the Company, Mr. Jones was the Senior QualityProduction Control Manager of Pacific Buying & Marketing Services, Ltd. From 1983 to Mayi985, Mr. Jones was employed by Greyhound Casual Wear Ltd. and was responsible for itsimports division.
Shirley Jones Daniels is currently the Sales Manager of G-III and has been employed by the Com-pany in such capacity since 1983. Her present responsibilities include supervision of theshowroom sales staff, developing new accounts, maintaining existing accounts and provid-ing sales training and product knowledge seminars for many customers. From 1981 to 1983,Ms. Jones was a sales manager, stylist and production manager for Comint Leather Goods.
Sigmund Weiss, a director of the Company, has been a certified public accountant since 1948,and has operated a general accounting practice for the past 35 years. Mr. Weiss has servedas an accountant for the Company since inception.
Willem van Bokhorst who will become a director of the Company, has been a partner in theNetherlands Antilles law firm of Smeets, Thesseling and van Bolthorst for more than thepast five years,
• Aron Goldfarb is the father of Morris Goldfarb. Carl Katz and Jeanette Nostra Katz are married to each other.• Together, all 12 Executives held 91.9% of the pre-IPO stock, 61.3% of the post-IPO shares. Compensation figures
do not include detailed bonus schemes.• Each director holds office until the next annual meeting of stockholders or until his successor shall have been
elected and qualified. Subject to the terms of applicable employment agreements, officers serve at the pleasureof the Board of Directors.
• The Board of Directors has an Executive Committee, Audit Committee and Option Committee. The ExecutiveCommittee, composed of Morris Goldfarb, Aron Goldfarb and Carl Katz is vested with the powers of the Board ofDirectors between meetings of the Board. The Audit Committee, composed of Lyle Berman, Sigmund Weiss and,upon his becoming a director, Willem van Bokhorst, is charged with reviewing the Company’s annual audit andmeeting with the Company’s independent accountants to review the Company’s internal controls and financialmanagement practices. The Option Committee, composed of Morris Goldfarb and Aron Goldfarb, will functionas the Committee under the 1989 “Stock Option Plan.” Of the first 92,000 shares slated to be distributed, BarryDratel (VP of Menswear), Carl Katz, and Jeanette Nostra Katz (Exec VP of Sienna) were to be granted 7,500, 10,000and 10,000 shares respectively.
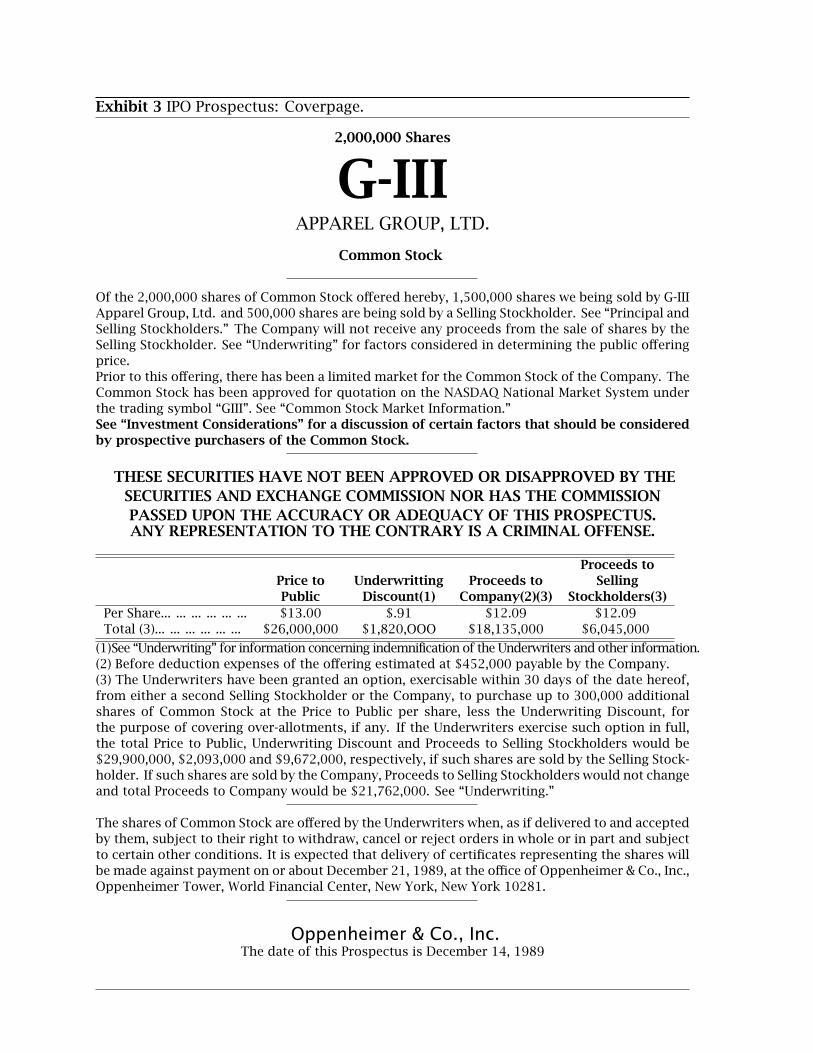
Exhibit 3 IPO Prospectus: Coverpage.
2,000,000 Shares
G-IIIAPPAREL GROUP, LTD.
Common Stock
Of the 2,000,000 shares of Common Stock offered hereby, 1,500,000 shares we being sold by G-IIIApparel Group, Ltd. and 500,000 shares are being sold by a Selling Stockholder. See “Principal andSelling Stockholders.” The Company will not receive any proceeds from the sale of shares by theSelling Stockholder. See “Underwriting” for factors considered in determining the public offeringprice.Prior to this offering, there has been a limited market for the Common Stock of the Company. TheCommon Stock has been approved for quotation on the NASDAQ National Market System underthe trading symbol “GIII”. See “Common Stock Market Information.”See “Investment Considerations” for a discussion of certain factors that should be consideredby prospective purchasers of the Common Stock.
THESE SECURITIES HAVE NOT BEEN APPROVED OR DISAPPROVED BY THESECURITIES AND EXCHANGE COMMISSION NOR HAS THE COMMISSIONPASSED UPON THE ACCURACY OR ADEQUACY OF THIS PROSPECTUS.ANY REPRESENTATION TO THE CONTRARY IS A CRIMINAL OFFENSE.
Proceeds toPrice to Underwritting Proceeds to SellingPublic Discount(1) Company(2)(3) Stockholders(3)
Per Share... ... ... ... ... ... $13.00 $.91 $12.09 $12.09Total (3)... ... ... ... ... ... $26,000,000 $1,820,OOO $18,135,000 $6,045,000
(1)See “Underwriting” for information concerning indemnification of the Underwriters and other information.(2) Before deduction expenses of the offering estimated at $452,000 payable by the Company.(3) The Underwriters have been granted an option, exercisable within 30 days of the date hereof,from either a second Selling Stockholder or the Company, to purchase up to 300,000 additionalshares of Common Stock at the Price to Public per share, less the Underwriting Discount, forthe purpose of covering over-allotments, if any. If the Underwriters exercise such option in full,the total Price to Public, Underwriting Discount and Proceeds to Selling Stockholders would be$29,900,000, $2,093,000 and $9,672,000, respectively, if such shares are sold by the Selling Stock-holder. If such shares are sold by the Company, Proceeds to Selling Stockholders would not changeand total Proceeds to Company would be $21,762,000. See “Underwriting.”
The shares of Common Stock are offered by the Underwriters when, as if delivered to and acceptedby them, subject to their right to withdraw, cancel or reject orders in whole or in part and subjectto certain other conditions. It is expected that delivery of certificates representing the shares willbe made against payment on or about December 21, 1989, at the office of Oppenheimer & Co., Inc.,Oppenheimer Tower, World Financial Center, New York, New York 10281.
Oppenheimer & Co., Inc.The date of this Prospectus is December 14, 1989
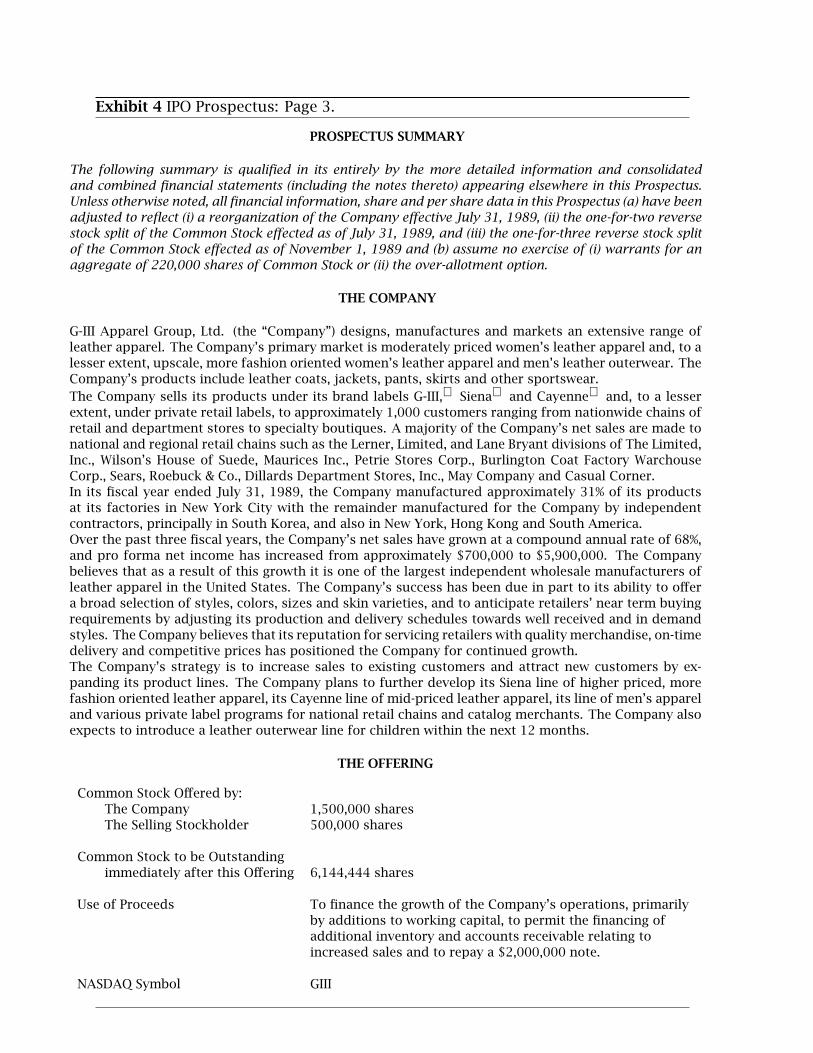
Exhibit 4 IPO Prospectus: Page 3.
PROSPECTUS SUMMARY
The following summary is qualified in its entirely by the more detailed information and consolidatedand combined financial statements (including the notes thereto) appearing elsewhere in this Prospectus.Unless otherwise noted, all financial information, share and per share data in this Prospectus (a) have beenadjusted to reflect (i) a reorganization of the Company effective July 31, 1989, (ii) the one-for-two reversestock split of the Common Stock effected as of July 31, 1989, and (iii) the one-for-three reverse stock splitof the Common Stock effected as of November 1, 1989 and (b) assume no exercise of (i) warrants for anaggregate of 220,000 shares of Common Stock or (ii) the over-allotment option.
THE COMPANY
G-III Apparel Group, Ltd. (the “Company”) designs, manufactures and markets an extensive range ofleather apparel. The Company’s primary market is moderately priced women’s leather apparel and, to alesser extent, upscale, more fashion oriented women’s leather apparel and men’s leather outerwear. TheCompany’s products include leather coats, jackets, pants, skirts and other sportswear.The Company sells its products under its brand labels G-III, Siena and Cayenne and, to a lesserextent, under private retail labels, to approximately 1,000 customers ranging from nationwide chains ofretail and department stores to specialty boutiques. A majority of the Company’s net sales are made tonational and regional retail chains such as the Lerner, Limited, and Lane Bryant divisions of The Limited,Inc., Wilson’s House of Suede, Maurices Inc., Petrie Stores Corp., Burlington Coat Factory WarchouseCorp., Sears, Roebuck & Co., Dillards Department Stores, Inc., May Company and Casual Corner.In its fiscal year ended July 31, 1989, the Company manufactured approximately 31% of its productsat its factories in New York City with the remainder manufactured for the Company by independentcontractors, principally in South Korea, and also in New York, Hong Kong and South America.Over the past three fiscal years, the Company’s net sales have grown at a compound annual rate of 68%,and pro forma net income has increased from approximately $700,000 to $5,900,000. The Companybelieves that as a result of this growth it is one of the largest independent wholesale manufacturers ofleather apparel in the United States. The Company’s success has been due in part to its ability to offera broad selection of styles, colors, sizes and skin varieties, and to anticipate retailers’ near term buyingrequirements by adjusting its production and delivery schedules towards well received and in demandstyles. The Company believes that its reputation for servicing retailers with quality merchandise, on-timedelivery and competitive prices has positioned the Company for continued growth.The Company’s strategy is to increase sales to existing customers and attract new customers by ex-panding its product lines. The Company plans to further develop its Siena line of higher priced, morefashion oriented leather apparel, its Cayenne line of mid-priced leather apparel, its line of men’s appareland various private label programs for national retail chains and catalog merchants. The Company alsoexpects to introduce a leather outerwear line for children within the next 12 months.
THE OFFERING
Common Stock Offered by:The Company 1,500,000 sharesThe Selling Stockholder 500,000 shares
Common Stock to be Outstandingimmediately after this Offering 6,144,444 shares
Use of Proceeds To finance the growth of the Company’s operations, primarilyby additions to working capital, to permit the financing ofadditional inventory and accounts receivable relating toincreased sales and to repay a $2,000,000 note.
NASDAQ Symbol GIII

Exhibit 5 IPO Prospectus: Page 4.
CONSOLIDATED AND COMBINED SUMMARY FINANCIAL INFORMATION(Dollars in thousands except per share data)
Three MonthsYear Ended July 31, (1) Ended October 31,
1985 1986 1987 1988 1989 1988 1989INCOME STATEMENT DATA:
Net sales $11,100 $21,375 $30,260 $50,002 $98,786 $30,734 $53,778Gross profit 2,089 2,922 4,673 7,882 17,129 5,023 9,930Selling, general and administrativeexpenses 2,018 2,350 2,635 3,951 5,416 1,558 2,460Operating profit 71 572 2,038 3,931 11,713 3,465 7,470
Income before income taxes 48 301 1,533 3,086 10,347 3,191 6,652Net income 40 154 727 2,719 9,526 2,921 3,780
Pro forma net income (2) 40 154 727 1,724 5,940 1,813 3,780
Pro forma net income percommon share based upon4,644,444 shares outstanding ineach period $.01 $.03 $.16 $.37 $1.28 $.39 $.81
July 31, 1989 October 31, 1989 (1)BALANCE SHEET DATA: Actual As Adjusted (3)
Working capital $ 6,199 $ 9,827 $25,510Total assets 38,089 41,181 41,181Short-term debt 20,547 18,778 4,938Long-term debt 3,547 3,480 1,480Total stockholders’ equity 5,317 9,096 26,779
—————–(1) See Note 1 to “Selected Consolidated and Combined Financial Data.”(2) Pro forma net income represents net income less a pro forma provision for income taxes. A subsidiary ofthe Company elected to be treated as a Subchapter S corporation for the years ended July 31, 1988 and 1989and, as a result, was not subject to Federal and New York State income taxes for such years.(3) Adjusted to reflect the sale of 1,500,000 shares of Common Stock by the Company hereby and the anticipateduse of the net proceeds therefrom.
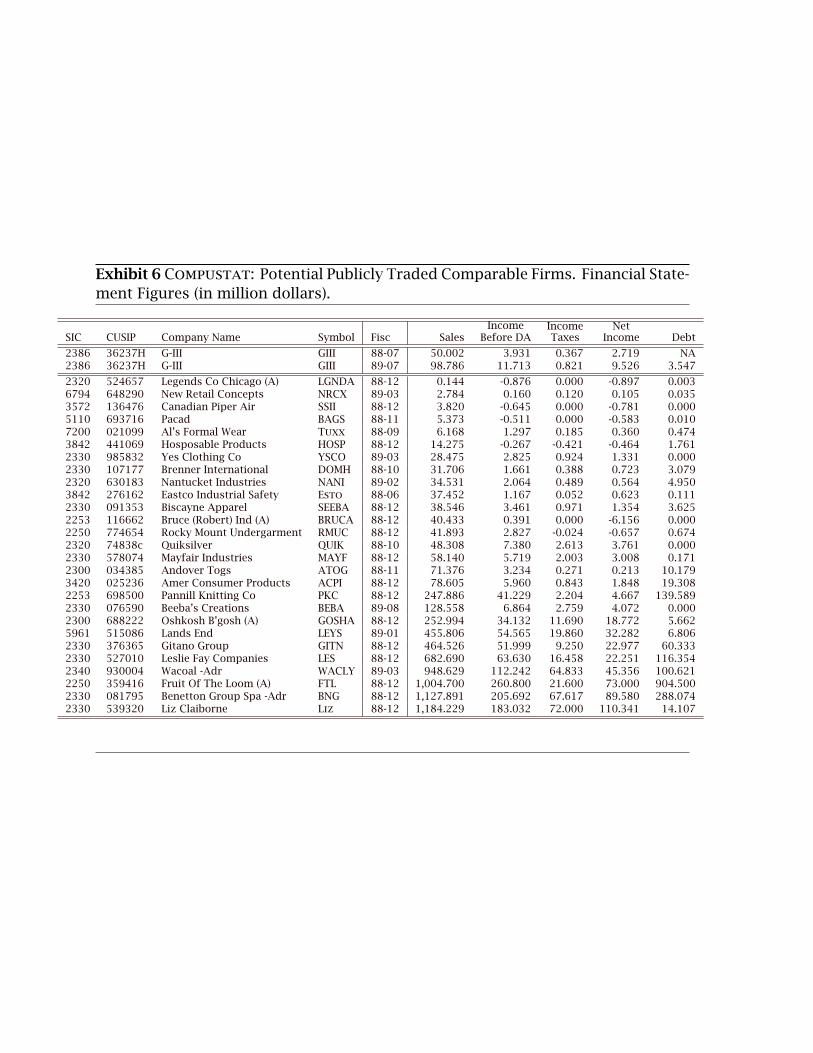
Exhibit 6 Compustat: Potential Publicly Traded Comparable Firms. Financial State-ment Figures (in million dollars).
SIC CUSIP Company Name Symbol Fisc SalesIncome
Before DAIncomeTaxes
NetIncome Debt
2386 36237H G-III GIII 88-07 50.002 3.931 0.367 2.719 NA2386 36237H G-III GIII 89-07 98.786 11.713 0.821 9.526 3.547
2320 524657 Legends Co Chicago (A) LGNDA 88-12 0.144 -0.876 0.000 -0.897 0.0036794 648290 New Retail Concepts NRCX 89-03 2.784 0.160 0.120 0.105 0.0353572 136476 Canadian Piper Air SSII 88-12 3.820 -0.645 0.000 -0.781 0.0005110 693716 Pacad BAGS 88-11 5.373 -0.511 0.000 -0.583 0.0107200 021099 Al’s Formal Wear Tuxx 88-09 6.168 1.297 0.185 0.360 0.4743842 441069 Hosposable Products HOSP 88-12 14.275 -0.267 -0.421 -0.464 1.7612330 985832 Yes Clothing Co YSCO 89-03 28.475 2.825 0.924 1.331 0.0002330 107177 Brenner International DOMH 88-10 31.706 1.661 0.388 0.723 3.0792320 630183 Nantucket Industries NANI 89-02 34.531 2.064 0.489 0.564 4.9503842 276162 Eastco Industrial Safety Esto 88-06 37.452 1.167 0.052 0.623 0.1112330 091353 Biscayne Apparel SEEBA 88-12 38.546 3.461 0.971 1.354 3.6252253 116662 Bruce (Robert) Ind (A) BRUCA 88-12 40.433 0.391 0.000 -6.156 0.0002250 774654 Rocky Mount Undergarment RMUC 88-12 41.893 2.827 -0.024 -0.657 0.6742320 74838c Quiksilver QUIK 88-10 48.308 7.380 2.613 3.761 0.0002330 578074 Mayfair Industries MAYF 88-12 58.140 5.719 2.003 3.008 0.1712300 034385 Andover Togs ATOG 88-11 71.376 3.234 0.271 0.213 10.1793420 025236 Amer Consumer Products ACPI 88-12 78.605 5.960 0.843 1.848 19.3082253 698500 Pannill Knitting Co PKC 88-12 247.886 41.229 2.204 4.667 139.5892330 076590 Beeba’s Creations BEBA 89-08 128.558 6.864 2.759 4.072 0.0002300 688222 Oshkosh B’gosh (A) GOSHA 88-12 252.994 34.132 11.690 18.772 5.6625961 515086 Lands End LEYS 89-01 455.806 54.565 19.860 32.282 6.8062330 376365 Gitano Group GITN 88-12 464.526 51.999 9.250 22.977 60.3332330 527010 Leslie Fay Companies LES 88-12 682.690 63.630 16.458 22.251 116.3542340 930004 Wacoal -Adr WACLY 89-03 948.629 112.242 64.833 45.356 100.6212250 359416 Fruit Of The Loom (A) FTL 88-12 1,004.700 260.800 21.600 73.000 904.5002330 081795 Benetton Group Spa -Adr BNG 88-12 1,127.891 205.692 67.617 89.580 288.0742330 539320 Liz Claiborne Liz 88-12 1,184.229 183.032 72.000 110.341 14.107
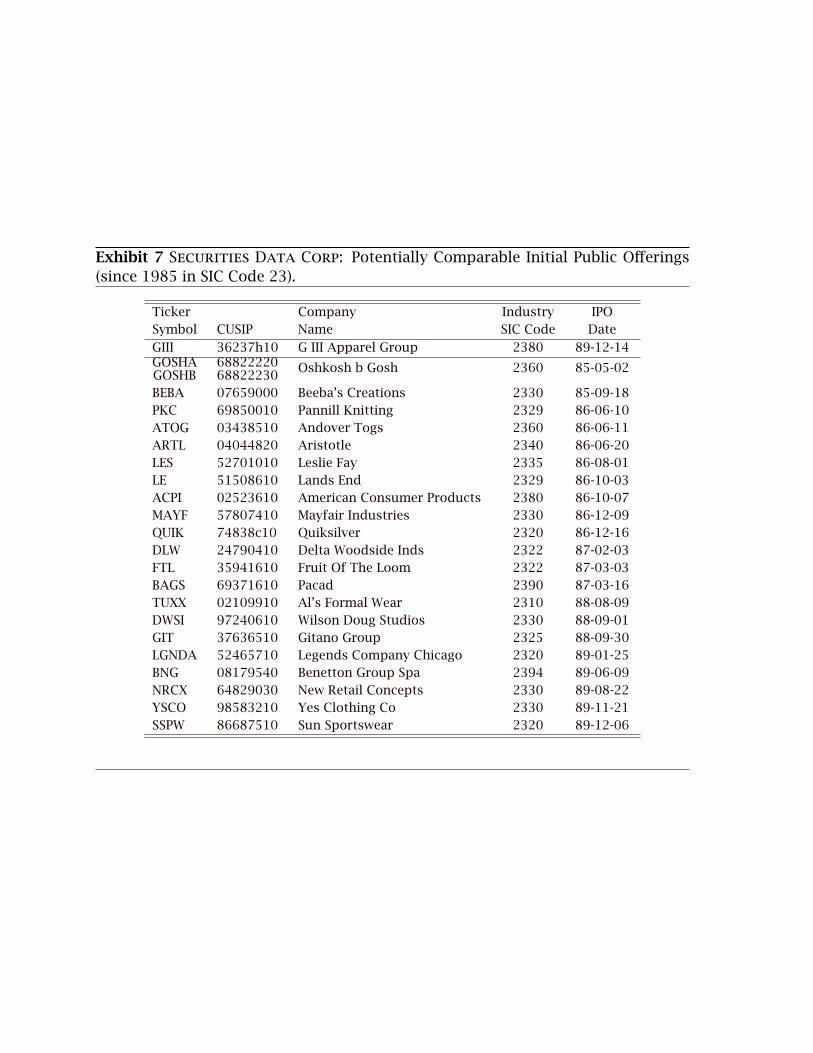
Exhibit 7 Securities Data Corp: Potentially Comparable Initial Public Offerings(since 1985 in SIC Code 23).
Ticker Company Industry IPOSymbol CUSIP Name SIC Code Date
GIII 36237h10 G III Apparel Group 2380 89-12-14GOSHAGOSHB
6882222068822230
Oshkosh b Gosh 2360 85-05-02
BEBA 07659000 Beeba’s Creations 2330 85-09-18PKC 69850010 Pannill Knitting 2329 86-06-10ATOG 03438510 Andover Togs 2360 86-06-11ARTL 04044820 Aristotle 2340 86-06-20LES 52701010 Leslie Fay 2335 86-08-01LE 51508610 Lands End 2329 86-10-03ACPI 02523610 American Consumer Products 2380 86-10-07MAYF 57807410 Mayfair Industries 2330 86-12-09QUIK 74838c10 Quiksilver 2320 86-12-16DLW 24790410 Delta Woodside Inds 2322 87-02-03FTL 35941610 Fruit Of The Loom 2322 87-03-03BAGS 69371610 Pacad 2390 87-03-16TUXX 02109910 Al’s Formal Wear 2310 88-08-09DWSI 97240610 Wilson Doug Studios 2330 88-09-01GIT 37636510 Gitano Group 2325 88-09-30LGNDA 52465710 Legends Company Chicago 2320 89-01-25BNG 08179540 Benetton Group Spa 2394 89-06-09NRCX 64829030 New Retail Concepts 2330 89-08-22YSCO 98583210 Yes Clothing Co 2330 89-11-21SSPW 86687510 Sun Sportswear 2320 89-12-06
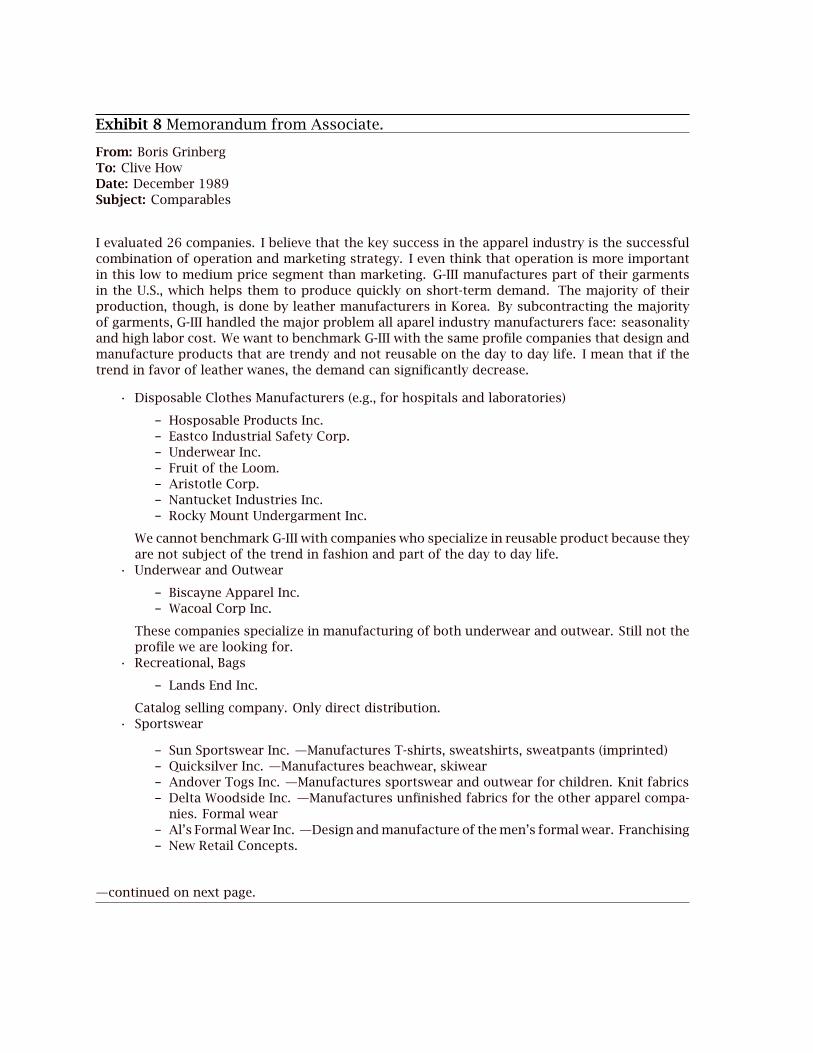
Exhibit 8 Memorandum from Associate.
From: Boris GrinbergTo: Clive HowDate: December 1989Subject: Comparables
I evaluated 26 companies. I believe that the key success in the apparel industry is the successfulcombination of operation and marketing strategy. I even think that operation is more importantin this low to medium price segment than marketing. G-III manufactures part of their garmentsin the U.S., which helps them to produce quickly on short-term demand. The majority of theirproduction, though, is done by leather manufacturers in Korea. By subcontracting the majorityof garments, G-III handled the major problem all aparel industry manufacturers face: seasonalityand high labor cost. We want to benchmark G-III with the same profile companies that design andmanufacture products that are trendy and not reusable on the day to day life. I mean that if thetrend in favor of leather wanes, the demand can significantly decrease.
• Disposable Clothes Manufacturers (e.g., for hospitals and laboratories)
– Hosposable Products Inc.– Eastco Industrial Safety Corp.– Underwear Inc.– Fruit of the Loom.– Aristotle Corp.– Nantucket Industries Inc.– Rocky Mount Undergarment Inc.
We cannot benchmark G-III with companies who specialize in reusable product because theyare not subject of the trend in fashion and part of the day to day life.
• Underwear and Outwear
– Biscayne Apparel Inc.– Wacoal Corp Inc.
These companies specialize in manufacturing of both underwear and outwear. Still not theprofile we are looking for.
• Recreational, Bags
– Lands End Inc.
Catalog selling company. Only direct distribution.• Sportswear
– Sun Sportswear Inc. —Manufactures T-shirts, sweatshirts, sweatpants (imprinted)– Quicksilver Inc. —Manufactures beachwear, skiwear– Andover Togs Inc. —Manufactures sportswear and outwear for children. Knit fabrics– Delta Woodside Inc. —Manufactures unfinished fabrics for the other apparel compa-
nies. Formal wear– Al’s Formal Wear Inc. —Design and manufacture of the men’s formal wear. Franchising– New Retail Concepts.
—continued on next page.

Exhibit 8 Memorandum from Associate – Continued.
• Dresses and Suits
– Leslie Fay - Manufactures Dresses and Suits for women.
• J. Designer Products
– Liz Claiborne
High price exclusive products. G-III manufactures moderate price garments and we wouldlike to benchmark it with companies that are in the same price range.
• Liturgical Vesture
– Martinez and Murphy-Design and manufacture of high quality Liturgical Vesture forclergy and churches.
• Non-apparel industries
– American Consumer Products Inc. - Manufacture of knives, building hardware, petproducts, letters , numbers and signs; gloves and rainwear
– Brenner Company-Engaged in business of fabricating and selling steel, waste removalequipment.
Best ChoicesHere are my top choices for comparables:
Yes Clothing Company designs and manufactures stylish women youth clothing. A partof their manufacturing is done in Far East. Price range is moderate.
Oshkosh B Gosh designs and manufactures men’s and women’s clothing, but at a moderateprice. They sell part of their garment as a private label.
Benetton Group designs and manufactures fashionable and stylish, bright colors casualwear. The majority of their production is done by subcontractors. (Unfortunately, asan Italian company, comparables are harder to come by.)
Alternate ChoicesThe following is the alternate group of three companies that have some similarities withG-III, but not as strong as previous ones.
Legends of Chicago Manufactures sportswear, blazer jackets and shirt tops.
Mayfair Industries Manufactures long and short sleeve casual garments, including T-shirt,sweatshirt and maternity oversized tops.
Gitano Group Manufacture men’s and women’s jeanswear and sportswear, women under-wear and other apparel.
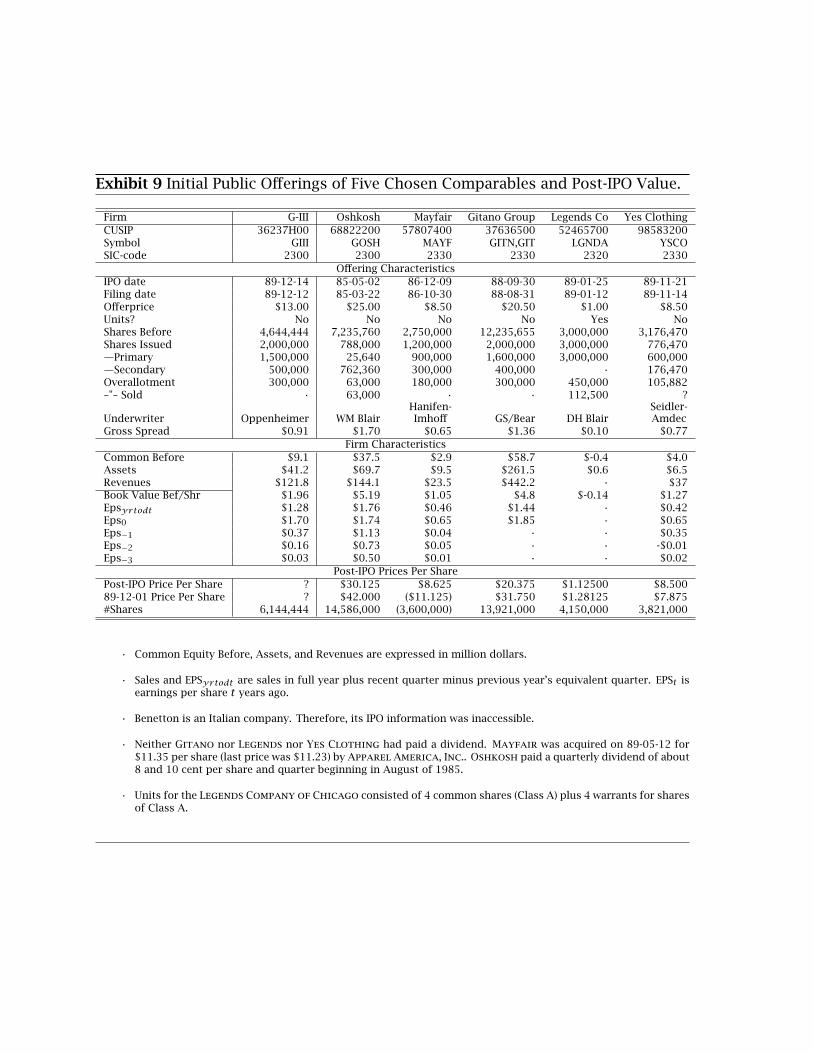
Exhibit 9 Initial Public Offerings of Five Chosen Comparables and Post-IPO Value.
Firm G-III Oshkosh Mayfair Gitano Group Legends Co Yes ClothingCUSIP 36237H00 68822200 57807400 37636500 52465700 98583200Symbol GIII GOSH MAYF GITN,GIT LGNDA YSCOSIC-code 2300 2300 2330 2330 2320 2330
Offering CharacteristicsIPO date 89-12-14 85-05-02 86-12-09 88-09-30 89-01-25 89-11-21Filing date 89-12-12 85-03-22 86-10-30 88-08-31 89-01-12 89-11-14Offerprice $13.00 $25.00 $8.50 $20.50 $1.00 $8.50Units? No No No No Yes NoShares Before 4,644,444 7,235,760 2,750,000 12,235,655 3,000,000 3,176,470Shares Issued 2,000,000 788,000 1,200,000 2,000,000 3,000,000 776,470—Primary 1,500,000 25,640 900,000 1,600,000 3,000,000 600,000—Secondary 500,000 762,360 300,000 400,000 · 176,470Overallotment 300,000 63,000 180,000 300,000 450,000 105,882–"– Sold · 63,000 · · 112,500 ?
Underwriter Oppenheimer WM BlairHanifen-Imhoff GS/Bear DH Blair
Seidler-Amdec
Gross Spread $0.91 $1.70 $0.65 $1.36 $0.10 $0.77Firm Characteristics
Common Before $9.1 $37.5 $2.9 $58.7 $-0.4 $4.0Assets $41.2 $69.7 $9.5 $261.5 $0.6 $6.5Revenues $121.8 $144.1 $23.5 $442.2 · $37Book Value Bef/Shr $1.96 $5.19 $1.05 $4.8 $-0.14 $1.27Epsyrtodt $1.28 $1.76 $0.46 $1.44 · $0.42Eps0 $1.70 $1.74 $0.65 $1.85 · $0.65Eps−1 $0.37 $1.13 $0.04 · · $0.35Eps−2 $0.16 $0.73 $0.05 · · -$0.01Eps−3 $0.03 $0.50 $0.01 · · $0.02
Post-IPO Prices Per SharePost-IPO Price Per Share ? $30.125 $8.625 $20.375 $1.12500 $8.50089-12-01 Price Per Share ? $42.000 ($11.125) $31.750 $1.28125 $7.875#Shares 6,144,444 14,586,000 (3,600,000) 13,921,000 4,150,000 3,821,000
• Common Equity Before, Assets, and Revenues are expressed in million dollars.
• Sales and EPSyrtodt are sales in full year plus recent quarter minus previous year’s equivalent quarter. EPSt isearnings per share t years ago.
• Benetton is an Italian company. Therefore, its IPO information was inaccessible.
• Neither Gitano nor Legends nor Yes Clothing had paid a dividend. Mayfair was acquired on 89-05-12 for$11.35 per share (last price was $11.23) by Apparel America, Inc.. Oshkosh paid a quarterly dividend of about8 and 10 cent per share and quarter beginning in August of 1985.
• Units for the Legends Company of Chicago consisted of 4 common shares (Class A) plus 4 warrants for sharesof Class A.

Exhibit 10 Compustat: Financial Statements of Five Comparables.C
om
pa
ra
bles:
Mo
stR
ecen
tQ
ua
rt
er
lie
sfr
om
Co
mpu
sta
t
G-I
IIG
itan
oLe
gen
ds
May
fair
Osh
kosh
Yes
Clo
thin
gO
ct8
8O
ct8
9Se
p8
8Se
p8
9Se
p8
8Se
p8
9Se
p8
8Se
p8
9Se
p8
8Se
p8
9Se
p8
8Se
p8
9N
etSa
les
30
.73
45
3.7
78
11
9.0
11
17
8.6
15
NA
1.2
23
15
.87
5N
A8
4.9
64
10
7.8
84
NA
10
.63
4G
ross
Pro
fit
5.0
23
9.9
30
32
.53
44
9.1
79
0.3
31
4.5
99
23
.60
03
5.4
60
3.2
11
SG&
A1
.55
82
.46
02
2.5
97
30
.98
60
.65
82
.76
19
.55
61
1.7
21
2.0
59
Op
Inc
Bef
DA
3.4
99
NR
NR
NR
-0.3
27
NR
NR
NR
NR
Op
Inc
Aft
DA
3.4
65
7.4
70
9.9
37
18
.19
3-0
.33
31
.83
81
4.0
44
23
.73
91
.15
2In
cb
efore
Tax
3.1
91
6.6
52
6.0
67
12
.11
8-0
.32
91
.74
61
3.7
77
22
.79
60
.94
1N
etIn
com
e2
.92
13
.78
04
.05
58
.60
3-0
.32
91
.10
18
.50
61
3.9
86
0.5
76
Cu
rren
tA
sset
s3
8.4
31
23
8.8
29
32
0.6
88
1.9
87
25
.16
48
4.5
63
10
4.7
05
NR
Cu
rren
tLi
abil
itie
s2
8.6
04
12
9.8
39
14
3.6
62
1.1
28
10
.72
12
2.1
15
41
.19
6T
ota
lA
sset
s4
1.1
81
28
2.2
64
38
9.8
57
2.1
36
28
.52
91
11
.02
61
47
.20
0ST
Deb
t1
8.7
78
95
.03
08
6.8
41
0.2
00
3.7
20
1.1
17
13
.77
5LT
Deb
t3
.48
00
.52
21
24
.91
70
.00
00
.16
37
.51
66
.18
9St
ock
Equ
ity
9.0
96
94
.94
91
21
.07
01
.00
11
7.6
58
0.2
90
97
.53
5T
rad
edSi
nce
Not
Yet
88
09
30
89
01
31
86
12
09
85
05
02
89
11
21
Co
mpa
ra
bles:
Mo
stR
ecen
tA
nn
ua
ls
G-I
IIG
itan
oLe
gen
ds
May
fair
Osh
kosh
Yes
Clo
thin
g1
98
91
98
81
98
91
98
81
98
91
98
71
98
81
98
71
98
81
98
91
98
81
98
9N
etSa
les
98
.78
64
64
.53
62
5.8
90
.14
41
.98
53
2.6
00
58
.14
02
26
.29
82
52
.99
43
15
.07
62
8.4
75
40
.30
2G
ross
Pro
fit
17
.12
91
33
.79
18
3.7
0-0
.14
20
.01
01
0.3
41
16
.03
17
4.4
69
68
.29
01
10
.32
38
.27
51
3.2
75
SG&
A5
.41
68
1.7
91
16
.62
90
.73
42
.21
55
.38
31
0.3
12
29
.92
43
4.1
58
43
.43
55
.45
07
.73
4O
pIn
cB
efD
A1
1.8
67
52
.00
67
.06
6-0
.87
6-2
.20
54
.95
85
.71
94
4.5
45
34
.13
26
6.8
88
2.8
25
5.5
41
Op
Inc
Aft
DA
11
.71
34
7.8
06
0.0
13
-0.8
78
-2.2
70
4.8
03
5.2
92
41
.75
53
0.7
05
62
.63
52
.78
55
.46
3In
cb
efore
IncT
ax1
0.3
47
37
.44
-0.8
97
-2.6
81
4.9
20
5.0
11
42
.23
73
0.4
62
61
.37
82
.25
54
.95
4N
etIn
com
e9
.52
6?
22
.98
30
.70
-0.8
97
-2.6
81
4.7
70
3.8
40
23
.89
91
8.7
72
37
.59
81
.33
12
.93
9C
urr
ent
Ass
ets
35
.42
42
29
.54
35
7.6
50
.22
51
.11
91
5.3
27
20
.68
98
3.4
79
94
.34
61
15
.85
26
.05
51
2.4
40
Cu
rren
tLi
abil
itie
s2
0.3
84
13
6.1
93
14
.37
1.1
46
0.6
65
5.0
24
5.5
28
21
.21
23
4.0
62
27
.17
53
.32
42
.59
8T
ota
lA
sset
s3
8.0
89
5.8
93
3.6
10
.42
81
.29
22
0.1
95
24
.00
61
13
.27
11
39
.06
51
63
.26
66
.20
91
2.7
70
STD
ebt
20
.54
78
5.3
51
01
.67
0.8
02
0.2
51
0.3
74
1.0
86
1.1
24
12
.96
37
.66
10
0LT
Deb
t3
.54
76
0.3
31
36
.38
0.0
03
0.0
00
0.2
83
0.1
71
6.7
90
5.6
62
4.5
30
00
Stock
Equ
ity
5.3
17
95
.83
12
6.5
4-0
.72
10
.62
71
4.8
88
18
.30
78
3.4
28
97
.18
61
28
.65
22
.88
51
0.1
72
Note
s:A
nn
ual
19
87
Info
rmat
ion
for
Legen
ds,
Git
ano,a
nd
May
fair
was
un
avai
lab
le.
An
nu
al1
98
9In
form
atio
nfo
rO
shkosh
was
un
avai
lab
le.
All
figu
res
are
qu
ote
din
mil
lion
doll
ars.
Figu
res
for
19
89
are
esti
mat
ed.?
ind
icat
esth
atG
-III
had
toin
cur
add
itio
nal
Sub
chap
ter
Sin
com
eta
xes,
bri
ngin
gn
etin
com
eto
5.9
40
.G
ross
Pro
fit
are
“Net
Rev
enu
es”
(sal
esm
inu
sco
sts
of
good
sold
).

Exhibit 11 Accounting Ratios in Percent: Panel A (Current Assets)
Com
pan
yC
USI
PD
ate
Assetst
?
Salest
Assetst
?
Receiv
ablest
Assetst
?
Invento
riest
Assetst
?
Operatin
gIncomet
Assetst
?
Market
ValueEOY
Assetst
?
Backlogt
Assetst
?
Employeest
Assetst
?
WorkingCap
italAcc
rualst
Assetst
?
∆Salest
Assetst
?
G-I
II36237H
7-8
938.1
259.4
55.0
26.9
31.2
158.5
NM
0.6
30.7
127.8
Git
ano
37
63
65
12
-88
29
2.5
15
8.8
21
.95
1.9
17
.89
9.9
63
.01
.4.
.
Lesl
ieFa
y5
27
01
01
2-8
83
63
.01
88
.03
0.3
29
.51
7.5
48
.65
4.0
1.1
3.8
27
.7
Liz
Cla
iborn
e5
39
32
01
2-8
86
29
.11
88
.21
0.9
26
.72
9.1
24
0.7
46
.10
.8-5
.82
0.8
May
fair
57
80
74
12
-88
24
.02
42
.23
8.6
44
.02
3.8
12
5.6
43
.51
.42
6.6
10
6.4
Bee
ba’
s6
54
76
M8
-88
51
.12
00
.43
9.9
38
.21
.26
8.6
72
.40
.82
.3-1
0.2
Osh
kosh
B’G
osh
68
82
22
12
-88
13
9.1
18
1.9
14
.65
3.1
24
.52
33
.46
6.9
4.2
4.9
19
.2
Yes
Clo
thin
g9
85
83
23
-88
6.2
45
8.6
25
.06
3.8
45
.5.
..
..
Git
ano
37
63
65
12
-89
44
0.9
14
2.0
26
.45
1.5
15
.29
3.9
77
.51
.01
9.6
36
.6
Lesl
ieFa
y5
27
01
01
2-8
93
87
.32
03
.03
0.3
31
.31
8.7
49
.35
0.9
1.1
9.7
26
.7
Liz
Cla
iborn
e5
39
32
01
2-8
98
48
.51
66
.31
5.5
23
.43
1.0
24
9.4
37
.80
.64
.82
6.7
Bee
ba’
s6
54
76
M8
-89
51
.82
48
.05
0.3
41
.81
4.0
84
.19
5.1
1.1
13
.85
0.5
Osh
kosh
B’G
osh
68
82
22
12
-89
16
3.3
19
3.0
14
.15
4.7
41
.03
66
.34
8.4
3.8
15
.43
8.0
IndividualComparables
Yes
Clo
thin
g9
85
83
23
-89
12
.83
15
.66
9.3
21
.74
3.4
22
4.4
62
.60
.85
5.3
92
.6
Mea
n8
82
32
.81
98
.32
4.8
34
.63
.61
83
.65
2.3
2.3
1.2
10
.0
Med
ian
88
32
.91
81
.92
5.0
38
.21
4.5
99
.95
2.6
1.6
4.1
18
.1
Std
dev
27Fi
rms
88
45
2.9
12
0.3
14
.41
8.1
48
.62
23
.62
7.7
2.1
19
.49
9.6
Mea
n8
92
96
.51
92
.32
6.0
36
.01
0.9
19
1.1
55
.22
.01
4.8
45
.6
Med
ian
89
41
.31
87
.82
5.3
40
.11
6.4
13
3.0
48
.41
.41
2.4
31
.7
Std
dev
24Fi
rms
89
53
1.9
98
.91
6.1
17
.24
2.4
17
4.1
49
.21
.42
2.1
92
.8
Mea
n8
8+
89
26
2.2
19
5.5
25
.33
5.3
7.0
18
7.4
53
.82
.18
.02
8.6
Med
ian
88
+8
93
8.2
18
2.7
25
.23
8.8
15
.21
03
.04
8.4
1.4
5.9
20
.0
WideComparables
Std
dev
51Fi
rms
88
+8
94
87
.01
09
.71
5.1
17
.54
5.5
19
7.7
39
.31
.82
1.7
96
.7
Note
s:T
able
Des
crip
tion
Foll
ow
sat
End
.
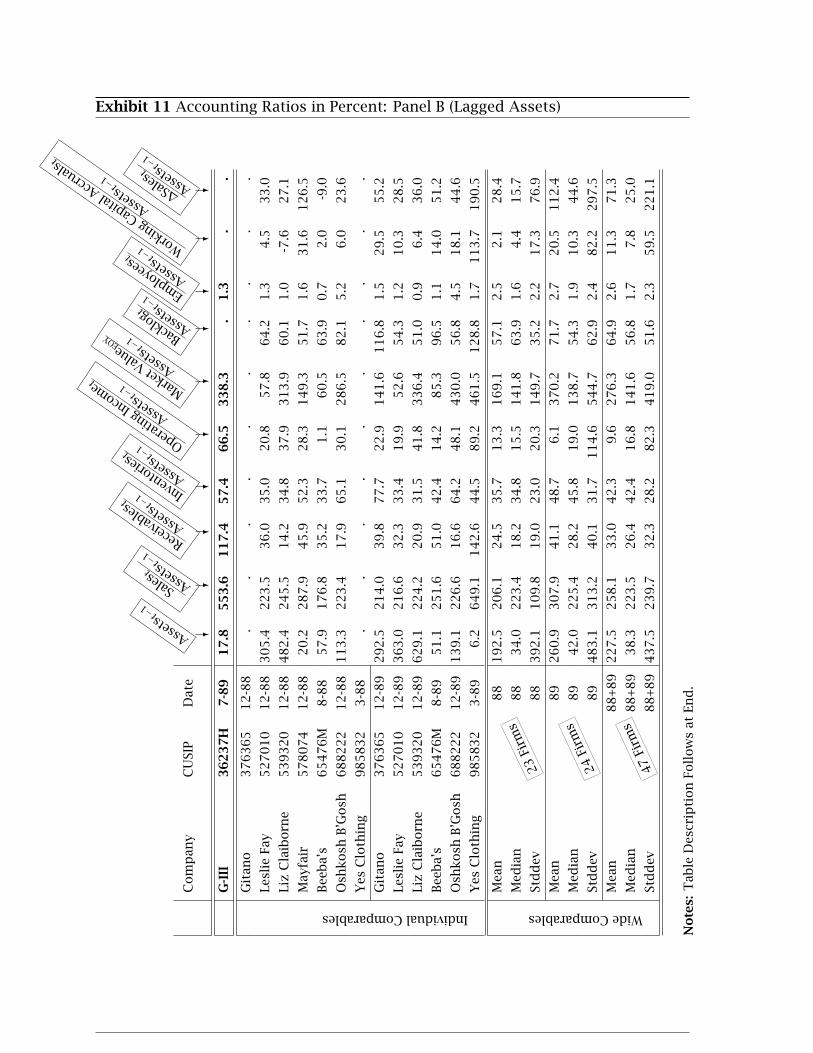
Exhibit 11 Accounting Ratios in Percent: Panel B (Lagged Assets)
Com
pan
yC
USI
PD
ate
Assetst−1
?
Salest
Assetst−1
?
Receiv
ablest
Assetst−1
?
Invento
riest
Assetst−1
?
Operatin
gIncomet
Assetst−1
?
Market
ValueEOY
Assetst−1
?
Backlogt
Assetst−1
?
Employeest
Assetst−1
?
WorkingCap
italAcc
rualst
Assetst−1
?
∆Salest
Assetst−1
?
G-I
II36237H
7-8
917.8
553.6
117.4
57.4
66.5
338.3
.1.3
..
Git
ano
37
63
65
12
-88
..
..
..
..
..
Lesl
ieFa
y5
27
01
01
2-8
83
05
.42
23
.53
6.0
35
.02
0.8
57
.86
4.2
1.3
4.5
33
.0
Liz
Cla
iborn
e5
39
32
01
2-8
84
82
.42
45
.51
4.2
34
.83
7.9
31
3.9
60
.11
.0-7
.62
7.1
May
fair
57
80
74
12
-88
20
.22
87
.94
5.9
52
.32
8.3
14
9.3
51
.71
.63
1.6
12
6.5
Bee
ba’
s6
54
76
M8
-88
57
.91
76
.83
5.2
33
.71
.16
0.5
63
.90
.72
.0-9
.0
Osh
kosh
B’G
osh
68
82
22
12
-88
11
3.3
22
3.4
17
.96
5.1
30
.12
86
.58
2.1
5.2
6.0
23
.6
Yes
Clo
thin
g9
85
83
23
-88
..
..
..
..
..
Git
ano
37
63
65
12
-89
29
2.5
21
4.0
39
.87
7.7
22
.91
41
.61
16
.81
.52
9.5
55
.2
Lesl
ieFa
y5
27
01
01
2-8
93
63
.02
16
.63
2.3
33
.41
9.9
52
.65
4.3
1.2
10
.32
8.5
Liz
Cla
iborn
e5
39
32
01
2-8
96
29
.12
24
.22
0.9
31
.54
1.8
33
6.4
51
.00
.96
.43
6.0
Bee
ba’
s6
54
76
M8
-89
51
.12
51
.65
1.0
42
.41
4.2
85
.39
6.5
1.1
14
.05
1.2
Osh
kosh
B’G
osh
68
82
22
12
-89
13
9.1
22
6.6
16
.66
4.2
48
.14
30
.05
6.8
4.5
18
.14
4.6
IndividualComparables
Yes
Clo
thin
g9
85
83
23
-89
6.2
64
9.1
14
2.6
44
.58
9.2
46
1.5
12
8.8
1.7
11
3.7
19
0.5
Mea
n8
81
92
.52
06
.12
4.5
35
.71
3.3
16
9.1
57
.12
.52
.12
8.4
Med
ian
88
34
.02
23
.41
8.2
34
.81
5.5
14
1.8
63
.91
.64
.41
5.7
Std
dev
23Fi
rms
88
39
2.1
10
9.8
19
.02
3.0
20
.31
49
.73
5.2
2.2
17
.37
6.9
Mea
n8
92
60
.93
07
.94
1.1
48
.76
.13
70
.27
1.7
2.7
20
.51
12
.4
Med
ian
89
42
.02
25
.42
8.2
45
.81
9.0
13
8.7
54
.31
.91
0.3
44
.6
Std
dev
24Fi
rms
89
48
3.1
31
3.2
40
.13
1.7
11
4.6
54
4.7
62
.92
.48
2.2
29
7.5
Mea
n8
8+
89
22
7.5
25
8.1
33
.04
2.3
9.6
27
6.3
64
.92
.61
1.3
71
.3
Med
ian
88
+8
93
8.3
22
3.5
26
.44
2.4
16
.81
41
.65
6.8
1.7
7.8
25
.0
WideComparables
Std
dev
47Fi
rms
88
+8
94
37
.52
39
.73
2.3
28
.28
2.3
41
9.0
51
.62
.35
9.5
22
1.1
Note
s:T
able
Des
crip
tion
Foll
ow
sat
End
.
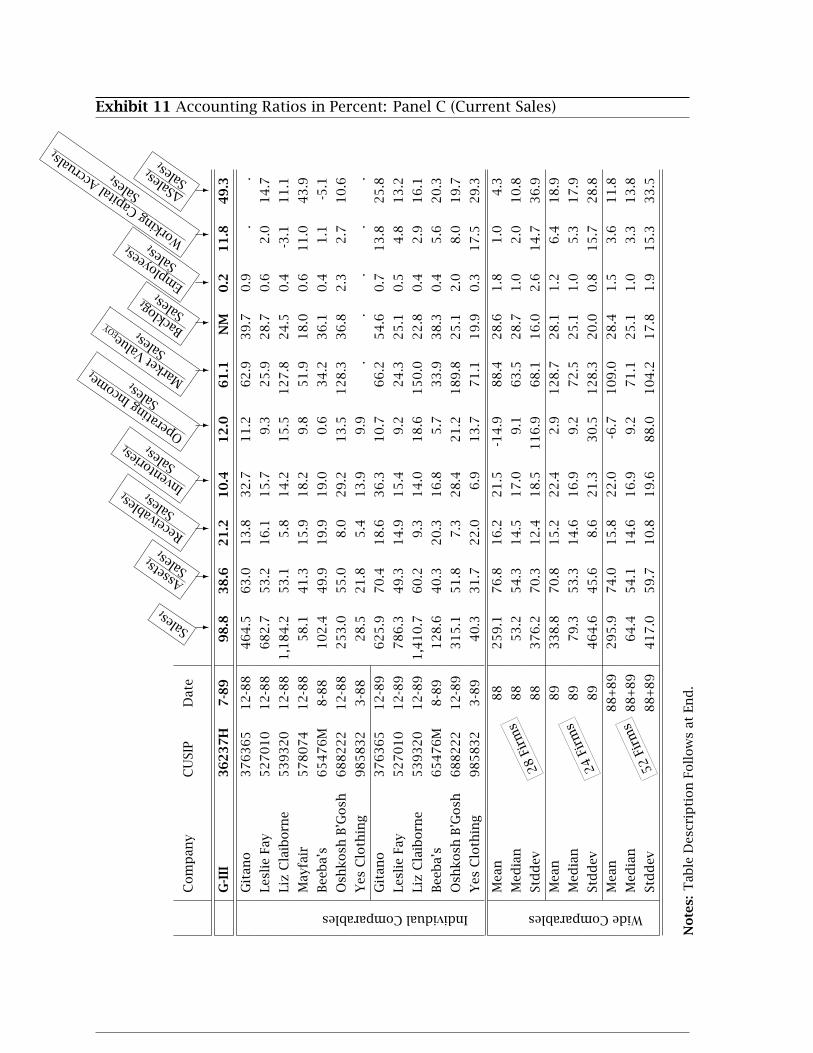
Exhibit 11 Accounting Ratios in Percent: Panel C (Current Sales)
Com
pan
yC
USI
PD
ate
Salest
?
Assetst
Salest
?
Receiv
ablest
Salest
?
Invento
riest
Salest
?
Operatin
gIncomet
Salest
?
Market
ValueEOY
Salest
?
Backlogt Sa
lest
?
Employeest
Salest
?
WorkingCap
italAcc
rualst
Salest
?
∆Salest
Salest
?
G-I
II36237H
7-8
998.8
38.6
21.2
10.4
12.0
61.1
NM
0.2
11.8
49.3
Git
ano
37
63
65
12
-88
46
4.5
63
.01
3.8
32
.71
1.2
62
.93
9.7
0.9
..
Lesl
ieFa
y5
27
01
01
2-8
86
82
.75
3.2
16
.11
5.7
9.3
25
.92
8.7
0.6
2.0
14
.7
Liz
Cla
iborn
e5
39
32
01
2-8
81
,18
4.2
53
.15
.81
4.2
15
.51
27
.82
4.5
0.4
-3.1
11
.1
May
fair
57
80
74
12
-88
58
.14
1.3
15
.91
8.2
9.8
51
.91
8.0
0.6
11
.04
3.9
Bee
ba’
s6
54
76
M8
-88
10
2.4
49
.91
9.9
19
.00
.63
4.2
36
.10
.41
.1-5
.1
Osh
kosh
B’G
osh
68
82
22
12
-88
25
3.0
55
.08
.02
9.2
13
.51
28
.33
6.8
2.3
2.7
10
.6
Yes
Clo
thin
g9
85
83
23
-88
28
.52
1.8
5.4
13
.99
.9.
..
..
Git
ano
37
63
65
12
-89
62
5.9
70
.41
8.6
36
.31
0.7
66
.25
4.6
0.7
13
.82
5.8
Lesl
ieFa
y5
27
01
01
2-8
97
86
.34
9.3
14
.91
5.4
9.2
24
.32
5.1
0.5
4.8
13
.2
Liz
Cla
iborn
e5
39
32
01
2-8
91
,41
0.7
60
.29
.31
4.0
18
.61
50
.02
2.8
0.4
2.9
16
.1
Bee
ba’
s6
54
76
M8
-89
12
8.6
40
.32
0.3
16
.85
.73
3.9
38
.30
.45
.62
0.3
Osh
kosh
B’G
osh
68
82
22
12
-89
31
5.1
51
.87
.32
8.4
21
.21
89
.82
5.1
2.0
8.0
19
.7
IndividualComparables
Yes
Clo
thin
g9
85
83
23
-89
40
.33
1.7
22
.06
.91
3.7
71
.11
9.9
0.3
17
.52
9.3
Mea
n8
82
59
.17
6.8
16
.22
1.5
-14
.98
8.4
28
.61
.81
.04
.3
Med
ian
88
53
.25
4.3
14
.51
7.0
9.1
63
.52
8.7
1.0
2.0
10
.8
Std
dev
28Fi
rms
88
37
6.2
70
.31
2.4
18
.51
16
.96
8.1
16
.02
.61
4.7
36
.9
Mea
n8
93
38
.87
0.8
15
.22
2.4
2.9
12
8.7
28
.11
.26
.41
8.9
Med
ian
89
79
.35
3.3
14
.61
6.9
9.2
72
.52
5.1
1.0
5.3
17
.9
Std
dev
24Fi
rms
89
46
4.6
45
.68
.62
1.3
30
.51
28
.32
0.0
0.8
15
.72
8.8
Mea
n8
8+
89
29
5.9
74
.01
5.8
22
.0-6
.71
09
.02
8.4
1.5
3.6
11
.8
Med
ian
88
+8
96
4.4
54
.11
4.6
16
.99
.27
1.1
25
.11
.03
.31
3.8
WideComparables
Std
dev
52Fi
rms
88
+8
94
17
.05
9.7
10
.81
9.6
88
.01
04
.21
7.8
1.9
15
.33
3.5
Note
s:T
able
Des
crip
tion
Foll
ow
sat
End
.

Exhibit 11 Accounting Ratios in Percent: Panel D (Market-Value Based)
Com
pan
yC
USI
PD
ate
Market-
ValueEOY
?
Salest
Market-
ValueEOY
?
Receiv
ablest
Market-
ValueEOY
?
Invento
riest
Market-
ValueEOY
?
Operatin
gIncomet
Market-
ValueEOY
?
Assetst
Market-
ValueEOY
?
Backlogt
Market-
ValueEOY
?
Employeest
Market-
ValueEOY
?
WorkingCap
italAcc
rualst
Market-
ValueEOY
?
∆Salest
Market-
ValueEOY
?
G-I
IIPre
-Off
erin
g36237H
7-8
960.4
141.0
29.9
14.7
17.0
54.4
NM
0.4
13.6
56.6
G-I
IIPost
-Off
erin
g36237H
7-8
980.0
123.7
26.2
12.9
14.9
47.7
NM
0.3
11.9
49.6
Git
ano
37
63
65
12
-88
29
2.3
15
8.9
21
.95
1.9
17
.81
00
.16
3.0
1.4
..
Lesl
ieFa
y5
27
01
01
2-8
81
76
.53
86
.86
2.3
60
.63
6.0
20
5.7
11
1.0
2.3
7.8
57
.0
Liz
Cla
iborn
e5
39
32
01
2-8
81
,51
4.0
78
.24
.51
1.1
12
.14
1.6
19
.20
.3-2
.48
.6
May
fair
57
80
74
12
-88
30
.11
92
.83
0.7
35
.11
9.0
79
.63
4.7
1.1
21
.28
4.7
Bee
ba’
s6
54
76
M8
-88
35
.12
92
.05
8.2
55
.61
.81
45
.71
05
.51
.13
.3-1
4.8
Osh
kosh
B’G
osh
68
82
22
12
-88
32
4.5
78
.06
.22
2.7
10
.54
2.9
28
.71
.82
.18
.2
Yes
Clo
thin
g9
85
83
23
-88
..
..
..
..
..
Git
ano
37
63
65
12
.89
43
8.5
14
2.7
26
.55
1.8
15
.31
00
.57
7.9
1.0
19
.73
6.8
Lesl
ieFa
y5
27
01
01
2.8
91
95
.74
01
.85
9.9
61
.93
6.9
19
7.9
10
0.7
2.2
19
.15
2.9
Liz
Cla
iborn
e5
39
32
01
2.8
92
,20
4.6
64
.06
.09
.01
1.9
38
.51
4.6
0.2
1.8
10
.3
Bee
ba’
s6
54
76
M8
.89
49
.22
61
.55
3.1
44
.11
4.8
10
5.4
10
0.3
1.1
14
.65
3.2
Osh
kosh
B’G
osh
68
82
22
12
.89
60
1.7
52
.43
.81
4.8
11
.12
7.1
13
.11
.04
.21
0.3
IndividualComparables
Yes
Clo
thin
g9
85
83
23
.89
30
.61
31
.82
9.0
9.0
18
.14
1.8
26
.20
.32
3.1
38
.7
Mea
n8
82
41
.72
01
.42
7.3
43
.61
4.2
12
9.1
80
.23
.31
.81
7.8
Med
ian
88
30
.11
57
.42
3.0
28
.11
1.7
10
0.1
44
.71
.82
.21
8.4
Std
dev
23Fi
rms
88
43
6.1
16
6.2
25
.13
9.5
19
.81
13
.31
03
.74
.51
8.9
71
.0
Mea
n8
93
55
.72
22
.43
1.4
43
.91
5.4
11
5.1
61
.62
.61
0.5
23
.1
Med
ian
89
31
.91
38
.01
9.8
20
.91
3.3
79
.23
7.7
1.1
11
.42
0.8
Std
dev
24Fi
rms
89
58
8.7
22
7.6
32
.34
6.6
16
.89
7.3
88
.73
.91
2.2
10
7.9
Mea
n8
8+
89
29
9.9
21
2.1
29
.44
3.7
14
.81
21
.97
0.6
2.9
6.2
20
.6
Med
ian
88
+8
93
0.1
14
0.6
21
.92
2.7
12
.49
7.0
37
.71
.34
.91
9.4
WideComparables
Std
dev
47Fi
rms
88
+8
95
17
.31
98
.02
8.8
42
.81
8.1
10
4.5
94
.94
.21
6.2
91
.6
Note
s:T
able
Des
crip
tion
Foll
ow
sat
End
.
Exhibit 11 Accounting Ratios in Percent: Explanations To Panels
Data Sources: The primary data source for comparable firms is the Compustat data base. The
primary data source for G-III is its IPO prospectus. November 1989 prices are obtained from the
CRSP data base.
Notation: All ratios are quoted in percent. A period denotes a missing value. The subscript tdenotes the fiscal year, “EOY” denotes end of year (the last trading day in December for 1988, the
last trading day in November for 1989).Data Items: Assets, sales, and market-values in the fifth column are quoted in million dollars. G-III’s pre-offering (post-offering) market-value was computed as 4.644 (6.144) million shares times$13 per share, or $80 ($60.4) million dollars, i.e., based on the number of shares outstandingpre-offering (post-offering). Sales are Net Sales. Operating Income is before depreciation andamortization. Working Capital Accruals are defined as
∆[current assets (4)− cash (1)]−∆[current liabilities (5)− current maturity of long-term debt (44)]
Working capital accruals (WKA) for G-III are computed from data in the IPO prospectus, page F3:
July1988
July1989
Oct.1989
Current Assets $16.0 $35.4 $38.4
Current Liabilities $12.3 $29.2 $28.6
Cash $0.4 $3.5 $1.1
Current Maturities of LT Debt $8.2 $20.5 $18.8
Therefore,WKA = ($31.9−$15.6)−($8.7−$4.1) = $11.7. In Oct. 1989,WKA = ($37.3−$31.9)−($9.8− $8.7) = $4.3. G-III sales were $98.8 million in 1989 (a change of $48.7 million from 1988),
$53.8 million in the first quarter of fiscal year 1990. Assets were $38.1 million as of 1989, $41.2
million as of the first quarter of fiscal year 1990. G-III’s IPO prospectus (p.19) describes its backlog
as “not meaningful.”
Comparables: The set of “wide comparable” firms consisted of the following firms, listed earlier
in Table 6: • Al’s Formal Wear (except in lagged-assets panel B due to a non-sensical figure) • American Consumer Products •Andover Togs • Benetton • Biscayne • Brenner • Bruce • Canadian Piper • Eastco • Fruit of the Loom • Gitano • Land’s
End • Legends Co • Leslie Fay • Liz Claiborne •Martinez •Mayfair • Nantucket • New Retail • Beeba’s • Oshkosh • Pacad
• Pannill • Quicksilver • Rocky Mountain Undergarment • Wacoal • Yes. The number of firms (angled box for
“wide comparables”) are based on firms for which sales/{denominator} could be computed, but
most other ratios have a similar number of firms. The exception is “Backlog” which is typically
available for only half of these firms.
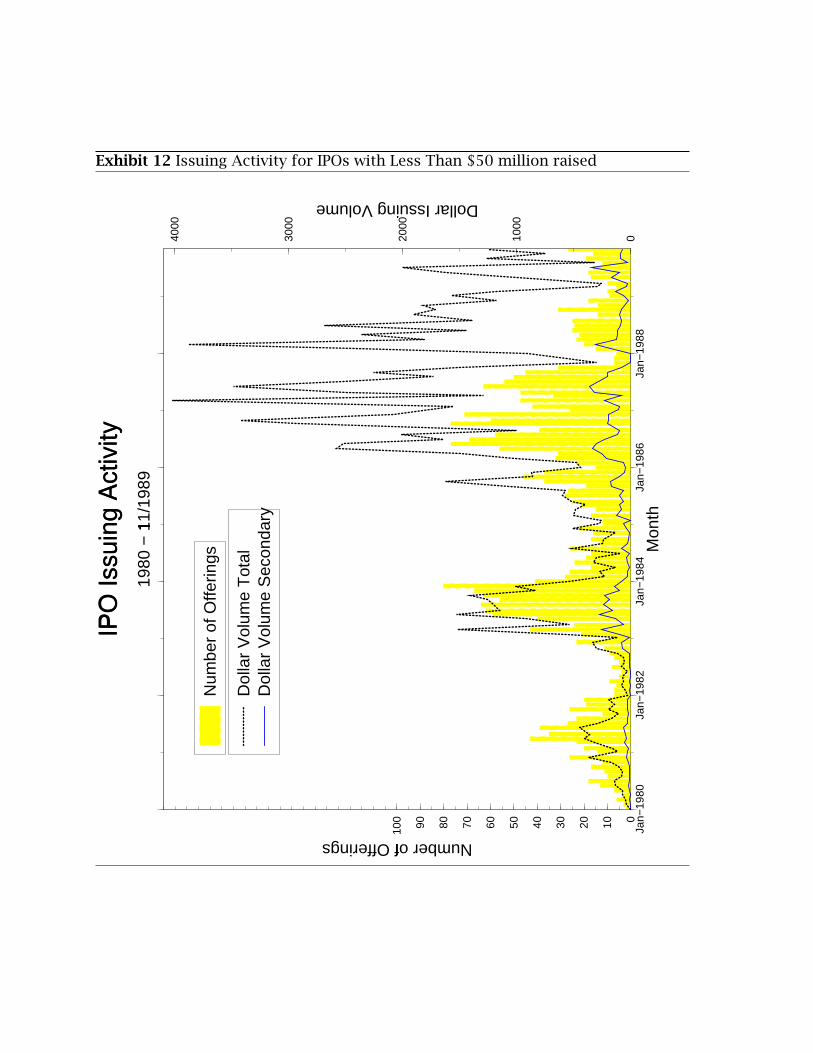
Exhibit 12 Issuing Activity for IPOs with Less Than $50 million raised
Jan−
1980
Jan−
1982
Jan−
1984
Jan−
1986
Jan−
1988
Mon
th0102030405060708090100
Number of Offerings �
IPO
Issu
ing
Act
ivity
1980
− 1
1/19
89
�
Num
ber
of O
fferin
gs
01000
2000
3000
4000
Dollar Issuing Volume �
Dol
lar
Vol
ume
Tot
alD
olla
r V
olum
e S
econ
dary
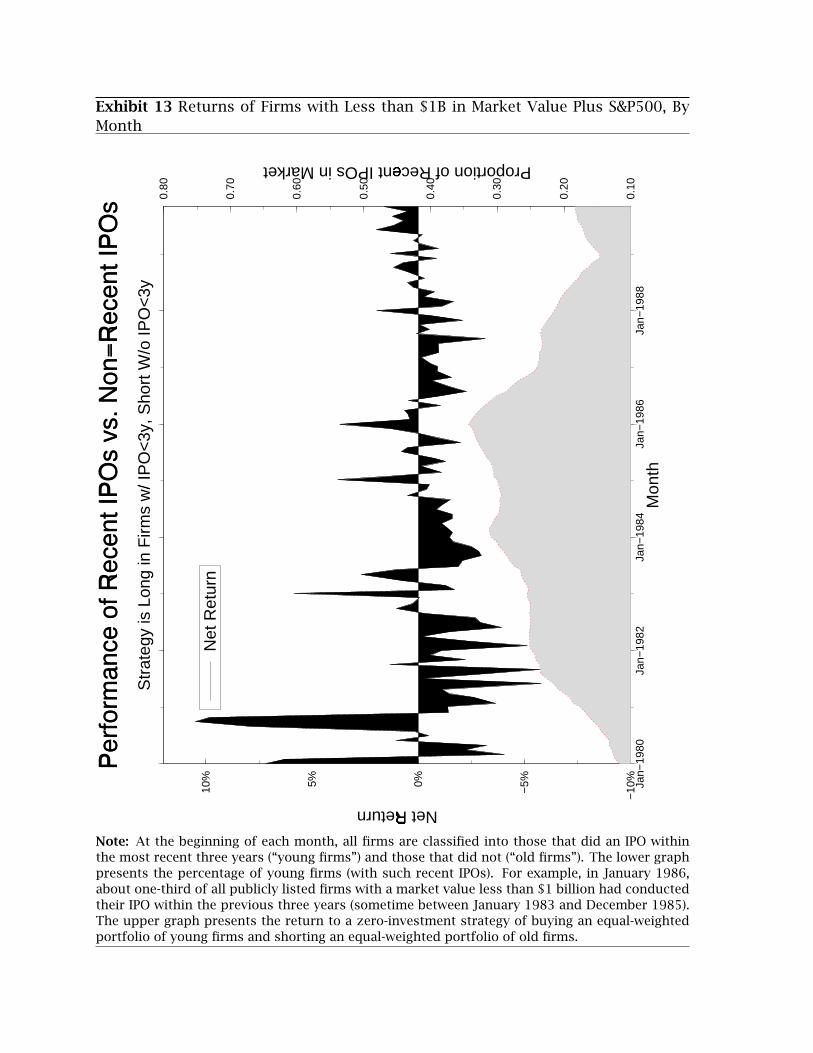
Exhibit 13 Returns of Firms with Less than $1B in Market Value Plus S&P500, ByMonth
Jan−
1980
Jan−
1982
Jan−
1984
Jan−
1986
Jan−
1988
Mon
th−
10%
−5%0%5%10
%
Net Return �
Per
form
ance
of R
ecen
t IP
Os
vs. N
on−
Rec
ent I
PO
sS
trat
egy
is L
ong
in F
irms
w/ I
PO
<3y
, Sho
rt W
/o IP
O<
3y
�
Net
Ret
urn
0.10
0.20
0.30
0.40
0.50
0.60
0.70
0.80
Proportion of Recent IPOs in Market �
Note: At the beginning of each month, all firms are classified into those that did an IPO withinthe most recent three years (“young firms”) and those that did not (“old firms”). The lower graphpresents the percentage of young firms (with such recent IPOs). For example, in January 1986,about one-third of all publicly listed firms with a market value less than $1 billion had conductedtheir IPO within the previous three years (sometime between January 1983 and December 1985).The upper graph presents the return to a zero-investment strategy of buying an equal-weightedportfolio of young firms and shorting an equal-weighted portfolio of old firms.
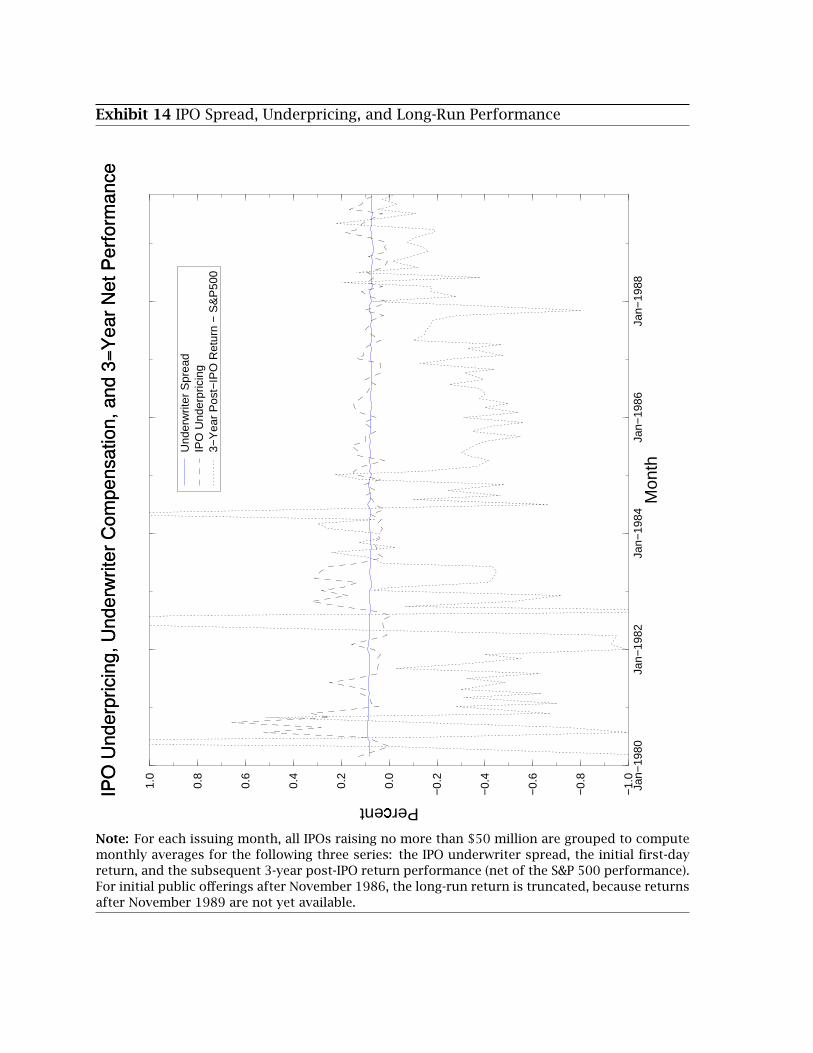
Exhibit 14 IPO Spread, Underpricing, and Long-Run Performance
Jan−
1980
Jan−
1982
Jan−
1984
Jan−
1986
Jan−
1988
Mon
th−
1.0
−0.
8
−0.
6
−0.
4
−0.
2
0.0
0.2
0.4
0.6
0.8
1.0
Percent �
IPO
Und
erpr
icin
g, U
nder
writ
er C
ompe
nsat
ion,
and
3−
Yea
r N
et P
erfo
rman
ce
Und
erw
riter
Spr
ead
IPO
Und
erpr
icin
g3−
Yea
r P
ost−
IPO
Ret
urn
− S
&P
500
Note: For each issuing month, all IPOs raising no more than $50 million are grouped to computemonthly averages for the following three series: the IPO underwriter spread, the initial first-dayreturn, and the subsequent 3-year post-IPO return performance (net of the S&P 500 performance).For initial public offerings after November 1986, the long-run return is truncated, because returnsafter November 1989 are not yet available.

VIII To Potential Instructors
From: Ivo Welch, http://welch.som.yale.edu/To: Potential InstructorsDate: May 1997Subject: G-III Case
Please notify the author (me) by email if you are planning to use this case, orif you are actually using this case. I have written a 15-page teaching note that de-scribes how one can teach this case in all detail (with references to relevant academicpublications). The note also includes a 4-page postscript with additional exhibits.However, I want to keep this note out of the hands of students, so I am controllingaccess to this teaching note quite tightly.
If you are interested to obtain this teaching note, I can either send you a hard-copy, or I can email this document in Acrobat .pdf format to a valid instructor emailaddress at your request. Please provide details, such as your background and theinstitutions and course in which you plan to use the case.
I am planning to improve the substance of the G-III case in the next 12 months.This explains the limited time period (until December 1998) during which I permitfree copying of this version for teaching purposes. (Eventually, the case will bepublished and command [no more than] the customary case fees.) In general, I willannounce any new versions or updates of this case on http://welch.som.yale.edu,where I will also make full printable and searchable versions of the case publiclyaccessible in Adobe Acrobat .pdf format.
I hope you will find this case to be useful. Any feedback would of course beappreciated.