Lørdag den 21. marts kl. 10-17 Søndag den 22. marts kl. 10-16
Upload
khangminh22Category
view
3download
0
UUnniivveerrssiittyy ooff PPrreettoorriiaa,, eettdd -- PPoonneelliiss,, SS
CHAPTER 3 DATA MARTS AS MANAGEMENT INFORMATION DELIVERY MECHANISMS
“A firm’s IQ is determined by the degree to which its IT infrastructure connects, shares, and structures information. Isolated applications and data, no matter how impressive, can produce idiot savants but not a highly functional corporate behavior.” – Steve H. Haeckel and Richard L. Nolan, Managing by Wire: Using IT
to Transform a Business An understanding of the definition of and distinction between data warehouses and data marts is required
prior to commencing an empirical investigation of data marts as management information delivery
mechanisms. The aims of this chapter are to provide material to aid this understanding by:
• To compare and contrast the data warehouse and types of data marts in order to arrive at an
understanding of what it is;
• To indicate the relationship between data warehouses and data marts;
• To describe, classify and characterise the access tools to data marts/data warehouses as
management information delivery mechanisms;
• To define criteria to select the appropriate data mart access tool(s); and
• To explore the use of data warehouses and data marts in organisations, particularly within the
context of sales and marketing, as discussed in literature.
3.1. Definitions of Data Warehouses and Data Marts In 1997, White (1997, 7) stated that there is “considerable debate and confusion in the industry about the
role and value of a data mart, and even about what a data mart is.” This debate and confusion has not
subsided in subsequent years as is evident from the following representative definitions found in literature:
• A data mart is an “implementation of the data warehouse in which the data scope is somewhat
limited compared to the enterprisewide [sic] data warehouse. A data mart may contain lightly
summarized departmental data and is customized to suit the needs of a particular department that
owns the data; in a large enterprise, data marts tend to be a way to build a data warehouse in a
sequential phases approach; a collection of data marts composes an enterprise-wide data
warehouse; conversely, a data warehouse may be construed as a collection of subset data marts”
(Berson and Smith, 1997:15). Furthermore, “Mostly, data marts are presented as an inexpensive
alternative to a data warehouse that takes significantly less time and money to build” (Berson and
Smith, 1997:124).

UUnniivveerrssiittyy ooff PPrreettoorriiaa,, eettdd -- PPoonneelliiss,, SS
42
• “When the term data mart came into vogue, it was generally used to describe an environment that
would receive a subset of a data warehouse’s contents and then would be the primary point of data
access for a subset of the organization’s total user base (i.e., one or two departments)” (Simon,
1998:4). This was because “smaller-scale data warehousing efforts, the ones that were being
developed in three to six months with scaled-back functionality, were usually successful” (Simon,
1998:6). In order to distinguish these successful efforts from the less successful enterprise-wide
data warehouse efforts “the phrase data mart was extended to refer not only to an environment
sourced by a data warehouse, but any smaller-scale effort with a relatively short time from concept
to deployment” (Simon, 1998:6).
• “… the term data mart, which has been used variously to describe a small standalone data
warehouse or a distributed secondary level of storage and distribution in conjunction with a data
warehouse.” (Dodge and Gorman, 1998:11)
• “A data mart, often referred to as a subject-oriented data warehouse, represents a subset of the
data warehouse comprised of relevant data for a particular business function (e.g., marketing,
sales, finance, etc.)” (Poe et al, 1998:18).
• “The term data mart is used to refer to a small-capacity data warehouse designed for use by a
business unit or department of a corporation” (Gray and Watson, 1998:103).
• “A scaled-down version of a data warehouse that is tailored to contain information likely to be
used only by the target group” (Gates, 1999:493).
• “A data mart is simply a smaller data warehouse. Usually the data in a mart is a subset of data that
is found in an enterprisewide warehouse, as follows:
o A data warehouse is for data throughout the enterprise.
o A data mart is specific to a particular department” (Microsoft Corporation, 1999:3).
• “… the definition of a [data] mart as a single-purpose warehouse serving a single allied group of
users” (Palo Alto Management Group, 2001:275).
• “A data mart contains a subset of corporate-wide data that is of value to a specific group of users.
The scope is confined to specific selected subjects” (Han and Kamber, 2001:67).
• “A data mart is smaller, less expensive, and more focused than a large-scale data warehouse. Data
marts can be a substitution for a data warehouse, or they can be used in addition to it” (Turban et
al, 2001:759).
From these definitions in literature, the following can be concluded:
1. A data mart is smaller in scope and/or size than a data warehouse;
2. A data mart is appears to be less expensive to build than a data warehouse; and
3. Data marts can take a number of forms, namely:

UUnniivveerrssiittyy ooff PPrreettoorriiaa,, eettdd -- PPoonneelliiss,, SS
43
• An optional part of a data warehouse, for reporting purposes, dependent, an alternative to directly
accessing the data warehouse with the data warehouse being a single centralised repository. In
these instances it is generally can be departmental or business process specific;
• A small stand-alone independent data warehouse.
• Data marts developed in a coordinated manner with conformed dimensions to form a distributed
data warehouse.
From the points 1 and 2 it is clear that there appears to be some difficulty in determining the exact
boundary between a data mart and a data warehouse, with the definition of a data mart frequently referring
to a data warehouse in order to provide a definition. Before exploring the different data marts outlined in
point 3 in depth, it is necessary to elaborate on the concept of the data warehouse.
3.1.1. Data Warehouse
Data that is captured and stored during the processing of transactions can be used to produce valuable
information to end-users, especially management. This management information can be used to plan,
monitor, and control business operations (Whitten et al, 1998:53). In order to exploit this data asset,
organisations began creating data warehouses to satisfy these demands for decision-making (Gates,
1999:250).
According to Inmon (2002:31), a data warehouse is “a subject-oriented, integrated, non-volatile [database
not updated directly by users] , time-variant collection of data in support of management’s decisions.” This
definition is concise but not without controversial points requiring interpretation:
• “Subject-oriented”—In the marketplace, the term subject-oriented implies functionally-aligned,
for example, sales data is separated from marketing data is separated from manufacturing data, and
each forms a separate “data warehouse” which is then a data mart.
• “Serves management”—There has been a change in managerial theory and organisational design
which has resulted in decision points being pushed down the organisational hierarchy, out to the
boundaries of the firm. However, in many organisations, management information is still
confined to middle and senior management with information flow down the hierarchy when
deemed necessary.
Whitten et al (1998:53) is of the opinion that management reporting and by implication management
information is a natural extension of transaction processing. According to Kimball (1996:310) a data
warehouse is “a copy of transaction data specifically structured for querying and reporting.” Kimball’s
definition eliminates problematic points in Inmon’s definition are eliminated. Furthermore, this implies
that the data warehouse is a separate database used for analytical purposes where all data is stored but in a
UUnniivveerrssiittyy ooff PPrreettoorriiaa,, eettdd -- PPoonneelliiss,, SS
44
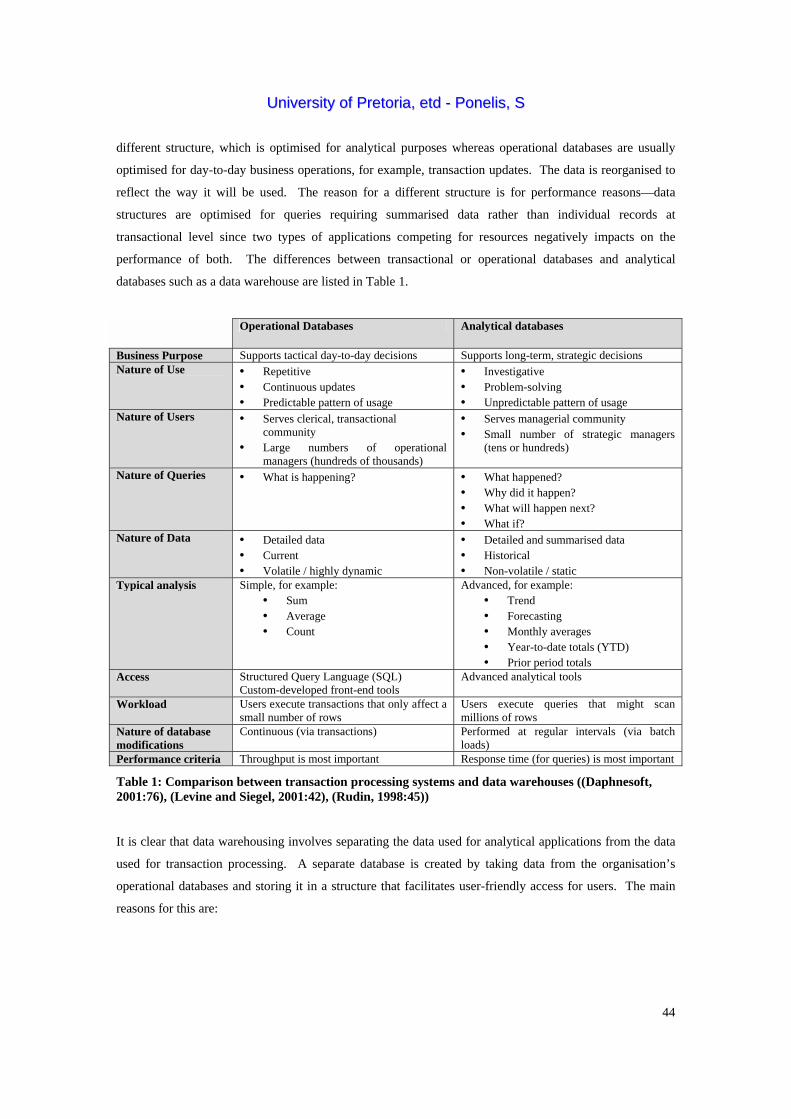
different structure, which is optimised for analytical purposes whereas operational databases are usually
optimised for day-to-day business operations, for example, transaction updates. The data is reorganised to
reflect the way it will be used. The reason for a different structure is for performance reasons—data
structures are optimised for queries requiring summarised data rather than individual records at
transactional level since two types of applications competing for resources negatively impacts on the
performance of both. The differences between transactional or operational databases and analytical
databases such as a data warehouse are listed in Table 1.
Operational Databases Analytical databases
Business Purpose Supports tactical day-to-day decisions Supports long-term, strategic decisions Nature of Use • Repetitive
• Continuous updates • Predictable pattern of usage
• Investigative • Problem-solving • Unpredictable pattern of usage
Nature of Users • Serves clerical, transactional community
• Large numbers of operational managers (hundreds of thousands)
• Serves managerial community • Small number of strategic managers
(tens or hundreds)
Nature of Queries • What is happening? • What happened? • Why did it happen? • What will happen next? • What if?
Nature of Data • Detailed data • Current • Volatile / highly dynamic
• Detailed and summarised data • Historical • Non-volatile / static
Typical analysis Simple, for example: • Sum • Average • Count
Advanced, for example: • Trend • Forecasting • Monthly averages • Year-to-date totals (YTD) • Prior period totals
Access Structured Query Language (SQL) Custom-developed front-end tools
Advanced analytical tools
Workload Users execute transactions that only affect a small number of rows
Users execute queries that might scan millions of rows
Nature of database modifications
Continuous (via transactions) Performed at regular intervals (via batch loads)
Performance criteria Throughput is most important Response time (for queries) is most important
Table 1: Comparison between transaction processing systems and data warehouses ((Daphnesoft, 2001:76), (Levine and Siegel, 2001:42), (Rudin, 1998:45))
It is clear that data warehousing involves separating the data used for analytical applications from the data
used for transaction processing. A separate database is created by taking data from the organisation’s
operational databases and storing it in a structure that facilitates user-friendly access for users. The main
reasons for this are:

UUnniivveerrssiittyy ooff PPrreettoorriiaa,, eettdd -- PPoonneelliiss,, SS
45
• Reduction of operational database workload;
• Optimisation of databases to cater for different requirements; and
• Integration of data from diverse sources.
A descriptive definition of a data warehouse is that of Han and Kamber (2001:67): “An enterprise
warehouse collects all of the information about subjects spanning the entire organization. It provides
corporate-wide data integration, usually from one or more operational systems or external information
providers, and is cross-functional in scope.” However, this definition does not cover the target audience or
users of the data warehouse. Whitten and Bentley (1998:40) places more focus on the users by defining a
data warehouse is “a read-only, informational database that is populated with detailed, summary, and
exception information that can be accessed by end-users and managers with DSS tools that generate a
virtually limitless variety of information in support of unstructured decisions.”
Other definitions of a data warehouse found in literature include:
• A data warehouse is a “database that can access all of a company’s information. While the
warehouse can be distributed over several computers and may contain several databases and
information from numerous sources in a variety of formats, it should be accessible to users
through simple commands” (Gates, 1999:493).
• A data warehouse provides “a unified corporate picture to the end-users by combining the data
from many operational systems and incompatible databases without affecting the performance of
the running operational systems” (Turban et al, 2001:758)
• “The data warehouse is an environment, not a product. It is an architectural construct of
information systems that provides users with current and historical decision support information
that is hard to access or present in traditional operational data stores. In fact, the data warehouse is
a cornerstone of the organization’s ability to do effective information processing, which among
other things, can enable and share the discovery and exploration of important business trends and
dependencies that otherwise would have gone unnoticed” (Berson and Smith, 1997:5).
• “Data is extracted from multiple sources (usually operational databases), pruned, cleansed,
reconciled and transformed into a more usable format and then loaded into the data warehouse for
subsequent access by multiple interested consumers” (Schulte, 1996).
The process described in these definitions is depicted in Figure 1.
Based on the above definitions, a data warehouse can be summarised that it:

UUnniivveerrssiittyy ooff PPrreettoorriiaa,, eettdd -- PPoonneelliiss,, SS
46
• Integrates sources from multiple, diverse operational sources;
• Allows for analysis of data over time;
• Provides analysis capabilities to decision makers;
Figure 1: Schematic Representation of Data Flow in a Data Warehouse Environment
• Provides improved performance for complex analytical queries;
• Relieves processing burden on transaction-oriented databases; and
• Converts enterprise data into strategic information (Heise, 2001: 34).
Furthermore, the data warehouse takes a “top-down perspective is that a completely centralized, tightly
designed master database must be completed before parts of it are summarized and published as individual
data marts [see 3.1.2.1. ]” (Kimball et al, 1998:18-19).
3.1.2. Data Marts
A data warehouse presents a solution for storing and accessing analytical data. There are a number of
advantages in building a data mart:
• The cost of building a data mart is generally lower;
• The implementation timeframe is shorter; and

UUnniivveerrssiittyy ooff PPrreettoorriiaa,, eettdd -- PPoonneelliiss,, SS
47
• Data marts contain less information than a data warehouse and therefore have more rapid response
and are more easily understood and navigated by users than an enterprise data warehouse (Gray and
Watson, 1998:103-104).
Based on the initial definitions from literature, it emerged that data marts can be one of a number of
different designs or architectures. Han and Kamber (2001:67) explain that the source of data determines
the data mart. As Gray and Watson (1998:104-105) states, a data mart may be:
• A subsidiary of a centralised data warehouse;
• Operate independently; or
• Integrated into a distributed data warehouse.
Each of these data mart architectures are referred to using specific terminology:
• A subsidiary of a centralised data warehouse is known as a dependent data mart; and
• A data mart that operates independently is known as an independent data mart
• A data mart integrated into a distributed data warehouse does not have a specific term assigned to it
except that a number of data marts constructed in this way results in a distributed data warehouse.
In this dissertation, this type of data mart will be referred to as an interdependent data mart.
These data mart architectures are explored in the following sections.
3.1.2.1. Dependent Data Mart
Data marts populated with data sourced from the enterprise data warehouse are called dependent data marts
(Berson & Smith, 1997:124, and Han & Kamber, 2001:67). These are sometimes also called replicated
data mart since the data mart is populated with a portion of the data warehouse’s data through replication
(Gray & Watson, 1998:104). This is depicted schematically in Figure 2.
By integrating data from various sources into a data warehouse and then letting the integrated data flow to a
number of dependent data marts each containing limited content tailored to the needs of the departmental
user community gives users the benefit without central co-ordination being sacrificed (Dodge & Gorman,
1998:572-573). The information provided to each data mart is determined by the departmental or
divisional needs for centralised information. It is also possible for locally generated and used information
to be stored in the dependent data mart. Furthermore, because the use is localised, alternative analytical
tools to those used to access the underlying data warehouse can be used (Simon, 1998:4-5). What is
important to note is that data is “never transmitted by the owner of the data mart to other portions of the
organization” (Gray and Watson, 1998:105).

UUnniivveerrssiittyy ooff PPrreettoorriiaa,, eettdd -- PPoonneelliiss,, SS
48
Figure 2: Data flow when using a dependent data mart
The dependent data mart architecture assumes enterprise data warehouse exists. History has shown during
the past 10 years that successfully implementing an enterprise data warehouse is extremely challenging
from a business and technical perspective (Friedman, 2002, and Han & Kamber, 2001:67). Examples of
these challenges are (Simon, 1998:5):
• Technical challenges, for example, scalability issues, such as handling very large databases; and
• Business challenges, for example, cross-organisational cooperation that is usually needed for a data
warehouse and the negative impact of corporate politics and determining the business value sought
from the data warehouse and relating that value back to specific functionality and data needs.
The result was that data warehouses were either only partially deployed or deployed but never used because
of problems such as data integrity, or cancelled completely.
3.1.2.2. Independent Data Mart
Problems with implementing an enterprise-wide data warehouse and the associated costs led to
development of the independent data mart. Independent data marts are populated with data captured from
one or more operational systems or external data sources, or with data generated locally within the

UUnniivveerrssiittyy ooff PPrreettoorriiaa,, eettdd -- PPoonneelliiss,, SS
49
department (Han & Kamber, 2001:67). This is depicted in Figure 3. The result is, theoretically, that each
department or division has its own data mart. This situation can result when vendors, unable to sell a data
warehouse to the whole enterprise, sell scaled-down versions of their product as a data mart to a department
or division.
Figure 3: Data flow when using independent data marts
While solving the problem of the particular department or division, a stand-alone data mart can result in
serious fragmentation in the organisation or so-called “islands of information.”1 When data marts are not
integrated with one another, they can generate inconsistent and conflicting data because for each
independent data mart assumptions are made about how to consolidate the data, and the data across several
data marts may not be consistent (Berson & Smith, 1997:125) with separate representations. These
differences can be a result of different definition of terms, reporting periods, and time lags in recording
information which is the reason that cannot be integrated with one another (Gray &Watson, 1998:104-105)
or in identification of source systems or in the extract, reformatting, and summarisation processing (Dodge
& Gorman, 1998:572). As Berson and Smith (1997:125) correctly state, the independent data mart
architecture does not include what is central to the concept of data warehousing, namely data integration.
1 “In some situations, building separate data marts may be a good solution if there is no intent to interact with other departments” (Microsoft Corporation, 1999:4). However, assuming no interaction will ever occur is a rather strong assumption.
UUnniivveerrssiittyy ooff PPrreettoorriiaa,, eettdd -- PPoonneelliiss,, SS
50
According to Berson and Smith (1997:125) independent data marts should rarely be deployed within an
overall technology or applications architecture since independent data marts “may involve complex
integration in the long run if its design and planning were not enterprise-wide” (Han & Kamber, 2001:67).
As Kimball et al (1998:18-19) states, the “bottom-up perspective is that an enterprise data warehouse can
be assembled from disparate and unrelated data marts” which has been shown in practice not to be the case.
This is confirmed by industry experts who have “acknowledged that, a majority of the time, data marts
must be rebuilt entirely according to a conformed … dimensional framework before they can be rolled up
into a data warehouse successfully [see 3.1.2.3. ]” (Microsoft Corporation, 1999:4).
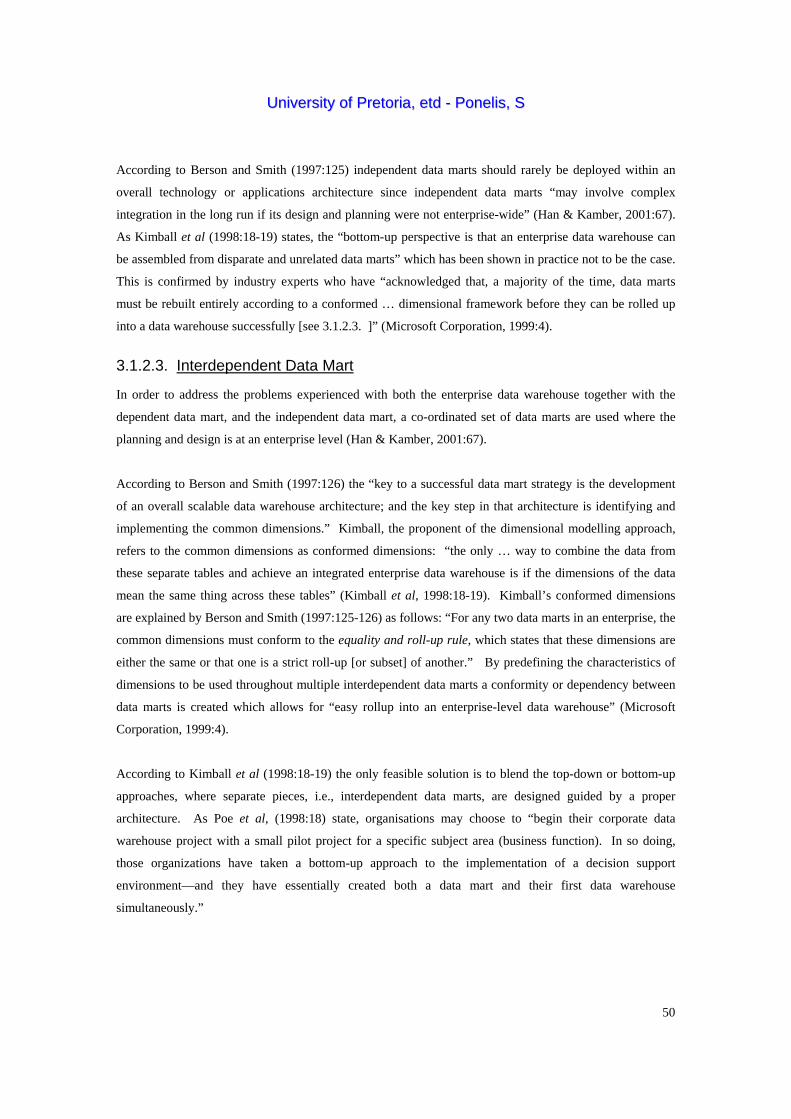
3.1.2.3. Interdependent Data Mart
In order to address the problems experienced with both the enterprise data warehouse together with the
dependent data mart, and the independent data mart, a co-ordinated set of data marts are used where the
planning and design is at an enterprise level (Han & Kamber, 2001:67).
According to Berson and Smith (1997:126) the “key to a successful data mart strategy is the development
of an overall scalable data warehouse architecture; and the key step in that architecture is identifying and
implementing the common dimensions.” Kimball, the proponent of the dimensional modelling approach,
refers to the common dimensions as conformed dimensions: “the only … way to combine the data from
these separate tables and achieve an integrated enterprise data warehouse is if the dimensions of the data
mean the same thing across these tables” (Kimball et al, 1998:18-19). Kimball’s conformed dimensions
are explained by Berson and Smith (1997:125-126) as follows: “For any two data marts in an enterprise, the
common dimensions must conform to the equality and roll-up rule, which states that these dimensions are
either the same or that one is a strict roll-up [or subset] of another.” By predefining the characteristics of
dimensions to be used throughout multiple interdependent data marts a conformity or dependency between
data marts is created which allows for “easy rollup into an enterprise-level data warehouse” (Microsoft
Corporation, 1999:4).
According to Kimball et al (1998:18-19) the only feasible solution is to blend the top-down or bottom-up
approaches, where separate pieces, i.e., interdependent data marts, are designed guided by a proper
architecture. As Poe et al, (1998:18) state, organisations may choose to “begin their corporate data
warehouse project with a small pilot project for a specific subject area (business function). In so doing,
those organizations have taken a bottom-up approach to the implementation of a decision support
environment—and they have essentially created both a data mart and their first data warehouse
simultaneously.”

UUnniivveerrssiittyy ooff PPrreettoorriiaa,, eettdd -- PPoonneelliiss,, SS
51
This approach requires that a significant amount of work to be spent during the design of the first
interdependent data mart in order to ensure future data marts can fit with the dimensions (Dodge &
Gorman, 1998:572). If this is not done, the result will be multiple independent data marts. Note that the
only difference between an independent and an interdependent data mart when building the first data mart
is the intention and the design of the data model. The structure will appear the same when depicted
diagrammatically. Figure 4 depicts diagrammatically the distributed data warehouse resulting from
multiple interdependent data marts.
Figure 4: Data flow when using interdependent data marts
Two or more interdependent data marts result in a distributed data warehouse. This approach to data
warehousing is preferred to a single enterprise data warehouse since it is possible to deliver a data mart to
business users in a far shorter timeframe thereby lowering project costs which accelerates the return on
investment (ROI). This also serves to gain credibility and get buy-in for further warehousing projects from
management. Furthermore, the initial hardware costs are also much less costly than investing in the
infrastructure required to support a large data warehouse (Martin, 1999). However, a distributed data
warehouse is the result of planning: “Each data mart is assigned a specific set of information for which it is
responsible. A central organization, such as IT, specifies the rules for the metadata so that the information
kept by each mart is compatible with that provided by all the other marts” (Gray & Watson, 1998:104-105).

UUnniivveerrssiittyy ooff PPrreettoorriiaa,, eettdd -- PPoonneelliiss,, SS
52
Figure 5 illustrates diagrammatically the distributed data warehouse from resulting from several
interdependent data marts.
Figure 5: Interdependent data marts resulting in a distributed data warehouse
Against the above definitions and descriptions, a summarised comparison of a data warehouse and the
different types of data marts are provided in Table 2.
Data mart
Data warehouse Dependent Independent Interdependent
Scope Enterprise-wide Subject or department Basic architectural assumption
Centralised Centralised Distributed Distributed
Size Up to several terabytes Megabytes to gigabytes Approach Top-down Bottom-up Middle-up-down Data source Operational systems Underlying
enterprise data warehouse
Operational systems Operational systems
Level of data Detailed Summarised Detailed and summarised
Detailed and summarised
Next level of migration
Data mart Not applicable Data warehouse Data warehouse
Distinguishing characteristics (if any)
• Enterprise wide • Derived and aggregated
• Independent • Shared, conformed dimensions
• Distributed data warehouse
• Independent and atomic
Benefits • Integrated • Quicker response times than data warehouse
• Integrated by design
• Shorter development time
Drawbacks • Long development time
• Requires enterprise data warehouse
• Fragmentation of data
• Possible integration issues
• Multiple extracts for update/refresh
Table 2: Comparison of data warehouse and types of data marts

UUnniivveerrssiittyy ooff PPrreettoorriiaa,, eettdd -- PPoonneelliiss,, SS
53
3.1.3. Relationship between Data Warehouse and Data Mart
From the quotations in literature, it is evident that there is a relationship between the concept of a data
warehouse and the concept of a data mart. In particular, dependent data marts form part of the overall data
warehouse environment and derive their data from the data warehouse. Independent data marts are
constructed in lieu of a data warehouse but are built on the same principles. In the case of interdependent
data marts, the collection of data marts is the data warehouse. It is also worthwhile to note the following
statement by Gray and Watson (1998:103) in this regard:
“The dichotomy between a data warehouse and a data mart is partially dependent on the
size of the organization. A large organization’s data mart may well be a small
organization’s data warehouse.”
Furthermore, as Watterson, quoted in Turban et al (2001:437), states data marts “ can be a substitution for a
data warehouse or they can be in addition to it, holding only part of the data warehouse content”
This relationship is succinctly described in the following excerpt by Microsoft Corporation (1999:4), a
vendor of data warehousing software:
“Both data warehouses and data marts describe the process of collecting data from other
sources. Data is summarized into a read-only format that is convenient for querying and
analysis. … Both data warehouses and data marts have the common objective of better
business decisions through better use of data.”
Simon (1998:4) corroborates this statement:
“You develop a data mart for the same reason you develop a data warehouse: to provide
a consolidation of data regardless of platform, geographic, application, and
organizational barriers. And once you’ve consolidated that data, you have created an
environment that will provide users with business intelligence.”
Logically and by definition, therefore, the terms data warehouse and data warehousing encompass that of a
data mart, a data mart being a data warehouse with more particular characteristics. A data mart is,
therefore, conceptually and theoretically a subset of a data warehouse although the boundaries are
increasingly being blurred. This is illustrated in Figure 6.

UUnniivveerrssiittyy ooff PPrreettoorriiaa,, eettdd -- PPoonneelliiss,, SS
54
Figure 6: Relation of a data mart to a data warehouse
In literature, reference to a data warehouse frequently also imply reference to a data mart. Throughout the
text, whenever reference to a data warehouse or data warehousing is made this must be taken to also apply
equally to a data mart except where explicitly indicated otherwise.
3.2. Advanced Analytical Tools to Access Data Marts The data mart, as physically stored in the database, is not accessible to users in a user-friendly manner. In
order to access the data contained within the data mart one or more front-end tools is required. Advanced
analytical tools serve this purpose, namely, to “provide a graphical user interface to the data warehouse.
The user will interact directly with the table structures, sometimes with a layer of abstraction to allow him
or her to assign business names to the different tables and columns” (Poe et al, 1998:23). Berson and
Smith (1997:120) confirms this view: “[t]he principal purpose of data warehousing is to provide
information to business users for strategic decision making. These users interact with the data warehouse
using front-end tools.” This is reiterated in a white paper of Daphnesoft (2001:78), which states that a “data
warehousing solution would be imperfect without an efficient data access tool that provides business
intelligence.”
According to McKinnon and Bruns (in Butcher, 1998:15) “most managers prefer to have facilities available
to enable them to design their own reports or at least have someone design them with their specific needs in
mind.” Similarly, Mintzberg (1975) points out, formal information systems tend to aggregate data and, as a
result, a lot of the available information is too general to be of much use. Designers of systems seem to
believe that data must be aggregated in order not to swamp the manager with information but in doing so
the data often ceases to be of use to the individual manager” (in Butcher, 1998:15). This is illustrated in
data warehouse
data mart

UUnniivveerrssiittyy ooff PPrreettoorriiaa,, eettdd -- PPoonneelliiss,, SS
55
Figure 7. Thus the term data mart refers to this complete architecture, i.e. the back-end, the data mart itself
as created in the database, and the front-end tools.
Figure 7: Architecture of data warehouse, independent or interdependent data mart (Gray and Watson, 1998:17)
The particular analytical tool(s) chosen depends on the nature of the user requirements. Users who fulfil
different tasks have different requirements and even users who fulfil the same task may have different
requirements to execute the task. Analytical tools will offer differing functionality, which will satisfy user
requirements. Analytical or access tools can be divided into groups or classes based on the specific user
needs each fulfils. Whilst this classification is useful for discussion purposes, it is a simplification because
a single product can serve multiple purposes (Gray and Watson, 1998:123). Table 3 contains a comparison
of the different classes of data warehouse access tools found in literature together with the consolidation of
these classifications for use in this dissertation.
Gray and Watson (1998:123)
Berson and Smith (1997:223)
Tanler (1997:95) Poe (1998: 233-234)
Consolidation of classifications
Queries Reporting Data Access/Query Tools
Managed query environments
Managed query Report Writers
Executive information systems
Executive information (EIS)
Query and Reporting
Executive Information Systems (EISs)
Query and reporting
Multidimensional Database Management Systems [MOLAP]
Decision support systems
On-line analytical processing
Multidimensional analysis
Advanced decision support tools
OLAP
Data mining (agent processing)
Data mining Data mining
Statistical analysis (user-directed)
Data mining
Table 3: Comparison of classes of data mart access tools with consolidation

UUnniivveerrssiittyy ooff PPrreettoorriiaa,, eettdd -- PPoonneelliiss,, SS
56
This consolidation of data mart access tool classifications is discussed in detail in the sections below. It is
important to note that, as Alter (1999:160) states: “the categories are not mutually exclusive … information
system categories often overlap and change as new applications combine new capabilities with old ones.”
Furthermore, “Any discussion of types of information systems faces a difficult problem because categories
simply won’t hold still” (Alter, 1999:160).
3.2.1. Query and Reporting
The aim of query and reporting tools are to allow users to retrieve and present information from the data
mart to perform some pre-defined or ad-hoc analysis.
Characteristics of query and reporting tools include:
• Define and build typical structured or standard reporting; • Build customised reporting;
• Provide graphic capabilities to present the results;
• Support for exception reporting facilities;
• Includes both straight query tools, which allow direct access to the data itself, and managed query
environments, where a metadata layer provides a business-oriented interface between the user and
the data;
• Can store and reuse queries;
• Ability to support stored shared queries and to share results;
• Ability to perform consecutive queries on saved results;
• Ability to estimate and limit query size and response time;
• Ability to cancel a query;
• Provides dissemination of information, such as support for distribution of results through e-mail;
• Used to analyse metrics and business indicators; and
• Accesses summarized information with the ability to drill down.
3.2.2. Online Analytical Processing
The aim of an online analytical processing (OLAP) tool is to allow users to intuitively navigate and analyse
information along business dimensions, independent of the way the data is stored, and highlighting the
underlying reasons or causes for business issues and opportunities. These tools are also sometimes referred
to as advanced decision support tools (Poe et al, 1998:23). They are designed for unstructured problem
solving.

UUnniivveerrssiittyy ooff PPrreettoorriiaa,, eettdd -- PPoonneelliiss,, SS
57
Characteristics of OLAP tools include:
• Provides analysis of data including scenario, trending, time series and what-if analysis;
• Presence of traffic lighting and exception reporting facilities;
• Includes predefined, semi-structured queries allowing variable constraints on limited data;
• Includes functional or vertical applications (for example, campaign management);
• Provides guided analysis of summarised, aggregated data along a series of dimensions such as
time, product, geography, etc.;
• Used in forecasting and planning;
• Allows trending, slicing, rotation or pivoting, drill down, drill through, etc.;
• Supports an iterative process most business analysts use, where asking and answering one question
generates three or four additional questions;
• Presents data graphically to improve its comprehension; and
• Provides ability to comprehend massive amounts of data or data with complex interrelationships.
The functionality of OLAP tools can best be illustrated with the concrete examples in Table 4.
Function Example Track performance Sales for a specific region Provide different views Receivables by month vs. receivables by customer Arrange information Top 10 account representatives
Table 4: Examples of OLAP tool functionality
3.2.3. Data Mining
Data mining is a “decision support process in which we search for patterns of information in data”
(Information Discovery, Inc. 2001:198), i.e. the discovery of meaningful new patterns, relationships and
trends in large volumes of data stored in a database or data mart by using pattern recognition technologies
and statistical and mathematical techniques (Mattison, 2001:181). The two main types of models used in
data mining are:
• Descriptive models, which describe patterns in existing data to guide decision making; and
• Predictive models, which use data with known results to explicitly predict result values for
different sources of data.
According to Pelletier and Todaro, (2000:1) data mining tools are “especially important for marketing
departments because marketing efforts succeeded when they single out customer segments with high profit
potential” which required manually analysing large volumes of data.

UUnniivveerrssiittyy ooff PPrreettoorriiaa,, eettdd -- PPoonneelliiss,, SS
58
Characteristics of data mining tools include:
• Provides exploratory analysis for expert analysts and statisticians;
• Discovers hidden patterns, trends, relationships, and predictive indicators;
• Users must understand how to condition data and structure and manage queries, including
knowledge of various data mining techniques;
• Desktop tools provide graphical interface to statistical modelling techniques;
• Presents data graphically to improve its comprehension; and
• Provides ability to comprehend massive amounts of data or data with complex interrelationships.
The functionality of OLAP tools can best be illustrated with the concrete examples in Table 5.
Function Example Uncover relationship Percentage of new home buyers that also buy ovens Assemble profiles Prospective customers Predict behaviour Characteristics of customers that are likely to defect
Table 5: Examples of data mining tool functionality
Once the rules and patterns associated with a particular business problem have been discerned, this logic
can be embedded into a production application. Users see results of the rules being applied to data, such as
identification of a customer at risk to defect, or to automatically score prospects or customers to determine
their receptivity to a new product.
Although there are different points of view on where the repository or database for data mining resides, this
is beyond the scope of this dissertation. However, the dissertation is based on the assumption that this
repository resides within the data mart with data mining tools sourcing data from the data mart. For more
detail on other options, including above or beside the warehouse, refer to Information Discovery, Inc.
(2001).
Based on the above discussion, the range of end-user functionality required and the tools that satisfy these
can be summarised on a continuum as depicted in Figure 8.
Query Drill down, Calculations, Modelling, Time series, What-if Knowledge
Pivot Derived data Financial forecasting analysis discovery
Query and Reporting OLAP Data Mining
Figure 8: High-level spectrum of functionality addressed by query and reporting, and OLAP tools

UUnniivveerrssiittyy ooff PPrreettoorriiaa,, eettdd -- PPoonneelliiss,, SS
59
3.3. Nature of Usage Swift (2000) discusses the evolutionary use of a data warehouse or data mart. This use progresses through
three stages, starting with reporting. Even reporting from the data warehouse to determine what happened,
mostly through predefined queries, “provides new views and an ability to use combined, cross-
organisational detailed data to understand the past” (Swift, 2000). The second stage of use is characterised
by analysis focusing on reasons for what happened. The final and most sophisticated stage, also presenting
the most competitive advantage, is predicting what will happen by means of analytical techniques. These
stages are summarised and mapped against the different classes of access tools in Table 6.
Stage of use Reporting Analysis Prediction Class of Access Tool Query and reporting OLAP Data mining
Table 6: Mapping of stages of data mart use (Swift, 2000) against class of access tool
Reporting and analysis both seek to answer questions that are historical or focused on the past whereas
prediction is focused on the future. This distinction in focus can be formulated more firmly. Deductive
tools support the “process of applying specific—though probably ad hoc—questions against the available
data” (3Com, 2001:38) whereas inductive tools support the “process of interrogating the available data
before a specific questions has been formulated” (3Com, 2001:39). Thus reporting and analysis using
query and reporting and OLAP tools are deductive in nature whereas prediction using data mining tools is
inductive in nature. This is summarised in Table 7.
Query and reporting Deductive OLAP
Inductive Data mining
Table 7: Categories of end-user application classifications
The natural progression from reporting to analysis to prediction normally takes place over time. One would
expect that the simplest needs, i.e. reporting needs would be satisfied first before progressing to analytical
needs and again, satisfying analytical needs before progressing to predictive needs. In line with this
expectation, the most common tools in use today in organisations are query and reporting, and OLAP tools.
There is, however, growing interest in the potential of data mining and statistical tools, and artificial
intelligence, for example expert systems to automate increasingly decision-making with larger
organisations particularly in the financial and retail industries utilising advanced analytical techniques for
prediction.
In order to further illustrate the purpose and use of these tools, examples of information requirements each
tool is capable of satisfying is given for two functional areas within an organisation, namely sales and
marketing, and manufacturing in Table 8.

UUnniivveerrssiittyy ooff PPrreettoorriiaa,, eettdd -- PPoonneelliiss,, SS
60
Use Access Tool Sales and marketing examples Manufacturing examples Reporting Query and
reporting
• Weekly sales report by product by region
• Consolidation of sales projections by product, region, and sales representative
• Flexible access to sales data by product and region
• Weekly production report by production and operation
• Determination of planned purchases based on a production schedule
• Flexible access to production data by product and operation
Analysis OLAP • Marketing data and models to analyse and forecast sales
• System helping insurance sales people test alternative policies
• Production data and models to analyse production results
• System displaying current priorities for machine operator
Prediction Data mining • Profit generating potential of customers based on profiles
• Product placement in retail space
• Learning patterns and sequences of faults on a production line to predict downtime
Table 8: Examples of information requirements by access tool and functional areas (based on Alter, 1999:163)
The use of data warehousing also differs according to the industry in which it is used. The use determines
the nature of the questions to be answered and will therefore determine the data mart access tool selected.
Table 9 summarises the strategic uses of data warehousing.
Industry Functional Area Applications / Use Airline Operations and Marketing • Crew assignment
• Aircraft deployment • Mix of fares • Analysis of route profitability • Frequent flyer programme promotions
Clothing Distribution and Marketing • Merchandising • Replenishment
Banking Product Development, Operations and Marketing
• Customer service • Trend analysis • Product and service promotions • Reduction of IS expenses
Personal Care Products Distribution and Marketing • Distribution decision • Product promotions • Sales decision • Pricing policy
Retail Chain Distribution and Marketing • Trend analysis • Buying pattern analysis • Pricing policy • Inventory control (maintaining exact levels) • Location-targeted sales promotions planning • Optimal channel distribution • Vendor pricing and performance analysis
Steel Manufacturing • Pattern analysis (quality control) Telecommunications Product Development, Operations
and Marketing • New product and service promotions • Reduction of IS budget • Profitability analysis
Table 9:Summary of strategic uses of data warehousing in selected industries (Turban et al, 2001:440), (Sharma, 1997:18)

UUnniivveerrssiittyy ooff PPrreettoorriiaa,, eettdd -- PPoonneelliiss,, SS
61
It is clear that data warehouses and data marts are used in variety of functional areas. The use of data
warehousing, independent of the industry in which it is applied, is summarised accurately by Norris et al
(2000:105), stating that it allows organizations to:
• Improve customer marketing;
• Streamline business operations; and
• Better understand and forecast their financial position.
Based on Table 9, the functional areas for which data warehousing is used include:
• Distribution and marketing;
• Manufacturing;
• Operations and marketing; and
• Product development, operations and marketing.
Marketing is an important area of application for data warehousing. This is confirmed by the applications
for which data warehouses and data marts are used in organisations listed in Table 10.
Applications Percent of Market (%)
Related to Sales and Marketing
Financial analysis 11 Customer marketing 10 ! Product performance 8 ! Sales force analysis 8 ! Quality 8 Promotion/marketing campaigns 7 ! Risk management 6 Vendor performance/partner management 6 ! Churn analysis 6 ! Category management 6 ! Market basket analysis 6 ! Supply chain analysis 6 Fraud detection 5 Other 3 Yield analysis 3 Network/traffic pattern analysis 2
Table 10: Applications for which data warehouses and/or data marts are used (Palo Alto Management Group, 2001:278)
The functional area that is particularly dominant is marketing, listed for each of the industries, and with
more than 50% of the applications of sales and marketing-related focus (indicated in Table 10), which
accounts for 57% of the market. According to Turban et al (2001:452) the data warehousing applications
with the highest impact are found in the area of marketing.

UUnniivveerrssiittyy ooff PPrreettoorriiaa,, eettdd -- PPoonneelliiss,, SS
62
According to a study by Palo Alto Management Group (2001:281), the most prominent driving forces for
investing in data warehousing and related solutions are to:
• Improve the decision and/or management processes;
• Satisfy the need to maintain a competitive edge;
• Reduce the operating costs;
• Improve customer service;
• Retain customers; and
• Identify new customers.
Among these most prominent driving forces customers feature prominently—integral to the sales and
marketing function. The importance use of data warehouses are echoed by Schroek (1998), who comments
that the positive impact of marketing data warehouses “can be measured as the ability to:
• Attract new customers through target marketing;
• Retain “at-risk” customers through advanced churn analysis, letting companies take action before
losing customers;
• Reduce costs through fraud detection programs;
• Provide better customer service by collecting all customer activity and making the information
available; and
• Improve financial results through detailed customer and product profitability analysis and activity-
based management.”
Tanler (1997:7) states that “[m]arketing data warehouses are designed to allow users to evaluate the
business performance of a product or service from multiple perspectives.” According to Sharma (1997:17),
the increase in sales revenue by leveraging detailed data was “initially the dominant factor, accounting for
80% of the motivation to invest in data warehousing. … Only 20% of the motivation was process-oriented
(in other words, the business need for more detailed information is to support operations).”
According to the definitions, a subject-specific data warehouse is a data mart. Therefore, referring to a
marketing data warehouse is, by definition, a contradiction. The author suggests that it could rather be
called a customer-centric data warehouse within this context where the entire data warehouse is focussed
entirely on customers. For example, a marketing data mart may be limited to customers, items, and sales
(Han and Kamber, 2001:67).
UUnniivveerrssiittyy ooff PPrreettoorriiaa,, eettdd -- PPoonneelliiss,, SS
63
Organisations worldwide are using data warehousing solutions to “achieve strategic advantage by gaining
better and more timely access to information about their business, products, customers and competition”
(Schroeck, 1998). Examples illustrating the use of data warehousing solutions are:
• “A pharmaceutical company analyses the results of its recent sales force activity to improve
targeting of physicians who should be first contacted; it also determines which marketing activities
will have the greatest impact in the next few months. The data include competitor market activity as
well as information about the local health care systems. The results are distributed to the sales force
via the Internet, intranets, or a private wide-area network that enables the representatives to review
the decision-making recommendations” (Turban et al, 2001:455).
• “A large consumer package goods company applies data mining to improve its sales process to
retailers. Data from consumer panels, shipments, and competitor’s activity are examined to
understand the reasons for brand and store switching. Through this analysis, the manufacturer can
select promotional strategies that best reach its target customer segments” (Turban et al, 2001:455).
• “Supermarket chains regularly analyze reams of cash register data [normally referred to as point-of-
sale or POS data] to discover what items customers are typically buying at the same time. These
shopping patterns are used for issuing coupons, designing floor layouts and products’ location, …
and creating shelf displays” (Turban et al, 2001:454).
• “Many manufacturing companies, including Polaroid, and retail organizations, such as Target
Stores, have very sophisticated product data warehouses that are designed specifically to support
their marketing operations. Both organizations are attempting to improve total product sales by
improving the quality of the information available for the thousands of decisions that are necessary
to continuously improve the marketing of products in dynamic and highly competitive businesses”
(Tanler, 1997:7-8).
Furthermore, Tanler (2000) indicated that data warehouses must operate outside the boundaries of a single
enterprise and that “extending the boundaries of data warehousing … has the potential to change the rules
for how a company operates and competes.” Thus, a data warehouse or data mart can play an important
role in making data received from channel partners available to users. When data is sourced from channel
partners, i.e., the data source is located outside of the organisation’s boundaries, there are a number of
options for integrating this data into the organisation’s information systems.

UUnniivveerrssiittyy ooff PPrreettoorriiaa,, eettdd -- PPoonneelliiss,, SS
64
3.4. Using Data Provided by Channel Partners Given the requirement for integration between different organisations discussed in Error! Reference
source not found. and the types of systems discussed in this chapter, there are a number of possible options
for the inclusion of data received from channel partners involving either the operational or analytical, i.e.,
the data warehouse or data mart, systems or both. This discussion on the use of data provided by channel
partners is particular to a third party logistics provider, such as a distributor, providing data to a
manufacturing organisation.
The generally ideal, theoretically acceptable model is for data from the distributor’s operational system to
be interfaced into the manufacturer’s operational system. There can be no analytical system at either
organisation implying the use of operational reporting capabilities or an analytical system at either or both
organisations which is populated with data from the operational systems. This is depicted
diagrammatically in Figure 9. A critical component of this option is the “alignment is the existence of
open-system computer architectures that provide for the seamless interlinkage of business systems with
other enterprise operational system, thereby unifying the marketing, production, and distribution activities
of the entire supply channel” (Ross, 1998:53).
Figure 9: Data flow between organisations’ operational systems
The second option is, rather than exchange data at the operational level, to exchange data at an analytical
level. Here the data used for management information purposes only is interfaced, generally by means of
the use of metadata through, for example, XML. This is depicted diagrammatically in Figure 10. This

UUnniivveerrssiittyy ooff PPrreettoorriiaa,, eettdd -- PPoonneelliiss,, SS
65
option can exhibit some of the operational functionality of the first option if data is fed into the operational
system(s) from the analytical system.
Figure 10: Data flow between organisations’ analytical systems
The third option is for the operational data from the data from the third party logistics provider to be fed
into the analytical system of the manufacturer. This is depicted diagrammatically in Figure 11. Although
the first two options above are theoretically acceptable and clean solutions, this option is a hybrid solution
not found in literature, either academic or trade. However, this option does occur in practice. The 3PL’s
operational system is treated as a source system similar to the manufacturer’s in-house operational systems
rather than having to include the data in an in-house operational system first.
In order to illustrate the use of data marts within this context further, the next chapter examines two case
studies in the pharmaceutical and branded consumer products industries where data originates in systems
outside the organisational boundaries utilising the third option, namely the hybrid solution, to utilise data
sourced from a channel partner, namely a third party distributor.
3.5. Chapter Conclusion The data warehouse, specifically the marketing data mart, by its very nature, is the repository where
customer data are integrated from where it is analysed. A data mart is accepted to be a departmental and/or
subject-specific data warehouse with a shorter implementation timeframe than a data warehouse of 3 to 6
months. Data marts were previously defined by its size but this is no longer generally accepted. The
attraction of data marts lie in this rapid development, as it is a less costly alternative to the data warehouse
to provide a subset of enterprise data to users. Data marts can either be dependent on a data warehouse as a

UUnniivveerrssiittyy ooff PPrreettoorriiaa,, eettdd -- PPoonneelliiss,, SS
66
data source or independent, receiving its data from one or more operational systems. A data mart also
encompasses one or more access tools, which allows end-users to access the data contained in the data mart
Figure 11: Data flow from one organisation’s operational system to another's analytical system
database. These access tools can be divided into one of three main categories, namely, query and reporting,
OLAP, and data mining. Each of these categories serves a particular purpose in delivering management
information. Data warehouses and data marts are predominantly built for sales and marketing applications.
In addition, data warehouses and data marts can play a vital role in making the data received from channel
partners available in an organisation.
Copyright © 2022 FDOKUMEN