
NCERT Solutions Class 6 Maths Chapter-9 Data Handling
22
-
Upload
khangminh22 -
Category
Documents
-
view
0 -
download
0
Transcript of NCERT Solutions Class 6 Maths Chapter-9 Data Handling

NCERT Solutions Class 6 Maths
Chapter-9 Data Handling
Exercise 9.1
Q.1 In a Mathematics test, the following marks were obtained by 40
students. Arrange these marks in a table using tally marks.
(a) Find how many students obtained marks equal to or more than 7. (b) How many students obtained marks below 4?
Solution:
We use the concept of data handling to answer the given question.
(a)
The total number of students who got 7 marks = 5
The total number of students who got 8 marks = 4
The total number of students who got 9 marks = 3
The total number of students who got marks equal to or more than 7 = 5 +
4 + 3 = 12
(b)
The total number of students who got 1 marks = 2
The total number of students who got 2 marks = 3
The total number of students who got 3 marks = 3
The total number of students who got marks below 4 = 2 + 3 + 3 = 8
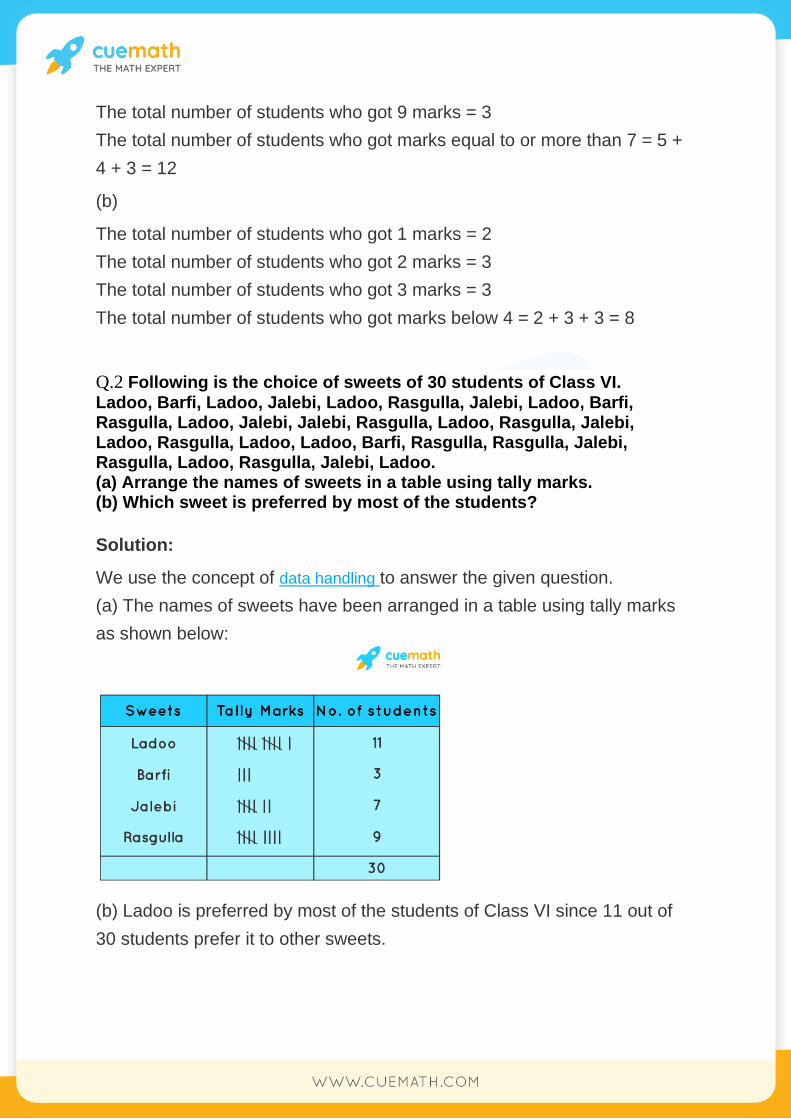
Q.2 Following is the choice of sweets of 30 students of Class VI.
Ladoo, Barfi, Ladoo, Jalebi, Ladoo, Rasgulla, Jalebi, Ladoo, Barfi, Rasgulla, Ladoo, Jalebi, Jalebi, Rasgulla, Ladoo, Rasgulla, Jalebi, Ladoo, Rasgulla, Ladoo, Ladoo, Barfi, Rasgulla, Rasgulla, Jalebi, Rasgulla, Ladoo, Rasgulla, Jalebi, Ladoo. (a) Arrange the names of sweets in a table using tally marks. (b) Which sweet is preferred by most of the students?
Solution:
We use the concept of data handling to answer the given question.
(a) The names of sweets have been arranged in a table using tally marks
as shown below:
(b) Ladoo is preferred by most of the students of Class VI since 11 out of
30 students prefer it to other sweets.

Q.3 Catherine threw a dice 40 times and noted the number appearing
each time as shown below :
Make a table and enter the data using tally marks. Find the number that appeared. (a) The minimum number of times (b) The maximum number of times (c) Find those numbers that appear an equal number of times.
Solution:
We use the concept of data handling to answer the given question.
(a) The number that appeared the minimum number of times = 4
(b) The number that appeared the maximum number of times = 5
(c) The numbers 1 and 6 appeared an equal number of times, that is 7.

Q.4 Following pictograph shows the number of tractors in five villages.
Observe the pictograph and answer the following questions. (i) Which village has the minimum number of tractors? (ii) Which village has the maximum number of tractors? (iii) How many more tractors village C has as compared to village B. (iv) What is the total number of tractors in all the five villages?
Solution:
(i) The village which has the minimum number of tractors is Village D. It has
3 tractors.
(ii) The village which has the maximum number of tractors is Village C. It
has 8 tractors.
(iii) There are 5 tractors in Village B and 8 tractors in Village C.
⇒ 8 – 5 = 3 tractors
Thus, in comparison to village B, village C has three more tractors.
(iv) The total number of tractors in all the five villages is 28.
⇒ 6 + 5 + 8 + 3 + 6 = 28 tractors
Q.5 The number of girl students in each class of a co-educational middle
school is depicted by the pictograph :
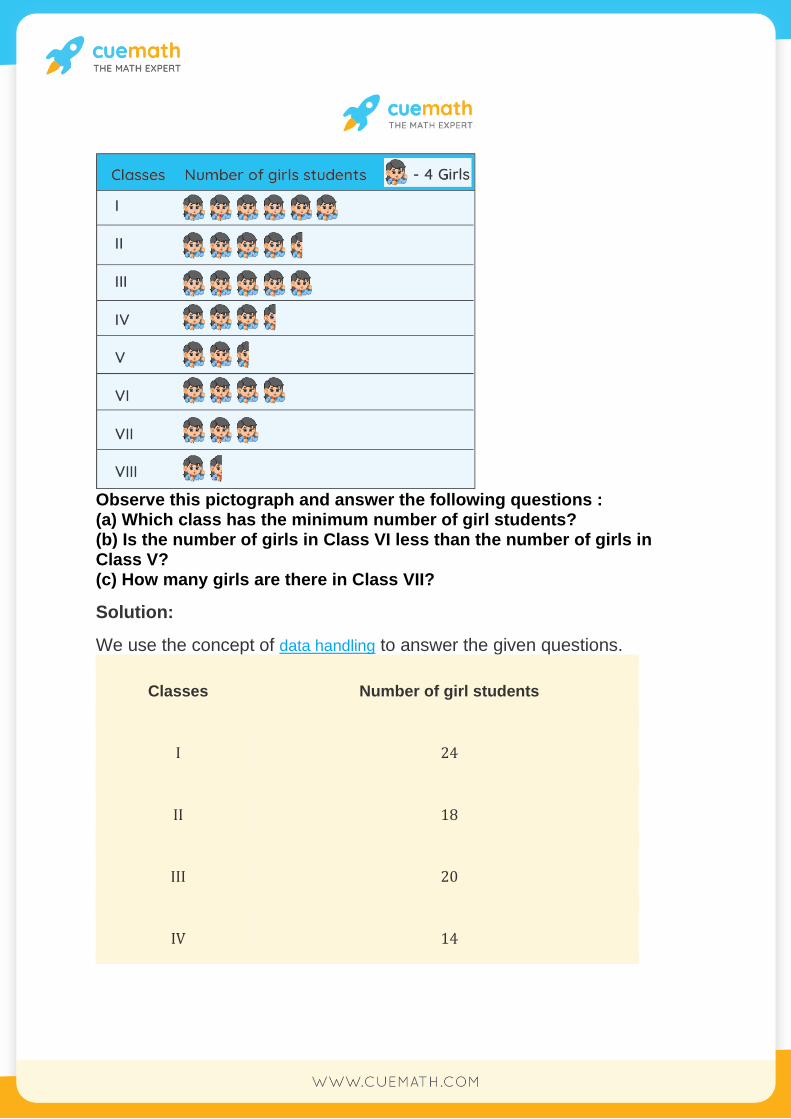
Observe this pictograph and answer the following questions : (a) Which class has the minimum number of girl students? (b) Is the number of girls in Class VI less than the number of girls in Class V? (c) How many girls are there in Class VII?
Solution:
We use the concept of data handling to answer the given questions.
Classes Number of girl students
I 24
II 18
III 20
IV 14
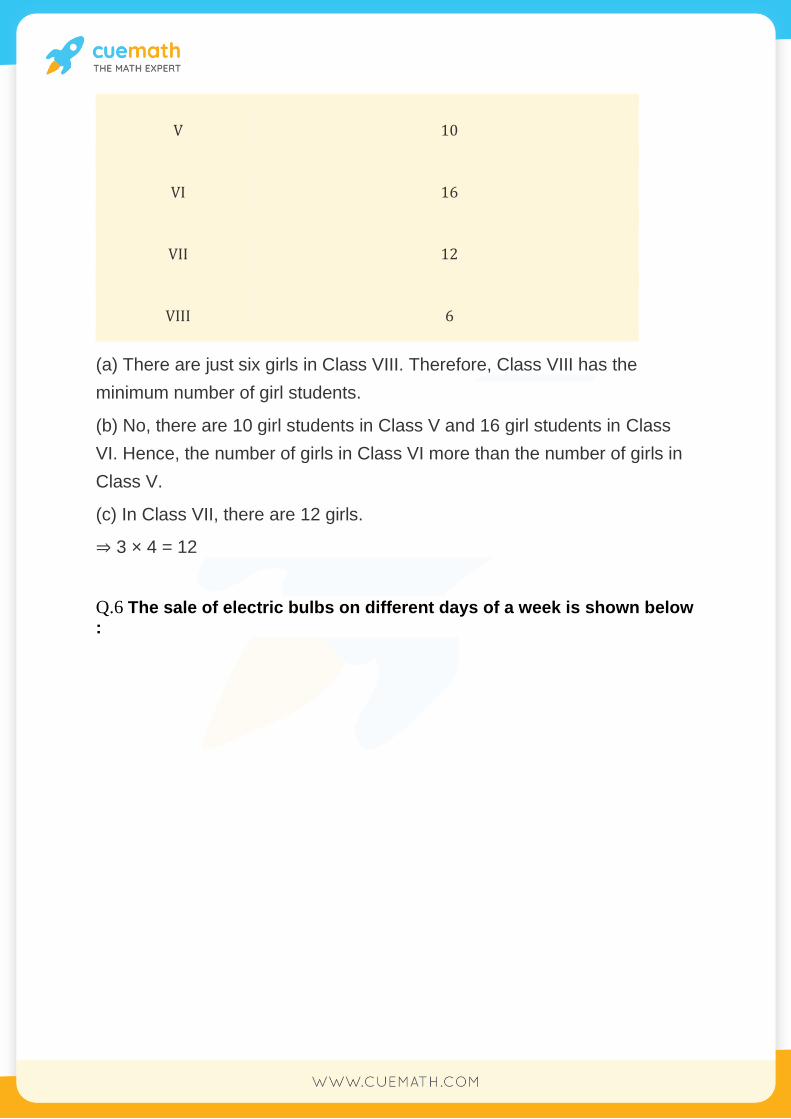
V 10
VI 16
VII 12
VIII 6
(a) There are just six girls in Class VIII. Therefore, Class VIII has the
minimum number of girl students.
(b) No, there are 10 girl students in Class V and 16 girl students in Class
VI. Hence, the number of girls in Class VI more than the number of girls in
Class V.
(c) In Class VII, there are 12 girls.
⇒ 3 × 4 = 12
Q.6 The sale of electric bulbs on different days of a week is shown below
:
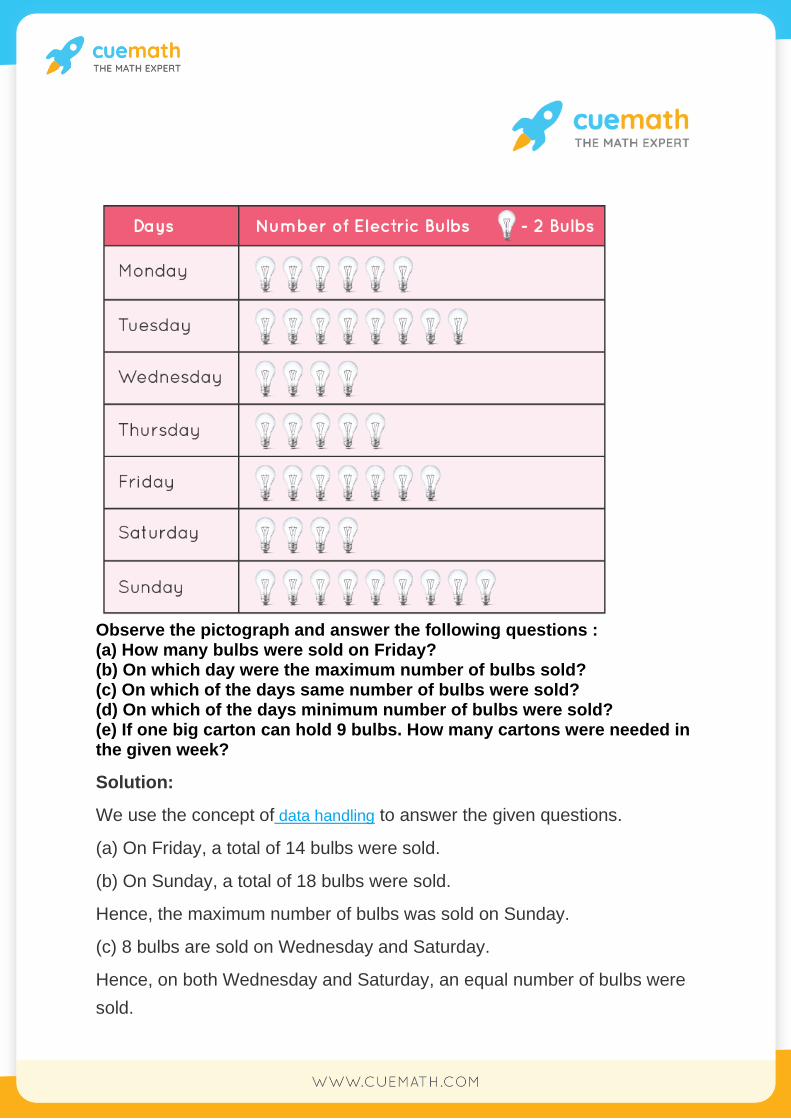
Observe the pictograph and answer the following questions : (a) How many bulbs were sold on Friday? (b) On which day were the maximum number of bulbs sold? (c) On which of the days same number of bulbs were sold? (d) On which of the days minimum number of bulbs were sold? (e) If one big carton can hold 9 bulbs. How many cartons were needed in the given week?
Solution:
We use the concept of data handling to answer the given questions.
(a) On Friday, a total of 14 bulbs were sold.
(b) On Sunday, a total of 18 bulbs were sold.
Hence, the maximum number of bulbs was sold on Sunday.
(c) 8 bulbs are sold on Wednesday and Saturday.
Hence, on both Wednesday and Saturday, an equal number of bulbs were
sold.
(d) 8 bulbs are sold on Wednesday and Saturday.
Hence, the Minimum number of bulbs was sold on Wednesday and
Saturday.
(e) A total of 86 bulbs were sold in the given week.
⇒ 12 + 16 + 8 + 10 + 14 + 8 + 18 = 86
Since one big carton can hold 9 bulbs, we would require
⇒ 86/9 ≈ 10 cartons
∴ 10 cartons were needed in the given week.
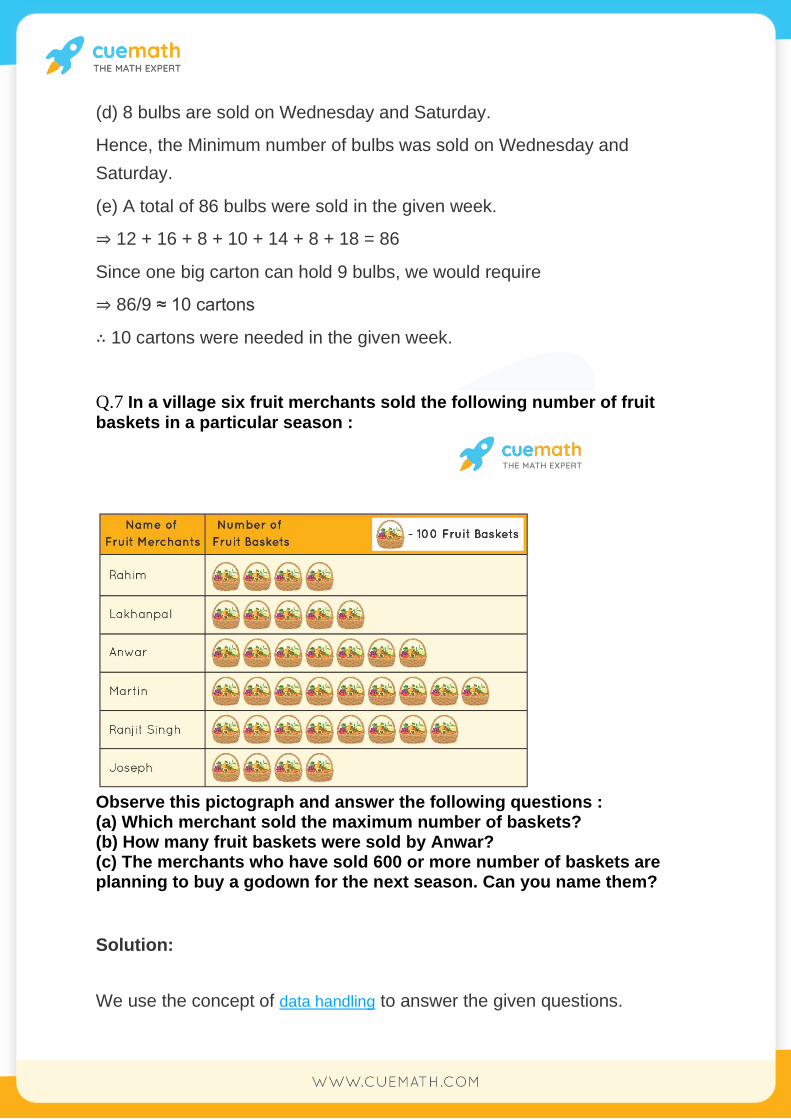
Q.7 In a village six fruit merchants sold the following number of fruit
baskets in a particular season :
Observe this pictograph and answer the following questions : (a) Which merchant sold the maximum number of baskets? (b) How many fruit baskets were sold by Anwar? (c) The merchants who have sold 600 or more number of baskets are planning to buy a godown for the next season. Can you name them?
Solution:
We use the concept of data handling to answer the given questions.

Name of Fruit Merchants Total number of fruit baskets
Rahim 400
Lakhanpal 550
Anwar 700
Martin 950
Ranjit Singh 800
Joseph 450
(a) The maximum number of fruit baskets were sold = 950
Hence, Martin was the one who sold the maximum fruit baskets.
(b) 7 × 100 = 700 fruit baskets were sold by Anwar
(c) The merchants who sold more than 600 fruit baskets were Anwar,
Martin, and Ranjit Singh.
NCERT Solutions Class 6 Maths
Chapter-9 Data Handling
Exercise 9.2
Q.1 The total number of animals in the five villages are as follows:
Village A: 80 Village D: 40 Village B: 120 Village E: 60. Village C: 90 Prepare a pictograph of these animals using one symbol to represent 10 animals and answer the following questions : (a) How many symbols represent animals of village E? (b) Which village has the maximum number of animals? (c) Which village has more animals: village A or village C?
Solution:
We use the concept of data handling to answer the given questions.
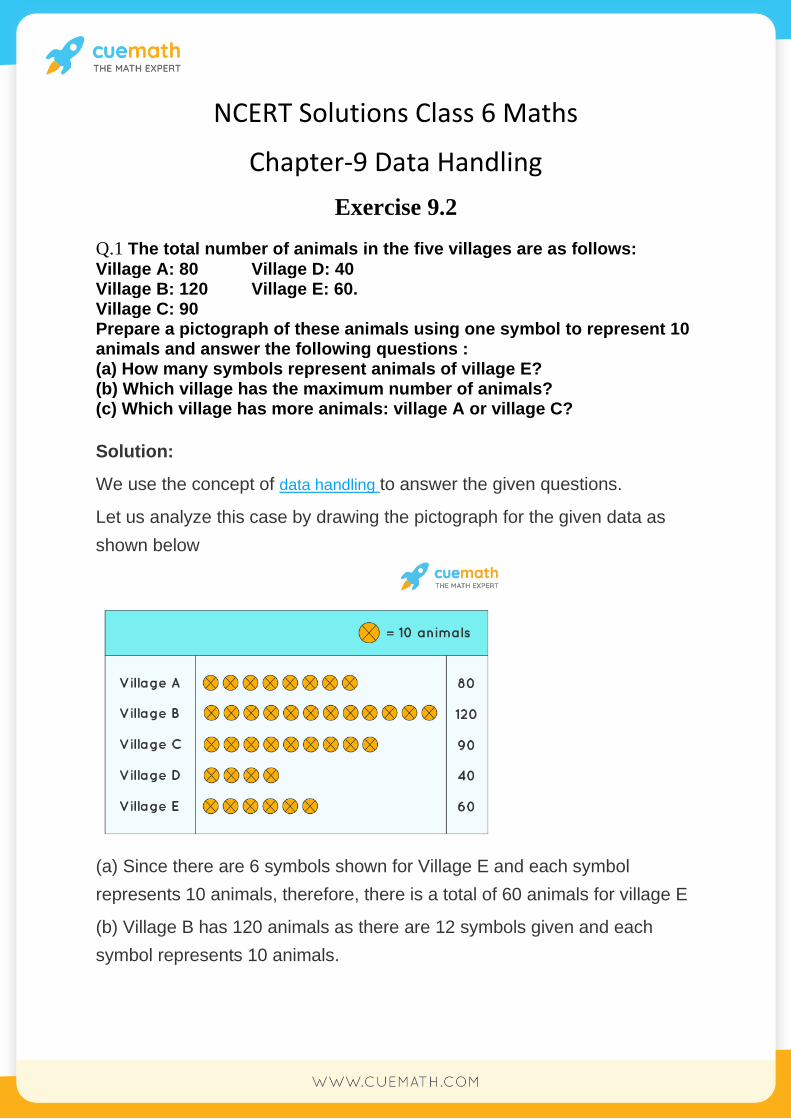
Let us analyze this case by drawing the pictograph for the given data as
shown below
(a) Since there are 6 symbols shown for Village E and each symbol
represents 10 animals, therefore, there is a total of 60 animals for village E
(b) Village B has 120 animals as there are 12 symbols given and each
symbol represents 10 animals.
(c) Village A has 80 animals because of 8 symbols and village C has 90
animals because of 9 symbols. Hence, village C has more animals than
village A
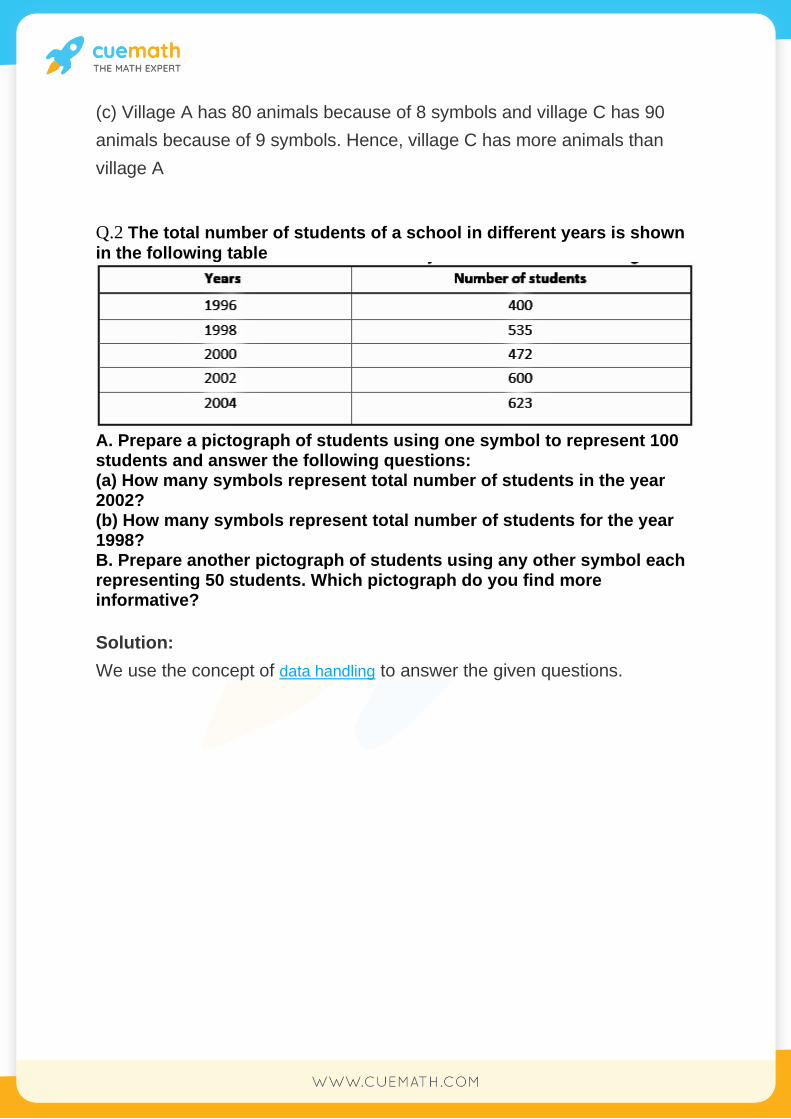
Q.2 The total number of students of a school in different years is shown
in the following table
A. Prepare a pictograph of students using one symbol to represent 100 students and answer the following questions: (a) How many symbols represent total number of students in the year 2002? (b) How many symbols represent total number of students for the year 1998? B. Prepare another pictograph of students using any other symbol each representing 50 students. Which pictograph do you find more informative?
Solution:
We use the concept of data handling to answer the given questions.
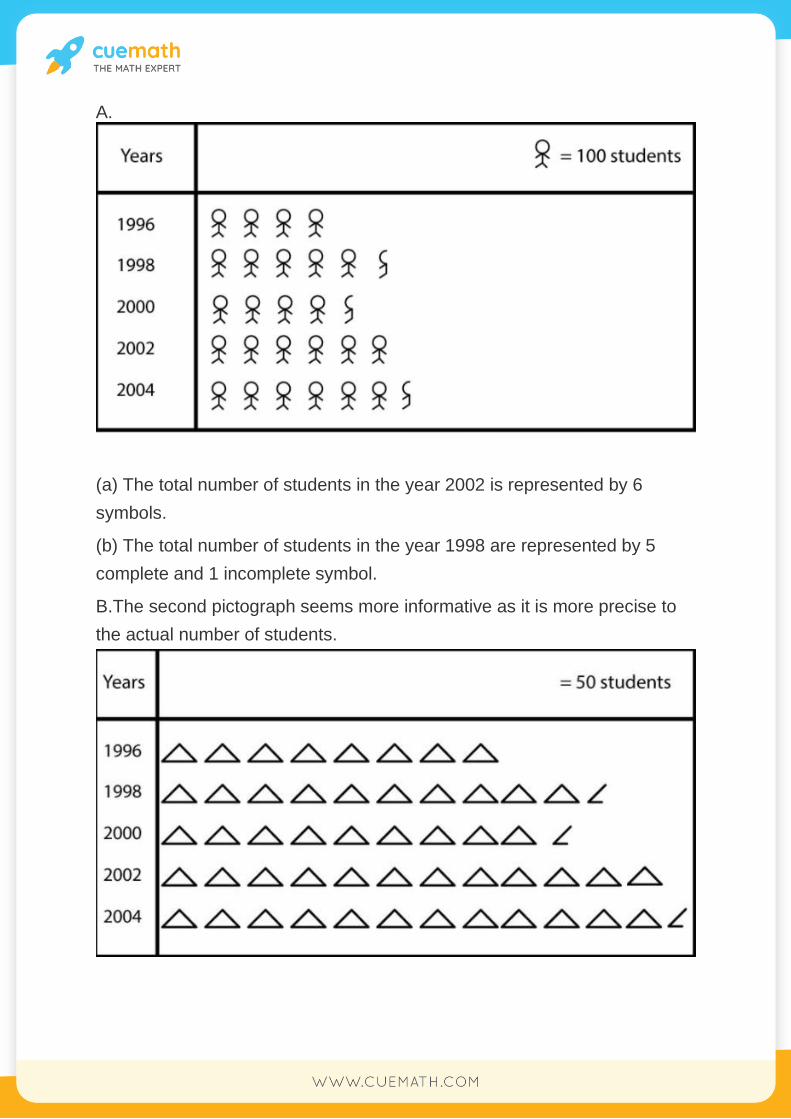
A.
(a) The total number of students in the year 2002 is represented by 6
symbols.
(b) The total number of students in the year 1998 are represented by 5
complete and 1 incomplete symbol.
B.The second pictograph seems more informative as it is more precise to
the actual number of students.
NCERT Solutions Class 6 Maths
Chapter-9 Data Handling
Exercise 9.3
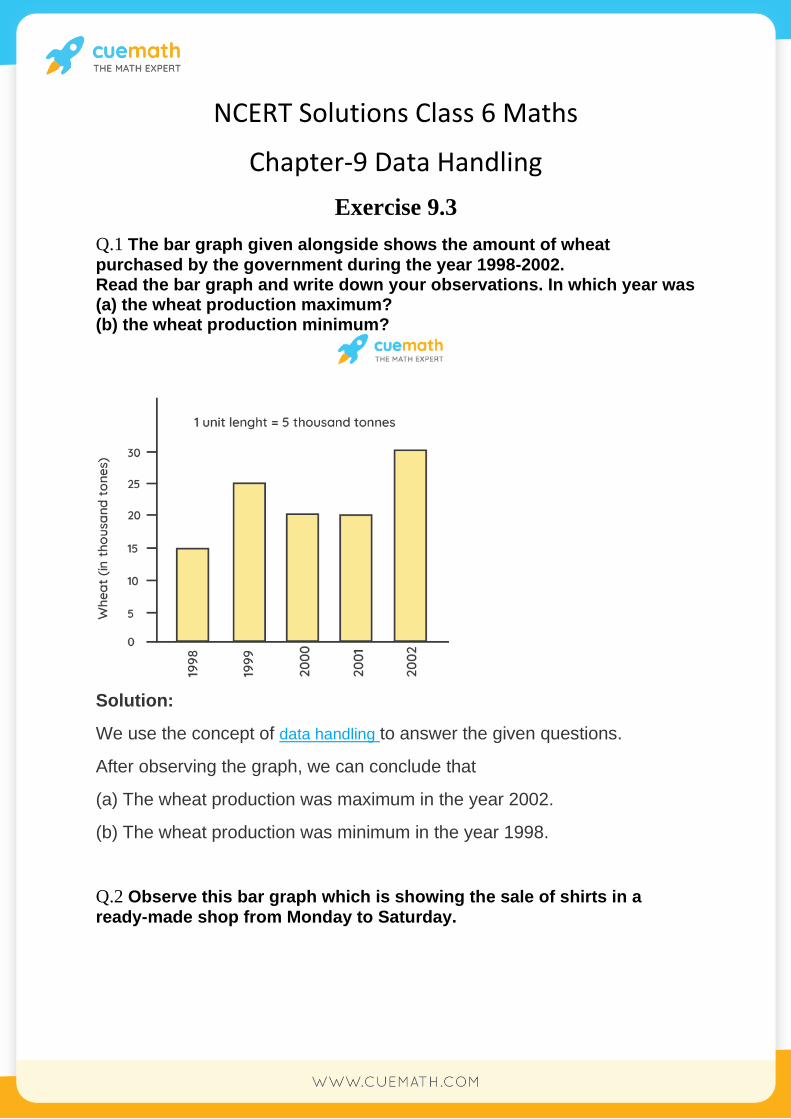
Q.1 The bar graph given alongside shows the amount of wheat
purchased by the government during the year 1998-2002. Read the bar graph and write down your observations. In which year was (a) the wheat production maximum? (b) the wheat production minimum?
Solution:
We use the concept of data handling to answer the given questions.
After observing the graph, we can conclude that
(a) The wheat production was maximum in the year 2002.
(b) The wheat production was minimum in the year 1998.
Q.2 Observe this bar graph which is showing the sale of shirts in a
ready-made shop from Monday to Saturday.
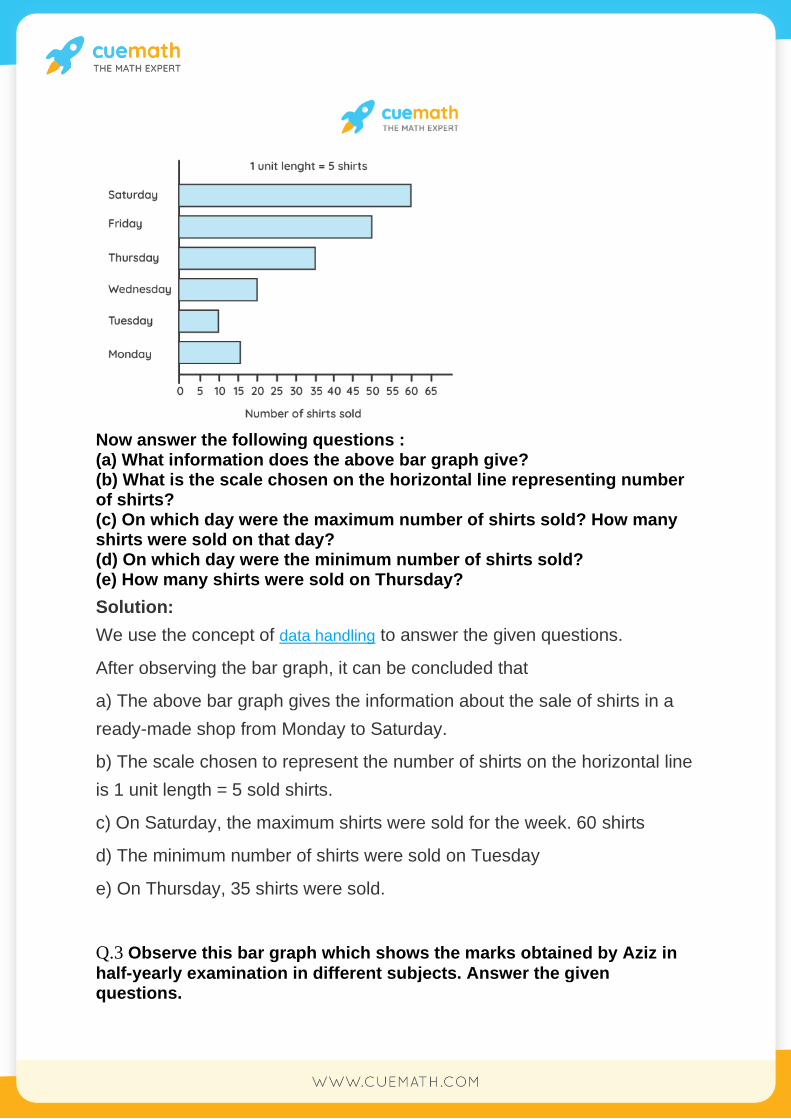
Now answer the following questions : (a) What information does the above bar graph give? (b) What is the scale chosen on the horizontal line representing number of shirts? (c) On which day were the maximum number of shirts sold? How many shirts were sold on that day? (d) On which day were the minimum number of shirts sold? (e) How many shirts were sold on Thursday?
Solution:
We use the concept of data handling to answer the given questions.
After observing the bar graph, it can be concluded that
a) The above bar graph gives the information about the sale of shirts in a
ready-made shop from Monday to Saturday.
b) The scale chosen to represent the number of shirts on the horizontal line
is 1 unit length = 5 sold shirts.
c) On Saturday, the maximum shirts were sold for the week. 60 shirts
d) The minimum number of shirts were sold on Tuesday
e) On Thursday, 35 shirts were sold.
Q.3 Observe this bar graph which shows the marks obtained by Aziz in
half-yearly examination in different subjects. Answer the given questions.

(a) What information does the bar graph give? (b) Name the subject in which Aziz scored maximum marks. (c) Name the subject in which he has scored minimum marks. (d) State the name of the subjects and marks obtained in each of them.
Solution:
We use the concept of data handling to answer the given questions.
After observing the above graph, we can say that
a) The graph shows marks obtained by Aziz in different subjects in half-
yearly examinations.
b) Aziz scored maximum marks in Hindi.
c) Aziz scored minimum marks in Social studies.
d) Marks obtained by Aziz in different subjects are
English = 60, Hindi = 80, Mathematics = 70, Science = 50 and Social
Studies = 40.
NCERT Solutions Class 6 Maths
Chapter-9 Data Handling
Exercise 9.4
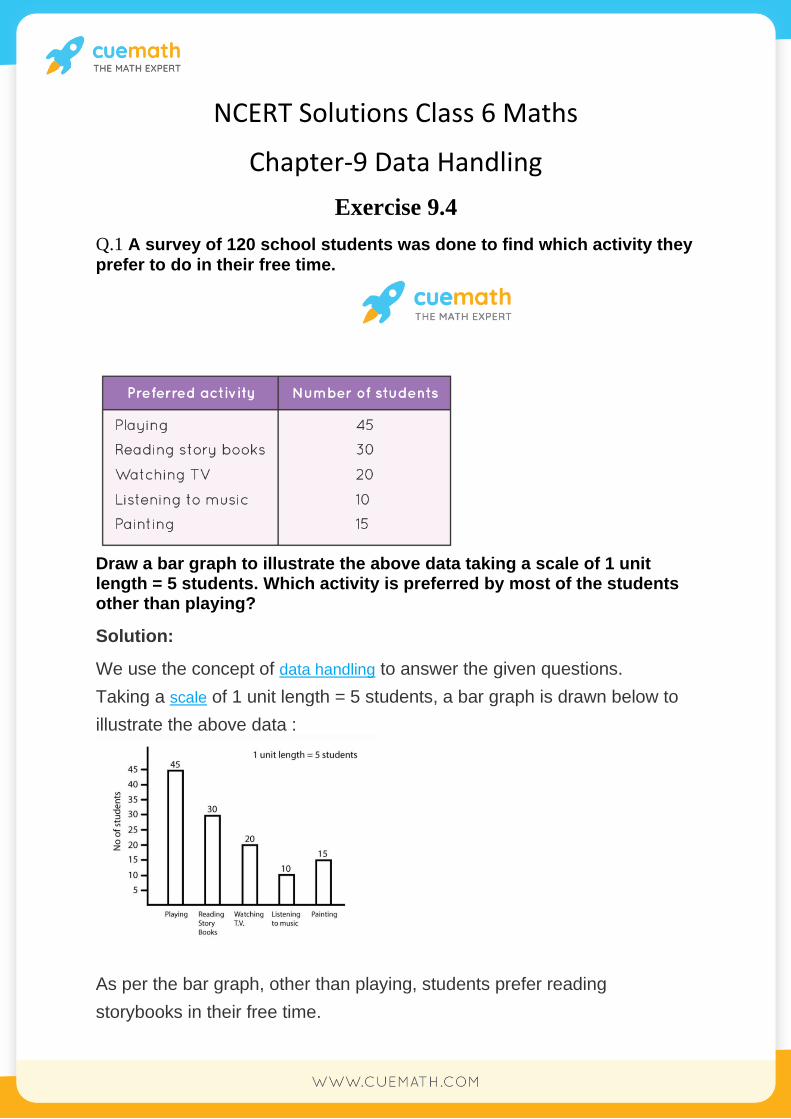
Q.1 A survey of 120 school students was done to find which activity they
prefer to do in their free time.
Draw a bar graph to illustrate the above data taking a scale of 1 unit length = 5 students. Which activity is preferred by most of the students other than playing?
Solution:
We use the concept of data handling to answer the given questions.
Taking a scale of 1 unit length = 5 students, a bar graph is drawn below to
illustrate the above data :
As per the bar graph, other than playing, students prefer reading
storybooks in their free time.

Q.2 The number of Mathematics books sold by a shopkeeper on six
consecutive days is shown below:
Draw a bar graph to represent the above information choosing the scale of your choice.
Solution:
We use the concept of data handling to answer the given questions.
According to the question, take a scale of 1 unit length = 10 books.
From the information given in the table and taking a scale of 1 unit length =
5 books, the following bar graph is drawn:
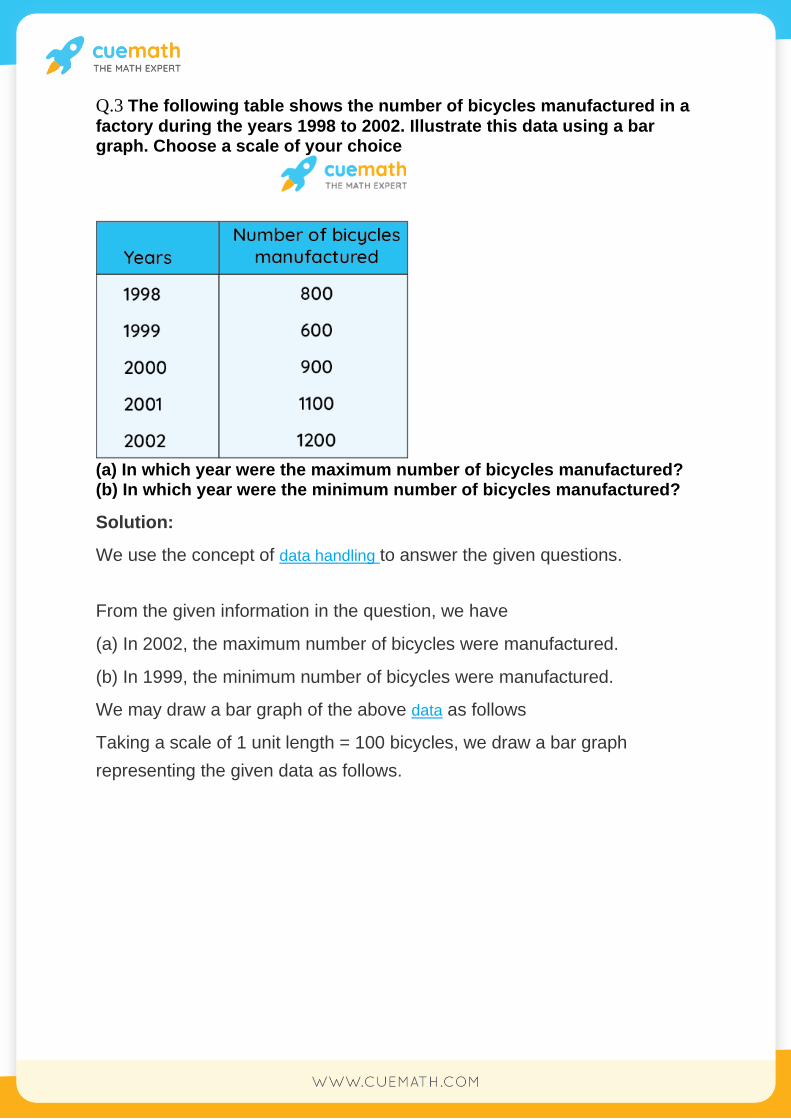
Q.3 The following table shows the number of bicycles manufactured in a
factory during the years 1998 to 2002. Illustrate this data using a bar graph. Choose a scale of your choice
(a) In which year were the maximum number of bicycles manufactured? (b) In which year were the minimum number of bicycles manufactured?
Solution:
We use the concept of data handling to answer the given questions.
From the given information in the question, we have
(a) In 2002, the maximum number of bicycles were manufactured.
(b) In 1999, the minimum number of bicycles were manufactured.
We may draw a bar graph of the above data as follows
Taking a scale of 1 unit length = 100 bicycles, we draw a bar graph
representing the given data as follows.

Q.4 Number of persons in various age groups in a town is given in the
following table.
Draw a bar graph to represent the above information and answer the following questions. (take 1 unit length = 20 thousands) (a) Which two age groups have same population? (b) All persons in the age group of 60 and above are called senior citizens. How many senior citizens are there in the town?
Solution:
We use the concept of data handling to answer the given questions.
From the information given in the question, we may draw a bar graph as
follows
Taking a scale of 1 unit length = 100 bicycles, we draw a bar graph
representing the given data as follows.
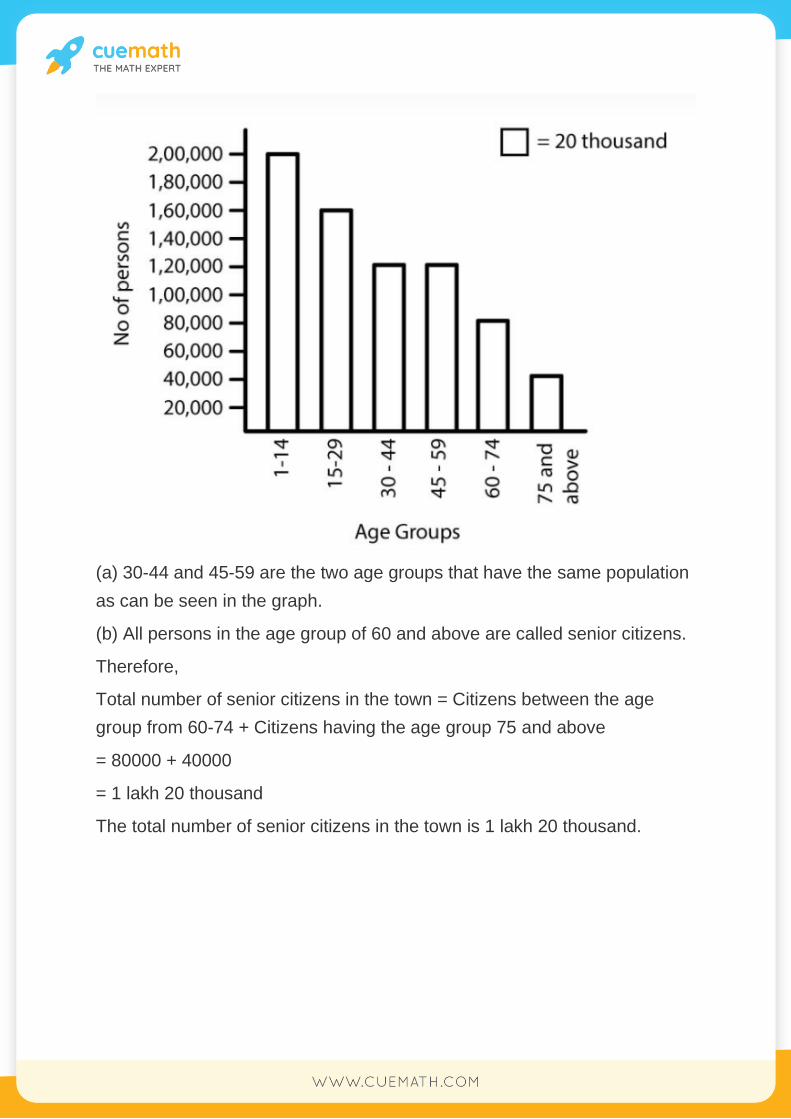
(a) 30-44 and 45-59 are the two age groups that have the same population
as can be seen in the graph.
(b) All persons in the age group of 60 and above are called senior citizens.
Therefore,
Total number of senior citizens in the town = Citizens between the age
group from 60-74 + Citizens having the age group 75 and above
= 80000 + 40000
= 1 lakh 20 thousand
The total number of senior citizens in the town is 1 lakh 20 thousand.