
CHAPTER 4 DATA WAREHOUSING - University of Pretoria
30
132 CHAPTER 4 DATA WAREHOUSING 4.1 Introduction In this chapter, the nature of data warehousing is discussed. The purpose of the chapter is to provide background knowledge for the forthcoming chapters on the relationship between data warehousing and systems thinking, rather than to give a complete description of data warehousing design methods. The terms data warehouse and data warehousing may be confusing. Therefore, it was decided to use the term data warehouse as a noun and data warehousing as the process to create a data warehouse. A data warehouse is throughout this thesis regarded as a system. The first section investigates the definition of a data warehouse. Data warehouses are then compared with operational information systems. The explanation of data warehousing is clarified by a discussion on data warehousing architecture. The main stages in the data warehousing lifecycle, namely requirements collection, data modelling, data staging and data access are discussed to highlight different views on data warehousing methods. Data warehousing success is of critical importance to the industry. The Cutter consortium (Anonymous, 2003:1) reported that 41% of data warehousing professionals has experienced data warehousing projects that failed. A review of current literature on data warehousing success factors is given to highlight the problems and opportunities in this field. An Internet research study on perceived critical success factors and main causes of failures serves as a link between the formal literature and the practices of data warehousing professionals. The chapter concludes with a literature investigation into the combination of systems thinking and data warehousing practices, which serves as an investigation of current research for the overall study presented in this thesis. This chapter represents the practice level of the philosophy, methodology 1 and practice model presented in this thesis. Although IS professionals would recognise University of Pretoria etd – Goede, R (2005)
-
Upload
khangminh22 -
Category
Documents
-
view
1 -
download
0
Transcript of CHAPTER 4 DATA WAREHOUSING - University of Pretoria
132
CHAPTER 4 DATA WAREHOUSING
4.1 Introduction
In this chapter, the nature of data warehousing is discussed. The purpose of the
chapter is to provide background knowledge for the forthcoming chapters on the
relationship between data warehousing and systems thinking, rather than to give a
complete description of data warehousing design methods.
The terms data warehouse and data warehousing may be confusing. Therefore, it
was decided to use the term data warehouse as a noun and data warehousing as the
process to create a data warehouse. A data warehouse is throughout this thesis
regarded as a system.
The first section investigates the definition of a data warehouse. Data warehouses
are then compared with operational information systems. The explanation of data
warehousing is clarified by a discussion on data warehousing architecture. The main
stages in the data warehousing lifecycle, namely requirements collection, data
modelling, data staging and data access are discussed to highlight different views on
data warehousing methods.
Data warehousing success is of critical importance to the industry. The Cutter
consortium (Anonymous, 2003:1) reported that 41% of data warehousing
professionals has experienced data warehousing projects that failed. A review of
current literature on data warehousing success factors is given to highlight the
problems and opportunities in this field. An Internet research study on perceived
critical success factors and main causes of failures serves as a link between the
formal literature and the practices of data warehousing professionals.
The chapter concludes with a literature investigation into the combination of systems
thinking and data warehousing practices, which serves as an investigation of current
research for the overall study presented in this thesis.
This chapter represents the practice level of the philosophy, methodology1 and
practice model presented in this thesis. Although IS professionals would recognise
UUnniivveerrssiittyy ooff PPrreettoorriiaa eettdd –– GGooeeddee,, RR ((22000055))
133
the information presented in this chapter as data warehousing methodology, it is
viewed as a generalisation of practices of data warehousing professionals and
therefore as practice. The term “method” is used to indicate data warehousing
methodology. The practice layer in the model can be divided into generalised
practices and individual practices. The generalised practices are presented in this
chapter and the individual practices in the next chapter.
Although the association between data warehousing practices and systems thinking
is only done in chapter 5, it is possible to identify systems thinking ideas in data
warehousing practices as presented in this chapter. The educated systems thinker
is able to identify conflicts in the definitions given for key data warehousing
terminology.
Different systems thinking ideas are already visible in definitions of information
systems. Mallach (2000:88) defines information systems as “a system whose
purpose is to store, process, and communicate information”. This definition can be
compared to that of Du Plooy et al. (1993:01): “Information systems is an inter-
disciplinary field of scholarly inquiry, where information, information systems and the
integration thereof with the organisation is studied in order to benefit the total system
(technology, people, organisation and society).” It is clear that the system in
Mallach’s definition has a tighter boundary than that of Du Plooy et al. (1993). The
latter follows a more holistic (soft systems) approach to IS.
4.2 What is a data warehouse?
Data warehouses are examples of decision support systems (DSS). A DSS can be
defined as a “computer-based information system whose primary purpose is to
provide knowledge workers with information on which to base informed decisions.”
(Mallach, 2000:13). DSS can be divided into data-oriented DSS, model-oriented
DSS and process-oriented DSS. A data-oriented DSS uses data base systems as
source of the decision support, in contrast to a model-oriented DSS which uses
mathematical models to support business decisions and a process-oriented DSS
which simulates human decision making processes (Mallach, 2000:143). Data
warehouses are the primary example of data-oriented DSS today.
UUnniivveerrssiittyy ooff PPrreettoorriiaa eettdd –– GGooeeddee,, RR ((22000055))

134
This literature study indicated two main authors in the field of data warehousing,
namely William Inmon, who is known as the father of data warehousing, and Ralph
Kimball. Their approaches to certain aspects of data warehousing differ greatly.
Industry practitioners are aware of these authors and their differences. Practitioners
choose to follow either an Inmon approach, or a Kimball approach. Other data
warehousing literature can easily be labelled as more towards Inmon’s, or more
towards Kimball’s ideas. Some of these differences will be highlighted in this
chapter. The literature study given in this chapter is mainly based on the work of
these two authors.
Inmon (1996:33) defines a data warehouse as a subject oriented integrated, non-
volatile, and time variant collection of data in support of management decisions.
McFadden et al. (1999:531) explain each of the parts of this definition:
“1. Subject oriented: A data warehouse is organised around the key subjects (or
high level entities) of the enterprise. Major subjects may include customers,
patients, students and products.
2. Integrated: The data housed in the data warehouse is defined using
consistent naming conventions, formats, encoding structures, and related
characteristics.
3. Time-variant: Data in the data warehouse contains a time dimension so that it
may be used as a historical record of the business.
4. Non-volatile: Data in the data warehouse is loaded and refreshed from
operational systems, but cannot be updated by end-users.”
Kimball et al. (1998:19) simply define a data warehouse as “the queryable source of
data in the enterprise.”
Poe et al. (1998:6) define a data warehouse as “a read-only analytical database that
is used as the foundation of a decision support system.”
The majority of literature (excluding Kimball et al. (1998) and Poe et al. (1998)) uses
the Inmon definition to define a data warehouse, as well as their own explanation of
the key terms, as for example quoted above from McFadden (1999:531).
Markus (2000) discusses a data warehouse as an example of business-driven
enterprise systems. She argues that the development process looks more like a
UUnniivveerrssiittyy ooff PPrreettoorriiaa eettdd –– GGooeeddee,, RR ((22000055))
135
large-scale organisational development or change management project, rather than a
traditional IS project (Markus, 2000:44).
4.3 Data warehousing versus online transaction processing (OLTP)
Data warehouses are also known as online analytical processing (OLAP) systems
because they serve managers and knowledge workers in the field of data analysis
and decision making.
Online transaction processing (OLTP) systems, or operational systems, are those
information systems that support the daily processing that an organisation does.
OLTP systems’ main purpose is to capture information about the economic activities
of an organisation. One might argue that the purpose of OLTP systems is to get
data into computers, whereas the purpose of data warehouses is to get data or
information out of computers.
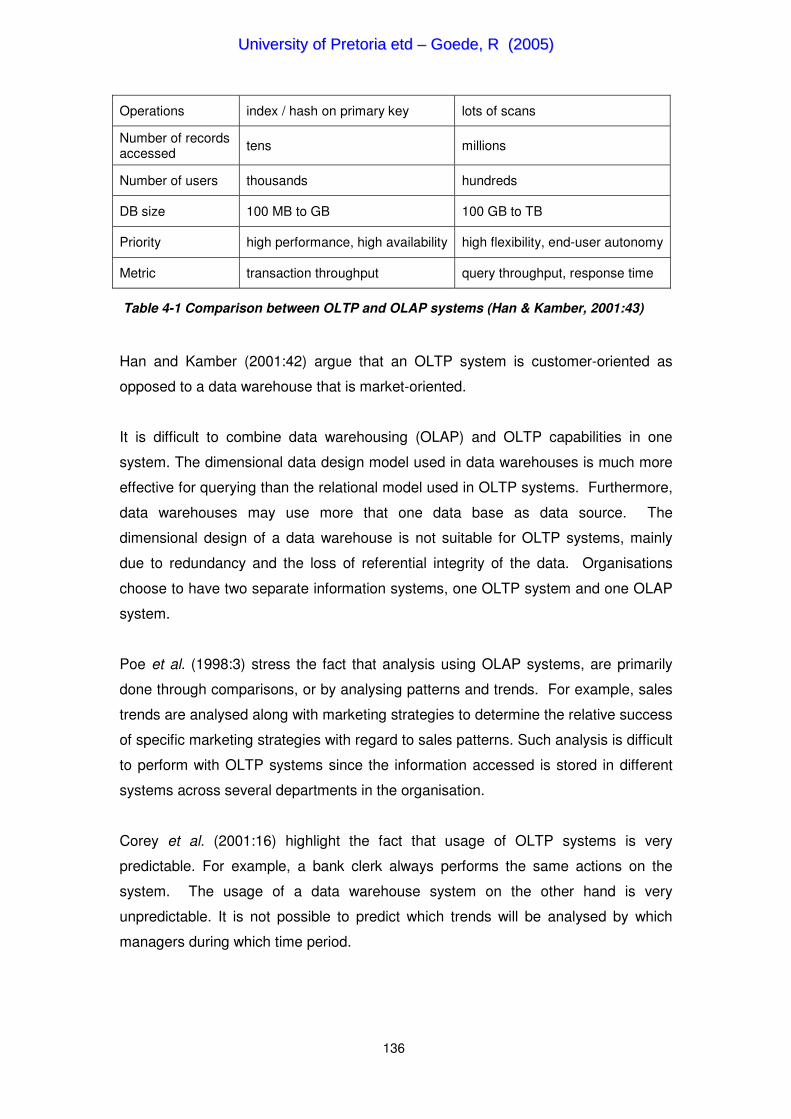
Han and Kamber (2001:43) describe the differences between data warehouses and
OLTP systems. The key differences are summarised in table 4.1.
Feature OLTP OLAP
Characteristic operational processing informational processing
Orientation transaction analysis
User clerk, data base administrator (DBA), data base professional
knowledge worker (e.g. manager, executive, analyst)
Function day-to-day operations long-term informational requirements, decision support
Data base (DB) design
entity relational (ER) based, application oriented star / snowflake, subject oriented
Data current; guaranteed up-to-date historical; accuracy maintained over time
Summarisation primitive, highly detailed summarised, consolidated
View detailed, flat relational summarised, multidimensional
Unit of work short, simple transaction complex query
Access read / write mostly read
Focus data in information out
UUnniivveerrssiittyy ooff PPrreettoorriiaa eettdd –– GGooeeddee,, RR ((22000055))
136
Operations index / hash on primary key lots of scans
Number of records accessed tens millions
Number of users thousands hundreds
DB size 100 MB to GB 100 GB to TB
Priority high performance, high availability high flexibility, end-user autonomy
Metric transaction throughput query throughput, response time
Table 4-1 Comparison between OLTP and OLAP systems (Han & Kamber, 2001:43)
Han and Kamber (2001:42) argue that an OLTP system is customer-oriented as
opposed to a data warehouse that is market-oriented.
It is difficult to combine data warehousing (OLAP) and OLTP capabilities in one
system. The dimensional data design model used in data warehouses is much more
effective for querying than the relational model used in OLTP systems. Furthermore,
data warehouses may use more that one data base as data source. The
dimensional design of a data warehouse is not suitable for OLTP systems, mainly
due to redundancy and the loss of referential integrity of the data. Organisations
choose to have two separate information systems, one OLTP system and one OLAP
system.
Poe et al. (1998:3) stress the fact that analysis using OLAP systems, are primarily
done through comparisons, or by analysing patterns and trends. For example, sales
trends are analysed along with marketing strategies to determine the relative success
of specific marketing strategies with regard to sales patterns. Such analysis is difficult
to perform with OLTP systems since the information accessed is stored in different
systems across several departments in the organisation.
Corey et al. (2001:16) highlight the fact that usage of OLTP systems is very
predictable. For example, a bank clerk always performs the same actions on the
system. The usage of a data warehouse system on the other hand is very
unpredictable. It is not possible to predict which trends will be analysed by which
managers during which time period.
UUnniivveerrssiittyy ooff PPrreettoorriiaa eettdd –– GGooeeddee,, RR ((22000055))
137
Eckerson (2003:7) argues that the most important difference between OLTP and
OLAP systems is that an OLTP system forces business process structure which
should not be changed, while OLAP systems need to be changed regularly. He
argues that the more often business intelligence (BI) systems are changed, the better
they become. They should change often to meet the ever changing needs of the
business.
Kimball et al. (1998:14) highlight similar differences to those presented in table 4.1.
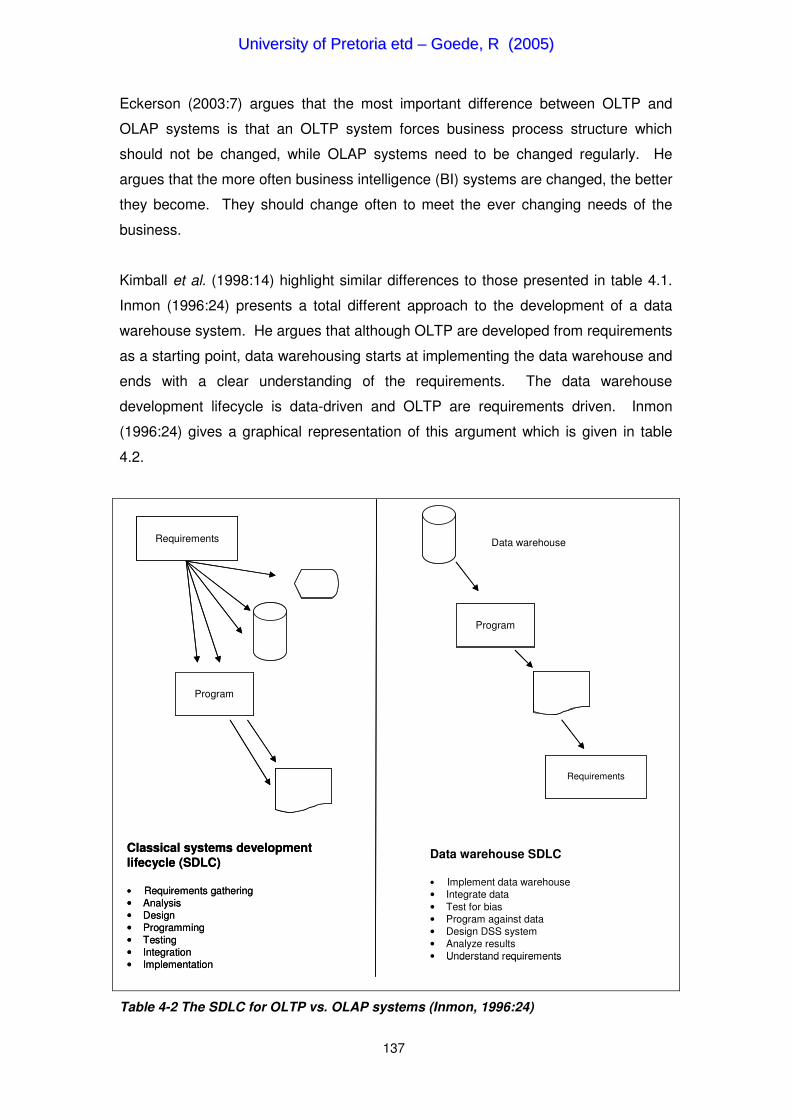
Inmon (1996:24) presents a total different approach to the development of a data
warehouse system. He argues that although OLTP are developed from requirements
as a starting point, data warehousing starts at implementing the data warehouse and
ends with a clear understanding of the requirements. The data warehouse
development lifecycle is data-driven and OLTP are requirements driven. Inmon
(1996:24) gives a graphical representation of this argument which is given in table
4.2.
Requirements
Program
Requirements
Program
Data warehouse
Data warehouse SDLC
• Implement data warehouse• Integrate data• Test for bias• Program against data• Design DSS system• Analyze results• Understand requirements
Classical systems development lifecycle (SDLC)
• Requirements gathering• Analysis• Design• Programming• Testing• Integration• Implementation
Requirements
Program
Requirements
Program
Data warehouse
Data warehouse SDLC
• Implement data warehouse• Integrate data• Test for bias• Program against data• Design DSS system• Analyze results• Understand requirements
Classical systems development lifecycle (SDLC)
• Requirements gathering• Analysis• Design• Programming• Testing• Integration• Implementation
Table 4-2 The SDLC for OLTP vs. OLAP systems (Inmon, 1996:24)
UUnniivveerrssiittyy ooff PPrreettoorriiaa eettdd –– GGooeeddee,, RR ((22000055))
138
Kimball et al. (1998) differ from this approach by following a requirements-driven
development lifecycle. This difference will feature strongly in the arguments
presented in chapter 5.
4.4 High level data warehouse architecture
This discussion aims to give a holistic view on data warehousing. The section begins
with a high level view presented by The Data Warehouse Institute (TDWI) of
businesses intelligence (BI). This is followed by a discussion based on the proposed
high level architecture given by Kimball et al. (1998). Differences to this approach
will be discussed in section 4.5 where a more detailed view is taken on the key
issues of data warehousing.
Eckerson (2003) from TDWI did a study on the success factors in implementing BI
systems in organisations and the role of data warehouses in this process. Eckerson
(2003:4) views the BI process holistically as a “data refinery”. Data from different
OLTP systems are integrated, which leads to a new product called information. The
data warehouse staging process is responsible for this transformation. Users
equipped with programs such as specialised reporting tools, OLAP tools and data
mining tools transform information to knowledge. This is done through analysis that
identifies trends, patterns and exceptions. Kimball et al. (1998:329) include this
process as part of the data warehouse project. The next step is to transform
knowledge to rules. Users create rules from knowledge; these may be simple rules
such as “Order 50 new units whenever inventory falls below 25 units”, or complex
rules generated by statistical algorithms or models. Rules lead to plans of action that
implement these rules. The actual implementation of these plans creates a cycle
when new data enters the data warehouse, to be transformed once again into
information and so forth. Although a data warehouse is only one tool in this process,
it illustrates the value and purpose of a data warehouse in the organisation.
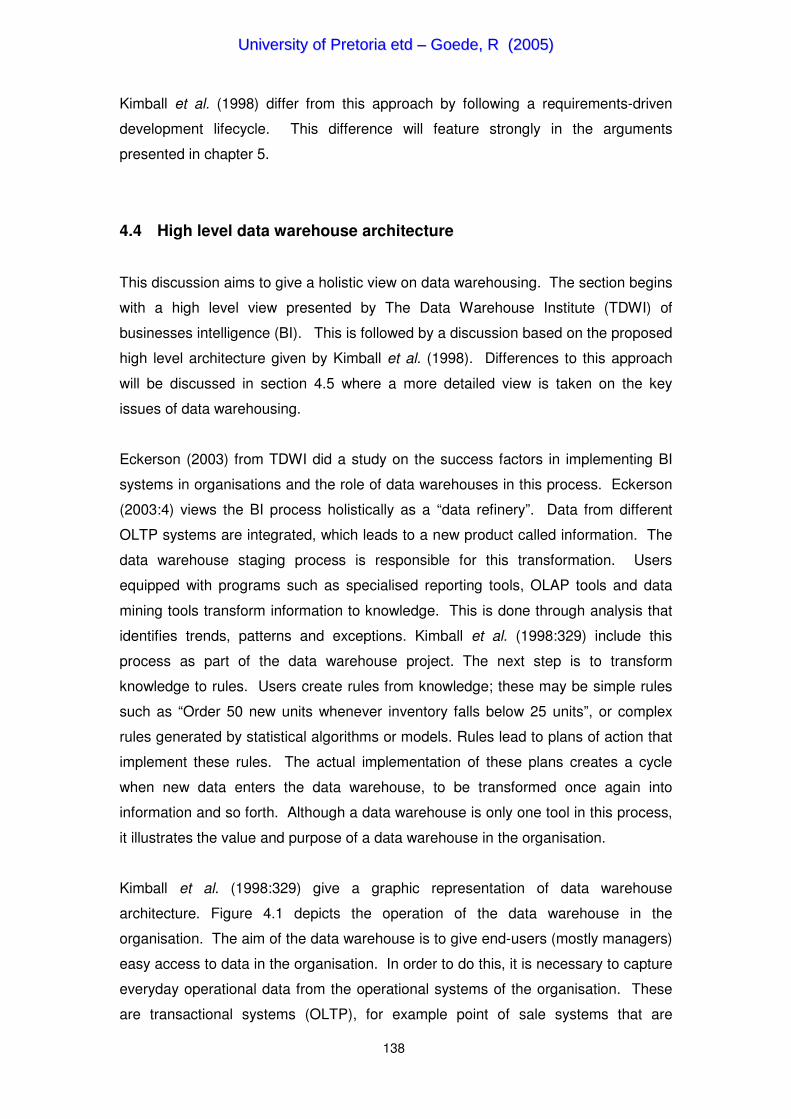
Kimball et al. (1998:329) give a graphic representation of data warehouse
architecture. Figure 4.1 depicts the operation of the data warehouse in the
organisation. The aim of the data warehouse is to give end-users (mostly managers)
easy access to data in the organisation. In order to do this, it is necessary to capture
everyday operational data from the operational systems of the organisation. These
are transactional systems (OLTP), for example point of sale systems that are
UUnniivveerrssiittyy ooff PPrreettoorriiaa eettdd –– GGooeeddee,, RR ((22000055))

139
designed around relational databases. Such systems become the source systems of
the data warehouse.
The data from the source systems go through a process called data staging to the
presentation servers (Kimball et al., 1998:345). Data staging involves four very
important actions. Firstly, the data is extracted from the source systems. The data
required for the data warehouse is usually distributed in various different source
systems with different file formats running on different hardware and operating
system platforms. Secondly, the data is transformed to the data warehouse format.
Errors and inconsistencies are removed during this phase. Thirdly, the data is
loaded into data marts in the presentation server. The final task of data staging is to
schedule this process.
Data stagingarea
Metadatacatalog
High level warehouse technical architecture
The back room The front room
Datastagingservices
Queryservices
- Extract- Transformation- Load- Job control
- Warehouse browsing- Access and security- Query management- Standard reporting- Activity monitor
Dimensional data martsincluding atomic data
Application models(e.g. data mining)
Key
Dataelement
Service
element
Source
systems
Presentation servers
Downstream /operationalsystems
Desktop dataaccess tools
Standardreporting tools
Dimensional data marts withonly aggregated data
The datawarehouse
bus
Conformeddimensions &conformedfacts
Figure 4.1 High level data warehouse architecture (Kimball et al., 1998:329)
The extraction of data from the operational source system influences the availability
of these systems, therefore these processes should be done during off-peak times
and as quickly as possible. High quality data warehouse output is dependent on high
quality data in the data warehouse (Redman, 1996:32). Therefore, the staging
process is most important from a data quality perspective.
UUnniivveerrssiittyy ooff PPrreettoorriiaa eettdd –– GGooeeddee,, RR ((22000055))

140
The presentation server is the heart of the data warehouse. Data marts are stored
here. Data marts are representations of business areas in the organisation. Data is
stored as star schemas consisting of fact and dimension tables. This is radically
different from the entity relational diagrams (ERD) used in traditional systems. Some
of the data marts contain atomic data, which is data of the highest level of detail in
the organisation, and which is normally transactional data. Other data marts contain
aggregate data, which are summaries, or totals representing longer periods of time.
The aggregate star schema is stored together with the atomic star schema in a data
mart that models a specific business process (Kimball et al., 1998:211). A detailed
discussion of data modelling and the differences between the authors are given in
section 4.5.3.
When the data is organised in data marts in the presentation server, it can be
accessed with end-user tools. Access methods differ greatly between operational
systems and data warehouses. In operational systems, fixed access methods are
pre-built as standardised reports. The users use the data in a predetermined way.
In data warehouses, very few standardised reports are written. The end-users use
browsers and ad hoc queries to access the data. Activity monitoring of the data
access helps the development team to streamline the warehouse by building
appropriate aggregate tables to speed up queries (Kimball et al., 1998:381). Data in
the data warehouse cannot be altered by the end-users, because of the historical
nature of the data. However, it is possible to add some of the report outputs to data
marts, thus enhancing the data warehouse’s functionality. These are usually results
from data mining that are stored in analytical data marts.
Metadata is data about all the data stored in the data warehouse. The metadata
repository contains all the data definitions, as well as information about the data
staging area. The metadata repository is very important for the maintenance and
change of the data warehouse and should contain technical data, as well as business
rules and contacts.
The functions of the data warehouse development team can be classified as front
room architecture or back room architecture. The back room is responsible for data
services including data staging and data modelling (Kimball et al., 1998:350). The
front room architecture comprises all the functions that deal with end-users. These
are mainly concerned with application development of data access tools (Kimball et
al., 1998:373).
UUnniivveerrssiittyy ooff PPrreettoorriiaa eettdd –– GGooeeddee,, RR ((22000055))

141
A data warehouse is a read-only data source, which means that end-users may not
change the value of data elements in the data warehouse. However, figure 4.1 does
contain a feedback arrow from the end-user systems towards the data staging area.
Specialised users may add data to the warehouse. A typical example is clustering
information that may be associated with customers, as a result of data mining
procedures that were carried out on the data in the data warehouse. For example,
risk factors might be assigned to customers in a financial institute’s data warehouse.
Inmon’s (1996) approach to data warehouse architecture differs from that of Kimball
et al. (1998). Kimball et al. (1998) describe a data mart as a subset of the data
warehouse. The data warehouse is the sum of all the data marts, each representing
a business process in the organisation. Inmon (1996) views a data mart as an
interface between the data warehouse and the end-user.
Figure 4.2 Data marts: Inmon vs. Kimball (adapted from Mailvaganam, 2003:2)
Data mart Data warehouse
OLTP User
Inmon’s model of a data mart
OLTP User
Kimball’s model of a data mart
Data mart
Data warehouse
UUnniivveerrssiittyy ooff PPrreettoorriiaa eettdd –– GGooeeddee,, RR ((22000055))

142
A data mart is a separate copy of a subset of the data in the data warehouse,
organised in a star schema to be accessed by end-users. This difference is
illustrated graphically in figure 4.2.
4.5 Aspects of data warehousing
This section contains different views of different authors on data warehousing
aspects. It will be shown in chapter 5 that these different views can be traced back to
different systems thinking methodologies1&2. The aim of this section is to give a
practice level description of different views on various data warehousing aspects.
4.5.1 The data warehouse development lifecycle
A data warehouse development lifecycle is a sequence of high-level tasks required
for effective data warehouse design, development, and deployment (Kimball et al.,
1998:33). Different authors have radically different views on the order of these tasks
in the development lifecycle for data warehouses. These differences are presented
in the following paragraphs.
Inmon (1996:290) advocates the use of a data-driven method. This means that DSS
processing begins with data and ends with requirements. Inmon calls this method
the CLDS (the reverse of SDLC) as depicted in table 4.2. According to Inmon
(1996:44), a data warehouse starts with building a central data store for one subject-
area, which is populated from operational systems. As the analytical ability of the
new data warehouse is discovered, demand for an integrated data store for another
subject area will grow and this process will repeat itself until a complete data
warehouse has been developed. Although Inmon (1996) presents the lifecycle of a
data warehouse to be opposite to the requirements-driven lifecycle of OLTP systems,
it is interesting to note that in his data warehouse review checklist (Inmon, 1996:297),
the second question (of a 54 question - checklist) is whether the end-user
requirements have been anticipated, or not.
In contrast to Inmon’s approach, Kimball et al. (1998:33) advocate the use of a
requirements-driven method. The process is depicted in figure 4.3. The data
warehouse starts with project planning to determine the readiness of the organisation
UUnniivveerrssiittyy ooff PPrreettoorriiaa eettdd –– GGooeeddee,, RR ((22000055))

143
for a data warehouse and to set the staff requirements for the data warehousing
team. A clear understanding of business requirements is the most important success
factor, and Kimball et al. (1998) state that this process of requirements collection
differs substantially from data-driven requirements analysis. The business
requirements establish the foundation for the three parallel tracks focussed on
technology, data and end-user applications.
Figure 4.3 The business dimensional lifecycle diagram (Kimball et al., 1998:33)
Bischoff and Alexander (1997:66) argue that the data warehouse development
lifecycle differs from the development lifecycle of on-line transaction processing
systems (OLTP). The stages they propose are:
Stage 1: Investigation
Stage 2: Analysis of the current environment
Stage 3: Identify requirements
Stage 4: Identify architecture
Stage 5: Data warehouse design
Stage 6: Implementation
Stage 7: Ongoing data administration
Project Management
Project plan- ning
Business require-ment definition
Maintenance & growth
Deploy- ment
Dimensional modelling
Physical design
Data staging design & development
Technical architecture design
Product selection & installation
End-user application specification
End-user application development
UUnniivveerrssiittyy ooff PPrreettoorriiaa eettdd –– GGooeeddee,, RR ((22000055))

144
It is clear that the requirements-driven method differs from an OLTP system’s design
method in the amount of time and effort spent on feasibility studies. Kimball et al.
(1998:43) argue that a certain degree of readiness of the organisation for a data
warehouse is essential for the development effort to succeed. This would include the
presence of a strong business management sponsor, a compelling business
motivation, a well functioning business and IS department partnership, the current
analytic decision making culture in the organisation, and technical feasibility based
on the current infrastructure of the organisation.
4.5.2 Collecting requirements
Collecting requirements is the foundation for all subsequent stages according to
Kimball et al. (1998:96). Kimball et al. (1998:97) state, “You can’t just ask users what
data they would like to see in the data warehouse. Instead, you need to talk to them
about their jobs, their objectives, and their challenges and try to figure out how they
make decisions, both today and in the future”.
Bischoff and Alexander (1997:67) advise that only requirements that support the
initial business area and nothing more should be investigated. This statement will be
used in the mapping of systems thinking methodologies1&2 in chapter 5, because
Kimball et al. (1998:266) accentuate the advantages of an investigation into the
entire organisation’s data usage, before deciding which business area and therefore
which data mart to develop initially. It is clear that this difference of opinion is rooted
in different systems views. Bischoff and Alexander’s opinion is motivated by hard
systems thinking and Kimball’s by soft systems thinking.
Inmon (1996:144) states, “Requirements for the data warehouse cannot be known a
priori.” The main idea of the data-driven method is to create a data warehouse from
existing data and to supply the decision makers with data to satisfy their needs,
without having to specify those needs upfront.
Kimball et al. (1998:97) give a detailed description on requirements collection for data
warehouse projects. The data warehousing team should begin by talking to the
business users, rather than talking to source systems experts. Business users are
not technically skilled and the data warehousing team should talk to them about their
jobs, rather than the data warehouse. The team may use facilitated sessions and/or
UUnniivveerrssiittyy ooff PPrreettoorriiaa eettdd –– GGooeeddee,, RR ((22000055))
145
personal interviews for this process. Both these techniques require the interview
team to gain prior knowledge on the operations of the organisation. Kimball et al.
(1998:101) advise the interviewing team to do research into prior data warehouse
development attempts, since business users might feel that the current team is
duplicating previous work. Business users as well as IS personnel should be
interviewed.
Interviews with business users should involve users on different levels in the
organisation. When business executives are interviewed, the first question should be
to establish the objectives of the organisation. Success measures for measuring the
current status should be discussed. Business opportunities and causes for concern
should be identified. A very important part of the interview is to discover future
developments in the organisation, as well as the information needs thereof (Kimball
et al., 1998:116). Heads of departments should be interviewed with a strong focus
on identifying routine decisions and current reports used for analysis. They should
also be questioned on their need for analysis in addition to the current available
information.
Interviews with IS personnel are conducted to determine the availability of data in
support of the business users’ requirements. These interviews serve as a reality
check, since the requirements of the business users are tested against the available
data. During the data staging phase, IS interviews will be followed up by detailed
sessions to work out all the technical problems embedded in the data. During this
first round of IS interviews, the team aims to understand the source systems in the
organisation, as well as to investigate current analysis methods. Questions are
asked to determine what type of analysis is done routinely. The current procedures
for handling ad hoc queries are investigated. It is very important to establish and
manage the expectations of IS personnel about the intended data warehouse
(Kimball et al., 1998:121).
During the closure of the interviews, users should be asked about the success
criteria for the project. One needs to determine measurable criteria for the success
of the data warehouse, which can be used as success metrics for the completed
project. These success criteria should specify availability of the data warehouse,
ease of use, data availability and business impact metrics. Interview information
should be written down as quickly as possible following the interview. The individual
interview write-up documentation is followed by a requirements finding document.
UUnniivveerrssiittyy ooff PPrreettoorriiaa eettdd –– GGooeeddee,, RR ((22000055))

146
Kimball et al. (1998:136) suggest the following headings for the requirements finding
documentation:
• Executive overview
• Project overview (including requirements definition approach and participants)
• Business requirements
o High level review of business objectives
o Analytic and information requirements (typically organised by business
process)
• Preliminary source system analysis (tied as often as possible to a business
requirement)
• Preliminary success criteria
Before data modelling can begin, the users need to confirm that the requirements
documentation accurately describes their requirements. The business users need to
aid the data warehousing team in prioritising and scoping the project.
4.5.3 Data modelling
After the requirements definition is agreed upon, the next task is the data modelling.
The soft requirements must now be modelled into hard diagrams. The success of
the data warehouse depends on whether these models represent the agreed upon
problem situation. Traditional models were set up using ERDs, which are very
technical. Kimball et al. (1998:141) advocate the use of star schemas, also known as
dimensional modelling, to model data marts.
There are many technical advantages for using star schemas, which are mostly
concerned with the performance of the data warehouse. Two of these advantages
are of special importance. Firstly, designs that consist of star schemas are easily
changeable. Kimball et al. (1998:149) describe how to make various changes to star
schemas effortlessly. This is not the case with ERDs. Changes to relationships
between entities normally involve major changes to the system. This means that
evolution as development method, and therefore the use of prototyping, is more
feasible when star schemas are used. The second advantage of star schemas is
that it is easy to understand. The non-technical business users are able to
understand the detail of the star schemas with very little technical guidance.
UUnniivveerrssiittyy ooff PPrreettoorriiaa eettdd –– GGooeeddee,, RR ((22000055))
147
The above can be illustrated by setting up an ERD and a star schema for the same
organisation. The organisation manufactures products and sells them to chain
retailers. The chain retailer’s sales are also measured. Comparing the ERD in figure
4.4 to the star schema in figure 4.5, the first problem with the ERD is that the entire
enterprise entity structure is represented on one diagram. Although this is
acceptable from a soft systems approach, it makes it very difficult to understand.
The star schema represents only one business process, i.e. the retail sales process.
Another major advantage of the star schema is that it includes the attributes of each
dimension. These, for example, may refer to the detailed information about the
products or the stores. There is simply no space to put this information on the ERD.
By looking at the star schema, the user will easily spot missing data fields.
The centre table in the star schema contains the numerical data, such as dollar
amounts of the event represented by the star schema, while the other fields in the
centre table are links to all other aspects of interest. The table in the centre is called
a fact table and the other descriptive tables dimension tables. This brief explanation
suffices for a non-technical business user to fully understand the star schema. It
would be extremely challenging to come up with a two-, or three-sentence
explanation of an ERD, especially since the cardinality of the relations is always
important.
It should be noted that there are various technical differences between ERDs and
star schemas that make star schemas very effective to use in data warehouses, but
also very ineffective to use in production systems. ERDs are much more effective in
production systems, mainly because of the limited redundancy of data compared to
the star schema.
Inmon (1996:85) proposes the use of an ERD data model for a data warehouse. The
corporate ERD of the data warehouse is a composite of many individual ERDs that
reflect the different views of people across the organisation. Inmon (1996:143) also
describes star schemas (which he refers to as star joins). A brief discussion on star
joins follows a detailed discussion on ERDs. Inmon concludes that a combination of
star joins and ERDs will lead to an optimal warehouse design. He offers little
explanation on how exactly this is achieved.
UUnniivveerrssiittyy ooff PPrreettoorriiaa eettdd –– GGooeeddee,, RR ((22000055))

148
Figure 4.5 A star schema isolating the retail sales process from figure 4.4 (Kimball et al., 1998:145)
Figure 4.4 An entity-relationship model of an enterprise that manufactures goods (Kimball et al., 1998:143)
UUnniivveerrssiittyy ooff PPrreettoorriiaa eettdd –– GGooeeddee,, RR ((22000055))

149
Most prominent data warehousing authors follow the approach of Kimball et al.
(1998) to modelling (Corey et al., 2001; Adamson & Venerable, 1998). The data
warehouse is seen as a collection of data marts. Each data mart represents a
business process in the organisation by means of a star schema, or a family of star
schemas of different granularity. Granularity is the level of data stored in the fact
table. Anatomic fact tables store data on transaction level and aggregate fact tables
store summarised totals in the fact table.
An area of discussion in data warehousing is whether it is feasible to only have data
marts without a separate data warehouse. The model proposed by Kimball et al.
(1998) can be viewed as such a data warehouse, whereas the model of Inmon
(1996) distinguishes between a data warehouse and separate data marts. Corey et
al. (2001:171) argue that the different data marts share information and if these need
to be loaded separately, errors are likely to occur because of the duplication of data.
A central data warehouse also allows for easier enforcement of data standards and
changes to data.
The model proposed by Kimball et al. (1998) does not sacrifice the advantages of a
central entity-relationship data warehouse. Instead of having central normalised
tables, the model of Kimball et al. (1998) has central denormalised dimension tables,
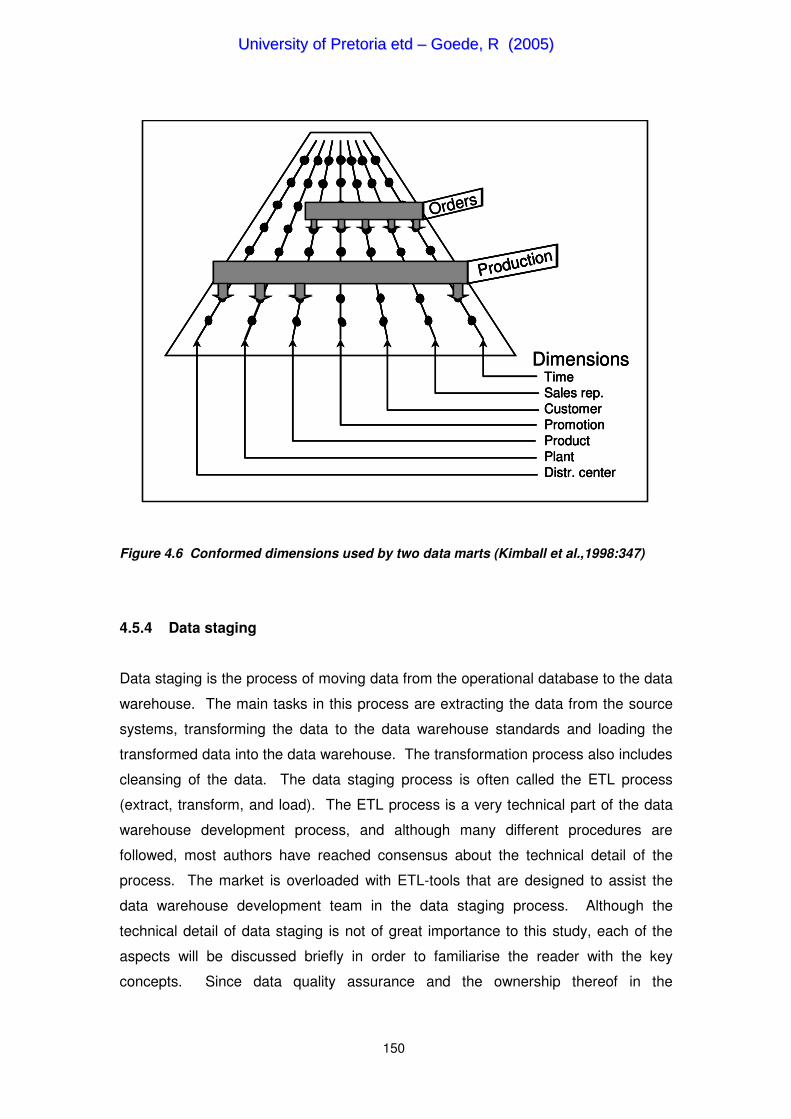
which he calls conformed dimensions. Figure 4.6 indicates how different data marts
share dimension tables.
The main difference between the approach of Kimball et al. (1998) approach and that
of Inmon (1996), is that Kimball’s conformed dimensions are denormalised, whereas
Inmon uses a highly normalised central data base model. Inmon’s data marts store a
second copy of the data from the centralised data warehouse tables, whereas the
dimensions of Kimball used in the data marts, are not copies of the conformed
dimensions, but the dimension tables themselves. Kimball et al. (1998:153) refers to
the set of conformed dimensions as the data warehouse bus.
Any organisation planning to develop a data warehouse needs to make a decision on
the design model they will use. Both models proved to be successful in industry.
From a systems thinking perspective, the model proposed by Kimball et al. (1998)
represents a softer approach because of increased user participation. While users
are able to verify the design comfortably when star schemas are used, they find it
extremely difficult to verify entity relational diagrams.
UUnniivveerrssiittyy ooff PPrreettoorriiaa eettdd –– GGooeeddee,, RR ((22000055))
150
Orders
Production
DimensionsTimeSales rep.CustomerPromotionProductPlantDistr. center
Orders
Production
DimensionsTimeSales rep.CustomerPromotionProductPlantDistr. center
Orders
ProductionProduction
DimensionsTimeSales rep.CustomerPromotionProductPlantDistr. center
Figure 4.6 Conformed dimensions used by two data marts (Kimball et al.,1998:347)
4.5.4 Data staging
Data staging is the process of moving data from the operational database to the data
warehouse. The main tasks in this process are extracting the data from the source
systems, transforming the data to the data warehouse standards and loading the
transformed data into the data warehouse. The transformation process also includes
cleansing of the data. The data staging process is often called the ETL process
(extract, transform, and load). The ETL process is a very technical part of the data
warehouse development process, and although many different procedures are
followed, most authors have reached consensus about the technical detail of the
process. The market is overloaded with ETL-tools that are designed to assist the
data warehouse development team in the data staging process. Although the
technical detail of data staging is not of great importance to this study, each of the
aspects will be discussed briefly in order to familiarise the reader with the key
concepts. Since data quality assurance and the ownership thereof in the
UUnniivveerrssiittyy ooff PPrreettoorriiaa eettdd –– GGooeeddee,, RR ((22000055))
151
organisation is of greater importance to the study, this section will be concluded with
a description of quality issues of data warehousing.
Extraction is the process of copying relevant data from the source systems. It is
essential to perform this process with as little disruption as possible to the source
system. This process soon becomes very technical when changes to data loaded
earlier in the data warehouse, needs to be managed. Technology of the source
systems may differ substantially from the data warehouse technology. The causes of
the problems include operating system platforms supporting only specific
programming languages and different data formats. Since the availability of the
source systems is of major importance to the organisations, the transformation of
data is done as a separate stage. The data is copied from the source systems
without any transformation to an intermediary storage system.
Since most data warehouses receive data from more than one source system, the
data needs to be transformed before it is loaded into the data warehouse. Data
attribute formats must be consolidated, for example date formats of source systems
may be different. Measurements, such as currency, need to be consolidated. Data
fields might have to be separated or joined, for example name fields. Most data
warehouse text books contain detailed descriptions on data transformation.
Data quality is addressed during the transformation process. Good quality data is
essential to the success of the data warehouse. Mallach (2000:121) discusses
eleven information quality factors:
• Relevance: The degree to which the information applies to the task being
performed.
• Correctness: The degree to which the information matches the reality.
• Accuracy: A measure of the difference, if any, between an information item
and the reality it represents. Inaccuracies may arise from computational
processes.
• Precision: The potential accuracy conveyed by internal or external data
representation.
• Completeness: The inclusion of all relevant data in arriving at information.
• Timeliness: The availability of information in time for its intended use, as well
as the currency of the information at the time of that use.
• Usability: The ease of using the information for its intended purpose.
UUnniivveerrssiittyy ooff PPrreettoorriiaa eettdd –– GGooeeddee,, RR ((22000055))

152
• Accessibility: The degree to which information is available to users when and
where needed.
• Conformity to expectations: Measures how closely the creation of an
information item matches the expectations of the people using it.
• Consistency: An information item based on data elements that refer to the
same time frame, organisational entity, and assumptions.
• Cost of information: This refers to both the costs of the computers, networks,
and more, that are used to obtain that information, and the cost of the time
users spend working with that information.
Cost can usually be traded off against other information quality factors (Mallach,
2000:122). Although these factors are aimed at information rather than data quality,
they should be applied to the data in the transformation phase to ensure that high
quality information is accessed by the end-users. English (1999) highlights the
importance of data quality standards and data ownership in achieving a high quality
data warehouse.
After the data is transformed into the correct format, it needs to be loaded into the
data warehouse. Loading refers to the initial loading of the data warehouse data, as
well as the incremental updates done on a daily basis after the data warehouse is in
operation. The loading operation is simplified by the thoroughness of the
transformation phase. Data transformation should solve all the problems that may
arise during loading. Tools for bulk-loading of data into a data warehouse are used
commonly and are very effective.
Metadata plays a vital role in the data staging process. This metadata includes
source to target mappings, detailed descriptions of all transformations, as well as
loading information. The final task in the data staging process is scheduling and
automation of the process. Logs are kept to handle exceptional cases during the
ETL-process.
It is vital for the quality of the data warehouse data to monitor the changes in the
source data systems. Changes to the source system data format will have a
considerable influence on the data warehouse staging functions. To ensure ongoing
quality of the data warehouse data, responsibility for the data quality from the source
systems should be explicitly assigned to an IS professional.
UUnniivveerrssiittyy ooff PPrreettoorriiaa eettdd –– GGooeeddee,, RR ((22000055))
153
4.5.5 Data access and deployment
Data access involves the creation of access applications for the business users to
access the information in the data warehouse. Users access information in a data
warehouse for analytical purposes. OLAP (online analytical processing) was
discussed in section 4.3. Tools for end-user access focus on trend analysis and ad
hoc queries.
Data access tools for standard capability are available from reputable vendors.
Organisations have to make a decision as to whether off-the-shelf products will be
able to satisfy their information access needs, or not. Training of business users on
these applications can also be outsourced. The type of access tool used (off-the-
shelf or custom made) and the training of the users (in-house or outsourced), is
indicative of the underlying systems thinking orientation of the data warehouse
development team. These factors will be explored in the mapping between systems
thinking methodologies1 and data warehousing practices presented in chapter 5.
The deployment of a data warehouse is another critical success factor. If the users’
perceptions are negative towards the data warehouse, they are unlikely to ever use
the warehouse. Such negativity normally results from a low quality system released
to the entire user population. It is therefore beneficial to make use of a small group
of users, mainly those who have been part of the development process, to test the
data warehouse. Having been involved from the start, these users adopted
ownership and are therefore highly motivated to ensure a successful implementation
of the data warehouse.
Once the data warehouse is implemented successfully, it is interesting to study the
use of the warehouse by the users. This can be done electronically, without the
knowledge of the users (Kimball et al., 1998:381). Questions that may be answered
include who is the lowest level employee using the data warehouse? How often
does top management use the warehouse to back decisions? Does the data
warehouse change the way people do their work? How many users upgrade their
skills to be able to access data from the data warehouse more effectively? These
questions, and many more, are influenced by the manner in which end-users access
the data in a data warehouse. As stated previously, there are very few standardised
reports readymade in the data warehouse. Users use templates to build their own
reports, which they are able to store and re-use. Users also access the data by
UUnniivveerrssiittyy ooff PPrreettoorriiaa eettdd –– GGooeeddee,, RR ((22000055))

154
using query tools that generate database query language. As users grow in
confidence, they normally request more training to enable them to use the data
warehouse optimally.
The above aspect of data warehouse applications has two effects on the
development team. Firstly, the development team never finishes the project; there
are always requests for more data marts and more functionality. This coincides with
the soft systems methodology2 of continuous learning. The second effect is that
management takes an even deeper interest in the data warehouse. This is beneficial
to the development team in that it normally helps them to get high level support for
their problems. The responsibility for the quality of the source data gets moved
around until management assigns it to a specific department.
4.6 Critical success factors in data warehousing
This section aims to report on current research related to success factors in data
warehousing. The first part focuses on peer reviewed academic research in the field
of data warehousing, and the second part reports on formal industry-driven research.
The section concludes with perceptions found in Internet publications.
4.6.1 Peer reviewed research: Critical success factors in data warehousing
This section reports on two recent publications on success factors in data
warehousing by Shin (2003), and Wixom and Watson (2001). Since these papers
only focus on the practice level of the philosophy, methodology1 and practice
schema, they are complementary but fundamentally different to the study reported in
this thesis.
Shin (2003) conducted a study on system success factors in data warehousing. He
collected data from three data sources in a large Fortune 500 enterprise with 65 000
employees in the United States of America (Shin, 2003:142). Firstly, a survey was
designed to collect relevant information from data warehouse users, which was
analysed through descriptive statistics. Secondly, unstructured group interviews with
end-users were performed to supplement the survey. Finally, frequent informal
interviews were held over a two month period with the information technology
manager responsible for the data warehouse. Shin (2003:146) studied system
UUnniivveerrssiittyy ooff PPrreettoorriiaa eettdd –– GGooeeddee,, RR ((22000055))
155
quality with regard to system throughput, ease of use, ability to locate data, access
authorisation and data quality. He also included information quality, service quality
(including user training) and user satisfaction in his study.
Shin (2003:153) found that user satisfaction is strongly influenced by data quality,
ability to locate data and system throughput (the time to get a result after launching a
query). Data consistency proved to be the most important aspect of data quality from
the end-user perspective. A lack of data consistency influenced the confidence in the
data warehouse results dramatically. The main problem with data location
experienced by the users, was a lack of knowledge regarding the structure of the
data warehouse. This problem was aggravated by a lack of metadata descriptions
about the tables in the data warehouse. The users preferred access tools above
writing their own SQL code, and they accentuated the importance of a single point of
query where a designated staff member could assist them with data location
problems. Slow response time proved to be a negative factor in user satisfaction.
Shin (2003:156) gives a summary of all difficulties encountered with the systems
design, as disclosed through informal interviews. These include: slow response time,
too many steps to get information, poor data modelling, lack of audit trails such as
the time of last update, and a general lack of metadata. The users complained about
limited access to the data warehouse, as well as the following data quality problems:
lack of recency, low data accuracy and missing data, data format anomalies,
duplicate records, inconsistent field names, and low data reliability and consistency.
Shin (2003:154) found that the average daily access frequency was 15 times, which
proved that information recovered from the data warehouse was vital for the
increased work productivity of many knowledge workers. More users used the data
warehouse for advanced data analysis than for routine daily tasks. Although specific
problems were identified in the data warehouse, the high usage frequency indicated
that the data warehouse project was successful.
Wixom and Watson (2001:21) argue that a data warehouse project is designed to lay
down the architecture for all management decision support systems in the
organisation. Therefore, the nature of a data warehouse is different to other
information systems, which leads to different success factors in data warehousing as
opposed to other types of information systems.
UUnniivveerrssiittyy ooff PPrreettoorriiaa eettdd –– GGooeeddee,, RR ((22000055))

156
Wixom and Watson (2001) conducted a survey among 111 organisations on
implementation factors in data warehousing success. The survey contained two
open ended questions where respondents were asked for a list of critical success
factors and obstacles to data warehouse success. These findings were used,
together with a literature review, to create an initial research model and to structure
interviews with ten data warehouse experts. The interviews confirmed the accuracy
of the research model, which is presented in figure 4.7.
The model indicates that perceived net benefit of the system is influenced by both
systems quality and data quality. They found that management support (including a
strong business sponsor) and resources address organisational issues that arise
during data warehouse implementation.
Figure 4.7 Research model for data warehousing success (Wixom & Watson, 2001:20)
Wixom and Watson (2001:20) found that sufficient resources, a high level of user
participation and highly skilled team members increased the likelihood that data
warehousing projects will finish on time, within budget, and with the correct
Implementation factors Implementation success System success
Management support
Champion
Resources
User participation
Source systems
Team skills
Data quality
Organisational implementation success
Development technology
Perceived net benefits
System quality
Technical implementation success
Project implementation success
UUnniivveerrssiittyy ooff PPrreettoorriiaa eettdd –– GGooeeddee,, RR ((22000055))

157
functionality. The model also indicates that diverse non-standardised source
systems and poor development technology will increase the technical problems that
project teams must overcome.
Another study by Little and Gibson (2003) identified the following eight factors
important to implementing a data warehouse:
“1. Top level management commitment and support
2. Complete organisational representation in the data warehouse
3. Prototyping the data warehouse use
4. External support for implementing data warehousing
5. Disciplined preparation for and completion of the data warehouse
implementation
6. Integrated enterprise-wide data model
7. Complete reusable metadata
8. Recognising potential inhibitors to data warehousing implementation”
4.6.2 Industry released research: Critical success factors in data
warehousing
The data warehouse institute (TDWI) is a major provider of in-depth, high quality
education and training in the business intelligence and data warehousing industry.
Their services include among others, educational conferences and onsite training.
Their reports are vendor-neutral and they aim to benefit the entire data warehouse
industry. They recently (2003) published a report on the research of Wayne
Eckerson (the director of TWDI research) on successful business intelligence
solutions. This report includes a description of the research methods that was used
to conduct a survey involving 540 business intelligence professionals. The report
contains the demographics of the respondents in terms of position, organisation
revenues, country, years of experience and industry. It is however not clear how the
data was analysed.
The report features six guidelines for success when developing business intelligence
(BI) solutions. Firstly, one needs to establish a vision. This means that a business
sponsor in the organisation, who is influential in motivating top management, should
be identified. Kimball et al. (1998) identify this as a readiness factor. Secondly, one
should “evangelise” the vision. The business sponsor should advocate the need for
change in the analytical culture of the organisation without creating unrealistic
UUnniivveerrssiittyy ooff PPrreettoorriiaa eettdd –– GGooeeddee,, RR ((22000055))
158
expectations. Thirdly, one should prioritise the “BI portfolio”. The BI portfolio is the
set of BI applications that fulfils the sponsor’s vision. The important aspect is to
manage the scope of the initial project. The report reiterates the importance of top
management’s motivational role in the project. One needs to develop a BI marketing
plan. Fourthly, enough resources should be allocated to launch the project and
funding must be available throughout the development of the BI portfolio.
Continuous funding for maintenance and growth has been identified as a negative
influence on BI application success. Fifthly, Eckerson (2003:33) states that one
should “align business and IT for the long haul”. He argues that extremely successful
BI applications take years to implement on enterprise-wide level. Such applications
integrate data from dozens of systems across geographic, organisational and political
boundaries. Their aim is to create a single version of the truth from a range of
incompatible systems and processes. This integration is not achieved overnight, and
it is therefore important not to underestimate the time and commitment involved in
creating successful BI applications. Finally, one needs to build trust in the system.
The business sponsor should facilitate the marketing of the new system. It is
important not to undermine its credibility by allowing entry of poor quality data.
Inaccurate data proved to be one of the main excuses for users not using the BI
application.
Other factors users identified for not using the BI application include (Eckerson,
2003:33):
“1. The data looks different even though it is accurate.
2. There is no way to discover the origins of metrics or data in the solution.
3. The user interface is confusing and the analytical tool is hard to use.
4. Users find it difficult to locate the reports they want.
5. Users are not shown how to use analytical tools in context of their own data.
6. Users can’t leverage the BI data in other applications they use.
7. There is no easy way to get assistance when using the BI solution.
8. User feedback doesn’t get implemented.
9. The BI system is slow and not always available.”
Eckerson (2003:34) concludes with a task list for the BI team to ensure that the BI
solution is used optimally by the business users:
“1. Implement a rigorous plan to ensure data quality.
2. Create a dictionary of data elements and metrics for business users.
3. Iteratively prototype the user interface and incorporate feedback.
UUnniivveerrssiittyy ooff PPrreettoorriiaa eettdd –– GGooeeddee,, RR ((22000055))
159
4. Make the BI solution or relevant reports available via the organisation’s
intranet.
5. Tune the performance of the BI solution to meet response time requirements.
6. Architect the system to scale seamlessly and inexpensively as usage grows.
7. Develop a training program that provides customisable instruction via multiple
modes of using real-life business scenarios and data.
8. Train and support power users in every department to create custom reports
for their colleagues and answer questions about the data.
9. Establish a help desk to answer technical questions.
10. Architect the BI solution so it can be easily updated and changed in response
to user requests.
11. Implement backup procedures and disaster recovery plans to maintain
availability.
12. Provide a scalable, reliable, and high performance solution.”
The survey results given by Eckerson (2003), as well as the model given by Wixom
and Watson (2001) confirm information given by Kimball et al. (1998). It proves the
acceptance and the importance of the work by Kimball et al. (1998). The section on
data warehousing success factors is concluded with a summary of informal Internet
publications on this topic.
4.6.3 Non-peer reviewed research: Critical success factors in data
warehousing
There are a large number of web sites that list data warehouse success factors, as
well as reasons for failure of data warehousing projects. Some focus success or
failure on technical issues, such as inappropriate architecture, and others on
business sponsorships and user participation. From a systems thinking perspective,
these indicate either a hard systems thinking approach, or a soft systems thinking
approach.
It is important not to always equate communications with users supporting a soft
systems approach. Adelman (2001:1) states that the number one critical success
factor in a data warehousing project is to manage user expectations with regard to
performance, availability, functionality in terms of level of detail, historical data, data
quality, timeliness and final date of completion. The same author states that it is
UUnniivveerrssiittyy ooff PPrreettoorriiaa eettdd –– GGooeeddee,, RR ((22000055))
160
most successful to involve users all the way through the project. It is impossible to
tell without further investigation whether the type of user participation is a sign of a
soft, or a hard systems thinking approach. The complete list of success factors given
by Adelman (2001:2) is:
“1. Expectations are communicated to the users.
2. User involvement is ensured.
3. The project has a good sponsor.
4. The team has the right skill set.
5. The schedule is realistic.
6. The right tools have been chosen.
7. Users are properly trained.”
One website (Anonymous, 2001) gives the following reasons for failure:
“1. Underestimating the complexity of the project.
2. Failure to understand the key element – the data.
3. Viewing it from a systems development lifecycle (SDLC) approach.
4. Organisations try to go from nothing to a complex system in a single project.”
It is clear that these reasons for failure focus on the technology used and not on the
participation of the business users.
Mimno (2001:1) state that the key factor in data warehousing success is to ensure
that the data warehousing application is business-driven and not technically driven.
He stresses that the data warehousing application must solve a strategically
important business problem, which coincide with a critical systems thinking approach
as indicated in chapter 5.
4.7 Literature investigation: Systems thinking and data warehousing
practices
The link between systems thinking methodologies1&2 and data warehousing practices
is the central theme of this study. It is therefore important to investigate the
existence of literature combining these fields.
Mallach (2000:84) defines a system as a “group of interacting components with a
purpose” in his monograph on decision support and data warehouse systems. He
UUnniivveerrssiittyy ooff PPrreettoorriiaa eettdd –– GGooeeddee,, RR ((22000055))

161
explains that a decision support system is a system according to this definition. He
uses systems, for example the human body and a transportation system, to relate the
systems idea to decision support systems. Mallach (2000) does not refer to systems
thinking, or systems thinking methodologies1&2, and therefore cannot be viewed as
relevant to the theme of this study.
Chapter 3 refers to literature on systems thinking and information systems. None of
the sources refer to data warehousing or decision support systems explicitly. A
comprehensive academic data base search, combined with an Internet search, did
not yield any useful results.
4.8 Summary
There are many differences between a data warehouse and an operational
information system. Operational systems should be able to access and update the
data in real time, and it is very important to minimise the duplication of data in the
system to ensure integrity of the data. Users access the data by using fixed pre-
designed methods. In contrast, data warehouses contain duplicate data to speed up
the query process. The integrity of the data is preserved, because users do not
update the data in the warehouse. A data warehouse contains historical, quality
controlled data, and many of the design principles are designed to optimise the
accessibility of the data. Users may access the data through ad hoc queries to
satisfy the decision support needs. These queries are not pre-designed, and the
warehouse team should monitor the use of the data warehouse in order to update the
design for optimal efficiency.
A review of peer reviewed and non-peer reviewed literature identified success factors
in data warehousing. It is clear that while some follow a business-driven approach to
data warehousing, others follow a technology-driven approach. Inmon (2000:1)
states that alternative storage to cope with more and more data is the future of
successful data warehousing projects.
None of the literature reviewed, gave philosophical or methodological1&2 motivation
for data warehousing practices. It is the aim of this study to investigate the links
between philosophy, methodology1 and data warehouse practice for the purpose of
furthering data warehousing practices.
UUnniivveerrssiittyy ooff PPrreettoorriiaa eettdd –– GGooeeddee,, RR ((22000055))