Chapter 12: Statistics and Probability - Menifee County Schools
66
736 Chapter 12 Statistics and Probability Why? RESTAURANTS A restaurant may ask their customers to complete a survey about their visit. The survey data can be analyzed using statistical methods. The restaurant staff can learn more about their customers and how to improve their experiences in the restaurant. Then Then In chapter 0, you calculated simple probability. Now Now In Chapter 12, you will: Design surveys and evaluate results. Use permutations and combinations. Find probabilities of compound events. Design and use simulations. KY Program of Studies HS-DAP-S-ES2 Students will know the characteristics of well-designed studies, including the role of randomization in surveys and experiments. HS-DAP-S-P15 Students will represent probabilities in multiple ways. Animation glencoe.com Statistics and Probability
-
Upload
khangminh22 -
Category
Documents
-
view
2 -
download
0
Transcript of Chapter 12: Statistics and Probability - Menifee County Schools

736 Chapter 12 Statistics and Probability
Why? RESTAURANTS A restaurant may ask their customers to complete a
survey about their visit. The survey data can be analyzed using statistical methods. The restaurant staff can learn more about their customers and how to improve their experiences in the restaurant.
ThenThenIn chapter 0, you calculated simple probability.
NowNowIn Chapter 12, you will:
Design surveys and evaluate results.
Use permutations and combinations.
Find probabilities of compound events.
Design and use simulations.
KY Programof Studies
HS-DAP-S-ES2 Students will know the characteristics of well-designed studies, including the role of randomization in surveys and experiments.HS-DAP-S-P15 Students will represent probabilities in multiple ways.
Animation glencoe.com
Statistics and Probability
Online Option
Text Option
QuickReviewQuickCheck
Chapter 12 Statistics and Probability 737
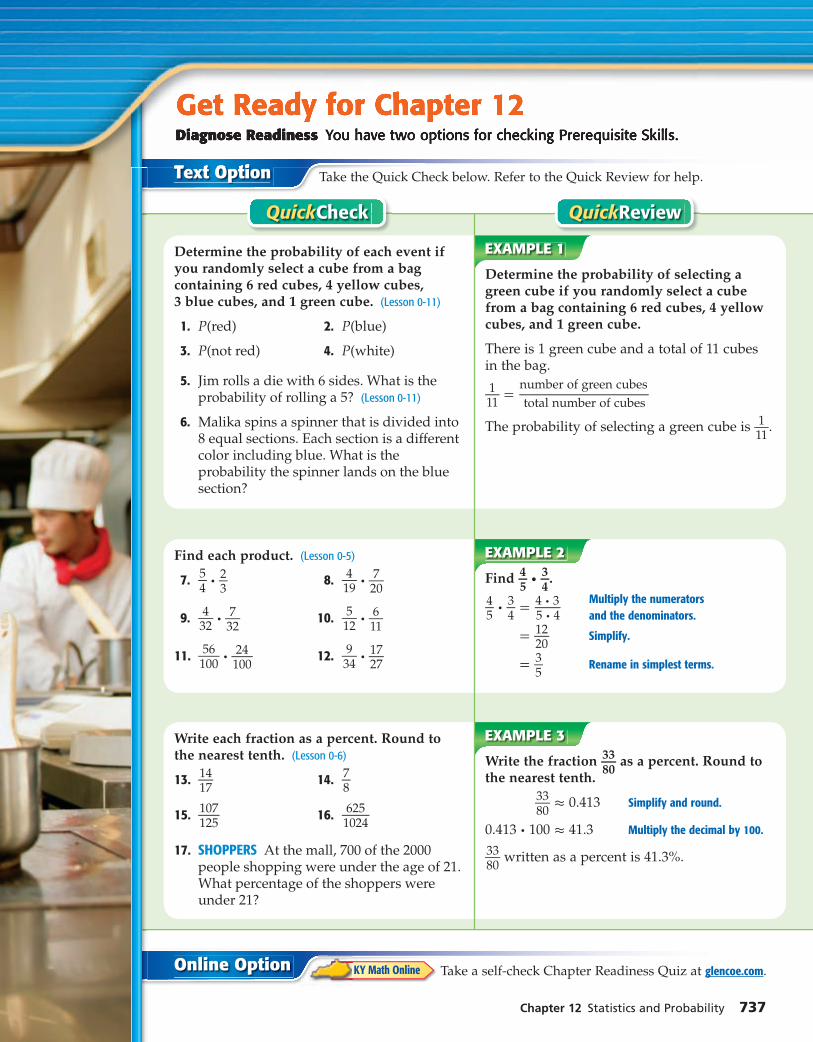
Take the Quick Check below. Refer to the Quick Review for help.
Write the fraction 33
_ 80
as a percent. Round to the nearest tenth.
33 _
80 ≈ 0.413 Simplify and round.
0.413 · 100 ≈ 41.3 Multiply the decimal by 100.
33 _
80 written as a percent is 41.3%.
Write each fraction as a percent. Round to the nearest tenth. (Lesson 0-6)
13. 14 _
17 14. 7
_ 8
15. 107 _
125 16. 625
_ 1024
17. SHOPPERS At the mall, 700 of the 2000 people shopping were under the age of 21. What percentage of the shoppers were under 21?
EXAMPLE 3
Determine the probability of selecting a green cube if you randomly select a cube from a bag containing 6 red cubes, 4 yellow cubes, and 1 green cube.
There is 1 green cube and a total of 11 cubes in the bag.
1 _ 11
= number of green cubes
__ total number of cubes
The probability of selecting a green cube is 1 _ 11
.
Determine the probability of each event if you randomly select a cube from a bag containing 6 red cubes, 4 yellow cubes, 3 blue cubes, and 1 green cube. (Lesson 0-11)
1. P(red) 2. P(blue)
3. P(not red) 4. P(white)
5. Jim rolls a die with 6 sides. What is the probability of rolling a 5? (Lesson 0-11)
6. Malika spins a spinner that is divided into 8 equal sections. Each section is a different color including blue. What is the probability the spinner lands on the blue section?
EXAMPLE 1
Find 4 _ 5 ·
3 _
4 .
4 _ 5 · 3 _
4 = 4 · 3
_ 5 · 4
Multiply the numerators and the denominators.
= 12 _
20 Simplify.
= 3 _ 5 Rename in simplest terms.
Find each product. (Lesson 0-5)
7. 5 _
4 · 2 _
3 8. 4
_ 19
· 7 _ 20
9. 4 _
32 · 7 _
32 10.
5 _
12 · 6 _
11
11. 56
_ 100
· 24 _
100 12.
9 _
34 · 17
_ 27
EXAMPLE 2
KY Math Online Take a self-check Chapter Readiness Quiz at glencoe.com.
Get Ready for Chapter 12Diagnose Readiness You have two options for checking Prerequisite Skills.
738 Chapter 12 Statistics and Probability
Study the chapter online Explore Math in Motion Get extra help from your own Personal Tutor Use Extra Examples for additional help Take a Self-Check Quiz Review Vocabulary in fun ways
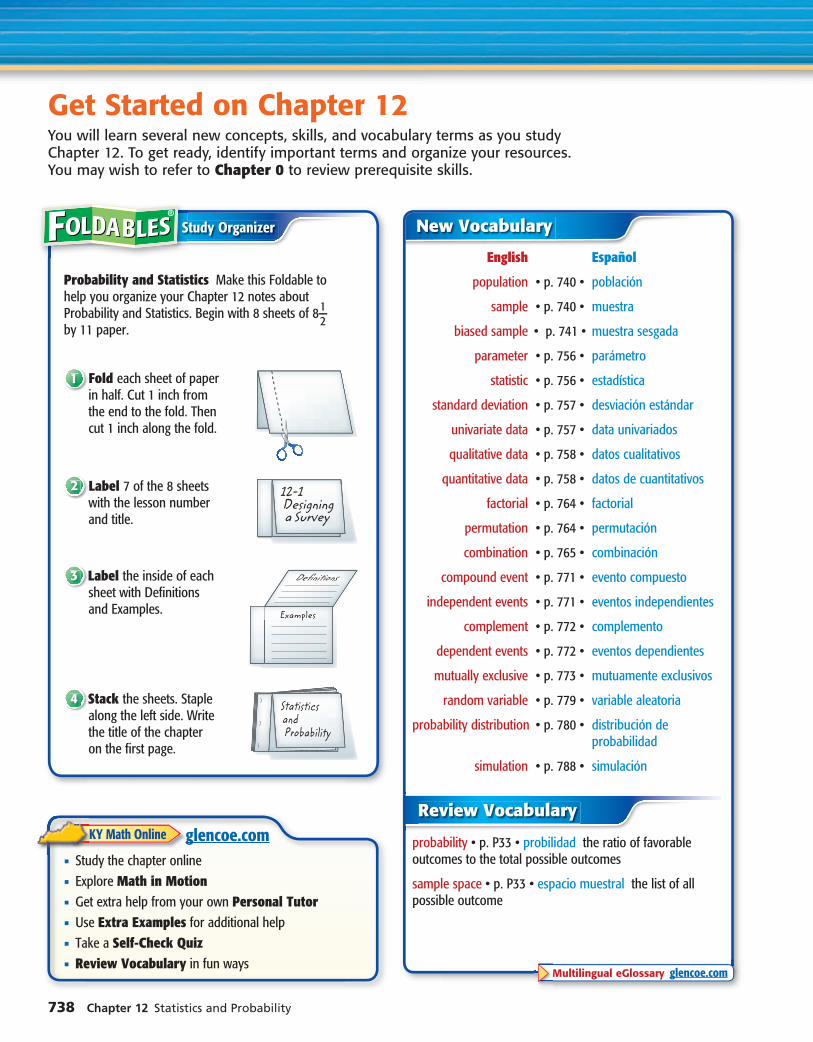
Get Started on Chapter 12You will learn several new concepts, skills, and vocabulary terms as you study Chapter 12. To get ready, identify important terms and organize your resources.You may wish to refer to Chapter 0 to review prerequisite skills.
New Vocabulary
English Español
population • p. 740 • población
sample • p. 740 • muestra
biased sample • p. 741 • muestra sesgada
parameter • p. 756 • parámetro
statistic • p. 756 • estadística
standard deviation • p. 757 • desviación estándar
univariate data • p. 757 • data univariados
qualitative data • p. 758 • datos cualitativos
quantitative data • p. 758 • datos de cuantitativos
factorial • p. 764 • factorial
permutation • p. 764 • permutación
combination • p. 765 • combinación
compound event • p. 771 • evento compuesto
independent events • p. 771 • eventos independientes
complement • p. 772 • complemento
dependent events • p. 772 • eventos dependientes
mutually exclusive • p. 773 • mutuamente exclusivos
random variable • p. 779 • variable aleatoria
probability distribution • p. 780 • distribución de probabilidad
simulation • p. 788 • simulación
Review Vocabulary
probability • p. P33 • probilidad the ratio of favorable outcomes to the total possible outcomes
sample space • p. P33 • espacio muestral the list of all possible outcome
Multilingual eGlossary glencoe.com
Study Organizer
12-1 Designinga Survey
Examples
Definitions
StatisticsandProbability
Probability and Statistics Make this Foldable to help you organize your Chapter 12 notes about Probability and Statistics. Begin with 8 sheets of 8 1 _ 2 by 11 paper.
1 Fold each sheet of paper in half. Cut 1 inch from the end to the fold. Then cut 1 inch along the fold.
2 Label 7 of the 8 sheets with the lesson number and title.
3 Label the inside of each sheet with Definitions and Examples.
4 Stack the sheets. Staple along the left side. Write the title of the chapter on the first page.
KY Math Online glencoe.com
Explore 12-1 Algebra Lab: Survey Questions 739
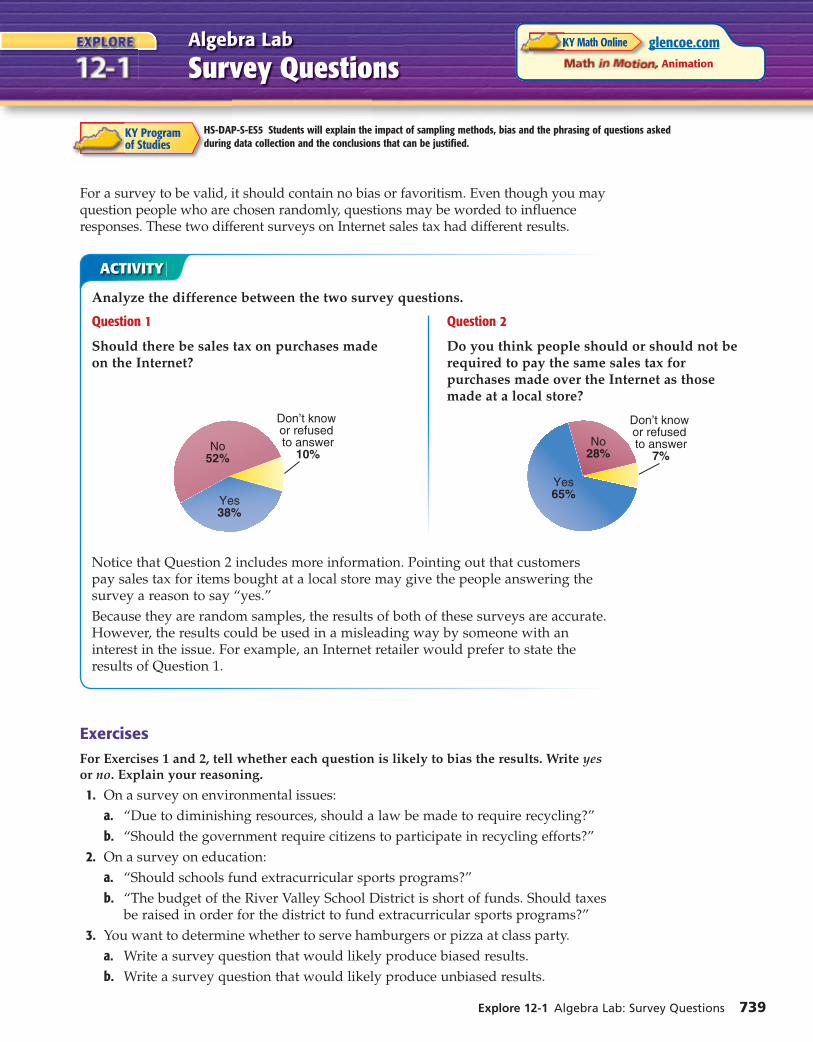
For a survey to be valid, it should contain no bias or favoritism. Even though you may question people who are chosen randomly, questions may be worded to influence responses. These two different surveys on Internet sales tax had different results.
ACTIVITY
Analyze the difference between the two survey questions.
Question 1
Should there be sales tax on purchases made on the Internet?
Question 2
Do you think people should or should not be required to pay the same sales tax for purchases made over the Internet as those made at a local store?
Notice that Question 2 includes more information. Pointing out that customers pay sales tax for items bought at a local store may give the people answering the survey a reason to say “yes.”
Because they are random samples, the results of both of these surveys are accurate. However, the results could be used in a misleading way by someone with an interest in the issue. For example, an Internet retailer would prefer to state the results of Question 1.
ExercisesExercisesFor Exercises 1 and 2, tell whether each question is likely to bias the results. Write yes or no. Explain your reasoning.
1. On a survey on environmental issues:
a. “Due to diminishing resources, should a law be made to require recycling?”
b. “Should the government require citizens to participate in recycling efforts?”
2. On a survey on education:
a. “Should schools fund extracurricular sports programs?”
b. “The budget of the River Valley School District is short of funds. Should taxes be raised in order for the district to fund extracurricular sports programs?”
3. You want to determine whether to serve hamburgers or pizza at class party.
a. Write a survey question that would likely produce biased results.
b. Write a survey question that would likely produce unbiased results.
Algebra Lab
Survey Questions
KY Programof Studies
HS-DAP-S-ES5 Students will explain the impact of sampling methods, bias and the phrasing of questions asked during data collection and the conclusions that can be justified.
glencoe.com Animation
KY Math Online

ThenThenYou organized data by using matrices. (Lesson 6-7)
NowNow Design surveys. Identify various
sampling techniques.
KY Programof Studies
HS-DAP-S-ES1 Students will understand and explain the differences among various kinds of studies and which types of inferences can be legitimately be drawn from each.HS-DAP-S-ES2 Students will know the characteristics of well-designed studies, including the role of randomization in surveys and experiments. Also addresses HS-DAP-S-DR7, HS-DAP-S-ES5, and HS-DAP-S-ES6.
New VocabularyNew Vocabularysamplepopulationsurveyobservational studyexperimentbiased samplerandom samplesi mple random samplest ratified random samplesy stematic random sample
KY Math Online
glencoe.com Extra Examples Personal Tutor Self-Check Quiz Homework Help
740 Chapter 12 Statistics and Probability
Designing a SurveyWhy?Why?
When manufacturing T-shirts, many steps and items must be checked for quality assurance. These include fabrication, care labels, hang tags, trims, print artwork, and embroidery. It would be too costly for a company to have each T-shirt inspected. Instead, they inspect a certain number of T-shirts made.
All of the T-shirts that are made are a population, and the T-shirts that are inspected are a sample of the population. The inspectors draw conclusions about the sample and apply those conclusions to the entire population.
Design a Survey A sample is some portion of a larger group, called the population. Since it is impractical to examine every item in a population, a sample is selected to represent the population. After the sample is analyzed, conclusions can be drawn about the entire population. The larger the sample size, or the more samples taken, the more closely it approximates the population.
To accurately draw a conclusion from data received from a sample, you will need to first decide on the best method of collecting the data.
Key Concept Data Collection Techniques
Type Definition/Use Example
survey • Data are from responses given by a sample of the population.
• To make a general conclusion about the population.
To determine whether the student body is happy with the spring dance theme, the dance committee asks a random sample of 50 students for their opinion.
observational study
• Data are recorded after just observing the sample.
• To compare reactions and draw a conclusion about responses of the population.
A toy company watches some children play and notes the toys they play with the most. They conclude that the population of two-year-olds prefers toys that sing to toys that do not make noise.
experiment
• Data are recorded after changing the sample.
• To make general conclusions about what will happen during an event.
A quality control manager runs the assembly machines 10 times at a certain rate. Each time the product is defective. She concludes that it would happen every time the machine runs at that pace.
For Your
Lesson 12-1 Designing a Survey 741
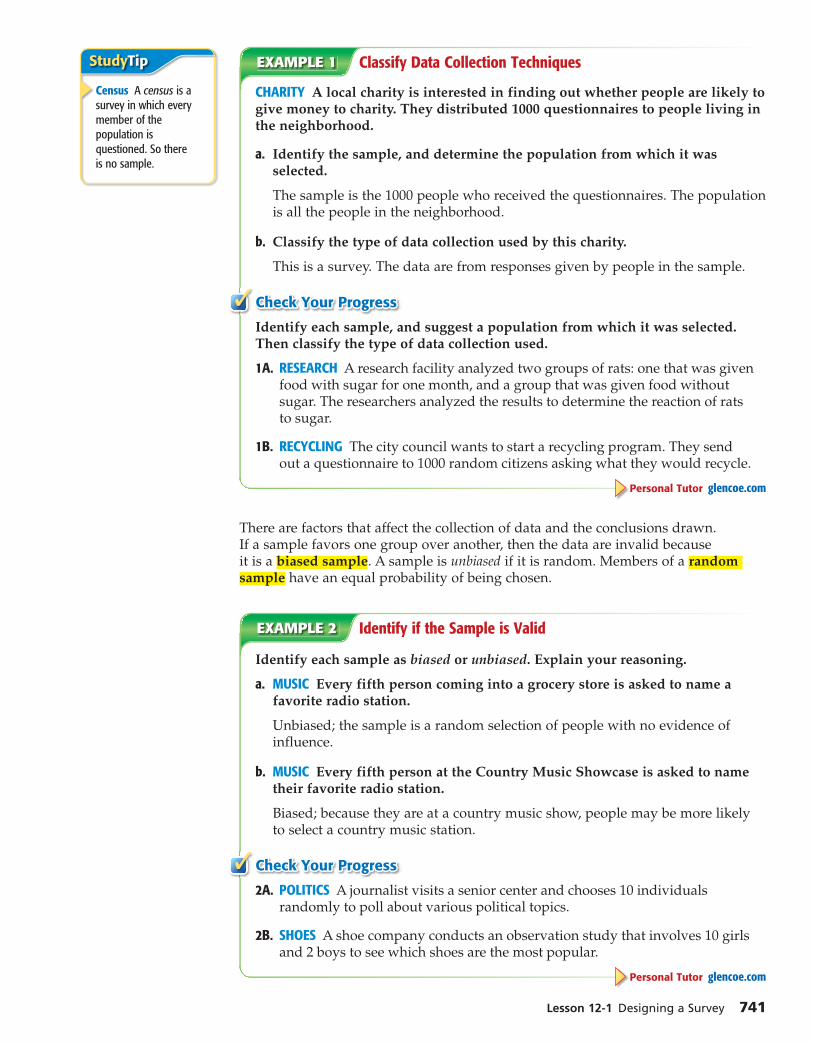
EXAMPLE 1 Classify Data Collection Techniques
CHARITY A local charity is interested in finding out whether people are likely to give money to charity. They distributed 1000 questionnaires to people living in the neighborhood.
a. Identify the sample, and determine the population from which it was selected.
The sample is the 1000 people who received the questionnaires. The population is all the people in the neighborhood.
b. Classify the type of data collection used by this charity.
This is a survey. The data are from responses given by people in the sample.
Check Your Progress✓Identify each sample, and suggest a population from which it was selected. Then classify the type of data collection used.
1A. RESEARCH A research facility analyzed two groups of rats: one that was given food with sugar for one month, and a group that was given food without sugar. The researchers analyzed the results to determine the reaction of rats to sugar.
1B. RECYCLING The city council wants to start a recycling program. They send out a questionnaire to 1000 random citizens asking what they would recycle.
Personal Tutor glencoe.com
There are factors that affect the collection of data and the conclusions drawn. If a sample favors one group over another, then the data are invalid because it is a biased sample. A sample is unbiased if it is random. Members of a random sample have an equal probability of being chosen.
EXAMPLE 2 Identify if the Sample is Valid
Identify each sample as biased or unbiased. Explain your reasoning.
a. MUSIC Every fifth person coming into a grocery store is asked to name a favorite radio station.
Unbiased; the sample is a random selection of people with no evidence of influence.
b. MUSIC Every fifth person at the Country Music Showcase is asked to name their favorite radio station.
Biased; because they are at a country music show, people may be more likely to select a country music station.
Check Your Progress✓ 2A. POLITICS A journalist visits a senior center and chooses 10 individuals
randomly to poll about various political topics.
2B. SHOES A shoe company conducts an observation study that involves 10 girls and 2 boys to see which shoes are the most popular.
Personal Tutor glencoe.com
Study Tip
Census A census is a survey in which every member of the population is questioned. So there is no sample.
742 Chapter 12 Statistics and Probability
Sampling Techniques Sample data are often used to estimate a characteristic within an entire population, such as voting preferences prior to an election. A random sample of a population is selected so that it is representative of the entire population. The sample should be chosen at random without any preference. Three common types of random samples are listed below.
Key Concept Random Samples
Type Definition Example
simple random sample
A sample that is equally likely to be chosen as any other sample from the population.
One hundred student ID numbers are randomly drawn from a hat, and those students are given a survey.
stratified random sample
The population is first divided in similar, nonoverlapping groups. A random sample is then selected from each group.
To reflect the diversity of the country, a candidate surveys citizens of various groups, based on their percent of the population.
systematic random sample
A sample in which the items in the sample are selected according to a specified time or item interval.
Every 10 minutes a toy is inspected. Or every 50th toy is inspected.
For Your
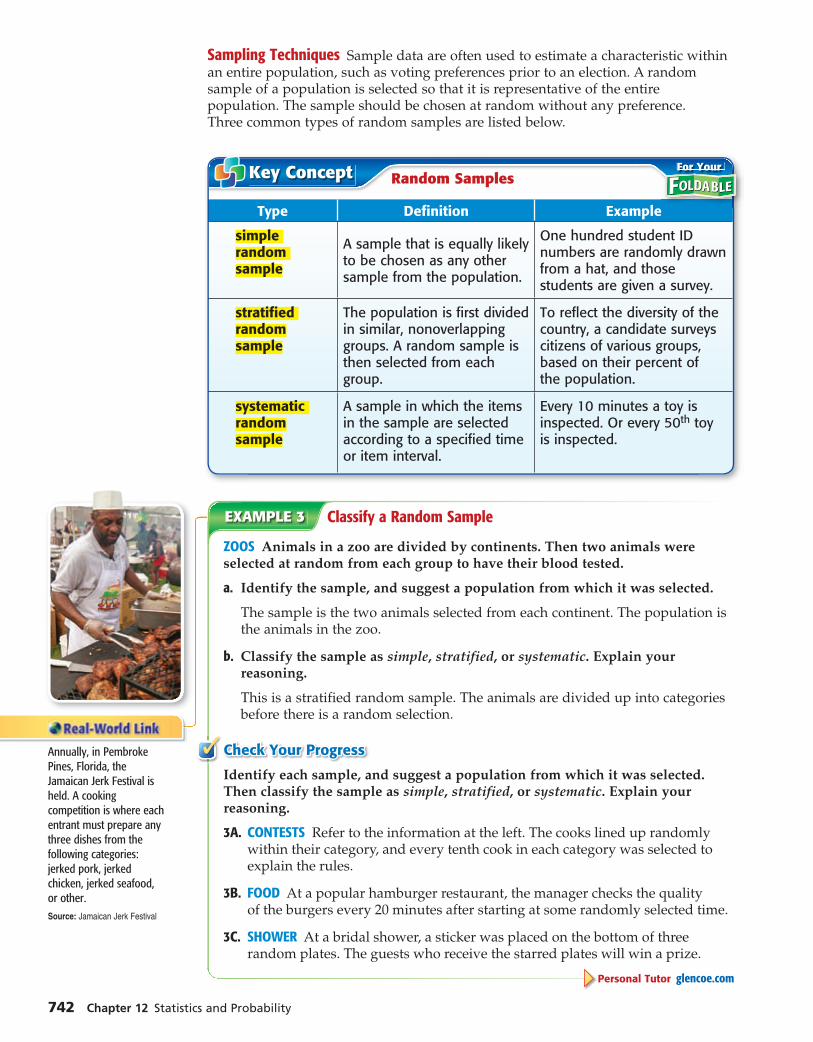
EXAMPLE 3 Classify a Random Sample
ZOOS Animals in a zoo are divided by continents. Then two animals were selected at random from each group to have their blood tested.
a. Identify the sample, and suggest a population from which it was selected.
The sample is the two animals selected from each continent. The population is the animals in the zoo.
b. Classify the sample as simple, stratified, or systematic. Explain your reasoning.
This is a stratified random sample. The animals are divided up into categories before there is a random selection.
Check Your Progress✓Identify each sample, and suggest a population from which it was selected. Then classify the sample as simple, stratified, or systematic. Explain your reasoning.
3A. CONTESTS Refer to the information at the left. The cooks lined up randomly within their category, and every tenth cook in each category was selected to explain the rules.
3B. FOOD At a popular hamburger restaurant, the manager checks the quality of the burgers every 20 minutes after starting at some randomly selected time.
3C. SHOWER At a bridal shower, a sticker was placed on the bottom of three random plates. The guests who receive the starred plates will win a prize.
Personal Tutor glencoe.com
Annually, in Pembroke Pines, Florida, the Jamaican Jerk Festival is held. A cooking competition is where each entrant must prepare any three dishes from the following categories: jerked pork, jerked chicken, jerked seafood, or other.Source: Jamaican Jerk Festival

Lesson 12-1 Designing a Survey 743
✓ Check Your Understanding
Identify each sample, and determine a population from which it was selected. Then classify the type of data collection used.
1. MUSIC A record company wants to test five designs for an album cover. They randomly invite ten teens from a local high school to view the different album covers and see which cover attracts the most attention.
2. PARTIES Federico is throwing a party for one of his friends. He is trying to decide on a theme and a color scheme. He sends a piece of paper in each invitation, asking guests questions to get their opinion.
Identify each sample as biased or unbiased. Explain your reasoning. Example 2p. 741
3. POLITICS A group of students stands at the door of the school and asks every tenth student who they would vote for in the upcoming election and why.
4. SHOPPING Every fifteenth shopper at the clothing store is asked what they would want most for their birthday.
Identify the sample, and suggest a population from which it was selected. Then classify the sample as simple, stratified, or systematic. Explain your reasoning.
5. SPORTS CARDS Greg divides his rookie baseball cards by teams. Then he randomly selects cards and records the players’ RBIs.
6. TELEVISION A nostalgia television network wants to conduct a cartoon marathon. To choose the episodes, they mail a questionnaire to people selected at random throughout the country.
Practice and Problem Solving = Step-by-Step Solutions begin on page R12.
Extra Practice begins on page 815.
Identify each sample, and determine a population from which it was selected. Then classify the type of data collection used.
77 FOOD A frozen food company is considering creating frozen meals with tofu instead of meat. At a testing, they randomly give half of a group of 100 people the meals with meat and the other half the same meals with tofu and ask the people how they like the meals.
8. PETS The owners of dog care center want to know how many of each size crates they should order. They send flyers into the neighborhood to ask what size or breed of dog each person has.
9. TRAVEL A travel agency asks each of its customers for the past two years about their favorite and least favorite destinations.
Identify each sample as biased or unbiased. Explain your reasoning.Example 2p. 741
10. MAGAZINES A magazine publisher asks every tenth person at a fitness expo what magazines they have in their household.
11. LIBRARY The local library asks everyone who checks out a book if they also used the computers at the library.
12. JEANS A clothing chain gives its customers a card they can mail back that asks them questions about the customer’s favorite brand of jeans.
13. AMUSEMENT PARKS An amusement park is deciding which rides to replace next year. As they leave the park, they ask teens what their least favorite ride is.
Example 1p. 741
Example 1p. 741
Example 3p. 742
Example 3p. 742
Example 1p. 741
Example 1p. 741
744 Chapter 12 Statistics and Probability
Identify the sample, and suggest a population from which it was selected. Then classify the sample as simple, stratified, or systematic. Explain your reasoning.
14. TANNING A tanning salon sorts its responses to a survey by the home states of the respondents. Then they are sorted to select teenagers.
1515 ART Mitsu uses her blog about art to ask readers about their favorite medium and supply center. She then tabulates and publishes the results.
16. CARS The service manger at a car dealership inspects every fifth car to make sure cars are detailed after being serviced.
17. MUSIC A music store gives every fiftieth customer a free CD by a local artist.
18. ELECTIONS To estimate who the leading candidate is, the candidate’s committee surveys a large group of people selected at random. The returns indicate that their candidate is leading by a margin of 58% to 42%.
a. Identify the sample. Suggest a population from which the sample was selected.
b. State the method of data collection.
c. Tell whether the sample is biased or unbiased. Explain.
d. If unbiased, classify the random sample as simple, stratified, or systematic.
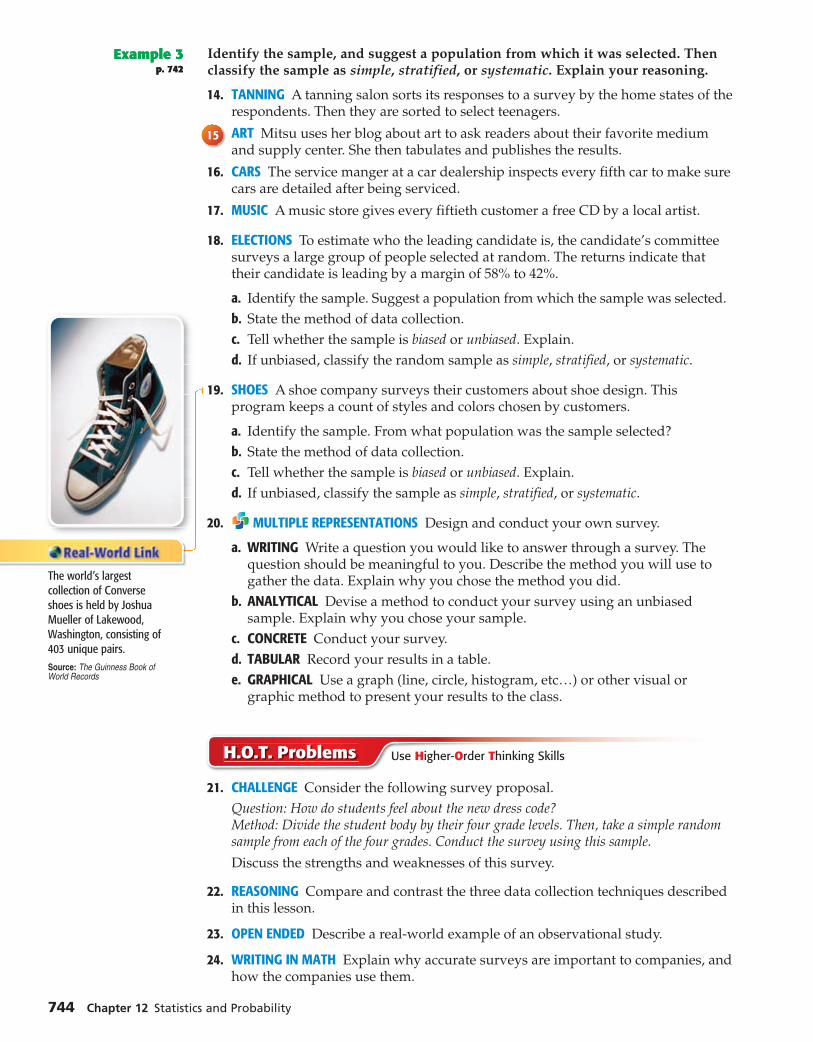
19. SHOES A shoe company surveys their customers about shoe design. This program keeps a count of styles and colors chosen by customers.
a. Identify the sample. From what population was the sample selected?
b. State the method of data collection.
c. Tell whether the sample is biased or unbiased. Explain.
d. If unbiased, classify the sample as simple, stratified, or systematic.
20. MULTIPLE REPRESENTATIONS Design and conduct your own survey.
a. WRITING Write a question you would like to answer through a survey. The question should be meaningful to you. Describe the method you will use to gather the data. Explain why you chose the method you did.
b. ANALYTICAL Devise a method to conduct your survey using an unbiased sample. Explain why you chose your sample.
c. CONCRETE Conduct your survey.
d. TABULAR Record your results in a table.
e. GRAPHICAL Use a graph (line, circle, histogram, etc…) or other visual or graphic method to present your results to the class.
H.O.T. Problems Use Higher-Order Thinking Skills
21. CHALLENGE Consider the following survey proposal.
Question: How do students feel about the new dress code?Method: Divide the student body by their four grade levels. Then, take a simple random sample from each of the four grades. Conduct the survey using this sample.
Discuss the strengths and weaknesses of this survey.
22. REASONING Compare and contrast the three data collection techniques described in this lesson.
23. OPEN ENDED Describe a real-world example of an observational study.
24. WRITING IN MATH Explain why accurate surveys are important to companies, and how the companies use them.
Example 3p. 742
Example 3p. 742
The world’s largest collection of Converse shoes is held by Joshua Mueller of Lakewood, Washington, consisting of 403 unique pairs. Source: The Guinness Book of World Records
25. GRIDDED RESPONSE The first stage of a rocket burns 28 seconds longer than the second stage. If the total burning time for both stages is 152 seconds, how many seconds does the first stage burn?
26. Ms. Brinkman invested $30,000; part at 5%, and part at 8%. The total interest on the investment was $2100 after one year. How much did she invest at 8%?
A $10,000 C $20,000
B $15,000 D $25,000
27. A pair of $25 jeans is on sale for 15% off. What is the sale price?
F $21.25 H $23.25
G $24.25 J $22.25
28. GEOMETRY A piece of wire 42 centimeters long is bent into the shape of a rectangle with a width that is twice its length. Find the dimensions of the rectangle.
A 5 cm, 12 cm C 9 cm, 16 cm
B 7 cm, 14 cm D 11 cm, 18 cm
Standardized Test Practice
Spiral Review
Solve each equation. State any extraneous solutions. (Lesson 11-8)
29. 3 _ c =
2 _
c + 2 30. 4
_ f =
2 _
f - 3 31.
j _
j + 2 =
j - 6 _
j - 2
32. h - 2 _
h =
h - 2 _
h - 5 33. 3m _
4 +
1 _
3 =
3m + 4 _
6 34. 6
_ 5 +
4p _
3 =
8p _
5
35. r - 2 _
r + 2 -
3r _ r - 2
= -2 36. t - 3 _
t + 3 - 2t _
t - 3 = -1 37.
4v _ 2v + 3
- 2v _ 2v - 3
= 1
38. SIRENS As an ambulance approaches, the siren sounds different than if it were sitting still. If an ambulance is moving toward you at v miles per hour and blowing its siren at a frequency f, then you hear the siren as if it were blowing at
a frequency h. This can be defined by the equation h = f _
1 - v _ n , where n is the
speed of sound, approximately 760 miles per hour. (Lesson 11-7)
a. Simplify the complex fraction in the formula.
b. Suppose that siren blows at a frequency of 45 cycles per minute and is moving toward you at 65 miles per hour. Find the frequency of the siren as you hear it. Round to the nearest whole number.
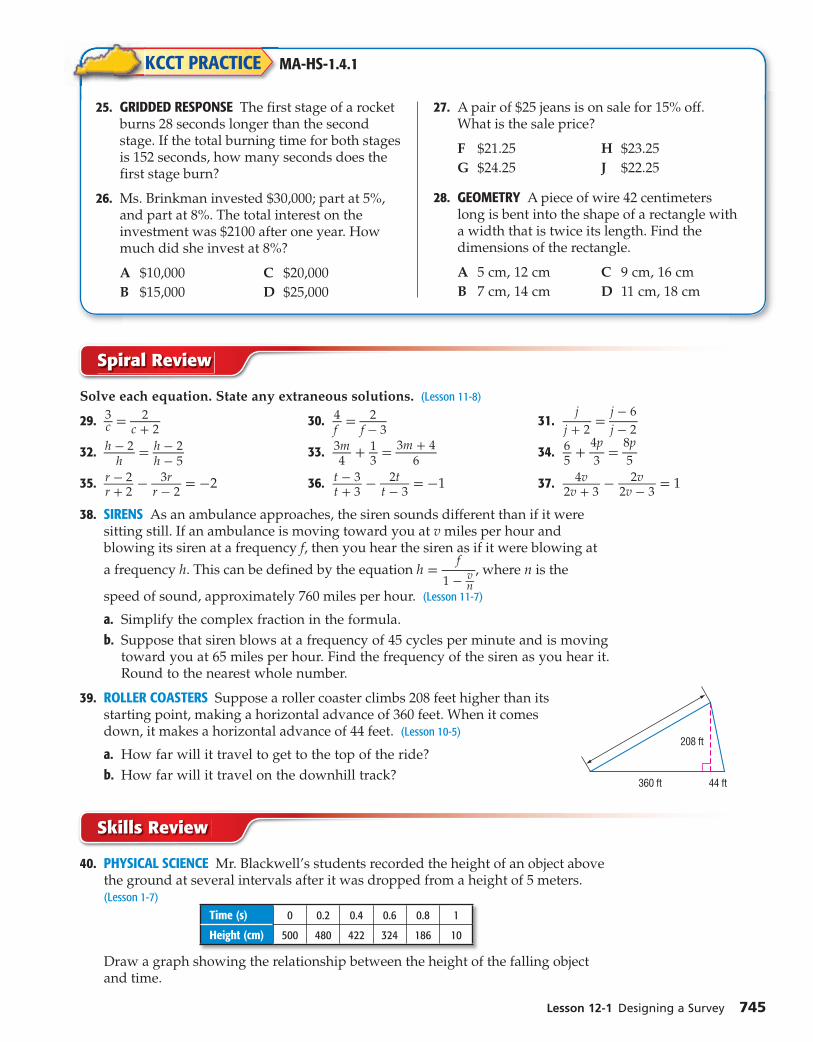
39. ROLLER COASTERS Suppose a roller coaster climbs 208 feet higher than its starting point, making a horizontal advance of 360 feet. When it comes down, it makes a horizontal advance of 44 feet. (Lesson 10-5)
a. How far will it travel to get to the top of the ride?
b. How far will it travel on the downhill track?
Skills Review
40. PHYSICAL SCIENCE Mr. Blackwell’s students recorded the height of an object above the ground at several intervals after it was dropped from a height of 5 meters. (Lesson 1-7)
Time (s) 0 0.2 0.4 0.6 0.8 1
Height (cm) 500 480 422 324 186 10
Draw a graph showing the relationship between the height of the falling object and time.
KCCT PRACTICE MA-HS-1.4.1
Lesson 12-1 Designing a Survey 745
360 ft 44 ft
208 ft

ThenThenYou designed surveys. (Lesson 12-1)
NowNow Summarize survey
results. Evaluate survey results.
KY Programof Studies
HS-DAP-S-CDS12 Students will evaluate reports based on data published in the media by considering the source of the data, the design of the study and the way the data are displayed and analyzed.HS-DAP-S-ES4 Students will evaluate published reports that are based on interpretations of data by examining the design of the study, the appropriateness of the data analysis and the validity of the conclusions.Also addresses HS-DAP-S-DR7 and HS-DAP-S-CDS13.
New VocabularyNew Vocabularyme asure of central
tendencyquantitative dataqualitative data
KY Math Online
glencoe.com Extra Examples Personal Tutor Self-Check Quiz Homework Help
746 Chapter 12 Statistics and Probability
Analyzing Survey ResultsWhy?Why?
Companies like to use surveys to get feedback on how they are doing in areas ranging from sales to how people like their Web site.
A company recently received these results from a survey about their Web site.
What do these values mean to the company? How were the data collected? Is the sample an accurate representation of their customers?
Summarize Survey Results Once data from a survey have been collected, they need to be summarized to be meaningful. We can summarize the data of a survey according to measures of central tendency.
Type Description When Best Used
mean the sum of the data divided by the number of items in the data set
The data sets have no outliers.
medianthe middle number of the ordered data, or the mean of the middle two numbers
The data set has outliers, but there are no big gaps in the middle of the data.
modethe number or numbers that occur most often
The data set has many repeated numbers.
Concept Summary Measures of Central TendencyFor Your
Some data cannot be analyzed using statistical methods. Quantitative data can be given and analyzed as numerical values. Some examples of these are test scores, hours that you have studied, or the weight of objects. Qualitative data cannot be given a numerical value. Some examples of these are gender, nationality, or television show preference.
It is also possible to have quantitative data and still not be able to find a measure of central tendency. This occurs when the data do not represent the same thing.
Lesson 12-2 Analyzing Survey Results 747
EXAMPLE 1 Select a Method to Summarize
Which measure of central tendency best represents the data, if any? Justify your answer. Then find the measure.
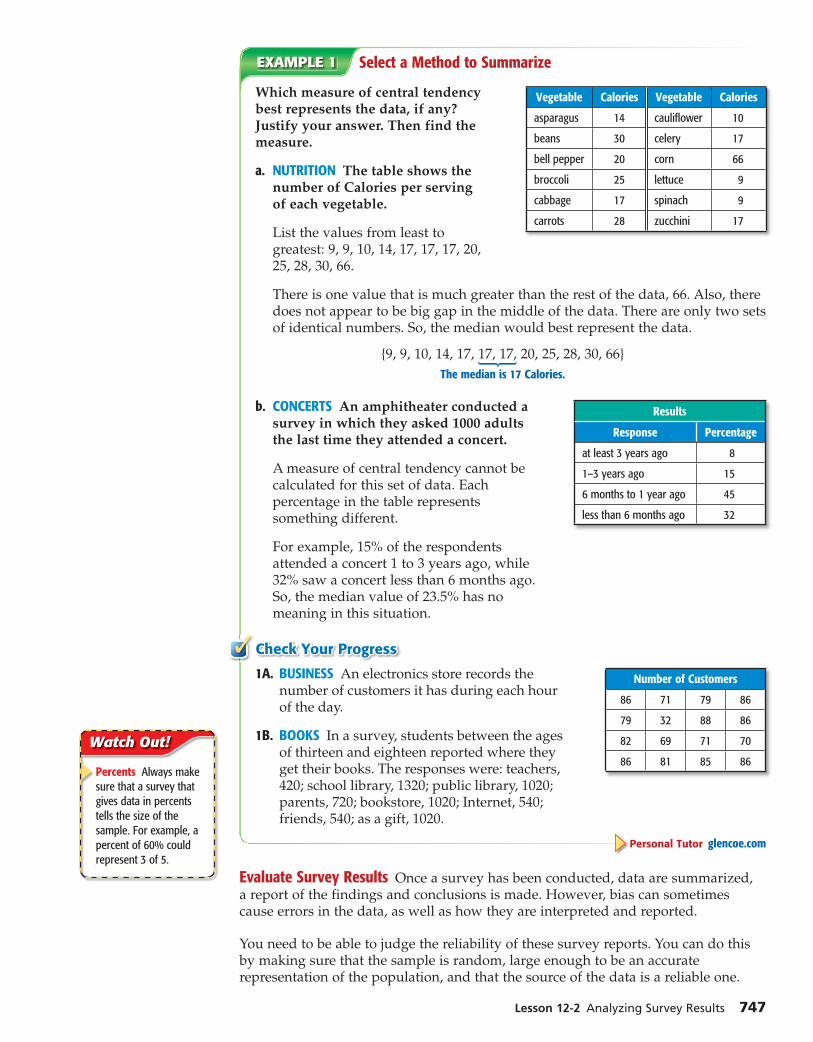
a. NUTRITION The table shows the number of Calories per serving of each vegetable.
List the values from least to greatest: 9, 9, 10, 14, 17, 17, 17, 20, 25, 28, 30, 66.
There is one value that is much greater than the rest of the data, 66. Also, there does not appear to be big gap in the middle of the data. There are only two sets of identical numbers. So, the median would best represent the data.
{9, 9, 10, 14, 17, 17, 17, 20, 25, 28, 30, 66}
The median is 17 Calories.
b. CONCERTS An amphitheater conducted a survey in which they asked 1000 adults the last time they attended a concert.
A measure of central tendency cannot be calculated for this set of data. Each percentage in the table represents something different.
For example, 15% of the respondents attended a concert 1 to 3 years ago, while 32% saw a concert less than 6 months ago. So, the median value of 23.5% has no meaning in this situation.
Check Your Progress✓ 1A. BUSINESS An electronics store records the
number of customers it has during each hour of the day.
1B. BOOKS In a survey, students between the ages of thirteen and eighteen reported where they get their books. The responses were: teachers, 420; school library, 1320; public library, 1020; parents, 720; bookstore, 1020; Internet, 540; friends, 540; as a gift, 1020.
Personal Tutor glencoe.com
Evaluate Survey Results Once a survey has been conducted, data are summarized, a report of the findings and conclusions is made. However, bias can sometimes cause errors in the data, as well as how they are interpreted and reported.
You need to be able to judge the reliability of these survey reports. You can do this by making sure that the sample is random, large enough to be an accurate representation of the population, and that the source of the data is a reliable one.
Vegetable Calories Vegetable Calories
asparagus 14 caulifl ower 10
beans 30 celery 17
bell pepper 20 corn 66
broccoli 25 lettuce 9
cabbage 17 spinach 9
carrots 28 zucchini 17
Results
Response Percentage
at least 3 years ago 8
1–3 years ago 15
6 months to 1 year ago 45
less than 6 months ago 32
Number of Customers
86 71 79 86
79 32 88 86
82 69 71 70
86 81 85 86
Watch Out!
Percents Always make sure that a survey that gives data in percents tells the size of the sample. For example, a percent of 60% could represent 3 of 5.
748 Chapter 12 Statistics and Probability
Often newspaper, magazine, and television reports include the results of a survey. These surveys need to be judged for their validity before you make a decision based on them. Some questions that you may want to ask yourself are:
• What are the population and samples? Can I identify them easily? Are they biased?
• What is the source? Is the data source a reputable group? Could they be biased?
• Do the data actually support the conclusion?
EXAMPLE 2 Evaluate a Survey
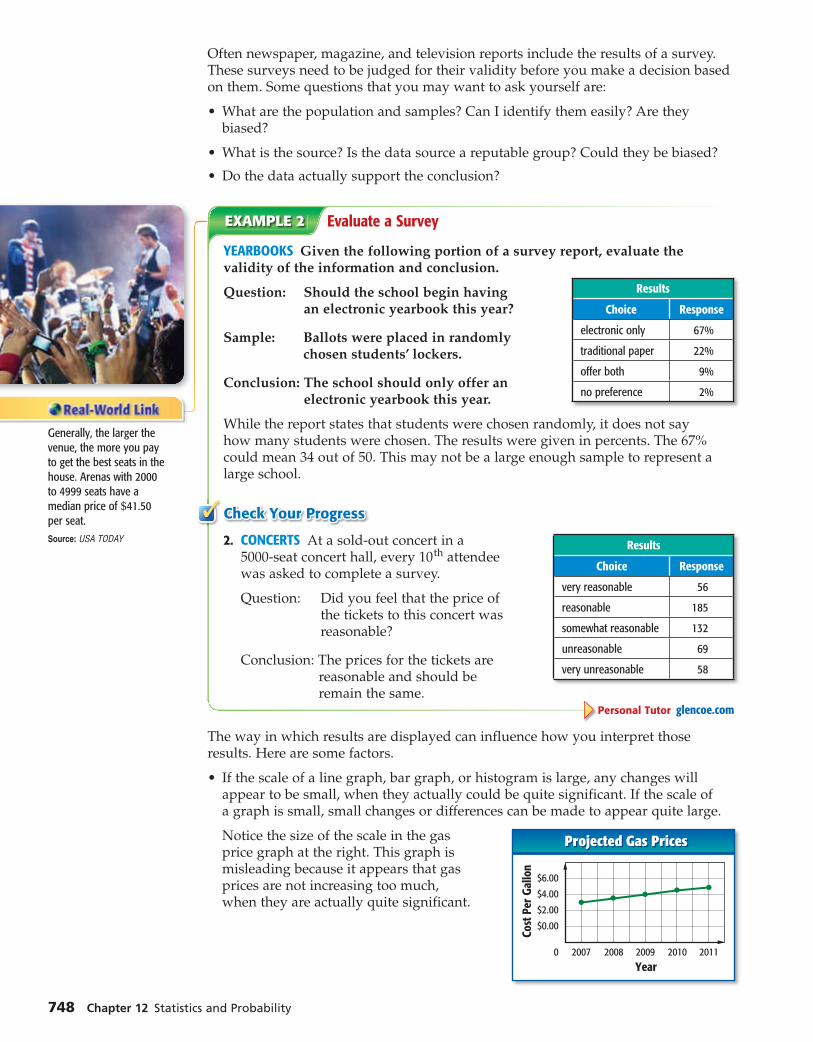
YEARBOOKS Given the following portion of a survey report, evaluate the validity of the information and conclusion.
Question: Should the school begin having Results
Choice Response
electronic only 67%
traditional paper 22%
offer both 9%
no preference 2%
an electronic yearbook this year?
Sample: Ballots were placed in randomly chosen students’ lockers.
Conclusio n: The school should only offer anelectronic yearbook this year.
While the report states that students were chosen randomly, it does not say how many students were chosen. The results were given in percents. The 67% could mean 34 out of 50. This may not be a large enough sample to represent a large school.
Check Your Progress✓ 2. CONCERTS At a sold-out concert in a Results
Choice Response
very reasonable 56
reasonable 185
somewhat reasonable 132
unreasonable 69
very unreasonable 58
5000-seat concert hall, every 10 th attendee was asked to complete a survey.
Question: Did you feel that the price of the tickets to this concert was reasonable?
Conclusio n: The prices for the tickets are reasonable and should be remain the same.
Personal Tutor glencoe.com
The way in which results are displayed can influence how you interpret those results. Here are some factors.
• If the scale of a line graph, bar graph, or histogram is large, any changes will appear to be small, when they actually could be quite significant. If the scale of a graph is small, small changes or differences can be made to appear quite large.
Notice the size of the scale in the gas price graph at the right. This graph is misleading because it appears that gas prices are not increasing too much, when they are actually quite significant.
Generally, the larger the venue, the more you pay to get the best seats in the house. Arenas with 2000 to 4999 seats have a median price of $41.50 per seat.Source: USA TODAY
Projected Gas PricesProjected Gas Prices
Cost
Per
Gal
lon
$6.00
$4.00
$2.00
$0.00
Year2007 2008 2009 2010 20110
300275250225200100
0
Year
Num
ber o
f Stu
dent
s
Opinions Regarding School Uniforms
Stron
glyAg
ree Agre
e
Don’t
Care
Disa
gree
Stron
glyDi
sagr
ee
Lesson 12-2 Analyzing Survey Results 749
The following are features of a display that can influence the conclusion.
• The scales of graphs should be constant.
• Using percents rather than the actual numbers from a set of data can give a misleading result. However, if the numbers in the sample are large, percents best represent values.
• In a bar graph or histogram, all of the bars should have the same width. The heights of the bars represent the data values. Changing the width of a bar can exaggerate differences.
• If the colors on a circle graph, bar graph, or histogram are different shades of the same color, groups may visually blend together and influence how you interpret the results.
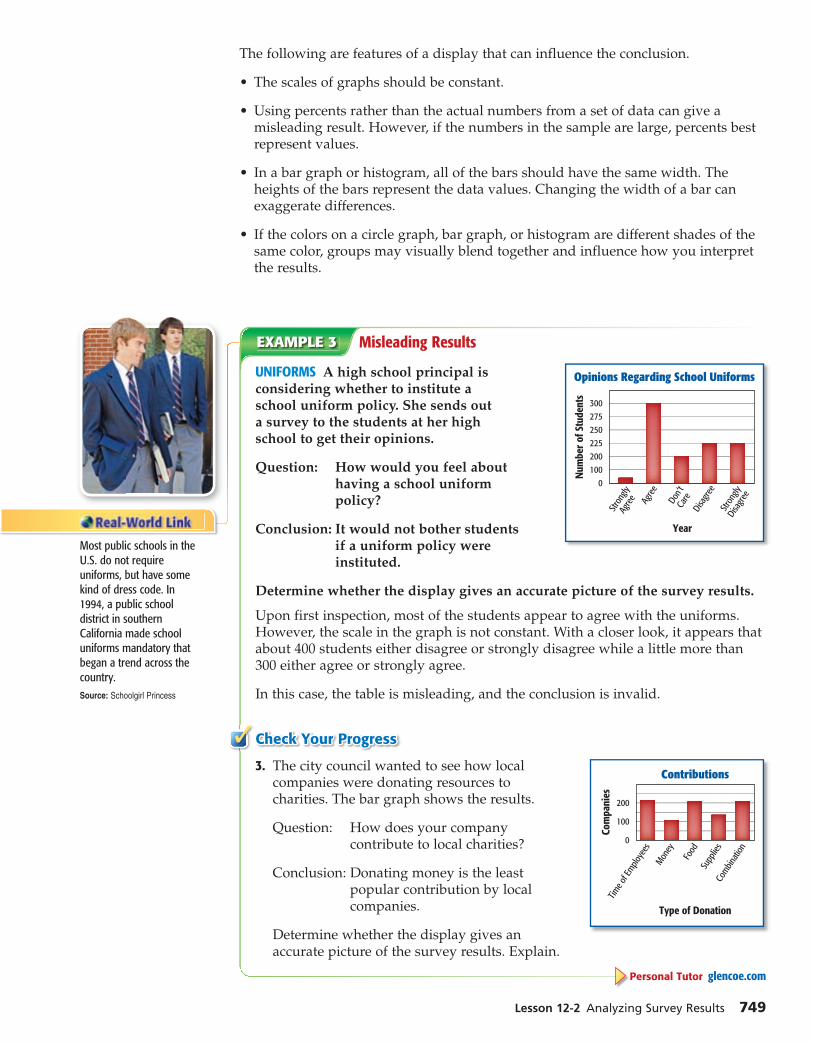
EXAMPLE 3 Misleading Results
UNIFORMS A high school principal is considering whether to institute a school uniform policy. She sends out a survey to the students at her high school to get their opinions.
Question: How would you feel about having a school uniform policy?
Conclusion: It would not bother students if a uniform policy were instituted.
Determine whether the display gives an accurate picture of the survey results.
Upon first inspection, most of the students appear to agree with the uniforms. However, the scale in the graph is not constant. With a closer look, it appears that about 400 students either disagree or strongly disagree while a little more than 300 either agree or strongly agree.
In this case, the table is misleading, and the conclusion is invalid.
Check Your Progress✓ 3. The city council wanted to see how local
200
100
0
Contributions
Time o
f Em
ploye
esM
oney
Food
Supp
lies
Com
binati
on
Com
pani
es
Type of Donation
companies were donating resources to charities. The bar graph shows the results.
Question: How does your company contribute to local charities?
Conclusion: Donating money is the least popular contribution by local companies.
Determine whether the display gives an accurate picture of the survey results. Explain.
Personal Tutor glencoe.com
Most public schools in the U.S. do not require uniforms, but have some kind of dress code. In 1994, a public school district in southern California made school uniforms mandatory that began a trend across the country.Source: Schoolgirl Princess
750 Chapter 12 Statistics and Probability
✓ Check Your Understanding
Which measure of central tendency best represents the data? Justify your answer. Then find the measure.
Example 1p. 746
1. RECYCLING Archmont High School is collecting recyclable paper as a fundraiser to buy some benches for the courtyard. The newspapers are gathered into 5-inch bundles. Ms. Sato counted the bundles received each Friday for the first quarter of the school year: {15, 12, 14, 15, 18, 15, 13, 14, 13, 12}.
2. TRAVEL An online travel agency wants to design some tours for families with teens. So, they surveyed students about their favorite vacation destinations. The top five responses were: beach, 25%; theme parks, 22%; lakes, 21%; historical sites, 17%; mountains, 15%
Given each survey report, evaluate the validity of the information and conclusion.
Example 2p. 747
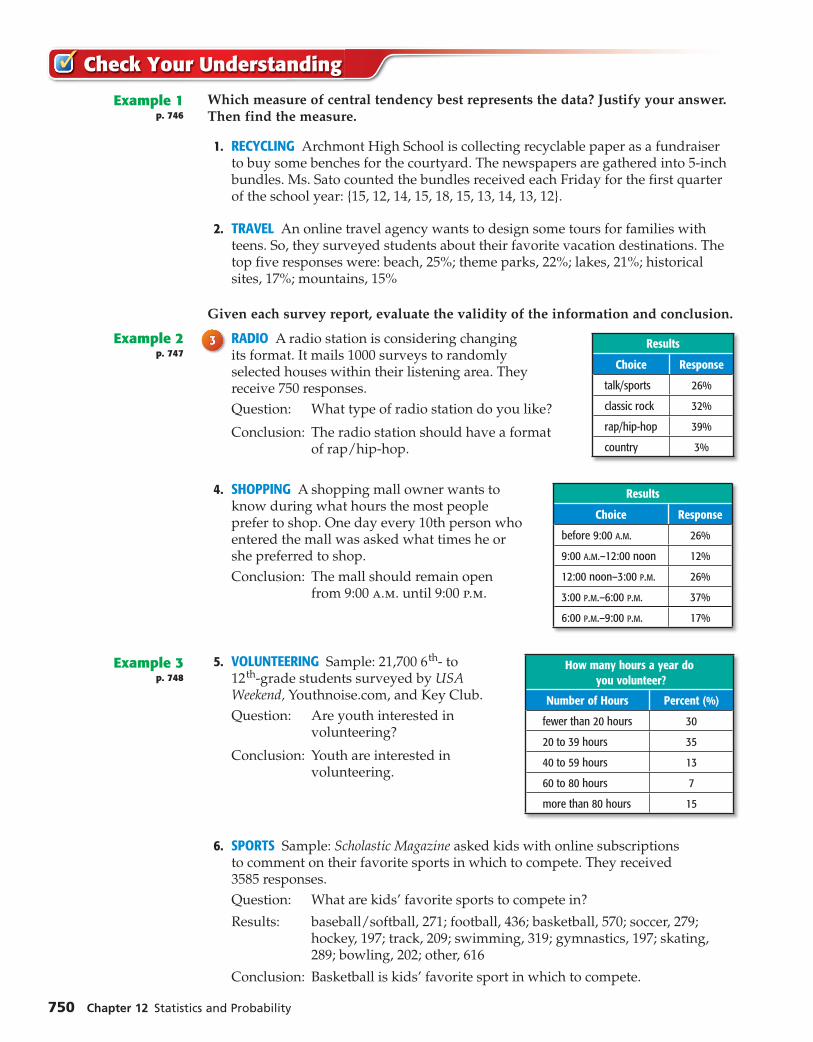
33 RADIO A radio station is considering changing Results
Choice Response
talk/sports 26%
classic rock 32%
rap/hip-hop 39%
country 3%
its format. It mails 1000 surveys to randomly selected houses within their listening area. They receive 750 responses.
Question: What type of radio station do you like?
Conclusion: The radio station should have a format of rap/hip-hop.
4. SHOPPING A shopping mall owner wants to Results
Choice Response
before 9:00 A.M. 26%
9:00 A.M.–12:00 noon 12%
12:00 noon–3:00 P.M. 26%
3:00 P.M.–6:00 P.M. 37%
6:00 P.M.–9:00 P.M. 17%
know during what hours the most people prefer to shop. One day every 10th person who entered the mall was asked what times he or she preferred to shop.
Conclusion: The mall should remain open from 9:00 a.m. until 9:00 p.m.
Example 3p. 748
5. VOLUNTEERING Sample: 21,700 6 th - to How many hours a year do you volunteer?
Number of Hours Percent (%)
fewer than 20 hours 30
20 to 39 hours 35
40 to 59 hours 13
60 to 80 hours 7
more than 80 hours 15
12 th -grade students surveyed by USA Weekend, Youthnoise.com, and Key Club.
Question: Are youth interested in volunteering?
Conclusion: Youth are interested in volunteering.
6. SPORTS Sample: Scholastic Magazine asked kids with online subscriptions to comment on their favorite sports in which to compete. They received 3585 responses.
Question: What are kids’ favorite sports to compete in?
Results: baseball/softball, 271; football, 436; basketball, 570; soccer, 279; hockey, 197; track, 209; swimming, 319; gymnastics, 197; skating, 289; bowling, 202; other, 616
Conclusion: Basketball is kids’ favorite sport in which to compete.
Lesson 12-2 Analyzing Survey Results 751
Determine whether each display gives an accurate picture of the survey results.Explain.
Example 4p. 749
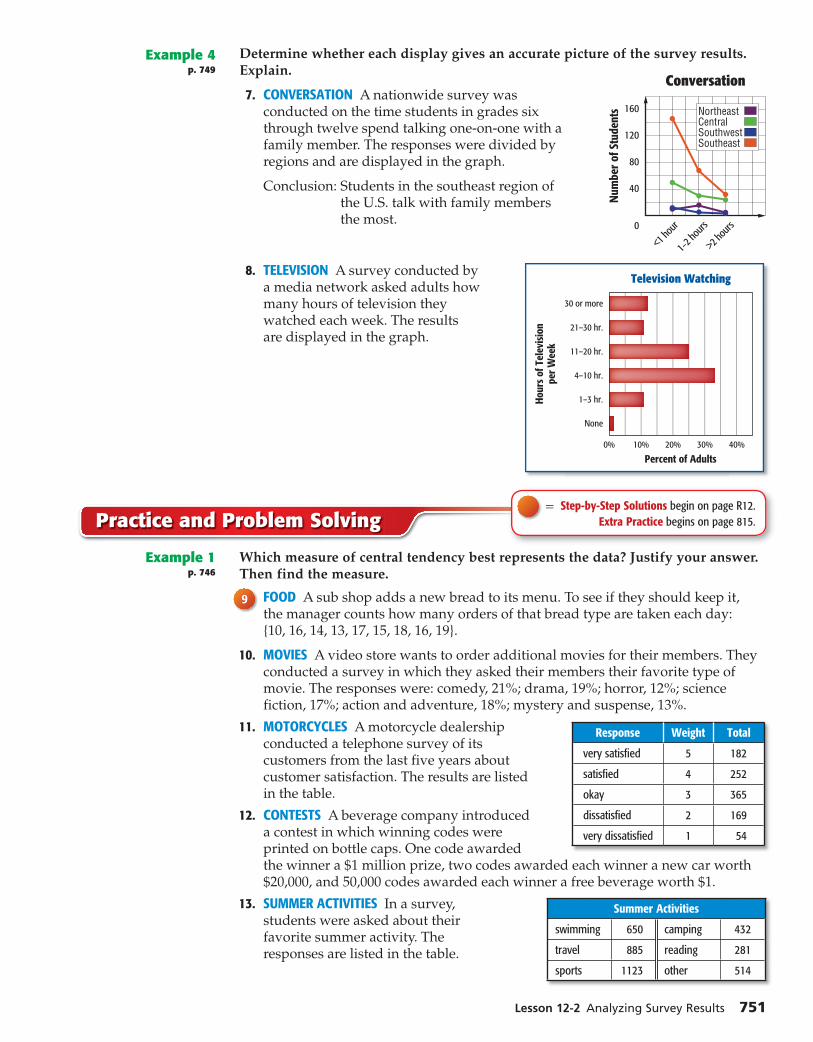
7. CONVERSATION A nationwide survey was
<1 hou
r
1–2 ho
urs
>2 hou
rs0
160
120
80
40
NortheastCentralSouthwestSoutheast
Num
ber o
f Stu
dent
s
Conversation
conducted on the time students in grades six through twelve spend talking one-on-one with a family member. The responses were divided by regions and are displayed in the graph.
Conclusion: Students in the southeast region of the U.S. talk with family members the most.
8. TELEVISION A survey conducted by Television Watching
30 or more
21–30 hr.
11–20 hr.
4–10 hr.
1–3 hr.
None
0% 10% 20% 30% 40%
Hour
s of
Tel
evis
ion
per W
eek
Percent of Adults
a media network asked adults how many hours of television they watched each week. The results are displayed in the graph.
Practice and Problem Solving = Step-by-Step Solutions begin on page R12.
Extra Practice begins on page 815.
Which measure of central tendency best represents the data? Justify your answer. Then find the measure.
Example 1p. 746
99 FOOD A sub shop adds a new bread to its menu. To see if they should keep it, the manager counts how many orders of that bread type are taken each day: {10, 16, 14, 13, 17, 15, 18, 16, 19}.
10. MOVIES A video store wants to order additional movies for their members. They conducted a survey in which they asked their members their favorite type of movie. The responses were: comedy, 21%; drama, 19%; horror, 12%; science fiction, 17%; action and adventure, 18%; mystery and suspense, 13%.
11. MOTORCYCLES A motorcycle dealership Response Weight Total
very satisfi ed 5 182
satisfi ed 4 252
okay 3 365
dissatisfi ed 2 169
very dissatisfi ed 1 54
conducted a telephone survey of its customers from the last five years about customer satisfaction. The results are listed in the table.
12. CONTESTS A beverage company introduced a contest in which winning codes were printed on bottle caps. One code awarded the winner a $1 million prize, two codes awarded each winner a new car worth $20,000, and 50,000 codes awarded each winner a free beverage worth $1.
13. SUMMER ACTIVITIES In a survey, Summer Activities
swimming 650 camping 432
travel 885 reading 281
sports 1123 other 514
students were asked about their favorite summer activity. The responses are listed in the table.
752 Chapter 12 Statistics and Probability
Given each survey report, evaluate the validity of the information and conclusion.Examples 2 and 3pp. 747–748
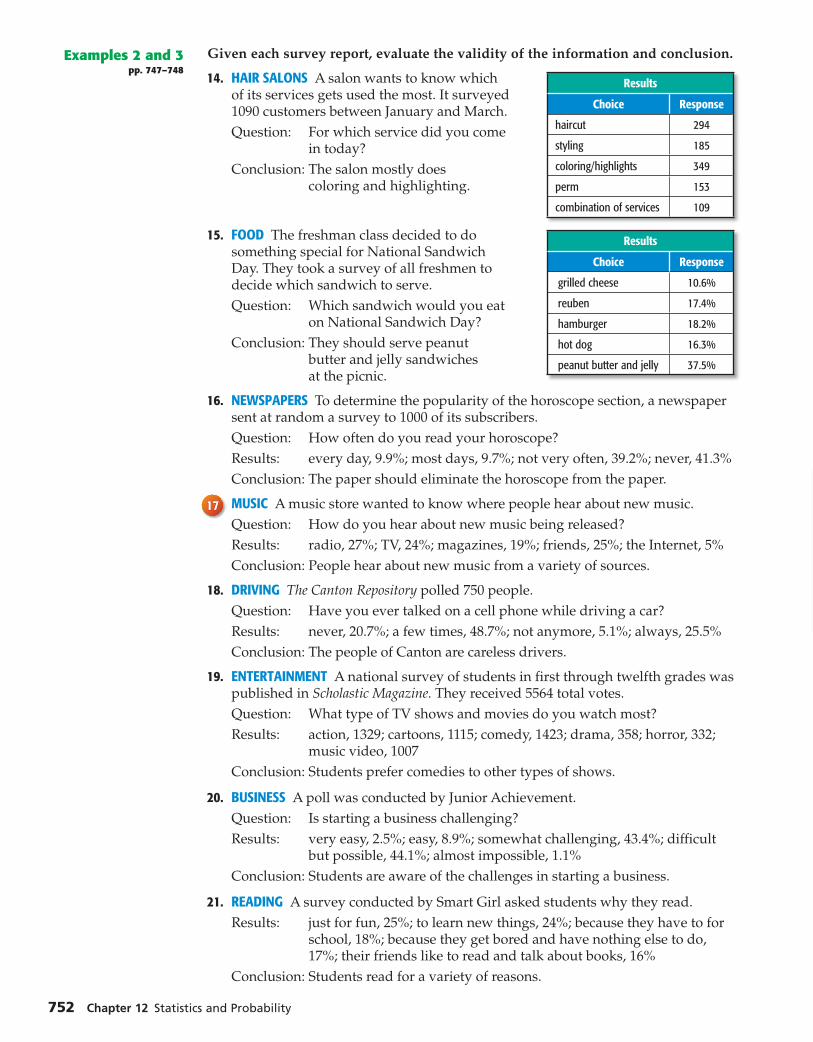
14. HAIR SALONS A salon wants to know which Results
Choice Response
haircut 294
styling 185
coloring/highlights 349
perm 153
combination of services 109
of its services gets used the most. It surveyed 1090 customers between January and March.
Question: For which service did you come in today?
Conclusion: The salon mostly does coloring and highlighting.
15. FOOD The freshman class decided to do Results
Choice Response
grilled cheese 10.6%
reuben 17.4%
hamburger 18.2%
hot dog 16.3%
peanut butter and jelly 37.5%
something special for National Sandwich Day. They took a survey of all freshmen to decide which sandwich to serve.
Question: Which sandwich would you eat on National Sandwich Day?
Conclusion: They should serve peanut butter and jelly sandwiches at the picnic.
16. NEWSPAPERS To determine the popularity of the horoscope section, a newspaper sent at random a survey to 1000 of its subscribers.
Question: How often do you read your horoscope?
Results: every day, 9.9%; most days, 9.7%; not very often, 39.2%; never, 41.3%
Conclusion: The paper should eliminate the horoscope from the paper.
1717 MUSIC A music store wanted to know where people hear about new music.
Question: How do you hear about new music being released?
Results: radio, 27%; TV, 24%; magazines, 19%; friends, 25%; the Internet, 5%
Conclusion: People hear about new music from a variety of sources.
18. DRIVING The Canton Repository polled 750 people.
Question: Have you ever talked on a cell phone while driving a car?
Results: never, 20.7%; a few times, 48.7%; not anymore, 5.1%; always, 25.5%
Conclusion: The people of Canton are careless drivers.
19. ENTERTAINMENT A national survey of students in first through twelfth grades was published in Scholastic Magazine. They received 5564 total votes.
Question: What type of TV shows and movies do you watch most?
Results: action, 1329; cartoons, 1115; comedy, 1423; drama, 358; horror, 332; music video, 1007
Conclusion: Students prefer comedies to other types of shows.
20. BUSINESS A poll was conducted by Junior Achievement.
Question: Is starting a business challenging?
Results: very easy, 2.5%; easy, 8.9%; somewhat challenging, 43.4%; difficult but possible, 44.1%; almost impossible, 1.1%
Conclusion: Students are aware of the challenges in starting a business.
21. READING A survey conducted by Smart Girl asked students why they read.
Results: just for fun, 25%; to learn new things, 24%; because they have to for school, 18%; because they get bored and have nothing else to do, 17%; their friends like to read and talk about books, 16%
Conclusion: Students read for a variety of reasons.
Lesson 12-2 Analyzing Survey Results 753
Determine whether each display gives an accurate picture of the survey results.Example 4p. 749
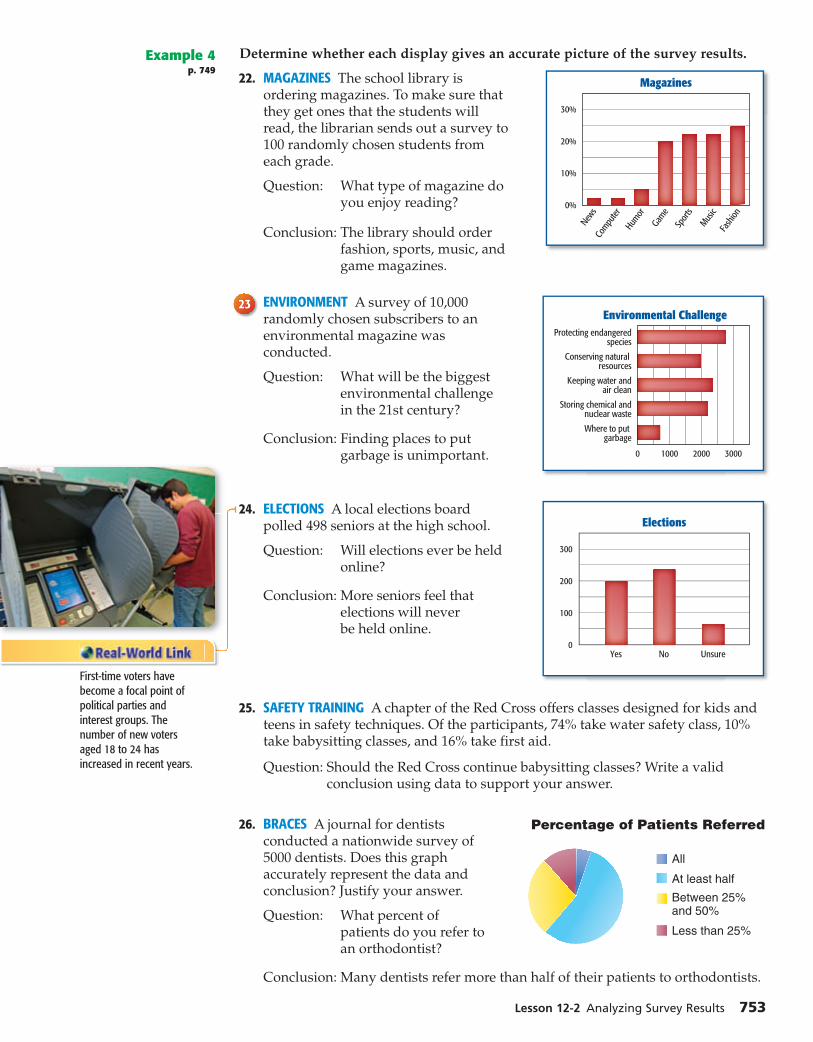
22. MAGAZINES The school library is
30%
20%
10%
0%
Magazines
News
Compu
terHum
orGam
eSp
orts
Music
Fash
ion
ordering magazines. To make sure that they get ones that the students will read, the librarian sends out a survey to 100 randomly chosen students from each grade.
Question: What type of magazine do you enjoy reading?
Conclusion: The library should order fashion, sports, music, and game magazines.
2323 ENVIRONMENT A survey of 10,000
0 1000 2000 3000
Environmental ChallengeProtecting endangered
species
Conserving natural resources
Keeping water andair clean
Storing chemical andnuclear waste
Where to put garbage
randomly chosen subscribers to an environmental magazine was conducted.
Question: What will be the biggest environmental challenge in the 21st century?
Conclusion: Finding places to put garbage is unimportant.
24. ELECTIONS A local elections board Elections
Yes No Unsure
300
200
100
0
polled 498 seniors at the high school.
Question: Will elections ever be held online?
Conclusion: More seniors feel that elections will never be held online.
25. SAFETY TRAINING A chapter of the Red Cross offers classes designed for kids and teens in safety techniques. Of the participants, 74% take water safety class, 10% take babysitting classes, and 16% take first aid.
Question: Should the Red Cross continue babysitting classes? Write a valid conclusion using data to support your answer.
26. BRACES A journal for dentists Percentage of Patients Referredconducted a nationwide survey of 5000 dentists. Does this graph accurately represent the data and conclusion? Justify your answer.
Question: What percent of patients do you refer to an orthodontist?
Conclusion: Many dentists refer more than half of their patients to orthodontists.
First-time voters have become a focal point of political parties and interest groups. The number of new voters aged 18 to 24 has increased in recent years.

754 Chapter 12 Statistics and Probability
27. CELEBRITIES A celebrity gossip magazine conducted a survey of their subscribers.
Question: Are you influenced by the behavior of celebrities?
Conclusion: Their subscribers are not influenced by the behavior of celebrities.
Does this graph accurately represent the data and conclusion? Justify your answer.
28. MULTIPLE REPRESENTATIONS In this problem, you will explore another way to analyze data.
a. CONCRETE Below is a distribution of coins in unequal stacks. Duplicate these stacks with coins.
b. GRAPHICAL Make a line plot of the stacks. Above each of these columns, record how much each stack differs from the mean (the number of coins per stack). Find the absolute value of each of these values.
c. ANALYTICAL Move the coins one at a time to make the stacks equal. Be sure to avoid unnecessary moves. Count the moves. The number of moves it takes to make the stacks equal tells us how much the original set of stacks differs from the set of equal stacks.
d. ANALYTICAL Find the mean of the absolute values. Describe what this value is and what it means in these circumstances.
H.O.T. Problems Use Higher-Order Thinking Skills
29. FIND THE ERROR Pepita and Ben are asked to decide which measure of central tendency to use given the data of test scores {84, 82, 80, 32, 87, 83, 85}. Is either of them correct? Explain your reasoning.
Pepita
The mean is the best measure of
central tendency because the
data are clumped together, and
there are no repeated values.
BenThe median is the bes t measure of central
tendency bec ause the data are clumped
toget her, but there is an outlier, and there
are no repeated values .
30. CHALLENGE Find a set of numbers that satisfies each list of conditions.
a. The mean, median, and mode are all the same number.
b. The mean is greater than the median.
c. The mode is 10 and the median is greater then the mean.
d. The mean is 6, the median is 5.5, and the mode is 9.
31. OPEN ENDED Describe a survey you would like to conduct. Include the sample, population, method of questioning, and how you would display the results.
32. WRITING IN MATH Explain why a company may display survey results inaccurately. Give one example of how they might accomplish this.
Influenced by Celebrities
Teenage girls are not that influenced by the behavior of celebrities. Of the 1700 teenage girls surveyed, only 5% thought that the excessive lifestyles of celebrities were cool. About 63% of the girls said that they were not influenced by celebrities.Source: Yahoo News

33. At the county fair, 1000 tickets were sold. Adult tickets cost $8.50, child’s tickets cost $4.50, and a total of $7300 was collected. How many child’s tickets were sold?
A 700 C 400
B 600 D 300
34. Edward has 20 dimes and nickels, which together total $1.40. How many nickels does he have?
F 12 H 8
G 10 J 6
35. If 4.5 kilometers is about 2.8 miles, how many miles is 6.1 kilometers?
A 3.2 miles C 3.8 miles
B 3.6 miles D 4.0 miles
36. EXTENDED RESPONSE Three times the width of a certain rectangle exceeds twice its length by three inches, and four times its length is twelve more than its perimeter.
a. Translate the verbal sentences into equations.
b. Find the dimensions of the rectangle.
c. What is the area of the rectangle?
Standardized Test Practice
Spiral Review
Identify each sample and suggest a population from which it is selected. State whether the sample is biased or unbiased. If unbiased, classify the sample as simple, stratified, or systematic. (Lesson 12-1)
37. SCHOOL To see who will represent their class at the pep rally, three names are drawn from a container containing identical pieces of paper with all of the freshmen’s names.
38. BOOKS To check the quality of the books being manufactured, a quality inspector checks every 50th book that comes off the line.
39. COMPUTERS Mayfield High School participated in a larger survey to find out how teens feel about certain issues involving social networks. The responses are divided into group by each age and then tallied for each question.
Find the roots of each function. (Lesson 11-8)
40. f(x) = x 2 - 8x + 15
__ x 2 + 5x - 6
41. f(x) = x 2 - x - 12 _
x 2 - 6x + 8 42. f(x) = x 2 - x - 30
__ x 2 - 3x - 18
Find the values of the three trigonometric ratios for angle A. (Lesson 10-8)
43. 9
136
44.
14
21
28
45.
1117
23
Skills Review
Find the mean, median, and mode for each set of data. (Lesson 0-12)
46. {100, 105, 100, 105, 100, 110} 47. {12, 25, 14, 35, 42, 27, 31, 48}
48. {90, 85, 92, 99, 78, 82, 92, 90} 49. {1, 5, 3, 7, 6, 2, 9, 2, 5, 1, 9, 1}
50. {55, 65, 45, 35, 65, 25, 85} 51. {25, 28, 21, 26, 25, 27, 29, 30}
KCCT PRACTICE MA-HS-1.4.1
Lesson 12-2 Analyzing Survey Results 755
ThenThenYou organized and summarized survey results. (Lesson 12-2)
NowNow Use statistics to analyze
survey results. Analyze data sets using
statistics.
KY Programof Studies
HS-DAP-S-CDS8 Students will understand how simple statistics reflect the values of population parameters and use sampling distributions as the basis for informal inference.HS-DAP-S-CDS10 Students will compare data sets using graphs and summary statistics. Also addresses HS-DAP-S-DR1, HS-DAP-S-DR3, and HS-DAP-S-CDS1.
New VocabularyNew Vocabularystatistical inferencestatisticparameterunivariate datameasures of variationme an absolute deviationstandard deviationvariance
KY Math Online
glencoe.com Extra Examples Personal Tutor Self-Check Quiz Homework Help
756 Chapter 12 Statistics and Probability
Statistics and Parameters
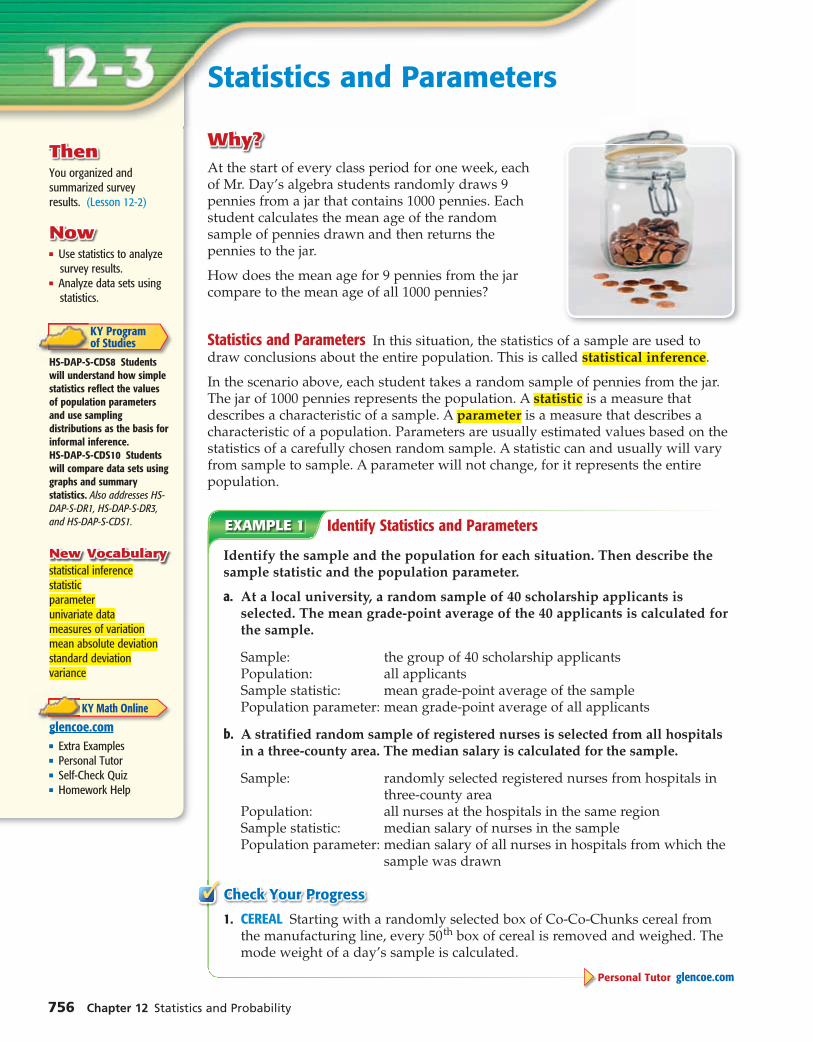
Why?Why?
At the start of every class period for one week, each of Mr. Day’s algebra students randomly draws 9 pennies from a jar that contains 1000 pennies. Each student calculates the mean age of the random sample of pennies drawn and then returns the pennies to the jar.
How does the mean age for 9 pennies from the jar compare to the mean age of all 1000 pennies?
Statistics and Parameters In this situation, the statistics of a sample are used to draw conclusions about the entire population. This is called statistical inference.
In the scenario above, each student takes a random sample of pennies from the jar. The jar of 1000 pennies represents the population. A statistic is a measure that describes a characteristic of a sample. A parameter is a measure that describes a characteristic of a population. Parameters are usually estimated values based on the statistics of a carefully chosen random sample. A statistic can and usually will vary from sample to sample. A parameter will not change, for it represents the entire population.
EXAMPLE 1 Identify Statistics and Parameters
Identify the sample and the population for each situation. Then describe the sample statistic and the population parameter.
a. At a local university, a random sample of 40 scholarship applicants is selected. The mean grade-point average of the 40 applicants is calculated for the sample.
Sample: the group of 40 scholarship applicants Population: all applicantsSample statistic: mean grade-point average of the samplePopulation parameter: mean grade-point average of all applicants
b. A stratified random sample of registered nurses is selected from all hospitals in a three-county area. The median salary is calculated for the sample.
Sample: randomly selected registered nurses from hospitals in three-county area
Population: all nurses at the hospitals in the same regionSample statistic: median salary of nurses in the samplePopulation parameter: median salary of all nurses in hospitals from which the
sample was drawn
Check Your Progress✓ 1. CEREAL Starting with a randomly selected box of Co-Co-Chunks cereal from
the manufacturing line, every 5 0 th box of cereal is removed and weighed. The mode weight of a day’s sample is calculated.
Personal Tutor glencoe.com

Lesson 12-3 Statistics and Parameters 757
ReviewVocabulary
bivariate datadata that involve two variables (Lesson 4-5)
Statistical Analysis Data that involve only one variable are called univariate data. This kind of data can be represented by measures of central tendency, such as the mean, median, and mode. Univariate data can also be represented by measures of variation, such as range, quartiles, and interquartile range.
Type Description When Best Used
range the difference between the greatest and least values
to describe which numbers are included in the data set
quartilethe values that divide the data set into four equal parts
to determine values in the upper or lower portions of a data set
interquartile range
the range of the middle half of a data set; the difference between the upper and lower quartiles
to determine what values lie in the middle half of the data set
Concept Summary Measures of VariationFor Your
The mean absolute deviation is the average of the absolute values of the differences between the mean and each value in the data set. Use this method to calculate the mean absolute deviation. Recall that absolute value is the distance from a number to zero on a number line.
Key Concept Mean Absolute Deviation
Step 1 Find the mean.
Step 2 Find the sum of the absolute values of the differences between each value in the set of data and the mean.
Step 3 Divide the sum by the number of values in the set of data.
For Your
EXAMPLE 2 Use the Mean Absolute Deviation
MARKETING Each person that visited the Comic Book Shoppe’s web site was asked to enter the number of times each month they buy a comic book. They received the following responses in one day: {2, 2, 3, 4, 14}. Find the mean absolute deviation.
Step 1 The mean of this set of data is 5.
Step 2 Find the sum of the absolute value of the difference between each value in the data set and the mean.⎪2 - 5⎥ + ⎪2 - 5⎥ + ⎪3 - 5⎥ + ⎪4 - 5⎥ + ⎪14 - 5⎥ = 3 + 3 + 2 + 1 + 9 or 18
Step 3 Divide the sum by the number of values: 18 ÷ 5 = 3.6.
Check Your Progress✓ 2. DANCES The prom committee kept count of how many tickets it sold each day
during lunch: {12, 32, 36, 41, 22, 47, 51, 33, 37, 49}. Find the mean absolute deviation of these data.
Personal Tutor glencoe.com
Recently, Japanese comics for girls, called “shojo,” have become popular. These comics are available in three forms: comic books, graphic novels, and online comics.Source: Disney Family

758 Chapter 12 Statistics and Probability
The standard deviation is a calculated value that shows how the data deviates from the mean of the set of data. The standard deviation is represented by the lower-case Greek symbol sigma, σ. The variance of the data is the square of the standard deviation. Use the method below to calculate the variance and standard deviation.
Key Concept Variance and Standard Deviation
Step 1 Find the mean, − x .
Step 2 Find the square of the difference between each value in the set of data and the mean. Then sum the squares and divide by the number of values in the set of data. The result is the variance.
Step 3 Take the square root of the variance to find the standard deviation.
For Your
EXAMPLE 3 Find the Variance and Standard Deviation
Find the mean, variance, and standard deviation of {3, 6, 11, 12, 13}.
Step 1 To find the mean, add the numbers and then divide by how many numbers are in the data set.
− x = 3 + 6 + 11 + 12 + 13
__ 5 = 45
_ 5 or 9
Step 2 To find the variance, square the difference between each number and the mean. Then sum the squares and divide by the number of values.
σ 2 =
(3 - 9 ) 2 + (6 - 9 ) 2 + (11 - 9 ) 2 + (12 - 9 ) 2 + (13 - 9 ) 2 _____
5
= (-6) 2 + (-3) 2 + 2 2 + 3 2 + 4 2
___ 5
= 36 + 9 + 4 + 9 + 16
__ 5 or 74
_ 5
Step 3 The standard deviation is the square root of the variance.
σ 2 = 74
_ 5 Variance
√ �
σ 2 = √ �
74 _
5 Take the square root of the variance.
σ ≈ 3.8 Use a calculator.
The mean of the set of data is 9, the variance is 74 _
5 , and the standard deviation is
approximately 3.8.
Check Your Progress✓Find the mean, variance, and standard deviation of each set of data.
3A. {6, 10, 15, 11, 8} 3B. {92, 84, 71, 83, 100}
Personal Tutor glencoe.com
The standard deviation illustrates the spread of the items in a set of data. For example, when the mean of a set of data is 75 and the standard deviation is 3, we know that almost all of the data values are very close to the mean. When the mean is 75 and the standard deviation is 15, then the data are more spread out and there is probably at least one outlier.
Study Tip
Symbols The mean of a sample and the mean of a population are calculated in the same way. − x usually refers to the mean of a sample, but in this text, it will refer to the mean of a population.
Study Tip
Categories of Data Quantitative data can also be called measurement data. Qualitative data is also known as categorical data.
Lesson 12-3 Statistics and Parameters 759
EXAMPLE 4 Statistical Analysis
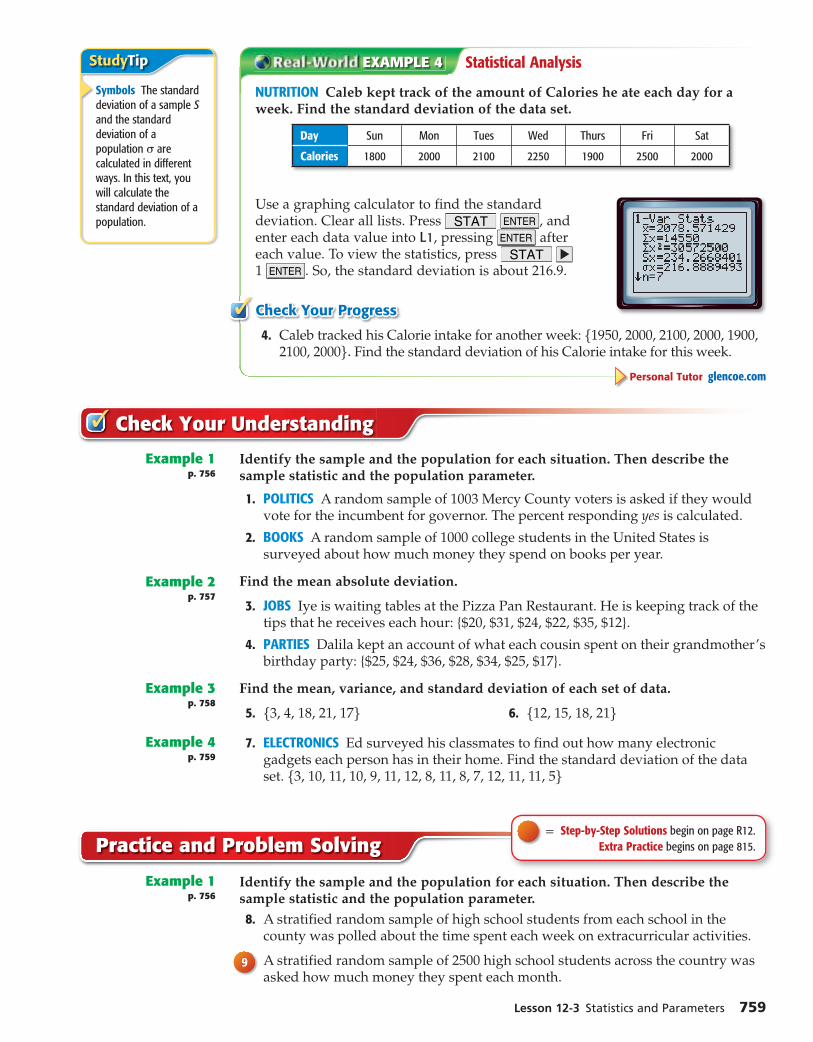
NUTRITION Caleb kept track of the amount of Calories he ate each day for a week. Find the standard deviation of the data set.
Day Sun Mon Tues Wed Thurs Fri Sat
Calories 1800 2000 2100 2250 1900 2500 2000
Use a graphing calculator to find the standard deviation. Clear all lists. Press STAT ENTER , and enter each data value into L1, pressing ENTER after each value. To view the statistics, press STAT 1 ENTER . So, the standard deviation is about 216.9.
Check Your Progress✓ 4. Caleb tracked his Calorie intake for another week: {1950, 2000, 2100, 2000, 1900,
2100, 2000}. Find the standard deviation of his Calorie intake for this week.
Personal Tutor glencoe.com
✓ Check Your Understanding
Identify the sample and the population for each situation. Then describe the sample statistic and the population parameter.
Example 1p. 756
1. POLITICS A random sample of 1003 Mercy County voters is asked if they would vote for the incumbent for governor. The percent responding yes is calculated.
2. BOOKS A random sample of 1000 college students in the United States is surveyed about how much money they spend on books per year.
Find the mean absolute deviation.Example 2p. 757
3. JOBS Iye is waiting tables at the Pizza Pan Restaurant. He is keeping track of the tips that he receives each hour: {$20, $31, $24, $22, $35, $12}.
4. PARTIES Dalila kept an account of what each cousin spent on their grandmother’s birthday party: {$25, $24, $36, $28, $34, $25, $17}.
Find the mean, variance, and standard deviation of each set of data.Example 3p. 758
5. {3, 4, 18, 21, 17} 6. {12, 15, 18, 21}
Example 4p. 759
7. ELECTRONICS Ed surveyed his classmates to find out how many electronic gadgets each person has in their home. Find the standard deviation of the data set. {3, 10, 11, 10, 9, 11, 12, 8, 11, 8, 7, 12, 11, 11, 5}
Practice and Problem Solving = Step-by-Step Solutions begin on page R12.
Extra Practice begins on page 815.
Identify the sample and the population for each situation. Then describe the sample statistic and the population parameter.
Example 1p. 756
8. A stratified random sample of high school students from each school in the county was polled about the time spent each week on extracurricular activities.
99 A stratified random sample of 2500 high school students across the country was asked how much money they spent each month.
Study Tip
Symbols The standard deviation of a sample S and the standard deviation of a population σ are calculated in different ways. In this text, you will calculate the standard deviation of a population.
760 Chapter 12 Statistics and Probability
Find the mean absolute deviation.Example 2p. 757
10. DVDS Mr. Robinson asked his students to count the number of DVDs they owned.
11. AMUSEMENT PARKS An amusement park manager wanted to keep track of how many bags of cotton candy were sold each hour on a Saturday: {16, 24, 15, 17, 22, 16, 18, 24, 17, 13, 25, 21}.
Find the mean, variance, and standard deviation of each set of data.Example 3p. 758
12. {3, 8, 7, 12} 1313 {76, 78, 83, 74, 75}
14. {0.01, 0.03, 0.1, 0.5} 15. {0.8, 0.01, 0.06, 0.02, 0.4, 0.8, 0.5}
Example 4p. 759
16. ONLINE AUCTIONS Scott makes keychains and sells them on an online auction site. He tracks the selling price of each keychain: {$3.25, $4.50, $5.00, $5.75, $2.25, $8.50, $6.00, $3.50, $4.50, $5.00}. Find the standard deviation.
17. PART-TIME JOBS Ms. Johnson asked all of the members of the girl’s tennis team to find the number of hours each week they work at part-time jobs: {10, 12, 0, 6, 9, 15, 12, 10, 11, 20}. Find the standard deviation of the data set.
18. BASKETBALL The heights of players on
an NBA team are shown.
a. Find the mean and standard deviation.
b. Suppose the player who is 5’9” was traded for Earl Boykins. Find the mean and the standard deviation. Describe the effect this trade has on the statistical calculations.
c. Suppose the player who is 5’9” was traded for Yao Ming. Find the mean and the standard deviation. Describe the effect this trade has on the statistical calculations.
19. PENNIES Mr. Day has another jar of pennies on his desk. There are 30 pennies in this jar. Theo looks at 5 pennies from the jar and replaces them. Lydia looks at 10 pennies and replaces them, and Peter looks at 20 pennies and replaces them.
a. Identify the sample and the population for each situation. Then describe a sample statistic and a population parameter.
b. The years of Theo’s pennies are {1974, 1975, 1981, 1999, 1992}. Find the mean and mean absolute deviation.
c. The years of Lydia’s pennies are {2004, 1999, 2004, 2005, 1991, 2003, 2005, 2000, 2001, 1998}. Find the mean and mean absolute deviation.
d. The years of Peter’s pennies are {2007, 2005, 1975, 2003, 2005, 1997, 1992, 1994, 1991, 1992, 2000, 1999, 2005, 1982, 2005, 2004, 1998, 2001, 2002, 2006}. Find the mean and mean absolute deviation.
e. Find the mean and mean absolute deviation for all of the pennies in the jar. Which sample was most accurate? Explain.
Years of Pennies in Jar
2001 1990 2000 1982 1991 1975
2007 1981 2005 2007 2003 2005
1997 1974 1992 1994 1991 1992
2000 1995 1999 2005 2006 2005
2004 2004 1998 2001 2002 2006
Heights of Professional Basketball Players (in.)
80 77 83 74 78
80 83 74 83 69
78 85 81 81 79
One of the tallest players in the NBA was Yao Ming at 7 ft 5 in. One of the shortest NBA players was Earl Boykins at 5 ft 5 in.Source: Inside Hoops
Number of DVDs
26 39 5 82 12 14
0 3 15 19 41 6
2 0 11 1 19 29
Lesson 12-3 Statistics and Parameters 761
20. BABYSITTING Samantha wants to see if she is getting a fair wage for babysitting at $8.50 per hour. She takes a survey of her friends to see what they charge per hour. The results are {$8, $8.50, $9, $7.50, $10, $8.25, $8.75}. Find the mean absolute deviation of the data.
2121 RUNNING The results of a 5K race are published in a local paper. Over a thousand people participated, but only the times of the top 15 finishers are listed.
1 5 th Annual 5K Road RacePlace Time (min:s) Place Time (min:s) Place Time (min:s)
1 15:56 6 16:34 11 17:14
2 16:06 7 16:41 12 17:46
3 16:11 8 16:54 13 17:56
4 16:21 9 17:00 14 17:57
5 16:26 10 17:03 15 18:03
a. Find the mean and mean absolute deviation of the top 15 running times. (Hint: Convert each time to seconds.)
b. Identify the sample and population.
c. Analyze the sample. Classify the data as qualitative or quantitative. Can a statistical analysis of the sample be applied to the population? Explain.
H.O.T. Problems Use Higher-Order Thinking Skills
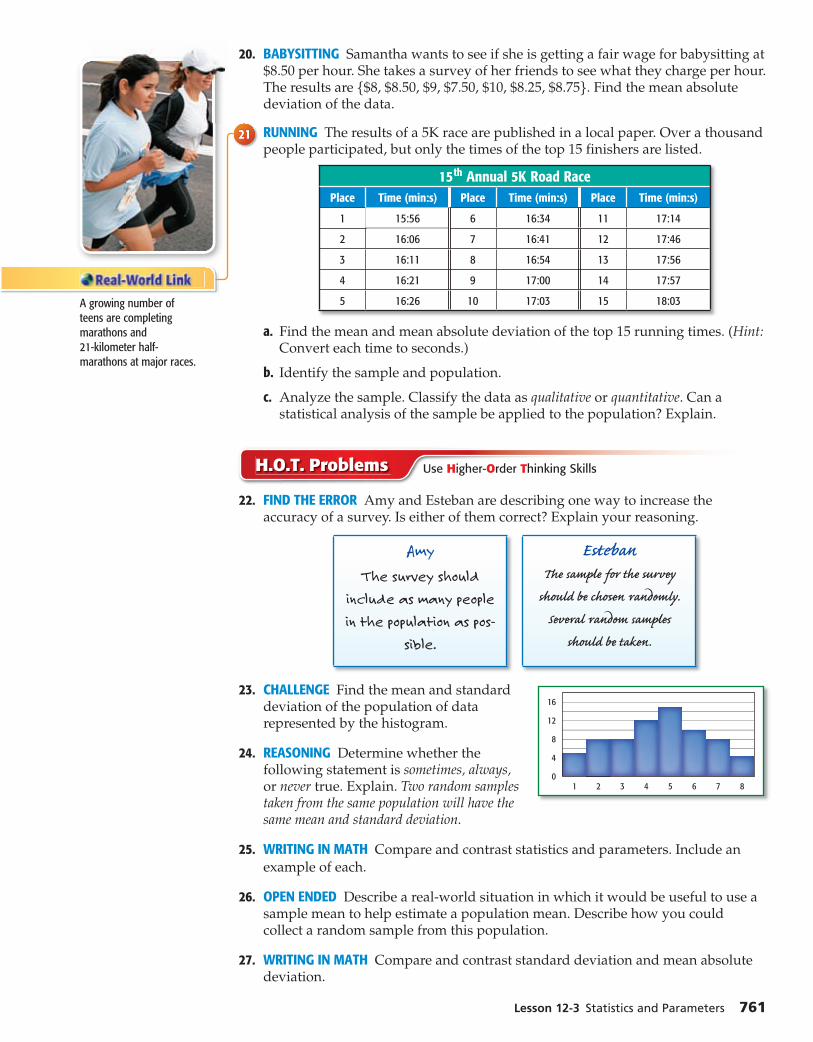
22. FIND THE ERROR Amy and Esteban are describing one way to increase the accuracy of a survey. Is either of them correct? Explain your reasoning.
Amy
The survey should
include as many people
in the population as pos-
sible.
EstebanTh e sample for the survey
should be chosen randomly.
Several random samples
should be taken.
23. CHALLENGE Find the mean and standard 16
12
8
4
01 2 3 4 5 6 7 8
deviation of the population of data represented by the histogram.
24. REASONING Determine whether the following statement is sometimes, always, or never true. Explain. Two random samples taken from the same population will have the same mean and standard deviation.
25. WRITING IN MATH Compare and contrast statistics and parameters. Include an
example of each.
26. OPEN ENDED Describe a real-world situation in which it would be useful to use a sample mean to help estimate a population mean. Describe how you could collect a random sample from this population.
27. WRITING IN MATH Compare and contrast standard deviation and mean absolute deviation.
A growing number of teens are completing marathons and 21-kilometer half-marathons at major races.
28. Melina bought a shirt that was marked 20%
off of $15.75. What was the original price?
A $16.69 C $18.69
B $17.69 D $19.69
29. SHORT RESPONSE A group of students visited the Capitol building. Twenty students met with the local representative. This was 16% of the students. How many student
ambassadors were there altogether?
30. The tallest 7 trees in a park have heights in meters of 19, 24, 17, 26, 24, 20, and 18. Find
the median of their heights.
F 17 H 21
G 20 J 24
31. It takes 3 hours for a boat to travel 27 miles upstream. The same boat can travel 30 miles downstream in 2 hours. Find the speed of the
boat.
A 12 mph C 3 mph
B 14 mph D 5 mph
Standardized Test Practice
Spiral Review
Tell which measure of central tendency best represents the data. Justify your answer. Then find the measure. (Lesson 12-2)
32. FOOD DRIVE A high school is offering an incentive to the class that brings in the most canned goods. The pounds of food brought by the classes are represented by the data set {8, 12, 18, 25, 21, 5, 10, 14}.
33. TEST SCORES The results of the math test are {78, 81, 85, 86, 88, 85, 90, 91, 85, 95, 98}.
Identify each sample as biased or unbiased. Explain your reasoning. (Lesson 12-1)
34. SHOPPING Every tenth person walking into the mall is asked to name their favorite store.
35. MUSIC Every fifth person at a rock concert is asked to name their favorite radio station.
36. GEOMETRY If the side length of a cube is s, the volume is represented by s 3 , and the surface area is represented by 6 s 2 . (Lesson 7–1)
a. Are the expressions for volume and surface area monomials? Explain.
b. If the side of a cube measures 3 feet, fi nd the volume and surface area.
c. Find a side length s such that the volume and surface area have the same
measure.
d. The volume of a cylinder can be found by multiplying the radius squared times the height times π, or V = π r 2 h. Suppose you have two cylinders. Each measure of the second is twice the measure of the fi rst, so V = π(2r ) 2 (2h). What
is the ratio of the volume of the fi rst cylinder to the second cylinder?
Skills Review
A bowl contains 3 red chips, 6 green chips, 5 yellow chips, and 8 orange chips. A chip is drawn randomly. Find each probability. (Lesson 0–11)
37. red 38. orange 39. yellow or green
40. not orange 41. not green 42. red or orange
KCCT PRACTICE MA-HS-4.2.1
762 Chapter 12 Statistics and Probability
s
Chapter 12 Mid-Chapter Quiz 763
Identify each sample, and suggest a population from which it was selected. Then classify the type of data collection used. (Lesson 12-1)
1. CEREAL A cereal company invites 100 children and parents in to test a new cereal and records the reactions.
2. SCHOOL LUNCH A school is creating a new lunch menu. They send out a questionnaire to all students with odd homeroom numbers to determine what items should be on the new menu.
3. MEDICINE A research facility gave a new medicine to hamsters and determined that 1 out of every 50 hamsters that took the medicine lost its hair. They conclude that the same thing will happen to every 50 people who take the medicine.
4. MASCOTS The cheerleaders send out a flyer with pictures of possible options for the new mascot to all the girls in the school. The girls mark their favorite mascot and send it back. The new mascot is chosen from the favorite from the survey.
Identify each sample as biased or unbiased. Explain your reasoning. (Lesson 12-1)
5. ART Every fifth person leaving the art museum is asked to name their favorite piece.
6. SHOPPING Each person leaving the Earring Pagoda is asked to name their favorite store in the mall.
7. FOOTBALL TEAM Every 10th student leaving the student union at Ohio State is asked to name their favorite college football team.
8. CLASSES Every 5th person leaving the school is asked to name their favorite class.
9. MULTIPLE CHOICE Every 10 minutes, Kaleigh writes down whether the TV is showing a commercial or a program. Which of the following best describes the sample? (Lesson 12-1)
A simple C systematic
B stratified D none of the above
Which measure of central tendency best represents the data? Justify your answer. Then find the measure. (Lesson 12-2)
10. PLAY AREA Ian listed the ages of the children playing at the play area at the mall. {2, 3, 2, 2, 4, 2, 3, 2, 8, 3, 4, 2}
11. RECYCLING Marielle is in charge of recycling cans at her school. She counts the number of cans recycled each week. {22, 10, 23, 25, 24, 23, 25, 19}
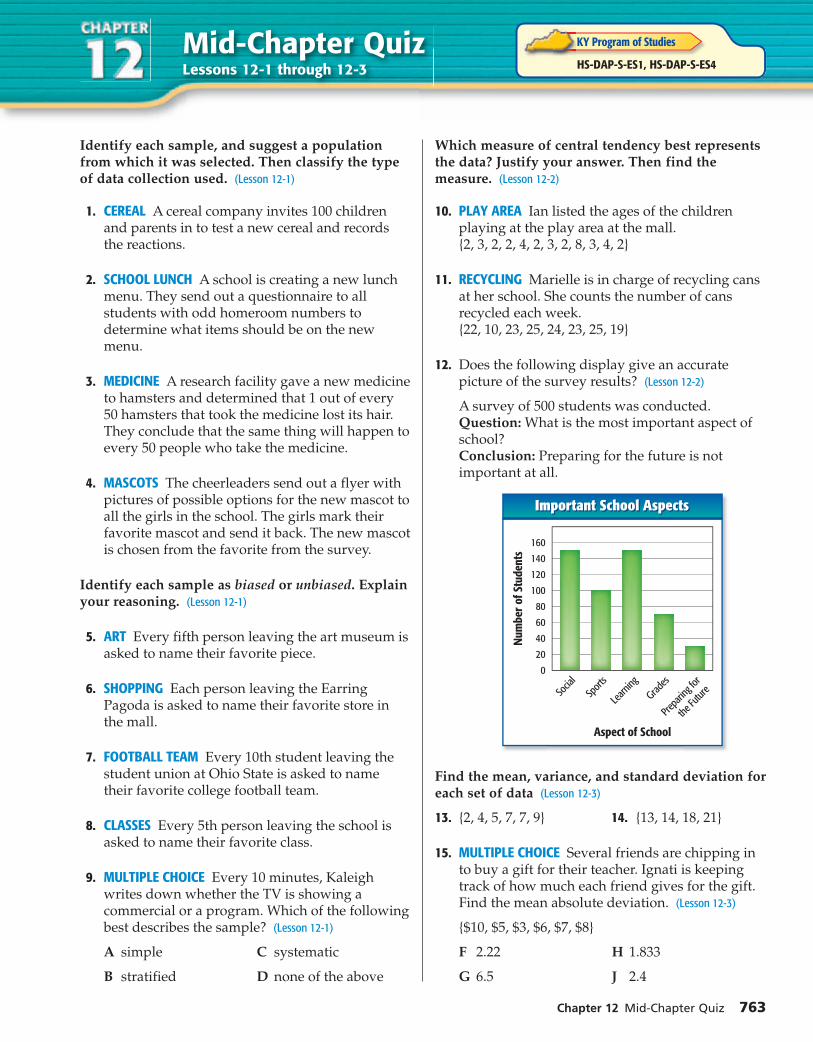
12. Does the following display give an accurate picture of the survey results? (Lesson 12-2)
A survey of 500 students was conducted.Question: What is the most important aspect of school?Conclusion: Preparing for the future is not important at all.
160
140
120
100
80
60
40
20
0
Aspect of School
Socia
lSp
orts
Learni
ng
Grades
Prepa
ring f
or
the Fu
ture
Num
ber o
f Stu
dent
sImportant School AspectsImportant School Aspects
Find the mean, variance, and standard deviation for each set of data (Lesson 12-3)
13. {2, 4, 5, 7, 7, 9} 14. {13, 14, 18, 21}
15. MULTIPLE CHOICE Several friends are chipping in to buy a gift for their teacher. Ignati is keeping track of how much each friend gives for the gift. Find the mean absolute deviation. (Lesson 12-3)
{$10, $5, $3, $6, $7, $8}
F 2.22 H 1.833
G 6.5 J 2.4
Mid-Chapter QuizLessons 12-1 through 12-3 HS-DAP-S-ES1, HS-DAP-S-ES4
KY Program of Studies

ThenThenYou used the Fundamental Counting Principle. (Lesson 0-11)
NowNow Use permutations. Use combinations.
KY Programof Studies
HS-DAP-S-P2 Students will apply the concepts of sample space and probability distribution to construct sample spaces and distributions in simple cases.HS-DAP-S-P14 Students will recognize and identify the differences between combinations and permutations and use them to count discrete quantities.Also addresses HS-NPO-S-NO4.
New VocabularyNew Vocabularypermutationsample spacefactorialcombination
KY Math Online
glencoe.com Extra Examples Personal Tutor Self-Check Quiz Homework Help
764 Chapter 12 Statistics and Probability
Permutations and CombinationsWhy?Why?
Angie’s coach told her that she would bat sixth in the softball game. When a coach decides on the team’s lineup before a game, the order in which she fills in the names is important because it determines the order in which the players will bat.
Permutations When a group of objects or people are arranged so that order is important, the arrangement is called a permutation. This can be found by using a list of all of the possibilities, called the sample space.
Suppose Angie’s coach has 4 players in mind for the first 4 spots in the lineup. The Fundamental Counting Principle can be used to determine the number of permutations. A batter cannot bat first and second, so once that player is chosen, they are not available for the next choice.
number of choices for choices for choices for choices for permutations 1st batter 2nd batter 3rd batter 4th batter
P = 4 · 3 · 2 · 1 = 24
There are 24 different ways to arrange the first four batters.
EXAMPLE 1 Permutation
TRAVEL A travel agency is planning a vacation package in which travelers will visit 5 cities around Europe. How many ways can the agency arrange the 5 cities along the tour?
Number of ways to arrange the cities = 5 · 4 · 3 · 2 · 1 = 120
There are 120 ways to arrange the cities.
Check Your Progress✓
1. MOVIES Lloyd and five friends go to a movie. In how many different ways can they sit together in a row of 6 empty seats?
Personal Tutor glencoe.com
The expression used in Example 1 to calculate the number of permutations of the five cities, 5 · 4 · 3 · 2 · 1, can be written as 5!, which is read 5 factorial.
Key Concept
Words The factorial of a positive integer n is the product of the integers less than or equal to n.
Symbols n! = n · (n - 1) · (n - 2) · … · 1, where 0! = 1
FactorialFor Your

Lesson 12-4 Permutations and Combinations 765
Suppose Angie’s coach has 5 players in mind for the top 3 spots in the lineup. The Fundamental Counting Principle can be used to determine the number of permutations.
choices for1st batter
choices for2nd batter
choices for3rd batter
5 · 4 · 3 = 60 permutations
Notice that 5 · 4 · 3 is the same as 5 · 4 · 3 · 2 · 1 __
2 · 1 . This relationship is expressed
in the following formula.
Key Concept
Words The number of permutations of n objects taken r at a time is the quotient of n! and (n - r)!.
Symbols P(n, r) = n! _
(n - r)!
Permutation FormulaFor Your
EXAMPLE 2 Use the Permutation Formula
LIBRARY The librarian in the school library is placing 6 of 10 magazines on a shelf in a school showcase. How many ways can she arrange the magazines in the case?
P(n, r) = n! _
(n - r)! Permutation Formula
P(10, 6) = 10!_(10 - 6)!
n = 10 and r = 6
= 10! _
4! Simplify.
=
10 · 9 · 8 · 7 · 6 · 5 · 4 · 3 · 2 · 1___4 · 3 · 2 · 1
Divide by common factors.
= 151,200 Simplify.
There are 151,200 ways for the librarian to arrange the magazines.
Check Your Progress✓
2. FASHION A designer has created 15 outfits and needs to select 10 for a fashion show. How many ways can the designer arrange the outfits for the show?
Personal Tutor glencoe.com
Combinations A selection of objects in which order is not important is called a combination. To find all two-letter combinations of A, B, and C, you would list all of the arrangements of two letters, which are listed below.
AB BA AC CA BC CB
Because order does not matter, AB and BA are the same, so there are 2! ways to write the same letters. Divide P(n, r) by 2! to remove the groups with identical objects.
Reading Math
Notation The permutation P(n, r) can also be written as nPr.
Study Tip
Permutations and Combinations If order matters in an arrangement, the arrangement is a permutation. If order does not matter in an arrangement, the arrangement is a combination.
766 Chapter 12 Statistics and Probability
EXAMPLE 3 Combination
FAMILY Horacio has 2 brothers and 2 sisters. Their parents assign chores to them each week. How many ways can two children be chosen to wash the dishes?
Since the order in which the children are chosen does not matter, we need to find the number of combinations of 5 children taken 2 at a time.
C(n, r) = number of permutations
____
number of permutations with identical objects
First find the number of permutations.
P(5, 2) =
5! _
3! or 20 n = 5 and r = 2
Because we are choosing 2, there are 2! = 2 permutations with identical objects.
C(n, r) = 20 _
2 or 10
There are 10 possible ways to choose 2 children.
Check Your Progress✓
3. TEST Louis is given the option of answering any 10 out of the 12 questions on his history test. How many ways can he complete the test?
Personal Tutor glencoe.com
We can now develop a formula for combinations.
Key Concept
Words The number of combinations of n objects taken r at a time is the quotient of n! and (n - r)!r!.
Symbols C(n, r) = n! _
(n - r)!r!
Combination FormulaFor Your
EXAMPLE 4 Use the Combination Formula
RETAIL Marques works part-time at a local department store. His manager asked him to choose for display 5 different styles of shirts from the wall of the store that has 8 shirts on it to put in a display. How many ways can Marques choose the shirts?
C(n, r) = n! _
(n - r)!r! Combination Formula
= 8! _
(8 - 5)!5! n = 8 and r = 5
= 8! _
3!5! Simplify.
=
8 · 7 · 6 · 5 · 4 · 3 · 2 · 1 __
3 · 2 · 1 · 5 · 4 · 3 · 2 · 1 Divide by common factors.
= 336 _
6 or 56 There are 56 ways for Marques to select 5 shirts.
Check Your Progress✓
4. SPRING DANCE A group of four students is selecting corsages and boutonnières to wear to the spring dance. They can choose from 18 different flowers which consist of 4 roses, 6 carnations, and 8 tulips. In how many ways can 4 flowers be chosen to wear?
Personal Tutor glencoe.com
Study Tip
Combination Formula The number of combinations is the quotient of the permutations and the number of permutations containing the same set of objects.
About 27% of teens make dinner for their families at least some of the time.Source: American Demographics
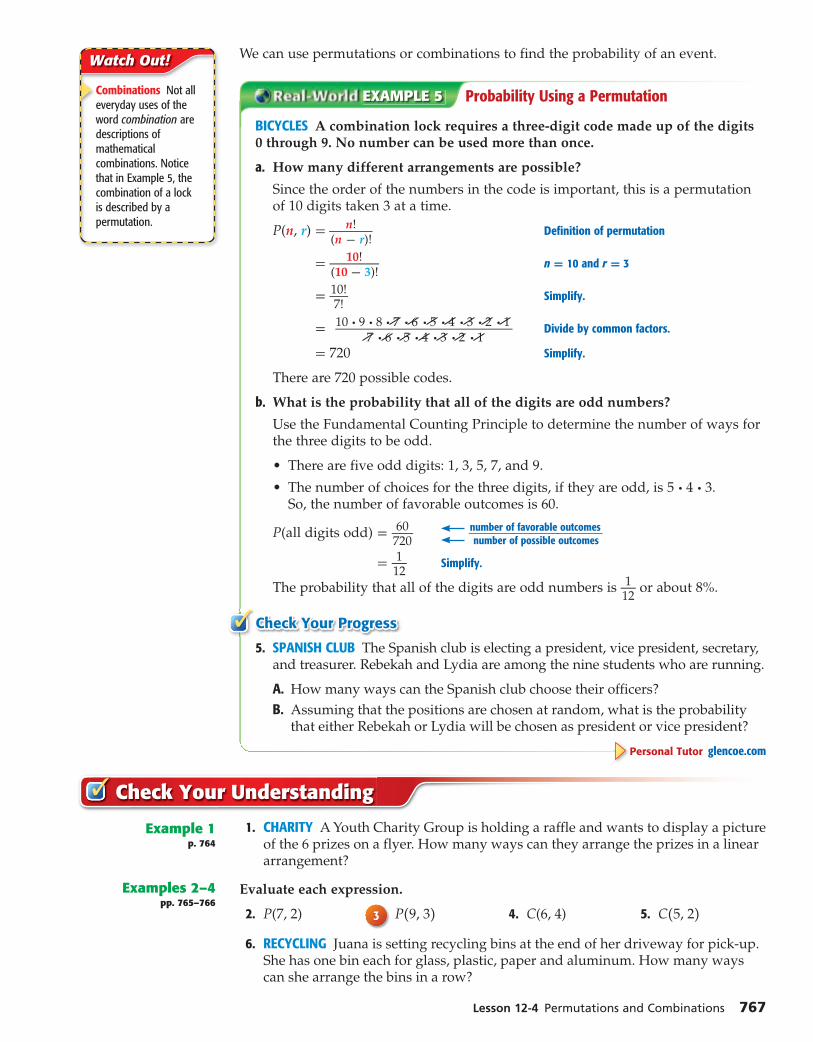
Lesson 12-4 Permutations and Combinations 767
We can use permutations or combinations to find the probability of an event.
EXAMPLE 5 Probability Using a Permutation
BICYCLES A combination lock requires a three-digit code made up of the digits 0 through 9. No number can be used more than once.
a. How many different arrangements are possible?
Since the order of the numbers in the code is important, this is a permutation of 10 digits taken 3 at a time.
P(n, r) =
n! _
(n - r)! Definition of permutation
=
10! _
(10 - 3)! n = 10 and r = 3
=
10! _
7! Simplify.
=
10 · 9 · 8 · 7 · 6 · 5 · 4 · 3 · 2 · 1 ___
7 · 6 · 5 · 4 · 3 · 2 · 1 Divide by common factors.
= 720 Simplify.
There are 720 possible codes.
b. What is the probability that all of the digits are odd numbers?
Use the Fundamental Counting Principle to determine the number of ways for the three digits to be odd.
• There are five odd digits: 1, 3, 5, 7, and 9.
• The number of choices for the three digits, if they are odd, is 5 · 4 · 3. So, the number of favorable outcomes is 60.
P(all digits odd) = 60 _
720 number of favorable outcomes ___
number of possible outcomes
= 1 _ 12
Simplify.
The probability that all of the digits are odd numbers is 1 _ 12
or about 8%.
Check Your Progress✓
5. SPANISH CLUB The Spanish club is electing a president, vice president, secretary, and treasurer. Rebekah and Lydia are among the nine students who are running.
A. How many ways can the Spanish club choose their officers?
B. Assuming that the positions are chosen at random, what is the probability that either Rebekah or Lydia will be chosen as president or vice president?
Personal Tutor glencoe.com
Watch Out!
Combinations Not all everyday uses of the word combination are descriptions of mathematical combinations. Notice that in Example 5, the combination of a lock is described by a permutation.
✓ Check Your Understanding
Example 1p. 764
1. CHARITY A Youth Charity Group is holding a raffle and wants to display a picture of the 6 prizes on a flyer. How many ways can they arrange the prizes in a linear arrangement?
Evaluate each expression.Examples 2–4pp. 765–766
2. P(7, 2) 33 P(9, 3) 4. C(6, 4) 5. C(5, 2)
6. RECYCLING Juana is setting recycling bins at the end of her driveway for pick-up. She has one bin each for glass, plastic, paper and aluminum. How many ways can she arrange the bins in a row?

768 Chapter 12 Statistics and Probability
7. FOOD Linda is preparing to bake a cake. She gets the ingredients out and sets them on the counter top. Six of the 14 ingredients are spices. How many ways can she arrange the spices in a row on the countertop?
Example 5p. 767
8. ICE CREAM The Dairy Barn offers 5 varieties of chocolate ice cream, 4 varieties of candy-flavored ice cream, and 6 varieties of berry-flavored ice cream.
a. In how many ways can a customer choose 3 flavors of ice cream?
b. Does the selection involve a permutation or a combination?
c. If the ice cream flavors are chosen randomly, what is the probability that a customer will select all chocolate?
Practice and Problem Solving = Step-by-Step Solutions begin on page R12.
Extra Practice begins on page 815.
Example 1p. 764
99 PHOTOGRAPHY The four captains of the football team are being arranged in a single line for a photograph that will appear in the newspaper. How many ways can the photographer arrange the players for the photograph?
10. SCIENCE FAIR There are 8 finalists in a science fair competition. How many ways can they stand in a row on the stage?
11. AMUSEMENT PARKS Tino is entering an amusement park with 5 of his friends. At the gate they must go through a turnstile one by one. How many ways can Tino and his friends go through the turnstile?
12. JOBS At a fast food restaurant there are 4 employees that are capable of running the cash registers. They will work at the front counter. How many ways can the manager arrange the employees at the four front counter registers?
Evaluate each expression.Examples 2–4pp. 765–766
13. P(6, 6) 14. P(5, 1) 15. P(4, 1) 16. P(7, 3)
17. C(7, 6) 18. C(5, 3) 19. C(5, 5) 20. C(3, 0)
21. DANCE At the spring dance, Christy and 7 of her friends sit on one side of a table. How many ways can Christy and her friends fill the 10 empty seats?
22. JEWELRY Jewel works at the jewelry store in the mall. Her manager asks her to place 3 of the 12 birthstone necklaces in the front display case. How many ways can she arrange the necklaces in the display case?
Example 5p. 767
23. MARBLES Fifteen marbles out of 20 must be randomly selected. There are 7 red marbles, 8 purple marbles, and 5 green marbles from which to choose. What is the probability that 5 of each color are selected?
24. SCHOOL PLAY Westerville High school is seeking volunteers to help decorate for the winter dance. In all, 4 freshmen, 5 sophomores, 6 juniors, and 8 seniors tried out for the 12 open spots.
a. How many ways can the 12 spots be chosen?
b. If the students are chosen randomly, what is the probability that at least one senior will be chosen?

Lesson 12-4 Permutations and Combinations 769
Determine whether each situation involves a permutation or a combination.
2525 choosing 3 different pizza toppings from a list of 12
26. selecting 4 different ingredients out of 8 for a salad
27. choosing team captains for a football team
28. choosing the first-, second-, and third-place winner of an art competition
29. selecting 5 books to read from a list of 8
30. an arrangement of the letters in the word probability
31. GAMES Tonisha is playing a game in which you make words to score points. There are 12 letters in the box, and she must choose 4. She cannot see the letters.
a. Suppose the 12 letters are all different. In how many ways can she choose 4?
b. She chooses A, T, R, and E. How many different arrangements of three letters can she make from these letters?
c. How many of the three-letter arrangements are words? List them.
32. PAGEANTS The Teen Miss USA pageant has 51 contestants. The judges choose Teen Miss USA and four runners-up.
a. Does the selection involve a permutation or a combination? Explain.
b. In how many ways can the judges choose Teen Miss USA and four runners-up?
33. BASKETBALL The coach had to select 5 out of 12 players on the team to start the game. How many different groups of players could be selected as starters?
34. LOCKER Christopher cannot remember the order of his locker combination. He only remembers that it contains the numbers 5, 16, and 31. What is the maximum number of attempts Christopher could make in order to open his locker?
H.O.T. Problems Use Higher-Order Thinking Skills
35. FIND THE ERROR Sydney and Ming want to form a 4-person committee to be in charge of decorations for the dance. They are determining how many committees are possible if 10 people are available. Is either of them correct?
Sydney
P(10, 4) = 10! _
(10 - 4)!
= 5040
Ming
C(10, 4) = 10! _ (10 - 4)!4!
= 210
36. CHALLENGE Seven identical mathematics books and 4 identical science books are to be stored on one shelf. In how many different ways can the 11 books be arranged?
37. WHICH ONE DOESN’T BELONG? Determine which situation does not belong. Explain.
choosing 5 players on a quiz team choosing 10 colored marbles from a bag
choosing 4 horses from 6 to run race ranking students in a senior class
38. REASONING Determine whether the statement P(n, r) = C(n, r) is sometimes, always, or never true. Explain your reasoning.
39. WRITING IN MATH Write a situation in which order is not important and 3 of the 8 objects are being selected.
A recent study found that schools with higher levels of student participation in the fine arts receive higher academic ratings and have lower dropout rates.Source: The National Association for Music Education

40. A gardener want to plant 3 different types of flowers along a path. If she is choosing from 8 different types of flowers, how many ways can the 3 flowers be planted?
A 342 B 338 C 336 D 328
41. If Jack can tie 21 knots in 15 minutes, how many can he tie in 25 minutes if he continues at the same pace?
F 18 H 36 G 35 J 37
42. Shante has 30 coins, quarters and dimes, that total $5.70. How many quarters does she have?
A 12 C 18
B 15 D 20
43. SHORT RESPONSE There are 3 red candies in a bag of 20 candies. If you draw one without looking, what is the probability of drawing a red candy?
Standardized Test Practice
Spiral Review
Find the mean, variance, and standard deviation of each set of data. (Lesson 12-3)
44. {76, 47, 59, 47, 72, 89} 45. {20, 30, 10, 40, 20, 12, 50}
46. {44, 34, 64, 74, 94, 104, 55} 47. {1, 5, 9, 4, 2, 4, 8, 4, 2, 1}
48. SURVEY A soda manufacturing company surveyed customers to find the number of cans of soda they drank in a week. They received the following responses: {14, 7, 3, 0, 10, 12, 10}. Which measure of central tendency best represents the data? Justify your answer. Then find the measure. (Lesson 12-2)
49. PET CARE Kendra takes care of pets while their owners are out of town. One week she has three dogs that all eat the same kind of dog food. The first dog eats a bag of food every 12 days, the second dog eats a bag every 15 days, and the third dog eats a bag every 16 days. How many same-sized bags of food should Kendra buy for one week? (Lesson 11-6)
Find each product. (Lesson 11-4)
50. 8 _
x 2 · x 4
_ 4x
51. 10 r 3 _
6 n 3 · 42 n 2
_
35 r 3 52.
10 y 3 z 2 _
6w x 3 · 12 w 2 x 2
_ 25 y 2 z 4
53. (n - 1)(n + 1)
__
(n + 1) ·
(n - 4) __
(n - 1)(n + 4) 54.
(x - 8) __
(x + 8)(x - 3) ·
(x + 4)(x - 3) __
(x - 8) 55.
3 a 2 b _
2gh ·
24 g 2 h _
15a b 2
56. COOKING The formula t = 40(25 + 1.85a)
__
50 - 1.85a relates the time t in minutes that it takes to
cook an average-size potato in an oven at an altitude of a in thousands of feet. (Lesson 11-3)
a. What is the value of a for an altitude of 4500 feet?
b. Calculate the time it takes to cook a potato at an altitude of 3500 feet and at 7000 feet. How do your cooking times compare at these two altitudes?
Skills Review
Ten red tiles, 12 blue tiles, 8 green tiles, 4 yellow tiles, and 12 black tiles are placed in a bag and selected at random. Find each probability. (Lesson 0-11)
57. P(blue) 58. P(red) 59. P(black or yellow)
60. P(green or red) 61. P(not blue) 62. P(not green)
KCCT PRACTICE MA-HS-4.4.2
770 Chapter 12 Statistics and Probability
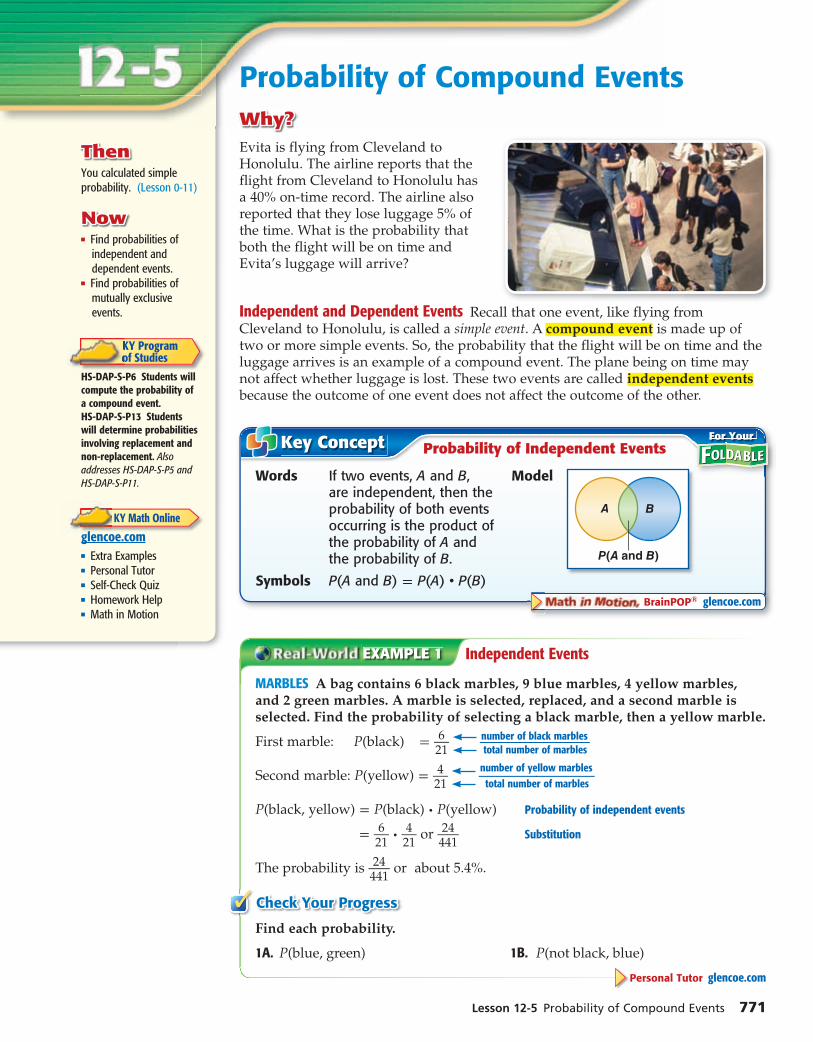
ThenThenYou calculated simple probability. (Lesson 0-11)
NowNow Find probabilities of
independent and dependent events.
Find probabilities of mutually exclusive events.
KY Programof Studies
HS-DAP-S-P6 Students will compute the probability of a compound event.HS-DAP-S-P13 Students will determine probabilities involving replacement and non-replacement. Also addresses HS-DAP-S-P5 and HS-DAP-S-P11.
KY Math Online
glencoe.com Extra Examples Personal Tutor Self-Check Quiz Homework Help Math in Motion
Lesson 12-5 Probability of Compound Events 771
Probability of Compound EventsWhy?Why?
Evita is flying from Cleveland to Honolulu. The airline reports that the flight from Cleveland to Honolulu has a 40% on-time record. The airline also reported that they lose luggage 5% of the time. What is the probability that both the flight will be on time and Evita’s luggage will arrive?
Independent and Dependent Events Recall that one event, like flying from Cleveland to Honolulu, is called a simple event. A compound event is made up of two or more simple events. So, the probability that the flight will be on time and the luggage arrives is an example of a compound event. The plane being on time may not affect whether luggage is lost. These two events are called independent events because the outcome of one event does not affect the outcome of the other.
Words If two events, A and B, are independent, then the probability of both events occurring is the product of the probability of A and the probability of B.
Symbols P(A and B) = P(A) • P(B)
Model
Key Concept Probability of Independent EventsFor Your
BrainPOP® glencoe.com
EXAMPLE 1 Independent Events
MARBLES A bag contains 6 black marbles, 9 blue marbles, 4 yellow marbles, and 2 green marbles. A marble is selected, replaced, and a second marble is selected. Find the probability of selecting a black marble, then a yellow marble.
First marble: P(black) = 6 _ 21
number of black marbles __ total number of marbles
Second marble: P(yellow) = 4 _ 21
number of yellow marbles
__ total number of marbles
P(black, yellow) = P(black) · P(yellow) Probability of independent events
= 6 _ 21
· 4 _ 21
or 24 _
441 Substitution
The probability is 24 _
441 or about 5.4%.
Check Your Progress✓Find each probability.
1A. P(blue, green) 1B. P(not black, blue)
Personal Tutor glencoe.com
C12-17P-888480:Person getting
luggage at baggage carousel
772 Chapter 12 Statistics and Probability
When the outcome of one event affects the outcome of another event, they are dependent events. In Example 1, if the marble was not placed back in the bag, then drawing the two marbles would have been dependent events. The probability of drawing the second marble depends on what marble was drawn first.
Key Concept
Words If two events, A and B, are dependent, then the probability of both events occurring is the product of the probability of A and the probability of B after A occurs.
Symbols P(A and B) = P(A) • P(B following A)
Probability of Dependent EventsFor Your
Recall that the complement of a set is the set of all objects that do not belong to the given set. In a standard deck of cards, the complement of drawing a heart is
drawing a diamond, club, or spade. So, the probability of drawing a heart is 13 _
52 , and
the probability of not drawing a heart is 52 - 13 _
52 or 39
_ 52
.
Notice that the sum of these probabilities is 1. This is true for any two complementary events.
EXAMPLE 2 Dependent Events
CARDS Cynthia randomly draws three cards from a standard deck one at a time without replacement. Find the probability that the cards are drawn in the given order.
a. P(diamond, spade, diamond)
First card: P(diamond) = 13
_ 52
or 1 _
4 number of diamonds __
total number of cards
Second card: P(spade) = 13
_ 51
number of spades
__ number of cards remaining
Third card: P(diamond) = 12
_ 50
or 6 _
25
number of diamonds remaining ___
number of cards remaining
P(diamond, spade, diamond) = P(diamond) · P(spade) · P(diamond)
= 1 _ 4 · 13
_ 51
· 6 _ 25
or 13 _
850 Substitution
The probability is 13 _
850 or about 1.5%.
b. P(four, four, not a jack)
After Cynthia draws the first two fours from the deck of 52 cards, there are 50 cards left. Since neither of these cards are jacks, there are still four jacks left in the deck. So, there are 52 - 2 - 4 or 46 cards that are not jacks.
P(four, four, not a jack) = P(four) · P(four) · P(not a jack)
= 4 _ 52
· 3 _ 51
· 46 _
50
= 552 _
132,600 or 23
_ 5525
The probability is 23 _
5525 or about 0.4%.
Find each probability.Check Your Progress✓ 2A. P(two, five, not a five) 2B. P(heart, not a heart, heart)
Personal Tutor glencoe.com
Problem-Solving Tip
Act It Out Acting out the situation can help you understand what the question is asking. Use a deck of cards to represent the situation described in the problem.
A standard deck of cards consists of 52 cards. There are 4 suits: hearts, diamonds, clubs, and spades. There are 13 cards of each suit. An ace, 2, 3, 4, 5, 6, 7, 8, 9, 10, jack, queen, and king. The hearts and diamonds are red while the clubs and spades are black.
Lesson 12-5 Probability of Compound Events 773
Mutually Exclusive Events Events that cannot occur at the same time are called mutually exclusive events. Suppose you wanted to find the probability of drawing a heart or a diamond. Since a card cannot be both a heart and a diamond, the events are mutually exclusive.
Words If two events, A and B, are mutually exclusive, then the probability that either A or B occurs is the sum of their probabilities.
Symbols P(A or B) = P(A) + P(B)
Model
Key Concept Mutually Exclusive EventsFor Your
EXAMPLE 3 Mutually Exclusive Events
A die is being rolled. Find each probability.
a. P(3 or 5) Since a die cannot show both a 3 and a 5 at the same time, these events are
mutually exclusive.
P(rolling a 3) = 1 _ 6 number of sides with a 3 __
total number of sides
P(rolling a 5) = 1 _ 6 number of sides with a 5 __
total number of sides
P(3 or 5) = P(rolling a 3) + P(rolling a 5) Probability of mutually exclusive events
= 1 _ 6 + 1 _
6 Substitution
= 2 _ 6 or 1 _
3 Add.
The probability of rolling a 3 or a 5 is 1 _ 3 or about 33%.
b. P(at least 4) Rolling at least a 4 means you can roll either a 4, 5, or a 6. So, you need to find
the probability of rolling a 4, 5, or a 6.
P(rolling a 4) = 1 _ 6 number of sides with a 4 __
total number of sides
P(rolling a 5) = 1 _ 6 number of sides with a 5 __
total number of sides
P(rolling a 6) = 1 _ 6 number of sides with a 6 __
total number of sides
P(at least 4) = P(rolling a 4) + P(rolling a 5) + P(rolling a 6) Mutually exclusive events
= 1 _ 6 + 1 _
6 + 1 _
6 Substitution
= 3 _ 6 or 1 _
2 Add.
The probability of rolling at least a 4 is 1 _ 2 or about 50%.
Check Your Progress✓ 3A. P(less than 3) 3B. P(even)
Personal Tutor glencoe.com
Study Tip
Alternative Method In Example 3a, you could have placed the number of possible outcomes over the total number of outcomes.1 + 1
_ 6 = 2 _ 6 or 1 _ 3
Study Tip
and and or While probabilities involving and deal with independent and dependent events, probabilities involving or deal with mutually exclusive and non-mutually exclusive events.
774 Chapter 12 Statistics and Probability
Suppose you want to find the probability of randomly drawing a 2 or a diamond from a standard deck of cards. Since it is possible to draw a card that is both a 2 and a diamond, these events are not mutually exclusive.
P(2) P(diamond) P(2, diamond)
4 _ 52
13 _
52 1 _
52
In the first two fractions above, the probability of drawing the two of diamonds is counted twice, once for a two and once for a diamond. To find the correct probability, subtract P(2 of diamonds) from the sum of the first two probabilities.
P(2 or a diamond) = P(2) + P(diamond) - P(2 of diamonds)
= 4 _ 52
+ 13 _
52 - 1 _
52
= 16 _
52 or 4 _
13 The probability is 4 _
13 or about 31%.
Words If two events, A and B, are not mutually exclusive, then the probability that either A or B occurs is the sum of their probabilities decreased by the probability of both occurring.
Model
Key Concept Events that are Not Mutually Exclusive
Symbols P(A or B) = P(A) + P(B) - P(A and B)
For Your
EXAMPLE 4 Events that are Not Mutually Exclusive
STUDENT ATHLETES Of 240 girls, 176 are on the Honor Roll, 48 play sports, and 36 are on the Honor Roll and play sports. What is the probability that a randomly selected student plays sports or is on the Honor Roll?
Since some students play varsity sports and are on the Honor Roll, the events are not mutually exclusive.
P(sports) = 48_240
P(Honor Roll) = 176_240
P(sports and Honor Roll) = 36_240
P(sports or Honor Roll) = P(sports) + P(HR) - P(sports and HR)
=
48_240
+
176_240
-
36_240
Substitution
= 188 _
240 or 47
_ 60
Simplify.
The probability is 47_60
or about 78%.
Check Your Progress✓ 4. PETS Out of 5200 households surveyed, 2107 had a dog, 807 had a cat, and 303
had both a dog and a cat. What is the probability that a randomly selected household has a dog or a cat?
Personal Tutor glencoe.com
Reading Math
A or B Unlike everyday language, the expression A or B allows the possibility of both A and B occurring.
Watch Out!
Intersection of Events When determining the probability of events that are not mutually exclusive, you may count the intersection of the events twice since it occurs in both events. It only actually occurs once.
DiamondsTwos
Lesson 12-5 Probability of Compound Events 775
✓ Check Your Understanding
Determine whether the events are independent or dependent. Then find the probability.
Examples 1 and 2pp. 771–772
1. BABYSITTING A toy bin contains 12 toys, 8 stuffed animals, and 3 board games. Marsha randomly chooses 2 toys for the child she is babysitting to play with. What is the probability that she chose 2 stuffed animals as the first two choices?
2. FRUIT A fruit basket contains 6 apples, 5 bananas, 4 oranges, and 5 peaches. Drew randomly chooses one piece of fruit, eats it, and chooses another piece of fruit. What is the probability that he chose a banana and then an apple?
3. MONEY Nakos has 4 quarters, 3 dimes, and 2 nickels in his pocket. Nakos randomly picks two coins out of his pocket. What is the probability Nakos did not choose a dime either time, if he replaced the first coin back in his pocket before choosing a second coin?
4. BOOKS Joanna needs a book to prop up a table leg. She randomly selects a book, puts it back
SCIENCE
HISTO
RYHISTO
RYM
ath
Mat
hM
ath
SCIENCE
SCIENCE
HISTO
RYHISTO
RYHISTO
RYM
ath
Mat
hM
ath
Mat
hM
ath
SCIENCE
on the shelf, and selects another book. What is the probability that Joanna selected two math books?
A card is drawn from a standard deck of playing cards. Determine whether the events are mutually exclusive or not mutually exclusive. Then find the probability.
Examples 3 and 4pp. 773–774
5. P(two or queen) 6. P(diamond or heart)
7. P(seven or club) 8. P(spade or ace)
Practice and Problem Solving = Step-by-Step Solutions begin on page R12.
Extra Practice begins on page 815.
Determine whether the events are independent or dependent. Then find the probability.
9. COINS If a coin is tossed 4 times, what is the probability of getting tails all 4 times?
10. DICE A die is rolled twice. What is the probability of rolling two different numbers?
Examples 1 and 2pp. 771–772
1111 CANDY A box of chocolates contains 10 milk chocolates, 8 dark chocolates, and 6 white chocolates. Sung randomly chooses a chocolate, eats it, and then randomly chooses another chocolate. What is the probability that Sung chose a milk chocolate and then a white chocolate?
12. DICE A die is rolled twice. What is the probability of rolling two of the same numbers?
13. PETS Chuck and Rashid went to a pet store to buy dog food. They chose from 10 brands of dry food, 6 brands of canned food, and 3 brands of pet snacks. What is the probability that Chuck and Rashid both chose dry food, if Chuck randomly chose first and liked the first brand he picked up?
14. CARS A rental agency has 12 white sedans, 8 gray sedans, 6 red sedans, and 3 green sedans for rent. Mr. Escobar rents a sedan, returns it because the radio is broken, and gets another sedan. What is the probability that Mr. Escobar was given a green sedan and then a gray sedan?
About 65% of pet owners acquire their pets free or at low cost. Source: National Council or Pet Population Study and Policy
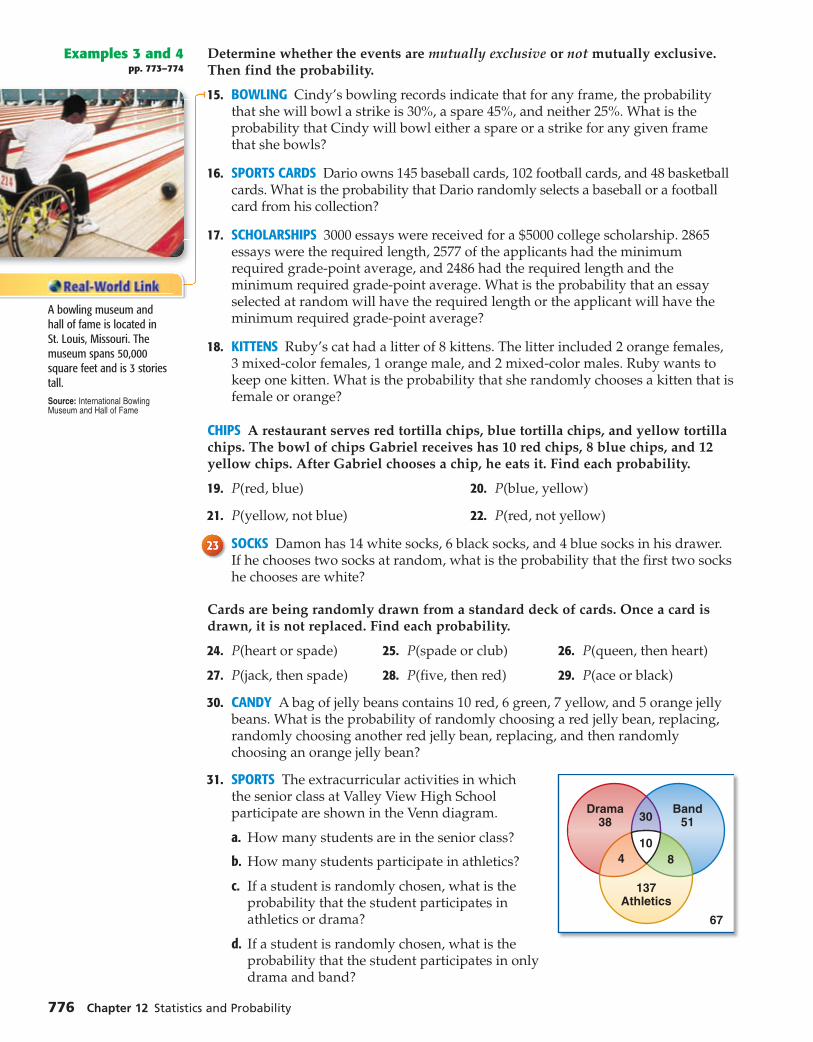
776 Chapter 12 Statistics and Probability
Determine whether the events are mutually exclusive or not mutually exclusive. Then find the probability.
Examples 3 and 4pp. 773–774
15. BOWLING Cindy’s bowling records indicate that for any frame, the probability that she will bowl a strike is 30%, a spare 45%, and neither 25%. What is the probability that Cindy will bowl either a spare or a strike for any given frame that she bowls?
16. SPORTS CARDS Dario owns 145 baseball cards, 102 football cards, and 48 basketball cards. What is the probability that Dario randomly selects a baseball or a football card from his collection?
17. SCHOLARSHIPS 3000 essays were received for a $5000 college scholarship. 2865 essays were the required length, 2577 of the applicants had the minimum required grade-point average, and 2486 had the required length and the minimum required grade-point average. What is the probability that an essay selected at random will have the required length or the applicant will have the minimum required grade-point average?
18. KITTENS Ruby’s cat had a litter of 8 kittens. The litter included 2 orange females, 3 mixed-color females, 1 orange male, and 2 mixed-color males. Ruby wants to keep one kitten. What is the probability that she randomly chooses a kitten that is female or orange?
CHIPS A restaurant serves red tortilla chips, blue tortilla chips, and yellow tortilla chips. The bowl of chips Gabriel receives has 10 red chips, 8 blue chips, and 12 yellow chips. After Gabriel chooses a chip, he eats it. Find each probability.
19. P(red, blue) 20. P(blue, yellow)
21. P(yellow, not blue) 22. P(red, not yellow)
2323 SOCKS Damon has 14 white socks, 6 black socks, and 4 blue socks in his drawer. If he chooses two socks at random, what is the probability that the first two socks he chooses are white?
Cards are being randomly drawn from a standard deck of cards. Once a card is drawn, it is not replaced. Find each probability.
24. P(heart or spade) 25. P(spade or club) 26. P(queen, then heart)
27. P(jack, then spade) 28. P(five, then red) 29. P(ace or black)
30. CANDY A bag of jelly beans contains 10 red, 6 green, 7 yellow, and 5 orange jelly beans. What is the probability of randomly choosing a red jelly bean, replacing, randomly choosing another red jelly bean, replacing, and then randomly choosing an orange jelly bean?
31. SPORTS The extracurricular activities in which the senior class at Valley View High School participate are shown in the Venn diagram.
a. How many students are in the senior class?
b. How many students participate in athletics?
c. If a student is randomly chosen, what is the probability that the student participates in athletics or drama?
d. If a student is randomly chosen, what is the probability that the student participates in only drama and band?
A bowling museum and hall of fame is located in St. Louis, Missouri. The museum spans 50,000 square feet and is 3 stories tall.Source: International Bowling Museum and Hall of Fame

Lesson 12-5 Probability of Compound Events 777
32. TILES Kirsten and José are playing a game. Kirsten places tiles numbered 1 to 50 in a bag. José selects a tile at random. If he selects a prime number or a number greater than 40, then he wins the game. What is the probability that José will on his first turn?
3333 MULTIPLE REPRESENTATIONS In this problem, you will explore conditional probability. Conditional probability is the probability that event B occurs given that event A has already occurred. It is calculated by dividing the probability of the occurrence of both events by the probability of the occurrence of the first event. The notation for conditional probability is P(B|A).
a. GRAPHICAL Draw a Venn diagram to illustrate P(A and B).
b. VERBAL Write the formula for P(B|A) given the Venn diagram.
c. ANALYTICAL A jar contains 12 marbles, of which 8 marbles are red and 4 marbles are green. If marbles are chosen without replacement, find P(red) and P(red, green).
d. ANALYTICAL Using the probabilities from part c and the Venn diagram in part a, determine the probability of choosing a green marble on the second selection, given that the first marble selected was red.
e. ANALYTICAL Write a formula for finding a conditional probability.
f. ANALYTICAL Use the definition from part e to answer the following: At a basketball game, 80% of the fans cheered for the home team. In the same crowd, 20% of the fans were waving banners and cheering for the home team. What is the probability that a fan waved a banner given that the fan cheered for the home team?
H.O.T. Problems Use Higher-Order Thinking Skills
34. FIND THE ERROR George and Aliyah are determining the probability of randomly choosing a blue or red marble from a bag of 8 blue marbles, 6 red marbles, 8 yellow marbles, and 4 white marbles. Is either of them correct? Explain.
George
P(blue or red) = P(blue) · P(red)
= 8 _ 26
· 6 _ 26
= 48 _
676
about 7%
Aliyah P(blue or red) = P(blue) + P(red)
= 8 _ 26
+ 6 _ 26
= 14 _
26
about 54%
35. CHALLENGE In some cases, if one bulb in a string of holiday lights fails to work, the whole string will not light. If each bulb in a set has a 99.5% chance of working, what is the maximum number of lights that can be strung together with at least a 90% chance that the whole string will light?
36. REASONING Suppose there are three events A, B, and C that are not mutually exclusive. List all of the probabilities you would need to consider in order to calculate P(A or B or C). Then write the formula you would use to calculate the probability.
37. OPEN ENDED Describe a situation in your life that involves dependent and independent events. Explain why the events are dependent or independent.
38. WRITING IN MATH Explain why the subtraction occurs when finding the probability of two events that are not mutually exclusive.
Reading Math
Conditional Probability P(B| A) is read the probability of B, given A.

39. In how many ways can a committee of 4 be selected from a group of 12 people?
A 48
B 483
C 495
D 11,880
40. A total of 925 tickets were sold for $5925. If adult tickets cost $7.50 and children's tickets cost $3.00, how many adult tickets were sold?
F 700 H 325
G 600 J 225
41. SHORT RESPONSE A circular swimming pool with a diameter of 28 feet has a deck of uniform width built around it. If the area of the deck is 60π square feet, find its width.
42. The probability of heads landing up when
you flip a coin is 1 _ 2 . What is the probability of
getting tails if you flip it again?
A 1 _ 4 C 1 _
2
B 1 _ 3 D 3 _
4
Standardized Test Practice
Spiral Review
43. SHOPPING The Millers have twelve grandchildren, 5 boys and 7 girls.For their anniversary, the grandchildren decided to pool their money and have three of them shop for the entire group. (Lesson 12-4)
a. Does this situation represent a combination or permutation?
b. How many ways are there to choose the three?
c. What is the probability that all three will be girls?
44. ECOLOGY A group of 1000 randomly selected teens were asked if they Teen Ecology Survey ResultsResponse Number
Yes, strongly agree 312
Yes, mildly agree 340
No, I don’t think so 109
No, absolutely not 116
Not sure 123
believed there was global warming. The results are shown in the table. Find the mean absolute deviation. (Lesson 12-3)
Solve each equation. State any extraneous solutions. (Lesson 11-8)
45. 4 _ a = 3
_ a - 2
46. 3 _ x = 1
_ x - 2
47. x _
x + 1 = x - 6
_ x - 1
48. 2n _ 3 + 1 _
2 = 2n - 3
_ 6
49. COOKING Hannah was making candy using a two-quart pan. As she stirred the
mixture, she noticed that the pan was about 2 _ 3 full. If each piece of candy has a
volume of about 3 _ 4 ounce, approximately how many pieces of candy will Hannah
make? (Hint: There are 32 ounces in a quart.) (Lesson 11-3)
50. GEOMETRY A rectangle has a width of 3 √ � 5 centimeters and a length of 4 √ � 10 centimeters. Find the area of the rectangle. Write as a simplified radical expression. (Lesson 10-2)
Skills Review
Solve each equation. Check your solution. (Lesson 10-4)
51. √ �� -3a = 6 52. √ � a = 100 53. √ �� -k = 4
54. 5 √ � 2 = √ � x 55. 3 √ � 7 = √ �� -y 56. 3 √ � 4a - 2 = 10
KCCT PRACTICE MA-HS-4.4.1
778 Chapter 12 Statistics and Probability

ThenThenYou found probabilities with permutations and combinations. (Lesson 12-4)
NowNow Find probabilities by
using random variables. Solve real-world
problems using distributions.
KY Programof Studies
HS-DAP-S-P4 Students will compute and interpret the expected value of random variables in simple cases.HS-DAP-S-P15 Students will represent probabilities in multiple ways. Also addresses HS-DAP-S-CDS2.
New VocabularyNew Vocabularyrandom variabledis crete random variableprobability distributionprobability histogram
KY Math Online
glencoe.com Extra Examples Personal Tutor Self-Check Quiz Homework Help
Lesson 12-6 Probability Distributions 779
Probability DistributionsWhy?Why?
A gaming software company with five online games on the market is interested in how many games their customers play. They surveyed 1000 randomly chosen customers. The results of the survey are shown in the frequency table.
Random Variables and Probability A variable with a value that is the numerical outcome of a random event is called a random variable. A random variable with a finite number of possibilities is a discrete random variable. We can let the random variable G represent the number of different games. So, G can equal 1, 2, 3, 4, or 5.
EXAMPLE 1 Random Variables
A graduation supply company offers 5 items that can be purchased for graduation: a diploma frame, graduation picture, cap and gown, senior key ring, and class pin. The school takes a poll of the seniors to see how many of these items each senior is buying. The results are shown in the table.
a. Find the probability that a randomly chosen senior is buying exactly 3 items.
Let X represent the number of items being purchased. There is only one outcome in which 3 items are being purchased, and there are 625 seniors.
P(X = 3) = 3 items being purchased
__
seniors surveyed P(X = n) is the probability of X occurring n times.
= 115 _
625 or 23
_
125
The probability is 23 _
125 or 18.4%
b. Find the probability that a randomly chosen senior buys at least 4 items.
There 145 + 97 or 242 seniors who are purchasing at least 4 items.
P(X ≥ 4) = 242 _
625
The probability is 242 _
625 or about 38.7%.
Check Your Progress✓GRADES After an algebra test, there are 7 students with As, 9 students with Bs, 11 students with Cs, 3 students with Ds, and 2 students with Fs.
1A. Find the probability that a randomly chosen student has a C.
1B. Find the probability that a randomly chosen student has at least a B.
Personal Tutor glencoe.com
Number of Items Being Purchased
Number of Seniors
0 12
1 122
2 134
3 115
4 145
5 97
Number ofComputer Games
Number of Customers
1 130
2 110
3 150
4 500
5 110
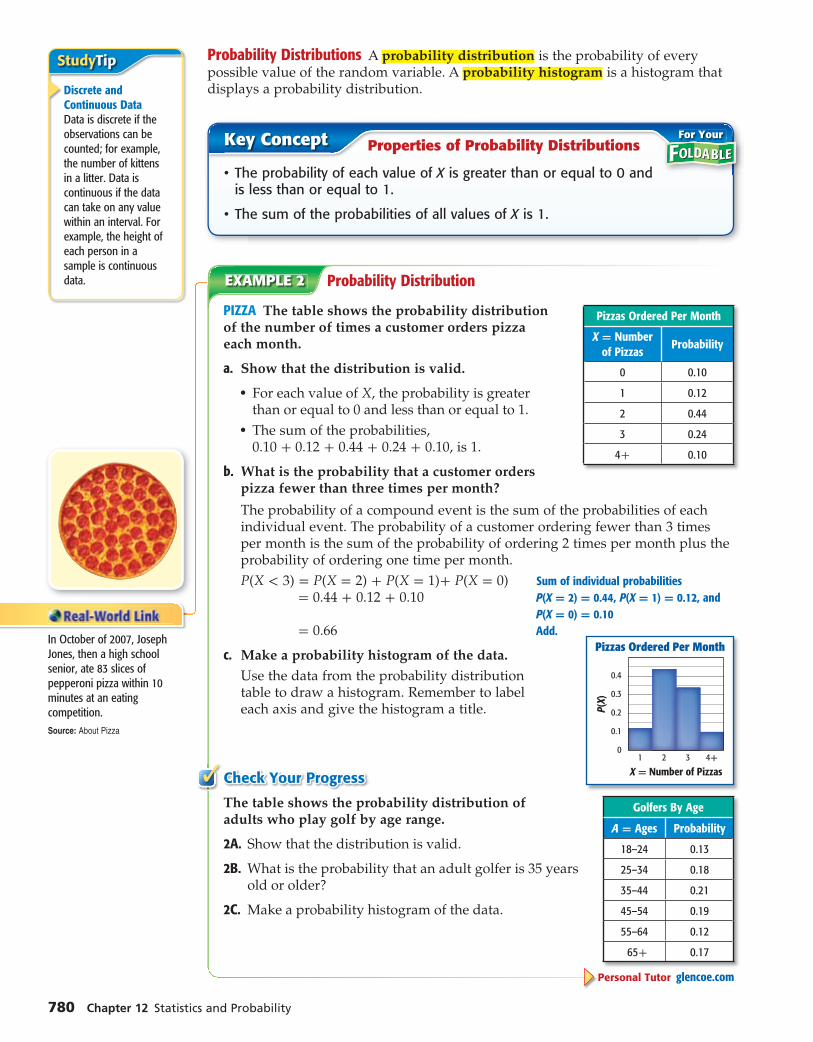
780 Chapter 12 Statistics and Probability
Probability Distributions A probability distribution is the probability of every possible value of the random variable. A probability histogram is a histogram that displays a probability distribution.
Key Concept Properties of Probability Distributions
• The probability of each value of X is greater than or equal to 0 and is less than or equal to 1.
• The sum of the probabilities of all values of X is 1.
For Your
EXAMPLE 2 Probability Distribution
PIZZA The table shows the probability distribution of the number of times a customer orders pizza each month.
a. Show that the distribution is valid.
• For each value of X, the probability is greater than or equal to 0 and less than or equal to 1.
• The sum of the probabilities, 0.10 + 0.12 + 0.44 + 0.24 + 0.10, is 1.
b. What is the probability that a customer orders pizza fewer than three times per month?
The probability of a compound event is the sum of the probabilities of each individual event. The probability of a customer ordering fewer than 3 times per month is the sum of the probability of ordering 2 times per month plus the probability of ordering one time per month.
P(X < 3) = P(X = 2) + P(X = 1)+ P(X = 0) Sum of individual probabilities = 0.44 + 0.12 + 0.10 P(X = 2) = 0.44, P(X = 1) = 0.12, and
P(X = 0) = 0.10 = 0.66 Add.
c. Make a probability histogram of the data.
Use the data from the probability distribution 0.4
0.3
0.2
0.1
0
Pizzas Ordered Per Month
P(X)
X = Number of Pizzas1 2 3 4+
table to draw a histogram. Remember to label each axis and give the histogram a title.
Check Your Progress✓The table shows the probability distribution of Golfers By Age
A = Ages Probability
18–24 0.13
25–34 0.18
35–44 0.21
45–54 0.19
55–64 0.12
65+ 0.17
adults who play golf by age range.
2A. Show that the distribution is valid.
2B. What is the probability that an adult golfer is 35 years old or older?
2C. Make a probability histogram of the data.
Personal Tutor glencoe.com
Pizzas Ordered Per Month
X = Number of Pizzas
Probability
0 0.10
1 0.12
2 0.44
3 0.24
4+ 0.10
In October of 2007, Joseph Jones, then a high school senior, ate 83 slices of pepperoni pizza within 10 minutes at an eating competition. Source: About Pizza
Study Tip
Discrete and Continuous Data Data is discrete if the observations can be counted; for example, the number of kittens in a litter. Data is continuous if the data can take on any value within an interval. For example, the height of each person in a sample is continuous data.
Lesson 12-6 Probability Distributions 781
✓ Check Your Understanding
Example 1p. 779
1. GPS A car dealership surveys 10,000 of its customers who have a GPS system in their vehicles to ask how often they have used the system within the past year. The results are shown in the table.
a. Find the probability that a randomly chosen customer will have used the GPS system more than 20 times.
b. Find the probability that a randomly chosen customer will have used the GPS system no more than 10 times.
2. JEANS A fashion boutique ordered jeans with different numbers of stripes down the outside seams. The table shows the probability distribution of the number of each type of jean that was sold in a particular week.
a. Show that the distribution is valid.
b. What is the probability that a randomly chosen pair of jeans has fewer than 3 stripes?
c. Make a probability histogram of the data.
Example 2p. 780
3. HOME THEATER An electronics store sells individually the components and speakers for home theaters. The store surveyed its home theater customers to see how many of the 10 components they bought. The results are shown in the table.
a. Find the probability that a randomly chosen customer bought 5 or 6 components.
b. Find the probability that a randomly chosen customer bought fewer than 5 components.
Practice and Problem Solving = Step-by-Step Solutions begin on page R12.
Extra Practice begins on page 815.
Example 1p. 779
4. FOOD DRIVE Ms. Valdez’s biology class held a food drive. The class kept track of the types of food donated.
a. Find the probability that a randomly chosen product will be soup.
b. Find the probability that a randomly chosen product will be a boxed dinner or pasta.
55 SCHOOL SPIRIT The student council wants to organize a spirit club to cheer at school sporting events. They surveyed the student body, and asked students how many sporting events they typically attend each year.
Number of Sporting Events 0–5 6–10 11–15 16–20 21+
Number of Students 96 112 204 108 80
a. Find the probability a randomly chosen student attended at most 10 events.
b. Find the probability a randomly chosen student attended at least 16 events.
Customers Using the GPS System
Uses Customers
0 1382
1–5 2350
6–10 2010
11–15 1863
16–20 1925
21+ 470
Home Theater Components Purchased
Components Customers
0–2 26
3–4 42
5–6 33
7–8 24
9–10 40
Types of Jeans Sold
X = Number of Stripes
Probability
0 0.15
1 0.19
2 0.26
3 0.22
4 0.18
Food Drive Donations Count
Product Packages
boxed dinner 36
pasta 22
juice 12
soup 45
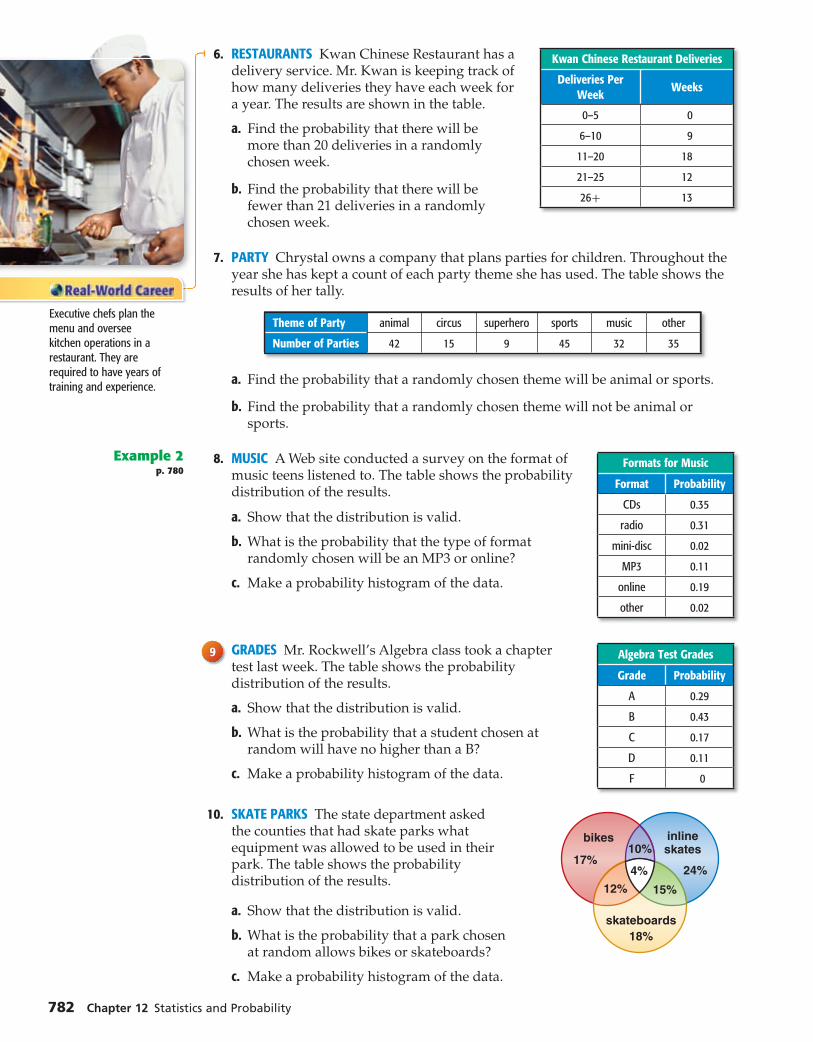
782 Chapter 12 Statistics and Probability
6. RESTAURANTS Kwan Chinese Restaurant has a delivery service. Mr. Kwan is keeping track of how many deliveries they have each week for a year. The results are shown in the table.
a. Find the probability that there will be more than 20 deliveries in a randomly chosen week.
b. Find the probability that there will be fewer than 21 deliveries in a randomly chosen week.
7. PARTY Chrystal owns a company that plans parties for children. Throughout the year she has kept a count of each party theme she has used. The table shows the results of her tally.
Theme of Party animal circus superhero sports music other
Number of Parties 42 15 9 45 32 35
a. Find the probability that a randomly chosen theme will be animal or sports.
b. Find the probability that a randomly chosen theme will not be animal or sports.
Example 2p. 780
8. MUSIC A Web site conducted a survey on the format of music teens listened to. The table shows the probability distribution of the results.
a. Show that the distribution is valid.
b. What is the probability that the type of format randomly chosen will be an MP3 or online?
c. Make a probability histogram of the data.
99 GRADES Mr. Rockwell’s Algebra class took a chapter test last week. The table shows the probability distribution of the results.
a. Show that the distribution is valid.
b. What is the probability that a student chosen at random will have no higher than a B?
c. Make a probability histogram of the data.
10. SKATE PARKS The state department asked the counties that had skate parks what equipment was allowed to be used in their park. The table shows the probability distribution of the results.
a. Show that the distribution is valid.
b. What is the probability that a park chosen at random allows bikes or skateboards?
c. Make a probability histogram of the data.
Formats for Music
Format Probability
CDs 0.35
radio 0.31
mini-disc 0.02
MP3 0.11
online 0.19
other 0.02
Algebra Test Grades
Grade Probability
A 0.29
B 0.43
C 0.17
D 0.11
F 0
Kwan Chinese Restaurant Deliveries
Deliveries Per Week
Weeks
0–5 0
6–10 9
11–20 18
21–25 12
26+ 13
Executive chefs plan the menu and oversee kitchen operations in a restaurant. They are required to have years of training and experience.
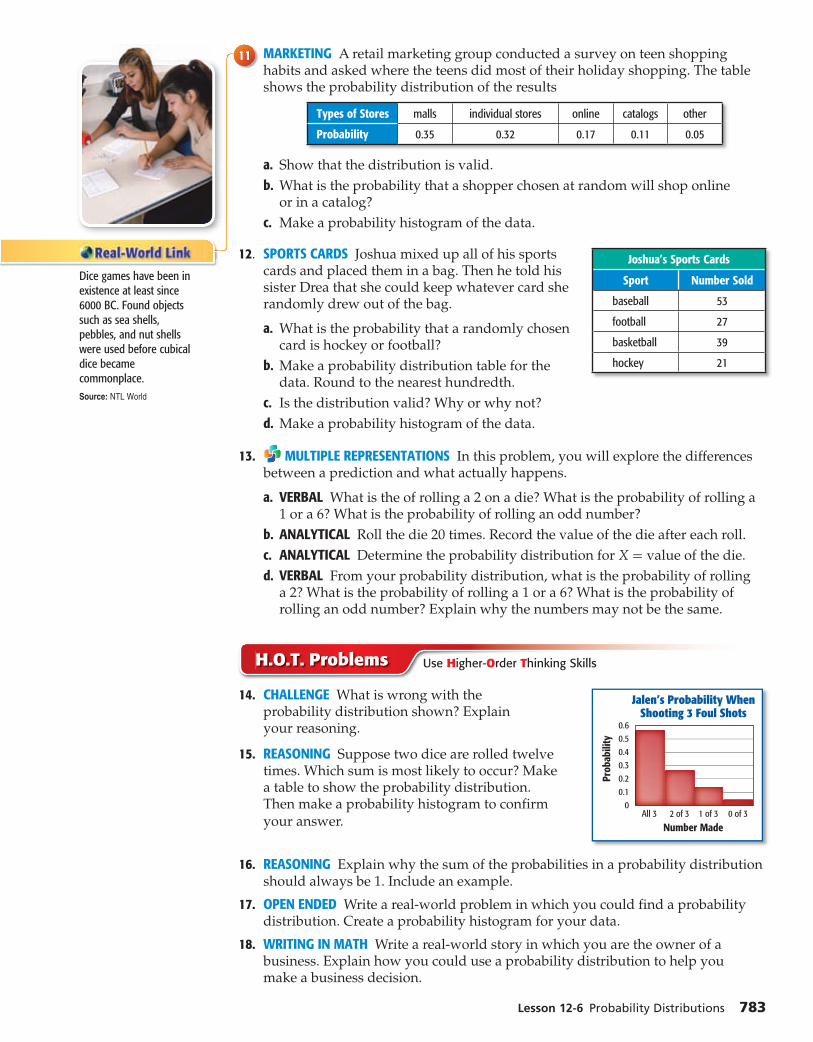
Lesson 12-6 Probability Distributions 783
1111 MARKETING A retail marketing group conducted a survey on teen shopping habits and asked where the teens did most of their holiday shopping. The table shows the probability distribution of the results
Types of Stores malls individual stores online catalogs other
Probability 0.35 0.32 0.17 0.11 0.05
a. Show that the distribution is valid.
b. What is the probability that a shopper chosen at random will shop online or in a catalog?
c. Make a probability histogram of the data.
12. SPORTS CARDS Joshua mixed up all of his sports cards and placed them in a bag. Then he told his sister Drea that she could keep whatever card she randomly drew out of the bag.
a. What is the probability that a randomly chosen card is hockey or football?
b. Make a probability distribution table for the data. Round to the nearest hundredth.
c. Is the distribution valid? Why or why not?
d. Make a probability histogram of the data.
13. MULTIPLE REPRESENTATIONS In this problem, you will explore the differences between a prediction and what actually happens.
a. VERBAL What is the of rolling a 2 on a die? What is the probability of rolling a 1 or a 6? What is the probability of rolling an odd number?
b. ANALYTICAL Roll the die 20 times. Record the value of the die after each roll.
c. ANALYTICAL Determine the probability distribution for X = value of the die.
d. VERBAL From your probability distribution, what is the probability of rolling a 2? What is the probability of rolling a 1 or a 6? What is the probability of rolling an odd number? Explain why the numbers may not be the same.
H.O.T. Problems Use Higher-Order Thinking Skills
14. CHALLENGE What is wrong with the
0.60.50.40.30.20.1
0
Number Made
Prob
abili
ty
Jalen’s Probability WhenShooting 3 Foul Shots
All 3 2 of 3 1 of 3 0 of 3
probability distribution shown? Explain your reasoning.
15. REASONING Suppose two dice are rolled twelve times. Which sum is most likely to occur? Make a table to show the probability distribution. Then make a probability histogram to confirm
your answer.
16. REASONING Explain why the sum of the probabilities in a probability distribution should always be 1. Include an example.
17. OPEN ENDED Write a real-world problem in which you could find a probability distribution. Create a probability histogram for your data.
18. WRITING IN MATH Write a real-world story in which you are the owner of a business. Explain how you could use a probability distribution to help you make a business decision.
Joshua’s Sports Cards
Sport Number Sold
baseball 53
football 27
basketball 39
hockey 21
Dice games have been in existence at least since 6000 BC. Found objects such as sea shells, pebbles, and nut shells were used before cubical dice became commonplace.Source: NTL World
19. A bucket contains 10 balls numbered 1, 1, 2, 3, 4, 4, 4, 5, 6, and 6. A ball is randomly chosen from the bucket. What is the probability of drawing a ball with a number greater than 6?
A 1 _
5 C 1
B 3 _
10 D 0
20. SHORT RESPONSE Mr. Bahn has $20,000 to invest. He invests part at 6% and the rest at 7%. He earns $1280 in interest within a year. How much did he invest at 7%?
21. Suppose there are 10 tickets in a box for a drawing numbered as follows: 1, 2, 2, 3, 4, 4, 6, 6, 9, and 9. A single ticket is randomly chosen from the box. What is the probability of drawing a ticket with a number less than 10?
F 1 _
5 H 1 G 3
_ 10
J 0
22. GEOMETRY The height of a triangle is 5 inches less than the length of its base. If the area of the triangle is 52 square inches, find the base and the height.
A 15 in., 9 in. C 13 in., 8 in.
B 11 in., 7 in. D 17 in., 11 in.
Standardized Test Practice
Spiral Review
23. PET TOYS A pet store has a bin of clearance items that contains 6 balls, 5 tug toys, 8 rawhide chews, and 4 chew toys, all in equal-sized boxes. If Johnda reaches in the box and pulls out two items, what is the probability that she will pull out a tug toy each time? (Lesson 12-5)
A die is rolled and a spinner is spun like the one shown. Find the probability. (Lesson 12-4)
24. P(3 and Y) 25. P(even and G)
26. P(prime number and R or B) 27. P(4 and not Y)
28. GAMES For a certain game, each player rolls four dice at the same time. (Lesson 12-3)
a. Do the outcomes of rolling the four dice represent a permutation or combination? Explain.
b. How many outcomes are possible? c. What is the probability that four dice show the same number on
a single roll?
Find each sum. (Lesson 11-6)
29. 4 _
a 2 + 6 _
a 30. 3
_ b 3
+ 7 _ b 2
31. 4 _
d + 6 + 5
_ d - 5
32. f _
f + 5 + 4
_ f - 4
33. 8h _ h + 6
+ h _ h - 3
34. 7k _
k - 3 + k _
k + 2
Skills Review
35. Write an expression to represent the probability of tossing a coin n times and getting n heads. Express as a power of 2. (Lesson 7-2)
36. Write an expression to represent the probability of rolling a die n times and getting 3 n times. Express as a power of 6. (Lesson 7-2)
37. Write an expression to represent the probability of rolling a die n times and get a prime number n times. Express as a power. (Lesson 7-2)
KCCT PRACTICE MA-HS-4.4.1
784 Chapter 12 Statistics and Probability
B Y
G R
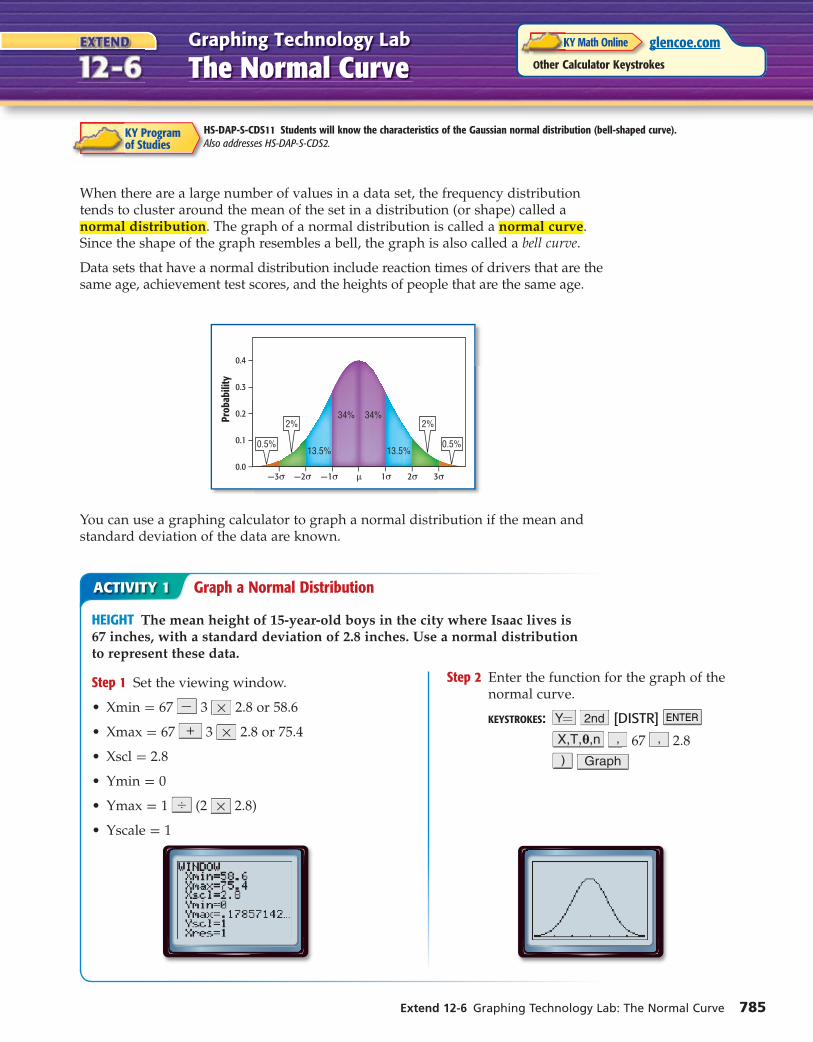
Extend 12-6 Graphing Technology Lab: The Normal Curve 785
When there are a large number of values in a data set, the frequency distribution tends to cluster around the mean of the set in a distribution (or shape) called a normal distribution. The graph of a normal distribution is called a normal curve. Since the shape of the graph resembles a bell, the graph is also called a bell curve.
Data sets that have a normal distribution include reaction times of drivers that are the same age, achievement test scores, and the heights of people that are the same age.
-3σ 3σ-2σ 2σ-1σ 1σμ
0.4
0.3
0.2
0.1
0.0
Prob
abili
ty
34%
13.5% 13.5%
34%
0.5% 0.5%
2% 2%
You can use a graphing calculator to graph a normal distribution if the mean and standard deviation of the data are known.
ACTIVITY 1 Graph a Normal Distribution
HEIGHT The mean height of 15-year-old boys in the city where Isaac lives is 67 inches, with a standard deviation of 2.8 inches. Use a normal distribution to represent these data.
Step 1 Set the viewing window.
• Xmin = 67 3 � 2.8 or 58.6
• Xmax = 67 3 � 2.8 or 75.4
• Xscl = 2.8
• Ymin = 0
• Ymax = 1 � (2 � 2.8)
• Yscale = 1
Step 2 Enter the function for the graph of the normal curve.
KEYSTROKES: [DISTR] ENTER θ 67 2.8
Graphing Technology Lab
The Normal Curveglencoe.com
Other Calculator Keystrokes
KY Math Online
KY Programof Studies
HS-DAP-S-CDS11 Students will know the characteristics of the Gaussian normal distribution (bell-shaped curve). Also addresses HS-DAP-S-CDS2.
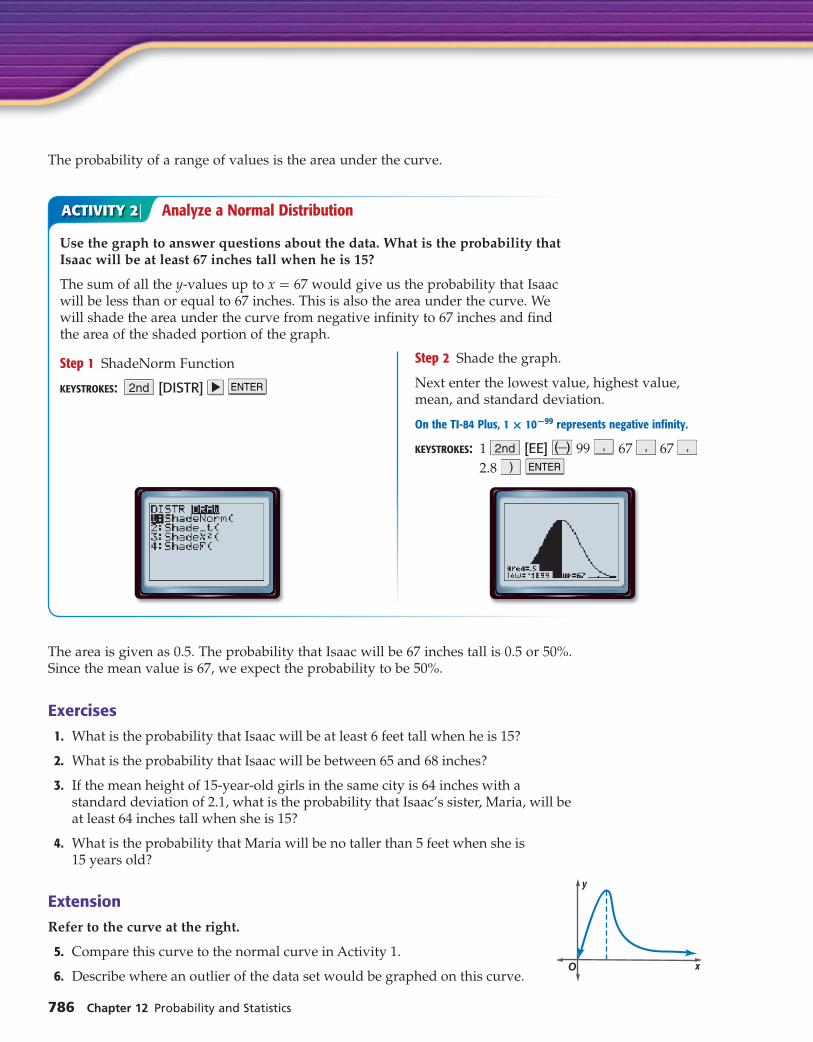
786 Chapter 12 Probability and Statistics
The probability of a range of values is the area under the curve.
ACTIVITY 2 Analyze a Normal Distribution
Use the graph to answer questions about the data. What is the probability that Isaac will be at least 67 inches tall when he is 15?
The sum of all the y-values up to x = 67 would give us the probability that Isaac will be less than or equal to 67 inches. This is also the area under the curve. We will shade the area under the curve from negative infinity to 67 inches and find the area of the shaded portion of the graph.
Step 1 ShadeNorm Function
KEYSTROKES: [DISTR] ENTER
Step 2 Shade the graph.
Next enter the lowest value, highest value, mean, and standard deviation.
On the TI-84 Plus, 1 × 10 -99 represents negative infinity.
KEYSTROKES: 1 [EE] ( ) 99 67 67
2.8 ENTER
The area is given as 0.5. The probability that Isaac will be 67 inches tall is 0.5 or 50%. Since the mean value is 67, we expect the probability to be 50%.
ExercisesExercises
1. What is the probability that Isaac will be at least 6 feet tall when he is 15?
2. What is the probability that Isaac will be between 65 and 68 inches?
3. If the mean height of 15-year-old girls in the same city is 64 inches with a standard deviation of 2.1, what is the probability that Isaac’s sister, Maria, will be at least 64 inches tall when she is 15?
4. What is the probability that Maria will be no taller than 5 feet when she is 15 years old?
ExtensionExtension
Refer to the curve at the right.
5. Compare this curve to the normal curve in Activity 1.
6. Describe where an outlier of the data set would be graphed on this curve.
y
x

ThenThenYou used probability distributions. (Lesson 12-6)
NowNow Design simulations to
estimate probabilities. Summarize data from
simulations.
KY Programof Studies
HS-DAP-S-P1 Students will design and conduct probability simulations and interpret the results.HS-DAP-S-P10 Students will determine and compare theoretical and experimental probabilities.Also addresses HS-DAP-S-ES3, HS-DAP-S-P3, and HS-DAP-S-P12.
New VocabularyNew Vocabularytheoretical probabilityex perimental probabilityrelative frequencyempirical studysimulationexpected value
KY Math Online
glencoe.com Extra Examples Personal Tutor Self-Check Quiz Homework Help
Lesson 12-7 Probability Simulations 787
Probability SimulationsWhy?Why?
Alexander plays on a high school soccer team. He has been practicing his goal kicks. He says he hopes to be able to make at least 63% of the goal kicks that he takes. To test this, he takes 50 goal kicks, of which he makes 33.
Theoretical and Experimental Probability So far, the probability used to describe events has been theoretical probability. Theoretical probability is determined mathematically and describes what should happen. In the situation above, the expected rate of 63% is a theoretical probability.
Another type of probability is experimental probability. Experimental probability is determined using data from tests or experiments. Experimental probability is the ratio of the number of times an outcome occurred to the total number of events or trials. This ratio is also known as the relative frequency.
experiment probability = frequency of an outcome
___ total number of trials
It is often useful to perform an empirical study. In this study, an experiment is performed repeatedly, data is collected and combined, and the results are analyzed.
EXAMPLE 1 Experimental Probability
SOCCER Refer to the information above.
a. What is the experimental probability that Alexander successfully makes his goal kicks?
experimental probability = 33 _
50
frequency of successes __
total number of free throw
The experimental probability of the test is 33 _
50 or 66%.
b. Alexander decides to kick 50 kicks two more times. He makes 29 of the first 50 kicks and 34 of the second 50. What is the experimental probability of all three tests?
experimental probability = 96 _
150 or 16
_ 25
The experimental probability of the three tests was 16 _
25 or 64%.
Check Your Progress✓ 1. GAMES Hakeem rolls a die 20 times. A 4 appears 5 times. What is the
experimental probability of rolling a 4?
Personal Tutor glencoe.com
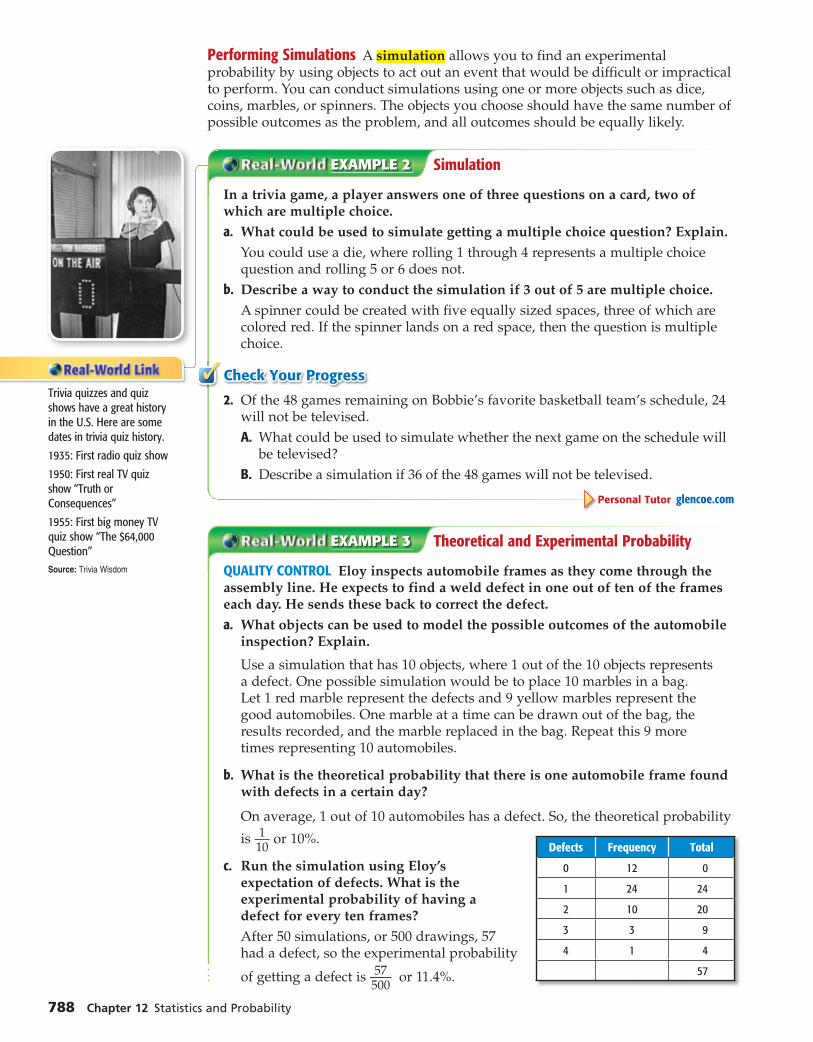
788 Chapter 12 Statistics and Probability
Performing Simulations A simulation allows you to find an experimental probability by using objects to act out an event that would be difficult or impractical to perform. You can conduct simulations using one or more objects such as dice, coins, marbles, or spinners. The objects you choose should have the same number of possible outcomes as the problem, and all outcomes should be equally likely.
EXAMPLE 2 Simulation
In a trivia game, a player answers one of three questions on a card, two of which are multiple choice.
a. What could be used to simulate getting a multiple choice question? Explain.
You could use a die, where rolling 1 through 4 represents a multiple choice question and rolling 5 or 6 does not.
b. Describe a way to conduct the simulation if 3 out of 5 are multiple choice.
A spinner could be created with five equally sized spaces, three of which are colored red. If the spinner lands on a red space, then the question is multiple choice.
Check Your Progress✓ 2. Of the 48 games remaining on Bobbie’s favorite basketball team’s schedule, 24
will not be televised.
A. What could be used to simulate whether the next game on the schedule will be televised?
B. Describe a simulation if 36 of the 48 games will not be televised.
Personal Tutor glencoe.com
EXAMPLE 3 Theoretical and Experimental Probability
QUALITY CONTROL Eloy inspects automobile frames as they come through the assembly line. He expects to find a weld defect in one out of ten of the frames each day. He sends these back to correct the defect.
a. What objects can be used to model the possible outcomes of the automobile inspection? Explain.
Use a simulation that has 10 objects, where 1 out of the 10 objects represents a defect. One possible simulation would be to place 10 marbles in a bag. Let 1 red marble represent the defects and 9 yellow marbles represent the good automobiles. One marble at a time can be drawn out of the bag, the results recorded, and the marble replaced in the bag. Repeat this 9 more times representing 10 automobiles.
b. What is the theoretical probability that there is one automobile frame found with defects in a certain day?
On average, 1 out of 10 automobiles has a defect. So, the theoretical probability
is 1 _ 10
or 10%.
c. Run the simulation using Eloy’s expectation of defects. What is the experimental probability of having a defect for every ten frames?
After 50 simulations, or 500 drawings, 57 had a defect, so the experimental probability
of getting a defect is 57 _
500 or 11.4%.
Trivia quizzes and quiz shows have a great history in the U.S. Here are some dates in trivia quiz history.
1935: First radio quiz show
1950: First real TV quiz show “Truth or Consequences”
1955: First big money TV quiz show “The $64,000 Question”Source: Trivia Wisdom
Defects Frequency Total
0 12 0
1 24 24
2 10 20
3 3 9
4 1 4
57
Lesson 12-7 Probability Simulations 789
d. How does the experimental probability compare to the theoretical probability of one defect found in a certain day?
The theoretical probability is 10%, and the experimental probability is 15%. They are relatively close. As the number of trials increased it would get closer to the theoretical probability.
Check Your Progress✓ 3. TELEVISION Anthony’s favorite show is going to be replayed by a cable
television station. They are going to play one episode each day in a random order. Anthony missed 3 of the 22 episodes.
A. What objects can be used to model the possible outcomes of one of the shows that he missed being aired on the first day?
B. What is the theoretical probability that it will be a show he missed?
C. The results of a simulation Anthony performed are shown in the table. What is the experimental probability that it will be a show he missed?
D. How does the experimental probability compare to the theoretical probability?
Personal Tutor glencoe.com
Reading Math
Law of Large Numbers The Law of Large Numbers states that as the number of trial increases, the experimental probability gets closer to the theoretical probability.
✓ Check Your Understanding
1. GAMES Games at the fair require the majority of players to lose in order for game owners to make a profit. New games are tested to make sure they have sufficient difficulty. The results of three test groups are listed in the table. The owners want a maximum of 33% of players to win. There were 50 participants in each test group.
a. What is the experimental probability that the participant was a winner in the second group?
b. What is the experimental probability of winning for all three groups?
2. BATTING AVERAGE In a computer baseball game, a baseball player has a batting average of 300. That is, he gets a hit 300 out of 1000, or 30% of the times he is at
bat. What could be used to simulate the player taking a turn at bat?
Example 2p. 788
33 TEST On a true-false test, Marlene answered 16 out of the 20 questions correctly by guessing randomly.
a. What could be used to simulate her correctly answering a question? Explain.
b. Describe a way to simulate the next 20 questions.
Example 3p. 788
4. LOTTERIES In a certain state, lottery numbers are five-digit numbers. Each digit can be 1, 2, 3, 4, 5, or 6. Once a week, a random number is chosen as the winner.
a. How many five-digit numbers are possible? Explain how you calculated the number of possible outcomes.
b. Perform a simulation for winning the lottery. Describe the objects you used.
c. According to your experiment, if you buy one ticket, what is the experimental probability of winning the lottery?
d. How does your experimental probability compare to the theoretical probability of winning the lottery?
Example 1p. 787
Example 1p. 787
Result Group 1 Group 2 Group 3Winners 13 15 19
Losers 37 35 31
Show Frequency
missed 5
watched 45

790 Chapter 12 Statistics and Probability
Practice and Problem Solving = Step-by-Step Solutions begin on page R12.
Extra Practice begins on page 815.
Example 1p. 787
5. CARDS Javier is drawing a card from a standard deck of cards, recording the suit, and then replacing the card in the deck. The table below shows his results.
Suit clubs diamonds hearts spades
Frequency 7 4 5 9
a. Find the experimental probability of drawing a heart.
b. Find the experimental probability of drawing a black card.
c. Javier repeated his test. The results are shown below. Find the experimental probability of drawing a spade for both tests.
Suit clubs diamonds hearts spades
Frequency 5 8 6 6
Example 2p. 788
6. CDS There are 6 country CDs, 8 pop CDs, 3 rap CDs, and 7 rock CDs in a storage case. What could be used for a simulation to determine the probability of randomly selecting any one type of CD to listen to?
77 TESTS What could be used to simulate guessing on a multiple-choice test with 4 possible answers for each question?
Example 3p. 788
8. JEANS Julie examines the stitching on pairs of jeans that are produced at a manufacturing plant. When defects are found, she sends the jeans back to correct the stitching. She expects to find defects in 1 out of every 16 pairs of jeans.
a. What can be used to model the possible outcomes of a pair of jeans being found with defects? Explain.
b. What is the theoretical probability that a random pair of jeans is found with a defect?
c. The results of simulations using Julie’s expectations are shown in the table at the right. What is the experimental probability that a random pair of jeans will have a defect?
d. How does the experimental probability compare to the theoretical probability?
9. DIE ROLL Roll a die 25 times and record your results. Find each probability based on your results.
a. What is the probability of rolling a 2?
b. What is the probability of rolling a prime number?
c. What is the probability of rolling an even number or 3?
d. Compare your results to the theoretical probabilities.
10. PRIZES For its tenth anniversary, a video store randomly gives each customer a prize from the following choices: a free movie rental, a free video game rental, a free bag of popcorn, or a free pre-viewed movie. The chance of winning each prize is equal.
a. What could be used to perform a simulation of this situation? Explain.
b. How could you use this simulation to model the next 50 free items?
Women between the ages of 16 and 24 have an average of 8 pairs of jeans.Source: Cotton Incorporated
Defects Frequency
0 71
1 9
2 11
3 6
4 3
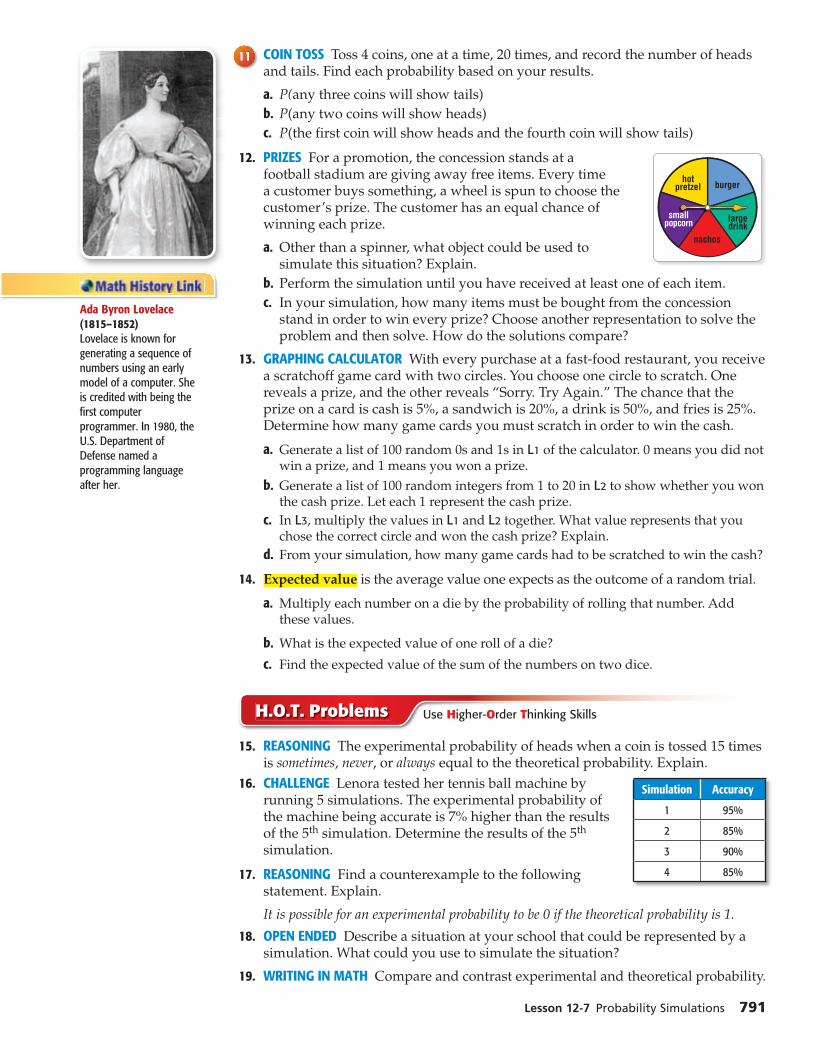
Lesson 12-7 Probability Simulations 791
1111 COIN TOSS Toss 4 coins, one at a time, 20 times, and record the number of heads and tails. Find each probability based on your results.
a. P(any three coins will show tails)
b. P(any two coins will show heads)
c. P(the first coin will show heads and the fourth coin will show tails)
12. PRIZES For a promotion, the concession stands at a
smallpopcorn
hotpretzel
largedrink
nachos
burgerfootball stadium are giving away free items. Every time a customer buys something, a wheel is spun to choose the customer’s prize. The customer has an equal chance of winning each prize.
a. Other than a spinner, what object could be used to simulate this situation? Explain.
b. Perform the simulation until you have received at least one of each item.
c. In your simulation, how many items must be bought from the concession stand in order to win every prize? Choose another representation to solve the problem and then solve. How do the solutions compare?
13. GRAPHING CALCULATOR With every purchase at a fast-food restaurant, you receive a scratchoff game card with two circles. You choose one circle to scratch. One reveals a prize, and the other reveals “Sorry. Try Again.” The chance that the prize on a card is cash is 5%, a sandwich is 20%, a drink is 50%, and fries is 25%. Determine how many game cards you must scratch in order to win the cash.
a. Generate a list of 100 random 0s and 1s in L1 of the calculator. 0 means you did not win a prize, and 1 means you won a prize.
b. Generate a list of 100 random integers from 1 to 20 in L2 to show whether you won the cash prize. Let each 1 represent the cash prize.
c. In L3, multiply the values in L1 and L2 together. What value represents that you chose the correct circle and won the cash prize? Explain.
d. From your simulation, how many game cards had to be scratched to win the cash?
14. Expected value is the average value one expects as the outcome of a random trial.
a. Multiply each number on a die by the probability of rolling that number. Add these values.
b. What is the expected value of one roll of a die?
c. Find the expected value of the sum of the numbers on two dice.
H.O.T. Problems Use Higher-Order Thinking Skills
15. REASONING The experimental probability of heads when a coin is tossed 15 times is sometimes, never, or always equal to the theoretical probability. Explain.
16. CHALLENGE Lenora tested her tennis ball machine by running 5 simulations. The experimental probability of the machine being accurate is 7% higher than the results of the 5th simulation. Determine the results of the 5th simulation.
17. REASONING Find a counterexample to the following statement. Explain.
It is possible for an experimental probability to be 0 if the theoretical probability is 1.
18. OPEN ENDED Describe a situation at your school that could be represented by a simulation. What could you use to simulate the situation?
19. WRITING IN MATH Compare and contrast experimental and theoretical probability.
Ada Byron Lovelace (1815–1852) Lovelace is known for generating a sequence of numbers using an early model of a computer. She is credited with being the first computer programmer. In 1980, the U.S. Department of Defense named a programming language after her.
Simulation Accuracy
1 95%
2 85%
3 90%
4 85%

20. GEOMETRY Suppose a covered water tank in the shape of a right circular cylinder is thirty feet long and eight feet in diameter. What is the surface area of the cylinder?
A 272π f t 2 C 286π f t 2
B 153π f t 2 D 248π f t 2
21. SHORT RESPONSE How many different ways can the letters P, Q, R, S be arranged?
22. In how many ways can the letters in the word STATISTICS be arranged?
F 50,400 H 15,400
G 20,800 J 3480
23. Two consecutive numbers have a sum of 91. What are the numbers?
A 41, 50 C 45, 46
B 44, 47 D 49, 42
Standardized Test Practice
Spiral Review
24. The table shows a class’s grade distribution, where A = 4.0, B = 3.0, C = 2.0, D = 1.0, and F = 0. (Lesson 12-6)
a. Is the probability distribution valid? Explain.
b. What is the probability that a student passes the course?
c. What is the probability that a student chosen at random from the class receives a grade of C or better?
Review problems are coded with a color by the section of the chapter that they are from. Each student draws and then returns a colored ball from a bucket to see which section their review problem will come from. There are 5 red, 10 yellow, 5 blue, and 2 green balls. Find each probability described. (Lesson 12-4)
25. P(yellow) 26. P(red) 27. P(red, blue) 28. P(yellow, green)
29. PARTIES Student Council is planning a party for the school volunteers. There are five 66-ounce unopened bottles of soda left from a recent dance. When
poured over ice, 5 1 _ 2 ounces of soda fills a cup. How many servings of soda can
they get from the bottles they have? (Lesson 11-7)
Write an inverse variation equation that relates x and y. Assume that y varies inversely as x. Then solve. (Lesson 11-1)
30. If y = 8.5 when x = -1, find x 31. If y = 8 when x = 1.55, find x 32. If y = 6.4 when x = 4.4, find xwhen y = -1. when y = -0.62. when y = 3.2.
33. TOPOGRAPHY To determine the mileage between landmarks, the U.S. military superimposes a coordinate grid over a map of the region. The units on this grid are approximately equal to 50,000 feet. So, a distance of 3 units on the grid equals an actual distance of 3(50,000) or 150,000 feet. Suppose the locations of two landmarks are at (132, 428) and (254, 105). Find the actual distance between these landmarks to the nearest mile. (Lesson 10-6)
Write each fraction as a percent rounded to the nearest whole number. (Lesson 0-6)
34. 26
_ 58
35. 55
_ 125
36. 14
_ 128
37. 82
_ 110
38. 76
_ 124
39. 23
_ 86
KCCT PRACTICE MA-HS-4.4.2
792 Chapter 12 Statistics and Probability
G = Grade 0 1.0 2.0 3.0 4.0
Probability 0.05 0.05 0.30 0.35 0.25
Chapter 12 Study Guide and Review 793
Vocabulary CheckChoose the word or term that best completes each sentence.
1. The arrangement in which order is important is called a (combination, permutation).
2. Rolling one die and then another are (dependent, independent) events.
3. The sum of probabilities of complements equals (0, 1).
4. Randomly drawing a marble from a jar and then drawing another marble are dependent events if the marbles (are, are not) replaced.
5. Events that cannot occur at the same time are (mutually exclusive, inclusive).
Key Vocabularybiased sample (p. 741)
combination (p. 765)
complement (p. 772)
compound event (p. 771)
conditional probability (p. 777)
dependent events (p. 772)
discrete random variable (p. 779)
empirical study (p. 787)
experiment (p. 740)
experimental probability (p.787)
factorial (p. 764)
independent events (p. 771)
inferential statistics (p. 757)
mean absolute deviation (p. 757)
mutually exclusive (p. 773)
parameter (p. 756)
permutation (p. 764)
population (p. 740)
probability distribution (p. 780)
qualitative data (p. 758)
quantitative data (p. 758)
random variable (p. 779)
relative frequency (p. 787)
sample (p. 740)
simple random sample (p. 742)
simulation (p. 788)
standard deviation (p. 757)
statistic (p. 756)
stratified random sample (p. 742)
survey (p. 740)
systemic random sample (p. 742)
theoretical probability (p. 787)
univariate data (p. 757)
variance (p. 757)
Key ConceptsDesigning a Survey and Analyzing Results (Lessons 12-1 and 12-2)
• The three methods for collecting data are surveys, observational studies, and experiments.
• A sample is biased if one group is favored over another.
• Data can be organized by mean, median, mode, range, quartile and interquartile range.
Statistics (Lesson 12-3)
• A parameter is a characteristic of a whole population.
• The mean absolute value is the average of the absolute values of differences between the mean and each value and the data set.
Permutations and Combinations (Lesson 12-4)
• In a permutation, the order of objects is important, P (n,r) = n! _
(n - r)!
• In a combination, the order of objects is not important, C (n,r) = n! _
(n - r)!r!
Probability Distributions and Simulations (Lessons 12-6 and 12-7)
• For each value of X, 0 ≤ P(X) ≤ 1. The sum of the probabilities of each value of X is 1.
• Theoretical probability describes expected outcomes, while experimental probability describes tested outcomes.
• Simulations are used to perform experiments that would be difficult or impossible to perform in real life.
Chapter Summary
Study Organizer
Be sure the Key Concepts are noted in your Foldable.
StatisticsandProbability
Study Guide and Review glencoe.com
• • Vocabulary Review
KY Math Online

794 Chapter 12 Study Guide and Review
Lesson-by-Lesson Review
Study Guide and Review
Designing a Survey (pp. 739–745)12-1
For the situation, identify the sample and suggest a population from which it was selected. Then, classify the type of data collection used.
An artist is trying to choose a cover for a children’s book. She sends out a flyer with the two covers to all of the students at one school. She asks them to check the favorite cover.
The sample is all of the students at the one school.The population is all children who read books.The type of data collection is a survey.
EXAMPLE 2
People listening to a country music radio station are asked to name their favorite type of music. Identify the sample as biased or unbiased.
The sample is biased because people listening to a country music station are more likely to vote for country music as their favorite.
6. SCHOOL DANCE The homecoming dance committee is trying to decide on a theme for the homecoming dance. They send out a questionnaire to all of the girls in the school to determine which theme they should use. Identify the sample and suggest a population from which it was selected. Then, classify the type of data collection used.
7. GOVERNMENT To determine whether voters support a new trade agreement, 5 people from the list of registered voters in each state and in the District of Columbia are selected at random. Is the sample biased or unbiased?
8. CANDY BARS To ensure that all of the chocolate bars are the appropriate weight, every 50th bar on the conveyor belt in the candy factory is removed and weighed. Is the sample simple, stratified, or systematic?
EXAMPLE 1
Analyzing Survey Results (pp. 746–755)12-2
SALARY A company wants to show the best representation of an employee’s salary. The salaries of the other employees in the company are $25,000, $30,000, $28,000, $29,000, $30,000, and $65,000. Tell which measure of center best represents the data. Then find the measure of center.
List the values from least to greatest: $25,000, $28,000, $29,000, $30,000, $30,000, $65,000.
There is one value that is much greater than the rest of the data, $65,000. Also, there does not appear to be a big gap in the middle of the data. The median would best represent the data.
The median is $29,500.
Tell which measure of center best represents the data. Then find the measure of center.
9. CLASSROOM Sophia keeps track of the ages of the students in her class. She wants to best represent the ages of her classmates. {13, 14, 13, 13, 14, 13, 13, 15, 14, 13, 14, 14, 10}
10. PETS Jason conducts a survey about the number of pets his friends have. He wants to best represent the number of pets. {0, 2, 1, 2, 4, 0, 2, 3, 1, 2, 1, 2, 3, 2, 4, 3, 10}
11. LUNCH PRICES The cafeteria wants to show the best representation of how much students spend on lunch. {2, 3, 4, 3, 2, 4, 1, 3, 4, 2, 3, 3, 4, 3}
EXAMPLE 3
HS-DAP-S-ES1,HS-DAP-S-ES2
HS-DAP-S-CDS12,HS-DAP-S-ES4
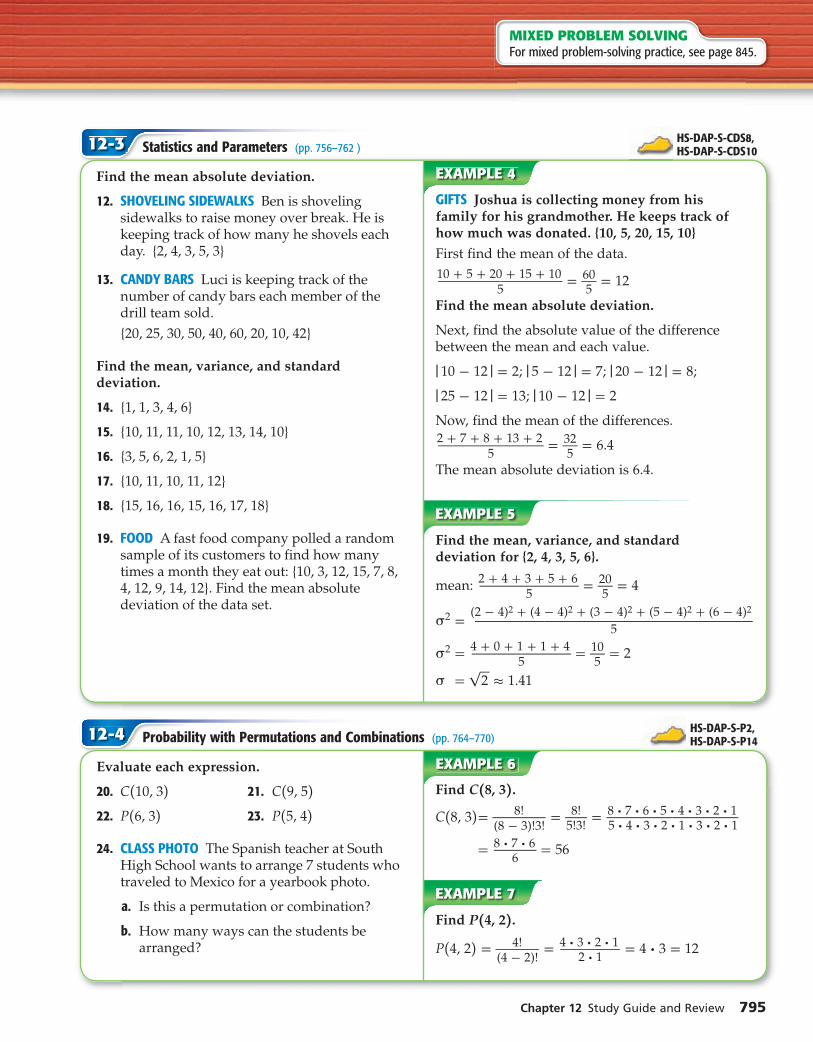
Chapter 12 Study Guide and Review 795
Statistics and Parameters (pp. 756–762 )12-3
GIFTS Joshua is collecting money from his family for his grandmother. He keeps track of how much was donated. {10, 5, 20, 15, 10}
First find the mean of the data.
10 + 5 + 20 + 15 + 10
__ 5 = 60
_ 5 = 12
Find the mean absolute deviation.
Next, find the absolute value of the difference between the mean and each value.
⎪10 - 12⎥ = 2; ⎪5 - 12⎥ = 7; ⎪20 - 12⎥ = 8;
⎪25 - 12⎥ = 13; ⎪10 - 12⎥ = 2
Now, find the mean of the differences.
2 + 7 + 8 + 13 + 2
__ 5 = 32
_ 5 = 6.4
The mean absolute deviation is 6.4.
EXAMPLE 5
Find the mean, variance, and standard deviation for {2, 4, 3, 5, 6}.
mean: 2 + 4 + 3 + 5 + 6
__ 5 = 20
_ 5 = 4
σ 2 =
(2 - 4) 2 + (4 - 4) 2 + (3 - 4) 2 + (5 - 4) 2 + (6 - 4) 2 ____
5
σ 2 =
4 + 0 + 1 + 1 + 4 __
5 = 10
_ 5 = 2
σ = √ � 2 ≈ 1.41
Find the mean absolute deviation.
12. SHOVELING SIDEWALKS Ben is shoveling sidewalks to raise money over break. He is keeping track of how many he shovels each day. {2, 4, 3, 5, 3}
13. CANDY BARS Luci is keeping track of the number of candy bars each member of the drill team sold.
{20, 25, 30, 50, 40, 60, 20, 10, 42}
Find the mean, variance, and standard deviation.
14. {1, 1, 3, 4, 6}
15. {10, 11, 11, 10, 12, 13, 14, 10}
16. {3, 5, 6, 2, 1, 5}
17. {10, 11, 10, 11, 12}
18. {15, 16, 16, 15, 16, 17, 18}
19. FOOD A fast food company polled a random sample of its customers to find how many times a month they eat out: {10, 3, 12, 15, 7, 8, 4, 12, 9, 14, 12}. Find the mean absolute deviation of the data set.
EXAMPLE 4
Probability with Permutations and Combinations (pp. 764–770)12-4
Find C (8, 3) .
C (8, 3) = 8! _
(8 - 3)!3! = 8!
_ 5!3!
= 8 · 7 · 6 · 5 · 4 · 3 · 2 · 1 __
5 · 4 · 3 · 2 · 1 · 3 · 2 · 1
= 8 · 7 · 6 _
6 = 56
EXAMPLE 7
Find P (4, 2) .
P (4, 2) = 4! _
(4 - 2)! = 4 · 3 · 2 · 1
_ 2 · 1
= 4 · 3 = 12
Evaluate each expression.
20. C (10, 3) 21. C (9, 5)
22. P (6, 3) 23. P (5, 4)
24. CLASS PHOTO The Spanish teacher at South High School wants to arrange 7 students who traveled to Mexico for a yearbook photo.
a. Is this a permutation or combination?
b. How many ways can the students be arranged?
EXAMPLE 6
MIXED PROBLEM SOLVINGFor mixed problem-solving practice, see page 845.
HS-DAP-S-CDS8,HS-DAP-S-CDS10
HS-DAP-S-P2,HS-DAP-S-P14
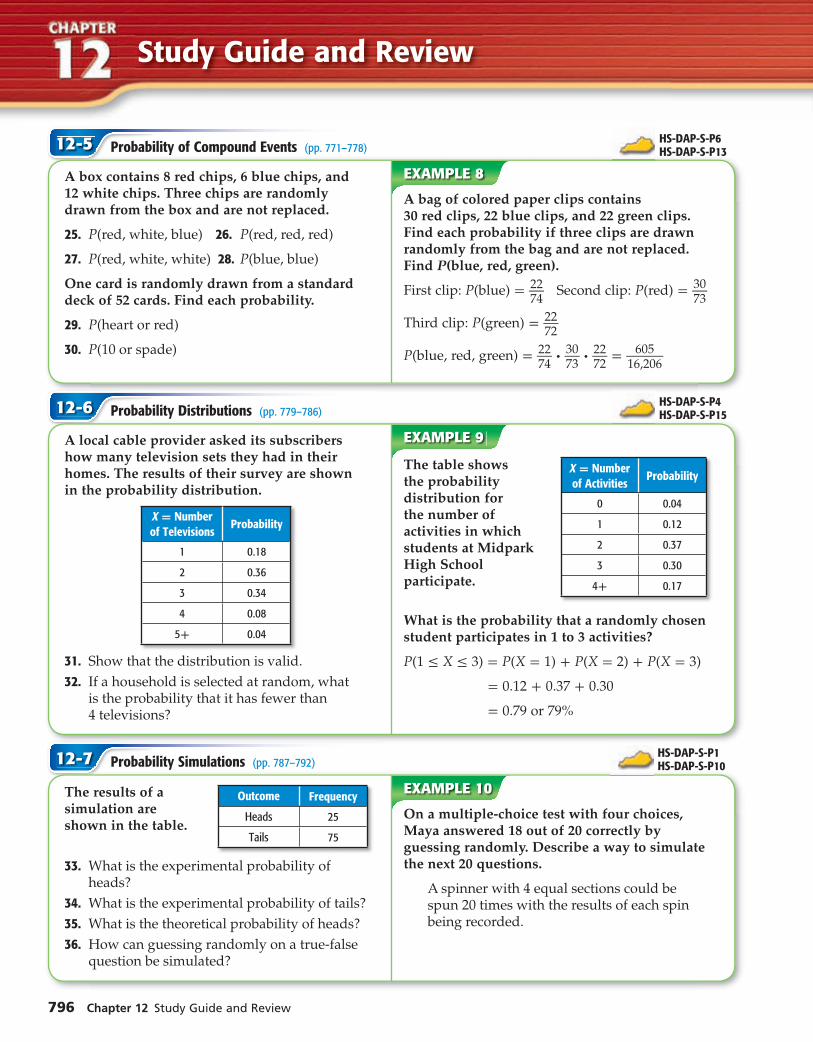
796 Chapter 12 Study Guide and Review
Study Guide and Review
Probability of Compound Events (pp. 771–778)12-5
A bag of colored paper clips contains 30 red clips, 22 blue clips, and 22 green clips. Find each probability if three clips are drawn randomly from the bag and are not replaced. Find P(blue, red, green).
First clip: P(blue) = 22 _
74 Second clip: P(red) = 30
_ 73
Third clip: P(green) = 22 _
72
P(blue, red, green) = 22 _
74 · 30
_ 73
· 22 _
72 = 605
_ 16,206
A box contains 8 red chips, 6 blue chips, and 12 white chips. Three chips are randomly drawn from the box and are not replaced.
25. P(red, white, blue) 26. P(red, red, red)
27. P(red, white, white) 28. P(blue, blue)
One card is randomly drawn from a standard deck of 52 cards. Find each probability.
29. P(heart or red)
30. P(10 or spade)
EXAMPLE 8
Probability Simulations (pp. 787–792)12-7
On a multiple-choice test with four choices, Maya answered 18 out of 20 correctly by guessing randomly. Describe a way to simulate the next 20 questions.
A spinner with 4 equal sections could be spun 20 times with the results of each spin being recorded.
The results of a Outcome Frequency
Heads 25
Tails 75
simulation are shown in the table.
33. What is the experimental probability of heads?
34. What is the experimental probability of tails?
35. What is the theoretical probability of heads?
36. How can guessing randomly on a true-false question be simulated?
EXAMPLE 10
Probability Distributions (pp. 779–786)12-6
The table shows X = Number of Activities
Probability
0 0.04
1 0.12
2 0.37
3 0.30
4+ 0.17
the probability distribution for the number of activities in which students at Midpark High School participate.
What is the probability that a randomly chosen student participates in 1 to 3 activities?
P(1 ≤ X ≤ 3) = P(X = 1) + P(X = 2) + P(X = 3)
= 0.12 + 0.37 + 0.30
= 0.79 or 79%
A local cable provider asked its subscribers how many television sets they had in their homes. The results of their survey are shown in the probability distribution.
X = Number of Televisions
Probability
1 0.18
2 0.36
3 0.34
4 0.08
5+ 0.04
31. Show that the distribution is valid.
32. If a household is selected at random, what is the probability that it has fewer than 4 televisions?
EXAMPLE 9
HS-DAP-S-P6HS-DAP-S-P13
HS-DAP-S-P4HS-DAP-S-P15
HS-DAP-S-P1HS-DAP-S-P10
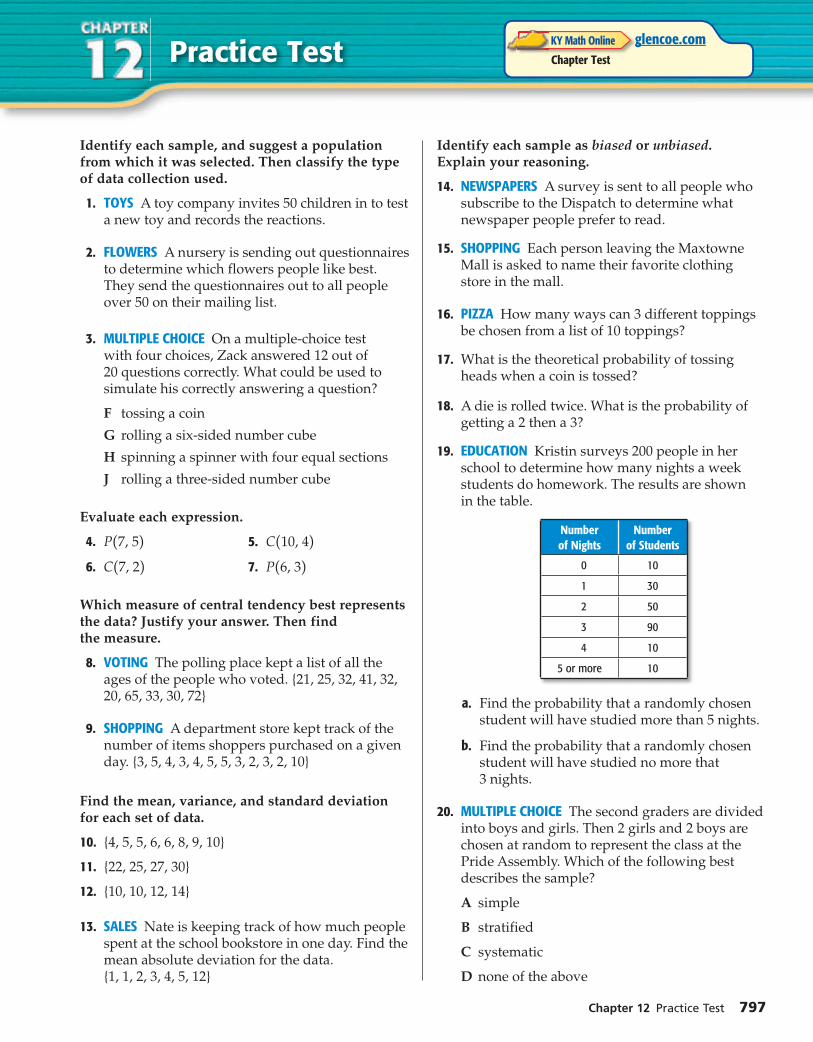
Chapter 12 Practice Test 797
Identify each sample, and suggest a population from which it was selected. Then classify the type of data collection used.
1. TOYS A toy company invites 50 children in to test a new toy and records the reactions.
2. FLOWERS A nursery is sending out questionnaires to determine which flowers people like best. They send the questionnaires out to all people over 50 on their mailing list.
3. MULTIPLE CHOICE On a multiple-choice test with four choices, Zack answered 12 out of 20 questions correctly. What could be used to simulate his correctly answering a question?
F tossing a coin
G rolling a six-sided number cube
H spinning a spinner with four equal sections
J rolling a three-sided number cube
Evaluate each expression.
4. P (7, 5) 5. C (10, 4)
6. C (7, 2) 7. P (6, 3)
Which measure of central tendency best represents the data? Justify your answer. Then find the measure.
8. VOTING The polling place kept a list of all the ages of the people who voted. {21, 25, 32, 41, 32, 20, 65, 33, 30, 72}
9. SHOPPING A department store kept track of the number of items shoppers purchased on a given day. {3, 5, 4, 3, 4, 5, 5, 3, 2, 3, 2, 10}
Find the mean, variance, and standard deviation for each set of data.
10. {4, 5, 5, 6, 6, 8, 9, 10}
11. {22, 25, 27, 30}
12. {10, 10, 12, 14}
13. SALES Nate is keeping track of how much people spent at the school bookstore in one day. Find the mean absolute deviation for the data. {1, 1, 2, 3, 4, 5, 12}
Identify each sample as biased or unbiased. Explain your reasoning.
14. NEWSPAPERS A survey is sent to all people who subscribe to the Dispatch to determine what newspaper people prefer to read.
15. SHOPPING Each person leaving the Maxtowne Mall is asked to name their favorite clothing store in the mall.
16. PIZZA How many ways can 3 different toppings be chosen from a list of 10 toppings?
17. What is the theoretical probability of tossing heads when a coin is tossed?
18. A die is rolled twice. What is the probability of getting a 2 then a 3?
19. EDUCATION Kristin surveys 200 people in her school to determine how many nights a week students do homework. The results are shown in the table.
Number of Nights
Number of Students
0 10
1 30
2 50
3 90
4 10
5 or more 10
a. Find the probability that a randomly chosen student will have studied more than 5 nights.
b. Find the probability that a randomly chosen student will have studied no more that 3 nights.
20. MULTIPLE CHOICE The second graders are divided into boys and girls. Then 2 girls and 2 boys are chosen at random to represent the class at the Pride Assembly. Which of the following best describes the sample?
A simple
B stratified
C systematic
D none of the above
Practice Test glencoe.comChapter Test
KY Math Online

Preparing for Standardized Tests
798 Chapter 12 Statistics and Probability
Organize DataSometimes you may be given a set of data that you need to analyze in order to solve problems on a standardized test. Use this lesson to practice organizing data to help you solve problems.
Strategies for Organizing DataStrategies for Organizing Data
Step 1
When you are given a problem statement containing data, consider:
• making a list of the data.
• using a table to organize the data.
• using a data display (such as a bar graph, Venn diagram, circle graph, line graph, or box-and-whisker plot) to organize the data.
Step 2
Organize the data.
• Create your table, list, or data display.
• If possible, fill in any missing values that can be found by intermediate computations.
Step 3
Analyze the data to solve the problem.
• Reread the problem statement to determine what you are being asked to solve.
• Use the properties of algebra to work with the organized data and solve the problem.
• If time permits, go back and check your answer.
EXAMPLE
Read the problem. Identify what you need to know. Then use the information in the problem to solve. Show your work.
Of the 24 students in a music class, 10 play the flute, 14 play the piano, and 13 play the guitar. Two students play the flute only, 5 the piano only, and 7 the guitar only. One student plays the flute and the guitar but not the piano. Two students play the piano and guitar but not the flute. Three students play all the instruments. If a student is selected at random, what is the probability that he or she plays the piano and flute, but not the guitar?
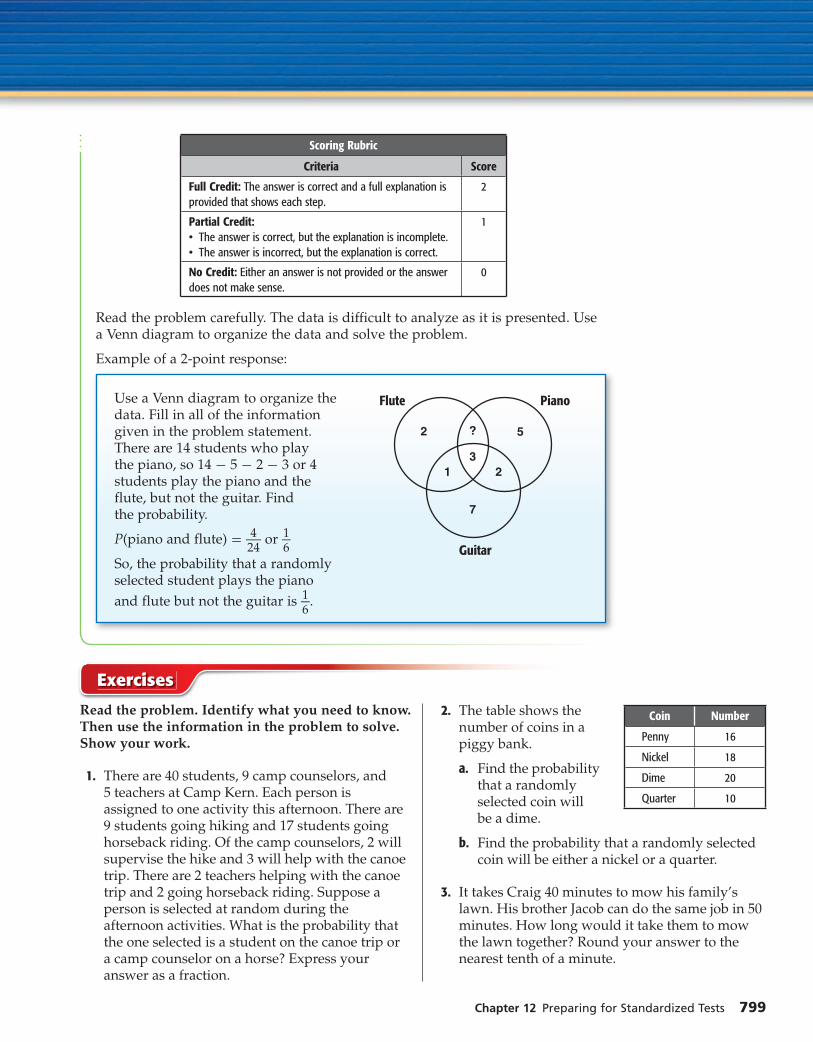
Chapter 12 Preparing for Standardized Tests 799
Read the problem. Identify what you need to know. Then use the information in the problem to solve. Show your work.
1. There are 40 students, 9 camp counselors, and 5 teachers at Camp Kern. Each person is assigned to one activity this afternoon. There are 9 students going hiking and 17 students going horseback riding. Of the camp counselors, 2 will supervise the hike and 3 will help with the canoe trip. There are 2 teachers helping with the canoe trip and 2 going horseback riding. Suppose a person is selected at random during the afternoon activities. What is the probability that the one selected is a student on the canoe trip or a camp counselor on a horse? Express your answer as a fraction.
2. The table shows the Coin Number
Penny 16
Nickel 18
Dime 20
Quarter 10
number of coins in a piggy bank.
a. Find the probability that a randomly selected coin will be a dime.
b. Find the probability that a randomly selected coin will be either a nickel or a quarter.
3. It takes Craig 40 minutes to mow his family’s lawn. His brother Jacob can do the same job in 50 minutes. How long would it take them to mow the lawn together? Round your answer to the nearest tenth of a minute.
Exercises
Scoring Rubric
Criteria Score
Full Credit: The answer is correct and a full explanation is provided that shows each step.
2
Partial Credit:• The answer is correct, but the explanation is incomplete.• The answer is incorrect, but the explanation is correct.
1
No Credit: Either an answer is not provided or the answer does not make sense.
0
Read the problem carefully. The data is difficult to analyze as it is presented. Use a Venn diagram to organize the data and solve the problem.
Example of a 2-point response:
Use a Venn diagram to organize the Flute Piano
Guitar
data. Fill in all of the information given in the problem statement. There are 14 students who play the piano, so 14 - 5 - 2 - 3 or 4 students play the piano and the flute, but not the guitar. Find the probability.
P(piano and flute) = 4 _ 24
or 1 _ 6
So, the probability that a randomly selected student plays the piano
and flute but not the guitar is 1 _ 6 .
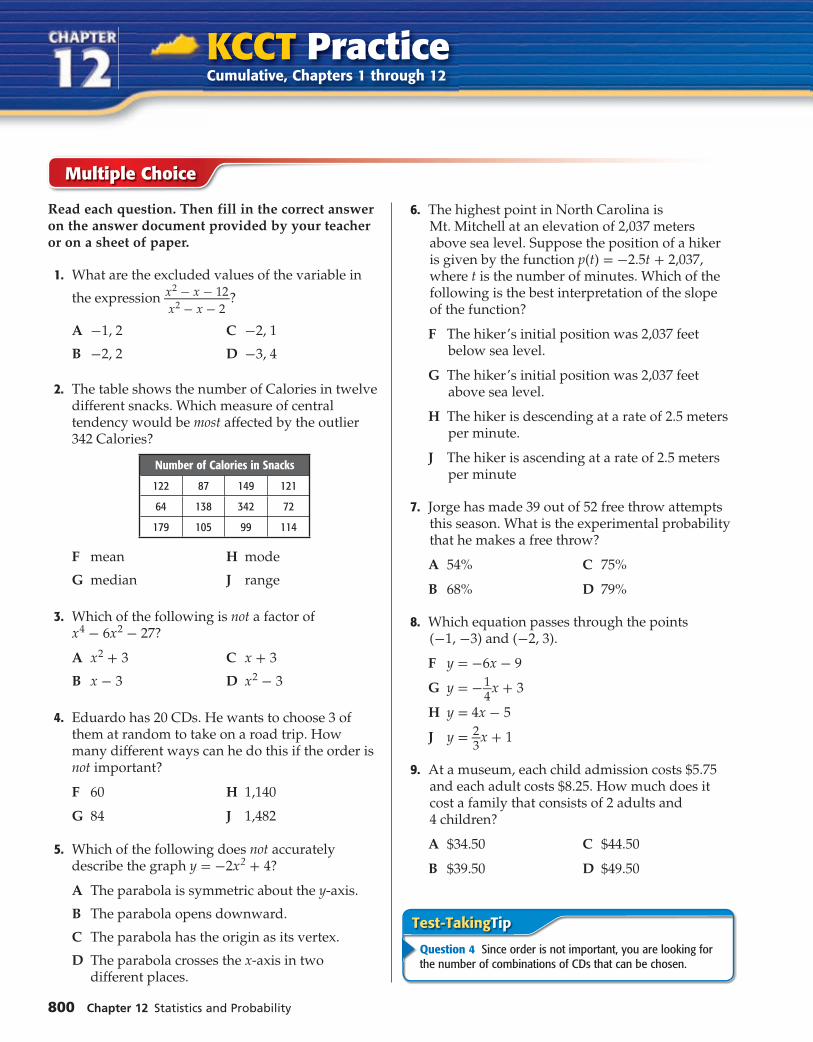
800 Chapter 12 Statistics and Probability
Multiple Choice
KCCT PracticeCumulative, Chapters 1 through 12
6. The highest point in North Carolina is Mt. Mitchell at an elevation of 2,037 meters above sea level. Suppose the position of a hiker is given by the function p(t) = -2.5t + 2,037, where t is the number of minutes. Which of the following is the best interpretation of the slope of the function?
F The hiker’s initial position was 2,037 feet below sea level.
G The hiker’s initial position was 2,037 feet above sea level.
H The hiker is descending at a rate of 2.5 meters per minute.
J The hiker is ascending at a rate of 2.5 meters per minute
7. Jorge has made 39 out of 52 free throw attempts this season. What is the experimental probability that he makes a free throw?
A 54% C 75%
B 68% D 79%
8. Which equation passes through the points (-1, -3) and (-2, 3).
F y = -6x - 9
G y = - 1 _
4 x + 3
H y = 4x - 5
J y = 2 _
3 x + 1
9. At a museum, each child admission costs $5.75 and each adult costs $8.25. How much does it cost a family that consists of 2 adults and 4 children?
A $34.50 C $44.50
B $39.50 D $49.50
Read each question. Then fill in the correct answer on the answer document provided by your teacher or on a sheet of paper.
1. What are the excluded values of the variable in
the expression x 2 - x - 12 _
x 2 - x - 2 ?
A -1, 2 C -2, 1
B -2, 2 D -3, 4
2. The table shows the number of Calories in twelve different snacks. Which measure of central tendency would be most affected by the outlier 342 Calories?
Number of Calories in Snacks
122 87 149 121
64 138 342 72
179 105 99 114
F mean H mode
G median J range
3. Which of the following is not a factor of x 4 - 6 x 2 - 27?
A x 2 + 3 C x + 3
B x - 3 D x 2 - 3
4. Eduardo has 20 CDs. He wants to choose 3 of them at random to take on a road trip. How many different ways can he do this if the order is not important?
F 60 H 1,140
G 84 J 1,482
5. Which of the following does not accurately describe the graph y = -2 x 2 + 4?
A The parabola is symmetric about the y-axis.
B The parabola opens downward.
C The parabola has the origin as its vertex.
D The parabola crosses the x-axis in two different places.
Test-TakingTip
Question 4 Since order is not important, you are looking for the number of combinations of CDs that can be chosen.

glencoe.comStandardized Test Practice
KY Math Online
Short Response/Gridded Response
Record your answers on the answer sheet provided by your teacher or on a sheet of paper.
10. GRIDDED RESPONSE Suppose Colleen spins the spinner below 80 times and records the results in a frequency table. How many times should she expect to spin a vowel?
A B
CED
11. What is the value of sin B? Express your answer as a fraction.
5 13
12. Graph f(x) ≥ |x - 2| on a coordinate grid.
13. GRIDDED RESPONSE Find the standard deviation of the set of data below. Show your work. Round
to the nearest tenth if necessary.
14 11 9 6
10 16 15 13
9 12 19 10
14. Larissa has 5 peanut butter cookies, 7 chocolate chip cookies, 4 sugar cookies, and 9 oatmeal raisin cookies in a jar. If she picks two cookies at random without replacing them, what is the probability that she will choose a peanut butter cookie then a sugar cookie? Express your answer as a fraction.
15. Write an expression that describes the area in square units of a triangle with a height of 4 c 3 d 2 and a base of 3 cd 4 .
16. Casey made 84 field goals during the basketball season for a total of 183 points. Each field goal was worth either 2 or 3 points. How many 2-point and 3-point field goals did Casey make during the season?
17. GRIDDED RESPONSE The booster club pays $180 to rent a concession stand at a football game. They purchase cans of soda for $0.25 and sell them at the game for $1.15. How many cans of soda must
they sell to break even?
Extended Response
Record your answers on a sheet of paper. Show your work.
18. To predict whether or not an issue on a ballot will pass or fail, a committee randomly calls 250 houses with area codes that are inside the voting district and asks the opinions of registered voters. Based on these efforts, the committee determines that 71% (±2.5%) of the voting population supports the issue. The committee concludes that the issue will pass.
a. Identify the sample.
b. Describe the population.
c. What method of data collection did the committee use: survey, experiment, or observational survey? Explain.
d. Is the sample biased or unbiased. Explain.
e. If unbiased, classify the sample as simple, stratifi ed, or systematic. Explain.
Need Extra Help?
If you missed Question... 1 2 3 4 5 6 7 8 9 10 11 12 13 14 15 16 17 18
Go to Lesson or Page... 11-2 12-5 8-5 12-4 9-3 3-3 7-3 12-7 1-3 12-7 10-8 5-6 12-3 12-5 7-1 6-5 2-4 12-1
MA-HS-
5.2.2
MA-HS-
4.2.1
MA-HS-
5.2.3
MA-HS-
4.4.2
MA-HS-
5.1.8
MA-HS-
1.4.1
MA-HS-
4.4.1
MA-HS-
5.3.3
MA-HS-
5.2.1
MA-HS-
4.4.1
MA-HS-
2.1.3
MA-HS-
5.3.3
MA-HS-
4.1.1
MA-HS-
4.4.1
MA-HS-
5.2.1
MA-HS-
5.3.4
MA-HS-
5.3.1
MA-HS-
4.3.1KY Program of Studies
Chapters 1–12 KCCT Practice 801