CHAPTER -1 INTRODUCTION
85
1 CHAPTER - 1 INTRODUCTION 1.1 Introduction Customer satisfaction Customer satisfaction, a business term , is a measure of how products and services supplied by a company meet or surpass customer expectation. It is seen as a key performance indicator within business and is part of the four perspectives of a Balanced Scorecard . In a competitive marketplace where businesses compete for customers, customer satisfaction is seen as a key differentiator and increasingly has become a key element of business strategy. Measuring customer satisfaction Organizations are increasingly interested in retaining existing customers while targeting non-customers; measuring customer satisfaction provides an indication of how successful the organization is at providing products and/or services to the market place. Customer satisfaction is an ambiguous and abstract concept and the actual manifestation of the state of satisfaction will vary from person to person and product/service to product/service. The state of satisfaction depends on a number of both psychological and physical variables which correlate with satisfaction behaviors such as return and recommend rate. The level of satisfaction can also vary depending on other options the customer may have and other products against which the customer can compare the organization's products. Some customers have needs of which they are not fully conscious, or they cannot articulate these needs, or they use words that require some interpretation. Even though the company follows some effective marketing strategies, they may not be gain more number of new customers. To know the marketing companies and offers on the basis of how well those campaigns satisfy specific customer’s needs.
-
Upload
independent -
Category
Documents
-
view
0 -
download
0
Transcript of CHAPTER -1 INTRODUCTION

1
CHAPTER - 1
INTRODUCTION
1.1 Introduction
Customer satisfaction
Customer satisfaction, a business term, is a measure of how products and services
supplied by a company meet or surpass customer expectation. It is seen as a key performance
indicator within business and is part of the four perspectives of a Balanced Scorecard. In a
competitive marketplace where businesses compete for customers, customer satisfaction is
seen as a key differentiator and increasingly has become a key element of business strategy.
Measuring customer satisfaction
Organizations are increasingly interested in retaining existing customers while
targeting non-customers; measuring customer satisfaction provides an indication of how
successful the organization is at providing products and/or services to the market place.
Customer satisfaction is an ambiguous and abstract concept and the actual
manifestation of the state of satisfaction will vary from person to person and product/service to
product/service. The state of satisfaction depends on a number of both psychological and
physical variables which correlate with satisfaction behaviors such as return and recommend
rate. The level of satisfaction can also vary depending on other options the customer may have
and other products against which the customer can compare the organization's products.
Some customers have needs of which they are not fully conscious, or they cannot
articulate these needs, or they use words that require some interpretation. Even though the
company follows some effective marketing strategies, they may not be gain more number of
new customers. To know the marketing companies and offers on the basis of how well those
campaigns satisfy specific customer’s needs.

2
At present consumer behavior is very important in all aspects of marketing, retailing,
etc. therefore it is important know that the consumer behavior regarding the purchase process
and decision making. So, every marketer’s should be emphasized on consumer decision
making process.
In my present study at PEARL BOTTLING PVT. LIMITED on CONSUMER
BEHAVIOUR ON SOFT DRINKS, it was observed that the consumer behavior is classified
with respect to the internal and external behavior of an individual.
In my observation I have classified the entire project report with various chapters
and emphasized on the analysis with a presentable format. Consumer behavior has
traditionally been thought of as the study of “why people buy?” with the premise that it
becomes easier to develop strategies to influence consumers once a market knows the
reasons people buy specific soft drinks.
The study of consumer behavior was very important because, the consumer behavior
aspects will influence sales of the companies of the consumer are dissatisfied with the
product it will lead to great decline in the sales, so, every company must identify the needs
and consumer in advance and take necessary decision regarding their needs and wants and try
to satisfy the consumer through improvements in the soft drinks.

3
1.2 NEED FOR THE STUDY
The consumer behavior aspects will influence sales of the companies of the
consumer are dissatisfied with the product it will lead to great decline in the
sales.
Take necessary decision regarding their needs and wants and try to satisfy the
consumer through improvements in the soft drinks.
Consumer respond to the various marketing stimuli such as product, price,
promotion, and place.
Evoke a positive response in the consumer.
Easily design effective marketing strategies.
4
1.3 OBJECTIVE OF THE STUDY
To know the competitors of pearl bottling pvt. Limited
To know the effect of marketing activities on consumer awareness.
To study on consumer behavior towards pearl bottling pvt. Limited
To measure the effectiveness of advertisement in promoting the products
To analyze the consumer behavior in selecting the pearl bottling pvt. Limited
To highlight the customer views & suggestions regarding the overall performance of
the pearl bottling pvt. Limited.

5
1.4 METHODOLOGY OF THE STUDY
Systematic methodology is the key success of any research project as it has direct
bearing on the relevance of research findings. The purpose of research is to gather most
reliable and unbiased information through the application of scientific principles and
techniques.
The aim and methodology is a way to present a clear idea of the research procedures and
used in the study, method of sampling etc.
The research methodology is a way of systematically solving the research problem. It may be
understood as science of studying hoe research is done specifically. In it we study various
steps that are generally adopted by a researcher in studying his research problem along with
the logic behind them.
ANALYSIS OF PRIMARY DATA
Primary data was collected with the help of questionnaire targeting the retailers. The
questionnaire consists of fourteen questions, which gives us the necessary data.
SOURCES OF PRIMERY DATA
The primary data was collected through the survey method with the help of a structured
questionnaire distributed to a sample of different soft drink consumers in various places in
Srikakulam.
i) RESEARCH INSTRUMENT: Printer questionnaire was used as the research instrument
to collect the required information. Separate questionnaires were prepared for retailer survey
and interview was taken by the help of the questionnaire.
ii) AREA OF SURVEY:- The survey was conducted in the different localities of
Srikakulam City.

6
SAMPLING PLAN – SAMPLING PLAN CONSISTS OF:
a) SAMPLING UNIT:- The consumers of grocery shop, general store, departmental store
was selected from different place of Srikakulam.
b) SAMPLE SIZE:- for consumer’s survey, 200 consumers were taken as sample size.
c) SAMPLING PROCEDURE:- Cluster sampling producer was followed.
d) SAMPLING METHOD:- Data were collected by consumers. The consumer directly
conducted and interviewed at their counter and the different areas.
e) TIME PERIOD OF STUDY:- The survey was conducted during 6th
may to 10th
June
2012. Primary data is collected from the consumer through a structured questionnaire. It
includes the first hand information from the outlets. It can view as a survey. The
questionnaire was especially designed to find out the consumer taste and preferences of the
soft drinks and problems and weakness of Pepsi in that particular area. The chapter deals
with main analysis part of the study and the dealer outlets covered in the study is
7 Road Junction
Balaga Junction
Bankers Colony
Illisipuram Junction
SECONDARY DATA:
Secondary sources include the information collected from the annual reports,
published and unpublished records of the company, various books and journals and internet
also being used for collecting the relevant data.
After gathering the data from those two sources the data was analyzed, tabulated and
interpreted and finally suggestions were offered for the betterment of the company.

7
RESEARCH DESIGN:
In this research descriptive, research design was used because it finds out the
diagnostic information by asking the question like:
(a) What is it?
(b) Why is it?
(c) What it will be?
(d) What is should be?
Here it has been tired to analyze and describe about the reason behind the customer
satisfaction in Srikakulam Market and what measures should be applied.
SELECTION OF SAMPLES:
When a small group is taken as the representative of the whole, the study is taken as
sampling study. The whole group from which the samples have been drawn is technically
known as universe of population and the group selected for the study is known as sample.
In the present study the universe is the total population if the six selected areas:
1. 7 Road Junction
2. Balaga Junction
3. Bankers Colony
4. Illisipuram Junction
As the universe is too much large so I decided to take only 200 consumers in the
Srikakulam Market as our size for the convenience of my study. The sample is very small as
compared to the universe which may inconvenient yet it fulfills the aim of the topic selected
to be studied. As sampling method simple random sampling design was taken. Because the
samples or the respondents were selected on the random basis without any bios.
8
DATA COLLECSTION (TOOL AND TECHNIQUES USED)
Data are of two types i.e., Primary and Secondary. To collect primary data from
different source, along with samples, different tools and techniques will be used.
To collect data from a universe, along with samples, different tools and techniques
are used.
The methods of primary data collection i.e. adopted that present study are interview
method (structured), questionnaires method (both open and closed ended) and also the
observation method.
Also the secondary data were collected through newspapers, articles, and Internet.
DATA ANALYSIS (STATISTICAL TECHNIQUE)
The Statistical techniques used in the study are:
Pi-Chart

9
PROBLEM ENCOUNTERED
1. Most of the people to whom I was trying to convenience, were refusing to talk to me,
because they thought that I had come from some government organization or I was
doing this only to earn money.
2. Female respondents were avoiding to my questions due to their shy nature and also
due to their conservativeness.
3. The responders were not giving the accurate data about income and about his policy
adopted.
4. Now they have the awareness towards the soft drinks they have adopted so it was
difficult for them to tell about looses and benefits of the drinks.
5. Some time the respondents were feeling very irritated while talking with me.
6. Due to illiteracy and low education, some respondents were unable to tell anything
authentically and also they did not have any interest on my topic.
7. At that time one of the major problems was hot season. It was summer time and in
this time I have moving different areas for the data collection and created very big
problem to me.
DATA ANALYZING TOOLS:
After gathering the data from the Primary and secondary sources the data was analyzed,
tabulated and interpretations were written down with the help of graphs and charts, with the
help of Microsoft Excel and Microsoft Word.

10
1.5 LIMITATIONS OF THE STUDY
The present study is subject to the following limitations:
The sample size is not universal, some part of other cities remained uncovered
Unavailability of some information due to lack of awareness of consumers
Time and expenses were major constraints
The study of the soft drink industry which is known to be seasonally fluctuating one
percent study does not take into account seasonal fluctuations. The results may not
suit for all the seasons.
Personal basis may be existing as the consumer of varied nature elicits the
information.

11
CHAPTER-2
PROFILE OF INDUSTRY
2.1 INDUSTRY PROFILE:
INTRODUCTION:
Type Cola
Manufacturer PepsiCo
Country of origin United State
Introduced 1898 (as Brad’s Drink) June 16,1903 (as Pepsi-Cola)
1961 (as Pepsi)
Related products Fanta, Dr.Pepper, 7 Up, Im Bru, Cola
Turka, Big Cola
Website www.pepsi.com
Pepsi
Is a carbonated soft drink produced and manufactured by PepsiCo. The drink was first made
in the 1890s by pharmacist Caleb Bradham in New Bern, North Carolina. The brand was
trademarked on June 16, 1903. There have been many Pepsi variants produced over the years
since 1898.
Origins
The pharmacy of Caleb Bradham, with a Pepsi dispenser, as portrayed in a New Bern
exhibition in the Historical Museum of Bern.

12
It was first introduced as "Brad's Drink" in New Bern, North Carolina in 1898 by
Caleb Bradham, who made it at his pharmacy where the drink was sold. It was later named
Pepsi Cola, possibly due to the digestive enzyme pepsin and kola nuts used in the recipe.
Bradham sought to create a fountain drink that was delicious and would aid in digestion and
boost energy
In 1903, Bradham moved the bottling of Pepsi-Cola from his drugstore to a rented
warehouse. That year, Bradham sold 7,968 gallons of syrup. The next year, Pepsi was sold in
six-ounce bottles, and sales increased to 19,848 gallons. In 1909, automobile race pioneer
Barney Old-field was the first celebrity to endorse Pepsi-Cola, describing it as "A bully
drink...refreshing, invigorating, a fine bracer before a race". The advertising theme
"Delicious and Healthful" was then used over the next two decades. In 1926, Pepsi received
its first logo redesign since the original design of 1905. In 1929, the logo was changed again.
In 1931, at the depth of the Great Depression, the Pepsi-Cola Company entered
bankruptcy - in large part due to financial losses incurred by speculating on wildly
fluctuating sugar prices as a result of World War I. Assets were sold and Roy C. Megargel
bought the Pepsi trademark. Eight years later, the company went bankrupt again. Pepsi's
assets were then purchased by Charles Guth; the President of Loft Inc. Loft was a candy
manufacturer with retail stores that contained soda fountains. He sought to replace Coca-Cola
at his stores' fountains after Coke refused to give him a discount on syrup. Guth then had
Loft's chemists reformulate the Pepsi-Cola syrup formula.
On three separate occasions between 1922 and 1933, the Coca-Cola Company was offered
the opportunity to purchase the Pepsi-Cola company and it declined on each occasion.
Pepsi-Cola trademark
The original trademark application for Pepsi-Cola was filed on September 23, 1902
with registration approved on June 16, 1903. In the application's statement, Caleb Bradham
describes the trademark as an, "arbitrary hyphenated word "PEPSI-COLA," and indicated
that the mark was in continuous use for his business since August 1, 1901. The Pepsi-Cola's
description is a flavoring-syrup for soda water. The trademark expired on April 15, 1994.

13
A second Pepsi-Cola trademark is on record with the USPTO. The application date
submitted by Caleb Bradham for the second trademark is Saturday, April 15, 1905 with the
successful registration date of April 15, 1906, over three years after the original date.
Curiously, in this application, Caleb Bradham states that the trademark had been
continuously used in his business "and those from who title is derived since February 15,
1896." While Pepsi-Cola was filed in the same category of personal and legal and social
services in both applications, in the 1905 application the description submitted to the USPTO
was for a tonic beverage. The federal status for the 1905 trademark is registered and renewed
and is owned by PepsiCo, Inc. of Purchase, New York.
Pepsi Logo
In 1998
Rise
During the Great Depression, Pepsi gained popularity following the introduction in
1936 of a 12-ounce bottle. Initially priced at 10 cents, sales were slow, but when the price
was slashed to five cents, sales increased substantially. With a radio advertising campaign
featuring the jingle "Pepsi-Cola hits the spot / Twelve full ounces, that's a lot / Twice as
much for a nickel, too / Pepsi-Cola is the drink for you," arranged in such a way that the
jingle never ends. Pepsi encouraged price-watching consumers to switch, obliquely referring
14
to the Coca-Cola standard of six ounces per bottle for the price of five cents (a nickel),
instead of the 12 ounces Pepsi sold at the same price. Coming at a time of economic crisis,
the campaign succeeded in boosting Pepsi's status. In 1937 500,000,000 bottles of Pepsi were
consumed. From 1936 to 1938, Pepsi-Cola's profits doubled.
Pepsi's success under Guth came while the Loft Candy business was faltering. Since
he had initially used Loft's finances and facilities to establish the new Pepsi success, the near-
bankrupt Loft Company sued Guth for possession of the Pepsi-Cola company. A long legal
battle, Guth v. Loft, then ensued, with the case reaching the Delaware Supreme Court and
ultimately ending in a loss for Guth.
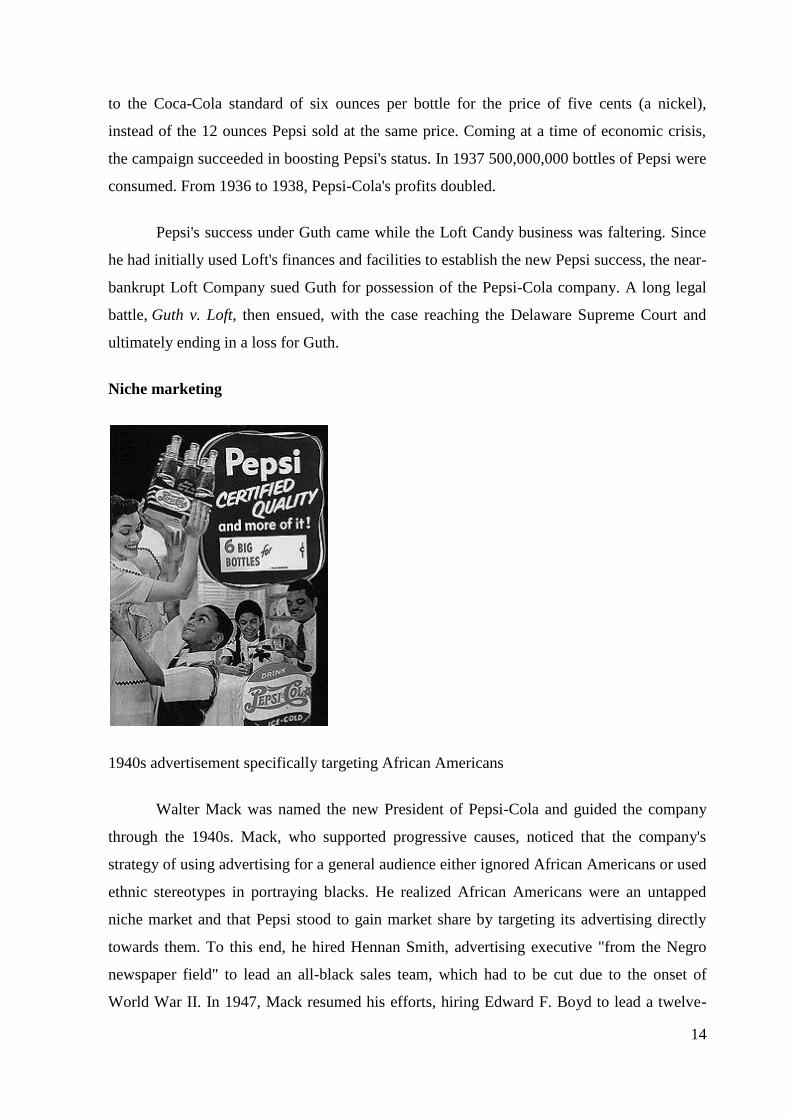
Niche marketing
1940s advertisement specifically targeting African Americans
Walter Mack was named the new President of Pepsi-Cola and guided the company
through the 1940s. Mack, who supported progressive causes, noticed that the company's
strategy of using advertising for a general audience either ignored African Americans or used
ethnic stereotypes in portraying blacks. He realized African Americans were an untapped
niche market and that Pepsi stood to gain market share by targeting its advertising directly
towards them. To this end, he hired Hennan Smith, advertising executive "from the Negro
newspaper field" to lead an all-black sales team, which had to be cut due to the onset of
World War II. In 1947, Mack resumed his efforts, hiring Edward F. Boyd to lead a twelve-

15
man team. They came up with advertising portraying black Americans in a positive light,
such as one with a smiling mother holding a six pack of Pepsi while her son (a young Ron
Brown, who grew up to be Secretary of Commerce) reaches up for one. Another ad
campaign, titled "Leaders in Their Fields", profiled twenty prominent African Americans
such as Nobel Peace Prize winner Ralph Bunche and photographer Gordon Parks.
Boyd also led a sales team composed entirely of blacks around the country to promote
Pepsi. Racial segregation and Jim Crow laws were still in place throughout much of the U.S.;
Boyd's team faced a great deal of discrimination as a result, from insults by Pepsi co-workers
to threats by the Ku Klux Klan. On the other hand, they were able to use racism as a selling
point, attacking Coke's reluctance to hire blacks and support by the chairman of Coke for
segregationist Governor of Georgia Herman Talmadge. As a result, Pepsi's market share as
compared to Coke's shot up dramatically. After the sales team visited Chicago, Pepsi's share
in the city overtook that of Coke for the first time.
This focus on the market for black people caused some consternation within the
company and among its affiliates. They did not want to seem focused on black customers for
fear white customers would be pushed away. In a meeting at the Waldorf-Astoria Hotel,
Mack tried to assuage the 500 bottlers in attendance by pandering to them, saying, "We don't
want it to become known as a nigger drink." After Mack left the company in 1950, support
for the black sales team faded and it was cut.
Marketing
Pepsi logo (1973-87). In 1987, the font was modified slightly to a more rounded
version which was used until 1991. This logo was used for Pepsi throwback in 2010
Other current Pepsi logo (2003-2010). Pepsi Wild Cherry and Pepsi ONE still use this design
as do most countries as of November 2009.

16
Pepsi bottle in Mexico.
As of November 2009, this logo is still in use in Mexico and most countries.
In 1975, Pepsi introduced the Pepsi Challenge marketing campaign where PepsiCo
set up a blind tasting between Pepsi-Cola and rival Coca-Cola. During these blind taste tests
the majority of participants picked Pepsi as the better tasting of the two soft drinks. PepsiCo
took great advantage of the campaign with television commercials reporting the results to the
public.
In 1976 Pepsi, RKO Bottlers in Toledo, Ohio hired the first female Pepsi salesperson,
Denise Muck, to coincide with the United States bicentennial celebration.
In 1996, PepsiCo launched the highly successful Pepsi Stuff marketing strategy. By
2002, the strategy was cited by Promo Magazine as one of 16 "Ageless Wonders" that
"helped redefine promotion marketing."
In 2007, PepsiCo redesigned their cans for the fourteenth time, and for the first time,
included more than thirty different backgrounds on each can, introducing a new background
every three weeks. One of their background designs includes a string of repetitive numbers
73774. This is a numerical expression from a telephone keypad of the word "Pepsi."
In late 2008, Pepsi overhauled their entire brand, simultaneously introducing a new
logo and a minimalist label design. The redesign was comparable to Coca-Cola's earlier
simplification of their can and bottle designs. Also in 4th quarter of 2008 Pepsi teamed up
with Google/You Tube to produce the first daily entertainment Show on YouTube, Pop tub.
This daily show deals with pop culture, internet viral videos, and celebrity gossip. Pop tub is
updated daily from Pepsi.

17
Since 2007, Pepsi, Lay's, and Gatorade have had a "Bring Home the Cup," contest for
Canada's biggest hockey fans. Hockey fans were asked to submit content (videos, pictures or
essays) for a chance at winning a party in their hometown with the Stanley Cup and Mark
Messier.
In 2009, "Bring Home the Cup," changed to "Team Up and Bring Home the Cup." The new
installment of the campaign asks for team involvement and an advocate to submit content on
behalf of their team for the chance to have the Stanley Cup delivered to the team's hometown
by Mark Messier.
Pepsi has official sponsorship deals with three of the four major North American
professional sports leagues: the National Football League, National Hockey League and
Major League Baseball. Pepsi also sponsors Major League Soccer.
Pepsi also has sponsorship deals in international cricket teams. The Pakistan cricket
team is just one of the teams that the brand sponsors. The team wears the Pepsi logo on the
front of their test and ODI test match clothing.
On July 6, 2009, Pepsi announced it would make a $1 billion investment in Russia
over three years, bringing the total Pepsi investment in the country to $4 billion.
In July 2009, Pepsi started marketing itself as Pepsi in Argentina in response to its
name being mispronounced by 25% of the population and as a way to connect more with all
of the population.
In October 2008, Pepsi announced that it would be redesigning its logo and re-
branding many of its products by early 2009. In 2009, Pepsi, Diet Pepsi and Pepsi Max began
using all lower-case fonts for name brands, and Diet Pepsi Max was re-branded as Pepsi
Max.
The brand's blue and red globe trademark became a series of "smiles," with the
central white band arcing at different angles depending on the product. Pepsi released this
logo in U.S. in late 2008, and later it was released in 2009 in Canada, Brazil, Bolivia,
Guatemala, Nicaragua, Honduras, El Salvador, Colombia, Argentina, Puerto Rico, Costa
Rica, Panama, Chile, Dominican Republic, the Philippines and Australia; in the rest of the

18
world the new logo will be released in 2010. As of Present, The UK has started to use the
new Pepsi logo on cans in a different ordered style to the US can.
Pepsi and Pepsi Max cans and bottles in Australia now carry the localized version of
the new Pepsi Logo. The word Pepsi and the logo are in the new style, while the word "Max"
is still in the previous style. Pepsi Wild Cherry continues to carry the 2003 Pepsi design on
bottles and cans as of November 2009.
Rivalry with Coca-Cola
Main article: Cola Wars
According to Consumer Reports, in the 1970s, the rivalry continued to heat up the
market. Pepsi conducted blind taste tests in stores, in what was called the "Pepsi Challenge".
These tests suggested that more consumers preferred the taste of Pepsi (which is believed to
have more lemon oil, less orange oil, and uses vanillin rather than vanilla) to Coke. The sales
of Pepsi started to climb, and Pepsi kicked off the "Challenge" across the nation. This
became known as the "Cola Wars."
In 1985, The Coca-Cola Company, amid much publicity, changed its formula. The
theory has been advanced that New Coke, as the reformulated drink came to be known, was
invented specifically in response to the Pepsi Challenge. However, a consumer backlash led
to Coca-Cola quickly introducing a modified Version of the original formula (removing the
expensive Haitian lime oil and changing the sweetener to corn syrup) as Coke "Classic".
According to Beverage Digest's 2008 report on Carbonated Soft Drinks (CSD),
PepsiCo's U.S. market share is 30.8 percent, while The Coca-Cola Company's is 42.7
percent. Coca-Cola outsells Pepsi in most parts of the U.S., notable exceptions being central
Appalachia, North Dakota, and Utah. In the city of Buffalo, New York, Pepsi outsells Coca-
Cola by a two-to-one margin.
Overall, Coca-Cola continues to outsell Pepsi in almost all areas of the world.
However, exceptions include India; Saudi Arabia; Pakistan (Pepsi has been a dominant
sponsor of the Pakistan cricket team since the 1990s); the Dominican Republic; Guatemala
the Canadian provinces of Quebec, Newfoundland and Labrador, Nova Scotia, and Prince
Edward Island; and Northern Ontario.

19
Pepsi had long been the drink of Canadian Francophone and it continues to hold its
dominance by relying on local Québécois celebrities (especially Claude Meunier, of La
Petite Vie fame) to sell its product. PepsiCo use the slogan "here, it's Pepsi" (Ice, c'est Pepsi)
to answer to Coca-cola publicity "Everywhere in the world, it's Coke" (Partout dans le
monde, c'est Coke).
By most accounts, Coca-Cola was India's leading soft drink until 1977 when it left
India after a new government ordered The Coca-Cola Company to turn over its secret
formula for Coke and dilute its stake in its Indian unit as required by the Foreign Exchange
Regulation Act (FERA). In 1988, PepsiCo gained entry to India by creating a joint venture
with the Punjab government-owned Punjab Agro Industrial Corporation (PAIC) and Voltas
India Limited. This joint venture marketed and sold Lehar Pepsi until 1991 when the use of
foreign brands was allowed; PepsiCo bought out its partners and ended the joint venture in
1994. In 1993, The Coca-Cola Company returned in pursuance of India's Liberalization
policy. In 2005, The Coca-Cola Company and PepsiCo together held 95% market share of
soft-drink sales in India. Coca-Cola India's market share was 52.5%
A sticker from a USSR-produced Pepsi bottle.
In Russia, Pepsi initially had a larger market share than Coke but it was undercut once
the Cold War ended. In 1972, PepsiCo Company struck a barter agreement with the then
government of the Soviet Union, in which PepsiCo was granted exportation and Western
marketing rights to Stolichnaya vodka in exchange for importation and Soviet marketing of
Pepsi-Cola. This exchange led to Pepsi-Cola being the first foreign product sanctioned for
sale in the U.S.S.R.
Reminiscent of the way that Coca-Cola became a cultural icon and its global spread
spawned words like "coca colonization", Pepsi-Cola and its relation to the Soviet system
turned it into an icon. In the early 1990s, the term "Pepsi-stroika" began appearing as a pun
on "perestroika", the reform policy of the Soviet Union under Mikhail Gorbachev. Critics
viewed the policy as a lot of fizz without substance and as an attempt to usher in Western
products in deals there with the old elites. Pepsi, as one of the first American products in the
Soviet Union, became a symbol of that relationship and the Soviet policy. This was reflected
in Russian author Victor Pelevin's book "Generation P".

20
In 1989, Billy Joel mentions the rivalry between the two companies in the song
"WeDidn’t Start the Fire". The line "Rock & Roll and Cola Wars" refers to Pepsi and Coke's
usage of various musicians in their advertising campaigns. Coke used Paula Abdul, while
Pepsi used Michael Jackson. They then continued to try to get other musicians to advertise
their beverages.
In 1992, following the Soviet collapse, Coca-Cola was introduced to the Russian
market. As it came to be associated with the new system and Pepsi to the old, Coca-Cola
rapidly captured a significant market share that might otherwise have required years to
achieve. By July 2005, Coca-Cola enjoyed a market share of 19.4 percent, followed by Pepsi
with 13 percent.
Pepsi did not sell soft drinks in Israel until 1992. Many Israelis and some American
Jewish organizations attributed Pepsi's previous reluctance to do battle to the Arab boycott.
Pepsi, which has a large and lucrative business in the Arab world, denied that. It said
economic rather than political reasons kept it out of Israel.
Slogans
A large advertisement made to resemble a Pepsi cup at Nickelodeon Universe in the Mall of
America.

21
1939–1950: "Twice as Much for a Nickel"
1950: "More Bounce to the Ounce"
1950–1957: "Any Weather is Pepsi Weather"
1957–1958: "Say Pepsi, Please"
1958–1961: "Be Sociable, Have a Pepsi"
1961-1963: "Now It's Pepsi for Those Who Think Young" (jingle sung by Joanie
Sommers)
1963–1967: "Come Alive, You're in the Pepsi Generation" (jingle sung by Joanie
Sommers)
1967–1969: "(Taste that beats the others cold) Pepsi Pours It On".
1969–1975: "You've Got a Lot to Live, and Pepsi's Got a Lot to Give"
1975–1977: "Have a Pepsi Day"
1977–1980: "Join the Pepsi People (Feeling Free)"
1980–1981: "Catch That Pepsi Spirit" [David Lucas, composer]
1981–1983: "Pepsi's got your taste for life"
1983: "It's cheaper than Coke!"
1983–1984: "Pepsi Now! Take the Challenge!"
1984–1991: "Pepsi. The Choice of a New Generation" (commercial with Michael
Jackson and The Jacksons, featuring Pepsi version of Billie Jean)
1984-1988: "Diet Pepsi. The Choice of a New Generation"
1988-1989: "Diet Pepsi. The Taste That's Generations Ahead"
1989-1990: "Diet Pepsi. The Right One"
1989-1992: "Diet Pepsi. The Taste That Beats Diet Coke"
1986–1987: "We've Got The Taste" (commercial with Tina Turner)
1987–1990: "Pepsi's Cool" (commercial with Michael Jackson, featuring Pepsi
version of Bad)
1990–1991: "You got the right one Baby UH HUH" (sung by Ray Charles for Diet
Pepsi)
1990–1991: "Yehi hai right choice Baby UH HUH" (Hindi - meaning "This is the
right choice Baby UH HUH") (India)
1991–1992: "Gotta Have It"/"Chill Out"
1992–1993: "Be Young, Have Fun, Drink Pepsi"
1993–1994: "Right Now" Van Halen song for the Crystal Pepsi advertisement.
1994–1995: "Double Dutch Bus" (Pepsi song sung by Brad Bentz)

22
1995: "Nothing Else is a Pepsi"
1995–1996: "Drink Pepsi. Get Stuff." Pepsi Stuff campaign
1996–1997: "Pepsi: There’s nothing official about it" (During the Wills World Cup
(cricket) held in India/Pakistan/Sri Lanka)
1997–1998: "Generation Next" - with the Spice Girls.
1998–1999: "It's the cola" (100th anniversary commercial)
1999–2000: "For Those Who Think Young"/"The Joy of Pepsi-Cola" (commercial
with Britney Spears/commercial with Mary J. Blige)
1999-2006: "Yeh dil maange more" (Hindi - meaning "This heart asks for more")
(India)
2003: "It's the Cola"/"Dare for More" (Pepsi Commercial)
2005–2006: "An ice cold Pepsi. It's better than sex!" (Larry Sypolt)
2006–2007: "Why You Doggin' Me"/"Taste the one that's forever young"
Commercial featuring Mary J. Blige
2007–2008: "More Happy"/"Taste the once that's forever young" (Michael
Alexander)
2008: "Pepsi Stuff" Super Bowl Commercial (Justin Timberlake)
: "Pepsi is #1" TV commercial (Luke Rosin)
–present: "Something for Everyone."
–present: "Refresh Everything"/"Every Generation Refreshes The World"
–present: "Yeh hai youngistaan meri jaan" (Hindi - meaning "This is our young
country my baby") (India)
–present: "My Pepsi My Way"(India)
–present: "Refresca tu Mundo" (Spanish - meaning "Refresh your world") (Latin
America)
-present: "Every Pepsi refreshes the world."
-present "Pepsi. Sarap Magbago." (Philippines)

23
Pepsi man
Pepsi man is an official Pepsi mascot from Pepsi's Japanese corporate branch. The
design of the Pepsi man character is attributed to Canadian comic book artist Travis Charest
created sometime around the mid 1990s. Pepsi man took on three different outfits; each one
representing the current style of the Pepsi can in distribution. Twelve commercials were
created featuring the character. His role in the advertisements is to appear with Pepsi to
thirsty people or people craving soda. Pepsi man happens to appear at just the right time with
the product. After delivering the beverage, sometimes Pepsi man would encounter a difficult
and action oriented situation which would result in injury.
In 1996, Sega-AM2 released the Sega Saturn version of their arcade fighting
game Fighting Vipers. In this game Pepsi man was included as a special character, with his
specialty listed as being the ability to "quench one's thirst". He does not appear in any other
version or sequel. In 1999, KID developed a video game for the PlayStation entitled Pepsi
man. As Pepsi man, the player runs, skateboards, rolls, and stumbles through various areas,
avoiding dangers and collecting cans of Pepsi all while trying to reach a thirsty person as in
the commercials.
Colas
'Edge'
: PepsiCo's new drink (Vanilla flavored.)
Pepsi
: PepsiCo's signature cola flavor and its namesake cola.
Diet Pepsi
: Artificial-sweetener variant
Pepsi Free
The first major-brand caffeine-free cola introduced in 1982. Currently marketed
as Caffeine-Free Pepsi and Caffeine-Free Diet Pepsi.

24
Pepsi Max: Low-calorie, sugar-free version of Pepsi.
Crystal Pepsi
: Clear cola; sold from 1992–1993.
Crystal from Pepsi
: Citrus-flavored reformulation of Crystal Pepsi.
Pepsi Clear
: Clear soda released in Mexico as a limited edition during Christmas 2005, the
Mexican equivalent of Crystal Pepsi
Pepsi AM
: Increased caffeine; marketed as a morning drink. Sold 1989–1990.
Pepsi Boom
: Caffeine, sugar and artificial sweetener-free. Sold in Germany, Italy and Spain
Pepsi Fresh
: Introduced Summer 2007
Pepsi Natural (Pepsi Raw in United Kingdom): Containing only "natural ingredients".
Released in select markets in U.S. and Mexico in 2009.
Pepsi Shiso
Introduced only in Japan as a limited edition for summer 2009, its transparent green.
Size: 147ml can, price: 147 yen. Also available in 500ml plastic bottles. Shiso in English is
"labiate" or "perilla".
Pepsi NEX
Zero calories. Distributed by Suntory.

25
Pepsi Blue
Blue-colored berry-flavored soda. Available 2002–2004 in the U.S.; remains available
in other countries.
Pepsi Blue Hawaii
Blue-colored, pineapple and lemon flavored. Released in Japan.
Pepsi Carnival
Tropical fruit-flavored, Introduced in Japan for a limited time summer 2006. Later
released as Pepsi Summer Mix in 2007 in the U.S.
Pepsi Fire
Limited edition, cinnamon-flavored. Sold in Guam, Saipan, Thailand, Mexico,
Malaysia, Singapore and the Philippines.
Pepsi Gold
Gold-colored, ginger-flavored variant available as part of a 2006 FIFA World Cup and
ICC Cricket World Cup 2007 promotion. Sold in Southeast Asia, Central Europe and Russia.
Pepsi Green
Bright-green variety introduced in Thailand in early 2009.
Pepsi Holiday Spice
Seasonal, cinnamon-flavored variant available fall 2004 and 2006 in the U.S. and
Canada.
Christmas Pepsi
Similar to Holiday Spice, with nutmeg and cocoa added to the ingredients list.
Available during 2007–2008 holiday seasons.

26
Pepsi Ice
Icy mint flavor. Sold in Guam, Thailand, Malaysia, Singapore and the Philippines. In
summer 2007, Pepsi used the name Pepsi Ice in the Czech Republic and Slovakia for a
limited edition cola with apple flavor.
Pepsi Ice Cucumber
Limited edition green, cucumber-flavored Pepsi sold in Japan in summer 2007.
Pepsi Jazz
Jazz with Black Cherry and French Vanilla, Jazz with Strawberries and Cream, and
Caramel Cream made in 2006.
Pepsi Kona
Coffee-flavored, test-marketed on the U.S. East Coast.
Pepsi Kick
Regular formula, with Ginseng and higher amount of caffeine. Uses the recent Pepsi
logo. Sold only in Latin America.
Lemon Pepsi
Lemon-flavored, available as a promotion for the beginning of the 2008 NFL season.
Pepsi Lime
Lime-flavored, introduced in spring 2005.

27
Pepsi Limon
Lime-flavored, released in Mexico in 2002. Re-introduced as Pepsi Twist in 2004,
since discontinued.
Pepsi A-ha
Lemon-flavored, sold in India.
Pepsi ONE
One-calorie Pepsi. Introduced in 1997.
Pepsi Raging Razz berry
Raspberry-flavored, available in 1991.
Pepsi Raw
British name for Pepsi Natural
Pepsi Red
Spicy, ginger-flavored. Released in Japan in 2006.
Pepsi Retro
With "natural" ingredients (sugar cane and kola nut extract). Released in Mexico in
February 2008, relaunched as Pepsi Natural in August 2009.
Pepsi Samba
Tropical-flavored (mango and tamarind). Introduced in Australia in 2005.
Pepsi Si
Marketed in predominantly Hispanic areas.

28
Pepsi Strawberry Burst
Pepsi Summer Chill
Apple-flavored, sold in Poland during summer 2007. Marketed as Pepsi Ice in the
Czech Republic and Slovakia.
Pepsi Summer Mix
Pepsi with tropical fruit flavors. Available in 2007 in limited areas.
Pepsi Throwback
Sweetened with sugar instead of high-fructose corn syrup, no citric acid, and in retro-
styled packaging. Brought back in December 2009 for 8 weeks after fan requests. As of
3/3/10 it is planning a possible world tour.
Pepsi Tropical Chill
Pepsi Tropical
Tropical-flavored, available in the U.S., U.K. and Japan in late 1994.
Pepsi Twist
Lemon-flavored
Pepsi Twist Mojito
Mojito and lemon-flavored. Non-alcoholic. Sold in Italy.
Pepsi Twistão
Strong lemon flavor, sold during summertime in Brazil. "Twistão", in Portuguese, is
the augmentative of "Twist".

29
Pepsi Vanilla
Vanilla-flavored, released in Canada and the U.S. in 2003 in response to Vanilla Coke.
Marketed as Pepsi Ice Cream in Russia.
Pepsi White
Yogurt-flavored, available in Japan.
Pepsi Wild Cherry
Cherry-flavored, introduced in 1988 as "Wild Cherry Pepsi". Changed name and
formula in 2005. Still uses the 2003 Pepsi design as of September 2009.
Pepsi 100
Available in 1998 for the anniversary of the drink and in 2003 for the anniversary of
the name "Pepsi".
Ingredients
Pepsi is made with carbonated water, high fructose corn syrup, caramel color, sugar,
phosphoric acid, caffeine, citric acid and natural flavors. A can of Pepsi (12 fl ounces) has 41
grams of carbohydrates (all from sugar), 30 mg of sodium, 0 grams of fat, 0 grams of protein,
38 mg of caffeine and 150 calories. The caffeine-free Pepsi-Cola contains the same
ingredients but without the caffeine.
The original Pepsi-Cola recipe was available from documents filed with the court at the time
that the Pepsi-Cola Company went bankrupt in 1929. The original formula contained neither
cola nor caffeine.
Competitors
-Cola
. Cola

30
ORGANISATION PROFILE-PEPSI CO. INC:
Pepsi co, INC is founded by DONALD M.KENDALL, President and chief executive
officer of Pepsi-cola and HERMAN W.LA Y Chairman &chief executive of Frito- Lay
through the Merger of two companies in the year 1965. CALEB BRADHAM, a New Bern,
created Pepsi-cola in the late 1890’s; C. Pharmacist, FRITO-LA Y, Inc. was formed by
ELEMER DOOLIN in 1932.
Major Products Of The New Companies Are:
Pepsi-cola Company----------- Pepsi -cola (formulated in 1898), Diet Pepsi (1964),
Mountain Dew (introduced by T.P Corporation 1948). Frito-lay Inc-----Fritos brand corn
chips, lay's brand potato chips, cheetos brand cheese flavored snacks, Ruffles brand potato
chips& Rold gold brand petzels.
Pepsi co, Inc. is among the most successful consumer products co in the world, with
1998 revenues of over $22 billion & 1,5 1,000 Employees. Pepsi company's brand names are
among the best known &most respected in the world. Some of the Pepsi Company's brand
names are 100 years old.
Frito-lay Company is the world's largest manufacturers and distributors of snack chip
and Tropicana products, Inc., is the world's largest marketer and producer of branded juices.
Pepsi Company's success is the result of
(a) Superior products
(b) High standards of performance
(c) Distinctive competitive strategies
(d) High integrity of its work force
Pepsi co., Inc., world head quarter is located in purchase, New York

31
PEPSI-COLA COMPANY
Calets Brabdham, a NEW BERU, and M. C. Druggist who first formulated Pepsi-
cola founded Pepsi Company's beverage business at the turn of the century.
Brand Pepsi and other Pepsi-cola products including diet Pepsi one, mountain dew
slice and mug brands account for nearly 1/3 of total soft drink in United States.
Out side U.S., Pepsi-cola company's soft drinks operations include the business of 7 -
up international. Pepsi-cola beverages are available in about 170 countries.
Pepsi-cola began selling its products internationally in the year 1934 with its
operations in Canada.
Key Pepsi-cola international markets include Argentina, Brazil, China, India, Mexico,
Philippines, Saudi Arabia, Spain, Thailand and United Kingdom.
Pepsi-cola provides advertising, marketing, sales and promotion support to Pepsi-cola
bottlers.
This includes some of the worlds best loved and most recognizing. New advertising
and existing promotions keep Pepsi-cola brands young.
The company manufactures and sells soft drink concentrate to Pepsi-cola bottlers.
1966 Pepsi enters Japan and Eastern Europe 1967 Pepsi Co. stock splits two-for one.
1968 North American van lines (NAVL) a premier transportation company, Pepsi co.,
and remained a strong contributor to Pepsi until it has divested in 1984.
1969 Bold modern Pepsi-cola packaging using red, white & blue is introduced. Frito-
Iay introduces Funyuns brand onion flavored snacks.
1970 Pepsi introduces the industry's first two liter bottles. Pepsi is the first company
to respond to consumer preference with lightweight, recyclable. Plastic bottles.
1971 Andrall E.Pearson is appointed president of Pepsi co., a position he holds unti I
his retirement in 1984.

32
1972 Don Kendrall announces agreement-making Pepsi-cola the first foreign product
sold in the then U.S.S.R. Pepsi co. is given exclusive rights to import Stolichnaya Russian
vodka in the U.S.
1974 Pepsi-cola becomes the first American consumer product to be produced,
marked and sold in the former Soviet Union.
1975 Pepsi Light, with a distinctive lemon taste, is introduced as an alternative to
traditional diet colas.
1976 Pepsi co. adopts code of worldwide business conduct. Pepsi-cola becomes the
single largest selling soft drinks brand sold in U.S. super markets.
1977 Pepsi co. stock splits three for one.
1979 Opening of Pepsi co. Research and technical center in Vallah, N.Y. Pepsi co. reaches
85 billion make in sales. Pepsi introduces twelve-pack cans.
1980 Pepsi co. food service international (PFSI) is formed to focus on over seas
development of restaurants.
1981 Pepsi co. fitness center is completed, making Pepsi co., one of the most
advanced companies in the area of employees' health & fitness.
1982 Pepsi free & Diet Pepsi free, the first major brand caffeine free colas are
introduced.
Inauguration of the first Pepsi-cola operation in China
1983 The Bottler Hall of Fame is established to recognize the achievement &
dedication of international bottlers.
1984 Diet Pepsi is reformulated with 100% Nutra Sweet, slice and Diet slice, the first
major soft drinks with fruit juice, are introduced.

33
1985 Pepsi companies first line of sweet snacks, sonrics is added in Mexico. The cola
war takes "one grant sip for mankind ", when a Pepsi "space can" is successfully tested
abroad the space shuttle.
1986 Pepsi co. Board of Directors visits the people's Republic of China to mark the
opening Pepsi's second bottling plant in China.
1987 Pepsi-cola Company moves to new head quarters in somersw, N.Y. Pepsi
sponsors tour of major music stars, including Miami sound Machine, David BowIe and Tina-
Tuner.
1988 Pepsi-Cola Company is re-organized along geographic lines- East, West, south
and Central Regions- each with its own president and senior management staff.
1989 Pepsi Company introduces share power stock option program for all employees
becoming the first large corporation to award stock options to virtually all fulltime
employees.
1990 Pepsi company named one of the fortune magazine's top 1 0 " most admired
corporations" for the second year in a row.
Pepsi signs the largest commercial trade agreement in history with the Soviet Union,
expecting sales in the U.S.S.R, to double by the end of the century. Pepsi re- entered the
Indian market in collaboration with Punjab Agro Industries Corporation (PAIC).
1991 Pepsi Company named one of the Fortune Magazines top 10 "most admired
corporations" for the 3rd year in a row.
Pepsi-cola introduces a new logo, its eighth in the year 1993.
Pepsi-cola forms joint venture with Thomas j. Lipton Company to develop and
market tea -based drinks.
Pepsi Company named one of fortune Magazines top 10 "most admired corporations
for the 4th year in a row.

34
Pepsi Company purchases an equity position 111 carts of Colors, Inc. the leading
manufacturer and marketer of mobile merchandising equipment. It is sold in 1995.
1993 Pepsi -cola begins distribution of Lipton's line of ready to drink teas nationwide.
Pepsi introduces "the cube" an innovation 24-can multipack that satisfies growing consumer
demand for convenient large size soft drink packaging.
Pepsi-cola international introduces Pepsi max, a soft drink with unique blend of
sweeteners that delivers maximum cola taste in a no-sugar product.
1994 Pepsi introduces Aquafina bottled water into test market.
1995 7 up international launches 7-up ice cola, a new clear cola. Pepsi Company
introduced lay's brand potato chips in 20 markets throughout the world.
1996 Pepsi co is on-line at
http://www.pepsico.com/launches and international operations combined into Pepsi-
cola Company. 1997 Pepsi Company announces plans to spin off its restaurants business as
an independent publicly traded company sell its food distribution company and focus on its
core beverage and snack food business. The spinoff is completed on October 6, 1997.
Shareholders receive one share in the new company, tricon Global Restaurants Inc.,
for every 10 shares they hold in Pepsi co. Inc. 1998 Pepsi-cola celebrates 100th Anniversary
with first worldwide bottlers conference held in Hawaii, the event is held during the same
time as first bottler's conference.
Pepsi-cola introduces two-liter plastic bottles with built in "grip handle" that makes it
easier to grip and pour.
Cadbury Schweppes pk. Agrees to purchase E.Wedel S.A Chocolate business from
Pepsi Company.
1999 In March the Pepsi Bottling group, the world's largest Pepsi bottler, begins
trading on the New York stock exchange. Pepsi-cola teams up with yahoo Inc. the biggest
web navigation company in a multimedia marketing campaign aimed at teens and young
adults.

35
Pepsi Company named to Fortune Magazine's list of "the fifty best companies for
Asians, Blacks and Hispanies". Aquafina to become official
Beverage sponsor of the All-American soccer stars victory tour.
2000 Pepsi-cola company launches new beverage line of fruit drinks (apple raspberry,
peach papaya, pink lemonade, strawberry melon, newgerine citrus).
Pepsi-cola re-introduced the Pepsi Company one of America's "50 best companies for
minorities". Chemicals used are ferrous, sulphate calcium hydroxide and chlorine initially
water is treated with all these chemicals in the treatment tank and become purified.
Pepsi Co is a world leader in convenient food and beverages, with revenues of about
$25 billion and over 142,000 employees. The company consists of the snack business of
Frito-Lay North America and the beverage Ana food businesses of PepsiCo Beverages and
Foods. Which includes Pepsi Co Beverages and Foods, which includes Pepsi Co Beverages
North America (Pepsi-Cola North America and Gatorade /
Tropicana North America) and Quaker Foods North America. PepsiCo International
includes the snack businesses of Frito-Lay International and beverage businesses of PepsiCo
Beverages International. PepsiCo brands are available in nearly 200 countries and territories.
Many of PepsiCo's brand names are over l00-years-old, but the corporation is relatively
young. PepsiCo was founded in 1965 through the merger of Pepsi-Cola and Frito-Lay.
Tropicana was acquired in 1998 and PepsiCo merged with The Quaker Oats Company,
including Gatorade, in 2001.
PepsiCo's success is the result of superior products, high standards of performance,
distinctive competitive strategies and the high integrity of our people.
Our mission is to be the world's premier consumer Products Company focused on
convenient foods and beverages. We seek to produce healthy financial rewards to investors
as we provide opportunities for growth and enrichment to our employees, our business
partners and the communities in which we operate. And in everything we do, we strive for
honesty, fairness and integrity.

36
SHAREHOLDERS
PepsiCo (symbol: PEP) shares are traded principally on the EW York Stock
Exchange in the United States. The company is also listed on the Amsterdam, Chicago,
Swiss and Tokyo stock exchanges. PepsiCo has consistently paid cash dividends since the
corporation was founded.
CORPORATE CITIZENSHIP
PepsiCo believes that as a corporate citizen, it has a responsibility to contribute to the
quality of life in our communities. This philosophy is put into action through support of
social agencies, projects and programs. The scope of this support is extensive - ranging from
sponsorship of local programs and .Support of employee volunteer activities, to contributions
of time, talent and funds to programs of national impact. Each division is responsible for its
own giving program. Corporate giving is focused on giving where PepsiCo employees
volunteer.
PEPSICO HEADQUARTERS
PepsiCo World Headquarters IS located in Purchase, New York, approximately 45
minutes from New York City. The seven building headquarters complex was designed by
Edward Durrell Stone, one of America's foremost architects. The building occupies 10 acres
of a 144-acre complex that includes the Donald M. Kendall Sculpture Gardens, a world
acclaimed sculpture collection in a garden setting.
The collection of works is focused on major twentieth century art, and features works
by masters such as Augusta Rodin, Henri Laurens, Henry Moore, Alexander Calder, Alberto
Giacometti, Arnaldo Pomodoro and Claes Oldenberg. The gardens were originally designed
by the world famous garden planner, Russell Page, and have been extended by Franyois
Goffinets. The grounds are open to the public, and a visitor's booth is in operation during the
spring and summer.
PepsiCo's snack food operations had their start in 1932 when two separate events took
place. In San Antonio, Texas, Elmer Doolin bought the recipe for an

37
Unknown food product - a corn chip - and started an entirely new industry. The
product was Fritos brand corn chips, and his firm became the Frito Company.
That same year in Nashville, Tennessee, Herman W. Lay started his own business
distributing potato chips. Mr. Lay later bought the company that supplied him with product
and changed its name to H.W. Lay Company. The Frito Company and H.W. Lay Company
merged in 1961 to become Frito-Lay, Inc.
Today, Frito-Lay brands account more than half of the U.S. snack chip industry.
PepsiCo began its international snack food operations in 1966. Today, with
operations in more than 40 countries, it is the leading multinational snack chip company,
accounting for more than one quarter of international retail snack chip sales. Products are
available in some 120 countries. Frito-Lay North America includes Canada and the United
States. Major Frito-Lay International markets include Australia, Brazil, Mexico, the
Netherlands, South Africa, the United Kingdom and Spain.
Often Frito-Lay products are known by local names. These names include Matutano
in Spain, Sabritas and Gamesa in Mexico, Elma Chips in Brazil, Walkers in the United
Kingdom and others. The company markets Frito-Lay brands on a global level, and
introduces unique products for local tastes.
Major Frito-Lay products include Ruffles, Lay's and Doritos brands snack chips.
Other major brands include Cheetos cheese flavored snacks, Tostitos tortilla chips, Santitas
tortilla chips, Rold Gold pretzels and Sun Chips multi grain snacks. Frito Lay also sells a
variety of snack dips and cookies, nuts and crackers.
PEPSI – COLA
PepsiCo's beverage business was founded at the turn of the century by Caleb
Bradham, a New Bern, North Carolina druggist, who first formulated Pepsi Cola. Today
consumers spend about $33 billion on Pepsi-Cola beverages.
Brand Pepsi and other Pepsi-Cola products - including Diet Pepsi, Pepsi-One,
Mountain Dew, Slice, Sierra Mist and Mug brands - account for nearly one-third of total soft
drink sales in the United States, a consumer market totaling about $60 billion.

38
Pepsi-Cola also offers a variety of non-carbonated beverages, including Aquafina
bottled water, Fruit works and All Sport.
In 1992 Pepsi-Cola formed a partnership with Thomas J. Lipton Co. Today Lipton is
the biggest selling ready-to-drink tea brand in the United States. Pepsi Cola also markets
Frappuccino ready-to-drink coffee through a partnership with Starbucks.
In 2001 SoBe became a part of Pepsi-Cola. SoBe manufactures and markets an
innovative line of beverages including fruit blends, energy drinks, dairy-based drinks, exotic
teas and other beverages with herbal ingredients.
Outside the United States, Pepsi-Cola soft drink operations include the business of
Seven-Up International. Pepsi-Cola beverages are available in about 160 countries and
territories.
Pepsi-Cola began selling its products internationally in 1934 with its operations in
Canada. Operations grew rapidly beginning in the 1950s. In addition to brands marketed in
the United States, major products include Mirinda and Pepsi Max. Pepsi-Cola North America
includes the United States and Canada. Key international markets include Argentina, Brazil,
China, India, Mexico, Philippines, Saudi Arabia, Spain, Thailand and the United Kingdom.
PepsiCo Beverages International also produces, sells and distributes Gatorade sports drinks
as well as Tropicana and other juices internationally.
Pepsi-Cola provides advertising, marketing, sales and promotional support to Pepsi-
Cola bottlers and food service customers. This includes some of the world's best-loved and
most-recognized advertising. New advertising and exciting promotions keep Pepsi-Cola
brands young.
The company manufactures and sells soft drink concentrate to Pepsi-Cola bottlers.
The company also provides fountain beverage products.

39
GATORADE & TROPICANA
Tropicana was founded in 1947 by Anthony Rossi as a Florida fruit packaging business. The
company entered the concentrate orange juice business in 1949, registering Tropicana as a
trademark.
In 1954 Rossi pioneered a pasteurization process for orange juice. For the first time,
consumers could enjoy the fresh taste of pure not-from-concentrate 100% Florida orange
juice in a ready-to-serve package. The juice, Tropicana Pure Premium, became the
company's flagship product.
In 1957 the name of the company was changed to Tropicana Products, headquartered
in Bradenton, Florida. The company went public in 1957, was purchased by Beatrice Foods
Co. in 1978, acquired by Kohlberg Kravis & Roberts in 1986 and sold to The Seagram
Company Ltd. in 1988. Seagram purchased the Dole global juice business in 1995. PepsiCo
acquired Tropicana, including the Dole juice business, in August 1998.
Today the Tropicana brand is available in 63 countries. Principal brands in North
America are Tropicana Pure Premium, Tropicana Season's Best, Dole Juices and Tropicana
Twister. Internationally, principal brands include Tropicana Pure Premium and Dole juices
along with Frui'Vita, L06za and Copella. Tropicana Pure Premium is the third largest brand
of all food products sold 111 grocery stores in the United States.
Gatorade sports drinks were acquired by the Quaker Oats Company in 1983 and
became a part of PepsiCo with the merger in 2001. Gatorade is the first isotonic sports drink.
Created in 1965 by researchers at the University of Florida for the school's football team,
"The Gators," Gatorade is now the world's leading sport's drink.
QUAKER FOODS
The Quaker Oats Company was formed in 190 1 when several American pioneers in
oat milling came together to incorporate. In Ravenna, Ohio, Henry D. Seymour and William
Heston had established the Quaker Mill Company and registered the now famous trademark.
Seymour wanted his product to be a symbol of honesty, integrity and strength. The- figures
of a man in Quaker clothes became the first registered trademark for breakfast cereal and
remains the hallmark for Quaker Oats today.

40
In Cedar Rapids, Iowa, John Stuart and his son, Robert, and their partner, George
Douglas, operated the largest cereal mill of the time. Ferdinand Schumacher, known as "The
Oatmeal King," had founded German Mills American Oatmeal Company in 1856.
Combining The Quaker Mill Company with the Stuart and Schumacher businesses
brought together the top oats milling expertise in the country as The Quaker Oats Company.
The first major acquisition of the company was Aunt Jemina Mills Company in 1926,
which is today the leading manufacturer of pancake mixes and syrup.
In 1986, The Quaker Oats Company acquired the Golden Grain Company, producers
of Rice-A-Roni.
PepsiCo merged with The Quaker Oats Company in 200 1. Its products still have the
eminence of wholesome, good-for-you food, as envisioned by the company over a century
ago.
2001 Pepsi company announces a new joint venture will be formed in Egypt
combining the salt snack operations of Chipsy, the current market leader, and tasty foods,
which is owned by Pepsi company Pepsi company launches Diversity @work, http:
PEPSI CO. MISSION STATEMENT
Pepsi CO., overall mission is to increase the value of their shareholder's investment.
They believe that their commercial success depends upon offering quality and value
to their consumers and providing products that are safe, wholesome, and economically
efficient and environmentally sound; providing a fair return to their investors while
adhering to the highest standards of integrity.
PEPSI CO'S ENVIRONMENTAL COMMITMENT
As a consumer products company, Pepsi co. does not have the major environmental
problems of heavy industry. Their biggest environmental challenge is packing generated by
their products.

41
Packaging is important to public health and a critical component of the distribution
system that delivers products to consumers and commercial establishment. To meet both
consumer demand and safeguard the environment they recycle, reuse and reduce packaging
wherever possible.
Each business is also committed to responsible use of resources required in manufacturing
their products.
42
PROFILE OF THE PEARL BOTTLLING UNIT
2.2 COMPANY PROFILE
Often new flavors are added to the product line of cool drinks to prevent a competitor.
By establishing a relation with retailers it is also desirable to sell more than one flavor of cool
drinks to decrease the impact of seasonal fluctuations in the point of view of productions.
Additional products are added to utilize the franchise of Visakhapatnam region to Pearl
Beverages which belongs to Pearl group, Head quarters at Delhi and Mr.C.K.jaipuria is the
chairman, managing director of the group. Pepsi Food Ltd. appointed Krishna Mohan
Beverages and Constructions as franchise in the year 1992. In 2003 it was changed to P earl
beverages taken by the pearl group. The premises were originally owned by campa-cola soft
Drinks since 1980 at Madhurawada. After the insolvency of campa-cola, KMBC purchased
the premises in 1990 in the auction by APSFC. Initially, it used to produce cola, orange and
lemon flavors under the brand names of Thrill, Rush, and Sprint. It has also produced Me.
Dowell's soda and bagpiper soda. It produced these drinks under franchise agreements, but
company could not exist in the market due to stiff competition from Parle products.
Advantage of franchise -
Reduced investment levels in manufacturing equipments:
If a company sources its products from franchises, it does not require setting up its own
manufacturing plant for the purpose. The company thus benefits from reduced investments in
manufacturing facilities, inventories of a raw material and other functions required for the
manufacturing of the components.
Savings on management time:
As the components are outsourced, the company stands to gain by saving on the
management time and cost. The role of the company gets restricted to establishing the
systems and in quality control at the franchise locations. Over a period of time the systems
implemented stabilize and hence the involvement of the company remains on at the strategic
decisions level.
43
Regular supply of components:
With the development of strong relations with the franchisees, the manufacture can be
assured of a regular supply of components as per the manufacture's specification.
Reduced interfacing and dealing with labor:
The labor and union employees involved in the manufacturing are the responsibility
of the franchisee. This is beneficial as it reduces the management time and involvement in
solving their issues.
Limitations of franchisee are:
Large volumes
To set up ancillary base, the company is required to produce large as the franchisee
may not be interested in making large investments in the manufacturing facilities if the
volumes required to be produced are low. Especially the existing franchisees will not take the
risk typing up with new players.
Financial support
In India, most vendors are small in size and do not have the capital to invest in these
equipments, which requires the manufactures to give them the financial support. This
problem becomes intense when the manufacture has an existing franchisee base and wants to
increase the capacity.
Quality
In some cases, due to cost considerations, the manufacturers are forced to compromise on
quality.
DISTRIBUTION
The company distributes its products in five districts.
1. Visakhapatnam 2. Srikakulam 3. Vizianagaram 4. East Godavari and 6. West
Godavari

44
The objectives of the company set in memorandum of Association and franchise agreements
are as follows:
1. To manufacture soft drinks by concentrate supplied by Pepsi
foods.
2. To market and advertise within specified area Pepsi
products.
3. To sell soft drinks at a fixed price
CAPACITY OF THE PEARL BOTTLING UNIT:
The company installed latest up to date automatic plant conforming to plant layout.
The installed production capacity is 400 bottles per minute i.e. 24,000 bottles per hour. The
plant is also having 100 bottles per I-liter line. During off-season the plant runs one shift and
during the 9 months season the plant runs double shift. The company has to produce3 enough
bottles of soft drinks at a speed to keep in pace with the disappearance of soft drinks from
shelves of the retailer.
QUALITY CONTROL:
Pearl beverages Pvt. Ltd. Takes great care to maintain the quality control of the
products in their factory. The bottles are visually examined for impurities continuously, as
the bottles move out. Samples are checked every ten minutes of production time by the
chemist for its quality & hygienic condition. The chemical analysis is also made for flavors,
gas content and sugar percentages. The appearance, smell and taste of the production are
suspended and the correcting measures are taken so as to set right the bottling process
irregularities. Further, samples from each batch are dispatched to the affiliated parent agency
company in each week for quality checkup. Moreover, agency of the company in each week
for quality checkup at any time to make sure that the quality is maintained to the exact
standard of the parent company.
At the end of the production schedule, daily all the equipment floor and wet patches
are cleaned with bleaching powder or some other solution. The standards of hygiene
maintained inside the production shops are commendable.

45
MANUFACTURING IN PEARL BEVERAGES PVT. LTD:
The process of manufacturing soft drinks mainly divided into 4 parts. They
1. Making of syrup
2. Treatment with water
3. Bottling
4. Crating
Making of syrup:
In this process, the syrup of a particular product is prepared by heating sugar with activated
carbon powder and filter aid (Hyflousuper cell) in treatment tank for a specified time and up
to a particular temperature.
Treatment with water:
removes the water and converts the water into soft water.
It frees the water of microorganisms.
the alkalinity to a required level.
Removes suspended matter in water.
Bottling:
In this process both the concentrate and the purified water are mixed together along with
CO2 gas and then bottled. In soft drinks field, only reusable glass bottles are used. They are
sterilized before the beverages are filled. For this purpose, the company makes use of
machine known as "bottle Washer". For cleaning of bottles washing chemicals such as
caustic soda and tri-sodium phosphate are used.
Crating:
The bottles collected from conveyor belts are placed manually into plastic crates. Each
plastic case has capacity of 24 bottles. These protect the bottles from breakage and for easy
handling of bottles. These crates are put on specially designed vans for carrying bottles and
are sent to various consumption points.

46
MARKETING FUNCTION:
PRODUCTS
The product being offered by Pearl Beverages is a soft drink in 6 flavors namely cola,
lemon clear, lemon cloudy, orange, mango, & soda. Expect for slice, Pearl Beverages has
bottling facilities for other brands.
PRICE
A 300 ml bottle of soft drink & 300ml of fountain Pepsi are priced at Rs. 9/- while a
500 ml cost Rs.25/- and 1 liter plastic at Rs45/- and 1.5 plastic cost Rs.52/- where the
consumer can take the bottle along with the drink. Chota Pepsi is introduced for just Rs. 5/-
for 200 ml.
PROMOTION
As sales promotion, the company has painted pan shops with Pepsi logo. Put up glow
sign boards & bill boards at important junctions, Pepsi advertisement material like stickers,
danglers and gift for consumers. It has also provided special refrigeration to exclusive Pepsi
retail outlets known as VISI COOLERS.
PLACE OF DISTRIBUTION
Pearl Beverages Ltd. Covers the 5 districts of the territory through 172 distributors
appointed at various locations for secondary distribution. Pearl beverages reach the 2200
outlets of vizag city through its 4 dealers. Each dealer is assigned a specific area which is
further divided into routes. Each route is assigned to a driver cum sales man. Each dealer is
given a target, which in turn is given to sales man depending upon the potential of his route.
Visakhapatnam is divided into 4 zones and the marketing is serviced by 3 distributors.
1. SAI ASWINI Enterprises.
2. COOL AND COOL Distributors
3. GAURI Agencies.

47
The total outlets covered by the plant are put to around 15000 in the five districts.
Visakhapatnam city contributes to 2200 outlets.
ORGANISATION STRUCTURE OF PEARL BOTTLING PVT LTD.
This is headed by able director, and is assisted by a team of well qualified &
experienced there are mainly 5 elements of organization structure:
1. Specialization of activities.
2. Standardization of activities.
3. Coordination of activities.
4. Centralization and decentralization of deviation making. S. Size of the work
unit.
Mr. Ruchirans Jaipuria is the head of the organization & administration. The
company is managed senior management personnel.
The following table shows the description of employees along with designation & no.
of employee.
S.No. Description No.employees
1. General Manager (Finance) 1
2. Commercial Manager 1
3. Marketing Manager 1
4. Territory Managers 4
5. Administration Manager 1
6. Production Manager 1
7. Asst. Personal Manager 1
8. Store Executives 3
9. Central Executives 25
10. Route Agents 50
11. Sales Trainee 1
12. Chemists 3
13. Accountants 5
14. Supervisors 8

48
15. Clerks 8
16. Operators 10
17. Electricians 3
18. Fitters 2
19. Computer cum Telephone Operator 12
20. Security Guards 6
21. Office Boys 13
22. Sweepers & Helpers 3
Organization Chart
Factory Manager Executive Manager Finance Manager
General Manager
(Sales & marketing
Sales Supervisor
( Direct Marketing)
Driver cum Salesmen
Sales Supervisor
( Direct Marketing)
Driver cum Salesmen
Managing Director
Loader Loader

49
FINANCIAL FUNCTION
PepsiCo Reports 13% First-Quarter Earnings Per Share Increase, Driven by 9%
Revenue Growth. PepsiCo reported a 13% increase in first-quarter earnings per share to
$0.60, fueled by a 9% increase in net revenue, with each of the Company's operating
Divisions contributing to both top- and bottom-line growth.
In India, most vendors are small in size and do not have the capital to invest in these
equipments, which requires the manufactures to give them the financial support. This
problem becomes intense when the manufacture has an existing franchisee base and wants to
increase the capacity.
Importantly, we're also seeing good profit performance despite continued pressure
from inflation in some of our key input costs. Overall, we're very pleased with the results in
the quarter, and remain confident in the outlook for 2006."
Net revenue grew 6%, reflecting volume growth of 2%, positive effective net
pricing and favorable mix, and despite the unfavorable impact from a shift in the timing of
the New Year's and Easter holidays.
Operating profit grew in line with revenue growth reflecting the revenue gains
and the impact of increased labor and benefits charges and higher costs for
cooking oil. Volume grew 5% in the quarter, with the division's non-carbonated beverage
portfolio increasing 18% and carbonated soft drinks (CSDs) declining 1%. The results for the
quarter also reflect a slightly unfavorable impact from a shift in the timing of the Easter
holiday.

50
CHAPTER-3
A THEORITICAL FRAME WORK
The term “Soft Drinks” refers to all types of non-alcoholic, carbonated, sweetened
and flavored beverages. They are all artificially sweetened. The soft drink industry has been
undergone many changes with changing consumer needs, wants and also changing
government policies. This formed the basis for different innovations in packaging such as
bottles, cans, tetra packs, pet bottles etc. in a variety of flavors. On a hot summer day, soft
drinks became a welcome factor for its refreshing taste and as one start gulping it, it gives
some sort of satisfaction, which cannot be defined in words but can only be felt.
With the changing trends and disappearing social and cultural differences among the
countries worldwide soft drink culture has grown enormously and in almost all the countries
soft drinks are consumed despite the varying factors like age, income, and climate, Etc. This
has led to the enormous increase in the soft drink market.
BACK GROUND AND SEGMENTATION OF SOFT DRINK INDUSTRY:
Non alcoholic soft drink beverage market can be divided into fruit drinks and soft
drinks. Soft drinks can be further divided into carbonated and non-carbonated drinks. Colas,
lemon and oranges are carbonated drinks while mango drinks come under non carbonated
category. The soft drinks market till early 1990s was in hands of domestic players like
campa, thumps up, Limca etc but with the opening up of economy and coming of MNC
players Pepsi and Coke the market has come totally under their control. Worldwide, Coke is
the leader in carbonated drinks market. In India it is Pepsi which scores over Coke is the
leader in carbonated drinks market. In India it is Pepsi which scores over Coke but this
difference is fast decreasing. Pepsi entered Indian market in 1991 coke re-entered (After
they were thrown out in 1977, by then central government) in 1993.
In this chapter various accepts of study are going to be discussed. To which area of
management that study belongs to and various concepts that are related the area of study.
The present outcomes under marketing and deals in the specific with the distribution network
and its management.
PEPSI COLA was in India from 1956-61 and left the country, as its products were
not acceptable by the Indian customers. But recently in 1990 it re-entered the Indian market,

51
where by PEPSI FOODS LIMITED was entered into a joint venture with PEPSI
INTERNATIONAL, TATA and VOLTAS.
PEPSI Bottlers and producers of soft drinks buy concentrate and sell at fixed price
and add a margin rationally for its products.
Indian with a population of more than 1.1 billion is potentially one of the largest
consumer markets in the world after china. The consumer market is popularly known as the
FMCG market or the fast moving consumer goods market. Soft drinks come under this
category. Soft drink is basically purchased in Indian basically for two reasons namely to
quench thirst and for refreshment. The Indian economy currently is passing through a bullish
phase with increasing per capita income. Subsequently the lifestyle of the Indian consumer
is also changing with increased spending on entertainment, refreshment etc. that is why soft
drink companies are looking forward to India with great enthusiasm in the future to increase
their revenue. The soft drink industry in India dates back to the 1940s when Parle introduced
the first branded soft drink called gold spot. Cola giant coca-cola was the first foreign soft
drink company to setup its shop in India in 1965. Coca-cola made a very good beginning and
dominated the market right from the word go. It faced no competition at that time. The
marketing people did not even need to publicize coca-cola. This extraordinary success of
coca-cola can be attributed to the following factors.
Absence of contemporary competitive brand.
The giant image of coca-cola in the western countries preceded their entry into the
Indian market,
Indians at that time were very fond of foreign goods.
Parle Exports Pvt. Ltd., later introduced a lemon flavored soft drink called Limca in
1970. Before this they had introduced a cola flavored drink called pepping which they had to
withdrew in the face of stiff competition from coca-cola. But the overtly conservative Indian
government of that time with special interest in safe guarding the interest of the Indian
companies started insisting that coca-cola should agree on the following points in order to
continue in India. Coca-Cola decided to windup its operations in1977 rather than bowing to
the Indian government. The main demands of the Indian government were.
Dilution of equity, as the government felt that lots of foreign currency was being
wasted.

52
Manufacturing of the secret concentrate in India.
Disclosure of the chemical composition of the concentrate.
The exit of coca-cola left a large vacuum in the soft drink market. But this also
accelerated the growth of several Indian soft drinks. Many new soft drinks like footie, jump-
in etc were launched in the form of tetra pack. However the bottling plants and the
distribution networks of these companies were not up to the mark and left much to be
desired. It took these companies almost one year to come up with new flavors like Campa
Cola, Rush etc. to survive in the industry.
However Parle, the pioneer in the soft drinks market blazed its way to national
prominence with their product Thumps Up bearing the slogan ‘happy days are here again’
which became a craze. This particular slogan helped to win over the loyalists of coca-cola
who were in a state of cola shock or cola depression. Soon the soft drink industry started
registering phenomenal growth rates and all parley products namely Gold Spot, Limca and
Thumps Up became the brand leaders in their own segments. In spite of this the soft drink
market had a huge untapped potential.
In 1990 coming of the multinational brand Pepsi and immediately started giving stiff
competition to Parley and Coke. The company of Pepsi was founded in 1890 at North
Carolina in USA. Its CEO is Roger Enrico. PepsiCo India Holdings Pvt. Ltd. In
headquartered in gurgaon and its CEO is Ms. Indra Nyui. In India it has 34 bottling plants of
which 8 are company owned bottling outlets (COBO) and 26 are franchise owned bottling
outlet (FOBO). SMV Beverages is a franchise owned bottling outlet. Coca-Cola reentered
the Indian market in 1993 in collaborations with Parley India Ltd.,
PEPSICO INDIAN HOLDINGS PVT. LTD. LAUNCHES PACKAGED NIMBU
PAANI ‘NIMBOOZ BY 7UP’.
PepsiCo India Holdings Pvt. Ltd., has launched its packaged nimbus paani ‘Nimbooz
by 7Up. The product, with real lemon juice, no fizz and no artificial flavors’, will be
available in three packaging formats of 200ml returnable glass bottles, 350ml PET and 200ml
tetra packs, priced at INR 10, INR 15 and INR 10 respectively.
PEPSICO INDIA HOLDINGS PVT. LTD. TO LAUNCH LEMON DRINK.
PepsiCo India Holdings Pvt. Ltd. Is expanding its product portfolio in India in the
lemon drinks category and has plans to introduce a product under 7Up brand a head of the

53
summer season. The new product would be less carbonated and is targeted at the mass
market for on-the move consumers.
Headquarter : New York, U.S.
Area served : Worldwide
Industry type : Food and non alcoholic beverages.
Products : Pepsi, Diet Pepsi, Mountain dew, 7 Up, Mirinda,
Slice, Tropicana products Nimbooz juice, Aquafina,
Fritos, Cheetos, and Lays.
Key person : Indra Krishnamurthy Nooyi (president) and (CEO)
MARKET AUDIT:
SWOT analysis is a tool for auditing an organization and its environment. It is the
first stage of planning and helps marketers to focus on key issues. SWOT stands for
strengths, weaknesses, opportunities, and threats. Strengths and weaknesses are internal
factors. Opportunities and threats are external factors.
A STRENGTH COULD BE:
Your specialist marketing expertise.
A new, innovative product or service.
Location of your business
Quality processes and procedures.
Any other aspect of your business that adds value to your product or service.
www.marketingteacher.com
A WEAKNESS COULD BE:
Lack of marketing expertise.
Undifferentiated products or services (i.e. in relation to your competitors)
Location of your business.

54
Poor quality goods or services.
Damaged reputation.
A OPPORTUNITY COULD BE:
A developing market such as the Internet.
Mergers, joint ventures or strategic alliances.
Moving into new market segments that offer improved profits.
A new international market.
A market vacated by an ineffective competitor.
A THREAT COULD BE:
A new competitor in your home market.
Price wars with competitors.
A competitor has a new, innovative product or service.
Competitors have superior access to channels of distribution.
Taxation is introduced on your product or service.
PEST ANALYSIS
It is very important that an organization considers its environment before beginning
the marketing process.
In fact, environmental analysis should be continuous and feed all aspects of planning.
The organization’s marketing environment is made up of:
1. The internal environment e.g. staff (or internal customers), office technology, wages
and finance, etc.
2. The micro-environment e.g. our external customers, agents and distributors, suppliers,
our competitors, etc.
3. The macro-environment e.g. Political (and legal) forces, Economic forces, Socio
cultural forces, and Technological forces. These are known as PEST factors.
POLITICAL FACTORS:
The political arena has a huge influence upon the
regulation of businesses, and the spending power of consumer and other businesses. You
must consider issues such as:

55
1. How stable is the political environment?
2. Will government policy influence laws that regulate or tax your business?
3. What is the government’s position on marketing ethics?
4. What is the government’s policy on the economy?
5. Does the government have a view on culture and religion?
ECONOMIC FACTORS:
Marketers need to consider the state of a trading economy in the short and long-terms.
This is especially true when planning for international marketing. You need to look at: 1.
Interest rates.
2. The level of inflation Employment level per capita.
3. Long-term prospects for the economy Gross Domestic Product (GDP) per capita, and
so on.
SOCIOCULTURAL FACTORS:
The social and cultural influences on business vary from country to country. It is very
important that such factors are considered. Factors include:
1. What is the dominant religion?
2. What are attitudes to foreign products and services?
3. Does language impact upon the diffusion of products on to markets?
4. How much time do consumers have for leisure?
5. What are the roles of men and women within society?
6. How long are the population living? Are the older generations wealthy?
7. Do the population have a strong/weak opinion on green issues?
TECHNOLOGICAL FACTORS
Technology is vital for competitive advantage, and is a major driver of globalization.
Consider the following points:

56
ANALYZING THE ENVIRONMENT – FIVE FORCES ANALYSIS:
Five Forces Analysis helps the marketers to contrast a competitive environment. It
has similarities with other tools for environmental audit, such as PEST analysis, but tends to
focus on the single, stand alone, business or SBU (Strategic Business Unit) rather than a
single product or range of products. For example, Dell would analyze the market for
Business Computers i.e., one of its SBUs.
1. Does technology allow for products and services to be made more cheaply and to a
better standard of quality?
2. Do the technologies offer consumers and businesses more innovative products and
services such as Internet banking, new generation mobile telephones, etc?
3. How is distribution changed by new technologies e.g book via the Internet, flight
tickets, auctions etc.?
4. Does technology offer companies a new way to communicate with consumers e.g.
banners, Customer Relationship Management (CRM), etc?
Five forces analysis looks at five key areas namely the threat of entry, the power of
buyers, the power of suppliers, the threat of substitutes and competitive rivalry.

57
THE THREAT OF ENTRY:
Economies of scale e.g. the benefits associated with bulk purchasing.
The high or low cost of entry e.g. how much will it cost for the latest technology?
Ease of access to distribution channels e.g. Do our competitors have the distribution
channels sewn up?
Cost advantages not related to the size of the company e.g. personal contacts or
knowledge that larger companies do not own or learning curve effects.
Will competitors retaliate?
Government action e.g. will new laws be introduced that will weakne our competitive
position?
How important is differentiation? E.g. The Champagne brand cannot be copies. This
desensitizes the influence of the environment.
THE POWER OF BUYERS:
This is high where there a few, large players in market e.g. the large grocery chains.
If there are a large number of undifferentiated, small suppliers e.g. small farming
businesses supplying the large grocery chains.
The cost of switching between suppliers is low e.g. from one fleet supplier of trucks
to another.
THE POWER OF SUPPLIERS
The power of suppliers tends to be a reversal of the power of buyers.
Where the switching costs are high e.g. Switching from one software supplier to
another.
Power is high where the brand is powerful e.g. Cadillac, Pizza Hut, Microsoft.
There is a possibility of the supplier integrating forward e.g. Brewers buying bars.
Customers are fragmented (not in clusters) so that they have little bargaining power
e.g. Gas/Petrol stations in remote places.
THE THREAT OF SUBSTITUTES
Where there is product-for-product substitution e.g. email for fax where there is
substitution of need e.g. better toothpaste reduces the need for dentists.
Where there is generic substitution (competing for the currency in your pocket) e.g.
Video suppliers compete with travel companies.
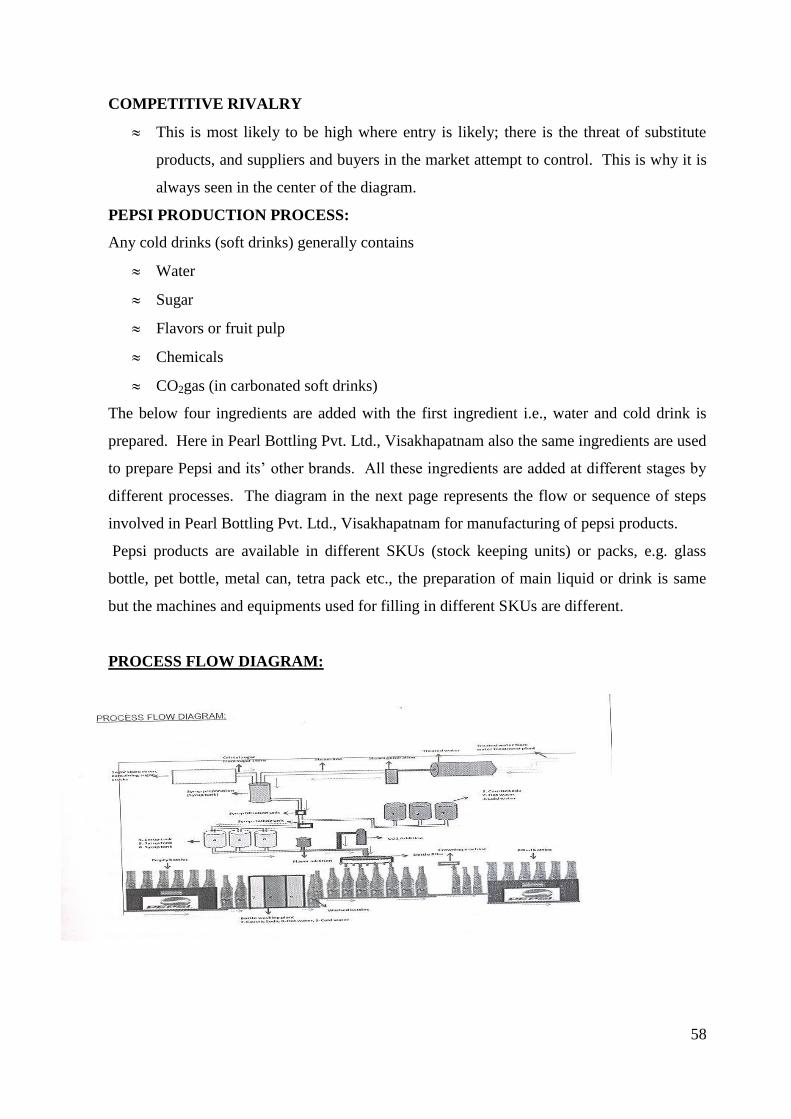
58
COMPETITIVE RIVALRY
This is most likely to be high where entry is likely; there is the threat of substitute
products, and suppliers and buyers in the market attempt to control. This is why it is
always seen in the center of the diagram.
PEPSI PRODUCTION PROCESS:
Any cold drinks (soft drinks) generally contains
Water
Sugar
Flavors or fruit pulp
Chemicals
CO2gas (in carbonated soft drinks)
The below four ingredients are added with the first ingredient i.e., water and cold drink is
prepared. Here in Pearl Bottling Pvt. Ltd., Visakhapatnam also the same ingredients are used
to prepare Pepsi and its’ other brands. All these ingredients are added at different stages by
different processes. The diagram in the next page represents the flow or sequence of steps
involved in Pearl Bottling Pvt. Ltd., Visakhapatnam for manufacturing of pepsi products.
Pepsi products are available in different SKUs (stock keeping units) or packs, e.g. glass
bottle, pet bottle, metal can, tetra pack etc., the preparation of main liquid or drink is same
but the machines and equipments used for filling in different SKUs are different.
PROCESS FLOW DIAGRAM:

59
During my visit to Pearl Bottling Pvt. Ltd., Visakhapatnam, I saw
1. Water treatment plant, where water is purified.
2. Bottle washing plant, where used glass bottles are washed
3. Syrup room, where syrup is prepared from sugar.
4. Bottle filling plant, where bottles are filled with the final product.
5. Acid room, where caustic soda is kept, which is used for cleaning the equipments and
pipelines after every batch of production.
6. Yard for keeping empty bottles and were houses for storing the filled bottles.
The brief introduction of each plants are given below.
1. WATER TREATMENT PLANT:
Water in Pearl Bottling Pvt. Ltd., Visakhapatnam is coming from the Sitarampur dam
on the Kharkai river. It is stored in a reservoir. This raw water is being treated in the water
treatment plant, before the production process starts. Coagulation process is used here for
this purpose. Main chemicals used are ferrous sulphate (FeSO4), calcium hydroxide (CaOH)
and chlorine (CaOH) and chlorine (cl). Initially water is treated with all these chemicals in
the treatment tank and becomes turbid. All the impurities get settled at the base and remove
the turbidity. Then, it is sent to the carbon tank where all the microorganisms and chlorines
are removed. The obtained is completely free from any kind of impurities and used in further
processing. The maximum alkalinity maintained until as much as 50ppm.
2. BOTTLE WASHING PLANT:
Used bottles returning from the market are stealthy. Before filling these empty
bottles with new product, these bottles are passed through the bottle washing plant where
these dirty bottles are washed. It is completely an auto process which takes place within a
machine called washer machine. The machine has three compartments. Bottle for washing
are placed on the conveyer come inside the machine and get successive treatment. Bottle for
washing are placed on the conveyer come inside the machine and get successive treatment.
Bottles are treated with 4% caustic soda in the first compartment at a temperature of 100-
150oC. Next these are conveyed to the second compartment, where bottles are again washed
with hot water at a temperature of 80-100oC in the third compartment bottles are treated with
cold or normal water at room temperature. Time duration in each compartment is 10
minuets. Bottles are then sent through the inspection center, where these are closely watched
against white rays of light. Bottles containing any dust or other unwanted things are
removed from the line here.

60
3. SYRUP ROOM:
Here syrup is prepared. Syrup is prepared by flowing steam and sugar crystals in a
specified ratio into a closed container. The temperature of this prepared sugar remains
between 80-100oC. This syrup contains some impurities as, sometimes there are some
impurities presents in sugar, so this syrup is filtered to remove all those contaminations.
Before storing in syrup tanks this syrup it is passed through the cooler where syrup
temperature is reduced to 25-30oC. this temperature is maintained throughout the whole
process. Here next flavors are added at a specified quantity with the syrup used for
preparation of Pepsi or other brands.
4. BOTTLE FILLING PLANT:
Next, for preparation of carbonated soft drinks brands like Pepsi, mirinda, 7UP, and
mountain dew, carbondioxide gas (CO2) is mixed with this prepared solution. And for the
brand like slice, fruit pulp is added. Now the solution is ready for filling into the bottles.
The washed empty bottles are filled by auto9matic filler machine. This machine can fill 60
bottles in one minuet. After filling, crowns or caps are fitted on the filled bottles with the
help of crowning machine. Now these filled bottles are ladled and then sent for packing and
storing in the go downs.
5. ACID ROOM:
There are three tanks in this room. The first tank contains caustic soda, the 2nd
tank
contains hot water and the third tank contains cold water. After finishing every batch of
production the whole production lines and containers/tanks are washed. And for this
purpose, first of all caustic soda is passed through the pipeline, next hot water and at the last
the last cold water.
6. YARD FOR KEEPING EMPTY BOTTLES:
Peral Bottling pvt. Ltd., Visakhapatnam has a large area in side its premises. A large part of
its open area is used for keeping the empty bottles.
7. WAREHOUSE:
Pearl Bottling pvt. Ltd., Visakhapatnam has its own warehouse in side its premises for
storing the produced products. The produced products are sent to the customers from these
warehouses. For transferring the filled bottles inside the company fork-lifts are used.

61
COMPETITORS:
While the competition is moving so close between venous Indian manufactures, it
was in 1990, Pepsi has been introduced for the first time to the Indian public. The
competition, which mainly existed between “ThumsUp” and “Pepsi”.
Consumers are going to be benefited when competition is stiff. It is proved beyond
doubt with the Indian soft drinks. Pepsi objected the introduction of 300ml bottles by coca-
cola. But the objection was over-ruled and government of India has pennitted coca-cola to
go ahead with 300ml bottles. While cola is mainly marketing its range among metropolitan
cities, Pepsi has introduced 300m 1 size throughout the country to take an edge over coca-
cola. Whether one buys COKE or PEPSI THUMSUP or DUKE, profits flow only to the
American economy.
MULTINATIONAL CORPORATIONS.
Previously, parle group has introduced slowly 250ml bottles of GOLDSPOT,
LIMCA, and CITRA in the market. At this time, PEPSI has introduced 1 litter bottle. While
all India soft drinks are sold in 200ml bottle, Pepsi with 250ml size has tried to conquer the
market.
Lack of competition is the primary cause for the slow rate of development of the
Indian soft drinks industry. Since 60% of the market is monopolized by one single company
and because of its restrictive practices hundreds of local and small companies could not
flourish.
If PEPSI will be investing Rs.300 Crores, coke will be pumping eighty times as much
as Pepsi’s i.e. Rs.2,400 crores nearly. The total investment is of size and scale that the
Rs.1,800 crores soft drinks business has never been before. Both players see an enormous
potential in this country.
The soft drink industry in India has annual sales of Rs.12,000 crores and most of the
bottling companies have been doing flourishing business. In the past five years all the
bottling companies have grown and expanded their activities placing more and more soft
drink cases in the market and by improving refrigeration, supply of electric bottle coolers,
etc. to the retailers. The soft drink market in India is growing at the rate of 10% every year.
With growing urbanization and the younger generation, which has a liking for
nonconventional foods and beverages there is good possibility that per capita consumption,
will go up.

62
TRENDS IN AND MARKET SHARE OF SOFT DRINK INDUSTRY:
Export Corporation in 1950 with swadeshi movement started by Janata party CCEC
was asked to reduce its foreign capital holding 40% and delivers the known how to Indian
company. This refusal forced CCEC to leave the country in 1977. With the leaving of coca-
cola the domestic soft drinks market got a lift and rose to capture the Indian market with
Parle as the main leader, GOLD SPOT, THUMPS UP, MAAZA and KISMET became a
house hold name. Its market share grew to 60% in 1991 and it emerged as the market leader.
The first challenge to the supremacy of Parle brands came from Pepsi cola in May 1990.
Pepsi that was in India from 1956-61 had left the country, as its Products were not
found acceptable to the Indian public. Pepsi company incorporation, he 22billion worth soft
drinks and fast foods company has finally reentered the Indian market.
Soft drinks come mainly three flours. cola, Lemon and Orange. According to
estimates, cola dominates the market with 40% market share “lemon flavored drinks come
second with 30% market share and orange flavored drinks third with a 20% share. Other
flavors account for the rest of the market.
SOFT DRINK BRANDS PRESENTLY AVAILABLE:
Flavors Cola Clear Orange Cloudy Mango Soda Apple
Brands Drink Lemon Flavors Lemon Flavors Flavors
Pepsi Pepsi 7-Up Mirinda Mirinda Slice Lehar Mirinda
TRENDS IN AVERAGE CONSUMPTION OF DRINKS:
Name of the Country Average Consumption per year
(per head)
India 5 Bottles
Pakistan 13 Bottles
West Germany 83 Bottles
U.S.A. 131 Bottles
Also the government of India considers soft drinks as non-essential commodity.
Thus, heavy excise duty is levied on bottled soft drink.
In a country like India where more than 70% of the population exists below the
poverty line. The trading activities of the soft drinks industry are concentrated in and around
big cities where the purchasing power of people is considered to be comparatively high

63
Consequently by world standards, India’s per capita consumption of these servicing is rock
bottom, less than our neighbors Pakistan and Bangladesh.
Country Per Capita Intake (Bottles)
India 3.7 5.3
Pakistan 13.0 30.0
Bangladesh 7.0 11.03
PEPSICO PACKAGING PROCESS
PepsiCo is an industry leader in packaging helping to promote and implement
standards for sustainable packaging.
PepsiCo distribute the products in a variety of packages, each carefully designed to
delivery convenience and appeal to the consumer while protecting the integrity of the
products. The team of engineers and packaging suppliers are dedicated to finding preferable
designs, and are working continuously towards improving the packaging performance while
reducing the packaging footprint. PepsiCo are committed to bringing the environmental
responsibilities to all areas of the business.
PEPSICO FOLLOW FIVE PRINCIPLES OF SUSTAINABLE PACKAGING
DESIGN:
Reduce :Using less material in the packaging, to conserve natural Resources.
Reuse : Increasing use of reusable packaging and increasing the
Amount of recycled material in the packaging.
Recycle : Designing packaging for recycling and developing
Biodegradable and compostable packaging solutions.
Remove : Eliminating environmentally sensitive materials and
Processes from the packaging.
Renew : Increasing use of renewable resources.
In an effort to meet his goals, PepsiCo have launched a global sustainable packaging policy
and formed a Sustainable Packaging Council dedicated to:
Developing sustainable packaging strategies, goals, and targets.
Developing alternative packaging material technologies.
Supporting responsible disposal practices.

64
CHAPTER-4
DATA ANALYSIS
TABLE -4.1 Preference status of Pepsi products
PEPSI PRODUCTS TOTAL PERCENTAGE
PEPSI 40 30%
MIRINDA ORANGE 15 11%
MIRIND LEMON 10 7%
7 UP 25 18%
MOUNTAIN DEW 14 10%
SLICE 21 16%
NIMBOOZ 05 4%
DIET PEPSI 05 4%
Figure: 4.1
30%
11% 7%
18%
10%
16%
4% 0%
5%
10%
15%
20%
25%
30%
35%
Pepsi Products

65
INTERPRETATION:
It was found that , can be interpreted that pepsi occupied 30%, 7up occupied 18%,
slice occupied 16% and mirinda orange occupied 11% ,mountain dew 10%, mirinda
limon7%, nimbooz 4%, diet pepsi 4% These description belongs to total pepsi occupied in
first place.
TABLE-4.1.2 Preference status of Coke products
COCA-COLA PRODUCT TOTAL PERCENTAGE
Thumps up 05 7%
Fanta 08 13%
Coca-Cola 04 6%
Sprit 15 24%
Maaza 25 39%
Limca 05 7%
Nimboo fresh 03 4%
Figure: 4.1.2
7%
13%
6%
24%
39%
7% 4%
0%
5%
10%
15%
20%
25%
30%
35%
40%
45%
Thumps Up
Fanta Coca-Cola Spirit Maaza Limca Nimboo Fresh
Coca-Cola Products

66
INTERPRETATION:
Table 4.1.2 depicts, customer‘s preference for different products of Pepsi. The
analysis show that 39% of the customers’ first preference to maaza cold drink. 24% of the
customers second preference to sprite cold drink.13% of the customers’ third preference to
fanta cold drink. 7% of the customers fourth preference to Thumps up cold drink. 7% of the
customers fifth preference to Limca cold drink.6% of the customers six preference to coca
cola cold drink.4% of the customers equal preference to nimboo fresh cold drink. Most of the
customers first preference to maaza cold drink.
4.2 Brand Preference Status of Pepsi
TABLE-4.2.1
Figure: 4.2.1
INTERPRETATION:
Table 4.2.1 shows , it can be interpreted 82% of the customers first preference
to taste,10% of the customers second preference to packing,6% of the customers third
preference to easily available,2% of the customers’ fourth preference to advertisement.
Most of the customers prefer taste.
82%
2% 6% 10% 0%
10%
20%
30%
40%
50%
60%
70%
80%
90%
Taste Advertisement Easily Available Packaging
Pepsi
PEPSI TOTAL PERCENTAGE
Taste 110 82%
Advertisement 3 2%
Easily available 8 6%
Packaging 14 10%

67
4.2.2 Brand Preference Status of coke
TABLE-4.2.2
COCACOLA TOTAL PERCENTAGE
Taste 48 75%
Advertisement 7 10%
Easily available O 0%
Packaging 10 15%
Figure: 4.2.2
INTERPRETATION :
Table 4.2.2 reflects , it can be interpreted75% of the customers’ first preference to
taste,15% of the customers second preference to packing,10% of the customers third
preference to easily available,0% of the customers fourth preference to advertisement. Most
of the customers prefer taste.
75%
10% 0%
15%
0%
10%
20%
30%
40%
50%
60%
70%
80%
Taste Advertisement Easily Available Packaging
Coca-Cola

68
4.3.1 Weekly Status of Purchases of Pepsi.
TABLE-4.3.1
PEPSI TOTAL PERCENTAGE
Once 54 40%
Twice 48 36%
Thrice 14 10%
More then three 19 14%
Figure: 4.3.1
INTERPRETATION:
It was found that, it can be interpreted 40% of the customers take Pepsi products
weekly once,36% of the customers take Pepsi products weekly two times,14% of the
customers take Pepsi products weekly three times,10% of the customers take Pepsi products
weekly more than three times. Most of the customers prefer to take a Pepsi products weekly
once
40% 36%
10% 14%
0%
5%
10%
15%
20%
25%
30%
35%
40%
45%
Once Twice Thrice More than Three
Pepsi

69
4.3.2 Weekly Status of Purchases of coke.
TABLE-4.3.2
COCACOLA TOTAL PERCENTAGE
Once 26 40%
Twice 27 41%
Thrice 07 11%
More then three 05 08%
Figure : 4.3.2
INTERPRETATION:
Table 4.3.2 found that, it can be interpreted 40% of the customers take Coca-Cola
products weekly once,41% of the customers take Coca-Cola products weekly two times,11%
of the customers take Coca-Cola products weekly three times,8% of the customers take
Coca-Cola products weekly more than three times Most of the customers prefer to take Pepsi
products weekly two times.
0%
5%
10%
15%
20%
25%
30%
35%
40%
45%
Once Twice Thrice More than Three
Coca-Cola

70
4.4.1 Status of Category of purchase preference of Pepsi drinks
TABLE-4.4.1
PEPSI TOTAL PERCENTAGE
200ml 36 27%
250ml 70 52%
300ml 22 16%
Can 07 05%
Figure 4.4.1
INRERPRETATION :
Table4.4.1 depicts, it can be interpreted 52% of the customers first preference take
250ml cold drink,27% of the customers second preference take 200ml cold drink,16% of the
customers third preference take 300ml cold drink,5% of the customers fourth preference take
can. Most of the customers’ first preference takes 250 ml cold drink.
27%
52%
16%
5% 0%
10%
20%
30%
40%
50%
60%
200ml 250ml 350ml Can
Pepsi

71
4.4.2 Status of Category of purchase preference of Pepsi drinks
TABLE-4.4.2
PEPSI TOTAL PERCENTAGE
200ml 12 18%
250ml 40 62%
300ml 08 12%
Can 05 08%
Figure :4.4.2
INRERPRETATION :
From the above table, it can be interpreted 62% of the customers’ first preference
takes 250ml cold drink,18% of the customers’ second preference takes 200ml cold drink,12%
of the customers’ third preference takes 300ml cold drink,8% of the customers fourth
preference take can. Most of the customers first preference take 250 ml cold drink.
18%
62%
12% 8%
0%
10%
20%
30%
40%
50%
60%
70%
200ml 250ml 350ml Can
Pepsi

72
4.5 Number of Respondents Area wise?
Table-4.5
Sl.No. AREA NUMBER OF OCCUPIED
1 Balaga Junction 6
2 7 Road Junction 22
3 Bankers Colony 49
4 Illisipuram Junction 73
Figure : 4.5
INTERPRETATION:
Table4.5 shows, it can be interpreted that 7 Road Junction occupied 15%, Balaga
Junction occupied, Bankers Colony occupied 32% and Illisipuram Junction occupied 49%.
These description belongs to total pepsi retailers occupied in 4 areas.
6
22
49
73
0
10
20
30
40
50
60
70
80
Balaga Junction 7 road Junction Bankers Colony Illisipuram
Area

73
4.6. Statues of watch soft drink advertisement in T.V
TABLE-4.6
Yes 98%
No 2%
Figure :4.6
INTERPRETATION:
Figure4.6 reflects, it can be interpreted 98% of the people watch soft drink
advertisement in T.V, 2% of the people did not watch soft drink advertisement in T.V Most
of the customers watch soft drink advertisement in T.V.
0%
20%
40%
60%
80%
100%
120%
Yes No
Advertisement

74
4.7 Statues of brand of prefer packaged drinking water
TABLE-4.7
BRAND TOTAL PERCENTAGE
Aquafina 20 10%
Bislery 54 27%
Water packet 88 44%
Kinley 23 12%
Others 15 7%
Figure : 4.7
INTERPRETATION:
From the above table, it can be interpreted 44% of the customers prefer drink a
packaged drinking water packet,27% of the customers prefer drink a packaged drinking
water bislery,12% of the customers prefer drink a packaged drinking water kinle,10% of the
customers prefer drink a packaged drinking water aquafina,7% of the customers prefer drink
a packaged drinking water others, Most of the customers prefer drink a packaged drinking
water packet.
10%
27%
44%
12% 7%
0%
5%
10%
15%
20%
25%
30%
35%
40%
45%
50%
Aquafina Bislery Water Packet Kinley Others
Brand

75
4.8 .Place of buying statues of soft drink
Table-4.8
BUYING PLACE TOTAL PERECENTAGE
Panshop 82 41%
Kirana shop 16 8%
Super market 73 37%
As per convenience 29 14%
Figure : 4.8
INTERPRETATION:
It was found that, can be interpreted 41% of customers buy a soft drink in a
panshop,37% of customers buy a soft drink in a super market,14% of customers buy a soft
drink in as per convenience,8% of customers buy a soft drink in a kirana shop.Most of the
people buy a soft drink in a panshop.
41%
8%
37%
14%
0%
5%
10%
15%
20%
25%
30%
35%
40%
45%
Panshop Kirana Shop Super Market As perConvience
Buying Place

76
4.9. Reason for drinking soft drink
TABLE-4.9
REASON TOTAL PERCENTAGE
Thirsty 45 22%
Hungry 20 10%
Refreshment 130 65%
None of the above 5 3%
Figure : 4.9
INTERPRETATION:
Table4.9 depicts, it can be interpreted 65% of the customers drink a soft drink for
refreshment,22% of the customers drink a soft drink for refreshment,10% of the customers
drink a soft drink for refreshment,3% of the customers drink a soft drink for refreshment.
Most of the customers drink a soft drink for refreshment.
22%
10%
65%
3% 0%
10%
20%
30%
40%
50%
60%
70%
Thursty Hungry Refreshment None of the Above
Reason

77
4.10. Statues of recent advertisement of soft drink
TABLE- 4.10
ADVERTISEMENT TOTAL PERCENTAGE
7up 25 12%
slice 24 11%
Mountain dew 10 5%
pepsi 65 32%
mirinda 11 6%
cocacola 8 4%
fanta 9 5%
thumsup 35 18%
limca 13 7%
Figure : 4.10
INTERPRETATION:
From the above table, it can be interpreted 32% of customers remember Pepsi
advertisement,18% of customers remember Thumpsup advertisement,12% of customers
remember 7up advertisement,11% of customers remember slice advertisement.7% of
customers remember limca advertisement,6% of customers remember mirinda
advertisement,5% of customers remember mountain dew and fanta advertisement,4% of
customers remember cocacola advertisement Most of the customer remember pepsi product
advertisement.
12% 11% 5%
32%
6% 4% 0%
5%
10%
15%
20%
25%
30%
35%
7up Slice Mountain Dew
Pepsi Mirinda Coco-Cola
Advertisement

78
CHAPTER-5
SUMMERY,FINDING,SUGGESTION
5.1 SUMMARY
The Project Entitled “Consume behavior towards Pepsi products” in pearl bottling
pvt.ltd consists of 5 chapters. The first chapter deals with Introduction Need of the Study
Objectives Methodology Limitations of the study.
The introduction deals with customer satisfaction with related to industry topic. The
customer satisfaction gives business expansions and promotions to retain and attract
customers. “Marketing begins with the customer and ends with the customer”. Companies
address needs by putting forth a value proposition, a set of benefits they offer to consumer to
satisfy their needs. The intangible value preposition is made physical by an offering, which
can be a combination of products, information and experiences. The offering will be
successful if it delivers value and satisfaction to the target buyers.
The need for the study deals to organize an in-depth study to understand the customer
tastes and preference regarding products. The primary objectives of the study were to know
the marketing audit, promotional activities by using signage, advertising, to know the
percentage of Pepsi occupy in different areas, to know the problems of retailers regarding the
distribution and identify the retailers opinion towards Pepsi products. Limitation for the
study is the sample size is not universal, some part of other cities remained uncovered
Unavailability of some information due to lack of awareness of retailers Time and expenses
were major constraints
In the Second Chapter, it gives Industry Profile and company profile in that birth of
the cold drink industries, basics of cold drink industries and its globalized activities.
The Third Chapter deals with the theoretical framework and, its offerings and future aims
.It has its own brand image in srikakulam and having width and depth of distribution through
their branches in many parts of Andhra Pradesh.
The Fourth Chapter deals with the data analysis and interpretation. The main part of
the report i.e., Analysis part is covered in this chapter. I did survey in 200 samples in 4
various areas. After conducting the survey I interpreted the total collected information using

79
a structured questionnaire. The required information is derived from that interpretation and
analysis. This analysis part contains tables and pie charts.
The Fifth Chapter deals with the summary of the topic. It gives brief conclusion of
the above four chapters. In this chapter the interpretation and analysis part also included. It
also includes summary, findings and suggestions, which give the entire idea of the topic
studied at a glance.

80
5.2 FINDINGS
The soft drinks market is growing day by day in India.
More than the half the total sells PEPSI products, but coming to the exclusive Pepsi
outlets.
Pepsi’s bottling strength is also very less compared to Coke.
Pepsi need to improve its taste otherwise launch a new cola product which having
good taste and very strong like Thums-Up
The survey is not 100% accurate, because customers and others are not willing to
give appropriate data.
The company is maintaining the quality of the products and it has good quality
control Dept.
Now a day because of changing the food habits the soft drinks are added to their food
habits.
Pepsi soft drinks are occupying more than half of the soft drinks market.
The demand for the fruit based soft drinks is go on increasing and they occupied the
top selling drinks position.
The retailers are not provided any credit on the purchase of the drinks.
Advertisements for every drink are given individually, because of that the consumers
are not aware of the total drinks offered by the company and the expenses will more
for the company.

81
5.3 SUGGESTIONS
The company has to increase its quality more and also has to introduce more verities
of drinks in to the market to increase its market share.
It has to change the advertisements in a manner that add the soft drinks as a part of
food.
The Pepsi has some more scope to increase its market share and it has to strive for
that.
Company has to concentrate on the fruit based drinks and add some more fruit based
drinks to the product line.
Pepsi Company has to increase the offers to the customers as well as retailers.
The dealers should provide the sufficient information to the retailers about the
products and the new offers to the retailers provided by the company.
The dealers should be provided the credit up to some limits by the company.
The advertisement should be given as a whole that will bring the awareness about the
products and reduce the advertisement cost of the company also.
Pepsi should take advantage of those target areas which are still not in coverage.
Target should be sent in such a way that it benefits both the Distributors, Company
and have a rise in sales.
Distributors should go into the market thrice in a week for market study.
The company should have to give the positive response over the complaints of the
outlets.
Pepsi should be given in credit to the retailers.
.

82
5.4 CONCLUSION
The project was a great experience for me in order to study the marketing aspects in
the world. It was a great opportunity for me to express what I have studied.
This industry is a place where two major players are there in the world. This Pepsi
Company gave me lot of opportunity and scope to understand the soft drink industry and its
marketing structure and distribution channels.
Lot of valuable information regarding the company and also the consumers, has been
collected from the survey which helped me clearly to understand the real problems faced by
the marketers to distribute and also make retailers to sell the company’s products in the
market. I understood who difficult to do the marketing in the present scenario.
The suggestions made to the company were really applicable for the growth and
benefit for the company in order to increase its market share and to become the market leader
in the soft drink industry, because a large number of competitors craving for the same
market.
Thus, finally it can be said that the industry needs a lot of channel management
activities to done along with various promotional strategies for the consumer by using
different signage. I wish the company to achieve its objectives achieved soon.
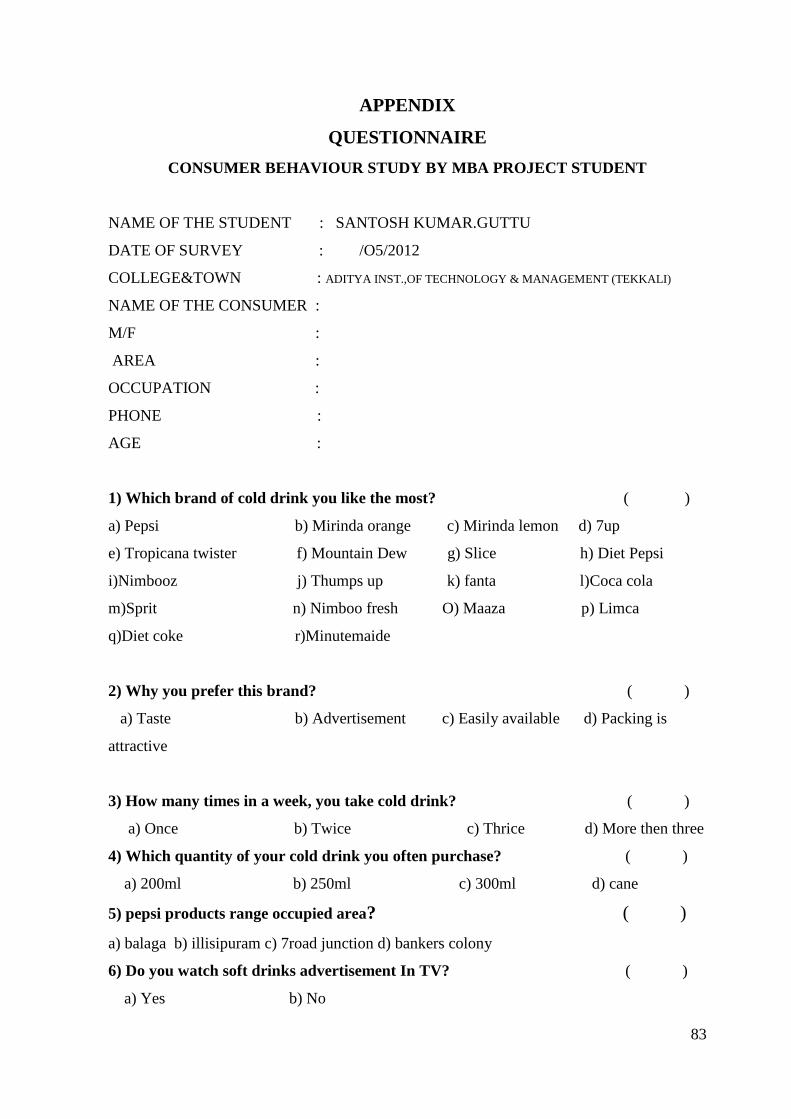
83
APPENDIX
QUESTIONNAIRE
CONSUMER BEHAVIOUR STUDY BY MBA PROJECT STUDENT
NAME OF THE STUDENT : SANTOSH KUMAR.GUTTU
DATE OF SURVEY : /O5/2012
COLLEGE&TOWN : ADITYA INST.,OF TECHNOLOGY & MANAGEMENT (TEKKALI)
NAME OF THE CONSUMER :
M/F :
AREA :
OCCUPATION :
PHONE :
AGE :
1) Which brand of cold drink you like the most? ( )
a) Pepsi b) Mirinda orange c) Mirinda lemon d) 7up
e) Tropicana twister f) Mountain Dew g) Slice h) Diet Pepsi
i)Nimbooz j) Thumps up k) fanta l)Coca cola
m)Sprit n) Nimboo fresh O) Maaza p) Limca
q)Diet coke r)Minutemaide
2) Why you prefer this brand? ( )
a) Taste b) Advertisement c) Easily available d) Packing is
attractive
3) How many times in a week, you take cold drink? ( )
a) Once b) Twice c) Thrice d) More then three
4) Which quantity of your cold drink you often purchase? ( )
a) 200ml b) 250ml c) 300ml d) cane
5) pepsi products range occupied area? ( )
a) balaga b) illisipuram c) 7road junction d) bankers colony
6) Do you watch soft drinks advertisement In TV? ( )
a) Yes b) No

84
7) if you want to drink packaged drinking water which brand you prefer ? ( )
a) Aquafina b) Bislery c)Water packet d) Kinley
e) Others
8) Where do buy the soft drink ? ( )
a) Pan shop b) kirana shop c) Super market d) As per
convenience
9) What is the reason to drink soft drinks ? ( )
a) Thirsty b) Hungry c) Refreshment d) None of the
above
10) Please mention one recent advertisement of soft drink remember by you ?
11) Any suggestions?

85
BIBLIOGRAPHY
AUTHOR TITLE/PUBLISHER/EDITION
1. Phillip kotler, keller Kevin - Marketing management / prenctice hall of India /14th
edition
2. Blackwell, miniard Engle - Consumer behavior / Thomson /volume 10
3. Shciff man - Consumer behavior / Himalaya publisher / volume 9
4. A.J lamba - Retail management / mc graw-hill / year-2007
5. Swapana pradhan - Retail management / volume-2 / year-2007
www.google.com
Hand books of statistical data
Pepsi websites:
www.pepsiworld.com
www.pepsico.com
News Papers
Business India Magazine