CHAPTER - 1 INTRODUCTION
133
1 CHAPTER - 1 INTRODUCTION Vegetable is ‘Edible seeds or roots or stems or leaves or bulbs or tubers or no sweet fruits of any of numerous herbaceous plant’. They are very tasty. They are of different varieties. They contain vitamins, minerals, fructose and maltose, pectin, acids, aromatic oils and fiber. Consumption of them means make one healthy. Marketing is the process of interesting potential customers and clients in products and/or services. The key word in this marketing definition is "process"; marketing involves researching, promoting, selling, and distributing your products or services. The system of business activities designed to plan, price, promote and distribution a demanded and satisfying vegetable to target market is a vegetable marketing. 1.1 Background Nepal is an agriculture based country. 65% of the total economically active population is engaged in this sector. For the balanced development of the country we have to give prime attention towards this sector. Nepal is a small Himalayan Kingdom and one of the world’s poorest nations. It is land locked between the China in the north and India in south, east and west. It is spread over an area of 147,181 sq. km. According to the population census 2001, the population of Nepal is about 23 Million. Geographically, Nepal is located between 80°4’and 88°12’ east longitude and between 26°22, and 30°27’ north latitude. It is divided into three topological belts, the Terai (a plane that lies along the southern border of India between 75 meters and 300 meter above the sea level), the Hill (a wide band of hills between 300 meters to 3,000 meters) and the Mountain (a rugged surface rising 3,000 meters to 8,848 meters). In north, only 21% of the land is under cultivation which includes agriculture of vegetables. Agriculture is mainstay of the nation’s economy. It provides 75% of employment and accounts for about 42% of nation’s Gross Domestic Product (GDP) and two third of export earnings. But it is a matter of great irony that more than 40% people are below the poverty line.
-
Upload
khangminh22 -
Category
Documents
-
view
2 -
download
0
Transcript of CHAPTER - 1 INTRODUCTION
1
CHAPTER - 1
INTRODUCTION
Vegetable is ‘Edible seeds or roots or stems or leaves or bulbs or tubers or no sweet fruits of
any of numerous herbaceous plant’. They are very tasty. They are of different varieties. They
contain vitamins, minerals, fructose and maltose, pectin, acids, aromatic oils and fiber.
Consumption of them means make one healthy. Marketing is the process of interesting potential
customers and clients in products and/or services. The key word in this marketing definition is
"process"; marketing involves researching, promoting, selling, and distributing your products or
services. The system of business activities designed to plan, price, promote and distribution a
demanded and satisfying vegetable to target market is a vegetable marketing.
1.1 Background
Nepal is an agriculture based country. 65% of the total economically active population is
engaged in this sector. For the balanced development of the country we have to give prime
attention towards this sector. Nepal is a small Himalayan Kingdom and one of the world’s
poorest nations. It is land locked between the China in the north and India in south, east and
west. It is spread over an area of 147,181 sq. km. According to the population census 2001, the
population of Nepal is about 23 Million.
Geographically, Nepal is located between 80°4’and 88°12’ east longitude and between 26°22,
and 30°27’ north latitude. It is divided into three topological belts, the Terai (a plane that lies
along the southern border of India between 75 meters and 300 meter above the sea level), the
Hill (a wide band of hills between 300 meters to 3,000 meters) and the Mountain (a rugged
surface rising 3,000 meters to 8,848 meters). In north, only 21% of the land is under cultivation
which includes agriculture of vegetables. Agriculture is mainstay of the nation’s economy. It
provides 75% of employment and accounts for about 42% of nation’s Gross Domestic Product
(GDP) and two third of export earnings. But it is a matter of great irony that more than 40%
people are below the poverty line.
2
In terms of development, Nepal is one of the least developed countries in the world with a per
capita income of USD 260 (Economic Survey, 2003/04). With a population size if 25 million,
(World Bank, 2005) more than 65 caste/ethnic groups are accommodated in the country. Nearly
38% if these people still subsist below poverty line according to the report of NPC, by the end of
ninth plan, the total figure of employed manpower was estimated to reach 995,900, whereas the
unemployed were estimated to be 5%. However, the percentage of underemployed labor will be
12.4% including the 5% of fully employed. The total unemployed figure is estimated to remain at
17.4% (Tenth Plan, 116-117). This shows a very serious problem in Nepal.
1.1.1 Vegetables
Vegetables are called Tarakari in Nepali. In dictionary terms, vegetable is ‘Edible seeds or roots
or stems or leaves or bulbs or tubers or no sweet fruits of any of numerous herbaceous plant’.
They are very tasty. They are of different varieties. They contain vitamins, minerals, fructose
and maltose, pectin, acids, aromatic oils and fiber. Consumption of them means make one
healthy.
Different vegetables are cultivated in different areas of the nation depend upon the type of soil
and climate. On the basis of vegetables cultivation, Nepal can be divided into the following four
different zones:
A. Tropical Zones
It has high and hot temperature throughout the year except some periods in the winter. The
annual temperature exceeds 24°C. There is no frost. The altitude ranges from less than
100m to 1,000m. The whole Tarai and the lower valleys in the hills fall in this zone.
B. Sub-Tropical Zone
This region is cooler than the tropical area but it has a distinct feature of summer and mild
frost winter. Summer is long and humid. General, altitude range is 1,000m and 1,500m with
an annual average temperature of 17°C to 24°C. Lower mid-hills and low hills fall in this
zone.
C. Mid-Temperature Zone
3
In this zone, the climate is moderate throughout the year and winter is not very severe.
Altitude ranges from 1500m to 2000m. During winter, the higher altitude may get snow. Mid-
hills, base of the high hills and lower Mahabharata lekh fall in this zone. The annual average
temperature is 10°C to 15°C.
D. Temperature Zone
This zone has a pronounced winter with frost. Snow occurs every year. It is cold throughout
the year with an average annual temperature being less than 10°C. The temperature in
winter is below 0°C. The altitude ranges from 2000m to 3000m. Mahabharata lekh and high
hills fall in this zone.
Vegetables are one of the most nutritious and delicious food items. It can be defined as the
matured ovary and other flower parts associated with it. It can be leaves, root or stems of
the plants too. It contains good source of vitamins and minerals required for human growth
and healthy health. Human beings have been consuming it from ancient times.
Consumption is it increased with the development of human society. Due to the increasing
health consciousness and income level of the people, consumption of vegetables has grown
significantly.
1.1.2 Types of Vegetables
Vegetables form an important part of our daily diet; the market is crammed with varieties of
vegetables. Veggies are naturally good and contain lots of minerals and vitamins. They help in
protecting our body against cancers, diabetes and heart diseases.
Almost all the vegetables are low in fat and calories, none has cholesterol, and many of them
are great sources of fiber. The high levels of fiber in vegetables keep the digestive system
healthier; allowing you to avoid issues with constipation. Since veggies are low on calories, it
enables us to eat lots of vegetables without consuming excess energy.
The presence of many vitamins and other substance in vegetables provide nutrients to the
body. Vegetables provide essential amino acids that body needs to survive. A simple meal of
spinach, beans, and whole grain rice is a great way to treat your body right. This give us a
4
natural feeling of liveliness and the energy to become more active helping to burn more energy
each day. Vegetables also add wonderful flavors to your diet.
The availability of vegetables differs from season to season. Different types of vegetables have
been categorized according to their type, and taste.
a) Bulb Vegetables
Bulb vegetables have relatively large, usually globe-shaped, underground buds, or bulbs,
with overlapping leaves arising from a short stem. Common bulb vegetables include onions
and garlic.
Garlic, chive, spring onion (known in Quebec as green onion or échalotte verte), water
chestnut, grey shallot (échalotte française), and other varieties of onions and leeks are
called bulb vegetables because it is not the leaves but the bulbs that are eaten.
Bulb vegetables are aromatic vegetables that are widely used to flavor casseroles, broths,
courts-bouillons and soups. Some bulb vegetables, garlic for example, are also known for
their medicinal virtues. Recent studies reveal that some foods help prevent cancer and even
possess antineoplastic properties. Among these “functional foods” as researchers call them
there are bulb vegetables such as garlic, shallots and onions.
Bulb vegetables can be stored for long periods of time and are not only delicious but very
good for us. Here are some bulb vegetables listed below
Elephant Garlic
Garlic
Chive
Spring onion / green shallot / scallion
Water chestnut
Grey shallot
Onion
Leek

5
b) Fruit Vegetables
The term fruit has different meanings dependent on context, and the term is not
synonymous in food preparation and biology. Fruits are the means by which flowering plants
disseminate seeds, and the presence of seeds indicates that a structure is most likely a fruit,
though not all seeds come from fruits.
No single terminology really fits the enormous variety that is found among plant fruits. The
term 'false fruit' (pseudo carp, accessory fruit) is sometimes applied to a fruit like the fig (a
multiple-accessory fruit; see below) or to a plant structure that resembles a fruit but is not
derived from a flower or flowers. Some gymnosperms, such as yew, have fleshy arils that
resemble fruits and some junipers have berry-like, fleshy cones. The term "fruit" has also
been inaccurately applied to the seed-containing female cones of many conifers.
Here are some fruit vegetables listed below
Avocados
Chayote
Cucumbers
Eggplant
Okra
Olives
Peppers
Squash
Tomatoes
Tomatillos
c) Inflorescent Vegetables
Inflorescent vegetables are vegetables with an edible flower.
Some examples of inflorescent vegetables are
Artichoke: flower head of which the bottom (the receptacle) and le base fothe leaves are
edible.
Cauliflower: hardy white vegetable with a fleshy inflorescence native to Europe.
6
Broccoli: unrounded green cauliflower, with a long green stem.
d) Leaf Vegetables
Leaf vegetables, such as spinach, are the most beneficial foods for your health. Recent
studies have proved that some leaf vegetables can contribute to help in the prevention of
cancer or have antineoplastic benefits. Cabbage, Brussels sprout, watercress and spinach
are part of what scientists call “functional foods”.
A leaf vegetable is one that is grown for its edible leaves. Most leaf vegetables are a good
source of potassium and vitamins A and C. They are very versatile and can be prepared raw
or cooked, in salads, as vegetable side dishes or added to recipes.
When purchasing leaf vegetables, we shall always look for vegetables that are very fresh,
have colourful and crunchy leaves, and show no sign of deterioration. Not only do they taste
great, fresh leaf vegetables have very high nutritional value.
Some leaf vegetables are listed as follow
Kohlrabi
Bok Choy
Kale (or borecole)
Nasturtium
Collard (Collard greens)
Chicory / escarole
Cabbage
Brussels sprouts
Nappa Cabbage
Toy Choy
Cress / Watercress
Endive
Spinach
Lettuce

7
Lambs' lettuce
Sorrel
Dandelion
Radicchio
e) Root Vegetables
Root vegetables are plant roots used as vegetables. Here "root" means any underground
part of a plant [1] (except that peanuts, which are underground seeds, are seldom called
root vegetables).
Root vegetables are generally storage organs, enlarged to store energy in the form of
carbohydrates. They differ in the concentration and the balance between sugars, starches,
and other types of carbohydrate.
Of particular economic importance are those with a high carbohydrate concentration in the
form of starch. These starchy root vegetables are important staple foods, particularly in
tropical regions. They overshadow the cereals throughout much of West Africa, Central
Africa, and Oceania, where they are used directly or mashed to make foufou or poi.
Some Jains are opposed to eating root vegetables for ethical reasons.
Botany distinguishes true roots such as tuberous roots and taproots from non-roots such as
tubers, rhizomes, corms, and bulbs. (Several types contain both taproot and hypocotyls
tissue, and it may be difficult to tell some types apart.) In ordinary, agricultural, and culinary
use, "root vegetable" can apply to all these types. The following list classifies root
vegetables according to anatomy.
Beets
Burdock
Carrots
Celeriac
Malanga
Parsnips
8
Radishes
Rutabaga
Salsify
Turnips
f) Stalk Vegetable
Stalk vegetables are vegetables with edible stalks. Asparagus, celery, fiddlehead ferns,
rhubarb - are all part of this category. In certain cases, the leaves of stalk vegetables are
also edible.
Certain stalk vegetables are familiar to us and the others deserve a closer look. Fennel and
Swiss chard, for example, are gaining in popularity not only because of their great taste but
also because of their high vitamin and mineral content.
Some stalk vegetables are listed below
Asparagus
Bamboo
Cardoon
Celery
Chard
Fiddlehead
Fennel
Kohlrabi
g) Tuber Vegetable
The tuber is the enlarged tip of an underground stem (rhizome). The plant uses this tip to
store food.
Tuber vegetables, like the yam, the manioc, the sweet potato, the potato and the
underestimated Jerusalem artichoke, have long served and still serve as a staple in many
9
regional cuisines. Indeed, they are generally very inexpensive and have that “stick to your
ribs” quality about them. They are rich in carbohydrates, very versatile and serve to
generously fill the plates of the most ravenous appetites.
Vegetables with large, edible, bulb-like roots that are high in nutrients but low in calories,
and most do not contain fat. Tubers are capable of producing new plants. Store dry and
unpeeled and they should keep for several weeks.
Examples of tubers listed below
Cassava
Crosne
Jerusalem artichoke
Jicama
Potato
Sweet potato
Taro
Yam
1.1.3 Organic Vegetables
Organic vegetables are made in a fashion that limits or excludes the use of synthetic materials
during production. For the vast majority of human history, agriculture can be described as
organic; only during the 20th century was a large supply of new synthetic chemicals introduced
to the vegetable supply. This more recent style of production is referred to as "conventional."
Under organic production, the use of conventional non-organic pesticides, insecticides and
herbicides is greatly restricted and saved as a last resort. However, contrary to popular belief,
certain non-organic fertilizers are still used. If livestock are involved, they must be reared without
the routine use of antibiotics and without the use of growth hormones, and generally fed a
healthy diet. In most countries, organic produce may not be genetically modified. It has been
suggested that the application of nanotechnology to vegetable and agriculture is a further
technology that needs to be excluded from certified organic vegetable.
10
Environmental pollution and vegetable safety due to chemical contamination become a great
concern worldwide. Food and Agriculture Organization (FAO) proposed “The World Food
Summit Plan of Action (1999)” in recognition with the importance of developing alternative
sustainable agriculture such as organic farming. Organic farming is an integrated farming
system which involved technical aspects (soil, agronomy, and weed and pest management) and
economic aspects (input, output and marketing) as well as human health. Organic farming
claims to have the potential to provide benefits in terms of environmental protection,
conservation of non-renewable resources, improved food quality, reduction in output of surplus
products and the reorientation of agriculture towards areas of market demand (Lampkin, 1990).
Sharma (2001) makes a case for organicfarming as the most widely recognized alternative
farming system for sustainable production without seriously harming the environment and
ecology. Veeresh (1999) opines that both high technology and sustainable environment cannot
go together.
Since consumption of organic food products is the best remedy to prevent the numerous health
hazards caused by conventionally produced foods, the global market has experienced
exceptionally high growth in organic foods in the United States, Europe, and in other countries,
yet market shares remain quite small (Piyasiri and Ariyawardana, 2002). However, in
developing countries, the growth of organic sector is quite slow and faces tremendous
challenges. Nepal’s organic agricultural production has a relatively short history. Adoption of
organic farming is quite slow, market for organic products is not well developed and no market
statistics are available in Nepal (Bhatta et al., 2008a).
Nevertheless, there is a growing trend among urban consumers to consume organic products
from places where they could get an assurance about the quality of the products. Market
features of organic products in Nepal show that it is still in the "formative stage" of the product
life cycle (Bhatta et al., 2008a). Despite these facts, there are some rays of hopes among the
organic producers and traders in the country. Growth of organic agriculture requires producers’
and consumers' awareness, availability of sound infrastructures and consumers' willingness to
pay for the organic products. Nepal, being a developing country, definitely majority of the
consumers is not well off. However, a large chunk of consumers are clustered in and around
urban areas of the country and they could pay for the organic products provided quality is
assured. Market potentials are mainly determined by consumer expectations of the product
attributes, which are attached to the product such as quality (Ramesh et al., 2005), price

11
(Roddy et al., 1996; Fotopoulos and Krystallis, 2002), certification (Kotler, 2001), price and
quality (Boyle and Lathrop, 2009). Also consumers’ awareness of health, food safety,
environmental, and technology issues related to food products as well as the industrialization of
agriculture and globalization, have been identified as diversification factors of food consumption
(Senauer, 1994). Some empirical evidences regarding consumers’ preference for differentiated
quality attributes are given by Bhatta et al. (2008b), Bower and Baxter (2000), Elliott and
Cameron (1994), Lans et al. (2001) and Okechuku (1994). There is the need to investigate
wider perspective of organic farming through producers’ and consumers’ view point.
HELVETAS Nepal, World Vision International Nepal, USAID are giving their great effort to
encourage the Nepali people in organic vegetable cultivation, marketing and good get good
income to make their life better. As a result more Nepali farmers are satisfied with the result of
their effort in organic vegetable agriculture.
1.1.4 Some Problems of Vegetable Cultivation
Vegetables pose immense values in Nepal and to its people but program on vegetable
development in this country appear weak. The fact may be that vegetable contribute very little in
the nation’s GDP, i.e. 3.4% by the vegetables versus 58% by food grains in agriculture sector
during 1995/96 (Shrestha, 1998). The government has initiated vegetable development
programs and activities in different ecological zones. Some progress and achievements have
been seen; but they are not to a satisfactory level. Some factors and condition that lead to
cause one of more problems, which hindered vegetables development activates are generalized
in this section.
The economic status of the rural mass is very low. They cannot go for planting of
Vegetables that require heavy initial investment as well as it require high level of care and
management practices regularly and continuously at the initial stage.
This high initial cost has distracted farmers from vegetable plantation. In one hand, small
farmers receive inadequate loans for farming while on the other hand, they are not sure of
quality of the product and its marketing disposal. Above all, for them, food grains (cereals and
millets) are more important than the fruits to sustain their existence.
12
Majority of Nepalese people have fragmented and scattered land. The increasing population
growth and normal family separation further decrease the land size. In this country, over 50% if
the farming household owns land less than one hectare. Vegetable farming needs a large
spacing of land. The small land size undulated and steep topography have also under
appropriated the value of it and hence, the production as well.
The vivid geography and topography available in this country are natural boon to create climatic
diversities accommodating enormous biodiversities including vegetable species that require
from a cool to hot and from dry to humid conditions. The side of mountain o high hills facing
north has cooler weather than the slope facing south. Even the physical characteristics of soils
of the valley and surrounding hills differ. These changes pose a great diversity in adaptation o
vegetable plants. The factors are not considered properly and adequately in planning process;
thus in many places where we visit, planting of vegetable plants in farmers field are defective.
Also, there exist difficulties in transportation of inputs and farm product. Marketing of perishable
product such as vegetable is a real concern. As a result, vegetable growing business has
become difficult in this country.
Vegetable plants need adequate temperature, rainfall, wind, light and humidity for proper growth
and development of it. Often times, frost, freeze, hailstorm, speedy winds and thunderstorms
are seen in various parts of Nepal. They cause problems in its cultivation to a variable extent.
Frost and freeze are so damaging to vegetable plants that hey may lead to death of these
plants. Hails reduce imbalance sources and sink relationship by destroying leaf surface. Speedy
winds are responsible for disturbing pollination particularly in the insect pollinated crops by
distracting pollinators. Such high winds aggravate premature drops of flowers and fruits heavily
and even uproot the whole plant.
Several types of soil are available in Nepal. Some are suitable for growing agriculture crops
while others are not. For vegetable species; they need 2 to 3 m deep soils with sufficient
available nutrients. But except in valleys, the hilly tracts
And undulating yet sloppy areas with marginal land types do not contain sufficient mineral
nutrients to support tree growth. Vegetable plants are planted in these soils do not produce
desirable harvest unless they are supplemented with adequate manure and fertilizers. In some
areas where farming is done intensively with fertilizer application, such practices have resulted
into poor soil conditions due to the unbalanced use of chemical fertilizers. Without proper
amelioration of these soils vegetable plants will not produces satisfactory yields.
13
When the host, pathogen (pest) and a suitable environment coin together many pests and
diseases damage vegetable crops with varying degree of yield loss. In Nepal, pests and
diseases attack vegetable plants severally. Proper care and management procedures before or
after the incident must be a regular schedule in orchards. Based on scientific procedures,
proper plant protection techniques and methodology for controlling pest and disease of
vegetable plants are not yet developed.
Without extension services agriculture activities and scientific technologies cannot be
disseminated to the local farmers. The present extension activities and outreach programs are
largely biased to cereals. Personnel who work for cereals cannot or will never be expert on
vegetables.
Therefore, objective vegetable extension programs are not available. Although one Assistant
Horticulturist is available at the District Agriculture Office, the officer is not an extension
specialist trained on vegetable extension program, policies and activities; thus extension and
expansion of vegetable cultivation are not to desirable level in Nepal.
In horticulture vegetable growing and production systems require appropriate technologies
based on scientific details. But today, most farmers in Nepal use traditional ideas or concepts
and adopt decades old methodologies. For example, vegetable plants are still grown in places
where cereals cannot be grown. Farmers feel that vegetable plants do not require manure and
fertilizer and irrigation is not essential for vegetable plants that once vegetable plants are
planted they bear vegetables automatically without care etc. unless the farmers are convinced
well and motivated for growing vegetable plants by using scientific techniques, vegetable plants
growing as a business is unlikely to prosper.
Most horticultural produce inducing vegetables are perishable and fleshy vegetable lose their
quality within a few days. In the market quality aspects are neglected. Consumers and buyers
are not impressed with low quality vegetables. The control over both the quality and price of
fruits should not be overlooked if vegetable plant growing is to be enhanced.
Tall and vigorous vegetable like fruit plants with long juvenility and irregular bearing behavior as
well as plant protection complexities were perennial problems to get sound vegetable planting.

14
True to type vegetable varieties are difficult to find in Nepal. Improvements on vegetable
varieties through proper selection, crossing, and mutation could be effective for solving many of
the problems that exist with vegetable plants. But these varieties for permanent and healthy
vegetable improvement program when proper evaluation and maintenance of these introduced
genotypes are lacking.
Most of the technical people know how about plant vegetable plants manure fields, providing
best cultural operations, control weeds, pests and diseases harvest vegetable from the plants,
etc. are borrowed from the other counties. Most horticulture experts working on vegetable
production technology do not have adequate in-country information. These experts cannot face
farmers and stay much behind to answer questions pertinent to specific operation for a given
variety at particular location.
The National Planning Commission has paid due respect to agriculture development. However,
little attention is given to vegetable plants, its cultivation and marketing. While preparing short or
long term programs different organizations/agencies must work, cooperate and coordinate with
one another in formulating plans, making budgets and evaluation level in terms of supplying
inputs, providing financial supports and sending technical experts. Sometimes
recommendations of one organization become futile with programs and policies of other line
agencies. Because of these situations, vegetable growers get frustrated.
1.1.5 Brief Introduction about Kathmandu
In the ancient period Kathmandu was called Nepal. People named this place as Pashupatinath
region after the Pashupatinath temple was built. The stone carving of Lichhivi period proves this
fact. The name Kathmandu was given by Sanskrit word Kasthamandap because a temple made
from wood only is constructed this temple. This district is one of the districts among the eight
district of central development region and is the capital of Bagmati Zone and Nepal.
King Guna Kamdav built the city of Kathmandu in 723 AD. It is widely believed that Kathmandu
was a big lake was habitable when Manjushree cut the hill open at Chovar to drain out the
water.
15
Kathmandu is named after “Kastha-Mandap” meaning the temple made of wood in Sanskrit, an
imposing Pagoda near Hanuman Dhoka Palace. Kathmandu is the capital city of Nepal. The
population of Kathmandu city is 1,081,845 according to the census 2058. In which males are
576,010 (53.17%) and females are 505,835 (46.83%). The higher population density is 1,800
persons/sq. ft. It is situated at an altitude of 1,350 meters.
Kathmandu, by virtue of being the capital city, is the nation’s first political, administrative,
commercial, tourist, educational and cultural center. The city has rich cultural heritage. In the
17th century the valley consisted of the three city-states and they are Kathmandu, Patan and
Bhaktapur. During this time the valley was an important link on the route between Tibet and
Northern India. During the reign of the Malla the palaces and many of the temples were built in
the 16th and 17th centuries.
When king Prithivi Narayan Shah united Nepal this was the end of the city-states in the
Kathmandu valley. Kathmandu became the capital of Nepal. The language spoken by the Khas
of western Nepal became the official language of Nepal replacing Newari. Because of the
growing number of people and vehicles in the valley, especially in Kathmandu, air and water
pollution are becoming a real problem.
The valley is fertile and rise, wheat, corn, vegetables and a variety of fruits (banana, orange) are
grown. Several rivers flow to the center of the valley and meet the holy Bagmati River, which
then flows to the south pass through the Chovar Gorge and eventually meets the Ganga in
India.
a. Geographical StatusKathmandu district lies in the 73rd position on the basis of area but lies in the first position on
the basis of population density of Nepal. The total area of Kathmandu is 41,202 hectares.
Geographically, eastern, northern and western side is covered by mountains regions. At the
southern side, plain agriculture lands are found. This district is at an altitude of 1,262 m to
2,032 m from the sea level. The shape of this district seems to be ‘L’ since it expanded from
east to west and turned towards south. The border of Kathmandu district touches seven
districts. Bhaktapur, Lalitpur, Kavrepalanchowk and Shindhupalchowk lie in east. Nuwakot
and Shinduplachowk lies in the north. And Bhaktapur, Lalitpur and Makawanpur lie in the
south. The three high mountains, Chandragiri, Shivapuri and Nagarjun lie in this district.
16
The area of this district is spread over 27°27’ to 20°49’ northen longitude and 85°10’ to
85°32’ eastern latitude. Kathmandu district, the capital of the country has one Metropolitan
City, one municipality and 57 Village Development Committees. This district is divided into 7
election sites and 17 sub zones for the election of district development committee.
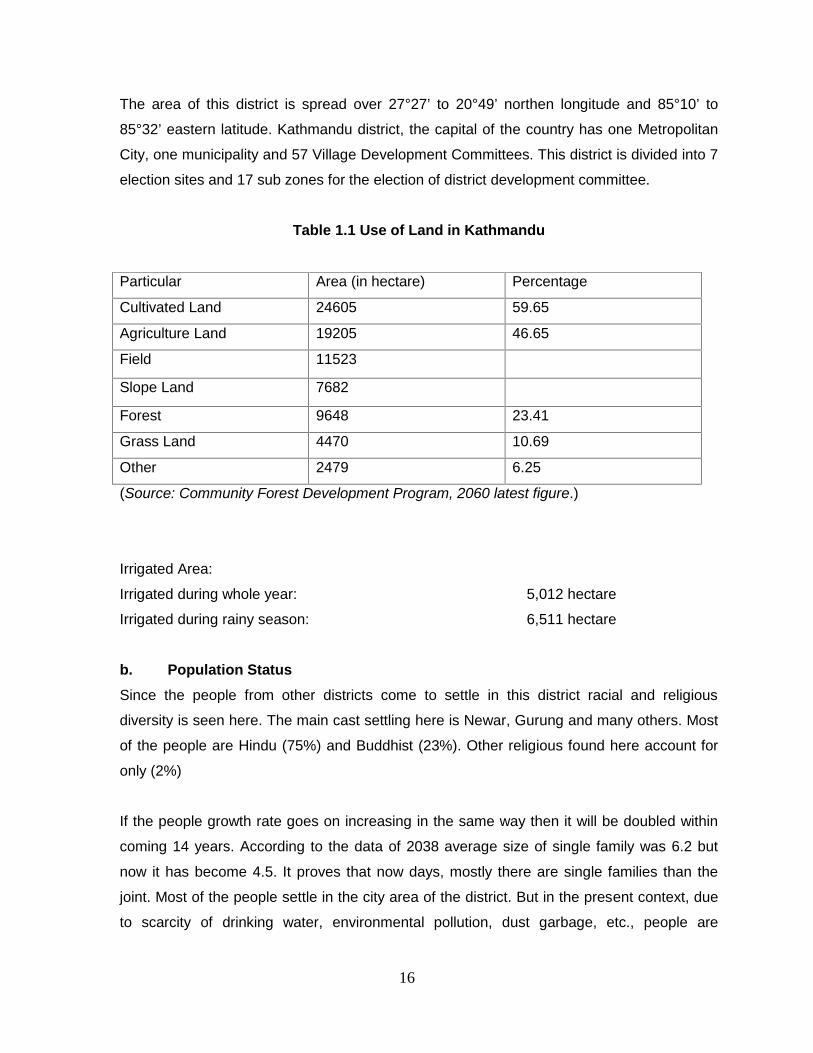
Table 1.1 Use of Land in Kathmandu
Particular Area (in hectare) Percentage
Cultivated Land 24605 59.65
Agriculture Land 19205 46.65
Field 11523
Slope Land 7682
Forest 9648 23.41
Grass Land 4470 10.69
Other 2479 6.25
(Source: Community Forest Development Program, 2060 latest figure.)
Irrigated Area:
Irrigated during whole year: 5,012 hectare
Irrigated during rainy season: 6,511 hectare
b. Population StatusSince the people from other districts come to settle in this district racial and religious
diversity is seen here. The main cast settling here is Newar, Gurung and many others. Most
of the people are Hindu (75%) and Buddhist (23%). Other religious found here account for
only (2%)
If the people growth rate goes on increasing in the same way then it will be doubled within
coming 14 years. According to the data of 2038 average size of single family was 6.2 but
now it has become 4.5. It proves that now days, mostly there are single families than the
joint. Most of the people settle in the city area of the district. But in the present context, due
to scarcity of drinking water, environmental pollution, dust garbage, etc., people are

17
migrating towards ‘Village Development Committees. Because of this reason, the cultivable
land is changing into housing land.
The Newars are considered to be the original inhabitant of the valley. They speak a Tibetan-
Burmese language but their physical feature are both similar to Mongolian, which indicated
the original form the east and Indo-Aryan features, which indicates origin from India.
c. Climate
Kathmandu has a pleasant sub-tropical cool climate. Summer (June-August) is warm to hot
(March-May) and autumn (September-November) is warm during the day and cool in the
night. Winter (December-February) is cold with minimum temperature of about 0°C but
mostly sunny during the days. The annual rainfall is about 1,300 mm.
The temperature and status of rainfall of any reason symbolize the condition of crop farming
and its consciences. Kathmandu district lies in the central mountainous region, near the
Himalayas. So, in the winter season the climate becomes very cold. In the summer season
climate is warm but not too hot.
The maximum temperature is 32°C in the month of Ashad and minimum temperature is -2°C
in Magh. The average rainfall is 1,764 ml.
d. Condition of Road
Roads of Kathmandu district touch most national roads. But in some of the Village
Development Committee transportation facilities are available only in winter. However, most
of the Village Development Committees of this district have graveled roads and concrete
roads. Because of the transportation facility, the sector of agriculture is too developed,
commercially. Total road length is 804 km (including concrete, graveled and non graveled
road).
e. Major Irrigation Projects
18
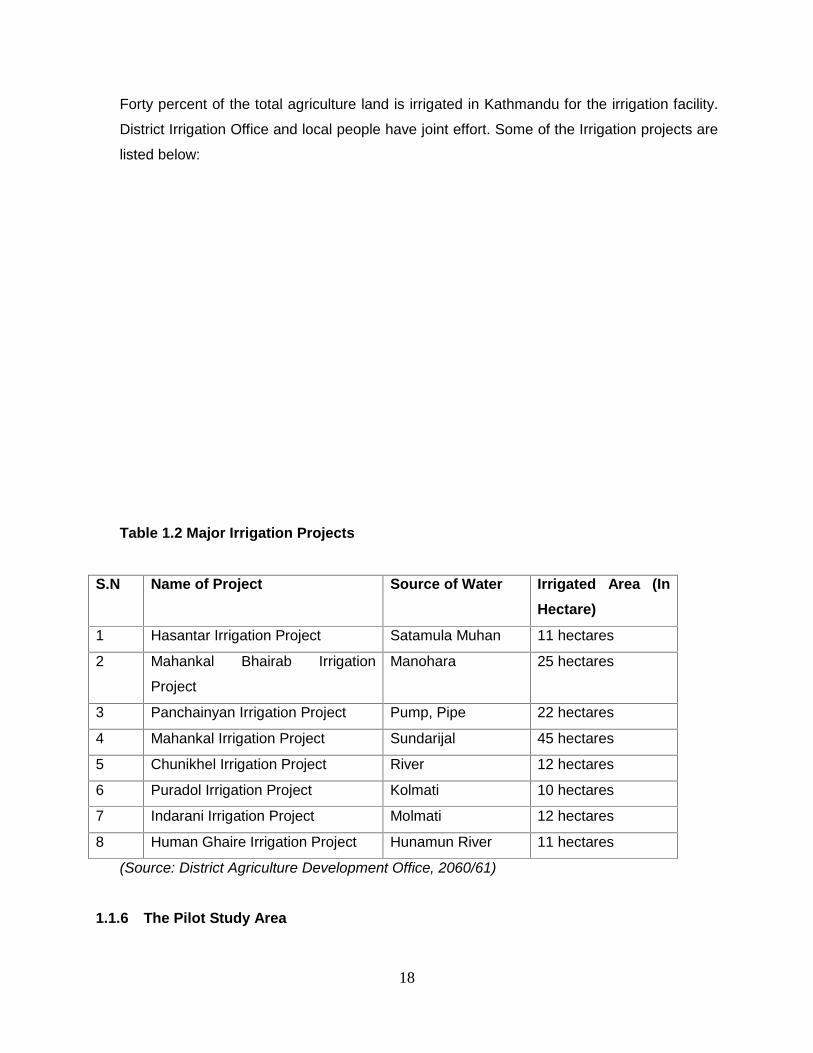
Forty percent of the total agriculture land is irrigated in Kathmandu for the irrigation facility.
District Irrigation Office and local people have joint effort. Some of the Irrigation projects are
listed below:
Table 1.2 Major Irrigation Projects
S.N Name of Project Source of Water Irrigated Area (InHectare)
1 Hasantar Irrigation Project Satamula Muhan 11 hectares
2 Mahankal Bhairab Irrigation
Project
Manohara 25 hectares
3 Panchainyan Irrigation Project Pump, Pipe 22 hectares
4 Mahankal Irrigation Project Sundarijal 45 hectares
5 Chunikhel Irrigation Project River 12 hectares
6 Puradol Irrigation Project Kolmati 10 hectares
7 Indarani Irrigation Project Molmati 12 hectares
8 Human Ghaire Irrigation Project Hunamun River 11 hectares
(Source: District Agriculture Development Office, 2060/61)
1.1.6 The Pilot Study Area
19
The different vegetable markets inside Kathmandu are taken as the pilot study area. Most of the
people from the peripheral village and almost all the people of the urban area buy and sell the
vegetables within this area. It is the main market place for city dwellers, village and even for the
jobholders of the other district than Kathmandu.
1.2 Statement of Problem
Since Kathmandu district is a rapidly urbanizing region of the country, its marketing problem
is much more complicated than in other parts of the country. Thus, we can conclude that
there is scarcity in seasonal production of vegetables that has resulted in artificial scarcity
as well as excess during some seasons. The farmers do not get remunerative prices and
the consumers do not get vegetables of their choice. The periling trend may lead to
dissociation of the farmer and submission of local produce by imports. The prominent
problem is therefore marketing of vegetables in a systematic manner.
Since, vegetables are produced in the different ecological centers of the country. Firstly,
there are lacking the proper transportation facility. For examples the vegetables which are
produced in the Himalayan reasons cannot transit easily. So we still are importing them
from China and India. It is due to the problem of road and transportation.
Secondly, the purchase of highly nutrient vegetables is very low in context of Nepalese.
This is due to low economic problem.
Thirdly, the supply of vegetables is irregular due to strikes in Nepal.
Fourthly, there is still lack of knowledge in certain vegetable production. They are not
expert.
Fifthly, we have lack of new production technology.
At last, there is no systematic marketing strategies made and storage is poor too. Thus
harvest losses are very high in our country. This study would concentrate around the
problems as stated in the following points:
a. Is the quality and quantity of vegetables available in Kathmandu satisfactory?
b. Is the price of vegetables reasonable?
c. Are the consumers aware of vegetables consumption?
d. What is the trend of vegetables farming and marketing in Kathmandu?
20
e. Are the vegetables within the affordable price level of general consumer?
1.2 Objectives of the study
The study will proceed with the following major objectives:
a. To review the situation of production and consumption of vegetables in Kathmandu
district.
b. To examine the demand for and supply of vegetables in Kathmandu district.
c. To analyze the problems and prospects of vegetable marketing in Kathmandu district.
d. To draw conclusions and recommend suggestions for the improvement of vegetables
marketing in the Kathmandu district based on the finding of this study.
1.3 Significance of the study
In Nepal, a greater percentage of population is under nourishment. They are suffering from
various diseases and such problems can be removed by consumption of more and more
vegetables in daily diet. Since Kathmandu district is rapidly urbanizing, its marketing problem is
more complicated than in the country as a whole. The vegetable market in the valley is suffering
from various marketing problems due to which a significant level of vegetable goes waste.
Appropriate provision marketing facilities help to minimize the imbalance between season and
off-season. It helps to smooth supply of vegetables throughout the year and help to establish
fixed price. Hence, some concrete steps have to be taken to improve production, distribution
and marketing of vegetable.
1.4 Limitations of the Study
Every study has to be conducted taking certain constraints into consideration. The study will
have following limitations:
a. The study will be based on the secondary as well as primary data.
b. The study will be based on the annual publication of vegetables
21
c. The study will be mainly focused on the problem on marketing in theoretical way and
the analysis of price of vegetables in statistical method.
d. This study will be limited only within Kathmandu district.
22
CHAPTER - 2
REVIEW OF LITERATURE
Review of literature means reviewing research studies or other relevant proposition in past
studies. This provides insights into past studies and progress on similar fields. This review can
be categorized into two major parts. One is conceptual/ Theoretical review and another is
review of related studies. Conceptual review is concerning into the subject matter that are
written in related studies, magazines and concerned books by experts in related field. The
review of related studies includes reviews of the previous studies which are related to the
subject matter of this study. It further divided into theme paper and review of previous studies.
2.1 Conceptual Review2.1.1 Marketing Concept
According to Phillip Kotler, “Marketing is typically seen as the task of creating, promotion,
delivering goods and services to consumers and business. In fact, marketing people are
involved in marketing type of entitles, goods, services, experiences, events, persons, places,
properties, organizations, information and ideas” (Kotler, 1997)
The numerous definitions offered for marketing we can distinguish between a social and
managerial definition. A social definition shows the roles of marketing plays in society. One
marketer said that marketing’s role is to “deliver a higher standard of living” social definition that
serves our purposes as follows:
“Marketing is societal process by which individuals and groups obtain what they need and what
though creating, offering and freely exhausting products and services of value with
others”(Kotler, 1997:8)
For a managerial definition, “Marketing has often been described as “the art of selling products”
but people are surprised when they hear that the most important part of marketing is not selling!
Selling is only the tip of the marketing iceberg” (Kotler, 1997:8)

23
According to American Marketing Association, “Marketing is the process of planning and
executing the conception, pricing, promotion and distribution of ideas, goods and services to
create exchange that satisfy individual and organizational goals” (Kotler, 1997:8)
Another definition given by William M. pride and O.C. Farewell attempts at viewing marketing as
a set of diverse marketing group of activities performed by diverse group of activities as
“Marketing consist of individual and organizational activities that facilitate and expedite the glow
of goods and services from producers to consumers satisfying exchange relationship in a
dynamic environment through the creation, distribution, promotion and pricing of goods,
services and ideas”
“Marketing has been developing together with development in human civilization. If we trace
three-four hundred years back to the history for human civilization, we find marketing of that
time, by modern standard was relatively uncultured. They did not read mechanism or tools or
techniques of marketing as used today. But now all the situations have changed the needs and
what have changed. Human aspirations for excellent and better status have given birth to
thousand of discoveries, inventions and innovations and established thousands of units of
different types of industry to fulfill that aspiration. These changes in turn not only interested for
successful marketing but also made the marketing a most competitive field” (Kotler, 1997:8)
There are five competing concepts under which organizations can choose to conduct their
business. They are the production concept, the product concept, he selling concept, the
marketing concept and the social marketing concept. The first three concepts are of limited
usefulness today. The marketing concepts holds that the key to achieving organizational goals
consist of determining the needs and wants of targets markets and delivering the designed
satisfactions more effectively and efficiently than competitors. It starts with a well defined
market, focuses on customer needs, co-ordinates all the activities that will affects customers,
and produces profits by satisfying customers. (Kotler, 1997:29)
In recent years, some have questioned whether the marketing concept is an appropriate
philosophy in a world faced with major demographics and environment challenges. The social
marketing concept holds that the organization’s task is to determine the needs, wants the
interests of target markets and to deliver the desired satisfaction more effectively than
24
competitors in a way that preserve or enhances the consumer’s and the society’s well beings.
The concept calls upon marketers to balance three considerations. (Kotler, 1997:29)
Company profit
Consumer satisfaction and
Public interest
Marketing is as critical to better performance in agriculture as farming itself. Therefore, market
reform ought to be an integral part of any policy for agricultural development (Acharya and
Agrawal, 1999).
Agriculture marketing can be defined as comprising of all activities involved in supply of farm
inputs to the farmers and movements of agricultural products from the farmers to the consumer.
Agricultural marketing system includes the assessment of demand for farm-inputs and their
supply, post-harvest handling of farm products, performances of various activities required in
transferring farm products form farm gate to processing industries and/or ultimate consumers,
assessment of demand for farm products and public policies and programs relating to the
pricing, handling, and purchase and sale of farm inputs and agricultural products.
Conventionally, agriculture marketing starts when the crop is harvested. Nevertheless, in the
commercial age, marketing starts with the decision to plant. ‘What’, ‘When’, ‘How much’,
‘Where’ are the basic questions involved in the decision making process that characterizes
where really marketing starts. Thus, agriculture marketing is conceived as a process which
starts from farmer’s decision to produce a saleable farm commodity and it involves all aspects of
the marketing structures or systems, both functional and institutional with technical and
economic considerations including products assembling, preparation for market, distribution and
use by final consumer (Kaini and Singh, 1998). This is relevant in marketing of fruits as well. So,
fruit marketing can be considered as a complex activity involving diverse problems from different
aspects, although there has been no any systematic economic study on the viability of fruits
industry in Nepal.
2.1.2 Evolution of Marketing
25
The evolution of marketing has been analyzed in similar way by various authors in their
independent works. Some of the authors are William J. Stanton, Philip Kotler, Gary Armstrong,
etc. The different stages in the process of evolution of marketing areas are as follows:
a) Production Oriented StageThe production concept lies in the philosophy that consumers will favor products that are
available and highly affordable and that management should therefore focus on improving
production and distribution efficiency (Kotler, 1997:17).
According to Kotler and Armstrong that it is still a useful philosophy in two types of
situations:
When the demand of a product exceeds the supply, management should look
for ways to increase production.
When cost of production is high and is required to decrease to expand market
(Kotler, and Armstrong, 1997:14).
b) The Product Oriented Stage
The ideas that the consumer will favor products that after the most quality, performance and
features and that the organization should therefore, devote its energy to making continuous
products improvements (Kotler, 1997:18).
c) The Sales Oriented Stage
The stage emerged with the philosophy that consumers would not buy enough of the
organization’s products unless the organization undertakes a large scale selling and
promotion effort (Ibid: 18).
d) Marketing Oriented Stage
26
The basic target of this stage is that the achievements of organization’s goals depend on
determining the needs and wants to target markets and delivering the desired satisfaction
more effectively and efficiently than do competitors (Ibid: 19).
e) Societal-Marketing Oriented Stage
This is the latest development in the field of marketing. The stage is based upon the fact that
the organization should determine the needs/wants and interest of the target markets and
deliver the desired satisfaction more effectively and efficiently than do competitors in a way
that maintain or improve the consumer’s and society’s well being (Ibid: 27).
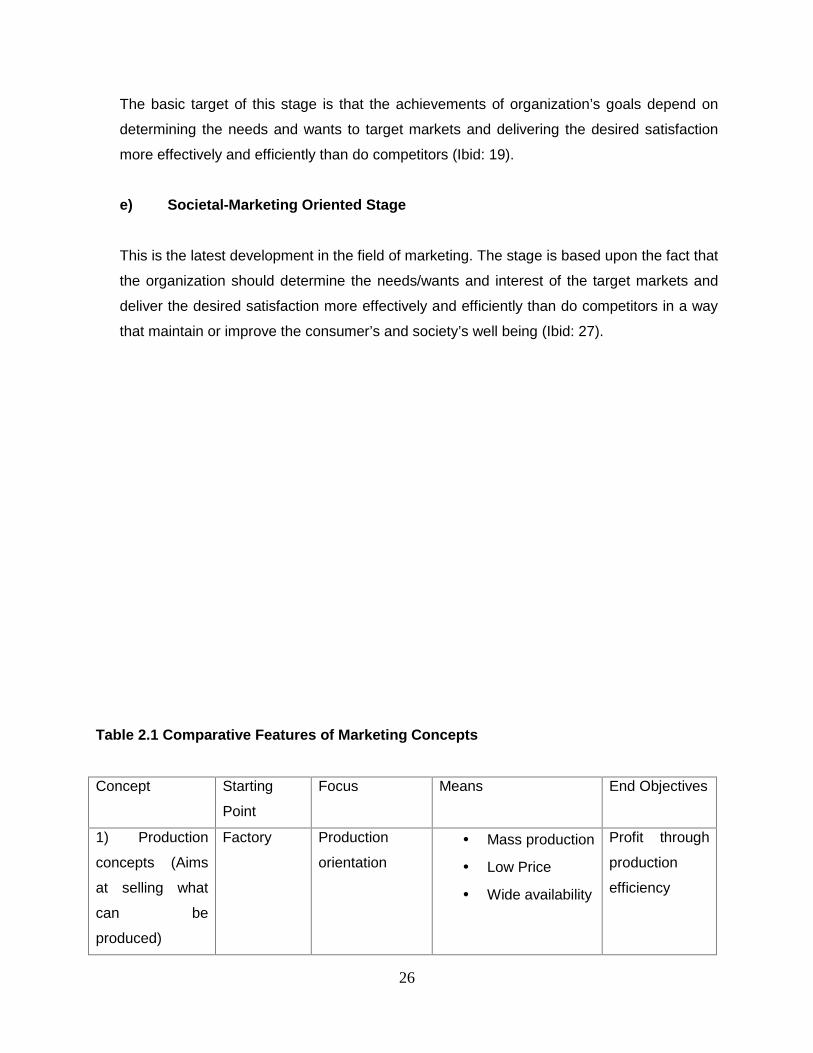
Table 2.1 Comparative Features of Marketing Concepts
Concept Starting
Point
Focus Means End Objectives
1) Production
concepts (Aims
at selling what
can be
produced)
Factory Production
orientation Mass production
Low Price
Wide availability
Profit through
production
efficiency
27
2) Product
concept (Aims at
improving the
product)
Factory Product quality
orientation High quality
Innovation
Performance
Guarantee
Profit through
well-made
products
3) Selling
concept
Markets Sellers needs
orientation Aggressive
selling
Heavy
promotion
Profit through
high sales
volume
4) Marketing
concept
Markets Customer
needs
orientation
Integrate
marketing
Profit through
customer
satisfaction
5) Societal
Marketing
concepts (Aims
at promoting
social welfare)
Marketing Social
responsibility
orientation
Integrate
marketing
Concern for
social welfare
Profit through
customer and
social well
being
(Source: Dr. Agrawal, G.R., Marketing Management in Nepal: 17)
2.1.3 Importance of Marketing
Marketing plays a very significant role in accelerating the pace of industrialization which, in turn,
aims at making the economy developed and strong. In this connection, it is significant to note
that marketing is the most important multiplier of economics integration and the fullest utilization
of assets and production capacity an economic already possesses. It is mobilizes latent
economic energy and finally contributes to the greatest needs for the rapid development of
entrepreneurs and mangers. Ultimately, the development of entrepreneurs and managers help
in managing industrial activities in a country. It is evident that the industrially developed
countries are developed in the area of marketing too.
Marketing plays an important role in the process of industrialization. The proceeds of industrial
activity are passed on to the society through the process of marketing. Hence, the success or
failure of business largely hinges upon the art and science of marketing which is composed of
explorative knowledge, tact and talent of veteran practitioners. In the global market, the
multinational companies like Sony, Hitachi, Philips, Procter and Gamble, Johnson and

28
Nicholson and many others have been permeating throughout the world with the help of modern
marketing practice and method, such as Tatas, the Birlas, Bajaj India and STC, Thai Food (Rara
Noodles) and Pancha Kanya Iron in Nepal. Marketing in this sense has made the producers as
well as the customers more conscious towards comparative services, values, safety,
satisfaction and convenience (Sharma, 1999:4).
Marketing is instrumental for industrial development. He also observes that marketing problems
could be more obtrusive that many other deterrents to the process of industrialization. The
growth of marketing attributes to disseminate new ideas favorable to economic growth
(Sherbini, 1955). Growth in marketing could help disseminate new ideas favorable to economic
growth, new pattern of consumption, possible new techniques and new ideas of social relations
(Hirch, 1969), while discussing the need for broadening the social role marketing argues that it
can help reduce and eliminate poverty, preserve, and natural resources and stimulate economic
growth. Slater (1976) mentions that it has become an article of faith among preachers of the
‘gospel’ that marketing has something vital and constructive enhances potential aggregate
demand, which further aids to enlarge market, and accelerate economic development. (Rao,
1982:60) opines that it plays the role of an educator, it cultivates changes in public attitude, it
brings about changes in the ‘quality of life’, it encourages a modern way of living, it increases
the standards of living; it strives to build efficient economic and social institution; it strives to
secure the satisfaction of the public which is the primary recipient of national development.
Marketing has a cost reducing dimensions. Effective marketing not only create new and bigger
markets, thereby helping to activate production, it enables industries to reduce cost, create
further demand and ensure further production increase (Anthoney, 1984).
Marketing irony of cultural values is the next pivotal element to an industry’s survival prosperity
or quite from a particular market. Campbell soup withdrew few markets in Brazil because
housewives believed they weren’t fulfilling homemaker’s role if they served canned soups. Even
in the countries like Japan, Australia, Singapore and many European countries, consumers
seem to put their money where their mouth is regarding the purchase of environmentally
sensitive products, in spite of being environmentalism political factors. However, this factor of
marketing may be underestimated in the countries like Nepal, Bangladesh, Pakistan, and India
and so on where there is a crying need of clothes, food and shelter, and lower purchasing
capacity; and irregular buying habit as compared to marketing countries.
29
Marketing threats or opportunities for industries also differ in their countries to a great extent,
differing in product, distribution, pricing, promotion, and control strategies.
2.1.4 Marketing Concepts in Nepal (Agrawal, 2003)
a. The economy of Nepal is characterized by excessive dependence on agriculture. The
industrial sector is in a developing stage. The role of services has been growing in
recent years. Dei to the topographic diversity of the country coupled with poor transport
and communication facilities, marketing has remained fragmented.
b. The public sector remains dominant in the Nepalese economy. The private sector is
developing dominant in the Nepalese economy. The private sector is developing and
dominated by the family owned and managed businesses. The advent of global
companies, especially in tourism and finances sectors, has resulted in the transfer of
new marketing skills along with capital and technology.
c. Marketing has traditionally remained a neglected aspect in Nepal. Enterprises tend to
concentrate on production and selling rather than marketing. The selling concept has
been serving as the marketing philosophy of Nepalese mangers. The public sector has
generally remained indifferent to the marketing concept.
d. The marketing concept has not been embraced by most Nepalese organizations. This is
clear from the following points:
i. Management philosophy’s most organization of Nepal does not emphasize
customer orientation.
ii. Target markets have not been clearly defined by most Nepalese organizations.
iii. Marketing information system has remained very weak in most organizations.
iv. Marketing activities have remained fragmented in the organization structures.
They have not been organizationally coordinated. Marketing department has not
become a part of the top management team.
v. Organizations tend to be more interested in producing products and marketing
profit through selling and production. This indicates the least concerned about
satisfying the needs of the customers.
30
e. Prospects for the marketing competition: Nepal has experienced significant socio-
economic changes over the last 25 years. The supply-driven marketing changes over the last 25
years. The supply-driven marketing where organizations could sell everything produced, is
increasingly giving way to demand driven marketing. The realization is gradually comes that
customer and their needs are important in marketing. The increasing intensity of competition in
the Nepalese market has also helped in this regards.
2.1.5 History of Production of Vegetables in Nepal
Growing of vegetables in Nepal is not of a recent origin. There are indigenous, yet wild and
cultivated vegetables in this country; they are reported to be observed from almost two
centuries. More specially, some of the important vegetables species like fruits mango, litchi,
papaya, guava, mandarin etc were introduced and planted in orchards prior to the Rana
Regime. During the Rana period, many vegetables orchards were established and vegetables
varieties introduced. Nepal Government initiated activities on vegetables crop development in a
few districts during the 1950s. However, country-wise vegetable and fruit development activities,
including research, training, sapling production and distribution took a rapid momentum form the
1960s after the establishment of 14 horticultural farms/stations at various districts with the
support of Indian Aid. Many agricultural and horticultural projects started in Nepal after 1970
with the financial and technical assistance of donor agencies and of different countries made
vegetables development programs even stronger, need-based and extensive.
Major development in vegetables production and marketing was started especially after the end
of Rana Regime, i.e. after 1950. Department of agriculture was created in 1950.51 which
initiated vegetables development activities in Nepal by establishing trial vegetables orchards at
Godavari and Kakani. Horticulture section was established in 1956 under the Department of
Agriculture and a horticulture unit was established at Parawanipur in 1959 where several
vegetables and fruits varieties were introduced into the farm from India. Another milestone was
achieved when Indian Cooperative Mission studied feasibility for horticulture development in
Nepal and submitted its report in 1960. Based on the recommendations in the report, some
were established all over the country with assistance of India aid.
In the fruit development programs, HMG/N has emphasized to grow more tree fruits in the areas
where the climatic conditions favor their growth for optimum production so that farmers get
31
maximum benefit from their produce. Considering such a perspective for improving vegetables
and fruits production in the country, many districts have been identified as suitable area for
specific vegetables and fruits production.
In 1991-92, average per capita food consumption in Nepal was about 1.03 kg/day of which
cereals constituted 50%, non-cereal plant food 15%, fruits and vegetables 21%, and livestock
products 14% [Department of Agricultural Development (DoAD 1992c)]. The diet of the people
is heavily dominated by rice.
Rice is the major crop, occupying about 37% of the total cropped area, followed by wheat with
16% of the cropped area. Other crops grown in the country are maize, millet, barley, potato,
cash crops, and a variety of fruits and vegetables. Total area under vegetables in 1995 was
estimated to be about 144,000 ha, only about 4% of the total cropped area. In the Tarai, the
important vegetables grown are tomato, eggplant, chili, cucurbits, okra, onion, cauliflower,
cabbage, and potato. The most important subtropical and temperate vegetables grown in the
Hills include cauliflower, tomato, potato, radish, cabbage, carrot, peas, cucurbits, beans, and
celery. Temperate vegetables, such as radish, turnip, broad-leaf mustard, etc., which require a
short growing season during the warm season, are produced in the Himalayan region.
Production of vegetable seed is most suited to the trans-Himalayan region, which has arid
conditions and good irrigation facilities.
In 1995, total vegetable production, excluding potato, was estimated to be 1.33 million t, at an
average yield of roughly 9.2 t/ha. With an estimated population of 22 million in 1995, annual per
capita vegetable availability at the farm level is estimated to be about 60 kg.
2.1.6 Present Status of Vegetable Cultivation
Physiographic Regions
As mentioned earlier, Nepal can be divided into three physiographic regions (Hills, Mountains,
and Tarai). The Mountain region of Nepal is divided into High Mountain and high Himal; and
valleys between mid Mountains and Tarai are classified as Siwaliks. Together with the Hills and
Tarai, there are therefore five physiographic regions in the country (Fig. 1). The following is a
brief description of each region.
32
The Tarai region covers an area of about 2.1 million ha; elevation ranges from 60 to 330 m
above mean sea level (amsl) (PACMAR and EC 1991); soils are deep and well-suited to crop
production. This region has a high potential for increasing crop production through irrigation
development, construction of roads, and improvement in the supply of agricultural inputs. The
potential for increased production of winter vegetables is very high.
The Siwalik region covers 1.9 million ha. Although the hills in this region are extremely rugged,
the distance from valley bottom to ridge top is usually less than 700 m. Most of the cultivable
land in this region is in the Dun Valleys, which have some potential for vegetable production.
Extreme variation in altitude provides wide range of climatic conditions, i.e. tropical, sub-tropical,
temperate, alpine, and tundra in this country.
With an area of 4.4million ha, Mid Mountains or Hills region consists of low to moderately high
mountains and deeply incised river valleys. Elevation in this region ranges from 500 to 3000 m.
Most farming is done on terraces built on slopes of less than 30°. In order to overcome land
degradation problems, the government has emphasized horticulture development in this region.
High Mountains region has an area of about 2.9million ha and elevation ranges from 3000 to
5000 m. More than 90% of the total cultivated land in this region is on terraced sloping land. A
wide range of warm temperate and cool temperate vegetable crops can be grown, but lack of
roads is a bottleneck to the marketing of surpluses.
High Himal region covers 3.4 million ha and elevation ranges from 2500 to 8848 m. Total
cultivated area is less than 0.2% of the whole region. Expansion of cultivated area is limited by
lack of arable land and irrigation. Although access to this region is extremely difficult, trekkers in
some areas of this region are generating a small but steadily growing demand for vegetables.
Agro ecological Zones
Based on physiographic, delineation of presently cultivated area, and altitude, for district agro
ecological zones can be identified with different potentials for vegetable production (PACMAR
and EC 1991).
33
Tropical Zone
The tropical zone runs east-west along the southern part of Nepal, with elevation ranging from
60 to 1000 m. The temperature fluctuates between 7" and 24°C in December January and
between 24" and 41°C in June-July, with the mean temperatures around 20-24°C. Annual
rainfall varies from 1300 mm in the east to 600 mm in the west. This climate is found in some
parts of the mid Hills and Siwaliks and all parts of the Tarai. This zone has good road access
and accounts for about 60% of the total cultivated land in the country. Seasonal variation in
temperature and rainfall in this zone permits the cultivation of vegetables in different seasons of
the year. Potato and other temperate crops are grown in the cool dry season, but other crops
grow best in the monsoon season.
Subtropical Zone
The subtropical zone also runs east-west almost along the middle part of the country with
elevation between 1000 and 1500 m. Summer are long, humid, and warm, with temperatures of
13-27°C in June-July and 2-17°C in December-January. Annual rainfall varies between 2800
mm in the east and 1000 mm in the west. This climate is found in some parts of the high Hills
and most parts of the middle Hills and Siwaliks, and covers about 20% of the cultivated land. As
in the tropical zone, most vegetables, including potato, can be grown here. Road access is
limited to some interior valleys of the Mid Mountain Region or Hills.
Warm Temperate Zone
The warm temperate zone is restricted to hill slopes in the mid and high Mountain physiographic
regions and has elevation ranging from 1500 to 2000 m. The zone is neither very cold during
winter nor very hot during summer, but there is occasionally snow in the higher areas. The
average winter daily temperatures fluctuate between 9" and 10°C in December-January and
between 12" and 21°C in June - July.
Annual mean temperatures range from 15° to 17°C, while annual rainfall varies from 900 mm in
the east to 140 mm in the west. This type of climate can be found in many parts of the high Hills
and covers about 12% of the cultivated land. The most commonly grown vegetables in this zone
include cauliflower, cabbage, radish, broad-leaf mustard, and potato. Road access is even more
34
limited in this zone than in the tropical and subtropical zones, which means there are fewer
accessible commercial production pockets.
2.1.7 Area and Production of Vegetables
As stated above, diverse topographic features and climatic conditions in Nepal permit the
successful production of a large number of vegetables. About 250 vegetable crops are grown in
Nepal, of which more than 50 are common (Pun 1987).
In terms of area, production, and value of production, cauliflower is the most important
vegetable in the country, followed by cabbage. Other important vegetables in terms of area
include tomato, eggplant, and chili. Onion is the fourth most important vegetable based on
volume and value of production.
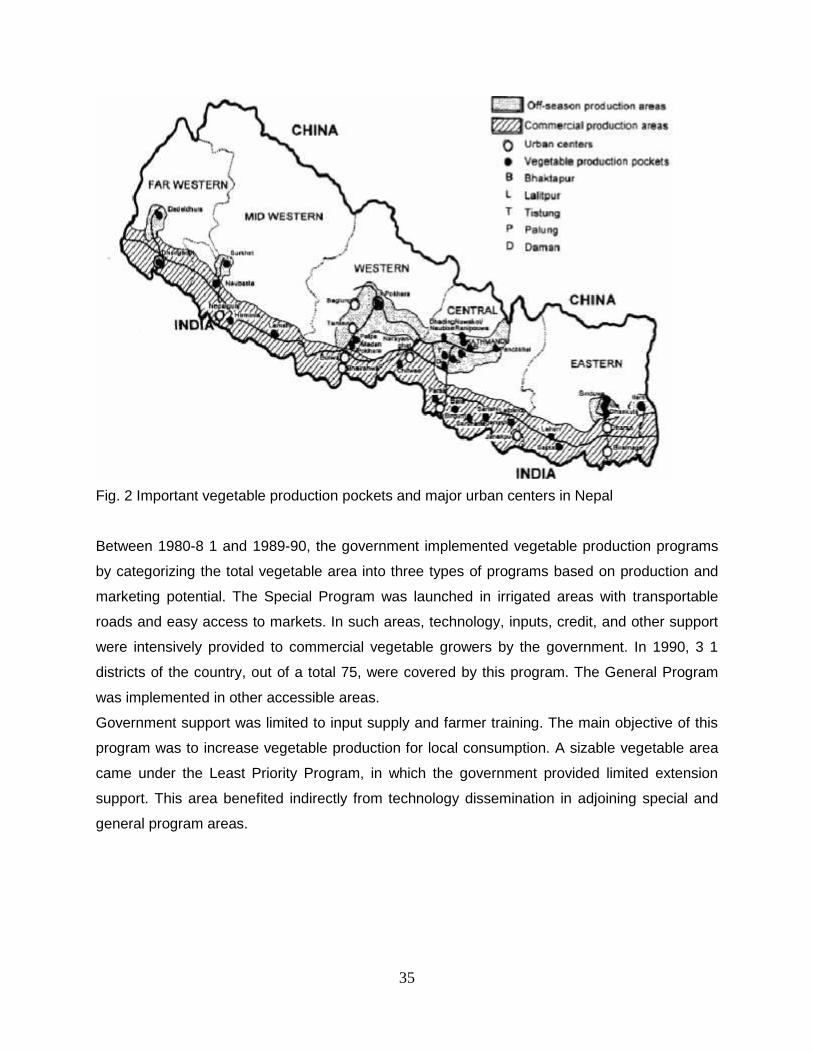
Major vegetable production pockets are shown in Fig. 2. They are mainly along the major
highways and close to urban centers. Major areas of vegetable production and periods of supply
to urban centers are presented in Table 2.
35
Fig. 2 Important vegetable production pockets and major urban centers in Nepal
Between 1980-8 1 and 1989-90, the government implemented vegetable production programs
by categorizing the total vegetable area into three types of programs based on production and
marketing potential. The Special Program was launched in irrigated areas with transportable
roads and easy access to markets. In such areas, technology, inputs, credit, and other support
were intensively provided to commercial vegetable growers by the government. In 1990, 3 1
districts of the country, out of a total 75, were covered by this program. The General Program
was implemented in other accessible areas.
Government support was limited to input supply and farmer training. The main objective of this
program was to increase vegetable production for local consumption. A sizable vegetable area
came under the Least Priority Program, in which the government provided limited extension
support. This area benefited indirectly from technology dissemination in adjoining special and
general program areas.
36
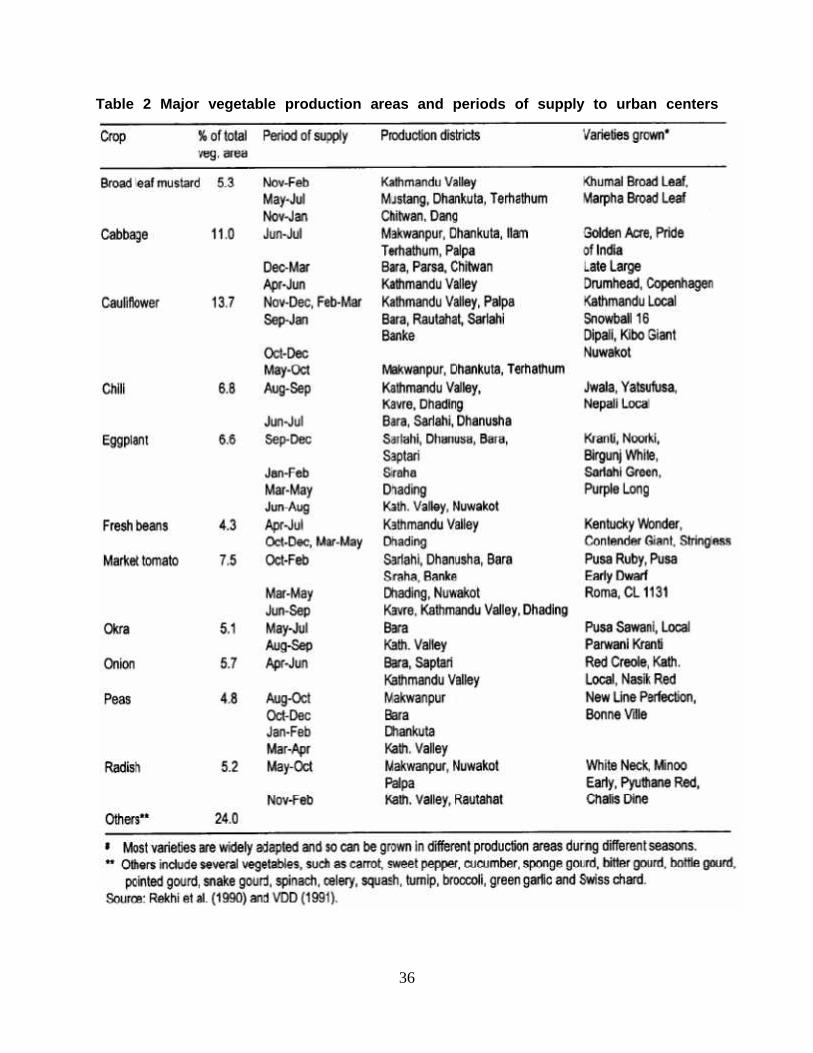
Table 2 Major vegetable production areas and periods of supply to urban centers
37
The total vegetable area in Nepal increased steadily from 82,000 ha in 1974 to about 140,000
ha in1988, but has stayed more or less constant since. Over the 21-year period, vegetable area
and yield both grew at an annual rate of about 3.0%, so total vegetable production in Nepal
increased by 5.9%per year.
However, the improvements did not follow a consistent pattern. In the first decade, vegetable
area expanded rapidly, but yields increased only marginally. During the following decade, there
was little increase in vegetable area, but yields increased significantly, due mainly to the spread
of improved varieties and increase in the use of other complementary inputs in irrigated areas.
The potato area more than doubled from 48,000 ha in 1974 to 106,000 ha in 1995 (3.6% annual
growth), while its production increased more than three times from 285,000 to 898,350 t (6.3%
per annum). The yield increase in the period was also impressive, from about 6 t to 8.5 t (2.7%
per annum) (Table 3). However, most of this increase took place in the last decade.
2.1.8 Vegetable Generic Resources
There are many cultivated and wild types of vegetables crops in Nepal. In fact, Nepal is rich in
bio-diversity of plant resources. About 6500 species of flowering plants exists in this country
(Chalise et al. 1993). In spite of many vegetables species such as Aanona, Phyllanthus, Aegele,
Phoenix, Castanopsis, Morus, Pyrus, Prunus, Myrica, Berberis, Vitis, Rubus, Fragaria, Actinidia,
etc. which are growing wild in forest areas there is a little documentation described about these
vegetables (Kaini, 1995). Notwithstanding, many vegetables species and their varieties of
cultivated types have been introduced to Nepal from other countries during the Rana Regime as
well as in later years when vegetables development activities began from last three and a half
decades.
2.1.9 Members in Distribution Channel of Vegetables in Kathmandu
Distribution is concerned with the physical distribution of goods and services to market and
transfer of ownership from marketer to buyers. Distribution can be done either directly or
through the independent middlemen or agencies, who have significant role in distribution
system. The general principle is that a right product having right price should be distributed to
the right place through appropriate distribution system.
38
The distribution channel refers to the institute who are involved in the process of supplying the
goods from the producers to the consumers. Channels of distribution don’t contain only
producers and customers but also include others like agent, contractors, etc. the channel of
distribution consists of different marketing institution. Some of the marketing institutions in case
of vegetable marketing are as follows:
1. Producers: A producers is case of vegetable marketing means the farmers. They
produce different types of vegetables. They may involve themselves in selling the
vegetables directly to the market or sell them to the retailers, wholesalers or commission
agents, etc.
2. Wholesalers: This institution does not have the role in production of vegetables but has
a great role in the supply of them in the market. They buy them from the farmers or
through the commission agent and sell to the retailers. Most of them in Kathmandu buy
them from out of the valley. They fix the profit margin.
3. Pre-harvest Contractor: Pre-harvest contractors are those people who make
arrangement to buy the vegetable before harvesting it. Wholesalers and the retailers
also act as pre-harvest contractor. Now a days, the pre-harvest contractor are increasing
and the farmers who do not have means of transport of whose farm is really at a far
distance from the market prefer to sell their products to them. In the study area only few
of them are found.
4. Retailer: Retailer is the parts of the trails marketing through which most of the
consumers get the vegetables. They buy vegetables from the farmers, wholesalers,
commission agents or pre-harvest contractors and fix some margin and sell it to the
market. In case of the city like Kathmandu retailers are of two types. They are
shopkeepers and hawkers.
a. Shopkeeper: Shopkeeper is those types of the retailer who have their own fix shop
and sell vegetables there. Here some shopkeepers have got permanent shop but
some of them sell on the side of the road. Most of them have their own price, which
39
is generally, fixed for a day but they may change the price seeing their neighbor
shopkeepers.
b. Hawkers: They are the sellers of vegetables who sell it from place to place. In the
beginning most of the hawkers were from Terai region but nowadays the people of
the valley and other places are also working as hawkers. They do not have fixed
price. They change the price from place and fixed the price according to their
convenience.
2.1.10 Existing Distribution Channel of VegetablesMarketing system has got great role for the consumption of the vegetables produced by the
farmers. If there are good marketing systems all the farmers and the consumers along with the
other parts of the markets are benefited. The marketing system of Kathmandu is not well
organized and it needs improvement. The main ways of vegetables distribution in Kathmandu
are as follows:
1. Producer-Wholesaler-Retailer - Consumer
2. Producer - Consumer
3. Producer-Retailer - Consumer
4. Producer-Wholesaler-Hawkers - Consumer
1. Producer-Wholesaler-Retailer - Consumer
In this type of marketing system the time taken by the vegetables to reach the consumers
is long and the profit margin shared is also less as it is shared in between the distribution
channel. The producers produce vegetables and sell it to the wholesalers take some profit
and sell it to the retailers. Retailers take some profit and sell them to consumers. Generally
fruit vegetable such as banana and orange are sold in this way.
2. Producer - Consumer
In this type of marketing system the producer (farmers) himself or herself are involved in
selling the vegetables in the market. Generally the producers of the leafy vegetables sell
their products directly to the market. In this case the selling is as mentioned below:
I. The producers themselves send sales force to the market and sell it to the
consumers.
40
II. Vegetables producers sell them on the road side market or stated wholesale or retail
market directly to consumers/customers.
III. They may sell it as a vendor.
IV. The consumers also go to the producers to buy the vegetables.
3. Producer-Retailer - Consumer
In this system the producers sell their products to the retailer and the retailers sell these to
the consumers taking some profit. The producers of banana, orange, etc are involved in
this system.
4. Producer-Wholesaler-Hawkers - Consumer
In this system the farmers sell their products to the wholesaler. Wholesalers take some
profit and sell to Hawker. Hawker takes some profit and sells to consumer. In this system
the time taken by the vegetables to reach the consumer is long and consumer pay high
price for vegetables as hawkers provide door to door service to consumers in Kathmandu.
Different types of vegetables are sold in this way like potato, onion, tomatoes, apples etc.
2.1.11 Facilities Available for Vegetable Marketing
Kathmandu does not have good production of vegetables and due to lack of knowledge and
many more other available circumstances people do not have knowledge about the vegetables
marketing. As a result, the managed vegetables market has yet been well established and
developed properly. Farmers are bound to sell their products in lower prices whereas the
middlemen make more profit. On the other hand the customers are more also not getting the
good vegetable though they pay good sum of money for that purpose. There are many reasons
responsible for that. Some of them are lack of proper storage, lack of good seeds, lack of right
information, lack of capital, lack of cultivation, caring, harvesting, storing, grading technology
and technique, etc (Shrestha, G.K, 1999)
The farmers and the customers have got only little facilities. The main facilities available for the
farmers are storage facilities and seed selling shop.
41
Storage FacilityGood and quality seeds can only yield good promotion but the availability of good seed is the
great anxiety for the farmers. In Kathmandu there are two cold stores established for the
storage facility where the farmers can store the fruit vegetables mainly banana and orange. The
two cold stores are: Dugad Cold Store and Budathoki Cold Store. Now Himshekhar Cold Store
is on construction process.
a. Dugad Cold StoreThe oldest cold store in Kathmandu is Dugad Cold Store. This cold store lies at Balaju
Industries are. This cold store has a storage capacity of 1200 Metric tons. Here different
types of food, vegetables and fruit are stored.
b. Budhathoki Cold StoreThis cold store lies in the Sitapaila VDC. This cold store has a storage capacity of 3,000
Metric tons. Here different types of food and fruit and vegetable are stored.
2.1.12 Government, Support for Vegetables Promotion
There are different local and government agencies, which are involved in the promotion of the
vegetables production and marketing, but their effort has been given the good and significant
result yet. District Agriculture Office has contributed to increase the production of vegetables.
Nepal Agriculture Research Council (NARC) is also conducting research in different vegetables
like citrus and other fruit vegetables.
2.1.13 Promotion of the Vegetables Marketing
The improvement in marketing is beneficial to the producer and the consumers both, the
vegetables in Kathmandu are not well managed so not only the consumers but also producers
are affected. Due to the lack of proper market some of the farmers even take their products to
neighboring districts Lalitpur and Bhaktapur early in the morning. Following arrangement is
regarded necessary for the promotions are regarded necessary for the promotion of the
vegetables marketing.
1. Proper Management of Marketing
42
For easy accessibility to consumers, most of the vegetables markets are kept in the open
place or on the side of roads. Hence, when it rains or due to any adverse climate condition,
both the seller and consumer are affected. Proper Market Information System facilities of
shed and protection of vegetables is lacking in marketing. Retailers just think of making
quick money whatever the quality of the goods they sell and their effects on the consumers.
The consumers themselves are not aware of the adverse effects.
2. Proper Market Information System
For the benefits of the producers, retailers and consumers marketing information system
may be implemented so that they will get all information including price. If the producers,
retailers and consumers have proper marketing information they should know about demand
and supply of market it helps to them for making further strategy.
Agro Enterprise Center (AEC) has setup a website www.agripricenepal.com. It is a joint
effort of Agriculture Promotion Programme, FNCCI, Village-Town Cooperative Development
Programme and the development programs of UN under joint coordination with the Market
Development Division. This is the developed form of the market information service started
by AEC-FNCCI in the year 2055. The objective of the web site is to provide as many
information as possible about market information of agriculture to the general public. As per
AEC, market information is collected from following centers:
a. Birtamode Bazaar- Agriculture Produce Market Collection Board, Birtamode.
b. Dharan Bazaar- Agriculture Produce Market Collection Board, Dharan.
c. Kathmandu Bazaar- Kalimati Fruits and Vegetable Market Development Board, Kalimati.
d. Narayangadh Bazaar- Chamber of Commerce, Narayangadh.
e. Butwal Bazaar- Butwal Chamber of Commerce.
f. Pokhara Bazaar- Pokhara Chamber of Commerce.
g. Nepalgunj Bazaar- Nepalgunj Chamber of Commerce.
h. Surkhet Bazaar- Surkhet Chamber of Commerce.
i. Mahendranagar Bazaar- Kanchanpur Chamber of Commerce.
j. Palpa Bazaar- Palpa Chamber of Commerce.
43
k. Hetauda Bazaar- Hetauda Munucipalty, Village Town Cooperative Development
Program.
Following information is available in the website:
i. Daily transaction detail- free of cost
ii. Daily news- free of cost
iii. List traders- free of cost
iv. Weekly and monthly details-chargeable
v. Monthly and annual details- chargeable
vi. Tread of market prices- chargeable
(Last three information can be available after paying an annual service charge of NPR
3,000.00)
3. Proper Transportation
The farmers also face problem due to the lack of proper system. Vegetables are perishable
items and will eventually rot if not delivered on time. Proper facilities of buses or other
vehicles can be arranged. In Kathmandu most of the places have transportation facility and
some places have to improve.
2.1.14 Marketing System of Vegetables
In agriculture- based development countries like Nepal, agriculture product marketing services
play a private role in fostering and sustaining agriculture and rural development. This ideal
marketing system is one that maximized the long run welfare of the society and that should
operate with maximum physical and locative efficiency.
Marketing is the most important function for assembling, processing and distribution of
marketing surplus. An efficient marketing system is essential for timely delivery and reduced
market costs. The efficiency of market is influenced by a number of external factors, such as
policy, regulatory frameworks and infrastructure. A well developed and efficient marketing
system fosters and provides leverage in the overall growth and development of an economy by
facilitating optimal product mix and planning, and its efficient distribution (Gurung, 1996).
44
Long marketing channels are one of the reasons for increasing marketing costs and inefficiency
in marketing. This results in loss of consumers’ welfare and producers share. Presence of
intermediaries makes the marketing system inefficient in the channels as compared to the
shorter ones.
2.2 Review of Related Studies
The attention of GON to the development of fruits cultivation was given from 1959/60 AD (2016
B.S) when the Indian Aid Mission submitted a preliminary report for horticulture development in
Nepal. Following the recommended of the report, 14 horticultural farms were established
throughout the country. The main objectives of these farms were to demonstrate the use of
scientific practices of cultivation to produce vegetables.
Research on vegetables is conducted with a view of providing information on vegetable that
have suitability and scope of cultivation in a particular area. Research and development work in
horticulture is being carried out by Nepal Agriculture Research Council (NARC) and Ministry of
Agriculture and Cooperative (MOA) through Department of Agriculture (DOA). NARC is solely
responsible for conducting the need based research which is directly related to farmer’s problem
and creation of new intervention by which poverty could be reduced by the production of hybrid
crops, seeds, animal products and others. NARC has following organization setup for
horticulture research and technology generation. At present Horticulture Research division is the
apex body under NARC system to formulate policy and strategies in horticulture research.
There are three commodities program- citrus and ginger in vegetable sector. Similarly, there are
3 horticulture researches stations located at Jumla, Dailekh, and Pokhara. Likewise ARS
(Agriculture Research Station) Jarahara, RARS Parwanipur, RARS Lumle, ARS Nepalgunj,
Surkhet and Doti has horticulture unit each. At yearly workshops with different stakeholders are
held and announcements and sharing of outcomes of horticulture research are done.
The thesis on the “A Study on Marketing of Vegetables in Kathmandu” is prepared with the time
bound of nine months. The research based on a study on the marketing of vegetables in
Kathmandu is very rare. As, it encompasses in the basic problem like supply, lack of storage
structures, lack of habit to buy vegetables, lack of knowledge to consume it from health point of
view.
45
Similarly, the marketing prospective is widening day to day. As the health consciousness is
increasing nowadays, marketing not only covers the whole chapter so the questionnaire for
shopkeeper as well as consumer is distributed. As compared to other survey it is more scientific,
analytical and valid. It has no false and imaginary data. The study is purely fielded oriented and
reliable of proof. Thus, it is really helpful for the problem solving in the sector of marketing.
While studying the vegetables marketing, it is felt necessary to review the research studies
conducted in this filed therefore, in this chapter an attempt is made to review the research works
on marketing of vegetables.
a. The overall situation of vegetable marketing in Kathmandu valley is still under developed
and inefficient. Moreover there is in adequate information relating to area, production,
prices marketing facilities movement of vegetables within the country. The study is also
in limited scale for the adequate supply of vegetables there will be the proper
technology, pricing supply and research will be needed (Bhattarai, 1985).
b. A study on ‘Marketing Management of Floriculture Producer’ published in 1991 by
Keshav Sharma reveals the use of eight main marketing channels in the marketing of
apples in J and K. these are:
(i) Producer- Consumer.
(ii) Producer- forwarding agent- commission agent- wholesaler- consumer.
(iii) Producer- producer’s co-operative marketing society/NAFED- retailer- consumer.
(iv) Producer- pre- harvest contractor- commission agent/wholesaler- retailer- consumer
(v) Producer- commission agent- wholesaler (self as forwarding agent)- retailer-
consumer.
(vi) Producer- JKHPMC Ltd. - wholesaler- retailer- consumer.
(vii)Producer- retailer- consumer
(viii)Producer- Processing unit- consumer.
The study also makes a number of recommendations to improve physical distribution,
product management, pricing, regarding marketing organizations, improving economics of
fresh vegetables in J and K, and improving marketing effectiveness for the development of
vegetables production (Sharma, 1991).
46
c. A thesis on ‘A study of floriculture enterprises in Kathmandu Valley’ is published in 1998
the main finding of this study is less production of florid product. Similarly, there is more
demand increasing day to day similarly, there is lack of study, research and proper
systematic marketing of florid product.
d. The common difficulties facing marginal farmers are the low value of their assets,
exposure to natural hazards (particularly in highlands), few opportunities to diversity in
agriculture and other businesses (or profit from existing diversification), and poor clout in
the mainstream politics (Tiwari, 1993).
e. “A study on Production and Marketing Practices in Kathmandu Valley” is the survey
study conducted by the Food and Agriculture Marketing Service Department in 1972.
The survey was conducted with the objective of analyzing the problems related to
vegetable production, marketing and institutional reforms. To know the existing cost of
production of different types of vegetables in the Valley was another objective of the
survey.
f. The second survey report on “Vegetable and Fruit Market Survey in Kathmandu Area”
was published in 1978. The study shows the monthly mean prices, availability and the
places of origin of different types of vegetable in Kathmandu Valley. The report indicates
that the quality and quantity of vegetables and fruits available in the market has
improved considerably for the last few years. Popular vegetables such as tomato, carrot,
brinjal, cabbage, etc. are available regularly throughout the year. However, there were
no remarkable price changes during the surveyed period.
g. The third survey “Vegetable Marketing in Kathmandu Valley” report was published in
January 1981. The price levels of three markets, namely, Mangal Bazaar of Patan
District and Asan and Purano Baneshwor (Both in Kathmandu District) were compared
on the basis of monthly average prices per product per market. The report reveals that
Mangal Bazaar is the dearest market for vegetables.
h. Another survey on “Vegetable Market Survey at Kathmandu and Pokhara” was
conducted by Mr. Junji Takahashi in 1982. The objective of the survey was to study the
prices of vegetables in Pokhara and two markets of Kathmandu. The report reveals that
47
there are no significant differences between the prices of almost all vegetables are
higher in Pokhara. However, the number of vegetable crops and quantity of vegetables
found in Pokhara market are far less than in Kathmandu. More than 50 kinds of
vegetables are found in Ranamukteshwor throughout the year while it is less than 50 in
Asan.
i. “A study on vegetable Production and Marketing (with special reference to the winter
vegetable production in Kathmandu Valley)” is dissertation paper prepared by Mr. Y. R.
Joshi in 1977. The objective of the study was to analyze the existing problems relating to
vegetable production and marketing. Accounting to him, area under vegetable cultivation
in the valley is decreasing. As a result, there has been significant rise in the prices of
vegetables. Cost-benefit analysis reveals that cauliflower requires highest cost i.e. Rs
5,270 per hectare followed by onion, radish, spinach, garlic and carrot. While highest
revenue comes from onion amounting Rs. 8,042 per hectare. It also provides the highest
profit of Rs. 3,858 per hectare.
j. The study of vegetable marketing in Bhaktapur District is conducted in 2006 by Mohan
Krishna Shrestha it conducts to find out real condition of vegetable market as the
demand of vegetable is higher than production but there is lack storage structure as well
as not proper organization support by municipality and the main problem in towards
farmers by untimely price fluctuation.
k. The report on vegetable was published by Agriculture Projects Service Center in 1978.
The report reveals that vegetable farming on a commercial scale, which is only a recent
development, is confined largely to the Terai region. In general, kitchen garden accounts
for most of the vegetable output in Nepal. The report reveals that reliable data regarding
vegetable production, consumption and imports are not available.
l. Seminar on fruit development in Nepal (2051) pointed out the crop improvements. In fruit
crops, varieties improvements and cultivar generation is either lacking or they are not
being considered important at present. The fruit crops improvement program should be
developed so that fruit varieties can be generated to suit local environment conditions.
Several basic and applied research awaited on these crops in Nepal includes:
Germplasm collection from within and outside the country for quantity characteristics,
pest and diseases resistance.

48
Genotype conservation and maintenance programs.
Studies on floral biology and pollination behavior.
Appropriate methods and technique on fruit improvements, such as selection,
hybridization, and mutation.
Varietal development through gene pooling, biotechnology and tissue culture
techniques.
m. “Dynamics of Vegetable” is another strong research report submitted by Thapa Ganesh
B. (2007), which focuses on the dynamics of vegetables. It covers the major vegetable
species and production areas in Nepal. It describes about the different “Vegetable
development programmes and its constraints”.
According to them cropping patterns, Adoption of Vegetable Material, Soil Preparation,
Planting and Nursery Management, Irrigation, Weeding and Other Cultural Practices,
Harvesting, Soil Fertility Management, Plant Protection, Moisture Conservation and
Management, Labor, Fertilizer, Pesticide are important factors in development of
different vegetables in different tropical zones. In conclusion they added Lack of Credit,
Poor Irrigation Facilities, Shortage of Good Quality Seeds, Support for the Cold Storage
Industry, Trade Restrictions, Pesticide Regulations, Exchange Rate Policy, Inadequate
Marketing Support System and Inadequate Marketing Support System are major
constraints in vegetable production and marketing in Nepal including Kathmandu valley.
n. “Consumers’ willingness and preference towards organic vegetables”, Krishna Bahadur
KC in 2009 is another strong research in organic vegetables. The research is done to
investigate the following questions.
What factors make consumption appealing to consumers?
What is the extent of value of such priority in reference to other? And what is the
preferential differentiation with respect to socio-demographic profile of the consumers?
The conclusion of the research is as follows:
• Most of the consumers with better income, higher education and small family size
are willing to pay more for organic vegetables; however, there is the need for
certification and labeling to give credence to the organic products.
49
• Grouping of consumers into homogeneous groups show that there is the need for
development of niche organic market focusing particular segment of the consumers
in the market.
• This is the first attempt in market penetration using CA. Further studies are needed
with more sample size and some quantitative price information focusing different
products.
o. Trade Competitiveness of Off-season Vegetables and Ginger In Selected Districts in
Western Development Region of Nepal is conducted by Agri-Business and Trade
Promotion Multipurpose Cooperative Limited
(ABTRACO) in 2005 is another strong research in vegetables.
Normally, the vegetables are produced according to the season. But the research
describes, all kinds of vegetables can be successfully produced during rainy/summer
conditions utilizing the mild and cool environments prevailing in the mid hills and
mountains of these districts. In Bhairavsthan area of Palpa, unlike the old system the
new system of grading ginger as whole ginger and piece-ginger was developed by
majority of farmers to cater the demand of India's markets.
In conclusion, Off-season vegetables such as tomato, cucumber, cauliflower and
cabbage produced in selected districts of Western Development Region have potentials
for production and meeting the demand of Tarai areas of Nepal and northern border
markets of India from summer to the early winter months. Ginger, likewise, has especial
quality to satisfy the consumers of some parts of northern India and Nepal. Ginger has
high prospects of production in hill areas to meet the potential demand of both domestic
and export markets. To fully exploit the opportunities and potentials, the farmers and
even the extension agents are yet to be well aware about the appropriate production
technologies and the marketing prospects. The critical issues that are hindering the
production, marketing and trade of these commodities need to be addressed and
constraints removed/ reduced to make these products competitive.
The research recommended as follows:
Off-season Vegetables
50
To improve competitiveness of off-season vegetables, following suggestions are
recommended:
• prepare a detail situational information about vegetable pockets,
• explore demand of domestic and potential export markets,
• standardize production techniques and quality of the product,
• introduce technological norms for producing standard product,
• introduce plastic crates for packaging,
• develop marketing information system at pocket sites/ level,
• operate transport vans through cooperatives and market committees wherever
felt necessary,
• strengthen cooperative capacity in marketing vegetables at domestic and export
markets,
• introduce tomato processing technology to the potential entrepreneurs,
• accord high priority in constructing rural agricultural/rural roads by DDC, DOA,
and Department of Rural Infrastructure and Rural Roads,
• familiarize farmers in commercial production pockets about export potentials,
• organize vegetable collection centers by involving farmers groups, local
government, DOA and private sector with public private partnership approach,
• introduce three grades in tomatoes into small, medium and big sizes,
• introduce Marketing and Contract Act,
• educate farmers and traders about the quality and procedural requirements in
SAFTA and WTO,
• remove local taxes on vegetables
• avoid harassments during transport and export for all the primary products in
general and more importantly for quickly perishable nature commodities in
specific.
GingerTo improve competitiveness of ginger following suggestions are recommended:
• organize collection centers by involving farmers groups, local government, DOA
and private sector along the line of public private partnership approach,
• conduct business meetings of potential entrepreneurs, investors, farmers and
technicians to explore various aspects of production and trade related matters,
• review pricing structures and management practices of cooperative society,
51
• develop marketing information system at production pocket level by involving
cooperative societies, market committees, local government units and CCI,
• arrange special transport vans/trucks services for agro-products by involving
cooperative societies and market committees,
• develop cooperative societies for marketing ginger,
• conduct demand assessment in northern markets of India
• disseminate market/price information to farmers and agro-entrepreneurs,
• sensitize farmers and agro-traders about the improvements required in raw
ginger and dry ginger in the context of SAFTA and WTO requirements,
• remove local taxes,
• remove the harassments during transport and in the check points and custom
points.
p. “Impact of RCIW Programme in Rural Food Security: A Case Study Dailekh District,
Nepal" is conducted by Bhandari T. (2006) where RCIW stands for Rural Community
Infrastructure Works Programme. RCIW Programme is priority based pro-poor focused
food security programme. Food security impact of this programme in beneficiaries' level
was not assessed before this study.
This study focused to fulfill the objectives; to assess the change in vegetable availability
by the support of project activities, to assess the people's participation in different
activities of the programme, to find out the major changes in vegetable and market
access realized by the people, to assess intra-household vegetable distribution, to
determine the major changes of RCIW programme and to examine the sustainability of
programme.
Major recommendations to achieve food and nutrition security significantly were:
increasing women's participation, intensive support at short duration on-farm and off-
farm enterprises focusing one village one product, implementation of production
supportive, food utilization, and marketing activities, increase rice and cash support for
at least one hundred days of minimum guaranteed employment days, and prolong at
least two additional phases to complete all the dimensions of food security.
52
2.2.1 Review of Journals
Haque, M.A.et.al., 1996; 195-204, reported that sharp fluctuation in prices and spared between
farmer’s price and consumer’s price for perishable agricultural commodities are frequently
observed in Bangladesh market. They also reported that market imperfections and inefficient
marketing system might be the prime factor responsible for this fluctuation and higher price
speed.
Shrivastava, G.C., 1992:229-233, has high-lightened that the producer’s share was inversely
related to the consumer’s process. He also pointed out that the shares of the producers and
retailers were directly affected by the consumer’s prices.
Verma, A.R. 1989 noted that an efficient marketing would guarantee a greater share to the
producers in the price paid by the consumers on one hand and greater satisfaction to the
consumer on the other.
Kulkarni, K.R., 1989 and Hussain et al. 1996 indicated that long marketing channels are one of
the reasons for increased marketing costs and inefficiency in marketing.
Kahlon A.S. and George M.V. 1985 mentioned that marketing cost and margins would vary
depending upon the nature of the commodity, services rendered that type of market channels,
the structure of the market and the level of its infrastructure development. They observed that
the farmer’s share of the consumer’s price was the highest (76.78 percent) for wheat and the
lowest for fruits (33.98 percent).
A rise in marketing cost is not sufficient reason to conclude that the marketing system is
inefficient. Efficiency can be determined only if consumer satisfaction is measured and
considered (Snodgrass M.M. and Wallace L.T., 1977). From farmer’s point of view, a marketing
system that can entice consumers to buy more is a good one. To make goods continuously
available to consumers at prices that allow the consumer to raise his standard of living and
increasing his satisfaction is good.
The recommendations of Shrestha G.K., (1999) can be summarized as follows:

53
Vegetables are very important in human nutrition as well as for improving the rural
economy.
Vegetable tree plantation help in the preservation of the ecology of fragile hills and
mountains provided the trees are planted scientifically. Lately, more and more emphasis
on improving vegetable tree culture and care has emerged in government and private
sectors to narrow the gap between demand and supply.
Different agricultural agency/institutions or organizations have specific plans, programs
and targets to support necessary technology for horticulture and development in the
nation. Achievements on vegetable development programs however are unsatisfactory.
Problems associated with the under achievement are lack of dedication in farmers,
technicians, researchers, extension agencies, etc., ineffective planning, as well as
uncoordinated policy and program implementation among different institutions/agencies.
NARC research stations, government horticulture centers/farms have developmental
and research objectives but their responsibilities are not well defined.
Vegetable trees by their nature require long term investments. Sufficient resources,
skilled manpower, financial commitments, adequate yet appropriate land availability,
and infrastructure facilities are either lacking of if available they are not being properly
used a present.
A rewarding work in vegetable growing business and its development is only possible if
proper strategic planning could be developed and exercised immediately so as to meet
vegetable requirements in years to come.
Among major constraints to vegetable development are production constraints, socio-
economic constraints, infrastructure constraints, institutional constraints, policy
constraints, and human resources constraints.
Research reorganization of NARC is needed to prepare vegetable research strategies to
develop production technologies and packages for commercial vegetable species.
NARC should have research attitudes for even directing its research funds to other
institutions or private research centers or individuals to promote vegetable research.
Production inputs should be made available in the production areas at times when they
are needed. Post- harvest handling, proper packaging, and timely marketing, etc. are
problems of vegetables after they are harvesting and these will remain as barrier if
adequate infrastructure facilities are not built.
54
A case study of vegetables done by Thapa, Sarf and Gaire in 2005 has compiled data from
MDD, JICA, ASD and MPHD to find out the status of demand for and supply of apples and
mandarin oranges in Nepal. As per their observation, the demand for both fruit in Nepal is
estimated to be just less than 4,000 tons per month or about 47,000 tons per annum. Total
annual demand for apple is about 1.8 times the domestic supply, or an aggregate annual deficit
of about 20,000 tons. By contrast, Nepal is surplus in orange production, with net surplus of
about 18,000 tons, about 1.4 times the annual domestic demand. The study further indicates
that productivity in Nepal is 50% lower than in India. Hence there is immense potential of
increasing productivity in the country. Even with low productivity, when all current planted areas
come to production, total production is projected to almost double in a decade’s time.
Vegetables demand responds strongly to income (MDD, 2000).
Vegetables are both imported from and exported to India, in different seasons. This could also
signify Nepal’s comparative advantage. Irrespective of this pattern, there is a need for and
considerable scope for important substitution and export promotion.
Table 2.3 shows huge deficits in the vegetable trade with India. Exports of all vegetable
averaged Rs 3 million during 1997-1998 while Nepal imported vegetables worth Rs 163.50
million in the same period, for a deficit of Rs 160.50 million. There are no good statistic and
studies that explain that trends in this trade. It seems that the sharp rise in imports after 1992/93
is associated with the liberal import regime with India following the bilateral trade treaty of
1991/92. The slowdown in imports and the corresponding improvements in trade balance can
only be obtained after increasing domestic production from newly development orchards. All in
all, the prospects for import substitution and export growth are good.
Table 2.3 Total vegetable trade with India (in million Rs)
1997/98 1998/99 1999/00 2000/01 2001/02 2002/03 2003/04
Export 3.0 3.2 14.2 4.6 6.1 2.4 0.7
Import 163.5 135.7 179.2 175.0 216.2 284.5 241.5
Trade
Balance
-160.5 -132.5 -165 -170.4 -210.1 -282.1 -240.8
(Source: MDD. 2005)
55
Many of the problems facing the vegetable sector in Nepal are internal in nature, which follows
from the fact the vegetable are not much traded products. Some of them are listed below:
Low productivity (about 50% if that in India)
Lack of competitiveness in both import and export markets for a variety of reasons.
Small, scattered production structure means that the government needs to take
initiatives and encourage appropriate institutional innovation (e.g. contract farming,
group approaches).
The commodities are characterized by seasonal problems and issues, thus requiring
solutions through storage, processing and trade.
Research efforts appear to be weak, both in productivity, variety and quality.
External trade with India suffers from some significant non-tariff barriers.
They further add that Octroi charges in Nepal disrupt transportation. Traditional complain all the
time about octroi charges, which can be as high as Rs 4,00 per truck when bananas, pineapples
and so forth are transported from the Terai to Kathmandu. Even vegetables transported on the
roof long distance public buses are charged octroi fees in the range of Rs 1,000-2,000.
These charges not only involve payments, but also other costs, both “unbilled” and transaction
costs of doing business. It is indeed an irony that the octroi system and misuses in the levy of
charges by local bodies’ countries to day despite the consensus that this is not good for trade.
Traders say they do not mind paying the charges, but resent very much the harassment.
2.2.2 Organizations Promoting the Vegetable Development in Nepal
There are numerous organizations established in Nepal to help in development of
vegetable from producing the seeds to arrange the market. They conduct different
profitable projects in rural as well as urban areas of Nepal. With the help of these
projects, these organizations directly or indirectly help the farmers to consumers for
betterment in their life. Some of them with their projects are listed as below:
1. Government of Nepal, Ministry of Agriculture and Co-operatives, Department of
Agriculture
Commercial Agriculture Development Project
56
The overall objective of the Commercial Agriculture Development Project
is to reduce poverty amongst poor rural people through gender and socially inclusive
development by equitable and sustainable commercialization in agriculture especially in
vegetable agriculture and promote the marketing. It functions on the principles of market
demand led approach, gender main streaming, public/private partnership arrangement,
flexible project management, local body capacity enhancement and environment
preparation.
Many stakeholder including farmers were highly profitable by this project in the
enhancement of capacity and more generation of income through vegetable cultivation
and marketing.
2. Agro Enterprise Centre/FNCCI
Several researches are conducted by Agro Enterprise Centre/FNCCI in different
subjects of vegetable. They includes from vegetable seeds, off-season vegetables,
organic vegetables etc. Some examples of the researches for Agro Enterprise
Centre/FNCCI are as follows:
Trade Competitiveness of Off-season Vegetables and Ginger In Selected Districts in
Western Development Region of Nepal
Vegetable Seeds Development Project
Price of Vegetables in Nepali Market
Administrative and Policy Constraints Faced by Small Farmers Producing
Vegetables Seeds in Dang and Vegetables in Banke Districts
3. Helvetas Nepal
Helvetas came to Nepal in 1956. The design of the current Country Programme follows
the general principles of Helvetas as an international organization. These principles are
shortly described in the Helvetas Cube.
Helvetas has four Working Areas of expertise. In Nepal, Helvetas is working in all four of
these with the major efforts as follows:
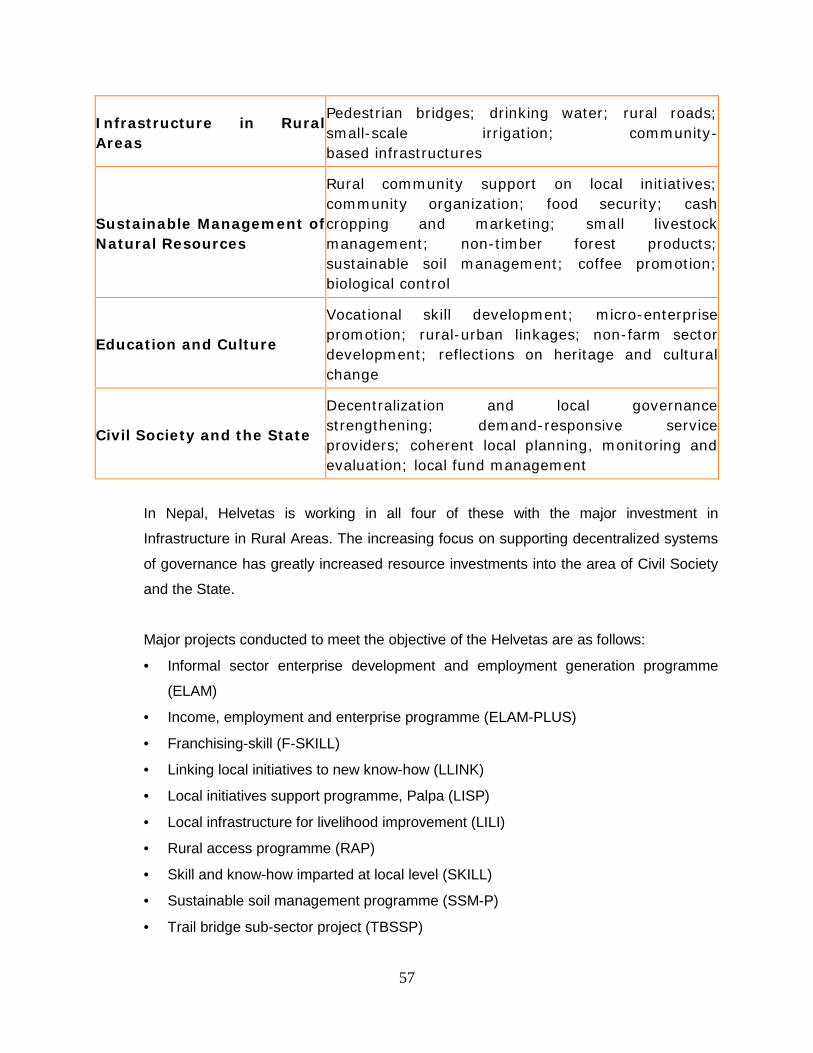
57
Infrastructure in RuralAreas
Pedestrian bridges; drinking water; rural roads;small-scale irrigation; community-based infrastructures
Sustainable Management ofNatural Resources
Rural community support on local initiatives;community organization; food security; cashcropping and marketing; small livestockmanagement; non-timber forest products;sustainable soil management; coffee promotion;biological control
Education and Culture
Vocational skill development; micro-enterprisepromotion; rural-urban linkages; non-farm sectordevelopment; reflections on heritage and culturalchange
Civil Society and the State
Decentralization and local governancestrengthening; demand-responsive serviceproviders; coherent local planning, monitoring andevaluation; local fund management
In Nepal, Helvetas is working in all four of these with the major investment in
Infrastructure in Rural Areas. The increasing focus on supporting decentralized systems
of governance has greatly increased resource investments into the area of Civil Society
and the State.
Major projects conducted to meet the objective of the Helvetas are as follows:
Informal sector enterprise development and employment generation programme
(ELAM)
Income, employment and enterprise programme (ELAM-PLUS)
Franchising-skill (F-SKILL)
Linking local initiatives to new know-how (LLINK)
Local initiatives support programme, Palpa (LISP)
Local infrastructure for livelihood improvement (LILI)
Rural access programme (RAP)
Skill and know-how imparted at local level (SKILL)
Sustainable soil management programme (SSM-P)
Trail bridge sub-sector project (TBSSP)
58
Water resources management programme (WRMP)
4. United States Agency for International Development /USAID
Nepalese Farmers Expand Marketing Reach
USAID taught Nepalese farmers how to make better use of labor, seeds, marketing, and
production technology in order to stimulate the production and trade of high-value
commodities such as vegetables, fruits, seeds, and honey. This $3.6 million project
focused on four areas: promoting market growth, improving technology and agricultural
extension services, building capacity for agricultural planning and policy reform, and
enhancing the nutritional value of rural diets to combat a high incidence of night
blindness among pregnant women.
The program also helped farmers establish rural markets and forge agreements with
traders for seed production and marketing. The farmers were taught how to expand and
reinforce market linkages to help ensure sustainability. As production increased, families
learned how to incorporate nutrient-rich foods into their diets, especially foods rich in
vitamin A, and to observe better sanitation and hygiene practices.
New technologies and hands-on training improved the output and marketing capabilities
of farmers as well as their post-harvest handling and processing skills. Nearly 40,000
farm families produced high-value agricultural products in the targeted zones. Several
new local marketing centers were established to sell high value agricultural products in
conflict-prone Western and Mid-Western Nepal.
In the areas where the project worked, the incomes of farmers increased 10 to 20 fold.
The total sale of vegetable crops increased from $0.63 million in 1998 to $2.99 million in
2002. In addition, during this period, the level of nutrition knowledge increased from 23%
to 80.6%, and the incidence of night blindness decreased from 14.7% to 5.1%.
5. SDC Swiss Agency for Development and Cooperation – South Asia Division
Vegetable seed to improve livelihood in rural Nepal
59
Vegetable seed production, as a low volume - high value commodity, offers a promising
strategy to reduce poverty and the increasing food insecurity in remote areas of Nepal.
Switzerland helps to promote the vegetable seed production in Nepal. In 2008, private
cooperatives with Swiss support provided more than 20% of the domestic seed supply.
Vegetable seed enterprises have contributed to increasing production by 20-30%, and
generate 2-3 times more income than traditional cereal crops from the same piece of
land.
Switzerland already recognized the importance of producing high quality vegetable seed
during the 1980s. Together with the Government of Nepal, the concept of private-public
partnership in the seed sector was introduced. Since then over 160 seed producing
cooperatives have been established. As a result, while in 1975, 9 mt (metric tone =
1,000 kilograms) vegetable seed were produced exclusively by state-owned farms, in
2008 over 900 mt were produced by farmers and private firms, representing more than
50% of the domestic requirement. The annual value of sale of domestic seed has risen
to 131.5 Million Nepalese Rupees (Nrs.; approx. CHF 2.2 million.).
Since 2004, Switzerland has been supporting the promotion of vegetable seed
production through a specialized Nepalese Non-Governmental Organization1. In 2007,
CEAPRED contributed nearly 22% to domestic vegetable seed production. Since the
beginning of Swiss support, more than 6200 farm families have become engaged in
seed production. Seed of 52 varieties of 27 vegetable crops is being produced, among
them pea, broad bean, radish, cress cucurbits and common beans. In average, each
participating household annually earns an additional 6445 Nrs. (CHF 110). This might
not seem to be very significant with a Swiss salary level in mind, but in a country with an
average national per-capita income equivalent to CHF 400, this income increase for poor
farmers might make the difference between food security and famine, between children
going to school or staying at home, between developing villages or migration.
Switzerland also contributed to improving the policy framework for private vegetable
seed production. In 2007, the mandate for source seed production, until then limited to
public farms, was opened to private firms. Likewise, private firms and NGOs are now
accredited for both field and quality inspection.
60
2.2.3 Case Studies of Vegetable Development in Nepal, Thailand, Vietnam and Bhutan
With a view to study the how our neighboring countries have been handling vegetable
production, several literatures were reviewed for cased in Nepal, Thailand, Vietnam and Bhutan.
2.2.2.1 Deciduous Vegetable Production in Nepal (Devkota, 2006)
Deciduous vegetable are considered as the most important vegetable crops of Nepal. The
country was importing deciduous vegetable plants from India until the mid 80’s.
a. Production of Planning MaterialDue to the encouragement from the Government several private nurseries have been
established in different in different regions, and now the country is self-sufficient in the
production of planting material of these crops. Even then the government farms have not
been able to cater to the increasing demand of planting materials. As a result, nearly 100
nurseries have so far been established by the private sector.
b. Establishment of orchards and its managementIn Nepal, more than 80% of cultivated land is in high and mid mountain regions is on sloping
mountainous terrain. In this hilly terrain the contour system of planting is followed. All trees
are planted on the contour. The distance between the rows depends on the slope, being
closer on steeper slopes and wider spaced otherwise.
Proper training of young plants and pruning of older trees are not strictly followed by farmers
in many areas of Nepal. Farmer’s negligence of these very important operations has created
a big problem in quality production. However, the most common system of training of
temperate vegetables practiced in the country is the modified leader system followed by the
open center system.
Soil fertility in the mid mountain regions are extremely low, and crops are mainly dependent
upon farm-yard manures and compost, and vegetable crops hardly receive fertilizers.
The writer has failed to highlight the marketing aspect of vegetables in the country
61
2.2.2.2 Deciduous Vegetable Production in Thailand (Subhadrabhandu, 2006)
Delicious vegetables are in high demand in tropical countries. The interest in these crops is on
the rise. Shortages in hard currency in most tropical countries reduce their import and
encourage attempts at local production.
In Thailand, deciduous vegetable production has been focused in the Northern region which
represents on the most important areas of the country from the standpoint of socio-economic,
agro-ecological and political considerations. The region accounts for one-quarter of the
country’s forest are and majority of the hill tribes live in this region. The increasing population in
the area and shifting cultivation of the opium and poppy in the region has caused damage to the
natural resources in the form of soil deterioration, flooding in wet periods and critical water
shortages in the summer months (Subhadrabandhu, S. and Punsri, P, 1987). In an effort to
improve the highlands, deciduous vegetable crops were introduced as substitution crops and
are expected to serve as the main source of income for the hills tribes. Perennial vegetable
trees are believed to have great potential in the highland areas of Northern Thailand, both
commercially and socially, as they can provide a steady and reliable income to the hill tribe
farmers. If successfully cultivation by encouraging more permanent settlement of hill tribe
people and may curtail the growing opium poppy.
Due to the long storage ability of high quality apple from the high chilling cultivars grown in
U.S.A, Australia, New Zealand and China, imported apple fruits are commonly sold in local
markets of Thailand at rather low prices. This makes the production of apple in the highland
areas not so attractive to hill tribe growers as they can only sell their fruits at rather low prices in
order to compete with imports, whereas the cost of production is almost the same as the other
deciduous fruits. Because of this reason, extension of apple cultivation by the hill tribe growers
has ended, and research work on apple has been suspended.
a. Production of Planting MaterialUnder Thai law, the lands in any watershed areas are preserved and protected from any
private ownership. The hill tribes, having lived in the areas for centuries, are allowed to stay
on but, legally, they have no ownership or rights to the land, and the government wants
them to practice settled agriculture without moving around.
62
For these reasons, there are no private nurseries producing planting materials of deciduous
vegetable crops in these areas. Also, due to the tight governmental budget, there are no
governmental organizations responsible for producing these plants. The planting materials
are produced by the Royal Project Stations scattered among the villages in these areas. At
the beginning, budded and grafted plants were planted in the stations in the experimental
plots. Their yield performances and the income from selling the vegetables were recorded.
The better cultivars were then made ready for distribution to hill tribe growers.
b. Establishment of orchards and its managementGenerally, the deciduous vegetables are planted in the lands that used to grow opium poppy
or field crops like maize and beans, where there is little land preparation needed. Clearing
the forest to plant the deciduous vegetable trees in forbidden as it is against the law, which
is one of the reasons for the low hectare of deciduous vegetable trees grown in the area of
Northern Thailand.
The majority of deciduous vegetable orchards are grown under rain fed conditions.
Biological together with presentation orchard management techniques are two key
measures adopted in Thailand.
c. MarketingIn Thailand, all that is produced is locally consumed, and there is no problem in marketing of
fresh vegetables as there is a ready demand for them. The Royal Project Foundation has
established the Marketing Section, which takes the responsibility of selling the vegetables fir
hill tribe growers who derive high returns. These deciduous vegetables are sold under the
brand name of “Doi Kam” in the market. At present, about 60 percent of the vegetables
produced in these areas are sold through this channel. The balance 40 percent is sold
directly by growers, mostly to tourists visiting the villages. There is potential for deciduous
vegetable growing in the highlands of Thailand.
Constraints in its development are, scarcity of land at the high altitudes, difficulties in
educating hill tribe growers, people from lowland are prohibited to venture into the hilly areas
and cultivate the land there, insufficient water resources to irrigate the deciduous vegetable
orchards.
63
2.2.2.3 Deciduous Vegetable Production in Vietnam (Cao-Van, 2006)
Many deciduous vegetables originated from South-East Asia and for this reason vegetables are
still being cultivated in the highlands of Vietnam. In Vietnam deciduous vegetables are cultivated
today by the ethnic minorities who inhabit the mountainous areas. Large areas are in production
but traditional practices have prevented any improvement in yield and quality.
a. Production of Planting MaterialOnly a few ethnic communities have mastered the technique of grafting in some private
nurseries. Lack of good planting material is the main limiting factor to expansion of
deciduous vegetable production in Vietnam.
b. Establishment of orchards and its managementThere is no significant preparatory work in the establishment of orchards. Very little effort is
made in Vietnam for the management of orchards.
c. MarketingVegetables are harvested in their immature state as harvest is determined only by the arrival
of prospective buyer. Further the country lacks facilities for handling, temporary storage
facilities and equipment for packing and temperature control. The vegetable farms are
inaccessible to roads and communications, etc. all this has resulted in huge losses. Under
these conditions of low quality, rich consumers resort to purchase of imported vegetable.
The study has advised introduced and testing followed by training in nursery techniques and
orchard management with assistance from countries with better resources and technique in
growing deciduous vegetables in tropical highlights.
It states that the demand for deciduous vegetables already exists and the domestic market
should be supplied with new and better produce at reasonable prices.
2.2.2.4 Deciduous Vegetable Production in Bhutan. (Dorji, 2006)
64
Bhutan is a small extremely mountainous country with a surface area of 46,000 sq. km, located
in the eastern Himalayas. More than 90% of the population lives in rural communities.
Vegetables in the country were grown in the past for domestic consumption only due to the
absence of means of transport. But now, with the construction of roads, surplus vegetables are
exported to neighboring parts of India, which has a tropical climate but an insatiable market for
temperate vegetables. Vegetable cultivation has been identified as a potential source of cash
income for the farmers. As a result, commercial plantations have also been established.
Commercial farming grew to its height due to the improved road network and development of
Bangladesh as an export market.
a. Production of Planting MaterialBhutan has been producing its own requirement of vegetable plants from its government
nursery under the umbrella of the National Seed and Plant Production Program (BASEPP).
Initially this nursery used to produce and distribution its own plants but new it has limited its
role to selling plants produced by its registered private growers.
b. Establishment of orchards and its managementCommercial deciduous vegetable orchards are established in highlands which are not
suitable for paddy cultivation. Orchards have been established located *mostly on mountain
slopes in between the cultivated fields and the forest cover. They are also found in the dry
lands in the valley bottoms. Orchards on the steep mountain slopes are terraced while the
gentle slopes are planted with deciduous vegetables along the contour.
Scientific management of orchards in Bhutan has led to increase in productivity. At present,
apple dominants deciduous vegetable production in Bhutan, followed by peach. The
advantage associated with the Bhutanese apple, however, is the low usage of pesticides
compared to the world’s major apple growing countries.
c. MarketingThe production of apple on a commercial scale is a relatively recent development, primarily
due to the development of roads and the export market. The export market is the single
most important factor that resulted in the recent dramatic increasing in the number of
plantation; and it could absorb almost % of the apple produced. Of the total annual
65
production, about 30% of the produce does not meet the export requirement and hence is
sold in the local market.
The Food Corporation of Bhutan (FCB) operates auction yards in three border towns close to
the border with India, where the farmers take their horticulture produce including vegetable, and
get good prices. The Agro-Food Processing Factory in Thimpu, established with the help of
DANIDA, and located within the apple growing areas, constitutes a major local outlet not only for
apples but also for other deciduous vegetables. The regular Sunday market is the only form of
wholesale market which is also a good retail outlet. At the moment, there are very few retail
shops selling vegetables primarily because of lack of good storage and packaging facilities.
2.2.2.5 Present Prospects of Horticulture Produce in China
Policy changes and economic factors have played a remarkable role in triggering China’s move
into the horticultural market. As demand has risen, a more market-oriented policy has allowed
China’s farmers to respond and supply massive quantities of vegetables, fruits, and nuts. Small
farmers and poor farmers who sell to poor traders have supplied most of the production. Tens of
millions of individuals are involved in the sector. The shift into horticulture crops has had many
consequences, most of them positive. Incomes have risen, farm output had diversified, the
quality of vegetables and fruits have risen, and China’s production for its domestic market has
expanded into the international arena. In fact, China’s horticulture sector has far outperformed
the predictions most of the production. Tens of millions of individuals are involved in the sector.
The shift into horticulture crops has had many consequences, most of them positive. Incomes
have risen, farm output had diversified, the quality of vegetables and fruits have risen, and
China’s production for its domestic market has expanded into the international arena. In fact,
China’s horticulture sector has far outperformed the predictions that anyone could have made
just ten years ago.
2.2.2.6 Recommendation for Vegetable Development in Nepal
A paper by Gautam J.C. in the year 1995 at a National Seminar on Fruit Development in Nepal
has made following recommendations:
66
The productivity of the cereals has been stagnated in the sense that output has not been
able to keep the pace with increasing populations. Thus these hill areas should be
gradually replaced by high value crops like fruits.
The crops diversification for market led production program according to suitability for
fruits should be adopted. These programs should go into the concentrate product areas
as directed by 8th Five year plan.
The horticulture roads should be constructed to facilitate the transport of produces and
inputs to production area.
The perennial crops have long gestation so farmers must be provided with opportunities
to earn regular income for transitional period.
The power supply and other infrastructure developed is a must for fruit developed as
cold storage facilities are necessary for storing the fruits in the production areas. The
power supply can be used for irrigation in high hills.
The research system in fruit sector is very poor. Research need to be directed in
generating the technologies on reducing the cost of production, improving marketing
system and post harvest management. Coordinated programs and divisions should
coordinate the research and government farms/station should also be allowed to
conduct researches.
There is a wide controversy on the fruit statistics available. A systematic survey has to
be conducted to standardize the government statistics.
The necessary inputs like quality saplings, fertilizers, pesticides should be made
available easily and timely in the production pocket area.
High interest rate of agriculture credit is one of the limitations to fruit development. The
interest rate should be reduced and credit should be provided in a timely manner to the
farmers. The long gestation of the fruit has negative impact on the farmers. Thus the
farmers should be provided opportunities to earn regularly in the transitional period.
67
CHAPTER - 3
RESEARCH METHODOLOGY
Introduction
Research Methodology is a systematic way to solve the research problems. It describes the
methods and process applied in the overall presentation of the study. This research design is
based on scientific method and efforts have been made to present and explain the specific
research design for the sake of attaining the research objective. It includes research design,
source of data, population and sample data gathering procedure and data processing
procedures.
3.1 Research Design
This dissertation is concerned in the vegetables marketing in Kathmandu district. This research
design consists of combination of structure and unstructured interview, schedule for primary
data and a wide research for secondary sources which help to analyze the relationship between
selected variables. The present study is based upon descriptive research design to find out
actual condition of vegetables marketing and to provide necessary possible suggestion for it.
3.2 Population and Sample
For the detailed study of the vegetables marketing the vegetables markets in the municipality
were taken as sample. All together 250 questions are distributed to opinion survey for
consumers of vegetables where as 202 retail and wholesale businessmen have been asked
questionnaire.
68
3.3 Sources of Data
Both types of primary and secondary data have been used for the present study. The primary
data and information were collected through field survey; primary data is collected from different
sources. Such a different sample respondents of the shopkeeper, producer and consumers
were collected from the study area. Different caste sample, respondents and Kalimati fruits and
vegetables market data were selected for collecting the primary data and secondary data were
collected from AEC, DOA, booklets, unpublished dissertations, published articles and internet.
Main focus is given to primary data. Both quantitative and qualitative data have been used.
3.1.1 Primary data
Primary data are collected through survey of Kuleshwor fruit and vegetable market, from the
interview with consumers, retailers and farmers of different age, caste and with different social
status.
3.1.2 Secondary data
Secondary data are collected from the different sources. The sources include different types of
magazine, different bulletin, AEC (reports), Kalimati fruits and vegetables market data,
Kuleshwor fruits and vegetable wholesaler market, District Agriculture Office data and various
official websites of Agricultural organizations.
3.1.3 Questionnaire
Structured and unstructured questionnaire were prepared for the collection of data. Different
sets of questionnaire where specially prepared for retailers and consumers.
3.1.4 Observation
While collecting data and studying the vegetables market, direct observation was done. Direct
observation was specially made in the different vegetables market, the behavior of both the
consumers and retailers were also noticed.
69
3.1.5 Interview
At the market place consumers were interviewed. Selection of the consumers was random.
Similarly the farmers were interviewed in their filed while some were on the way to the market.
On the other hand the cold store and seed shopkeepers were also interviewed.
3.4 Data Collection Techniques
This study, both structured and unstructured questionnaires as well as interview methods were
used for quantitative and qualitative data. Structured questionnaires were used to collect the
basic information about the production and marketing of vegetables. Both types of data were
collected with help of the methods like direct observation method, interview, schedule were
used to study.
The stated objectives of this study have been achieved by collecting data and information
primarily from the secondary sources. Then data has been collected from published as well as
unpublished reports, research studies and other publications. The data which is not available in
the reports and publications were gathered by the personal contacts with the respective
authorities. In addition, information has also been collected from the primary sources through
the use of information interview, observation and questionnaire methods. The following
secondary sources have been tapped for the collection of the required data and information.
1. Vegetable Development Division, Khumaltar
2. Kalimati Vegetable and Fruit Market Development Board, Kalimati
3. National Fruit Development Programme, Khumaltar
4. Food and Agriculture Marketing Services Department
5. Statistics Division of Customs Department
6. Other sources including the books, articles, reports, research studies, and publications
published by the various authorities
3.5 Data Analysis Tools
70
After collection of primary and secondary data, coding, entry, tabulation, calculation and
analysis were performed to fulfill the objectives of the study. Analysis of data has been done
both descriptively and statistically in textual and tabular/graphical form. The quantitative data
were categorized, tabulated and analyzed using appropriate statistical tools like null hypothesis
tests, Chi square test, least square method, weighted average mean.
The data has been collected from different castes and society, using various instruments and
data has been analyzed. Each part of the information classified, analyzed and described
mathematically and statistically classifying with tabulating them in different categories into sub
headings. The data have been analyzed using a various statistical and mathematical tools and
techniques such as percentage, graph, bar diagram, pie chart, and maps etc. different charts
have been used to classify the quantitative as well as qualitative data.
3.6 Limitations of the Methodology
The methodology has following limitations:
a. The research design may not comprise of all the facets of its area.
b. The sample size is too small. It is selected by researcher’s judgment; there is a risk of not
representing the whole characteristic of its population.
c. Questionnaire and interview procedure may not be sufficient for the relevant data collection.
d. Data analysis tools may not be enough to describe the data because of limited scope.
e. The research has been completed during a limited time period of six months with very
limited resources.
f. The amount of investment required for such a challenging subject has not been adequate
from the researchers’ side.
CHAPTER - 4
DATA PRESENTATION AND ANALYSIS
This chapter focuses on the presentation and analysis of data obtained from research
interviews. A description of the respondent who took part in the study will be given. The
researcher will present the data from the different interview schedules. Data analysis will also be
71
discussed. According to De VOs (1998:334) "Data analysis in qualitative research is a
challenging and highly creative process. It starts with data collection. The researcher is
intimately involved with the respondents and the data that are generated."
4.1 Data Presentation and Analysis
Main sources of secondary data are District Agriculture Office, Kathmandu (DAOK), Agro
Enterprise Center (AEC), Kalimati/Kuleshwor fruits and vegetables wholesaler markets, Market
Information Service (MIS), Nepal etc.
Kalimati Fruits and Vegetable Market is the pioneer organized terminal wholesale market where
retailer, institutional consumers and other bulk consumer procure their supplies of commodities.
For giving an organized shape of the marketing of agriculture produce specially fruits and
vegetable products in Kathmandu valley. Food and Agriculture marketing department under the
Ministry of Agriculture in 1987 set up Kalimati Fruits and Vegetable market.
Bara, Bhaktapur, Chitwan, Dhadin, Gorkha, Jhapa, Kavre, Lalitpur, Makawanpur, Morang,
Nuwakot, Parsha, Rautahat, Sarlahi, Sunasari, Tanahu are the major vegetable, fruits and
spices suppling source in Kalimati Market. Beside that some vegetable and fruits are being
supplied from India and Tibbat but compared to the other sources the share of India and Tibet
are seen very nominal.
As per the record of Kalimati Market, the annual turnover of vegetable, fruits and spices in the
year 2054 through Kalimati market is 203511.562 MT.
Figure-4.1
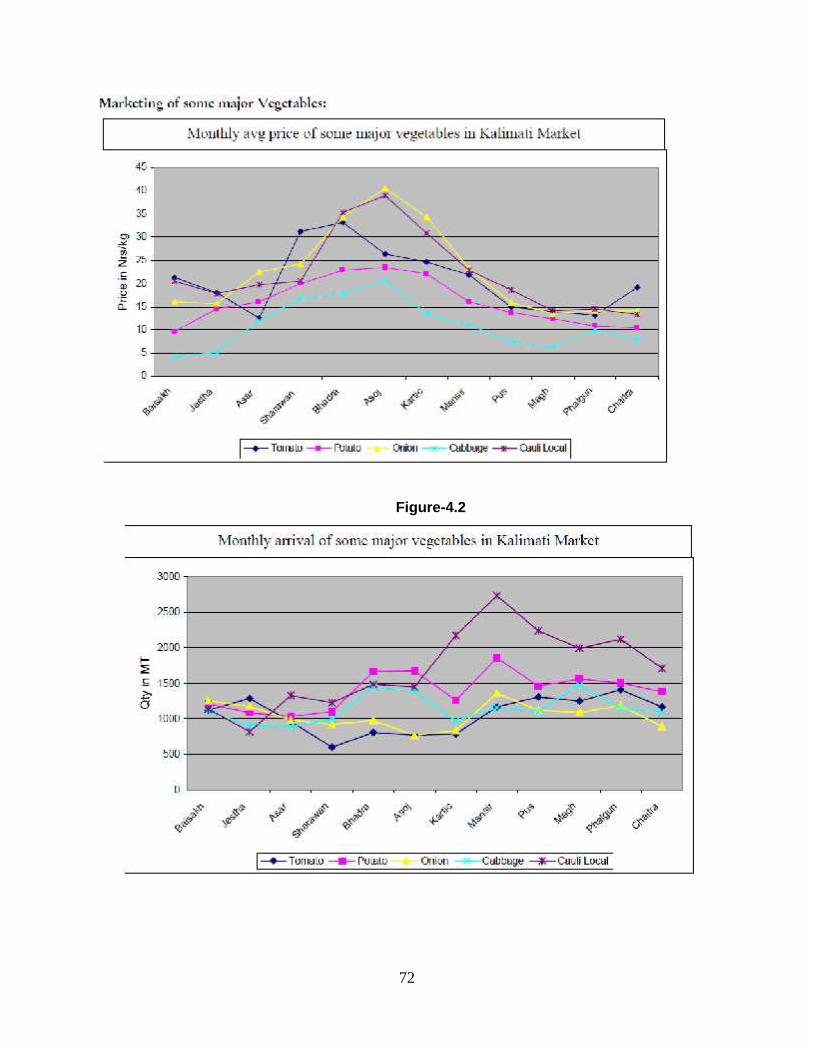
72
Figure-4.2
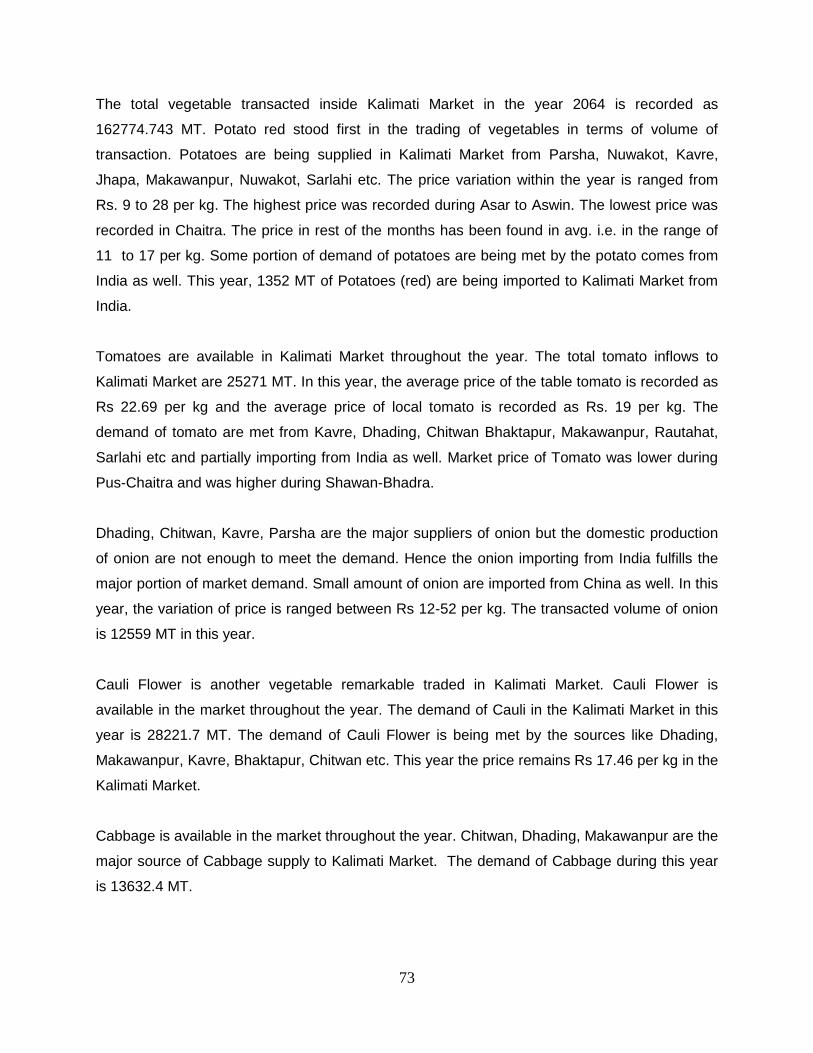
73
The total vegetable transacted inside Kalimati Market in the year 2064 is recorded as
162774.743 MT. Potato red stood first in the trading of vegetables in terms of volume of
transaction. Potatoes are being supplied in Kalimati Market from Parsha, Nuwakot, Kavre,
Jhapa, Makawanpur, Nuwakot, Sarlahi etc. The price variation within the year is ranged from
Rs. 9 to 28 per kg. The highest price was recorded during Asar to Aswin. The lowest price was
recorded in Chaitra. The price in rest of the months has been found in avg. i.e. in the range of
11 to 17 per kg. Some portion of demand of potatoes are being met by the potato comes from
India as well. This year, 1352 MT of Potatoes (red) are being imported to Kalimati Market from
India.
Tomatoes are available in Kalimati Market throughout the year. The total tomato inflows to
Kalimati Market are 25271 MT. In this year, the average price of the table tomato is recorded as
Rs 22.69 per kg and the average price of local tomato is recorded as Rs. 19 per kg. The
demand of tomato are met from Kavre, Dhading, Chitwan Bhaktapur, Makawanpur, Rautahat,
Sarlahi etc and partially importing from India as well. Market price of Tomato was lower during
Pus-Chaitra and was higher during Shawan-Bhadra.
Dhading, Chitwan, Kavre, Parsha are the major suppliers of onion but the domestic production
of onion are not enough to meet the demand. Hence the onion importing from India fulfills the
major portion of market demand. Small amount of onion are imported from China as well. In this
year, the variation of price is ranged between Rs 12-52 per kg. The transacted volume of onion
is 12559 MT in this year.
Cauli Flower is another vegetable remarkable traded in Kalimati Market. Cauli Flower is
available in the market throughout the year. The demand of Cauli in the Kalimati Market in this
year is 28221.7 MT. The demand of Cauli Flower is being met by the sources like Dhading,
Makawanpur, Kavre, Bhaktapur, Chitwan etc. This year the price remains Rs 17.46 per kg in the
Kalimati Market.
Cabbage is available in the market throughout the year. Chitwan, Dhading, Makawanpur are the
major source of Cabbage supply to Kalimati Market. The demand of Cabbage during this year
is 13632.4 MT.
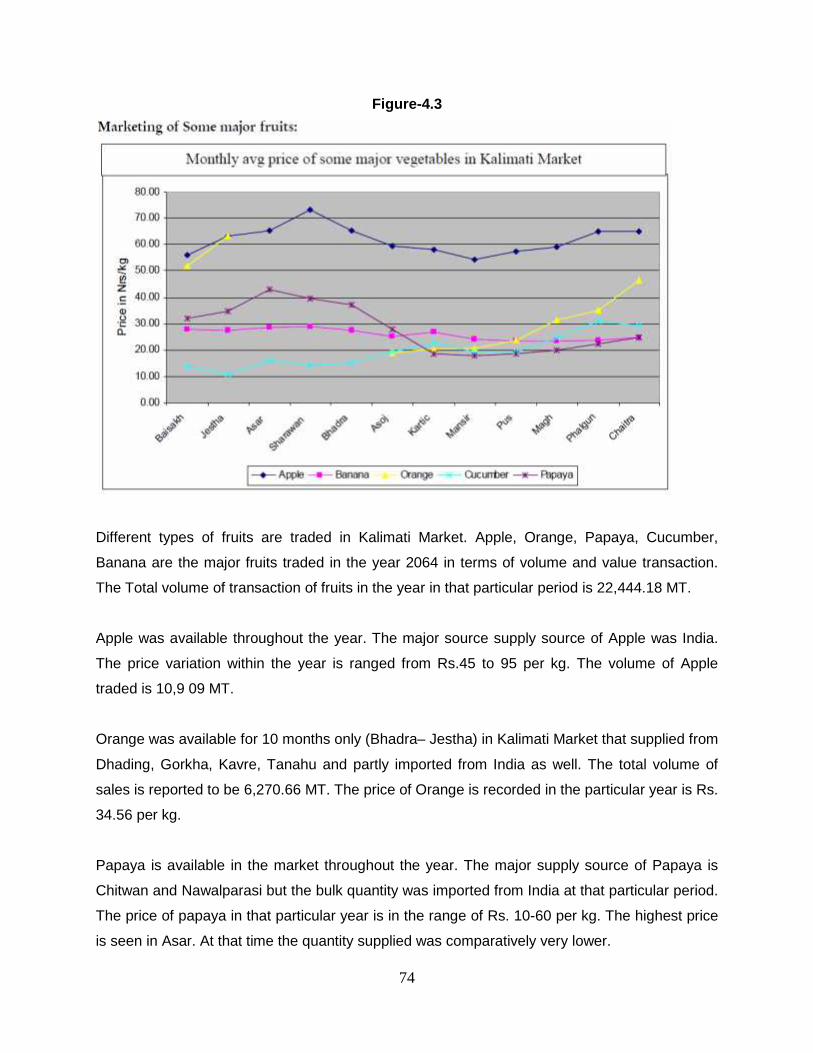
74
Figure-4.3
Different types of fruits are traded in Kalimati Market. Apple, Orange, Papaya, Cucumber,
Banana are the major fruits traded in the year 2064 in terms of volume and value transaction.
The Total volume of transaction of fruits in the year in that particular period is 22,444.18 MT.
Apple was available throughout the year. The major source supply source of Apple was India.
The price variation within the year is ranged from Rs.45 to 95 per kg. The volume of Apple
traded is 10,9 09 MT.
Orange was available for 10 months only (Bhadra– Jestha) in Kalimati Market that supplied from
Dhading, Gorkha, Kavre, Tanahu and partly imported from India as well. The total volume of
sales is reported to be 6,270.66 MT. The price of Orange is recorded in the particular year is Rs.
34.56 per kg.
Papaya is available in the market throughout the year. The major supply source of Papaya is
Chitwan and Nawalparasi but the bulk quantity was imported from India at that particular period.
The price of papaya in that particular year is in the range of Rs. 10-60 per kg. The highest price
is seen in Asar. At that time the quantity supplied was comparatively very lower.
75
Cucumber is the most traded fruit in the year 2064. The major supply source of Cucumber is
Chitwan, Dhading, Kavre, Lalitpur, Nuwakot, The demand of cucumber is fulfilled by the locally
produce once as well. Cucumber is available throughout the year. The price of Cucumber is
higher in the month of Mansir that is Rs 31.2 per kg. And lower in the month of Jestha that is Rs
10.68 per kg. The total sale of Cucumber in that year is 8,641.4 MT.
Bananas are available all around the year. The price variation is recorded in that particular year
is Rs. 20-65 per doz. Price is relatively higher during Asar –Bhadra and lower during Pus-
Phalgun. The total traded volume of Bananas in this year is 623 MT.
Marketing of Ginger and Chilly Green:
Figure-4.4
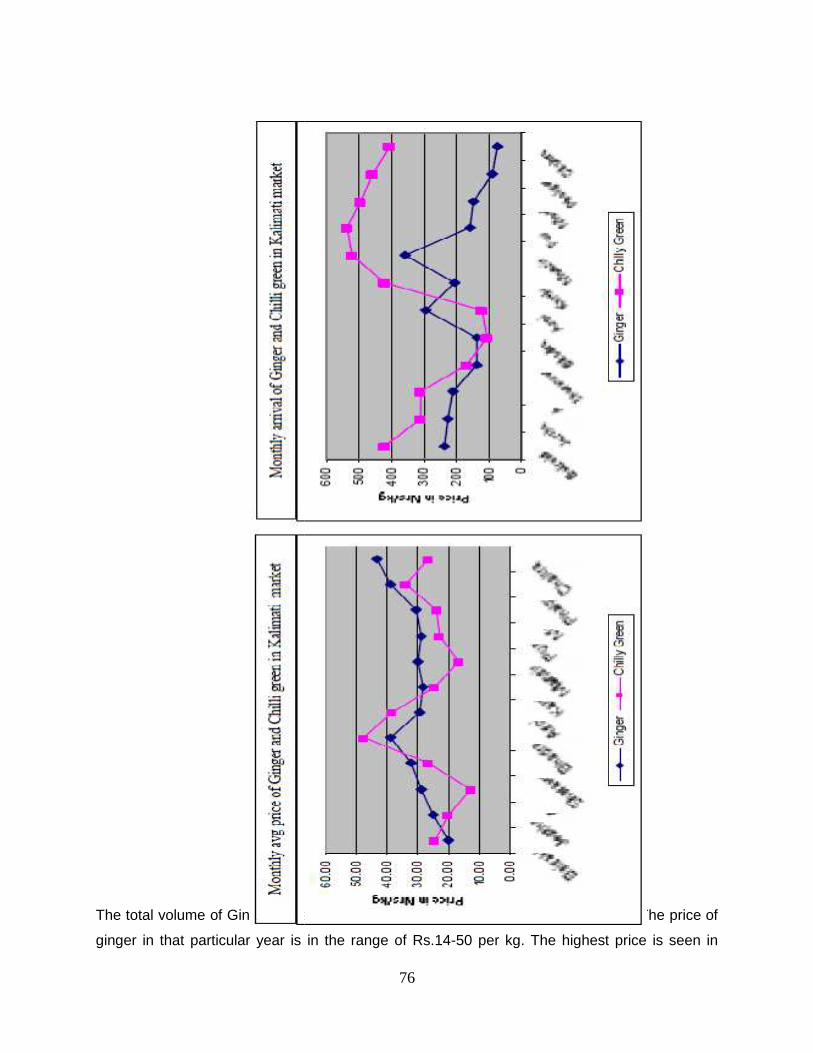
76
The total volume of Ginger transaction in the year 2064 is accounts for 2278.8 MT The price of
ginger in that particular year is in the range of Rs.14-50 per kg. The highest price is seen in
76
The total volume of Ginger transaction in the year 2064 is accounts for 2278.8 MT The price of
ginger in that particular year is in the range of Rs.14-50 per kg. The highest price is seen in
76
The total volume of Ginger transaction in the year 2064 is accounts for 2278.8 MT The price of
ginger in that particular year is in the range of Rs.14-50 per kg. The highest price is seen in
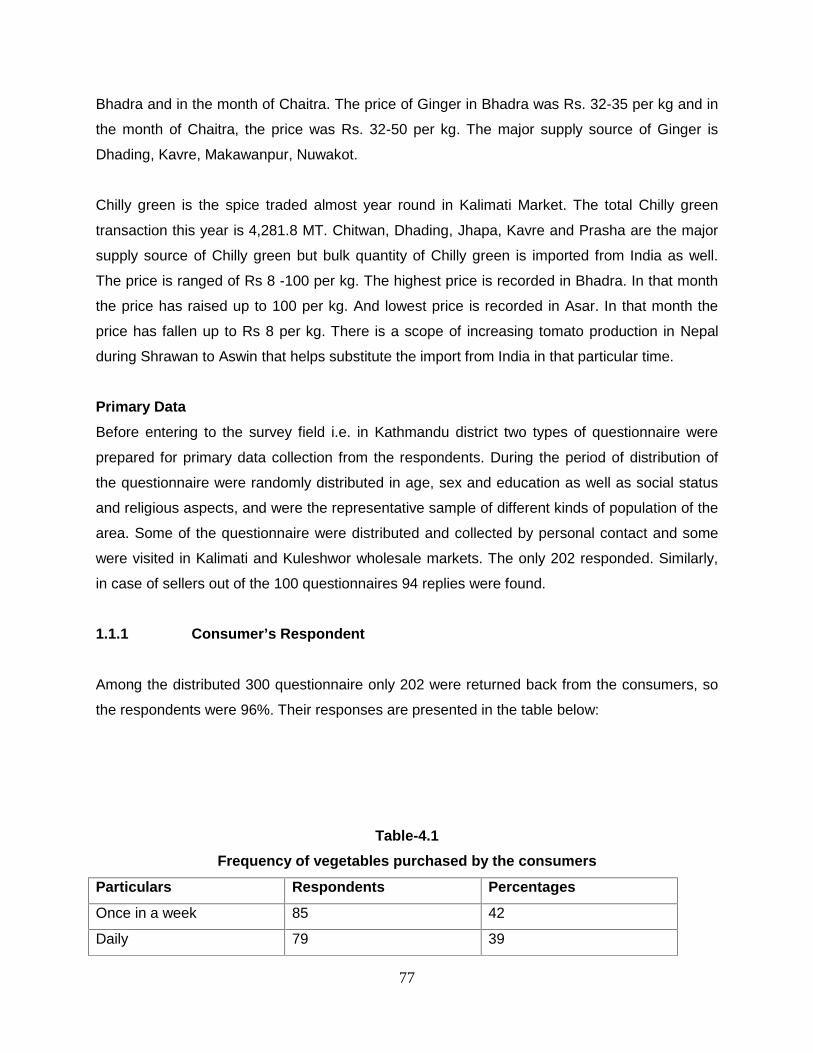
77
Bhadra and in the month of Chaitra. The price of Ginger in Bhadra was Rs. 32-35 per kg and in
the month of Chaitra, the price was Rs. 32-50 per kg. The major supply source of Ginger is
Dhading, Kavre, Makawanpur, Nuwakot.
Chilly green is the spice traded almost year round in Kalimati Market. The total Chilly green
transaction this year is 4,281.8 MT. Chitwan, Dhading, Jhapa, Kavre and Prasha are the major
supply source of Chilly green but bulk quantity of Chilly green is imported from India as well.
The price is ranged of Rs 8 -100 per kg. The highest price is recorded in Bhadra. In that month
the price has raised up to 100 per kg. And lowest price is recorded in Asar. In that month the
price has fallen up to Rs 8 per kg. There is a scope of increasing tomato production in Nepal
during Shrawan to Aswin that helps substitute the import from India in that particular time.
Primary DataBefore entering to the survey field i.e. in Kathmandu district two types of questionnaire were
prepared for primary data collection from the respondents. During the period of distribution of
the questionnaire were randomly distributed in age, sex and education as well as social status
and religious aspects, and were the representative sample of different kinds of population of the
area. Some of the questionnaire were distributed and collected by personal contact and some
were visited in Kalimati and Kuleshwor wholesale markets. The only 202 responded. Similarly,
in case of sellers out of the 100 questionnaires 94 replies were found.
1.1.1 Consumer’s Respondent
Among the distributed 300 questionnaire only 202 were returned back from the consumers, so
the respondents were 96%. Their responses are presented in the table below:
Table-4.1Frequency of vegetables purchased by the consumers
Particulars Respondents Percentages
Once in a week 85 42
Daily 79 39
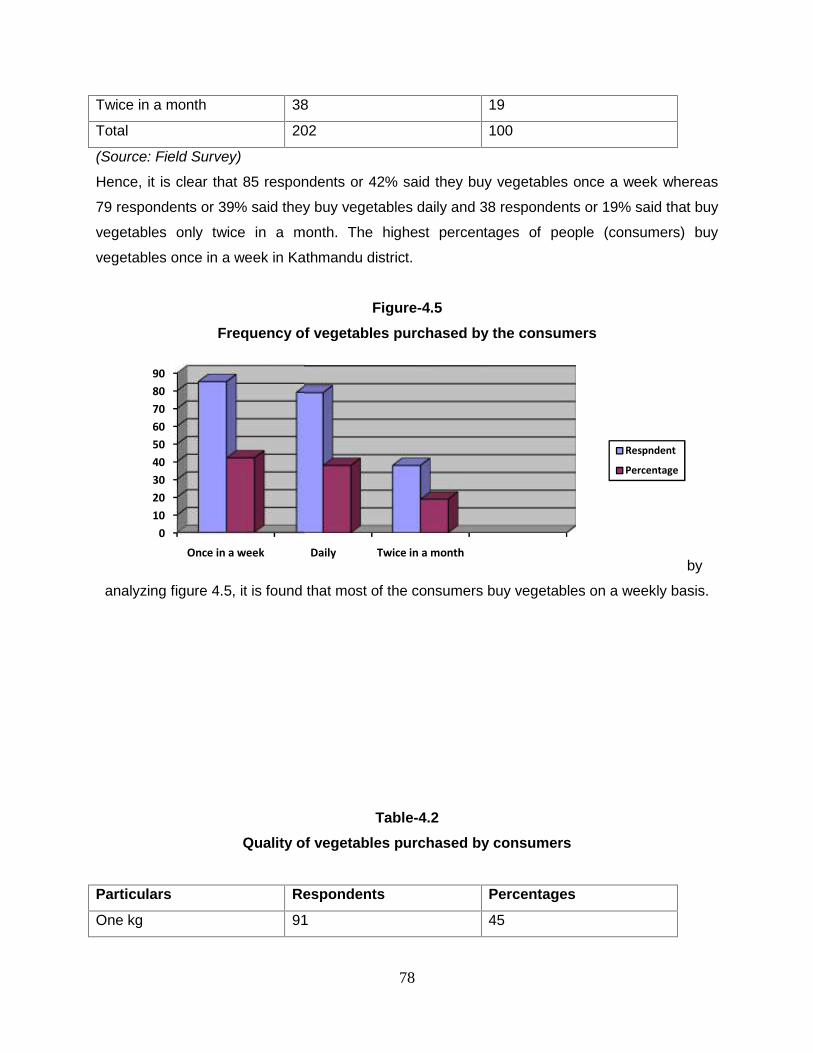
78
Twice in a month 38 19
Total 202 100
(Source: Field Survey)
Hence, it is clear that 85 respondents or 42% said they buy vegetables once a week whereas
79 respondents or 39% said they buy vegetables daily and 38 respondents or 19% said that buy
vegetables only twice in a month. The highest percentages of people (consumers) buy
vegetables once in a week in Kathmandu district.
Figure-4.5Frequency of vegetables purchased by the consumers
by
analyzing figure 4.5, it is found that most of the consumers buy vegetables on a weekly basis.
Table-4.2Quality of vegetables purchased by consumers
Particulars Respondents Percentages
One kg 91 45
0102030405060708090
Once in a week Daily
78
Twice in a month 38 19
Total 202 100
(Source: Field Survey)
Hence, it is clear that 85 respondents or 42% said they buy vegetables once a week whereas
79 respondents or 39% said they buy vegetables daily and 38 respondents or 19% said that buy
vegetables only twice in a month. The highest percentages of people (consumers) buy
vegetables once in a week in Kathmandu district.
Figure-4.5Frequency of vegetables purchased by the consumers
by
analyzing figure 4.5, it is found that most of the consumers buy vegetables on a weekly basis.
Table-4.2Quality of vegetables purchased by consumers
Particulars Respondents Percentages
One kg 91 45
Daily Twice in a month
78
Twice in a month 38 19
Total 202 100
(Source: Field Survey)
Hence, it is clear that 85 respondents or 42% said they buy vegetables once a week whereas
79 respondents or 39% said they buy vegetables daily and 38 respondents or 19% said that buy
vegetables only twice in a month. The highest percentages of people (consumers) buy
vegetables once in a week in Kathmandu district.
Figure-4.5Frequency of vegetables purchased by the consumers
by
analyzing figure 4.5, it is found that most of the consumers buy vegetables on a weekly basis.
Table-4.2Quality of vegetables purchased by consumers
Particulars Respondents Percentages
One kg 91 45
Respndent
Percentage
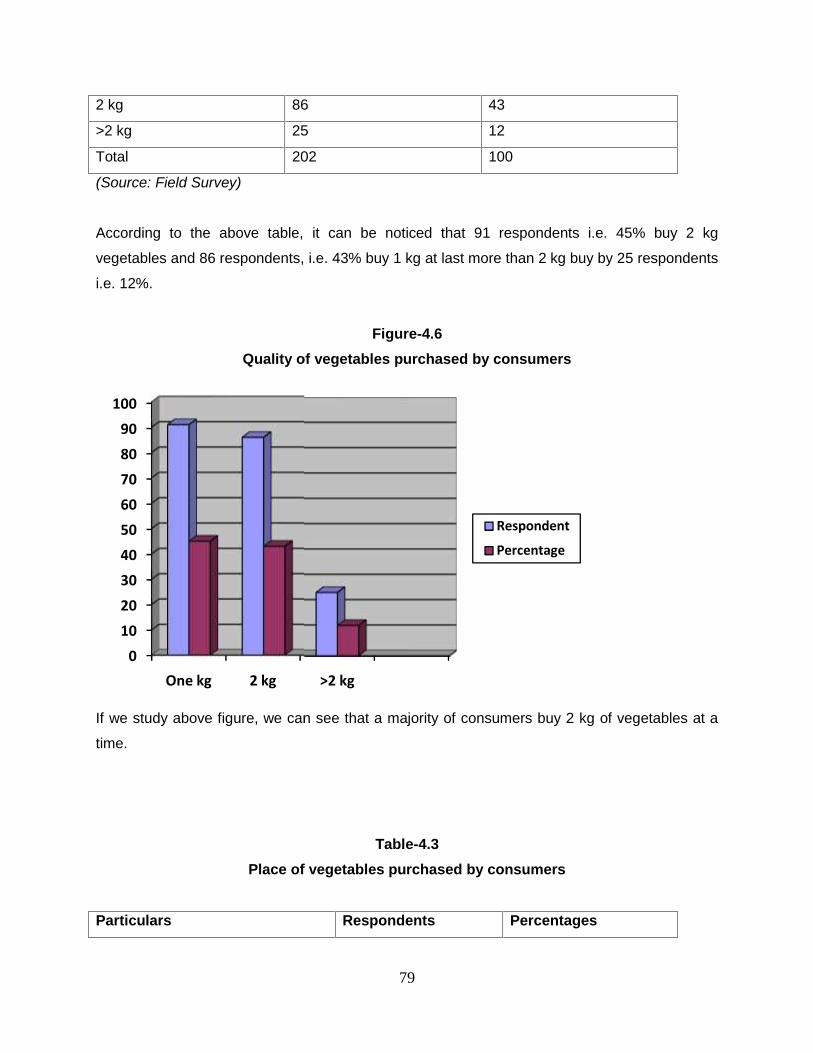
79
2 kg 86 43
>2 kg 25 12
Total 202 100
(Source: Field Survey)
According to the above table, it can be noticed that 91 respondents i.e. 45% buy 2 kg
vegetables and 86 respondents, i.e. 43% buy 1 kg at last more than 2 kg buy by 25 respondents
i.e. 12%.
Figure-4.6Quality of vegetables purchased by consumers
If we study above figure, we can see that a majority of consumers buy 2 kg of vegetables at a
time.
Table-4.3Place of vegetables purchased by consumers
Particulars Respondents Percentages
0102030405060708090
100
One kg 2 kg
79
2 kg 86 43
>2 kg 25 12
Total 202 100
(Source: Field Survey)
According to the above table, it can be noticed that 91 respondents i.e. 45% buy 2 kg
vegetables and 86 respondents, i.e. 43% buy 1 kg at last more than 2 kg buy by 25 respondents
i.e. 12%.
Figure-4.6Quality of vegetables purchased by consumers
If we study above figure, we can see that a majority of consumers buy 2 kg of vegetables at a
time.
Table-4.3Place of vegetables purchased by consumers
Particulars Respondents Percentages
>2 kg
Respondent
Percentage
79
2 kg 86 43
>2 kg 25 12
Total 202 100
(Source: Field Survey)
According to the above table, it can be noticed that 91 respondents i.e. 45% buy 2 kg
vegetables and 86 respondents, i.e. 43% buy 1 kg at last more than 2 kg buy by 25 respondents
i.e. 12%.
Figure-4.6Quality of vegetables purchased by consumers
If we study above figure, we can see that a majority of consumers buy 2 kg of vegetables at a
time.
Table-4.3Place of vegetables purchased by consumers
Particulars Respondents Percentages
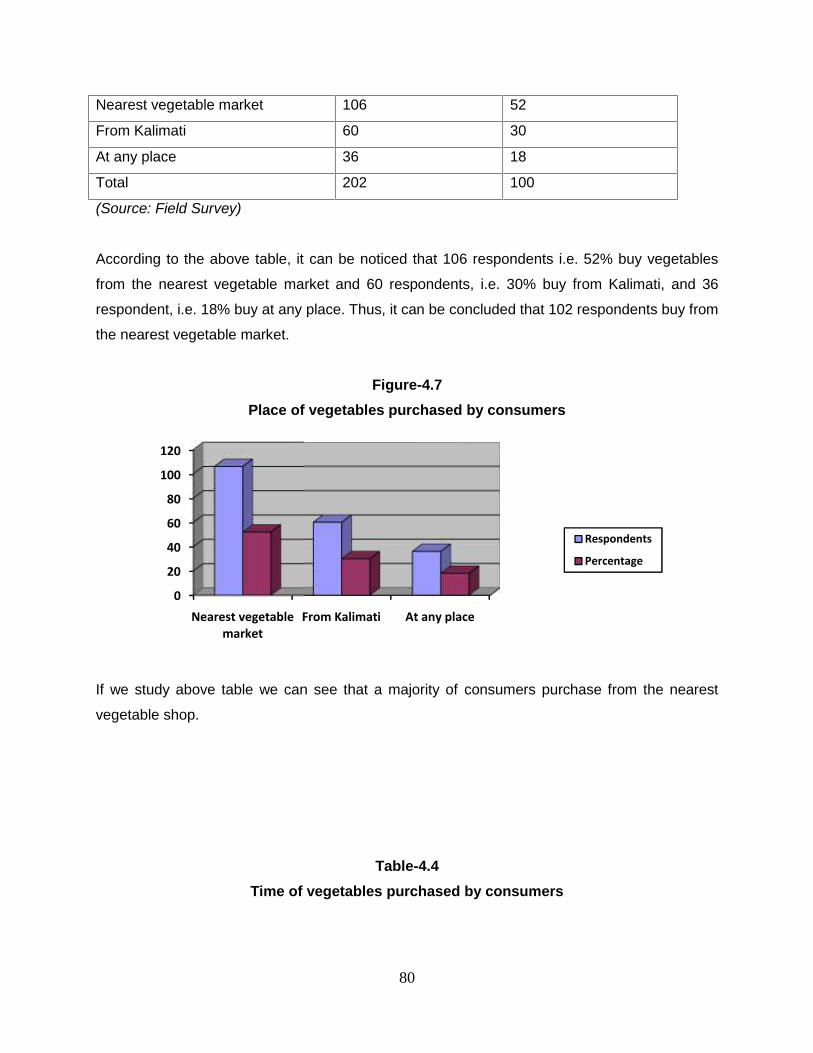
80
Nearest vegetable market 106 52
From Kalimati 60 30
At any place 36 18
Total 202 100
(Source: Field Survey)
According to the above table, it can be noticed that 106 respondents i.e. 52% buy vegetables
from the nearest vegetable market and 60 respondents, i.e. 30% buy from Kalimati, and 36
respondent, i.e. 18% buy at any place. Thus, it can be concluded that 102 respondents buy from
the nearest vegetable market.
Figure-4.7Place of vegetables purchased by consumers
If we study above table we can see that a majority of consumers purchase from the nearest
vegetable shop.
Table-4.4Time of vegetables purchased by consumers
0
20
40
60
80
100
120
Nearest vegetablemarket
From Kalimati
80
Nearest vegetable market 106 52
From Kalimati 60 30
At any place 36 18
Total 202 100
(Source: Field Survey)
According to the above table, it can be noticed that 106 respondents i.e. 52% buy vegetables
from the nearest vegetable market and 60 respondents, i.e. 30% buy from Kalimati, and 36
respondent, i.e. 18% buy at any place. Thus, it can be concluded that 102 respondents buy from
the nearest vegetable market.
Figure-4.7Place of vegetables purchased by consumers
If we study above table we can see that a majority of consumers purchase from the nearest
vegetable shop.
Table-4.4Time of vegetables purchased by consumers
Nearest vegetablemarket
From Kalimati At any place
Respondents
Percentage
80
Nearest vegetable market 106 52
From Kalimati 60 30
At any place 36 18
Total 202 100
(Source: Field Survey)
According to the above table, it can be noticed that 106 respondents i.e. 52% buy vegetables
from the nearest vegetable market and 60 respondents, i.e. 30% buy from Kalimati, and 36
respondent, i.e. 18% buy at any place. Thus, it can be concluded that 102 respondents buy from
the nearest vegetable market.
Figure-4.7Place of vegetables purchased by consumers
If we study above table we can see that a majority of consumers purchase from the nearest
vegetable shop.
Table-4.4Time of vegetables purchased by consumers
Respondents
Percentage
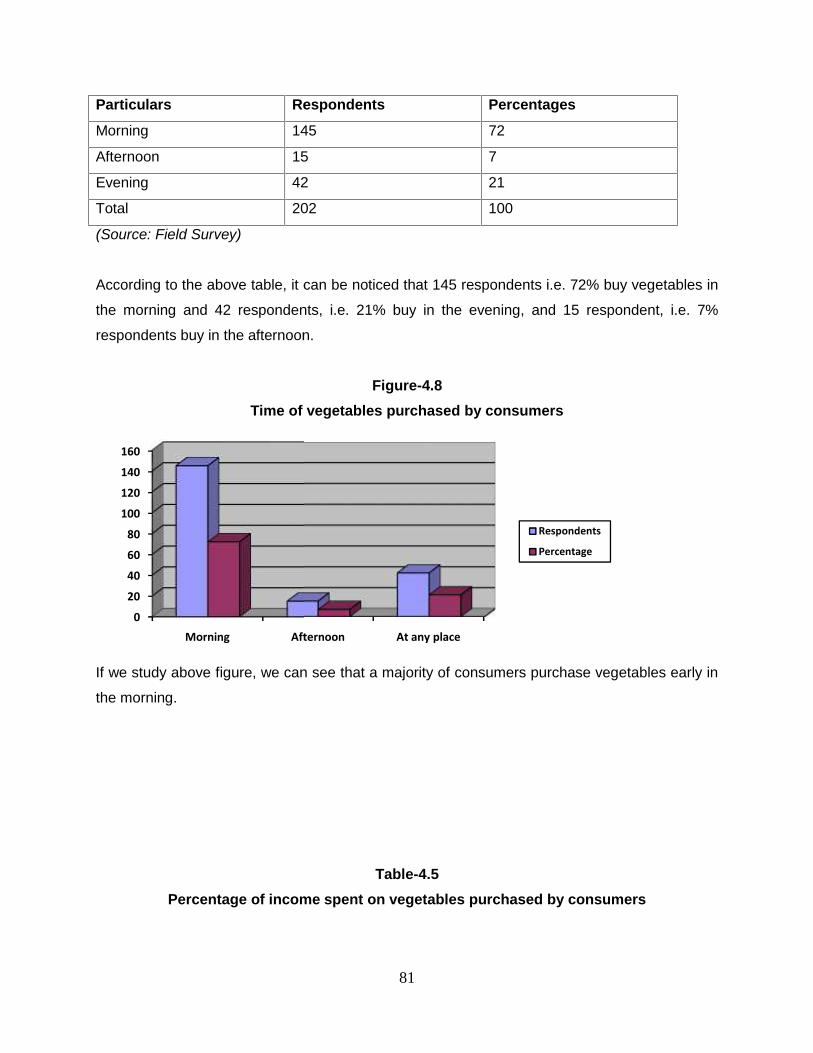
81
Particulars Respondents Percentages
Morning 145 72
Afternoon 15 7
Evening 42 21
Total 202 100
(Source: Field Survey)
According to the above table, it can be noticed that 145 respondents i.e. 72% buy vegetables in
the morning and 42 respondents, i.e. 21% buy in the evening, and 15 respondent, i.e. 7%
respondents buy in the afternoon.
Figure-4.8Time of vegetables purchased by consumers
If we study above figure, we can see that a majority of consumers purchase vegetables early in
the morning.
Table-4.5Percentage of income spent on vegetables purchased by consumers
0
20
40
60
80
100
120
140
160
Morning Afternoon
81
Particulars Respondents Percentages
Morning 145 72
Afternoon 15 7
Evening 42 21
Total 202 100
(Source: Field Survey)
According to the above table, it can be noticed that 145 respondents i.e. 72% buy vegetables in
the morning and 42 respondents, i.e. 21% buy in the evening, and 15 respondent, i.e. 7%
respondents buy in the afternoon.
Figure-4.8Time of vegetables purchased by consumers
If we study above figure, we can see that a majority of consumers purchase vegetables early in
the morning.
Table-4.5Percentage of income spent on vegetables purchased by consumers
Afternoon At any place
Respondents
Percentage
81
Particulars Respondents Percentages
Morning 145 72
Afternoon 15 7
Evening 42 21
Total 202 100
(Source: Field Survey)
According to the above table, it can be noticed that 145 respondents i.e. 72% buy vegetables in
the morning and 42 respondents, i.e. 21% buy in the evening, and 15 respondent, i.e. 7%
respondents buy in the afternoon.
Figure-4.8Time of vegetables purchased by consumers
If we study above figure, we can see that a majority of consumers purchase vegetables early in
the morning.
Table-4.5Percentage of income spent on vegetables purchased by consumers
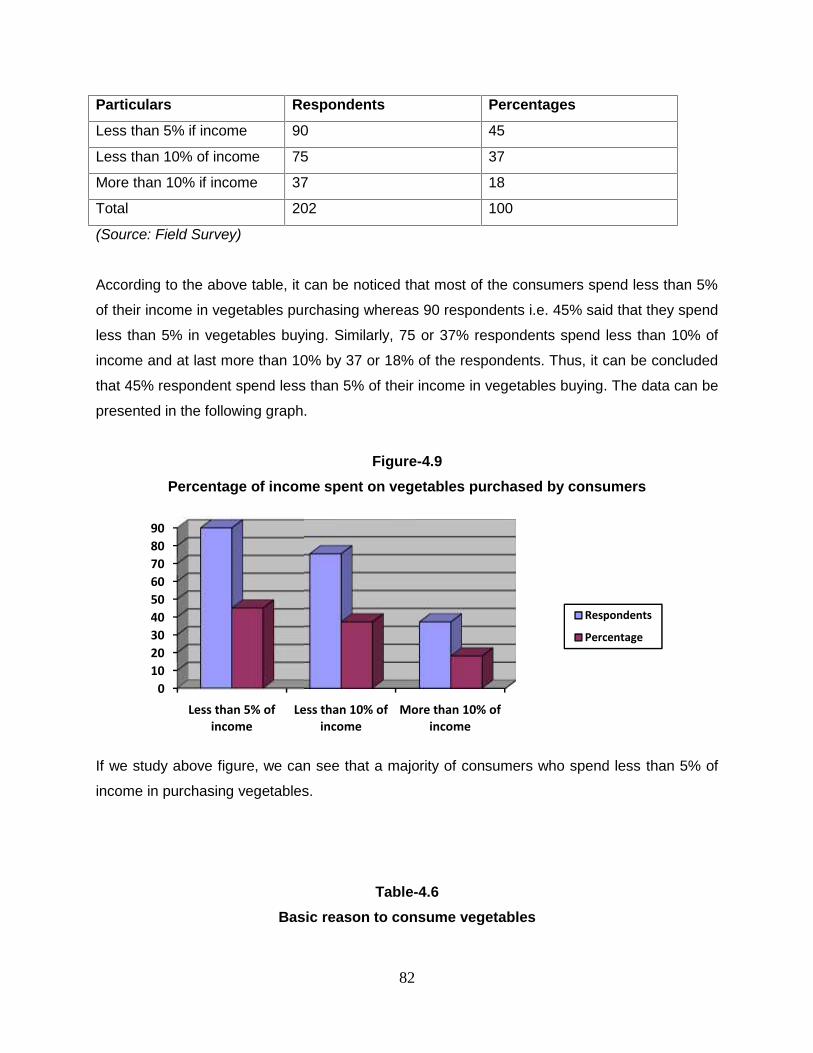
82
Particulars Respondents Percentages
Less than 5% if income 90 45
Less than 10% of income 75 37
More than 10% if income 37 18
Total 202 100
(Source: Field Survey)
According to the above table, it can be noticed that most of the consumers spend less than 5%
of their income in vegetables purchasing whereas 90 respondents i.e. 45% said that they spend
less than 5% in vegetables buying. Similarly, 75 or 37% respondents spend less than 10% of
income and at last more than 10% by 37 or 18% of the respondents. Thus, it can be concluded
that 45% respondent spend less than 5% of their income in vegetables buying. The data can be
presented in the following graph.
Figure-4.9Percentage of income spent on vegetables purchased by consumers
If we study above figure, we can see that a majority of consumers who spend less than 5% of
income in purchasing vegetables.
Table-4.6Basic reason to consume vegetables
0102030405060708090
Less than 5% ofincome
Less than 10% ofincome
82
Particulars Respondents Percentages
Less than 5% if income 90 45
Less than 10% of income 75 37
More than 10% if income 37 18
Total 202 100
(Source: Field Survey)
According to the above table, it can be noticed that most of the consumers spend less than 5%
of their income in vegetables purchasing whereas 90 respondents i.e. 45% said that they spend
less than 5% in vegetables buying. Similarly, 75 or 37% respondents spend less than 10% of
income and at last more than 10% by 37 or 18% of the respondents. Thus, it can be concluded
that 45% respondent spend less than 5% of their income in vegetables buying. The data can be
presented in the following graph.
Figure-4.9Percentage of income spent on vegetables purchased by consumers
If we study above figure, we can see that a majority of consumers who spend less than 5% of
income in purchasing vegetables.
Table-4.6Basic reason to consume vegetables
Less than 10% ofincome
More than 10% ofincome
Respondents
Percentage
82
Particulars Respondents Percentages
Less than 5% if income 90 45
Less than 10% of income 75 37
More than 10% if income 37 18
Total 202 100
(Source: Field Survey)
According to the above table, it can be noticed that most of the consumers spend less than 5%
of their income in vegetables purchasing whereas 90 respondents i.e. 45% said that they spend
less than 5% in vegetables buying. Similarly, 75 or 37% respondents spend less than 10% of
income and at last more than 10% by 37 or 18% of the respondents. Thus, it can be concluded
that 45% respondent spend less than 5% of their income in vegetables buying. The data can be
presented in the following graph.
Figure-4.9Percentage of income spent on vegetables purchased by consumers
If we study above figure, we can see that a majority of consumers who spend less than 5% of
income in purchasing vegetables.
Table-4.6Basic reason to consume vegetables
Respondents
Percentage
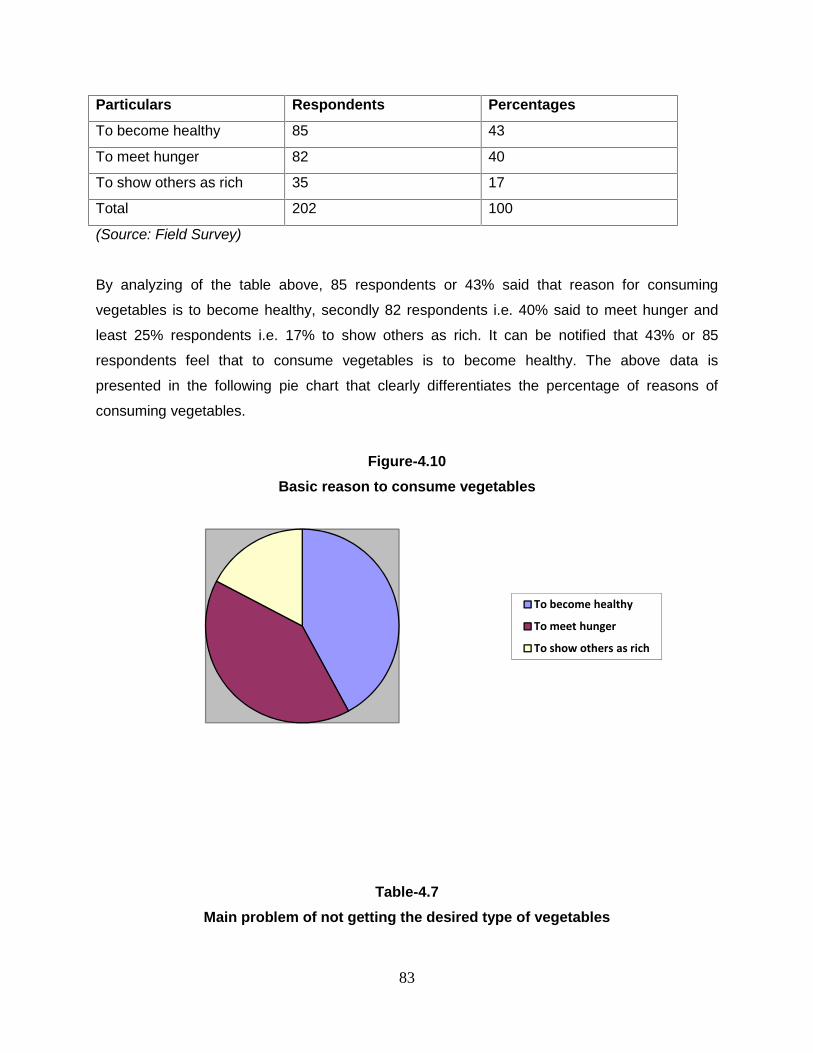
83
Particulars Respondents Percentages
To become healthy 85 43
To meet hunger 82 40
To show others as rich 35 17
Total 202 100
(Source: Field Survey)
By analyzing of the table above, 85 respondents or 43% said that reason for consuming
vegetables is to become healthy, secondly 82 respondents i.e. 40% said to meet hunger and
least 25% respondents i.e. 17% to show others as rich. It can be notified that 43% or 85
respondents feel that to consume vegetables is to become healthy. The above data is
presented in the following pie chart that clearly differentiates the percentage of reasons of
consuming vegetables.
Figure-4.10Basic reason to consume vegetables
Table-4.7Main problem of not getting the desired type of vegetables
To become healthy
To meet hunger
To show others as rich
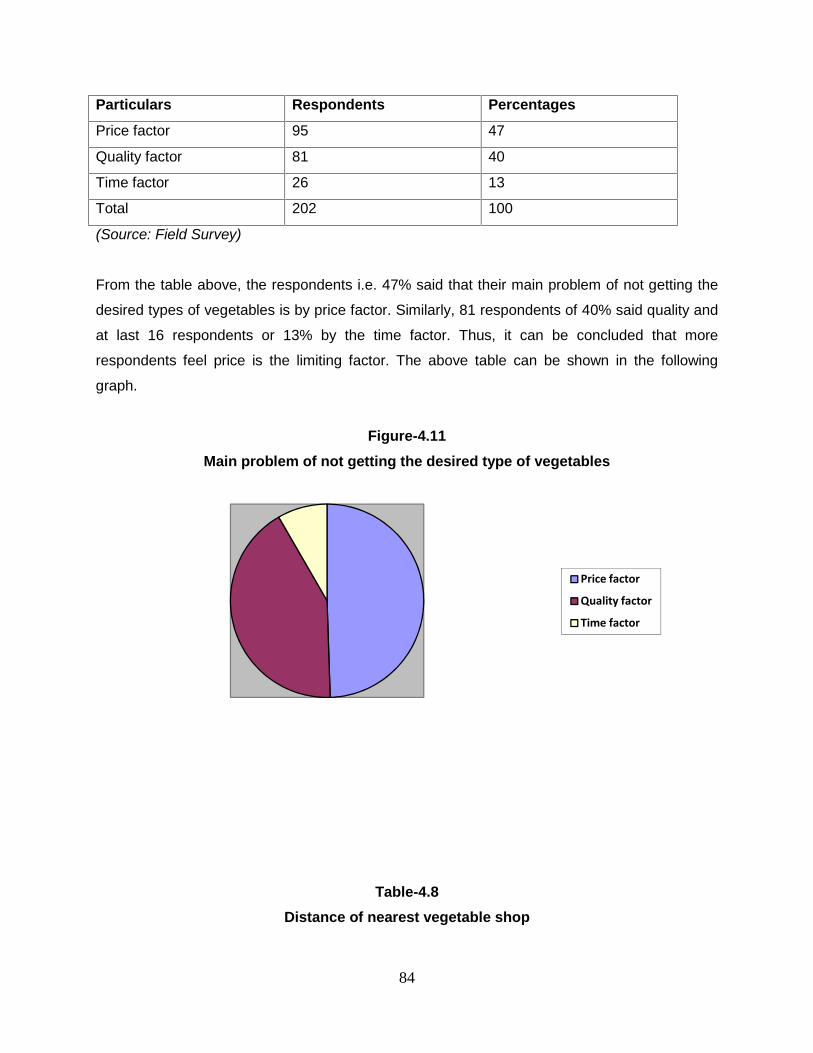
84
Particulars Respondents Percentages
Price factor 95 47
Quality factor 81 40
Time factor 26 13
Total 202 100
(Source: Field Survey)
From the table above, the respondents i.e. 47% said that their main problem of not getting the
desired types of vegetables is by price factor. Similarly, 81 respondents of 40% said quality and
at last 16 respondents or 13% by the time factor. Thus, it can be concluded that more
respondents feel price is the limiting factor. The above table can be shown in the following
graph.
Figure-4.11Main problem of not getting the desired type of vegetables
Table-4.8Distance of nearest vegetable shop
Price factor
Quality factor
Time factor
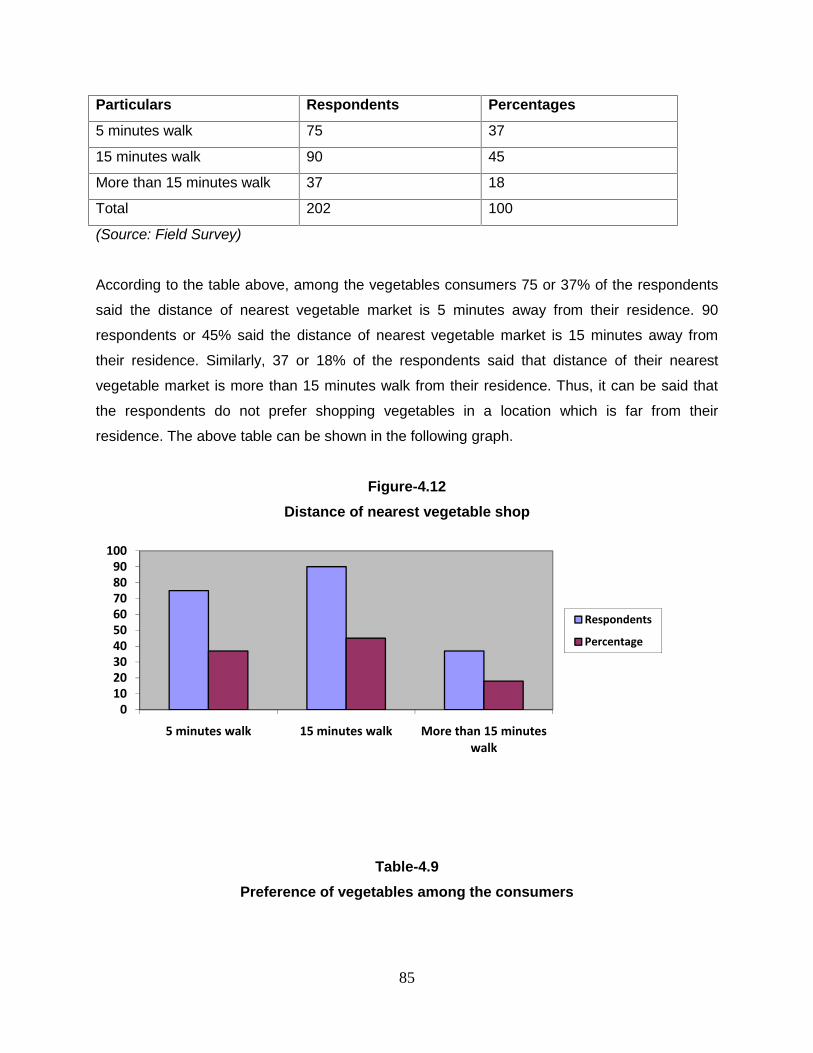
85
Particulars Respondents Percentages
5 minutes walk 75 37
15 minutes walk 90 45
More than 15 minutes walk 37 18
Total 202 100
(Source: Field Survey)
According to the table above, among the vegetables consumers 75 or 37% of the respondents
said the distance of nearest vegetable market is 5 minutes away from their residence. 90
respondents or 45% said the distance of nearest vegetable market is 15 minutes away from
their residence. Similarly, 37 or 18% of the respondents said that distance of their nearest
vegetable market is more than 15 minutes walk from their residence. Thus, it can be said that
the respondents do not prefer shopping vegetables in a location which is far from their
residence. The above table can be shown in the following graph.
Figure-4.12Distance of nearest vegetable shop
Table-4.9Preference of vegetables among the consumers
0102030405060708090
100
5 minutes walk 15 minutes walk More than 15 minuteswalk
Respondents
Percentage
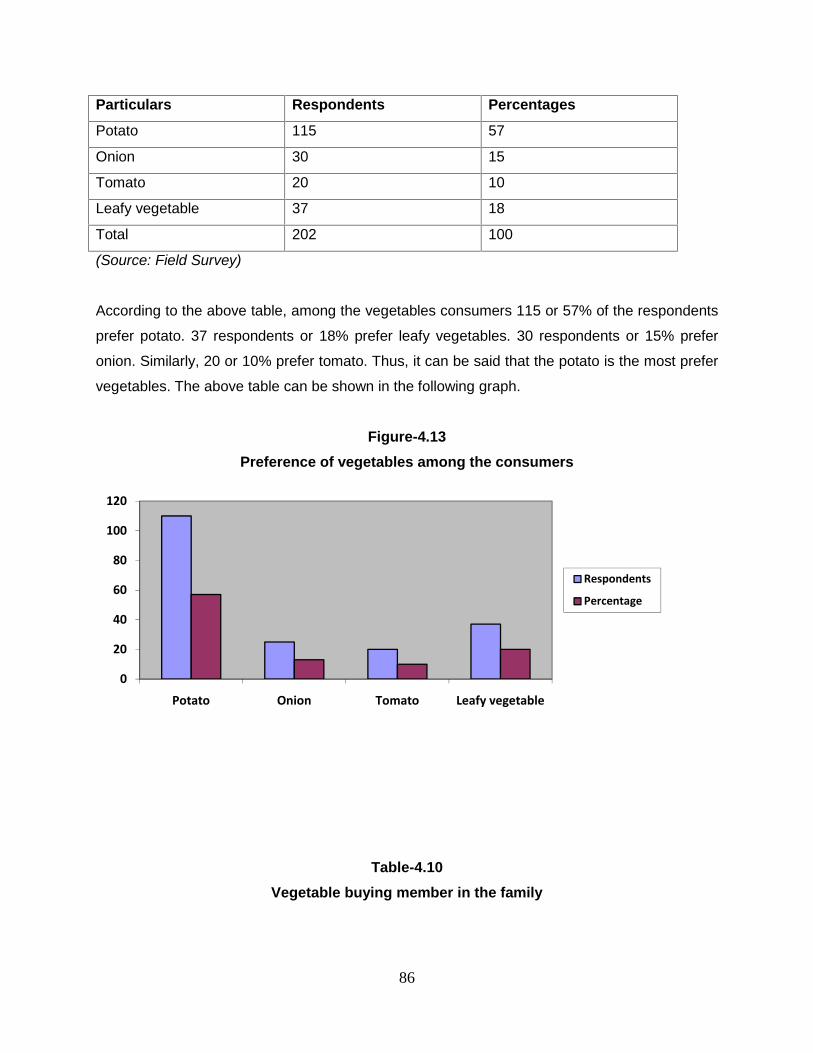
86
Particulars Respondents Percentages
Potato 115 57
Onion 30 15
Tomato 20 10
Leafy vegetable 37 18
Total 202 100
(Source: Field Survey)
According to the above table, among the vegetables consumers 115 or 57% of the respondents
prefer potato. 37 respondents or 18% prefer leafy vegetables. 30 respondents or 15% prefer
onion. Similarly, 20 or 10% prefer tomato. Thus, it can be said that the potato is the most prefer
vegetables. The above table can be shown in the following graph.
Figure-4.13Preference of vegetables among the consumers
Table-4.10Vegetable buying member in the family
0
20
40
60
80
100
120
Potato Onion Tomato Leafy vegetable
Respondents
Percentage
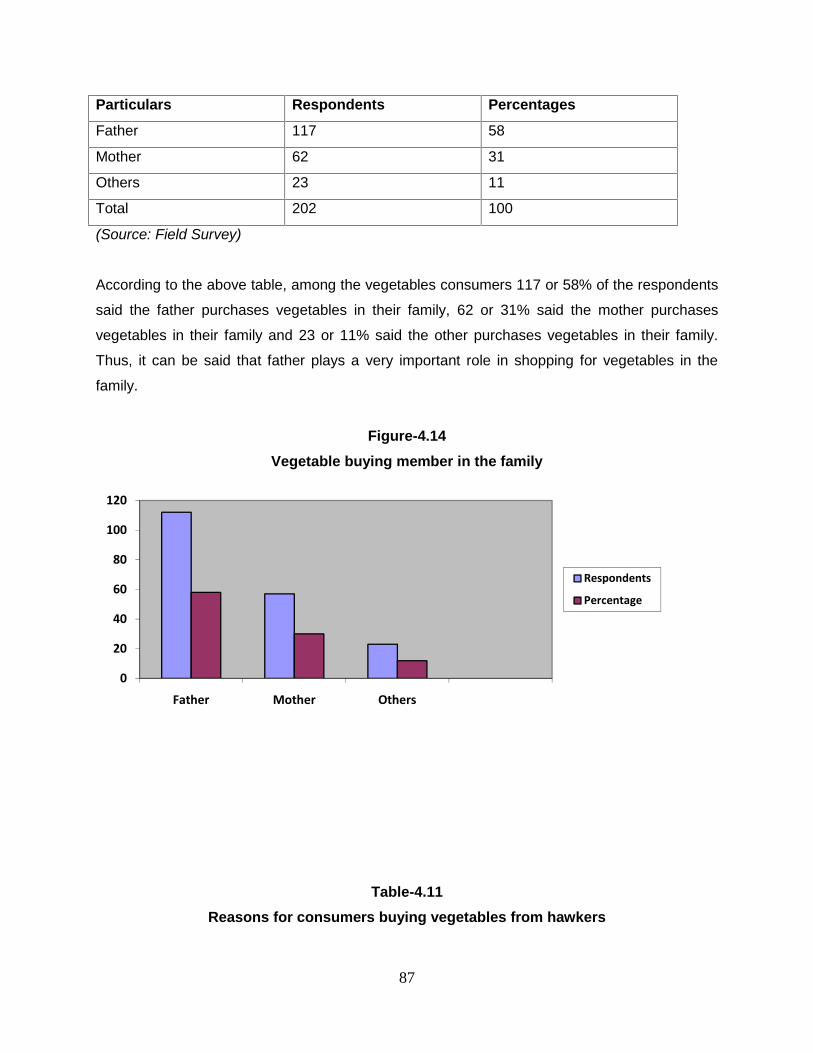
87
Particulars Respondents Percentages
Father 117 58
Mother 62 31
Others 23 11
Total 202 100
(Source: Field Survey)
According to the above table, among the vegetables consumers 117 or 58% of the respondents
said the father purchases vegetables in their family, 62 or 31% said the mother purchases
vegetables in their family and 23 or 11% said the other purchases vegetables in their family.
Thus, it can be said that father plays a very important role in shopping for vegetables in the
family.
Figure-4.14Vegetable buying member in the family
Table-4.11Reasons for consumers buying vegetables from hawkers
0
20
40
60
80
100
120
Father Mother Others
Respondents
Percentage
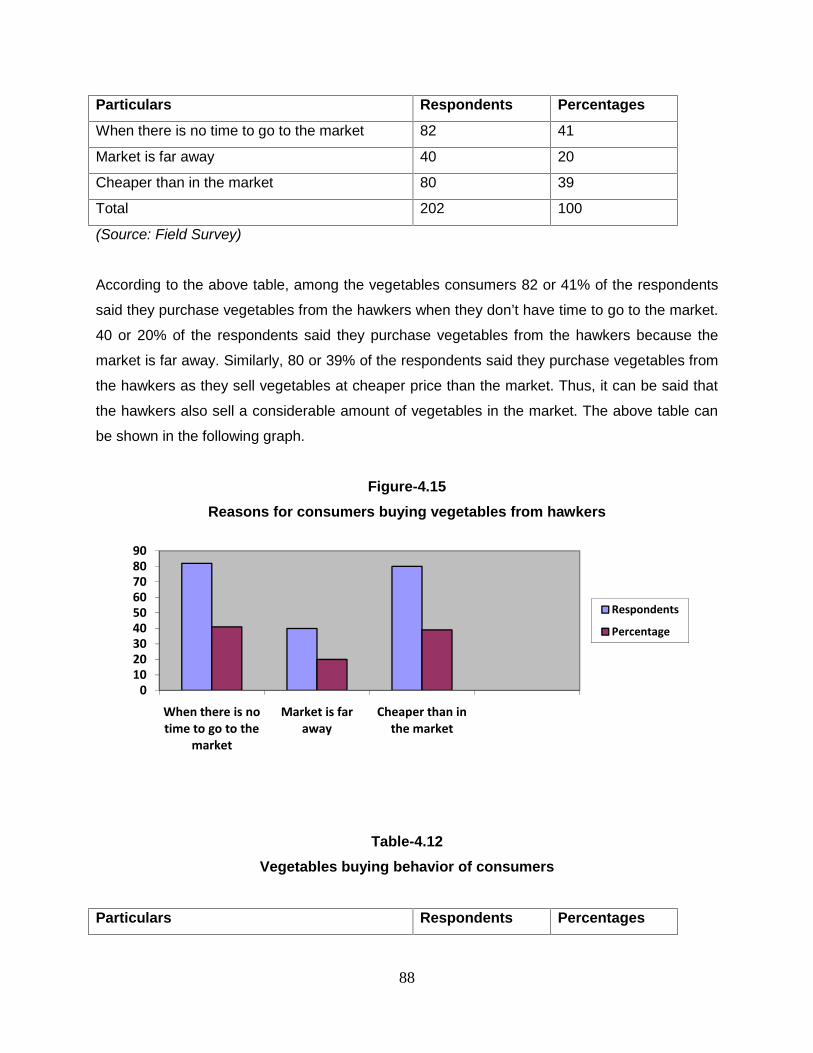
88
Particulars Respondents Percentages
When there is no time to go to the market 82 41
Market is far away 40 20
Cheaper than in the market 80 39
Total 202 100
(Source: Field Survey)
According to the above table, among the vegetables consumers 82 or 41% of the respondents
said they purchase vegetables from the hawkers when they don’t have time to go to the market.
40 or 20% of the respondents said they purchase vegetables from the hawkers because the
market is far away. Similarly, 80 or 39% of the respondents said they purchase vegetables from
the hawkers as they sell vegetables at cheaper price than the market. Thus, it can be said that
the hawkers also sell a considerable amount of vegetables in the market. The above table can
be shown in the following graph.
Figure-4.15Reasons for consumers buying vegetables from hawkers
Table-4.12Vegetables buying behavior of consumers
Particulars Respondents Percentages
0102030405060708090
When there is notime to go to the
market
Market is faraway
Cheaper than inthe market
Respondents
Percentage
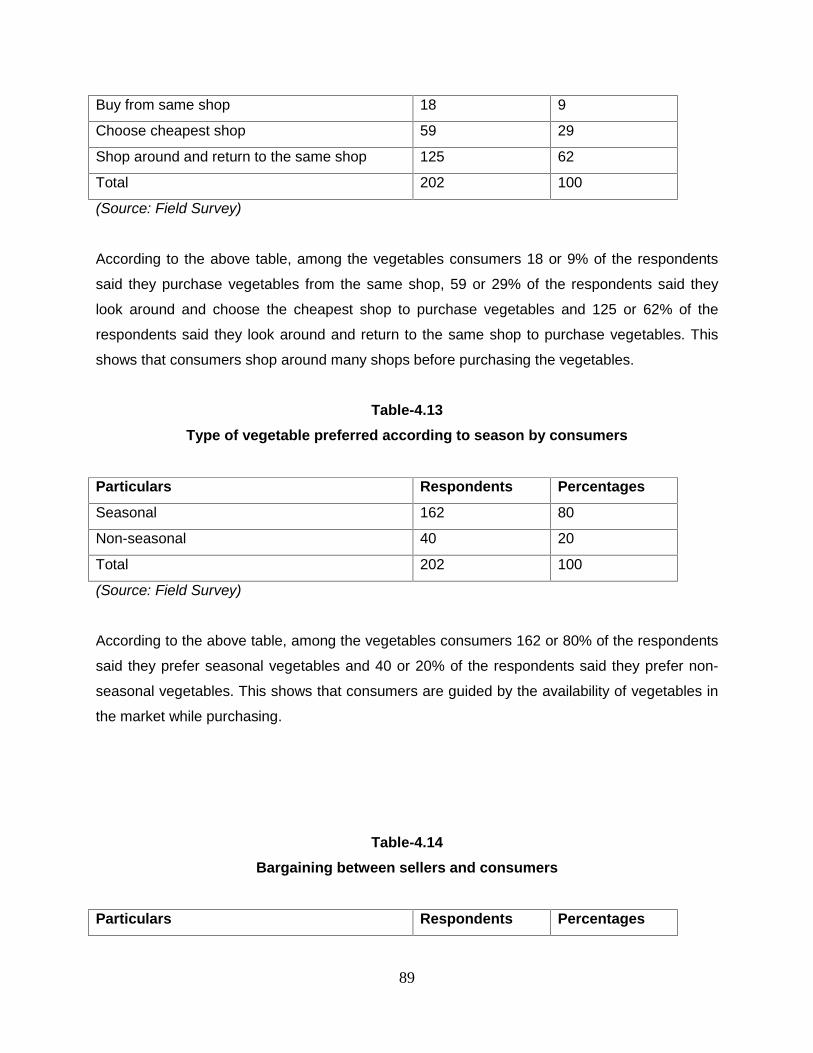
89
Buy from same shop 18 9
Choose cheapest shop 59 29
Shop around and return to the same shop 125 62
Total 202 100
(Source: Field Survey)
According to the above table, among the vegetables consumers 18 or 9% of the respondents
said they purchase vegetables from the same shop, 59 or 29% of the respondents said they
look around and choose the cheapest shop to purchase vegetables and 125 or 62% of the
respondents said they look around and return to the same shop to purchase vegetables. This
shows that consumers shop around many shops before purchasing the vegetables.
Table-4.13Type of vegetable preferred according to season by consumers
Particulars Respondents Percentages
Seasonal 162 80
Non-seasonal 40 20
Total 202 100
(Source: Field Survey)
According to the above table, among the vegetables consumers 162 or 80% of the respondents
said they prefer seasonal vegetables and 40 or 20% of the respondents said they prefer non-
seasonal vegetables. This shows that consumers are guided by the availability of vegetables in
the market while purchasing.
Table-4.14Bargaining between sellers and consumers
Particulars Respondents Percentages
90
Yes 185 91
No 17 9
Total 202 100
(Source: Field Survey)
According to the above table, among the vegetables consumers 185 or 91% of the respondents
said they bargain while buying vegetables, 17 or 9% of the respondents said they don’t bargain
while buying vegetables. This shows that consumers are very sensitive when it comes to price
and most of them make it a point to bargain in order to reduce the price while buying
vegetables.
Table-4.15Satisfaction of consumers in terms of quality of vegetables
Particulars Respondents Percentages
Yes 15 8
No 187 92
Total 202 100
(Source: Field Survey)
According to the above table, among the vegetables consumers 15 or 8% of the respondents
said they are satisfied with the quality of vegetables available in the market while a majority, i.e.
187 or 92% of the respondents said they are not satisfied with the quality. This shows that
consumers are not all satisfied with the quality of vegetables that are available in the market.
Table-4.16Reasons for dissatisfaction of consumers in terms of quality of vegetables
Particulars Respondents Percentages
91
Inconsistent size and taste 60 29
Does not look good 50 25
Both 92 46
Total 202 100
(Source: Field Survey)
According to the above table, among the vegetables consumers 60 or 29% of the respondents
were not satisfied with the quality of vegetables due to inconsistent size and taste of vegetables,
50 or 25% of the respondents said they are not satisfied with the quality due to the look of the
vegetables and 92 or 46% of the respondents said they are not satisfied with the quality due to
the look of the vegetables size, taste and look of the vegetables. This shows that size, taste and
appearance must be appealing to the consumers.
Table-4.17Value for money from vegetables purchased by consumers
Particulars Respondents Percentages
Yes 15 7
No 187 93
Total 202 100
(Source: Field Survey)
According to the above table, out of total 202 respondents, only 15 or 7% of the respondents
said they do get value for money spent on vegetables, 187 or 93% of the respondents said they
do not get value for money spent on vegetables. This shows that consumers are not satisfied
with the amount of money and quality of vegetables available in the market.
Table-4.18Important factor for consumers in a vegetable market
Particulars Respondents Percentages
Parking facility 41 20
92
Cleanliness 36 18
Market has to be near to home 125 62
Total 202 100
(Source: Field Survey)
According to the above table, out of total 202 respondents, 41 or 20% of the respondents said
they think parking facility is the most important factor in vegetable market, 36 or 18% of the
respondents said they think cleanliness is the most important factor in the vegetable market and
125 or 62% of the respondents said they think distance from home is the most important factor
in the vegetable market. This shows that consumers prefer vegetable markets to be near to their
home.
1.1.2 Retailers ResponsesAmong the 100 questionnaire distributed, only 94 answers were obtained, so the respondent
percentage is 94%.
Table-4.19Time of vegetables selling in the market by the vegetables retailers
Particulars Respondents Percentages
Day 8 8
Morning 58 62
Evening 28 30
Total 94 100
(Source: Field Survey)
According to the above table, out of total 94 respondents, 58 or 62% of the respondents sells
vegetables in the morning, 28 or 30% of the respondents sells vegetables in the evening and 8
or 8% of the respondents sells vegetables in the day. The above table can be shown in the
following graph
Figure-4.16Time of vegetables selling in the market by the vegetables retailers
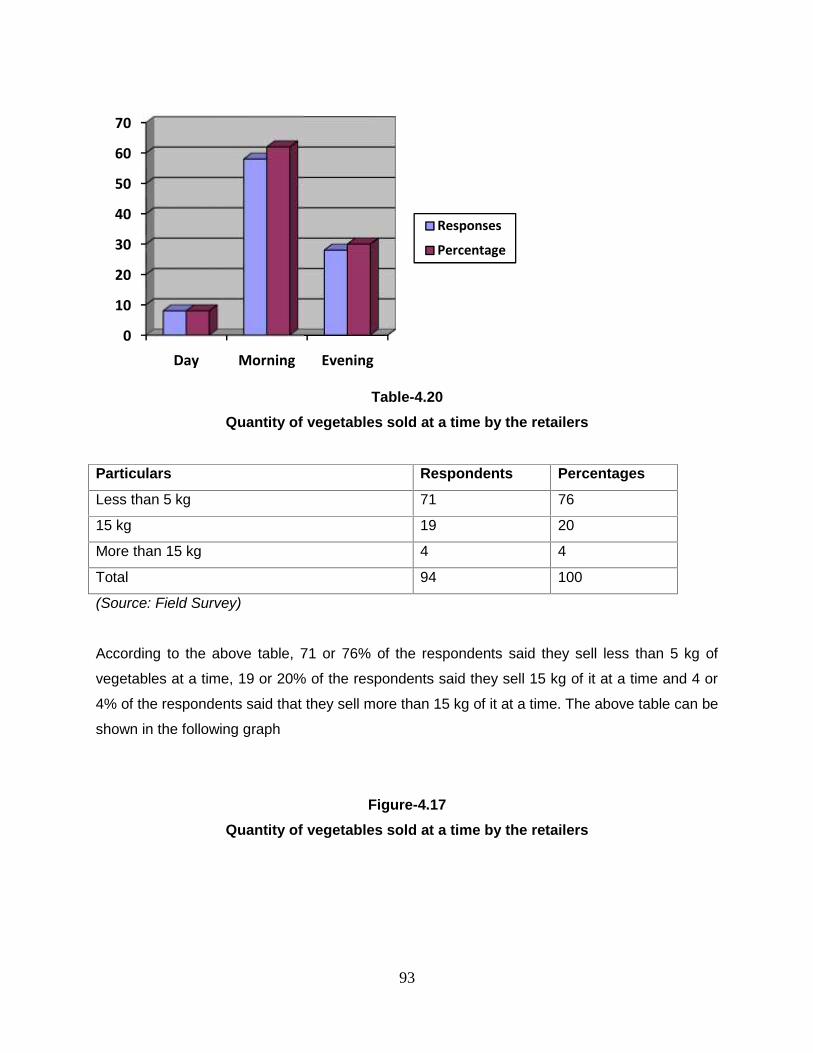
93
Table-4.20Quantity of vegetables sold at a time by the retailers
Particulars Respondents Percentages
Less than 5 kg 71 76
15 kg 19 20
More than 15 kg 4 4
Total 94 100
(Source: Field Survey)
According to the above table, 71 or 76% of the respondents said they sell less than 5 kg of
vegetables at a time, 19 or 20% of the respondents said they sell 15 kg of it at a time and 4 or
4% of the respondents said that they sell more than 15 kg of it at a time. The above table can be
shown in the following graph
Figure-4.17Quantity of vegetables sold at a time by the retailers
0
10
20
30
40
50
60
70
Day Morning
93
Table-4.20Quantity of vegetables sold at a time by the retailers
Particulars Respondents Percentages
Less than 5 kg 71 76
15 kg 19 20
More than 15 kg 4 4
Total 94 100
(Source: Field Survey)
According to the above table, 71 or 76% of the respondents said they sell less than 5 kg of
vegetables at a time, 19 or 20% of the respondents said they sell 15 kg of it at a time and 4 or
4% of the respondents said that they sell more than 15 kg of it at a time. The above table can be
shown in the following graph
Figure-4.17Quantity of vegetables sold at a time by the retailers
Morning Evening
Responses
Percentage
93
Table-4.20Quantity of vegetables sold at a time by the retailers
Particulars Respondents Percentages
Less than 5 kg 71 76
15 kg 19 20
More than 15 kg 4 4
Total 94 100
(Source: Field Survey)
According to the above table, 71 or 76% of the respondents said they sell less than 5 kg of
vegetables at a time, 19 or 20% of the respondents said they sell 15 kg of it at a time and 4 or
4% of the respondents said that they sell more than 15 kg of it at a time. The above table can be
shown in the following graph
Figure-4.17Quantity of vegetables sold at a time by the retailers
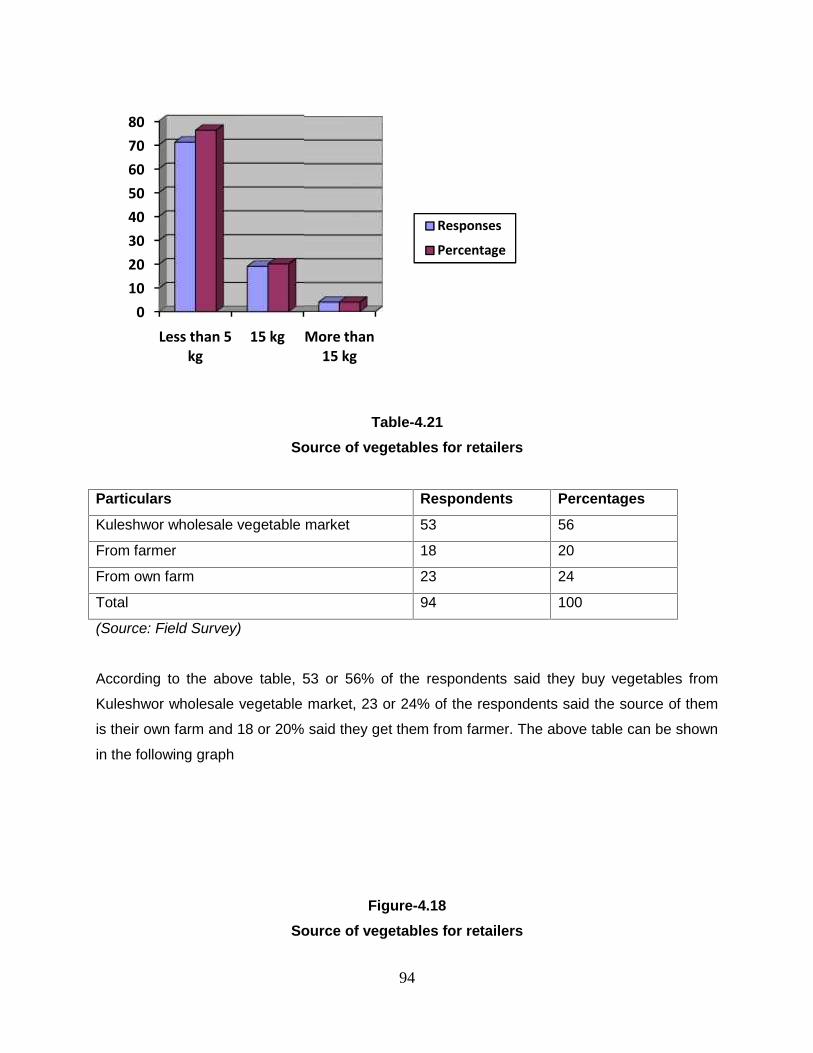
94
Table-4.21Source of vegetables for retailers
Particulars Respondents Percentages
Kuleshwor wholesale vegetable market 53 56
From farmer 18 20
From own farm 23 24
Total 94 100
(Source: Field Survey)
According to the above table, 53 or 56% of the respondents said they buy vegetables from
Kuleshwor wholesale vegetable market, 23 or 24% of the respondents said the source of them
is their own farm and 18 or 20% said they get them from farmer. The above table can be shown
in the following graph
Figure-4.18Source of vegetables for retailers
01020304050607080
Less than 5kg
15 kg More than15 kg
94
Table-4.21Source of vegetables for retailers
Particulars Respondents Percentages
Kuleshwor wholesale vegetable market 53 56
From farmer 18 20
From own farm 23 24
Total 94 100
(Source: Field Survey)
According to the above table, 53 or 56% of the respondents said they buy vegetables from
Kuleshwor wholesale vegetable market, 23 or 24% of the respondents said the source of them
is their own farm and 18 or 20% said they get them from farmer. The above table can be shown
in the following graph
Figure-4.18Source of vegetables for retailers
More than15 kg
Responses
Percentage
94
Table-4.21Source of vegetables for retailers
Particulars Respondents Percentages
Kuleshwor wholesale vegetable market 53 56
From farmer 18 20
From own farm 23 24
Total 94 100
(Source: Field Survey)
According to the above table, 53 or 56% of the respondents said they buy vegetables from
Kuleshwor wholesale vegetable market, 23 or 24% of the respondents said the source of them
is their own farm and 18 or 20% said they get them from farmer. The above table can be shown
in the following graph
Figure-4.18Source of vegetables for retailers
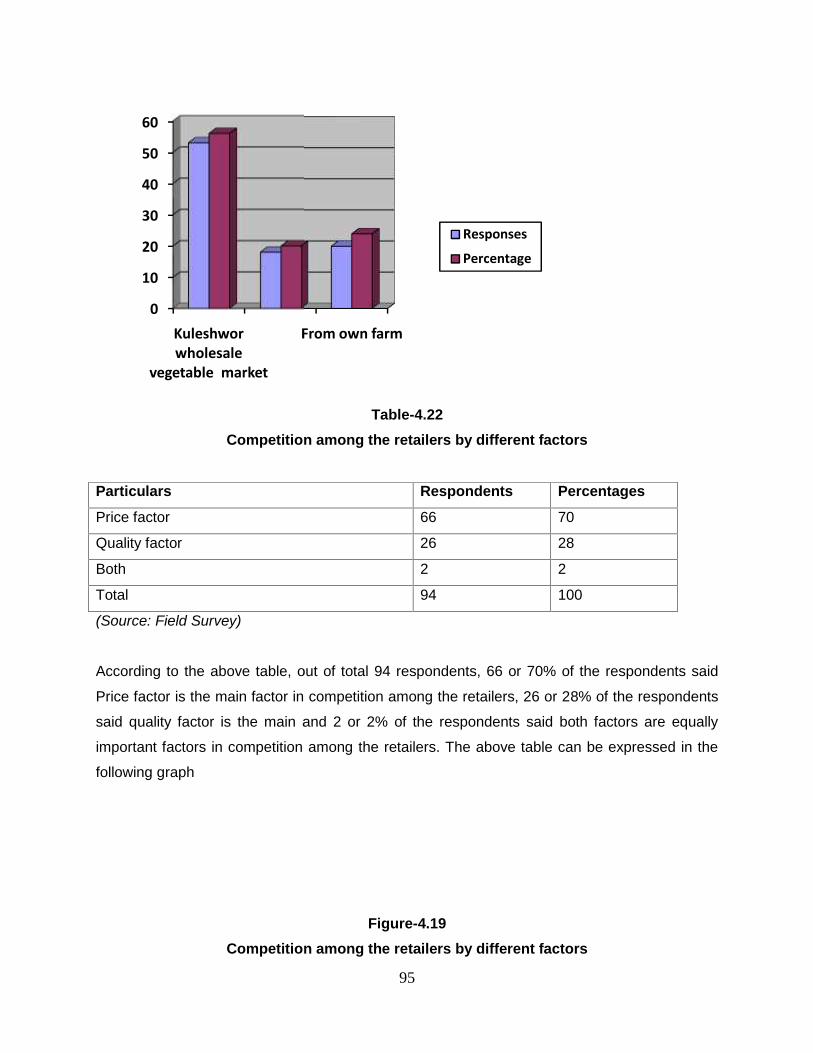
95
Table-4.22Competition among the retailers by different factors
Particulars Respondents Percentages
Price factor 66 70
Quality factor 26 28
Both 2 2
Total 94 100
(Source: Field Survey)
According to the above table, out of total 94 respondents, 66 or 70% of the respondents said
Price factor is the main factor in competition among the retailers, 26 or 28% of the respondents
said quality factor is the main and 2 or 2% of the respondents said both factors are equally
important factors in competition among the retailers. The above table can be expressed in the
following graph
Figure-4.19Competition among the retailers by different factors
0
10
20
30
40
50
60
Kuleshworwholesale
vegetable market
From own farm
95
Table-4.22Competition among the retailers by different factors
Particulars Respondents Percentages
Price factor 66 70
Quality factor 26 28
Both 2 2
Total 94 100
(Source: Field Survey)
According to the above table, out of total 94 respondents, 66 or 70% of the respondents said
Price factor is the main factor in competition among the retailers, 26 or 28% of the respondents
said quality factor is the main and 2 or 2% of the respondents said both factors are equally
important factors in competition among the retailers. The above table can be expressed in the
following graph
Figure-4.19Competition among the retailers by different factors
From own farm
Responses
Percentage
95
Table-4.22Competition among the retailers by different factors
Particulars Respondents Percentages
Price factor 66 70
Quality factor 26 28
Both 2 2
Total 94 100
(Source: Field Survey)
According to the above table, out of total 94 respondents, 66 or 70% of the respondents said
Price factor is the main factor in competition among the retailers, 26 or 28% of the respondents
said quality factor is the main and 2 or 2% of the respondents said both factors are equally
important factors in competition among the retailers. The above table can be expressed in the
following graph
Figure-4.19Competition among the retailers by different factors
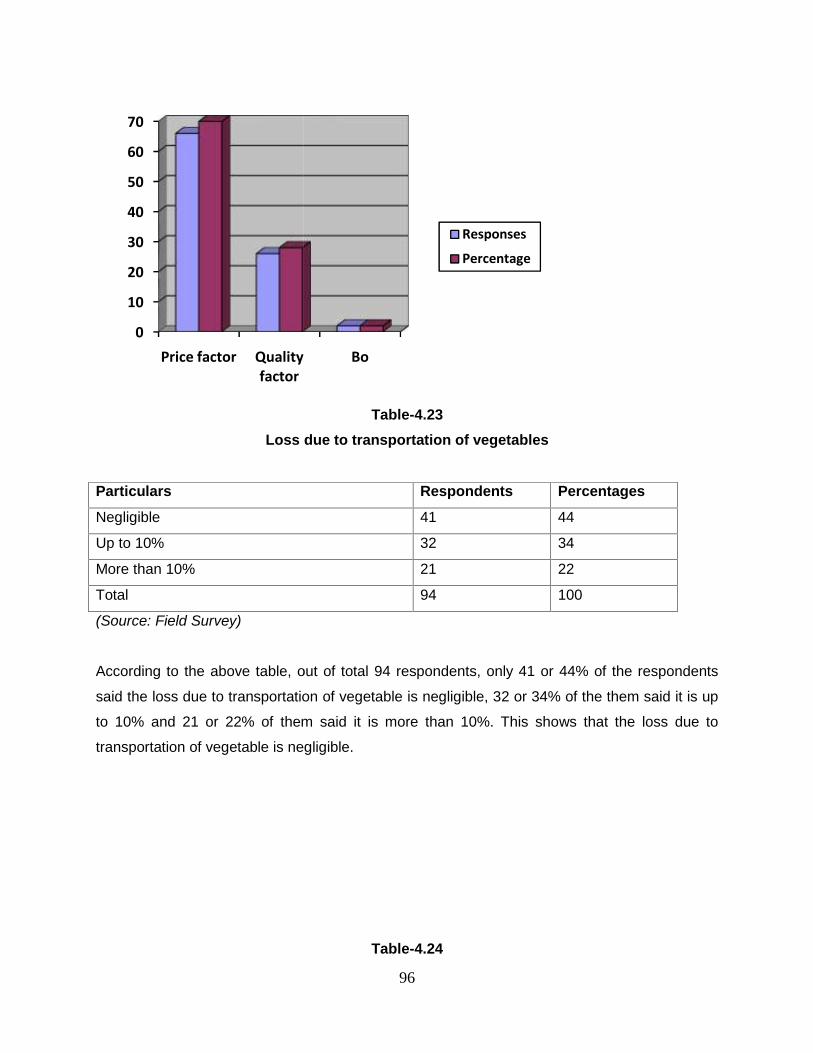
96
Table-4.23Loss due to transportation of vegetables
Particulars Respondents Percentages
Negligible 41 44
Up to 10% 32 34
More than 10% 21 22
Total 94 100
(Source: Field Survey)
According to the above table, out of total 94 respondents, only 41 or 44% of the respondents
said the loss due to transportation of vegetable is negligible, 32 or 34% of the them said it is up
to 10% and 21 or 22% of them said it is more than 10%. This shows that the loss due to
transportation of vegetable is negligible.
Table-4.24
0
10
20
30
40
50
60
70
Price factor Qualityfactor
96
Table-4.23Loss due to transportation of vegetables
Particulars Respondents Percentages
Negligible 41 44
Up to 10% 32 34
More than 10% 21 22
Total 94 100
(Source: Field Survey)
According to the above table, out of total 94 respondents, only 41 or 44% of the respondents
said the loss due to transportation of vegetable is negligible, 32 or 34% of the them said it is up
to 10% and 21 or 22% of them said it is more than 10%. This shows that the loss due to
transportation of vegetable is negligible.
Table-4.24
Qualityfactor
Bo
Responses
Percentage
96
Table-4.23Loss due to transportation of vegetables
Particulars Respondents Percentages
Negligible 41 44
Up to 10% 32 34
More than 10% 21 22
Total 94 100
(Source: Field Survey)
According to the above table, out of total 94 respondents, only 41 or 44% of the respondents
said the loss due to transportation of vegetable is negligible, 32 or 34% of the them said it is up
to 10% and 21 or 22% of them said it is more than 10%. This shows that the loss due to
transportation of vegetable is negligible.
Table-4.24
97
Size of family of Retailers
Particulars Respondents Percentages
2-4 20 21
4-6 43 46
6 and above 31 33
Total 94 100
(Source: Field Survey)
According to the above table, out of total 94 respondents, 43 or 46% of the respondents said the
size of family is from 4-6, 31 or 33% of the respondents said their size of the family is 6 or above
and 20 or 21% of them said they have the size of family is from 2-4. This shows that there is the
majority of size from 4-6 in a retailer’s family.
Table-4.25Secondary income of the retailers
Particulars Respondents Percentages
Yes 76 80
No 18 20
Total 94 100
(Source: Field Survey)
According to the above table, out of total 94 respondents, 76 or 80% of the respondents said
they have other ancillary profession and 18 or 20% of the respondents said they do not have
other profession. This shows that most of the retailers also have a secondary source of income
besides selling vegetables. The above table can be shown in the following figure.
Figure-4.20Secondary income of the retailers

98
Table-4.26Basic problems of retailers
Particulars Respondents Percentages
Lack of regular supply of vegetables 11 12
Vegetables destruction 52 55
Problem of cold store 31 33
Total 94 100
(Source: Field Survey)
According to the above table, out of total 94 respondents, 11 or 12% of the respondents said the
basic problem was lack of regular supply of vegetables, 52 or 55% of the respondents said that
their basic problem was vegetables during destruction during transportation and storage. 31 or
33% of the respondents said that their basic problem was problem of cold storage. The above
table can be shown in the following graph.
Figure-4.21Basic problems of retailers
Yes
No
98
Table-4.26Basic problems of retailers
Particulars Respondents Percentages
Lack of regular supply of vegetables 11 12
Vegetables destruction 52 55
Problem of cold store 31 33
Total 94 100
(Source: Field Survey)
According to the above table, out of total 94 respondents, 11 or 12% of the respondents said the
basic problem was lack of regular supply of vegetables, 52 or 55% of the respondents said that
their basic problem was vegetables during destruction during transportation and storage. 31 or
33% of the respondents said that their basic problem was problem of cold storage. The above
table can be shown in the following graph.
Figure-4.21Basic problems of retailers
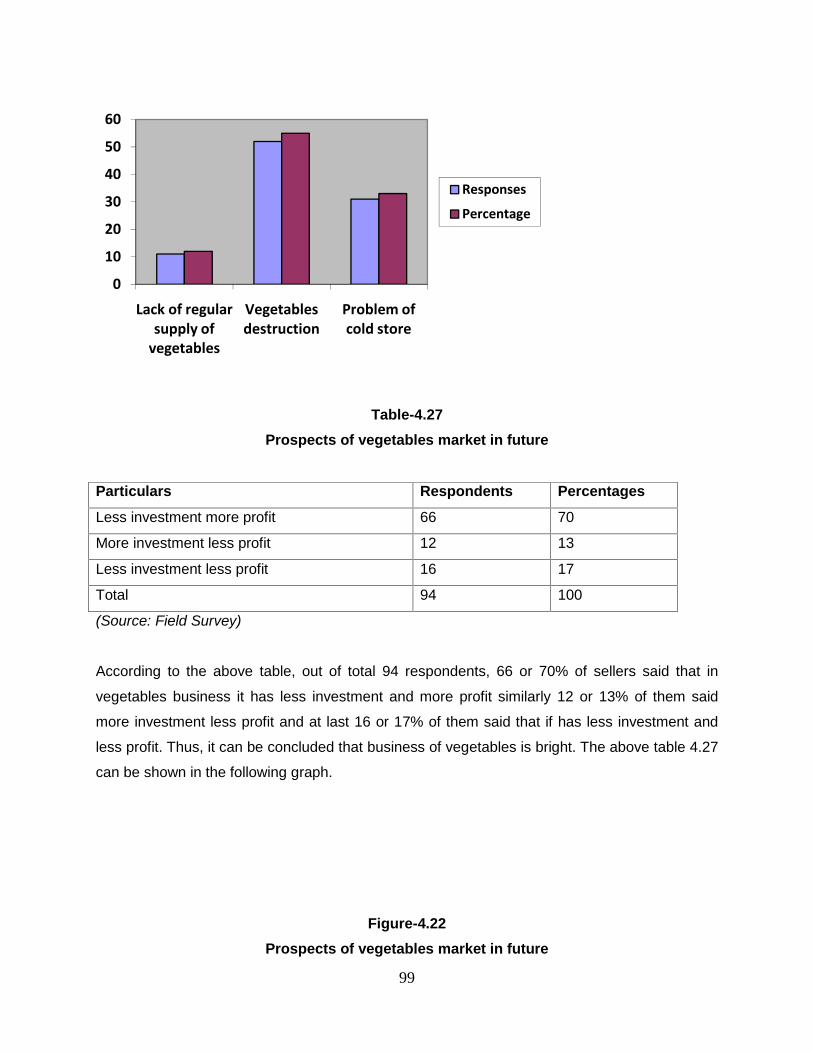
99
Table-4.27Prospects of vegetables market in future
Particulars Respondents Percentages
Less investment more profit 66 70
More investment less profit 12 13
Less investment less profit 16 17
Total 94 100
(Source: Field Survey)
According to the above table, out of total 94 respondents, 66 or 70% of sellers said that in
vegetables business it has less investment and more profit similarly 12 or 13% of them said
more investment less profit and at last 16 or 17% of them said that if has less investment and
less profit. Thus, it can be concluded that business of vegetables is bright. The above table 4.27
can be shown in the following graph.
Figure-4.22Prospects of vegetables market in future
0
10
20
30
40
50
60
Lack of regularsupply of
vegetables
Vegetablesdestruction
Problem ofcold store
Responses
Percentage
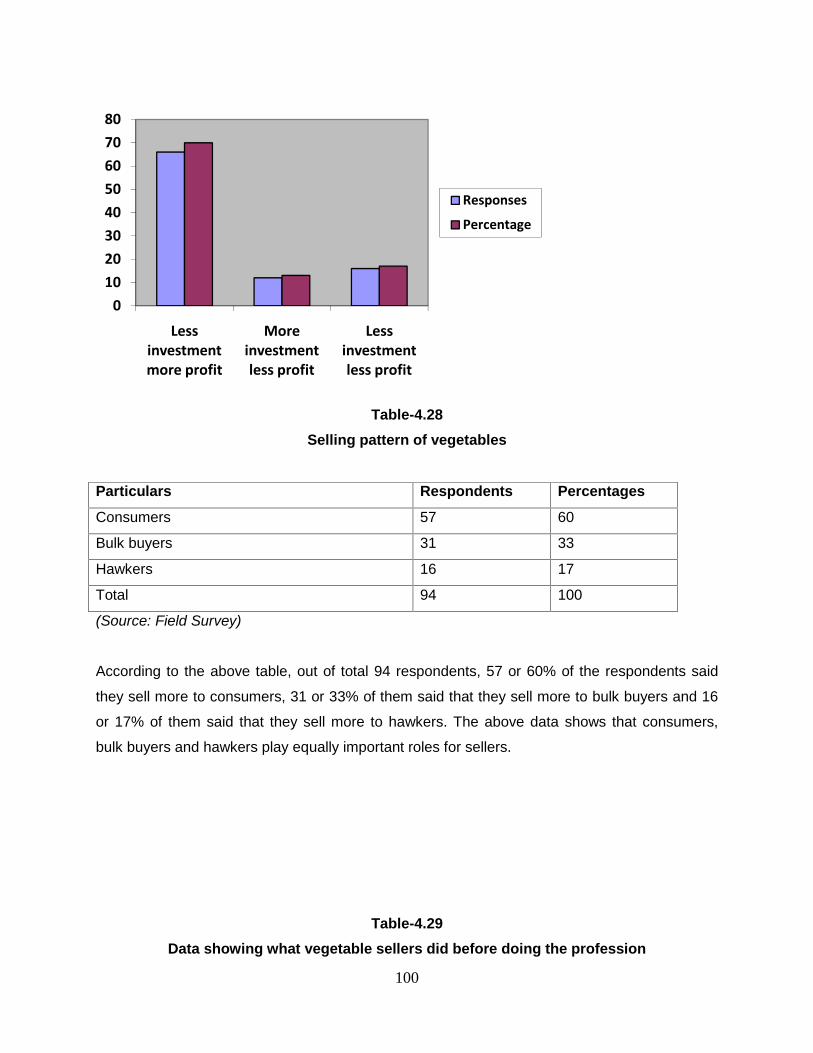
100
Table-4.28Selling pattern of vegetables
Particulars Respondents Percentages
Consumers 57 60
Bulk buyers 31 33
Hawkers 16 17
Total 94 100
(Source: Field Survey)
According to the above table, out of total 94 respondents, 57 or 60% of the respondents said
they sell more to consumers, 31 or 33% of them said that they sell more to bulk buyers and 16
or 17% of them said that they sell more to hawkers. The above data shows that consumers,
bulk buyers and hawkers play equally important roles for sellers.
Table-4.29Data showing what vegetable sellers did before doing the profession
01020304050607080
Lessinvestmentmore profit
Moreinvestmentless profit
Lessinvestmentless profit
Responses
Percentage
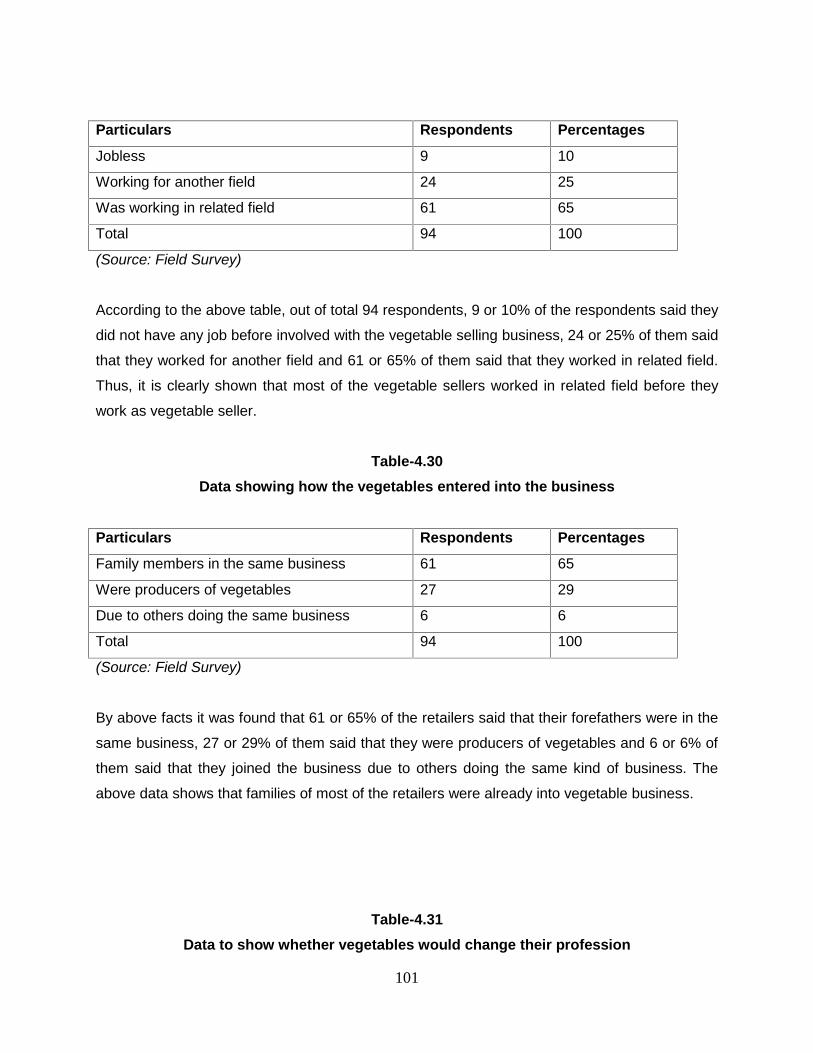
101
Particulars Respondents Percentages
Jobless 9 10
Working for another field 24 25
Was working in related field 61 65
Total 94 100
(Source: Field Survey)
According to the above table, out of total 94 respondents, 9 or 10% of the respondents said they
did not have any job before involved with the vegetable selling business, 24 or 25% of them said
that they worked for another field and 61 or 65% of them said that they worked in related field.
Thus, it is clearly shown that most of the vegetable sellers worked in related field before they
work as vegetable seller.
Table-4.30Data showing how the vegetables entered into the business
Particulars Respondents Percentages
Family members in the same business 61 65
Were producers of vegetables 27 29
Due to others doing the same business 6 6
Total 94 100
(Source: Field Survey)
By above facts it was found that 61 or 65% of the retailers said that their forefathers were in the
same business, 27 or 29% of them said that they were producers of vegetables and 6 or 6% of
them said that they joined the business due to others doing the same kind of business. The
above data shows that families of most of the retailers were already into vegetable business.
Table-4.31Data to show whether vegetables would change their profession
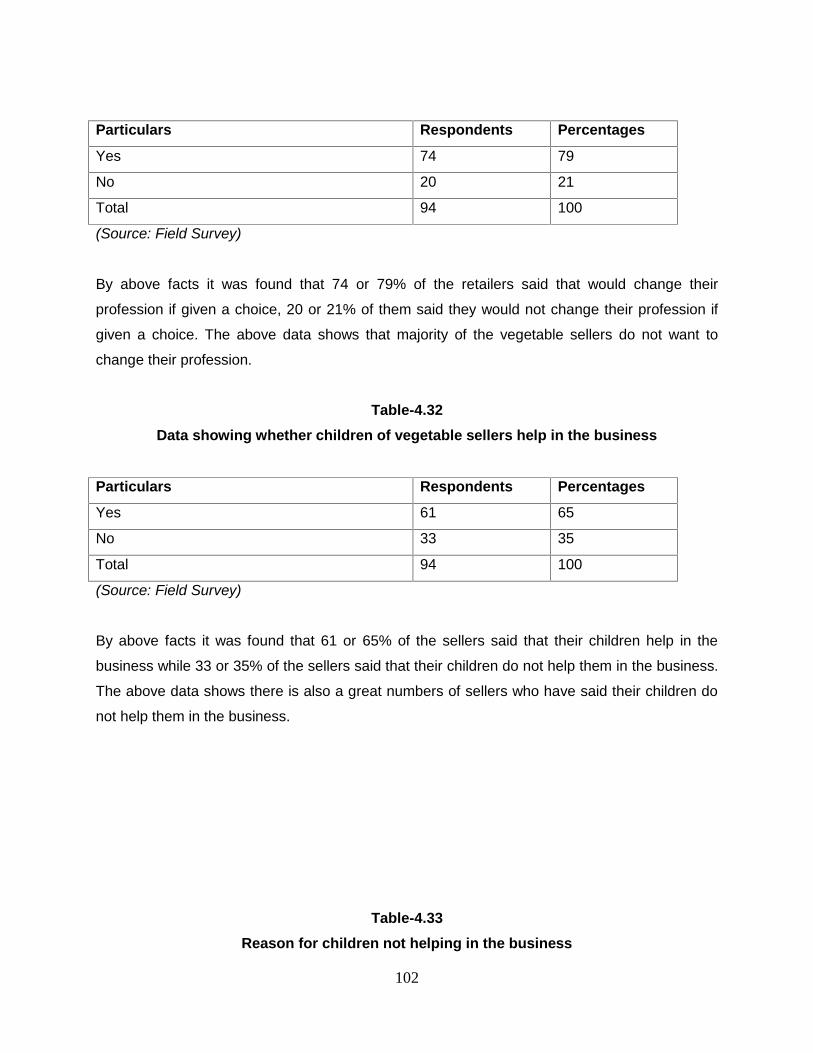
102
Particulars Respondents Percentages
Yes 74 79
No 20 21
Total 94 100
(Source: Field Survey)
By above facts it was found that 74 or 79% of the retailers said that would change their
profession if given a choice, 20 or 21% of them said they would not change their profession if
given a choice. The above data shows that majority of the vegetable sellers do not want to
change their profession.
Table-4.32Data showing whether children of vegetable sellers help in the business
Particulars Respondents Percentages
Yes 61 65
No 33 35
Total 94 100
(Source: Field Survey)
By above facts it was found that 61 or 65% of the sellers said that their children help in the
business while 33 or 35% of the sellers said that their children do not help them in the business.
The above data shows there is also a great numbers of sellers who have said their children do
not help them in the business.
Table-4.33Reason for children not helping in the business
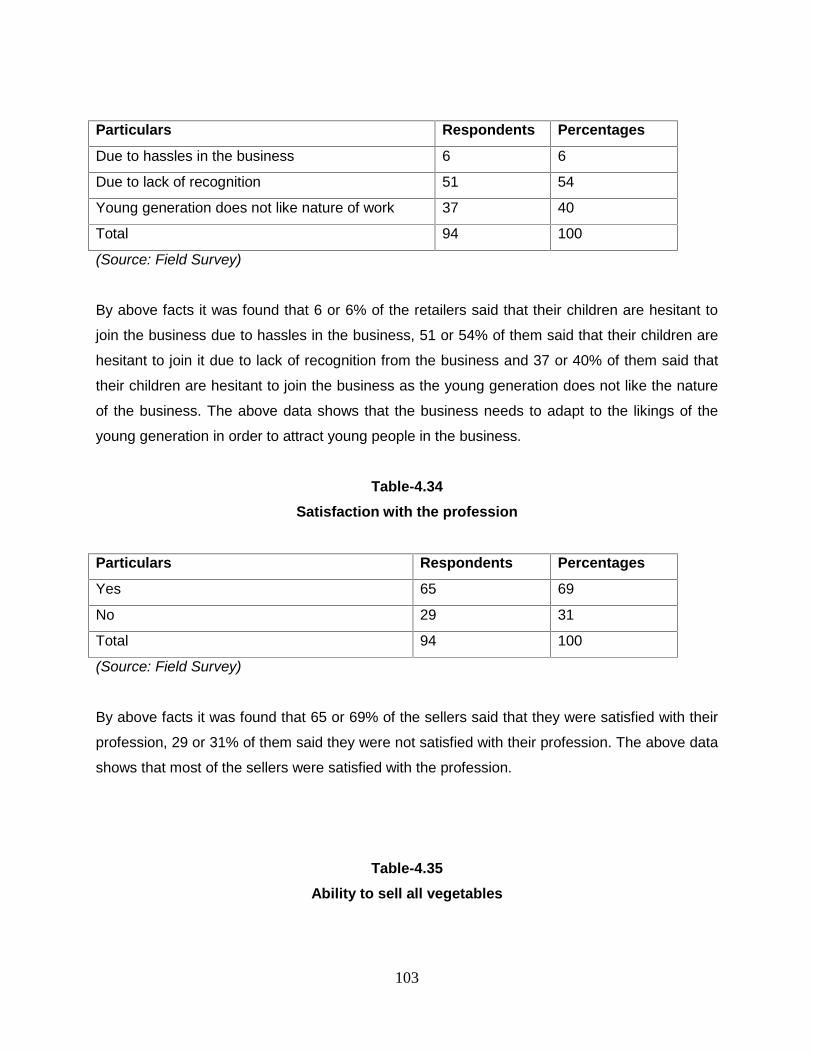
103
Particulars Respondents Percentages
Due to hassles in the business 6 6
Due to lack of recognition 51 54
Young generation does not like nature of work 37 40
Total 94 100
(Source: Field Survey)
By above facts it was found that 6 or 6% of the retailers said that their children are hesitant to
join the business due to hassles in the business, 51 or 54% of them said that their children are
hesitant to join it due to lack of recognition from the business and 37 or 40% of them said that
their children are hesitant to join the business as the young generation does not like the nature
of the business. The above data shows that the business needs to adapt to the likings of the
young generation in order to attract young people in the business.
Table-4.34Satisfaction with the profession
Particulars Respondents Percentages
Yes 65 69
No 29 31
Total 94 100
(Source: Field Survey)
By above facts it was found that 65 or 69% of the sellers said that they were satisfied with their
profession, 29 or 31% of them said they were not satisfied with their profession. The above data
shows that most of the sellers were satisfied with the profession.
Table-4.35Ability to sell all vegetables
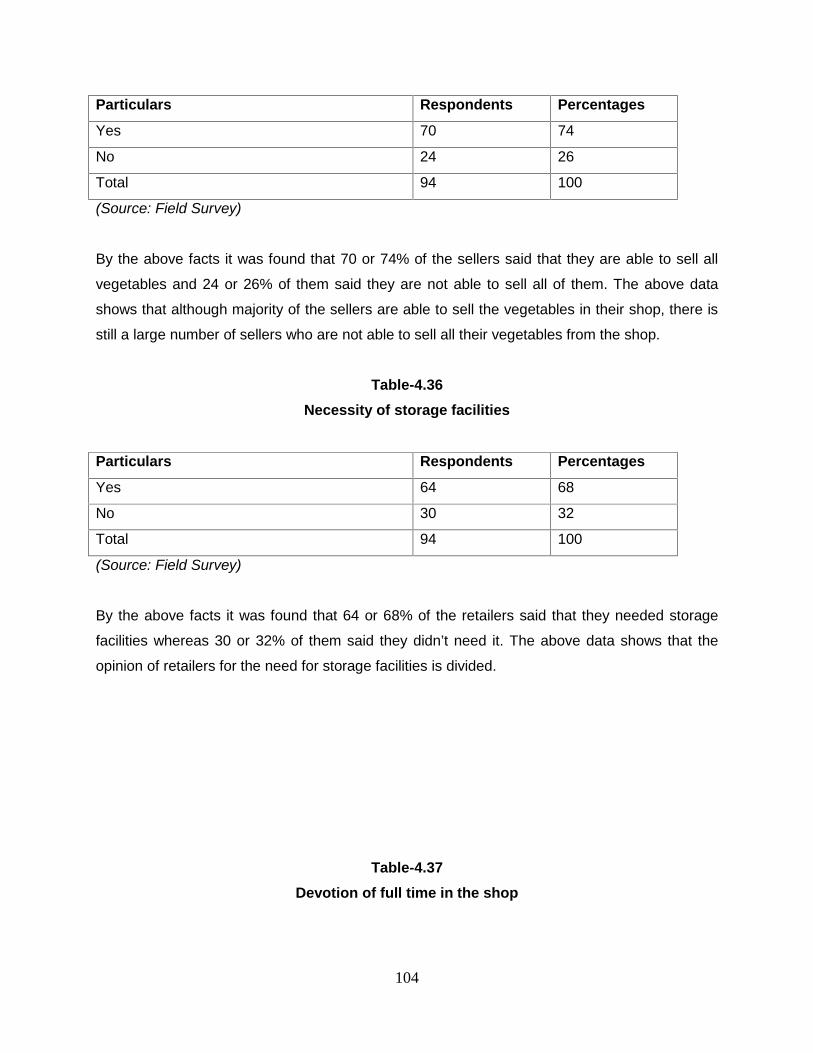
104
Particulars Respondents Percentages
Yes 70 74
No 24 26
Total 94 100
(Source: Field Survey)
By the above facts it was found that 70 or 74% of the sellers said that they are able to sell all
vegetables and 24 or 26% of them said they are not able to sell all of them. The above data
shows that although majority of the sellers are able to sell the vegetables in their shop, there is
still a large number of sellers who are not able to sell all their vegetables from the shop.
Table-4.36Necessity of storage facilities
Particulars Respondents Percentages
Yes 64 68
No 30 32
Total 94 100
(Source: Field Survey)
By the above facts it was found that 64 or 68% of the retailers said that they needed storage
facilities whereas 30 or 32% of them said they didn’t need it. The above data shows that the
opinion of retailers for the need for storage facilities is divided.
Table-4.37Devotion of full time in the shop

105
Particulars Respondents Percentages
Yes 67 71
No 27 29
Total 94 100
(Source: Field Survey)
By the above facts it was found that 67 or 71% of the retailers said that they devote their full
time in business whereas 27 or 29% of the respondents said they don’t devote their full time in
business. So it shows majority of people involved in vegetable business devote their full time in
business.
Table-4.38Important role in the sector of vegetables in the view of retailers
Particulars Respondents Percentages
Producers 57 60
Retailers 28 30
Consumers 9 10
Total 94 100
(Source: Field Survey)
By the above facts it was found that 57 or 60% of the sellers said that producers play the most
important role in the business whereas 28 or 30% of them said retailers play the most important
role in the business and 9 or 10% of them said the consumers play the most important role in
the business. The above data shows that the role of producers played in the vegetables
business is very important in the view of vegetable sellers.
1.1.3 Test of Hypothesis
Hypothesis 1:
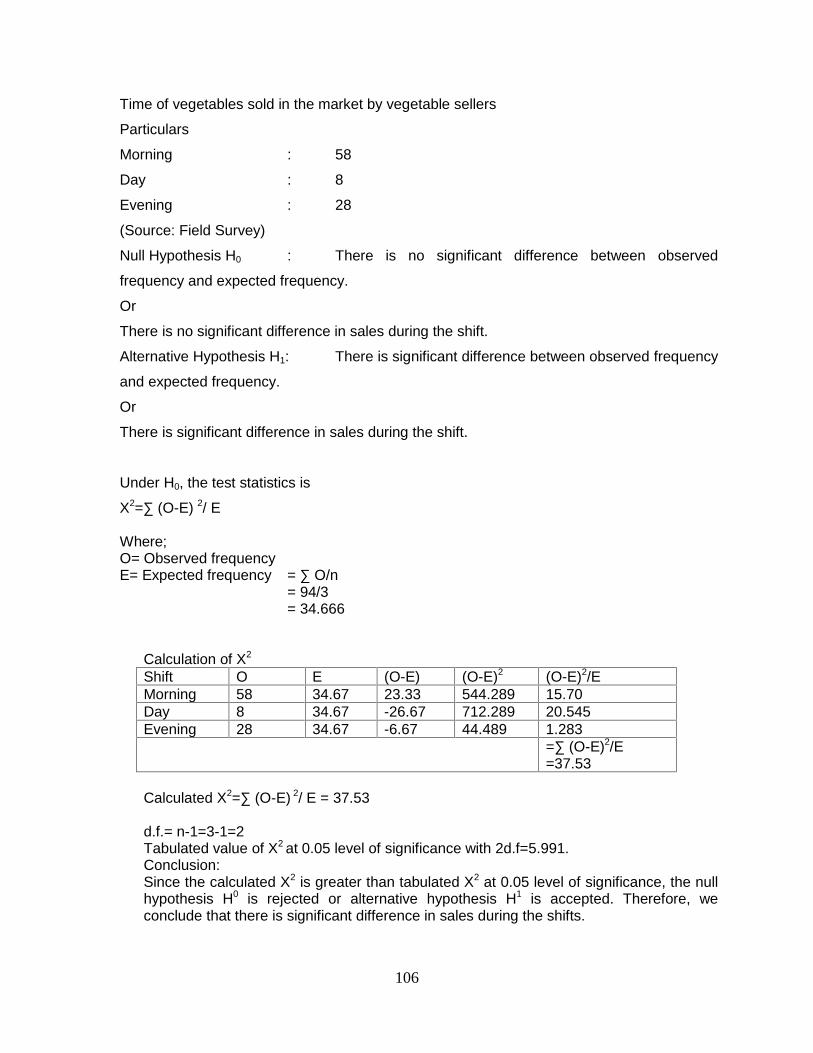
106
Time of vegetables sold in the market by vegetable sellers
Particulars
Morning : 58
Day : 8
Evening : 28
(Source: Field Survey)
Null Hypothesis H0 : There is no significant difference between observed
frequency and expected frequency.
Or
There is no significant difference in sales during the shift.
Alternative Hypothesis H1: There is significant difference between observed frequency
and expected frequency.
Or
There is significant difference in sales during the shift.
Under H0, the test statistics is
Χ2=∑ (O-E) 2/ E
Where;O= Observed frequencyE= Expected frequency = ∑ O/n
= 94/3= 34.666
Calculation of Χ2
Shift O E (O-E) (O-E)2 (O-E)2/EMorning 58 34.67 23.33 544.289 15.70Day 8 34.67 -26.67 712.289 20.545Evening 28 34.67 -6.67 44.489 1.283
=∑ (O-E)2/E=37.53
Calculated Χ2=∑ (O-E) 2/ E = 37.53
d.f.= n-1=3-1=2Tabulated value of X2 at 0.05 level of significance with 2d.f=5.991.Conclusion:Since the calculated X2 is greater than tabulated X2 at 0.05 level of significance, the nullhypothesis H0 is rejected or alternative hypothesis H1 is accepted. Therefore, weconclude that there is significant difference in sales during the shifts.
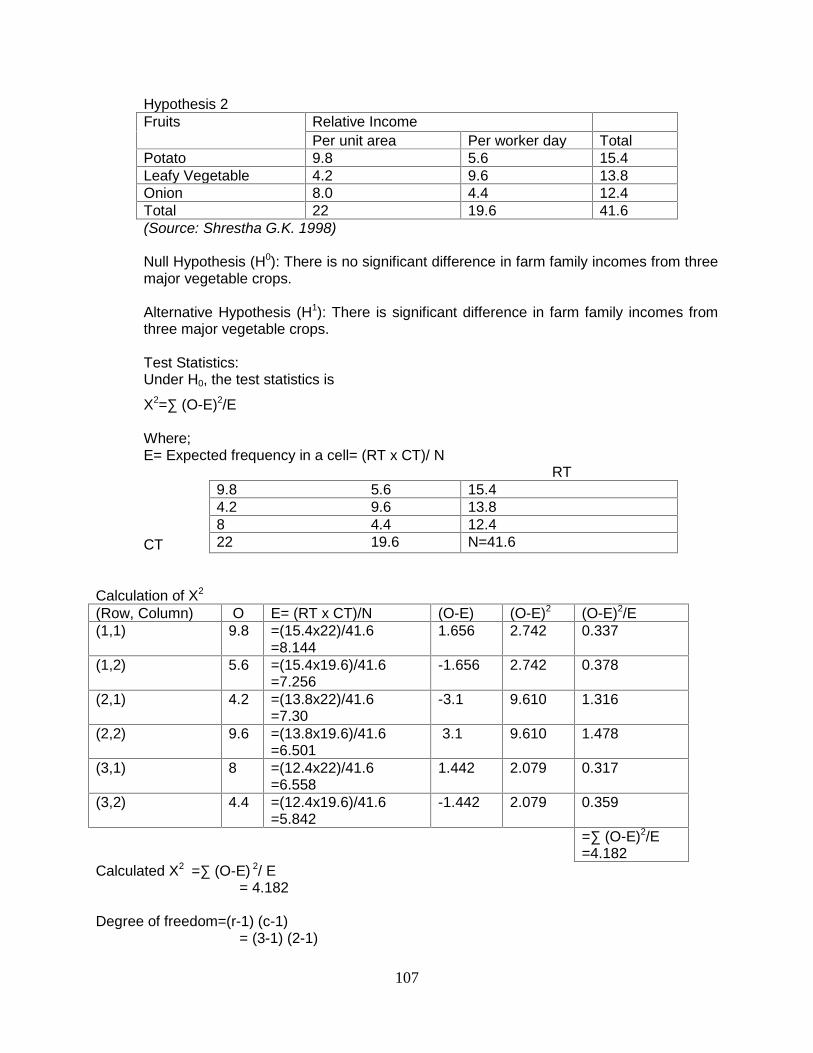
107
Hypothesis 2Fruits Relative Income
Per unit area Per worker day TotalPotato 9.8 5.6 15.4Leafy Vegetable 4.2 9.6 13.8Onion 8.0 4.4 12.4Total 22 19.6 41.6(Source: Shrestha G.K. 1998)
Null Hypothesis (H0): There is no significant difference in farm family incomes from threemajor vegetable crops.
Alternative Hypothesis (H1): There is significant difference in farm family incomes fromthree major vegetable crops.
Test Statistics:Under H0, the test statistics is
Χ2=∑ (O-E)2/E
Where;E= Expected frequency in a cell= (RT x CT)/ N
RT
CT
9.8 5.6 15.44.2 9.6 13.88 4.4 12.422 19.6 N=41.6
Calculation of X2
(Row, Column) O E= (RT x CT)/N (O-E) (O-E)2 (O-E)2/E(1,1) 9.8 =(15.4x22)/41.6
=8.1441.656 2.742 0.337
(1,2) 5.6 =(15.4x19.6)/41.6=7.256
-1.656 2.742 0.378
(2,1) 4.2 =(13.8x22)/41.6=7.30
-3.1 9.610 1.316
(2,2) 9.6 =(13.8x19.6)/41.6=6.501
3.1 9.610 1.478
(3,1) 8 =(12.4x22)/41.6=6.558
1.442 2.079 0.317
(3,2) 4.4 =(12.4x19.6)/41.6=5.842
-1.442 2.079 0.359
=∑ (O-E)2/E=4.182
Calculated Χ2 =∑ (O-E) 2/ E= 4.182
Degree of freedom=(r-1) (c-1)= (3-1) (2-1)
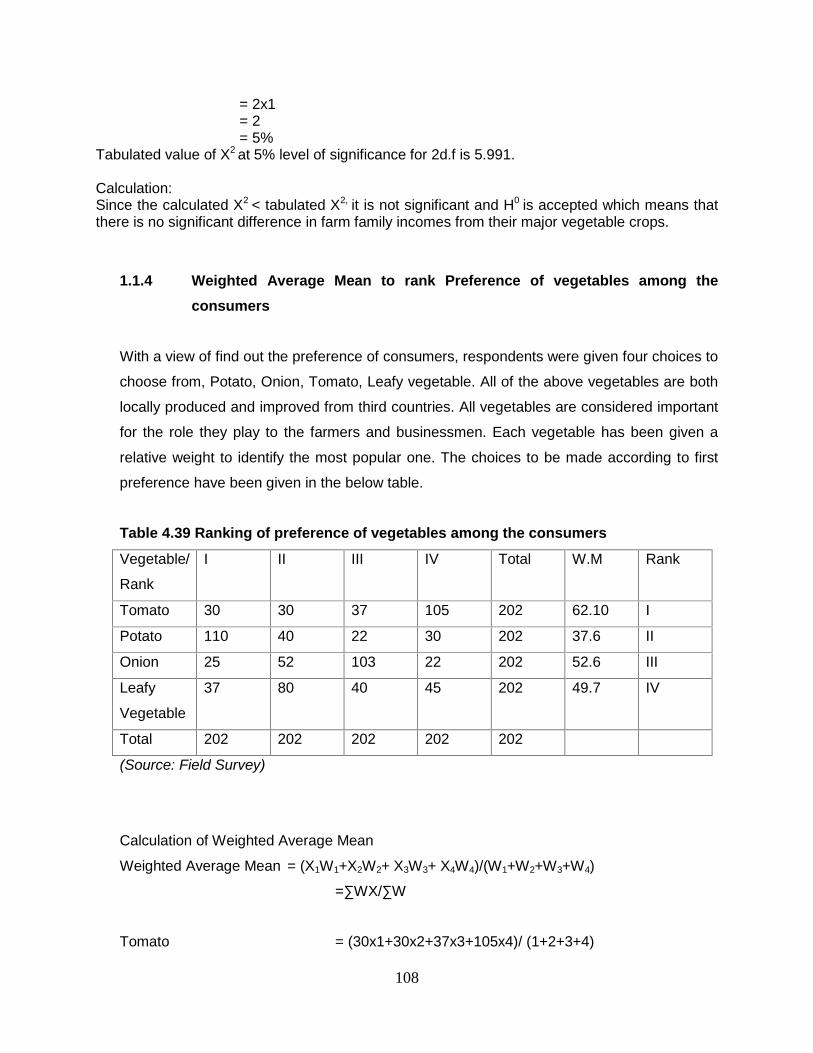
108
= 2x1= 2= 5%
Tabulated value of X2 at 5% level of significance for 2d.f is 5.991.
Calculation:Since the calculated X2 < tabulated X2, it is not significant and H0 is accepted which means thatthere is no significant difference in farm family incomes from their major vegetable crops.
1.1.4 Weighted Average Mean to rank Preference of vegetables among theconsumers
With a view of find out the preference of consumers, respondents were given four choices to
choose from, Potato, Onion, Tomato, Leafy vegetable. All of the above vegetables are both
locally produced and improved from third countries. All vegetables are considered important
for the role they play to the farmers and businessmen. Each vegetable has been given a
relative weight to identify the most popular one. The choices to be made according to first
preference have been given in the below table.
Table 4.39 Ranking of preference of vegetables among the consumers
Vegetable/
Rank
I II III IV Total W.M Rank
Tomato 30 30 37 105 202 62.10 I
Potato 110 40 22 30 202 37.6 II
Onion 25 52 103 22 202 52.6 III
Leafy
Vegetable
37 80 40 45 202 49.7 IV
Total 202 202 202 202 202
(Source: Field Survey)
Calculation of Weighted Average Mean
Weighted Average Mean = (X1W1+X2W2+ X3W3+ X4W4)/(W1+W2+W3+W4)
=∑WX/∑W
Tomato = (30x1+30x2+37x3+105x4)/ (1+2+3+4)

109
=62.10
Potato = (110x1+40x2+22x3+30x4)/ (1+2+3+4)
=37.6
Onion = (25x1+52x2+103x3+22x4)/ (1+2+3+4)
= 52.6
Leafy vegetable = (37x1+80x2+40x3+45x4)/ (1+2+3+4)
= 49.7
The table shows that among 202 respondents, 110 respondents’ first choice was Potato.
Similarly, 37 said leafy vegetables, 30 said onion and 30 said tomato.
Again, among the same 202 respondents, for the second important category, 80
respondents’ choice was leafy vegetables followed by 52 respondents whose choice as
onions and 30 respondent’s choice was potatoes and 40 respondents have a choice as
tomatoes.
Again, for the third most important choice among the 202 respondents, the first choice of
103 respondents was onions followed by 50 leafy vegetables, 37 tomatoes and 22 potatoes.
For the fourth most important choice among the 202 respondents, 105 respondents said
they preferred tomatoes, followed by 45 leafy vegetable, 30 potatoes and 22 onions. The
data is presented in the chart below.
Figure No. 4.23 Preference of Vegetables
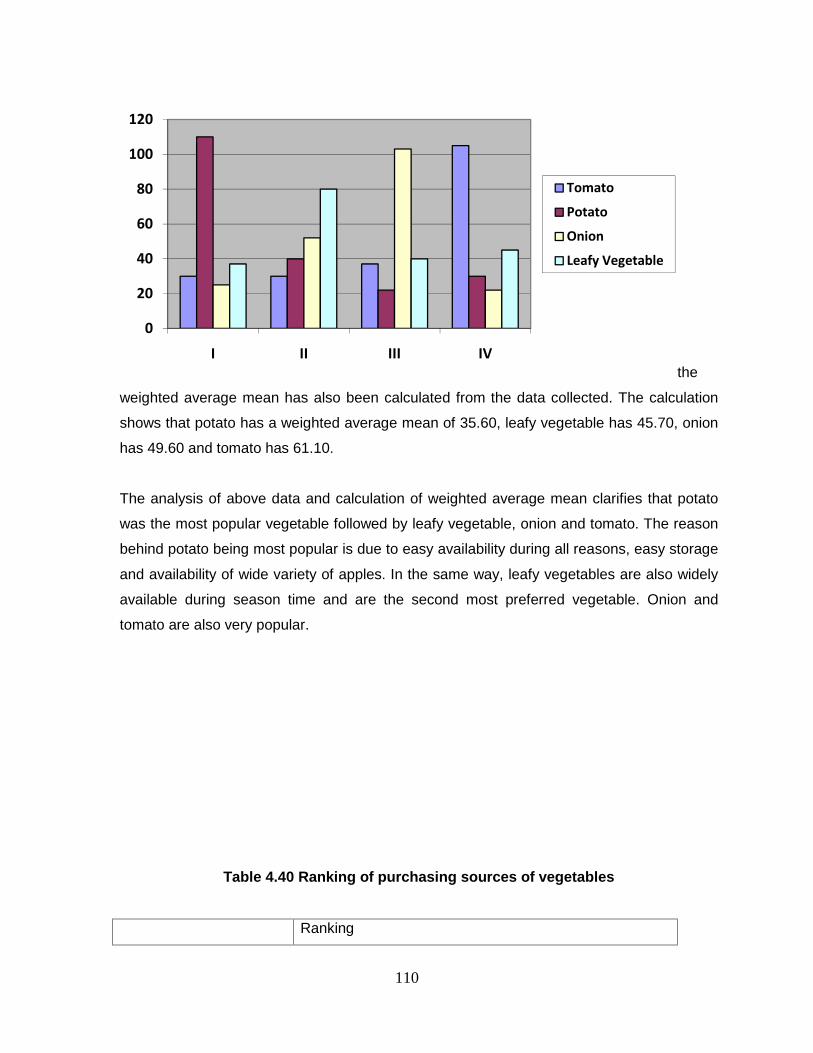
110
the
weighted average mean has also been calculated from the data collected. The calculation
shows that potato has a weighted average mean of 35.60, leafy vegetable has 45.70, onion
has 49.60 and tomato has 61.10.
The analysis of above data and calculation of weighted average mean clarifies that potato
was the most popular vegetable followed by leafy vegetable, onion and tomato. The reason
behind potato being most popular is due to easy availability during all reasons, easy storage
and availability of wide variety of apples. In the same way, leafy vegetables are also widely
available during season time and are the second most preferred vegetable. Onion and
tomato are also very popular.
Table 4.40 Ranking of purchasing sources of vegetables
Ranking
0
20
40
60
80
100
120
I II III IV
Tomato
Potato
Onion
Leafy Vegetable
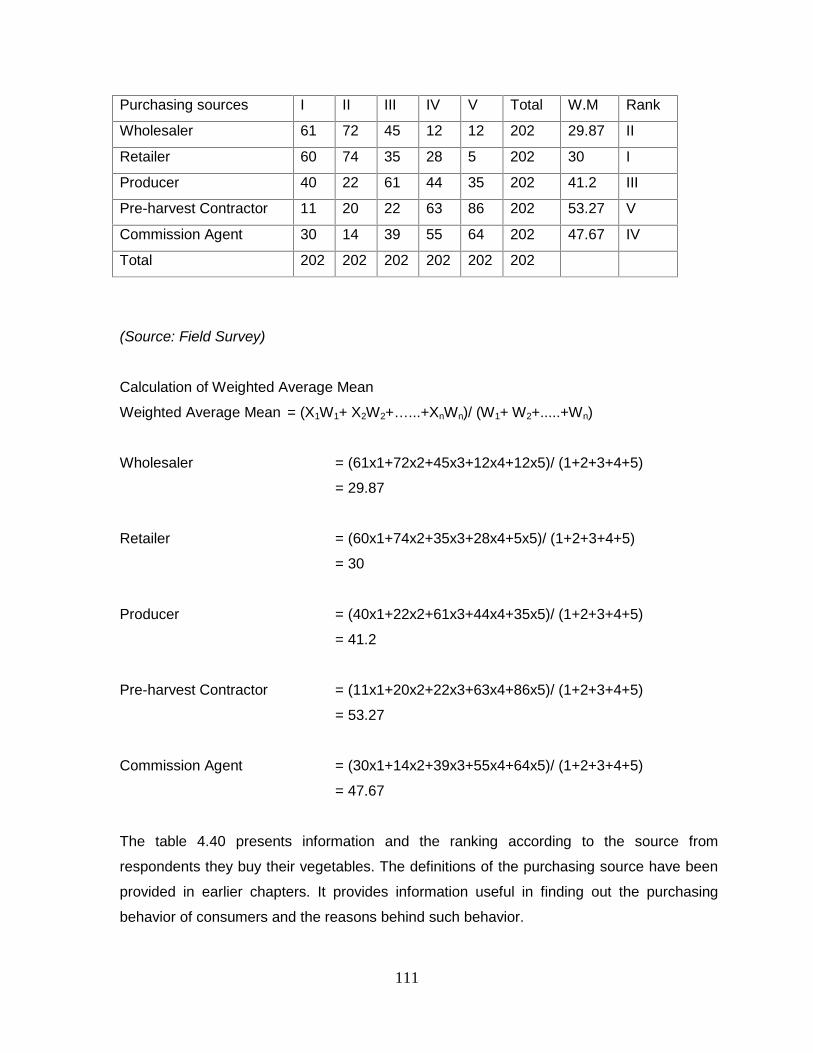
111
Purchasing sources I II III IV V Total W.M Rank
Wholesaler 61 72 45 12 12 202 29.87 II
Retailer 60 74 35 28 5 202 30 I
Producer 40 22 61 44 35 202 41.2 III
Pre-harvest Contractor 11 20 22 63 86 202 53.27 V
Commission Agent 30 14 39 55 64 202 47.67 IV
Total 202 202 202 202 202 202
(Source: Field Survey)
Calculation of Weighted Average Mean
Weighted Average Mean = (X1W1+ X2W2+…...+XnWn)/ (W1+ W2+.....+Wn)
Wholesaler = (61x1+72x2+45x3+12x4+12x5)/ (1+2+3+4+5)
= 29.87
Retailer = (60x1+74x2+35x3+28x4+5x5)/ (1+2+3+4+5)
= 30
Producer = (40x1+22x2+61x3+44x4+35x5)/ (1+2+3+4+5)
= 41.2
Pre-harvest Contractor = (11x1+20x2+22x3+63x4+86x5)/ (1+2+3+4+5)
= 53.27
Commission Agent = (30x1+14x2+39x3+55x4+64x5)/ (1+2+3+4+5)
= 47.67
The table 4.40 presents information and the ranking according to the source from
respondents they buy their vegetables. The definitions of the purchasing source have been
provided in earlier chapters. It provides information useful in finding out the purchasing
behavior of consumers and the reasons behind such behavior.
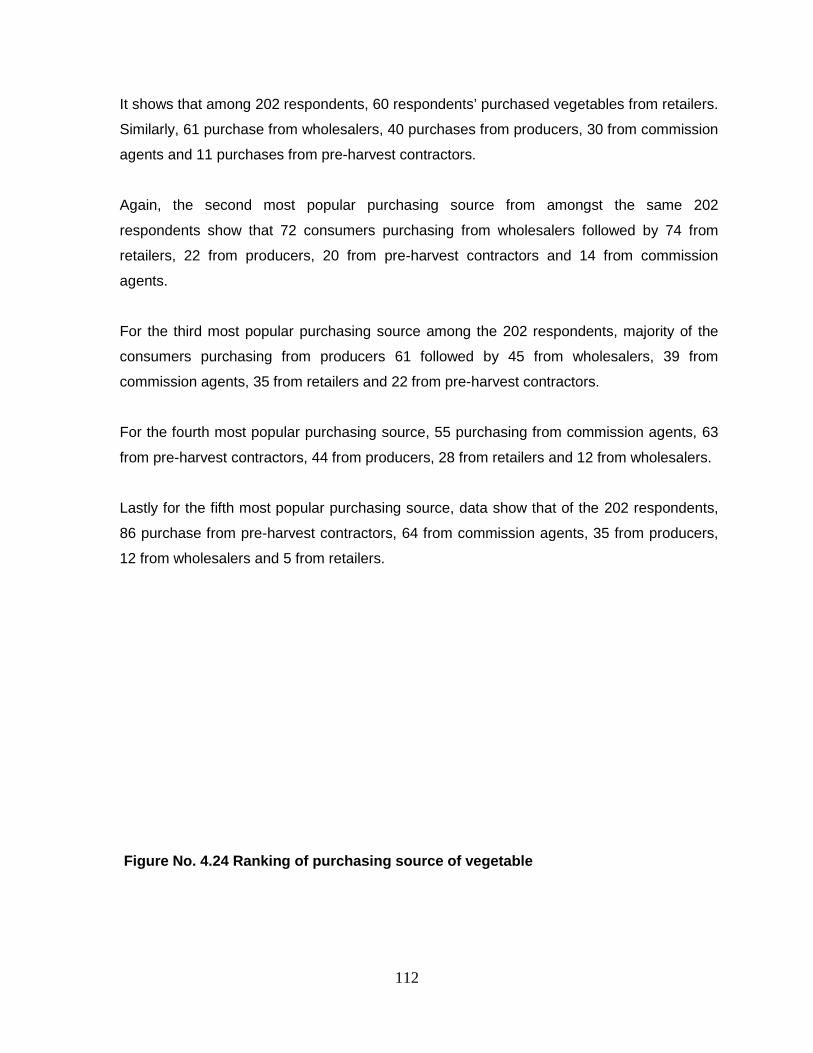
112
It shows that among 202 respondents, 60 respondents’ purchased vegetables from retailers.
Similarly, 61 purchase from wholesalers, 40 purchases from producers, 30 from commission
agents and 11 purchases from pre-harvest contractors.
Again, the second most popular purchasing source from amongst the same 202
respondents show that 72 consumers purchasing from wholesalers followed by 74 from
retailers, 22 from producers, 20 from pre-harvest contractors and 14 from commission
agents.
For the third most popular purchasing source among the 202 respondents, majority of the
consumers purchasing from producers 61 followed by 45 from wholesalers, 39 from
commission agents, 35 from retailers and 22 from pre-harvest contractors.
For the fourth most popular purchasing source, 55 purchasing from commission agents, 63
from pre-harvest contractors, 44 from producers, 28 from retailers and 12 from wholesalers.
Lastly for the fifth most popular purchasing source, data show that of the 202 respondents,
86 purchase from pre-harvest contractors, 64 from commission agents, 35 from producers,
12 from wholesalers and 5 from retailers.
Figure No. 4.24 Ranking of purchasing source of vegetable
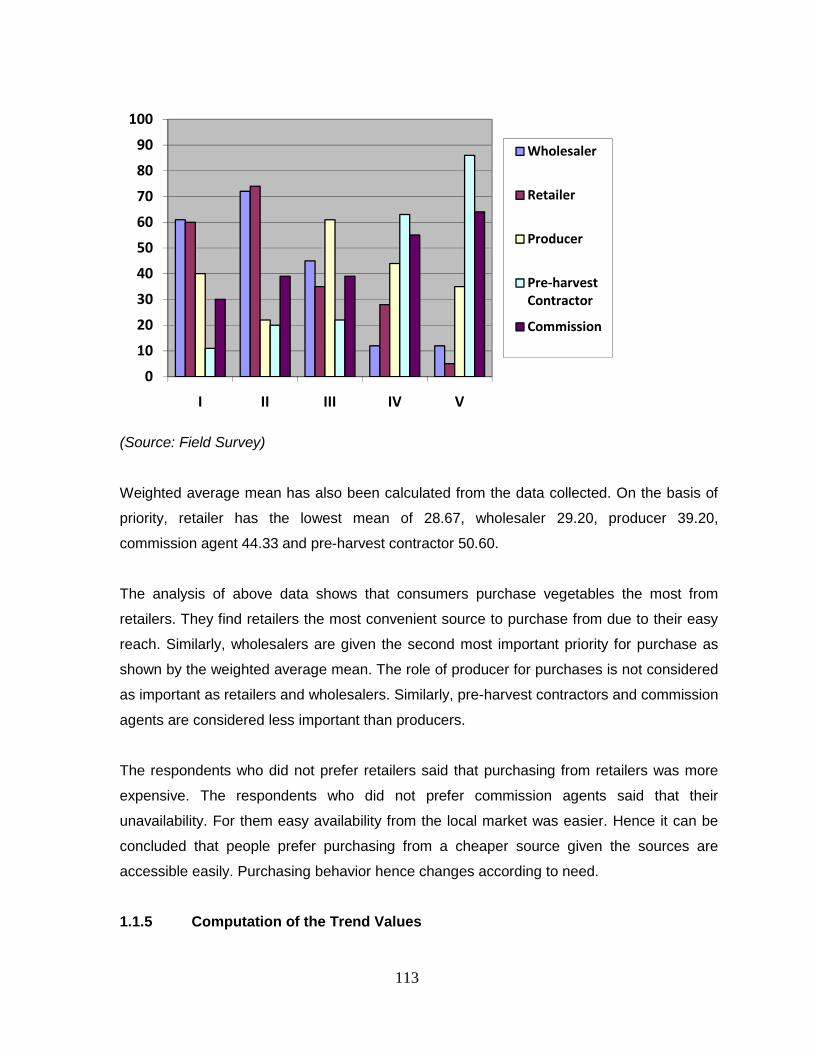
113
(Source: Field Survey)
Weighted average mean has also been calculated from the data collected. On the basis of
priority, retailer has the lowest mean of 28.67, wholesaler 29.20, producer 39.20,
commission agent 44.33 and pre-harvest contractor 50.60.
The analysis of above data shows that consumers purchase vegetables the most from
retailers. They find retailers the most convenient source to purchase from due to their easy
reach. Similarly, wholesalers are given the second most important priority for purchase as
shown by the weighted average mean. The role of producer for purchases is not considered
as important as retailers and wholesalers. Similarly, pre-harvest contractors and commission
agents are considered less important than producers.
The respondents who did not prefer retailers said that purchasing from retailers was more
expensive. The respondents who did not prefer commission agents said that their
unavailability. For them easy availability from the local market was easier. Hence it can be
concluded that people prefer purchasing from a cheaper source given the sources are
accessible easily. Purchasing behavior hence changes according to need.
1.1.5 Computation of the Trend Values
0
10
20
30
40
50
60
70
80
90
100
I II III IV V
Wholesaler
Retailer
Producer
Pre-harvestContractor
Commission
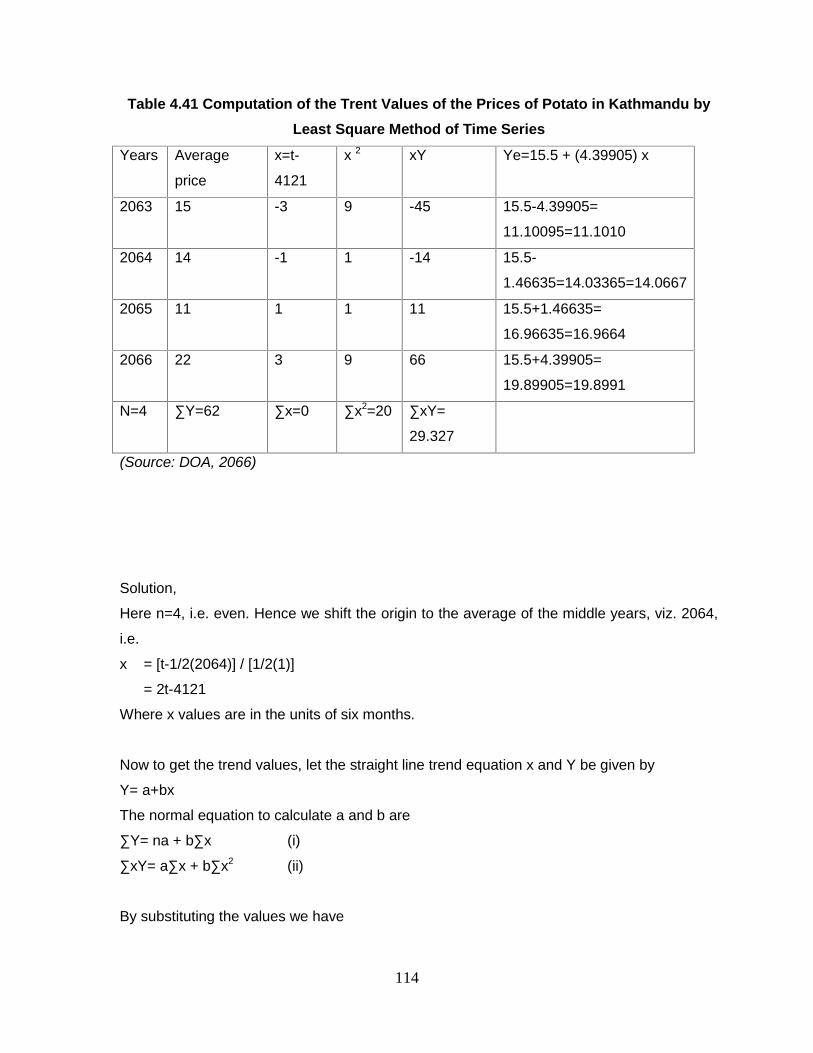
114
Table 4.41 Computation of the Trent Values of the Prices of Potato in Kathmandu byLeast Square Method of Time Series
Years Average
price
x=t-
4121
x 2 xY Ye=15.5 + (4.39905) x
2063 15 -3 9 -45 15.5-4.39905=
11.10095=11.1010
2064 14 -1 1 -14 15.5-
1.46635=14.03365=14.0667
2065 11 1 1 11 15.5+1.46635=
16.96635=16.9664
2066 22 3 9 66 15.5+4.39905=
19.89905=19.8991
N=4 ∑Y=62 ∑x=0 ∑x2=20 ∑xY=
29.327
(Source: DOA, 2066)
Solution,
Here n=4, i.e. even. Hence we shift the origin to the average of the middle years, viz. 2064,
i.e.
x = [t-1/2(2064)] / [1/2(1)]
= 2t-4121
Where x values are in the units of six months.
Now to get the trend values, let the straight line trend equation x and Y be given by
Y= a+bx
The normal equation to calculate a and b are
∑Y= na + b∑x (i)
∑xY= a∑x + b∑x2 (ii)
By substituting the values we have
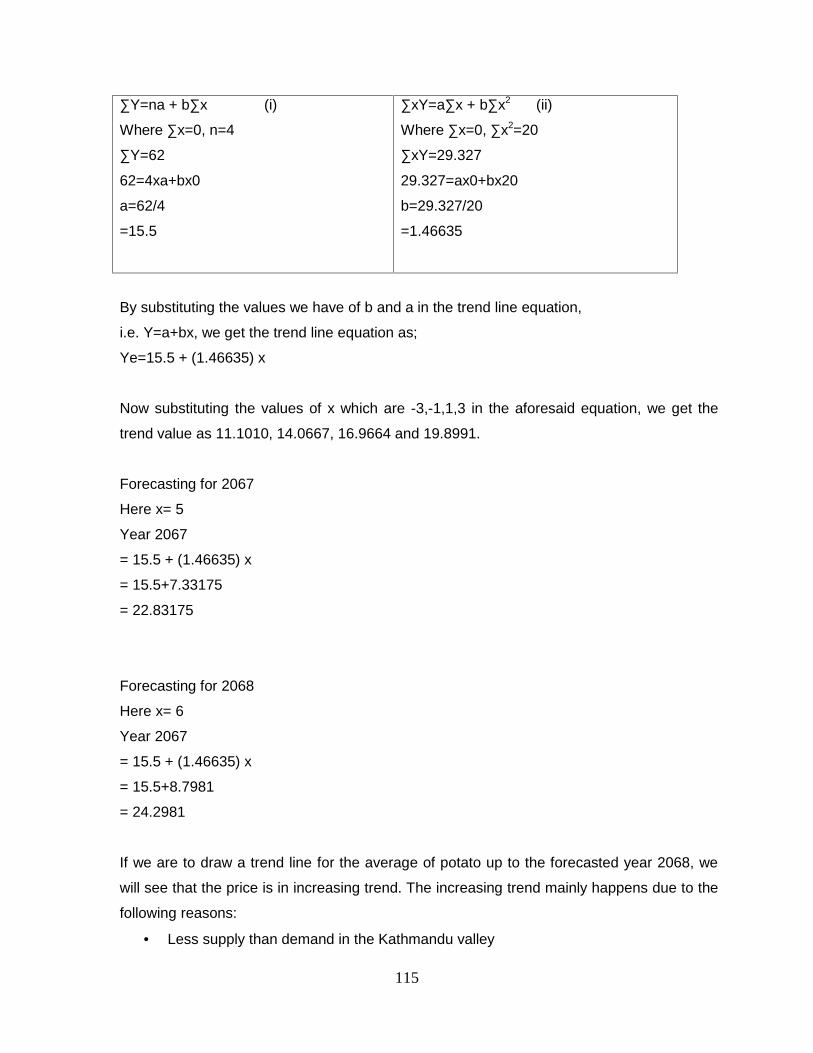
115
∑Y=na + b∑x (i)
Where ∑x=0, n=4
∑Y=62
62=4xa+bx0
a=62/4
=15.5
∑xY=a∑x + b∑x2 (ii)
Where ∑x=0, ∑x2=20
∑xY=29.327
29.327=ax0+bx20
b=29.327/20
=1.46635
By substituting the values we have of b and a in the trend line equation,
i.e. Y=a+bx, we get the trend line equation as;
Ye=15.5 + (1.46635) x
Now substituting the values of x which are -3,-1,1,3 in the aforesaid equation, we get the
trend value as 11.1010, 14.0667, 16.9664 and 19.8991.
Forecasting for 2067
Here x= 5
Year 2067
= 15.5 + (1.46635) x
= 15.5+7.33175
= 22.83175
Forecasting for 2068
Here x= 6
Year 2067
= 15.5 + (1.46635) x
= 15.5+8.7981
= 24.2981
If we are to draw a trend line for the average of potato up to the forecasted year 2068, we
will see that the price is in increasing trend. The increasing trend mainly happens due to the
following reasons:
Less supply than demand in the Kathmandu valley
116
Less storage space
Inferior packaging
Inefficient transportation network
Although the increase in retail prices of potato cannot be totally accepted in Kathmandu, the
rate is seen to fluctuate with each passing season. Data from DOA shows that the average
rate decreased during 2064 and decreases more in 2065. Again it increased unexpectedly
at 2066. The above least square method of time shows that the average price of potato will
increase continuously at years 2067 and 2068. These potatoes are manufactured in Nepal
and some are imported from India and china. Quality of potato produced in Nepal is high
enough in comparison to imported potatoes. Even then, due to the high transportation cost,
the imported apples become cheaper in Kathmandu. This is one example which shows that
transportation plays a very important role for the distribution of vegetables in Kathmandu.
4.2 Major Findings of the Study
On the basis of the comprehensive analysis of the data, the study has following findings:
As per DAO, Kathmandu, the production of different vegetables in the country that
include onion, tomato, potato, leafy vegetables, etc is 5,021 metric tons and
productive area is 560 hectares.
APP, NARC vision 2021, and Tenth Plan/PRSP have all outlined the importance of
reducing poverty though increase in agricultural products more competitive in the
regional and world markets through commercialization and competitiveness, and
protection, promoting and properly utilizing natural and environmental resources, and
biological diversity.
Nepal has the potential of producing wide varieties of vegetables. Although the
challenges from import substitution and quality of vegetables are ever existing
problems.
The buying behavior of consumers is mostly once in a week. This is shown by 48%
of the respondents choosing to do so.
117
General buying trend of the consumers is more during the mornings than in the
evenings as indicated by70% of the respondents during morning and 22% buying in
the evening.
Similarly, the quantity of vegetables purchase by the consume is 2kg at a time by
47%, followed by 1kg by 42%, and more than 2kg by 11%.
The field survey also shows that people prefer to buy from the nearest organized
vegetables shop rather than any place. This is shown by 53% of the respondents.
Respondents invest less than 5 percentage of income by 44 percent similarly 10
percent invest by 37 percent and 19 percent invest more than 10 percent in
vegetables buying.
The study shows that the main reason for consuming vegetables is for health
reasons. Problems is not finding the desired vegetables of choice however, is
attributed to the price factor. The tentative distance of the vegetables shop however
is at least 15 minutes walk from the respondent’s home.
Potato happened to be most favorite vegetables followed by leafy vegetables, onion
and tomato and the buyer in the family is the father.
Consumers buy the most from retailers although they buy from hawkers also when
they have no time to go to the market. The shop they buy from is mostly the same
but consumers are becoming more price conscious. The level of dissatisfaction of
the consumers from the vegetables available is huge due to inconsistency in size,
shape and the taste and value for money.
The quantity of vegetables sold by the sellers at a time is 5kg average and then
followed by 15kg and more than 15kg.
The supply of vegetables is from mainly the Kuleshwor vegetables wholesale market
followed by farmers and the farms.
The competition among the vegetables sellers is by the factor of price followed by
quantity.
Basic problems of retailers are destruction of vegetables due to its perishable nature.
Prospects of the vegetables markets is increasing day by day as it has low
investment more profit and can take care of whole family, the average size of their
family being 4-6. Even then, the retailers are found involved in other profession as an
alternative source of income.
118
Retailers sell mostly to consumers rather than in to bulk buyers. Bulk buyers are
found to buy from the wholesale market as it tends to be cheaper there.
Most of the retailers were involved in the related business before becoming
vegetables retailers i.e., some of their family members had already been associated
with this business. However, despite being satisfied with the profession, most of
them showed willingness to change their profession if given a choice. This is perhaps
why the young generation is not much willing to join their parents’ profession.
Reason being hassles from the business and lack of recognition from the job. This is
also been due to the full time requirement in the shop.
Vegetables retailers are able to sale most of the vegetables at varied prices
depending upon the quality. Storage facility would have added value to their product
as most retailers feel the necessity for storage facilities.
The most important role in the vegetables business despite the important role of
consumers and retailers in marketing of vegetables is the producer.
119
CHAPTER - 5
SUMMARY, CONCLUSION AND
RECOMMENDATION
5.1 Summary
Vegetables are one of the important food items in our daily diet. Due to the consciousness in the
health now-a- days everybody consumes vegetables. So, there is mere prospect and need of
the vegetables marketing.
This research has been conducted on the topic “Marketing of vegetables in Kathmandu District”.
In course of research, different people and places inside Kathmandu were visited for the
purpose of asking question and also for making personal observations. Before entering to the
field, two specific types of questionnaires were prepared. For consumers, 200 questionnaires
were circulated out of which a total of 96% responded. Similarly, in case sellers out of 100
questionnaires, 94 responses were found.
The main objective of the study is to find out production, consumption, problems, prospects,
demand and supply of vegetables. Useful suggestions have also been given.
The main outcome of the study is as follows:
The production of vegetables in Kathmandu district is 5,021 mt. and has an increasing trend.
The consumers invest less than 5% in vegetables in vegetables buying. Consumers need to
be made aware of the advantage of consuming vegetables.
Vegetables are mostly imported from other countries due to less domestic production.
The sellers have problems in selling vegetables as it perishes due to lack of proper cold
storage, lack of export in production, lack of proper marketing channels, lack of proper
infrastructure for market.
The low income level and less purchasing power of consumers effect the vegetables
consumption. There is competition among the sellers in price and quality.
The increasing population and increasing demand for vegetables clearly indicate the
potential market and prospects of vegetables market Kathmandu district.
120
5.2 Conclusion
Vegetables constitute an essential and important supplement to the human body. Due to the
consciousness in the health, the demand of vegetables is increasing day by day. It helps to
overcome the nutritional needs of Nepalese. With their low income, as it is the rich source of
different vitamins and minerals.
Nepal is an agricultural based country as its economy is based on agriculture. Vegetables
cultivation is a part of agriculture. The production of vegetables can contribute a great in
national economy and people’s health. But the production of vegetables is not in sufficient
quantity as well as quality. Similarly there are many more problems in the proper distribution,
storage, production and quality aspects.
The Government also needs to subsidize the agricultural sector and provide incentives to the
farmers. Research in the field of vegetables need to be intensified rapidly in order to stop
imports and encourage exports.
There are different types of problems regarding the vegetables marketing within the both sides
i.e. within consumers as well as retailers. In case of consumers they do not have sufficient
ability to buy vegetables so price is the factor. Quality and timely availability of the products is
the other problems. Similarly, on the part of retailers, there is lack of investment capacity.
Competition is very high among retailers. There is more post harvest loss in vegetables due to
its perishable nature and lack of proper cold storage facilities. Market as such is not a problem
and the consumption of vegetables in Kathmandu is found to be increasing every day.
We come to conclude on the basis of this study that there remain many problems but the
prospects of the fruits marketing is increasing on other hand day by day. This study shows that
there are great prospects in vegetables marketing particularly in Kathmandu district. But there
are so many problems that need to be addressed properly and timely. Thus, the future
marketing prospects is very bright.
5.3 Recommendation
121
Vegetables marketing are one of the needs for the needs of the management urbanization and
for the managed urbanization and for the betterment of the health condition of the people
following are the recommendation:
1) Some aspects of the labor contract law are relevant to vegetables processing industry in
view of the short season for production, as well as for processing. This means that
processing industries need to have the flexibility to hire workers on a seasonal basis without
facing labor-related disruptions.
2) Appropriate research is the key to upgrading quality. Both farmers and traders complain that
suitable varieties of vegetables for processing are not available in Nepal. There is little
research work on introduction, testing and release to process able varieties by public or
private institutions. This requires inter alia a critical mass of highly trained horticulturalists in
NARC. A strong public research programme is needed on efficient methods of extracting
and preserving vegetables locally.
3) Since the production of the vegetables is highly seasonal, cold storage plays a very
important role. The experience with the cold storage has not been good so far. There is a
lack of analysis on what would make these units feasible in Nepal, compared to for e.g.
those in the Indian border towns, which requires a separate study on the economics of
investing in cold storage.
4) Exports need to be encouraged. Potato and leafy vegetables are two major exportable
vegetables of Nepal. Though onion orchards are nearer to road head as compared with
potato, orchards in both cases are not planted from commercial point of view. Hence, some
support in facilitating collection, grading, wrapping and packaging vegetables would
enhance export.
5) In the Nepalese context, authorized agents for vegetables are lacking. So, there is more
flexibility in vegetables pricing. Due to the presence of the middle agents, producers have to
share lesser profits. Authorized agents must be available so that the farmers, consumers
and the sellers are benefited.
122
6) Government should make the proper policy for promotion of vegetables market. Lack of
government rules and regulation in one hand and flexible rules are seen in practice. So,
government policy should be stable and practical.
7) The younger generation of vegetables businessmen should be encouraged to join their
family business. It is found that the number of businessmen involved in this profession is not
growing at the same rate other businesses are growing.
8) Percentage of expenditure of the general consumers in vegetables purchase is insignificant.
Consumers should be encouraged to spend more in purchase of vegetables through the
different advertising media. Local produce could also be encouraged from this. Instead of
focusing more on imports, local produce should be marketed and made available in the
cities.
Recommendation for Further ResearchFollowing areas need further research
a. Research into problems in production of vegetables.
b. Separate marketing mix strategy (i.e. product, price, place and promotion) should be done.
c. Determination of competitive advantage of Nepalese vegetables.
d. Effects of Government policy towards vegetables.
e. An in-depth research into potato production and marketing vegetables.
f. Comparative analysis of vegetables market in the neighboring countries and how we can
learn from their success.
123
BIBLIOGRAPHY
Acharya, S.S. and Agrawal, N.L. (1984), “Efficiency in Millet Marketing; A case study ofRajasthan”. India. Indian Journal of Agriculture Economics.
Agro Enterprises Center-(2005/06). “Annual Report of AEC”
Agro Enterprises Center-(2006/07). “Annual Report of AEC”
Agro Enterprises Center-(2007/08). “Annual Report of AEC”
Agro Enterprises Center-(2008/09). “Annual Report of AEC”
Bhattarai, M. 1992. A study on marketing of tomato in Sarlahi District: Problems andprospects.Report Submitted by No-Frills Consultant to Winrock International, Kathmandu,Nepal.
Budathoki, K., Gurung, G.B., and Lohar, D.P. 1993. Vegetable crops: Indigenous knowledgeand technology in the western Hills of Nepal. In: Tamang, D., Gill, G., and Thapa, G. (ed.)Indigenous management of natural resources in Nepal. Kathmandu, Nepal, WinrockInternational.
Cao-Van, P. “Deciduous Vegetable Production in Vietnam”, Vietanam.
CBS (Central Bureau of Statistics). 1993a. Statistical Year Book of Nepal 1993. CBS.Kathmandu, Nepal.
CBS (Central Bureau of Statistics). 1993b. Four-Monthly Statistical Bulletin. Year 14, Volume 3.CBS, Kathmandu, Nepal.
Crown Agents in Association with Devtec. 1991. Nepal fertilizer sector management study,Volume I. Final Report Submitted to His Majesty's Government of Nepal/UNDP/ADB.Department of Customs. Various issues (1990-1992). Foreign Trade Statistics. Ministry ofFinance, Kathmandu, Nepal.
DFAMS (Department of Food and Agricultural Marketing Services). 1984. Food consumptionsurvey: Jhapa, Dhankuta and Solukhumbu Districts (In Nepali). DFAMS, Kathmandu, Nepal.
DFAMS (Department of Food and Agricultural Marketing Services). 1985. Food consumptionsurvey: Mustang, Gorkha and Rupandehi Districts (In Nepali). DFAMS, Kathmandu, Nepal.
Dhakal, B. 1993. The buk method of potato farming in the high Hills of Nepal. In: Tamang, D.,Gill, G., and Thapa, G. (ed.) Indigenous management of natural resources in Nepal.Kathmandu, Nepal, Winrock International
District Agriculture Office (2005/06), “Annual Report of Kathmandu”.
124
DoAD (Department of Agricultural Development). 1992a. Economic aspects of fruit andvegetable production in selected districts of Nepal. Economic Analysis Division, HariharBhawan, Lalitpur, Nepal.
DoAD (Department of Agricultural Development). 1992b. Costs of production and returns ofmajor crops in Nepal. Economic Analysis Division, Harihar Bhawan, Lalitpur, Nepal.
DoAD (Department of Agricultural Development). 1992c. Food Balance Sheet of Nepal,1991/92. Agricultural Marketing Development Division, Harihar Bhawan, Lalitpur, Nepal.
DoAD (Department of Agricultural Development). Various issues ( 199 1 - 1994). AgriculturalMarketing Information Bulletin, Special Issue. Agricultural Marketing Development Division,Harihar Bhawan, Lalitpur, Nepal.
DoR (Department of Road). 1995. Nepal Road Statistics. RoR, Kathmandu, Nepal. pp: 2.Gill, G.J., and Bajracharya, B. 1994. Current status and problems of the cold storage industry inNepal. Winrock International, Kathmandu, Nepal.
Dorji, P. (1995), “Deciduous Vegetable Production in Bhutan”, Royal Government of Bhutan,Ministry of Agriculture.
Gautam J.C. (1995), “Vegetable Development in Nepal”, Paper presented at the NationalSeminar on Vegetable Development in Nepal held from Feb, 22-24, 1995. Jointly organized byVegetable Development Project with support from JICA at Kirtipur, Nepal.
Kulkarni, K.R. (1985), “Agriculture Marketing in India”, Bombay, India.
Lalika, G.P. 1989. Production constraints in potato in Khatmandu valley, Agricultural MarketingDevelopment Division, Harihar Bhawan, Lalitpur, Nepal.
MDD (2001), “The study on the marketing system of selected high value agriculturalcommodities in the commercial pockets of Nepal”.
MDD (2202), “Agricultural marketing information bulletin” (special issue-2001).
MOA (Ministry of Agriculture). 1986. Impact study of vegetable production program in the vicinityof highways (In Nepali). Evaluation and Project Analysis Division, Kathmandu, Nepal.
MOA (Ministry of Agriculture). 1987. Impact study of vegetable development program (InNepali). Evaluation and Project Analysis Division, Kathmandu, Nepal.
MOA (Ministry of Agriculture). 1995. Statistical information on Nepalese agriculture, 1994/95.Agricultural Statistics Division, Singha Durbar, Kathmandu, Nepal.
Munankami, R. 1985. A study on marketing costs and margins of major commodities in Nepal.Department of Food and Agricultural Marketing Services. Lalitpur, Nepal.
Munankami, R. 1990. An analysis of contractual production of vegetable seeds in Nepal, Vol. V.Radish seed, Bhaktapur. No-Frills Consultants, Kathmandu, Nepal.
125
Munankami, R., and Dhakal, B.P. 1990. Economics of production of vegetable seeds in Nepal,Vol. IX. Carrot seed, Mustang. No-Frills Consultants, Kathmandu, Nepal.
Munankami, R., and Gautam, T. 1990. Economics of production of vegetable seeds in Nepal,Vol. VI. Onion seed, Rukum. No-Frills Consultants, Kathmandu, Nepal.
Munankami, R., and Mahat, P. 1990. An analysis of contractual production of vegetable seedsin Nepal, Vol. I. Pole bean seed, Belkot, Nuwakot. No-Frills Consultants, Kathmandu, Nepal.
Munankami, R., Gautam, T., and Dhakal, B.P. 1990. Economics of production of vegetableseeds in Nepal, Vol. 11. Radish seed, Dhankuta. No-Frills Consultants, Kathmandu, Nepal.
Munankami, R., and Jha, A.K. 1990. An analysis of contractual production of vegetable seeds inNepal, Vol. VI. Tomato seed, Sarlahi. No-Frills Consultants, Kathmandu, Nepal.
Munankami, R., and Neupane, N. 1990. Economics of production of vegetable seeds in Nepal,Vol. VII. Radish seed, Rukum. No-Frills Consultants, Kathmandu, Nepal.
Munankami, R., and Neupane, N. 1991. Economics of production of vegetable seeds in Nepal,Vol. VIII. Rayo seed, Terhathum. No-Frills Consultants, Kathmandu, Nepal.
Napit, K.B., and Thapa, L.K. 1990. An analysis of contractual production of vegetable seeds inNepal, Vol. IV. Marpha and Tukche, Mustang. No-Frills Consultants, Kathmandu, Nepal.
NARC (Nepal Agriculture Research Council). 1989. Annual Report 1987/88. NARC,Kathmandu, Nepal.
No-Frills. 1989. Opportunity profiles. Document Prepared for Business Executives, Workshopon Agro-Enterprises Development in Nepal, held in Dhulikhel, Nepal, 30 Nov. -2 Dec. 1989,jointly sponsored by USAID/Nepal, Agricultural Development Bank/Nepal, National CooperativeBusiness Association/Washington D.C. and No-Frills Consultants, Kathmandu, Nepal.
NPC (National Planning Commission). 1992. Eighth Five Year Plan, 1992-93 to 1996-97 (InNepali). NPC, Kathmandu, Nepal.
NRB (Nepal Rastra Bank). 1980. Agricultural credit review survey, Nepal. NRB, Kathmandu,Nepal. NRB (Nepal Rastra Bank). 1989. Multipurpose household budget survey: A study onincome distribution, employment, and consumption patterns in Nepal. NRB, Kathmandu, Nepal.PACMAR (Pacific Management Resources Inc.) and EC (East Consult (P) Ltd.). 1991. Masterplan for horticulture development. Various volumes. Project Report Submitted to His Majesty'sGovernment of Nepal and Asian Development Bank.
Pandey, I.R. 1993. Some indigenous practices of vegetable production by Jyapoo farmersaround the Kathmandu valley. In: Tamang, D., Gill, G., and Thapa, G. (ed.) Indigenousmanagement of natural resources in Nepal. Kathamandu, Nepal, Winrock International
Pandey, I.R., Yonjon, P., and Thapa, P.K. 1990. Study on the economics of radish seedproduction in Bhaktapur, Nepal. Vegetable Development Division and FAO Fresh Vegetableand Vegetable Seed Production Project, Kathmandu, Nepal.
126
Pretty, L.P. 1992. Production technology and constraints in Tomato production in the mountains(in Nepali). DoAD, Kathmandu, Nepal.
Pun, L. 1987. Production of vegetables and marketing needs of farmers. In: Proceedings ofsmall farmer marketing extension training workshop sponsored by DFAMS and FAO, 8-1 0September, Pokhara, Nepal.
Rana, A.N. 1990. Vegetable production and policy in Nepal. In: Proceedings of a workshop onvegetable research and development in South Asia, held from 24-29 September 1990.Islamabad, Pakistan.
Rekhi, S.S., Shah, B.B., and Aryal, S.B. 1990. Vegetable development in Nepal: Present status,future strategy and constraints. MFS Series No. 15. ICIMOD, Kathmandu, Nepal.
Verma, A.R. (1989), “Rural Marketing in India: Empirical Studies from Madhya Pradesh”, NewDelhi.
Satyal, M.R. 1979. A study on marketing costs and margins of major food commodities in Nepal.Report submitted to FAO Regional Office for Asia and the Far East, Kathmandu, Nepal.
Shah, B. B. 1990. Vegetable research in Nepal. In: Shanmugasundaram, S. (ed.) Vegetableresearch and development in South Asia: proceedings of a workshop held at Islamabad,Pakistan, 24-29 September 1990.
Sharma, S. 1994. Economic liberalization and incentives in agriculture in Nepal: Challenges andopportunities. Report Submitted to Winrock International, Kathmandu, Nepal.
Shrestha G.K. (1992), “Pinneapple Production in Nepal”, Kathmandu, Nepal.
Shrestha G.K (995), “Research activities on vegetable crops in Nepal”, Kirtipur.
Shrestha, K.B., and Werner, R.A. 1992. Issues and constraints in improvement of post-harvesttechnology in fruits and vegetables in Nepal. Vegetable Development Division, Kathmandu,Nepal.
Subhadrabandhu, S “Deciduous Vegetable Production in Thailand”, Bangkok. ProfessorDepartment of Horticulture. Faculty of Agriculture, Kasetsaart University.Subhadrabandhu, S. and Punsri, P (1987), “Deciduous Fruit Trees as an alternative to apiumpoppy in Northen Thailand”, Acta Horticulture.
Takahashi, J. (1982), “Vegetable Market Survey at Kathmandu and Pokhara”, Kathmandu.
Thapa, G.B. 1994. Public resources allocation and agricultural performance in Nepal. ResearchReport Series No. 24. Winrock International, Kathmandu, Nepal.
Thapa, G.B., and Koirala, G. 1992. A study of food situation and outlook for Nepal. Final ReportSubmitted to the International Food Policy Research Institute, APROSC, Kathmandu, Nepal.
Thapa, P.K, Saraf, D, Gaire K.R (2006), “Commodity Case Study: Fruits”. Food and AgricultureOrganization of the United Nations Rome, Italy.
127
Tiwary, M. (2003), “Marginal farmers, agricultural practices and rural poverty in Nepal”. Food
VDD (Vegetable Development Division). 1991. Kitchen gardening manual (in Nepali). DoAD,Kathmandu, Nepal.
Websites
http://doanepal.gov.npwww.agripricenepal.comwww.aec-fncci.orgwww.aicc.gov.npwww.applejournal.comwww.b2b.com.npwww.cadp.gov.npwww.cbi.eduwww.cbs.gov.npwww.fao.gov.npwww.fdd.org.npwww.fncci.com.npwww.helvetasnepal.org.npwww.mti.gov.npwww.moa.gov.npwww.moacwto.gov.npwww.npc.gov.npwww.sdc.org.npwww.usaid.gov

128
APPENDIX-IQUESTIONNARIRE FOR CONSUMERS
Dear Sir/Madam,
I would like to bring to your kind notice that I am writing a thesis entitled, “A Study on theVegetable Market in Kathmandu”, for the partial fulfillment of the Masters of Business Studies(MBS) under Tribhuvan University, Nepal. Your information and response based on followingquestionnaire would be very valuable. This information would be used for research purpose onlyand would be kept confidential.
Name:Address:
Please Tick (√) in the appropriate options for the following questions:1. When do you buy vegetables?
a. Once a weekb. Dailyc. Twice a month
2. How many vegetables do you buy at a time?a. 1 kgb. 2 kgc. 3 kg
3. From where do you buy vegetables?a. Nearby homeb. From Kalimatic. At any place
4. At what time do you buy vegetables?a. Morningb. Afternoonc. Evening
5. How much of your earnings do you spend in vegetables?a. Below 5%b. About 10%c. More than 10%
6. Why do you eat vegetables?a. For better healthb. To show others as richc. To satisfy hunger
129
7. What problems do you see in finding vegetables of your choice?a. Time factorb. Quality factorc. Lack of regular supply
8. What is the tentative distance of the nearest vegetables shop from your residence?a. 5 minutes walkb. 15 minutes walkc. More than 15 minutes walk
9. Which vegetable do you prefer the most?a. Potatob. Onionc. Tomatod. Leafy Vegetable
10. Which of your family members purchase vegetables?a. Fatherb. Motherc. Others
11. How frequently do you buy vegetables?a. Once a weekb. Dailyc. Twice a week
12. From whom you purchase the vegetables from?a. Wholesalersb. Retailersc. Hawkers
13. Why do you buy from Hawkers?a. When I don’t have time to go to the marketb. The market is far awayc. Cheaper than the market
14. How do you define your vegetable buying behavior?a. I buy from the shopb. I look around many shops and choose the cheapest shopc. I look around many shops and go to my regular shop
15. Do you buy seasonal vegetables or other non-seasonal vegetables?a. Yesb. No
130
16. Do you bargain while buying vegetables?a. Yesb. No
17. Are you satisfied with the quality of vegetables available in the market?a. Yesb. No
18. If you are not satisfied with the quality of vegetables available in the market, why?a. Inconsistent size and tasteb. Does not look goodc. Both of a and b
19. Do you think you get value for the money you spend on vegetables?a. Yesb. No
20. What do you think is the most important factor for a vegetable market?a. Parking facilityb. Cleanlinessc. Market has to be near to home
21. How do you rank your preference of the following vegetables?Vegetables/Rank I II IIIPotatoOnionTomatoLeafy Vegetable
22. How would you rank your preference of vegetable purchasing source?PurchasingSources/Rank
I II III
WholesalersRetailersPre-harvest ContractorCommission Agent
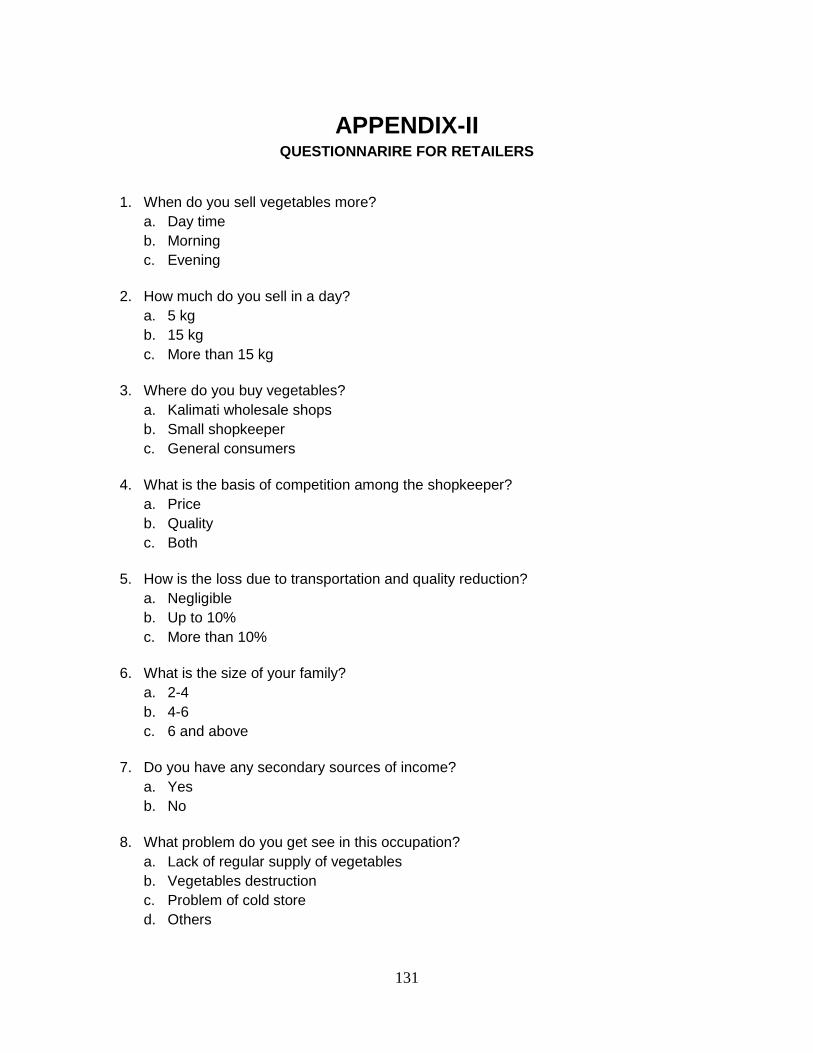
131
APPENDIX-IIQUESTIONNARIRE FOR RETAILERS
1. When do you sell vegetables more?a. Day timeb. Morningc. Evening
2. How much do you sell in a day?a. 5 kgb. 15 kgc. More than 15 kg
3. Where do you buy vegetables?a. Kalimati wholesale shopsb. Small shopkeeperc. General consumers
4. What is the basis of competition among the shopkeeper?a. Priceb. Qualityc. Both
5. How is the loss due to transportation and quality reduction?a. Negligibleb. Up to 10%c. More than 10%
6. What is the size of your family?a. 2-4b. 4-6c. 6 and above
7. Do you have any secondary sources of income?a. Yesb. No
8. What problem do you get see in this occupation?a. Lack of regular supply of vegetablesb. Vegetables destructionc. Problem of cold stored. Others
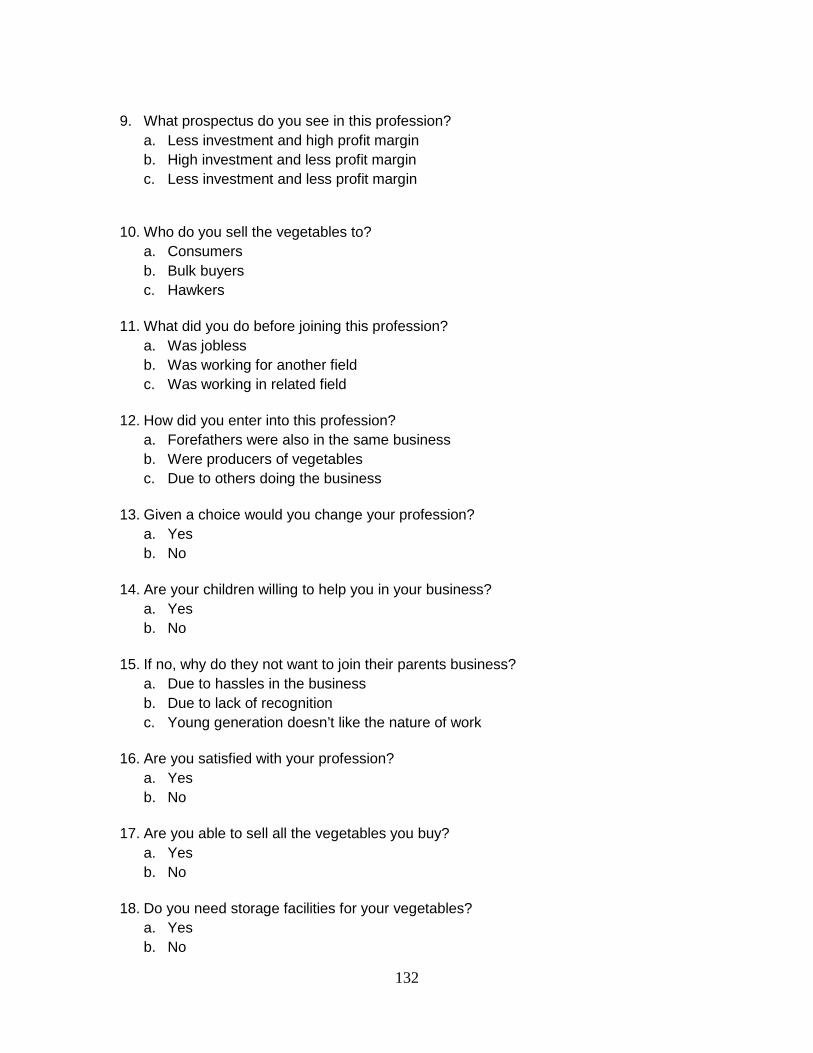
132
9. What prospectus do you see in this profession?a. Less investment and high profit marginb. High investment and less profit marginc. Less investment and less profit margin
10. Who do you sell the vegetables to?a. Consumersb. Bulk buyersc. Hawkers
11. What did you do before joining this profession?a. Was joblessb. Was working for another fieldc. Was working in related field
12. How did you enter into this profession?a. Forefathers were also in the same businessb. Were producers of vegetablesc. Due to others doing the business
13. Given a choice would you change your profession?a. Yesb. No
14. Are your children willing to help you in your business?a. Yesb. No
15. If no, why do they not want to join their parents business?a. Due to hassles in the businessb. Due to lack of recognitionc. Young generation doesn’t like the nature of work
16. Are you satisfied with your profession?a. Yesb. No
17. Are you able to sell all the vegetables you buy?a. Yesb. No
18. Do you need storage facilities for your vegetables?a. Yesb. No
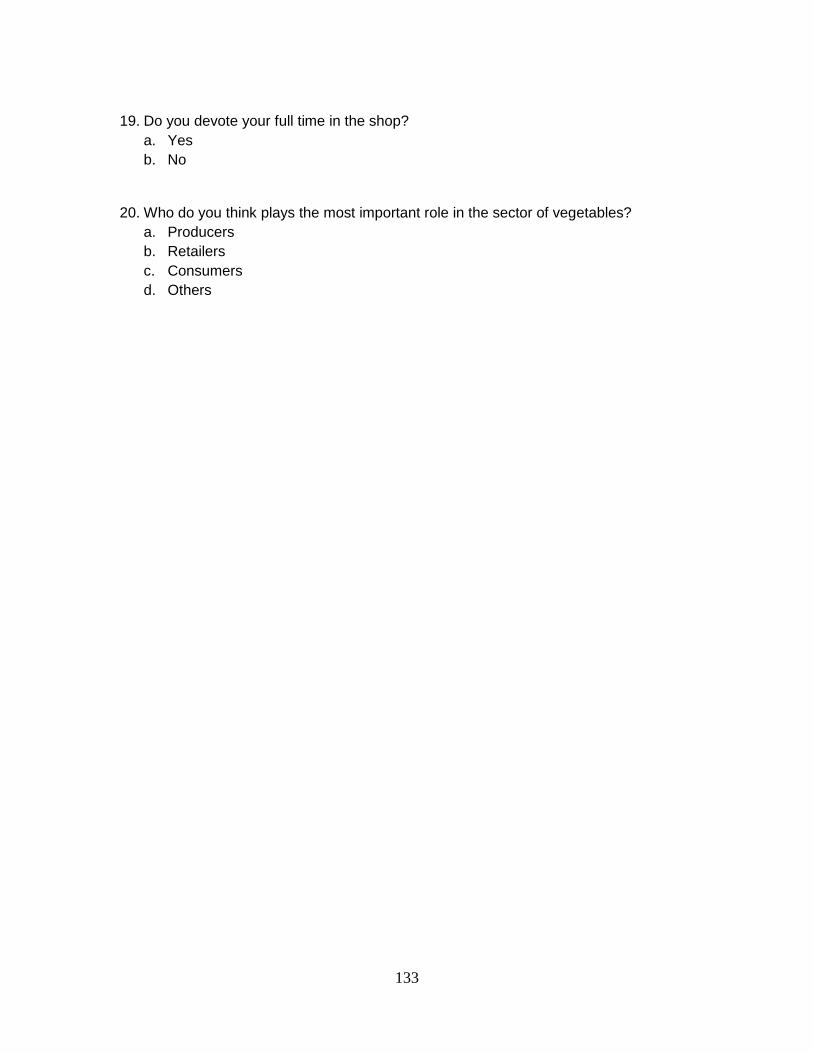
133
19. Do you devote your full time in the shop?a. Yesb. No
20. Who do you think plays the most important role in the sector of vegetables?a. Producersb. Retailersc. Consumersd. Others