Changes in the soil microbial community with a pine plantation restoration in a dry valley of the...
14
Ann. N.Y. Acad. Sci. ISSN 0077-8923 ANNALS OF THE NEW YORK ACADEMY OF SCIENCES Issue: Ecological Complexity and Sustainability Changes in the soil microbial community with a pine plantation restoration in a dry valley of the upper reaches of the Minjiang River, southwest China Zhanfeng Liu, 1,2 Guohua Liu, 1 Bojie Fu, 1 Yaqiong Wu, 1 Huifeng Hu, 1 and Shenglei Fu 2 1 State Key Laboratory of Urban and Regional Ecology, Research Center for Eco-environmental Sciences, Chinese Academy of Sciences, Beijing, China. 2 Institute of Ecology, South China Botanical Garden, Chinese Academy of Sciences, Guangzhou, China Address for correspondence: Bojie Fu, State Key Laboratory of Urban and Regional Ecology, Research Center for Eco-Environmental Sciences, Chinese Academy of Sciences, P.O. Box 2871, Beijing 100085, China. Voice: +86-10-62923557; fax: +86-10-62923557. [email protected] The objective of this study was to investigate the changes in soil microbial biomass C, microbial metabolic activity, functional diversity, and metabolic diversity pattern during the restoration process of a pine (Pinus tabulaeformis) plantation. In this study, a chronosequence approach was adopted. Three sites of pine plantations along a restoration chronosequence (12 years old (PF12), 25 years old (PF25), 35 years old (PF35)), and their paired reference sites of natural shrub community (Shrub1, Shrub2, and Shrub3) were selected. Soil microbial biomass C increased and microbial quotient declined with pine plantation age. Microbial metabolic activity, as measured by average well color development (using Biolog GN 2 plates), exhibited a decline along the restoration chronosequence with values ranked as PF12 > PF35 > PF25 in topsoil and PF12 > PF25 > PF35 in subsoil. Functional diversity, as estimated by substrate diversity and substrate richness, exhibited a pattern similar to the metabolic activity. Principal component analysis indicated that metabolic diversity followed recognized patterns along the restoration chronosequence with PF12 significantly different from PF25 and PF35. There was an apparent reduction of microbial metabolic activity and functional diversity during pine plantation restoration, which can be explained by a general decline in soil nutrient availability, particularly C availability, and soil pH associated with the establishment of a coniferous species. Keywords: microbial metabolic activity; microbial functional diversity; pine plantation; restoration chronosequence; microbial biomass C; microbial quotient Introduction The soil microbial communities play key roles in ecosystems and mediate many ecological processes that are central to ecosystem functioning, includ- ing nutrient cycling, organic matter decomposition, and carbon cycling (Schimel 1995). Studies have reported that the soil microbial community is a more sensitive component of the terrestrial ecosys- tem to disturbance than plants and animals in forest ecosystems (Panikov 1999). The size, composition, and activity of the soil microbial community can also reflect the impacts of ecosystem types and man- agement strategies upon them. At the same time, management strategies and restoration approaches can significantly affect the structure and function of soil microbial communities. Therefore, the soil microbial community can provide invaluable infor- mation for ecosystem restoration, and it has been used as an indicator of restoration process in de- graded land (Harris 2003). Soil microbial biomass and metabolic diversity patterns are two major components of soil micro- bial communities (Rogers and Tate 2001). Soil mi- crobial biomass is the living and active part of the soil organic matter, the source and sink of avail- able nutrients (Diaz-Ravina et al . 1993). Soil mi- crobial biomass can respond rapidly to changes in soil management practices, so it has been recom- mended as a useful ecological indicator of envi- ronmental stress caused by anthropogenic activities. Soil microbial quotient (the soil microbial biomass doi: 10.1111/j.1749-6632.2009.05407.x E82 Ann. N.Y. Acad. Sci. 1195 (2010) E82–E95 c 2010 New York Academy of Sciences.
-
Upload
independent -
Category
Documents
-
view
1 -
download
0
Transcript of Changes in the soil microbial community with a pine plantation restoration in a dry valley of the...

Ann. N.Y. Acad. Sci. ISSN 0077-8923
ANNALS OF THE NEW YORK ACADEMY OF SCIENCESIssue: Ecological Complexity and Sustainability
Changes in the soil microbial community with a pineplantation restoration in a dry valley of the upper reachesof the Minjiang River, southwest China
Zhanfeng Liu,1,2 Guohua Liu,1 Bojie Fu,1 Yaqiong Wu,1 Huifeng Hu,1 and Shenglei Fu2
1State Key Laboratory of Urban and Regional Ecology, Research Center for Eco-environmental Sciences, Chinese Academyof Sciences, Beijing, China. 2Institute of Ecology, South China Botanical Garden, Chinese Academy of Sciences, Guangzhou,China
Address for correspondence: Bojie Fu, State Key Laboratory of Urban and Regional Ecology, Research Center forEco-Environmental Sciences, Chinese Academy of Sciences, P.O. Box 2871, Beijing 100085, China. Voice:+86-10-62923557; fax: +86-10-62923557. [email protected]
The objective of this study was to investigate the changes in soil microbial biomass C, microbial metabolic activity,functional diversity, and metabolic diversity pattern during the restoration process of a pine (Pinus tabulaeformis)plantation. In this study, a chronosequence approach was adopted. Three sites of pine plantations along a restorationchronosequence (12 years old (PF12), 25 years old (PF25), 35 years old (PF35)), and their paired reference sitesof natural shrub community (Shrub1, Shrub2, and Shrub3) were selected. Soil microbial biomass C increased andmicrobial quotient declined with pine plantation age. Microbial metabolic activity, as measured by average well colordevelopment (using Biolog GN2 plates), exhibited a decline along the restoration chronosequence with values rankedas PF12 > PF35 > PF25 in topsoil and PF12 > PF25 > PF35 in subsoil. Functional diversity, as estimated by substratediversity and substrate richness, exhibited a pattern similar to the metabolic activity. Principal component analysisindicated that metabolic diversity followed recognized patterns along the restoration chronosequence with PF12significantly different from PF25 and PF35. There was an apparent reduction of microbial metabolic activity andfunctional diversity during pine plantation restoration, which can be explained by a general decline in soil nutrientavailability, particularly C availability, and soil pH associated with the establishment of a coniferous species.
Keywords: microbial metabolic activity; microbial functional diversity; pine plantation; restoration chronosequence;
microbial biomass C; microbial quotient
Introduction
The soil microbial communities play key roles inecosystems and mediate many ecological processesthat are central to ecosystem functioning, includ-ing nutrient cycling, organic matter decomposition,and carbon cycling (Schimel 1995). Studies havereported that the soil microbial community is amore sensitive component of the terrestrial ecosys-tem to disturbance than plants and animals in forestecosystems (Panikov 1999). The size, composition,and activity of the soil microbial community canalso reflect the impacts of ecosystem types and man-agement strategies upon them. At the same time,management strategies and restoration approachescan significantly affect the structure and function
of soil microbial communities. Therefore, the soilmicrobial community can provide invaluable infor-mation for ecosystem restoration, and it has beenused as an indicator of restoration process in de-graded land (Harris 2003).
Soil microbial biomass and metabolic diversitypatterns are two major components of soil micro-bial communities (Rogers and Tate 2001). Soil mi-crobial biomass is the living and active part of thesoil organic matter, the source and sink of avail-able nutrients (Diaz-Ravina et al. 1993). Soil mi-crobial biomass can respond rapidly to changes insoil management practices, so it has been recom-mended as a useful ecological indicator of envi-ronmental stress caused by anthropogenic activities.Soil microbial quotient (the soil microbial biomass
doi: 10.1111/j.1749-6632.2009.05407.xE82 Ann. N.Y. Acad. Sci. 1195 (2010) E82–E95 c© 2010 New York Academy of Sciences.

Liu et al. Soil microbial community and plantation restoration
carbon: soil organic carbon ratio) has been usedas an indicator of future changes of soil organicmatter status in response to external disturbance.It was reported that the role of microbial biomassin soil organic matter deposition and N turnoveris significant, particularly in disturbed and/or re-generating ecosystems (Arunachalam et al. 1996).Arunachalam and Pandey (2003) characterized thealtitudinal and successional trends in soil microbialbiomass during the vegetation recovery of the aban-doned cultivation systems, and pointed out that thealtitudinal and successional dynamics of soil micro-bial biomass carbon and nitrogen were linked tosoil organic matter and total nitrogen (TN) con-tents in the soil during community development af-ter abandonment. Jia et al. (2005) investigated soilmicrobial biomass and nutrients in soil at a sec-ondary forest chronosequence and found that soilmicrobial biomass carbon increased quickly, andreached the maximum in a 17-year-old secondaryforest; but it decreased and remained at a stable levelthereafter.
The diversity of the soil microbial communityalso plays an important role in soil ecosystem func-tion maintenance. Microbial metabolic diversitypattern, estimated by using Biolog method, is a bet-ter indicator for evaluating the functional changesin soil microbial community than the soil micro-bial biomass. In spite of various limitations, Biologmethod has been widely used to characterize micro-bial communities associated with various crop typesand tree species in agricultural, grassland and forestsoils (White et al. 2005).
The dry valley of the upper reaches of MinjiangRiver is the key region for rebuilding the ecologicalprotective barrier for the upper Changjiang River inSouthwest China. The main ecological issues in thisarea were vegetation cover decreasing, and soil andwater loss, which further deteriorate the hydrologi-cal condition and induce the occurrence of naturaldisasters, such as landslides. Environment degra-dation also hinders the economic development ofthis area. Therefore, urgent issue for the area isto restore the degraded ecosystems by ecologicalapproaches, particularly for vegetation restoration.Many restoration studies have been conducted inthis area, however, most of which mainly focusedon vegetation types, plant community structure,plant diversity, and their impact on soil propertiesand nutrient cycling (Pan and Liu 1998; Wu et al.
2001;Pang et al. 2002), little information is availableon how the soil microbial community might changeduring the plantation restoration process. Duringthe vegetation restoration process, large changes inplant diversity, composition, and production occur(Chen et al. 2003; Chen and Li 2004) and lead tothe hypothesis that these changes should also af-fect the biomass and structure of the soil microbialcommunity. On the basis of the analysis above, thispaper aimed to investigate the changes in soil micro-bial community during the restoration process of apine plantation and to enhance our understandingof how aboveground and belowground componentof the ecosystem interact when plantations are es-tablished on the degraded land.
Materials and methods
Study areaThe study area is located at Mao County, SichuanProvince, Southwestern China (103◦41′06′′-103◦44′27′′E; 31◦37′20′′-31◦44′53′′N, and 1500–3090 m asl.) (Fig. 1). This area was the centralpart of the dry valley of upper reaches of MinjiangRiver, which is one of the four principal tributariesof the Changjiang river. The landform of thisarea is river-cut canyons and mountains. Themean annual temperature is 11.0◦ C, and meanannual precipitation is 494.8 mm. Mean annualevaporation is 1356 mm. The aridity index (theratio of potential maximum evaporation to rainfall)for this area is 1.92, which is typical of semiaridenvironments (Zhu and Li 1989). Brown soil isthe predominant soil type. The original nativevegetation of this area was forest. Because ofextensive deforestation and destruction, the forestcover was decreased from 50% in the Yuan dynasty(1297 A.D.-1341 A.D.), 30% in 1949, to 18% in1980 (Li 1990). Consequently, most of the forestsin this area were degraded into a secondary shrubcommunity (Quercus aliena var. acuteserrata andCorylus heterophylla) (Li 1990). Starting in the late1950s, large-scale plantations were established inthe area. The plantations were established predom-inantly on the shrubland and a majority of theplantations were composed of P. tabulaeformis, P.armandi, and Picea asperata. The plantations wereestablished from seedlings and by aerial planting.In this study, the chronosequence approach wasadopted. Three sites of pine plantations along a
Ann. N.Y. Acad. Sci. 1195 (2010) E82–E95 c© 2010 New York Academy of Sciences. E83

Soil microbial community and plantation restoration Liu et al.
Figure 1. The location of the study area (modified from Li et al. (2006)).
restoration chronosequence (12 years old (PF12),25 years old (PF25), 35 years old (PF35)), and theirpaired reference sites of natural shrub community(Shrub1, Shrub2, and Shrub3) were selected.The detail descriptions about plant communitycharacteristics for these selected sites were listed inTable 1. All the sites have similar topography andsoil type to minimize site differences.
Soil sampling and vegetation surveyTopsoil (0–10 cm) and subsoil (10–20 cm) sampleswere collected in April, July and October 2005 fromthree replicate plots (20 m × 20 m) at each siteas described above. The distances between any twoof these replicate plots exceeded 100 m. The sam-ples in each plot were collected randomly from fivepoints and mixed into one composite sample. Aftercarefully removing the surface organic matter andplant roots, each bulked sample was halved. One halfwas air-dried for the analysis of soil physicochemi-cal properties, the other half was passed through a2-mm sieve, placed in sealed plastic bags, kept on ice,transported to the laboratory, and stored at 4◦ C formicrobial assays. Microbial assays were conductedwithin 48 h of sampling.
Vegetation survey was also conducted in the sam-ple plots (20 m × 20 m) at each site. In these sam-ple plots, all tree species were identified and mea-sured for layer coverage, DBH (diameter at breastheight), total height, and frequency. Within eachsample plot, five 5 m × 5 m quadrats on the di-agonal line were chosen, where shrub species wereidentified and measured for layer coverage, base di-ameter, total height. Within each 5 m × 5 m quadrat,one 1 m × 1 m quadrat was set up to identifyherb species and measure for layer coverage andheight.
Soil physicochemical propertiesThe methods used for the analysis of soil physico-chemical properties were adopted from Lu (1999).Soil pH was determined in 1: 2.5 soil: water slurryusing a combination glass electrode. The bulk den-sity of the soils was determined by the core method.Soil organic carbon (SOC) was determined by thepotassium dichromate titration method after diges-tion. TN was determined by the semimicro Kjeldahlmethod. Total phosphorus (TP) was determinedcolorimetrically after wet digestion with H2SO4 plusHClO4.
E84 Ann. N.Y. Acad. Sci. 1195 (2010) E82–E95 c© 2010 New York Academy of Sciences.

Liu et al. Soil microbial community and plantation restoration
Table 1. Description of plant community properties under paired pine plantation and shrub vegetation plots
DBH or Plant
Base density Layer
Height diameter (plants coverage)
Site (m) (cm) ha−1) (%) Plant composition
PF12 7.57 9.42 2133 70 A: Pinus tabulaeformis; S: 35% layer coverage,
0.88 m height, 0.47 cm base diameter,
31,200 plants ha−1, main species: Quercus
aliena var. acuteserrata, Lespedeza bicolor,
Corylus heterophylla; H: 17% layer
coverage, 17.28 cm height, 75,4000 plants
ha−1, main species: Carex
enervis,Epimedium brevicornu, Thalictrum
aquilegifolium
PF25 11.65 12.45 2133 80 A: Pinus tabulaeformis; S: 40% layer coverage,
1.31 m height, 0.53 cm base diameter;
17,520 plants ha−1, main species: Quercus
aliena var. acuteserrata, Lespedeza bicolor,
Corylus heterophylla; H: 35% layer
coverage, 20.76 cm height, 9,66,000 plants
ha−1, main species: Pteris cretica,
Cimicifuga foetida, Carex enervis
PF35 13.88 13.88 2000 90 A: Pinus tabulaeformis; S: 40% layer coverage,
1.42 m height, 0.77 cm base diameter,
18,160 plants ha−1, main species: Salix
oritrepha, Lespedeza bicolor, Corylus
heterophylla; H: 31.4% layer coverage,
23.27 cm height, 8,00,000 plants ha−1,
main species: Pteris cretica, Deyeuxia grata
Shrub1 1.04 1.03 26,800 90 S: Quercus aliena var. acuteserrata, Cotinus
coggygriap, Ostryopsis davidiana, Lespedeza
bicolor; H: 20% layer coverage, 17.77 cm
height, 8,16,667 plants ha−1, main species:
Carex enervis, Epimedium brevicornu
Shrub2 1.52 0.82 22,400 90 S: Quercus aliena var. acuteserrata, Corylus
heterophylla,Lespedeza bicolor; H: 14.33%
layer coverage, 22.26 cm height, 8,90,000
plants ha−1, main species: Deyeuxia grata,
Carex enervis, Pteris cretica
Shrub3 0.9 0.27 17,600 40 S: Quercus aliena var. acuteserrata, Corylus
heterophylla, Lespedeza bicolor; H: 49.4%
layer coverage, 26.17 cm height, 9,46,000
plants ha−1, main species: Pteris cretica,
Astilbe chinensis
DBH diameter at breast height, A arbor layer, S shrub layer, H herb layer, PF12 12-year-old pine plantation, PF2525-year-old pine plantation, PF35 35-year-old pine plantation, Shrub1, Shrub2, Shrub3 the paired shrub communityfor each pine plantation site, respectively.
Ann. N.Y. Acad. Sci. 1195 (2010) E82–E95 c© 2010 New York Academy of Sciences. E85

Soil microbial community and plantation restoration Liu et al.
Soil CO2 emissionSoil CO2 emission was measured using a LI-CORsoil CO2 emission chamber (model LI-6400-09; LI-COR Biosciences, Lincoln, NE) and a LI-6400 in-frared gas analyzer (LI-COR Biosciences). Five soilcollars were positioned randomly in each plot andthe soil CO2 emission was measured hourly for24 h in April, July, and October in 2005. To minimizethe CO2 emission from litter, the litterfall layer wasremoved, and then the PVC soil collars (10.5 cm ininternal diameter and 8 cm in height) were inserted5 cm into the soil. The LI-6400 read five flux valuesat each time, and the average of these values wasused as the mean soil CO2 emission rate of this in-terval. Soil temperature and soil water content (%)were measured at the same time as the measuring ofthe soil CO2 emission rate. The soil temperature wasmeasured at 5-cm soil depth with a soil temperatureprobe (6000-09TC, LI-COR Inc., NE, ± 1.5◦ C, 0–50◦ C). A TDR probe (ML2X, England, ± 0.01%,0–40◦ C; ± 0.02%, 40–70◦ C) was used for deter-mine the soil volumetric water content.
Soil microbial communitySoil microbial biomass C (SMBC) was determinedby the chloroform fumigation method (Vance et al.1987), using a Kc = 0.45. The metabolic diver-sity patterns were measured using Biolog method(Garland and Mills 1991). The Biolog GN2 plates(Biolog Inc., Hayward, CA) used in our study con-tain 96 wells preloaded with a buffered nutrientmedium and a tetrazolium violet redox dye (Bi-olog 1993). Each of the 95 wells additionally con-tains a different carbon source, the remaining wellis left without a carbon source to function as acontrol. The moisture content of each soil sam-ple was determined, which ensured that a constantequivalent dry-mass of soil was used for prepara-tion of Biolog inoculum following 240-h incubationat 25◦ C.
The method used for inoculum preparation wasadopted from Zak et al. (1994b). Cell density of theinoculum can influence results because of the effectof cell numbers on the rates of color development.This can be minimized by analyzing the results atconstant average well color development (AWCD).Following Zak et al. (1994b), the 95 different carbonsources were assorted to six groups: carbohydrates(CH, n = 28), carboxylic acids (CA, n = 24), aminoacids (AA, n = 20), miscellaneous (MI, n = 12),
polymers (PO, n = 5), and amides and amines (AM,n = 6). The AWCD was calculated as a measure ofBiolog measurable metabolic activity either for indi-vidual substrate groups (AWCDS) or for all the meanof all substrates (AWCDT). Functional diversity wasmeasured as substrate diversity (H), substrate rich-ness (S) and substrate evenness (E). S is the num-ber of different substrates that used by the microbialcommunity. H encompasses both substrate richnessand the intensity of substrate use and quantified ac-cording to information theory (Magurran 1988). Emeasures the equitability of activity across all usedsubstrates. Since well color was already fully devel-oped after 48-h incubation, the Biolog plate dataafter 72-h incubation were used.
Statistical analysesOne-way ANOVA, ANCOVA, correlation analysis,and principal component analysis (PCA) were per-formed using SPSS 13.0 for Windows. Data thatwere not normally distributed were square-root orlog transformed prior to analysis. When significancewas observed at the P < 0.05 level, Tukey’s post hoctest was used for multiple comparison analysis. TheBiolog microplate data after 72-h incubation werecompared by PCA. The plots of the principal com-ponent scores for each sample were used to displaythe differences in metabolic diversity patterns be-tween soils through time.
Results
Soil physicochemical propertiesAt both sampling depths, SOC increased with theage of pine plantations, whereas the bulk densitywas found to decrease slightly in topsoil (Table 2).TN and TP exhibited a U-shaped trend: the values atPF25 were generally lower than at PF12 and PF35.However, soil C: N ratio exhibited a bell-shapedtrend with the values at PF25 significantly higherthan at PF12 and PF35 in topsoil. SOC, TN, and TPwere positively correlated with plantation age, whilepH and bulk density were negatively correlated withplantation age (Table 3). In addition, TN in PF12 and SOC in PF 12 and PF35 were significantlydifferent from the paired shrub community. How-ever, no significant differences were observed forother soil properties between the pine plantationsand the paired shrub community at each samplingsite.
E86 Ann. N.Y. Acad. Sci. 1195 (2010) E82–E95 c© 2010 New York Academy of Sciences.

Liu et al. Soil microbial community and plantation restoration
Table 2. Some physiochemical parameters of the topsoil and subsoil under paired pine plantation and shrubvegetation plots
Bulk density
Sites (g cm−3) pH SOC (%) TN (%) TP (g kg−1) Soil C:N ratio
Topsoil
PF12 1.17 (0.21) 7.08 (1.16) ab 1.28 (0.07) d 0.18 (0.04) c 0.41 (0.11) bc 7.72 (1.72) b
PF25 1.02 (0.02) 5.58 (0.06) c 2.29 (0.11) c 0.16 (0.02) c 0.21 (0.01) d 15.08 (2.15) a
PF35 0.95 (0.07) 6.11 (0.33) bc 3.53 (0.03) b 0.41 (0.05) b 0.60 (0.01) a 8.65 (1.17) b
Shrub1 1.12 (0.26) 8.08 (0.08) a 2.74 (0.03) bc 0.31 (0.03) bc 0.56 (0.02) ab 8.85 (0.16) b
Shrub2 1.10 (0.01) 5.09 (0.11) c 2.97 (0.05) bc 0.30 (0.09) bc 0.35 (0.07) cd 10.72 (3.40) ab
Shrub3 0.95 (0.10) 5.33 (0.15) c 7.25 (1.58) a 0.68 (0.16) a 0.73 (0.14) a 10.64 (0.18) ab
Subsoil
PF12 1.28 (0.10) 7.30 (1.32) ab 1.00 (0.08) b 0.24 (0.15) 0.41 (0.06) bc 4.56 (2.48) c
PF25 1.33 (0.21) 5.51 (0.02) c 1.11 (0.08) b 0.10 (0.03) 0.17 (0.02) d 10.84 (3.61) a
PF35 1.03 (0.05) 6.19 (0.09) bc 2.38 (0.01) b 0.29 (0.01) 0.54 (0.01) ab 8.12 (0.41) abc
Shrub1 1.18 (0.05) 8.31 (0.05) a 1.34 (0.02) b 0.25 (0.06) 0.55 (0.01) ab 5.50 (0.19) bc
Shrub2 1.28 (0.19) 5.36 (0.17) c 1.73 (0.02) b 0.17 (0.03) 0.26 (0.04) cd 10.22 (1.77) ab
Shrub3 1.03 (0.05) 5.33 (0.35) c 5.86 (3.13) a 0.52 (0.25) 0.68 (0.15) a 11.11 (0.73) a
Standard errors are in parentheses and values in the same column followed by the same letter are not significantlydifferent at P < 0.05.SOC soil organic carbon, TN total nitrogen, TP total phosphorus. For the abbreviations of sites see Table 1.
Soil microbial biomass C and microbialquotientThe SMBC in topsoil was significantly higher thanthat in subsoil (Fig. 2A). The SMBC at PF12 andPF35 was significantly lower than their paired shrubcommunities. The SMBC exhibited significantlycorrelations with plantation age, SOC, TN, TP, andbulk density (Table 3). The SMBC was significantlyhigher in PF35 than in PF12 and PF25 (Fig. 2A).
The soil microbial quotient (SMBC: SOC) underthe pine plantations was generally higher than underthe paired shrub communities in topsoil, whereassignificant difference was only found between PF35and its paired shrub community (Fig. 2B). For sub-soil, the soil microbial quotient under the pineplantations was generally lower than under theirpaired shrub communities except for PF35. Thesoil microbial quotient was negatively correlatedwith plantation age and TN, and positively corre-lated with pH and bulk density (Table 3). One-wayANOVA indicated that the soil microbial quotientshowed significant differences between PF12 andother pine plantation sites (F = 112.79; P < 0.01)with no significant difference between PF25 andPF35.
Substrate utilization profiles of soil microbialcommunitiesThe soil microbial metabolic activity, as measuredby AWCDT, showed differences with the age of thepine plantations (Fig. 3). However, pine planta-tions had similar microbial metabolic activities tothe paired shrub communities with an exception atPF35 for topsoil. There was an apparent decline inAWCDT with the plantation age increasing and thevalues ranked as follow: PF12 > PF35 > PF25 (topsoil) and PF12 > PF25 > PF35 (subsoil) (Fig. 3).Similar to SMBC and soil microbial quotient, theAWCDT showed significant difference between PF12and other pine plantation sites with no differencebetween PF25 and PF35.
In general, the microbial use of amides andamines (AM), polymers (PO), miscellaneous (MI),carboxylic acids (CA), amino acids (AA), and carbo-hydrates (CH) seems to be retarded and the specificsubstrate metabolic activity (AWCDS) of the six sub-strate groups under PF25 and PF35 was significantlylower than PF12 (Fig. 4). However, only AWCDS
of PO, MI, AA, and CH were significantly differ-ent between PF12 and other pine plantation sites.According to the correlation analysis, plantation age,
Ann. N.Y. Acad. Sci. 1195 (2010) E82–E95 c© 2010 New York Academy of Sciences. E87

Soil microbial community and plantation restoration Liu et al.
Table 3. Significant results of the correlation analysiswith microbial parameters used as dependent and plan-tation age and soil physicochemical parameters as inde-pendent variables
Plantation Bulk
age R density R
MI −0.482∗
MI 0.544∗
CH −0.518∗
CH 0.587∗ ∗
AWCDT −0.450∗
AWCDT 0.533∗
SMBC 0.906∗ ∗ ∗
SMBC −0.856∗ ∗ ∗
SOC 0.992∗ ∗ ∗
SMQ 0.887∗ ∗ ∗
SMQ −0.850∗ ∗
BD −0.992∗ ∗ ∗
TP
pH −0.675∗ ∗
H 0.576∗ ∗
TN 0.812∗ ∗
S 0.544∗
TP 0.492∗
PO 0.496∗
AA 0.533∗
pH SMBC 0.736∗ ∗ ∗
H 0.569∗ ∗
S 0.590∗ ∗
TN
AM 0.459∗
SMBC 0.930∗ ∗ ∗
PO 0.675∗ ∗
SMQ −0.494∗
MI 0.703∗ ∗
CA 0.588∗ ∗
SOC
AA 0.774∗ ∗ ∗
SMBC 0.941∗ ∗ ∗
CH 0.769∗ ∗ ∗
AWCDT 0.803∗ ∗ ∗
SMQ 0.823∗ ∗ ∗
Soil C:N ratio
H −0.707∗ ∗ ∗
S −0.701∗ ∗
AM −0.554∗ ∗
PO −0.724∗ ∗ ∗
MI −0.564∗
CA −0.582∗ ∗
AA −0.808∗ ∗ ∗
CH −0.625∗ ∗
AWCDT −0.724∗ ∗ ∗
TN, total nitrogen; TP, total phosphorus; SOC, soil or-ganic carbon; SMBC, soil microbial biomass carbon;SMQ, soil microbial quotient; H , substrate diversity; S,substrate richness; AWCDT , microbial metabolic activity;AM , amides and amines; PO, polymers; MI, miscella-neous; AA, amino acids; CA, carboxylic acids; CH, carbo-hydrates.P levels:
∗<0.05,
∗ ∗<0.01,
∗ ∗ ∗<0.001.
Figure 2. Changes in (A) soil microbial biomass C(SMBC) and (B) soil microbial quotient along a restora-tion chronosequence in pine plantations and their pairedshrub vegetation plots. Bars represent standard errors ofmeans. Within each data series, columns marked by thesame letter are not significantly different at P < 0.05. Forthe abbreviations of sites see Table 1.
pH, soil C: N ratio, bulk density, and TP are themajor factors determining the Biolog measurablecomponents of microbial community at the sitesinvestigated (Table 3). The plantation age and soilC: N ratio was negatively correlated with AWCDT
and AWCDS of several functional groups. Soil pHwas positively correlated with AWCDT and AWCDS
of the six functional groups. Soil bulk density waspositively correlated with AWCDT and AWCDS ofMI and CH, and TP was positively correlated withAWCDS of PO and AA (Table 3).
The decline in soil microbial metabolic activityduring pine plantation restoration was also con-firmed by the soil CO2 emission data (Fig. 5A). Ourresults also indicated that soil temperature and soilwater content varied greatly among sampling sites(Fig. 5B). Soil CO2 emission decreased graduallywith the age of pine plantation. ANCOVA indicatedthat the effect of plantation age on soil CO2 emission
E88 Ann. N.Y. Acad. Sci. 1195 (2010) E82–E95 c© 2010 New York Academy of Sciences.

Liu et al. Soil microbial community and plantation restoration
Figure 3. Average well color development of all sub-strates (AWCDT) in topsoil and subsoil along a restora-tion chronosequence in pine plantations and theirpaired shrub vegetation plots. Bars represent standarderrors of means. Within each data series, columnsmarked by the same letter are not significantly dif-ferent at P < 0.05. For the abbreviations of sites seeTable 1.
was still significant (F = 9.936, P < 0.001) when soiltemperature (F = 706.158, P < 0.001) and soil wa-ter content (F = 2.205, P = 0.139) were included ascovariates in the analysis. ANCOVA also suggestedthat soil temperature played an important role in ex-plaining the variation of soil CO2 emission amongthe sampling sites.
Ordination biplots for PCA of Biolog data areshown in Figure 6. The different positions of therestoration chronosequences for the first two prin-cipal components indicated that there were largedifferences in the metabolic capability of the soilmicrobial community between sampling sites. Fortopsoil, PC1 and PC2 explained 40.1% and 17.7%of the variation in soil microbial community, re-spectively. An ANOVA of the PC1 scores obtainedfrom topsoil indicated that PC1 scores were signifi-cantly different (F = 8.251; P < 0.001) and mainlyseparated PF12 from PF25 and PF35. However, nosignificant differences were found between the PC2scores (F = 1.580, P = 0.199). For subsoil, PC1and PC2 explained 61.3% and 10.0% of the varia-tion in soil microbial community, respectively. ThePCA results obtained from the subsoil were similar
Figure 4. Average well color developments of the six substrate groups (AWCDS) in topsoil and subsoil alonga restoration chronosequence in pine plantations and their corresponding shrub vegetation plots. Bars representstandard errors of means. AM, amides and amines; PO, polymers; MI, miscellaneous; AA, amino acids; CA, carboxylicacids; CH, carbohydrates. For the abbreviations of sites see Table 1.
Ann. N.Y. Acad. Sci. 1195 (2010) E82–E95 c© 2010 New York Academy of Sciences. E89

Soil microbial community and plantation restoration Liu et al.
Figure 5. Changes in (A) soil CO2 emission and (B)soil temperature and soil water content along a restora-tion chronosequence in pine plantations and their pairedshrub vegetation plots. Bars represent standard errors ofmeans. Within each data series, columns marked by thesame letter are not significantly different at P < 0.05. Forthe abbreviations of sites see Table 1. The data for Shrub3are not available.
to those from topsoil and the metabolic diversitypatterns showed a significant separation along PC1(F =5.434; P =0.002) but not along PC2 (F =0.819;P =0.548). PF12 was again separated from PF25 andPF35 along PC1.
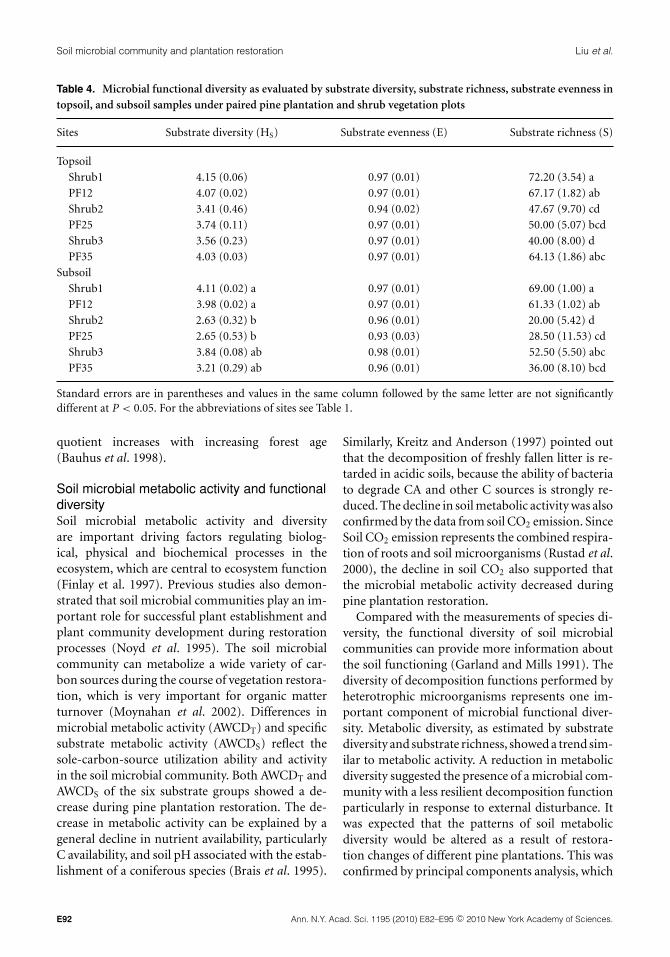
Both pine plantations and their paired shrubcommunities at each site were similar in the func-tional diversity of the soil microbial community(Table 4). Substrate diversity and substrate richnessshowed a trend similar to microbial metabolic activ-ity (AWCDT and AWCDS) and the values followedthe order PF12 > PF35 > PF25 in both soil layers.However, substrate diversity and substrate richnesswere found significantly different between restora-tion chronosequences only in subsoil. The results ofthe correlation analyses suggested that soil pH, soilC: N ratio and TP were the primary factors influ-encing the function diversity of the soil microbialcommunity (Table 3).
Discussions and conclusions
Soil microbial biomass and microbial quotientThe vegetation cover has substantial effects on soilproperties, mainly due to its contribution to theaccumulation of organic matter in soils (Rutiglianoet al. 2004). There was an increase of SOC and adecrease of bulk density with increasing age of pineplantations. We also found that PF25 had lower TNand TP, and a higher soil C: N ratio than PF12 andPF35, which indicated that the availability of N andP was low under PF25 where soil N and P likelybecame limiting.
Soil microbial biomass reflects the degree of im-mobilization of C and N. A decrease in soil mi-crobial biomass could result in nutrient mineral-ization, while an increase in microbial biomass maylead to nutrient immobilization. The SMBC was sig-nificantly lower under pine plantations than theirpaired shrub communities. This can be attributedto a more diverse litter under the shrub community,which is able to support a larger and diverse mi-crobial community (Nsabimana et al. 2004). Thehigh content of phenols and other biochemicalsin the litter of pine needles may inhibit microbialgrowth and activity (Nsabimana et al. 2004; Prihaand Smolander 1997). SMBC increased with plan-tation age, SOC, TN and TP in this study, whichwas consistent with the studies reporting an in-crease in SMBC during plant primary (Insam andHaselwandter 1989) and secondary succession(Santruckova 1992). Changes in soil nutrients dur-ing pine plantation restoration can explain the in-crease in SMBC. In addition, this increase likelyreflects the increase in above-ground net pri-mary production which regulates the soil labileC content (Zak et al. 1994a). However, Aikioet al. (2000) observed a decrease in organic mat-ter, soil microbial biomass and activity as wellas soil nutrients along the primary succession inFinland, due to leaching of nutrients from thesandy mineral soil and thinning of the humuslayer.
Soil microbial quotient, which can be interpretedas the portion of SOC immobilized in microbialcells, is a useful parameter for monitoring the soilorganic matter and a sensitive index for measuringSOC or soil microbial biomass (Garcia et al. 2002).The soil microbial quotient declined with the ageof plantation restoration. Similar trends have been
E90 Ann. N.Y. Acad. Sci. 1195 (2010) E82–E95 c© 2010 New York Academy of Sciences.

Liu et al. Soil microbial community and plantation restoration
Figure 6. Principal components analysis of carbon utilization profiles (Biolog data after 72-h incubation) from (A)topsoil and (B) subsoil along a restoration chronosequence in pine plantations and their paired shrub vegetationplots. Bars represent standard errors of means. For the abbreviations of sites see Table 1.
observed during plant primary succession (Insamand Domsch 1988; Ding et al. 1992; Schipper et al.2001). A high soil microbial quotient at the onset ofrestoration is likely due to the relatively high pro-portion of organic matter from fresh litter inputsbeing available to support the microbial commu-nity. Consequently, in early stages of restoration,the SMBC: SOC ratio is relatively high. Althoughthe proportion of labile soil organic matter is high
at the start of restoration, the absolute amount ofavailable carbon is very low. As restoration proceeds,recalcitrant organic matter accumulates so that asmaller proportion of total soil organic matter isavailable to support the microbial community, andthe soil microbial quotient declines. The microbialquotient was thus affected not only by the quantity,but also by the quality, of the carbon input. Otherstudies, however, have shown that the soil microbial
Ann. N.Y. Acad. Sci. 1195 (2010) E82–E95 c© 2010 New York Academy of Sciences. E91
Soil microbial community and plantation restoration Liu et al.
Table 4. Microbial functional diversity as evaluated by substrate diversity, substrate richness, substrate evenness intopsoil, and subsoil samples under paired pine plantation and shrub vegetation plots
Sites Substrate diversity (HS) Substrate evenness (E) Substrate richness (S)
Topsoil
Shrub1 4.15 (0.06) 0.97 (0.01) 72.20 (3.54) a
PF12 4.07 (0.02) 0.97 (0.01) 67.17 (1.82) ab
Shrub2 3.41 (0.46) 0.94 (0.02) 47.67 (9.70) cd
PF25 3.74 (0.11) 0.97 (0.01) 50.00 (5.07) bcd
Shrub3 3.56 (0.23) 0.97 (0.01) 40.00 (8.00) d
PF35 4.03 (0.03) 0.97 (0.01) 64.13 (1.86) abc
Subsoil
Shrub1 4.11 (0.02) a 0.97 (0.01) 69.00 (1.00) a
PF12 3.98 (0.02) a 0.97 (0.01) 61.33 (1.02) ab
Shrub2 2.63 (0.32) b 0.96 (0.01) 20.00 (5.42) d
PF25 2.65 (0.53) b 0.93 (0.03) 28.50 (11.53) cd
Shrub3 3.84 (0.08) ab 0.98 (0.01) 52.50 (5.50) abc
PF35 3.21 (0.29) ab 0.96 (0.01) 36.00 (8.10) bcd
Standard errors are in parentheses and values in the same column followed by the same letter are not significantlydifferent at P < 0.05. For the abbreviations of sites see Table 1.
quotient increases with increasing forest age(Bauhus et al. 1998).
Soil microbial metabolic activity and functionaldiversitySoil microbial metabolic activity and diversityare important driving factors regulating biolog-ical, physical and biochemical processes in theecosystem, which are central to ecosystem function(Finlay et al. 1997). Previous studies also demon-strated that soil microbial communities play an im-portant role for successful plant establishment andplant community development during restorationprocesses (Noyd et al. 1995). The soil microbialcommunity can metabolize a wide variety of car-bon sources during the course of vegetation restora-tion, which is very important for organic matterturnover (Moynahan et al. 2002). Differences inmicrobial metabolic activity (AWCDT) and specificsubstrate metabolic activity (AWCDS) reflect thesole-carbon-source utilization ability and activityin the soil microbial community. Both AWCDT andAWCDS of the six substrate groups showed a de-crease during pine plantation restoration. The de-crease in metabolic activity can be explained by ageneral decline in nutrient availability, particularlyC availability, and soil pH associated with the estab-lishment of a coniferous species (Brais et al. 1995).
Similarly, Kreitz and Anderson (1997) pointed outthat the decomposition of freshly fallen litter is re-tarded in acidic soils, because the ability of bacteriato degrade CA and other C sources is strongly re-duced. The decline in soil metabolic activity was alsoconfirmed by the data from soil CO2 emission. SinceSoil CO2 emission represents the combined respira-tion of roots and soil microorganisms (Rustad et al.2000), the decline in soil CO2 also supported thatthe microbial metabolic activity decreased duringpine plantation restoration.
Compared with the measurements of species di-versity, the functional diversity of soil microbialcommunities can provide more information aboutthe soil functioning (Garland and Mills 1991). Thediversity of decomposition functions performed byheterotrophic microorganisms represents one im-portant component of microbial functional diver-sity. Metabolic diversity, as estimated by substratediversity and substrate richness, showed a trend sim-ilar to metabolic activity. A reduction in metabolicdiversity suggested the presence of a microbial com-munity with a less resilient decomposition functionparticularly in response to external disturbance. Itwas expected that the patterns of soil metabolicdiversity would be altered as a result of restora-tion changes of different pine plantations. This wasconfirmed by principal components analysis, which
E92 Ann. N.Y. Acad. Sci. 1195 (2010) E82–E95 c© 2010 New York Academy of Sciences.

Liu et al. Soil microbial community and plantation restoration
showed that the metabolic diversity patterns un-der PF12 were significantly different from that ofPF25 and PF35. These differences might have re-flected the differences in the ability of the microbialcommunities to metabolize different carbon sourcesat these sites. Furthermore, differences in carbonsource utilization can be linked to differences incarbon source availability (Grayston et al. 1998).Soil pH, soil C: N ratio and TP were closely corre-lated with the substrate diversity and substrate rich-ness, which revealed the role of soil characteristics indetermining microbial communities in soils. Bothmicrobial metabolic activity (AWCDT and AWCDS)and functional diversity were negatively correlatedwith soil C: N ratio, suggesting that the depressionof several groups in spots of comparatively high Ccontent in soils causes a more even distribution insubstrate use. A possible explanation is that the ac-cumulation of recalcitrant substrates has led to animpoverishment of the microbial community. Thiswas consistent with the findings that some special-ization of function occurs among microorganismswith increasing recalcitrance of SOM during laterstages of the decomposition process (Ladd et al.1996). We conclude that functional diversity lossduring the process of pine plantation restorationcould be explained by low pH caused by pine nee-dle decomposition, leading to an accumulation inrecalcitrant carbon in soils.
Implications for restoration practicesSOC and soil microbial biomass carbon underpine plantations were accumulating with increas-ing plantation age, suggesting that pine plantationrestoration may be a satisfactory restoration prac-tice from a perspective of soil carbon sequestration.However, there was an apparent reduction of mi-crobial metabolic activity and functional diversityduring pine plantation restoration, which causedby the decrease in pH and an accumulation inrecalcitrant carbon in soils. The results indicatedthat pine plantation might not be the best choicein terms of the maintenance of microbial func-tional diversity. On May 12, 2008, an earthquakeoccurred right in the study area (103.4◦E; 31.0◦N)with a magnitude of 8.0. The earthquake has dra-matically changed the landscape and destructed thevegetation. An urgent issue in the area is to restorethe earthquake-damaged ecosystem, particularly forvegetation restoration. Since our work was done be-
fore the earthquake, it will provide baseline data forthe restoration of these damaged ecosystems.
Acknowledgments
This project was supported by National Basic Re-search Program of China (No.2009CB421104), theNational Natural Sciences Foundation of China (No.40621061 and No.40871248), and the KnowledgeInnovation Program of South China Botanical Gar-den, Chinese Academy of Sciences.
Conflicts of interest
The authors declare no conflicts of interest.
References
Aikio, S., H. Vare & R. Strommer. 2000. Soil microbial activity
and biomass in the primary succession of a dry heath
forest. Soil Biol. Biochem. 32: 1091–1100.
Arunachalam, A. & H.N. Pandey. 2003. Ecosystem restora-
tion of Jhum fallows in Northeast India: microbial C and
N along altitudinal and successional gradients. Restor.
Ecol. 11: 168–173.
Arunachalam, A. et al. 1996. The impact of disturbance on
detrital dynamics and soil microbial biomass of a Pinus
kesiya forest in north-east India. Forest Ecol. Manag. 88:
273–282.
Bauhus, J., D. Pare & L. Cote. 1998. Effects of tree species
stand age and soil type on soil microbial biomass and its
activity in a southern boreal forest. Soil Biol. Biochem.
30: 1077–1089.
Biolog. 1993. Instructions for Use of Biolog GP and GN Mi-
croplates. Biolog. Hayward, CA.
Brais, S. et al. 1995. Changes in nutrient availability and forest
floor characteristics in relation to stand age and forest
composition in the southern part of the boreal forest of
northwestern Quebec. Forest Ecol. Manag. 76: 181–189.
Chen, X.W. & B.L. Li. 2004. Tree diversity change in remain-
ing primary mixed-broadleaved Korean pine forest un-
der climate change and human activities. Biodiversity
Conserv. 13: 563–577.
Chen, X.W., B.L. Li & Z.S. Lin. 2003. The acceleration of suc-
cession for the restoration of the mixed-broadleaved Ko-
rean pine forests in Northeast China. Forest Ecol. Manag.
177: 503–514.
Diaz-Ravina, M., M.J. Acea & T. Carballas. 1993. Microbial
biomass and its contribution to nutrient concentration
in forest soils. Soil Biol. Biochem. 25: 25–31.
Ann. N.Y. Acad. Sci. 1195 (2010) E82–E95 c© 2010 New York Academy of Sciences. E93

Soil microbial community and plantation restoration Liu et al.
Ding, M.M. et al. 1992. Effect of afforestation on microbial
biomass and activity in soils of tropical China. Soil Biol.
Biochem. 24: 865–872.
Finlay, B.J., S.C. Maberly & J.I. Cooper. 1997. Micro-
bial diversity and ecosystem function. Oikos 80: 209–
213.
Garcia, C. et al. 2002. Effect of plant cover decline on chemical
and microbiological parameters under Mediterranean
climate. Soil Biol. Biochem. 34: 635–642.
Garland, J.L. & A. Mills. 1991. Classification and character-
ization of heterotrophic microbial communities on the
basis of patterns of community-level sole-carbon-source
utilization. Appl. Environ. Microb. 57: 2351–2359.
Grayston, S.J. et al. 1998. Selective influence of plant species
on microbial diversity in the rhizosphere. Soil Biol.
Biochem. 30: 369–378.
Harris, J.A. 2003. Measurements of the soil microbial com-
munity for estimating the success of restoration. Eur. J.
Soil. Sci. 54: 801–808.
Insam, H. & K.H. Domsch. 1988. Relationship between soil
organic carbon and microbial biomass on chronose-
quences of the reclamation sites. Microbial Ecol. 15: 177–
188.
Insam, H. & K. Haselwandter. 1989. Metabolic quotient of the
soil microflora in relation to plant succession. Oecologia
79: 174–178.
Jia, G.M. et al. 2005. Microbial biomass and nutrients in
soil at the different stages of secondary forest succession
in Ziwulin, Northwest China. Forest Ecol. Manag. 217:
117–125.
Kreitz, S. & T.H. Anderson. 1997. Substrate utilization pat-
terns extractable and non-extractable bacterial fractions
in neutral and acidic beech forest soils. In Microbial
Communities: Functional versus Structural Approaches.
H. Insam & A. Rangger, Eds.: 149–160. Springer. Berlin-
Heidelberg-New York.
Ladd, J.N. et al. 1996. Soil structure and biological activity. In
Soil Biochemistry. G. Stotzky & J.M. Bollag, Eds.: 23–77.
Marcel Dekker. New York.
Li, A.N. et al. 2006. Eco-environmental vulnerability evalu-
ation in mountainous region using remote sensing and
GIS-A case study in the upper reaches of Minjiang River,
China. Ecol. Model. 192: 175–187.
Li, C.B. 1990. Forest Ecological Research in Sichuan Province.
Sichuan Science and Technology Press. Chengdu, China.
Lu, R.K. 1999. Analytical Methods of Soil Agrochemistry. Chi-
nese Agriculture Science and Technology Press. Beijing.
Magurran, A.E. 1988. Ecological Diversity and its Measure-
ment . Princeton University Press. Princeton, NJ.
Moynahan, O.S., C.A. Zabinski & J.E. Gannon. 2002. Micro-
bial community structure and carbon utilization diver-
sity in a mine tailings revegetation study. Restor. Ecol.
10: 77–87.
Noyd, R.K. et al. 1995. Native prairie grasses and microbial
community responses to reclamation of taconite iron
ore tailing. Can J. Bot. 73: 1645–1654.
Nsabimana, D., R.J. Haynes & F.M. Wallis. 2004. Size, activity
and catabolic diversity of the soil microbial biomass as
affected by land use. Appl. Soil Ecol. 26: 81–92.
Pan, K.W. & Z.G. Liu. 1998. Structures and dynamics of the
tree layer of artificial mixed forests in clear-cut areas of
subalpine dark coniferous forests. Chinese J. Appl. Envi-
ron. Biol. 4: 327–334 (In Chinese with English abstract).
Pang, X.Y. et al. 2002. Nutrient distribution and cycling of
artificial and natural subalpine spruce forests in Western
Sichuan. J. Appl. Environ. Biol. 1: 1–7 (In Chinese with
English abstract).
Panikov, N.S. 1999. Understanding and prediction of soil
microbial community dynamics under global change.
Appl. Soil Ecol. 11: 161–176.
Priha, O. & A. Smolander. 1997. Microbial biomass and ac-
tivity in soil and litter under Pinus sylvestris, Picea abies
and Betula pendula at two forest sites. Biol. Fert. Soils 33:
17–24.
Rogers, B.F. & R.L. Tate III. 2001. Temporal analysis of the soil
microbial community along a toposequence in Pineland
soils. Soil Biol. Biochem. 33: 1389–1401.
Rustad, L.E., T.G. Huntington & R.D. Boone. 2000. Controls
on soil respiration: implications for climate change. Bio-
geochemistry 48: 1–6.
Rutigliano, F.A., R.D. Ascoli & A.V. De Santo. 2004. Soil
microbial metabolism and nutrient status in a Mediter-
ranean area as affected by plant cover. Soil Biol. Biochem.
36: 1719–1729.
Santruckova, H. 1992. Microbial biomass, activity and soil
respiration in relation to secondary succession. Pedobi-
ologia 36: 341–350.
Schimel, D.S. 1995. Terrestrial ecosystems and the carbon
cycle. Global Change Biol. 1: 77–91.
Schipper, L.A. et al. 2001. Changes in microbial heterotrophic
diversity along five plant successional sequences. Soil
Biol. Biochem. 33: 2093–2103.
Vance, E.D., P.C. Brookes & D.S. Jenkinson. 1987. An extrac-
tion method for measuring soil microbial biomass C.
Soil Biol. Biochem. 19: 703–707.
White, C. et al. 2005. Functional diversity of microbial com-
munities in the mixed boreal plain forest of central
Canada. Soil Biol. Biochem. 37: 1359–1372.
Wu, Y. et al. 2001. Species diversity changes in subalpine
coniferous forests of different restoration stages and
E94 Ann. N.Y. Acad. Sci. 1195 (2010) E82–E95 c© 2010 New York Academy of Sciences.

Liu et al. Soil microbial community and plantation restoration
their effects on soil properties. J. Plant Ecol. (Chinese
Version) 25: 641–647 (In Chinese with English abstract).
Zak, D.R. et al. 1994a. Plant production and soil microorgan-
isms in late-successional ecosystems: a continental-scale
study. Ecology 75: 2333–2347.
Zak, J.C. et al. 1994b. Functional diversity of microbial com-
munities: a quantitative approach. Soil Biol. Biochem.
26: 1101–1108.
Zhu, P.F. & D.R. Li. 1989. Forest Soil in Sichuan (in Chinese).
Sichuan Science and Technology Press. Chengdu, China.
Ann. N.Y. Acad. Sci. 1195 (2010) E82–E95 c© 2010 New York Academy of Sciences. E95