Changes in sediment redox conditions following the BP DWH blowout event
12
Changes in sediment redox conditions following the BP DWH blowout event D.W. Hastings a,n , P.T. Schwing b , G.R. Brooks a , R.A. Larson a,b , J.L. Morford c , T. Roeder a , K.A. Quinn b , T. Bartlett a , I.C. Romero b , D.J. Hollander b a Eckerd College, 4200 54th Ave South, Saint Petersburg, FL 33711, USA b University of South Florida, College of Marine Science,140 7th Ave. South, Saint Petersburg, FL 33701, USA c Franklin & Marshall College, Chemistry Department, P.O. Box 3003, Lancaster, PA 17604-3003, USA article info Keywords: Oil spill Gulf of Mexico Deepwater Horizon Paleoredox Trace metal Rhenium Manganese abstract Following the blowout of the Macondo well, a pulse in sedimentation resulted in changes in sedimentary redox conditions. This is demonstrated by downcore and temporal changes in the concentration of redox sensitive metals: Mn, Re, and Cd. Sediment cores collected in the NE Gulf of Mexico (GoM) reveal increased sedimentation after the Deepwater Horizon (DWH) blowout. The formation of mucous-rich marine snow in surface waters and subsequent rapid deposition to underlying sediments is the likely cause. Respiration of this material resulted in decreased pore-water oxygen concentration and a shoaled redoxcline, resulting in two distinct Mn peaks in sediments following the event, one typically in the top 10 mm, with the other at 20–30 mm. Most cores near the wellhead reveal this non-steady state behavior for up to two years after the event. Associated with the Mn minimum between the two Mn peaks, a modest (15–30%) enrichment of Re consistent with reducing sediments typically exists. A three-year time series of three stations following the event reveal that sediment Re increased 3–4 times compared to the pre-impact baseline value for two years, indicating sediments are increasingly more reducing for two years. In the third year, Re concentration decreased, suggesting a return towards pre-impact conditions. In select sites where the density of benthic foraminifera was determined, an assemblage- wide decrease occurred coincident with reducing conditions as determined by redox sensitive metals, demonstrating the important consequences of changing redox conditions on benthic ecosystems. Determination of redox sensitive metals will continue to constrain the temporal evolution of reducing conditions, which will serve to document the long-term effects of the spill, and the possible return to pre-event conditions. & 2014 The Authors. Published by Elsevier Ltd. This is an open access article under the CC BY-NC-ND license (http://creativecommons.org/licenses/by-nc-nd/4.0/). 1. Introduction The uncontrolled release of oil following the blowout event on April 20, 2010 on the Deepwater Horizon drilling platform was unique in many respects. It was the largest offshore accident in the history of the U.S. petroleum industry with over 600 million L of oil (Atlas and Hazen, 2011) and 1.0–1.5 10 10 mol of natural gas (Valentine et al., 2010) released into the marine environment at a depth of 1544 m, accompanied by over 6.8 million L of dispersant (Kujawinski et al., 2011). This was the largest accidental release of petroleum and gas into the marine environment, at the deepest depth, with the greatest amount of dispersant added during the spill. The dispersant was added both at depth and at the surface. The exact fate of the released oil is difficult to determine; best estimates are that 35–60% reached the surface, where it evaporated, was deposited on the coast, or was incorporated into flocculent material (Ryerson et al., 2012; Thibodeaux et al., 2011). Subsurface intrusions of natural gas and oil formed, at 1000–1300 m and at 400 m (Joye et al., 2011). These estimates leave about one third of the total oil released unaccounted for. During and following the event, a large amount of mucous-rich marine snow contaminated with oil formed in the surface waters (Passow et al., 2012). Several mechanisms have been proposed to explain the formation of the marine snow following the event, including coagulation of phytoplankton with oil droplets; coagula- tion of suspended matter with the oil droplets; and production of mucosoid material from the degraders of the oil, which grew and multiplied rapidly following the event (Passow et al., 2012). Increased microbial activity following the event has been well documented at the surface and in the water column (Edwards et al., 2011; Joye et al., 2014; Redmond and Valentine, 2011; Valentine Contents lists available at ScienceDirect journal homepage: www.elsevier.com/locate/dsr2 Deep-Sea Research II http://dx.doi.org/10.1016/j.dsr2.2014.12.009 0967-0645/& 2014 The Authors. Published by Elsevier Ltd. This is an open access article under the CC BY-NC-ND license (http://creativecommons.org/licenses/by-nc-nd/4.0/). n Corresponding author. Tel.: þ1 727 864 7884. E-mail address: [email protected] (D.W. Hastings). Please cite this article as: Hastings, D.W., et al., Changes in sediment redox conditions following the BP DWH blowout event. Deep-Sea Res. II (2015), http://dx.doi.org/10.1016/j.dsr2.2014.12.009i Deep-Sea Research II ∎ (∎∎∎∎) ∎∎∎–∎∎∎
Transcript of Changes in sediment redox conditions following the BP DWH blowout event

Changes in sediment redox conditions following the BP DWHblowout event
D.W. Hastings a,n, P.T. Schwing b, G.R. Brooks a, R.A. Larson a,b, J.L. Morford c, T. Roeder a,K.A. Quinn b, T. Bartlett a, I.C. Romero b, D.J. Hollander b
a Eckerd College, 4200 54th Ave South, Saint Petersburg, FL 33711, USAb University of South Florida, College of Marine Science, 140 7th Ave. South, Saint Petersburg, FL 33701, USAc Franklin & Marshall College, Chemistry Department, P.O. Box 3003, Lancaster, PA 17604-3003, USA
a r t i c l e i n f o
Keywords:Oil spillGulf of MexicoDeepwater HorizonPaleoredoxTrace metalRheniumManganese
a b s t r a c t
Following the blowout of the Macondo well, a pulse in sedimentation resulted in changes in sedimentaryredox conditions. This is demonstrated by downcore and temporal changes in the concentration of redoxsensitive metals: Mn, Re, and Cd. Sediment cores collected in the NE Gulf of Mexico (GoM) revealincreased sedimentation after the Deepwater Horizon (DWH) blowout. The formation of mucous-richmarine snow in surface waters and subsequent rapid deposition to underlying sediments is the likelycause. Respiration of this material resulted in decreased pore-water oxygen concentration and a shoaledredoxcline, resulting in two distinct Mn peaks in sediments following the event, one typically in the top10 mm, with the other at 20–30 mm. Most cores near the wellhead reveal this non-steady state behaviorfor up to two years after the event. Associated with the Mn minimum between the two Mn peaks, amodest (15–30%) enrichment of Re consistent with reducing sediments typically exists. A three-yeartime series of three stations following the event reveal that sediment Re increased 3–4 times comparedto the pre-impact baseline value for two years, indicating sediments are increasingly more reducing fortwo years. In the third year, Re concentration decreased, suggesting a return towards pre-impactconditions. In select sites where the density of benthic foraminifera was determined, an assemblage-wide decrease occurred coincident with reducing conditions as determined by redox sensitive metals,demonstrating the important consequences of changing redox conditions on benthic ecosystems.Determination of redox sensitive metals will continue to constrain the temporal evolution of reducingconditions, which will serve to document the long-term effects of the spill, and the possible return topre-event conditions.& 2014 The Authors. Published by Elsevier Ltd. This is an open access article under the CC BY-NC-ND
license (http://creativecommons.org/licenses/by-nc-nd/4.0/).
1. Introduction
The uncontrolled release of oil following the blowout event onApril 20, 2010 on the Deepwater Horizon drilling platform wasunique in many respects. It was the largest offshore accident in thehistory of the U.S. petroleum industry with over 600 million L ofoil (Atlas and Hazen, 2011) and 1.0–1.5�1010 mol of natural gas(Valentine et al., 2010) released into the marine environment at adepth of 1544 m, accompanied by over 6.8 million L of dispersant(Kujawinski et al., 2011). This was the largest accidental release ofpetroleum and gas into the marine environment, at the deepestdepth, with the greatest amount of dispersant added during thespill. The dispersant was added both at depth and at the surface.
The exact fate of the released oil is difficult to determine; bestestimates are that 35–60% reached the surface, where it evaporated,was deposited on the coast, or was incorporated into flocculentmaterial (Ryerson et al., 2012; Thibodeaux et al., 2011). Subsurfaceintrusions of natural gas and oil formed, at 1000–1300 m and at�400 m (Joye et al., 2011). These estimates leave about one third ofthe total oil released unaccounted for.
During and following the event, a large amount of mucous-richmarine snow contaminated with oil formed in the surface waters(Passow et al., 2012). Several mechanisms have been proposed toexplain the formation of the marine snow following the event,including coagulation of phytoplankton with oil droplets; coagula-tion of suspended matter with the oil droplets; and production ofmucosoid material from the degraders of the oil, which grew andmultiplied rapidly following the event (Passow et al., 2012).
Increased microbial activity following the event has been welldocumented at the surface and in the water column (Edwards et al.,2011; Joye et al., 2014; Redmond and Valentine, 2011; Valentine
Contents lists available at ScienceDirect
journal homepage: www.elsevier.com/locate/dsr2
Deep-Sea Research II
http://dx.doi.org/10.1016/j.dsr2.2014.12.0090967-0645/& 2014 The Authors. Published by Elsevier Ltd. This is an open access article under the CC BY-NC-ND license (http://creativecommons.org/licenses/by-nc-nd/4.0/).
n Corresponding author. Tel.: þ1 727 864 7884.E-mail address: [email protected] (D.W. Hastings).
Please cite this article as: Hastings, D.W., et al., Changes in sediment redox conditions following the BP DWH blowout event. Deep-SeaRes. II (2015), http://dx.doi.org/10.1016/j.dsr2.2014.12.009i
Deep-Sea Research II ∎ (∎∎∎∎) ∎∎∎–∎∎∎

et al., 2010; Ziervogel et al., 2012). The consequent microbial produc-tion of sticky transparent exopolymeric particles (TEP) enhances theaggregation process, as would the release of exopolymeric substances(EPS) by phytoplankton (Passow, 2000; Verdugo and Santschi, 2010).Marine snow may have formed within the subsurface oil intrusionsas well as at the surface (Passow, 2014; Passow et al., 2012; Ziervogelet al., 2012).
The large flocs of marine snow observed in the upper watercolumn were the precursors of what is observed as a substantialsedimentation pulse (Schrope, 2013). While exact documentation ofthe sedimentation event remains challenging due to the rapid timescale, there is evidence in the benthic environment of increasedsedimentation over an extensive area in the NE Gulf of Mexico(GoM) close to the wellhead following the spill (Montagna et al.,2013; White et al., 2012; Ziervogel et al., 2012). The swift transportof particles from the surface to the sediments is a well-establishedprocess with relatively large sinking particles (e.g. Alldredge andSilver, 1988; Asper et al., 1992). Consistent with this pulse, a visuallydistinctive, brown, fine-grained surface layer in the top 1–2 cmwithdark brown or black bands is seen in the sediment cores affected bythe blowout event.
A single mechanism for this increase in sedimentation has notbeen identified. The formation and aggregation of marine snowfollowing the event, sinking rapidly to the bottom, is one likelyscenario. Mucous-rich marine snow was observed following the spill(Passow et al., 2012), and in simulations of the spill (Passow, 2014),which is consistent with the rapid sedimentation to depth. Changes inthe outflow of the Mississippi River is another feasible mechanism.The Mississippi River was diverted in an effort to protect sensitivecoastlines, and with a modest increase in Mississippi River outflow(Bianchi et al., 2011), siliciclastic input to the GoMmay have increased.About 5% of the total oil released was burned (Ryerson et al., 2012);the pyrogenic remnant waste could be another contributor to thesedimentation pulse, albeit a minor one.
Our hypothesis was that the pulse of organic rich material to thesea floor associated with the marine snow event resulted in increasedrespiration of organic carbon in the sediments, which in turn resultedin decreased oxygen in sediment pore waters. We use changes in therelative concentration of redox sensitive elements, Mn, Re, and Cd, toconstrain changes in the redox state of marine sediments followingthe blowout event.
1.1. Background: redox sensitive metals
Authigenic enrichment of redox sensitive metals occurs underreducing conditions since these metals undergo a change in redoxstate and either become less soluble, are adsorbed to surfaces, orform insoluble metal sulfides. These metals have been exploited innumerous studies to constrain paleoredox conditions (e.g. Crusiuset al., 1996; Dean, 1989; Morford et al., 2001, 2012; Nameroff et al.,2002; Tribovillard et al., 2006). Bulk Mn is depleted, and Re, Cd, V,Mo, and U are all authigenically enriched under reducing conditionsproviding an excellent proxy for low oxygen and anoxic environ-ments. In this study, we focus on Mn, Re and Cd. Several excellentreview articles (Algeo and Rowe, 2012; Morford and Emerson, 1999;Tribovillard et al., 2006) describe these processes in detail; asummary of their geochemical behavior is provided below.
1.1.1. ManganeseThe redox chemistry of manganese (Mn) in marine sediments
has been studied extensively, in part due to the importance of Mncycling across the redoxcline in reducing environments. Solid Mn(IV) oxides delivered from overlying seawater are readily reduced todissolved Mn(II) when pore water oxygen is consumed. The solubleMn(II) diffuses upward, and where pore water oxygen is present, is
then oxidized to Mn(IV) oxide completing the redox cycle of Mn inthe sediment (e.g. Burdige and Gieskes, 1983; Froelich et al., 1979;Gobeil et al., 1997). A distinct peak in bulk Mn typically marks thetop of the redoxcline. Recent findings of abundant porewater Mn(III) in hemiplegic sediments requires a revision of this classic redoxmodel to include one electron transfer reactions for the Mn cycle(Madison et al., 2013). Dissolved Mn(III) intermediates are producedby oxidation of Mn(II) by dissolved oxygen as well as dissimilatoryMnO2 reduction by organic matter (Madison et al., 2013).
1.1.2. RheniumRhenium (Re) behaves conservatively in seawater, is mobile
under oxic conditions, and precipitates under mildly reducingconditions (Crusius et al., 1996). It is ideally suited as a redox tracersince its detrital concentration is very low relative to the authi-genic deposition; oxic marine sediments have low concentrationsof 0.6 ppb or less (Boyko et al., 1986; Koide et al., 1986). Re is notenriched in ferromanganese nodules (Koide et al., 1986), does notshow an association with either Fe or Mn oxides (Morford et al.,2005; Schaller et al., 2000), and hydrothermal processes play anegligible role in Re geochemistry (Ravizza et al., 1996). Re isenriched in reducing sediments because dissolved Re(VII)O4
- isreduced and precipitates in the solid phase, most likely as Re(IV)O2
(Crusius et al., 1996). Re enrichment occurs under both anoxic(Colodner et al., 1993) and suboxic conditions, below the zones ofU and Fe reduction and prior to sulfate reduction (Crusius et al.,1996; Morford et al., 2005).
1.1.3. CadmiumCadmium (Cd) is a nutrient-like element in seawater, with water
column profiles analogous to dissolved phosphate implying anassociation of Cd with biogenic soft parts. Degradation of Cd-richorganic material results in enrichment of Cd at or just below thesediment–water interface. Authigenic enrichment occurs where Mnis depleted, just below the redox front (Gobeil et al., 1997). Enrich-ment of Cd is a consequence of precipitation of an insoluble sulfidephase at very low sulfide levels below common analytical detectionlimits of several mmol/kg (Rosenthal et al., 1995a).
1.1.4. BariumBarium (Ba) in marine sediments is controlled by several factors.
Ba preservation declines under suboxic conditions, with high organiccarbon respiration and/or low bottom water oxygen (McManus et al.,1998). Thus, the accumulation rate of marine barite in marinesediments has been used to reconstruct past changes in oceanproductivity (e.g. McManus et al., 1999; Paytan and Griffith, 2007).Authigenic barite forms in the water column, as well as within marinesediments and around hydrothermal vents and cold seeps (Griffithand Paytan, 2012), many of which are found in the Northern GoM andis thus of particular importance (Feng and Roberts, 2011; Joye et al.,2010). Mississippi River water is enriched in barium relative to GoMwater (Hanor and Chan, 1977).
Of special relevance to this work, barium is highly enriched indrilling mud, which relies on barite to increase the density(Trocine and Trefry, 1983). In May 2010, an attempt was made toplug the leaking well with more than 105 bbl/day (4200�105 L/day) of high density drilling mud, the so-called “top kill” (NationalCommission on the BP Deepwater Horizon Oil Spill, 2011). Anenrichment of Ba was seen in deep-water plume samples in May2010 associated with this effort (Joung and Shiller, 2013). Enrich-ment of Ba in surficial sediments close to the wellhead is evidenceof this effort.
D.W. Hastings et al. / Deep-Sea Research II ∎ (∎∎∎∎) ∎∎∎–∎∎∎2
Please cite this article as: Hastings, D.W., et al., Changes in sediment redox conditions following the BP DWH blowout event. Deep-SeaRes. II (2015), http://dx.doi.org/10.1016/j.dsr2.2014.12.009i

2. Methods
2.1. Site description
We collected sediment cores at five stations in the NE GoM aboardthe R/V Weatherbird II on a series of cruises from August 2010 toAugust 2013 (Fig. 1; Table 1). Cores were retrieved with an OceanInstruments MC-800 multi-corer, which collects up to eight 10 cmdiameter cores without disturbing the sediment-water interface. Coreswere carefully extruded using a calibrated threaded rod at 2 mmresolution in the top 20mm, and at 5 mm resolution below 20mm.
Sediment samples from stations close to the wellhead wereretrieved with a box core aboard the RV Pelican leg PE-1031 on May5–9, 2010, two weeks after the explosion, which we use as a pre-event control since it precedes the large sedimentation pulse. Coreswere extruded at 2–3 cm resolution.
Box cores from the Fisk Basin (PE07-5I; 817 m depth; 27133.01N,92110.11W) and Garrison Basin (PE07-2; 1570 m depth; 26140.51N,93155.51W) were collected on the R/V Pelican in 2007; a box corebeneath a long-term sediment trap mooring in the NGoM wascollected in January 2009 (PE09-004 MC1). Linear sediment
accumulation rates are relatively high (20–40 cm/kyr) due to largeinputs of terrigenous material from the Mississippi River. AMS 14Cdates with bomb radiocarbon confirm that the core-top samplesinclude the most recently deposited sediments (Richey et al., 2007).
2.2. Visual core descriptions
Cores collected in the NE GoM on August 2010 and later reveal asurficial dark brown layer, 1–10 cm thick, overlying a lighter, tancolored layer, which extends to the base of the sediment core.Within the dark brown surface layer, at least one and sometimestwo distinct darker brown-black bands are present. The sediment–water interface for core DSH-08 (February 2011) was at an incline,with a 5–7 mm offset from one side to another. Thus, the intervalthat we report at 7 mm depth was at the sediment water interfaceand exposed to bottom water on one side of the core barrel.
2.3. Solid phase analyses
Subsamples (�0.2 g) were freeze dried, weighed, then digestedin a Milestone Ethos EZ microwave oven in closed Teflons digestion
Fig. 1. Map of sites sampled for analysis.
D.W. Hastings et al. / Deep-Sea Research II ∎ (∎∎∎∎) ∎∎∎–∎∎∎ 3
Please cite this article as: Hastings, D.W., et al., Changes in sediment redox conditions following the BP DWH blowout event. Deep-SeaRes. II (2015), http://dx.doi.org/10.1016/j.dsr2.2014.12.009i

vessels with 10 mL concentrated trace metal grade HNO3 at 165 1Cand high pressure (�25 bar) for 15 min according to standardmethods (US EPA method 3051a). The digest was diluted 1:10 withMQ ultrapure H2O, and filtered with 0.45 mm PVDF syringe filters.Since HF was not used in the digestion method, the digest does notinclude refractory components such as aluminosilicates, but doesinclude authigenic phases, crude oil, organic phases, FeMn oxides,and carbonates.
The samples were analyzed using an Agilent 7500cx ICP-MS withan octopole reaction cell in helium mode for Mn, Fe, and Cd toreduce isobaric interferences and in no-gas mode for Mo, Ba, and Re.Prior to analysis, samples were spiked with an internal standardcontaining Ge, In, and Bi in order to correct for instrumental driftduring analysis. Elemental concentrations were determined using a6-point external calibration line. Triplicate samples were typicallymeasured for one or two depth intervals in each core with anaverage relative precision of 72%, 74%, 74%, and 74% (1σ) forMn, Re, Cd and Ba, respectively. Long-term analytical precision basedon analyzing the same sample 3 times each run over 1.5 years of ICPMS analyses is 73%, 75%, 75%, and 72% (1σ) for Mn, Re, Cd andBa, respectively. A complete data set collected under this project,including all elements determined by ICP-MS, is stored with the Gulfof Mexico Research Initiative Information and Data Cooperative(GRIIDC) and available at https://data.gulfresearchinitiative.org. Thedata set used in this paper is available as a supplementary data set athttp://www.pangaea.de.
2.4. Benthic foraminifera
Subsamples of sediment were freeze-dried, weighed and washedwith a sodium hexametaphosphate solution through a 63-μm sieve todisaggregate the clay particles from foraminifera tests. The coarsefraction remaining on the sieve was dried and weighed again. Allbenthic foraminifera were picked from the samples, identified, andcounted. Total assemblage density is reported, as opposed to livingcommunity density for direct comparison of up-core (post-DWH) todown-core (pre-DWH control) records (Osterman, 2003; Scott and
Medioli, 1980). The total assemblage density approach was alsoappropriate since these records were to be used as reference recordswhen determining any persistent sedimentary (physical, chemical,biological) features related to the DWH event in future sedimentaryrecords on the decadal time-scale (Osterman, 2003; Scott and Medioli,1980). Foraminifera assemblage density values were reported inindividual per unit volume (indiv/cm3) (Sen Gupta et al., 2009). Thevalues were normalized to the known wet volume of each samplebased on the core diameter (10 cm) and the thickness of each sample(2 or 5 mm).
3. Results
3.1. Pre-impact results
Our first task is to establish natural, pre-event levels of redoxsensitive metals and the normal depth of the redoxcline before thespill. Determining this is a challenge, since sediment cores nearthe wellhead were not sampled at high resolution before theevent. We identify pre-event conditions using sediment cores atthree sites located in the Northern GoM: Garrison and Fisk Basin,and site PE 09-004, where a sediment trap is moored. We alsoobtained a suite of four cores near the wellhead taken less thantwo weeks after the explosion and before substantial sedimenta-tion occurred; the site closest to the wellhead is presented here.Authigenic metal data are presented graphically in Fig. 2a–d, andin supplementary data Table 1.
3.1.1. Garrison basin(Fig. 2a; 1570 m): Mn values are at a low baseline value in the
top 120 mm, increase to a distinct peak at 162 mm, then decreaseback to baseline levels. Both Re and Cd remain low with noenrichment at depth. These profiles indicate a redoxcline at 170–180 mm, where bulk Mn begins to decrease, with no enrichmentof either Re or Cd associated with reducing conditions. Ba values
Table 1Sample sites.
Site ID Latitude Longitude Water depth (m) Collection date
DSH-08 2917.367N 87152.064W 1143 December 2010February 2011September 2011August 2012August 2013
DSH-10 28158.743N 87153.497W 1520 August 2010December 2010February 2011September 2011August 2012August 2013
PCB-06 2917.362N 87115.973W 1011 December 2010February 2011September 2011August 2012August 2013
SW-01 28113.252N 8914.17W 1187 August 2012DWH-01 Wellhead 28143.462N 88123.237W 1577 August 2012
August 2013Pre-event coresFisk Basin PE07 6-II 27133.00N 92110.10W 817 July 2007Garrison Basin PE07-2 26140.50N 93155.50W 1570 July 2007W. Florida Slope NT 1200 27157.982 8611.388 1200 June 2011PE 1031-6 28146.557N 88124.293W 1380 May 2010PE 1031-11 28149.454N 88127.378W 1138 May 2010PE 1031-12 28151.179N 88129.194W 879 May 2010PE 1031-23 28150.574N 88140.713W 732 May 2010Sed Trap Site PE09-004 MC1 27131.508N 90110.126W 1132 January 2009
D.W. Hastings et al. / Deep-Sea Research II ∎ (∎∎∎∎) ∎∎∎–∎∎∎4
Please cite this article as: Hastings, D.W., et al., Changes in sediment redox conditions following the BP DWH blowout event. Deep-SeaRes. II (2015), http://dx.doi.org/10.1016/j.dsr2.2014.12.009i

between 200 and 300 ppm indicate levels that would be expectedin sediments not affected by drilling activities or cold seeps.
3.1.2. Fisk basin(Fig. 2b; 817 m): Shallower and situated closer to the mouth of
the Mississippi River than Garrison Basin, Fisk Basin shows a
shallower redoxcline, at 90–120 mm, as indicated by the Mn peakcentered at 80 mm. Re is constant at 0.4 ppb from the surface to110 mm, where it increases to the base of the core. Cd decreasesfrom the surface to 170 mm, and then increases to 0.4 ppm at thebottom of the core, likely associated with CdS(s) formation. In bothGarrison and Fisk Basin, Ba decreases from surface values of 300and 600 ppm, respectively, to �200 ppm in the top 10–40 mm.
3.1.3. Sediment trap site PE09-004(Fig. 2c; 1132 m): Closer to the wellhead than either Garrison or
Fisk Basin, this site adds insight into pre-impact profiles of redoxsensitive metals at a depth similar to impacted sites. A distinct Mnpeak at 77 mmwith Re enrichment directly below this depth indicatesa redoxcline somewhat shallower than the two other pre-impact sites.The absence of Cd enrichment is consistent with no sulfide, andtherefore no CdS(s).
3.1.4. Proximal to DWH wellhead PE 1031-6(Fig. 2d; 1380 m): Sediments taken twoweeks after the explosion
7 km from the DWHwellhead at site PE 1031-6, showMn decreasingfrom 12.6 mg/g at the surface (0–20 mm), to 2.7 mg/g at 65 mm. Reincreases from 0.6 ppb in the top 20 mm to 1.4 ppb at 35 mm,followed by more substantial increases to 2.6 ppb at 100 mm and5.7 ppb at 125 mm. The sample resolution for this core is coarse,20–30 mm, and is not adequate to resolve the characteristic Mn peak,or allow a detailed comparison to our sampling at 2 mm resolution.Sediments from three additional sites sampled at the same time closeto the wellhead were also analyzed as part of our effort and provideinsight into pre-event [Re].
3.2. Post-impact results
3.2.1. Time seriesThree sites were sampled five to six times between August
2010–August 2013, allowing us to determine how the eventimpacted surficial sediments and to constrain the temporal evolu-tion of reducing conditions. While Mo, V, and U are enriched insuboxic and anoxic sediments and are frequently part of the suite ofredox sensitive trace metals, downcore changes in these elementswere associated primarily with changes in Mn oxide (e.g. Hem,1978) and did not provide geochemical insight into other processes.We do not discuss changes on Mo, V, and U since they primarilyreflect changes in bulk Mn in the surficial sediments affected by thedepositional event. Rather than present figures of all 17 downcoremetal profiles from each time different stations were sampled, wedescribe general trends and present downcore results that arerepresentative of element profiles at the three different stations.In each figure, the surface 30 mm is shown in greater detail toreveal more subtle changes in down core concentrations. A com-plete data set with metal data from each station are provided insupplementary data Table 1. Temporal evolution of reducing con-ditions is best described by changing [Re] over time.
3.2.2. DSH-10Bulk Mn is typically characterized by two peaks in the top
5–30 mm, separated by about 15 mm (Fig. 3a–c). In December2010 and August 2013 profiles, there is a broad Mn maximumspread between 5 and 19 mm, rather than two distinct peaks; thesurficial Mn peak at 11 mm in the February 2011 profile ischaracterized by just one point, with a relatively small increaseof 3 mg/g (25%). In most profiles, there is a modest Re enrichmentof 0.1–0.3 ppb coincident with the Mn minimum defined by thetwo peaks. This is either not significant or nonexistent in Septem-ber 2011, August 2012, and August 2013. Except for September2011, Re increases to a distinct relative maximum just below the
0
50
100
150
200
0 10 20
Dep
th (m
m)
Dep
th (m
m)
Dep
th (m
m)
Dep
th (m
m)
Mn (mg/g)
0.0 0.5 1.0
Re (ppb)
0.0 0.2 0.4
Cd (ppm)
0 100 200 300
Ba (ppm)
0
50
100
150
200
0 5 10 15
Mn (mg/g)
0.0 0.5 1.0
Re (ppb)
0.0 0.2 0.4
Cd (ppm)
reducing
0 500
Ba (ppm)
0
50
100
150
200
0 20 40 Mn (mg/g)
0.0 0.5 Re (ppb)
0.0 0.2 0.4 Cd (ppm)
MnOx
reducing
0 2000 4000 Ba (ppm)
0
50
100
150
0 10
Mn (mg/g)
0 2 4Re (ppb)
0.0 0.2 0.4Cd (ppm)
0 100 200 300
Ba (ppm)
Fig. 2. Pre-impact redox sensitive metal and Ba profiles at (a) Garrison Basin;(b) Fisk Basin, (c) USGS sediment trap site (PE09-04), and (d) PE 1031-6, nearwell head.
D.W. Hastings et al. / Deep-Sea Research II ∎ (∎∎∎∎) ∎∎∎–∎∎∎ 5
Please cite this article as: Hastings, D.W., et al., Changes in sediment redox conditions following the BP DWH blowout event. Deep-SeaRes. II (2015), http://dx.doi.org/10.1016/j.dsr2.2014.12.009i

second Mn peak, then decreases before increasing again at depth,typically at �100 mm. For August 2010 and February 2011, asecondary Cd peak of 0.08 ppb and 0.05 ppb exists at 5 mm and
19 mm, respectively, in addition to the broad Cd enrichment belowthe deeper peak common in all profiles. This secondary Cd peak isreduced in the September 2011 and August 2012 profiles.
0
10
20
30
0 10 20
Dep
th (m
m)
Dep
th (m
m)
Dep
th (m
m)
Dep
th (m
m)
Dep
th (m
m)
Dep
th (m
m)
Mn (mg/g)
0.0 0.5 1.0
Re (ppb)
0.0 0.2 0.4
Cd (ppm)
0
50
100
150
200
0 10 20 0.0 1.0 2.0 0.0 0.2 0.4
reducing
reducing
0 200 400
Ba (ppm)
0 200 400
0 1 2 0.0 0.2 0.4 0
50
100
150
0 10 20
0.0 0.5 1.0 Re (ppb)
0.0 0.2 0.4 Cd (ppm)
0
10
20
30
0 10 20 Mn (mg/g)
reducing
reducing
0 200 400 600 Ba (ppm)
0 200 400 600
0
10
20
30
0 10 20 30 Mn (mg/g)
0.0 0.2 0.4 Cd (ppm)
0.0 0.5 1.0
Re (ppb)
0
50
100
150
200
0 10 20 30 0.0 0.2 0.4 0 1 2 3 4
reducing
0 200 400
Ba (ppm)
0 200 400
Fig. 3. Redox sensitive metal and Ba profiles at time series site DSH 10, 1520 m for (a) August 2010, (b) December 2010, and (c) August 2012.
D.W. Hastings et al. / Deep-Sea Research II ∎ (∎∎∎∎) ∎∎∎–∎∎∎6
Please cite this article as: Hastings, D.W., et al., Changes in sediment redox conditions following the BP DWH blowout event. Deep-SeaRes. II (2015), http://dx.doi.org/10.1016/j.dsr2.2014.12.009i

3.2.3. DSH-08As with DSH-10 there are two Mn maxima in the surface
30–40 mm for samples taken in December 2010 and February2011. Re increases from the surface by �0.2–0.4 ppb to a maximumcoincident with the Mn minimum (Fig. 4a and b). In February 2011,there is also a Re peak at 29 mm, at the base of the second Mn peak.The last three sample dates (September 2011, August 2012, August2013) show a single Mn peak, or a very subtle second peak, ratherthan a distinct double Mn peak, with a more gradual decline in Mnto the baseline values at depth. In August 2013, Re has a distinctpeak at 15 mm where Mn is decreasing. Below the relative mini-mum at 19 mm, Re then gradually increases to the base of the core.
3.2.4. PCB-06In December 2010 (Fig. 5a), double Mn peaks are evident, close to
the surface at 5 mm and at 21mm, a feature which is less pronounced
in February 2011 (Fig. 5b), and subdued, or no longer present, in thelast three sample efforts (September 2011, August 2012, August 2013. InDecember 2010, a modest Re enrichment of 0.1 ppb is coincident withthe Mn minimum at 7mm (Fig. 5a). Re enrichment above backgroundvalues is at the surface in February 2011; surface Re continues to beabove background values in September 2011. Subsurface Re peaks at50–70mm are evident in all but the February 2011 core. For December2010, February 2011, and September 2011 a secondary Cd peak exists at15–17mm, in addition to the broad Cd enrichment below the deeperpeak common in all profiles. Minor variations in Re patterns in August2012, and 2013 cores seem to show the opposite patterns: modest Reincreases are not coincident with Mn minima.
3.2.5. SW-01, April 2012Mn is characterized by two peaks, at 15 mm and 81mm with a
relative minimum at 35 mm (Fig. 6). Re mirrors the Mn profile with a
0
10
20
30
40
0 10
Dep
th(m
m)
Mn (mg/g)
0.0 0.2 0.4
Cd (ppm)
0.0 0.5 1.0
Re (ppb)
0 500 1000
Ba (ppm)
0
50
100
0 10
Dep
th(m
m)
0.0 0.2 0.4 0 1 2 0 500 1000
Reducing; fewer forams
0 1 2
0.0 0.5 1.0
Re (ppb)
0
10
20
30
40
0 5 10
Dep
th(m
m)
Mn (mg/g)
0.0 0.2 0.4
Cd (ppm)
0 500 1000
Ba (ppm)
0
50
100
150
0 5 10
Dep
th(m
m)
0.0 0.2 0.4 0.6 0 500 1000
reducing
reducing; fewer forams
reducing
reducing
Fig. 4. Redox sensitive metal and Ba profiles at time series site DSH 08, 1143 m for (a) December 2010 and (b) February 2011.
D.W. Hastings et al. / Deep-Sea Research II ∎ (∎∎∎∎) ∎∎∎–∎∎∎ 7
Please cite this article as: Hastings, D.W., et al., Changes in sediment redox conditions following the BP DWH blowout event. Deep-SeaRes. II (2015), http://dx.doi.org/10.1016/j.dsr2.2014.12.009i

clear maximum at 35 mm, a minimum at 60–80mm, then increasingto a maximum of 2.4 ppb at 142 mm. At or below the redoxclines asdefined by the Mnminima, Cd increases to a maximum of 0.22 ppm at35 mm and again at 102 mm. Ba shows an unusual downcore profile,with two distinct maxima; Ba values are consistent with normal, pre-impact concentrations (265 ppm) at the surface, with distinct maximaat 5 mm (1100 ppm) and at 51 mm (1000 ppm).
4. Discussion
4.1. Pre-impact geochemistry
It is well established that the downward flux of organic carbonto the sediments, and subsequent oxidation, is the driving force forearly diagenesis in marine sediments, resulting in the reduction of aseries of electron acceptors: oxygen, nitrate, Mn oxides, Fe oxides,then sulfate, in order of decreasing energy per mole organic carbon(e.g. Emerson et al., 1980; Froelich et al., 1979). After oxygen isnearly depleted, nitrate is reduced, followed by reduction of Mn(IV)oxides to Mn(II). The dissolved Mn(II) diffuses upward, is reoxidizedto Mn(IV) by pore water oxygen, and then trapped within the
sediment. Under steady-state conditions, this leads to the formationof a single Mn peak, which typically defines the depth of theredoxcline (e.g. Burdige and Gieskes, 1983). The redox state ofsurface sediments and the depth of the redoxcline is controlled bythe flux of organic carbon to sediments, bottom water oxygenconcentration, and the degradation rate constant for the carbon(e.g. Emerson et al., 1985). This single Mn peak typical of continentalslope sediments is clearly observed in cores we sampled before theevent from the Sediment Trap Site, Fisk Basin, and Garrison Basin, at77 mm, 80 mm, and 165 mm, respectively. Re increases below theMn peak, consistent with Re enrichment in mildly reducing sedi-ments. This characteristic Mn peak is considerably shallower incores near the wellhead (e.g. PE-1031-6) since they are closer to theMississippi River, with its high nutrient load and resulting highproductivity and high sedimentation rate.
4.2. Post impact – organic geochemistry
Following the blowout event, our working hypothesis is thatthe accumulation of marine snow resulted in a substantial sedi-mentation pulse. In addition to an increase in sedimentation rate,
0
10
20
30
0 10
Dep
th(m
m)
Mn (mg/g)
0.0 0.2 0.4 Cd (ppm)
0 200 400
Ba (ppm)
0.0 0.5 1.0
Re (ppb)
0
50
100
150
0 10
Dep
th(m
m)
0.0 0.2 0.4 0 200 400 0 1 2 3
reducing
reducing
0
10
20
30
0 10
Dep
th(m
m)
Mn (mg/g)
0.0 0.2 0.4
Cd (ppm)
0 200 400
Ba (ppm)
0.0 0.5 1.0
Re (ppb)
0
50
100
150
200
0 10
Dep
th(m
m)
0.0 0.2 0.4 0 200 400 0 1 2 3
reducing
Foram mortality
Fig. 5. Redox sensitive metal and Ba profiles at time series site PCB 06, 1011 m for (a) December 2010 and (b) February 2011.
D.W. Hastings et al. / Deep-Sea Research II ∎ (∎∎∎∎) ∎∎∎–∎∎∎8
Please cite this article as: Hastings, D.W., et al., Changes in sediment redox conditions following the BP DWH blowout event. Deep-SeaRes. II (2015), http://dx.doi.org/10.1016/j.dsr2.2014.12.009i

the quality of the organic carbon associated with the sedimentpulse and the oil-associated marine snow was likely more labileand would be remineralized more quickly than the relatively lowquality partially degraded fecal pellets that make up most of theorganic carbon rain. “High quality,” fresh diatom-derived organiccarbon is remineralized 4300% faster than “low quality” carbonfrom fecal pellets, showing that different organic matter makes asignificant difference in respiration rates and residence time ofcarbon on the ocean floor (Mayor et al., 2012). At least 50% of therecently deposited aliphatic hydrocarbons in each of the threetimes series cores degraded between the December 2010 andFebruary 2011 sampling (Romero, personal communication).
The changing influence of the Mississippi River is potentially aconfounding factor. Nutrient-and sediment-laden Mississippi Riverwater would enhance productivity in the NE GoM and could poten-tially be responsible for the increased sedimentation rate. In responseto the spill, fresh water from theMississippi River was diverted in 2010in an effort to minimize damage to the coasts (Bianchi et al., 2011). Ayear later, in May 2011, the Mississippi River flooded to record levels, a100-year flood event (Falcini et al., 2012) while 2012 experienced aserious drought as revealed by USGS riverine discharge data (http://water.usgs.gov/). The most substantial changes in sedimentation arerecorded shortly after the blowout (Schrope, 2013) not during the laterchanges in river discharge in 2011 or 2012.
4.3. Post impact: Mn geochemistry
The sedimentation pulse mixed with fresh organic carbon wouldresult in increased microbial respiration with consumption of oxygen,and a shoaling of the redoxcline. As the redox boundary migratesupward, the new Mn oxide peak is shallower, leaving behind a relicMn peak at depth. The observation of two or more Mn peaks, and theconcept of non-steady state diagenesis was explored to describepaleoredox variations and changes in paleoproductivity (Finneyet al., 1988), changes in the modern carbon cycle (Kuzyk et al., 2011)and in turbidite sequences in the North East Atlantic (Colley et al.,1984; Thomson et al., 1993). Pulsed sedimentation to the seafloor isnot uncommon (e.g. Gobeil et al., 1997, 2001; Honjo et al., 1982). It isworth noting that the redox boundary canmigrate upward quickly butdownward more slowly due to relatively fast oxidation of organicmatter in contrast to the slower diffusion of oxygen (Gobeil et al.,2001). We rely on the well-known behavior of Mn cycling in reducingsediments, along with redox sensitive elements, Re and Cd, toconstrain changes in reducing conditions of sediments.
Exceptions where no double peak for Mn is observed includeDSH-08 and PCB-06 in September 2011 and PCB-06 profiles in
August 2012; the relic Mn peak is subtle in the August 2012 DSH-08Mn profile. This is likely due to the reduction of the Mn oxideassociated with the relic peak under the more reducing conditions.There is a wide range in reported kinetics for the reduction of Mnoxide with first order rate constants ranging from 0.002 d�1 forpelagic sediments (Burdige and Gieskes, 1983) and 8–60 day�1 forcoastal environments (Aller, 1980). A pulse of organic carbon to thesea floor can trigger reduction of Mn and Fe oxides within just a fewdays with a first order rate constant of 0.159 d�1 (Magen et al.,2011), demonstrating that Mn oxides in surficial sediments can berapidly reduced.
4.4. Post impact: Re enrichment
Re is the clearest indicator of reducing conditions, since detritalRe is very low, has no known role in biogeochemical processes, andis not associated with cycling of Mn oxides (Morford et al., 2005;Schaller et al., 2000). For cores not impacted by the blowout event,down core Re is effectively constant in the surficial 70–100 mm at0.3–0.4 ppb (Garrison Basin; Fig. 2a), 0.4 ppb (Fisk Basin; Fig. 2b)and 0.5 ppb (Sediment Trap site; Fig. 2c). Below the Mn peak, Reincreases as sediments becoming more reducing with depth. Sur-face sediments from the suite of cores (PE 1031) sampled just afterthe blowout close to the wellhead are progressively more reducingat shallower water depths and closer to the Mississippi River. This isshown by decreasing Mn content and greater Re enrichment insurface (0–20 mm) sediments in cores at shallower depths andcloser to the mouth of the Mississippi River.
Several features of the Re profiles provide insight into theevolution of reducing conditions following the impact. A modestRe enrichment of 0.1–0.3 ppb typically occurs below the shallowestMn peak, and coincident with the Mn minimum, characteristicallyat 15–20 mm at sites between August 2010 and February 2011. Thisinfers reducing conditions relatively shallow in sediments. The lossof this feature in the September 2011 and 2012 cores could be aresult of oxidation of the organic carbon and diffusion of O2 into thesediments, or the re-emergence of bioturbation with recovery ofnormal conditions.
A distinct Re peak at 30–40 mm at site DSH-10 (Fig. 3a–c), and at50–70 mm for all but one profile from PCB-06 (Fig. 5a), suggestsnon-steady state behavior, and is consistent with substantially morereducing conditions following the sediment pulse. The absence ofhigh-resolution Re data from cores preceding the impact makes acomparison with normal conditions difficult. Nonetheless, thesubsurface Re peak implies non-steady state conditions.
0
50
100
150
200
0 10 20 30
Dep
th(m
m)
Mn (mg/g) 0.0 0.2 0.4
Cd (ppm) 0 500 1000 1500
Ba (ppm)
0 1 2
Re (ppb)
reducing
reducing
Fig. 6. Redox sensitive metal and Ba profiles at site SW-01, 1187 m; April 2012.
D.W. Hastings et al. / Deep-Sea Research II ∎ (∎∎∎∎) ∎∎∎–∎∎∎ 9
Please cite this article as: Hastings, D.W., et al., Changes in sediment redox conditions following the BP DWH blowout event. Deep-SeaRes. II (2015), http://dx.doi.org/10.1016/j.dsr2.2014.12.009i
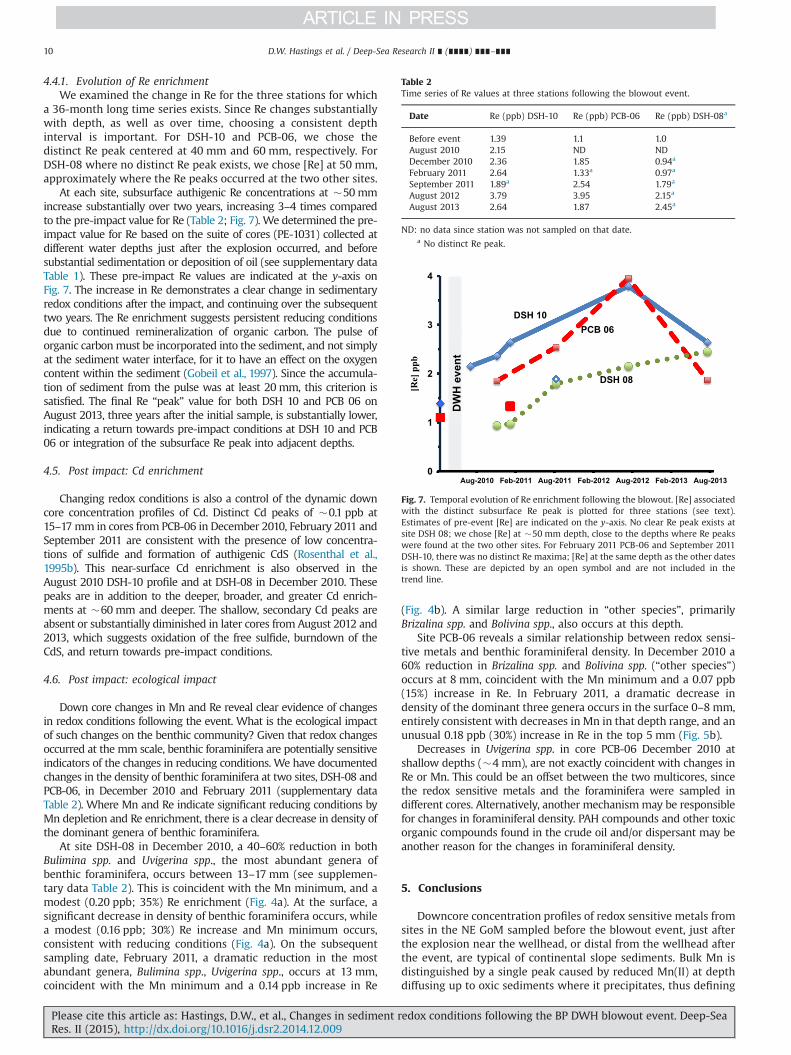
4.4.1. Evolution of Re enrichmentWe examined the change in Re for the three stations for which
a 36-month long time series exists. Since Re changes substantiallywith depth, as well as over time, choosing a consistent depthinterval is important. For DSH-10 and PCB-06, we chose thedistinct Re peak centered at 40 mm and 60 mm, respectively. ForDSH-08 where no distinct Re peak exists, we chose [Re] at 50 mm,approximately where the Re peaks occurred at the two other sites.
At each site, subsurface authigenic Re concentrations at �50mmincrease substantially over two years, increasing 3–4 times comparedto the pre-impact value for Re (Table 2; Fig. 7). We determined the pre-impact value for Re based on the suite of cores (PE-1031) collected atdifferent water depths just after the explosion occurred, and beforesubstantial sedimentation or deposition of oil (see supplementary dataTable 1). These pre-impact Re values are indicated at the y-axis onFig. 7. The increase in Re demonstrates a clear change in sedimentaryredox conditions after the impact, and continuing over the subsequenttwo years. The Re enrichment suggests persistent reducing conditionsdue to continued remineralization of organic carbon. The pulse oforganic carbonmust be incorporated into the sediment, and not simplyat the sediment water interface, for it to have an effect on the oxygencontent within the sediment (Gobeil et al., 1997). Since the accumula-tion of sediment from the pulse was at least 20mm, this criterion issatisfied. The final Re “peak” value for both DSH 10 and PCB 06 onAugust 2013, three years after the initial sample, is substantially lower,indicating a return towards pre-impact conditions at DSH 10 and PCB06 or integration of the subsurface Re peak into adjacent depths.
4.5. Post impact: Cd enrichment
Changing redox conditions is also a control of the dynamic downcore concentration profiles of Cd. Distinct Cd peaks of �0.1 ppb at15–17mm in cores from PCB-06 in December 2010, February 2011 andSeptember 2011 are consistent with the presence of low concentra-tions of sulfide and formation of authigenic CdS (Rosenthal et al.,1995b). This near-surface Cd enrichment is also observed in theAugust 2010 DSH-10 profile and at DSH-08 in December 2010. Thesepeaks are in addition to the deeper, broader, and greater Cd enrich-ments at �60mm and deeper. The shallow, secondary Cd peaks areabsent or substantially diminished in later cores from August 2012 and2013, which suggests oxidation of the free sulfide, burndown of theCdS, and return towards pre-impact conditions.
4.6. Post impact: ecological impact
Down core changes in Mn and Re reveal clear evidence of changesin redox conditions following the event. What is the ecological impactof such changes on the benthic community? Given that redox changesoccurred at the mm scale, benthic foraminifera are potentially sensitiveindicators of the changes in reducing conditions. We have documentedchanges in the density of benthic foraminifera at two sites, DSH-08 andPCB-06, in December 2010 and February 2011 (supplementary dataTable 2). Where Mn and Re indicate significant reducing conditions byMn depletion and Re enrichment, there is a clear decrease in density ofthe dominant genera of benthic foraminifera.
At site DSH-08 in December 2010, a 40–60% reduction in bothBulimina spp. and Uvigerina spp., the most abundant genera ofbenthic foraminifera, occurs between 13–17 mm (see supplemen-tary data Table 2). This is coincident with the Mn minimum, and amodest (0.20 ppb; 35%) Re enrichment (Fig. 4a). At the surface, asignificant decrease in density of benthic foraminifera occurs, whilea modest (0.16 ppb; 30%) Re increase and Mn minimum occurs,consistent with reducing conditions (Fig. 4a). On the subsequentsampling date, February 2011, a dramatic reduction in the mostabundant genera, Bulimina spp., Uvigerina spp., occurs at 13 mm,coincident with the Mn minimum and a 0.14 ppb increase in Re
(Fig. 4b). A similar large reduction in “other species”, primarilyBrizalina spp. and Bolivina spp., also occurs at this depth.
Site PCB-06 reveals a similar relationship between redox sensi-tive metals and benthic foraminiferal density. In December 2010 a60% reduction in Brizalina spp. and Bolivina spp. (“other species”)occurs at 8 mm, coincident with the Mn minimum and a 0.07 ppb(15%) increase in Re. In February 2011, a dramatic decrease indensity of the dominant three genera occurs in the surface 0–8 mm,entirely consistent with decreases in Mn in that depth range, and anunusual 0.18 ppb (30%) increase in Re in the top 5 mm (Fig. 5b).
Decreases in Uvigerina spp. in core PCB-06 December 2010 atshallow depths (�4 mm), are not exactly coincident with changes inRe or Mn. This could be an offset between the two multicores, sincethe redox sensitive metals and the foraminifera were sampled indifferent cores. Alternatively, another mechanismmay be responsiblefor changes in foraminiferal density. PAH compounds and other toxicorganic compounds found in the crude oil and/or dispersant may beanother reason for the changes in foraminiferal density.
5. Conclusions
Downcore concentration profiles of redox sensitive metals fromsites in the NE GoM sampled before the blowout event, just afterthe explosion near the wellhead, or distal from the wellhead afterthe event, are typical of continental slope sediments. Bulk Mn isdistinguished by a single peak caused by reduced Mn(II) at depthdiffusing up to oxic sediments where it precipitates, thus defining
Table 2Time series of Re values at three stations following the blowout event.
Date Re (ppb) DSH-10 Re (ppb) PCB-06 Re (ppb) DSH-08a
Before event 1.39 1.1 1.0August 2010 2.15 ND NDDecember 2010 2.36 1.85 0.94a
February 2011 2.64 1.33a 0.97a
September 2011 1.89a 2.54 1.79a
August 2012 3.79 3.95 2.15a
August 2013 2.64 1.87 2.45a
ND: no data since station was not sampled on that date.a No distinct Re peak.
0
1
2
3
4
Aug-2010 Feb-2011 Aug-2011 Feb-2012 Aug-2012 Feb-2013 Aug-2013
[Re]
ppb
DW
H e
vent
DSH 10PCB 06
DSH 08
Fig. 7. Temporal evolution of Re enrichment following the blowout. [Re] associatedwith the distinct subsurface Re peak is plotted for three stations (see text).Estimates of pre-event [Re] are indicated on the y-axis. No clear Re peak exists atsite DSH 08; we chose [Re] at �50 mm depth, close to the depths where Re peakswere found at the two other sites. For February 2011 PCB-06 and September 2011DSH-10, there was no distinct Re maxima; [Re] at the same depth as the other datesis shown. These are depicted by an open symbol and are not included in thetrend line.
D.W. Hastings et al. / Deep-Sea Research II ∎ (∎∎∎∎) ∎∎∎–∎∎∎10
Please cite this article as: Hastings, D.W., et al., Changes in sediment redox conditions following the BP DWH blowout event. Deep-SeaRes. II (2015), http://dx.doi.org/10.1016/j.dsr2.2014.12.009i

the depth where sediments become reducing. Immediately belowthe Mn peak, Re increases above detrital values, followed byincreases in authigenic Cd reflecting a CdS phase. Water depthand distance from the Mississippi River have a substantial influ-ence on the depth of the redoxcline and the behavior of theseredox sensitive metals.
Following the blowout event, a substantial marine snow eventwhich led to a large sedimentation pulse was recorded in NE GoMsediments. Subsequent respiration of the organic carbon asso-ciated with the marine snow resulted in reducing conditions, asevidenced by downcore changes in redox sensitive metals Mn, Reand Cd.
After the event, at three time series sites (DSH-08, DSH-10, andPCB-06) and at SW-01, double Mn peaks are typically present, at�5 mm and at �20–30 mm, consistent with the non-steady statebehavior associated with a shoaling redoxcline and a relic Mn peak.Some profiles do not show two distinct peaks but reveal shoulderswith relatively high Mn values over a broad depth range of 10–15 mm. These double Mn peaks result from the observed changes inthe input of organic carbon and possibly a more labile carbon source.Double peaks of Re and Cd are present in several profiles, indicatingnon-steady state behavior for these redox sensitive metals as well.
Re concentrations at the subsurface maximum (40–60 mm)increase over two years at all three sites, demonstrating thatreducing conditions persist over time. In the last sampling effortin August 2013, [Re] decreased at two sites, suggesting a possiblereturn towards pre-impact conditions. Cd enrichment indicatesdepths where CdS is precipitating due to presence of sulfide andreducing conditions. In August 2012 no double peak for Mn is seenat PCB-06, and the secondary peak in DSH-08 is minor, anotherindication that the surface sediments (o30 mm) may have beguntoward return to pre-impact conditions.
An assemblage-wide decrease in benthic foraminiferal densityoccurred at the same depth intervals as reducing conditionssuggesting an important consequence of changing redox conditionsin sediments to biotic communities.
Acknowledgments
We dedicate this work to Benjamin Flower, who passed away inJuly 2012. Ben was careful and caring, hard working and honest,and dedicated to his family, friends, and colleagues. He was anenthusiastic ultimate (Frisbees) player, who embraced the “Spiritof the Game” in both his professional and personal life.
Many thanks to the numerous Eckerd College undergraduatestudents who helped in the laboratory and at sea including ShannonHammaker, Chloe Holzinger, Farley Miller, Claire Miller, and CordaySelden. Grateful acknowledgments to Alan Shiller, who providedimportant insight at a critical time. A special thanks to Luke McKayand Andreas Teske (University of North Carolina) for collecting andproviding valuable sediment samples collected just after the explo-sion. Thanks to the exceptional crew of the R/V Weatherbird II fortheir capable assistance at sea collecting samples, and staying safeduring the field operations.
We would like to thank the National Science Foundation RapidGrant program for providing the funding for the Deep Sea Instru-ments MC-800 Multi-corer. We acknowledge the British Petroleum/Florida Institute of Oceanography (BP/FIO) Gulf Oil Spill Prevention,Response, and Recovery Grants Program for providing funding forthe initial research cruises during 2010 and 2011. This research wasmade possible by funding from The Gulf of Mexico ResearchInitiative to both the Deep-C Consortium and to the C IMAGEConsortium. The complete data set can be accessed at the GRIIDCwebsite: http://www.data.gulfresearchinitiative.org/.
Appendix A. Supporting information
Supplementary data associated with this article can be found inthe online version at http://dx.doi.org/10.1016/j.dsr2.2014.12.009.
References
Algeo, T.J., Rowe, H., 2012. Paleoceanographic applications of trace-metal concen-tration data. Chem. Geol. 324–325, 6–18.
Alldredge, A.L., Silver, M.W., 1988. Characteristics, dynamics and significance ofmarine snow. Progess Oceanogr. 20, 41–82.
Aller, R.C., 1980. Diagenetic processes near the sediment–water interface of longisland sound. II. Fe and Mn. In: Barry, S. (Ed.), Advances in Geophysics. Elsevier,pp. 351–415.
Asper, V.L., Deuser, W.G., Knauer, G.A., Lohrenz, S.E., 1992. Rapid coupling of sinkingparticle fluxes between surface and deep ocean waters. Nature 357, 670–672.
Atlas, R.M., Hazen, T.C., 2011. Oil biodegradation and bioremediation: a tale of thetwo worst spills in U.S. history. Environ. Sci. Technol. 45, 6709–6715.
Bianchi, T.S., Cook, R.L., Perdue, E.M., Kolic, P.E., Green, N., Zhang, Y., Smith, R.W.,Kolker, A.S., Ameen, A., King, G., Ojwang, L.M., Schneider, C.L., Normand, A.E.,Hetland, R., 2011. Impacts of diverted freshwater on dissolved organic matterand microbial communities in Barataria Bay, Louisiana, U.S.A. Mar. Environ. Res.72, 248–257.
Boyko, T., Baturin, G., Miller, A., 1986. Rhenium in recent ocean sediments.Geochem. Int. 23, 38–47.
Burdige, D.J., Gieskes, J.M., 1983. A pore water/solid phase diagenetic model formanganese in marine sediments. Am. J. Sci. 283, 29–47.
Colley, S., Thomson, J., Wilson, T.R.S., Higgs, N.C., 1984. Post-depositional migrationof elements during diagenesis in brown clays and turbidite sequences in theNortheast Atlantic. Geochim. Cosmochim. Acta 48, 1223–1236.
Colodner, D., Sachs, J., Ravizza, G., Turekian, K., Edmond, J., Boyle, E., 1993. Thegeochemical cycle of rhenium: a reconnaissance. Earth Planet. Sci. Lett. 117,205–221.
Crusius, J., Calvert, S., Pedersen, T., Sage, D., 1996. Rhenium and molybdenumenrichments in sediments as indicators of oxic, suboxic and sulfidic conditionsof deposition. Earth Planet. Sci. Lett. 145, 65–78.
Dean, W.E., 1989. Changes in redox conditions in deep-sea sediments of thesubarctic North Pacific ocean: possible evidence for the presence of NorthPacific deep water. Paleoceanography 4, 639–653.
Edwards, B.R., Reddy, C.M., Camilli, R., Carmichael, C.A., Longnecker, K., Mooy, B.A.S.V.,2011. Rapid microbial respiration of oil from the Deepwater Horizon spill inoffshore surface waters of the Gulf of Mexico. Environ. Res. Lett. 6, 035301.
Emerson, S., Jahnke, R., Bender, M., Froelich, P., Klinkhammer, G., Bowser, C.,Setlock, G., 1980. Early diagenesis in sediments from the eastern equatorialPacific. I. Pore water nutrient and carbonate profiles. Earth Planet. Sci. Lett. 49,57–80.
Emerson, S.E., Fischer, K., Reimers, C., Heggie, D., 1985. Organic carbon dynamicsand preservation in deep-sea sediments. Deep Sea Res. 32, 1–22.
Falcini, F., Khan, N.S., Macelloni, L., Horton, B.P., Lutken, C.B., McKee, K.L., Santoleri,R., Colella, S., Li, C., Volpe, G., D/‘Emidio, M., Salusti, A., Jerolmack, D.J., 2012.Linking the historic 2011 Mississippi River flood to coastal wetland sedimenta-tion. Nat. Geosci. 5, 803–807.
Feng, D., Roberts, H.H., 2011. Geochemical characteristics of the barite deposits atcold seeps from the northern Gulf of Mexico continental slope. Earth Planet. Sci.Lett. 309, 89–99.
Finney, B.P., Lyle, M., Heath, G.R., 1988. Sedimentation at MANOP site H (EasternEquatorial Pacific) over the past 400,000 years: climatically induced redoxvariations and their effects on transition metal cycling. Paleoceanography 3,169–189.
Froelich, P.N., Klinkhammer, G.P., Bender, M.L., Leudtke, N., Heath, G.R., Cullen, D.,Dauphin, P., Hammond, D., Hartman, B., 1979. Early oxidation of organic matterin pelagic sediments of the eastern Equatorial Atlantic: suboxic diagenesis.Geochim. Cosmochim. Acta 43, 1075–1090.
Gobeil, C., Macdonald, R.W., Sundby, B., 1997. Diagenetic separation of cadmiumand manganese in suboxic continental margin sediments. Geochim. Cosmo-chim. Acta 61, 4647–4654.
Gobeil, C., Sundby, B., Macdonald, R.W., Smith, J.N., 2001. Recent change in organiccarbon flux to Arctic Ocean deep basins: Evidence from acid volatile sulfide,manganese and rhenium discord in sediments. Geophys. Res. Lett. 28,1743–1746.
Griffith, E.M., Paytan, A., 2012. Barite in the ocean – occurrence, geochemistry andpalaeoceanographic applications. Sedimentology 59, 1817–1835.
Hanor, J.S., Chan, L.-H., 1977. Non-conservative behavior of barium during mixing ofMississippi River and Gulf of Mexico waters. Earth Planet. Sci. Lett. 37, 242–250.
Hem, J.D., 1978. Redox processes at surfaces of manganese oxide and their effectson aqueous metal ions. Chem. Geol. 21, 199–218.
Honjo, S., Manganini, S.J., Cole, J.J., 1982. Sedimentation of biogenic matter in thedeep ocean. Deep Sea Res. Part A. Oceanogr. Res. Pap. 29, 609–625.
Joung, D., Shiller, A.M., 2013. Trace element distributions in the water column nearthe deepwater horizon well blowout. Environ. Sci. Technol. 47, 2161–2168.
Joye, S.B., Bowles, M.W., Samarkin, V.A., Hunter, K.S., Niemann, H., 2010. Biogeo-chemical signatures and microbial activity of different cold-seep habitats along
D.W. Hastings et al. / Deep-Sea Research II ∎ (∎∎∎∎) ∎∎∎–∎∎∎ 11
Please cite this article as: Hastings, D.W., et al., Changes in sediment redox conditions following the BP DWH blowout event. Deep-SeaRes. II (2015), http://dx.doi.org/10.1016/j.dsr2.2014.12.009i

the Gulf of Mexico deep slope. Deep Sea Res. Part II: Top. Stud. Oceanogr. 57,1990–2001.
Joye, S.B., MacDonald, I.R., Leifer, I., Asper, V., 2011. Magnitude and oxidationpotential of hydrocarbon gases released from the BP oil well blowout. Nat.Geosci. 4, 160–164.
Joye, S.B., Teske, A.P., Kostka, J.E., 2014. Microbial dynamics following the macondooil well blowout across Gulf of Mexico environments. BioScience 64, 766–777.
Koide, M., Hodge, V.F., Yang, J.S., Stallard, M., Goldberg, E.G., Calhoun, J., Bertine, K.K., 1986. Some comparative marine chemistries of rhenium, gold, silver andmolybdenum. Appl. Geochem. 1, 705–714.
Kujawinski, E.B., Kido Soule, M.C., Valentine, D.L., Boysen, A.K., Longnecker, K.,Redmond, M.C., 2011. Fate of dispersants associated with the deepwaterhorizon oil spill. Environ. Sci. Technol. 45, 1298–1306.
Kuzyk, Z.Z.A., Macdonald, R.W., Stern, G.A., Gobeil, C., 2011. Inferences about themodern organic carbon cycle from diagenesis of redox-sensitive elements inHudson Bay. J. Mar. Syst. 88, 451–462.
Madison, A.S., Tebo, B.M., Mucci, A., Sundby, B., Luther, G.W., 2013. Abundantporewater Mn(III) is a major component of the sedimentary redox system.Science 341, 875–878.
Magen, C., Mucci, A., Sundby, B., 2011. Reduction rates of sedimentary Mn and Feoxides: an incubation experiment with Arctic Ocean sediments. Aquat. Geo-chem. 17, 629–643.
Mayor, D.J., Thornton, B., Hay, S., Zuur, A.F., Nicol, G.W., McWilliam, J.M., Witte, U.F.,2012. Resource quality affects carbon cycling in deep-sea sediments. ISME J. 6,1740–1748.
McManus, J., Berelson, W.M., Hammond, D.E., Klinkhammer, G.P., 1999. Bariumcycling in the North Pacific: implications for the utility of Ba as a paleopro-ductivity and paleoalkalinity proxy. Paleoceanography 14, 53–61.
McManus, J., Berelson, W.M., Klinkhammer, G.P., Johnson, K.S., Coale, K.H., Ander-son, R.F., Kumar, N., Burdige, D.J., Hammond, D.E., Brumsack, H.J., McCorkle, D.C., Rushdi, A., 1998. Geochemistry of barium in marine sediments: implicationsfor its use as a paleoproxy. Geochim. Cosmochim. Acta 62, 3453–3473.
Montagna, P.A., Baguley, J.G., Cooksey, C., Hartwell, I., Hyde, L.J., Hyland, J.L., Kalke,R.D., Kracker, L.M., Reuscher, M., Rhodes, A.C.E., 2013. Deep-sea benthicfootprint of the deepwater horizon blowout. PLoS One 8, e70540.
Morford, J.L., Emerson, S.E., 1999. The geochemistry of redox sensitive trace metalsin sediments. Geochim. Cosmochim. Acta 63, 1735–1750.
Morford, J.L., Emerson, S.R., Breckel, E.J., Kim, S.H., 2005. Diagenesis of oxyanions (V,U, Re, and Mo) in pore waters and sediments from a continental margin.Geochim. Cosmochim. Acta 69, 5021–5032.
Morford, J.L., Martin, W.R., Carney, C.M., 2012. Rhenium geochemical cycling:Insights from continental margins. Chem. Geol. 324, Äì325, 73–86.
Morford, J.L., Russell, A.D., Emerson, S., 2001. Trace metal evidence for changes inthe redox environment associated with the transition from terrigenous clay todiatomaceous sediment, Saanich Inlet, BC. Mar. Geol. 174, 355–369.
Nameroff, T.J., Balistrieri, L.S., Murray, J.W., 2002. Suboxic trace metal geochemistryin the Eastern Tropical North Pacific. Geochim. Cosmochim. Acta 66, 1139–1158.
National Commission on the BP Deepwater Horizon Oil Spill, 2011. Deep Water: TheGulf Oil Disaster and the Future of Offshore Drilling. Report to the President.National Commission on the BP Deepwater Horizon Oil Spill and OffshoreDrilling, p. 150.
Osterman, L.E., 2003. Benthic foraminifers from the continental shelf and slope ofthe Gulf of Mexico: an indicator of shelf hypoxia. Estuar. Coast. Shelf Sci. 58,17–35.
Passow, U., 2000. Formation of transparent exopolymer particles, TEP, fromdissolved precursor material. Mar. Ecol. Prog. Ser. 192, 1–11.
Passow, U., 2014. Formation of rapidly-sinking, oil-associated marine snow. DeepSea Res. Part II: Top. Stud. Oceanogr..
Passow, U., Ziervogel, K., Asper, V., Diercks, A., 2012. Marine snow formation in theaftermath of the Deepwater Horizon oil spill in the Gulf of Mexico. Environ. Res.Lett. 7, 035301.
Paytan, A., Griffith, E.M., 2007. Marine barite: recorder of variations in ocean exportproductivity. Deep Sea Res. Part II: Top. Stud. Oceanogr. 54, 687–705.
Ravizza, G., Martin, C.E., German, C.R., Thompson, G., 1996. Os isotopes as tracers inseafloor hydrothermal systems: metalliferous deposits from the TAG hydro-thermal area, 261N Mid-Atlantic Ridge. Earth Planet. Sci. Lett. 138, 105–119.
Redmond, M.C., Valentine, D.L., 2012. Natural gas and temperature structured amicrobial community response to the Deepwater Horizon oil spill. Proc. Natl.Acad. Sci. 109, 20292–20297.
Richey, J.N., Poore, R.Z., Flower, B.P., Quinn, T.M., 2007. A 1400-year multi-proxyrecord of climate variability from the northern Gulf of Mexico. Geology 35,423–426.
Rosenthal, Y., Boyle, E.A., Labeyrie, L., Oppo, D., 1995a. Glacial enrichments ofauthigenic Cd and U in Subantarctic sediments: a climatic control on theelements' oceanic budget? Paleoceanography 10, 395–413.
Rosenthal, Y., Lam, P., Boyle, E.A., Thomson, J., 1995b. Authigenic cadmiumenrichments in suboxic sediments: precipitation and postdepositional mobility.Earth Planet. Sci. Lett. 132, 99–111.
Ryerson, T.B., Camilli, R., Kessler, J.D., Kujawinski, E.B., Reddy, C.M., Valentine, D.L.,Atlas, E., Blake, D.R., de Gouw, J., Meinardi, S., Parrish, D.D., Peischl, J., Seewald,J.S., Warneke, C, 2012. Chemical data quantify Deepwater Horizon hydrocarbonflow rate and environmental distribution. Proc. Natl. Acad. Sci. 109,20246–20253.
Schaller, T., Morford, J., Emerson, S.R., Feely, R.A., 2000. Oxyanions in metalliferoussediments: tracers for paleoseawater metal concentrations? Geochim. Cosmo-chim. Acta 64, 2243–2254.
Schrope, M., 2013. Dirty blizzard buried deepwater horizon oil. Nat. News.Scott, D.B., Medioli, F.S., 1980. Living vs. total foraminiferal populations; their
relative usefulness in paleoecology. J. Paleontol. 54, 814–831.Sen Gupta, B.K., Lobegeier, M.K., Smith, L.E., 2009. Foraminiferal communities of
bathyal hydrocarbon seeps, northern Gulf of Mexico a taxonomic, ecologic, andgeologic study. In: Baton Rouge, La (Ed.), OCS Study MMS., Gulf of Mexico OCSRegion. U.S. Dept. of the Interior, M.M.S., New Orleans, LA, p. 385.
Thibodeaux, L.J., Valsaraj, K.T., John, V.T., Papadopoulos, K.D., Pratt, L.R., Pesika, N.S.,2011. Marine oil fate: knowledge gaps, basic research, and development needs;a perspective based on the Deepwater Horizon spill. Environ. Eng. Sci. 28,87–93.
Thomson, J., Higgs, N.C., Croudace, I.W., Colley, S., Hydes, D.J., 1993. Redox zonationof elements at an oxic/post-oxic boundary in deep-sea sediments. Geochim.Cosmochim. Acta 57, 579–595.
Tribovillard, N., Algeo, T.J., Lyons, T., Riboulleau, A., 2006. Trace metals aspaleoredox and paleoproductivity proxies: an update. Chem. Geol. 232, 12–32.
Trocine, R.P., Trefry, J.H., 1983. Particulate metal tracers of petroleum drilling muddispersion in the marine environment. Environ. Sci. Technol. 17, 507–512.
Valentine, D.L., Kessler, J.D., Redmond, M.C., Mendes, S.D., Heintz, M.B., Farwell, C.,Hu, L., Kinnaman, F.S., Yvon-Lewis, S., Du, M., Chan, E.W., Tigreros, F.G.,Villanueva, C.J., 2010. Propane respiration jump-starts microbial response to adeep oil spill. Science 330, 208–211.
Verdugo, P., Santschi, P.H., 2010. Polymer dynamics of DOC networks and gelformation in seawater. Deep Sea Res. Part II: Top. Stud. Oceanogr. 57,1486–1493.
White, H.K., Hsing, P.-Y., Cho, W., Shank, T.M., Cordes, E.E., Quattrini, A.M., Nelson, R.K., Camilli, R., Demopoulos, A.W.J., German, C.R., Brooks, J.M., Roberts, H.H.,Shedd, W., Reddy, C.M., Fisher, C.R., 2012. Impact of the Deepwater Horizon oilspill on a deep-water coral community in the Gulf of Mexico. Proc. Natl. Acad.Sci. 109, 20303–20308.
Ziervogel, K., McKay, L., Rhodes, B., Osburn, C.L., Dickson-Brown, J., Arnosti, C.,Teske, A., 2012. Microbial activities and dissolved organic matter dynamics inoil-contaminated surface seawater from the deepwater horizon oil spill site.PLoS One 7, e34816.
D.W. Hastings et al. / Deep-Sea Research II ∎ (∎∎∎∎) ∎∎∎–∎∎∎12
Please cite this article as: Hastings, D.W., et al., Changes in sediment redox conditions following the BP DWH blowout event. Deep-SeaRes. II (2015), http://dx.doi.org/10.1016/j.dsr2.2014.12.009i