
Test procedures handbook for surveillance receivers below ...

Research paper
Changes in hydraulic geometry of the Hwang River below the HapcheonRe-regulation Dam, South Korea
YOUNG HO SHIN, Manager, Korea Water Resources Corporation (K-water), Daejeon, South Korea.Email: [email protected]
PIERRE Y. JULIEN, Professor, Department of Civil and Environmental Engineering, Colorado State University,Fort Collins, CO 80523, USA. Email: [email protected] (Author for correspondence)
ABSTRACTThe changes in hydraulic geometry of the Hwang River downstream of Hapcheon Dam have been investigated since 1982. The study reach is 45 kmlong from the Hapcheon Re-regulation Dam to the confluence with the Nakdong River, in South Korea. The geographic information system (GIS)analysis of a time series of aerial photographs taken in 1982, 1993 and 2004 showed that the non-vegetated active channel width decreased anaverage of 152 m (47% width reduction since 1982). The average median bed material size increased from 1.07 mm in 1983 to 5.72 mm in 2003,and the bed slope of the reach decreased from 94 to 85 cm/km from 1983 to 2003. The analysis of aerial photographs and field surveys shows thatthe 2004 channel width was asymptotically approaching the estimated equilibrium width from the Julien and Wargadalam (Julien, P.Y. andWargadalam, J., 1995. Alluvial channel geometry: theory and applications. Journal of Hydraulic Engineering, 121 (4), 312–325) hydraulic geometryequations. An exponential model is proposed and is in good agreement with field measurements. The sediment transport model GSTAR-1D shows thatthe thalweg elevation will reach equilibrium around 2013–2015. The thalweg elevation simulated for 2013 is expected to remain almost identical to thepredictions for 2023. The bed elevation changes should affect primarily the 20 km reach immediately downstream of the re-regulation dam.
Keywords: Channel change; alluvial channels; downstream hydraulic geometry; dams; re-regulation dams; Hwang River
1 Introduction
Dams affect the downstream hydraulic geometry of rivers and
change bed elevation, channel width, flow depth, bed material
sizes, armouring and bank vegetation.Hydraulic geometry is expli-
citly concerned with adjustment at a cross-section (at-a-station) or
downstream in response to changes in imposed flows and sediment
inputs (Phillips et al. 2005). A few researchers (e.g. Xu 1990,
Brandt 2000) have attempted to explicitly link principles of hydrau-
lic geometry and regime theory below dams. For the case where
clear water scour occurs, Xu’s (1990, 1996, 2001) model of
complex response downstream from reservoirs predicts a three-
stage adjustment process. First is a decrease in width/depth ratio
and channel slope, coupled with an increase in sinuosity. Feed-
backs in stage two lead to increasing width/depth w/d ratios and
decreasing sinuosity, with a slowdown in the rate of slope
change. Dam construction can produce adjustment of river chan-
nels as sediment trapped above the dam results in clearer water
immediately downstream of the dam (Downs and Gregory 2004).
A common response to the release of clear water below dams
is degradation of the channel bed, typically at rates much higher
than in natural rivers (Knighton 1998). Williams and Wolman
(1984) studied changes in mean channel-bed elevation,
channel width, bed-material sizes, vegetation, water discharges
and sediment loads downstream from 21 dams constructed on
alluvial river in USA. In their study, bed degradation varied
from negligible to about 7.5 m in the 287 cross-sections. In
general, most degradation occurred during the first decade or
two after dam closure (Williams and Wolman 1984). Simon
et al. (2002) investigated the effects of the altered flow regime
and bed degradation on bank stability by two independent
bank-stability analyses (one for planar failures, the other for
rotational failures) at the downstream of Fort Peck Dam in Mis-
souri River. They also analysed channel migration rates using
maps and photographs. River bed armouring is the main result
of the degradation process downstream of dams. Armouring
refers to coarsening of the bed-material size as a result of degra-
dation of well-graded sediment mixtures (Julien 2002). Shen and
Received on 5 November 2009. Accepted on 21 January 2010.
ISSN 1571-5124 print/ISSN 1814-2060 onlineDOI:10.1080/15715121003651252http://www.informaworld.com
139
Intl. J. River Basin Management Vol. 8, No. 2 (2010), pp. 139–150
# 2010 International Association for Hydro-Environment Engineering and Research
Downloaded By: [Colorado State University] At: 15:47 20 July 2010

Lu (1983) examined the development of bed armouring and
derived three simple regression equations to predict the median
size, d30 and d84, of the final armouring bed material size distri-
bution for different gradation of the initial bed material and flow
conditions. Major increases of bed sediment sizes had been
reported within sand-bed reaches, dominated by sediments of
100–200 mm being converted to coarse-sand and gravel-bed
reaches (Petts 1984). Karim et al. (1983) developed a one-dimen-
sional approach for bed armouring in alluvial channels, and
Karim and Holly (1986) applied this approach to simulate 20
years of bed degradation in the Missouri River downstream of
Gavins Point Dam. The research result shows good agreement
with the observed bed characteristics. More recently, Richard
et al. (2005a) has examined the morphological changes below
Cochiti Dam in New Mexico, USA (Richard and Julien 2003).
A model describing changes in channel width with time was
also defined by Richard et al. (2005b).
As 20 years have passed since some multi-purpose dams were
completed in South Korea, it seems important to monitor the
river changes downstream of those dams. The Hwang River, a
tributary of the Nakdong River, was selected as the study reach
for 45 km reach from the Hapcheon Re-regulation Dam to the
confluence with the Nakdong River. This study reach is represen-
tative of channel bed degradation, bed material coarsening,
channel narrowing and vegetation expansion processes.
Basic studies (Ministry of Construction and Transportation
1983, 1993, 2003) were conducted by the Korean Government
(Ministry of Construction and Transportation (MOCT)). These
studies included climate change, land use change, surveying of
river channel and estimating bed material as part of the river
channel management plan and river basin investigation. These
studies showed evidence of channel bed degradation and bed
material coarsening during the 13-year period immediately
after the completion of the dam. In addition, several researchers
investigated the effect of flow regime changes on the river mor-
phology and vegetation cover in the downstream river reach after
the Hapcheon Dam construction (Choi et al. 2004, 2005, Woo
et al. 2004a, 2004b). They analysed the changes in bed elevation,channel cross-sections and vegetation expansion by this flow
regime change. However, these studies mainly focused on the
effects of the dam construction in riparian vegetation and mor-
phology at present time without the prediction of future
channel changes. It is also important to predict the future
changes in hydraulic geometry and define where a new equili-
brium and stability conditions may be reached.
This research proposes a contribution toward better under-
standing of river regulation below dams, and the response to
varying water and sediment inputs. Because dams influence
the two primary factors (water and sediment) that determine
the shape, size and overall morphology of a river, they represent
fundamental interventions in the fluvial system (Xu 1990, Grant
et al. 2003). This research thoroughly documents the changing
inputs to the downstream river system of the Hwang River
before and after construction of the Hapcheon Dam.
The main objectives of this research are as follows:
(1) Identifying spatial and temporal trends and the correspond-
ing response of the channel before and after dam construc-
tion. The focus is on the variations in hydrologic and
sediment regimes, and the changes in bed material, bed
elevation, active channel width, vegetation expansion and
channel planform geometry.
(2) Using computer models to predict future channel changes
until 2023 and specifically analyse lateral and vertical vari-
ations in channel width, bed slope, bed material and expan-
sion of islands and vegetation.
2 Hwang River study reach
This study reach is located on the Hwang River, one of the
tributaries to the Nakdong River, South Korea. The Hwang
River flows from west to east. It is located at the western part
of the Nakdong River basin as shown in Figure 1. The river
length is 107.6 km and the total river basin area is 1329 km2.
The study reach is 45 km long and extends from the Hapcheon
Re-regulation Dam to the Nakdong River confluence. The
partial basin area of 372.4 km2 covers 28% of the total
Figure 1 Study reach of the Hwang River below Hapcheon Dam
140 Young Ho Shin and Pierre Y. Julien
Downloaded By: [Colorado State University] At: 15:47 20 July 2010

Hwang River basin (1329 km2). The Hapcheon Main Dam was
constructed in the narrow canyon of the Hwang River. The dam
is located about 16 km north of Hapcheon City. This purpose of
the dam was to reduce flood damage and provide supply water
to the downstream of the Nakdong River. The basin area at the
dam site covers 925 km2. It has a reservoir storage capacity of
790 × 106 m3.
Figure 2 shows a diagram of plan view between the Hapcheon
Main Dam and Re-regulation Dam. The re-regulation dam is
located 6.5 km downstream of the main dam to regulate the dis-
charge from the main hydro power station. The main power
station is located 2 km upstream from the Re-regulation Dam
and operates only 3 h per day except during flood season. The
maximum discharge of the main power station is 119 m3/s
(1,285,200 m3/day) and the re-regulation dam regulates this
3 h discharge as approximately 15 m3/s on a daily basis.
3 Analysis of spatial and temporal trends
Most of the data collection began on the Hwang River in 1983
with the national river channel maintenance plan to protect prop-
erties from flood damage by the Ministry of Construction of
Korea, which is now known as the MOCT in 1996. Data are gen-
erally collected every 10 years and focused on maintenance and
construction of levee along the channel especially downstream of
the Hapcheon Re-regulation Dam to reduce flood damage. It
included cross-section survey, bed material size survey, flow dis-
charge, meteorological data, water quality and environmental
conditions such as distribution of animals and plants. There are
three major data sets for this study reach (1983, 1993, 2003).
Aerial photos taken in 1982, 1993 and 2004 were gathered
from the National Geographic Information Institute of Korea to
quantify and compare the channel adjustment before and after
dam construction. Discharge data also were available at the
gauging stations of MOCT and KOWACO from 1969 to 2005.
The discharge, aerial photos, cross-sections and sediment data
were utilized to quantify the analysis of the channel changes
along the study reach. The water discharge, bed material, bed
slope and channel width were examined before and after dam
construction to identify historic trends. Sediment transport
rates were estimated using empirical equations and compared
with measured data from the reservoir sedimentation surveys
of the Hapcheon Main Dam in 2002 (KOWACO 2002). Also,
representative values for each of these variables were identified
for use in the channel stability analysis. Finally, a field investi-
gation was conducted to confirm the trends in channel response
determined at the cross-sections along the study reach.
3.1 Flow regime
Daily stream discharge data along the study reach were available
from 1969 to present at the gauging stations of KOWACO and
MOCT. The flow discharge data were collected at the Changri
Station, which changed its name to the Hapcheon Re-regulation
Dam gauging station operated by KOWACO after 1989 (after
completion of the dam). In addition, hourly and 30 min data
were available since 1996. There were also two water level
gauging stations downstream of the Hapcheon Re-regulation
Dam, namely the Hapcheon and Jukgo gauging stations operated
by MOCT since 1962. Most of the analysis is based on the most
reliable data source at the Hapcheon Re-regulation Dam.
As shown in Figure 3 and Table 1, water discharge records
since 1969 reveal a decline in annual peak discharge after the
Hapcheon Main Dam and Re-regulation Dam construction.
Quantified impacts of the Hapcheon Main Dam and the
Re-regulation Dam on the annual water discharge regime
included the following listed items:
(1) The dam attenuated mean annual peak discharges greater
than 528 m3/s (from 654.7 to 126.3 m3/s). The mean
annual peak discharge of the post-dam period (1989–
2005) was only 19% of the mean annual peak discharge
during the pre-dam period (1969–1981).
Figure 2 Plan view of the HapcheonMainDam andRe-regulationDam
Figure 3 Annual peak discharges at the Hapcheon Re-regulation Damsite from 1969 to 2005
Changes in hydraulic geometry of the Hwang River 141
Downloaded By: [Colorado State University] At: 15:47 20 July 2010

(2) The bankfull discharge (1.58 year discharge frequency) was
estimated by using annual daily peak discharges for pre-dam
(1969–1981) and post-dam (1989–2005) period. The
bankfull discharge of post-dam period was only 17% of
the bankfull discharge during the pre-dam period.
(3) The mean daily discharge was greater during the pre-dam
period than during the post-dam period (28.7 m3/s during
pre-dam and 22.1 m3/s during post-dam period). This corre-
sponds to a 23% decrease in mean daily discharge at the
Hapcheon Re-regulation Dam gauge.
(4) The flow duration curve shown in Figure 4 illustrates the
changes in the distribution of daily flows before and after
dam construction. The impact of the dam in reducing the fre-
quency of discharges larger than 30m3/s is clearly indicated,
as well as the increased frequency of flow discharges
between 10 and 30 m3/s.
Cross-section survey data were also measured in 1983, 1993
and 2003 for this study reach. The cross-section survey data set
from 1983 was obtained from the National Water Management
Information System (WAMIS) of Korea website. It consists of
Microsoft Excel spreadsheets and it was converted to HEC-
RAS format to facilitate the analysis of flow conditions. The
cross-section survey data sets from 1993 were only available
in a survey report; so only the thalweg elevation data could be
extracted and digitized. Finally, the cross-section survey data
set from 2003 contained HEC-RAS geometric input file (Minis-
try of Construction and Transportation 2003); so it was directly
used in the analysis to the study flow conditions. The cross-
section surveys were collected approximately 500 m apart for a
total of 100 cross-sections in 1983 and 1993. However, in
2003, a more detailed cross-section survey was conducted at a
spacing of 250 m, thus providing detailed information for a
total of 210 cross-sections.
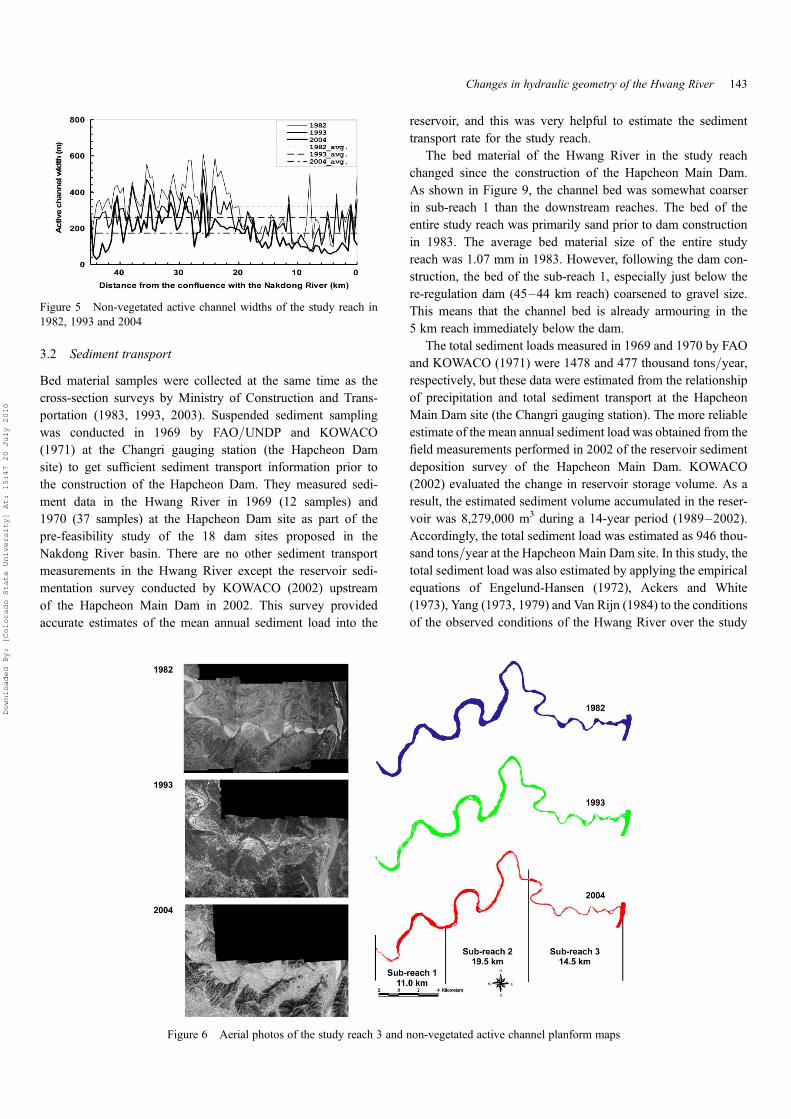
The lateral response of this channel for each of the three aerial
surveys was measured in terms of non-vegetated active channel
width, channel width/depth ratio and sinuosity. Width changes
were measured from the non-vegetated active channel digitized
from aerial photos taken in 1982, 1993 and 2004. As shown in
Figure 5, the active channel width decreased after dam construc-
tion along the entire study reach from 321 m in 1982 to 172 m in
2004. The width of the entire reach was reduced to just 54% of
the active channel width of 1982. The rate of change in active
channel width between 1993 and 2004 was faster than between
1982 and 1993.
The width/depth ratios also slightly decreased in most of the
reaches except sub-reach 3 (Shin 2007). The width/depth ratio
of the entire reach decreased from 279 to 258 from 1982 to
2004, respectively. The sinuosity of all reaches slightly
decreased after the dam construction. Also, the total sinuosity
of the study reach remained higher than 1.8 throughout all
years from 1982 to 2004. Sub-reach 2 was the most sinuous
reach among the three sub-reaches. According to the planform
maps of the non-vegetated active channel (Figure 6), channel
planform geometry was relatively unchanged from pre- to
post-dam period.
The longitudinal profile for the entire reach is shown in
Figure 7 from the field surveys in 1983, 1993 and 2003. The
bed slope of sub-reach 1 increased after dam completion but
the slope of downstream sub-reaches decreased. The bed slope
of the entire reach declined from 94.3 to 84.7 cm/km from
1983 to 2003. During the post-dam period, the largest degra-
dation occurred along the 45–30 km reach (15 km reach immedi-
ately downstream of the re-regulation dam). An average
degradation of 2.6 m for this reach (45–30 km) was measured
from 1983 to 2003.
According to the field investigation and the analysis of aerial
photos and cross-sectional profiles summarized in Table 2, the
channel scour and narrowing occurred at most of the cross-
sections along the study reach. As shown in Figure 8, the reach
immediately below the dam (between 45 and 40 km from the con-
fluence with the Nakdong River) showed the maximum scour. In
the middle reach, approximately between 38 and 15 km, the
channel bed reached relatively stable conditions even showed
bed scour and channel narrowing. However, the reach at the
end of the study reach showed channel division into several
sub channels and island formation with establishment of peren-
nial vegetation. The increase in vegetated areas and in the areas
covered by islands also corroborates the observations of Choi
et al. (2005).Figure 4 Flow duration curves at the Hapcheon Re-regulation Damsite from 1969 to 2005
Table 1 Mean annual peak and minimum discharge at the Hapcheon
Re-regulation Dam site
Period
Mean annual
peak discharge
(m3/s)
Mean annual
minimum discharge
(m3/s)
Pre-dam (1969–1981) 654.7 2.6
Post-dam (1989–2005) 126.3 4.1
Overall (1969–2005) 355.3 3.5
142 Young Ho Shin and Pierre Y. Julien
Downloaded By: [Colorado State University] At: 15:47 20 July 2010
3.2 Sediment transport
Bed material samples were collected at the same time as the
cross-section surveys by Ministry of Construction and Trans-
portation (1983, 1993, 2003). Suspended sediment sampling
was conducted in 1969 by FAO/UNDP and KOWACO
(1971) at the Changri gauging station (the Hapcheon Dam
site) to get sufficient sediment transport information prior to
the construction of the Hapcheon Dam. They measured sedi-
ment data in the Hwang River in 1969 (12 samples) and
1970 (37 samples) at the Hapcheon Dam site as part of the
pre-feasibility study of the 18 dam sites proposed in the
Nakdong River basin. There are no other sediment transport
measurements in the Hwang River except the reservoir sedi-
mentation survey conducted by KOWACO (2002) upstream
of the Hapcheon Main Dam in 2002. This survey provided
accurate estimates of the mean annual sediment load into the
reservoir, and this was very helpful to estimate the sediment
transport rate for the study reach.
The bed material of the Hwang River in the study reach
changed since the construction of the Hapcheon Main Dam.
As shown in Figure 9, the channel bed was somewhat coarser
in sub-reach 1 than the downstream reaches. The bed of the
entire study reach was primarily sand prior to dam construction
in 1983. The average bed material size of the entire study
reach was 1.07 mm in 1983. However, following the dam con-
struction, the bed of the sub-reach 1, especially just below the
re-regulation dam (45–44 km reach) coarsened to gravel size.
This means that the channel bed is already armouring in the
5 km reach immediately below the dam.
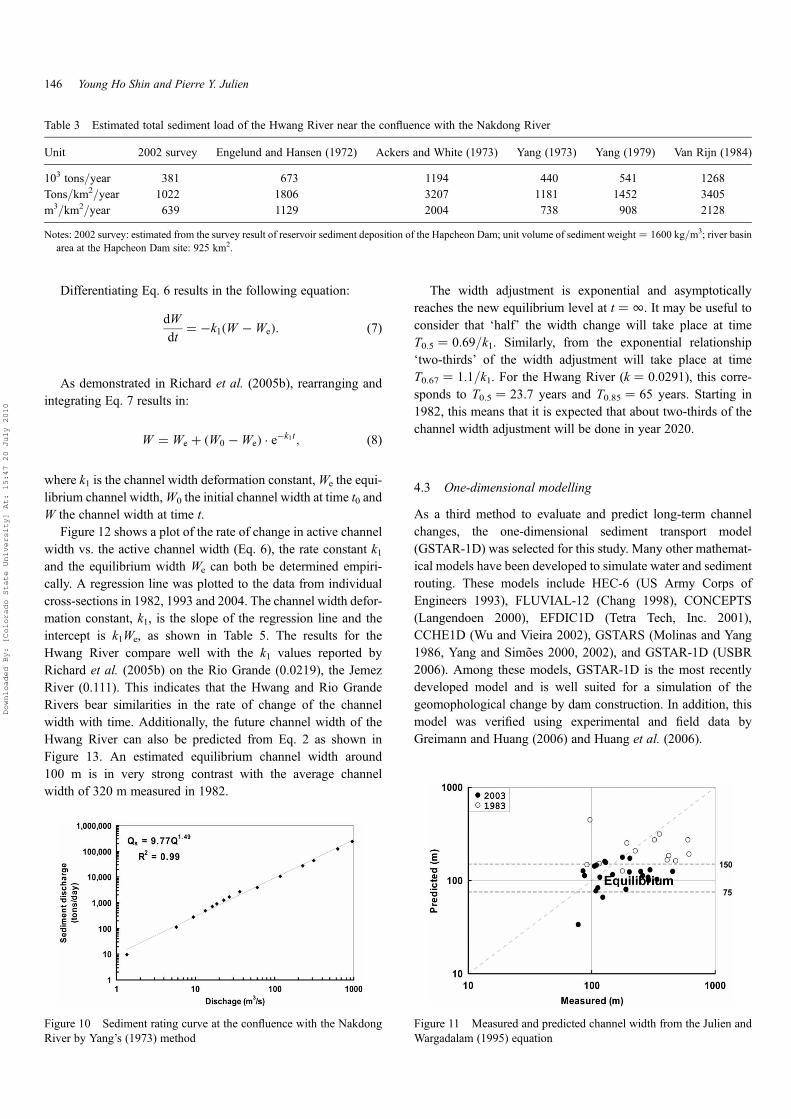
The total sediment loads measured in 1969 and 1970 by FAO
and KOWACO (1971) were 1478 and 477 thousand tons/year,
respectively, but these data were estimated from the relationship
of precipitation and total sediment transport at the Hapcheon
Main Dam site (the Changri gauging station). The more reliable
estimate of the mean annual sediment load was obtained from the
field measurements performed in 2002 of the reservoir sediment
deposition survey of the Hapcheon Main Dam. KOWACO
(2002) evaluated the change in reservoir storage volume. As a
result, the estimated sediment volume accumulated in the reser-
voir was 8,279,000 m3 during a 14-year period (1989–2002).
Accordingly, the total sediment load was estimated as 946 thou-
sand tons/year at the Hapcheon Main Dam site. In this study, the
total sediment load was also estimated by applying the empirical
equations of Engelund-Hansen (1972), Ackers and White
(1973), Yang (1973, 1979) and Van Rijn (1984) to the conditions
of the observed conditions of the Hwang River over the study
Figure 6 Aerial photos of the study reach 3 and non-vegetated active channel planform maps
Figure 5 Non-vegetated active channel widths of the study reach in1982, 1993 and 2004
Changes in hydraulic geometry of the Hwang River 143
Downloaded By: [Colorado State University] At: 15:47 20 July 2010

reach. From the analysis of these different sediment transport
formulas summarized in Table 3, Shin (2007) concluded that
the Yang (1973) method was the most appropriate to estimate
sediment transport in this study reach. The corresponding sedi-
ment-rating curve for the study reach is shown in Figure 10.
4 Prediction of future channel changes
Three different methods are used to model the lateral and vertical
deformation rates of alluvial channels. The methods are based on
measured changes in bed slope and non-vegetated active channel
width, and predict future rates of change and estimate the equili-
brium state of the channel.
4.1 Equilibrium channel width prediction
First, the hydraulic geometry equation of Julien andWargadalam
(1995) was applied for this study. The method estimates the
channel flow depth h, surface width W, average flow velocity
V, friction slope S of a channel as a function of the dominant dis-
charge, the median grain diameter of the bed and the Shield par-
ameter t∗. The relationships obtained from a large data set
including data from 835 rivers and canals defines the simplified
downstream hydraulic geometry for non-cohesive alluvial chan-
nels for hydraulically rough turbulent flows as
h � 0.133Q0.4t∗−0.2 (1)
W � 0.512Q0.53d−0.33s t∗−0.27 (2)
V � 14.7Q0.07d0.33s t∗0.47 (3)
S � 12.4Q−0.4dst∗1.2 (4)
t∗ � 0.121Q0.33d−0.83s S0.83, (5)
where Q is the flow discharge and ds the grain diameter.
Figure 7 Variation of longitudinal profiles of the study reach in 1983,1993 and 2003
Table 2 Geomorphic response of the Hwang River below Hapcheon Dam
Location Geomorphic response Field evidence or indicators
40 km (1 km downstream of the
Yongju bridge)
Channel scour Thalweg elevation decreased 3.53 m (42.03�38.5 m)
Channel rerouted and divided Channel divided into two sub channels
Channel narrowing 63.4% of 1982 channel width (393.4�249.5 m)
Island formation with vegetation growth Island formed after the channel rerouted and divided
Bed armouring Gravel bed material, d50 was 1.2 mm in 2003 survey but it
already coarser than before (sand�gravel)
35 km (Vicinity of Hapcheon
city)
Channel scour Thalweg elevation decreased 2.24 m (34.34�32.1 m)
Reclaimed playground on left flood plain Reclaimed playground at left-side sand channel bed
Channel narrowing 79.8% of 1982 channel width (479.6�382.7 m)
Stable channel No island formation and vegetation growth and little change
in bed material size (same as sand)
25 km (Immediately downstream
of the Youngjeon bridge)
Channel scour Thalweg elevation was little changed but maximum scour
depth is 2.51 m (23.25�20.74 m)
Reclaimed playground on right flood plain Reclaimed playground at right-side sand channel bed as
shown in Figure 4-34 and 4-35 (Shin 2007)
Channel narrowing 75.8% of 1982 channel width (241.2�182.9 m)
Stable channel No island formation and vegetation growth and little change
in bed material size (same as sand)
1.5 km (Just upstream of the
Cheongduk bridge)
Channel scour Thalweg elevation was little changed but maximum scour
depth is 3.21 m (10.81�7.6 m)
Channel rerouted and divided Channel divided into several sub channels (braided)
Channel narrowing 25.0% of 1982 channel width (299.4�74.9 m)
Island formation with vegetation growth Several islands with perennial vegetation (willow)
144 Young Ho Shin and Pierre Y. Julien
Downloaded By: [Colorado State University] At: 15:47 20 July 2010

The hydraulic geometry of stable channels is obtained from the
above equations when t∗ � 0.047 (Julien 2002). In comparison
with the field measurements of the Hwang River, the results
shown in Figure 11 are in better agreement in 2004 than in
1982. However, the alluvial channel of the Hwang River in the
study reach has not yet reached equilibrium. The estimated
equilibrium channel width from Eq. 2 was 116 m in Table 4,
compared to channel width of 178.9 m measured in 2004.
4.2 Transient changes in channel width
The second method used the exponential function for the channel
width. The exponential function developed by Richard et al.(2005b) was applied to fit the active channel width change per
time for the study reach. The hypothesis of this method implies
that the change in channel width is proportional to the difference
between the current channel width and the equilibriumwidth,We:
DW
Dt= −k1(W −We), (6)
where DW is the change in active channel width (m) during the
time period Dt; and Dt the time period (years).
Figure 8 Planforms (1982 and 2004), cross-section geometry (1983 and 2003) and photos (2007) of the study reach
Figure 9 Median bed material size along the study reach
Changes in hydraulic geometry of the Hwang River 145
Downloaded By: [Colorado State University] At: 15:47 20 July 2010
Differentiating Eq. 6 results in the following equation:
dW
dt= −k1(W −We). (7)
As demonstrated in Richard et al. (2005b), rearranging and
integrating Eq. 7 results in:
W = We + (W0 −We) · e−k1t, (8)
where k1 is the channel width deformation constant,We the equi-
librium channel width,W0 the initial channel width at time t0 andW the channel width at time t.
Figure 12 shows a plot of the rate of change in active channel
width vs. the active channel width (Eq. 6), the rate constant k1and the equilibrium width We can both be determined empiri-
cally. A regression line was plotted to the data from individual
cross-sections in 1982, 1993 and 2004. The channel width defor-
mation constant, k1, is the slope of the regression line and the
intercept is k1We, as shown in Table 5. The results for the
Hwang River compare well with the k1 values reported by
Richard et al. (2005b) on the Rio Grande (0.0219), the Jemez
River (0.111). This indicates that the Hwang and Rio Grande
Rivers bear similarities in the rate of change of the channel
width with time. Additionally, the future channel width of the
Hwang River can also be predicted from Eq. 2 as shown in
Figure 13. An estimated equilibrium channel width around
100 m is in very strong contrast with the average channel
width of 320 m measured in 1982.
The width adjustment is exponential and asymptotically
reaches the new equilibrium level at t ¼ 1. It may be useful to
consider that ‘half’ the width change will take place at time
T0.5 ¼ 0.69/k1. Similarly, from the exponential relationship
‘two-thirds’ of the width adjustment will take place at time
T0.67 ¼ 1.1/k1. For the Hwang River (k ¼ 0.0291), this corre-
sponds to T0.5 ¼ 23.7 years and T0.85 ¼ 65 years. Starting in
1982, this means that it is expected that about two-thirds of the
channel width adjustment will be done in year 2020.
4.3 One-dimensional modelling
As a third method to evaluate and predict long-term channel
changes, the one-dimensional sediment transport model
(GSTAR-1D) was selected for this study. Many other mathemat-
ical models have been developed to simulate water and sediment
routing. These models include HEC-6 (US Army Corps of
Engineers 1993), FLUVIAL-12 (Chang 1998), CONCEPTS
(Langendoen 2000), EFDIC1D (Tetra Tech, Inc. 2001),
CCHE1D (Wu and Vieira 2002), GSTARS (Molinas and Yang
1986, Yang and Simoes 2000, 2002), and GSTAR-1D (USBR
2006). Among these models, GSTAR-1D is the most recently
developed model and is well suited for a simulation of the
geomophological change by dam construction. In addition, this
model was verified using experimental and field data by
Greimann and Huang (2006) and Huang et al. (2006).
Figure 11 Measured and predicted channel width from the Julien andWargadalam (1995) equation
Figure 10 Sediment rating curve at the confluence with the NakdongRiver by Yang’s (1973) method
Table 3 Estimated total sediment load of the Hwang River near the confluence with the Nakdong River
Unit 2002 survey Engelund and Hansen (1972) Ackers and White (1973) Yang (1973) Yang (1979) Van Rijn (1984)
103 tons/year 381 673 1194 440 541 1268
Tons/km2/year 1022 1806 3207 1181 1452 3405
m3/km2/year 639 1129 2004 738 908 2128
Notes: 2002 survey: estimated from the survey result of reservoir sediment deposition of the Hapcheon Dam; unit volume of sediment weight ¼ 1600 kg/m3; river basinarea at the Hapcheon Dam site: 925 km2.
146 Young Ho Shin and Pierre Y. Julien
Downloaded By: [Colorado State University] At: 15:47 20 July 2010

GSTAR-1D is a hydraulic and sediment transport numerical
model developed to simulate flows in rivers and channels with
or without movable boundaries. This model can simulate water
surface profiles in single channels, dendritic and looped network
channels. It has also both steady and unsteady algorithms for
surface flow and sediment transport. It uses the standard step
method to solve the energy equation for steady gradually varied
flows. It solves the St-Venant equations for unsteady rapid
varied flows. For a long-term simulation, the unsteady terms of
the sediment transport continuity equation are ignored, and the
non-equilibrium sediment transport method is used. For a
short-term simulation, the governing equation for sediment
transport is the convection diffusion equation with a source term
arising from sediment erosion/deposition (Huang et al. 2006).GSTAR-1D is a one-dimensional model and has inherent
limitations (Huang et al. 2006). It should not be applied to situ-
ations where a two-dimensional or three-dimensional model is
needed. The model ignores secondary currents, lateral diffusion
and super elevation in bends. Many of the sediment transport
modules and concepts used in GSTAR-1D are simplified one-
dimensional formulations. The input data for GSTAR-1D
includes cross-section data, river length, slope, river network
configuration, bed material gradation, Manning’s roughness
coefficient, discharge and water surface elevation at the upstream
or downstream boundary conditions, etc. The output of GSTAR-
1D includes water surface elevations, cross-section elevation
Figure 12 Measured change in active channel width vs. active channelwidth
Table 4 Measured and predicted channel width from Julien and Wargadalam’s (1995) hydraulic geometry equations
Distance (km) Slope (m/m) Median diameter, d50 (mm) Discharge, Q (m3/s)
Channel width (m)
% errorMeasured Predicted
45.02 0.015502 44 86.3 275.0 33.3 288
42 0.000239 1.2 86.3 83.3 124.1 49
40 0.001235 1.7 86.3 249.5 83.2 267
38 0.002271 0.95 86.3 182.2 77.6 257
36 0.000626 0.45 86.3 243.1 111.8 254
34 0.006716 0.79 97.9 184.8 65.9 264
32 0.000840 1.1 97.9 259.9 100.4 261
30 0.002613 0.89 97.9 209.4 80.1 262
28 0.000506 0.4 97.9 283.8 125.5 256
26 0.001079 0.58 97.9 391.4 102.0 274
24 0.000885 0.51 97.9 251.7 108.1 257
22 0.000094 0.5 97.9 194.2 177.3 29
20 0.000505 0.82 97.9 192.7 116.0 240
18 0.000113 0.45 97.9 128.7 172.3 34
16 0.000454 0.61 97.9 94.0 122.7 30
14 0.001096 0.52 109.5 242.7 108.1 255
12 0.000244 0.69 109.5 105.7 145.8 38
10 0.000505 0.2 109.5 124.8 142.3 14
7.95 0.000657 0.33 109.5 81.9 127.1 55
6 0.000443 0.12 109.5 62.0 155.0 150
4 0.001977 0.115 109.5 65.7 112.0 71
2 0.000351 0.14 109.5 100.2 160.4 60
0 0.000900 0.15 109.5 108.4 129.4 19
Average 0.00173 2.5 99.4 178.9 116.5 28.8
Table 5 Empirical estimation of k1 and We from active channel width
data
Reach no. k1 k1We We (m) R2
Entire 0.0291 1.6581 75 0.42
1 0.0271 1.0607 39 0.18
2 0.0313 3.1615 101 0.57
3 0.0437 3.707 85 0.58
Changes in hydraulic geometry of the Hwang River 147
Downloaded By: [Colorado State University] At: 15:47 20 July 2010

changes due to erosion or deposition, changes to riverbed
material, sediment concentrations and sediment load, bed shear
stress, etc.
This model is particularly useful to determine the vertical
changes in bed elevation as well as the rates of degradation
and coarsening of the bed material. The simulations used the
original 1983 measured cross-sections and bed material grada-
tion data as well as the daily flow discharge data at the Hapcheon
Re-regulation Dam. The model simulated 20 years (1983–2003)
under non-uniform flow conditions. The model was calibrated
using the steady flow conditions at the bankfull discharge of
509.8 m3/s for the pre-dam period (1983–1988) and 86.3 m3/
s for the post-dam period (1989–2003). The simulation results
in Shin (2007) were in good agreement with the measured data
in 2003. As shown in Figure 14, the numerical model reproduces
the same general shape and magnitude as the observed thalweg
elevation changes in the main channel.
After 2003, the model was used to predict the future changes
in channel bed elevation (thalweg elevation) and bed material
size along the study reach. The model was run to simulate a
20-year period from 2003 to 2023, and the measured data of
2003 were used as initial condition for this simulation. The
bed elevation changes mostly occurred immediately down-
stream of the re-regulation dam from 45 to 33 km. The
maximum scour depth was about 4 m near the re-regulation
dam (45–25 km) after 1983. From the results shown in Figure
15, these bed elevations changes are expected to vanish within
10 years (2013) and the channel bed of the upper reach will
be essentially stable after 2013. Armouring is also taking place
in the upper part of the study reach as shown in Figure 16,
and a gravel-bed channel can be found for a distance of about
10 km downstream of the re-regulation dam. The simulated
average bed material size will coarsen in 2023 (from 1 to
9 mm) from 43 to 35 km.
5 Summary and conclusions
This article describes the past and prospective changes in
channel geometry of the 45 km reach of the Hwang River
between the Hapcheon Re-regulation Dam and the confluence
with the Nakdong River. Historical time series data including
flow rate, aerial photos, cross-section survey, sediment transport
and bed material data were gathered, estimated and applied for
this study reach. The available data set is sufficiently detailed to
describe the dynamic response in alluvial channel geometry of
the Hwang River after dam construction. This analysis corrobo-
rates earlier findings about the changes in fluvial morphology
and vegetation from Choi et al. (2004, 2005) and Woo et al.
(2004a, 2004b). New findings are obtained from the detailed
analysis of the changes in hydraulic geometry from GIS
photo interpretation, and the modelling simulations predict
future river changes in channel width, bed elevation and bed
material size until 2023. The primary conclusions of this analy-
sis are as follows:
(1) There are significant differences between pre- and post-dam
hydraulic geometry of the Hwang River. The channel bed
coarsened from sand to gravel (from 2.16 to 44 mm) over
the 5 km reach below the re-regulation dam. The river
Figure 14 Measured and predicted thalweg elevation from 1983 to2003 by GSTAR-1D model
Figure 15 Measured (1983 and 2003) and predicted thalweg elevationchanges from 2003 to 2023
Figure 13 Exponential model of channel width change over the time
148 Young Ho Shin and Pierre Y. Julien
Downloaded By: [Colorado State University] At: 15:47 20 July 2010

channel degraded up to 2.6 m over the 20 km reach
downstream of the re-regulation dam. The channel width
decreased significantly and channel stability increased
following construction of the dam.
(2) Three methods are used to predict future changes and to
estimate the state of future equilibrium for this reach:
(a) The method of Julien and Wargadalam (1995) shows
in Figure 11 that the channel width decreased and
approached the estimated equilibrium channel width of
115 m.
(b) The exponential model of Richard et al. (2005b) in
Figure 13 shows good agreement (particularly sub-
reach 3) between the gradual changes in channel width
since dam construction. The estimated future equili-
brium channel width should become about 100 m com-
pared with 320 m of channel width in 1982.
(c) The results of the GSTAR-1D model in Figures 15 and
16 indicate that the changes in bed elevation and bed
material distribution should reach stable/equilibrium
condition around 2013–2015. The simulated thalweg
elevation should not change much from 2013 until
2023. In addition, bed elevation changes are primarily
expected along the 20 km reach immediately below the
re-regulation dam. The maximum channel scour depth
was about 4 m. The simulated average bed material
size is expected to coarsen until 2023 (from 1 to 9 mm).
Acknowledgements
This paper is primarily the result of the analysis of the first
writer during his PhD studies at Colorado State University
(Shin 2007). The financial support from the Korea Water
Resources Corporation (K-water) during the course of the
study is gratefully acknowledged. However, the results do not
necessarily reflect policies or endorsement of K-water. The
writers are grateful to Hyosub Cho, Jungyup Kim, and
Changrae Jang and Jahun Jun at K-water who individually
contributed to this study.
References
Ackers, P. and White, W.R., 1973. Sediment transport: new
approach and analysis. Journal of Hydraulics Division,
ASCE, 99 (HY11), 2041–2060.
Brandt, S.A., 2000. Prediction of downstream geomorphological
changes after dam construction: a stream power approach.
Water Resources Development, 16, 343–367.Chang, H.C., 1998. Fluvial-12 mathematical model forerodible channels, User’s Manual, San Diego State Univer-
sity, San Diego, CA, USA.
Choi, S.U., Yoon, B., andWoo, H., 2005. Effects of dam-induced
flow regime change on downstream river morphology and
vegetation cover in the Hwang River, Korea. River Research
and Applications, 21, 315–325.Choi, S.U., et al., 2004. Effect of flow regime changes due to
damming on the river morphology and vegetation cover in
the downstream river reach: a case of Hapcheon Dam on the
Hwang River (in Korean). Journal of Korea Water ResourcesAssociation, 37 (1), 55–66.
Downs, P.W. and Gregory, K.J., 2004. River channel manage-ment: towards sustainable catchment hydrosystems. OxfordUniversity Press, Berkeley, CA, USA, 395 pp.
Engelund, F. and Hansen, E., 1972. A monograph on sediment
transport in alluvial streams. Copenhagen: Teknisk Forlag.
FAO (Food and Agriculture Organization of the United Nations)
and KOWACO (Korea Water Resources Development Cor-
poration), 1971. Pre-investment survey of the Nakdong RiverBasin, Korea, Vol. 4, Sediment Transportation in Rivers of
the Nakdong Basin, Seoul, Korea.
Grant, G.E., Schmidt, J.C., and Lewis, S.L., 2003. A geological
framework for interpreting downstream effects of dams on
rivers. Water Science and Application, 7, 209–225.
Greimann, B.P. and Huang, J., 2006. One-dimensional modelingof incision through reservoir deposits. Hydraulic Engineers,
Sedimentation and River Hydraulics Group, Technical
Service Center, USBureau of Reclamation, Denver, CO, USA.
Huang, J.V., Greimann, B.P., and Bauer, T., 2006. Developmentand application of GSTAR-1D. Proceedings of the eighth
Federal Interagency Sedimentation Conference (8th FISC),
Reno, NV, USA.
Julien, P.Y., 2002. River mechanics. New York, NY: Cambridge
University Press, 434 pp.
Julien, P.Y. andWargadalam, J., 1995.Alluvial channel geometry:
theory and applications. Journal ofHydraulicEngineering, 121(4), 312–325.
Karim, M.F. and Holly, F.M., 1986. Armoring and sorting simu-
lation in alluvial rivers. Journal of Hydraulic Engineering,112 (8), 705–715.
Karim, M.F., Holly, F.M., and Kennedy, J.F., 1983. Bed
armoring processes in alluvial and application to Missouri
River. Iowa City, IA: University of Iowa, IIHR Rep, No. 269.
Knighton, A.D., 1998. Fluvial forms and processes: a new per-
spective. New York: Oxford University Press, 383 pp.
Figure 16 Measured (1983 and 2003) and predicted median bedmaterial size (d50, mm) from 2003 to 2023
Changes in hydraulic geometry of the Hwang River 149
Downloaded By: [Colorado State University] At: 15:47 20 July 2010

KOWACO (Korea Water Resources Corporation), 2002. The
report of survey of reservoir sediment deposition of HapcheonDam, KOWACO Report, Daejon, Korea.
Langendoen, E.J., 2000. CONCEPTS – conservational channel
evolution and pollutant transport system. USDA-ARS
National Sedimentation Laboratory, Research Report No. 16,
December, Oxford, MS, USA.
Ministry of Construction and Transportation (MOCT), 1983. Areport of master plan for the river improvement project inthe Hwang River, Nakdong River basin (in Korean), MOCT
Report, Seoul, Korea.
Ministry of Construction and Transportation (MOCT), 1993. Areport of analysis for the river bed change in the HwangRiver, Nakdong River basin (in Korean), MOCT Report,
Seoul, Korea.
Ministry of Construction and Transportation (MOCT), 2003. Areport of master plan for the river improvement project in
the Hwang River, Nakdong River basin (in Korean), MOCT
Report, Seoul, Korea.
Molinas, A. and Yang, C.T., 1986. Computer program user’s
manual for GSTARS (generalized stream tube model for allu-vial river simulation). Denver, CO: US Bureau of Recla-
mation, Technical Service Center.
Petts, G.E., 1984. Impounded rivers: perspectives for ecological
management. Chichester, UK: Wiley & Sons.
Phillips, J.D., Slattery, M.C., and Musselman, Z.A., 2005.
Channel adjustment of the lower Trinity River, Texas, down-
stream of Livingston Dam. Earth Surface Processes andLandforms, 30, 1419–1439.
Richard, G.A. and Julien, P.Y., 2003. Dam impacts and
restoration on an alluvial river – Rio Grande, New Mexico.Invited Paper at the US-Chinese Joint Workshop on Sediment
Transport and Environmental Studies, Milwaukee, WI, 21–28
July 2002, International Journal of Sediment Research.Richard, G.A., Julien, P.Y., and Baird, D.C., 2005a. Case study:
modeling the lateral mobility of the Rio Grande below Cochiti
Dam, New Mexico. Journal of Hydraulic Engineering, 131
(11), 931–941.
Richard, G.A., Julien, P.Y., and Baird, D.C., 2005b. Statistical
analysis of lateral migration of the Rio Grande, New
Mexico. Geomorphology, 71, 139–155.Shen, H.W. and Lu, J., 1983. Development and prediction of bed
armoring. Journal ofHydraulicEngineering, 109 (4), 611–629.
Shin, Y.H., 2007.Channel changes downstream of the HapcheonRe-regulation Dam in South Korea, Dissertation (PhD),
Colorado State University, Fort Collins, CO, 80523.
Simon, A., et al., 2002. Case study: channel stability of the
Missouri River, Eastern Montana. Journal of HydraulicEngineering, 128 (10), 880–890.
Tetra Tech, Inc, 2001. EFDC1D, a one dimensional hydrodyn-
amic and sediment transport model for river and stream
networks, model theory and users guide, Prepared for US
Environmental Protection Agency, Office of Science and Tech-nology, Washington, DC.
US Army Corps of Engineers, 1993. The Hydraulic Engineering
Center, HEC-6 Scour and deposition in rivers and reservoirs,user’s manual, March 1977, revised 1993. Concord, MA,
USA.
USBR, 2006. DRAFT user’s manual for GSTAR-1D 1.1.3. USDepartment of Interior Bureau of Reclamation Technical
Service Center Sedimentation and River Hydraulic Group,
Denver, CO, USA.
Van Rijn, L.C., 1984. Sediment transport, part I: bed load trans-
port. Journal of Hydraulic Engineering ASCE, 110 (10),
1431–1456.
Williams, G.P. and Wolman, M.G., 1984. Downstream effects ofdams on alluvial rivers. Washington DC, US Geological
Survey, Professional Paper, 1286.
Woo, H., et al., 2004a. Effect of river channel meander on hydro-
geomorphologically induced vegetation expansion on sand-
bars. Proceedings of the 6th ICHE, Brisbane, Australia.
Woo, H., Choi, S.U., and Yoon, B., 2004b. Downstream effect of
dam on river morphology and sandbar vegetation, Proceed-ings of the symposium of the 72nd annual ICOLD meeting,Seoul, Korea.
Wu, W. and Vieira, D.A., 2002. One-dimensional channelnetwork model CCHE1D version 3.0 – technical manual.National Center for Computational Hydroscience and Engin-
eering, The University of Mississippi, Technical Report No.
NCCHE-TR-2002-1, Mississippi, MS, USA.
Xu, J., 1990. An experimental study of complex response in river
channel adjustment downstream from a reservoir. EarthSurface Processes and Land forms, 15, 53–53.
Xu, J., 1996. Channel pattern change downstream from a reser-
voir: an example of wandering braided rivers. Geomorphol-ogy, 15 (2), 147–158.
Xu, J., 2001. Modified conceptual model for predicting the ten-
dency of alluvial channel adjustment induced by human
activities. Chinese Science Bulletin, 46, 51–57.Yang, C.T., 1973. Incipient motion and sediment transport.
Journal of Hydraulics Division, ASCE, 99 (HY10),
1679–1704.
Yang, C.T., 1979. Unit stream power equation for gravel. Journalof Hydraulics, 40, 123–138.
Yang, C.T. and Simoes, F.J.M., 2000.User’s manual for GSTARS2.1 (generalized stream tube model for alluvial river simu-lation version 2.1). Denver, CO: US Bureau of Reclamation,
Technical Service Center.
Yang, C.T. and Simoes, F.J.M., 2002. User’s manual for GSTAR3(generalized stream tube model for alluvial river simulationversion 3.0). Denver,CO:USBureauofReclamation,Technical
Service Center.
150 Young Ho Shin and Pierre Y. Julien
Downloaded By: [Colorado State University] At: 15:47 20 July 2010
Copyright © 2022 FDOKUMEN