cfsa.pdf - DC Council
762
Page 1 of 176 GOVERNMENT OF THE DISTRICT OF COLUMBIA Child and Family Services Agency Child and Family Services Agency’s Responses Performance Oversight Hearing FY 2017 and FY 2018 (First Quarter) Pre-Hearing Questions Submitted to the Council of the District of Columbia, Committee on Human Services February 12, 2018 Agency Organization 1. Please provide a current organizational chart for CFSA. Please provide a narrative explanation of any organizational changes made during FY17 and to date in FY18. See Attachment Q1, CFSA Organizational Chart 2. With respect to employee evaluations, goals, responsibilities, and objectives in FY17 and to date in FY18, please describe: a. The process for establishing employee goals, responsibilities, and objectives. CFSA uses the performance management standards in Chapter 14 of the District Personnel Regulations to establish employee performance plans for each fiscal year. The plans encompass competencies, S.M.A.R.T. goals, and individual development plans (IDPs), each geared toward aiding the direction and accomplishment of key functions and tasks assigned to the employee. In addition, the CFSA management team works collaboratively across program administrations to ensure that employee goals align with the organization’s strategic goals and mandates under District law. b. The steps taken to ensure that all CFSA employees are meeting individual job requirements. Managers conduct supervision with direct reports to assess current performance. In these discussions, managers and employees review clinical/administrative practice. In addition, managers and staff identify opportunities for improved performance and prioritize key targets, initiatives, and goals.
-
Upload
khangminh22 -
Category
Documents
-
view
0 -
download
0
Transcript of cfsa.pdf - DC Council
Page 1 of 176
GOVERNMENT OF THE DISTRICT OF COLUMBIA Child and Family Services Agency
Child and Family Services Agency’s Responses
Performance Oversight Hearing FY 2017 and FY 2018 (First Quarter)
Pre-Hearing Questions
Submitted to the Council of the District of Columbia, Committee on Human Services
February 12, 2018
Agency Organization
1. Please provide a current organizational chart for CFSA. Please provide a narrative
explanation of any organizational changes made during FY17 and to date in FY18.
See Attachment Q1, CFSA Organizational Chart
2. With respect to employee evaluations, goals, responsibilities, and objectives in FY17
and to date in FY18, please describe:
a. The process for establishing employee goals, responsibilities, and objectives. CFSA uses the performance management standards in Chapter 14
of the District Personnel Regulations to establish employee performance plans
for each fiscal year. The plans encompass competencies, S.M.A.R.T. goals,
and individual development plans (IDPs), each geared toward aiding the
direction and accomplishment of key functions and tasks assigned to the
employee. In addition, the CFSA management team works collaboratively
across program administrations to ensure that employee goals align with the
organization’s strategic goals and mandates under District law.
b. The steps taken to ensure that all CFSA employees are meeting individual
job requirements. Managers conduct supervision with direct reports to assess
current performance. In these discussions, managers and employees review
clinical/administrative practice. In addition, managers and staff identify
opportunities for improved performance and prioritize key targets, initiatives,
and goals.
Page 2 of 176
c. The remedial actions taken for employees who failed to meet employee
goals, responsibilities, and objectives. If an employee demonstrates sub-
optimal performance, managers address this by use of a Performance
Improvement Plan (PIP). This performance management tool is designed to
assist the employee in improving performance. The Agency can also offer
training in the areas of identified deficiencies through CFSA, DCHR,
Skillport, and external vendors. Human Resources and management can
provide verbal counseling. Where the matter is not performance related
(stress, drug and alcohol, domestic matters) employees are referred to the
Employee Assistance Program (EAP).
Alternatively, management may also follow corrective and/or adverse action
as deemed appropriate for conduct or performance-based deficiencies, under
Chapter 16 of the District’s Personnel Regulations.
3. Please list all reports (annual or otherwise) published by CFSA, citing statutory
authority. Please highlight the report deadline as well as the date of actual
submission by CFSA for FY17 and to date in FY18.
CFSA submits the following required reports annually to the D.C. Council. All reports
reflect program activity for the previous year.
● The Newborn Safe Haven Program Report is due annually on January 31, as a
result of the Newborn Safe Haven Act of 2010 (D.C. Law 18-158; D.C. Code §
4–1451.01 et seq.). The law requires an annual status report on the number of
newborns in the District surrendered under the law within the year. The 2016
Report was transmitted to the D.C. Council on January 25, 2017.
The 2017 Report was transmitted to the D.C. Council on January 18, 2018.
● The Grandparent Caregivers Program Report is due annually on February 28,
under the Grandparent Caregivers Pilot Program Establishment Act of 2005 (D.C.
Law 16-69; D.C. Code § 4–251.01 et seq.). The law requires an annual report that
includes a statistical overview of the number of children and families receiving a
monthly subsidy through the Grandparent Caregivers Program. The 2016 Report
was transmitted to the D.C. Council on March 15, 2017. The 2017 Report was
transmitted to the D.C. Council on January 29, 2018.
Page 3 of 176
● Child and Family Services Youth Ombudsman Annual Status Report is due
annually on February 28, under the Foster Youth Statement of Rights and
Responsibilities Amendment Act of 2012 (D.C. Law 19-276; D.C. Code § 4–
1303.71 et seq.) and the Foster Parents Statement of Rights and Responsibilities
Amendment Act of 2016 (D.C. Law 21-217; D.C. Official Code § 4-1303.81 et
seq.). The report reflects concerns reported by foster youth, foster parents, and
concerned parties; outcomes of the investigations; and trends and issues. The
2016 Foster Youth Ombudsman Annual Status Report was expected to be
transmitted to the D.C. Council on February 28, 2017. The 2017 Report is
expected to be transmitted to the D.C. Council by February 28, 2018.
● Child and Family Services Agency’s Annual Public Report is due annually on
February 1, under the DC Adoption and Safe Families Act (ASFA) of 2000 (D.C.
Law 13-136; D.C. Code § 4–1303.01 et seq.). CFSA is required to provide an
annual public report (APR) to the Executive Office of the Mayor, the Council of
the District of Columbia, and the general public. Each APR must describe the
ongoing and specific actions CFSA has taken to implement the federal Adoption
and Safe Families Amendment Act of 2000 (ASFA). The 2016 Report was
transmitted to the D.C. Council on February 10, 2017. The 2017 Report is
expected to be transmitted to the D.C. Council by February 28, 2018.
Spending
4. Please provide the amount budgeted and actually spent in FY17 and to date in FY18
for the agency and its programs and activities, broken out by source of funds,
Comptroller Source, and Comptroller Object.
See Attachments Q4, CFSA Budget and Expenditures FY2017 & FY2018
5. Have any spending pressures been identified for FY17? If so, please provide a
detailed narrative of the spending pressure, including any steps that are being taken
to minimize its impact of the budget.
CFSA has not identified any spending pressures in FY2017.
Page 4 of 176
Contracting and Procurement
6. Please list each contract, grant, and procurement (“contract”) awarded or entered
into by CFSA during FY17 and FY18 to date. For each contract, please provide the
following information, where applicable:
a. Name of the provider;
b. Approved and actual budget;
c. Funding source(s);
d. Whether it was competitively bid or sole sourced;
e. Purpose of the contract;
f. The term of the contract;
g. Contract deliverables;
h. Contract outcomes;
i. Any corrective action taken or technical assistance provided;
j. Program and activity supported by the contract;
k. Employee responsible for overseeing the contract; and
l. Oversight/Monitoring plan for the contract.
See Attachments Q6a, CFSA Contracts FY2017 & FY2018; Q6b, CFSA Grants
FY2017 & FY2018; and Q6l, Contracts and Grants Oversight Monitoring Plan
7. Please provide the following information for all contract modifications made during
FY17 and to date in FY18:
a. Name of the vendor;
b. Purpose of the contract;
c. Modification term;
d. Modification cost, including budgeted amount and actual spent;
e. Narrative explanation of the reason for the modification; and
f. Funding source.
See Attachments Q7, Contract Modifications FY2017 & FY2018
Page 5 of 176
Child Protection Investigations and Differential Response
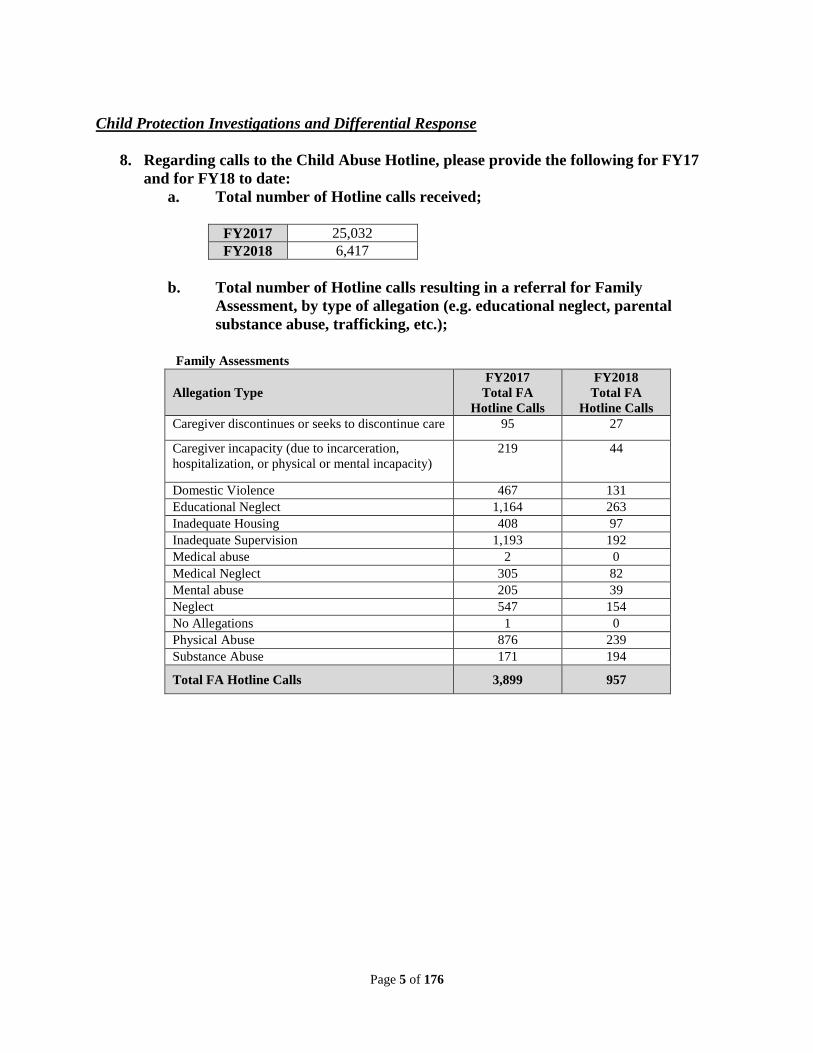
8. Regarding calls to the Child Abuse Hotline, please provide the following for FY17
and for FY18 to date:
a. Total number of Hotline calls received;
FY2017 25,032
FY2018 6,417
b. Total number of Hotline calls resulting in a referral for Family
Assessment, by type of allegation (e.g. educational neglect, parental
substance abuse, trafficking, etc.);
Family Assessments
Allegation Type
FY2017
Total FA
Hotline Calls
FY2018
Total FA
Hotline Calls
Caregiver discontinues or seeks to discontinue care 95 27
Caregiver incapacity (due to incarceration,
hospitalization, or physical or mental incapacity)
219 44
Domestic Violence 467 131
Educational Neglect 1,164 263
Inadequate Housing 408 97
Inadequate Supervision 1,193 192
Medical abuse 2 0
Medical Neglect 305 82
Mental abuse 205 39
Neglect 547 154
No Allegations 1 0
Physical Abuse 876 239
Substance Abuse 171 194
Total FA Hotline Calls 3,899 957
Page 6 of 176
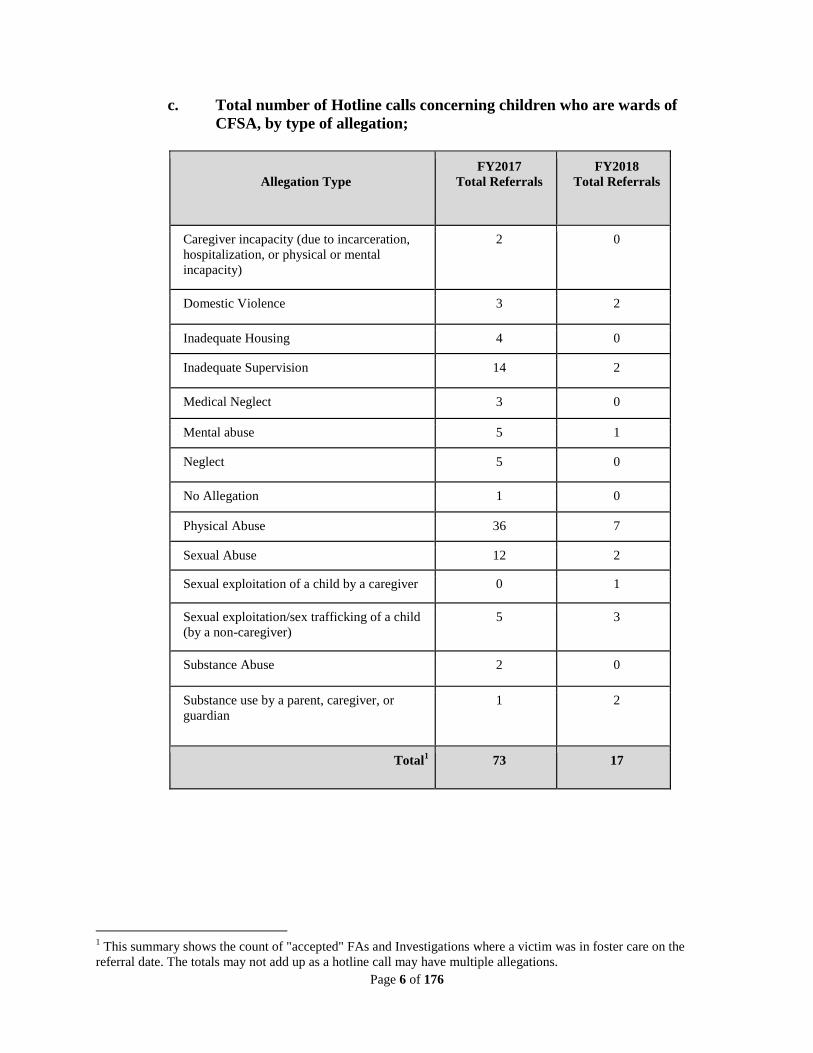
c. Total number of Hotline calls concerning children who are wards of
CFSA, by type of allegation;
Allegation Type
FY2017
Total Referrals
FY2018
Total Referrals
Caregiver incapacity (due to incarceration,
hospitalization, or physical or mental
incapacity)
2 0
Domestic Violence 3 2
Inadequate Housing 4 0
Inadequate Supervision 14 2
Medical Neglect 3 0
Mental abuse 5 1
Neglect 5 0
No Allegation 1 0
Physical Abuse 36 7
Sexual Abuse 12 2
Sexual exploitation of a child by a caregiver 0 1
Sexual exploitation/sex trafficking of a child
(by a non-caregiver)
5 3
Substance Abuse 2 0
Substance use by a parent, caregiver, or
guardian
1 2
Total1 73 17
1 This summary shows the count of "accepted" FAs and Investigations where a victim was in foster care on the
referral date. The totals may not add up as a hotline call may have multiple allegations.
Page 7 of 176
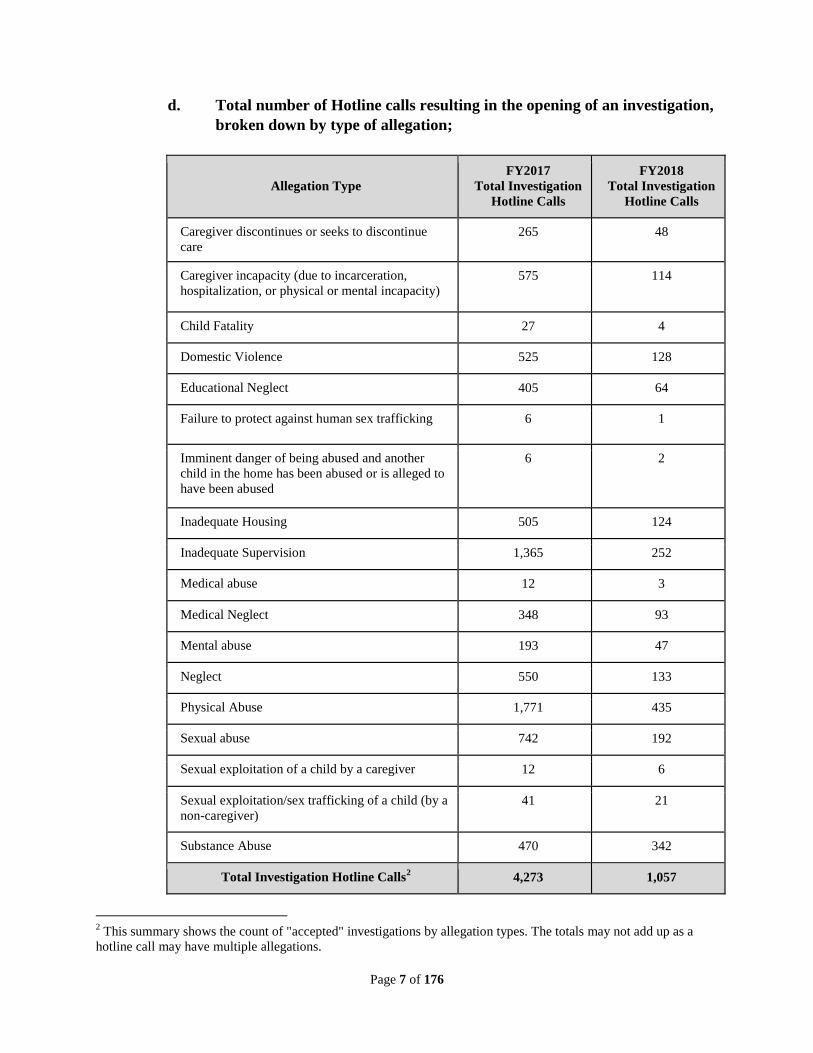
d. Total number of Hotline calls resulting in the opening of an investigation,
broken down by type of allegation;
Allegation Type
FY2017
Total Investigation
Hotline Calls
FY2018
Total Investigation
Hotline Calls
Caregiver discontinues or seeks to discontinue
care
265 48
Caregiver incapacity (due to incarceration,
hospitalization, or physical or mental incapacity)
575 114
Child Fatality 27 4
Domestic Violence 525 128
Educational Neglect 405 64
Failure to protect against human sex trafficking 6 1
Imminent danger of being abused and another
child in the home has been abused or is alleged to
have been abused
6 2
Inadequate Housing 505 124
Inadequate Supervision 1,365 252
Medical abuse 12 3
Medical Neglect 348 93
Mental abuse 193 47
Neglect 550 133
Physical Abuse 1,771 435
Sexual abuse 742 192
Sexual exploitation of a child by a caregiver 12 6
Sexual exploitation/sex trafficking of a child (by a
non-caregiver)
41 21
Substance Abuse 470 342
Total Investigation Hotline Calls2 4,273 1,057
2 This summary shows the count of "accepted" investigations by allegation types. The totals may not add up as a
hotline call may have multiple allegations.
Page 8 of 176
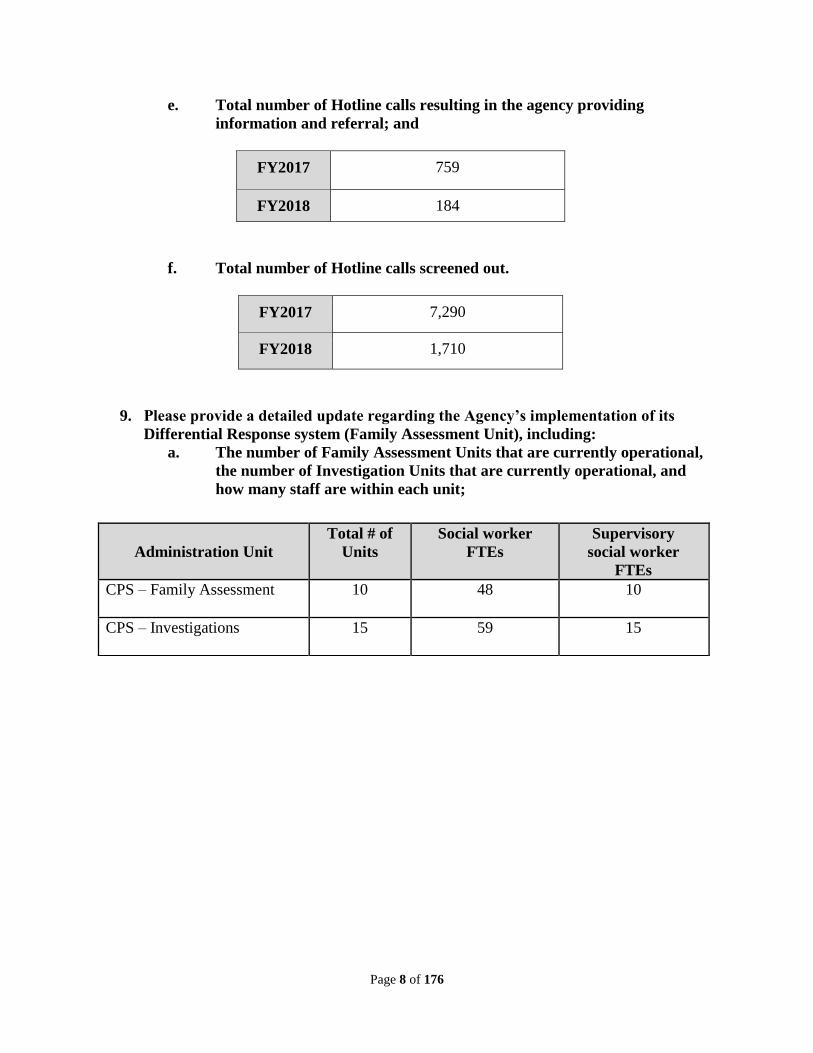
e. Total number of Hotline calls resulting in the agency providing
information and referral; and
FY2017 759
FY2018 184
f. Total number of Hotline calls screened out.
FY2017 7,290
FY2018 1,710
9. Please provide a detailed update regarding the Agency’s implementation of its
Differential Response system (Family Assessment Unit), including:
a. The number of Family Assessment Units that are currently operational,
the number of Investigation Units that are currently operational, and
how many staff are within each unit;
Administration Unit
Total # of
Units
Social worker
FTEs
Supervisory
social worker
FTEs
CPS – Family Assessment 10 48
10
CPS – Investigations 15
59
15
Page 9 of 176
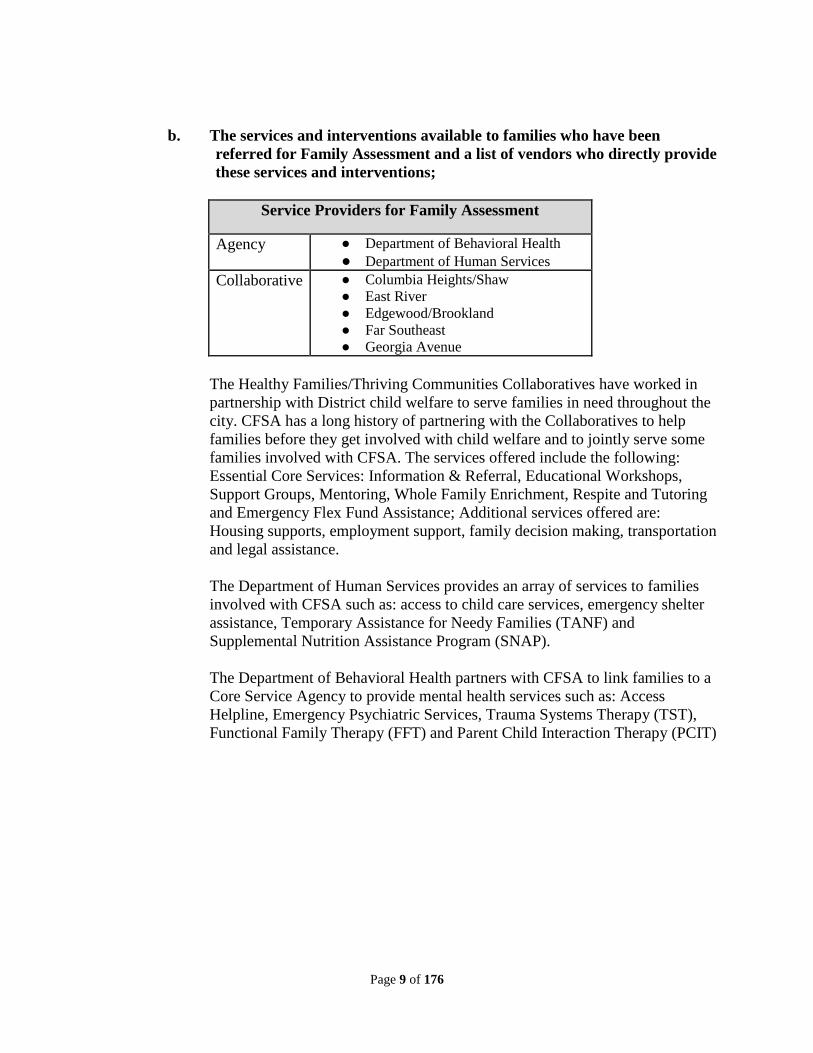
b. The services and interventions available to families who have been
referred for Family Assessment and a list of vendors who directly provide
these services and interventions;
Service Providers for Family Assessment
Agency ● Department of Behavioral Health
● Department of Human Services
Collaborative ● Columbia Heights/Shaw
● East River
● Edgewood/Brookland
● Far Southeast
● Georgia Avenue
The Healthy Families/Thriving Communities Collaboratives have worked in
partnership with District child welfare to serve families in need throughout the
city. CFSA has a long history of partnering with the Collaboratives to help
families before they get involved with child welfare and to jointly serve some
families involved with CFSA. The services offered include the following:
Essential Core Services: Information & Referral, Educational Workshops,
Support Groups, Mentoring, Whole Family Enrichment, Respite and Tutoring
and Emergency Flex Fund Assistance; Additional services offered are:
Housing supports, employment support, family decision making, transportation
and legal assistance.
The Department of Human Services provides an array of services to families
involved with CFSA such as: access to child care services, emergency shelter
assistance, Temporary Assistance for Needy Families (TANF) and
Supplemental Nutrition Assistance Program (SNAP).
The Department of Behavioral Health partners with CFSA to link families to a
Core Service Agency to provide mental health services such as: Access
Helpline, Emergency Psychiatric Services, Trauma Systems Therapy (TST),
Functional Family Therapy (FFT) and Parent Child Interaction Therapy (PCIT)
Page 10 of 176
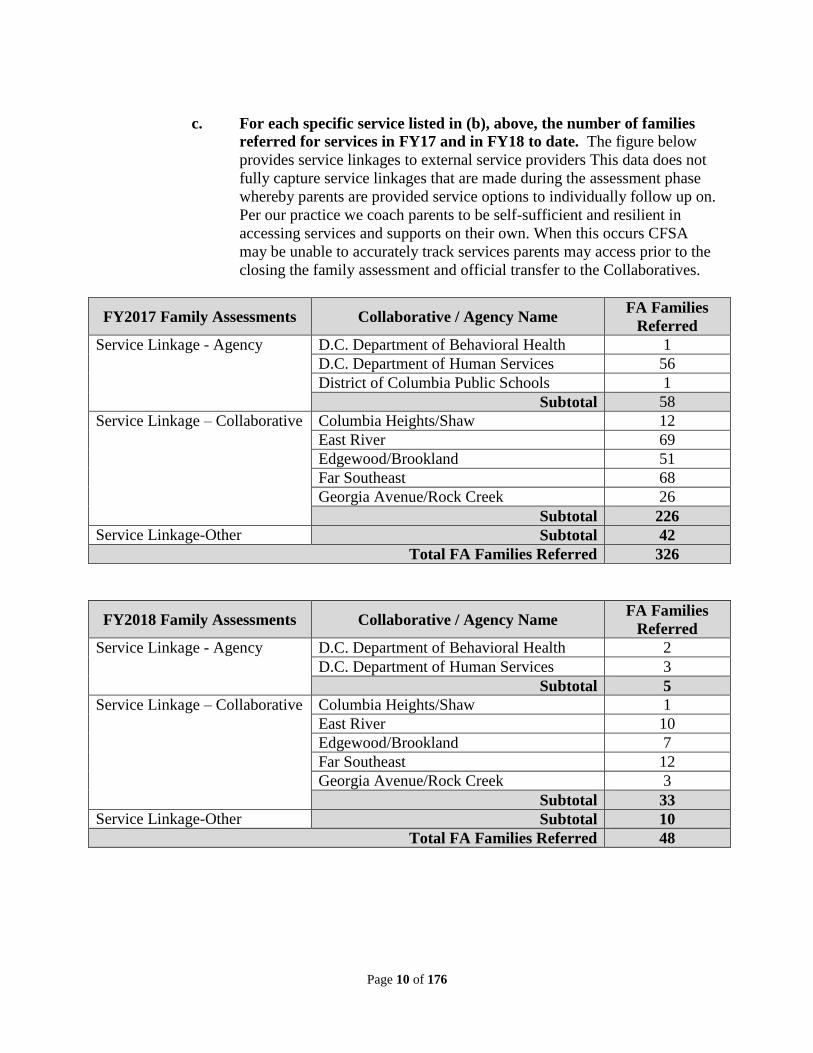
c. For each specific service listed in (b), above, the number of families
referred for services in FY17 and in FY18 to date. The figure below
provides service linkages to external service providers This data does not
fully capture service linkages that are made during the assessment phase
whereby parents are provided service options to individually follow up on.
Per our practice we coach parents to be self-sufficient and resilient in
accessing services and supports on their own. When this occurs CFSA
may be unable to accurately track services parents may access prior to the
closing the family assessment and official transfer to the Collaboratives.
FY2017 Family Assessments Collaborative / Agency Name FA Families
Referred
Service Linkage - Agency D.C. Department of Behavioral Health 1
D.C. Department of Human Services 56
District of Columbia Public Schools 1
Subtotal 58
Service Linkage – Collaborative Columbia Heights/Shaw 12
East River 69
Edgewood/Brookland 51
Far Southeast 68
Georgia Avenue/Rock Creek 26
Subtotal 226
Service Linkage-Other Subtotal 42
Total FA Families Referred 326
FY2018 Family Assessments Collaborative / Agency Name FA Families
Referred
Service Linkage - Agency D.C. Department of Behavioral Health 2
D.C. Department of Human Services 3
Subtotal 5
Service Linkage – Collaborative Columbia Heights/Shaw 1
East River 10
Edgewood/Brookland 7
Far Southeast 12
Georgia Avenue/Rock Creek 3
Subtotal 33
Service Linkage-Other Subtotal 10
Total FA Families Referred 48
Page 11 of 176
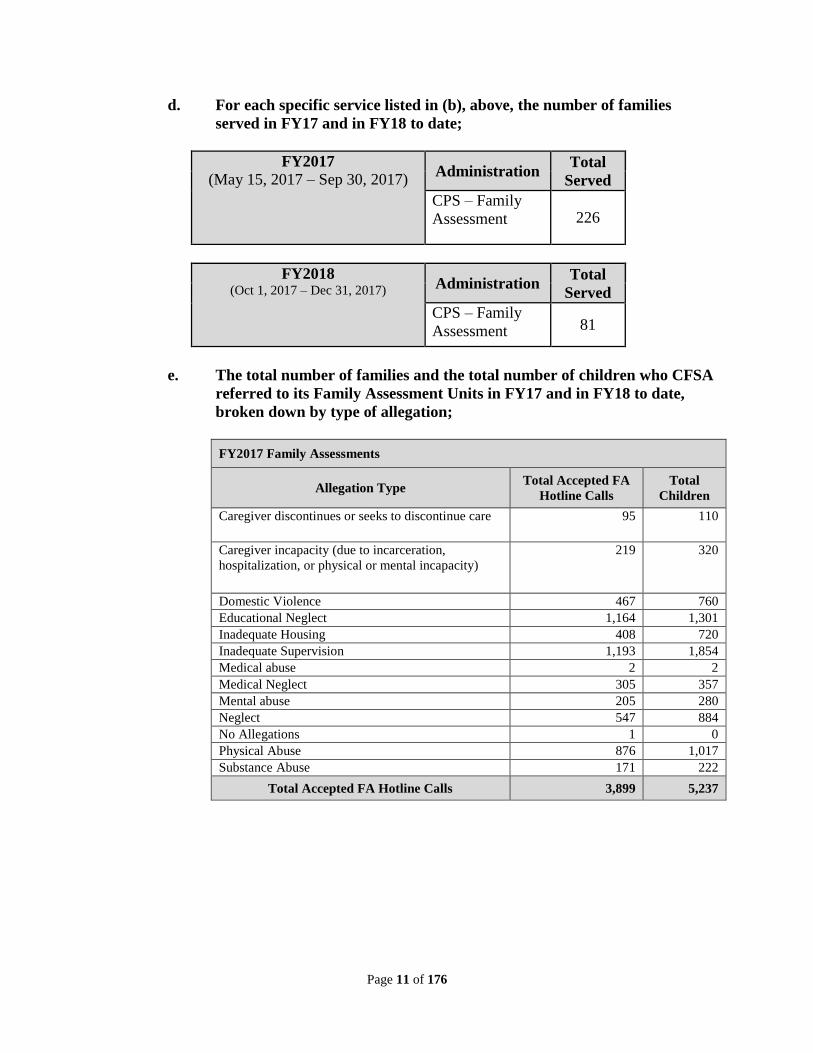
d. For each specific service listed in (b), above, the number of families
served in FY17 and in FY18 to date;
FY2017
(May 15, 2017 – Sep 30, 2017)
Administration Total
Served
CPS – Family
Assessment 226
FY2018 (Oct 1, 2017 – Dec 31, 2017) Administration
Total
Served
CPS – Family
Assessment 81
e. The total number of families and the total number of children who CFSA
referred to its Family Assessment Units in FY17 and in FY18 to date,
broken down by type of allegation;
FY2017 Family Assessments
Allegation Type Total Accepted FA
Hotline Calls
Total
Children
Caregiver discontinues or seeks to discontinue care 95 110
Caregiver incapacity (due to incarceration,
hospitalization, or physical or mental incapacity)
219 320
Domestic Violence 467 760
Educational Neglect 1,164 1,301
Inadequate Housing 408 720
Inadequate Supervision 1,193 1,854
Medical abuse 2 2
Medical Neglect 305 357
Mental abuse 205 280
Neglect 547 884
No Allegations 1 0
Physical Abuse 876 1,017
Substance Abuse 171 222
Total Accepted FA Hotline Calls 3,899 5,237
Page 12 of 176
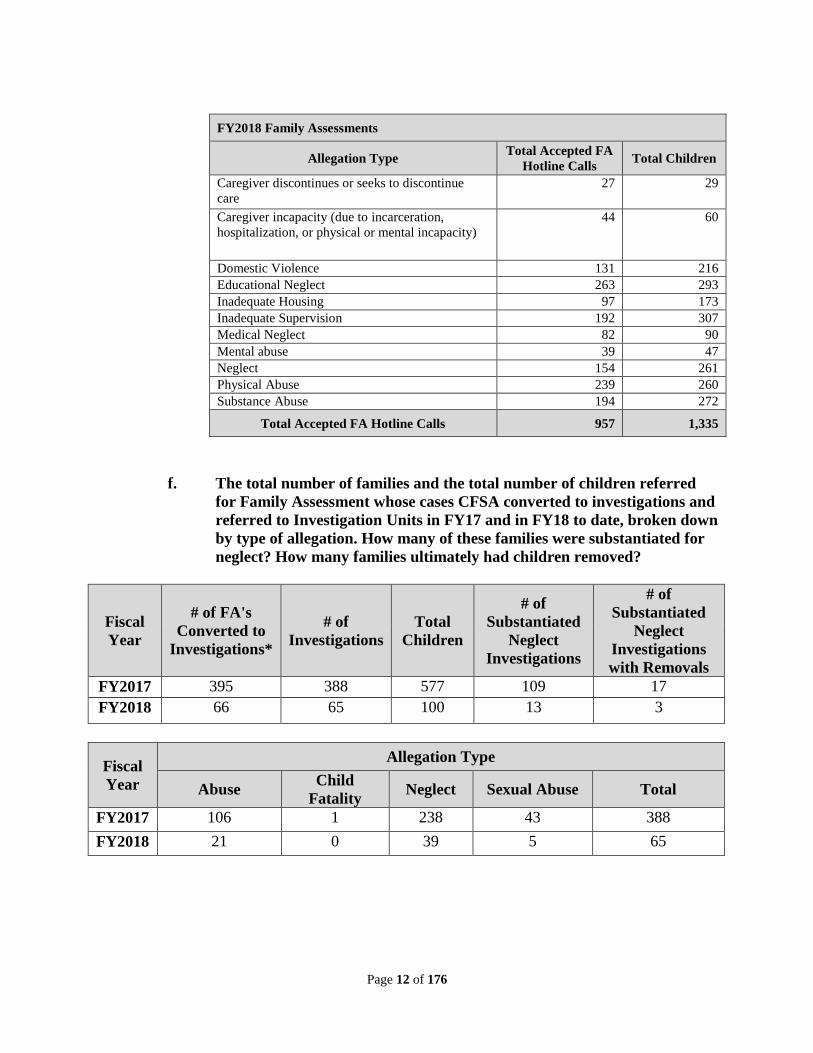
FY2018 Family Assessments
Allegation Type Total Accepted FA
Hotline Calls Total Children
Caregiver discontinues or seeks to discontinue
care
27 29
Caregiver incapacity (due to incarceration,
hospitalization, or physical or mental incapacity)
44 60
Domestic Violence 131 216
Educational Neglect 263 293
Inadequate Housing 97 173
Inadequate Supervision 192 307
Medical Neglect 82 90
Mental abuse 39 47
Neglect 154 261
Physical Abuse 239 260
Substance Abuse 194 272
Total Accepted FA Hotline Calls 957 1,335
f. The total number of families and the total number of children referred
for Family Assessment whose cases CFSA converted to investigations and
referred to Investigation Units in FY17 and in FY18 to date, broken down
by type of allegation. How many of these families were substantiated for
neglect? How many families ultimately had children removed?
Fiscal
Year
# of FA's
Converted to
Investigations*
# of
Investigations
Total
Children
# of
Substantiated
Neglect
Investigations
# of
Substantiated
Neglect
Investigations
with Removals
FY2017 395 388 577 109 17
FY2018 66 65 100 13 3
Fiscal
Year
Allegation Type
Abuse Child
Fatality Neglect Sexual Abuse Total
FY2017 106 1 238 43 388
FY2018 21 0 39 5 65
Page 13 of 176
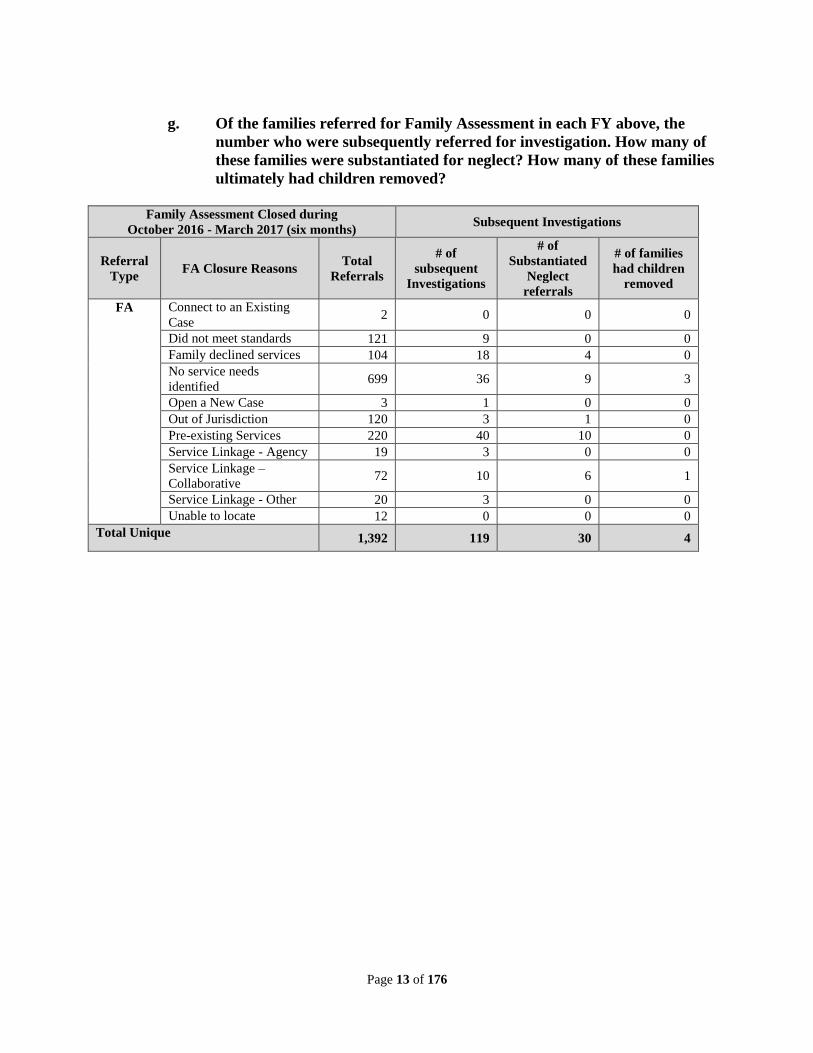
g. Of the families referred for Family Assessment in each FY above, the
number who were subsequently referred for investigation. How many of
these families were substantiated for neglect? How many of these families
ultimately had children removed?
Family Assessment Closed during
October 2016 - March 2017 (six months) Subsequent Investigations
Referral
Type FA Closure Reasons
Total
Referrals
# of
subsequent
Investigations
# of
Substantiated
Neglect
referrals
# of families
had children
removed
FA Connect to an Existing
Case 2 0 0 0
Did not meet standards 121 9 0 0 Family declined services 104 18 4 0 No service needs
identified 699 36 9 3
Open a New Case 3 1 0 0 Out of Jurisdiction 120 3 1 0 Pre-existing Services 220 40 10 0 Service Linkage - Agency 19 3 0 0 Service Linkage –
Collaborative 72 10 6 1
Service Linkage - Other 20 3 0 0 Unable to locate 12 0 0 0
Total Unique 1,392 119 30 4
Page 14 of 176
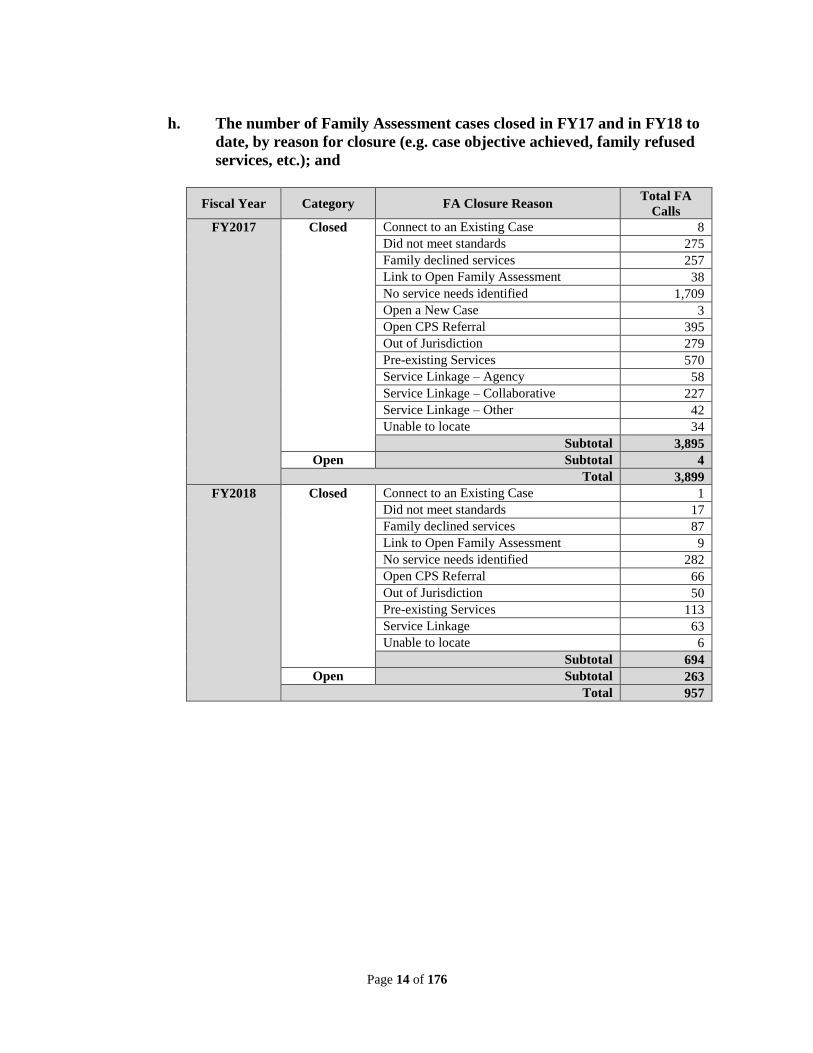
h. The number of Family Assessment cases closed in FY17 and in FY18 to
date, by reason for closure (e.g. case objective achieved, family refused
services, etc.); and
Fiscal Year Category FA Closure Reason Total FA
Calls
FY2017 Closed Connect to an Existing Case 8
Did not meet standards 275
Family declined services 257
Link to Open Family Assessment 38
No service needs identified 1,709
Open a New Case 3
Open CPS Referral 395
Out of Jurisdiction 279
Pre-existing Services 570
Service Linkage – Agency 58
Service Linkage – Collaborative 227
Service Linkage – Other 42
Unable to locate 34
Subtotal 3,895
Open Subtotal 4
Total 3,899
FY2018 Closed Connect to an Existing Case 1
Did not meet standards 17
Family declined services 87
Link to Open Family Assessment 9
No service needs identified 282
Open CPS Referral 66
Out of Jurisdiction 50
Pre-existing Services 113
Service Linkage 63
Unable to locate 6
Subtotal 694
Open Subtotal 263
Total 957
Page 15 of 176
i. Please provide any evaluations or assessments that have been conducted
regarding the differential response. Please describe what efforts the
agency is making to assess the effectiveness of differential response;
including the timelines for any evaluation(s), the methods that will be
used, and an explanation of the types of data that will be collected as part
of the evaluation process.
See Attachment Q9(i), CFSA Family Assessment Pathway: Assessment, Action
Steps and Future Plans
Entry Services will continue to monitor the effectiveness of this model in
partnership with the QA Division as follows:
CFSA plans to initiate a case review of Family Assessment (FA) cases in
Entry Services (ES) with the objective of assessing the quality of practice.
CFSA will use the findings to identify strengths and areas for improvement
with emphasis on assessing data collection, timeliness, and decision-making
to achieve child or youth safety.
Sampling Methodology Review Process: CFSA will conduct this review of
closed FA cases quarterly, beginning in May 2018, by reviewing cases closed
between January and March 2018. In August 2018, CFSA will conduct a
review of FA cases closed between April and June 2018. In November 2018,
CFSA will conduct a review of July through September 2018 closed FA cases.
10. Please provide a detailed update regarding the Agency’s in-home cases: a. The number of staff currently serving in-home cases; A total of 46 social
workers, 10 family support workers, 10 supervisory social workers, two
program managers and one administrator serve in-home cases.
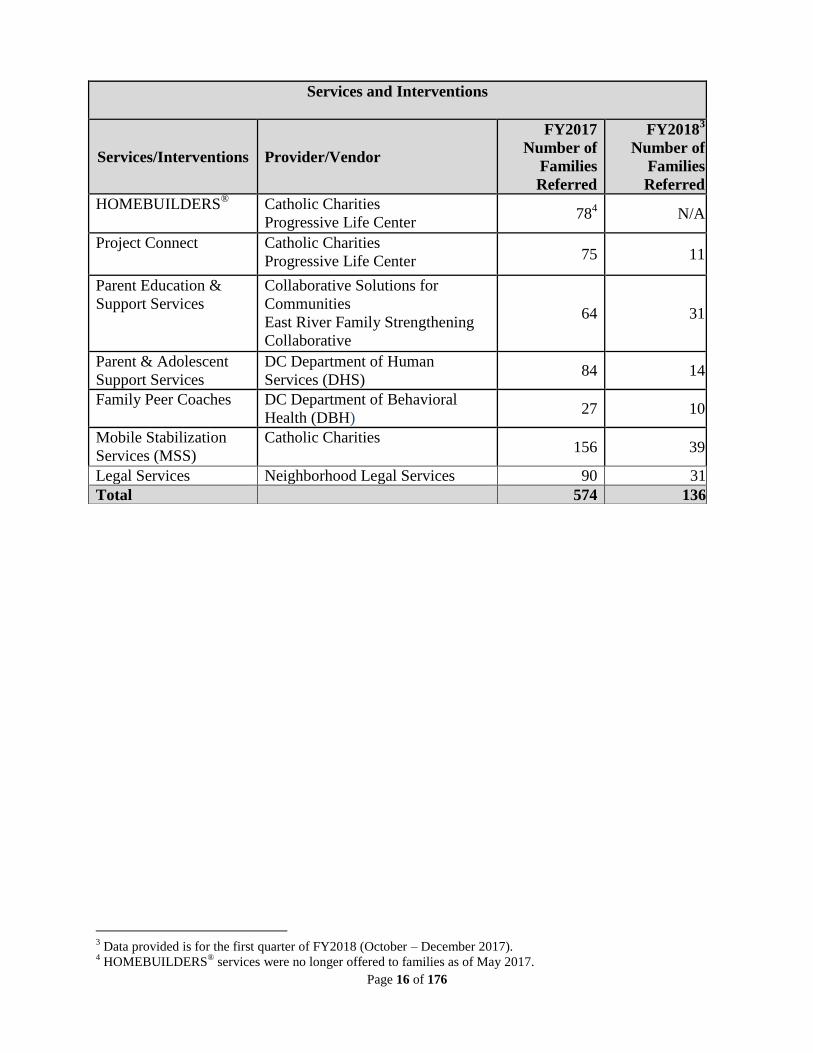
b. The services and interventions available to families who have in-home
cases and a list of vendors who directly provide these services and
interventions; See the Services and Interventions table below.
c. For each specific service listed in (b), above, the number of families
referred for services in FY17 and in FY18 to date;
FY2017 499
FY2018 136
Note: Total number of unique cases closed that were assigned to
In-Home & Reunification Services Divisions
Page 16 of 176
3 Data provided is for the first quarter of FY2018 (October – December 2017).
4 HOMEBUILDERS
® services were no longer offered to families as of May 2017.
Services and Interventions
Services/Interventions Provider/Vendor
FY2017
Number of
Families
Referred
FY20183
Number of
Families
Referred
HOMEBUILDERS®
Catholic Charities
Progressive Life Center 78
4 N/A
Project Connect Catholic Charities
Progressive Life Center 75 11
Parent Education &
Support Services
Collaborative Solutions for
Communities
East River Family Strengthening
Collaborative
64 31
Parent & Adolescent
Support Services
DC Department of Human
Services (DHS) 84 14
Family Peer Coaches DC Department of Behavioral
Health (DBH) 27 10
Mobile Stabilization
Services (MSS)
Catholic Charities 156 39
Legal Services Neighborhood Legal Services 90 31
Total 574 136
Page 17 of 176
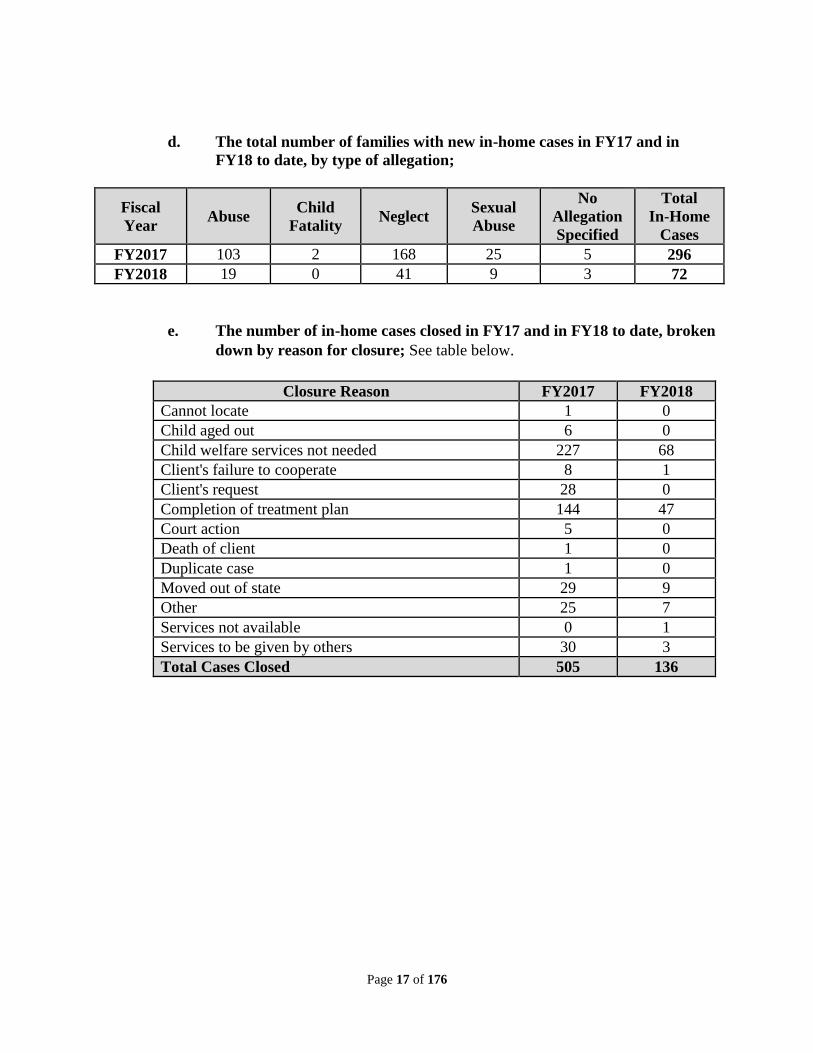
d. The total number of families with new in-home cases in FY17 and in
FY18 to date, by type of allegation;
Fiscal
Year Abuse
Child
Fatality Neglect
Sexual
Abuse
No
Allegation
Specified
Total
In-Home
Cases
FY2017 103 2 168 25 5 296
FY2018 19 0 41 9 3 72
e. The number of in-home cases closed in FY17 and in FY18 to date, broken
down by reason for closure; See table below.
Closure Reason FY2017 FY2018
Cannot locate 1 0
Child aged out 6 0
Child welfare services not needed 227 68
Client's failure to cooperate 8 1
Client's request 28 0
Completion of treatment plan 144 47
Court action 5 0
Death of client 1 0
Duplicate case 1 0
Moved out of state 29 9
Other 25 7
Services not available 0 1
Services to be given by others 30 3
Total Cases Closed 505 136
Page 18 of 176
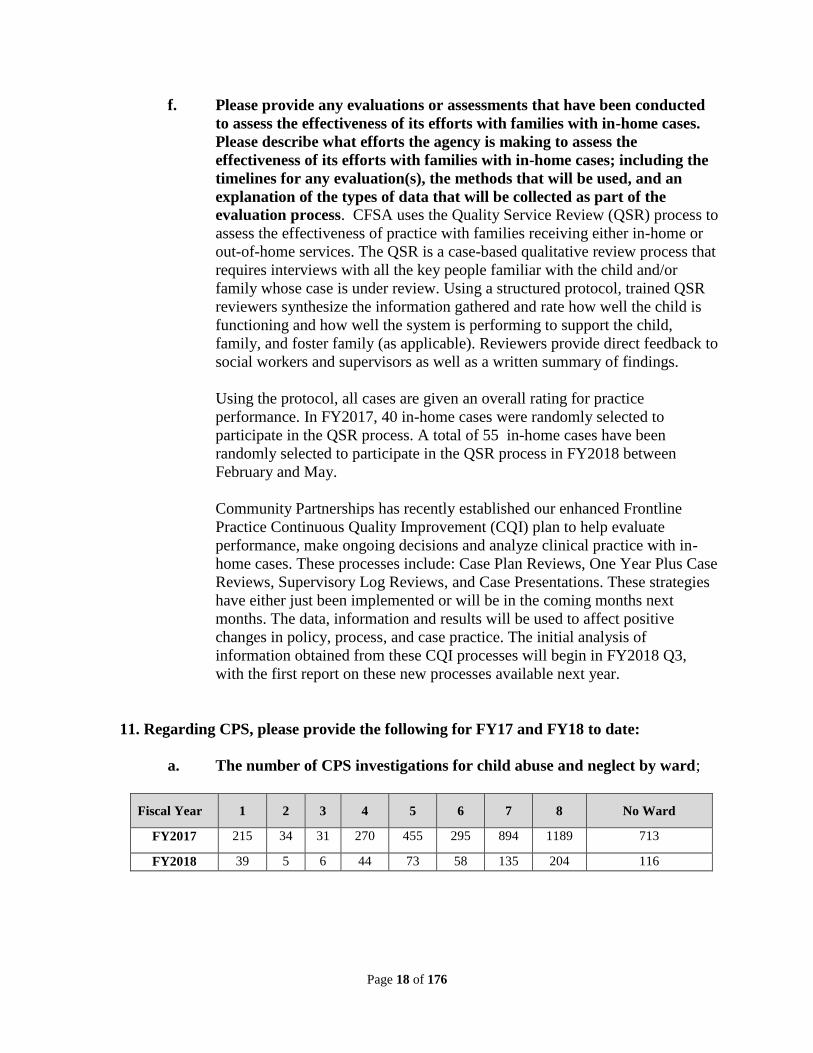
f. Please provide any evaluations or assessments that have been conducted
to assess the effectiveness of its efforts with families with in-home cases.
Please describe what efforts the agency is making to assess the
effectiveness of its efforts with families with in-home cases; including the
timelines for any evaluation(s), the methods that will be used, and an
explanation of the types of data that will be collected as part of the
evaluation process. CFSA uses the Quality Service Review (QSR) process to
assess the effectiveness of practice with families receiving either in-home or
out-of-home services. The QSR is a case-based qualitative review process that
requires interviews with all the key people familiar with the child and/or
family whose case is under review. Using a structured protocol, trained QSR
reviewers synthesize the information gathered and rate how well the child is
functioning and how well the system is performing to support the child,
family, and foster family (as applicable). Reviewers provide direct feedback to
social workers and supervisors as well as a written summary of findings.
Using the protocol, all cases are given an overall rating for practice
performance. In FY2017, 40 in-home cases were randomly selected to
participate in the QSR process. A total of 55 in-home cases have been
randomly selected to participate in the QSR process in FY2018 between
February and May.
Community Partnerships has recently established our enhanced Frontline
Practice Continuous Quality Improvement (CQI) plan to help evaluate
performance, make ongoing decisions and analyze clinical practice with in-
home cases. These processes include: Case Plan Reviews, One Year Plus Case
Reviews, Supervisory Log Reviews, and Case Presentations. These strategies
have either just been implemented or will be in the coming months next
months. The data, information and results will be used to affect positive
changes in policy, process, and case practice. The initial analysis of
information obtained from these CQI processes will begin in FY2018 Q3,
with the first report on these new processes available next year.
11. Regarding CPS, please provide the following for FY17 and FY18 to date:
a. The number of CPS investigations for child abuse and neglect by ward;
Fiscal Year 1 2 3 4 5 6 7 8 No Ward
FY2017 215 34 31 270 455 295 894 1189 713
FY2018 39 5 6 44 73 58 135 204 116
Page 19 of 176
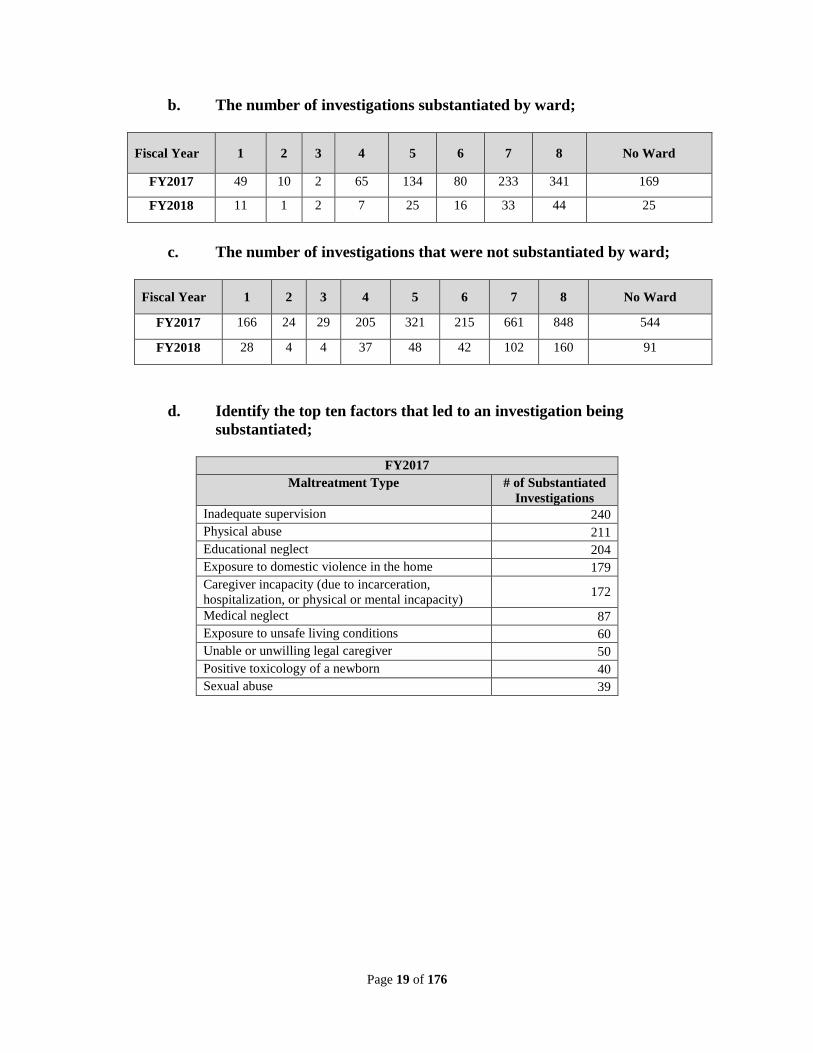
b. The number of investigations substantiated by ward;
Fiscal Year 1 2 3 4 5 6 7 8 No Ward
FY2017 49 10 2 65 134 80 233 341 169
FY2018 11 1 2 7 25 16 33 44 25
c. The number of investigations that were not substantiated by ward;
Fiscal Year 1 2 3 4 5 6 7 8 No Ward
FY2017 166 24 29 205 321 215 661 848 544
FY2018 28 4 4 37 48 42 102 160 91
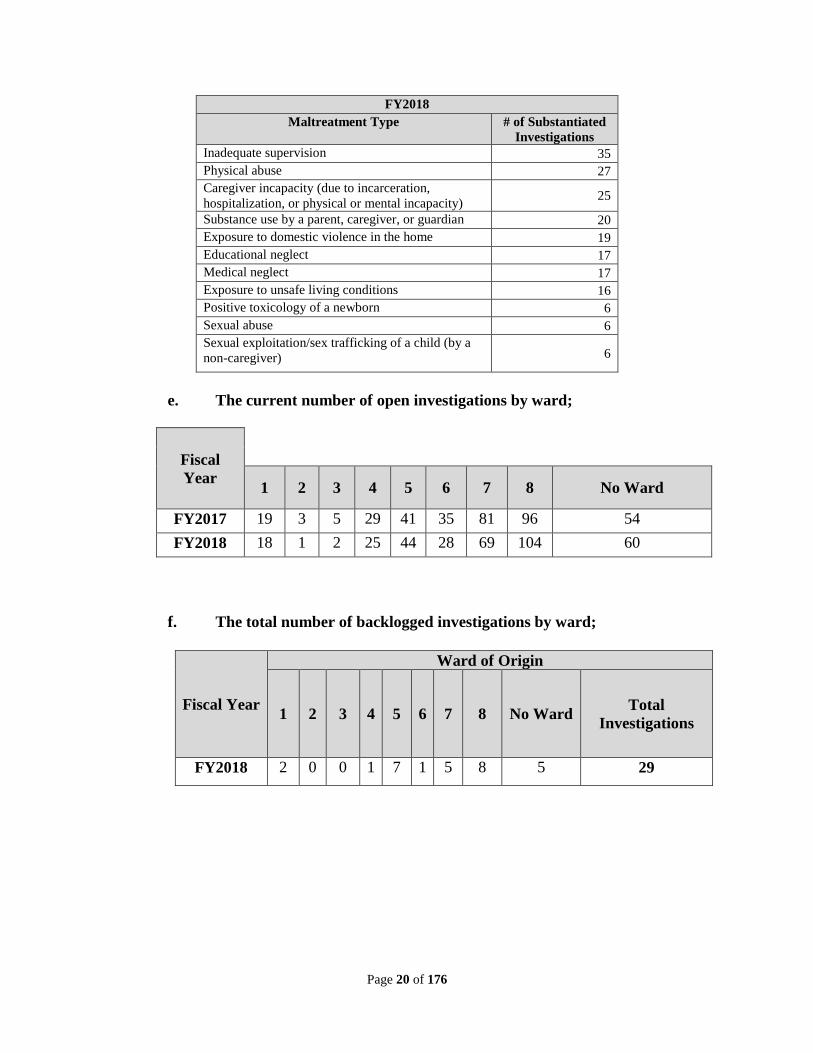
d. Identify the top ten factors that led to an investigation being
substantiated;
FY2017
Maltreatment Type # of Substantiated
Investigations
Inadequate supervision 240
Physical abuse 211
Educational neglect 204
Exposure to domestic violence in the home 179
Caregiver incapacity (due to incarceration,
hospitalization, or physical or mental incapacity) 172
Medical neglect 87
Exposure to unsafe living conditions 60
Unable or unwilling legal caregiver 50
Positive toxicology of a newborn 40
Sexual abuse 39
Page 20 of 176
FY2018
Maltreatment Type # of Substantiated
Investigations
Inadequate supervision 35
Physical abuse 27
Caregiver incapacity (due to incarceration,
hospitalization, or physical or mental incapacity) 25
Substance use by a parent, caregiver, or guardian 20
Exposure to domestic violence in the home 19
Educational neglect 17
Medical neglect 17
Exposure to unsafe living conditions 16
Positive toxicology of a newborn 6
Sexual abuse 6
Sexual exploitation/sex trafficking of a child (by a
non-caregiver) 6
e. The current number of open investigations by ward;
Fiscal
Year 1 2 3 4 5 6 7 8 No Ward
FY2017 19 3 5 29 41 35 81 96 54
FY2018 18 1 2 25 44 28 69 104 60
f. The total number of backlogged investigations by ward;
Fiscal Year
Ward of Origin
1 2 3 4 5 6 7 8 No Ward Total
Investigations
FY2018 2 0 0 1 7 1 5 8 5 29
Page 21 of 176
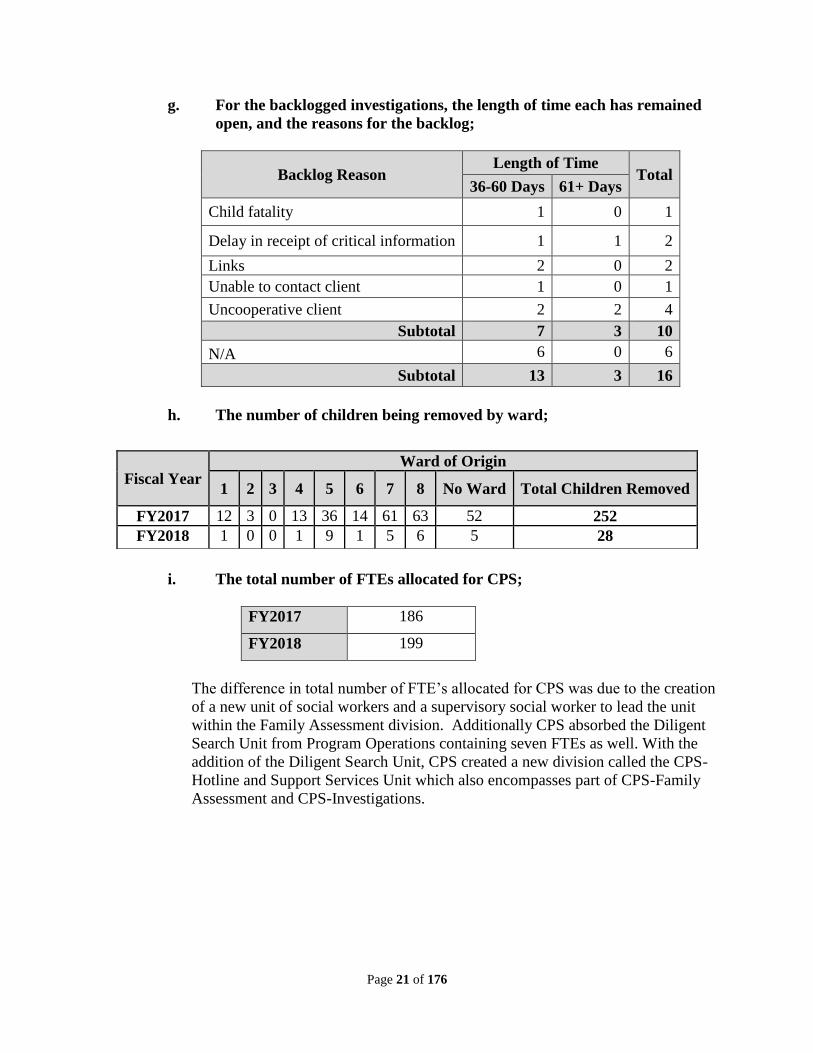
g. For the backlogged investigations, the length of time each has remained
open, and the reasons for the backlog;
Backlog Reason Length of Time
Total 36-60 Days 61+ Days
Child fatality 1 0 1
Delay in receipt of critical information 1 1 2
Links 2 0 2
Unable to contact client 1 0 1
Uncooperative client 2 2 4
Subtotal 7 3 10
N/A 6 0 6
Subtotal 13 3 16
h. The number of children being removed by ward;
i. The total number of FTEs allocated for CPS;
FY2017 186
FY2018 199
The difference in total number of FTE’s allocated for CPS was due to the creation
of a new unit of social workers and a supervisory social worker to lead the unit
within the Family Assessment division. Additionally CPS absorbed the Diligent
Search Unit from Program Operations containing seven FTEs as well. With the
addition of the Diligent Search Unit, CPS created a new division called the CPS-
Hotline and Support Services Unit which also encompasses part of CPS-Family
Assessment and CPS-Investigations.
Fiscal Year Ward of Origin
1 2 3 4 5 6 7 8 No Ward Total Children Removed
FY2017 12 3 0 13 36 14 61 63 52 252
FY2018 1 0 0 1 9 1 5 6 5 28
Page 22 of 176
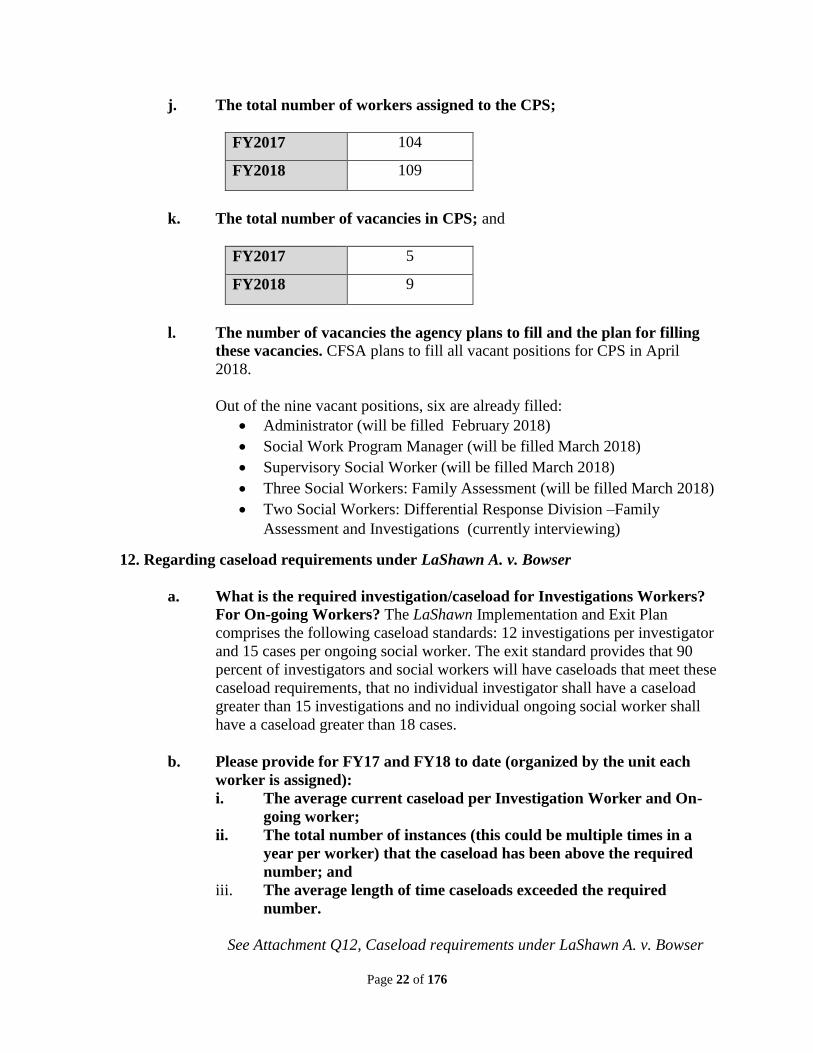
j. The total number of workers assigned to the CPS;
FY2017 104
FY2018 109
k. The total number of vacancies in CPS; and
FY2017 5
FY2018 9
l. The number of vacancies the agency plans to fill and the plan for filling
these vacancies. CFSA plans to fill all vacant positions for CPS in April
2018.
Out of the nine vacant positions, six are already filled:
Administrator (will be filled February 2018)
Social Work Program Manager (will be filled March 2018)
Supervisory Social Worker (will be filled March 2018)
Three Social Workers: Family Assessment (will be filled March 2018)
Two Social Workers: Differential Response Division –Family
Assessment and Investigations (currently interviewing)
12. Regarding caseload requirements under LaShawn A. v. Bowser
a. What is the required investigation/caseload for Investigations Workers?
For On-going Workers? The LaShawn Implementation and Exit Plan
comprises the following caseload standards: 12 investigations per investigator
and 15 cases per ongoing social worker. The exit standard provides that 90
percent of investigators and social workers will have caseloads that meet these
caseload requirements, that no individual investigator shall have a caseload
greater than 15 investigations and no individual ongoing social worker shall
have a caseload greater than 18 cases.
b. Please provide for FY17 and FY18 to date (organized by the unit each
worker is assigned):
i. The average current caseload per Investigation Worker and On-
going worker;
ii. The total number of instances (this could be multiple times in a
year per worker) that the caseload has been above the required
number; and
iii. The average length of time caseloads exceeded the required
number.
See Attachment Q12, Caseload requirements under LaShawn A. v. Bowser
Page 23 of 176
c. For each of the units (e.g. FY17 Intake & Investigation Caseload, FY17,
Family and Assessment Caseload, FY18 Ongoing Caseload, etc.), please
provide the following information for the four (4) instances of workers
with the highest caseloads (only provide information for instances in
which the caseload exceeds the required caseload number):
iv. The caseload of the worker; and
v. The length of time that the caseload exceeded the required
number.
See Attachment Q12, Caseload requirements under LaShawn A. v. Bowser
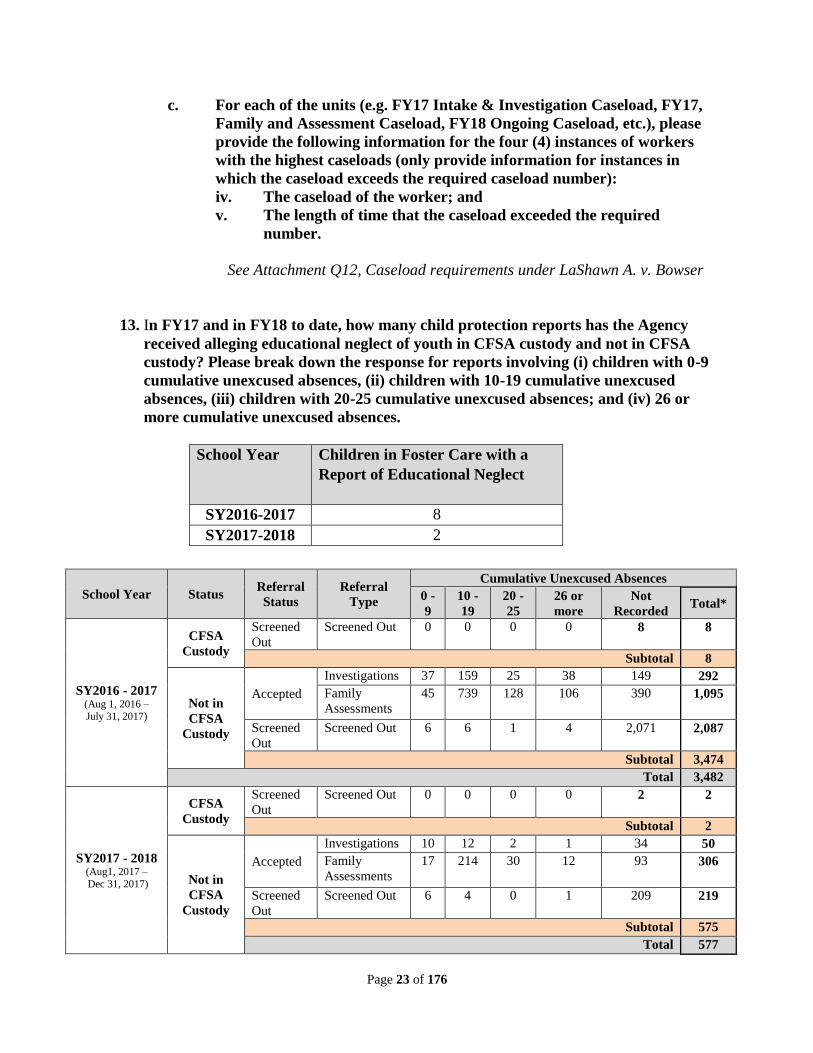
13. In FY17 and in FY18 to date, how many child protection reports has the Agency
received alleging educational neglect of youth in CFSA custody and not in CFSA
custody? Please break down the response for reports involving (i) children with 0-9
cumulative unexcused absences, (ii) children with 10-19 cumulative unexcused
absences, (iii) children with 20-25 cumulative unexcused absences; and (iv) 26 or
more cumulative unexcused absences.
School Year Children in Foster Care with a
Report of Educational Neglect
SY2016-2017 8
SY2017-2018 2
School Year Status Referral
Status
Referral
Type
Cumulative Unexcused Absences
0 -
9
10 -
19
20 -
25
26 or
more
Not
Recorded Total*
SY2016 - 2017 (Aug 1, 2016 –
July 31, 2017)
CFSA
Custody
Screened
Out
Screened Out 0 0 0 0 8 8
Subtotal 8
Not in
CFSA
Custody
Accepted
Investigations 37 159 25 38 149 292
Family
Assessments
45 739 128 106 390 1,095
Screened
Out
Screened Out 6 6 1 4 2,071 2,087
Subtotal 3,474
Total 3,482
SY2017 - 2018 (Aug1, 2017 –
Dec 31, 2017)
CFSA
Custody
Screened
Out
Screened Out 0 0 0 0 2 2
Subtotal 2
Not in
CFSA
Custody
Accepted
Investigations 10 12 2 1 34 50
Family
Assessments
17 214 30 12 93 306
Screened
Out
Screened Out 6 4 0 1 209 219
Subtotal 575
Total 577
Page 24 of 176
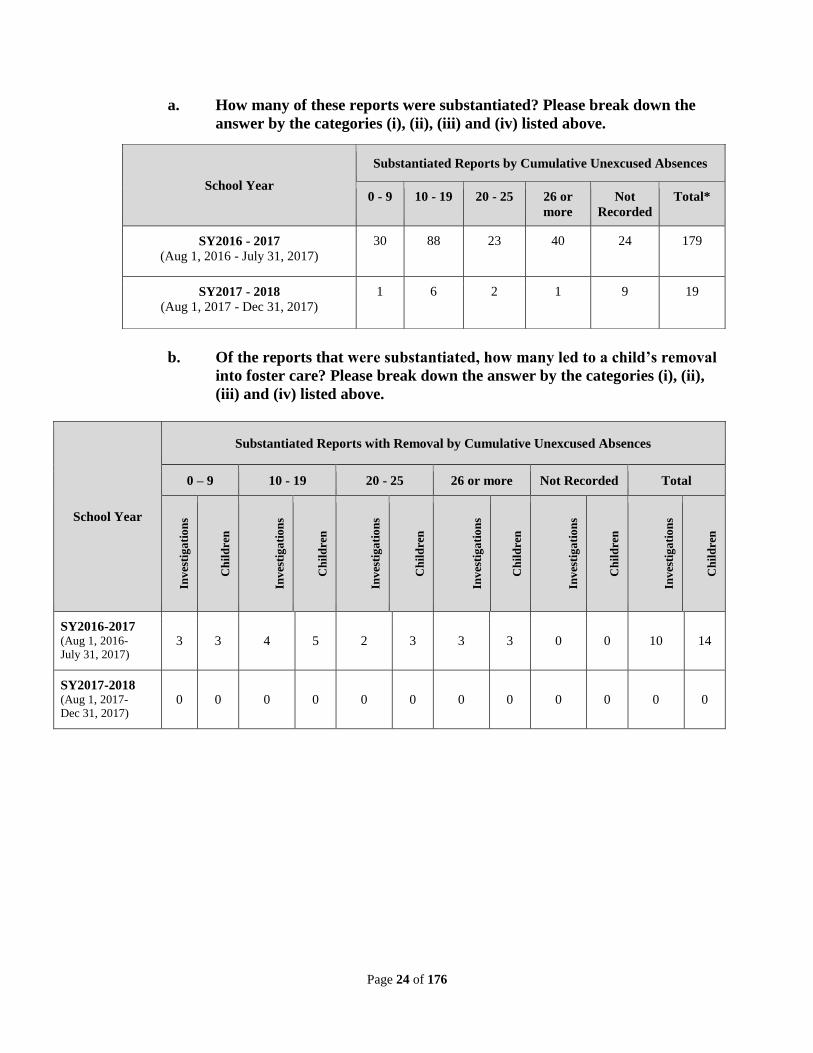
a. How many of these reports were substantiated? Please break down the
answer by the categories (i), (ii), (iii) and (iv) listed above.
b. Of the reports that were substantiated, how many led to a child’s removal
into foster care? Please break down the answer by the categories (i), (ii),
(iii) and (iv) listed above.
School Year
Substantiated Reports with Removal by Cumulative Unexcused Absences
0 – 9 10 - 19 20 - 25 26 or more Not Recorded Total
Inv
esti
ga
tio
ns
Ch
ild
ren
Inv
esti
ga
tio
ns
Ch
ild
ren
Inv
esti
ga
tio
ns
Ch
ild
ren
Inv
esti
ga
tio
ns
Ch
ild
ren
Inv
esti
ga
tio
ns
Ch
ild
ren
Inv
esti
ga
tio
ns
Ch
ild
ren
SY2016-2017 (Aug 1, 2016-
July 31, 2017) 3 3 4 5 2 3 3 3 0 0 10 14
SY2017-2018 (Aug 1, 2017-
Dec 31, 2017) 0 0 0 0 0 0 0 0 0 0 0 0
School Year
Substantiated Reports by Cumulative Unexcused Absences
0 - 9 10 - 19 20 - 25 26 or
more Not
Recorded Total*
SY2016 - 2017
(Aug 1, 2016 - July 31, 2017) 30 88 23 40 24 179
SY2017 - 2018
(Aug 1, 2017 - Dec 31, 2017) 1 6 2 1 9 19
Page 25 of 176
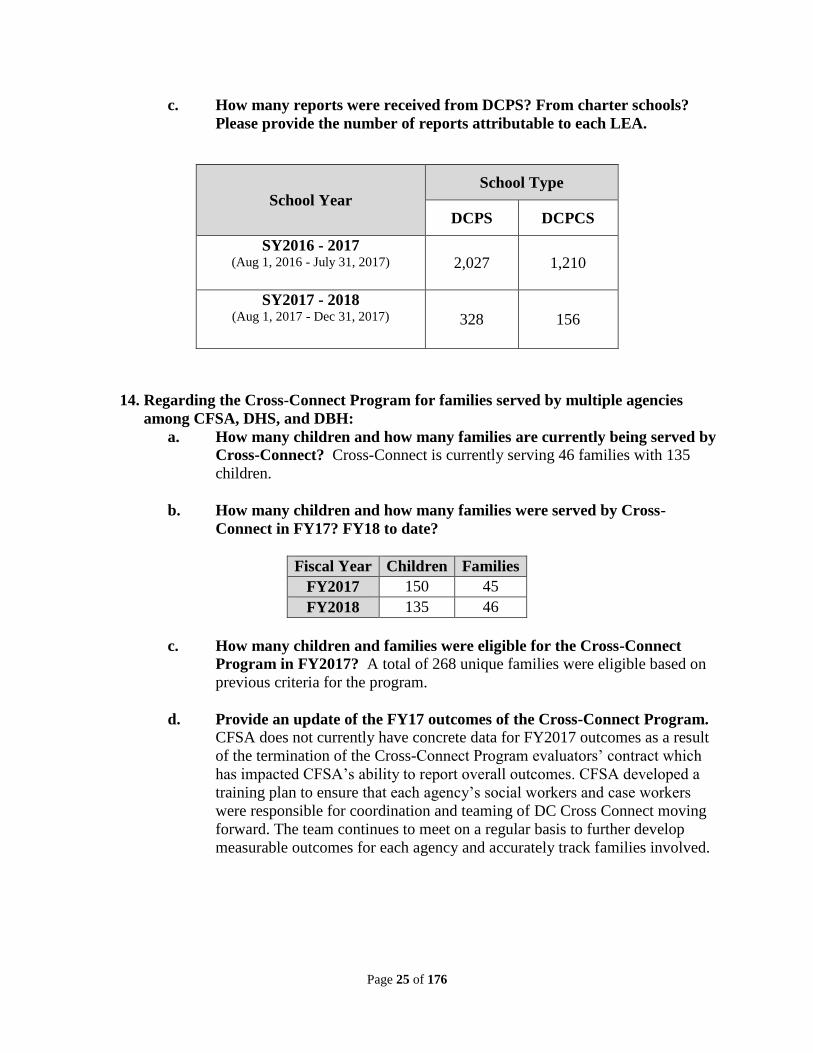
c. How many reports were received from DCPS? From charter schools?
Please provide the number of reports attributable to each LEA.
14. Regarding the Cross-Connect Program for families served by multiple agencies
among CFSA, DHS, and DBH:
a. How many children and how many families are currently being served by
Cross-Connect? Cross-Connect is currently serving 46 families with 135
children.
b. How many children and how many families were served by Cross-
Connect in FY17? FY18 to date?
Fiscal Year Children Families
FY2017 150 45
FY2018 135 46
c. How many children and families were eligible for the Cross-Connect
Program in FY2017? A total of 268 unique families were eligible based on
previous criteria for the program.
d. Provide an update of the FY17 outcomes of the Cross-Connect Program.
CFSA does not currently have concrete data for FY2017 outcomes as a result
of the termination of the Cross-Connect Program evaluators’ contract which
has impacted CFSA’s ability to report overall outcomes. CFSA developed a
training plan to ensure that each agency’s social workers and case workers
were responsible for coordination and teaming of DC Cross Connect moving
forward. The team continues to meet on a regular basis to further develop
measurable outcomes for each agency and accurately track families involved.
School Year School Type
DCPS DCPCS
SY2016 - 2017 (Aug 1, 2016 - July 31, 2017) 2,027 1,210
SY2017 - 2018 (Aug 1, 2017 - Dec 31, 2017) 328 156
Page 26 of 176
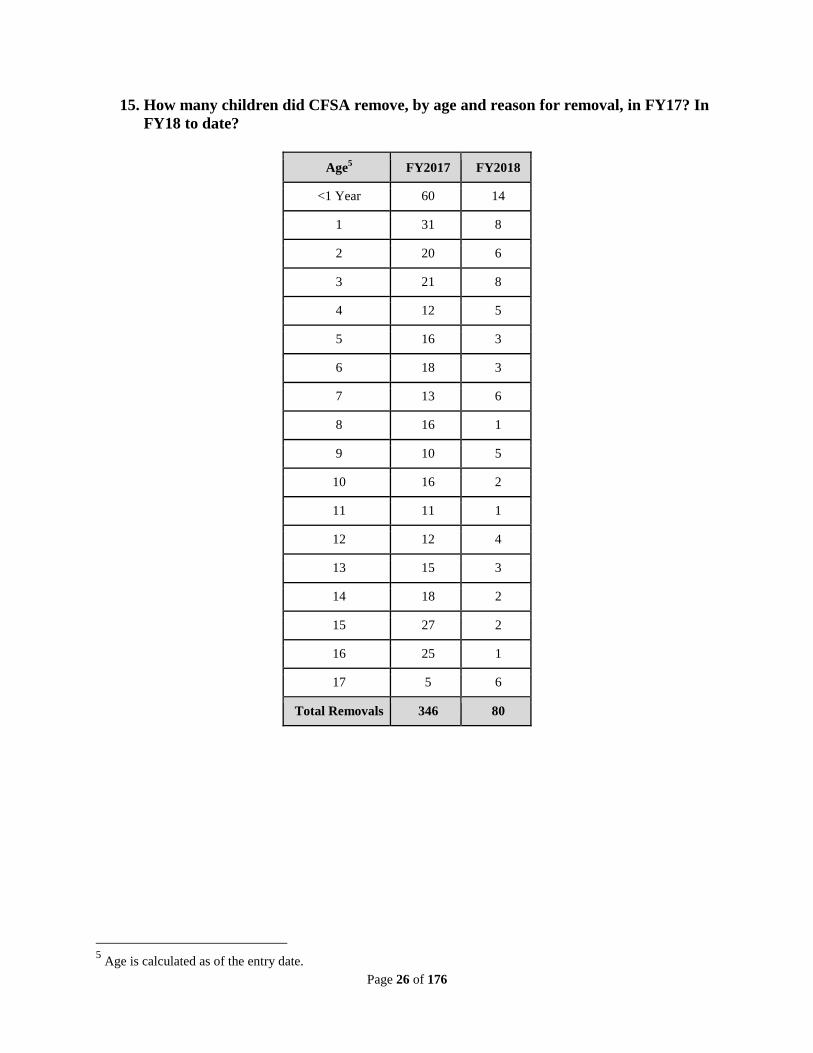
15. How many children did CFSA remove, by age and reason for removal, in FY17? In
FY18 to date?
Age5 FY2017 FY2018
<1 Year 60 14
1 31 8
2 20 6
3 21 8
4 12 5
5 16 3
6 18 3
7 13 6
8 16 1
9 10 5
10 16 2
11 11 1
12 12 4
13 15 3
14 18 2
15 27 2
16 25 1
17 5 6
Total Removals 346 80
5 Age is calculated as of the entry date.
Page 27 of 176
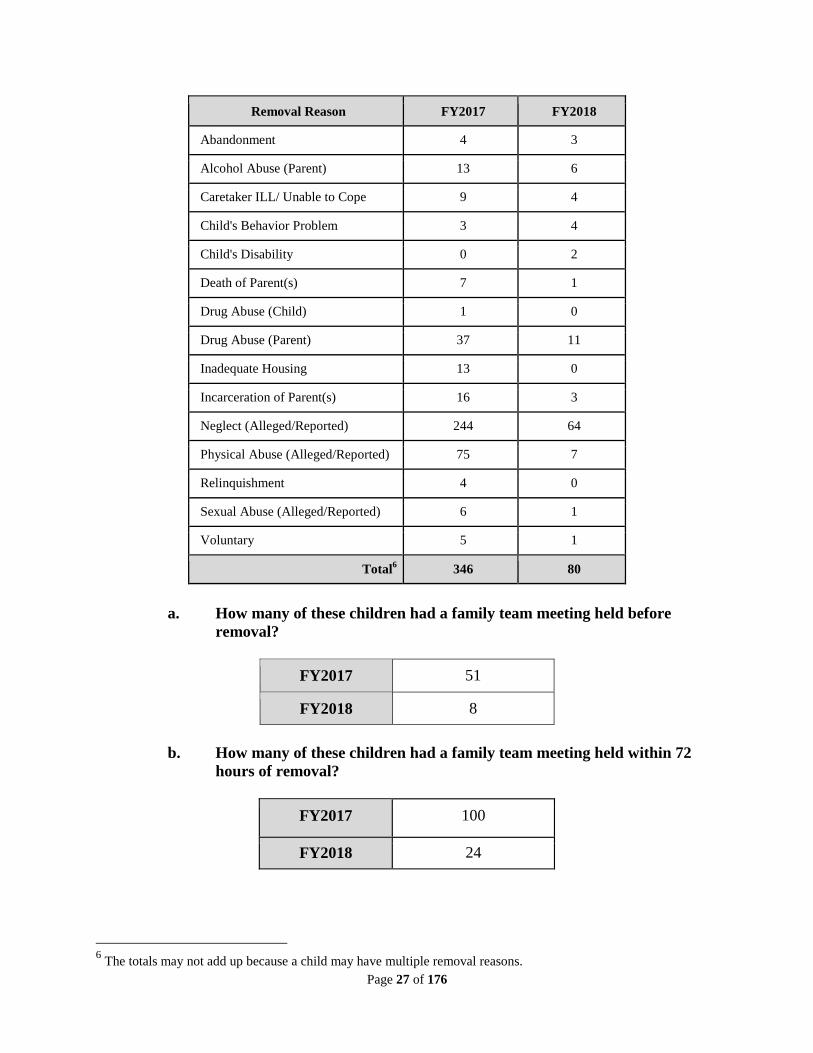
Removal Reason FY2017 FY2018
Abandonment 4 3
Alcohol Abuse (Parent) 13 6
Caretaker ILL/ Unable to Cope 9 4
Child's Behavior Problem 3 4
Child's Disability 0 2
Death of Parent(s) 7 1
Drug Abuse (Child) 1 0
Drug Abuse (Parent) 37 11
Inadequate Housing 13 0
Incarceration of Parent(s) 16 3
Neglect (Alleged/Reported) 244 64
Physical Abuse (Alleged/Reported) 75 7
Relinquishment 4 0
Sexual Abuse (Alleged/Reported) 6 1
Voluntary 5 1
Total6 346 80
a. How many of these children had a family team meeting held before
removal?
FY2017 51
FY2018 8
b. How many of these children had a family team meeting held within 72
hours of removal?
FY2017 100
FY2018 24
6 The totals may not add up because a child may have multiple removal reasons.
Page 28 of 176
c. How many of these children had a non-custodial parent identified prior
to removal? CFSA does not currently track this data. However, in the case of
all removals, CFSA requests the name and contact information of all non-
custodial parents and submits a mandatory referral to our Diligent Search Unit
requesting information on all respective parents/kin.
d. How many of these children had kinship resources identified prior to
removal? CFSA does not currently track this data. However, in the case of
all removals, CFSA requests the name and contact information of all non-
custodial parents and submits a mandatory referral to our Diligent Search Unit
requesting information on all respective parents/kin.
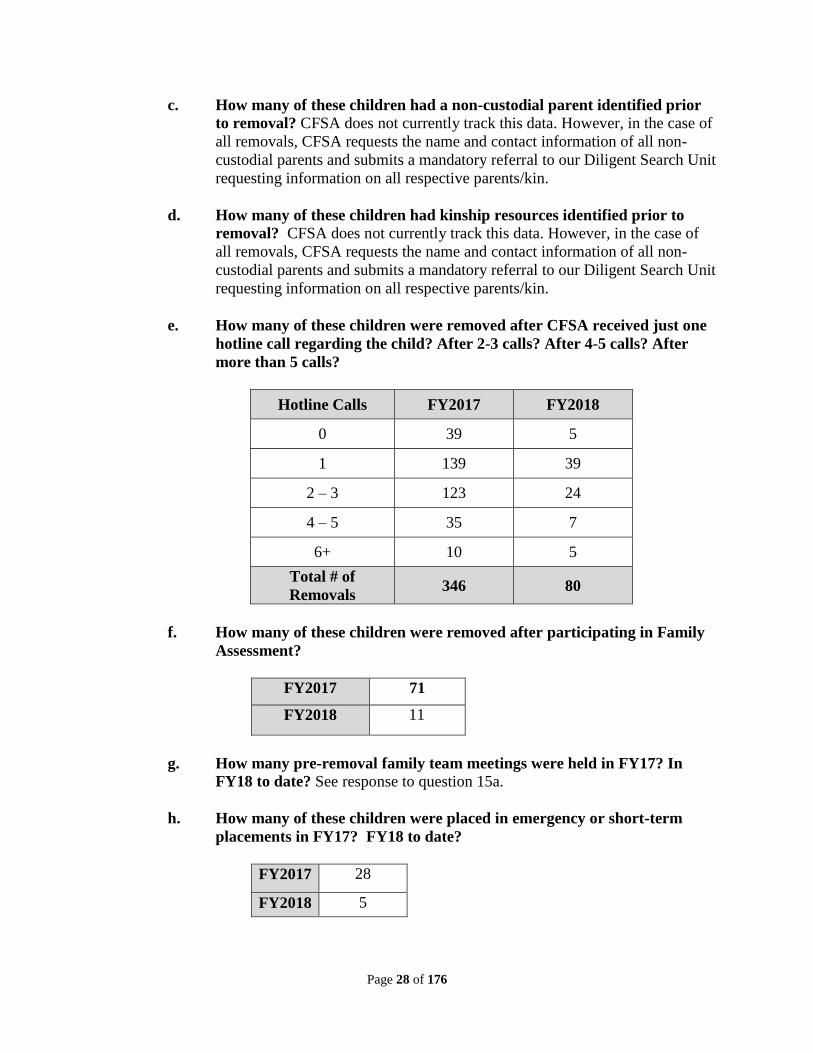
e. How many of these children were removed after CFSA received just one
hotline call regarding the child? After 2-3 calls? After 4-5 calls? After
more than 5 calls?
Hotline Calls FY2017 FY2018
0 39 5
1 139 39
2 – 3 123 24
4 – 5 35 7
6+ 10 5
Total # of
Removals 346 80
f. How many of these children were removed after participating in Family
Assessment?
FY2017 71
FY2018 11
g. How many pre-removal family team meetings were held in FY17? In
FY18 to date? See response to question 15a.
h. How many of these children were placed in emergency or short-term
placements in FY17? FY18 to date?
FY2017 28
FY2018 5
Page 29 of 176
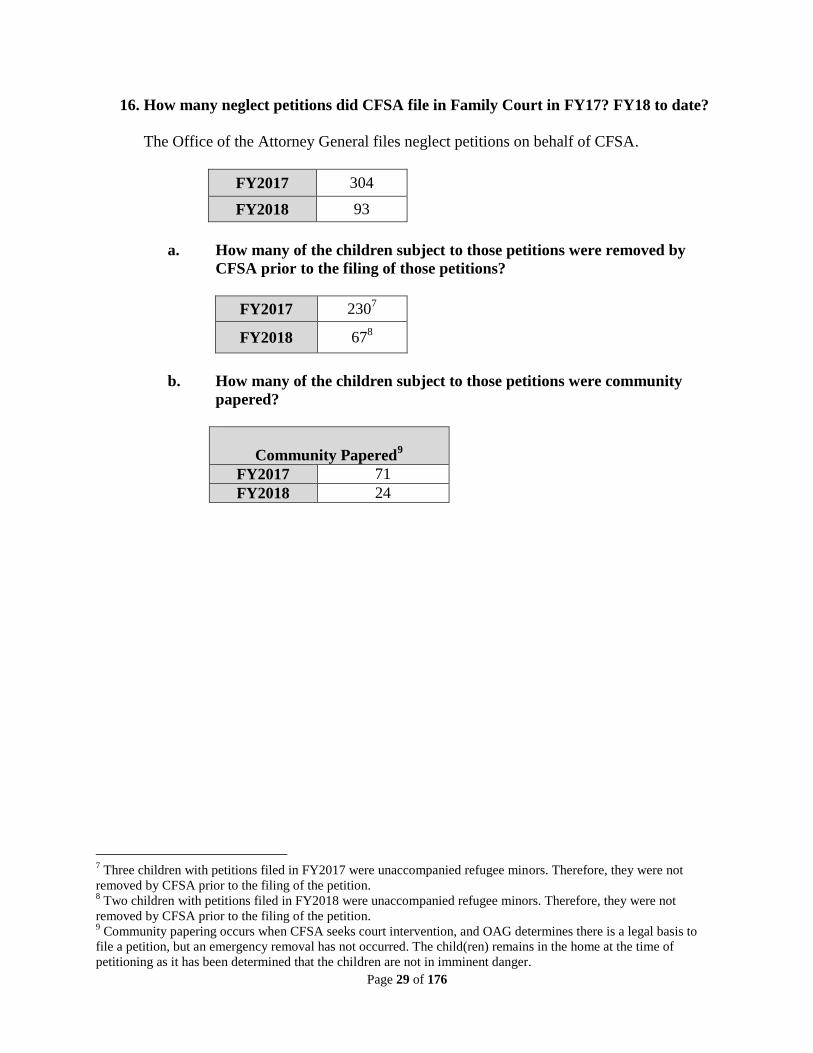
16. How many neglect petitions did CFSA file in Family Court in FY17? FY18 to date?
The Office of the Attorney General files neglect petitions on behalf of CFSA.
FY2017 304
FY2018 93
a. How many of the children subject to those petitions were removed by
CFSA prior to the filing of those petitions?
FY2017 2307
FY2018 678
b. How many of the children subject to those petitions were community
papered?
Community Papered9
FY2017 71
FY2018 24
7 Three children with petitions filed in FY2017 were unaccompanied refugee minors. Therefore, they were not
removed by CFSA prior to the filing of the petition. 8 Two children with petitions filed in FY2018 were unaccompanied refugee minors. Therefore, they were not
removed by CFSA prior to the filing of the petition. 9 Community papering occurs when CFSA seeks court intervention, and OAG determines there is a legal basis to
file a petition, but an emergency removal has not occurred. The child(ren) remains in the home at the time of
petitioning as it has been determined that the children are not in imminent danger.
Page 30 of 176
c. What, if any, data does CFSA collect on outcomes for children whose
cases are no-papered? In FY2017, 32 children (from 25 families) were no-
papered. For these families, CFSA tracks whether there are any further
referrals to the hotline and findings of those referrals and whether there are
any further removals and/or open cases.
Of the 32 children, a total of 18 (14 families) had an open case with CFSA
following the no-paper decision. One child was later removed and has an open
out-of-home case. For 17 children (13 families), the case was an in-home
case, and for nine children (six families) the case remains open. For eight
children (seven families), the case is now closed.
For 12 children (10 families), there have not been any further calls to the
hotline, removals, or open cases.
In FY2018 to date, nine children (seven families) were no-papered. For two
children (two families), there has been one additional call to the hotline that
was screened out at the hotline. For four children (four families), an in-home
case was opened as a result of the initial referral. Three of these cases
continue to be open. One case was closed after the biological mother was
located and the child was released to the mother’s care after a courtesy visit
was completed at the mother’s home. For five children (three families), there
were no further calls to the hotline, removals, or open cases.
d. What, if any, data does CFSA collect on outcomes for children where the
allegations do not result in removal or court involvement? A screened-in
allegation results in either an investigation or a Family Assessment. In the
event that the investigation or assessment does not result in removal or court
involvement, the family may be referred to their local community
Collaborative for services or to the CFSA Community Partnerships
Administration for in-home services. In each instance (open in-home case or
family involvement with a Collaborative), CFSA tracks or receives
information about outcomes.
Page 31 of 176
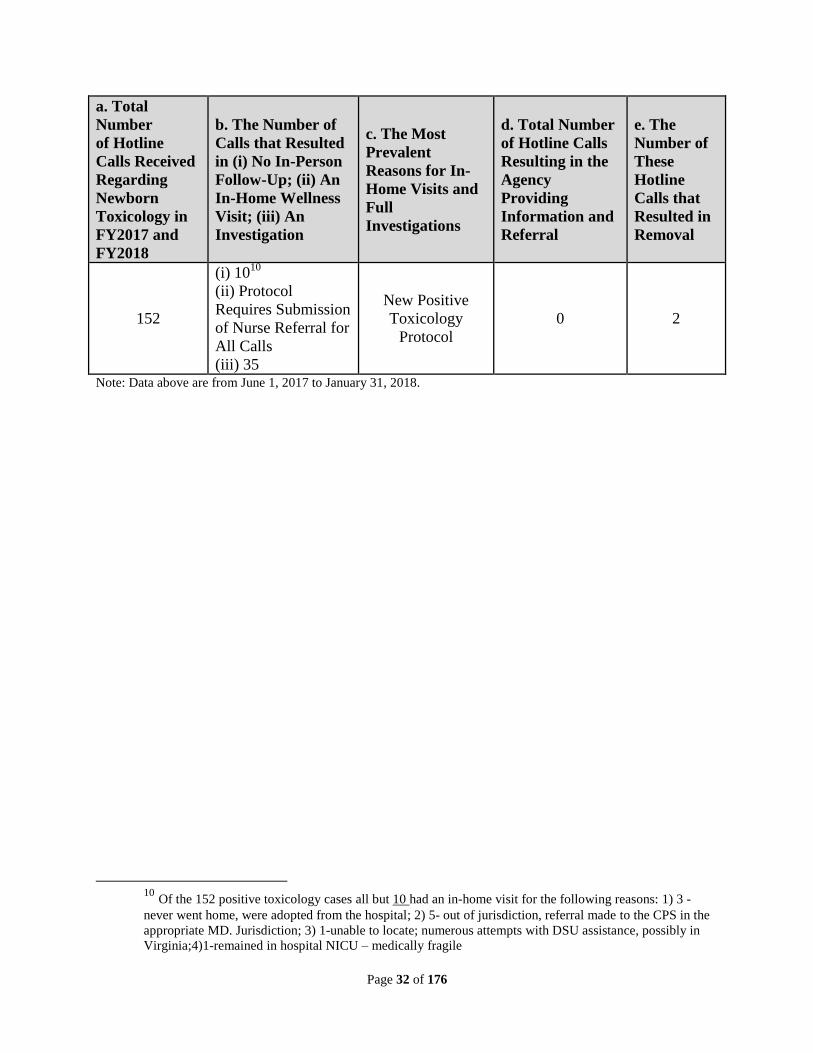
17. Regarding Early Interventions for At-Risk Newborns, please provide an update on
the Agency’s policies for newborns with positive toxicology results.
a. Total number of Hotline calls received regarding newborn toxicology in
FY17 and FY18 to date;
b. The number of calls that resulted in (i) no in-person follow-up; (ii) an in-
home wellness visit; (iii) an investigation;
c. The most prevalent reasons for in-home visits and full investigations;
d. Total number of Hotline calls resulting in the agency providing information
and referral;
e. The number of these Hotline calls that resulted in removal.
Effective June 1, 2017, CFSA’s new procedure for At-Risk Newborns requires
that all positive toxicology reports for newborns are screened in for assignment
for an investigation or family assessment.
Regardless of the pathway, all reports require a referral to the CFSA Office of
Well Being for intervention by the CFSA nursing staff; development of an
intervention plan; completion of home visits to ensure a safe environment;
establishing contact with the parent, caregivers, siblings, and other household
members to assess safety and risk; and the submission of other referrals as
needed.
CFSA has developed a response protocol regarding all positive toxicology
referrals that are screened in regardless of pathway. All newborn positive
toxicology referrals are required to have a Plan of Safe Care in accordance with
the federal Comprehensive Addiction and Recovery Act (CARA). The Plan of
Safe Care includes provision of services and supports that address the infant’s and
affected caregiver’s physical and social-emotional health and safety needs. The
Plan of Safe Care is documented in the Intervention Plan which is required for all
family assessments or investigations that involve positive toxicology reports.
Page 32 of 176
a. Total
Number
of Hotline
Calls Received
Regarding
Newborn
Toxicology in
FY2017 and
FY2018
b. The Number of
Calls that Resulted
in (i) No In-Person
Follow-Up; (ii) An
In-Home Wellness
Visit; (iii) An
Investigation
c. The Most
Prevalent
Reasons for In-
Home Visits and
Full
Investigations
d. Total Number
of Hotline Calls
Resulting in the
Agency
Providing
Information and
Referral
e. The
Number of
These
Hotline
Calls that
Resulted in
Removal
152
(i) 1010
(ii) Protocol
Requires Submission
of Nurse Referral for
All Calls
(iii) 35
New Positive
Toxicology
Protocol
0 2
Note: Data above are from June 1, 2017 to January 31, 2018.
10
Of the 152 positive toxicology cases all but 10 had an in-home visit for the following reasons: 1) 3 -
never went home, were adopted from the hospital; 2) 5- out of jurisdiction, referral made to the CPS in the
appropriate MD. Jurisdiction; 3) 1-unable to locate; numerous attempts with DSU assistance, possibly in
Virginia;4)1-remained in hospital NICU – medically fragile
Page 33 of 176
18. In FY17 and FY18 to date, how many of the children with a substantiated report of
child abuse or neglect had their investigation resolved through a safety plan to live
with relatives (i.e., not removed/placed in foster care)?
a. For the youth identified above, how many were returned to the parent
within three months, six months, and one year after the safety plan was
signed?
b. Were those returns consistent with the requirements of the safety plan,
e.g., was the child safely returned?
c. For how many of the youth identified above was there a hotline call
within three months, six months, and one year after the safety plan was
signed?
d. For how many of the youth identified in (c) above was the hotline report
screened in? Please break down by Family Assessment and investigation.
e. For those investigated, how many resulted in a substantiated finding of
abuse or neglect?
When relatives step forward and prevent a child from entering the child
welfare system, that child is safe with willing/able caretakers, and the need for
CFSA intervention comes to an end. CFSA does not track children who are
successfully diverted from the system.
Health and Mental Health Care
19. Provide the following information regarding medical and dental screenings for
children entering foster care or are wards of CFSA:
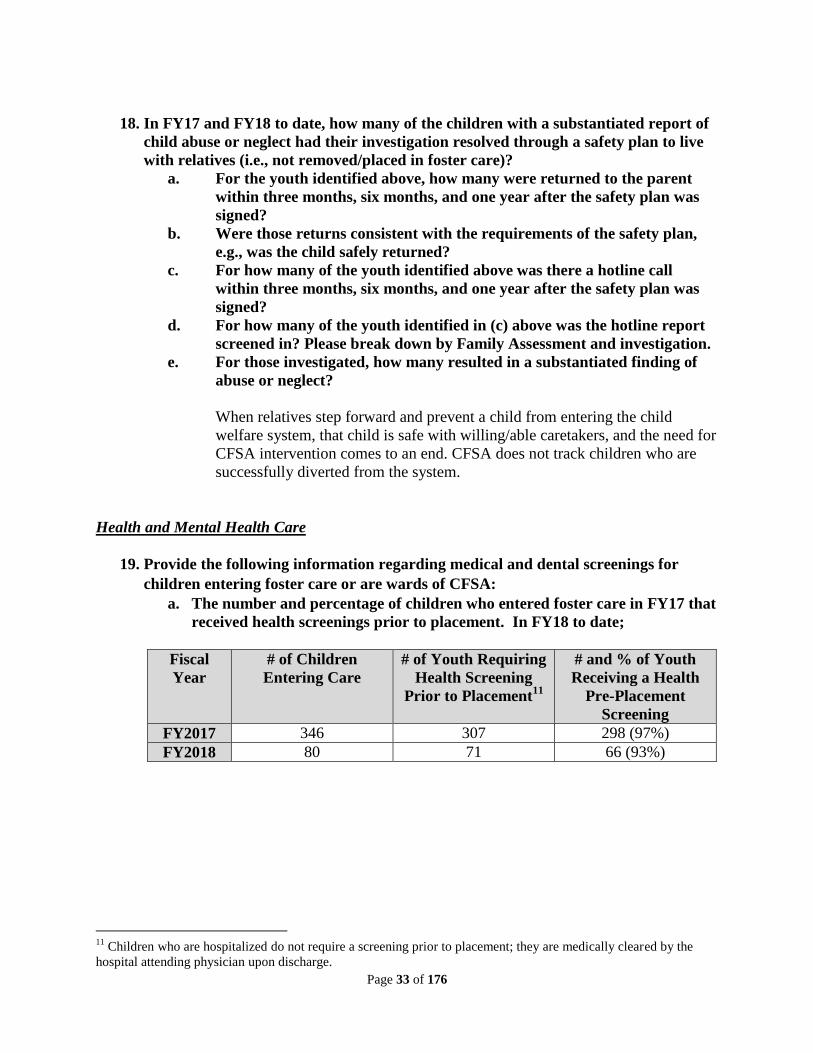
a. The number and percentage of children who entered foster care in FY17 that
received health screenings prior to placement. In FY18 to date;
Fiscal
Year
# of Children
Entering Care
# of Youth Requiring
Health Screening
Prior to Placement11
# and % of Youth
Receiving a Health
Pre-Placement
Screening
FY2017 346 307 298 (97%)
FY2018 80 71 66 (93%)
11
Children who are hospitalized do not require a screening prior to placement; they are medically cleared by the
hospital attending physician upon discharge.
Page 34 of 176
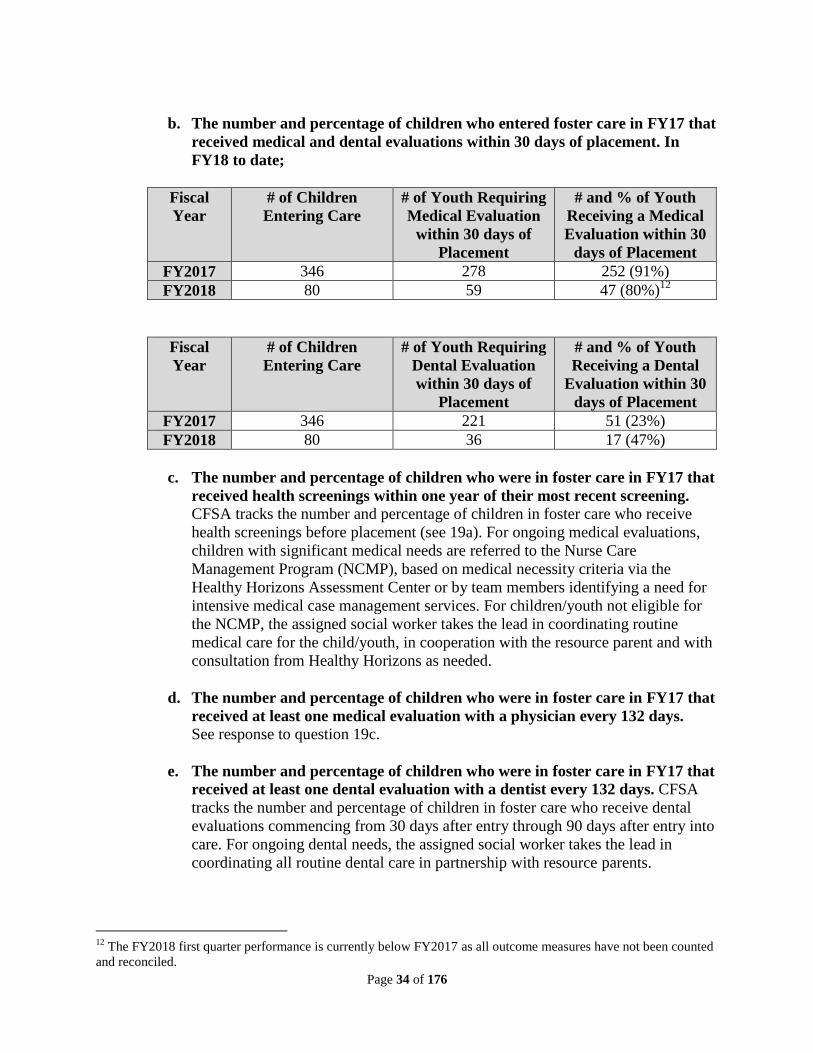
b. The number and percentage of children who entered foster care in FY17 that
received medical and dental evaluations within 30 days of placement. In
FY18 to date;
Fiscal
Year
# of Children
Entering Care
# of Youth Requiring
Medical Evaluation
within 30 days of
Placement
# and % of Youth
Receiving a Medical
Evaluation within 30
days of Placement
FY2017 346 278 252 (91%)
FY2018 80 59 47 (80%)12
Fiscal
Year
# of Children
Entering Care
# of Youth Requiring
Dental Evaluation
within 30 days of
Placement
# and % of Youth
Receiving a Dental
Evaluation within 30
days of Placement
FY2017 346 221 51 (23%)
FY2018 80 36 17 (47%)
c. The number and percentage of children who were in foster care in FY17 that
received health screenings within one year of their most recent screening.
CFSA tracks the number and percentage of children in foster care who receive
health screenings before placement (see 19a). For ongoing medical evaluations,
children with significant medical needs are referred to the Nurse Care
Management Program (NCMP), based on medical necessity criteria via the
Healthy Horizons Assessment Center or by team members identifying a need for
intensive medical case management services. For children/youth not eligible for
the NCMP, the assigned social worker takes the lead in coordinating routine
medical care for the child/youth, in cooperation with the resource parent and with
consultation from Healthy Horizons as needed.
d. The number and percentage of children who were in foster care in FY17 that
received at least one medical evaluation with a physician every 132 days.
See response to question 19c.
e. The number and percentage of children who were in foster care in FY17 that
received at least one dental evaluation with a dentist every 132 days. CFSA
tracks the number and percentage of children in foster care who receive dental
evaluations commencing from 30 days after entry through 90 days after entry into
care. For ongoing dental needs, the assigned social worker takes the lead in
coordinating all routine dental care in partnership with resource parents.
12
The FY2018 first quarter performance is currently below FY2017 as all outcome measures have not been counted
and reconciled.
Page 35 of 176
20. Provide the following information regarding medication management for children
who were in foster care in FY17:
a. The number and percentages of children who had a valid prescription for
any type of medication in FY17. CFSA does not aggregate data on
prescriptions.
b. The number and percentage of children who had at least one medication
management appointment in FY17. CFSA is working with the D.C.
Department of Behavioral Health to strengthen data sharing on medication
management for children accessing this service through a CSA. The CFSA
social worker is the lead on coordinating medication management
appointments in partnership with the resource parent and can access additional
support from nurse care managers/clinicians in the Office of Well Being.
21. For FY17 and FY18 to date:
a. How many medically fragile and developmentally delayed children and
youth have entered care? In FY2017, four children/youth met the criteria
for a diagnosis of being medically fragile, and two children/youth met the
criteria for a diagnosis of developmental delay. In FY2018, two
children/youth met the criteria for a medically fragile diagnosis. Two
children/youth met the criteria for developmental delays.
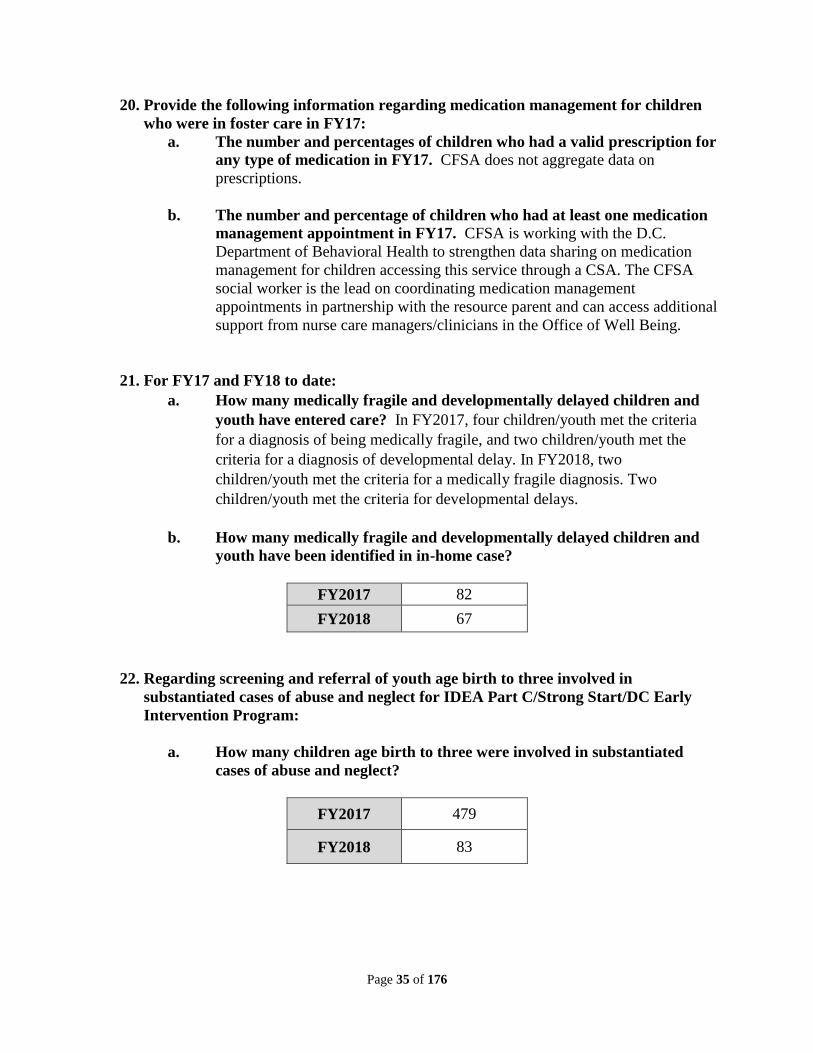
b. How many medically fragile and developmentally delayed children and
youth have been identified in in-home case?
FY2017 82
FY2018 67
22. Regarding screening and referral of youth age birth to three involved in
substantiated cases of abuse and neglect for IDEA Part C/Strong Start/DC Early
Intervention Program:
a. How many children age birth to three were involved in substantiated
cases of abuse and neglect?
FY2017 479
FY2018 83
Page 36 of 176
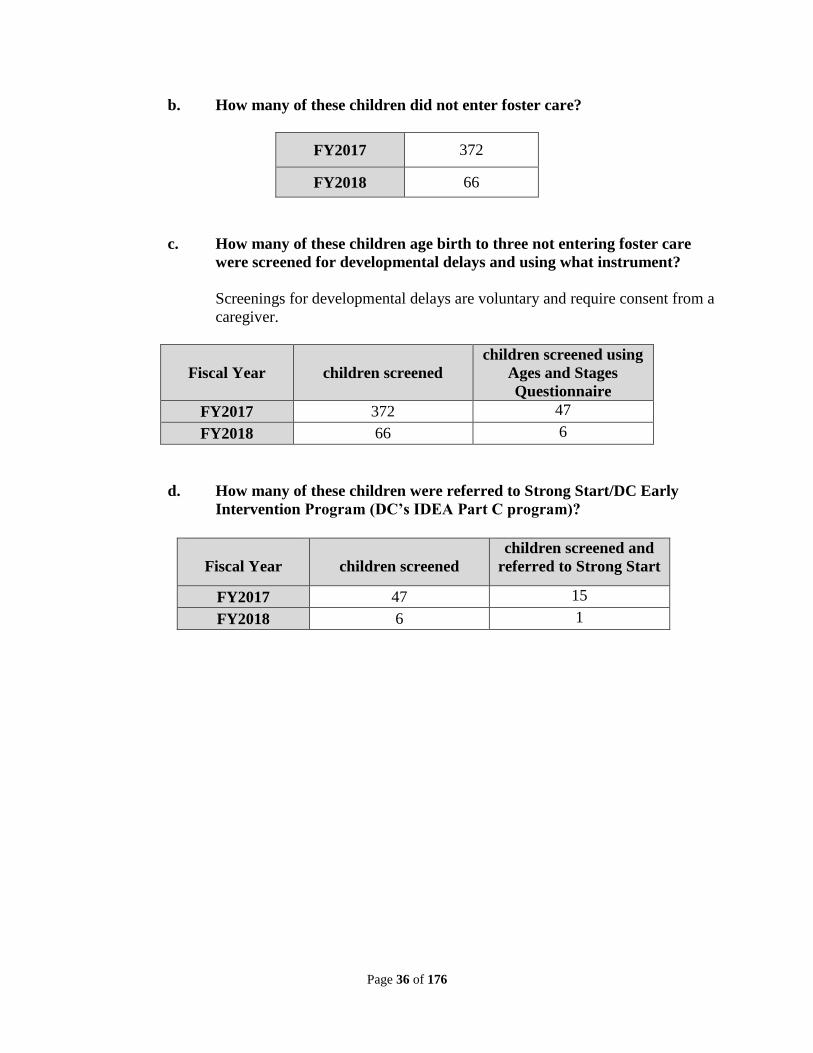
b. How many of these children did not enter foster care?
FY2017 372
FY2018 66
c. How many of these children age birth to three not entering foster care
were screened for developmental delays and using what instrument?
Screenings for developmental delays are voluntary and require consent from a
caregiver.
Fiscal Year children screened
children screened using
Ages and Stages
Questionnaire
FY2017 372 47
FY2018 66 6
d. How many of these children were referred to Strong Start/DC Early
Intervention Program (DC’s IDEA Part C program)?
Fiscal Year
children screened
children screened and
referred to Strong Start
FY2017 47 15
FY2018 6 1
Page 37 of 176
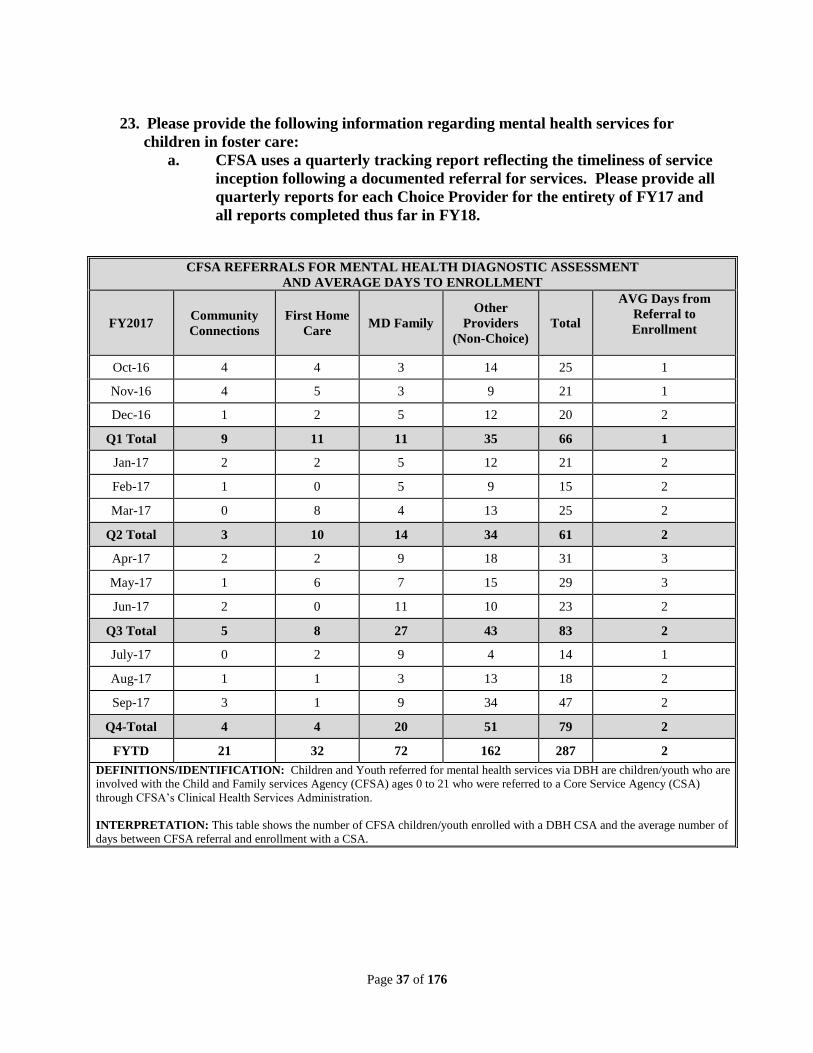
23. Please provide the following information regarding mental health services for
children in foster care:
a. CFSA uses a quarterly tracking report reflecting the timeliness of service
inception following a documented referral for services. Please provide all
quarterly reports for each Choice Provider for the entirety of FY17 and
all reports completed thus far in FY18.
CFSA REFERRALS FOR MENTAL HEALTH DIAGNOSTIC ASSESSMENT
AND AVERAGE DAYS TO ENROLLMENT
FY2017 Community
Connections First Home
Care MD Family
Other
Providers
(Non-Choice) Total
AVG Days from
Referral to
Enrollment
Oct-16 4 4 3 14 25 1
Nov-16 4 5 3 9 21 1
Dec-16 1 2 5 12 20 2
Q1 Total 9 11 11 35 66 1
Jan-17 2 2 5 12 21 2
Feb-17 1 0 5 9 15 2
Mar-17 0 8 4 13 25 2
Q2 Total 3 10 14 34 61 2
Apr-17 2 2 9 18 31 3
May-17 1 6 7 15 29 3
Jun-17 2 0 11 10 23 2
Q3 Total 5 8 27 43 83 2
July-17 0 2 9 4 14 1
Aug-17 1 1 3 13 18 2
Sep-17 3 1 9 34 47 2
Q4-Total 4 4 20 51 79 2
FYTD 21 32 72 162 287 2
DEFINITIONS/IDENTIFICATION: Children and Youth referred for mental health services via DBH are children/youth who are
involved with the Child and Family services Agency (CFSA) ages 0 to 21 who were referred to a Core Service Agency (CSA)
through CFSA’s Clinical Health Services Administration.
INTERPRETATION: This table shows the number of CFSA children/youth enrolled with a DBH CSA and the average number of
days between CFSA referral and enrollment with a CSA.
Page 38 of 176
In FY2017, CFSA referred 287 children and youth for mental health
assessments and treatment. D.C. Department of Behavioral Health (DBH)
staff co-located at CFSA connects children directly with DBH Core Service
Agency (CSA) Choice Providers and other CSAs within the DBH network.
This electronic access ensures rapid referral to the CSAs. Of the 287 referrals,
125 were referred to a Child Choice Provider and the remaining 162 children
were enrolled with alternative DBH Core Service Agencies (Hillcrest, Family
Matters, MBI, Contemporary Family Services, Howard Road and LAYC).
Enrollment with the provider occurred within an average of one day.
Enrollment does not indicate receipt of services but rather that the child has
been connected to a CSA for further evaluation to determine the need for
services. The remaining children were referred and connected to private
providers.
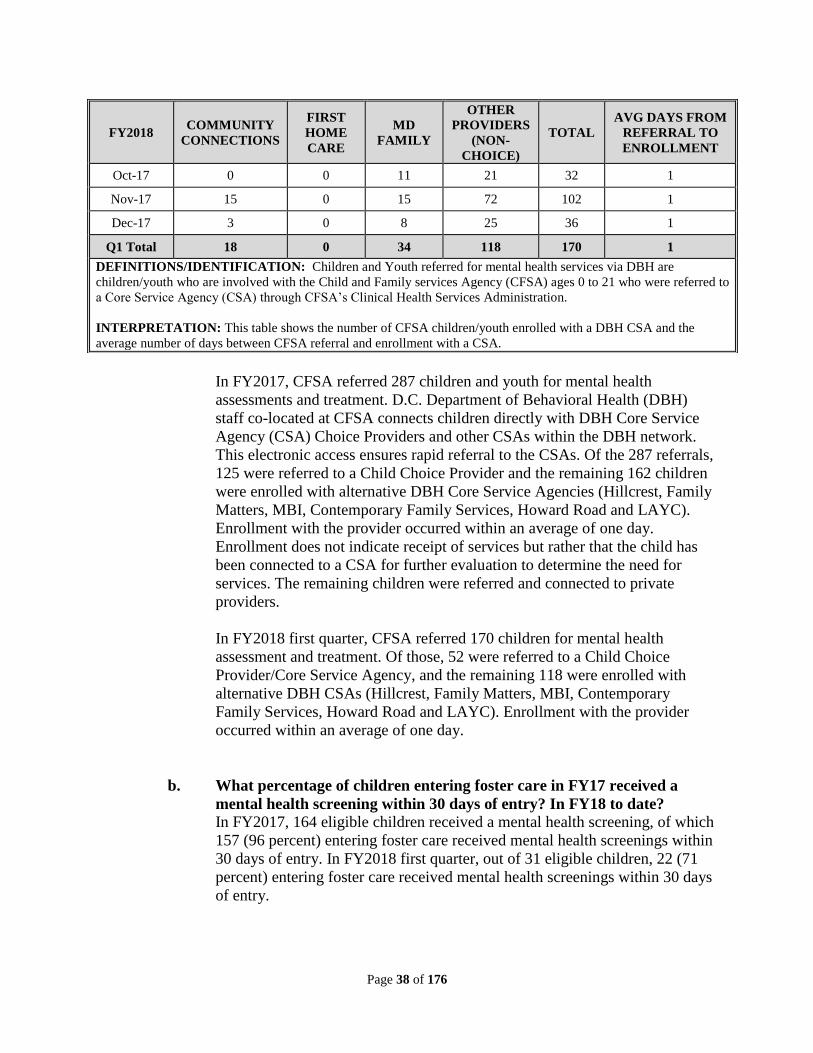
In FY2018 first quarter, CFSA referred 170 children for mental health
assessment and treatment. Of those, 52 were referred to a Child Choice
Provider/Core Service Agency, and the remaining 118 were enrolled with
alternative DBH CSAs (Hillcrest, Family Matters, MBI, Contemporary
Family Services, Howard Road and LAYC). Enrollment with the provider
occurred within an average of one day.
b. What percentage of children entering foster care in FY17 received a
mental health screening within 30 days of entry? In FY18 to date?
In FY2017, 164 eligible children received a mental health screening, of which
157 (96 percent) entering foster care received mental health screenings within
30 days of entry. In FY2018 first quarter, out of 31 eligible children, 22 (71
percent) entering foster care received mental health screenings within 30 days
of entry.
FY2018 COMMUNITY
CONNECTIONS
FIRST
HOME
CARE
MD
FAMILY
OTHER
PROVIDERS
(NON-
CHOICE)
TOTAL
AVG DAYS FROM
REFERRAL TO
ENROLLMENT
Oct-17 0 0 11 21 32 1
Nov-17 15 0 15 72 102 1
Dec-17 3 0 8 25 36 1
Q1 Total 18 0 34 118 170 1
DEFINITIONS/IDENTIFICATION: Children and Youth referred for mental health services via DBH are
children/youth who are involved with the Child and Family services Agency (CFSA) ages 0 to 21 who were referred to
a Core Service Agency (CSA) through CFSA’s Clinical Health Services Administration.
INTERPRETATION: This table shows the number of CFSA children/youth enrolled with a DBH CSA and the
average number of days between CFSA referral and enrollment with a CSA.
Page 39 of 176
i. As a result of these screenings, how many of these children were
referred for further mental health evaluations with a mental
health professional? In FY2017, out of the 164 screenings
completed, 46 children received a positive screening and were referred
for further mental health evaluation. In FY2018, out of the 47
screenings completed, 14 children received a positive screening and
were referred for further mental health evaluation.
ii. How many of these children completed the additional evaluations
with a mental health professional? In FY2017, out the 46 children
referred for further mental health evaluations, 27 children completed a
Diagnostic Evaluation/Intake Assessment either through DBH or a
private provider. For those who did not complete additional
evaluations:
● 12 children were already enrolled and receiving treatment prior
to entry into foster care.
● Four children did not complete intake due to case closure.
● Two children were under the age of eligibility.
● One child was developmentally delayed.
In FY2018, of the 14 children referred for further mental health
evaluation, three completed a Diagnostic Evaluation/Intake
Assessment either through DBH or a private provider. For those who
did not complete additional evaluations:
● Two children were already enrolled and receiving treatment
prior to entry into foster care.
● Seven children are pending intake.
● Two children did not complete intake due to case closure.
c. What percentage of children who were in foster care in FY17 received the
CAFAS/PECFAS every 90 days? In FY18 to date? In FY2017, 68 percent
of children who were in foster care received the CAFAS/PECFAS assessment
every 90 days. In FY2018, 78 percent of children who were in foster care
received the CAFAS/PECFAS assessment every 90 days.
d. For children who received mental health services in each of these time
periods, what is the average time between the mental health screening
and delivery of services? The average time between the mental health
screening administered by CFSA and delivery of services by DBH in FY2017
was 35 days. The average time between the mental health screening
administered by CFSA and delivery of services by DBH in FY2018 is 20
days.
Page 40 of 176
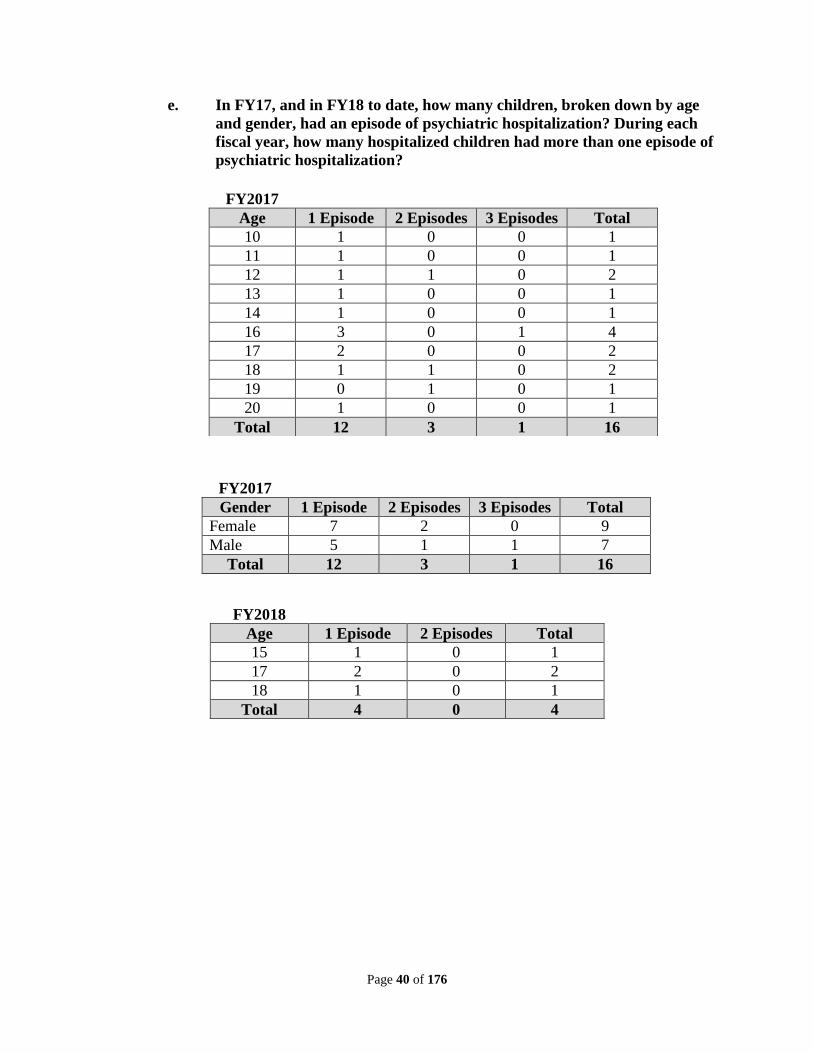
e. In FY17, and in FY18 to date, how many children, broken down by age
and gender, had an episode of psychiatric hospitalization? During each
fiscal year, how many hospitalized children had more than one episode of
psychiatric hospitalization?
FY2017
Age 1 Episode 2 Episodes 3 Episodes Total
10 1 0 0 1
11 1 0 0 1
12 1 1 0 2
13 1 0 0 1
14 1 0 0 1
16 3 0 1 4
17 2 0 0 2
18 1 1 0 2
19 0 1 0 1
20 1 0 0 1
Total 12 3 1 16
FY2017
Gender 1 Episode 2 Episodes 3 Episodes Total
Female 7 2 0 9
Male 5 1 1 7
Total 12 3 1 16
FY2018
Age 1 Episode 2 Episodes Total
15 1 0 1
17 2 0 2
18 1 0 1
Total 4 0 4
Page 41 of 176
Notes: 1. “Age” is calculated at the time of placement in PIW. 2. "Total" is a unique count of
children. The subtotals may not add up because a child may incur multiple placement
episodes at multiple ages during the reporting period
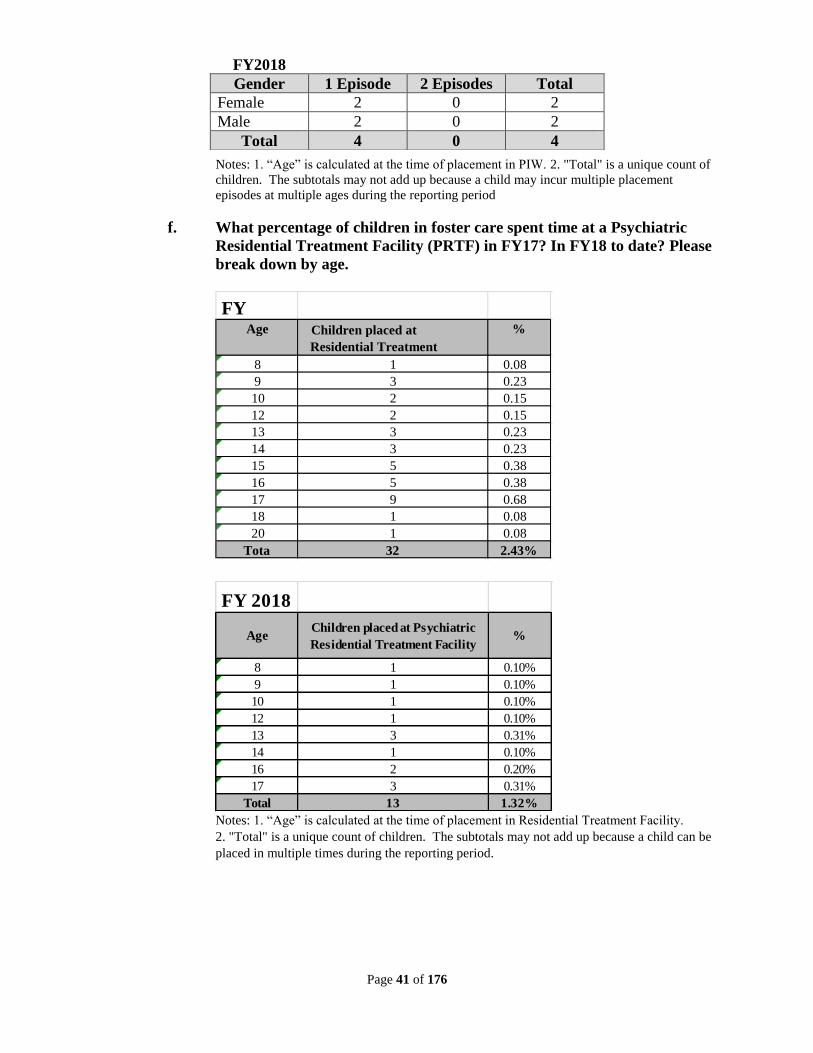
f. What percentage of children in foster care spent time at a Psychiatric
Residential Treatment Facility (PRTF) in FY17? In FY18 to date? Please
break down by age.
Notes: 1. “Age” is calculated at the time of placement in Residential Treatment Facility.
2. "Total" is a unique count of children. The subtotals may not add up because a child can be
placed in multiple times during the reporting period.
FY 2018
AgeChildren placed at Psychiatric
Residential Treatment Facility%
8 1 0.10%
9 1 0.10%
10 1 0.10%
12 1 0.10%
13 3 0.31%
14 1 0.10%
16 2 0.20%
17 3 0.31%
Total 13 1.32%
FY2018
Gender 1 Episode 2 Episodes Total
Female 2 0 2
Male 2 0 2
Total 4 0 4
FY
2017 Age Children placed at
Psychiatric Residential Treatment
Facility
%
8 1 0.08
% 9 3 0.23
% 10 2 0.15
% 12 2 0.15
% 13 3 0.23
% 14 3 0.23
% 15 5 0.38
% 16 5 0.38
% 17 9 0.68
% 18 1 0.08
% 20 1 0.08
% Tota
l 32 2.43%
Page 42 of 176
g. How many referrals for evidence-based, specialized services (Multi-
Systemic Therapy, Functional Family Therapy, Trauma-Focused
Cognitive Behavioral Therapy, Child Parent Psychotherapy for Family
Violence, and Parent Child Interaction Therapy) did CFSA make in
FY17? How many referrals has CFSA made in FY18 to date? For each
fiscal year, please identify how many referrals were made for cases in
which children:
i. Had not been removed at the time of referral;
ii. Were in foster care at the time of the referral; and
iii. Were living under protective supervision following a period in foster
care at the time of referral.
CFSA refers children and youth to DBH for a diagnostic assessment to
determine the need for mental health/substance abuse services. The
assessment guides the selection of evidence-based therapy to meet the client’s
needs. DBH submits the referral to the Core Service Agency.
In FY2017, 168 children/youth received evidence-based therapy. Of that total,
19 were referred directly by CFSA. The remaining referrals were done
through the CSA in which the children/youth were actively enrolled.
In FY2018, there are 49 children/youth currently receiving evidence-based
therapy. Of that total, six were referred directly by CFSA. The remaining
referrals were done through the CSA in which the children/youth were
actively enrolled.
The following charts show the number of children and youth receiving
Evidence-Based Therapy and the number of referrals made directly by CFSA.
CFSA continues to work with DBH towards development of a shared tracking
system that will facilitate better communication and service tracking.
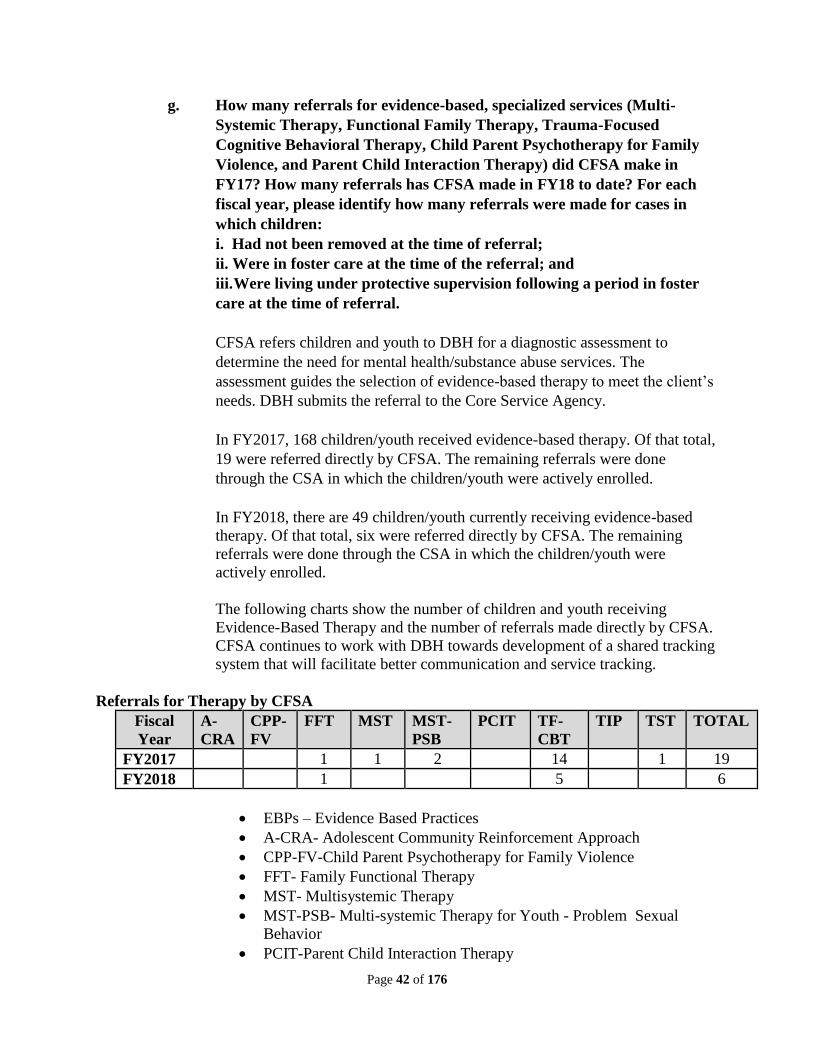
Referrals for Therapy by CFSA
Fiscal
Year
A-
CRA
CPP-
FV
FFT MST MST-
PSB
PCIT TF-
CBT
TIP TST TOTAL
FY2017 1 1 2 14 1 19
FY2018 1 5 6
EBPs – Evidence Based Practices
A-CRA- Adolescent Community Reinforcement Approach
CPP-FV-Child Parent Psychotherapy for Family Violence
FFT- Family Functional Therapy
MST- Multisystemic Therapy
MST-PSB- Multi-systemic Therapy for Youth - Problem Sexual
Behavior
PCIT-Parent Child Interaction Therapy
Page 43 of 176
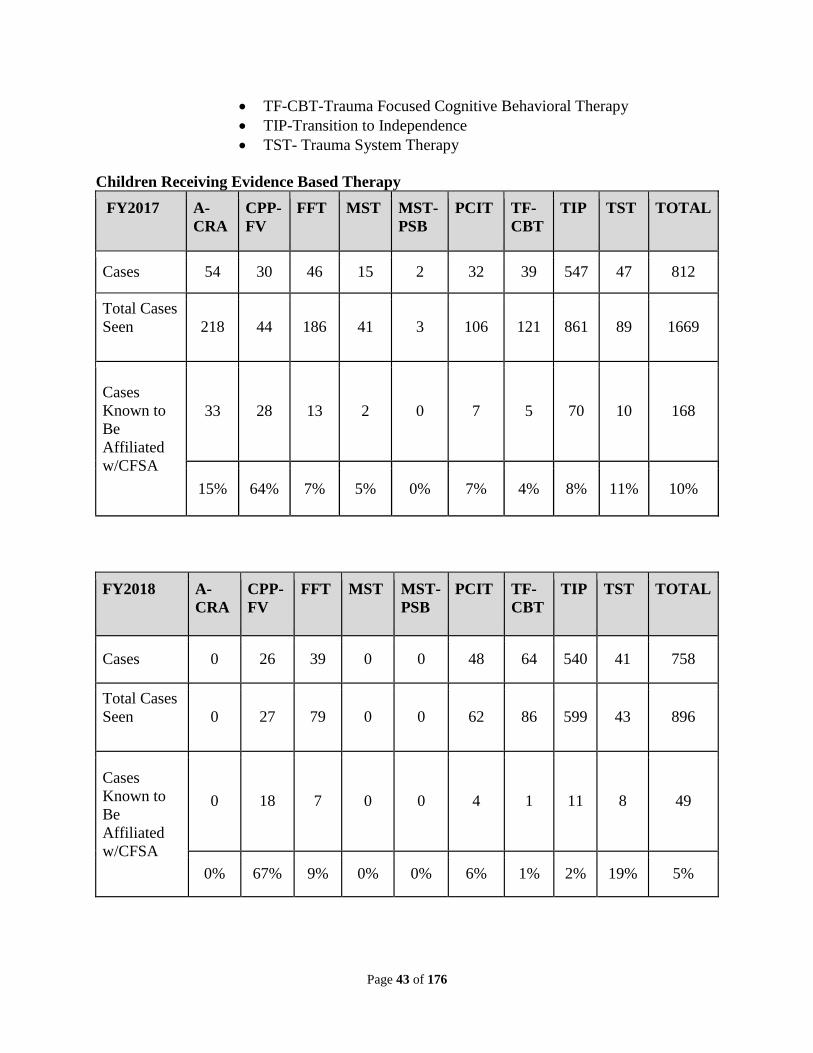
TF-CBT-Trauma Focused Cognitive Behavioral Therapy
TIP-Transition to Independence
TST- Trauma System Therapy
Children Receiving Evidence Based Therapy
FY2017 A-
CRA
CPP-
FV
FFT MST MST-
PSB
PCIT TF-
CBT
TIP TST TOTAL
Cases 54 30 46 15 2 32 39 547 47 812
Total Cases
Seen
218 44 186 41 3 106 121 861 89 1669
Cases
Known to
Be
Affiliated
w/CFSA
33 28 13 2 0 7 5 70 10 168
15% 64% 7% 5% 0% 7% 4% 8% 11% 10%
FY2018
A-
CRA
CPP-
FV
FFT MST MST-
PSB
PCIT TF-
CBT
TIP TST TOTAL
Cases 0 26 39 0 0 48 64 540 41 758
Total Cases
Seen
0 27 79 0 0 62 86 599 43 896
Cases
Known to
Be
Affiliated
w/CFSA
0 18 7 0 0 4 1 11 8 49
0% 67% 9% 0% 0% 6% 1% 2% 19% 5%
Page 44 of 176
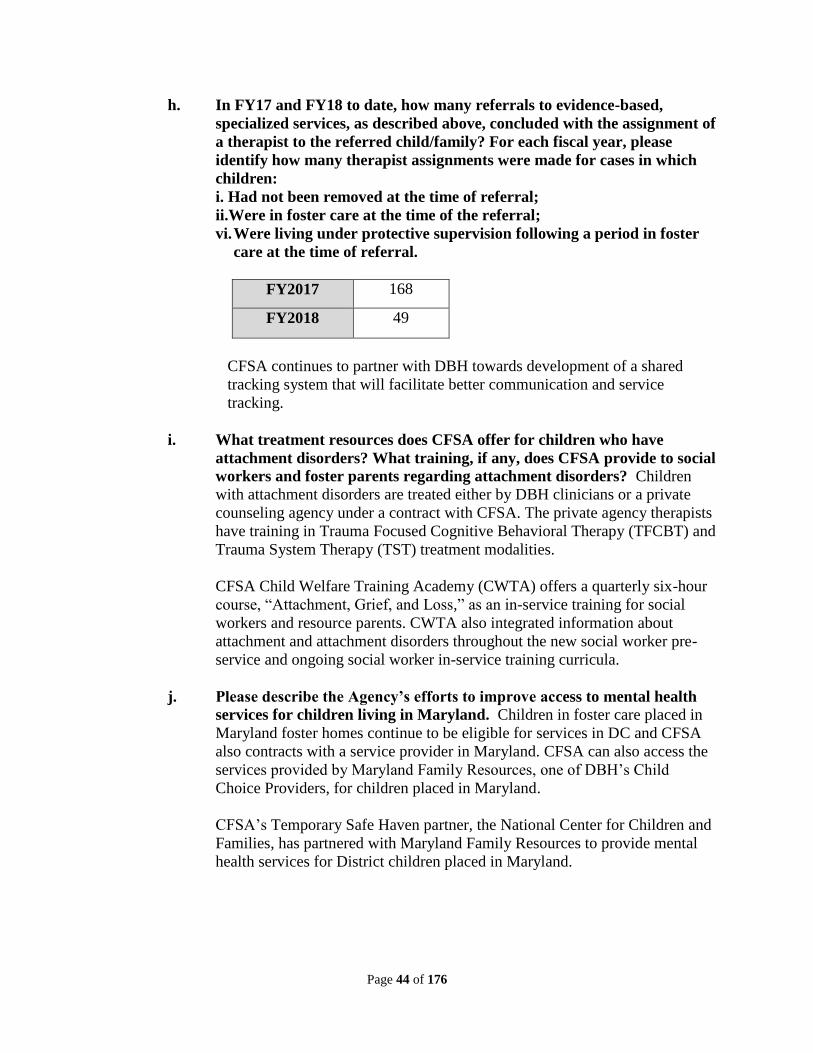
h. In FY17 and FY18 to date, how many referrals to evidence-based,
specialized services, as described above, concluded with the assignment of
a therapist to the referred child/family? For each fiscal year, please
identify how many therapist assignments were made for cases in which
children:
i. Had not been removed at the time of referral;
ii.Were in foster care at the time of the referral;
vi. Were living under protective supervision following a period in foster
care at the time of referral.
FY2017 168
FY2018 49
CFSA continues to partner with DBH towards development of a shared
tracking system that will facilitate better communication and service
tracking.
i. What treatment resources does CFSA offer for children who have
attachment disorders? What training, if any, does CFSA provide to social
workers and foster parents regarding attachment disorders? Children
with attachment disorders are treated either by DBH clinicians or a private
counseling agency under a contract with CFSA. The private agency therapists
have training in Trauma Focused Cognitive Behavioral Therapy (TFCBT) and
Trauma System Therapy (TST) treatment modalities.
CFSA Child Welfare Training Academy (CWTA) offers a quarterly six-hour
course, “Attachment, Grief, and Loss,” as an in-service training for social
workers and resource parents. CWTA also integrated information about
attachment and attachment disorders throughout the new social worker pre-
service and ongoing social worker in-service training curricula.
j. Please describe the Agency’s efforts to improve access to mental health
services for children living in Maryland. Children in foster care placed in
Maryland foster homes continue to be eligible for services in DC and CFSA
also contracts with a service provider in Maryland. CFSA can also access the
services provided by Maryland Family Resources, one of DBH’s Child
Choice Providers, for children placed in Maryland.
CFSA’s Temporary Safe Haven partner, the National Center for Children and
Families, has partnered with Maryland Family Resources to provide mental
health services for District children placed in Maryland.
Page 45 of 176
k. What treatment resources does CFSA offer for children who have an
autism spectrum disorder? What training, if any, does CFSA provide to
social workers and foster parents regarding autism spectrum disorders?
Children who are diagnosed on the Autism Spectrum Disorder are enrolled
with Health Services for Children with Special Needs (HSCSN) to receive
treatment including behavioral therapy services and medication management.
Children diagnosed with Autism Spectrum Disorders also receive speech,
language, and occupational therapy and social skills through education
programming as indicated on their Individual Education Plan (IEP).
CWTA offers a four-hour in-service training course about ASD to social
workers and foster parents. It provides social workers and foster parents with
a review of the diagnosis of autism and its associated symptoms along the
spectrum, with a focus on specific interventions and best practices for children
and youth diagnosed with ASD.
24. Please provide a detailed update regarding the Agency’s implementation of mobile
crisis stabilization services for youth in foster care, including the following
information:
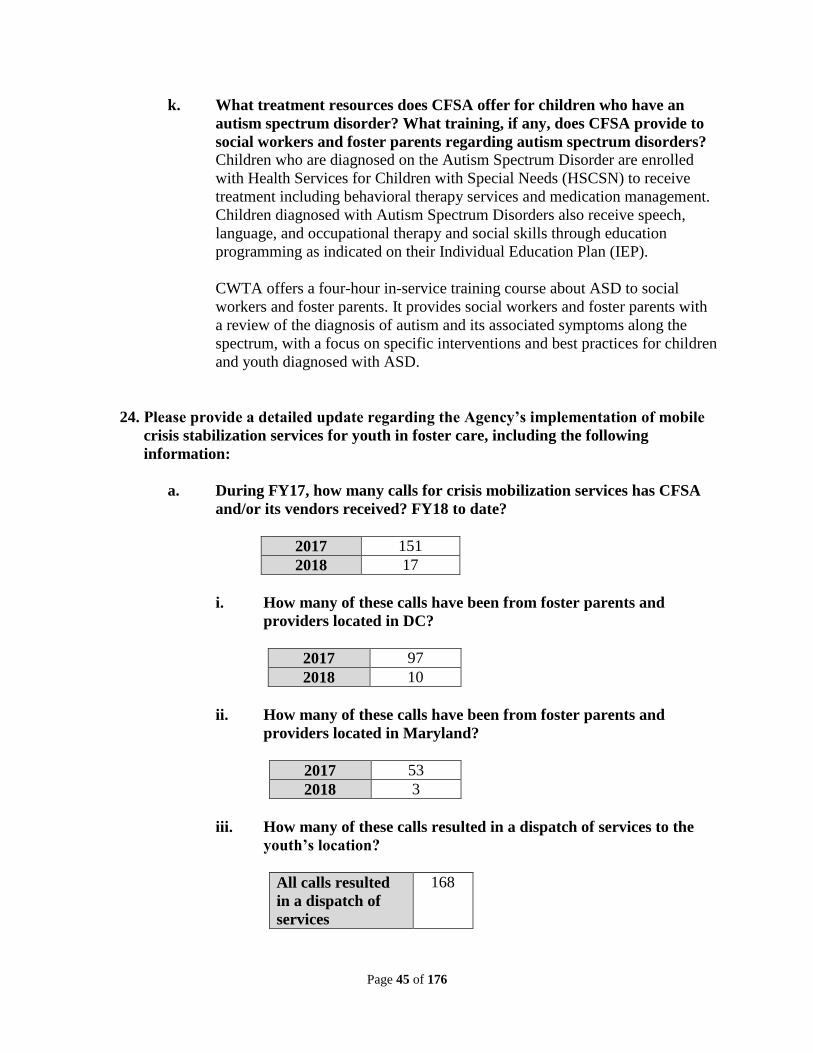
a. During FY17, how many calls for crisis mobilization services has CFSA
and/or its vendors received? FY18 to date?
2017 151
2018 17
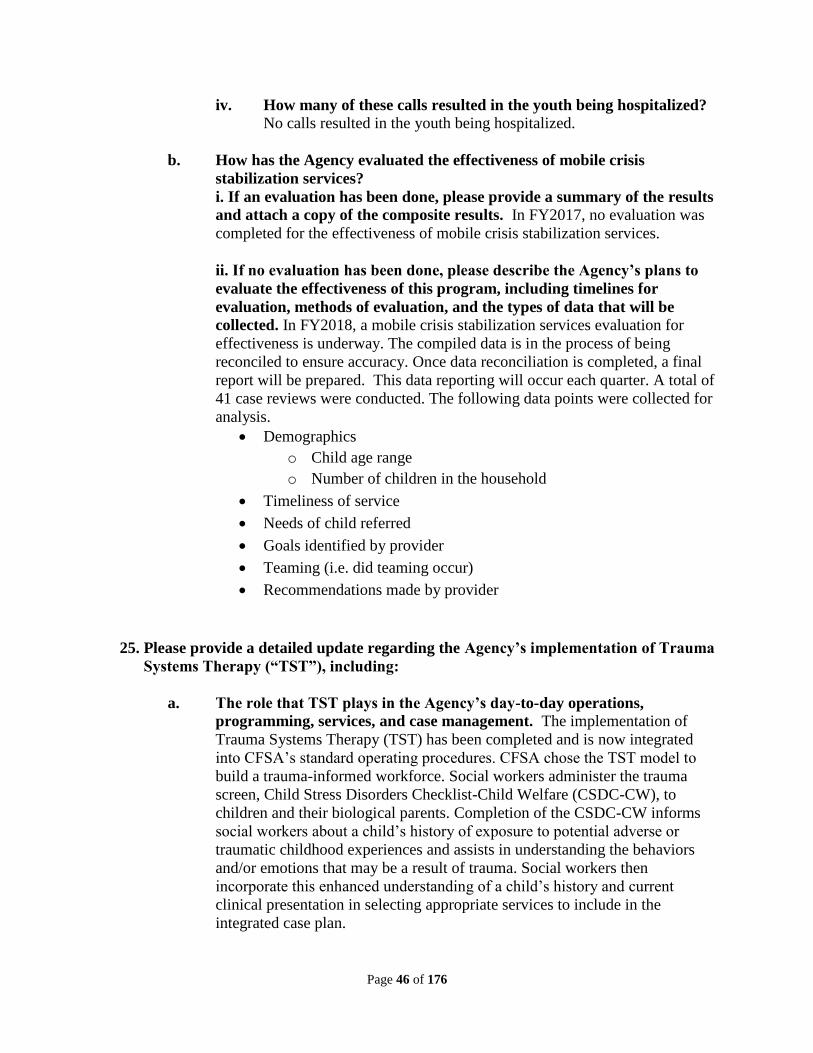
i. How many of these calls have been from foster parents and
providers located in DC?
2017 97
2018 10
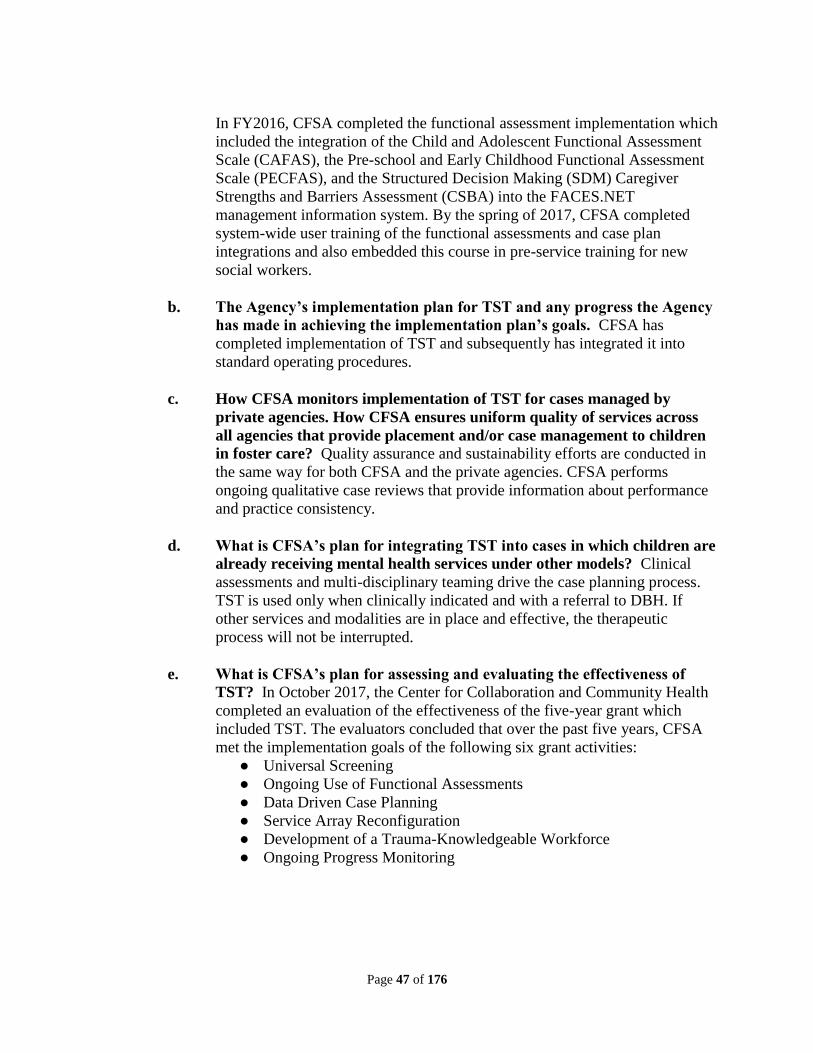
ii. How many of these calls have been from foster parents and
providers located in Maryland?
2017 53
2018 3
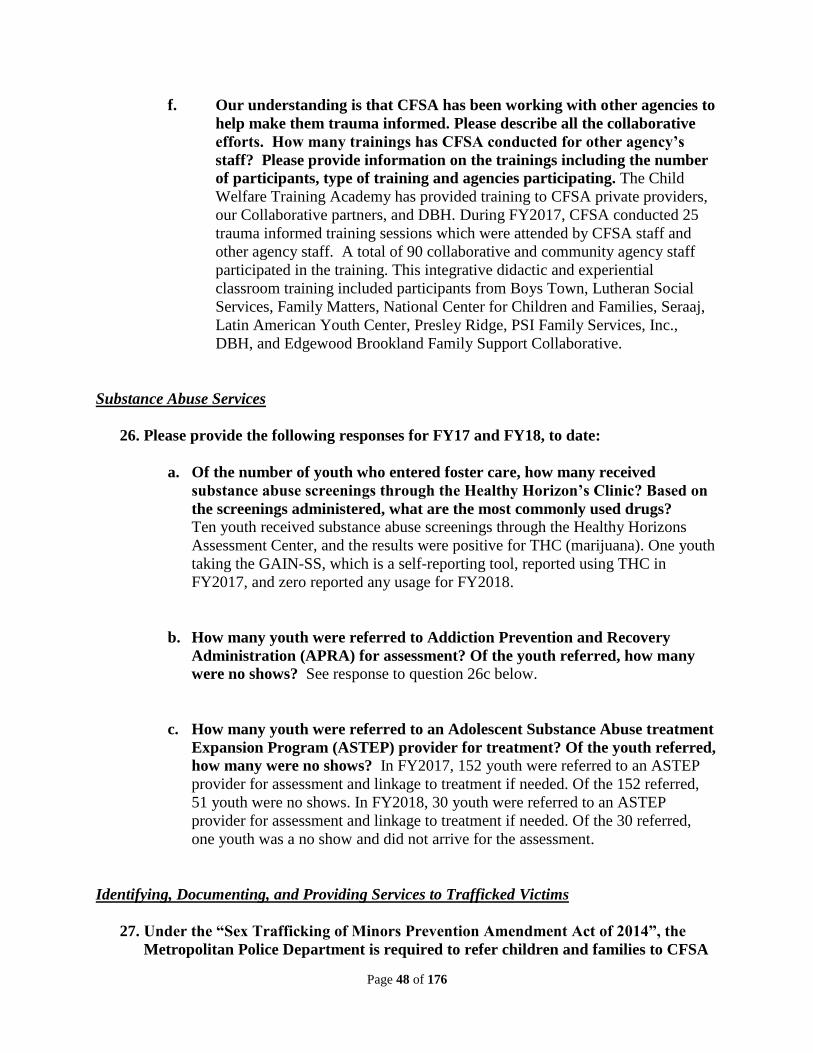
iii. How many of these calls resulted in a dispatch of services to the
youth’s location?
All calls resulted
in a dispatch of
services
168
Page 46 of 176
iv. How many of these calls resulted in the youth being hospitalized? No calls resulted in the youth being hospitalized.
b. How has the Agency evaluated the effectiveness of mobile crisis
stabilization services?
i. If an evaluation has been done, please provide a summary of the results
and attach a copy of the composite results. In FY2017, no evaluation was
completed for the effectiveness of mobile crisis stabilization services.
ii. If no evaluation has been done, please describe the Agency’s plans to
evaluate the effectiveness of this program, including timelines for
evaluation, methods of evaluation, and the types of data that will be
collected. In FY2018, a mobile crisis stabilization services evaluation for
effectiveness is underway. The compiled data is in the process of being
reconciled to ensure accuracy. Once data reconciliation is completed, a final
report will be prepared. This data reporting will occur each quarter. A total of
41 case reviews were conducted. The following data points were collected for
analysis.
Demographics
o Child age range
o Number of children in the household
Timeliness of service
Needs of child referred
Goals identified by provider
Teaming (i.e. did teaming occur)
Recommendations made by provider
25. Please provide a detailed update regarding the Agency’s implementation of Trauma
Systems Therapy (“TST”), including:
a. The role that TST plays in the Agency’s day-to-day operations,
programming, services, and case management. The implementation of
Trauma Systems Therapy (TST) has been completed and is now integrated
into CFSA’s standard operating procedures. CFSA chose the TST model to
build a trauma-informed workforce. Social workers administer the trauma
screen, Child Stress Disorders Checklist-Child Welfare (CSDC-CW), to
children and their biological parents. Completion of the CSDC-CW informs
social workers about a child’s history of exposure to potential adverse or
traumatic childhood experiences and assists in understanding the behaviors
and/or emotions that may be a result of trauma. Social workers then
incorporate this enhanced understanding of a child’s history and current
clinical presentation in selecting appropriate services to include in the
integrated case plan.
Page 47 of 176
In FY2016, CFSA completed the functional assessment implementation which
included the integration of the Child and Adolescent Functional Assessment
Scale (CAFAS), the Pre-school and Early Childhood Functional Assessment
Scale (PECFAS), and the Structured Decision Making (SDM) Caregiver
Strengths and Barriers Assessment (CSBA) into the FACES.NET
management information system. By the spring of 2017, CFSA completed
system-wide user training of the functional assessments and case plan
integrations and also embedded this course in pre-service training for new
social workers.
b. The Agency’s implementation plan for TST and any progress the Agency
has made in achieving the implementation plan’s goals. CFSA has
completed implementation of TST and subsequently has integrated it into
standard operating procedures.
c. How CFSA monitors implementation of TST for cases managed by
private agencies. How CFSA ensures uniform quality of services across
all agencies that provide placement and/or case management to children
in foster care? Quality assurance and sustainability efforts are conducted in
the same way for both CFSA and the private agencies. CFSA performs
ongoing qualitative case reviews that provide information about performance
and practice consistency.
d. What is CFSA’s plan for integrating TST into cases in which children are
already receiving mental health services under other models? Clinical
assessments and multi-disciplinary teaming drive the case planning process.
TST is used only when clinically indicated and with a referral to DBH. If
other services and modalities are in place and effective, the therapeutic
process will not be interrupted.
e. What is CFSA’s plan for assessing and evaluating the effectiveness of
TST? In October 2017, the Center for Collaboration and Community Health
completed an evaluation of the effectiveness of the five-year grant which
included TST. The evaluators concluded that over the past five years, CFSA
met the implementation goals of the following six grant activities:
● Universal Screening
● Ongoing Use of Functional Assessments
● Data Driven Case Planning
● Service Array Reconfiguration
● Development of a Trauma-Knowledgeable Workforce
● Ongoing Progress Monitoring
Page 48 of 176
f. Our understanding is that CFSA has been working with other agencies to
help make them trauma informed. Please describe all the collaborative
efforts. How many trainings has CFSA conducted for other agency’s
staff? Please provide information on the trainings including the number
of participants, type of training and agencies participating. The Child
Welfare Training Academy has provided training to CFSA private providers,
our Collaborative partners, and DBH. During FY2017, CFSA conducted 25
trauma informed training sessions which were attended by CFSA staff and
other agency staff. A total of 90 collaborative and community agency staff
participated in the training. This integrative didactic and experiential
classroom training included participants from Boys Town, Lutheran Social
Services, Family Matters, National Center for Children and Families, Seraaj,
Latin American Youth Center, Presley Ridge, PSI Family Services, Inc.,
DBH, and Edgewood Brookland Family Support Collaborative.
Substance Abuse Services
26. Please provide the following responses for FY17 and FY18, to date:
a. Of the number of youth who entered foster care, how many received
substance abuse screenings through the Healthy Horizon’s Clinic? Based on
the screenings administered, what are the most commonly used drugs?
Ten youth received substance abuse screenings through the Healthy Horizons
Assessment Center, and the results were positive for THC (marijuana). One youth
taking the GAIN-SS, which is a self-reporting tool, reported using THC in
FY2017, and zero reported any usage for FY2018.
b. How many youth were referred to Addiction Prevention and Recovery
Administration (APRA) for assessment? Of the youth referred, how many
were no shows? See response to question 26c below.
c. How many youth were referred to an Adolescent Substance Abuse treatment
Expansion Program (ASTEP) provider for treatment? Of the youth referred,
how many were no shows? In FY2017, 152 youth were referred to an ASTEP
provider for assessment and linkage to treatment if needed. Of the 152 referred,
51 youth were no shows. In FY2018, 30 youth were referred to an ASTEP
provider for assessment and linkage to treatment if needed. Of the 30 referred,
one youth was a no show and did not arrive for the assessment.
Identifying, Documenting, and Providing Services to Trafficked Victims
27. Under the “Sex Trafficking of Minors Prevention Amendment Act of 2014”, the
Metropolitan Police Department is required to refer children and families to CFSA
Page 49 of 176
when there is a suspicion that children might be involved in trafficking.
Additionally, the federal “Preventing Sex Trafficking and Strengthening Families
Act of 2014” requires that CFSA identify, document, and determine services for
children and youth under the care or supervision of the state, who the state has
reasonable cause to believe are victims, or are at risk of becoming a victim, of sex
trafficking or a severe form of trafficking in persons. Lastly, the “Justice for
Victims of Trafficking Act of 2015” requires that CFSA provide services to children
known or suspected to be victims of sex trafficking. Please provide an update on the
law. The Child Neglect and Sex Trafficking Amendment Act of 2017 was introduced in
the DC Council on April 24, 2017. A public hearing was held on June 22, 2017. The bill
was referred to the Committee on the Judiciary and Public Safety and is currently under
council review.
a. Last year, CFSA explained that that it was developing protocols to screen
and accept all referrals for minor sex trafficking without regard to the
identity of the maltreator. Please provide an update on the creation of the
protocols and a copy thereof.
Procedures
Hotline Worker includes a standard question for all reports:
Do you have any knowledge of the child(ren) being sexually
exploited? If the caller indicates “yes,” the Hotline Worker
proceeds with the new Screening Tool (see attachment).
If the caller mentions during the report a belief that the child is being
trafficked or prostituting, the Hotline Worker proceeds with the new
Screening Tool.
Hotline Worker selects the new allegation if appropriate, along with
any additional allegations.
Hotline Worker adds the maltreator into the client list:
Unknown Trafficker or
Name of person trafficking the child.
Hotline Worker selects “Sex Trafficker” and “Alleged Maltreator”
under the client role. “Not in the home” should be selected unless the
individual resides in the home.
Under the Hotline Recommendation Screen, the Hotline Worker
selects CPS/I 24 Hour, checking the OTHER box and entering Sex
Trafficking as the reason.
If there are immediate safety concerns, the Hotline Worker promptly
consults with the Hotline Supervisor.
Hotline Worker sends the referral to MPD and CPS.
Hotline Worker notifies all appropriate parties.
I&R Category
Hotline Worker selects Sexual Exploitation/Sex Trafficking of a Child
(by a Non-Caregiver) under the Preliminary Screening section if the
victim is a Ward of DC, but they are age 18 or older.
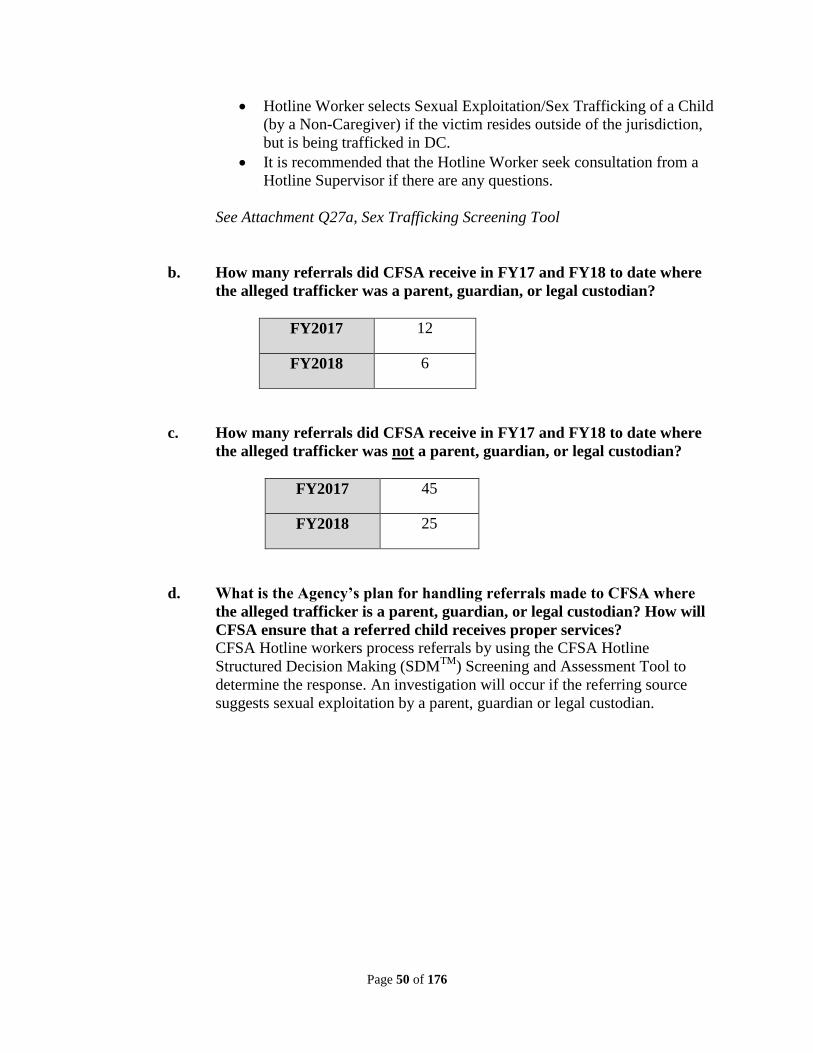
Page 50 of 176
Hotline Worker selects Sexual Exploitation/Sex Trafficking of a Child
(by a Non-Caregiver) if the victim resides outside of the jurisdiction,
but is being trafficked in DC.
It is recommended that the Hotline Worker seek consultation from a
Hotline Supervisor if there are any questions.
See Attachment Q27a, Sex Trafficking Screening Tool
b. How many referrals did CFSA receive in FY17 and FY18 to date where
the alleged trafficker was a parent, guardian, or legal custodian?
FY2017 12
FY2018 6
c. How many referrals did CFSA receive in FY17 and FY18 to date where
the alleged trafficker was not a parent, guardian, or legal custodian?
FY2017 45
FY2018 25
d. What is the Agency’s plan for handling referrals made to CFSA where
the alleged trafficker is a parent, guardian, or legal custodian? How will
CFSA ensure that a referred child receives proper services?
CFSA Hotline workers process referrals by using the CFSA Hotline
Structured Decision Making (SDMTM
) Screening and Assessment Tool to
determine the response. An investigation will occur if the referring source
suggests sexual exploitation by a parent, guardian or legal custodian.
Page 51 of 176
For those youth who are CFSA involved, regardless of whether the alleged
trafficker is a parent, guardian or legal custodian, there is an Internal CFSA
Commercial Sexual Exploitation of Children (CSEC) Case Review that is held
weekly to review youth who are confirmed or at risk for sex trafficking. CSEC
Case Reviews have a multidisciplinary team approach that includes the social
work team, mental health provider, anti-trafficking agencies, caregiver, GAL
and MPD (if appropriate). The purpose of these reviews are to discuss the
identified risks associated with CSEC, the child’s overall functioning and
health, and to develop a plan of care to address any barriers such as mental
health, substance abuse, domestic violence, safety and placement. A
representative from Fair Girls or Courtney House participates in CFSA CSEC
Case Reviews to provide updates regarding their contact with the youth and
the status of services which are tracked by the youth’s social work team.
e. What is the Agency’s plan for handling referrals made to CFSA where
the alleged trafficker is not a parent, guardian, or legal custodian? How
will CFSA ensure that a referred child receives proper services?
For referrals in which the alleged trafficker is not a parent, guardian or legal
custodian, CPS refers the youth to one of the anti-trafficking organizations
(i.e. Fair Girls or Courtney House). These youth are also referred by MPD to
the monthly District Wide Multidisciplinary Team Meeting. The multi-agency
representatives (Safe Shores, Child and Family Services Agency, Department
of Behavioral Health, Court Social Services, Office of the Attorney General,
Children’s National Medical Center, Department of Youth Rehabilitation
Services, Child Guidance Clinic and Metropolitan Police Department) discuss
youth who have come to the attention of their respective agencies with risks
associated with Commercial Sexual Exploitation of Children (CSEC). The
purpose is to plan for linkage to services which can specifically address sex
trafficking and mental health concerns. A representative from the Department
of Behavioral Health and the referred anti-trafficking agency is present to
confirm whether the youth is receiving services.
f. What kind of screening for sex trafficking will occur? Please provide a
copy of the screening tool and who will conduct the screenings?
There are a number of assessment approaches used by CFSA to identify
victims of sex trafficking. Preliminarily, the social worker would use key
indicators and red flags to determine whether a further assessment is needed.
If the child is the subject of a Child Protective Services report and the
preliminary assessment suggests that child has been sexually exploited, a
referral is made to one of the designated community resources specializing in
commercial sexual exploitation/sex trafficking assessment and intervention.
Page 52 of 176
Children may also receive an assessment during the pre-
placement/replacement screening or 30-day comprehensive assessment at the
Healthy Horizons Assessment Center (HHAC). When the screening shows
indicators of sexual exploitation/sex trafficking, the nurse practitioner will
complete the HHAC Sex Trafficking questionnaire. In situations where a child
in an ongoing case is showing indicators of being trafficked, the social worker
will complete the sex trafficking questions in the Child Stress Disorders
Checklist-Child Welfare (CSDC-CW).
See Attachment Q27f, Child Stress Disorder Checklist-Child Welfare
(CSDC-CW)
g. How is CFSA coordinating with other sister Agencies to properly screen
and provide services to these youth? Did CFSA work with other agencies
to develop their screening tool? CFSA coordinates with the following
agencies to screen and provide services to youth impacted or thought to be
impacted by sex trafficking.
Metropolitan Police Department (MPD): CFSA and MPD have reciprocal
agreements regarding screening and the provision of services to this
population. CFSA’s procedures require all reports that indicate alleged sex
trafficking to be reported to MPD immediately and no later than 24 hours after
the information is received. MPD is required to report to CFSA when MPD
has knowledge, information, or suspicion that a child is engaging in behaviors
related to sex trafficking. CFSA collaborates with MPD to ensure the child is
referred to one of the designated community resources specializing in sex
trafficking assessment and intervention, runaway and homeless youth
programs, and other identified resources.
Department of Behavioral Health (DBH): If the initial medical screening
indicates evidence of sex trafficking, the nurse practitioner may confer with
the DBH co-located staff for service referrals.
Court Social Services Division (CSSD): The Child Guidance Clinic of the
CCSD developed the Sex-trafficking Assessment Review (STAR), a brief,
objective, non-intrusive, quantitative decision making system for determining
a youth’s amount of CSEC risk. The STAR is intended to screen and triage
children’s needs therefore, the STAR is typically not used to confirm a CSEC
suspicion, but rather to assess whether or not a youth should be provided with
a thorough CSEC assessment.
Office of the Attorney General (OAG): The CFSA social worker coordinates
with the assigned assistant attorney general (AAG) from the Office of the
Attorney General regarding legal matters.
Page 53 of 176
h. In FY17 and FY18 to date, how many CFSA staff members have been
trained on human trafficking issues? How frequently do CFSA staff
attend these trainings? What is covered in the training? What additional
trainings are planned for FY18? In FY2017, 272 CFSA staff and 27 private
agency staff completed the required six-hour Human Trafficking classroom
course. In addition to the six-hour Human Trafficking course, 70 CFSA staff
completed the one-hour webinar. The webinar was not offered to private
agency staff.
In FY2018, a total of 69 CFSA staff and one private agency staff completed
the classroom training of Human Trafficking. There were no webinar
offerings for FY2018.
The Human Sex Trafficking six-hour course is offered monthly to CFSA and
private agency staff. CFSA will continue to provide monthly offerings in
FY2018. All new social workers are required to take the Human Trafficking
six-hour classroom training.
The Human Trafficking webinar provided a broad overview of human
trafficking highlighting national trends, legislation, and signs of human
trafficking. The six-hour course helped the participant to:
Recognize the factors and conditions that place children and youth
involved in the child welfare system at heightened risk for commercial
sexual exploitation of children (CSEC).
Understand their role and responsibility in identifying, reporting, and
responding to children and youth who are victims of, or at risk of
becoming victims of CSEC.
Demonstrate best practice approaches in reducing risk of
victimization, engaging children and youth in screening, responding to
CSEC indicators, and partnering to develop trauma-informed and
strengths-based plans to promote safety and empowerment.
Identify a continuum of services to meet the holistic and specialized
needs of children and youth who have experienced CSEC.
Describe strategies for cross-agency collaboration to address these
needs in a trauma-informed way that promotes safety and resilience.
Page 54 of 176
In FY2017, CFSA partnered with Tina Frundt of Courtney’s House to provide
a two-hour and three-hour general human trafficking training to staff and a
Child Protective Services-specific human trafficking training entitled
“Improving Services for Victimized Children”. Overall, 124 CFSA and
private agency staff completed these specialized trainings.
Ms. Frundt’s training emphasized the following:
• an understanding of the signs of human sex trafficking in female, male,
and transgender youth;
• an awareness of engagement techniques to use with this population when
human sex trafficking is suspected; and
• an understanding of the service referral process for human sex trafficking
victims.
These sessions also incorporated information from the Human Sex Trafficking
survivor’s perspective. CFSA will continue its contractual partnership with
Ms. Frundt of Courtney’s House for Human Sex Training offerings in
FY2018.
In FY2018, the Child Welfare Training Academy will present a human
trafficking session focused on providing social workers and staff with
information directly from youth about how to engage in conversations around
sex and labor trafficking and maintaining safety.
i. Describe how the Agency is coordinating with law enforcement and child
welfare agencies in other jurisdictions when youth in foster care are
suspected to be trafficked outside of the District. CFSA works regularly
with MPD’s Youth Division and the detectives assigned to the FBI Child
Exploitation Task Force.
28. Provide an update on the placement options CFSA currently has to house youth
who have been identified as or are at-risk of being trafficked.
a. How many of these placements currently exist and what is the capacity of
each existing placement? As of January 31, 2018, CFSA has five
Specialized Opportunities for Youth (SOY) foster parents who have
completed the CWTA human sex trafficking training and are available for
placement. The placement capacity for these SOY homes is five youth.
Currently, we have four foster youth placed with these SOY parents, leaving
one current vacancy.
Page 55 of 176
b. What plans does CFSA have to increase placement options?
In FY2018, CFSA expects to add three additional SOY homes, specifically
trained and available for youth who have been sex trafficked, bringing our
total capacity to eight homes.
c. Provide an update on CFSA’s Placement Administration’s efforts to
identify resource families with special training as placement options for
youth who have been identified or are at-risk of being trafficked.
The CWTA human/sex trafficking training sessions are offered to all licensed
foster parents (CFSA and NCCF) to support specialized training in caring for
youth who have been identified or are at-risk of being trafficked.
d. How are the placement options prepared to handle the needs of this
population? CFSA’s SOY parents receive additional training to support our
high-end clinical youth. CWTA human/sex trafficking and sex trafficking
training is provided to ensure that the SOY parents are prepared to support the
needs of the youth.
29. How many children and youth under the care or supervision of the state has CFSA
identified as being sex trafficked or at-risk of sex trafficked? What efforts are CFSA
making to prevent youth under the care or supervision of the state (including in
foster care) from being sex trafficked or commercially and sexually exploited?
See response to questions 30 and 31.
30. Has CFSA contracted with any community-based service providers to offer services
to survivors of child sex trafficking and children at risk of being sex trafficked?
Please identify the providers that CFSA has and plans to contract with as well as the
services they offer. What locally-based services can CFSA provide to parents,
guardians and caregivers who want assistance addressing a child’s risk for sex-
trafficking?
CFSA has contracted with Courtney’s House to provide parent support groups for
parents, guardians, and caregivers who want assistance addressing a child’s risk for sex-
trafficking. These groups are an opportunity for parents/caregivers to express their
concerns, learn more about how to support a young person who is at risk, and get support
from others in a similar situation.
FY2017 63
FY2018 32
Page 56 of 176
31. Provide an update on how CFSA collaborated with DCPS and DCPCS to raise
awareness of the signs and risk factors of the commercial sexual exploitation of
students?
The Child Welfare Training Academy (CWTA) provides in-person training sessions to
the District of Columbia Public School System, Office of the State Superintendent of
Education, Department of Human Services, Department of Youth Rehabilitation
Services, and any other youth serving agency that requests training. The online mandated
reporter training is currently in the process of being updated to align with the new in-
person training session.
32. During FY17, how many hotline calls did CFSA receive concerning allegations of
the commercial sexual exploitation of a child by someone who is not the child’s
parent, guardian, or legal custodian? FY18 to date? Provide the outcome of these
calls and their corresponding referrals.
See response to questions 27b and 27c.
FY2017
o Allegation of Sexual exploitation of a child by a non-caregiver= 45
o Allegation Findings and Outcome
- Inconclusive= four
- Substantiated= six (three referrals had an open foster care case; the
other three referrals were closed and community support identified for
youth and family)
- Unfounded= 24 (two referrals had an open case with foster care and
three referrals had an open case with in-home)
- No Finding= 11 (one referral had an open case with foster care, four
referrals were screened out, the rest were incomplete due to being “out
of jurisdiction”, waiting for a determination by law enforcement or
forwarded to a RED Team)
Page 57 of 176
FY2018
o Allegation of Sexual exploitation of a child by a non-caregiver= 25
o Allegation Findings and Outcome
- Inconclusive= three (one referral had an open foster care case)
- Substantiated= six (in four referrals the youth was unable to locate or
moved out of jurisdiction, the other two cases were either already
connected or referred for community services)
- Unfounded= seven (one referral had an open foster care case)
- No Finding= nine (one referral had an open foster care case, two
referrals had an open case with in-home, three referrals remain open
and the remainder were incomplete due to being “out of jurisdiction”,
waiting for a determination by law enforcement or forwarded to a
RED Team)
33. What resources does CFSA need in order to meet the case management needs of
children who have been allegedly commercially sexually exploited by people who are
not their parents, guardians, or legal custodians?
In order to meet the case management needs of children who have been allegedly
commercially exploited, CFSA will need the following:
Housing options for youth who are victims of sex trafficking
Substance abuse services
24 hr. Crisis Response Team
34. CFSA has implemented a Multi-Disciplinary Team to review cases that have a
trafficking component. Please explain the purpose this Team’s meetings, what is
discussed, what is the goal, who attends the meetings, and any outcomes from these
meetings? What is CFSA doing to comply with confidentiality mandates for DYRS
and CFSA youth?
CFSA has an administrative issuance (AI) on trafficking which address protocols for how
to handle cases where there is evidence of sex trafficking. Internal case reviews are
conducted with the social worker, supervisory social worker, program manager, nurse
care manager, trauma coach/assigned clinical services staff, placement (as applicable),
foster parent or caregiver (as appropriate), AAG and GAL. The purpose of the case
review is to develop a safety plan in collaboration with community resources (if
assigned) and the parent (if appropriate). CFSA is also a member of the CSEC case
review that takes place monthly at Safe Shores, the DC Children’s Advocacy Center.
Page 58 of 176
The other agencies that attend the CSEC case review are OAG, MPD, DBH, Court Social
Services (probation and the Child Guidance Clinic), DYRS, Children’s National Medical
Center’s Child and Adolescent Protection Center and Safe Shores. Information is shared
with agencies pursuant to existing MOAs and statutory guidelines.
35. Please describe the involvement that CFSA will have in the DC Superior Court’s
HOPE Court. What resources does CFSA need in order to effectively implement its
role in HOPE Court?
CFSA started attending HOPE court for juvenile cases the week of January 29, 2018, and
is awaiting the date when HOPE court will start hearing neglect cases. Currently, CFSA
does not need any additional resources and will utilize current resources to continue to
implement its role in HOPE Court with ongoing case management duties.
36. Please list all memoranda of understanding (MOU) entered into by CFSA during
FY17 and FY18 to date concerning the sharing of personal information of children
who have been allegedly commercially sexually exploited, as well as any memoranda
of understanding currently in force. For each, indicate the date entered and the
termination date.
There were no memoranda of understandings (MOUs) entered into by CFSA in FY2017
and FY2018 concerning the sharing of personalized information of children who have
been allegedly commercially sexually exploited.
The DC MOU on Child Sexual Abuse Investigation, Prosecution, and Prevention,
updated on May 2011 and still in effect, covers the sharing of information within the
Multidisciplinary Team (MDT) participants. Information about children who have been
allegedly commercially sexually exploited is discussed in this forum.
Specific Programs and Services
37. Please provide an update on CFSA’s Four Pillars initiative and the most up-to-date
outcome data in each category (front door, temporary safe haven, well-being, and
exit to permanence).
See Attachment Q37, Four Pillars Scorecard
Page 59 of 176
38. Describe the screening, supports, and modifications that CFSA offers parents, legal
guardians, and custodians with disabilities in order to ensure that these adults can
benefit from CFSA’s reunification and family preservation services.
CFSA and the DC Department on Disability Services (DDS) have entered into a joint
venture to meet the needs of families involved with CFSA who have a diagnosis of
intellectual disability and involvement with either Rehabilitation Services Agency or
Developmental Disabilities Administration. The program is Successful Parenting-DC,
which encompasses five Parent Educators/Peer Navigators (PE/PN), who are persons
with disabilities or who care for a family member with disabilities. Successful Parenting
DC provides two services: (1) up to six hours a week of behaviorally-based community
and home-based instruction in parenting and life skills and (2) support using the Peer
Navigation service delivery model for DC parents as they navigate CFSA and DDA and
other systems. Services are provided one-on-one and in the parents’ home or alongside of
them while they carry out day-to-day activities related to parenting and child
wellbeing. Families are identified through a cross match of DDS and CFSA data. In
addition, they are identified by CFSA social workers as families enter CFSA or by
Developmental Disability Administration Care Coordinators once they learn that the
individual is involved with CFSA. Also, some families are identified by the OAG during
their court involvement due to community papering or removal. These efforts all work
toward the goals of family reunion, stabilization, and family preservation.
39. In FY17, CFSA announced that it was going to redesign its Safe and Stable Families
program. Please provide any evaluations or assessments that have been conducted
regarding the effectiveness of individual Safe and Stable Families programs/services
or the Safe and Stable Families initiative as a whole. Please provide an update on
this redesign process and expected outcomes.
See Attachment Q39, Safe and Stable Families Semi-Annual Progress Report
Page 60 of 176
40. For each program under CFSA’s Safe and Stable Families/Title IV-E Waiver
initiative, please provide:
a. The program’s current capacity;
b. The program’s current enrollment;
c. The number of families and the number of children served by each
program in FY17; and
d. The number of families and the number of children served by each
program in FY18 to date.
Services/
Interventions
Provider/Vendor
Capacity
FY2017
# of
families
served
FY2017
# of
children
served
FY2018
# of
families
served
FY2018
# of
children
served
HOMEBUILDERS®
Catholic Charities of
the Progressive Life
Center
24 4113
77 N/A
Project Connect Catholic Charities of
the Progressive Life
Center 96 86
14 197 5 6
Parent Education &
Support Services
Collaborative
Solutions for
Communities
East River Family
Strengthening
Collaborative
100
19
41
17
39
Parent & Adolescent
Support Services
Department of Human
Services (DHS)
70
N/A
68
N/A
25
Family Peer Coaches Department of
Behavioral Health
(DBH)
40
31
79
17
47
Mobile Crisis
Stabilization (MSS)
Catholic Charities
Archdiocese of
Washington 300 715
158
1216
39
Legal Services Neighborhood Legal
Services 100 54 89 24 59
13 HOMEBUILDERS® services were no longer offered to families as of May 30, 2017. 14
Includes families that discharged and were currently enrolled as of October 1, 2017. 15
Number only includes MSS biological families as MSS foster home population captures children only 16
Number only includes MSS biological families as MSS foster home population captures children only
Page 61 of 176
41. The Title IV-E Waiver is set to expire in 2019. Please describe what efforts the
agency is making to assess the effectiveness to IV-E Waiver programming. If the
Title IV-E Waiver is not renewed, how does CFSA plan to continue its critical
community-based prevention work with children and families in the District?
CFSA tracked implementation of its Title IV-E Waiver by monitoring program activity
and using both quantitative and qualitative methods through a partnership with
Coordinated Care Services. In December 2017, evaluation data indicated limited results
from our early strategies, and therefore, the agency realigned strategies in January 2017
to continue implementing this important prevention work through the Safe and Stable
Families Redesign (SSF). This was a six month process during which CFSA planned with
community partners to address the following:
● Increase, target, and coordinate preventive services that improve child safety and
keep families from having to enter the child welfare system.
● Develop a more flexible array of quality services that addresses the primary issues
of families CFSA is serving at home.
● Ensure availability of community-based resources in areas of greatest need in the
city.
● Improve CFSA and partners accountability for forging a tighter safety net that
consistently delivers positive outcomes for families and the community.
As a result of the SSF Redesign, CFSA conducted a comprehensive negotiation with each
Collaborative to focus funding in their FY2018 contracts on specific target populations
and actions—primarily:
● Family Support Workers: Increased number of family support workers at the
Collaboratives to support expanded referrals from CFSA. This includes not only
more referrals of families CFSA is serving but also, for the first time, referrals of
families at risk but not directly involved with CFSA.
● Homelessness: Young families experiencing homelessness, in partnership with
the DC Department of Human Services.
● Grandparent Caregivers: Grandparents participating in the District’s Grandparent
Caregiver Subsidy Program when those “grand-families” have additional needs
for support.
● Neighborhood Targeted Resources: A concentration of Collaborative resources in
the areas of greatest need in our city, Wards 7 and 8. This includes an array of
essential core services to address typical family needs such as funds for
emergencies, referrals to mental health or substance abuse treatment, tutoring for
school-age children, parent support groups, and recreational opportunities.
● Capacity Building: Grants to build the capacity of grassroots family support
programs.
● Data Collection and Reporting: Greater accountability through improved data
collection and reporting that provide a clear picture of outcomes.
The redesigned Safe and Stable Families approach will allow CFSA to continue targeted
prevention and family stabilization activities after the IV-E waiver expires.
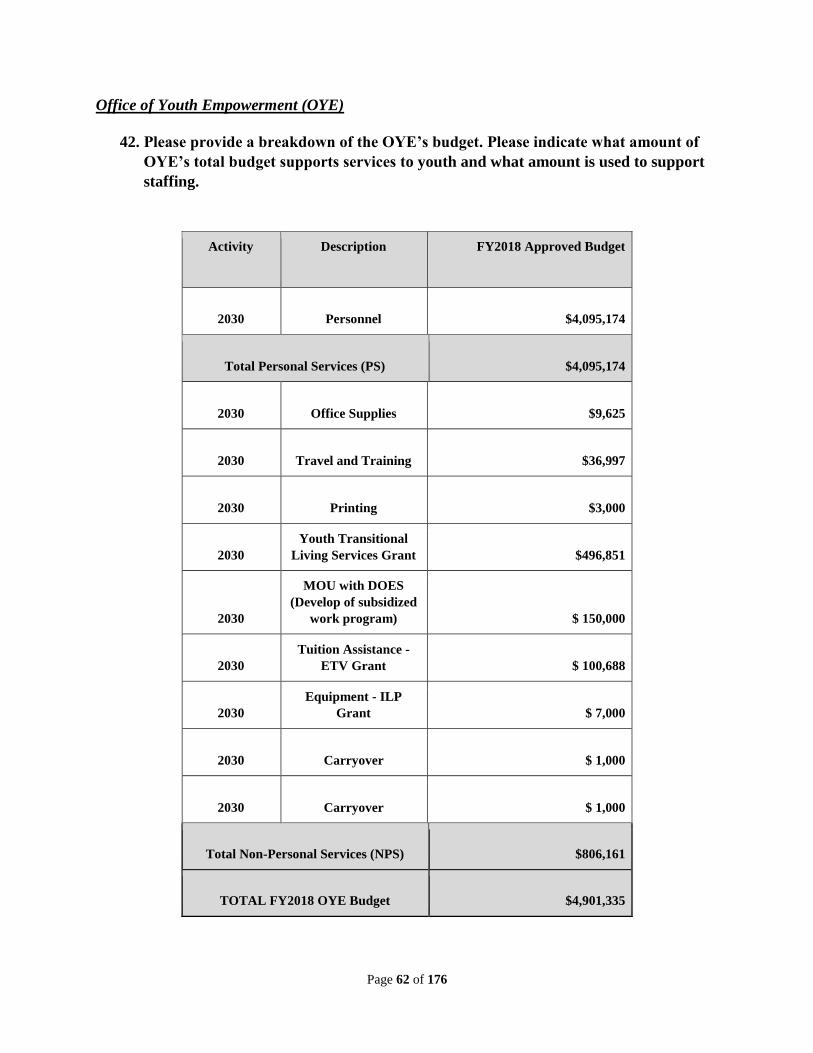
Page 62 of 176
Office of Youth Empowerment (OYE)
42. Please provide a breakdown of the OYE’s budget. Please indicate what amount of
OYE’s total budget supports services to youth and what amount is used to support
staffing.
Activity Description FY2018 Approved Budget
2030 Personnel $4,095,174
Total Personal Services (PS) $4,095,174
2030 Office Supplies $9,625
2030 Travel and Training $36,997
2030 Printing $3,000
2030
Youth Transitional
Living Services Grant $496,851
2030
MOU with DOES
(Develop of subsidized
work program) $ 150,000
2030
Tuition Assistance -
ETV Grant $ 100,688
2030
Equipment - ILP
Grant $ 7,000
2030 Carryover $ 1,000
2030 Carryover $ 1,000
Total Non-Personal Services (NPS) $806,161
TOTAL FY2018 OYE Budget $4,901,335
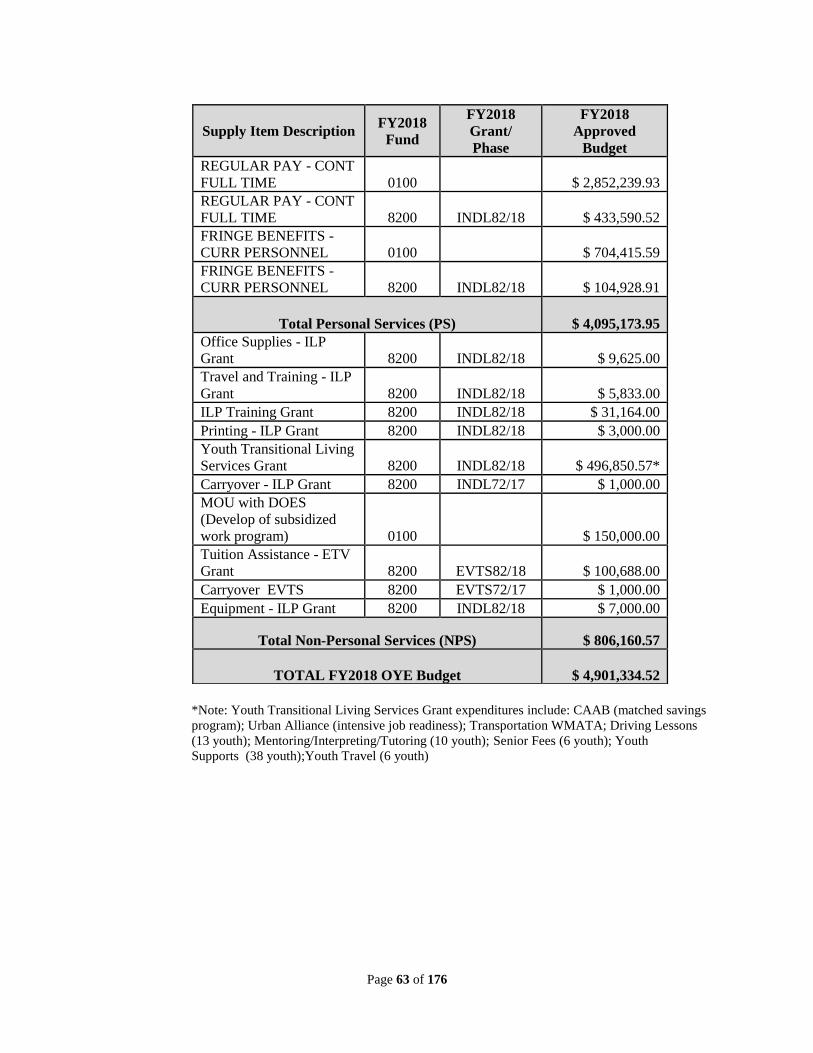
Page 63 of 176
*Note: Youth Transitional Living Services Grant expenditures include: CAAB (matched savings
program); Urban Alliance (intensive job readiness); Transportation WMATA; Driving Lessons
(13 youth); Mentoring/Interpreting/Tutoring (10 youth); Senior Fees (6 youth); Youth
Supports (38 youth);Youth Travel (6 youth)
Supply Item Description FY2018
Fund
FY2018
Grant/
Phase
FY2018
Approved
Budget
REGULAR PAY - CONT
FULL TIME 0100 $ 2,852,239.93
REGULAR PAY - CONT
FULL TIME 8200 INDL82/18 $ 433,590.52
FRINGE BENEFITS -
CURR PERSONNEL 0100 $ 704,415.59
FRINGE BENEFITS -
CURR PERSONNEL 8200 INDL82/18 $ 104,928.91
Total Personal Services (PS) $ 4,095,173.95
Office Supplies - ILP
Grant 8200 INDL82/18 $ 9,625.00
Travel and Training - ILP
Grant 8200 INDL82/18 $ 5,833.00
ILP Training Grant 8200 INDL82/18 $ 31,164.00
Printing - ILP Grant 8200 INDL82/18 $ 3,000.00
Youth Transitional Living
Services Grant 8200 INDL82/18 $ 496,850.57*
Carryover - ILP Grant 8200 INDL72/17 $ 1,000.00
MOU with DOES
(Develop of subsidized
work program) 0100 $ 150,000.00
Tuition Assistance - ETV
Grant 8200 EVTS82/18 $ 100,688.00
Carryover EVTS 8200 EVTS72/17 $ 1,000.00
Equipment - ILP Grant 8200 INDL82/18 $ 7,000.00
Total Non-Personal Services (NPS) $ 806,160.57
TOTAL FY2018 OYE Budget $ 4,901,334.52
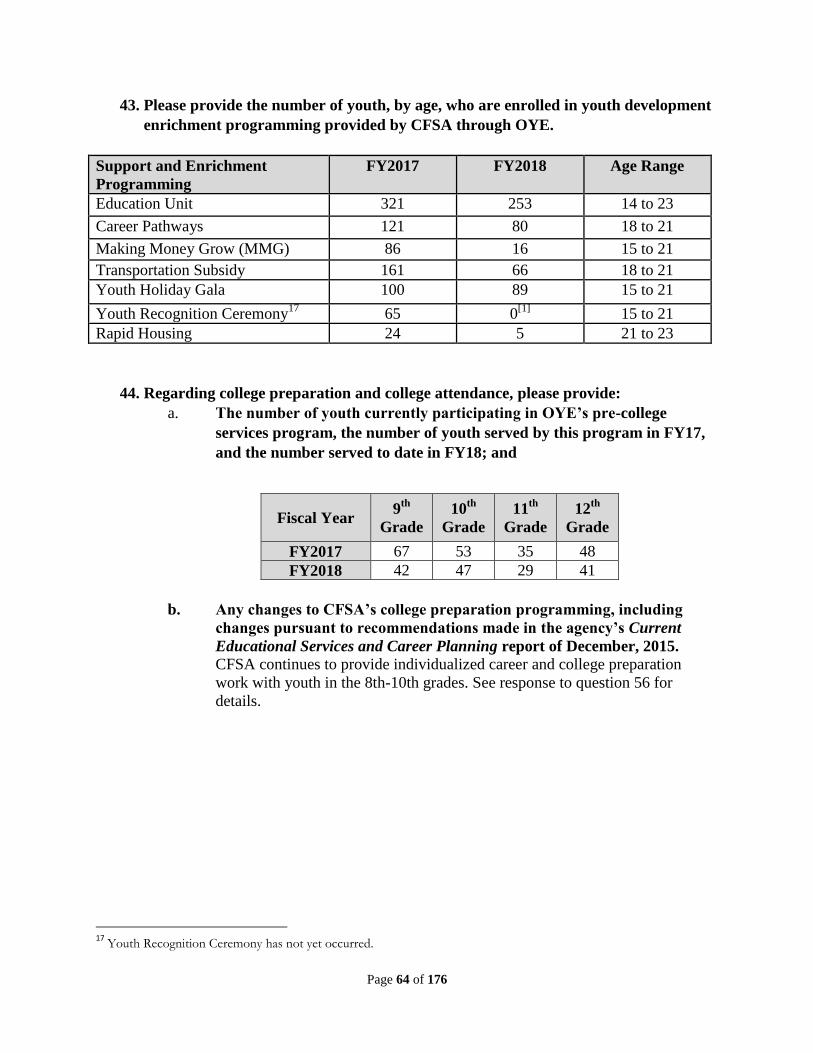
Page 64 of 176
43. Please provide the number of youth, by age, who are enrolled in youth development
enrichment programming provided by CFSA through OYE.
Support and Enrichment
Programming
FY2017 FY2018 Age Range
Education Unit 321 253 14 to 23
Career Pathways 121 80 18 to 21
Making Money Grow (MMG) 86 16 15 to 21
Transportation Subsidy 161 66 18 to 21
Youth Holiday Gala 100 89 15 to 21
Youth Recognition Ceremony17
65 0[1]
15 to 21
Rapid Housing 24 5 21 to 23
44. Regarding college preparation and college attendance, please provide:
a. The number of youth currently participating in OYE’s pre-college
services program, the number of youth served by this program in FY17,
and the number served to date in FY18; and
Fiscal Year 9
th
Grade
10th
Grade
11th
Grade
12th
Grade
FY2017 67 53 35 48
FY2018 42 47 29 41
b. Any changes to CFSA’s college preparation programming, including
changes pursuant to recommendations made in the agency’s Current
Educational Services and Career Planning report of December, 2015.
CFSA continues to provide individualized career and college preparation
work with youth in the 8th-10th grades. See response to question 56 for
details.
17
Youth Recognition Ceremony has not yet occurred.
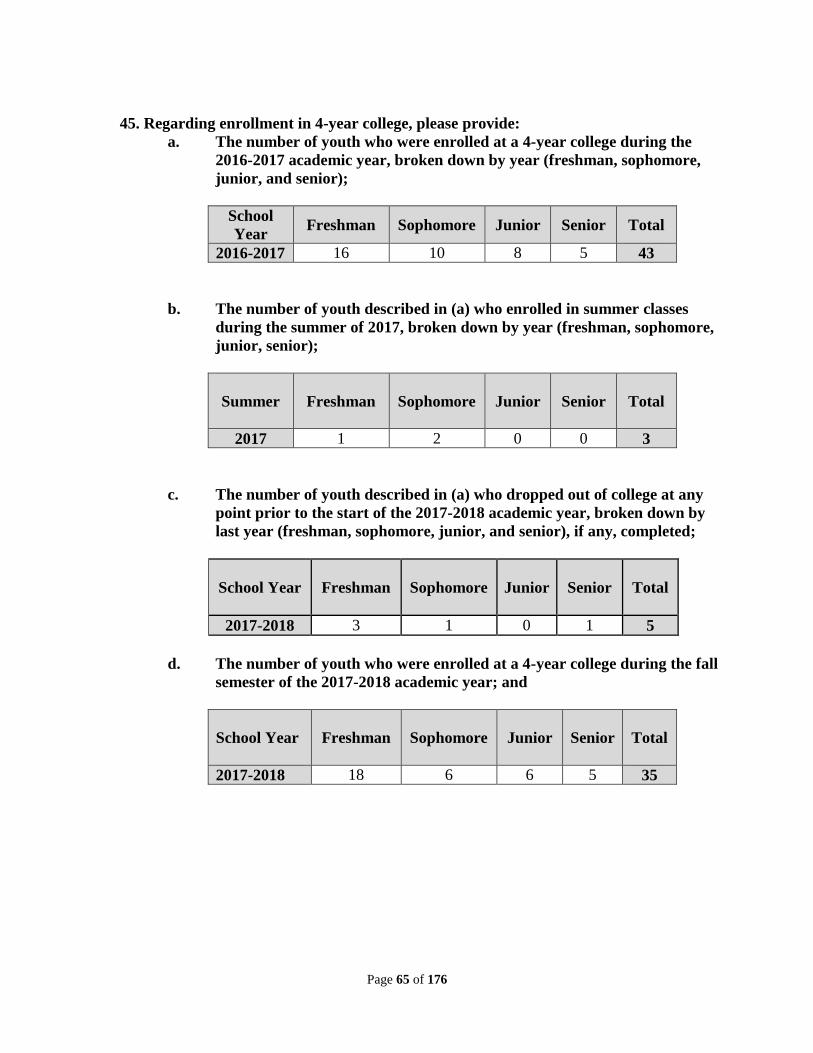
Page 65 of 176
45. Regarding enrollment in 4-year college, please provide:
a. The number of youth who were enrolled at a 4-year college during the
2016-2017 academic year, broken down by year (freshman, sophomore,
junior, and senior);
School
Year Freshman Sophomore Junior Senior Total
2016-2017 16 10 8 5 43
b. The number of youth described in (a) who enrolled in summer classes
during the summer of 2017, broken down by year (freshman, sophomore,
junior, senior);
Summer
Freshman Sophomore Junior Senior Total
2017 1 2 0 0 3
c. The number of youth described in (a) who dropped out of college at any
point prior to the start of the 2017-2018 academic year, broken down by
last year (freshman, sophomore, junior, and senior), if any, completed;
School Year
Freshman Sophomore Junior Senior Total
2017-2018 3 1 0 1 5
d. The number of youth who were enrolled at a 4-year college during the fall
semester of the 2017-2018 academic year; and
School Year
Freshman Sophomore Junior Senior Total
2017-2018 18 6 6 5 35
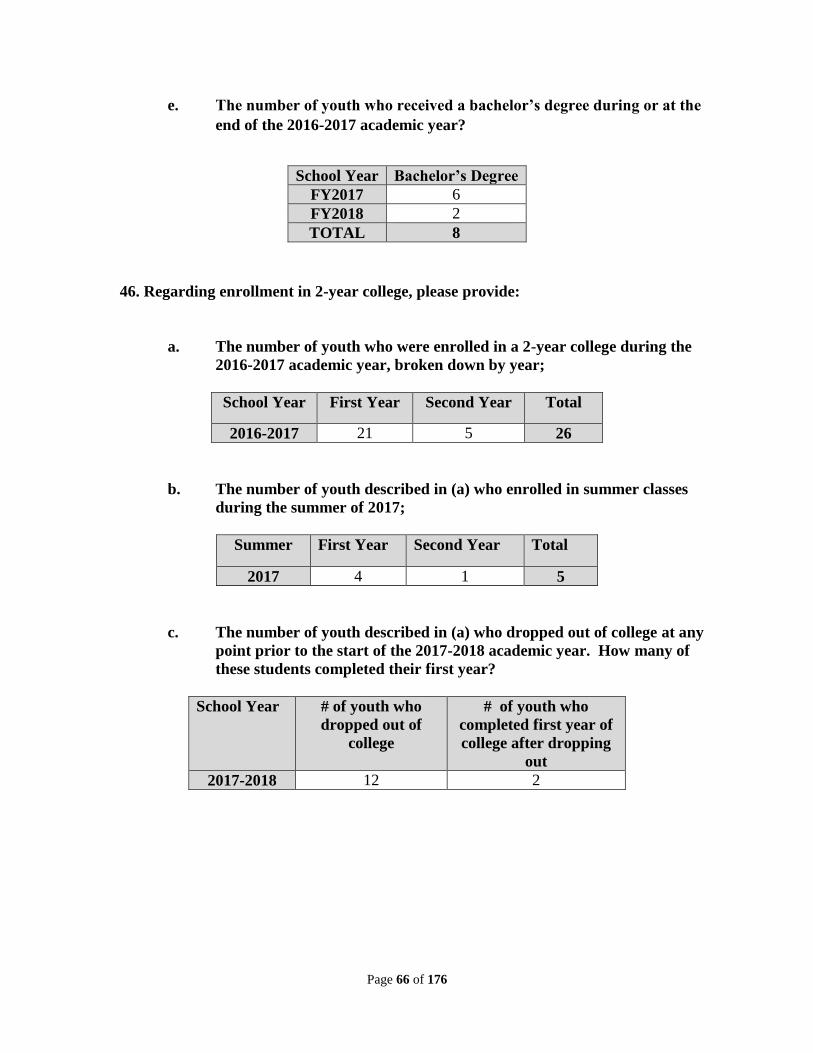
Page 66 of 176
e. The number of youth who received a bachelor’s degree during or at the
end of the 2016-2017 academic year?
School Year Bachelor’s Degree
FY2017 6
FY2018 2
TOTAL 8
46. Regarding enrollment in 2-year college, please provide:
a. The number of youth who were enrolled in a 2-year college during the
2016-2017 academic year, broken down by year;
School Year First Year Second Year Total
2016-2017 21 5 26
b. The number of youth described in (a) who enrolled in summer classes
during the summer of 2017;
Summer First Year Second Year Total
2017 4 1 5
c. The number of youth described in (a) who dropped out of college at any
point prior to the start of the 2017-2018 academic year. How many of
these students completed their first year?
School Year # of youth who
dropped out of
college
# of youth who
completed first year of
college after dropping
out
2017-2018 12 2
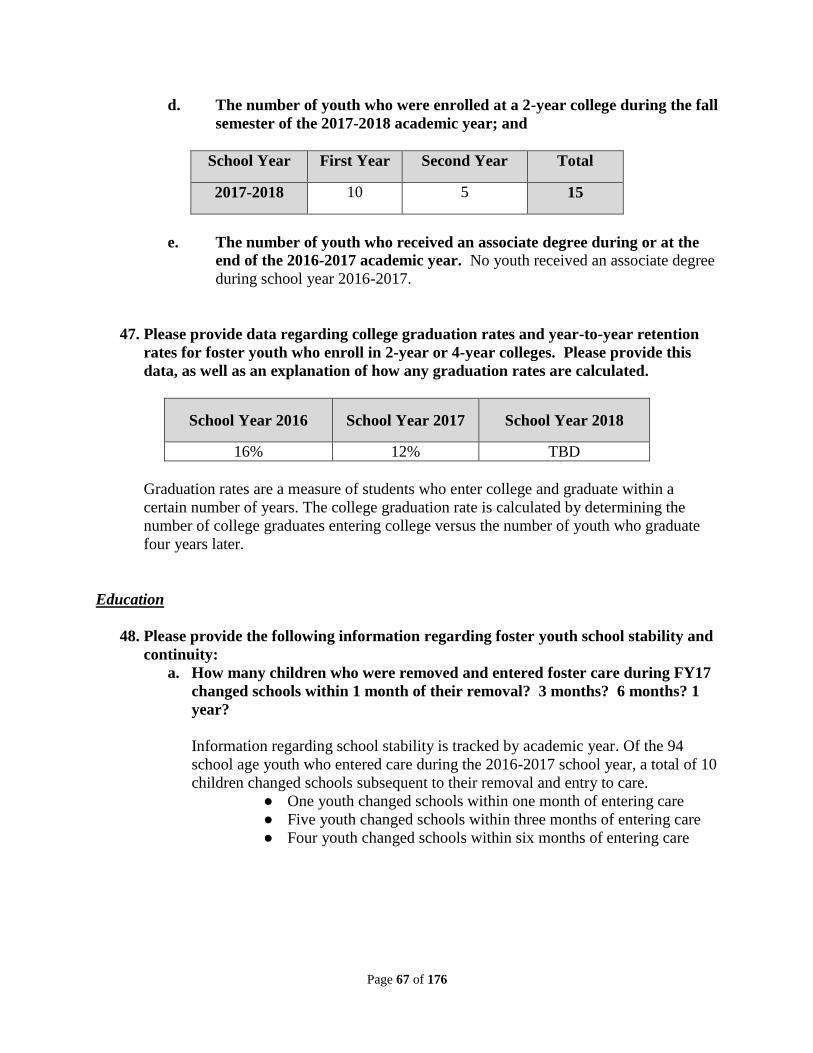
Page 67 of 176
d. The number of youth who were enrolled at a 2-year college during the fall
semester of the 2017-2018 academic year; and
School Year First Year Second Year Total
2017-2018 10 5 15
e. The number of youth who received an associate degree during or at the
end of the 2016-2017 academic year. No youth received an associate degree
during school year 2016-2017.
47. Please provide data regarding college graduation rates and year-to-year retention
rates for foster youth who enroll in 2-year or 4-year colleges. Please provide this
data, as well as an explanation of how any graduation rates are calculated.
School Year 2016 School Year 2017 School Year 2018
16% 12% TBD
Graduation rates are a measure of students who enter college and graduate within a
certain number of years. The college graduation rate is calculated by determining the
number of college graduates entering college versus the number of youth who graduate
four years later.
Education
48. Please provide the following information regarding foster youth school stability and
continuity:
a. How many children who were removed and entered foster care during FY17
changed schools within 1 month of their removal? 3 months? 6 months? 1
year?
Information regarding school stability is tracked by academic year. Of the 94
school age youth who entered care during the 2016-2017 school year, a total of 10
children changed schools subsequent to their removal and entry to care.
● One youth changed schools within one month of entering care
● Five youth changed schools within three months of entering care
● Four youth changed schools within six months of entering care
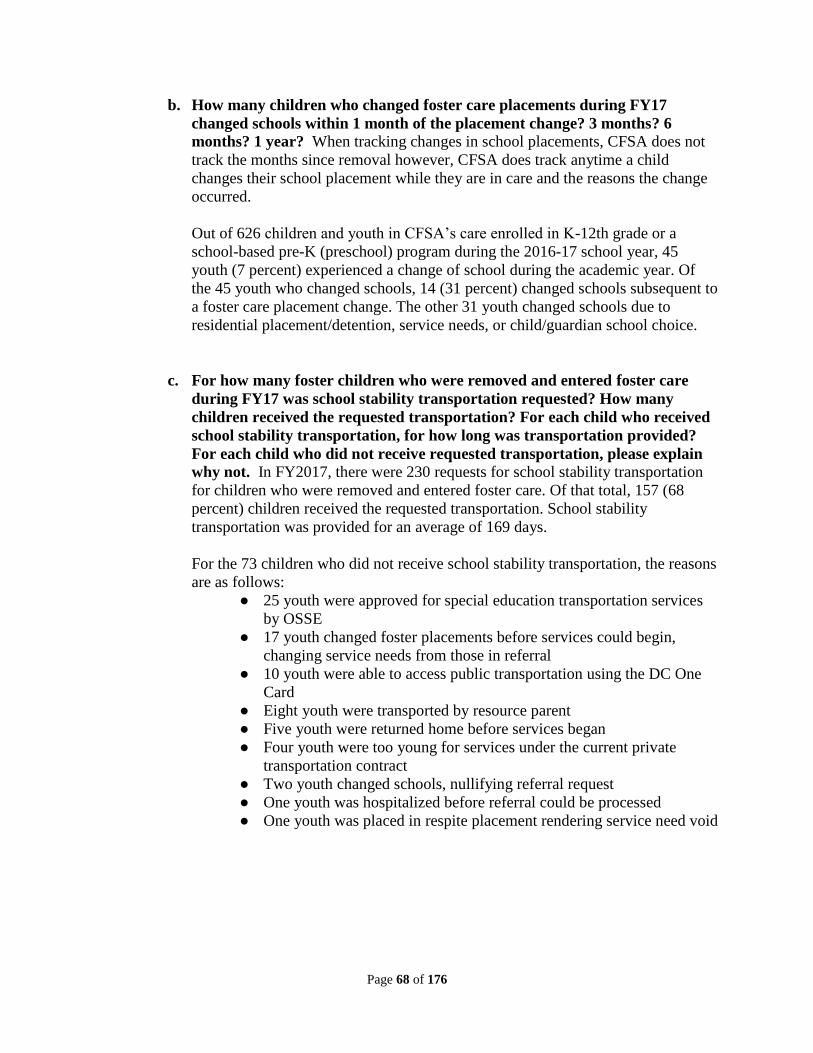
Page 68 of 176
b. How many children who changed foster care placements during FY17
changed schools within 1 month of the placement change? 3 months? 6
months? 1 year? When tracking changes in school placements, CFSA does not
track the months since removal however, CFSA does track anytime a child
changes their school placement while they are in care and the reasons the change
occurred.
Out of 626 children and youth in CFSA’s care enrolled in K-12th grade or a
school-based pre-K (preschool) program during the 2016-17 school year, 45
youth (7 percent) experienced a change of school during the academic year. Of
the 45 youth who changed schools, 14 (31 percent) changed schools subsequent to
a foster care placement change. The other 31 youth changed schools due to
residential placement/detention, service needs, or child/guardian school choice.
c. For how many foster children who were removed and entered foster care
during FY17 was school stability transportation requested? How many
children received the requested transportation? For each child who received
school stability transportation, for how long was transportation provided?
For each child who did not receive requested transportation, please explain
why not. In FY2017, there were 230 requests for school stability transportation
for children who were removed and entered foster care. Of that total, 157 (68
percent) children received the requested transportation. School stability
transportation was provided for an average of 169 days.
For the 73 children who did not receive school stability transportation, the reasons
are as follows:
● 25 youth were approved for special education transportation services
by OSSE
● 17 youth changed foster placements before services could begin,
changing service needs from those in referral
● 10 youth were able to access public transportation using the DC One
Card
● Eight youth were transported by resource parent
● Five youth were returned home before services began
● Four youth were too young for services under the current private
transportation contract
● Two youth changed schools, nullifying referral request
● One youth was hospitalized before referral could be processed
● One youth was placed in respite placement rendering service need void
Page 69 of 176
d. How does the Agency inform foster parents and other stakeholders of the
availability of school stability transportation? CFSA’s Office of Well Being
(OWB) provides presentations and updates to foster parents and other
stakeholders on a full range of supportive services to support school stability,
including transportation. In August 2017, the OWB included information about
school stability transportation services in a presentation to both CFSA and private
agency foster parents at CFSA’s annual Health and Wellness Fair. In October
2017, the OWB also gave a presentation to The Children’s Law Center staff on
CFSA’s educational services, including transportation services. In addition, CFSA
created a school transportation tip sheet that reviews the specific criteria to qualify
for and receive school stability transportation which is posted on the CFSA
website.
CFSA continues its outreach to individual foster families about transportation
services upon a new entry into care. If school stability is an issue, a CFSA
transportation specialist is notified. The specialist contacts the social worker and
foster family to see if transportation services are needed to maintain the child’s
school stability.
Similarly, upon receipt of a referral from a social worker for transportation in
ongoing cases, the transportation specialist contacts both the social worker and
foster parent(s) to review and discuss all available transportation options a child
has to get safely to and from school while maintaining school stability.
e. How does the Agency train CFSA social workers regarding the availability of
school stability transportation? How does it train private agency social
workers regarding this topic? In addition to the individual case outreach to
social workers regarding school stability transportation services, OWB advertises
school transportation and other educational support services at several agency-
wide resource fairs which are open to CFSA and private agency social workers.
The agency has also created Education Tip Sheets and FAQs including one
specifically on the School Stability and School Transportation Services provided
by the agency. These tip sheets have been distributed at trainings and staff
meetings and are accessible on the Education and Child Care Resources page on
CFSA’s website at http://cfsa.dc.gov/page/educationresources.
Page 70 of 176
f. Describe the agency’s efforts in FY17 and FY18 to date, to improve school
stability and continuity for youth who enter foster care or change foster care
placements while in care. In FY2017, CFSA continued to demonstrate a firm
commitment to improve school stability and continuity for youth in care and
custody. We have continued to work with OSSE and the local education agencies
to implement new provisions of the Every Student Succeeds Act (ESSA) that
support foster youth’s school stability. For example, in August 2017, OWB
education specialists contacted every D.C. school for which the agency did not
have an identified foster care point of contact (POC) and asked for a contact to be
named. This enabled CFSA to start the school year with an established point of
contact at each school if the agency needs to address any issues related to a foster
youth’s school experience. CFSA has developed Memoranda of Understanding
(MOUs) with local educational agencies (LEAs) to develop school stability
transportation procedures that ensure a collaborative approach to planning and
funding transportation for foster youth to maintain school stability.
CFSA is also updating the Educational Services policy to align with the foster
care school stability provisions of the ESSA. This policy will clarify guidance on
when and how best interest determinations should be made; and it will ensure the
final determinations are documented, shared with all relevant parties, and
reviewed to determine if updates are needed.
49. Provide an update on CFSA’s efforts to gather aggregate data regarding the
academic performance of the foster youth population.
CFSA negotiated agreements with the Office of the State Superintendent (OSSE) and
Prince George’s County Public Schools (PGPCS) to access the standardized test scores of
all District foster youth attending DC Public Schools (DCPS), Public Charter Schools
(DCPCS) and PGPCS who are required to take standardized tests. The scores provide an
indicator of each youth’s reading and math proficiency levels.
a. Please provide any aggregate data the agency has available regarding the
percentage of children in foster care who are at, above, or below grade level
in math. The following chart provides a breakdown of the standardized test
scores from school year 2016-2017 provided to CFSA by Prince George’s County
Public Schools and the Office of the State Superintendent for Education.
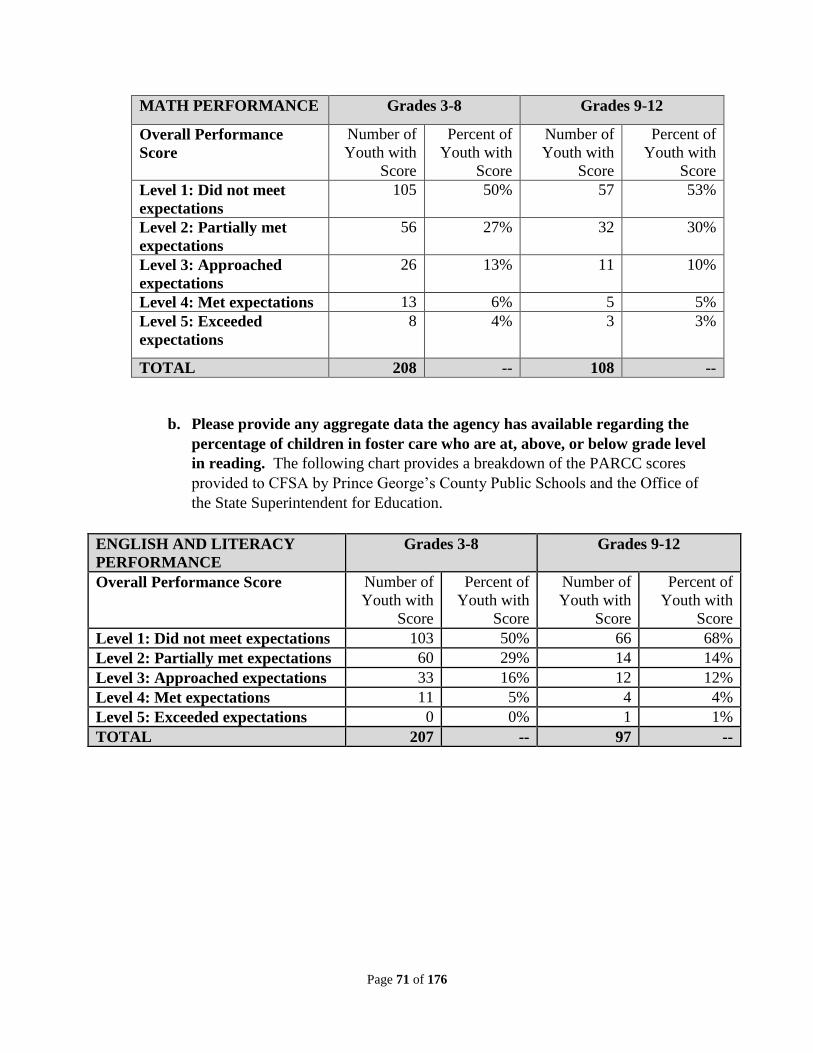
Page 71 of 176
MATH PERFORMANCE Grades 3-8 Grades 9-12
Overall Performance
Score
Number of
Youth with
Score
Percent of
Youth with
Score
Number of
Youth with
Score
Percent of
Youth with
Score
Level 1: Did not meet
expectations
105 50% 57 53%
Level 2: Partially met
expectations
56 27% 32 30%
Level 3: Approached
expectations
26 13% 11 10%
Level 4: Met expectations 13 6% 5 5%
Level 5: Exceeded
expectations
8 4% 3 3%
TOTAL 208 -- 108 --
b. Please provide any aggregate data the agency has available regarding the
percentage of children in foster care who are at, above, or below grade level
in reading. The following chart provides a breakdown of the PARCC scores
provided to CFSA by Prince George’s County Public Schools and the Office of
the State Superintendent for Education.
ENGLISH AND LITERACY
PERFORMANCE
Grades 3-8 Grades 9-12
Overall Performance Score Number of
Youth with
Score
Percent of
Youth with
Score
Number of
Youth with
Score
Percent of
Youth with
Score
Level 1: Did not meet expectations 103 50% 66 68%
Level 2: Partially met expectations 60 29% 14 14%
Level 3: Approached expectations 33 16% 12 12%
Level 4: Met expectations 11 5% 4 4%
Level 5: Exceeded expectations 0 0% 1 1%
TOTAL 207 -- 97 --
Page 72 of 176
50. How many youth received tutoring in FY17 and to date in FY18?
FY2017 243
FY2018 165
a. What is the total funding in the FY18 budget for tutoring? Explain any
variance from FY17?
CFSA’s FY2018 tutoring budget is $1,000,000. There is no variance in the budget
from FY2017.
b. Please identify each tutoring provider and the amount allocated in FY18?
Explain any variance from FY17? CFSA has two contracted tutoring providers:
A Plus Success, LLC and Soul Tree, LLC. A Plus Success has been allocated a
total of $635,280 to provide tutoring service through June 2018 compared to its
$482,040 contract amount last year. Soul Tree, LLC has been allocated a total of
$376,032 for its services through June 2018, compared to its contract amount of
$329,880 last year.
The tutoring contract amounts are larger in FY2018 compared to FY2017 to
accommodate the rising number of students the agency has connected to tutoring
services in order to increase their academic skills and performance.
In addition, CFSA also entered into a new contract with Lindamood-Bell, an
internationally renowned literacy program, to provide an intensive summer
literacy program to foster youth performing below grade level in their reading
skills. The contract is for $93,050 to provide each participating student with a
minimum of 120 hours of reading instruction from their Lindamood-Bell certified
instructors.
Page 73 of 176
c. What have been the outcomes of youth in tutoring?
Tutoring Outcomes
CFSA is able to measure a student’s academic progress from in-home tutoring
service by comparing the student’s pre-service assessment diagnostic test results
with the student’s post-service assessment (a re-assessment of the student using
the same diagnostic tool) results. Post-service assessments are generally
administered every six months.
A comparison of the pre-service assessment and post-service assessment for 124
youth who received tutoring services from one of our two tutoring vendors, for six
months to a year during FY2017, revealed the following measures of
improvement in students’ academic skills:
Reading Skills Outcomes after at least six months of tutoring service:
TOTAL = 79%* improved their Reading Skills; 56% improved their reading
by ½ grade or more (see further breakdowns below).
13% have improved their reading by two or more full grade levels
16% have improved their reading by a full grade level to two grade levels
28% have improved their reading by a ½ grade to full grade level
22% have improved their reading by a ½ grade level
Math Skills Outcomes after at least six months of tutoring service:
TOTAL = 77%* improved their Math Skills; 57% improved their Math
skills by ½ grade or more (see further breakdown below).
15% improved their math skills by two or more full grade levels
13% improved their math skills by a full grade level to two grade levels
29% improved their math skills by a ½ grade to full grade level
20% improved their math skills by ½ grade
For children who have received tutoring for a year or more, a second post-service
assessment is given to the youth. For the current monitoring period, CFSA has 44
youth who fall in that category and have received scores which revealed the
following results:
Reading Skills Outcomes after one year, or more, of tutoring service:
TOTAL = 80%* have improved their Reading Skills; 50% have improved
their Reading Skills by full grade or more (see further breakdown below).
20% improved their reading by two or more full grade levels
30% improved their reading by a full grade level to two grade levels
14% improved their reading by a ½ grade to full grade level
16% improved their math skills by ½ grade or less
Page 74 of 176
Math Skills Outcomes after one year, or more, of tutoring service:
TOTAL = 85%* have improved their Math Skills; 46% have improved their
Math Skills by a full grade or more (see further breakdown below).
14% improved their reading by two or more full grade levels
32% improved their reading by a full grade level to two grade levels
30% improved their reading by a ½ grade to full grade level
9% improved their math skills by ½ grade or less
* The percentage of students not identified in each category are those who made
no significant improvements in their post assessments for that particular category.
These youth were identified as ones who were not available to reap the benefits of
tutoring services due to a variety of circumstances, including periods of detention,
hospitalization, or absconding; periods of emotional or placement instability that
interfered with their ability to be available for tutoring service; and/or the youths’
persistent resistance or refusal to make themselves available for the service or
fully cooperate with the post assessment test administration.
Lindamood Bell Program Outcomes:
A total of 12 at-risk youth in grades 3-8 completed CFSA’s Lindamood-Bell
Summer Literacy Program from July 5 – August 1, 2017. Students received an
average of 117 hours of instruction from Lindamood-Bell’s Seeing Stars program,
focused on developing the decoding and phonemic awareness skills necessary for
reading mastery.
To measure program outcomes, each participating student was administered a pre-
test, including a battery of standardized assessments, to determine their
performance levels before instruction began and the same battery of tests as a
post-test upon program completion. Comparison of the participating students’ pre
and post test scores, revealed the following outcomes:
2.5 average grade level improvement in word attack skills
1.6 average grade level improvement in reading accuracy
1.1 average grade level improvement in reading fluency
Page 75 of 176
51. How many youth received mentoring services in FY17 and to date in FY18?
FY2017 132
FY2018 99
a. What is the total funding in the FY18 budget for mentoring? Explain any
variance from FY17? CFSA’s FY2018 mentoring budget is $500,000. There is no
variance in the budget from FY2017.
b. Please identify the each mentoring provider and the amount allocated in
FY18? Explain any variance from FY17? Best Kids, Inc. is CFSA’s mentoring
provider. The mentoring service contract is $500,000. There is no variance from FY2017.
c. What have been the outcomes of youth in mentoring?
FY2017 mentoring outcomes
● Cognitive Functioning:
▪ 87 percent of surveyed youth increased their scholastic competence and
educational expectations.
▪ 85 percent of surveyed youth increased their grades.
● Emotional/Behavioral Functioning:
▪ 97 percent of surveyed caregivers report youth increased their feelings of
empowerment.
▪ 82 percent of surveyed caregivers report youth increased their self-esteem
and self-expectations.
● Social Functioning:
▪ 82 percent of surveyed youth report increased feelings of parental trust.
▪ 86 percent of surveyed youth report increased social acceptance and
relationships with their peers.
● Risky Behaviors:
▪ 88 percent of surveyed youth report increased feelings of risk avoidance.
● Involvement of caregiver: The caregiver has an intricate role in the mentoring
relationship they provide support and encouragement to the youth as well as
insight to the mentor with regards to issues and behaviors.
Page 76 of 176
FY2018 mentoring outcomes
● Cognitive Functioning:
▪ 100 percent of surveyed youth increased their scholastic competence and
educational expectations.
▪ 84 percent of surveyed youth increased their grades.
● Emotional/Behavioral Functioning:
▪ 100 percent of surveyed caregivers report youth increased their feelings of
empowerment.
▪ 83 percent of surveyed caregivers report youth increased their self-esteem
and self-expectations.
● Social Functioning:
▪ 100 percent of surveyed youth report increased feelings of parental trust.
▪ 86 percent of surveyed youth report increased social acceptance and
relationships with their peers.
● Risky Behaviors:
▪ 89 percent of surveyed youth report increased feelings of risk avoidance.
● Involvement of caregiver: The caregiver has an intricate role in the mentoring
relationship they provide support and encouragement to the youth as well as
insight to the mentor with regards to issues and behaviors. As a result,
participation rates for children 12 and under increased and remained
consistent.
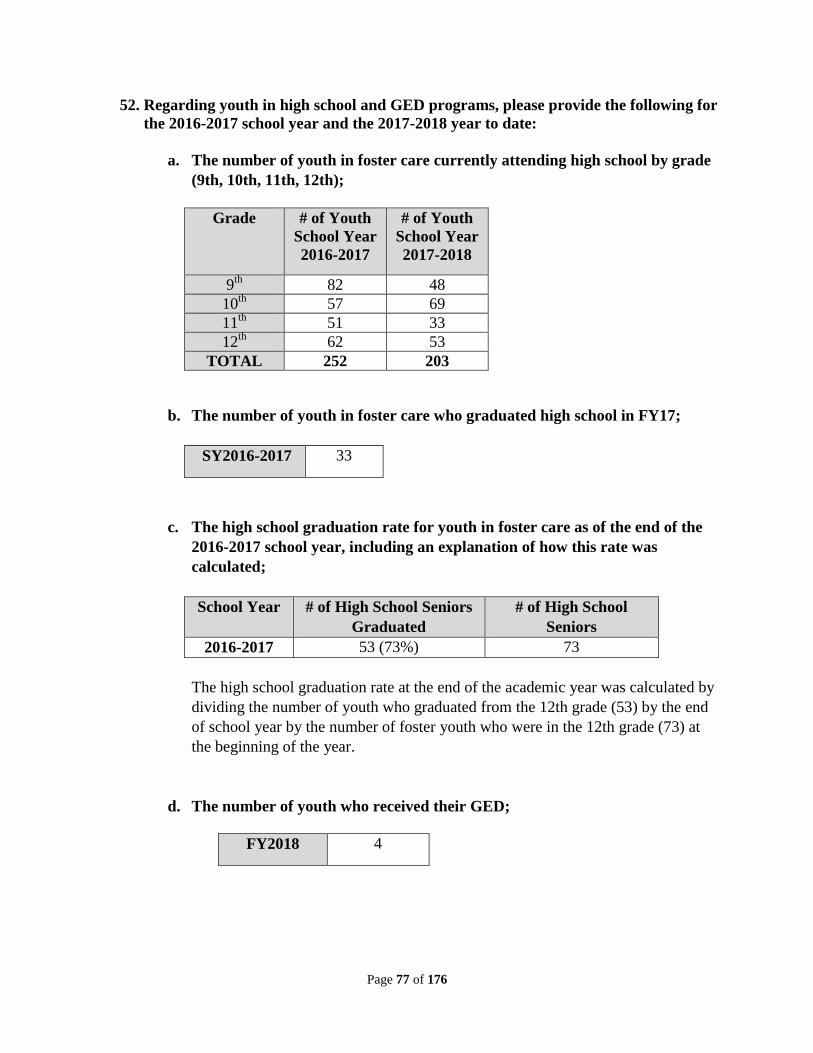
Page 77 of 176
52. Regarding youth in high school and GED programs, please provide the following for
the 2016-2017 school year and the 2017-2018 year to date:
a. The number of youth in foster care currently attending high school by grade
(9th, 10th, 11th, 12th);
Grade # of Youth
School Year
2016-2017
# of Youth
School Year
2017-2018
9th
82 48
10th
57 69
11th
51 33
12th
62 53
TOTAL 252 203
b. The number of youth in foster care who graduated high school in FY17;
SY2016-2017 33
c. The high school graduation rate for youth in foster care as of the end of the
2016-2017 school year, including an explanation of how this rate was
calculated;
School Year # of High School Seniors
Graduated
# of High School
Seniors
2016-2017 53 (73%) 73
The high school graduation rate at the end of the academic year was calculated by
dividing the number of youth who graduated from the 12th grade (53) by the end
of school year by the number of foster youth who were in the 12th grade (73) at
the beginning of the year.
d. The number of youth who received their GED;
FY2018 4
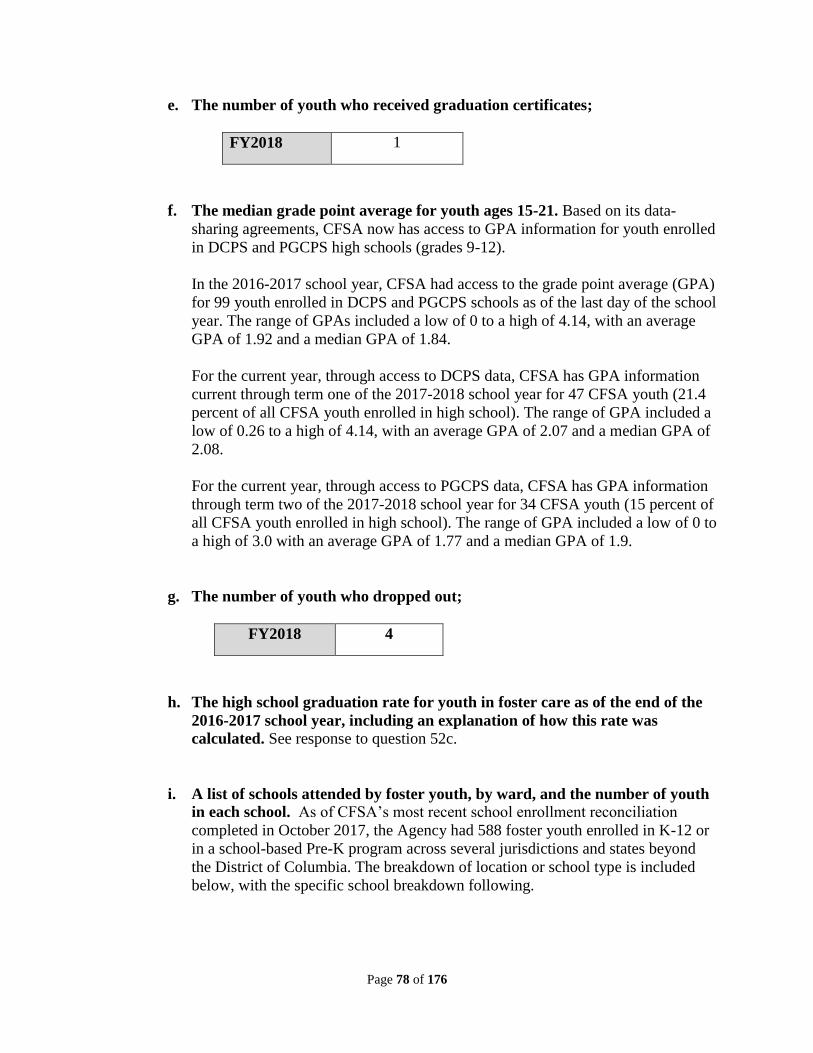
Page 78 of 176
e. The number of youth who received graduation certificates;
FY2018 1
f. The median grade point average for youth ages 15-21. Based on its data-
sharing agreements, CFSA now has access to GPA information for youth enrolled
in DCPS and PGCPS high schools (grades 9-12).
In the 2016-2017 school year, CFSA had access to the grade point average (GPA)
for 99 youth enrolled in DCPS and PGCPS schools as of the last day of the school
year. The range of GPAs included a low of 0 to a high of 4.14, with an average
GPA of 1.92 and a median GPA of 1.84.
For the current year, through access to DCPS data, CFSA has GPA information
current through term one of the 2017-2018 school year for 47 CFSA youth (21.4
percent of all CFSA youth enrolled in high school). The range of GPA included a
low of 0.26 to a high of 4.14, with an average GPA of 2.07 and a median GPA of
2.08.
For the current year, through access to PGCPS data, CFSA has GPA information
through term two of the 2017-2018 school year for 34 CFSA youth (15 percent of
all CFSA youth enrolled in high school). The range of GPA included a low of 0 to
a high of 3.0 with an average GPA of 1.77 and a median GPA of 1.9.
g. The number of youth who dropped out;
FY2018 4
h. The high school graduation rate for youth in foster care as of the end of the
2016-2017 school year, including an explanation of how this rate was
calculated. See response to question 52c.
i. A list of schools attended by foster youth, by ward, and the number of youth
in each school. As of CFSA’s most recent school enrollment reconciliation
completed in October 2017, the Agency had 588 foster youth enrolled in K-12 or
in a school-based Pre-K program across several jurisdictions and states beyond
the District of Columbia. The breakdown of location or school type is included
below, with the specific school breakdown following.
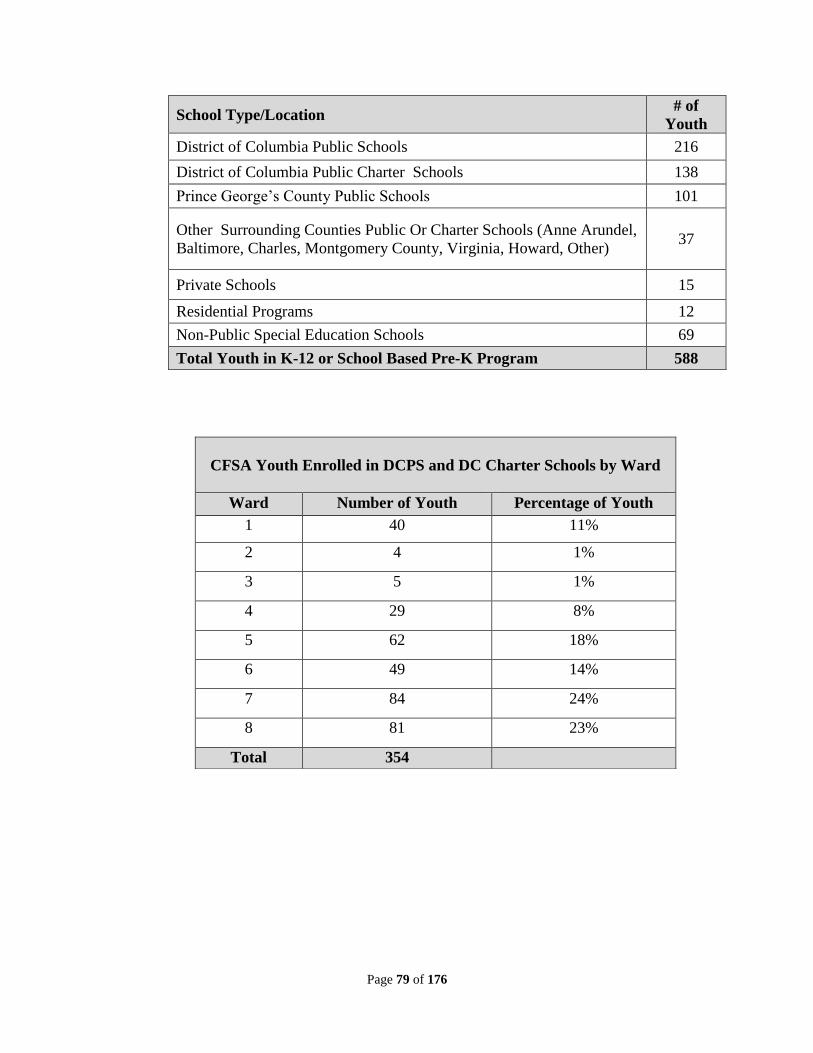
Page 79 of 176
School Type/Location # of
Youth
District of Columbia Public Schools 216
District of Columbia Public Charter Schools 138
Prince George’s County Public Schools 101
Other Surrounding Counties Public Or Charter Schools (Anne Arundel,
Baltimore, Charles, Montgomery County, Virginia, Howard, Other) 37
Private Schools 15
Residential Programs 12
Non-Public Special Education Schools 69
Total Youth in K-12 or School Based Pre-K Program 588
CFSA Youth Enrolled in DCPS and DC Charter Schools by Ward
Ward Number of Youth Percentage of Youth
1 40 11%
2 4 1%
3 5 1%
4 29 8%
5 62 18%
6 49 14%
7 84 24%
8 81 23%
Total 354
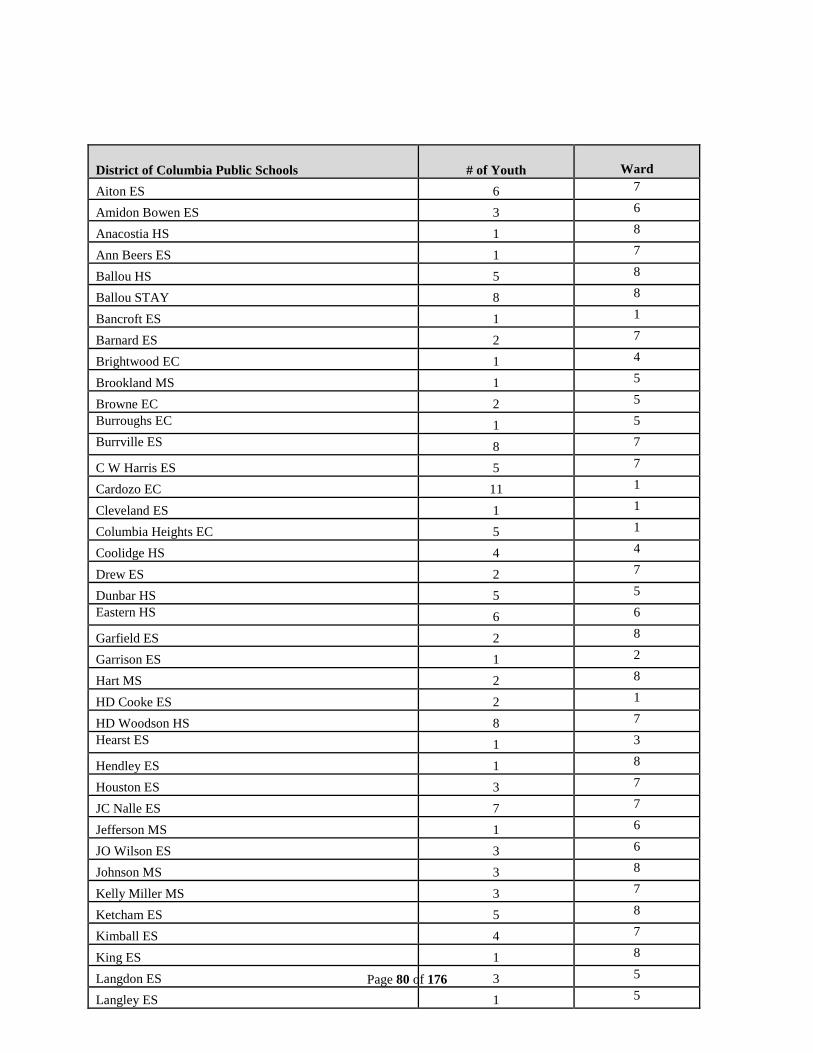
Page 80 of 176
District of Columbia Public Schools # of Youth
Ward
Aiton ES 6 7
Amidon Bowen ES 3 6
Anacostia HS 1 8
Ann Beers ES 1 7
Ballou HS 5 8
Ballou STAY 8 8
Bancroft ES 1 1
Barnard ES 2 7
Brightwood EC 1 4
Brookland MS 1 5
Browne EC 2 5
Burroughs EC 1 5
Burrville ES 8 7
C W Harris ES 5 7
Cardozo EC 11 1
Cleveland ES 1 1
Columbia Heights EC 5 1
Coolidge HS 4 4
Drew ES 2 7
Dunbar HS 5 5
Eastern HS 6 6
Garfield ES 2 8
Garrison ES 1 2
Hart MS 2 8
HD Cooke ES 2 1
HD Woodson HS 8 7
Hearst ES 1 3
Hendley ES 1 8
Houston ES 3 7
JC Nalle ES 7 7
Jefferson MS 1 6
JO Wilson ES 3 6
Johnson MS 3 8
Kelly Miller MS 3 7
Ketcham ES 5 8
Kimball ES 4 7
King ES 1 8
Langdon ES 3 5
Langley ES 1 5
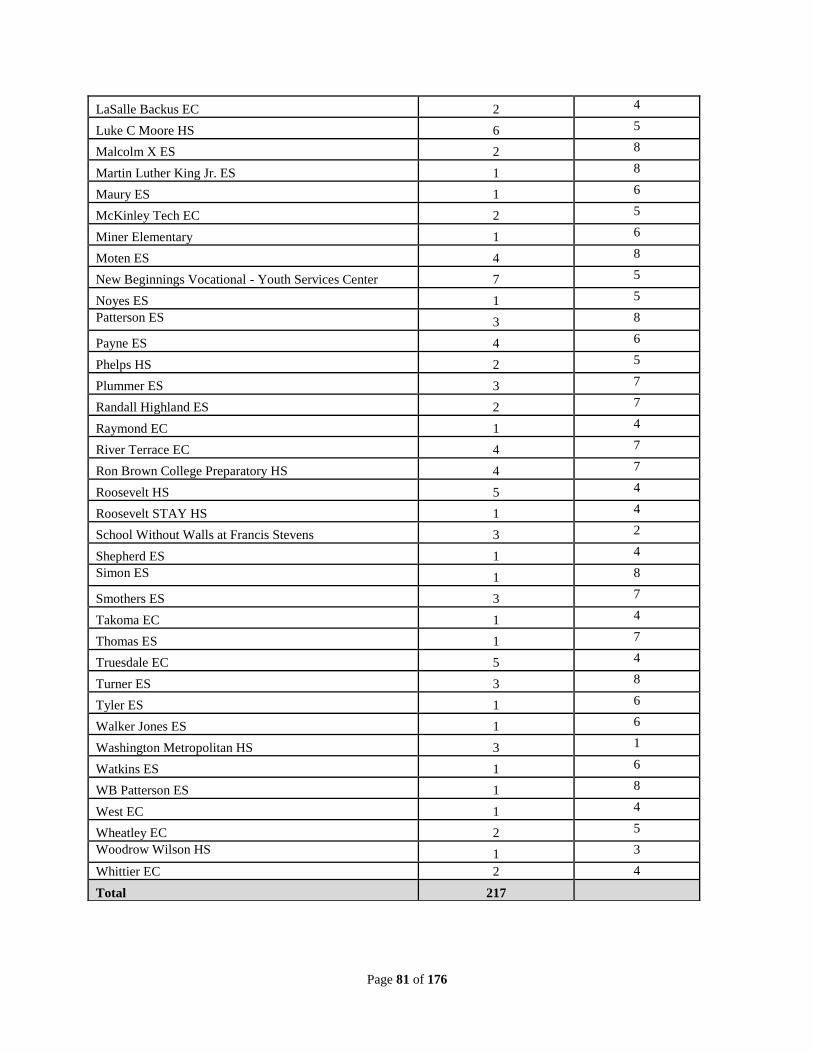
Page 81 of 176
LaSalle Backus EC 2 4
Luke C Moore HS 6 5
Malcolm X ES 2 8
Martin Luther King Jr. ES 1 8
Maury ES 1 6
McKinley Tech EC 2 5
Miner Elementary 1 6
Moten ES 4 8
New Beginnings Vocational - Youth Services Center 7 5
Noyes ES 1 5
Patterson ES 3 8
Payne ES 4 6
Phelps HS 2 5
Plummer ES 3 7
Randall Highland ES 2 7
Raymond EC 1 4
River Terrace EC 4 7
Ron Brown College Preparatory HS 4 7
Roosevelt HS 5 4
Roosevelt STAY HS 1 4
School Without Walls at Francis Stevens 3 2
Shepherd ES 1 4
Simon ES 1 8
Smothers ES 3 7
Takoma EC 1 4
Thomas ES 1 7
Truesdale EC 5 4
Turner ES 3 8
Tyler ES 1 6
Walker Jones ES 1 6
Washington Metropolitan HS 3 1
Watkins ES 1 6
WB Patterson ES 1 8
West EC 1 4
Wheatley EC 2 5
Woodrow Wilson HS 1 3
Whittier EC 2 4
Total 217
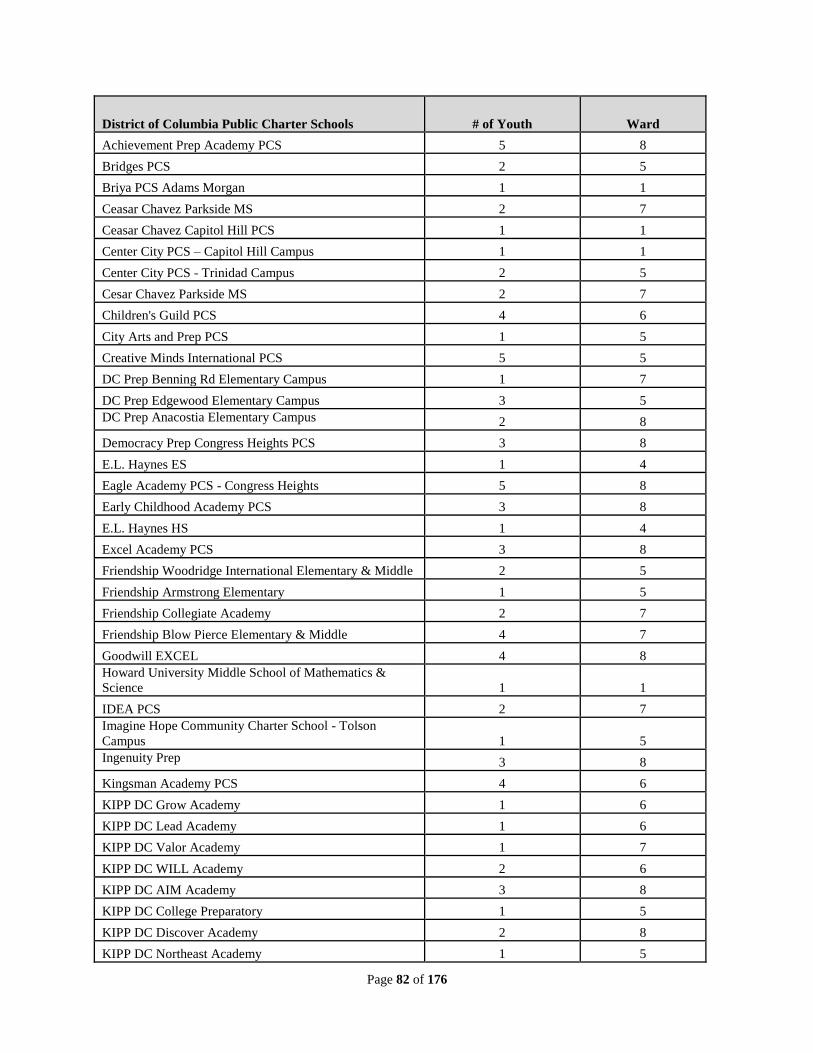
Page 82 of 176
District of Columbia Public Charter Schools # of Youth Ward
Achievement Prep Academy PCS 5 8
Bridges PCS 2 5
Briya PCS Adams Morgan 1 1
Ceasar Chavez Parkside MS 2 7
Ceasar Chavez Capitol Hill PCS 1 1
Center City PCS – Capitol Hill Campus 1 1
Center City PCS - Trinidad Campus 2 5
Cesar Chavez Parkside MS 2 7
Children's Guild PCS 4 6
City Arts and Prep PCS 1 5
Creative Minds International PCS 5 5
DC Prep Benning Rd Elementary Campus 1 7
DC Prep Edgewood Elementary Campus 3 5
DC Prep Anacostia Elementary Campus 2 8
Democracy Prep Congress Heights PCS 3 8
E.L. Haynes ES 1 4
Eagle Academy PCS - Congress Heights 5 8
Early Childhood Academy PCS 3 8
E.L. Haynes HS 1 4
Excel Academy PCS 3 8
Friendship Woodridge International Elementary & Middle 2 5
Friendship Armstrong Elementary 1 5
Friendship Collegiate Academy 2 7
Friendship Blow Pierce Elementary & Middle 4 7
Goodwill EXCEL 4 8
Howard University Middle School of Mathematics &
Science 1 1
IDEA PCS 2 7
Imagine Hope Community Charter School - Tolson
Campus 1 5
Ingenuity Prep 3 8
Kingsman Academy PCS 4 6
KIPP DC Grow Academy 1 6
KIPP DC Lead Academy 1 6
KIPP DC Valor Academy 1 7
KIPP DC WILL Academy 2 6
KIPP DC AIM Academy 3 8
KIPP DC College Preparatory 1 5
KIPP DC Discover Academy 2 8
KIPP DC Northeast Academy 1 5
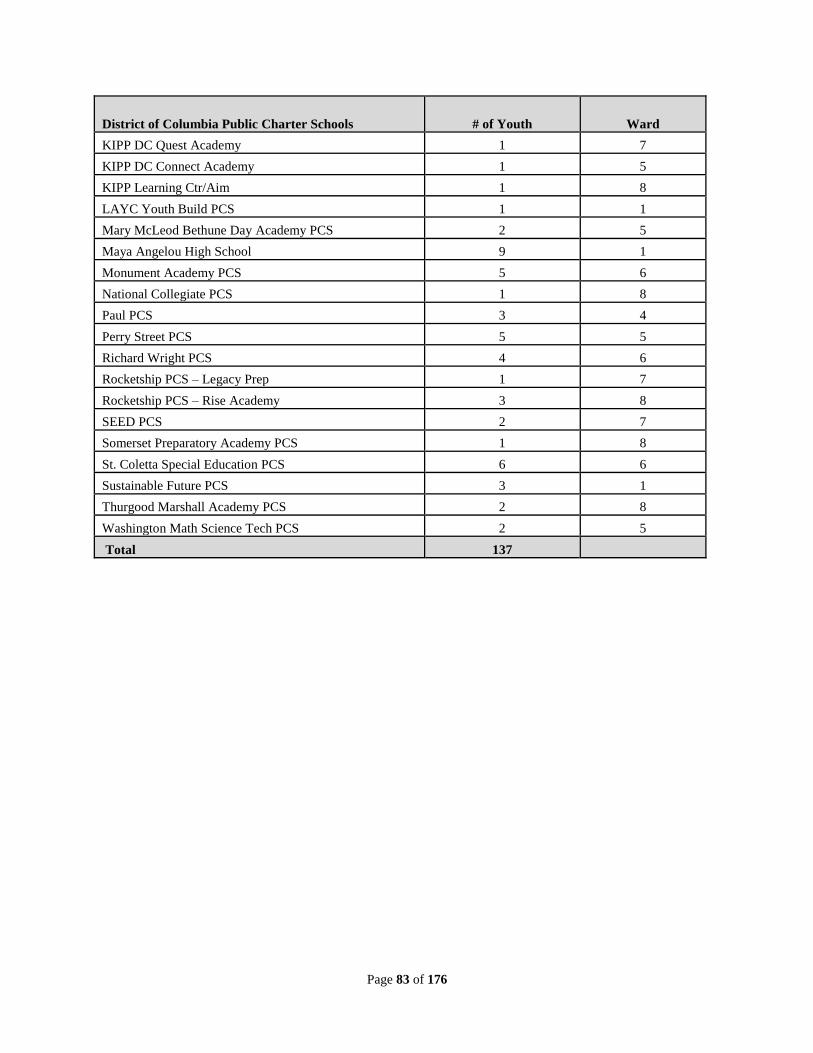
Page 83 of 176
District of Columbia Public Charter Schools # of Youth Ward
KIPP DC Quest Academy 1 7
KIPP DC Connect Academy 1 5
KIPP Learning Ctr/Aim 1 8
LAYC Youth Build PCS 1 1
Mary McLeod Bethune Day Academy PCS 2 5
Maya Angelou High School 9 1
Monument Academy PCS 5 6
National Collegiate PCS 1 8
Paul PCS 3 4
Perry Street PCS 5 5
Richard Wright PCS 4 6
Rocketship PCS – Legacy Prep 1 7
Rocketship PCS – Rise Academy 3 8
SEED PCS 2 7
Somerset Preparatory Academy PCS 1 8
St. Coletta Special Education PCS 6 6
Sustainable Future PCS 3 1
Thurgood Marshall Academy PCS 2 8
Washington Math Science Tech PCS 2 5
Total 137
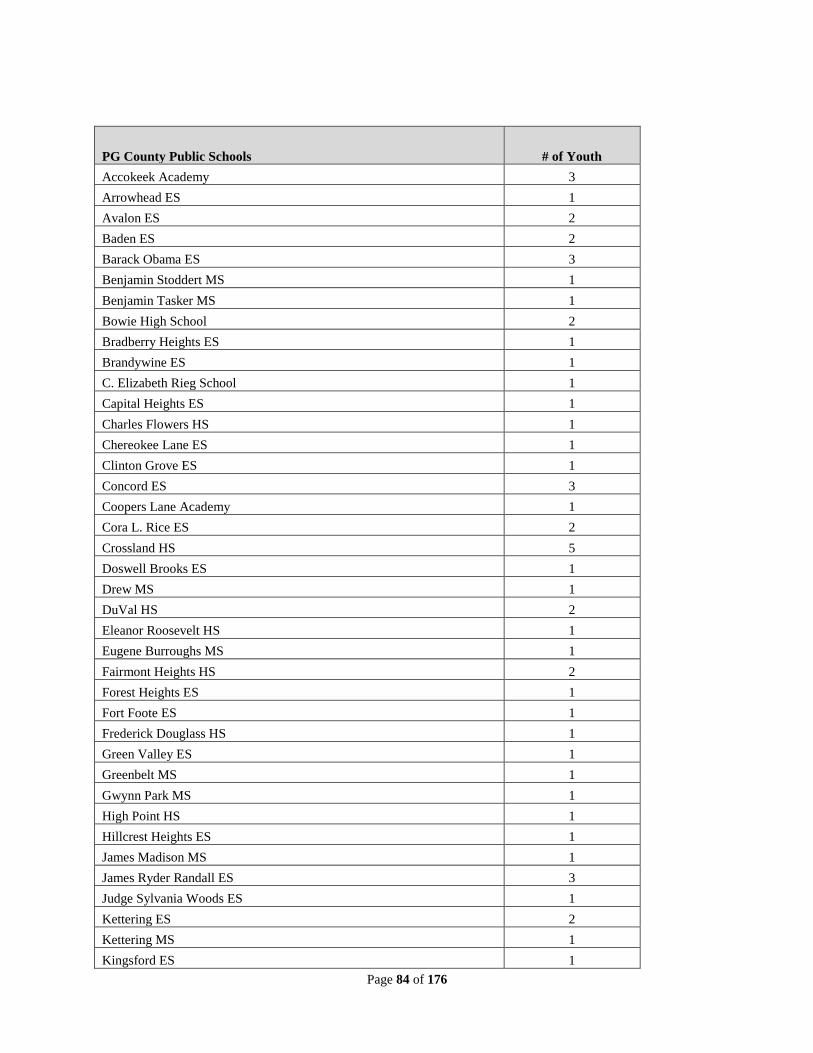
Page 84 of 176
PG County Public Schools # of Youth
Accokeek Academy 3
Arrowhead ES 1
Avalon ES 2
Baden ES 2
Barack Obama ES 3
Benjamin Stoddert MS 1
Benjamin Tasker MS 1
Bowie High School 2
Bradberry Heights ES 1
Brandywine ES 1
C. Elizabeth Rieg School 1
Capital Heights ES 1
Charles Flowers HS 1
Chereokee Lane ES 1
Clinton Grove ES 1
Concord ES 3
Coopers Lane Academy 1
Cora L. Rice ES 2
Crossland HS 5
Doswell Brooks ES 1
Drew MS 1
DuVal HS 2
Eleanor Roosevelt HS 1
Eugene Burroughs MS 1
Fairmont Heights HS 2
Forest Heights ES 1
Fort Foote ES 1
Frederick Douglass HS 1
Green Valley ES 1
Greenbelt MS 1
Gwynn Park MS 1
High Point HS 1
Hillcrest Heights ES 1
James Madison MS 1
James Ryder Randall ES 3
Judge Sylvania Woods ES 1
Kettering ES 2
Kettering MS 1
Kingsford ES 1
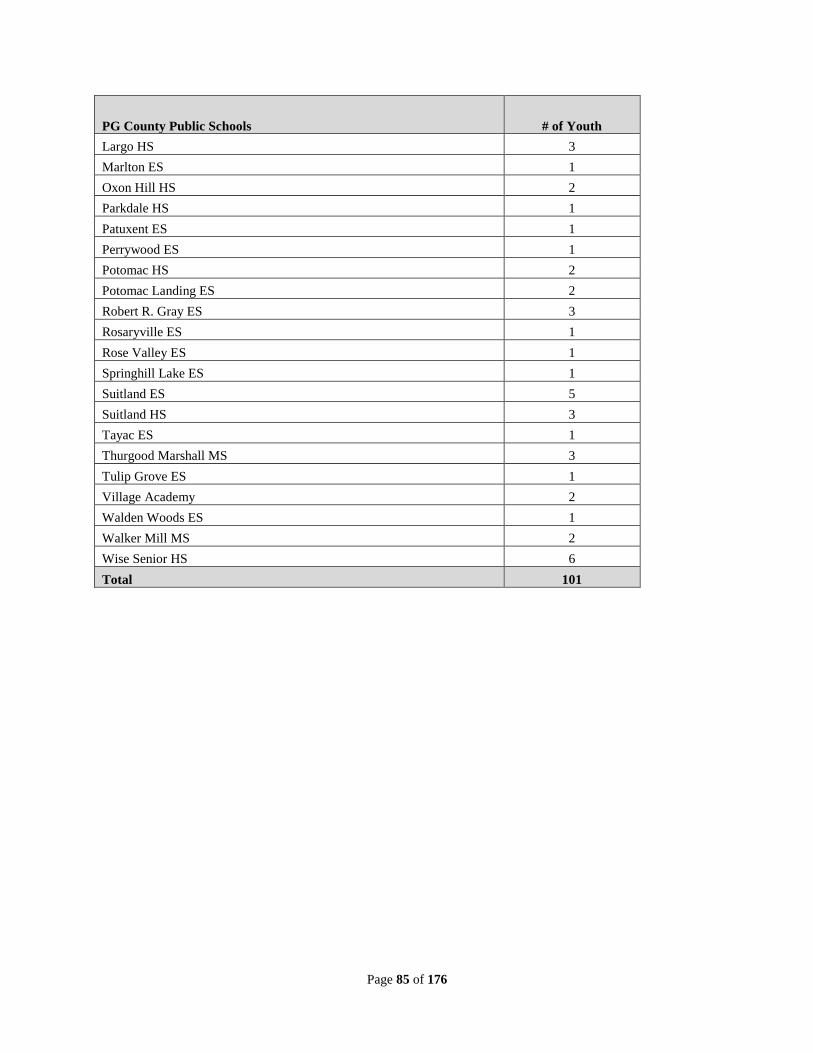
Page 85 of 176
PG County Public Schools # of Youth
Largo HS 3
Marlton ES 1
Oxon Hill HS 2
Parkdale HS 1
Patuxent ES 1
Perrywood ES 1
Potomac HS 2
Potomac Landing ES 2
Robert R. Gray ES 3
Rosaryville ES 1
Rose Valley ES 1
Springhill Lake ES 1
Suitland ES 5
Suitland HS 3
Tayac ES 1
Thurgood Marshall MS 3
Tulip Grove ES 1
Village Academy 2
Walden Woods ES 1
Walker Mill MS 2
Wise Senior HS 6
Total 101
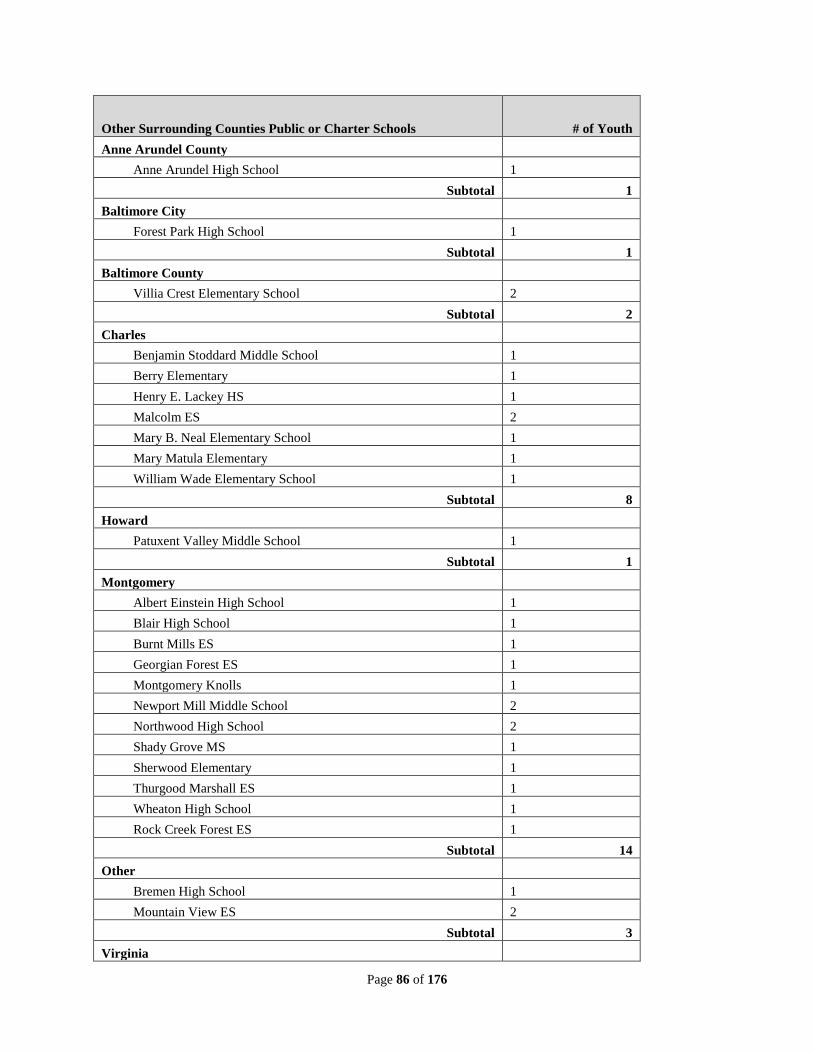
Page 86 of 176
Other Surrounding Counties Public or Charter Schools # of Youth
Anne Arundel County
Anne Arundel High School 1
Subtotal 1
Baltimore City
Forest Park High School 1
Subtotal 1
Baltimore County
Villia Crest Elementary School 2
Subtotal 2
Charles
Benjamin Stoddard Middle School 1
Berry Elementary 1
Henry E. Lackey HS 1
Malcolm ES 2
Mary B. Neal Elementary School 1
Mary Matula Elementary 1
William Wade Elementary School 1
Subtotal 8
Howard
Patuxent Valley Middle School 1
Subtotal 1
Montgomery
Albert Einstein High School 1
Blair High School 1
Burnt Mills ES 1
Georgian Forest ES 1
Montgomery Knolls 1
Newport Mill Middle School 2
Northwood High School 2
Shady Grove MS 1
Sherwood Elementary 1
Thurgood Marshall ES 1
Wheaton High School 1
Rock Creek Forest ES 1
Subtotal 14
Other
Bremen High School 1
Mountain View ES 2
Subtotal 3
Virginia
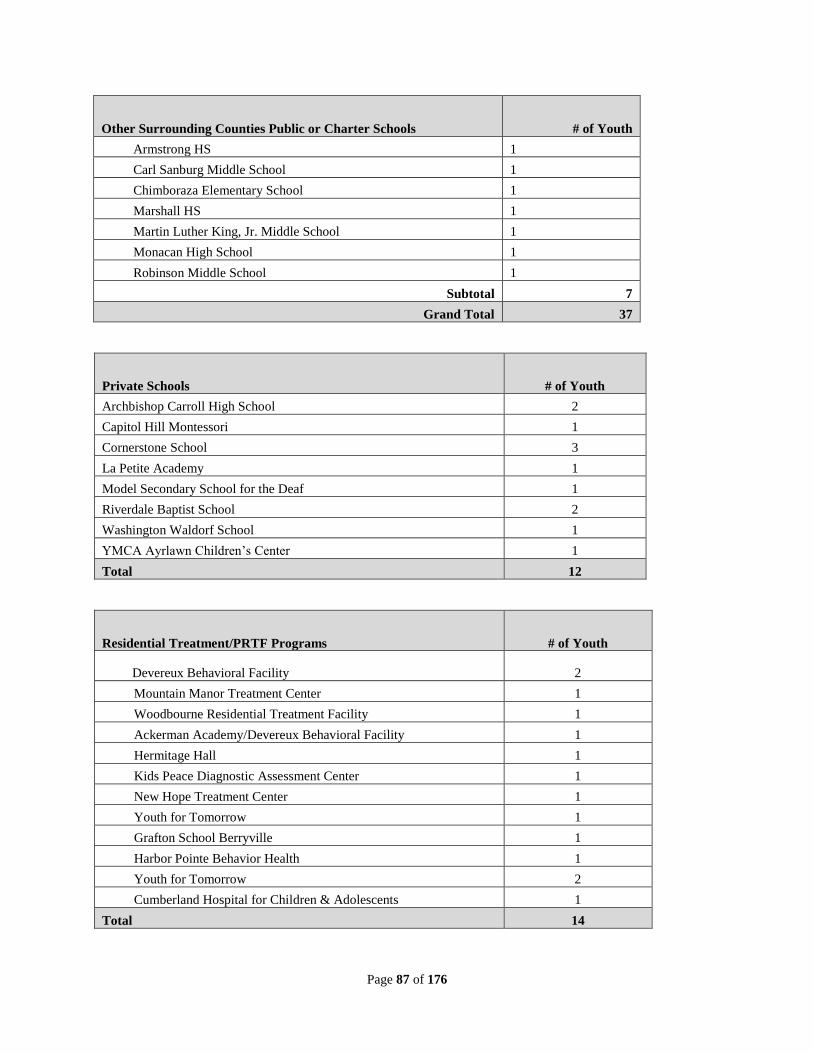
Page 87 of 176
Other Surrounding Counties Public or Charter Schools # of Youth
Armstrong HS 1
Carl Sanburg Middle School 1
Chimboraza Elementary School 1
Marshall HS 1
Martin Luther King, Jr. Middle School 1
Monacan High School 1
Robinson Middle School 1
Subtotal 7
Grand Total 37
Private Schools # of Youth
Archbishop Carroll High School 2
Capitol Hill Montessori 1
Cornerstone School 3
La Petite Academy 1
Model Secondary School for the Deaf 1
Riverdale Baptist School 2
Washington Waldorf School 1
YMCA Ayrlawn Children’s Center 1
Total 12
Residential Treatment/PRTF Programs # of Youth
Devereux Behavioral Facility 2
Mountain Manor Treatment Center 1
Woodbourne Residential Treatment Facility 1
Ackerman Academy/Devereux Behavioral Facility 1
Hermitage Hall 1
Kids Peace Diagnostic Assessment Center 1
New Hope Treatment Center 1
Youth for Tomorrow 1
Grafton School Berryville 1
Harbor Pointe Behavior Health 1
Youth for Tomorrow 2
Cumberland Hospital for Children & Adolescents 1
Total 14
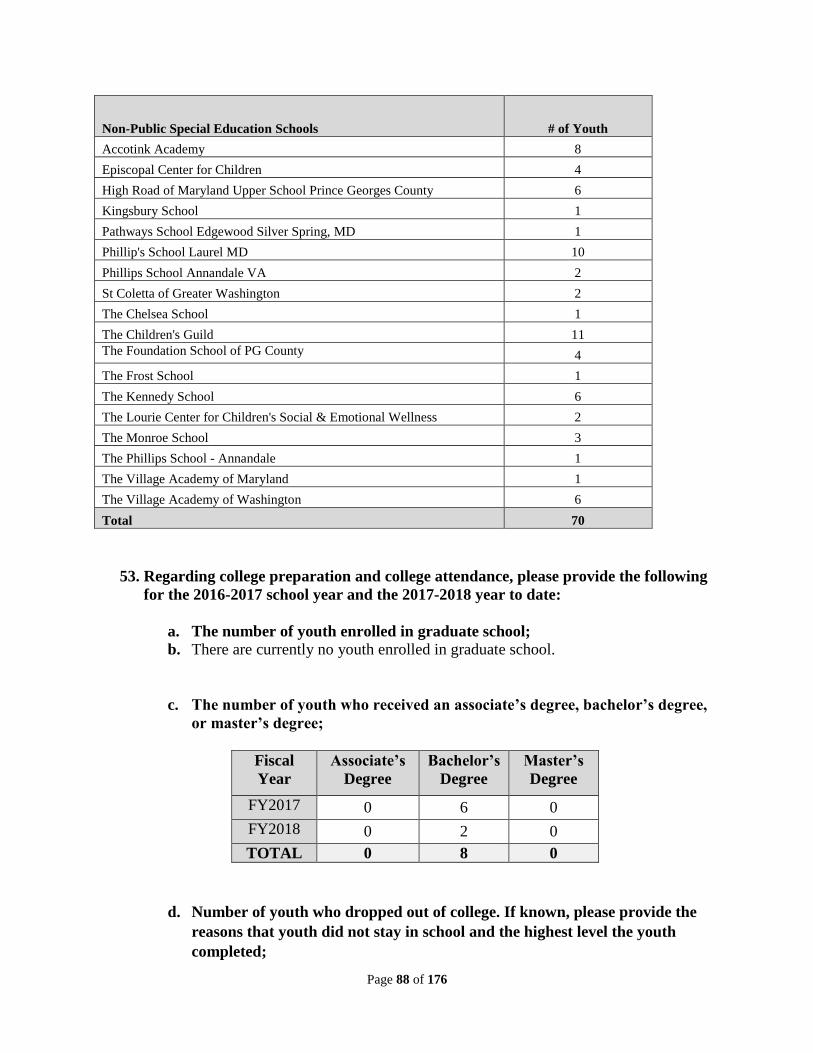
Page 88 of 176
Non-Public Special Education Schools # of Youth
Accotink Academy 8
Episcopal Center for Children 4
High Road of Maryland Upper School Prince Georges County 6
Kingsbury School 1
Pathways School Edgewood Silver Spring, MD 1
Phillip's School Laurel MD 10
Phillips School Annandale VA 2
St Coletta of Greater Washington 2
The Chelsea School 1
The Children's Guild 11
The Foundation School of PG County 4
The Frost School 1
The Kennedy School 6
The Lourie Center for Children's Social & Emotional Wellness 2
The Monroe School 3
The Phillips School - Annandale 1
The Village Academy of Maryland 1
The Village Academy of Washington 6
Total 70
53. Regarding college preparation and college attendance, please provide the following
for the 2016-2017 school year and the 2017-2018 year to date:
a. The number of youth enrolled in graduate school;
b. There are currently no youth enrolled in graduate school.
c. The number of youth who received an associate’s degree, bachelor’s degree,
or master’s degree;
Fiscal
Year
Associate’s
Degree
Bachelor’s
Degree
Master’s
Degree
FY2017 0 6 0
FY2018 0 2 0
TOTAL 0 8 0
d. Number of youth who dropped out of college. If known, please provide the
reasons that youth did not stay in school and the highest level the youth
completed;
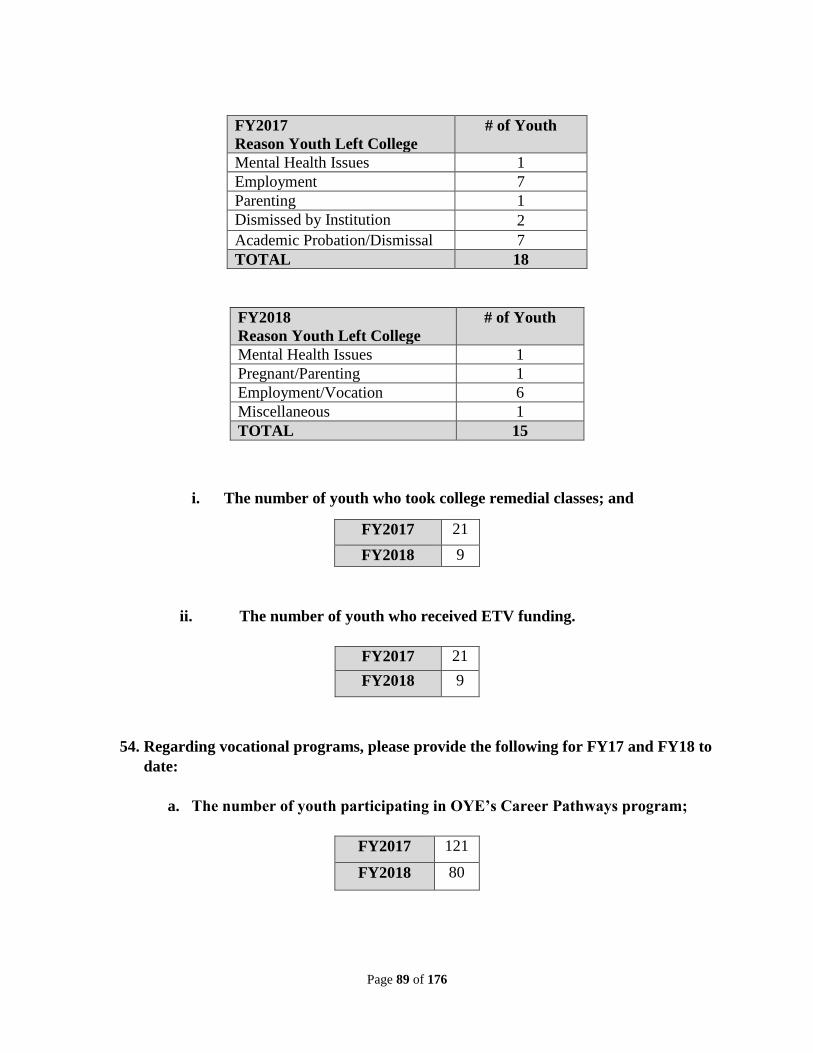
Page 89 of 176
FY2017
Reason Youth Left College
# of Youth
Mental Health Issues 1
Employment 7
Parenting 1
Dismissed by Institution 2
Academic Probation/Dismissal 7
TOTAL 18
FY2018
Reason Youth Left College
# of Youth
Mental Health Issues 1
Pregnant/Parenting 1
Employment/Vocation 6
Miscellaneous 1
TOTAL 15
i. The number of youth who took college remedial classes; and
FY2017 21
FY2018 9
ii. The number of youth who received ETV funding.
FY2017 21
FY2018 9
54. Regarding vocational programs, please provide the following for FY17 and FY18 to
date:
a. The number of youth participating in OYE’s Career Pathways program;
FY2017 121
FY2018 80
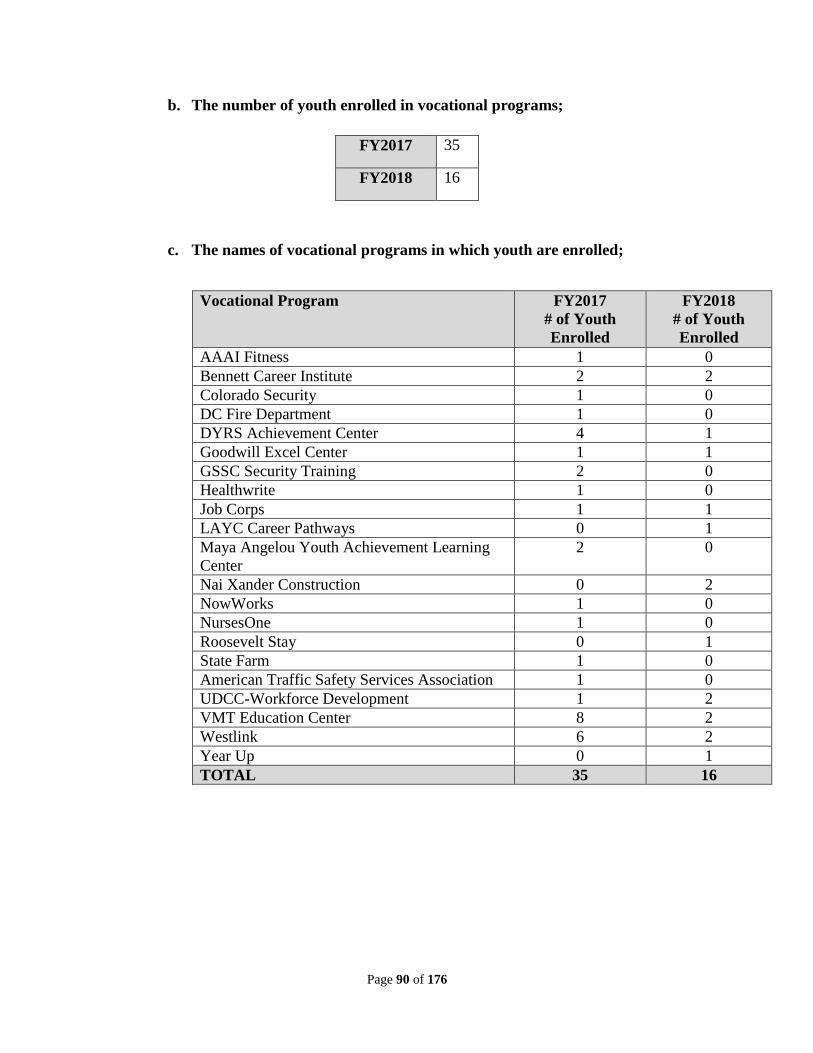
Page 90 of 176
b. The number of youth enrolled in vocational programs;
FY2017 35
FY2018 16
c. The names of vocational programs in which youth are enrolled;
Vocational Program FY2017
# of Youth
Enrolled
FY2018
# of Youth
Enrolled
AAAI Fitness 1 0
Bennett Career Institute 2 2
Colorado Security 1 0
DC Fire Department 1 0
DYRS Achievement Center 4 1
Goodwill Excel Center 1 1
GSSC Security Training 2 0
Healthwrite 1 0
Job Corps 1 1
LAYC Career Pathways 0 1
Maya Angelou Youth Achievement Learning
Center
2 0
Nai Xander Construction 0 2
NowWorks 1 0
NursesOne 1 0
Roosevelt Stay 0 1
State Farm 1 0
American Traffic Safety Services Association 1 0
UDCC-Workforce Development 1 2
VMT Education Center 8 2
Westlink 6 2
Year Up 0 1
TOTAL 35 16
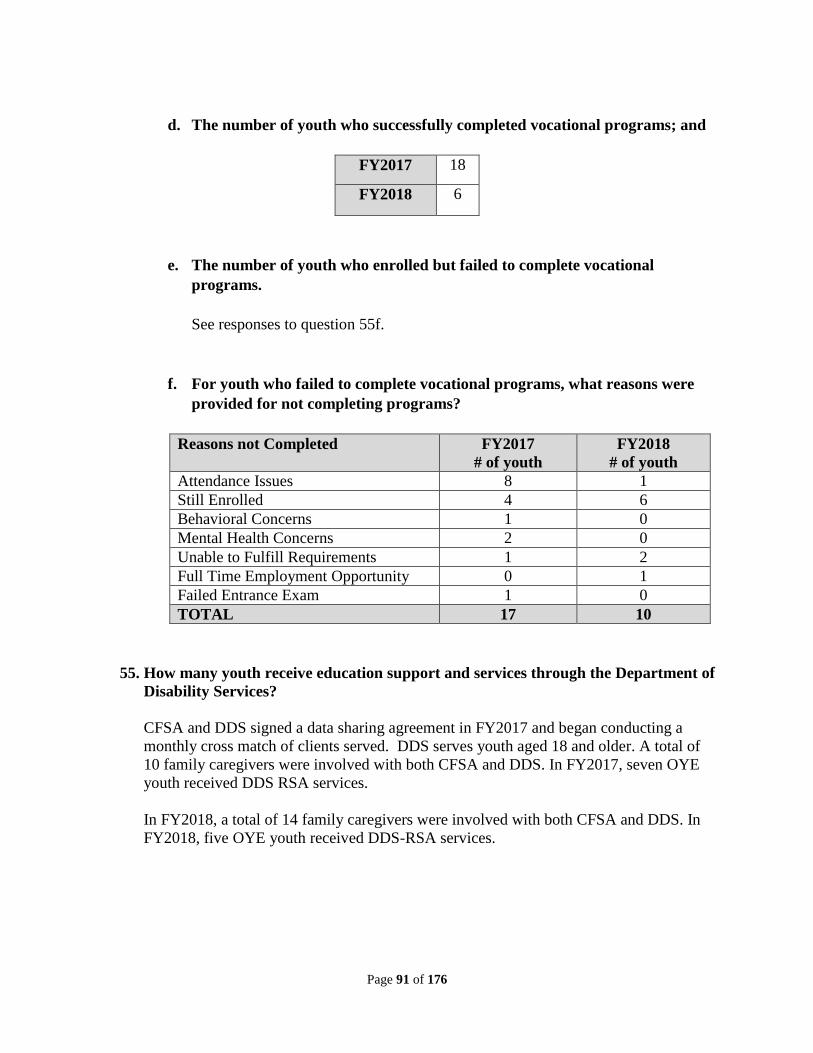
Page 91 of 176
d. The number of youth who successfully completed vocational programs; and
FY2017 18
FY2018 6
e. The number of youth who enrolled but failed to complete vocational
programs.
See responses to question 55f.
f. For youth who failed to complete vocational programs, what reasons were
provided for not completing programs?
Reasons not Completed FY2017
# of youth
FY2018
# of youth
Attendance Issues 8 1
Still Enrolled 4 6
Behavioral Concerns 1 0
Mental Health Concerns 2 0
Unable to Fulfill Requirements 1 2
Full Time Employment Opportunity 0 1
Failed Entrance Exam 1 0
TOTAL 17 10
55. How many youth receive education support and services through the Department of
Disability Services?
CFSA and DDS signed a data sharing agreement in FY2017 and began conducting a
monthly cross match of clients served. DDS serves youth aged 18 and older. A total of
10 family caregivers were involved with both CFSA and DDS. In FY2017, seven OYE
youth received DDS RSA services.
In FY2018, a total of 14 family caregivers were involved with both CFSA and DDS. In
FY2018, five OYE youth received DDS-RSA services.
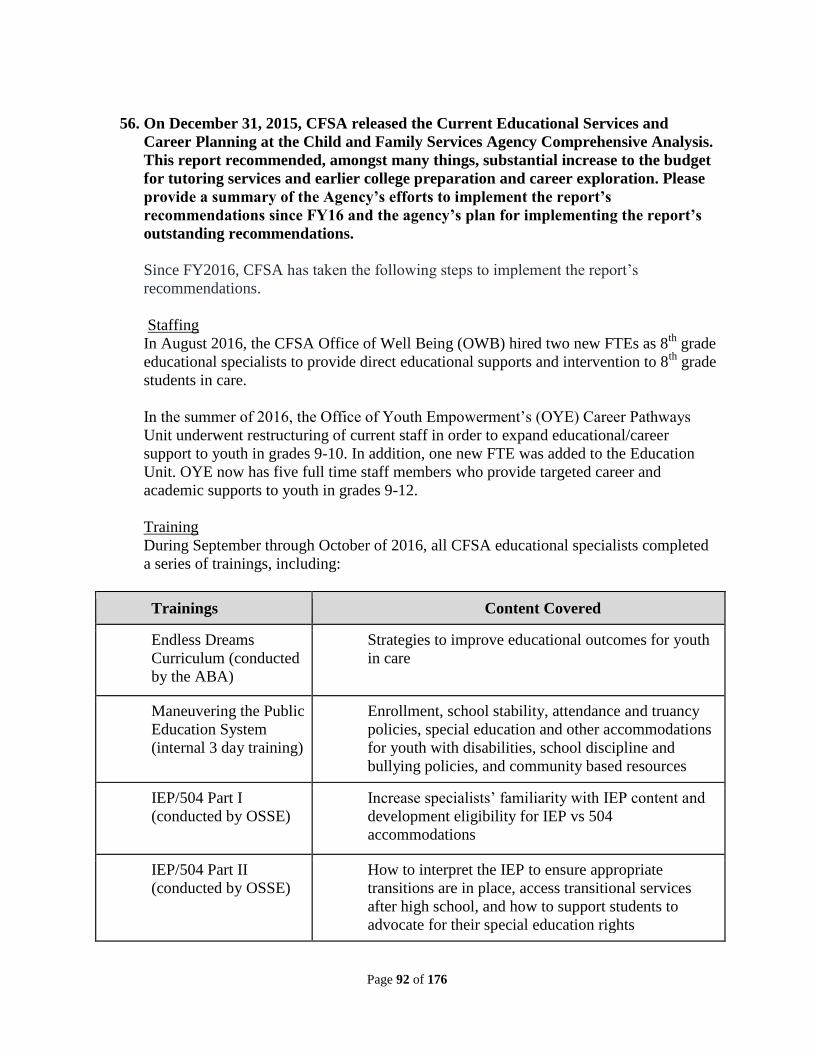
Page 92 of 176
56. On December 31, 2015, CFSA released the Current Educational Services and
Career Planning at the Child and Family Services Agency Comprehensive Analysis.
This report recommended, amongst many things, substantial increase to the budget
for tutoring services and earlier college preparation and career exploration. Please
provide a summary of the Agency’s efforts to implement the report’s
recommendations since FY16 and the agency’s plan for implementing the report’s
outstanding recommendations.
Since FY2016, CFSA has taken the following steps to implement the report’s
recommendations.
Staffing
In August 2016, the CFSA Office of Well Being (OWB) hired two new FTEs as 8th
grade
educational specialists to provide direct educational supports and intervention to 8th
grade
students in care.
In the summer of 2016, the Office of Youth Empowerment’s (OYE) Career Pathways
Unit underwent restructuring of current staff in order to expand educational/career
support to youth in grades 9-10. In addition, one new FTE was added to the Education
Unit. OYE now has five full time staff members who provide targeted career and
academic supports to youth in grades 9-12.
Training
During September through October of 2016, all CFSA educational specialists completed
a series of trainings, including:
Trainings Content Covered
Endless Dreams
Curriculum (conducted
by the ABA)
Strategies to improve educational outcomes for youth
in care
Maneuvering the Public
Education System
(internal 3 day training)
Enrollment, school stability, attendance and truancy
policies, special education and other accommodations
for youth with disabilities, school discipline and
bullying policies, and community based resources
IEP/504 Part I
(conducted by OSSE)
Increase specialists’ familiarity with IEP content and
development eligibility for IEP vs 504
accommodations
IEP/504 Part II
(conducted by OSSE)
How to interpret the IEP to ensure appropriate
transitions are in place, access transitional services
after high school, and how to support students to
advocate for their special education rights
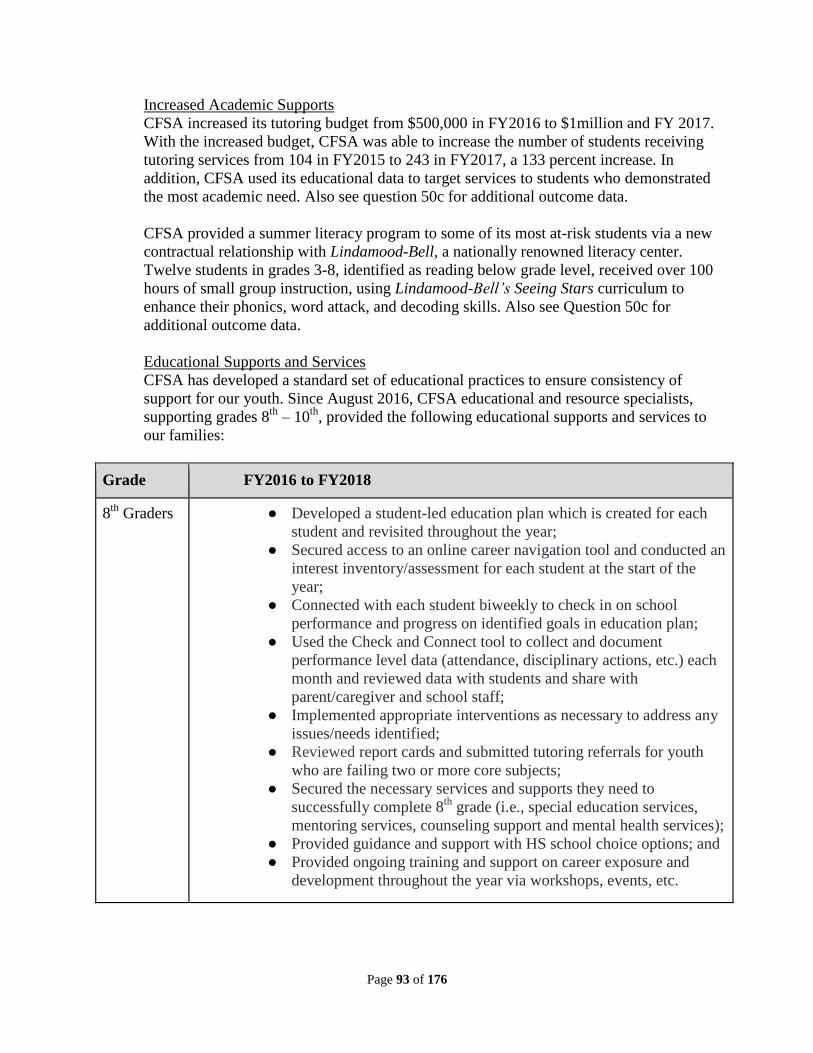
Page 93 of 176
Increased Academic Supports
CFSA increased its tutoring budget from $500,000 in FY2016 to $1million and FY 2017.
With the increased budget, CFSA was able to increase the number of students receiving
tutoring services from 104 in FY2015 to 243 in FY2017, a 133 percent increase. In
addition, CFSA used its educational data to target services to students who demonstrated
the most academic need. Also see question 50c for additional outcome data.
CFSA provided a summer literacy program to some of its most at-risk students via a new
contractual relationship with Lindamood-Bell, a nationally renowned literacy center.
Twelve students in grades 3-8, identified as reading below grade level, received over 100
hours of small group instruction, using Lindamood-Bell’s Seeing Stars curriculum to
enhance their phonics, word attack, and decoding skills. Also see Question 50c for
additional outcome data.
Educational Supports and Services
CFSA has developed a standard set of educational practices to ensure consistency of
support for our youth. Since August 2016, CFSA educational and resource specialists,
supporting grades 8th
– 10th
, provided the following educational supports and services to
our families:
Grade FY2016 to FY2018
8th
Graders ● Developed a student-led education plan which is created for each
student and revisited throughout the year;
● Secured access to an online career navigation tool and conducted an
interest inventory/assessment for each student at the start of the
year;
● Connected with each student biweekly to check in on school
performance and progress on identified goals in education plan;
● Used the Check and Connect tool to collect and document
performance level data (attendance, disciplinary actions, etc.) each
month and reviewed data with students and share with
parent/caregiver and school staff;
● Implemented appropriate interventions as necessary to address any
issues/needs identified;
● Reviewed report cards and submitted tutoring referrals for youth
who are failing two or more core subjects;
● Secured the necessary services and supports they need to
successfully complete 8th
grade (i.e., special education services,
mentoring services, counseling support and mental health services);
● Provided guidance and support with HS school choice options; and
● Provided ongoing training and support on career exposure and
development throughout the year via workshops, events, etc.
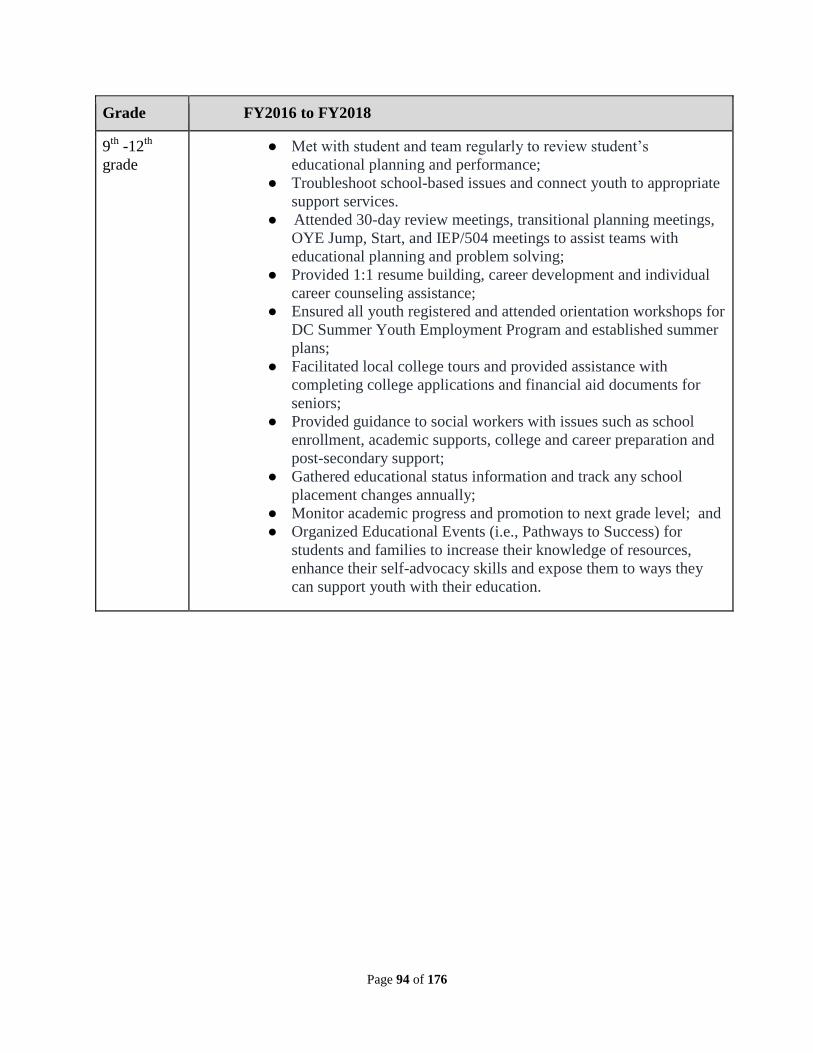
Page 94 of 176
Grade FY2016 to FY2018
9th
-12th
grade
● Met with student and team regularly to review student’s
educational planning and performance;
● Troubleshoot school-based issues and connect youth to appropriate
support services.
● Attended 30-day review meetings, transitional planning meetings,
OYE Jump, Start, and IEP/504 meetings to assist teams with
educational planning and problem solving;
● Provided 1:1 resume building, career development and individual
career counseling assistance;
● Ensured all youth registered and attended orientation workshops for
DC Summer Youth Employment Program and established summer
plans;
● Facilitated local college tours and provided assistance with
completing college applications and financial aid documents for
seniors;
● Provided guidance to social workers with issues such as school
enrollment, academic supports, college and career preparation and
post-secondary support;
● Gathered educational status information and track any school
placement changes annually;
● Monitor academic progress and promotion to next grade level; and
● Organized Educational Events (i.e., Pathways to Success) for
students and families to increase their knowledge of resources,
enhance their self-advocacy skills and expose them to ways they
can support youth with their education.
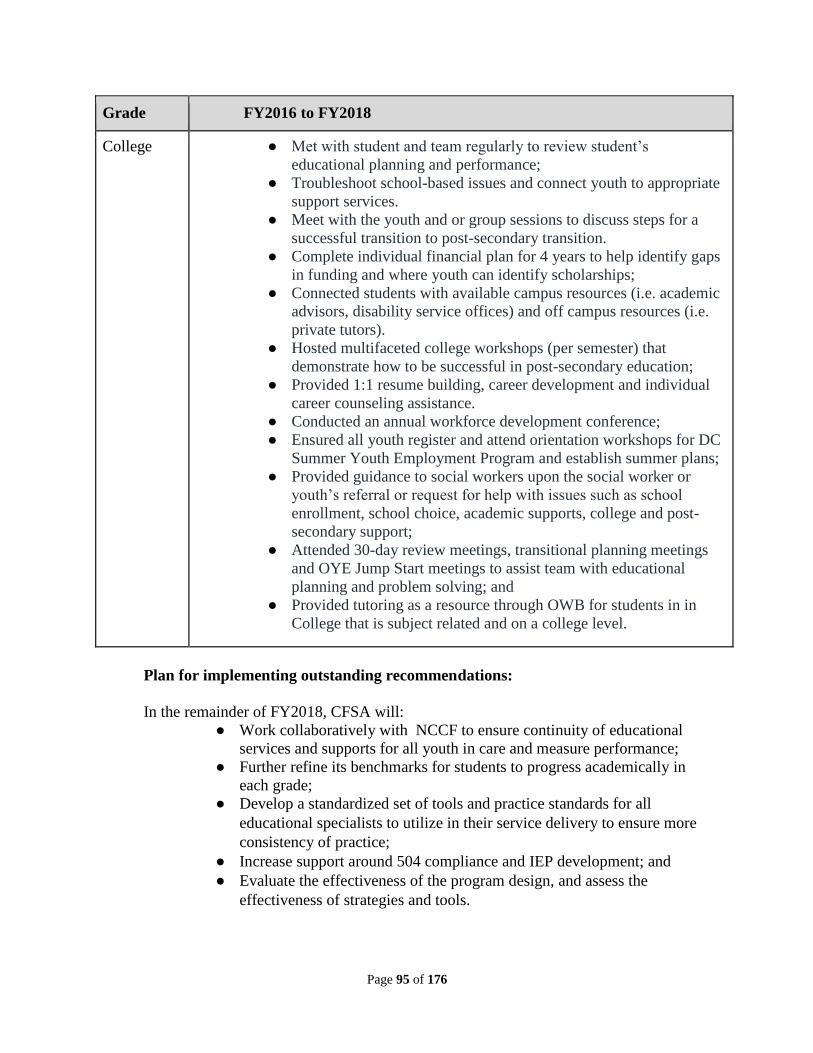
Page 95 of 176
Grade FY2016 to FY2018
College ● Met with student and team regularly to review student’s
educational planning and performance;
● Troubleshoot school-based issues and connect youth to appropriate
support services.
● Meet with the youth and or group sessions to discuss steps for a
successful transition to post-secondary transition.
● Complete individual financial plan for 4 years to help identify gaps
in funding and where youth can identify scholarships;
● Connected students with available campus resources (i.e. academic
advisors, disability service offices) and off campus resources (i.e.
private tutors).
● Hosted multifaceted college workshops (per semester) that
demonstrate how to be successful in post-secondary education;
● Provided 1:1 resume building, career development and individual
career counseling assistance.
● Conducted an annual workforce development conference;
● Ensured all youth register and attend orientation workshops for DC
Summer Youth Employment Program and establish summer plans;
● Provided guidance to social workers upon the social worker or
youth’s referral or request for help with issues such as school
enrollment, school choice, academic supports, college and post-
secondary support;
● Attended 30-day review meetings, transitional planning meetings
and OYE Jump Start meetings to assist team with educational
planning and problem solving; and
● Provided tutoring as a resource through OWB for students in in
College that is subject related and on a college level.
Plan for implementing outstanding recommendations:
In the remainder of FY2018, CFSA will:
● Work collaboratively with NCCF to ensure continuity of educational
services and supports for all youth in care and measure performance;
● Further refine its benchmarks for students to progress academically in
each grade;
● Develop a standardized set of tools and practice standards for all
educational specialists to utilize in their service delivery to ensure more
consistency of practice;
● Increase support around 504 compliance and IEP development; and
● Evaluate the effectiveness of the program design, and assess the
effectiveness of strategies and tools.
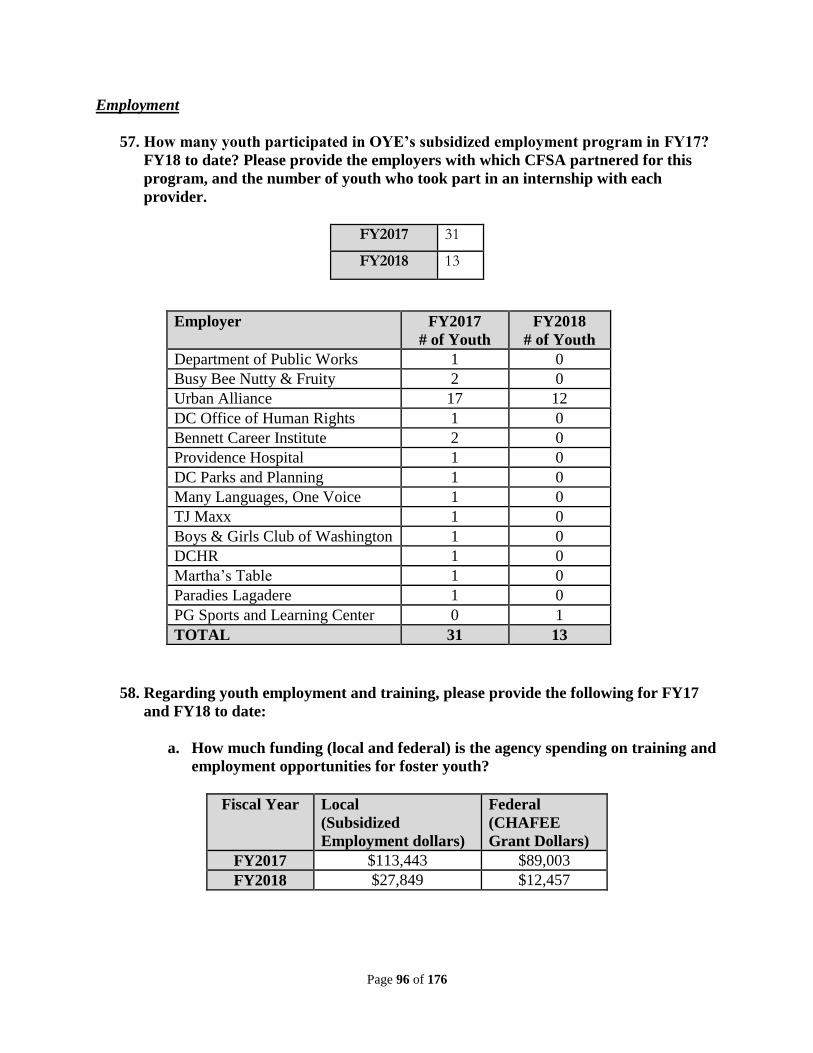
Page 96 of 176
Employment
57. How many youth participated in OYE’s subsidized employment program in FY17?
FY18 to date? Please provide the employers with which CFSA partnered for this
program, and the number of youth who took part in an internship with each
provider.
FY2017 31
FY2018 13
Employer FY2017
# of Youth
FY2018
# of Youth
Department of Public Works 1 0
Busy Bee Nutty & Fruity 2 0
Urban Alliance 17 12
DC Office of Human Rights 1 0
Bennett Career Institute 2 0
Providence Hospital 1 0
DC Parks and Planning 1 0
Many Languages, One Voice 1 0
TJ Maxx 1 0
Boys & Girls Club of Washington 1 0
DCHR 1 0
Martha’s Table 1 0
Paradies Lagadere 1 0
PG Sports and Learning Center 0 1
TOTAL 31 13
58. Regarding youth employment and training, please provide the following for FY17
and FY18 to date:
a. How much funding (local and federal) is the agency spending on training and
employment opportunities for foster youth?
Fiscal Year Local
(Subsidized
Employment dollars)
Federal
(CHAFEE
Grant Dollars)
FY2017 $113,443 $89,003
FY2018 $27,849 $12,457
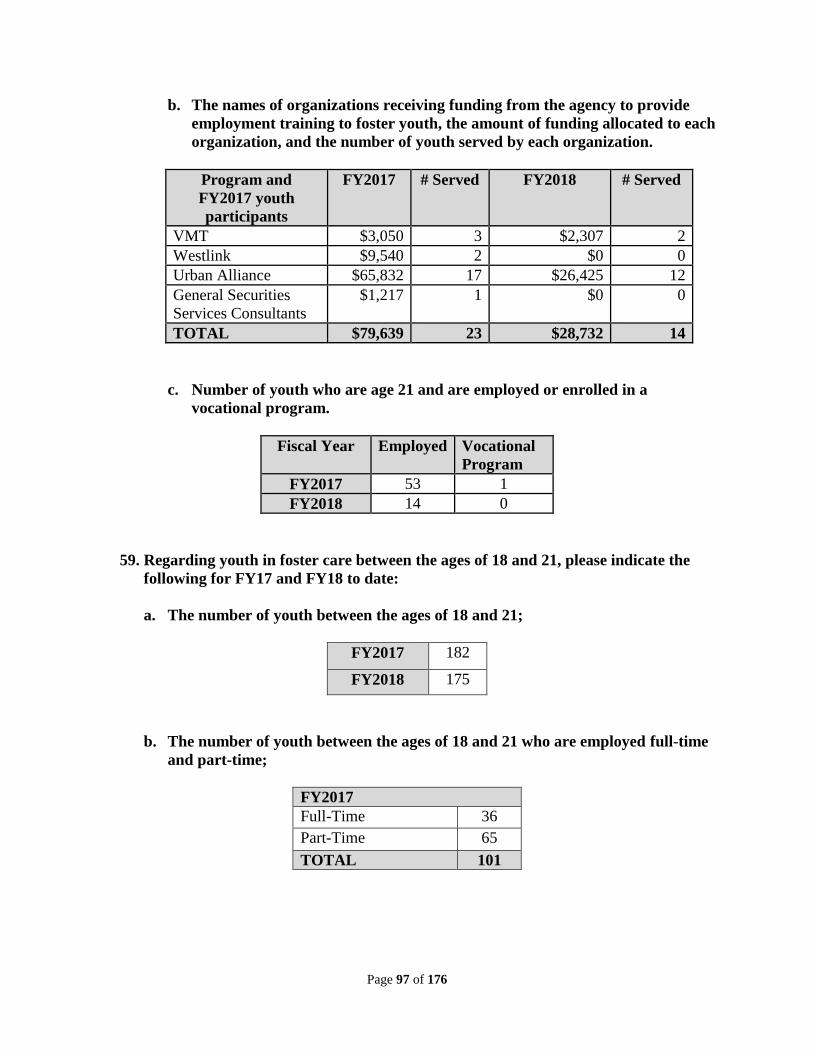
Page 97 of 176
b. The names of organizations receiving funding from the agency to provide
employment training to foster youth, the amount of funding allocated to each
organization, and the number of youth served by each organization.
Program and
FY2017 youth
participants
FY2017 # Served FY2018 # Served
VMT $3,050 3 $2,307 2
Westlink $9,540 2 $0 0
Urban Alliance $65,832 17 $26,425 12
General Securities
Services Consultants
$1,217 1 $0 0
TOTAL $79,639 23 $28,732 14
c. Number of youth who are age 21 and are employed or enrolled in a
vocational program.
Fiscal Year Employed Vocational
Program
FY2017 53 1
FY2018 14 0
59. Regarding youth in foster care between the ages of 18 and 21, please indicate the
following for FY17 and FY18 to date:
a. The number of youth between the ages of 18 and 21;
FY2017 182
FY2018 175
b. The number of youth between the ages of 18 and 21 who are employed full-time
and part-time;
FY2017
Full-Time 36
Part-Time 65
TOTAL 101
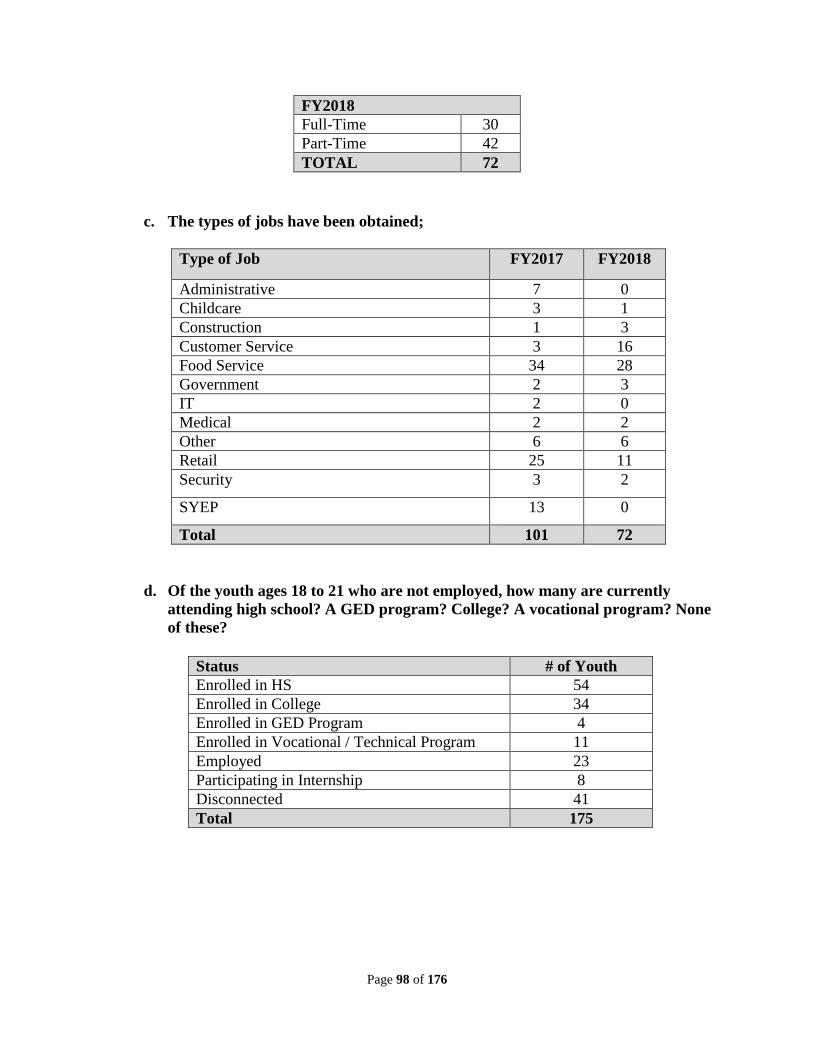
Page 98 of 176
FY2018
Full-Time 30
Part-Time 42
TOTAL 72
c. The types of jobs have been obtained;
Type of Job FY2017 FY2018
Administrative 7 0
Childcare 3 1
Construction 1 3
Customer Service 3 16
Food Service 34 28
Government 2 3
IT 2 0
Medical 2 2
Other 6 6
Retail 25 11
Security 3 2
SYEP 13 0
Total 101 72
d. Of the youth ages 18 to 21 who are not employed, how many are currently
attending high school? A GED program? College? A vocational program? None
of these?
Status # of Youth
Enrolled in HS 54
Enrolled in College 34
Enrolled in GED Program 4
Enrolled in Vocational / Technical Program 11
Employed 23
Participating in Internship 8
Disconnected 41
Total 175
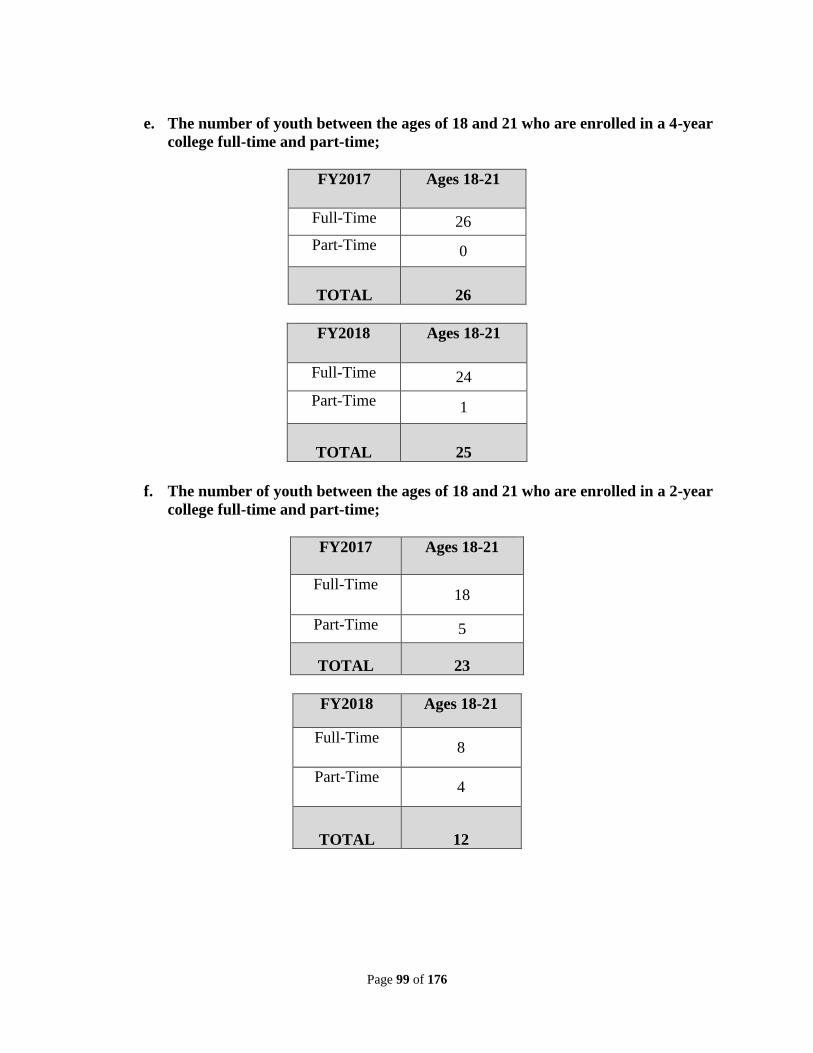
Page 99 of 176
e. The number of youth between the ages of 18 and 21 who are enrolled in a 4-year
college full-time and part-time;
FY2017 Ages 18-21
Full-Time 26
Part-Time 0
TOTAL 26
FY2018 Ages 18-21
Full-Time 24
Part-Time 1
TOTAL 25
f. The number of youth between the ages of 18 and 21 who are enrolled in a 2-year
college full-time and part-time;
FY2017 Ages 18-21
Full-Time 18
Part-Time 5
TOTAL 23
FY2018 Ages 18-21
Full-Time 8
Part-Time 4
TOTAL 12
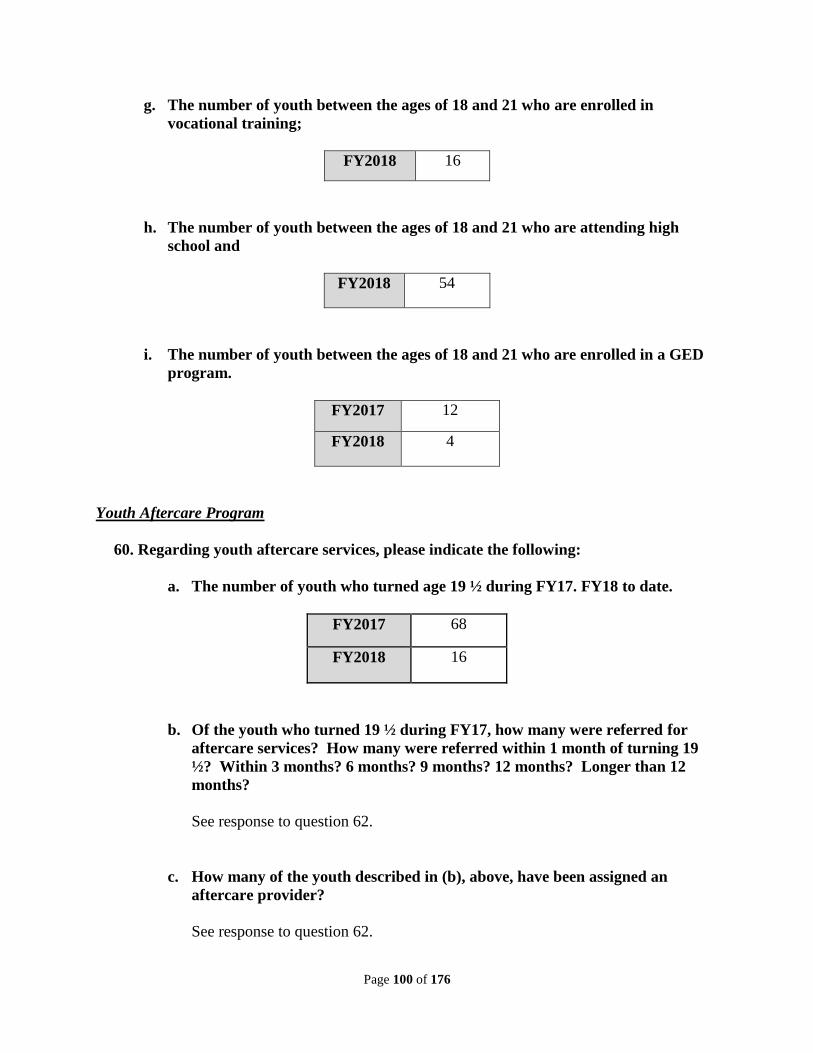
Page 100 of 176
g. The number of youth between the ages of 18 and 21 who are enrolled in
vocational training;
FY2018 16
h. The number of youth between the ages of 18 and 21 who are attending high
school and
FY2018 54
i. The number of youth between the ages of 18 and 21 who are enrolled in a GED
program.
FY2017 12
FY2018 4
Youth Aftercare Program
60. Regarding youth aftercare services, please indicate the following:
a. The number of youth who turned age 19 ½ during FY17. FY18 to date.
FY2017 68
FY2018 16
b. Of the youth who turned 19 ½ during FY17, how many were referred for
aftercare services? How many were referred within 1 month of turning 19
½? Within 3 months? 6 months? 9 months? 12 months? Longer than 12
months?
See response to question 62.
c. How many of the youth described in (b), above, have been assigned an
aftercare provider?
See response to question 62.
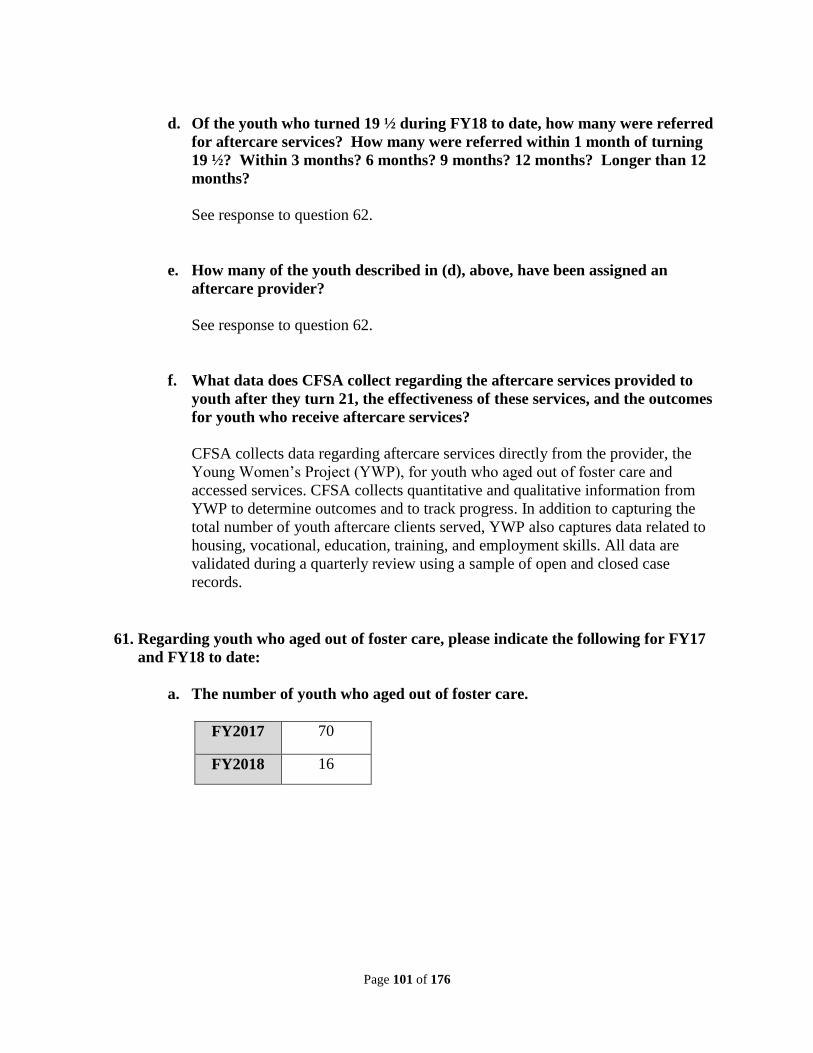
Page 101 of 176
d. Of the youth who turned 19 ½ during FY18 to date, how many were referred
for aftercare services? How many were referred within 1 month of turning
19 ½? Within 3 months? 6 months? 9 months? 12 months? Longer than 12
months?
See response to question 62.
e. How many of the youth described in (d), above, have been assigned an
aftercare provider?
See response to question 62.
f. What data does CFSA collect regarding the aftercare services provided to
youth after they turn 21, the effectiveness of these services, and the outcomes
for youth who receive aftercare services?
CFSA collects data regarding aftercare services directly from the provider, the
Young Women’s Project (YWP), for youth who aged out of foster care and
accessed services. CFSA collects quantitative and qualitative information from
YWP to determine outcomes and to track progress. In addition to capturing the
total number of youth aftercare clients served, YWP also captures data related to
housing, vocational, education, training, and employment skills. All data are
validated during a quarterly review using a sample of open and closed case
records.
61. Regarding youth who aged out of foster care, please indicate the following for FY17
and FY18 to date:
a. The number of youth who aged out of foster care.
FY2017 70
FY2018 16
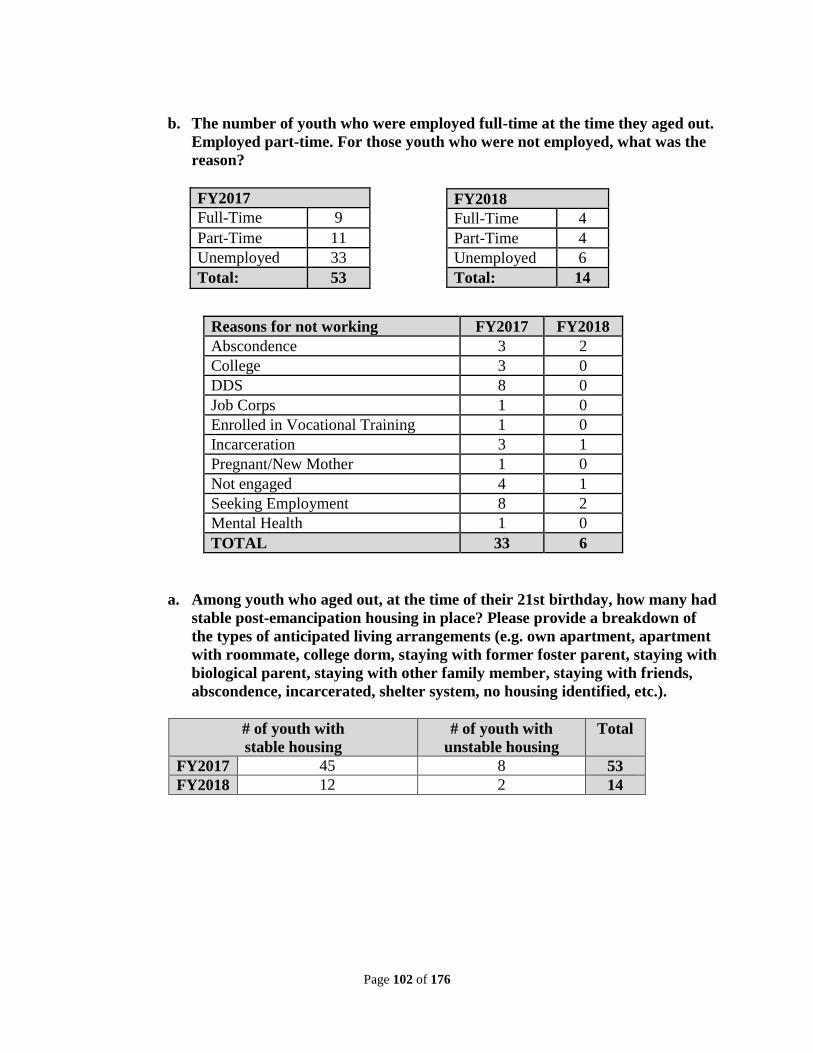
Page 102 of 176
b. The number of youth who were employed full-time at the time they aged out.
Employed part-time. For those youth who were not employed, what was the
reason?
Reasons for not working FY2017 FY2018
Abscondence 3 2
College 3 0
DDS 8 0
Job Corps 1 0
Enrolled in Vocational Training 1 0
Incarceration 3 1
Pregnant/New Mother 1 0
Not engaged 4 1
Seeking Employment 8 2
Mental Health 1 0
TOTAL 33 6
a. Among youth who aged out, at the time of their 21st birthday, how many had
stable post-emancipation housing in place? Please provide a breakdown of
the types of anticipated living arrangements (e.g. own apartment, apartment
with roommate, college dorm, staying with former foster parent, staying with
biological parent, staying with other family member, staying with friends,
abscondence, incarcerated, shelter system, no housing identified, etc.).
# of youth with
stable housing
# of youth with
unstable housing
Total
FY2017 45 8 53
FY2018 12 2 14
FY2017
Full-Time 9
Part-Time 11
Unemployed 33
Total: 53
FY2018
Full-Time 4
Part-Time 4
Unemployed 6
Total: 14
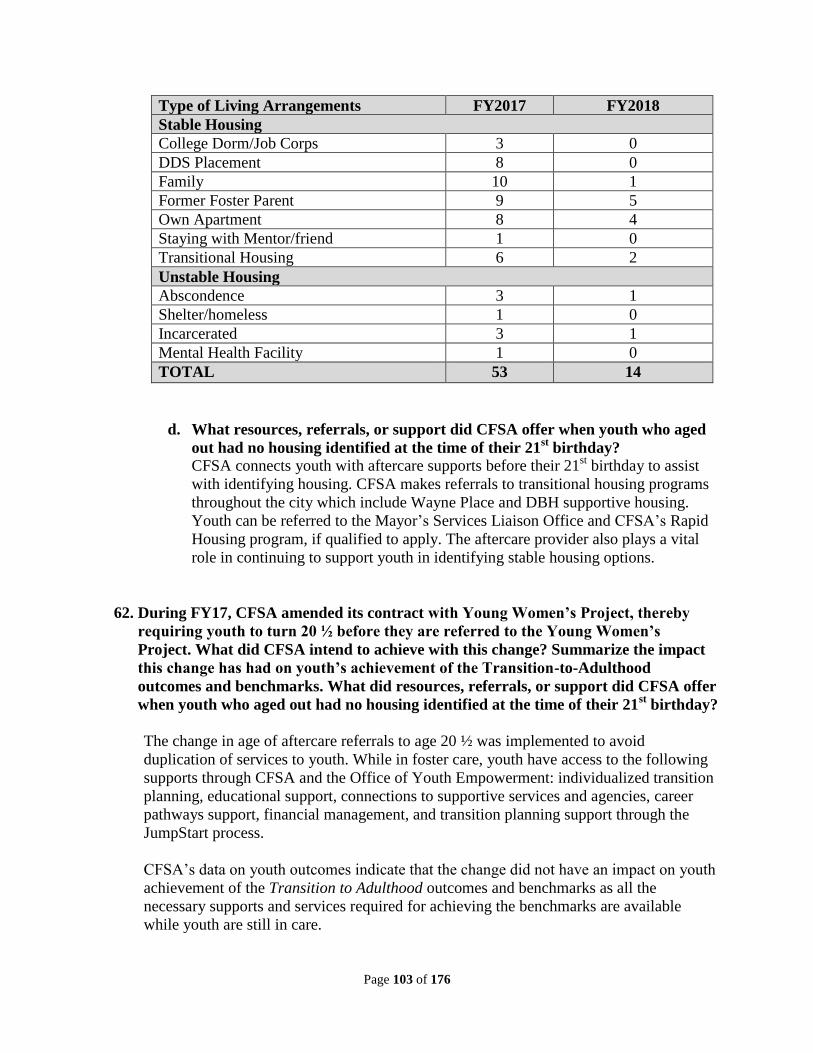
Page 103 of 176
Type of Living Arrangements FY2017 FY2018
Stable Housing
College Dorm/Job Corps 3 0
DDS Placement 8 0
Family 10 1
Former Foster Parent 9 5
Own Apartment 8 4
Staying with Mentor/friend 1 0
Transitional Housing 6 2
Unstable Housing
Abscondence 3 1
Shelter/homeless 1 0
Incarcerated 3 1
Mental Health Facility 1 0
TOTAL 53 14
d. What resources, referrals, or support did CFSA offer when youth who aged
out had no housing identified at the time of their 21st birthday?
CFSA connects youth with aftercare supports before their 21st birthday to assist
with identifying housing. CFSA makes referrals to transitional housing programs
throughout the city which include Wayne Place and DBH supportive housing.
Youth can be referred to the Mayor’s Services Liaison Office and CFSA’s Rapid
Housing program, if qualified to apply. The aftercare provider also plays a vital
role in continuing to support youth in identifying stable housing options.
62. During FY17, CFSA amended its contract with Young Women’s Project, thereby
requiring youth to turn 20 ½ before they are referred to the Young Women’s
Project. What did CFSA intend to achieve with this change? Summarize the impact
this change has had on youth’s achievement of the Transition-to-Adulthood
outcomes and benchmarks. What did resources, referrals, or support did CFSA offer
when youth who aged out had no housing identified at the time of their 21st birthday?
The change in age of aftercare referrals to age 20 ½ was implemented to avoid
duplication of services to youth. While in foster care, youth have access to the following
supports through CFSA and the Office of Youth Empowerment: individualized transition
planning, educational support, connections to supportive services and agencies, career
pathways support, financial management, and transition planning support through the
JumpStart process.
CFSA’s data on youth outcomes indicate that the change did not have an impact on youth
achievement of the Transition to Adulthood outcomes and benchmarks as all the
necessary supports and services required for achieving the benchmarks are available
while youth are still in care.
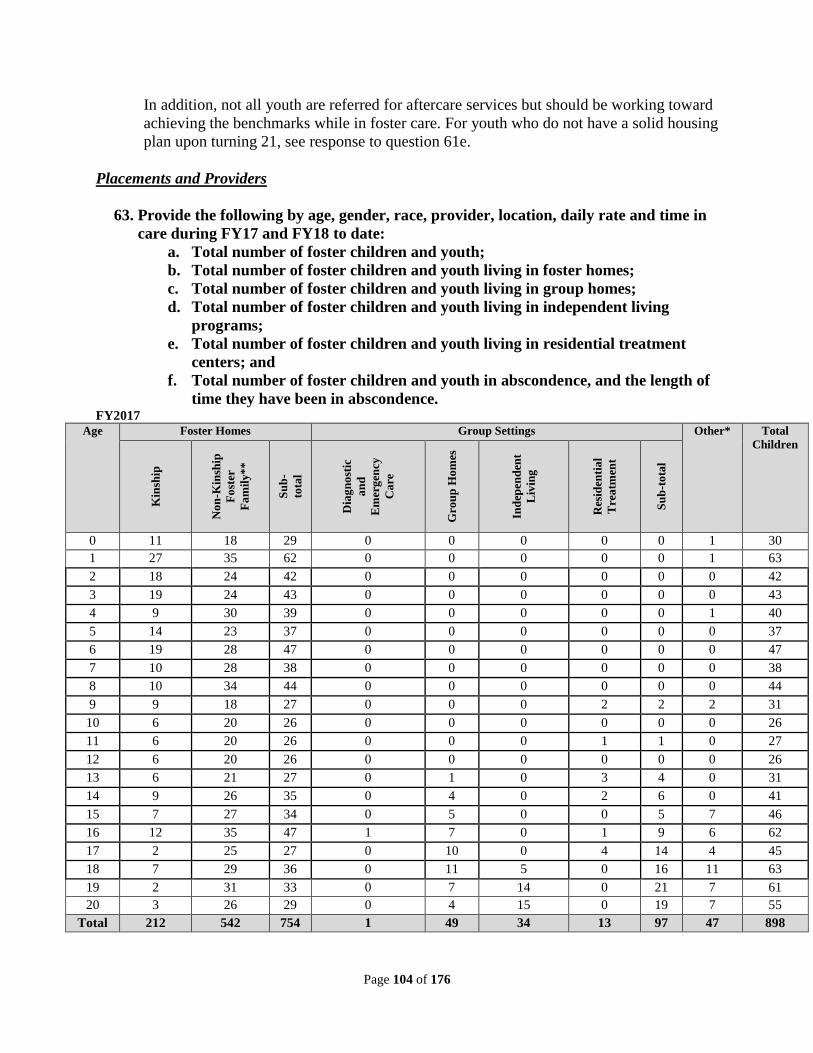
Page 104 of 176
In addition, not all youth are referred for aftercare services but should be working toward
achieving the benchmarks while in foster care. For youth who do not have a solid housing
plan upon turning 21, see response to question 61e.
Placements and Providers
63. Provide the following by age, gender, race, provider, location, daily rate and time in
care during FY17 and FY18 to date:
a. Total number of foster children and youth;
b. Total number of foster children and youth living in foster homes;
c. Total number of foster children and youth living in group homes;
d. Total number of foster children and youth living in independent living
programs;
e. Total number of foster children and youth living in residential treatment
centers; and
f. Total number of foster children and youth in abscondence, and the length of
time they have been in abscondence. FY2017
Age Foster Homes Group Settings Other* Total
Children
Kin
ship
No
n-K
insh
ip
Fo
ster
Fa
mil
y*
*
Su
b-
tota
l
Dia
gn
ost
ic
an
d
Em
erg
ency
Ca
re
Gro
up
Ho
mes
Ind
epen
den
t
Liv
ing
Res
iden
tia
l
Tre
atm
ent
Su
b-t
ota
l
0 11 18 29 0 0 0 0 0 1 30
1 27 35 62 0 0 0 0 0 1 63
2 18 24 42 0 0 0 0 0 0 42
3 19 24 43 0 0 0 0 0 0 43
4 9 30 39 0 0 0 0 0 1 40
5 14 23 37 0 0 0 0 0 0 37
6 19 28 47 0 0 0 0 0 0 47
7 10 28 38 0 0 0 0 0 0 38
8 10 34 44 0 0 0 0 0 0 44
9 9 18 27 0 0 0 2 2 2 31
10 6 20 26 0 0 0 0 0 0 26
11 6 20 26 0 0 0 1 1 0 27
12 6 20 26 0 0 0 0 0 0 26
13 6 21 27 0 1 0 3 4 0 31
14 9 26 35 0 4 0 2 6 0 41
15 7 27 34 0 5 0 0 5 7 46
16 12 35 47 1 7 0 1 9 6 62
17 2 25 27 0 10 0 4 14 4 45
18 7 29 36 0 11 5 0 16 11 63
19 2 31 33 0 7 14 0 21 7 61
20 3 26 29 0 4 15 0 19 7 55
Total 212 542 754 1 49 34 13 97 47 898
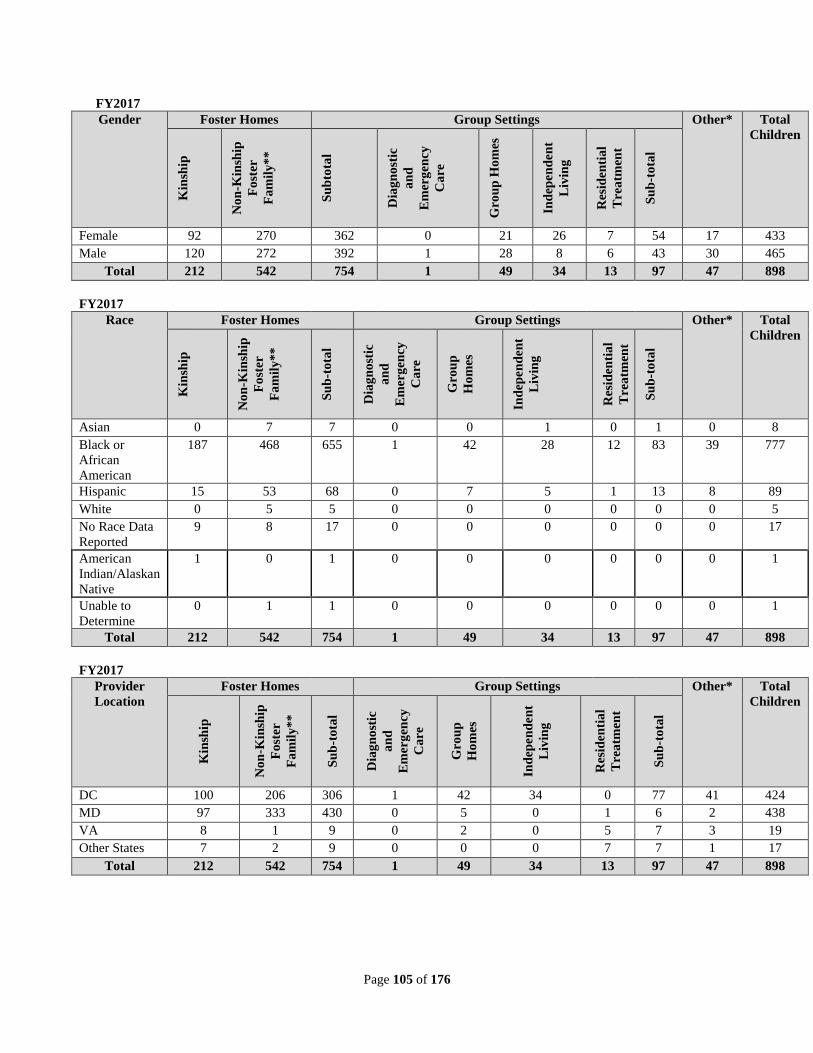
Page 105 of 176
FY2017
Gender Foster Homes Group Settings Other* Total
Children
Kin
ship
No
n-K
insh
ip
Fo
ster
Fa
mil
y*
*
Su
bto
tal
Dia
gn
ost
ic
an
d
Em
erg
ency
Ca
re
Gro
up
Ho
mes
Ind
epen
den
t
Liv
ing
Res
iden
tia
l
Tre
atm
ent
Su
b-t
ota
l
Female 92 270 362 0 21 26 7 54 17 433
Male 120 272 392 1 28 8 6 43 30 465
Total 212 542 754 1 49 34 13 97 47 898
FY2017
Race Foster Homes Group Settings Other*
Total
Children
Kin
ship
No
n-K
insh
ip
Fo
ster
Fa
mil
y*
*
Su
b-t
ota
l
Dia
gn
ost
ic
an
d
Em
erg
ency
Ca
re
Gro
up
Ho
mes
Ind
epen
den
t
Liv
ing
Res
iden
tia
l
Tre
atm
ent
Su
b-t
ota
l
Asian 0 7 7 0 0 1 0 1 0 8
Black or
African
American
187 468 655 1 42 28 12 83 39 777
Hispanic 15 53 68 0 7 5 1 13 8 89
White 0 5 5 0 0 0 0 0 0 5
No Race Data
Reported
9 8 17 0 0 0 0 0 0 17
American
Indian/Alaskan
Native
1 0 1 0 0 0 0 0 0 1
Unable to
Determine
0 1 1 0 0 0 0 0 0 1
Total 212 542 754 1 49 34 13 97 47 898
FY2017
Provider
Location
Foster Homes Group Settings Other* Total
Children
Kin
ship
No
n-K
insh
ip
Fo
ster
Fa
mil
y*
*
Su
b-t
ota
l
Dia
gn
ost
ic
an
d
Em
erg
ency
Ca
re
Gro
up
Ho
mes
Ind
epen
den
t
Liv
ing
Res
iden
tia
l
Tre
atm
ent
Su
b-t
ota
l
DC 100 206 306 1 42 34 0 77 41 424
MD 97 333 430 0 5 0 1 6 2 438
VA 8 1 9 0 2 0 5 7 3 19
Other States 7 2 9 0 0 0 7 7 1 17
Total 212 542 754 1 49 34 13 97 47 898
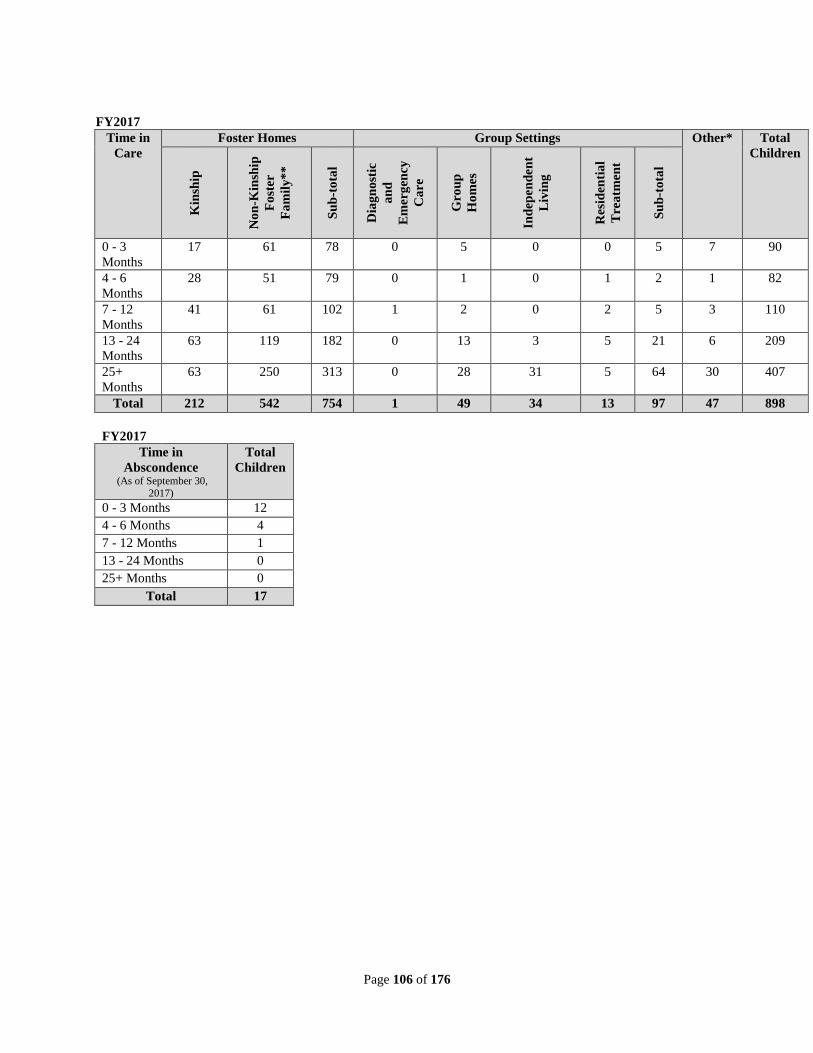
Page 106 of 176
FY2017
Time in
Care
Foster Homes Group Settings Other* Total
Children
Kin
ship
No
n-K
insh
ip
Fo
ster
Fa
mil
y*
*
Su
b-t
ota
l
Dia
gn
ost
ic
an
d
Em
erg
ency
Ca
re
Gro
up
Ho
mes
Ind
epen
den
t
Liv
ing
Res
iden
tia
l
Tre
atm
ent
Su
b-t
ota
l
0 - 3
Months
17 61 78 0 5 0 0 5 7 90
4 - 6
Months
28 51 79 0 1 0 1 2 1 82
7 - 12
Months
41 61 102 1 2 0 2 5 3 110
13 - 24
Months
63 119 182 0 13 3 5 21 6 209
25+
Months
63 250 313 0 28 31 5 64 30 407
Total 212 542 754 1 49 34 13 97 47 898
FY2017
Time in
Abscondence (As of September 30,
2017)
Total
Children
0 - 3 Months 12
4 - 6 Months 4
7 - 12 Months 1
13 - 24 Months 0
25+ Months 0
Total 17
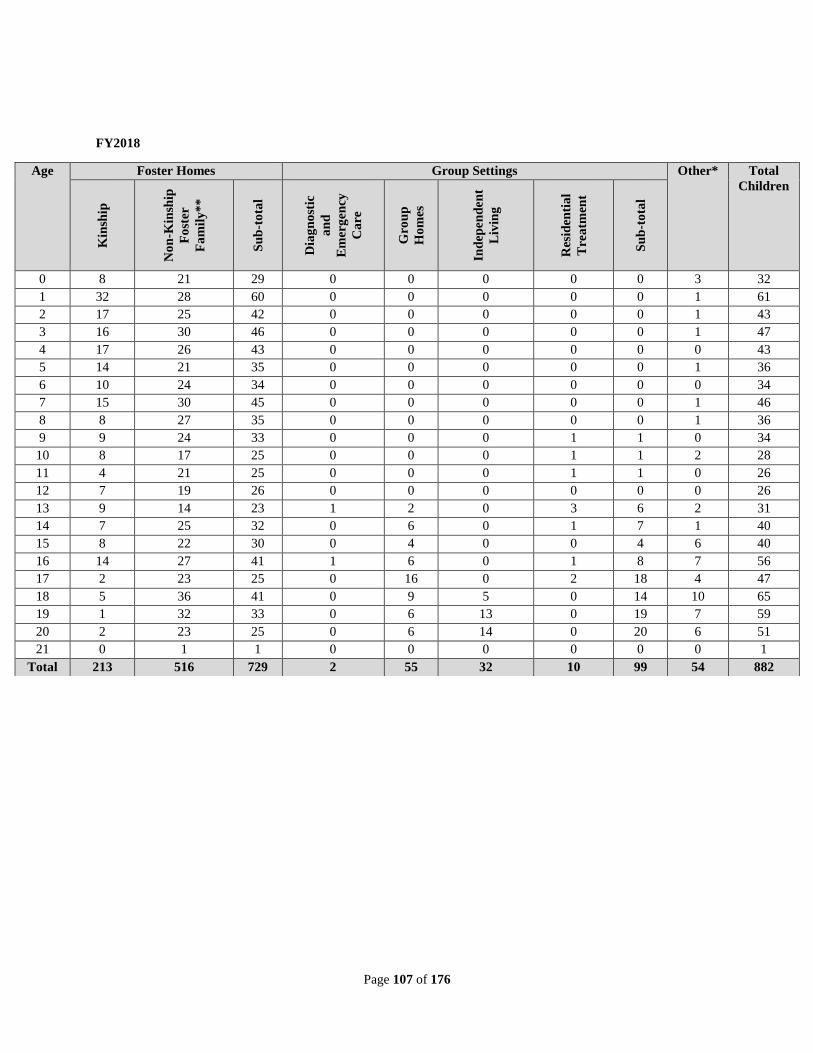
Page 107 of 176
FY2018
Age Foster Homes Group Settings Other* Total
Children
Kin
ship
No
n-K
insh
ip
Fo
ster
Fa
mil
y*
*
Su
b-t
ota
l
Dia
gn
ost
ic
an
d
Em
erg
ency
Ca
re
Gro
up
Ho
mes
Ind
epen
den
t
Liv
ing
Res
iden
tia
l
Tre
atm
ent
Su
b-t
ota
l
0 8 21 29 0 0 0 0 0 3 32
1 32 28 60 0 0 0 0 0 1 61
2 17 25 42 0 0 0 0 0 1 43
3 16 30 46 0 0 0 0 0 1 47
4 17 26 43 0 0 0 0 0 0 43
5 14 21 35 0 0 0 0 0 1 36
6 10 24 34 0 0 0 0 0 0 34
7 15 30 45 0 0 0 0 0 1 46
8 8 27 35 0 0 0 0 0 1 36
9 9 24 33 0 0 0 1 1 0 34
10 8 17 25 0 0 0 1 1 2 28
11 4 21 25 0 0 0 1 1 0 26
12 7 19 26 0 0 0 0 0 0 26
13 9 14 23 1 2 0 3 6 2 31
14 7 25 32 0 6 0 1 7 1 40
15 8 22 30 0 4 0 0 4 6 40
16 14 27 41 1 6 0 1 8 7 56
17 2 23 25 0 16 0 2 18 4 47
18 5 36 41 0 9 5 0 14 10 65
19 1 32 33 0 6 13 0 19 7 59
20 2 23 25 0 6 14 0 20 6 51
21 0 1 1 0 0 0 0 0 0 1
Total 213 516 729 2 55 32 10 99 54 882
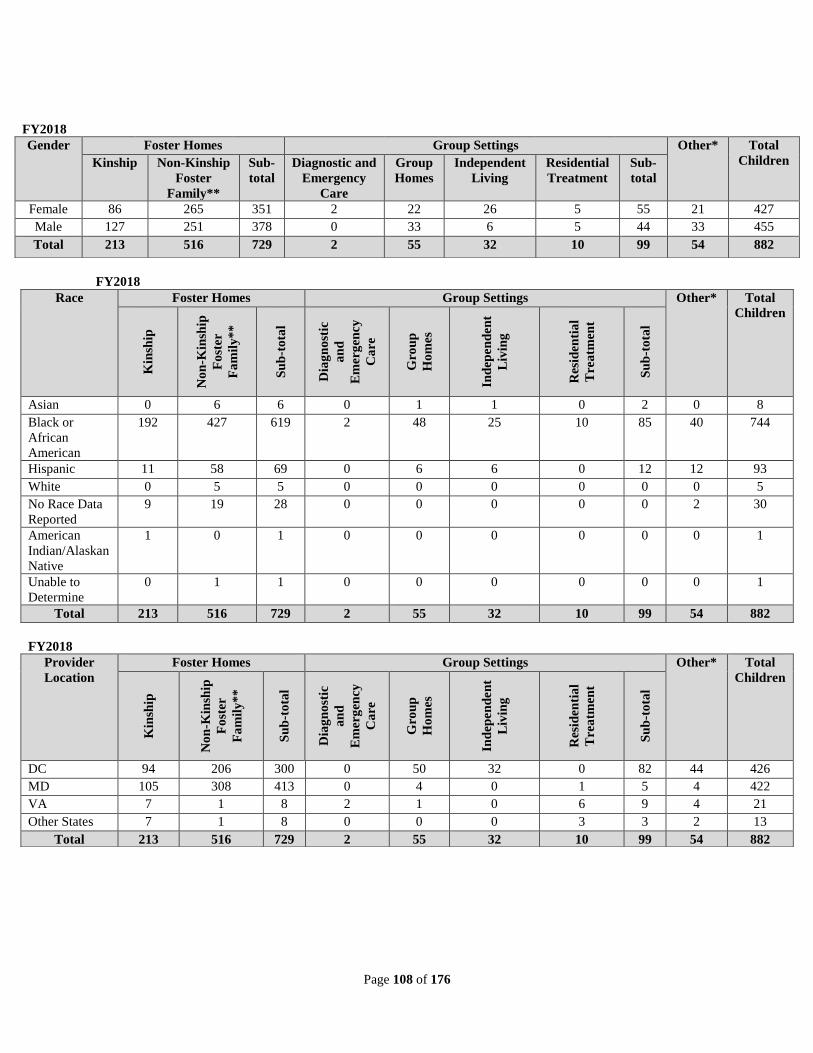
Page 108 of 176
FY2018
FY2018
Gender Foster Homes Group Settings Other* Total
Children Kinship Non-Kinship
Foster
Family**
Sub-
total
Diagnostic and
Emergency
Care
Group
Homes
Independent
Living
Residential
Treatment
Sub-
total
Female 86 265 351 2 22 26 5 55 21 427
Male 127 251 378 0 33 6 5 44 33 455
Total 213 516 729 2 55 32 10 99 54 882
Race Foster Homes Group Settings Other* Total
Children
Kin
ship
No
n-K
insh
ip
Fo
ster
Fa
mil
y*
*
Su
b-t
ota
l
Dia
gn
ost
ic
an
d
Em
erg
ency
Ca
re
Gro
up
Ho
mes
Ind
epen
den
t
Liv
ing
Res
iden
tia
l
Tre
atm
ent
Su
b-t
ota
l
Asian 0 6 6 0 1 1 0 2 0 8
Black or
African
American
192 427 619 2 48 25 10 85 40 744
Hispanic 11 58 69 0 6 6 0 12 12 93
White 0 5 5 0 0 0 0 0 0 5
No Race Data
Reported
9 19 28 0 0 0 0 0 2 30
American
Indian/Alaskan
Native
1 0 1 0 0 0 0 0 0 1
Unable to
Determine
0 1 1 0 0 0 0 0 0 1
Total 213 516 729 2 55 32 10 99 54 882
FY2018
Provider
Location
Foster Homes Group Settings Other* Total
Children
Kin
ship
No
n-K
insh
ip
Fo
ster
Fa
mil
y*
*
Su
b-t
ota
l
Dia
gn
ost
ic
an
d
Em
erg
ency
Ca
re
Gro
up
Ho
mes
Ind
epen
den
t
Liv
ing
Res
iden
tia
l
Tre
atm
ent
Su
b-t
ota
l
DC 94 206 300 0 50 32 0 82 44 426
MD 105 308 413 0 4 0 1 5 4 422
VA 7 1 8 2 1 0 6 9 4 21
Other States 7 1 8 0 0 0 3 3 2 13
Total 213 516 729 2 55 32 10 99 54 882
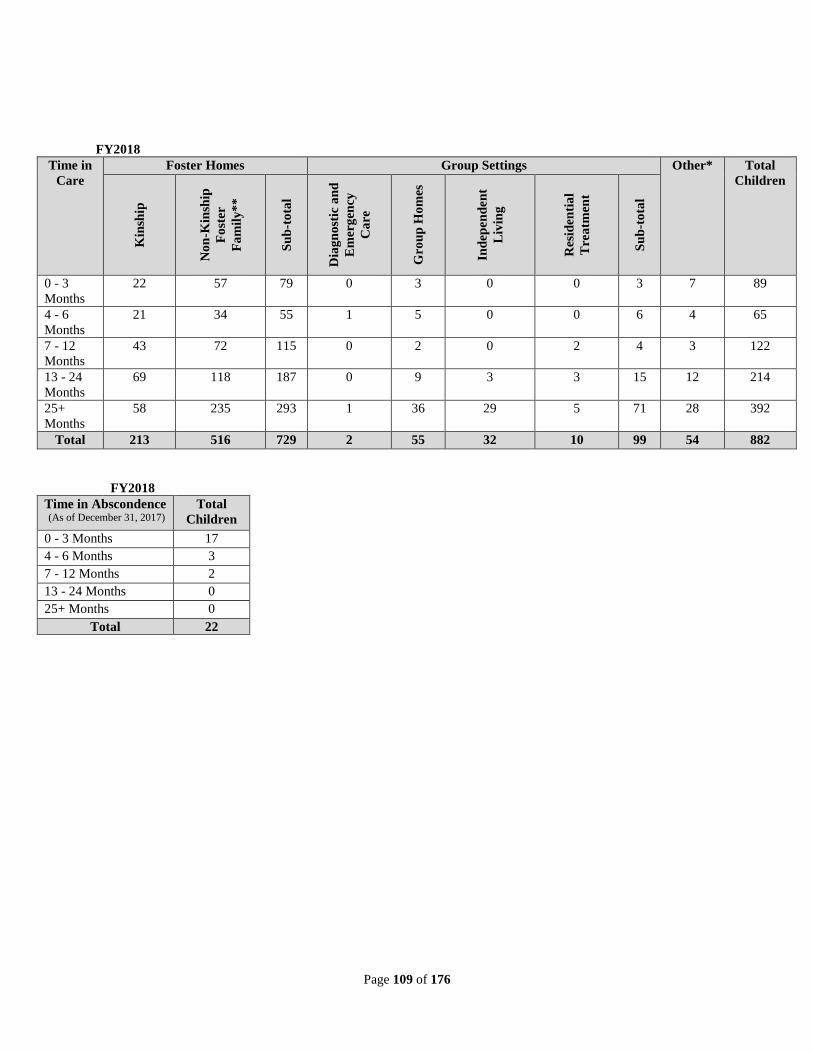
Page 109 of 176
FY2018 Time in
Care
Foster Homes Group Settings Other* Total
Children
Kin
ship
No
n-K
insh
ip
Fo
ster
Fa
mil
y*
*
Su
b-t
ota
l
Dia
gn
ost
ic a
nd
Em
erg
ency
Ca
re
Gro
up
Ho
mes
Ind
epen
den
t
Liv
ing
Res
iden
tia
l
Tre
atm
ent
Su
b-t
ota
l
0 - 3
Months
22 57 79 0 3 0 0 3 7 89
4 - 6
Months
21 34 55 1 5 0 0 6 4 65
7 - 12
Months
43 72 115 0 2 0 2 4 3 122
13 - 24
Months
69 118 187 0 9 3 3 15 12 214
25+
Months
58 235 293 1 36 29 5 71 28 392
Total 213 516 729 2 55 32 10 99 54 882
FY2018
Time in Abscondence (As of December 31, 2017)
Total
Children
0 - 3 Months 17
4 - 6 Months 3
7 - 12 Months 2
13 - 24 Months 0
25+ Months 0
Total 22
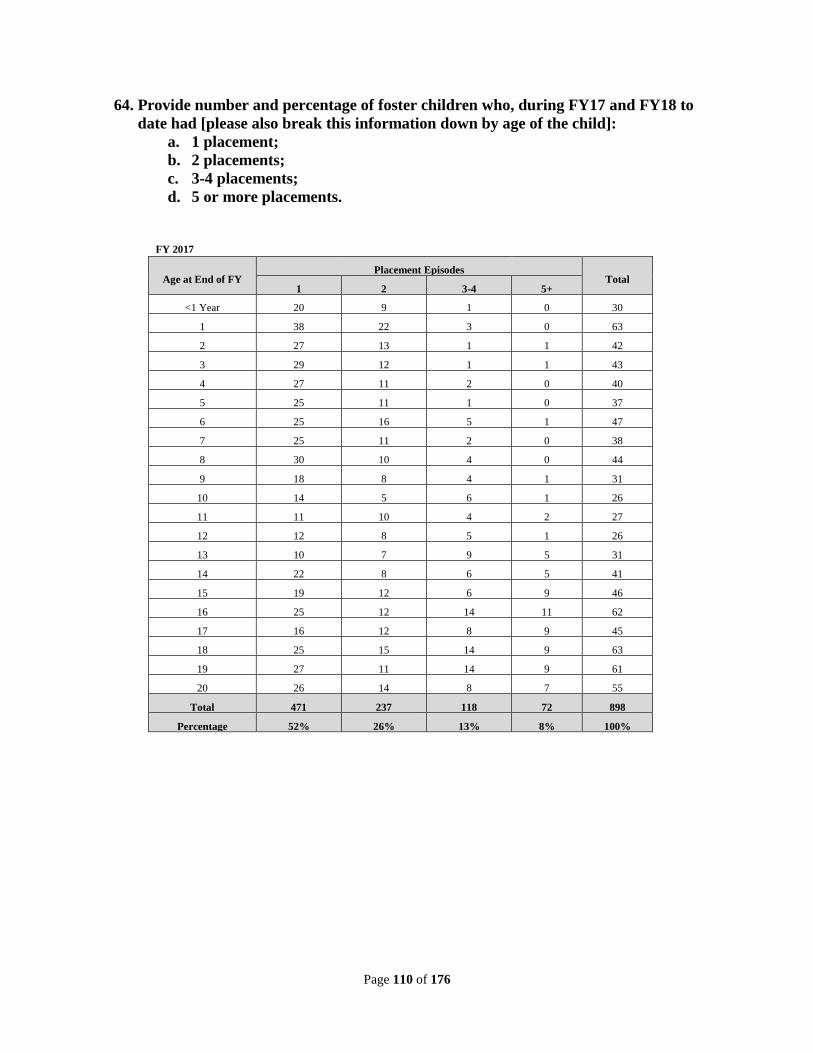
Page 110 of 176
64. Provide number and percentage of foster children who, during FY17 and FY18 to
date had [please also break this information down by age of the child]:
a. 1 placement;
b. 2 placements;
c. 3-4 placements;
d. 5 or more placements.
FY 2017
Age at End of FY Placement Episodes
Total 1 2 3-4 5+
<1 Year 20 9 1 0 30
1 38 22 3 0 63
2 27 13 1 1 42
3 29 12 1 1 43
4 27 11 2 0 40
5 25 11 1 0 37
6 25 16 5 1 47
7 25 11 2 0 38
8 30 10 4 0 44
9 18 8 4 1 31
10 14 5 6 1 26
11 11 10 4 2 27
12 12 8 5 1 26
13 10 7 9 5 31
14 22 8 6 5 41
15 19 12 6 9 46
16 25 12 14 11 62
17 16 12 8 9 45
18 25 15 14 9 63
19 27 11 14 9 61
20 26 14 8 7 55
Total 471 237 118 72 898
Percentage 52% 26% 13% 8% 100%
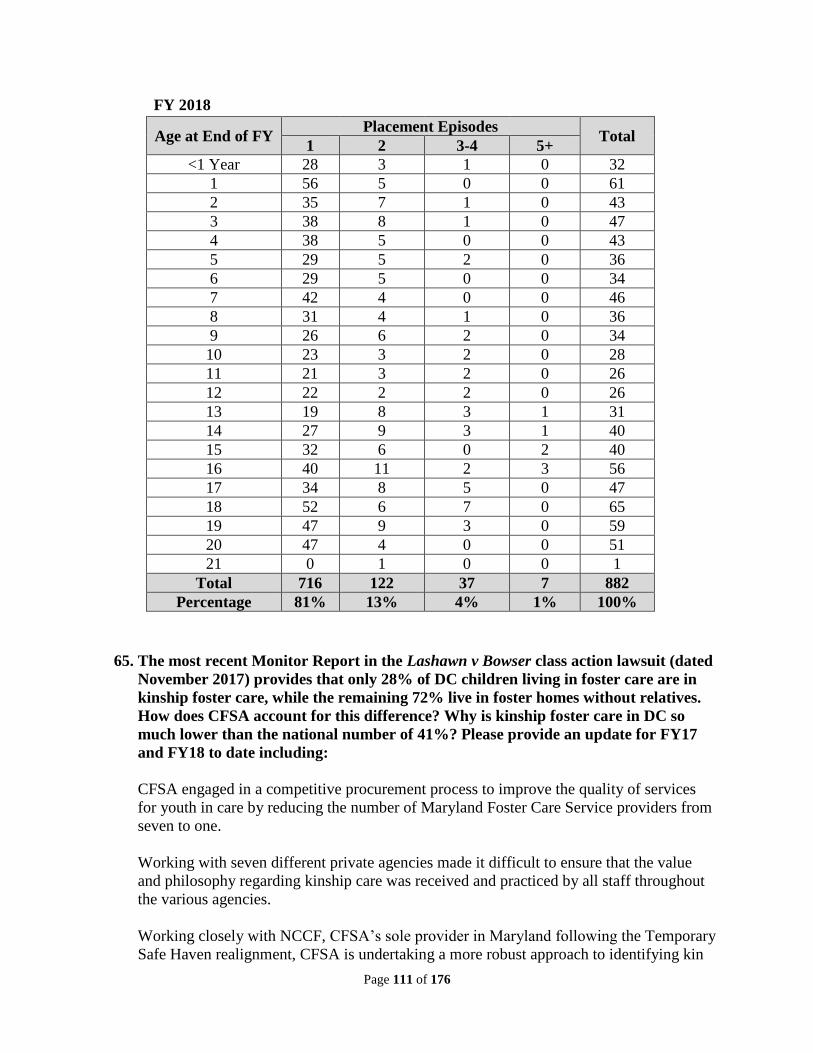
Page 111 of 176
FY 2018
Age at End of FY Placement Episodes
Total 1 2 3-4 5+
<1 Year 28 3 1 0 32
1 56 5 0 0 61
2 35 7 1 0 43
3 38 8 1 0 47
4 38 5 0 0 43
5 29 5 2 0 36
6 29 5 0 0 34
7 42 4 0 0 46
8 31 4 1 0 36
9 26 6 2 0 34
10 23 3 2 0 28
11 21 3 2 0 26
12 22 2 2 0 26
13 19 8 3 1 31
14 27 9 3 1 40
15 32 6 0 2 40
16 40 11 2 3 56
17 34 8 5 0 47
18 52 6 7 0 65
19 47 9 3 0 59
20 47 4 0 0 51
21 0 1 0 0 1
Total 716 122 37 7 882
Percentage 81% 13% 4% 1% 100%
65. The most recent Monitor Report in the Lashawn v Bowser class action lawsuit (dated
November 2017) provides that only 28% of DC children living in foster care are in
kinship foster care, while the remaining 72% live in foster homes without relatives.
How does CFSA account for this difference? Why is kinship foster care in DC so
much lower than the national number of 41%? Please provide an update for FY17
and FY18 to date including:
CFSA engaged in a competitive procurement process to improve the quality of services
for youth in care by reducing the number of Maryland Foster Care Service providers from
seven to one.
Working with seven different private agencies made it difficult to ensure that the value
and philosophy regarding kinship care was received and practiced by all staff throughout
the various agencies.
Working closely with NCCF, CFSA’s sole provider in Maryland following the Temporary
Safe Haven realignment, CFSA is undertaking a more robust approach to identifying kin
Page 112 of 176
and working to mitigate barriers to placing children with kin wherever possible. During
FY2018, NCCF will implement two additional evidenced-based models; 30 Days to
Family and Extreme Recruitment.
Many of our kin/support families reside is Maryland. Although many are willing to be
licensed, many are screened out because they do not meet COMAR regulations (34% of
foster care youth are placed in Maryland). Unfortunately, the state of Maryland does not
use waivers, and CFSA does not have jurisdiction outside of DC. Sometimes, this makes it
more difficult to place our youth with kin in Maryland.
a. The percentage of foster children placed with kin. Increasing the number of
children and youth placed with kin remains a key CFSA strategy for first
placement and subsequently if kin were not initially available. In 2012, CFSA
consulted with the Annie E. Casey Foundation to assess kinship policy and
practice strategies and with a strong kinship care provider agency in another
state for best practices, resulting in the CFSA KinFirst program. Following
these consultations, CFSA increased kinship placements from 16 percent in
2012 to 24 percent in 2017.
b. What efforts did CFSA make to increase the percentage of foster children
placed with kin? CFSA continues to focus on improving policies and
practices to increase the percentage of youth in care who are placed with kin.
In December 2017, CFSA engaged A Second Chance, Inc., with support
through Casey Family Programs, to complete an organizational assessment of
kinship policies and practices, which will culminate in an analysis and
recommendations in April 2018.
While CFSA will receive recommendations from the analysis, much work has
and will be done with our partner provider NCCF to undertake a more robust
approach to identifying kin and working to mitigate barriers to placing
children with kin wherever possible. During FY2018, NCCF will implement
two additional evidenced-based models: 30 Days to Family and Extreme
Recruitment. CFSA will determine what aspects of these evidenced based
practices we will implement at CFSA.
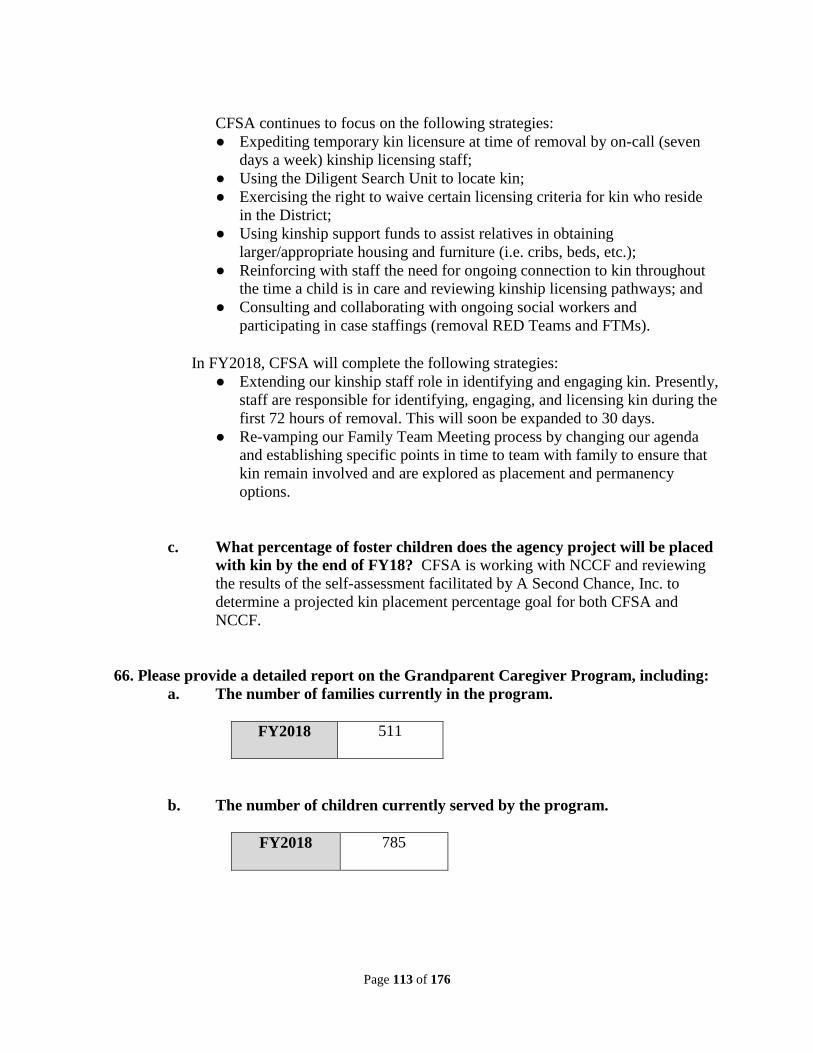
Page 113 of 176
CFSA continues to focus on the following strategies:
● Expediting temporary kin licensure at time of removal by on-call (seven
days a week) kinship licensing staff;
● Using the Diligent Search Unit to locate kin;
● Exercising the right to waive certain licensing criteria for kin who reside
in the District;
● Using kinship support funds to assist relatives in obtaining
larger/appropriate housing and furniture (i.e. cribs, beds, etc.);
● Reinforcing with staff the need for ongoing connection to kin throughout
the time a child is in care and reviewing kinship licensing pathways; and
● Consulting and collaborating with ongoing social workers and
participating in case staffings (removal RED Teams and FTMs).
In FY2018, CFSA will complete the following strategies:
● Extending our kinship staff role in identifying and engaging kin. Presently,
staff are responsible for identifying, engaging, and licensing kin during the
first 72 hours of removal. This will soon be expanded to 30 days.
● Re-vamping our Family Team Meeting process by changing our agenda
and establishing specific points in time to team with family to ensure that
kin remain involved and are explored as placement and permanency
options.
c. What percentage of foster children does the agency project will be placed
with kin by the end of FY18? CFSA is working with NCCF and reviewing
the results of the self-assessment facilitated by A Second Chance, Inc. to
determine a projected kin placement percentage goal for both CFSA and
NCCF.
66. Please provide a detailed report on the Grandparent Caregiver Program, including:
a. The number of families currently in the program.
FY2018
511
b. The number of children currently served by the program.
FY2018
785
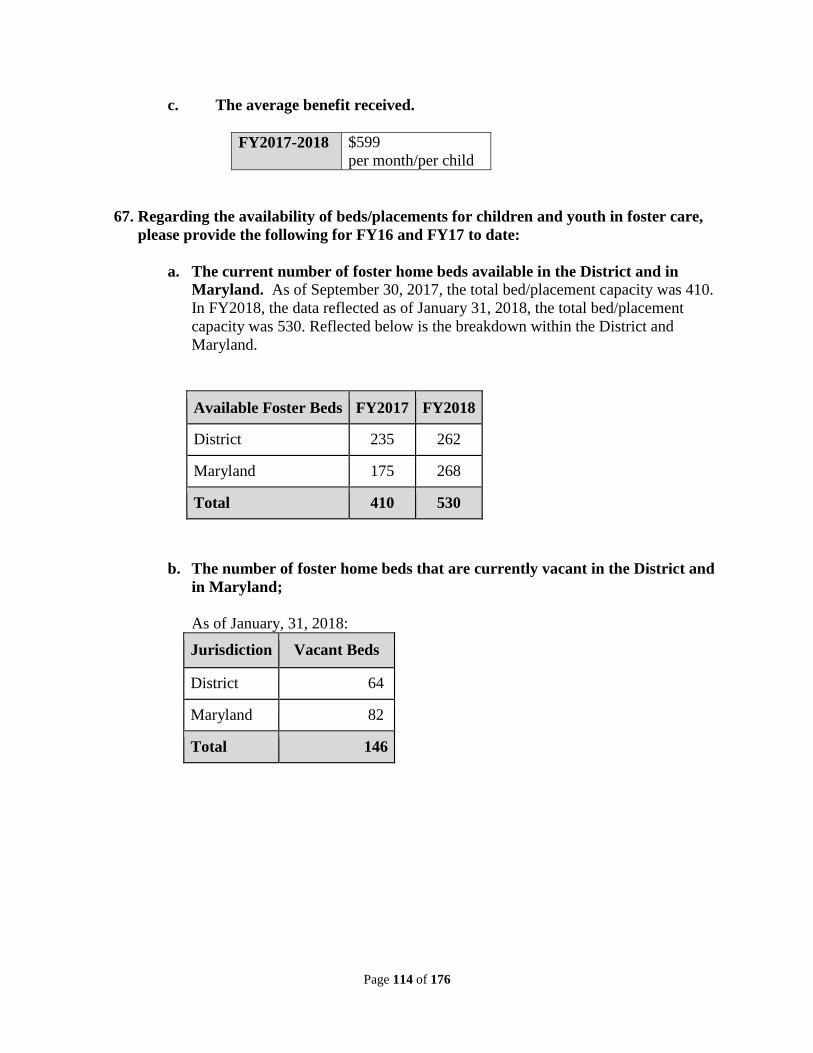
Page 114 of 176
c. The average benefit received.
FY2017-2018
$599
per month/per child
67. Regarding the availability of beds/placements for children and youth in foster care,
please provide the following for FY16 and FY17 to date:
a. The current number of foster home beds available in the District and in
Maryland. As of September 30, 2017, the total bed/placement capacity was 410.
In FY2018, the data reflected as of January 31, 2018, the total bed/placement
capacity was 530. Reflected below is the breakdown within the District and
Maryland.
Available Foster Beds FY2017 FY2018
District 235 262
Maryland 175 268
Total 410 530
b. The number of foster home beds that are currently vacant in the District and
in Maryland;
As of January, 31, 2018:
Jurisdiction Vacant Beds
District 64
Maryland 82
Total 146
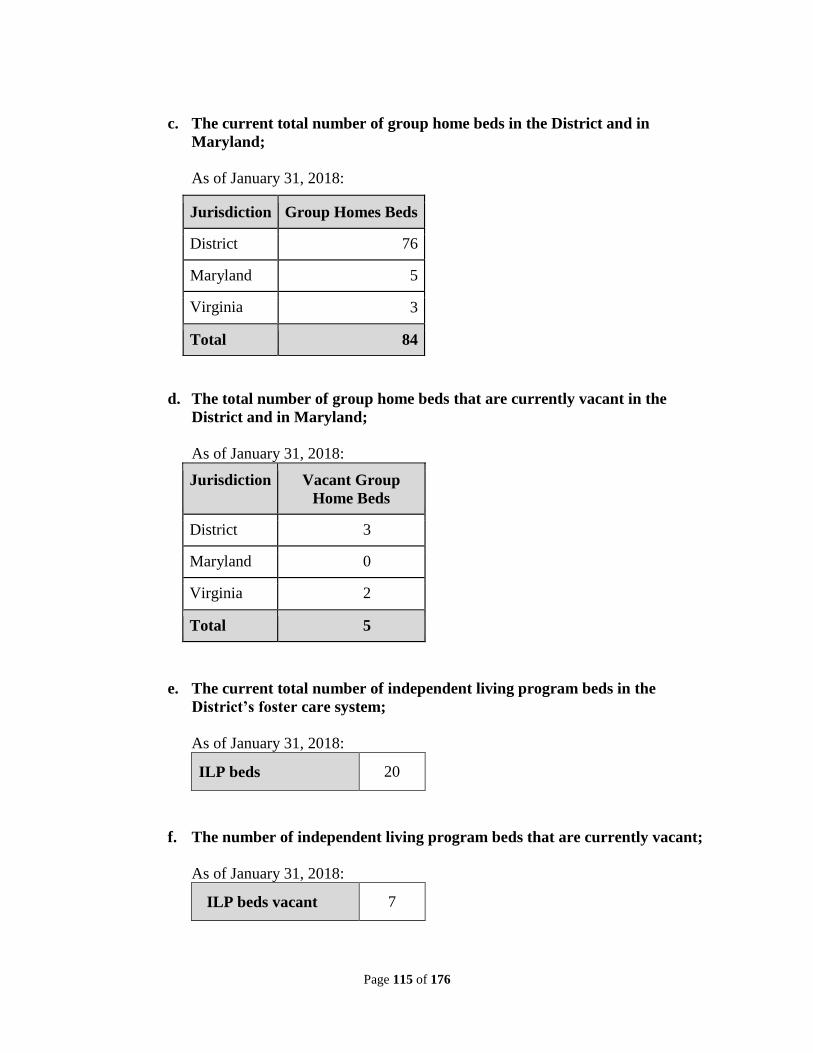
Page 115 of 176
c. The current total number of group home beds in the District and in
Maryland;
As of January 31, 2018:
d. The total number of group home beds that are currently vacant in the
District and in Maryland;
As of January 31, 2018:
Jurisdiction Vacant Group
Home Beds
District 3
Maryland 0
Virginia 2
Total 5
e. The current total number of independent living program beds in the
District’s foster care system;
As of January 31, 2018:
ILP beds 20
f. The number of independent living program beds that are currently vacant;
As of January 31, 2018:
ILP beds vacant 7
Jurisdiction Group Homes Beds
District 76
Maryland 5
Virginia 3
Total 84
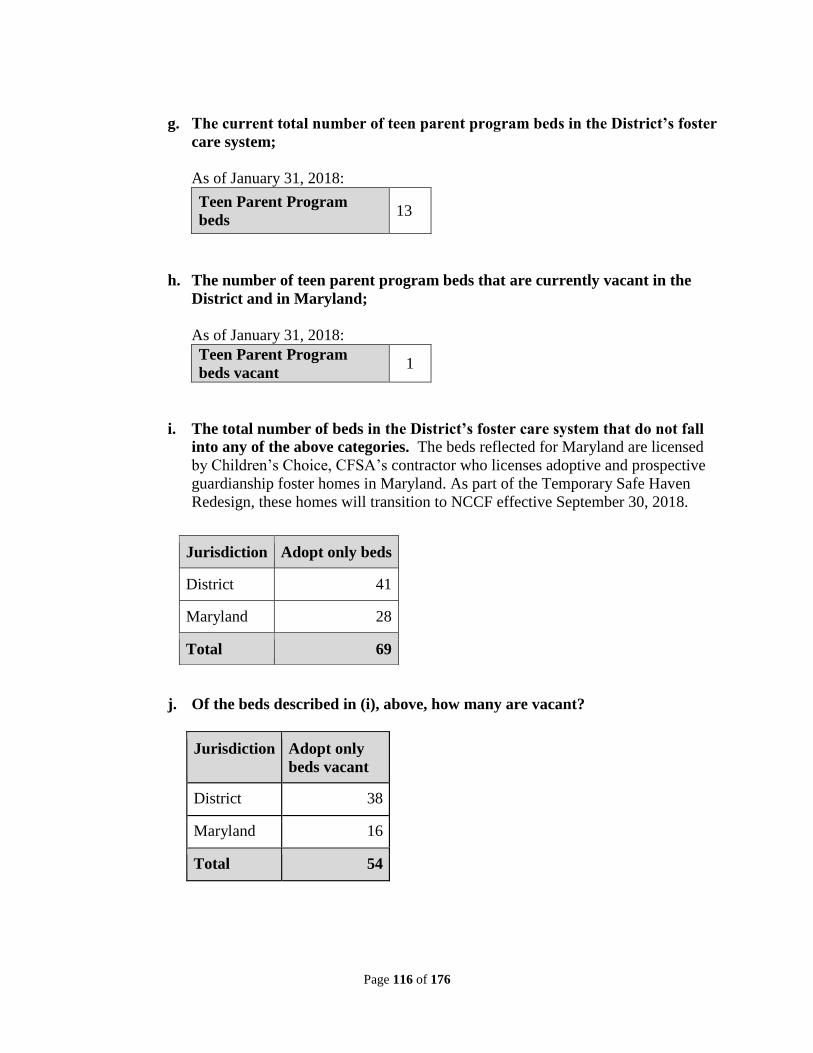
Page 116 of 176
g. The current total number of teen parent program beds in the District’s foster
care system;
As of January 31, 2018:
Teen Parent Program
beds 13
h. The number of teen parent program beds that are currently vacant in the
District and in Maryland;
As of January 31, 2018:
Teen Parent Program
beds vacant 1
i. The total number of beds in the District’s foster care system that do not fall
into any of the above categories. The beds reflected for Maryland are licensed
by Children’s Choice, CFSA’s contractor who licenses adoptive and prospective
guardianship foster homes in Maryland. As part of the Temporary Safe Haven
Redesign, these homes will transition to NCCF effective September 30, 2018.
j. Of the beds described in (i), above, how many are vacant?
Jurisdiction Adopt only
beds vacant
District 38
Maryland 16
Total 54
Jurisdiction Adopt only beds
District 41
Maryland 28
Total 69
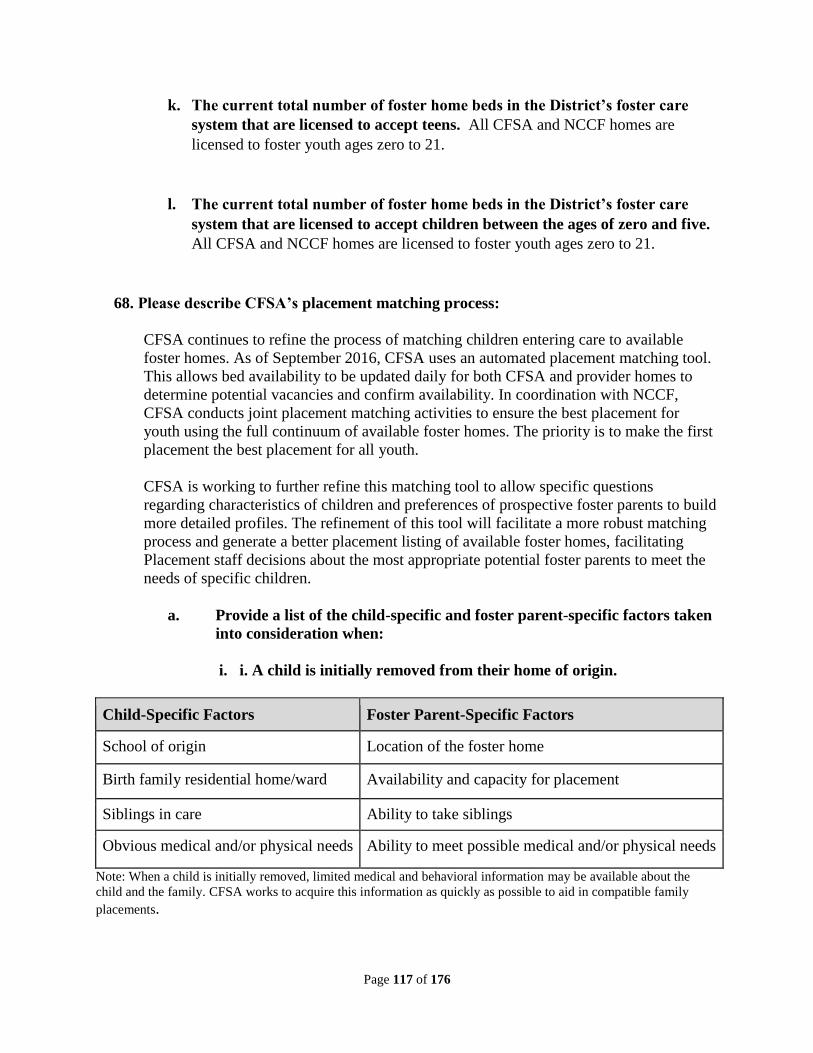
Page 117 of 176
k. The current total number of foster home beds in the District’s foster care
system that are licensed to accept teens. All CFSA and NCCF homes are
licensed to foster youth ages zero to 21.
l. The current total number of foster home beds in the District’s foster care
system that are licensed to accept children between the ages of zero and five.
All CFSA and NCCF homes are licensed to foster youth ages zero to 21.
68. Please describe CFSA’s placement matching process:
CFSA continues to refine the process of matching children entering care to available
foster homes. As of September 2016, CFSA uses an automated placement matching tool.
This allows bed availability to be updated daily for both CFSA and provider homes to
determine potential vacancies and confirm availability. In coordination with NCCF,
CFSA conducts joint placement matching activities to ensure the best placement for
youth using the full continuum of available foster homes. The priority is to make the first
placement the best placement for all youth.
CFSA is working to further refine this matching tool to allow specific questions
regarding characteristics of children and preferences of prospective foster parents to build
more detailed profiles. The refinement of this tool will facilitate a more robust matching
process and generate a better placement listing of available foster homes, facilitating
Placement staff decisions about the most appropriate potential foster parents to meet the
needs of specific children.
a. Provide a list of the child-specific and foster parent-specific factors taken
into consideration when:
i. i. A child is initially removed from their home of origin.
Child-Specific Factors Foster Parent-Specific Factors
School of origin Location of the foster home
Birth family residential home/ward Availability and capacity for placement
Siblings in care Ability to take siblings
Obvious medical and/or physical needs Ability to meet possible medical and/or physical needs
Note: When a child is initially removed, limited medical and behavioral information may be available about the
child and the family. CFSA works to acquire this information as quickly as possible to aid in compatible family
placements.
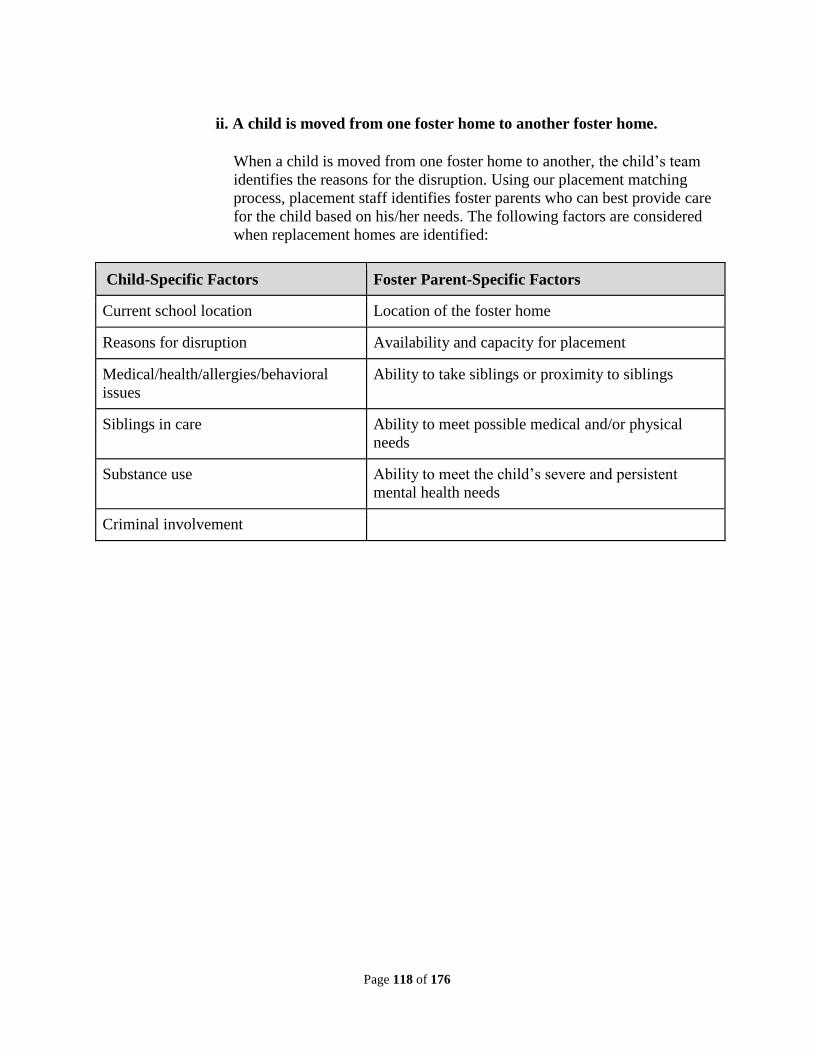
Page 118 of 176
ii. A child is moved from one foster home to another foster home.
When a child is moved from one foster home to another, the child’s team
identifies the reasons for the disruption. Using our placement matching
process, placement staff identifies foster parents who can best provide care
for the child based on his/her needs. The following factors are considered
when replacement homes are identified:
Child-Specific Factors Foster Parent-Specific Factors
Current school location Location of the foster home
Reasons for disruption Availability and capacity for placement
Medical/health/allergies/behavioral
issues
Ability to take siblings or proximity to siblings
Siblings in care Ability to meet possible medical and/or physical
needs
Substance use Ability to meet the child’s severe and persistent
mental health needs
Criminal involvement
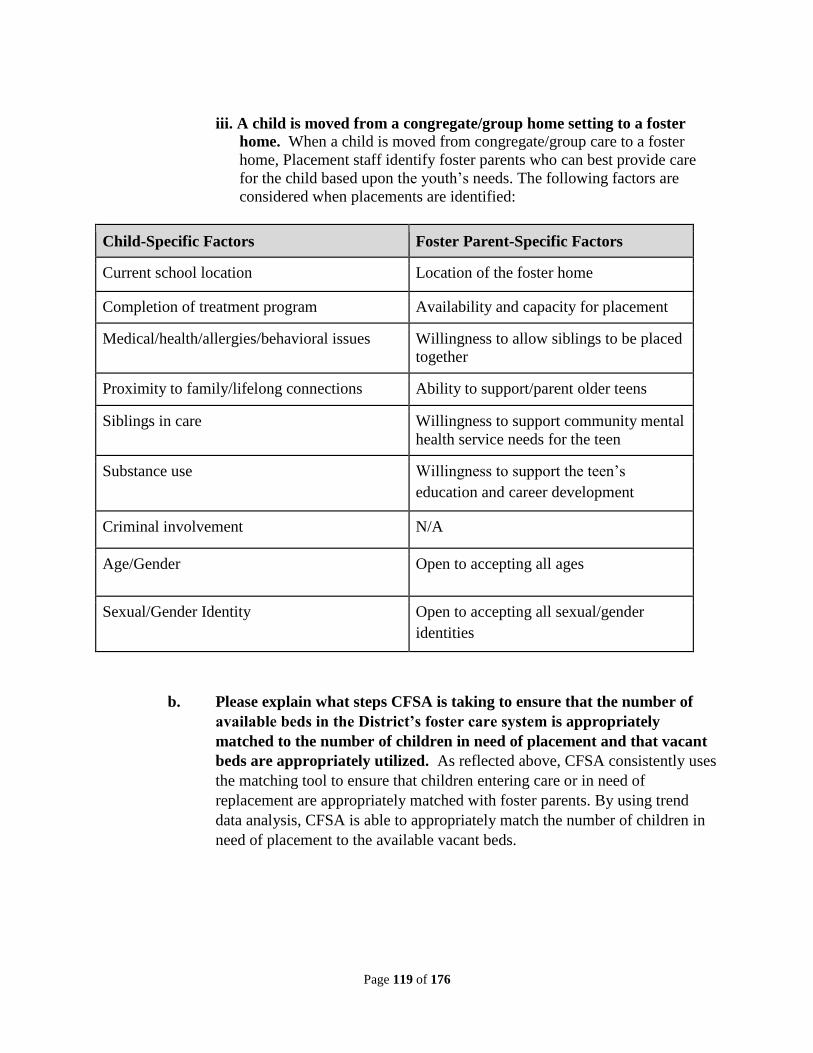
Page 119 of 176
iii. A child is moved from a congregate/group home setting to a foster
home. When a child is moved from congregate/group care to a foster
home, Placement staff identify foster parents who can best provide care
for the child based upon the youth’s needs. The following factors are
considered when placements are identified:
Child-Specific Factors Foster Parent-Specific Factors
Current school location Location of the foster home
Completion of treatment program Availability and capacity for placement
Medical/health/allergies/behavioral issues Willingness to allow siblings to be placed
together
Proximity to family/lifelong connections Ability to support/parent older teens
Siblings in care Willingness to support community mental
health service needs for the teen
Substance use Willingness to support the teen’s
education and career development
Criminal involvement N/A
Age/Gender Open to accepting all ages
Sexual/Gender Identity Open to accepting all sexual/gender
identities
b. Please explain what steps CFSA is taking to ensure that the number of
available beds in the District’s foster care system is appropriately
matched to the number of children in need of placement and that vacant
beds are appropriately utilized. As reflected above, CFSA consistently uses
the matching tool to ensure that children entering care or in need of
replacement are appropriately matched with foster parents. By using trend
data analysis, CFSA is able to appropriately match the number of children in
need of placement to the available vacant beds.
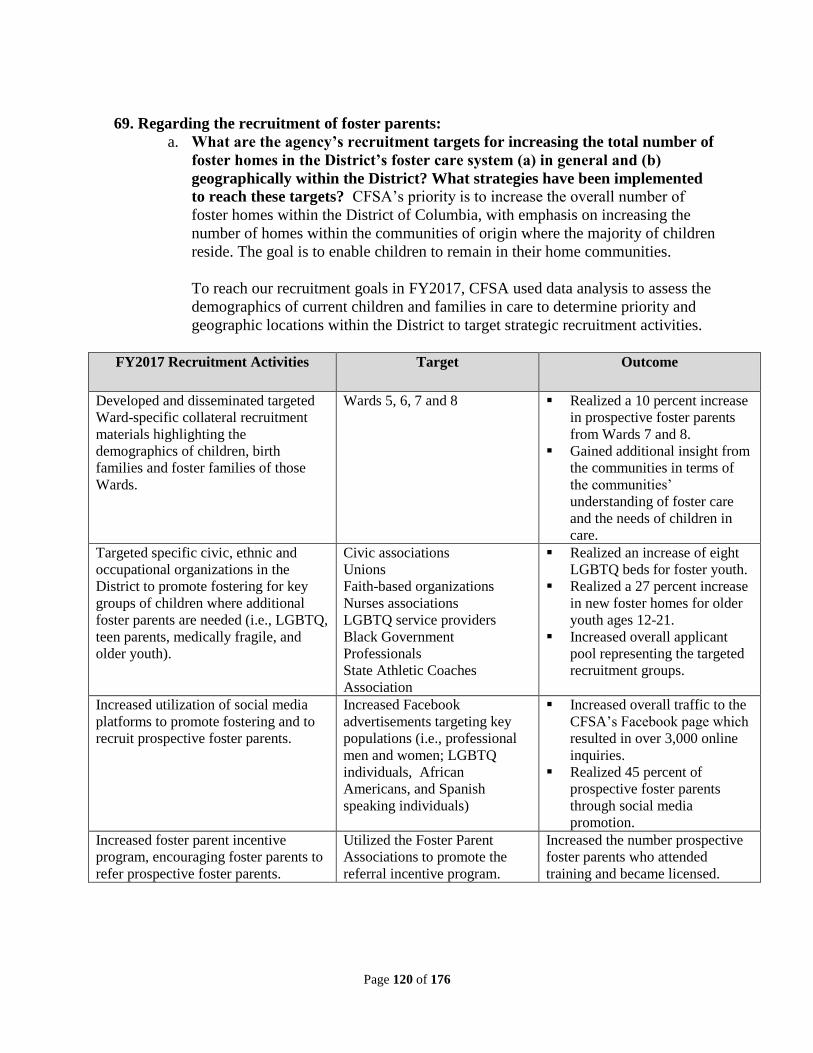
Page 120 of 176
69. Regarding the recruitment of foster parents:
a. What are the agency’s recruitment targets for increasing the total number of
foster homes in the District’s foster care system (a) in general and (b)
geographically within the District? What strategies have been implemented
to reach these targets? CFSA’s priority is to increase the overall number of
foster homes within the District of Columbia, with emphasis on increasing the
number of homes within the communities of origin where the majority of children
reside. The goal is to enable children to remain in their home communities.
To reach our recruitment goals in FY2017, CFSA used data analysis to assess the
demographics of current children and families in care to determine priority and
geographic locations within the District to target strategic recruitment activities.
FY2017 Recruitment Activities Target Outcome
Developed and disseminated targeted
Ward-specific collateral recruitment
materials highlighting the
demographics of children, birth
families and foster families of those
Wards.
Wards 5, 6, 7 and 8 Realized a 10 percent increase
in prospective foster parents
from Wards 7 and 8.
Gained additional insight from
the communities in terms of
the communities’
understanding of foster care
and the needs of children in
care.
Targeted specific civic, ethnic and
occupational organizations in the
District to promote fostering for key
groups of children where additional
foster parents are needed (i.e., LGBTQ,
teen parents, medically fragile, and
older youth).
Civic associations
Unions
Faith-based organizations
Nurses associations
LGBTQ service providers
Black Government
Professionals
State Athletic Coaches
Association
Realized an increase of eight
LGBTQ beds for foster youth.
Realized a 27 percent increase
in new foster homes for older
youth ages 12-21.
Increased overall applicant
pool representing the targeted
recruitment groups.
Increased utilization of social media
platforms to promote fostering and to
recruit prospective foster parents.
Increased Facebook
advertisements targeting key
populations (i.e., professional
men and women; LGBTQ
individuals, African
Americans, and Spanish
speaking individuals)
Increased overall traffic to the
CFSA’s Facebook page which
resulted in over 3,000 online
inquiries.
Realized 45 percent of
prospective foster parents
through social media
promotion.
Increased foster parent incentive
program, encouraging foster parents to
refer prospective foster parents.
Utilized the Foster Parent
Associations to promote the
referral incentive program.
Increased the number prospective
foster parents who attended
training and became licensed.
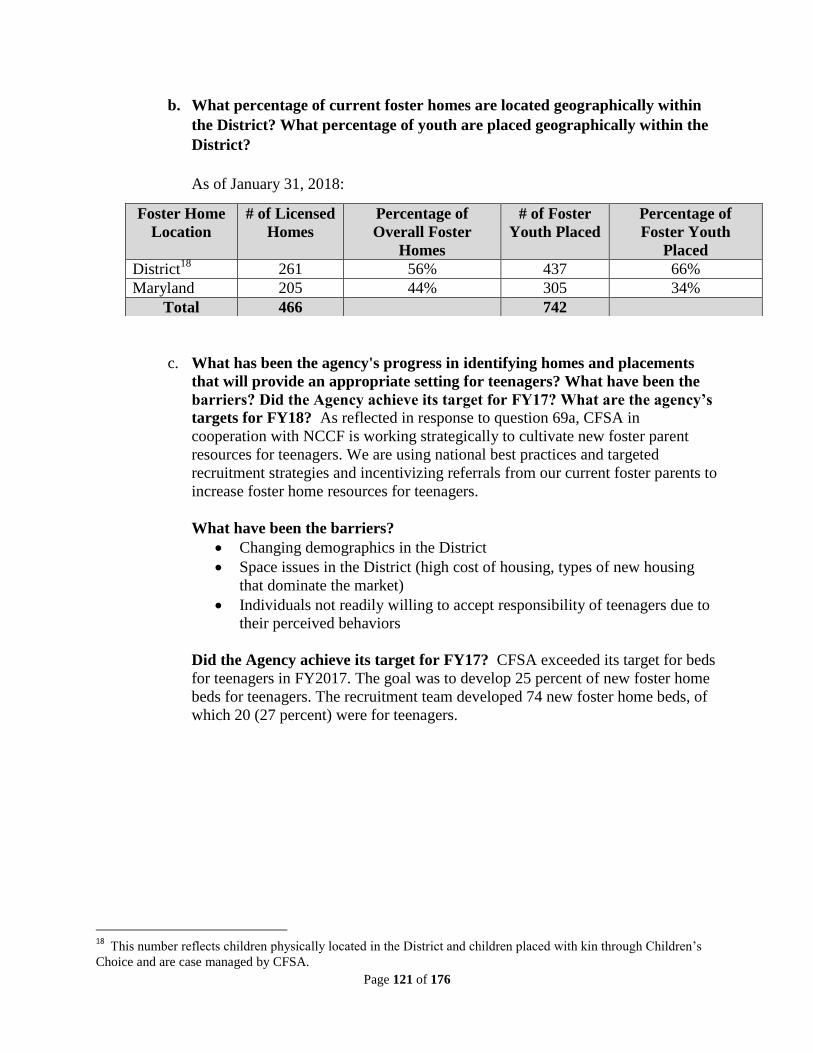
Page 121 of 176
b. What percentage of current foster homes are located geographically within
the District? What percentage of youth are placed geographically within the
District?
As of January 31, 2018:
c. What has been the agency's progress in identifying homes and placements
that will provide an appropriate setting for teenagers? What have been the
barriers? Did the Agency achieve its target for FY17? What are the agency’s
targets for FY18? As reflected in response to question 69a, CFSA in
cooperation with NCCF is working strategically to cultivate new foster parent
resources for teenagers. We are using national best practices and targeted
recruitment strategies and incentivizing referrals from our current foster parents to
increase foster home resources for teenagers.
What have been the barriers?
Changing demographics in the District
Space issues in the District (high cost of housing, types of new housing
that dominate the market)
Individuals not readily willing to accept responsibility of teenagers due to
their perceived behaviors
Did the Agency achieve its target for FY17? CFSA exceeded its target for beds
for teenagers in FY2017. The goal was to develop 25 percent of new foster home
beds for teenagers. The recruitment team developed 74 new foster home beds, of
which 20 (27 percent) were for teenagers.
18
This number reflects children physically located in the District and children placed with kin through Children’s
Choice and are case managed by CFSA.
Foster Home
Location
# of Licensed
Homes
Percentage of
Overall Foster
Homes
# of Foster
Youth Placed
Percentage of
Foster Youth
Placed
District18
261 56% 437 66%
Maryland 205 44% 305 34%
Total 466 742
Page 122 of 176
Projection Targets for FY2018:
Develop a total of 80 new foster home beds, targeting the following
populations:
o 20 new foster home beds for teenagers (20 percent of the 80 new
beds).
o 10 new Specialized Opportunities for Youth (SOY) Program beds
(10 percent of the 80 new beds).
o Five new professional foster parents for Pregnant and Parenting
Youth (PPY).
o Additional beds for medically fragile transgender youth, and
intellectually delayed youth.
d. What has been the agency's progress in identifying homes and placements
that will provide an appropriate setting for pregnant and parenting youth?
What have been the barriers? Did the Agency achieve its target for FY17?
What are the agency’s targets for FY18? There were no defined targets in
FY2017. However, a placement needs assessment for pregnant and parenting
youth was completed by the OYE Generations Unit. It determined a need for five
professional foster parents to meet the needs of CFSA’s at-risk teen parents and a
family group home to meet the needs of young mothers who are not prepared for
independent living and have struggled in traditional foster homes.
In October 2018, based on the placement needs assessment, CFSA identified three
homes for the pregnant/parenting youth (PPY) population. Two other families are
under consideration (for a total of five homes). CFSA anticipates professional
foster parent homes to come online by June FY2018.
What have been the barriers? To date, there are no barriers to initiating this
effort.
What are the agency’s targets for FY18? The PPY professional foster parent
initiative is slated for implementation in 2018.
Page 123 of 176
e. What has been the agency's progress in identifying homes and placements
that will provide an appropriate setting for children with special needs?
What have been the barriers? Did the Agency achieve its target for FY17?
What are the agency’s targets for FY18? In FY2017, CFSA procured homes
for children with special needs through our provider agencies. Although we
continue to implement strategies to develop resources for this population,
additional resources are always needed. Children with special needs cover a range
of issues including medically fragile, intellectually delayed (ID), and children on
the autism spectrum.
Through Temporary Safe Haven Redesign, CFSA and NCCF are working to
expand the overall foster parent service array to meet the needs of more children
with special needs. This work will inform our foster parent strategic recruitment
efforts.
What have been the barriers? Prospective foster parents have shared the
following:
The high demands, responsibility, and skills required to work with this
population.
The need for and identification of specific training to meet the needs of
this population.
Reluctance to foster children with special needs, particularly those in
health and human service fields.
Concern about not having adequate resources or supports to care
effectively for this population of children.
Did the Agency achieve its target for FY17? There were no specific
recruitment targets for children with special needs in FY2017.
What are the agency’s targets for FY18?
Medically Fragile: Develop 5-10 additional beds Medically Fragile:
Intellectually Delayed Youth: Partner with the Department of Disability
Services (DDS) to review eligible youth, beginning at age 17 rather than age
21, and transfer the placement in the current foster home from CFSA to DDS.
Page 124 of 176
f. What has been the agency's progress in identifying homes and placements
that will provide a safe and positive space for LGBTQ foster youth? What
have been the barriers? Did the Agency achieve its target for FY17? What
are the agency’s targets for FY18? In FY2017, CFSA realized success in
increasing the number of foster home beds for LGBTQ youth from 32 beds to 40
beds (20 percent increase).
What have been the barriers? CFSA has experienced challenges in developing
beds for transgender youth. In FY2018, CFSA will place special emphasis on
developing beds for transgender youth.
Did the Agency achieve its target for FY17? There was no specific goal set for
FY2017.
What are the agency’s targets for FY18? Develop an additional 3-5 LGTBQ
beds with special emphasis on beds for transgender youth.
g. What percentage of current foster homes licensed by CFSA and NCCF have
adults who have received trauma informed training? Of the 284 licensed
CFSA foster homes, 46 percent of those homes have foster parents who have
received trauma informed training. (131/284 = 46 percent)/. Of the 133 licensed
NCCF foster homes, 38 percent have foster parents who have received trauma
informed training. (51/133 = 38 percent). All NCCF foster parents complete New
Generation PRIDE, which is a trauma informed training curriculum.
h. What percentage of current foster homes licensed by CFSA and NCCF have
adults who speak Spanish and are culturally competent to care for Latino
children and youth? What percentage of Hispanic foster youth live in foster
homes where the adults speak Spanish? Collectively, CFSA and NCCF
[including our contract with Latin American Youth Center (LAYC)] have a total
of 15 foster homes (3 percent of CFSA’s foster homes) with adults who speak
Spanish, supporting 16 foster children (2 percent of CFSA’s current foster care
population). Based on CFSA’s 2017 Resource Development Plan (RDP), CFSA
has 22 Spanish-speaking children. To ensure that CFSA has adequate capacity,
the Agency will continue to identify Spanish speaking foster parents.
Page 125 of 176
i. What are the Agency’s recruitment targets for increasing the total number of
foster homes where the adults speak Spanish and the other frequently spoken
non-English languages amongst children in foster care? What have been the
barriers? What strategies have been implemented to reach these targets?
What are the Agency’s targets for FY18? In partnership with NCCF and
through our contract with LAYC, develop 3-5 foster homes where adults speak
Spanish.
What strategies have been implemented to reach these targets?
Use social media advertisements and commercials on Spanish-language
radio stations to reach the Spanish-speaking community.
Provided recruitment brochure in Spanish to Spanish-speaking
individuals/families.
Partner with a Spanish-speaking service provider to recruit Spanish
speaking foster parents.
What have been the barriers?
Getting prospective foster families to start the licensing process.
Completing the licensing process with the required official documentation.
Recruiting Spanish speaking foster parents to diversify available foster
homes.
j. What are the Agency’s recruitment targets for increasing the total number of
foster homes where the adults are experienced with caring for children who
are medically fragile or have serious developmental or physical disabilities?
What have been the barriers? What strategies have been implemented to
reach these targets? What are the Agency’s targets for FY18?
Targets:
In FY2017, CFSA had no specific recruitment targets for this population.
What have been the barriers?
In speaking with prospective foster parents to serve this population, the following
has been communicated:
The high demands, responsibility, and skills required to work with this
population.
The need for and identification of specific training for foster parents to
meet the needs of this population.
Reluctance to foster children with special needs, particularly those in
health and human service fields.
Page 126 of 176
Concern about not having adequate resources or supports to care
effectively for this population of children (i.e., adequate access to
quality mental health services, consistent community home health care
services and ongoing coverage for certain services – those not covered
by Medicaid).
Did the Agency achieve its target for FY17? CFSA had no specific
recruitment targets for this population.
What are the agency’s targets for FY18?
Develop 5-10 additional beds for medically fragile youth.
Partner with the Department of Disability Services (DDS) to
review eligible youth, beginning at age 17 rather than age 21, and
transfer the placement in the current foster home from CFSA to
DDS.
70. During FY17, how many youth in out-of-home care stayed in a hotel while awaiting a
licensed placement? FY18 to date? For each youth who stayed in a hotel, please
provide:
a. The age of the youth;
b. The length of the youth’s hotel stay;
c. The efforts made to identify a licensed placement; and
d. The type of placement the youth was moved to following his/her hotel stay.
In FY2017 and FY2018, no youth stayed in a hotel while awaiting a licensed placement.
71. For youth who stayed in hotels during FY17 and FY18 to date, please explain what
steps the agency took to provide supervision for the youth.
In FY2017 and FY2018, no youth stayed in a hotel while awaiting a licensed placement.
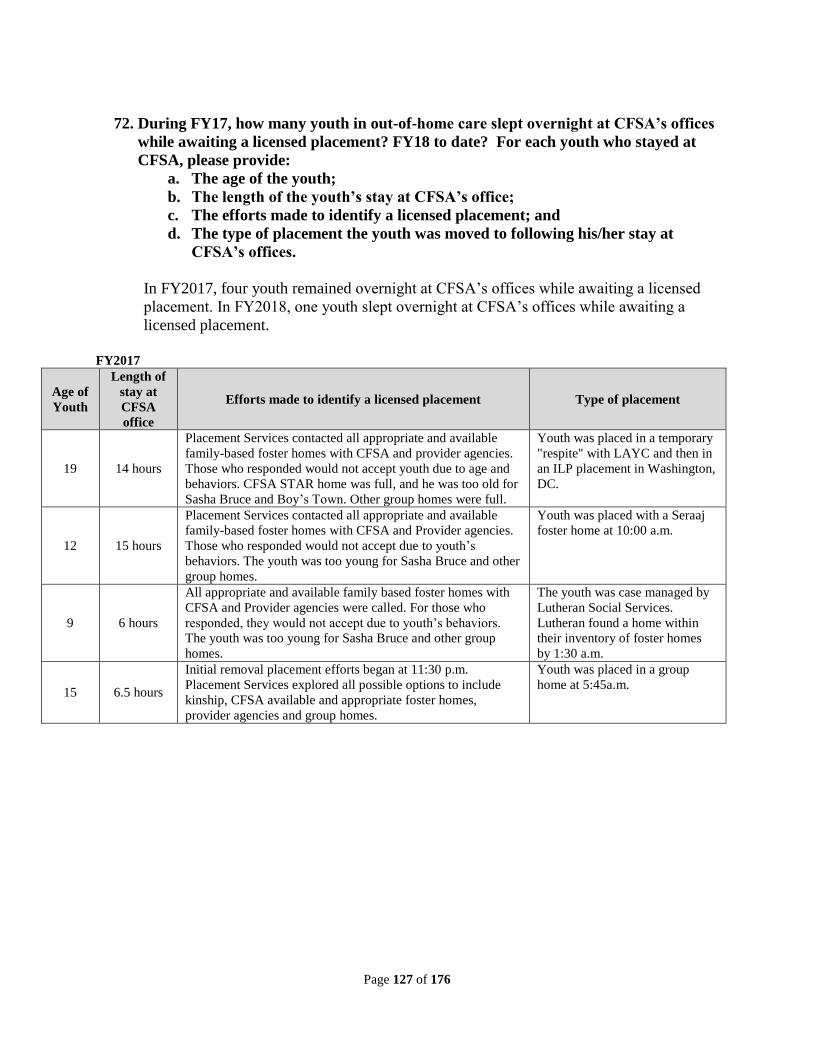
Page 127 of 176
72. During FY17, how many youth in out-of-home care slept overnight at CFSA’s offices
while awaiting a licensed placement? FY18 to date? For each youth who stayed at
CFSA, please provide:
a. The age of the youth;
b. The length of the youth’s stay at CFSA’s office;
c. The efforts made to identify a licensed placement; and
d. The type of placement the youth was moved to following his/her stay at
CFSA’s offices.
In FY2017, four youth remained overnight at CFSA’s offices while awaiting a licensed
placement. In FY2018, one youth slept overnight at CFSA’s offices while awaiting a
licensed placement.
FY2017
Age of
Youth
Length of
stay at
CFSA
office
Efforts made to identify a licensed placement Type of placement
19 14 hours
Placement Services contacted all appropriate and available
family-based foster homes with CFSA and provider agencies.
Those who responded would not accept youth due to age and
behaviors. CFSA STAR home was full, and he was too old for
Sasha Bruce and Boy’s Town. Other group homes were full.
Youth was placed in a temporary
"respite" with LAYC and then in
an ILP placement in Washington,
DC.
12 15 hours
Placement Services contacted all appropriate and available
family-based foster homes with CFSA and Provider agencies.
Those who responded would not accept due to youth’s
behaviors. The youth was too young for Sasha Bruce and other
group homes.
Youth was placed with a Seraaj
foster home at 10:00 a.m.
9 6 hours
All appropriate and available family based foster homes with
CFSA and Provider agencies were called. For those who
responded, they would not accept due to youth’s behaviors.
The youth was too young for Sasha Bruce and other group
homes.
The youth was case managed by
Lutheran Social Services.
Lutheran found a home within
their inventory of foster homes
by 1:30 a.m.
15 6.5 hours
Initial removal placement efforts began at 11:30 p.m.
Placement Services explored all possible options to include
kinship, CFSA available and appropriate foster homes,
provider agencies and group homes.
Youth was placed in a group
home at 5:45a.m.
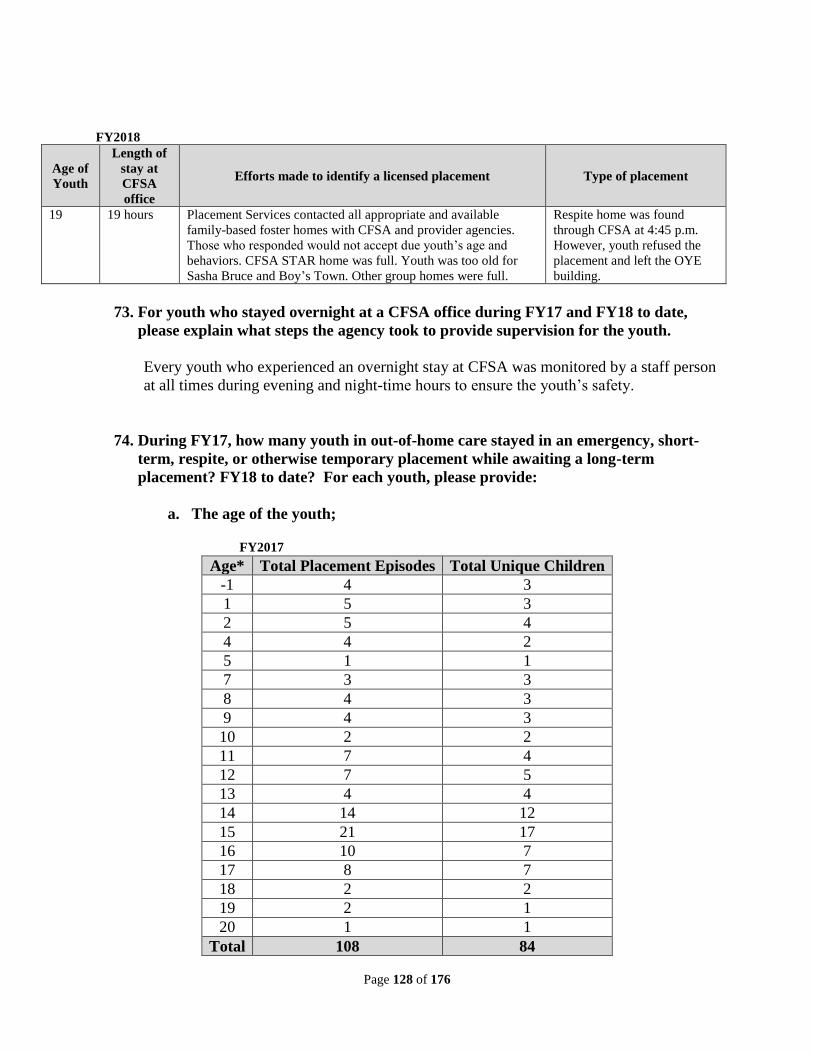
Page 128 of 176
FY2018
Age of
Youth
Length of
stay at
CFSA
office
Efforts made to identify a licensed placement Type of placement
19 19 hours Placement Services contacted all appropriate and available
family-based foster homes with CFSA and provider agencies.
Those who responded would not accept due youth’s age and
behaviors. CFSA STAR home was full. Youth was too old for
Sasha Bruce and Boy’s Town. Other group homes were full.
Respite home was found
through CFSA at 4:45 p.m.
However, youth refused the
placement and left the OYE
building.
73. For youth who stayed overnight at a CFSA office during FY17 and FY18 to date,
please explain what steps the agency took to provide supervision for the youth.
Every youth who experienced an overnight stay at CFSA was monitored by a staff person
at all times during evening and night-time hours to ensure the youth’s safety.
74. During FY17, how many youth in out-of-home care stayed in an emergency, short-
term, respite, or otherwise temporary placement while awaiting a long-term
placement? FY18 to date? For each youth, please provide:
a. The age of the youth;
FY2017
Age* Total Placement Episodes Total Unique Children
-1 4 3
1 5 3
2 5 4
4 4 2
5 1 1
7 3 3
8 4 3
9 4 3
10 2 2
11 7 4
12 7 5
13 4 4
14 14 12
15 21 17
16 10 7
17 8 7
18 2 2
19 2 1
20 1 1
Total 108 84
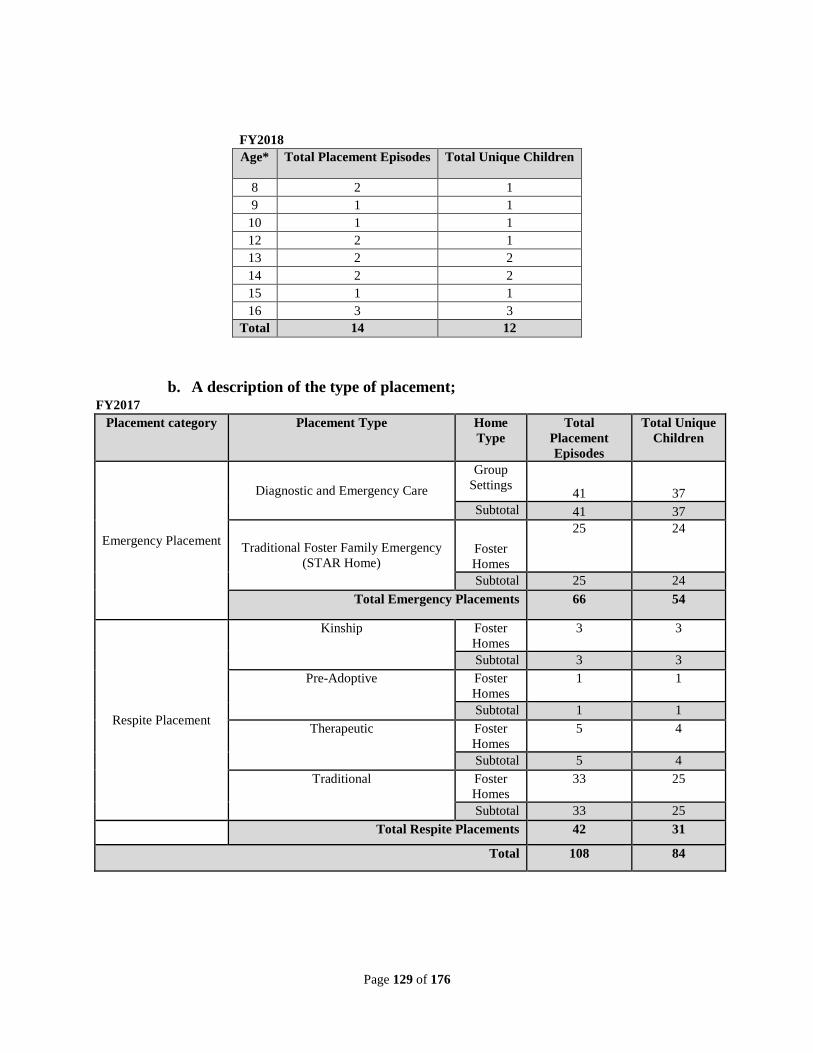
Page 129 of 176
FY2018
Age* Total Placement Episodes Total Unique Children
8 2 1
9 1 1
10 1 1
12 2 1
13 2 2
14 2 2
15 1 1
16 3 3
Total 14 12
b. A description of the type of placement; FY2017
Placement category Placement Type Home
Type
Total
Placement
Episodes
Total Unique
Children
Emergency Placement
Diagnostic and Emergency Care
Group
Settings 41 37
Subtotal 41 37
Traditional Foster Family Emergency
(STAR Home) Foster
Homes
25 24
Subtotal 25 24
Total Emergency Placements 66 54
Respite Placement
Kinship Foster
Homes
3 3
Subtotal 3 3
Pre-Adoptive Foster
Homes
1 1
Subtotal 1 1
Therapeutic Foster
Homes
5 4
Subtotal 5 4
Traditional Foster
Homes
33 25
Subtotal 33 25
Total Respite Placements 42 31
Total 108 84
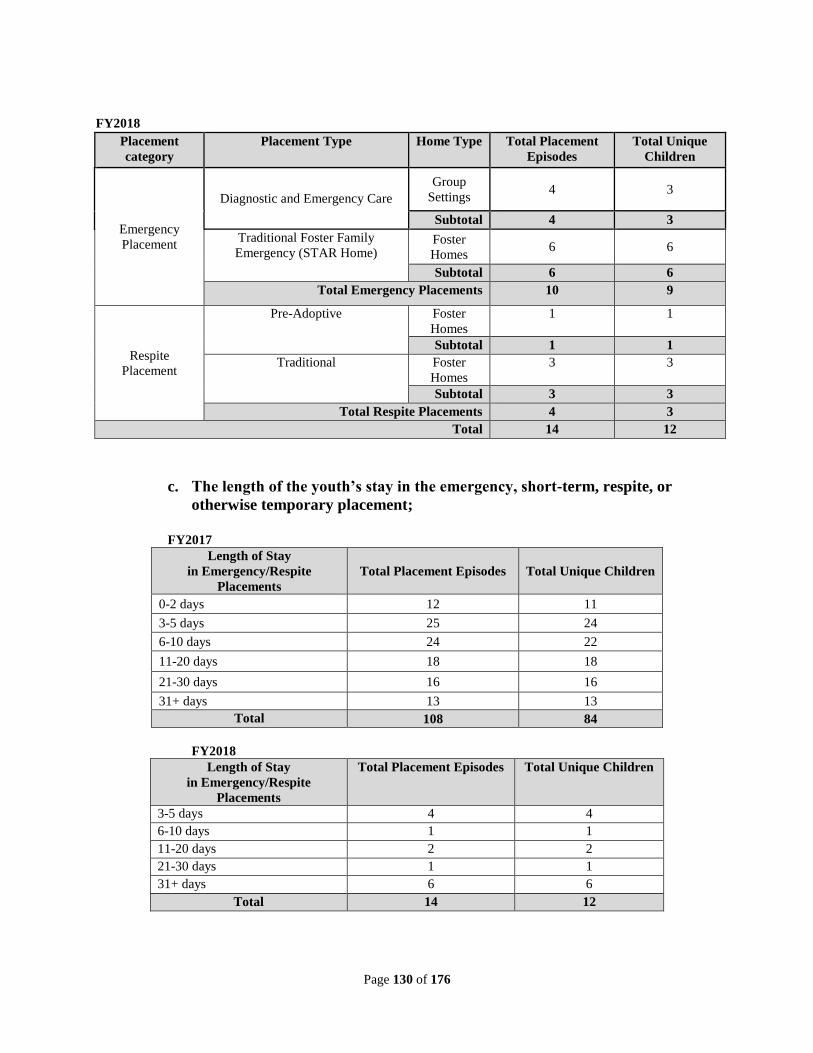
Page 130 of 176
FY2018
Placement
category
Placement Type Home Type Total Placement
Episodes
Total Unique
Children
Emergency
Placement
Diagnostic and Emergency Care
Group
Settings 4 3
Subtotal 4 3
Traditional Foster Family
Emergency (STAR Home) Foster
Homes 6 6
Subtotal 6 6
Total Emergency Placements 10 9
Respite
Placement
Pre-Adoptive Foster
Homes
1 1
Subtotal 1 1
Traditional Foster
Homes
3 3
Subtotal 3 3
Total Respite Placements 4 3
Total 14 12
c. The length of the youth’s stay in the emergency, short-term, respite, or
otherwise temporary placement;
FY2017
Length of Stay
in Emergency/Respite
Placements
Total Placement Episodes Total Unique Children
0-2 days 12 11
3-5 days 25 24
6-10 days 24 22
11-20 days 18 18
21-30 days 16 16
31+ days 13 13
Total 108 84
FY2018
Length of Stay
in Emergency/Respite
Placements
Total Placement Episodes Total Unique Children
3-5 days 4 4
6-10 days 1 1
11-20 days 2 2
21-30 days 1 1
31+ days 6 6
Total 14 12
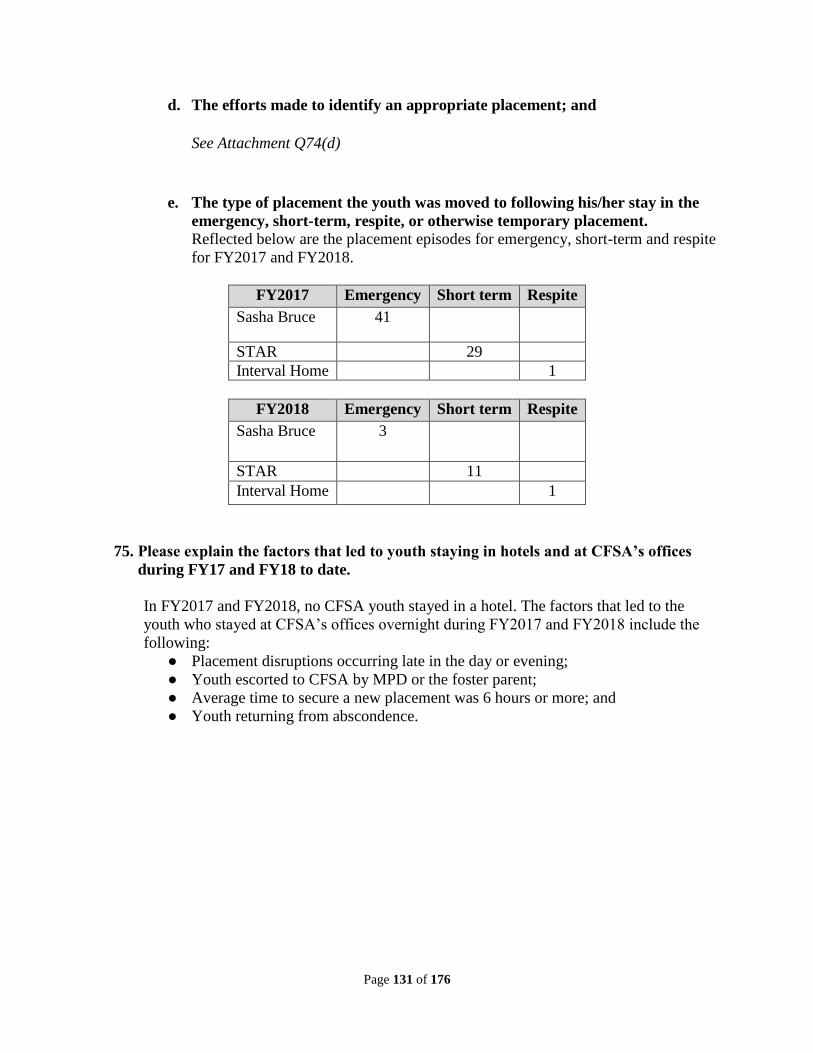
Page 131 of 176
d. The efforts made to identify an appropriate placement; and
See Attachment Q74(d)
e. The type of placement the youth was moved to following his/her stay in the
emergency, short-term, respite, or otherwise temporary placement.
Reflected below are the placement episodes for emergency, short-term and respite
for FY2017 and FY2018.
FY2017 Emergency Short term Respite
Sasha Bruce 41
STAR 29
Interval Home 1
FY2018 Emergency Short term Respite
Sasha Bruce 3
STAR 11
Interval Home 1
75. Please explain the factors that led to youth staying in hotels and at CFSA’s offices
during FY17 and FY18 to date.
In FY2017 and FY2018, no CFSA youth stayed in a hotel. The factors that led to the
youth who stayed at CFSA’s offices overnight during FY2017 and FY2018 include the
following:
● Placement disruptions occurring late in the day or evening;
● Youth escorted to CFSA by MPD or the foster parent;
● Average time to secure a new placement was 6 hours or more; and
● Youth returning from abscondence.
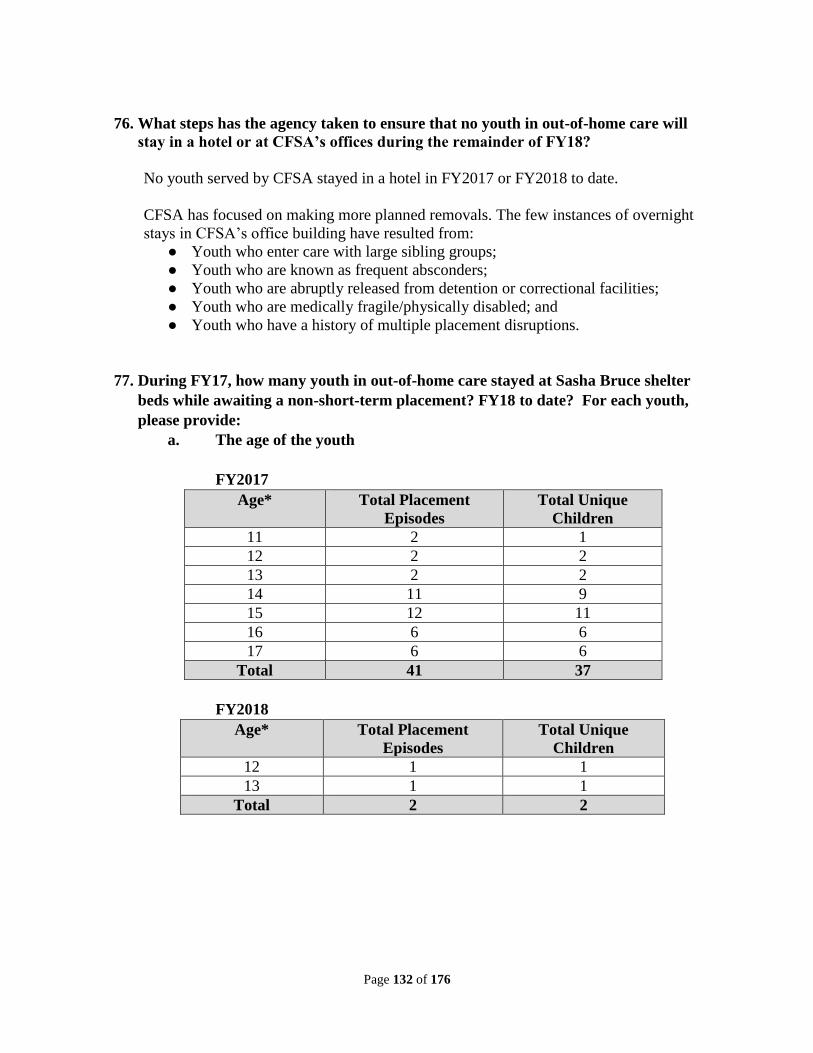
Page 132 of 176
76. What steps has the agency taken to ensure that no youth in out-of-home care will
stay in a hotel or at CFSA’s offices during the remainder of FY18?
No youth served by CFSA stayed in a hotel in FY2017 or FY2018 to date.
CFSA has focused on making more planned removals. The few instances of overnight
stays in CFSA’s office building have resulted from:
● Youth who enter care with large sibling groups;
● Youth who are known as frequent absconders;
● Youth who are abruptly released from detention or correctional facilities;
● Youth who are medically fragile/physically disabled; and
● Youth who have a history of multiple placement disruptions.
77. During FY17, how many youth in out-of-home care stayed at Sasha Bruce shelter
beds while awaiting a non-short-term placement? FY18 to date? For each youth,
please provide:
a. The age of the youth
FY2017
Age* Total Placement
Episodes
Total Unique
Children
11 2 1
12 2 2
13 2 2
14 11 9
15 12 11
16 6 6
17 6 6
Total 41 37
FY2018
Age* Total Placement
Episodes
Total Unique
Children
12 1 1
13 1 1
Total 2 2
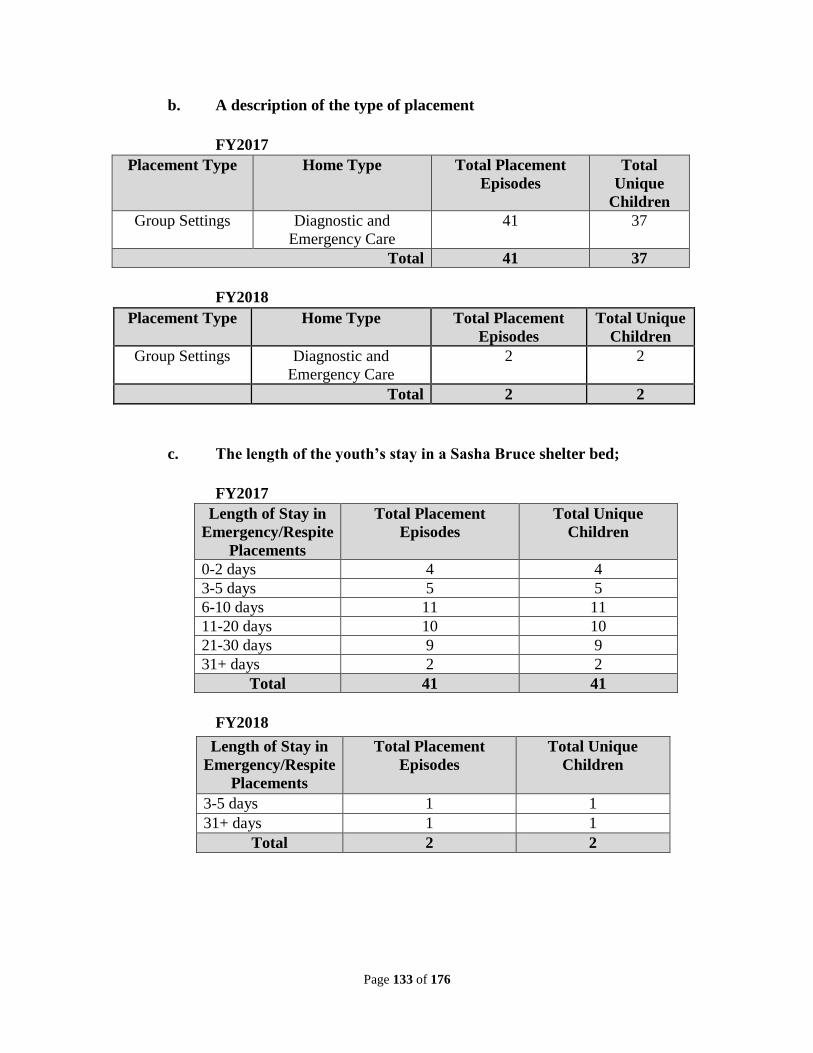
Page 133 of 176
b. A description of the type of placement
FY2017
Placement Type Home Type Total Placement
Episodes
Total
Unique
Children
Group Settings Diagnostic and
Emergency Care
41 37
Total 41 37
FY2018
Placement Type Home Type Total Placement
Episodes
Total Unique
Children
Group Settings Diagnostic and
Emergency Care
2 2
Total 2 2
c. The length of the youth’s stay in a Sasha Bruce shelter bed;
FY2017
Length of Stay in
Emergency/Respite
Placements
Total Placement
Episodes
Total Unique
Children
0-2 days 4 4
3-5 days 5 5
6-10 days 11 11
11-20 days 10 10
21-30 days 9 9
31+ days 2 2
Total 41 41
FY2018
Length of Stay in
Emergency/Respite
Placements
Total Placement
Episodes
Total Unique
Children
3-5 days 1 1
31+ days 1 1
Total 2 2
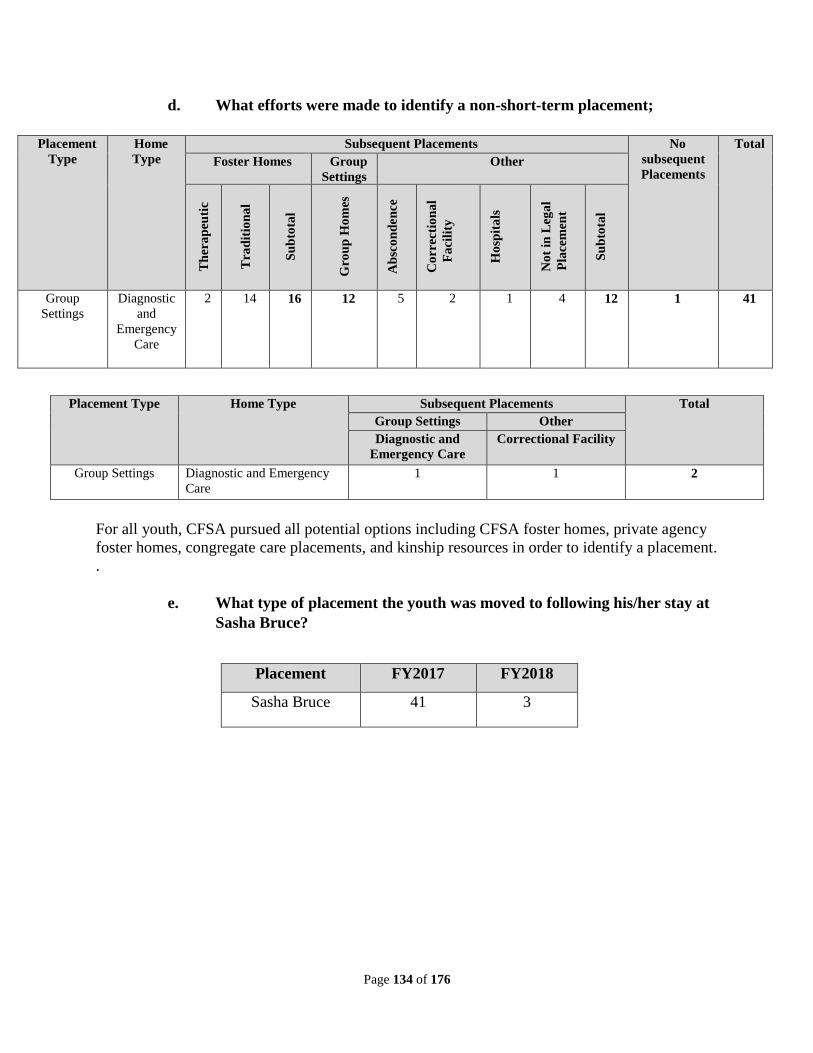
Page 134 of 176
d. What efforts were made to identify a non-short-term placement;
Placement
Type
Home
Type
Subsequent Placements No
subsequent
Placements
Total
Foster Homes Group
Settings
Other
Th
era
peu
tic
Tra
dit
ion
al
Su
bto
tal
Gro
up
Ho
mes
Ab
sco
nd
en
ce
Co
rrec
tio
na
l
Fa
cili
ty
Ho
spit
als
No
t in
Leg
al
Pla
cem
ent
Su
bto
tal
Group
Settings
Diagnostic
and
Emergency
Care
2 14 16 12 5 2 1 4 12 1 41
For all youth, CFSA pursued all potential options including CFSA foster homes, private agency
foster homes, congregate care placements, and kinship resources in order to identify a placement.
.
e. What type of placement the youth was moved to following his/her stay at
Sasha Bruce?
Placement FY2017 FY2018
Sasha Bruce 41 3
Placement Type Home Type Subsequent Placements Total
Group Settings Other
Diagnostic and
Emergency Care
Correctional Facility
Group Settings Diagnostic and Emergency
Care
1 1 2
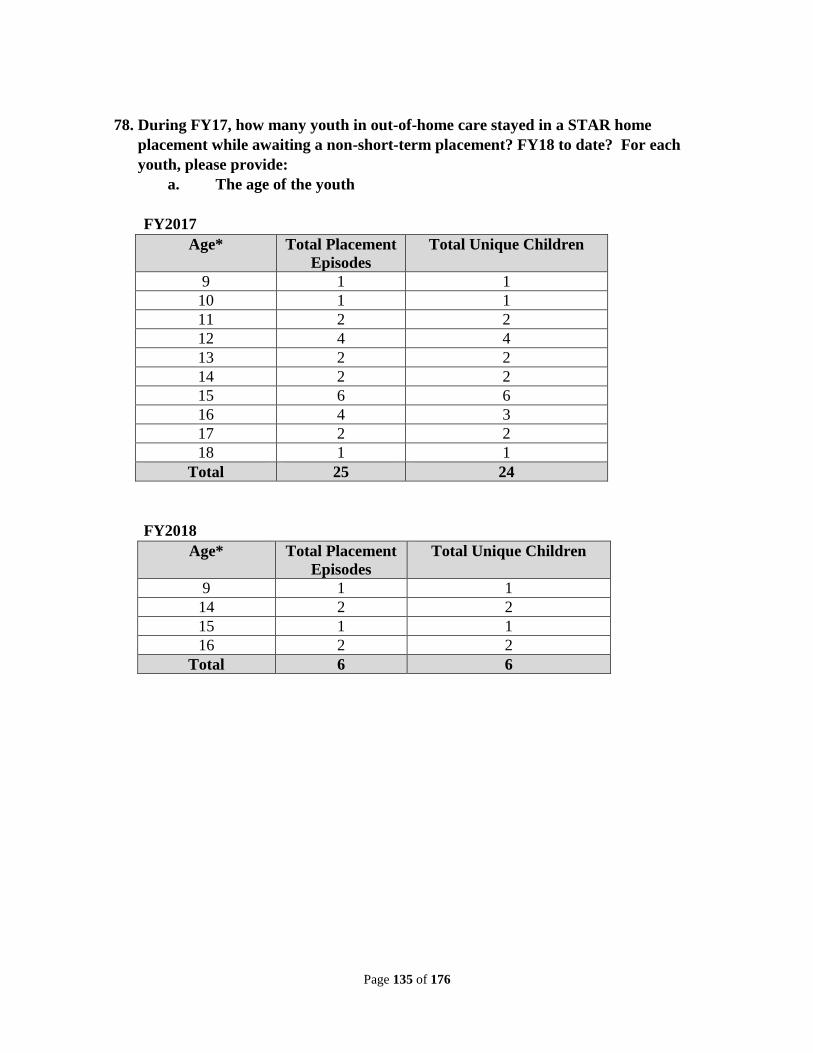
Page 135 of 176
78. During FY17, how many youth in out-of-home care stayed in a STAR home
placement while awaiting a non-short-term placement? FY18 to date? For each
youth, please provide:
a. The age of the youth
FY2017
Age* Total Placement
Episodes
Total Unique Children
9 1 1
10 1 1
11 2 2
12 4 4
13 2 2
14 2 2
15 6 6
16 4 3
17 2 2
18 1 1
Total 25 24
FY2018
Age* Total Placement
Episodes
Total Unique Children
9 1 1
14 2 2
15 1 1
16 2 2
Total 6 6
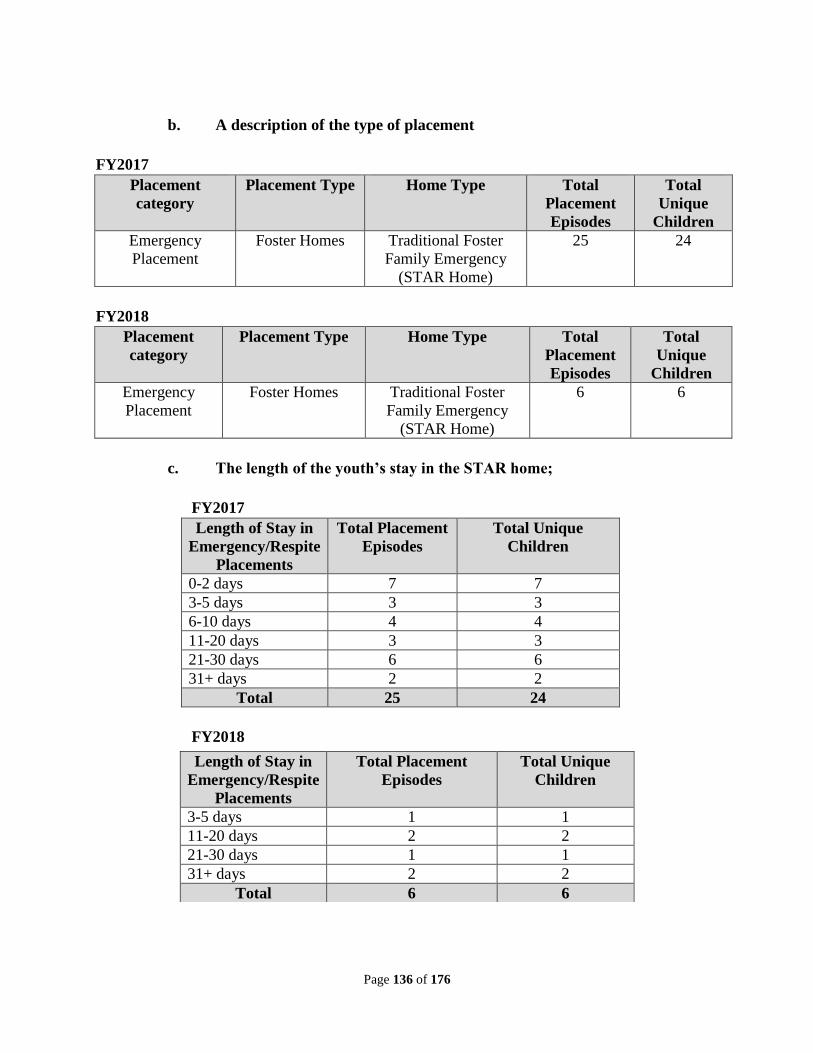
Page 136 of 176
b. A description of the type of placement
FY2017
Placement
category
Placement Type Home Type Total
Placement
Episodes
Total
Unique
Children
Emergency
Placement
Foster Homes Traditional Foster
Family Emergency
(STAR Home)
25 24
FY2018
Placement
category
Placement Type Home Type Total
Placement
Episodes
Total
Unique
Children
Emergency
Placement
Foster Homes Traditional Foster
Family Emergency
(STAR Home)
6 6
c. The length of the youth’s stay in the STAR home;
FY2017
Length of Stay in
Emergency/Respite
Placements
Total Placement
Episodes
Total Unique
Children
0-2 days 7 7
3-5 days 3 3
6-10 days 4 4
11-20 days 3 3
21-30 days 6 6
31+ days 2 2
Total 25 24
FY2018
Length of Stay in
Emergency/Respite
Placements
Total Placement
Episodes
Total Unique
Children
3-5 days 1 1
11-20 days 2 2
21-30 days 1 1
31+ days 2 2
Total 6 6
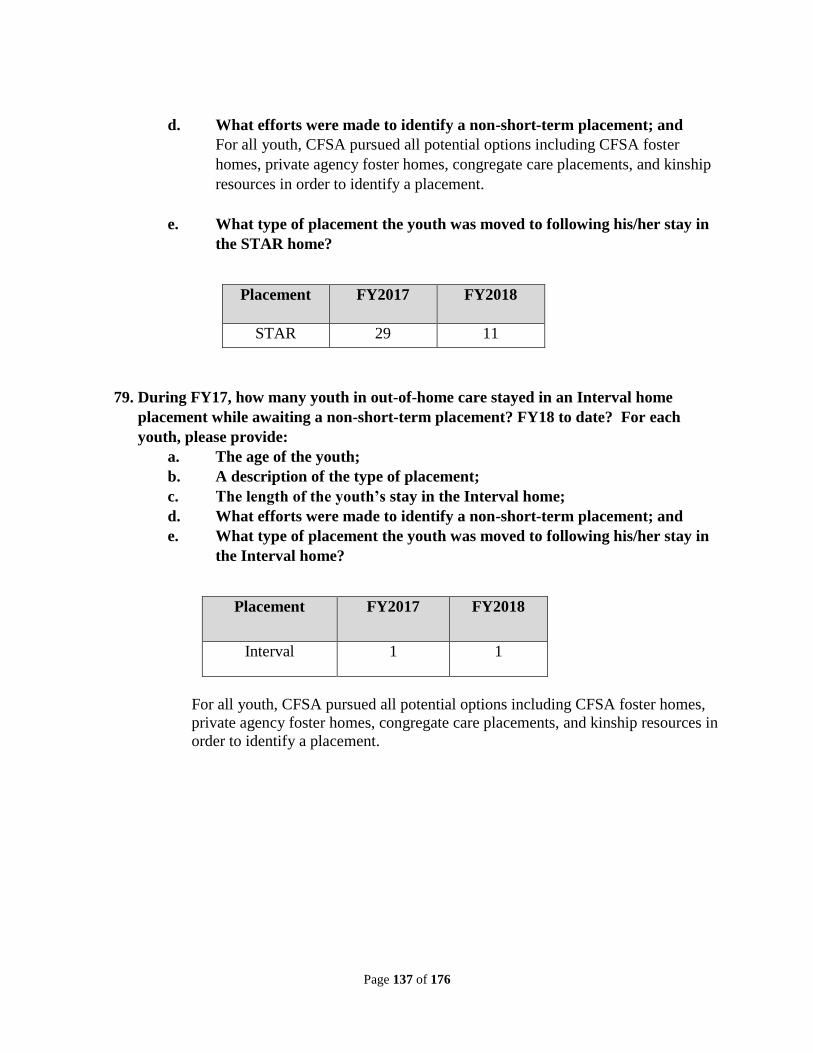
Page 137 of 176
d. What efforts were made to identify a non-short-term placement; and
For all youth, CFSA pursued all potential options including CFSA foster
homes, private agency foster homes, congregate care placements, and kinship
resources in order to identify a placement.
e. What type of placement the youth was moved to following his/her stay in
the STAR home?
Placement FY2017 FY2018
STAR 29 11
79. During FY17, how many youth in out-of-home care stayed in an Interval home
placement while awaiting a non-short-term placement? FY18 to date? For each
youth, please provide:
a. The age of the youth;
b. A description of the type of placement;
c. The length of the youth’s stay in the Interval home;
d. What efforts were made to identify a non-short-term placement; and
e. What type of placement the youth was moved to following his/her stay in
the Interval home?
Placement FY2017 FY2018
Interval 1 1
For all youth, CFSA pursued all potential options including CFSA foster homes,
private agency foster homes, congregate care placements, and kinship resources in
order to identify a placement.
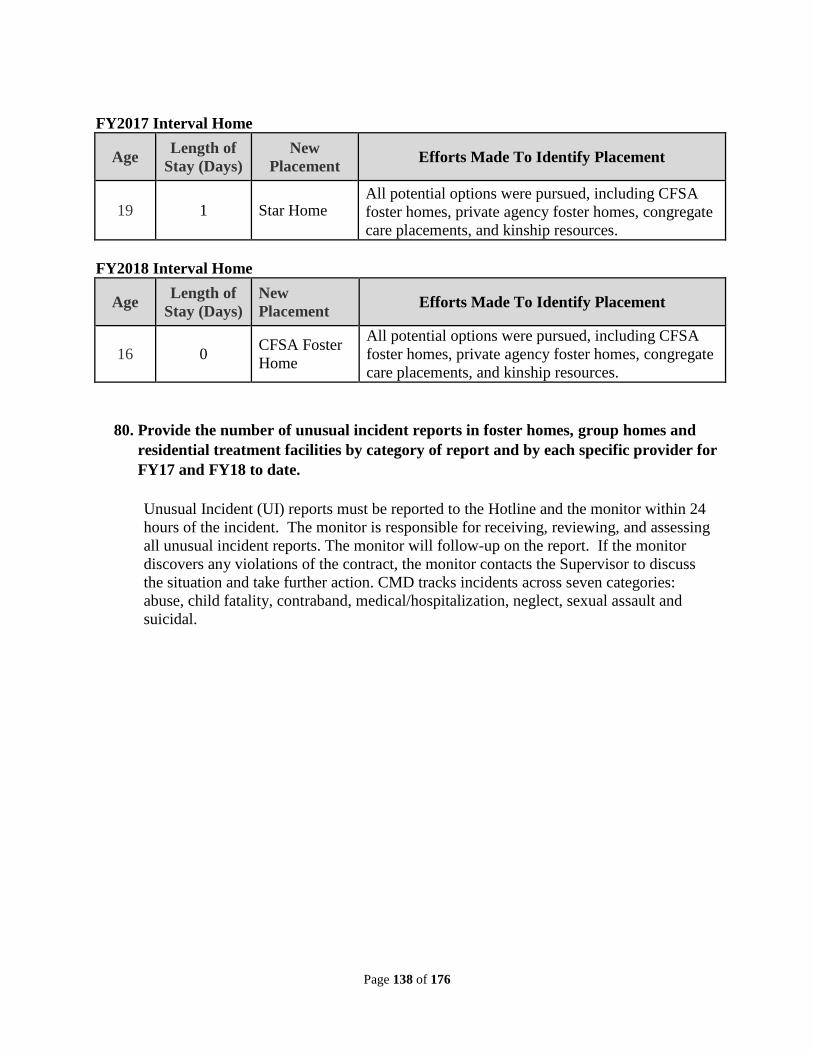
Page 138 of 176
FY2017 Interval Home
Age Length of
Stay (Days)
New
Placement Efforts Made To Identify Placement
19 1 Star Home All potential options were pursued, including CFSA
foster homes, private agency foster homes, congregate
care placements, and kinship resources.
FY2018 Interval Home
Age Length of
Stay (Days)
New
Placement Efforts Made To Identify Placement
16 0 CFSA Foster
Home
All potential options were pursued, including CFSA
foster homes, private agency foster homes, congregate
care placements, and kinship resources.
80. Provide the number of unusual incident reports in foster homes, group homes and
residential treatment facilities by category of report and by each specific provider for
FY17 and FY18 to date.
Unusual Incident (UI) reports must be reported to the Hotline and the monitor within 24
hours of the incident. The monitor is responsible for receiving, reviewing, and assessing
all unusual incident reports. The monitor will follow-up on the report. If the monitor
discovers any violations of the contract, the monitor contacts the Supervisor to discuss
the situation and take further action. CMD tracks incidents across seven categories:
abuse, child fatality, contraband, medical/hospitalization, neglect, sexual assault and
suicidal.
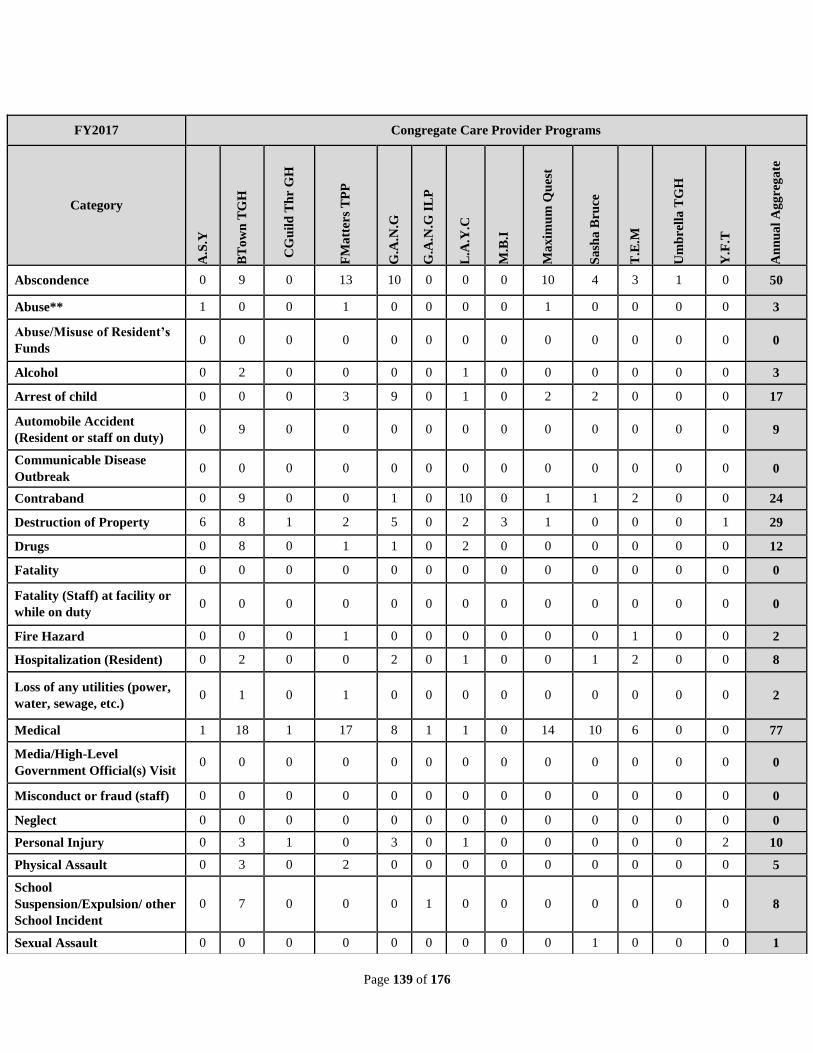
Page 139 of 176
FY2017 Congregate Care Provider Programs
Category A
.S.Y
BT
ow
n T
GH
C
Gu
ild
Th
r G
H
FM
att
ers
TP
P
G.A
.N.G
G.A
.N.G
IL
P
L.A
.Y.C
M.B
.I
Ma
xim
um
Qu
est
Sa
sha
Bru
ce
T.E
.M
Um
bre
lla
TG
H
Y.F
.T
An
nu
al
Ag
gre
ga
te
Abscondence 0 9 0 13 10 0 0 0 10 4 3 1 0 50
Abuse** 1 0 0 1 0 0 0 0 1 0 0 0 0 3
Abuse/Misuse of Resident’s
Funds 0 0 0 0 0 0 0 0 0 0 0 0 0 0
Alcohol 0 2 0 0 0 0 1 0 0 0 0 0 0 3
Arrest of child 0 0 0 3 9 0 1 0 2 2 0 0 0 17
Automobile Accident
(Resident or staff on duty) 0 9 0 0 0 0 0 0 0 0 0 0 0 9
Communicable Disease
Outbreak 0 0 0 0 0 0 0 0 0 0 0 0 0 0
Contraband 0 9 0 0 1 0 10 0 1 1 2 0 0 24
Destruction of Property 6 8 1 2 5 0 2 3 1 0 0 0 1 29
Drugs 0 8 0 1 1 0 2 0 0 0 0 0 0 12
Fatality 0 0 0 0 0 0 0 0 0 0 0 0 0 0
Fatality (Staff) at facility or
while on duty 0 0 0 0 0 0 0 0 0 0 0 0 0 0
Fire Hazard 0 0 0 1 0 0 0 0 0 0 1 0 0 2
Hospitalization (Resident) 0 2 0 0 2 0 1 0 0 1 2 0 0 8
Loss of any utilities (power,
water, sewage, etc.) 0 1 0 1 0 0 0 0 0 0 0 0 0 2
Medical 1 18 1 17 8 1 1 0 14 10 6 0 0 77
Media/High-Level
Government Official(s) Visit 0 0 0 0 0 0 0 0 0 0 0 0 0 0
Misconduct or fraud (staff) 0 0 0 0 0 0 0 0 0 0 0 0 0 0
Neglect 0 0 0 0 0 0 0 0 0 0 0 0 0 0
Personal Injury 0 3 1 0 3 0 1 0 0 0 0 0 2 10
Physical Assault 0 3 0 2 0 0 0 0 0 0 0 0 0 5
School
Suspension/Expulsion/ other
School Incident
0 7 0 0 0 1 0 0 0 0 0 0 0 8
Sexual Assault 0 0 0 0 0 0 0 0 0 1 0 0 0 1
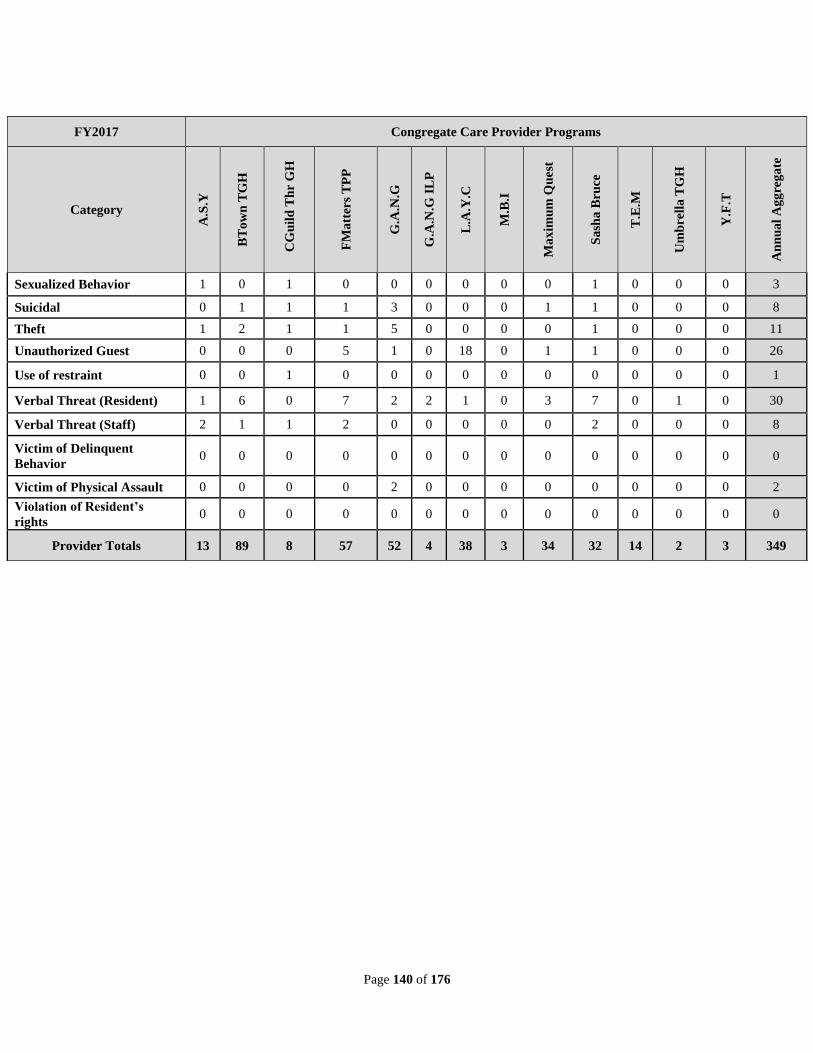
Page 140 of 176
FY2017 Congregate Care Provider Programs
Category A
.S.Y
BT
ow
n T
GH
C
Gu
ild
Th
r G
H
FM
att
ers
TP
P
G.A
.N.G
G.A
.N.G
IL
P
L.A
.Y.C
M.B
.I
Ma
xim
um
Qu
est
Sa
sha
Bru
ce
T.E
.M
Um
bre
lla
TG
H
Y.F
.T
An
nu
al
Ag
gre
ga
te
Sexualized Behavior 1 0 1 0 0 0 0 0 0 1 0 0 0 3
Suicidal 0 1 1 1 3 0 0 0 1 1 0 0 0 8
Theft 1 2 1 1 5 0 0 0 0 1 0 0 0 11
Unauthorized Guest 0 0 0 5 1 0 18 0 1 1 0 0 0 26
Use of restraint 0 0 1 0 0 0 0 0 0 0 0 0 0 1
Verbal Threat (Resident) 1 6 0 7 2 2 1 0 3 7 0 1 0 30
Verbal Threat (Staff) 2 1 1 2 0 0 0 0 0 2 0 0 0 8
Victim of Delinquent
Behavior 0 0 0 0 0 0 0 0 0 0 0 0 0 0
Victim of Physical Assault 0 0 0 0 2 0 0 0 0 0 0 0 0 2
Violation of Resident’s
rights 0 0 0 0 0 0 0 0 0 0 0 0 0 0
Provider Totals 13 89 8 57 52 4 38 3 34 32 14 2 3 349
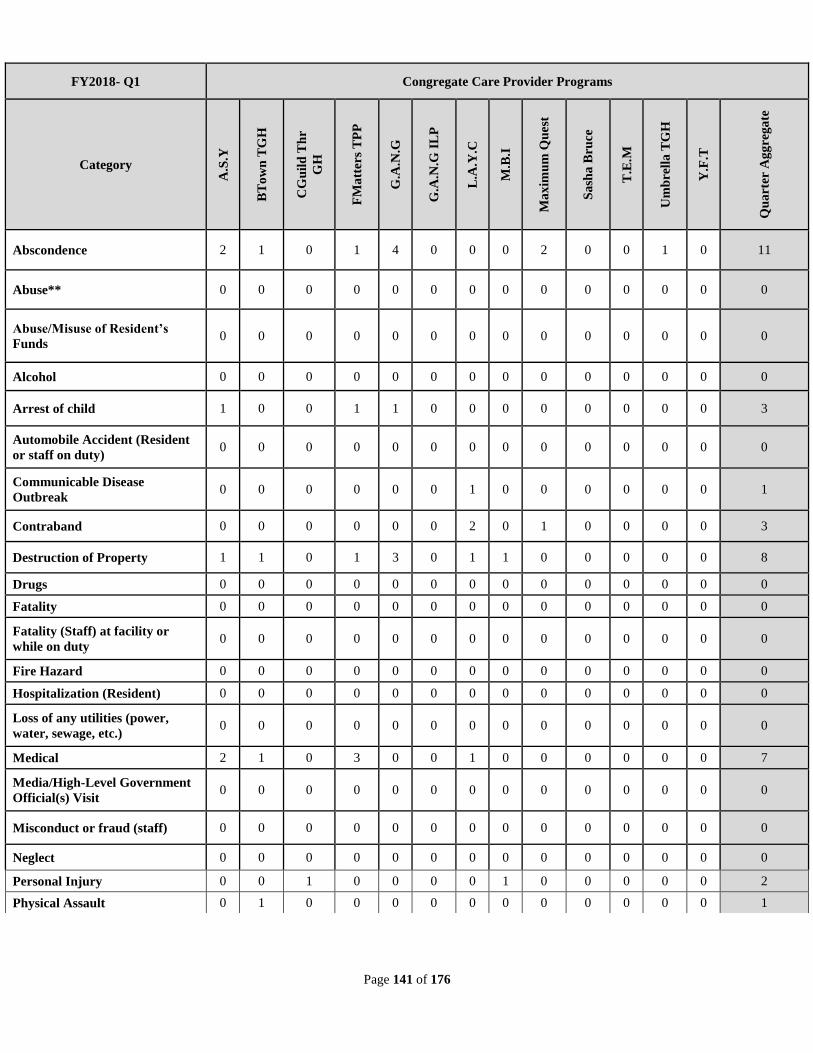
Page 141 of 176
FY2018- Q1 Congregate Care Provider Programs
Category
A.S
.Y
BT
ow
n T
GH
CG
uil
d T
hr
GH
FM
att
ers
TP
P
G.A
.N.G
G.A
.N.G
IL
P
L.A
.Y.C
M.B
.I
Ma
xim
um
Qu
est
Sa
sha
Bru
ce
T.E
.M
Um
bre
lla
TG
H
Y.F
.T
Qu
art
er A
gg
rega
te
Abscondence 2 1 0 1 4 0 0 0 2 0 0 1 0 11
Abuse** 0 0 0 0 0 0 0 0 0 0 0 0 0 0
Abuse/Misuse of Resident’s
Funds 0 0 0 0 0 0 0 0 0 0 0 0 0 0
Alcohol 0 0 0 0 0 0 0 0 0 0 0 0 0 0
Arrest of child 1 0 0 1 1 0 0 0 0 0 0 0 0 3
Automobile Accident (Resident
or staff on duty) 0 0 0 0 0 0 0 0 0 0 0 0 0 0
Communicable Disease
Outbreak 0 0 0 0 0 0 1 0 0 0 0 0 0 1
Contraband 0 0 0 0 0 0 2 0 1 0 0 0 0 3
Destruction of Property 1 1 0 1 3 0 1 1 0 0 0 0 0 8
Drugs 0 0 0 0 0 0 0 0 0 0 0 0 0 0
Fatality 0 0 0 0 0 0 0 0 0 0 0 0 0 0
Fatality (Staff) at facility or
while on duty 0 0 0 0 0 0 0 0 0 0 0 0 0 0
Fire Hazard 0 0 0 0 0 0 0 0 0 0 0 0 0 0
Hospitalization (Resident) 0 0 0 0 0 0 0 0 0 0 0 0 0 0
Loss of any utilities (power,
water, sewage, etc.) 0 0 0 0 0 0 0 0 0 0 0 0 0 0
Medical 2 1 0 3 0 0 1 0 0 0 0 0 0 7
Media/High-Level Government
Official(s) Visit 0 0 0 0 0 0 0 0 0 0 0 0 0 0
Misconduct or fraud (staff) 0 0 0 0 0 0 0 0 0 0 0 0 0 0
Neglect 0 0 0 0 0 0 0 0 0 0 0 0 0 0
Personal Injury 0 0 1 0 0 0 0 1 0 0 0 0 0 2
Physical Assault 0 1 0 0 0 0 0 0 0 0 0 0 0 1
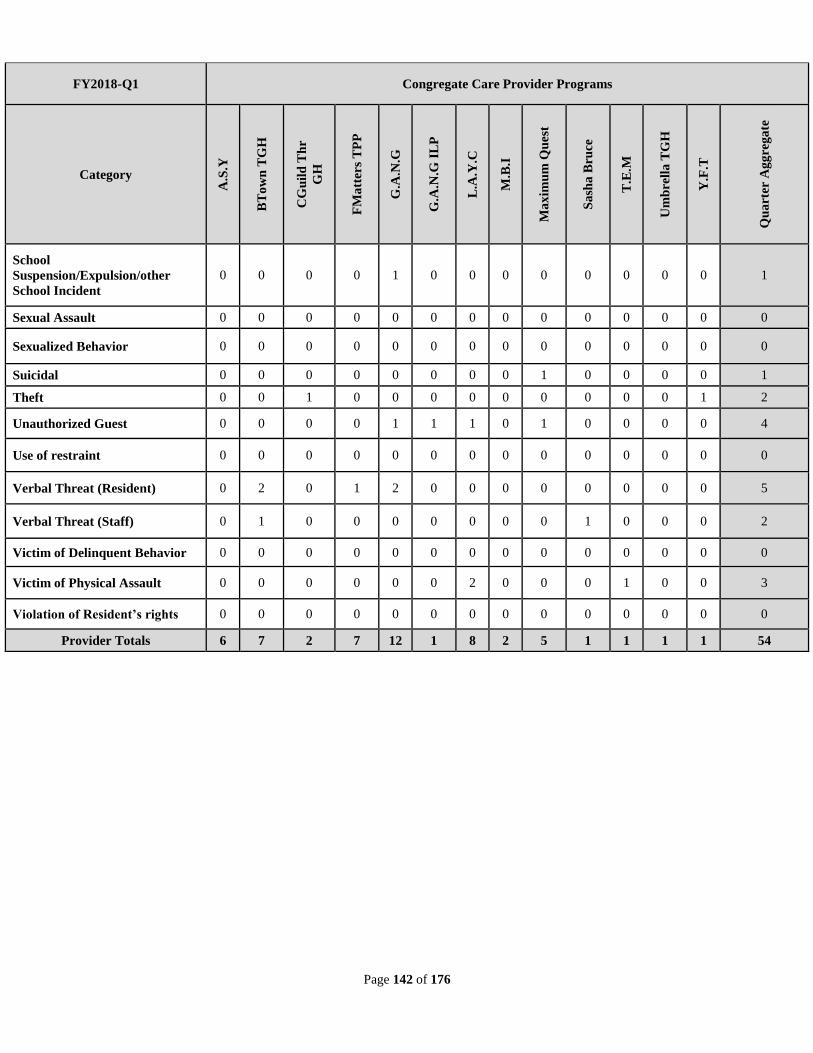
Page 142 of 176
FY2018-Q1 Congregate Care Provider Programs
Category
A.S
.Y
BT
ow
n T
GH
CG
uil
d T
hr
GH
FM
att
ers
TP
P
G.A
.N.G
G.A
.N.G
IL
P
L.A
.Y.C
M.B
.I
Ma
xim
um
Qu
est
Sa
sha
Bru
ce
T.E
.M
Um
bre
lla
TG
H
Y.F
.T
Qu
art
er A
gg
rega
te
School
Suspension/Expulsion/other
School Incident
0 0 0 0 1 0 0 0 0 0 0 0 0 1
Sexual Assault 0 0 0 0 0 0 0 0 0 0 0 0 0 0
Sexualized Behavior 0 0 0 0 0 0 0 0 0 0 0 0 0 0
Suicidal 0 0 0 0 0 0 0 0 1 0 0 0 0 1
Theft 0 0 1 0 0 0 0 0 0 0 0 0 1 2
Unauthorized Guest 0 0 0 0 1 1 1 0 1 0 0 0 0 4
Use of restraint 0 0 0 0 0 0 0 0 0 0 0 0 0 0
Verbal Threat (Resident) 0 2 0 1 2 0 0 0 0 0 0 0 0 5
Verbal Threat (Staff) 0 1 0 0 0 0 0 0 0 1 0 0 0 2
Victim of Delinquent Behavior 0 0 0 0 0 0 0 0 0 0 0 0 0 0
Victim of Physical Assault 0 0 0 0 0 0 2 0 0 0 1 0 0 3
Violation of Resident’s rights 0 0 0 0 0 0 0 0 0 0 0 0 0 0
Provider Totals 6 7 2 7 12 1 8 2 5 1 1 1 1 54
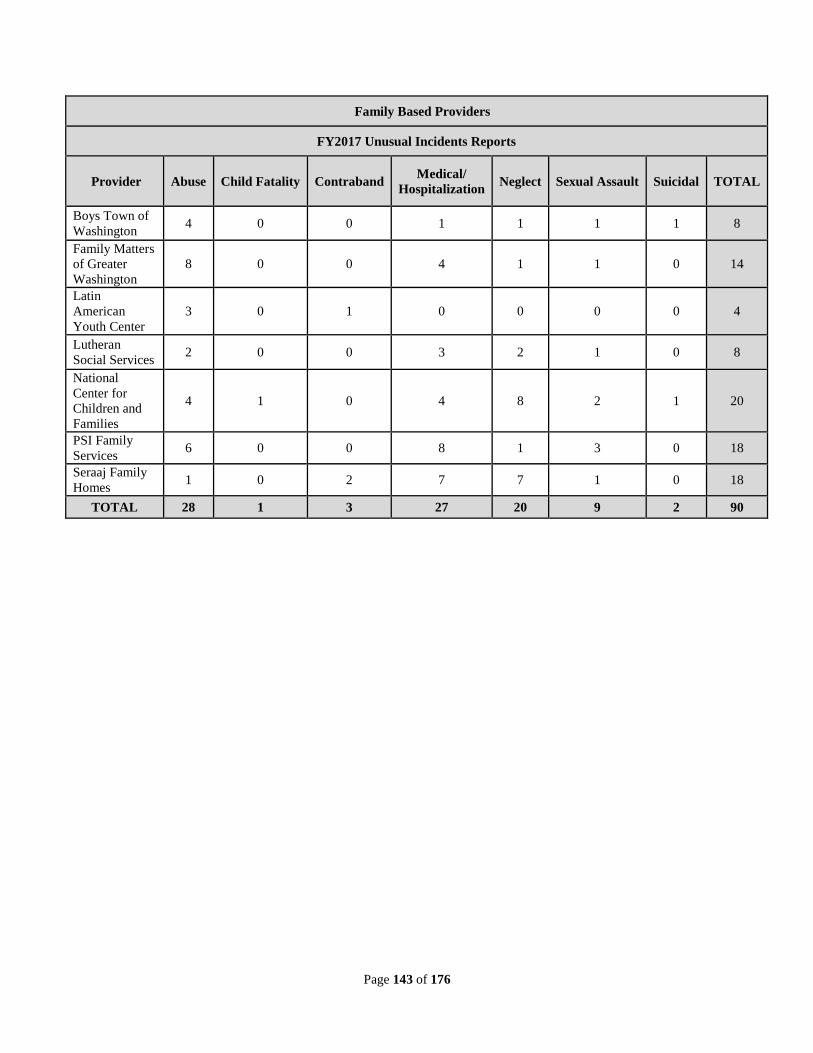
Page 143 of 176
Family Based Providers
FY2017 Unusual Incidents Reports
Provider Abuse Child Fatality Contraband Medical/
Hospitalization Neglect Sexual Assault Suicidal TOTAL
Boys Town of
Washington 4 0 0 1 1 1 1 8
Family Matters
of Greater
Washington
8 0 0 4 1 1 0 14
Latin
American
Youth Center
3 0 1 0 0 0 0 4
Lutheran
Social Services 2 0 0 3 2 1 0 8
National
Center for
Children and
Families
4 1 0 4 8 2 1 20
PSI Family
Services 6 0 0 8 1 3 0 18
Seraaj Family
Homes 1 0 2 7 7 1 0 18
TOTAL 28 1 3 27 20 9 2 90
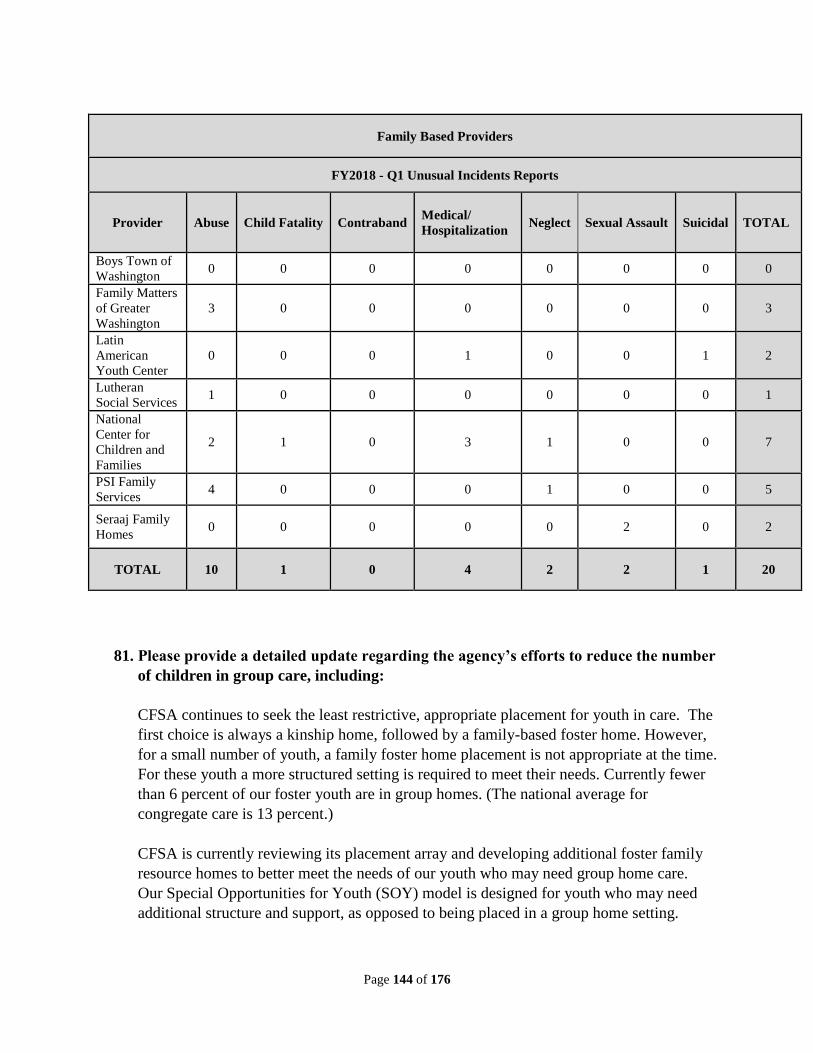
Page 144 of 176
Family Based Providers
FY2018 - Q1 Unusual Incidents Reports
Provider Abuse Child Fatality Contraband Medical/
Hospitalization Neglect Sexual Assault Suicidal TOTAL
Boys Town of
Washington 0 0 0 0 0 0 0 0
Family Matters
of Greater
Washington
3 0 0 0 0 0 0 3
Latin
American
Youth Center
0 0 0 1 0 0 1 2
Lutheran
Social Services 1 0 0 0 0 0 0 1
National
Center for
Children and
Families
2 1 0 3 1 0 0 7
PSI Family
Services 4 0 0 0 1 0 0 5
Seraaj Family
Homes 0 0 0 0 0 2 0 2
TOTAL 10 1 0 4 2 2 1 20
81. Please provide a detailed update regarding the agency’s efforts to reduce the number
of children in group care, including:
CFSA continues to seek the least restrictive, appropriate placement for youth in care. The
first choice is always a kinship home, followed by a family-based foster home. However,
for a small number of youth, a family foster home placement is not appropriate at the time.
For these youth a more structured setting is required to meet their needs. Currently fewer
than 6 percent of our foster youth are in group homes. (The national average for
congregate care is 13 percent.)
CFSA is currently reviewing its placement array and developing additional foster family
resource homes to better meet the needs of our youth who may need group home care.
Our Special Opportunities for Youth (SOY) model is designed for youth who may need
additional structure and support, as opposed to being placed in a group home setting.
Page 145 of 176
While CFSA continuously works to reduce group home placements in general, it is also
working to enhance the quality of group home placements by implementing national best
practice standards and establishing standard expectations for group home services. CFSA
will also implement standardized training expectations for all group home providers to
address the clinical needs of our youth. CFSAS anticipates that youth who do need group
home care will be able to complete the full treatment programs more timely and be
prepared to return to a family based foster care setting.
a. A description of any reduction in the number of children placed in group
homes (in FY2017 and projections for FY2018). Our group care population has
remained consistent in FY2017 and is expected to remain consistent for FY2018.
b. A description of where children who would have been living in group homes
are living instead. Group home placements are considered a higher level of care.
Rarely is a group home placement used for an initial entry. Most youth placed in
group homes have either had challenges in family-based foster home, have been
discharged from a detention facility, or have a history of chronic abscondence.
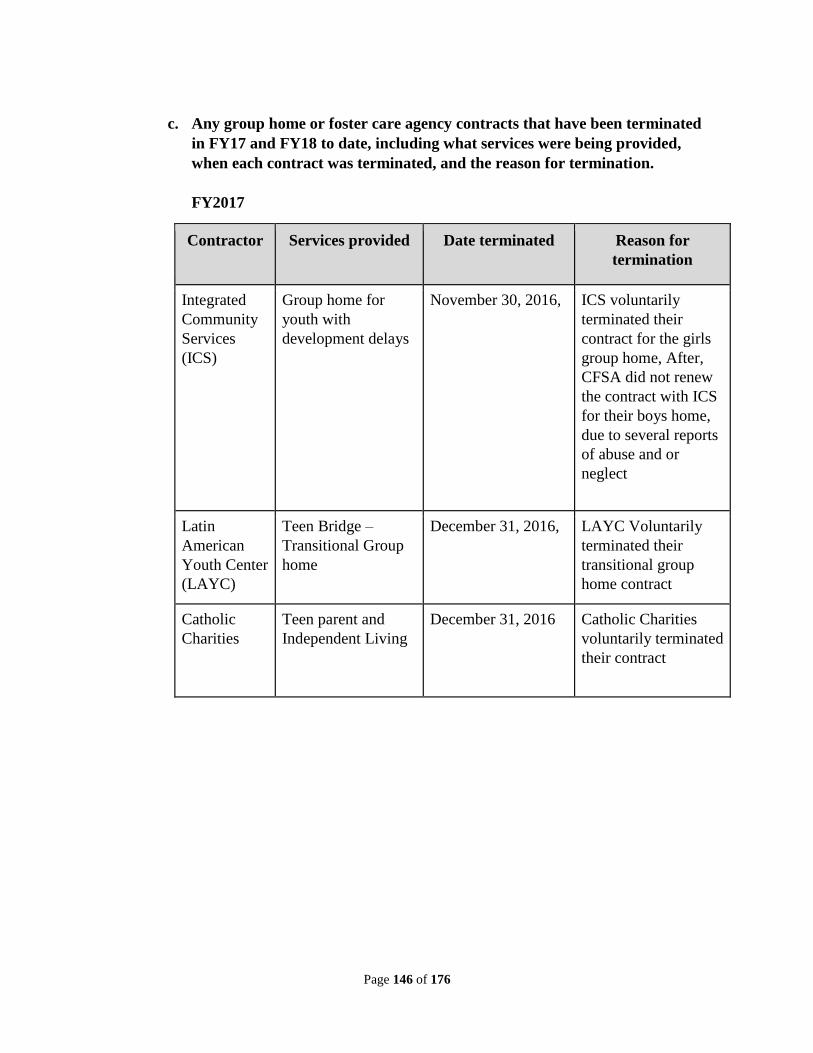
Page 146 of 176
c. Any group home or foster care agency contracts that have been terminated
in FY17 and FY18 to date, including what services were being provided,
when each contract was terminated, and the reason for termination.
FY2017
Contractor Services provided Date terminated Reason for
termination
Integrated
Community
Services
(ICS)
Group home for
youth with
development delays
November 30, 2016, ICS voluntarily
terminated their
contract for the girls
group home, After,
CFSA did not renew
the contract with ICS
for their boys home,
due to several reports
of abuse and or
neglect
Latin
American
Youth Center
(LAYC)
Teen Bridge –
Transitional Group
home
December 31, 2016, LAYC Voluntarily
terminated their
transitional group
home contract
Catholic
Charities
Teen parent and
Independent Living
December 31, 2016 Catholic Charities
voluntarily terminated
their contract
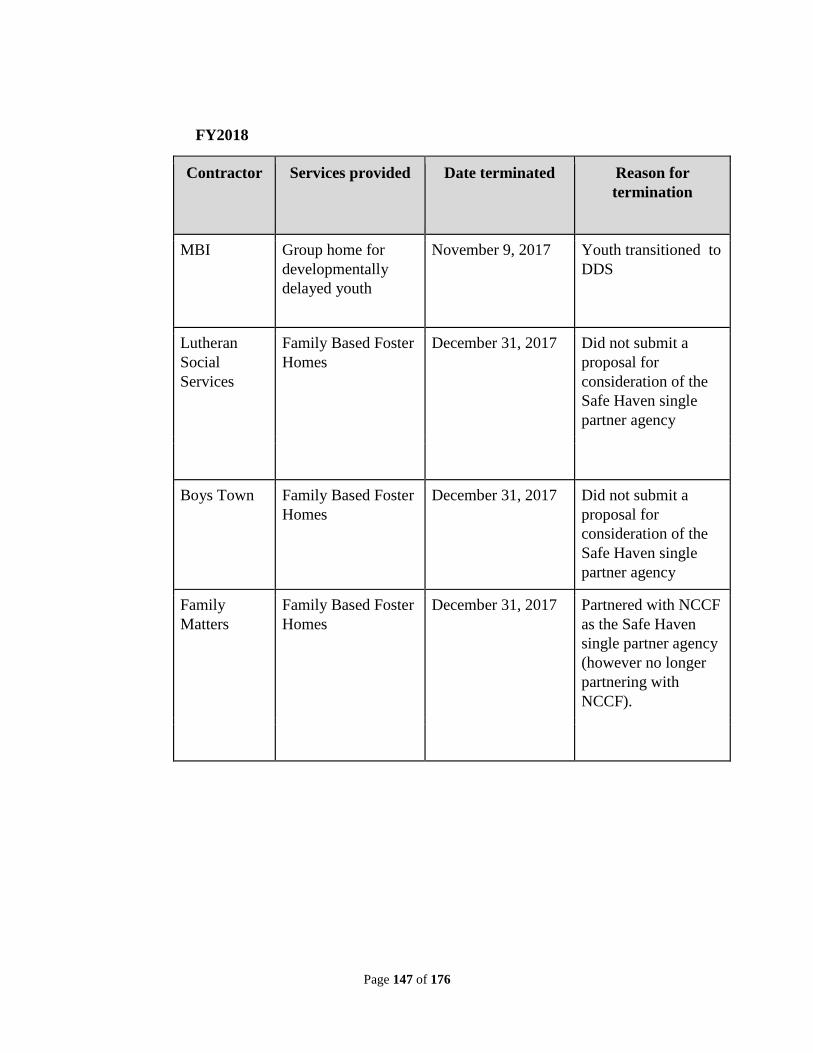
Page 147 of 176
FY2018
Contractor Services provided Date terminated Reason for
termination
MBI Group home for
developmentally
delayed youth
November 9, 2017 Youth transitioned to
DDS
Lutheran
Social
Services
Family Based Foster
Homes
December 31, 2017 Did not submit a
proposal for
consideration of the
Safe Haven single
partner agency
Boys Town Family Based Foster
Homes
December 31, 2017 Did not submit a
proposal for
consideration of the
Safe Haven single
partner agency
Family
Matters
Family Based Foster
Homes
December 31, 2017 Partnered with NCCF
as the Safe Haven
single partner agency
(however no longer
partnering with
NCCF).
Page 148 of 176
82. During FY17, CFSA amended its policy regarding eligibility for Independent Living
Programs. Please provide the policy and explain the changes made.
The Administrative Issuance (AI) on Independent Living Programs (“ILP”) is in the
process of finalization with an anticipated publication date of February 28, 2018. When it
is posted to CFSA’s online policy manual, the link will be forwarded to the committee.
Key changes to the AI are as follows:
Introduced youth eligibility requirements such that participants meet a minimum
age and maturity levels, and demonstrate an ability to follow-through on her or
his own case plan.
Streamlined the application and approval process.
Clarified monthly stipend and weekly allowance requirements to differentiate
between the amounts that are required under regulation versus the amounts that
the Agency typically pays (which exceed those regulatory requirements.)
Developed an annual Stipend Schedule, to be published as a companion piece of
governance, outlining the cost items that figure into the monthly stipend and the
method and schedule for their distribution to youth in ILP programs.
83. During FY17, CFSA started amending its policy regarding youth who were absent
from their placements. Describe how CFSA responds when youth who are dually
committed to the care or custody of CFSA and another agency are missing from non-
foster home placements both inside of and outside of the District.
When youth who are dually committed to the care and custody of CFSA and DYRS for
whom CFSA is the lead agency are reported missing from a congregate or therapeutic
treatment facility through an unusual incident report, CFSA follows our policy and
protocol for missing youth and informs DYRS of the youth’s missing status and efforts
made to locate the youth. If DYRS is the lead agency, notifications and unusual incident
reports from the facility are sent directly to DYRS. DYRS then initiates their process for
locating a missing child and alerts CFSA to the child’s missing status and the steps taken
to locate the youth. CFSA then follows the process as outlined in the agency’s policy to
locate the youth.
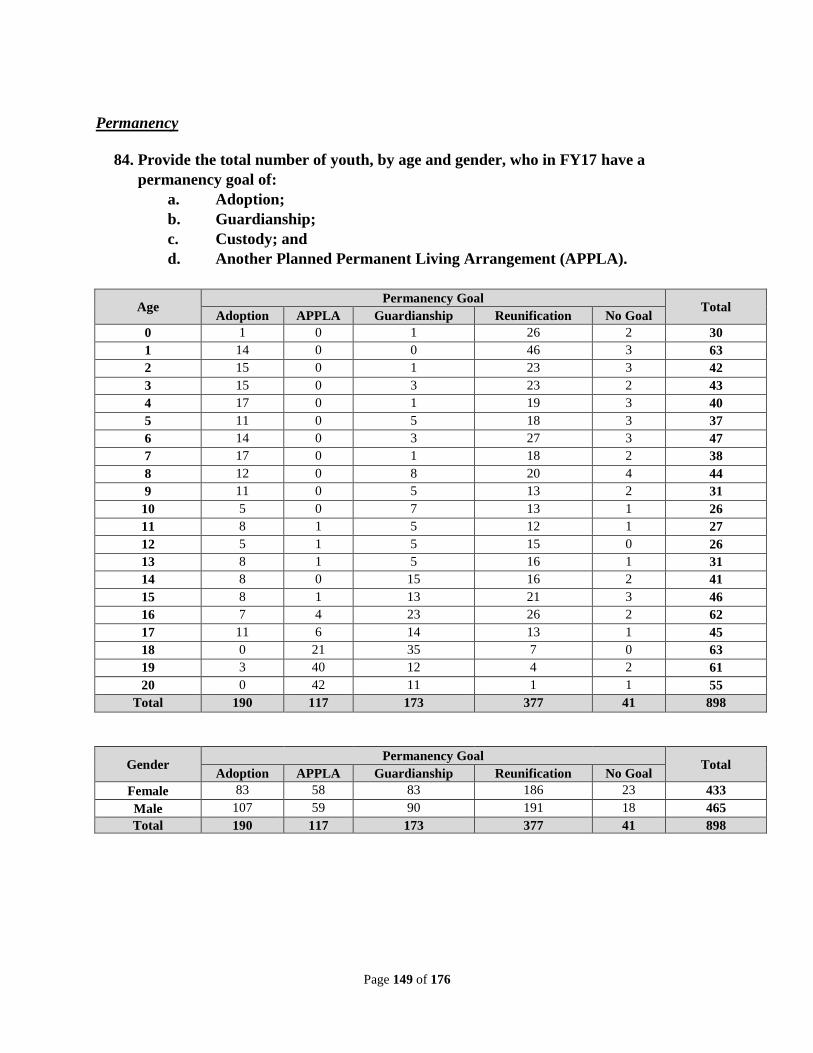
Page 149 of 176
Permanency
84. Provide the total number of youth, by age and gender, who in FY17 have a
permanency goal of:
a. Adoption;
b. Guardianship;
c. Custody; and
d. Another Planned Permanent Living Arrangement (APPLA).
Age Permanency Goal
Total Adoption APPLA Guardianship Reunification No Goal
0 1 0 1 26 2 30
1 14 0 0 46 3 63
2 15 0 1 23 3 42
3 15 0 3 23 2 43
4 17 0 1 19 3 40
5 11 0 5 18 3 37
6 14 0 3 27 3 47
7 17 0 1 18 2 38
8 12 0 8 20 4 44
9 11 0 5 13 2 31
10 5 0 7 13 1 26
11 8 1 5 12 1 27
12 5 1 5 15 0 26
13 8 1 5 16 1 31
14 8 0 15 16 2 41
15 8 1 13 21 3 46
16 7 4 23 26 2 62
17 11 6 14 13 1 45
18 0 21 35 7 0 63
19 3 40 12 4 2 61
20 0 42 11 1 1 55
Total 190 117 173 377 41 898
Gender Permanency Goal
Total Adoption APPLA Guardianship Reunification No Goal
Female 83 58 83 186 23 433
Male 107 59 90 191 18 465
Total 190 117 173 377 41 898
Page 150 of 176
85. The Federal Preventing Sex Trafficking and Strengthening Families Act of 2014
prohibits the use of APPLA as a permanency goal for children under the age of 16.
What is CFSA’s plan to implement this law and are there any CFSA youth with an
APPLA permanency goal who is under 16 years of age? Please describe any changes
from FY16.
Prior to the 2014 legislation, CFSA’s policies and procedures prohibited the use of the
Alternative Planned Permanent Living Arrangement (APPLA) as a goal for youth under
16 years old. It is important to note that the DC Family court has the authority to change
a goal outside of the CFSA’s recommendation.
No youth under 16 years old had a goal change to APPLA in FY2017 and 20 in FY2018.
Four youth under the age of 16 had a goal change to APPLA prior to FY2017. Three of
the four youth are Unaccompanied Refugee Minors.
86. The federal Sex Trafficking and Strengthening Families Act of 2014 allows children
ages 14 and older to participate in transition planning for successful adulthood.
a. Describe CFSA’s efforts to expand its current transition planning efforts
to begin at age 14. CFSA works diligently to achieve permanence for youth
in the foster care system and the majority of youth are reunified or exit to
permanency through guardianship or adoption. However in recognition of the
importance of establishing transition-to-adulthood goals, CFSA begins
transition planning for youth age 14, or as a they enter high school. The
agency understands that goals developed at age 14 will likely evolve and
change by the time a young person reaches 21; therefore the youth transition
planning meeting is focused on goal attainments and assessing when/how
goals must be tailored to fit each individual child. The young person, and their
team, during the quarterly meetings mark progress towards fulfilling their
objectives and adjusting as necessary. To help youth get a strong start on this
important work, at age 15 they become eligible for Chafee-funded services
provided through the Office of Youth Empowerment (OYE). In addition,
beginning in the 9th
grade, CFSA youth are connected to OYE for education
and career preparation work. Following Federal Guidelines transition planning
begins at age 14 and regular treatment planning meetings are held every six
months until the age of 20 when the meetings are held every 90 days.
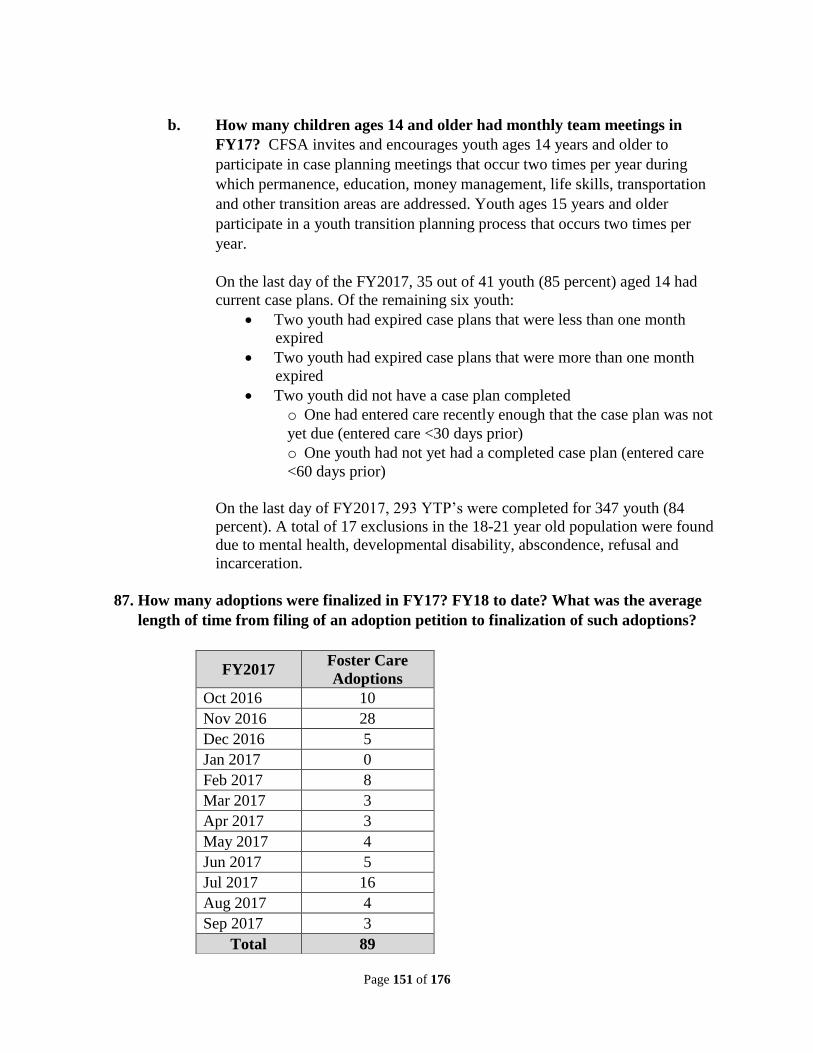
Page 151 of 176
b. How many children ages 14 and older had monthly team meetings in
FY17? CFSA invites and encourages youth ages 14 years and older to
participate in case planning meetings that occur two times per year during
which permanence, education, money management, life skills, transportation
and other transition areas are addressed. Youth ages 15 years and older
participate in a youth transition planning process that occurs two times per
year.
On the last day of the FY2017, 35 out of 41 youth (85 percent) aged 14 had
current case plans. Of the remaining six youth:
Two youth had expired case plans that were less than one month
expired
Two youth had expired case plans that were more than one month
expired
Two youth did not have a case plan completed
o One had entered care recently enough that the case plan was not
yet due (entered care <30 days prior)
o One youth had not yet had a completed case plan (entered care
<60 days prior)
On the last day of FY2017, 293 YTP’s were completed for 347 youth (84
percent). A total of 17 exclusions in the 18-21 year old population were found
due to mental health, developmental disability, abscondence, refusal and
incarceration.
87. How many adoptions were finalized in FY17? FY18 to date? What was the average
length of time from filing of an adoption petition to finalization of such adoptions?
FY2017
Foster Care
Adoptions
Oct 2016 10
Nov 2016 28
Dec 2016 5
Jan 2017 0
Feb 2017 8
Mar 2017 3
Apr 2017 3
May 2017 4
Jun 2017 5
Jul 2017 16
Aug 2017 4
Sep 2017 3
Total 89
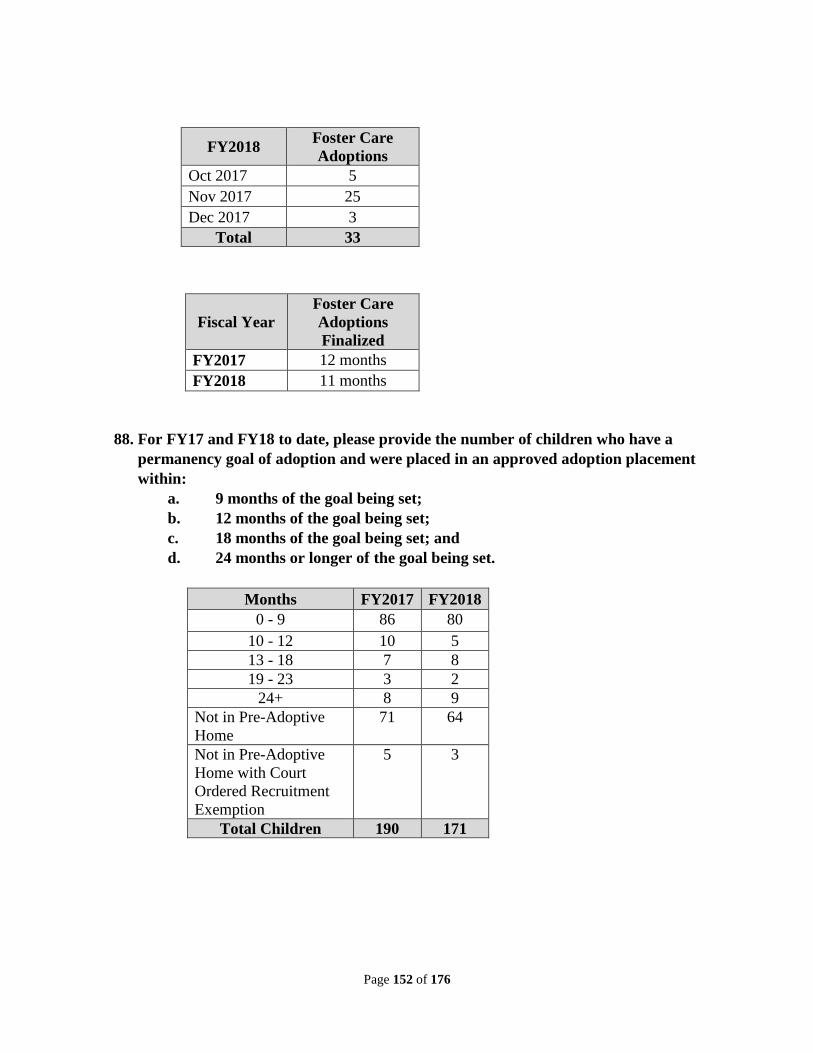
Page 152 of 176
Fiscal Year
Foster Care
Adoptions
Finalized
FY2017 12 months
FY2018 11 months
88. For FY17 and FY18 to date, please provide the number of children who have a
permanency goal of adoption and were placed in an approved adoption placement
within:
a. 9 months of the goal being set;
b. 12 months of the goal being set;
c. 18 months of the goal being set; and
d. 24 months or longer of the goal being set.
Months FY2017 FY2018
0 - 9 86 80
10 - 12 10 5
13 - 18 7 8
19 - 23 3 2
24+ 8 9
Not in Pre-Adoptive
Home
71 64
Not in Pre-Adoptive
Home with Court
Ordered Recruitment
Exemption
5 3
Total Children 190 171
FY2018 Foster Care
Adoptions
Oct 2017 5
Nov 2017 25
Dec 2017 3
Total 33
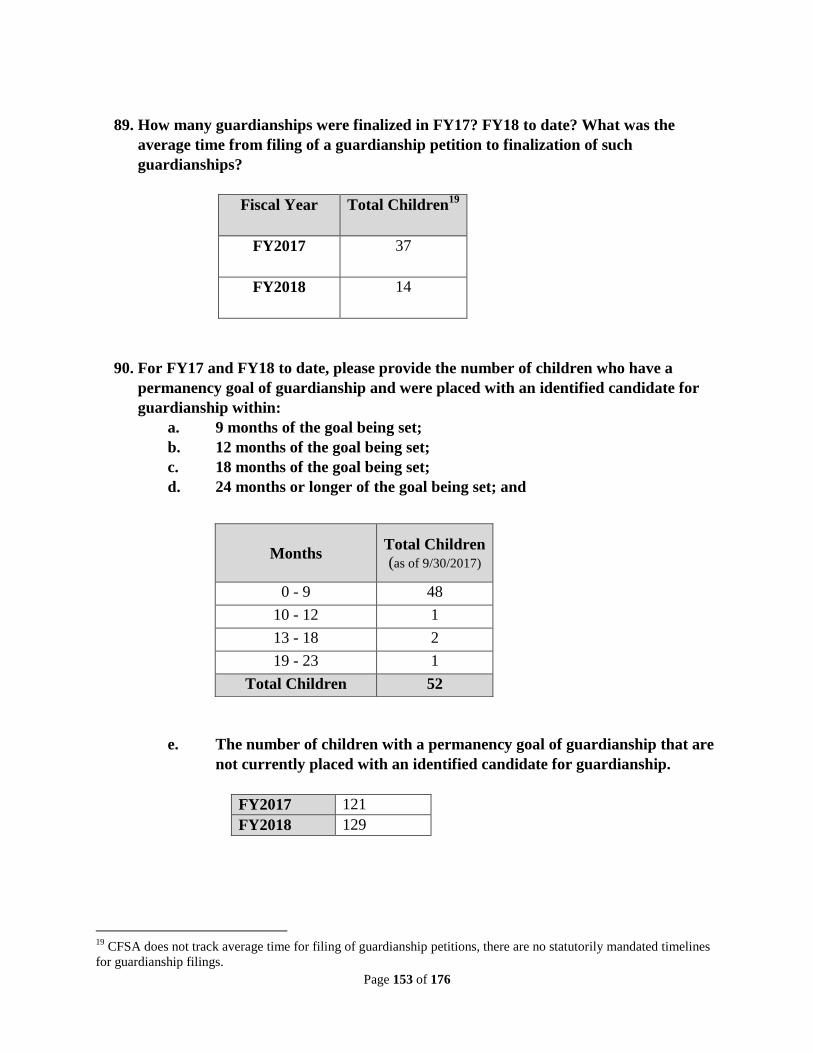
Page 153 of 176
89. How many guardianships were finalized in FY17? FY18 to date? What was the
average time from filing of a guardianship petition to finalization of such
guardianships?
Fiscal Year Total Children19
FY2017 37
FY2018 14
90. For FY17 and FY18 to date, please provide the number of children who have a
permanency goal of guardianship and were placed with an identified candidate for
guardianship within:
a. 9 months of the goal being set;
b. 12 months of the goal being set;
c. 18 months of the goal being set;
d. 24 months or longer of the goal being set; and
e. The number of children with a permanency goal of guardianship that are
not currently placed with an identified candidate for guardianship.
FY2017 121
FY2018 129
19
CFSA does not track average time for filing of guardianship petitions, there are no statutorily mandated timelines
for guardianship filings.
Months Total Children
(as of 9/30/2017)
0 - 9 48
10 - 12 1
13 - 18 2
19 - 23 1
Total Children 52
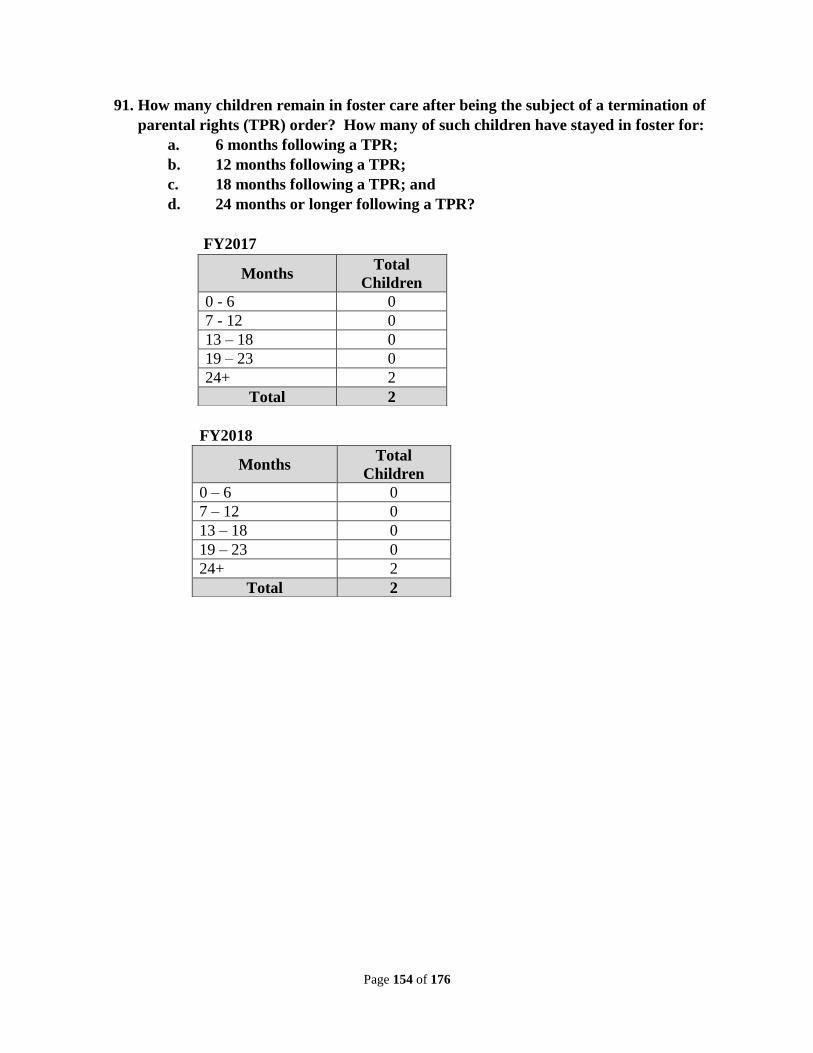
Page 154 of 176
91. How many children remain in foster care after being the subject of a termination of
parental rights (TPR) order? How many of such children have stayed in foster for:
a. 6 months following a TPR;
b. 12 months following a TPR;
c. 18 months following a TPR; and
d. 24 months or longer following a TPR?
FY2017
FY2018
Months Total
Children
0 - 6 0
7 - 12 0
13 – 18 0
19 – 23 0
24+ 2
Total 2
Months Total
Children
0 – 6 0
7 – 12 0
13 – 18 0
19 – 23 0
24+ 2
Total 2
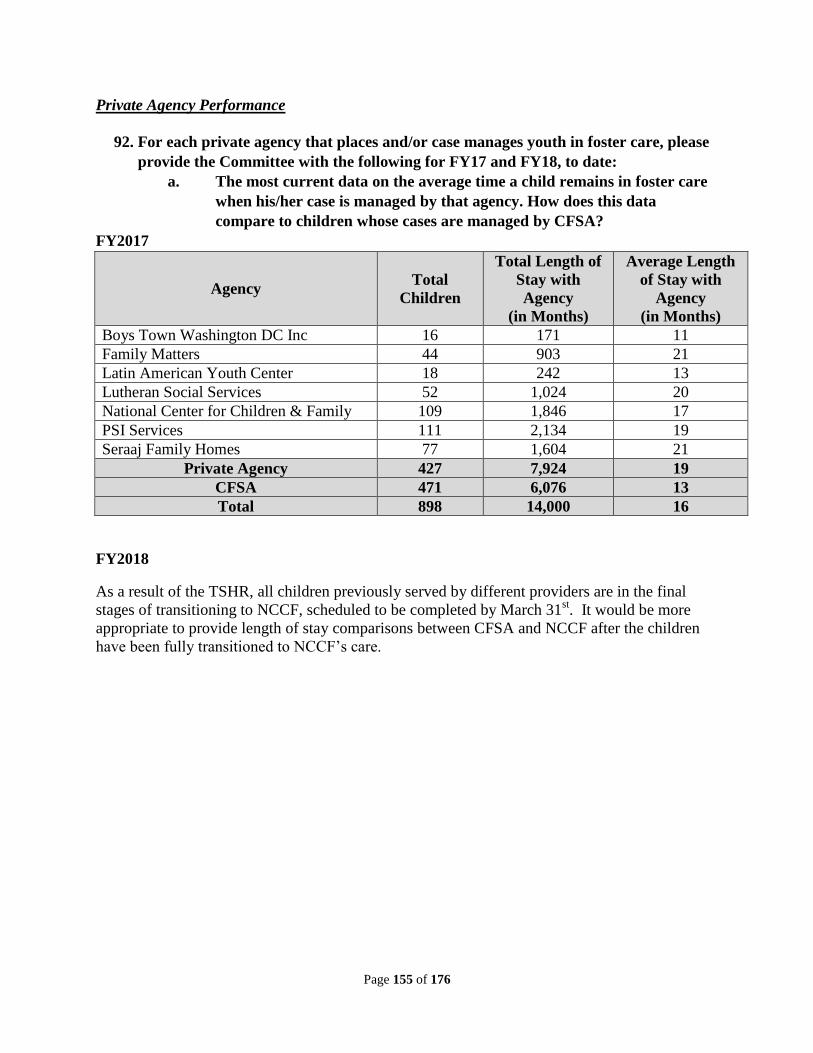
Page 155 of 176
Private Agency Performance
92. For each private agency that places and/or case manages youth in foster care, please
provide the Committee with the following for FY17 and FY18, to date:
a. The most current data on the average time a child remains in foster care
when his/her case is managed by that agency. How does this data
compare to children whose cases are managed by CFSA?
FY2017
Agency Total
Children
Total Length of
Stay with
Agency
(in Months)
Average Length
of Stay with
Agency
(in Months)
Boys Town Washington DC Inc 16 171 11
Family Matters 44 903 21
Latin American Youth Center 18 242 13
Lutheran Social Services 52 1,024 20
National Center for Children & Family 109 1,846 17
PSI Services 111 2,134 19
Seraaj Family Homes 77 1,604 21
Private Agency 427 7,924 19
CFSA 471 6,076 13
Total 898 14,000 16
FY2018
As a result of the TSHR, all children previously served by different providers are in the final
stages of transitioning to NCCF, scheduled to be completed by March 31st. It would be more
appropriate to provide length of stay comparisons between CFSA and NCCF after the children
have been fully transitioned to NCCF’s care.
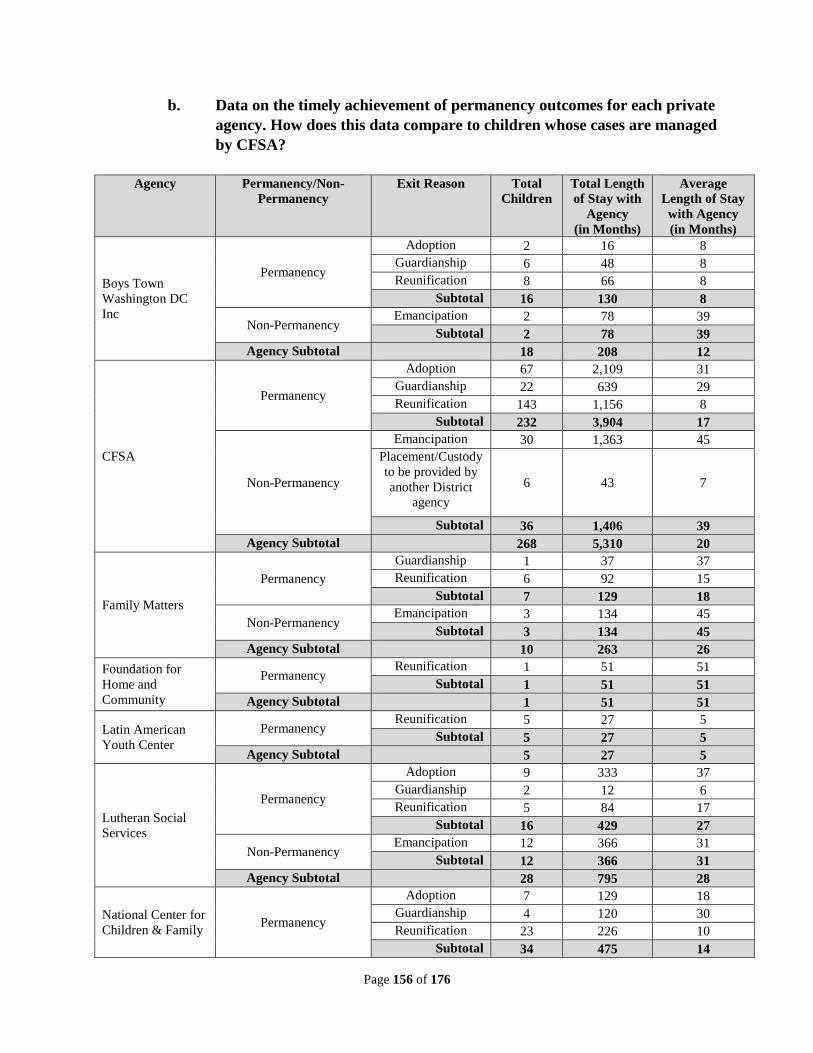
Page 156 of 176
b. Data on the timely achievement of permanency outcomes for each private
agency. How does this data compare to children whose cases are managed
by CFSA?
Agency Permanency/Non-
Permanency
Exit Reason Total
Children
Total Length
of Stay with
Agency
(in Months)
Average
Length of Stay
with Agency
(in Months)
Boys Town
Washington DC
Inc
Permanency
Adoption 2 16 8
Guardianship 6 48 8
Reunification 8 66 8
Subtotal 16 130 8
Non-Permanency Emancipation 2 78 39
Subtotal 2 78 39
Agency Subtotal 18 208 12
CFSA
Permanency
Adoption 67 2,109 31
Guardianship 22 639 29
Reunification 143 1,156 8
Subtotal 232 3,904 17
Non-Permanency
Emancipation 30 1,363 45
Placement/Custody
to be provided by
another District
agency
6 43 7
Subtotal 36 1,406 39
Agency Subtotal 268 5,310 20
Family Matters
Permanency
Guardianship 1 37 37
Reunification 6 92 15
Subtotal 7 129 18
Non-Permanency Emancipation 3 134 45
Subtotal 3 134 45
Agency Subtotal 10 263 26
Foundation for
Home and
Community
Permanency Reunification 1 51 51
Subtotal 1 51 51
Agency Subtotal 1 51 51
Latin American
Youth Center
Permanency Reunification 5 27 5
Subtotal 5 27 5
Agency Subtotal 5 27 5
Lutheran Social
Services
Permanency
Adoption 9 333 37
Guardianship 2 12 6
Reunification 5 84 17
Subtotal 16 429 27
Non-Permanency Emancipation 12 366 31
Subtotal 12 366 31
Agency Subtotal 28 795 28
National Center for
Children & Family Permanency
Adoption 7 129 18
Guardianship 4 120 30
Reunification 23 226 10
Subtotal 34 475 14
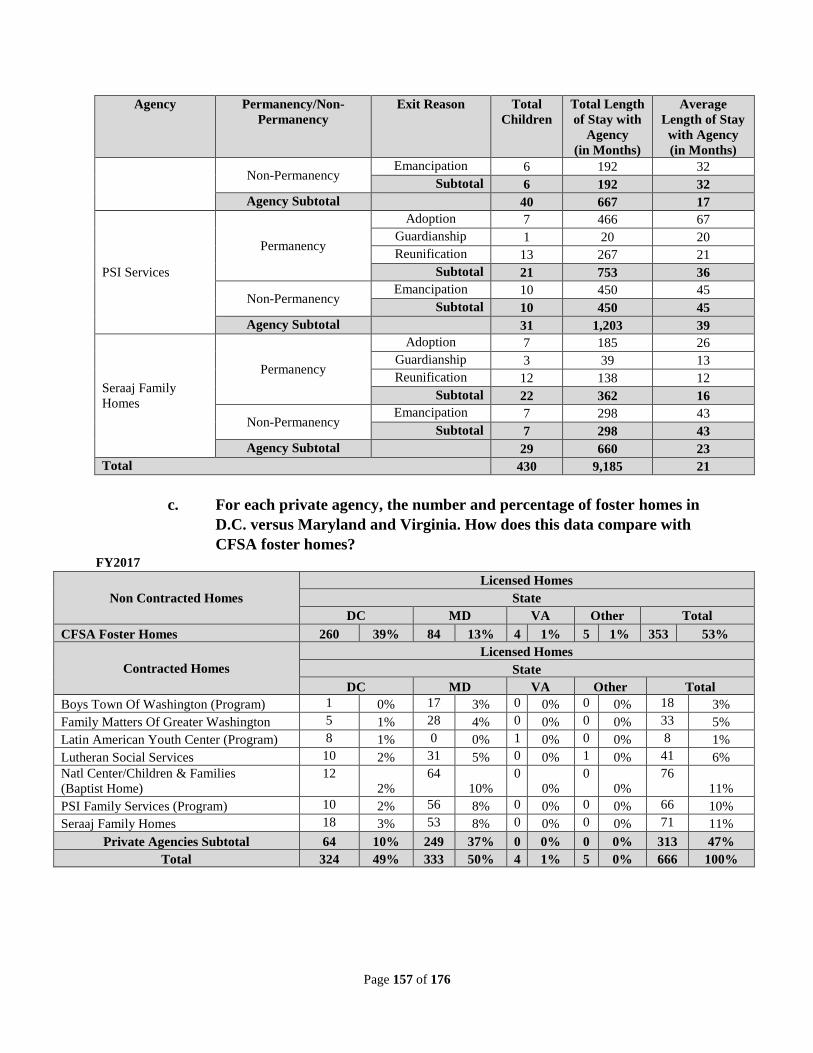
Page 157 of 176
Agency Permanency/Non-
Permanency
Exit Reason Total
Children
Total Length
of Stay with
Agency
(in Months)
Average
Length of Stay
with Agency
(in Months)
Non-Permanency Emancipation 6 192 32
Subtotal 6 192 32
Agency Subtotal 40 667 17
PSI Services
Permanency
Adoption 7 466 67
Guardianship 1 20 20
Reunification 13 267 21
Subtotal 21 753 36
Non-Permanency Emancipation 10 450 45
Subtotal 10 450 45
Agency Subtotal 31 1,203 39
Seraaj Family
Homes
Permanency
Adoption 7 185 26
Guardianship 3 39 13
Reunification 12 138 12
Subtotal 22 362 16
Non-Permanency Emancipation 7 298 43
Subtotal 7 298 43
Agency Subtotal 29 660 23
Total 430 9,185 21
c. For each private agency, the number and percentage of foster homes in
D.C. versus Maryland and Virginia. How does this data compare with
CFSA foster homes? FY2017
Non Contracted Homes
Licensed Homes
State
DC MD VA Other Total
CFSA Foster Homes 260 39% 84 13% 4 1% 5 1% 353 53%
Contracted Homes
Licensed Homes
State
DC MD VA Other Total
Boys Town Of Washington (Program) 1 0% 17 3% 0 0% 0 0% 18 3%
Family Matters Of Greater Washington 5 1% 28 4% 0 0% 0 0% 33 5%
Latin American Youth Center (Program) 8 1% 0 0% 1 0% 0 0% 8 1%
Lutheran Social Services 10 2% 31 5% 0 0% 1 0% 41 6%
Natl Center/Children & Families
(Baptist Home)
12
2%
64
10%
0
0%
0
0%
76
11%
PSI Family Services (Program) 10 2% 56 8% 0 0% 0 0% 66 10%
Seraaj Family Homes 18 3% 53 8% 0 0% 0 0% 71 11%
Private Agencies Subtotal 64 10% 249 37% 0 0% 0 0% 313 47%
Total 324 49% 333 50% 4 1% 5 0% 666 100%
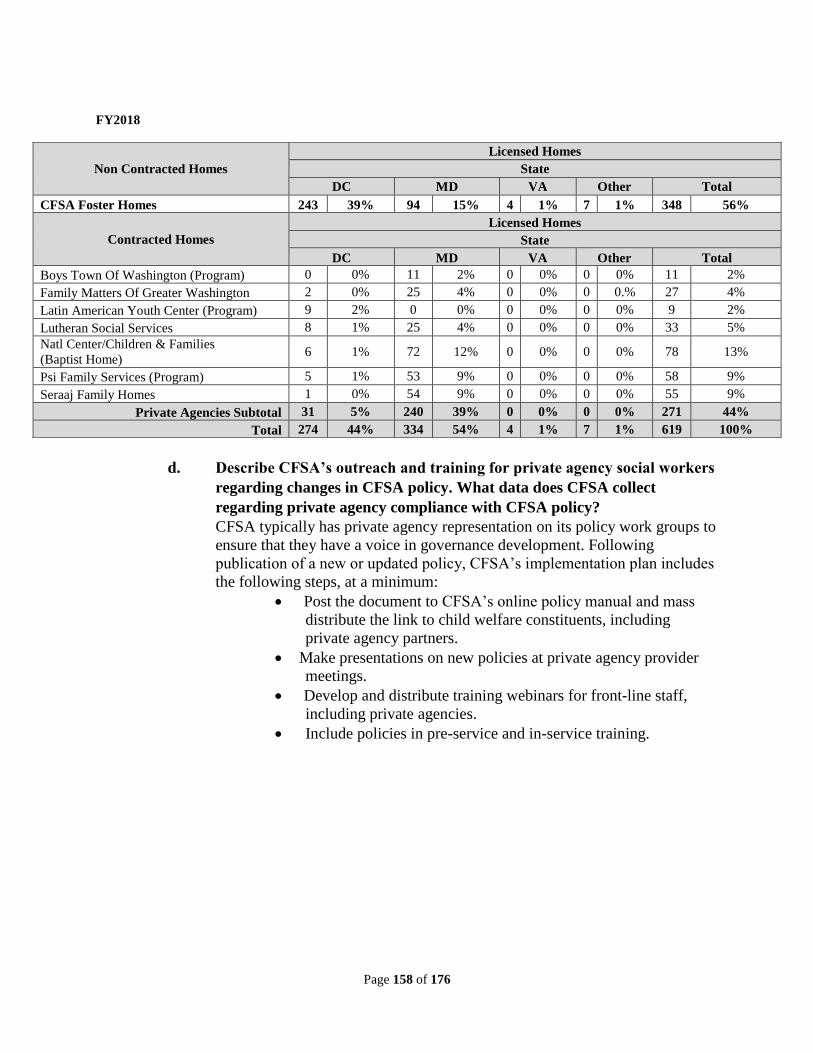
Page 158 of 176
FY2018
d. Describe CFSA’s outreach and training for private agency social workers
regarding changes in CFSA policy. What data does CFSA collect
regarding private agency compliance with CFSA policy?
CFSA typically has private agency representation on its policy work groups to
ensure that they have a voice in governance development. Following
publication of a new or updated policy, CFSA’s implementation plan includes
the following steps, at a minimum:
Post the document to CFSA’s online policy manual and mass
distribute the link to child welfare constituents, including
private agency partners.
Make presentations on new policies at private agency provider
meetings.
Develop and distribute training webinars for front-line staff,
including private agencies.
Include policies in pre-service and in-service training.
Non Contracted Homes
Licensed Homes
State
DC MD VA Other Total
CFSA Foster Homes 243 39% 94 15% 4 1% 7 1% 348 56%
Contracted Homes
Licensed Homes
State
DC MD VA Other Total
Boys Town Of Washington (Program) 0 0% 11 2% 0 0% 0 0% 11 2%
Family Matters Of Greater Washington 2 0% 25 4% 0 0% 0 0.% 27 4%
Latin American Youth Center (Program) 9 2% 0 0% 0 0% 0 0% 9 2%
Lutheran Social Services 8 1% 25 4% 0 0% 0 0% 33 5%
Natl Center/Children & Families
(Baptist Home) 6 1% 72 12% 0 0% 0 0% 78 13%
Psi Family Services (Program) 5 1% 53 9% 0 0% 0 0% 58 9%
Seraaj Family Homes 1 0% 54 9% 0 0% 0 0% 55 9%
Private Agencies Subtotal 31 5% 240 39% 0 0% 0 0% 271 44%
Total 274 44% 334 54% 4 1% 7 1% 619 100%
Page 159 of 176
93. During FY18, CFSA started the Safe Haven Redesign, which transitioned all foster
homes in DC and Maryland that were case managed by one of seven (7) private
agencies to the management of CFSA or the National Center for Children and
Families (NCCF).
a. Please explain why CFSA was not able to fully implement the Safe Haven
Redesign as of January 1, 2018 and what steps the Agency has taken and
will continue to take to ensure that there are (i) sufficient beds for all
youth in foster care; and (ii) there is minimal placement changes?
To ensure that all transitioning foster home recertifications were fully
COMAR (required by Maryland) compliant NCCF, our agency partner,
elected to conduct full home study reviews as opposed to utilizing the
expedited home study review process initially negotiated with the State of
Maryland. Therefore, 69 foster homes recertifications (31 PSI and 38 Seraaj)
were extended to March 31, 2018.
i. i. Throughout the transition process this fall CFSA and NCCF worked
together continuously to ensure that all transitioning youth and new
removals were placed in the most appropriate placements in a timely
manner. As of December 31, 2017 three of the six providers’ (Boys Town,
Lutheran Social Services and Family Matters) foster parents and foster
youth successfully transitioned to NCCF or to CFSA. To date, the
majority of existing foster parents (88 percent DC and 73 percent in
Maryland) have successfully transitioned.
With the transition CFSA will acquire a number of newly licensed foster
homes that currently have no placements, therefore the overall pool of
available foster home beds in Maryland will increase.
ii. ii. Regarding placement stability, for the 316 children initially affected by
the Temporary Safe Haven Redesign (TSHR) transition, only 19 children
required replacement (6 percent of the affected children). Overall, the
youth in foster care remained stable throughout the major portion of the
TSHR transition.
Page 160 of 176
b. How many youth have changed placements because their foster parents
did not want to be managed by CFSA or NCCF (or for other reasons
related to the redesign)?
i. How many of these youth changed jurisdictions as a result of
this placement change? Of the 19 youth replaced, seven moved
from a Maryland foster home placement to a District foster home
placement. Four were placed in CFSA foster homes and three
were placed in CFSA monitored group homes.
ii. How many of these youth changed schools as a result of this
placement change? To date, only four of the 19 youth replaced as
a result of TSHR have transferred to a new school (less than 1
percent of the overall 316 youth who were affected by TSHR
implementation).
c. How many youth does the Agency expect to change placements?
i. How is the Agency planning to track the effects of these
changes? CFSA does not anticipate a significant number of
additional changes related to TSHR. Of the remaining 69 foster
home transitions, current foster parents have indicated that they
will transfer to NCCF by March 31, 2018. While there may be
some changes that occur over the next two months, these changes
would be within the normal course of business.
ii. What resources are the Agency using or planning to use to
ensure smooth changes/transitions? CFSA and NCCF meet
weekly on the status of license re-certifications. NCCF re-licensing
staff is adequately resourced to process the remaining foster home
recertifications by March 31, 2018. Therefore, CFSA does not
anticipate needing additional resources.
Page 161 of 176
d. How many foster home beds (vacant and filled) did CFSA net by ending
its contract with the seven private agencies and awarding the sole
provider contract to NCCF? Taking into consideration those foster homes
that closed as a result of children reaching permanency and normal attrition
through foster parent retirements it is not possible to project “net new” foster
home beds based on Temporary Safe Haven Redesign foster home beds at this
time. CFSA will have a better estimate of “net new” foster home beds by
March 31, 2018 once the remaining foster homes have transitioned.
e. How is CFSA ensuring that NCCF is equipped to provide DC foster
youth and their families culturally competent case management?
CFSA and NCCF have well established training programs and utilize national
best practice training curricula to train staff. A portion of that training
addresses cultural competency.
CFSA and NCCF have strong quality assurance processes to address
continuous quality improvement and are mutually working together on
clinical best practices with line staff and managers to ensure continuity of
service delivery.
Working closely together as partners CFSA and NCCF will also create
enhanced training opportunities to train staff on areas of birth family
engagement and identification of kin resources, utilizing national evidence
based practices.
f. What supports does CFSA plan to provide foster parents in Maryland if
these foster parents express that NCCF is not providing them the
supports necessary to care for the DC foster children that are in their
home? CFSA and NCCF are working jointly to ensure that there is open
communication regarding resources and supports. Over the past year CFSA
worked closely with the overall foster parent community to identify gaps in
services and to address concerns through tough hall meetings and written
communication. As partners CFSA and NCCF will continue this work,
providing clear communication on what services are provided and how
services should be accessed, either from CFSA directly or NCCF. In
instances where foster parents have concerns about access to needed services
foster parents have the ability to communicate with the CFSA Program
Operations and Office of Well Being Management leadership and the agency
ombudsman for assistance.
Page 162 of 176
94. Please list any reprogramming, in or out which occurred in FY17 and FY18, to date.
For each reprogramming, please list the total amount of reprogramming, the original
purposes for which funds were dedicated, and the reprogrammed use of funds.
See Attachment Q94, Local and Federal Reprogramming Reports FY2017-FY2018
95. Please provide a list of all studies, research papers, and analyses (“studies”) the
agency prepared, or contracted for, during FY17 and FY18, to date. Please state the
status and purpose of each study.
See Attachment Q95, CFSA Research and Analysis Reports
Youth Bill of Rights
96. Regarding the Foster Youth Rights and Responsibilities Act of 2012, please provide
an update about ongoing efforts taken to educate:
a. Youth about their rights and responsibilities; In February 2016, the CFSA
Child Welfare Training Academy (CWTA) designed and developed a webinar
for training of the Youth Bill of Rights (YBOR). The webinar was recorded
and sent to CFSA and private agency social workers, family support workers
and resource parents. Included with the webinar link was the completed
YBOR document and instructions on how to access the webinar.
The YBOR is posted on the Agency’s website along with the associated law
and regulations. CFSA requires group home providers to post copies of the
document in their facilities, and we ensure that this has taken place as part of
routine facility monitoring.
YBORs have also been included as part of the Placement Packet. This will
ensure that when a youth is placed the resource parents and youth have an
opportunity to review and understand their rights. Lastly, CFSA has created
YBOR’s in other languages, which is available on the CFSA internet:
● Spanish
● Vietnamese
● Amharic
CFSA and private-provider social workers are mandated to provide a
hardcopy of the YBOR to all children and youth over age 14 in foster care or
to the guardian ad litem of children under 14 years of age.
Page 163 of 176
b. Resource providers about their responsibilities under the law?
The CFSA Director sent guidance through email notification to family-based
foster care providers, congregate care providers, CFSA foster parents, Family
Court judges, guardians ad litem, child advocates, and other stakeholders. It
emphasized the intent of the YBOR and clarified that everyone involved with
children and youth in care is expected to uphold these rights, and described
distribution procedures going forward.
CFSA maintains ongoing efforts to educate stakeholders about YBOR
included OPPPS team member completion information sessions and staff
development sessions for the Private Agencies and CFSA staff. Recently in
January 2018, information review sessions occurred with staff at OYE, the
Private Agencies and Permanency.
Housing & Rapid Housing
97. Please provide a detailed status report on the usage of Rapid Housing in FY17 and in
FY18 to date, including:
a. The number of parents who applied for Rapid Housing to keep children out
of foster care. How many children were within these families?
See chart below.
b. The number of parents who received Rapid Housing to keep children out of
foster care. How many children were within these families?
See chart below.
c. The number of reunification cases in which families applied for Rapid
Housing. See chart below.
d. The number of reunification cases in which families received Rapid Housing.
See chart below.
e. The number of youth emancipating from care who applied for Rapid
Housing. See chart below.
f. The number of youth emancipating from care who received Rapid Housing.
See chart below.
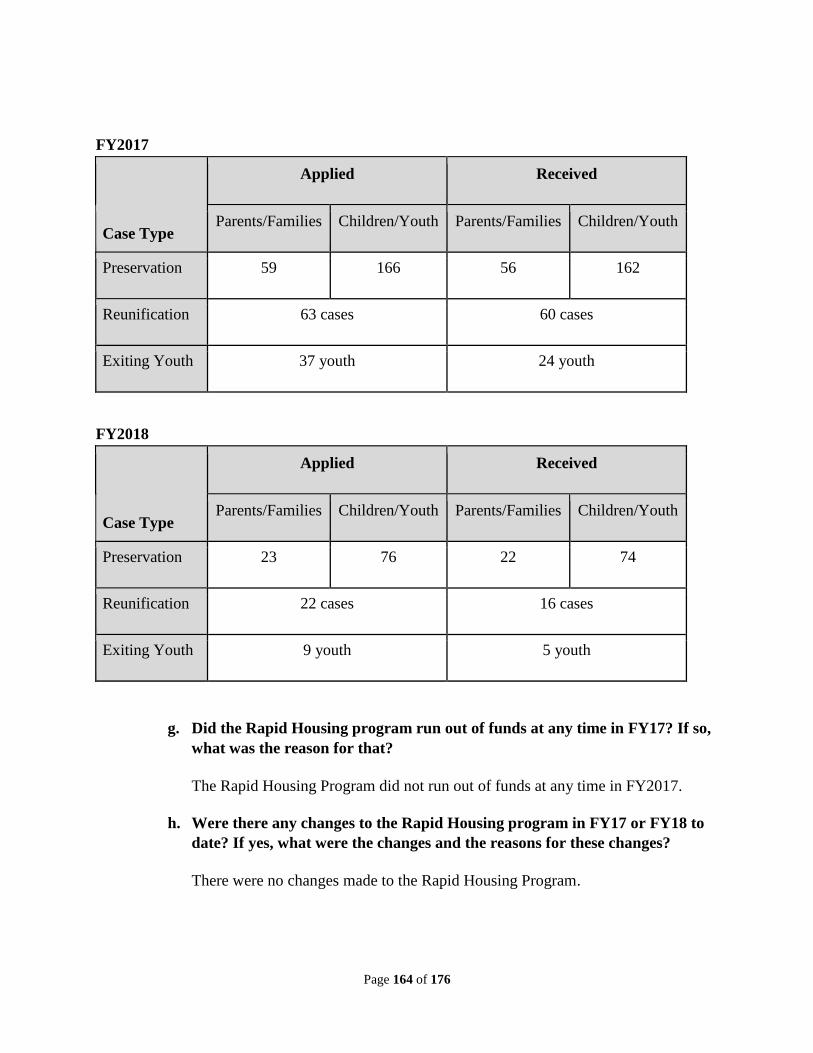
Page 164 of 176
FY2017
Case Type
Applied Received
Parents/Families Children/Youth Parents/Families Children/Youth
Preservation 59 166 56 162
Reunification 63 cases 60 cases
Exiting Youth 37 youth 24 youth
FY2018
Case Type
Applied Received
Parents/Families Children/Youth Parents/Families Children/Youth
Preservation 23 76 22 74
Reunification 22 cases 16 cases
Exiting Youth 9 youth 5 youth
g. Did the Rapid Housing program run out of funds at any time in FY17? If so,
what was the reason for that?
The Rapid Housing Program did not run out of funds at any time in FY2017.
h. Were there any changes to the Rapid Housing program in FY17 or FY18 to
date? If yes, what were the changes and the reasons for these changes?
There were no changes made to the Rapid Housing Program.
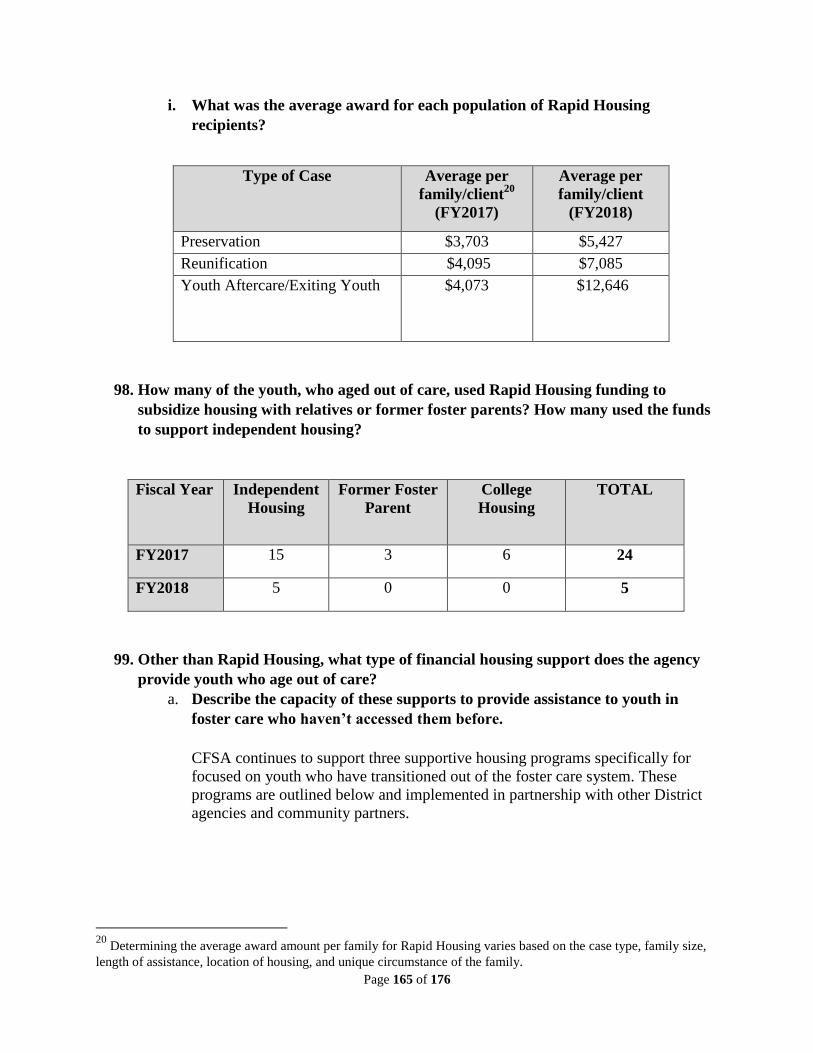
Page 165 of 176
i. What was the average award for each population of Rapid Housing
recipients?
Type of Case Average per
family/client20
(FY2017)
Average per
family/client
(FY2018)
Preservation $3,703 $5,427
Reunification $4,095 $7,085
Youth Aftercare/Exiting Youth $4,073 $12,646
98. How many of the youth, who aged out of care, used Rapid Housing funding to
subsidize housing with relatives or former foster parents? How many used the funds
to support independent housing?
Fiscal Year Independent
Housing
Former Foster
Parent
College
Housing
TOTAL
FY2017 15 3 6 24
FY2018 5 0 0 5
99. Other than Rapid Housing, what type of financial housing support does the agency
provide youth who age out of care?
a. Describe the capacity of these supports to provide assistance to youth in
foster care who haven’t accessed them before.
CFSA continues to support three supportive housing programs specifically for
focused on youth who have transitioned out of the foster care system. These
programs are outlined below and implemented in partnership with other District
agencies and community partners.
20
Determining the average award amount per family for Rapid Housing varies based on the case type, family size,
length of assistance, location of housing, and unique circumstance of the family.
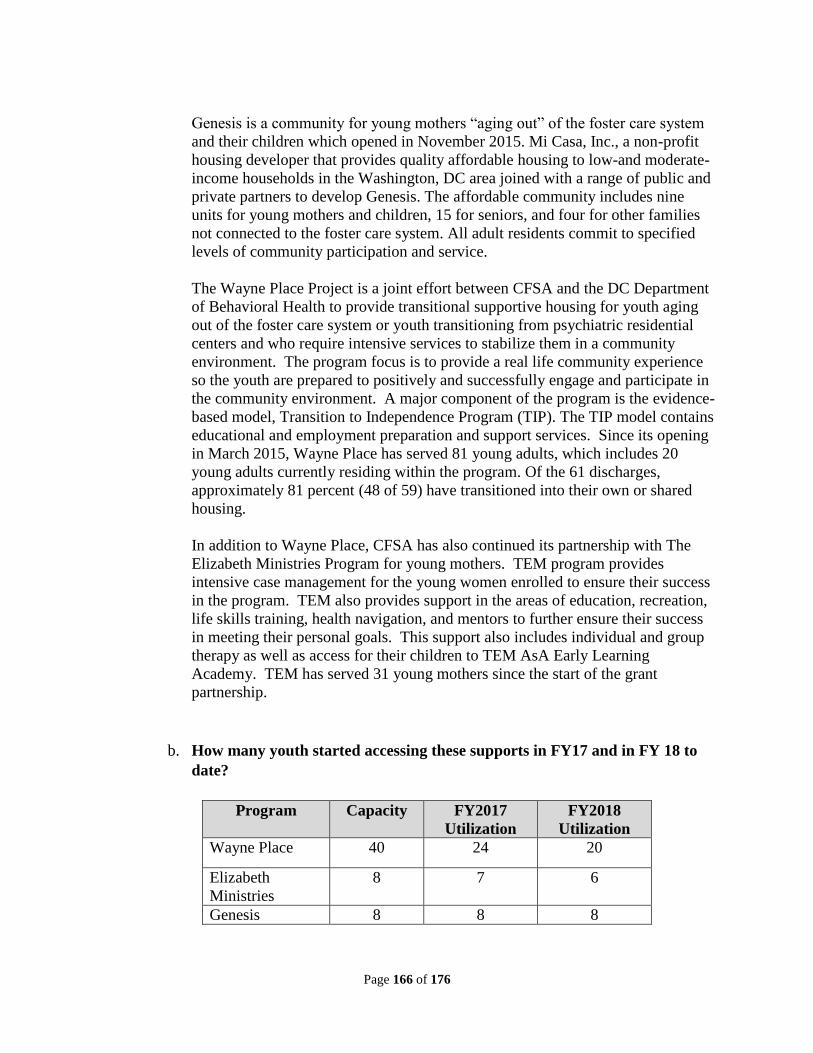
Page 166 of 176
Genesis is a community for young mothers “aging out” of the foster care system
and their children which opened in November 2015. Mi Casa, Inc., a non-profit
housing developer that provides quality affordable housing to low-and moderate-
income households in the Washington, DC area joined with a range of public and
private partners to develop Genesis. The affordable community includes nine
units for young mothers and children, 15 for seniors, and four for other families
not connected to the foster care system. All adult residents commit to specified
levels of community participation and service.
The Wayne Place Project is a joint effort between CFSA and the DC Department
of Behavioral Health to provide transitional supportive housing for youth aging
out of the foster care system or youth transitioning from psychiatric residential
centers and who require intensive services to stabilize them in a community
environment. The program focus is to provide a real life community experience
so the youth are prepared to positively and successfully engage and participate in
the community environment. A major component of the program is the evidence-
based model, Transition to Independence Program (TIP). The TIP model contains
educational and employment preparation and support services. Since its opening
in March 2015, Wayne Place has served 81 young adults, which includes 20
young adults currently residing within the program. Of the 61 discharges,
approximately 81 percent (48 of 59) have transitioned into their own or shared
housing.
In addition to Wayne Place, CFSA has also continued its partnership with The
Elizabeth Ministries Program for young mothers. TEM program provides
intensive case management for the young women enrolled to ensure their success
in the program. TEM also provides support in the areas of education, recreation,
life skills training, health navigation, and mentors to further ensure their success
in meeting their personal goals. This support also includes individual and group
therapy as well as access for their children to TEM AsA Early Learning
Academy. TEM has served 31 young mothers since the start of the grant
partnership.
b. How many youth started accessing these supports in FY17 and in FY 18 to
date?
Program Capacity FY2017
Utilization
FY2018
Utilization
Wayne Place 40 24 20
Elizabeth
Ministries
8 7 6
Genesis 8 8 8
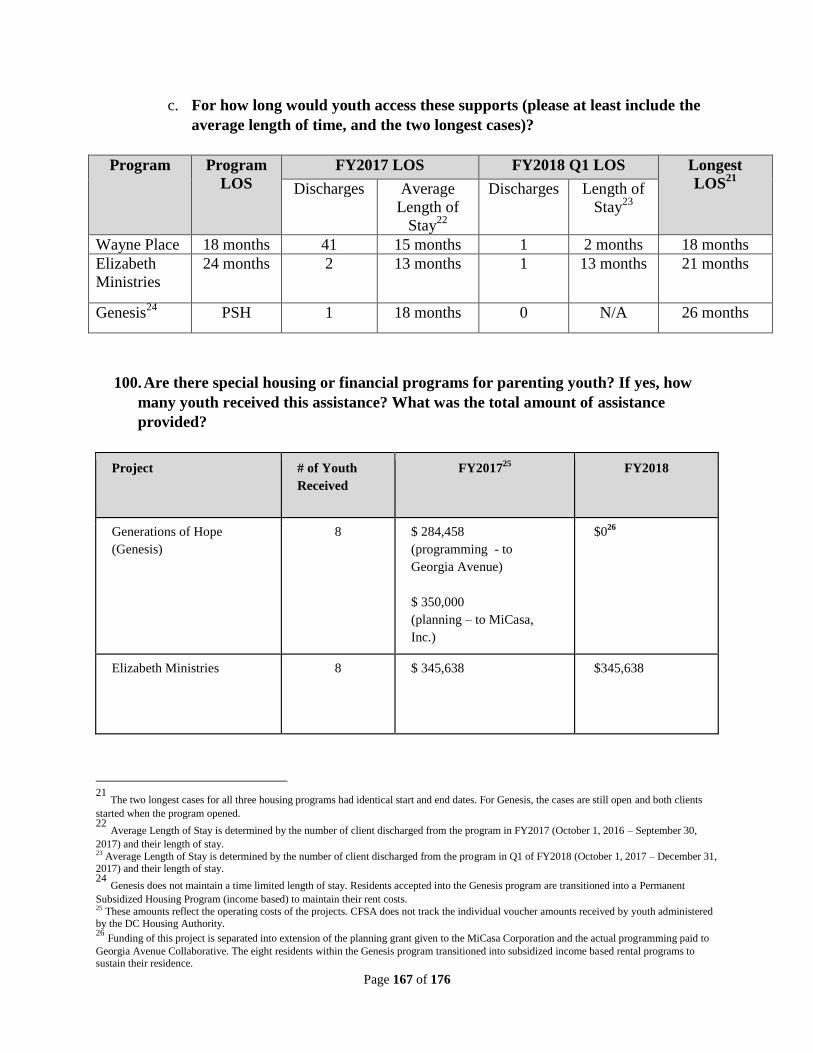
Page 167 of 176
c. For how long would youth access these supports (please at least include the
average length of time, and the two longest cases)?
Program Program
LOS
FY2017 LOS FY2018 Q1 LOS Longest
LOS21
Discharges Average
Length of
Stay22
Discharges Length of
Stay23
Wayne Place 18 months 41 15 months 1 2 months 18 months
Elizabeth
Ministries
24 months 2 13 months 1 13 months 21 months
Genesis24
PSH 1 18 months 0 N/A 26 months
100. Are there special housing or financial programs for parenting youth? If yes, how
many youth received this assistance? What was the total amount of assistance
provided?
Project # of Youth
Received
FY201725
FY2018
Generations of Hope
(Genesis)
8 $ 284,458
(programming - to
Georgia Avenue)
$ 350,000
(planning – to MiCasa,
Inc.)
$026
Elizabeth Ministries 8 $ 345,638 $345,638
21
The two longest cases for all three housing programs had identical start and end dates. For Genesis, the cases are still open and both clients
started when the program opened. 22
Average Length of Stay is determined by the number of client discharged from the program in FY2017 (October 1, 2016 – September 30,
2017) and their length of stay. 23 Average Length of Stay is determined by the number of client discharged from the program in Q1 of FY2018 (October 1, 2017 – December 31, 2017) and their length of stay. 24
Genesis does not maintain a time limited length of stay. Residents accepted into the Genesis program are transitioned into a Permanent
Subsidized Housing Program (income based) to maintain their rent costs. 25 These amounts reflect the operating costs of the projects. CFSA does not track the individual voucher amounts received by youth administered by the DC Housing Authority. 26
Funding of this project is separated into extension of the planning grant given to the MiCasa Corporation and the actual programming paid to
Georgia Avenue Collaborative. The eight residents within the Genesis program transitioned into subsidized income based rental programs to sustain their residence.
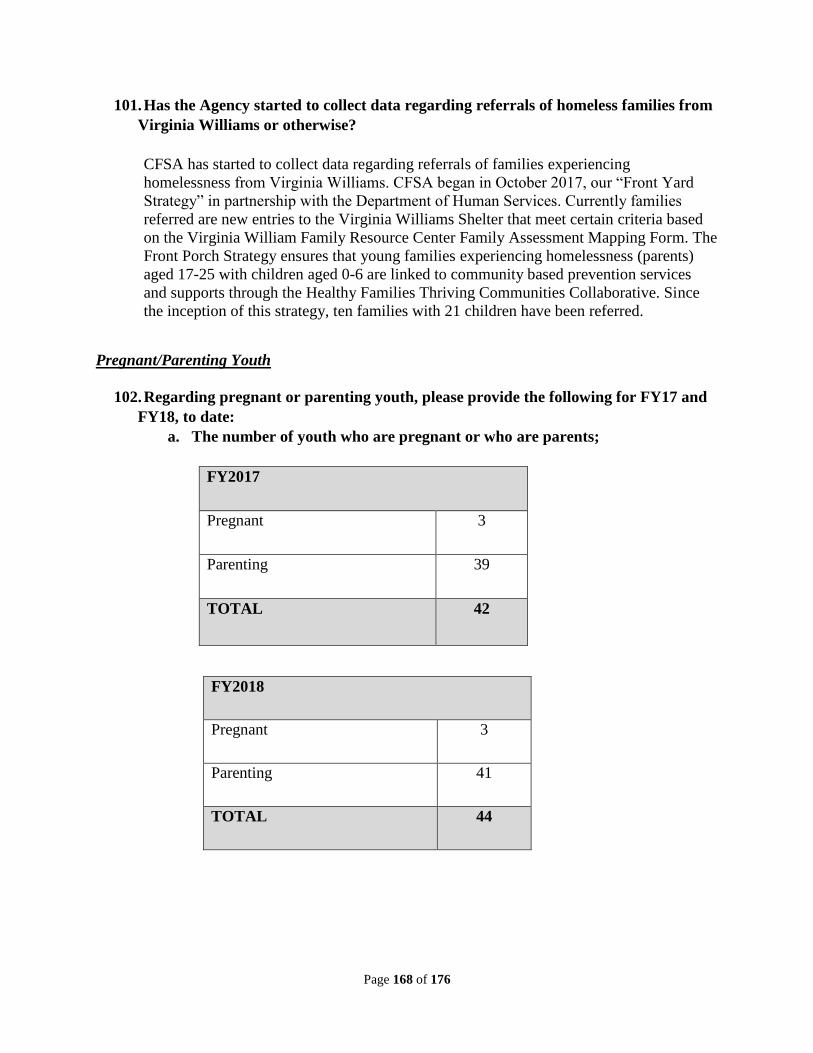
Page 168 of 176
101. Has the Agency started to collect data regarding referrals of homeless families from
Virginia Williams or otherwise?
CFSA has started to collect data regarding referrals of families experiencing
homelessness from Virginia Williams. CFSA began in October 2017, our “Front Yard
Strategy” in partnership with the Department of Human Services. Currently families
referred are new entries to the Virginia Williams Shelter that meet certain criteria based
on the Virginia William Family Resource Center Family Assessment Mapping Form. The
Front Porch Strategy ensures that young families experiencing homelessness (parents)
aged 17-25 with children aged 0-6 are linked to community based prevention services
and supports through the Healthy Families Thriving Communities Collaborative. Since
the inception of this strategy, ten families with 21 children have been referred.
Pregnant/Parenting Youth
102. Regarding pregnant or parenting youth, please provide the following for FY17 and
FY18, to date:
a. The number of youth who are pregnant or who are parents;
FY2017
Pregnant 3
Parenting 39
TOTAL 42
FY2018
Pregnant 3
Parenting 41
TOTAL 44
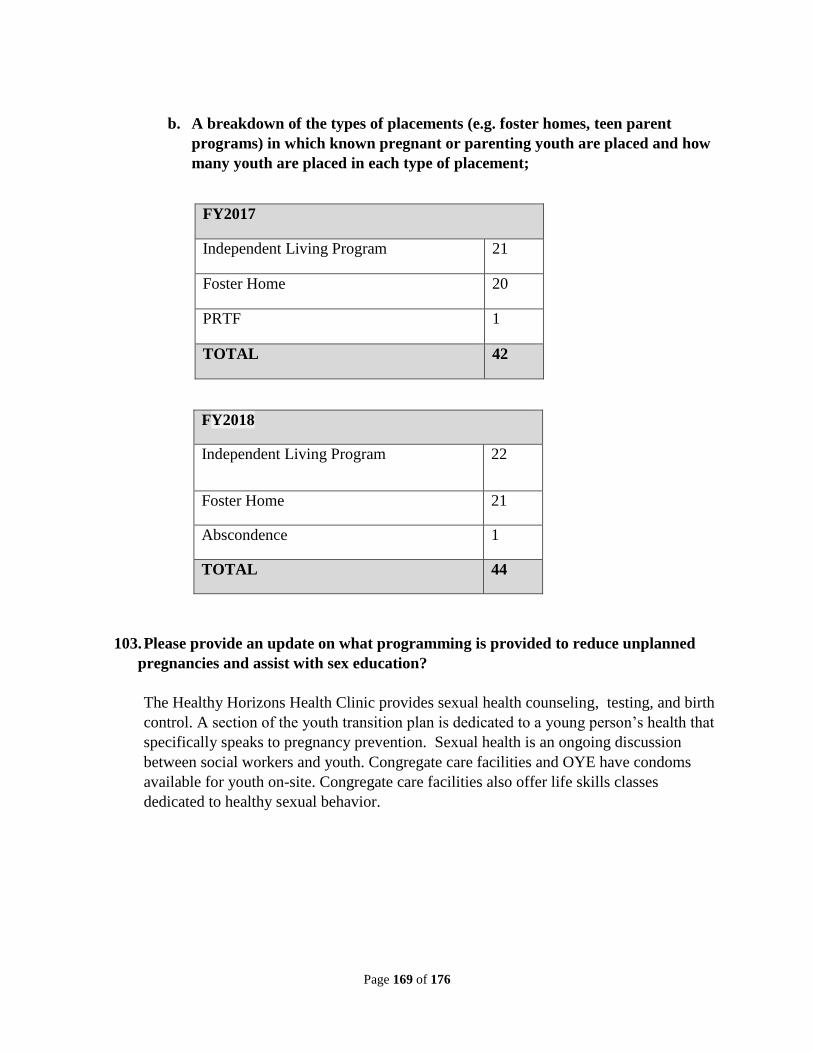
Page 169 of 176
b. A breakdown of the types of placements (e.g. foster homes, teen parent
programs) in which known pregnant or parenting youth are placed and how
many youth are placed in each type of placement;
FY2017
Independent Living Program 21
Foster Home 20
PRTF 1
TOTAL 42
FY2018
Independent Living Program 22
Foster Home 21
Abscondence 1
TOTAL 44
103. Please provide an update on what programming is provided to reduce unplanned
pregnancies and assist with sex education?
The Healthy Horizons Health Clinic provides sexual health counseling, testing, and birth
control. A section of the youth transition plan is dedicated to a young person’s health that
specifically speaks to pregnancy prevention. Sexual health is an ongoing discussion
between social workers and youth. Congregate care facilities and OYE have condoms
available for youth on-site. Congregate care facilities also offer life skills classes
dedicated to healthy sexual behavior.
Page 170 of 176
104. Regarding teen parent programs, please describe:
a. The training that program staff receive in order to work with teen parents;
Program staff who work with teen parents are required to meet the same training
requirements as staff within other congregate care programs as outlined in
Chapter 62, Licensing of Youth Shelters, Runaway Shelters, Emergency Care
Facilities, and Youth Group Homes. Program staff must complete at least 20
hours of pre-service training and 40 hours of annual in-service training.
b. How CFSA monitors teen parent programs to ensure the safety of and
quality of services provided to pregnant and parenting youth;
CFSA conducts monthly announced and unannounced visits, monthly physical
plant inspections, youth record reviews, staff record reviews; and youth
interviews to ensure the safety and quality of services for pregnant and parenting
youth.
c. The programming CFSA provides for teen mothers/fathers;
Teen mothers in congregate care facilities are offered substance abuse support,
financial literacy, sewing classes, home maintenance classes, healthy cooking
classes, field trips, movie nights, and “mommy read to me” activities. They are
also able to participate in the Personal Best and Bright Beginnings curricula
which focus on the mothers as adolescents and parents while strongly
encouraging co-parenting.
Teen mothers and teen fathers are also eligible for linkage to all community
resources pertaining to parenting youth such as Women, Infants & Children
(WIC), Safe Sleep, Healthy Babies, Mary’s Center, and the DC Diaper
Bank. CFSA does not track teen fathers in care or linkage to community
resources. However, if a young man is identified as a father he is eligible to
receive the same supportive services.
d. The number of teen mothers/teen fathers that have participated in these
programs? All teen mothers placed in congregate care have participated in one
or more of the programs provided through their placements as it is a requirement
for continued admission, individualized case management, and programming. A
total of 35 teen mothers and six teen fathers participated in parenting classes. A
total of 31 participated in cooking/ meal planning. A total of 29 participated in
budgeting/ financial literacy. Seven teen parents participated in substance abuse
classes.
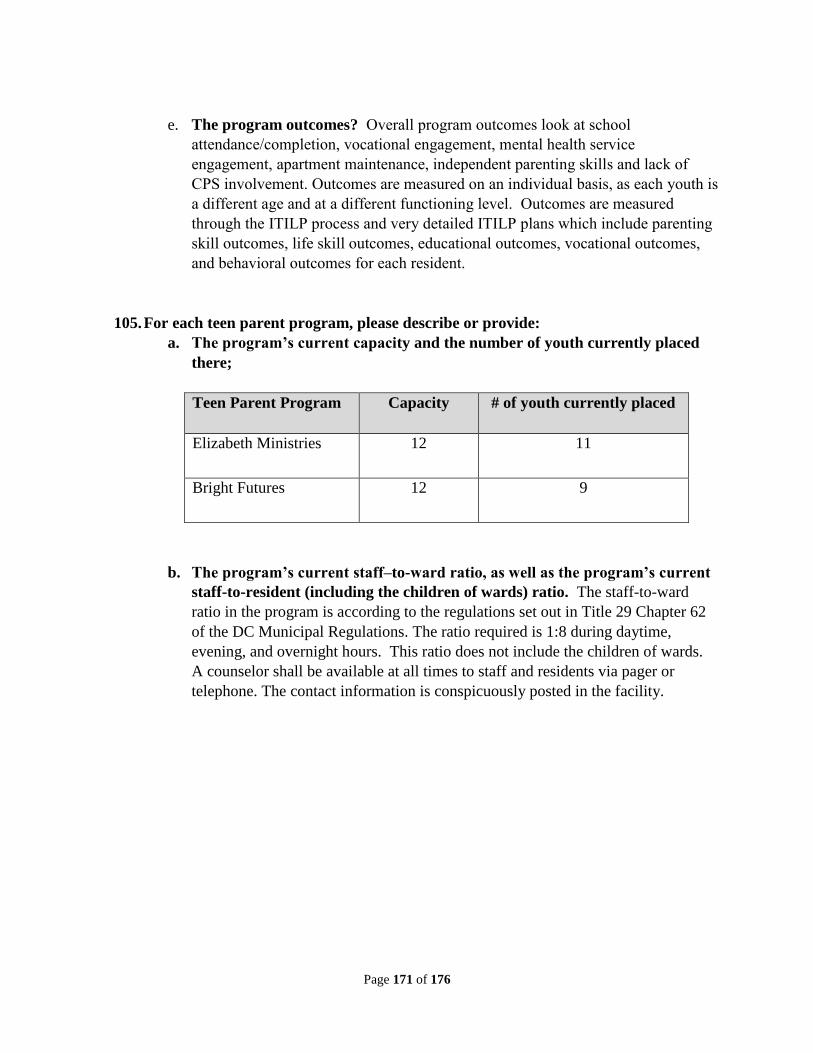
Page 171 of 176
e. The program outcomes? Overall program outcomes look at school
attendance/completion, vocational engagement, mental health service
engagement, apartment maintenance, independent parenting skills and lack of
CPS involvement. Outcomes are measured on an individual basis, as each youth is
a different age and at a different functioning level. Outcomes are measured
through the ITILP process and very detailed ITILP plans which include parenting
skill outcomes, life skill outcomes, educational outcomes, vocational outcomes,
and behavioral outcomes for each resident.
105. For each teen parent program, please describe or provide:
a. The program’s current capacity and the number of youth currently placed
there;
Teen Parent Program Capacity # of youth currently placed
Elizabeth Ministries 12 11
Bright Futures 12 9
b. The program’s current staff–to-ward ratio, as well as the program’s current
staff-to-resident (including the children of wards) ratio. The staff-to-ward
ratio in the program is according to the regulations set out in Title 29 Chapter 62
of the DC Municipal Regulations. The ratio required is 1:8 during daytime,
evening, and overnight hours. This ratio does not include the children of wards.
A counselor shall be available at all times to staff and residents via pager or
telephone. The contact information is conspicuously posted in the facility.
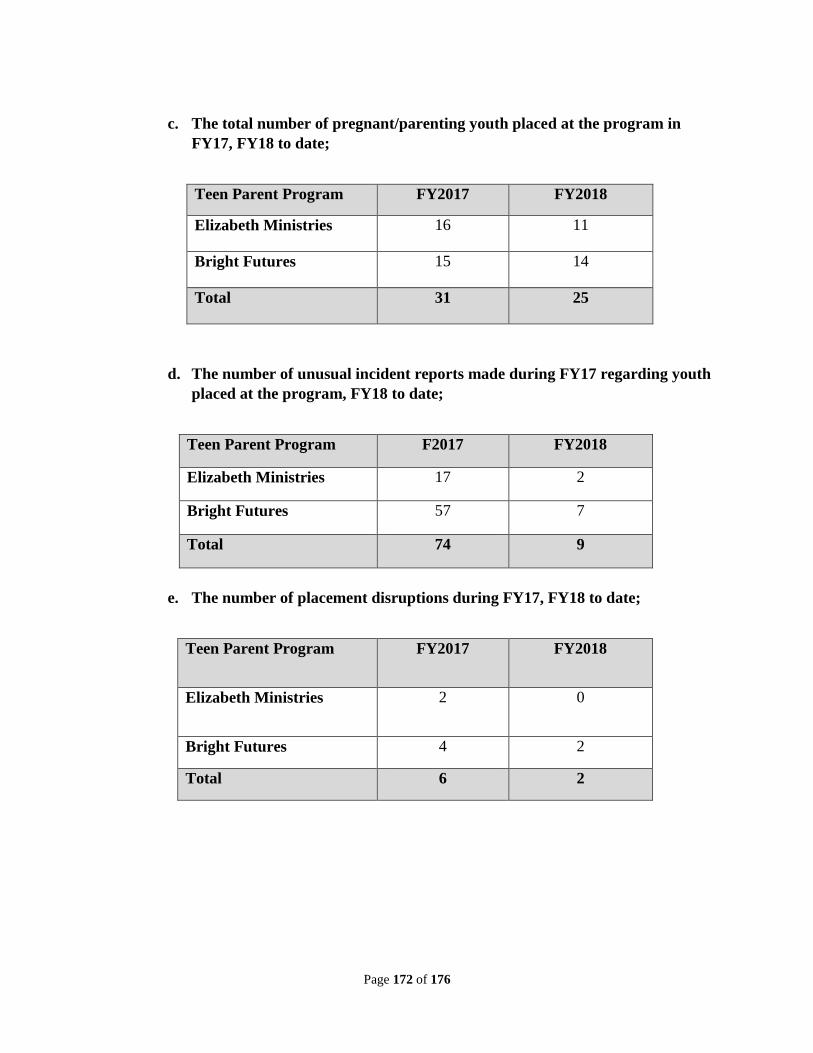
Page 172 of 176
c. The total number of pregnant/parenting youth placed at the program in
FY17, FY18 to date;
Teen Parent Program FY2017 FY2018
Elizabeth Ministries 16 11
Bright Futures 15 14
Total 31 25
d. The number of unusual incident reports made during FY17 regarding youth
placed at the program, FY18 to date;
Teen Parent Program F2017 FY2018
Elizabeth Ministries 17 2
Bright Futures 57 7
Total 74 9
e. The number of placement disruptions during FY17, FY18 to date;
Teen Parent Program FY2017 FY2018
Elizabeth Ministries 2 0
Bright Futures 4 2
Total 6 2
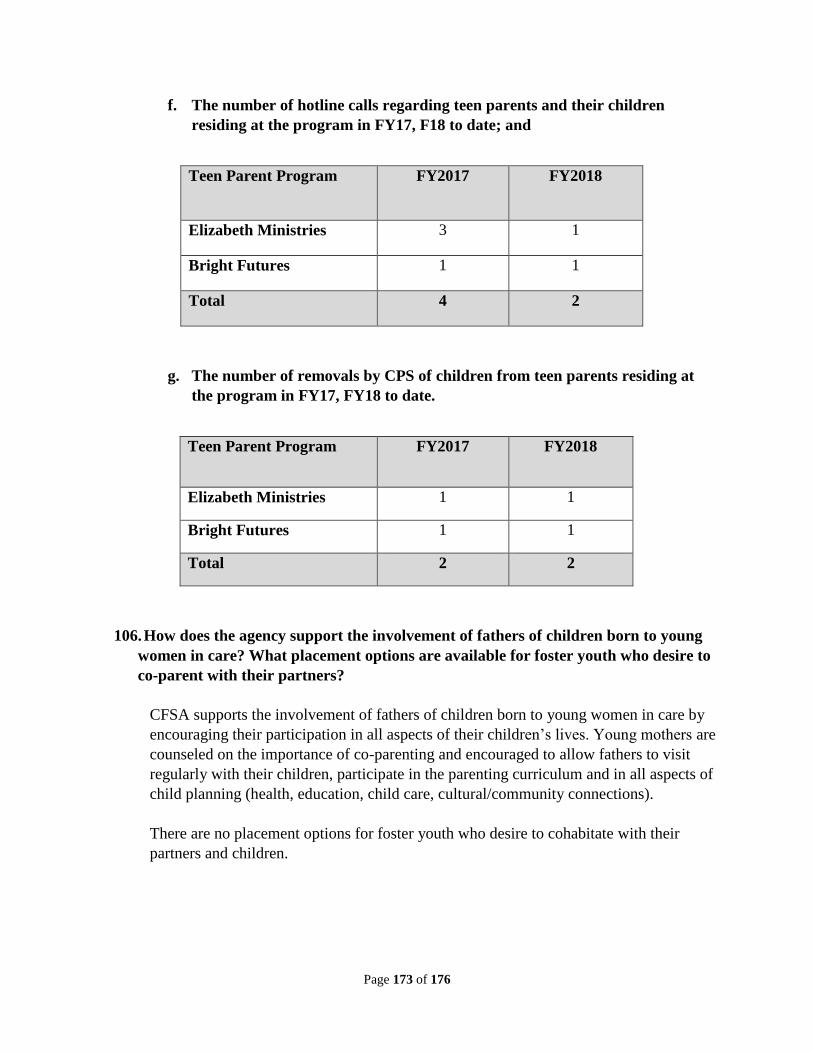
Page 173 of 176
f. The number of hotline calls regarding teen parents and their children
residing at the program in FY17, F18 to date; and
Teen Parent Program FY2017 FY2018
Elizabeth Ministries 3 1
Bright Futures 1 1
Total 4 2
g. The number of removals by CPS of children from teen parents residing at
the program in FY17, FY18 to date.
Teen Parent Program FY2017 FY2018
Elizabeth Ministries 1 1
Bright Futures 1 1
Total 2 2
106. How does the agency support the involvement of fathers of children born to young
women in care? What placement options are available for foster youth who desire to
co-parent with their partners?
CFSA supports the involvement of fathers of children born to young women in care by
encouraging their participation in all aspects of their children’s lives. Young mothers are
counseled on the importance of co-parenting and encouraged to allow fathers to visit
regularly with their children, participate in the parenting curriculum and in all aspects of
child planning (health, education, child care, cultural/community connections).
There are no placement options for foster youth who desire to cohabitate with their
partners and children.
Page 174 of 176
107. Please provide an update regarding CFSA’s progress in implementing the
recommendations of its Youth Aftercare Workgroup.
Below are the recommendations presented by the Youth Aftercare Workgroup with an
update on progress in each area:
1. Designate Leadership and Staffing for the program.
The Office of Youth Empowerment has been designated as the lead for this program,
working to ensure a seamless referral process and monitoring the progress of the
youth being served.
2. Establish expanded, uniformed outcome measures.
CFSA is using a comprehensive set of “Transition-to-Adulthood” benchmarks and
outcomes to measure progress of youth participating in Aftercare services. These
benchmarks and outcomes cover ten critical domains for youth and young adults ages
14-23: housing, education, employment, financial stability, health, (physical, mental,
sexual), relationships/core connections, personal agency/maturity, life skills,
documents and parenting. Across these domains, the benchmarks and outcomes aim
for the achievement of two overarching goals: day-to-day stability and the
development of broad adult competencies.
3. Change the program mode.
Recognizing that best practice in working with young adults aging out of the foster
care system indicates use of a youth partnership/positive youth development model,
in FY2017, CFSA issued a new scope of work for Aftercare that would rely
extensively on this model. The selected provider, The Young Women’s Project,
demonstrated the requisite experience and capacity to implement Aftercare services
within this framework, and is now executing that work.
4. Start substantive transition to adulthood work earlier.
CFSA recognizes the importance of establishing transition-to-adulthood goals at age
14 (or as a youth enters high school) and, indeed, such work is federally mandated to
begin at this age. In addition, the agency understands that goals developed at age 14
will likely evolve and change by the time a young person reaches age 21. As a result,
our outcomes and benchmarks are calibrated to assess whether each young person has
the needed capacity to stay on track towards fulfilling his or her own objectives and
to ensure that if an objective or benchmark is not achieved within one timeframe, that
it continues into the next, or is modified as needed. To help youth get a strong start
on this important work, at age 15 they become eligible for Chafee-funded services
provided through the Office of Youth Empowerment (OYE). In addition, beginning
in the 9th
grade, CFSA youth are connected to OYE for education and career
preparation work.
Page 175 of 176
5. Make feasible, priority program improvements prior to FY2017.
As a result of the Youth Aftercare Workgroup’s efforts, two distinct actions were
taken prior to, and during, FY 2017. 1) CFSA developed and issued a new Youth
Aftercare Scope of Work reflective of best practices in the field, and then contracted
with a single provider to execute this work. Contracting with a single provider
(compared to five providers previously) was aimed at increasing equity of service
provision, streamlining and facilitating access to programming, and improving
management and consistency. 2) An agency-wide collaboration, with significant
participation from community stakeholders, developed a comprehensive set of
progressive outcomes and benchmarks for youth ages 14-23, for use across all agency
programming.
6. Ensure strong intra-agency transitions and communication.
Establishing single points of contact within both the agency and the contractor has
substantially strengthened the transition to Aftercare, including improved
communication, more expeditious referral, and greater consistency in follow-up.
LaShawn A. v. Bowser
108. Please provide a status update on the class action lawsuit LaShawn A. v. Bowser.
LaShawn v. Bowser is a class action lawsuit filed in 1989 on behalf of all children in the
care of the District’s public child welfare program and all children who are the subject of
a report of abuse or neglect. There are 88 Exit Standards to be achieved. The court
monitoring period is every six months. As of June 30, 2017, of the 88 Exit Standards
included in the LaShawn A. v. Bowser Implementation and Exit Plan, the District met 73
(83 percent) Exit Standards27
.
During the January to June 2017 monitoring period, the Court Monitor, noted that
performance improved on several of the remaining Exit Standards, including:
● Acceptable Investigations – 75 percent of investigations were of acceptable
quality, up from 72 percent of investigation in the previous period.
● Visits between Parents and Children – the monthly performance ranged from 77
percent to 87 percent, up from a December 2016 performance of 83 percent in the
previous period.
There is a status hearing scheduled for May 16, 2018.
See Attachment Q108, LaShawn Infographic
27
The 73 Exit Standards includes three Exit Standards that were partially met for the January – June 2017
monitoring period. Exit Standards that were partially met are: IEP citation I.C.22.a – Health and Dental Care: Health
Screenings , IEP citation I.C.22.d – Health and Dental Care: Medicaid, and IEP citation I.D.25 - Caseloads
Page 176 of 176
Budget and Policy Directives
109. Please provide a status update on the agency’s compliance with the committee’s
FY18 budget and policy directives. When reports or other documents are indicated,
please provide those documents.
The Committee on Human Services did not provide the Child and Family Services
Agency with any policy directives for FY2018. However, the Committee did provide
policy recommendations to CFSA. Listed below are the actions taken by CFSA in
response to the Committee’s recommendations.
Policy Recommendations
CFSA applies intensive and direct strategies to services for older youth in care by doing
the following:
● Utilizing CASAS testing and career assessments to determine interest and
employability skills to match with programming
● Link to DOES for career exposure at a younger age, additional options for
vocational training, and added support to older youth who are disconnected
● Connecting with Community Based Organizations to provide youth with
subsidized employment
● Teaming with all stakeholders to ensure necessary supports are in place for youth
to be successful.
● Increased staffing and training to provide direct supports for youth in grades 8
through college graduation
● OYE organizes educational events for youth and families to enhance self-
advocacy and exposure to educational supports
● Tracking school placement changes and supporting placement in appropriate
educational settings
● Specialists attend team meetings to support and problem solve
Budget Recommendations
CFSA met the deadline for all local fund reductions and increases as identified in the
FY2018 Budget.
Internal Operations, Analysis, and Performance
110. Please provide a list of all MOUs currently in place and any MOUs planned for the
coming year. Please provide copies of all such MOUs.
See Attachment Q110, CFSA MOUs
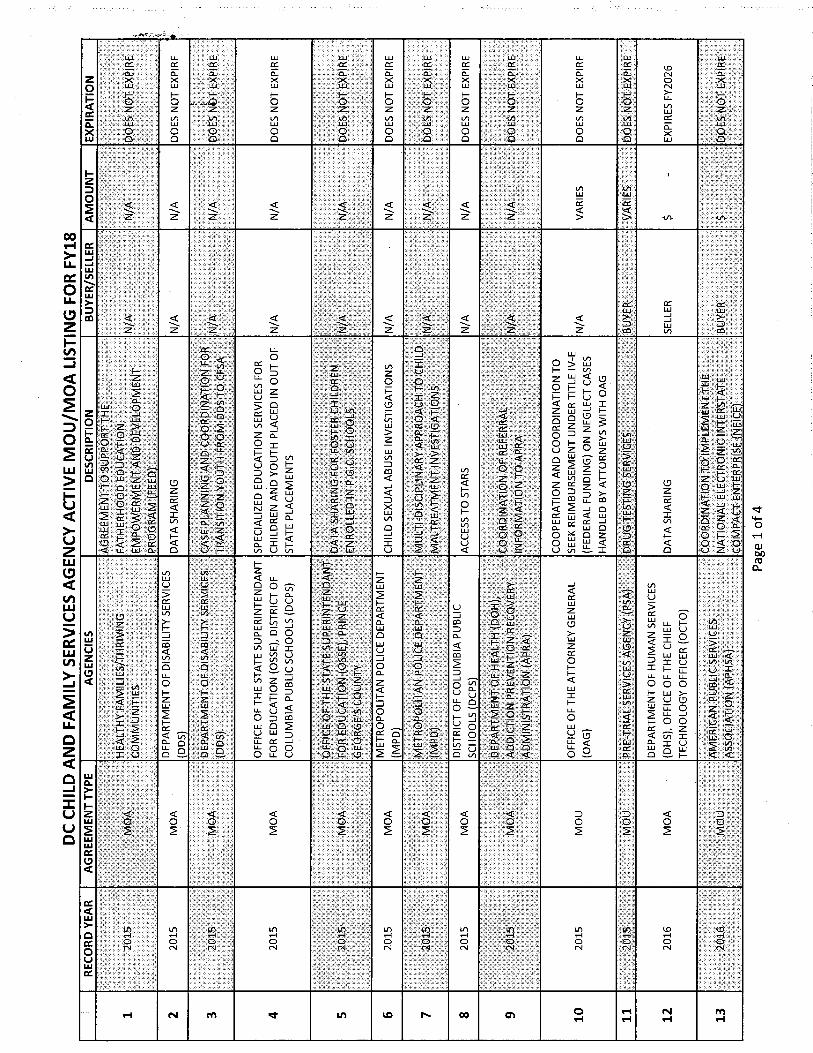
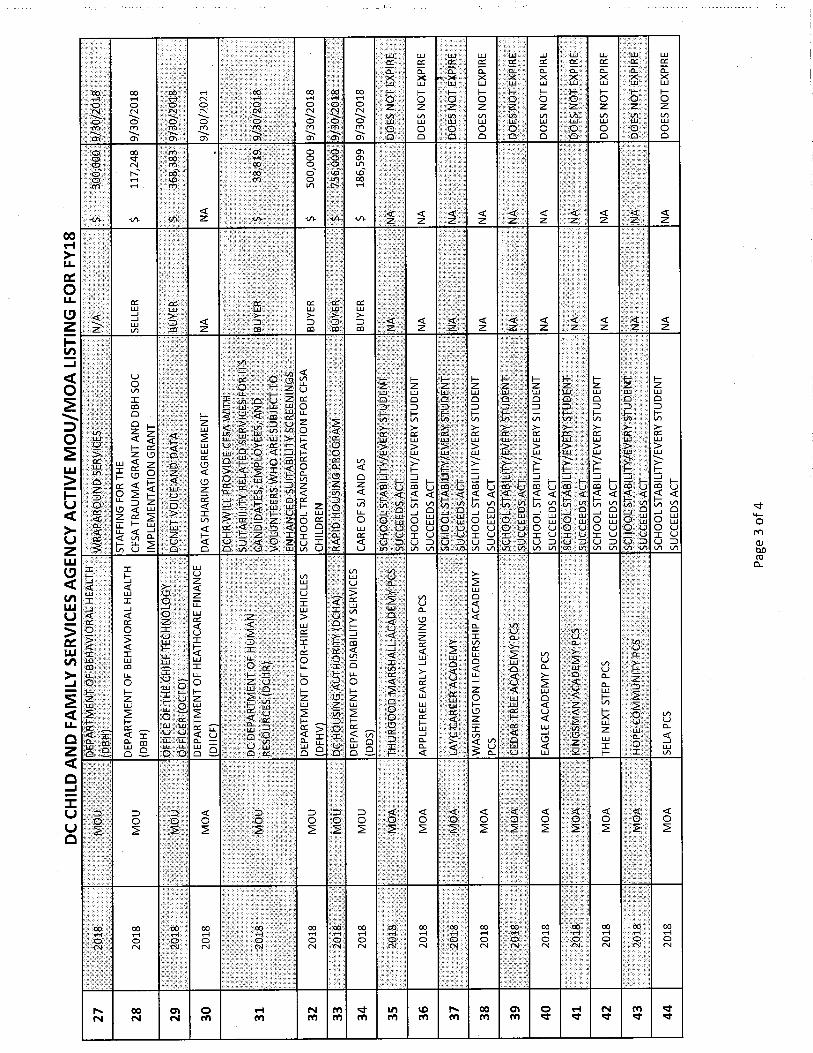
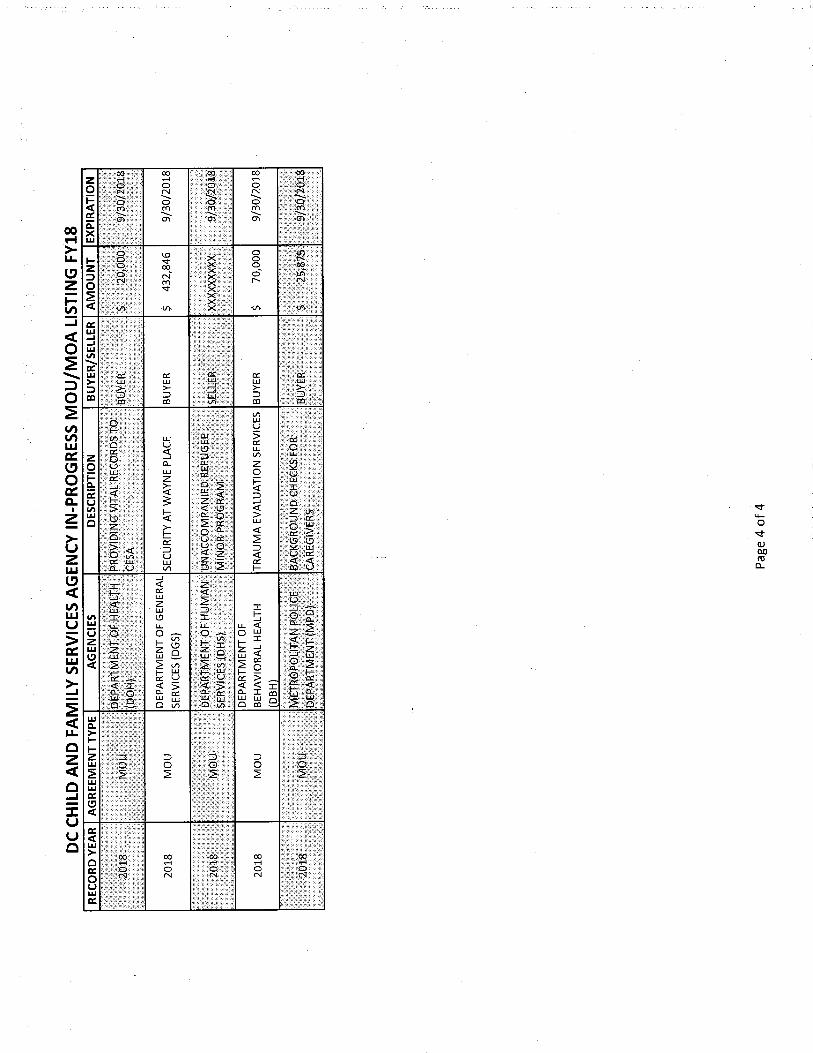

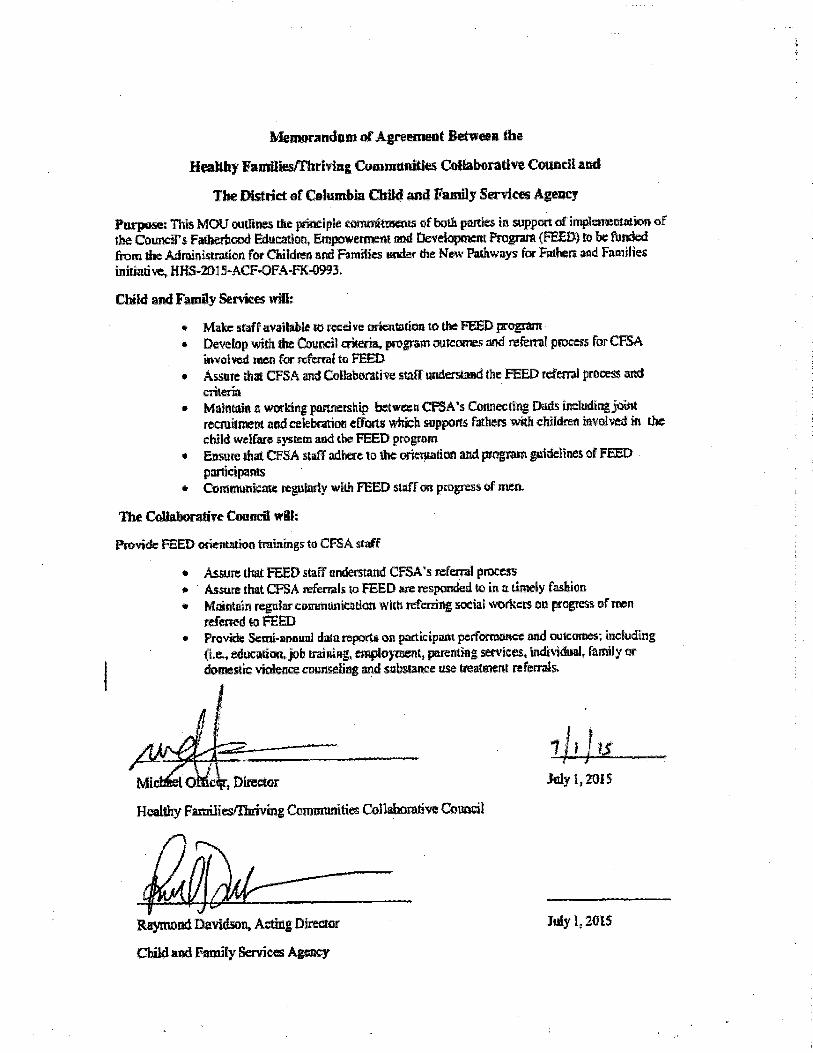


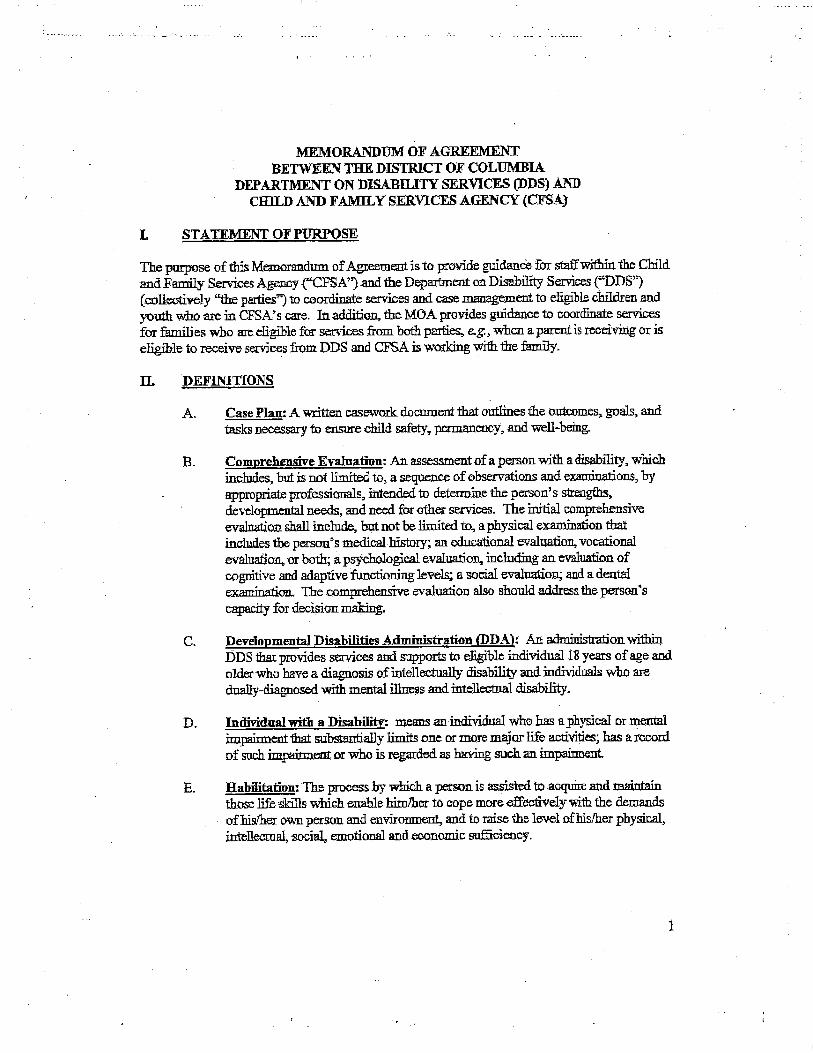
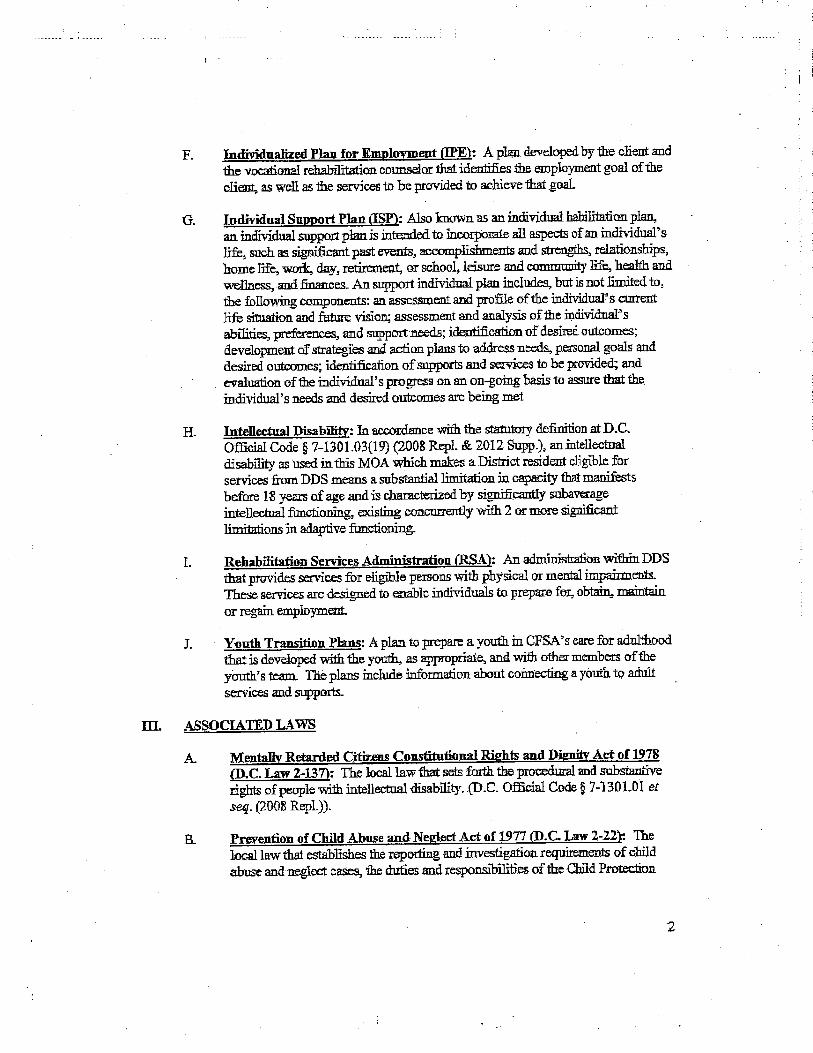

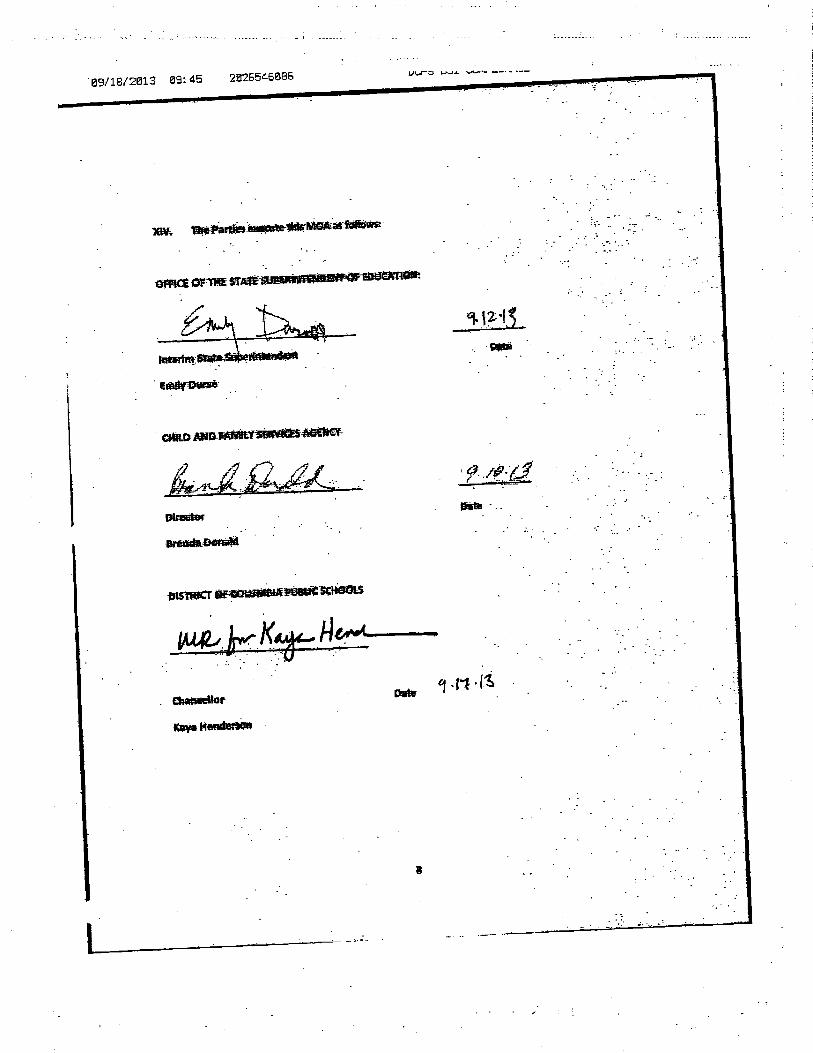

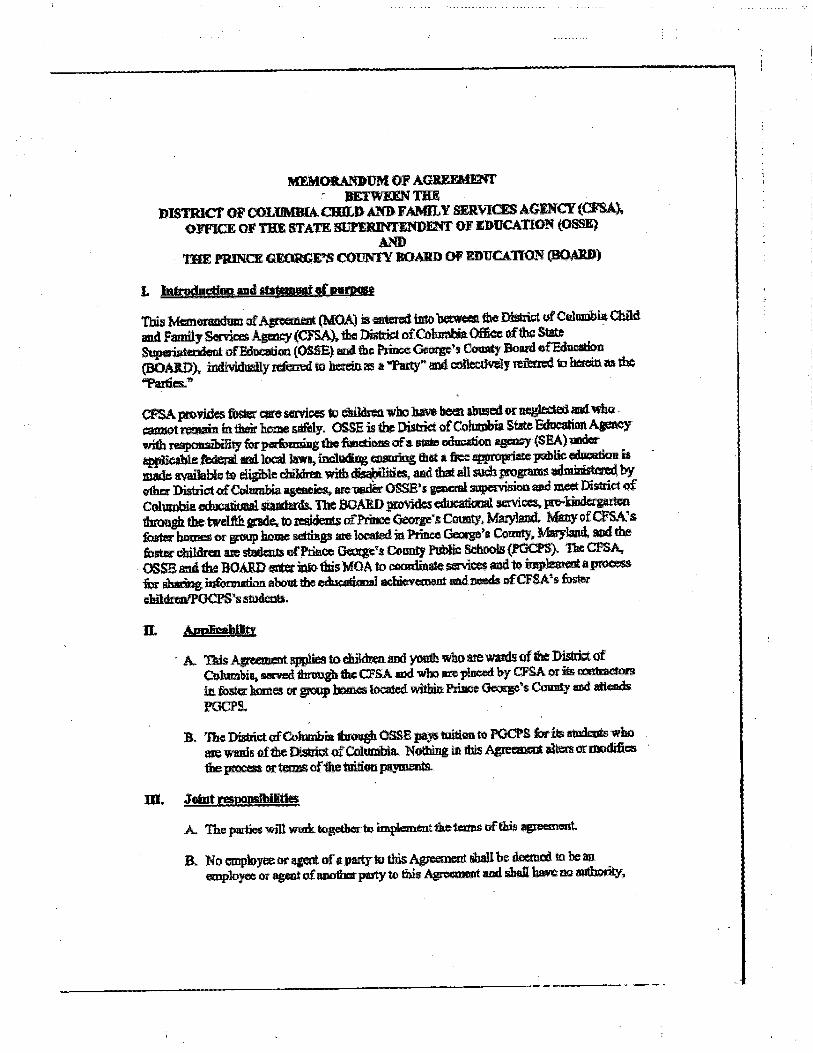
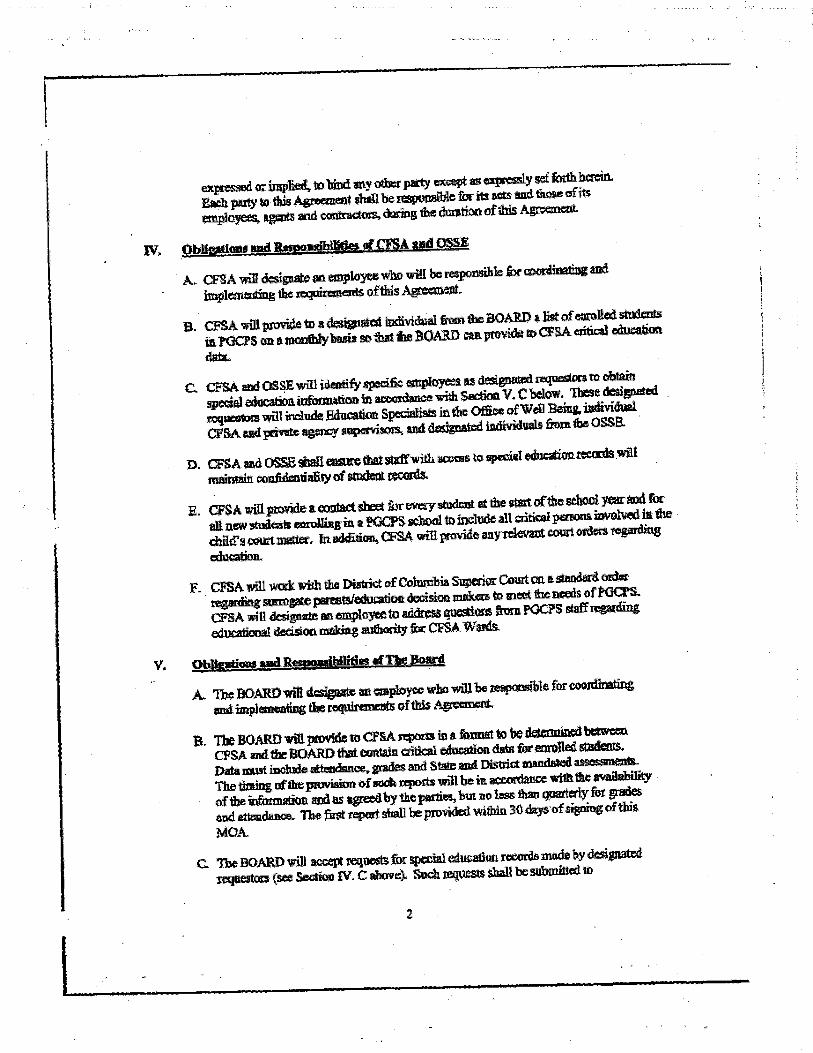
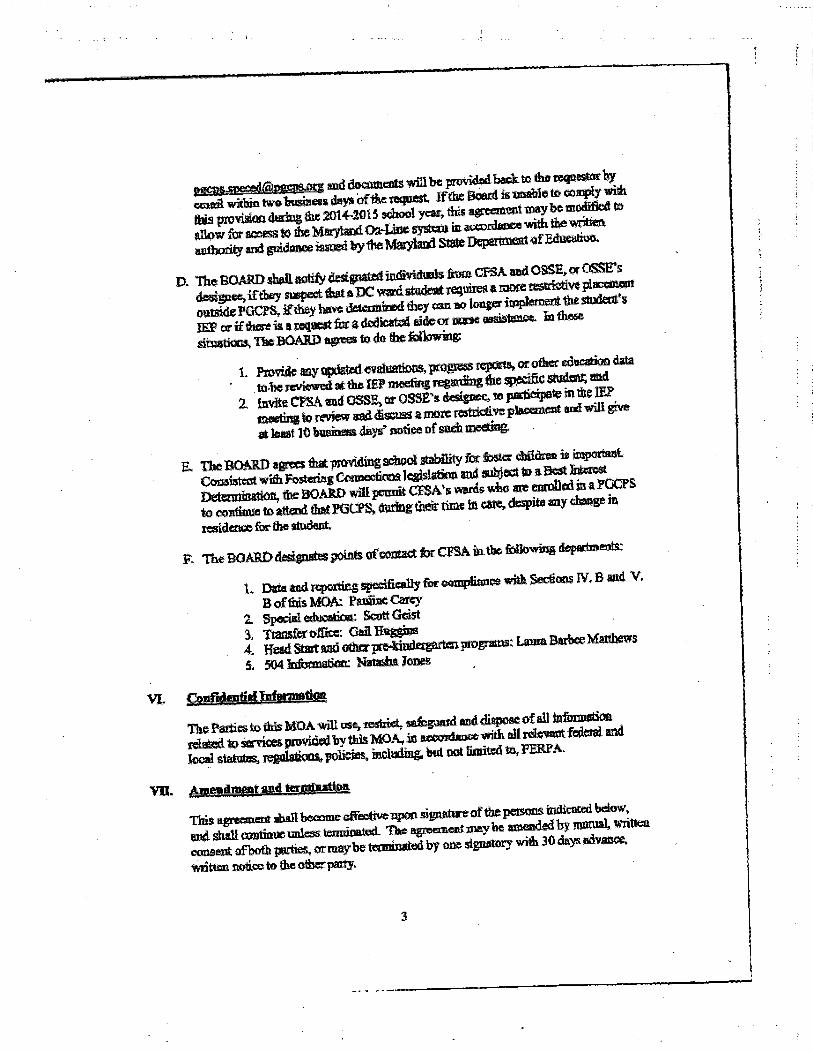
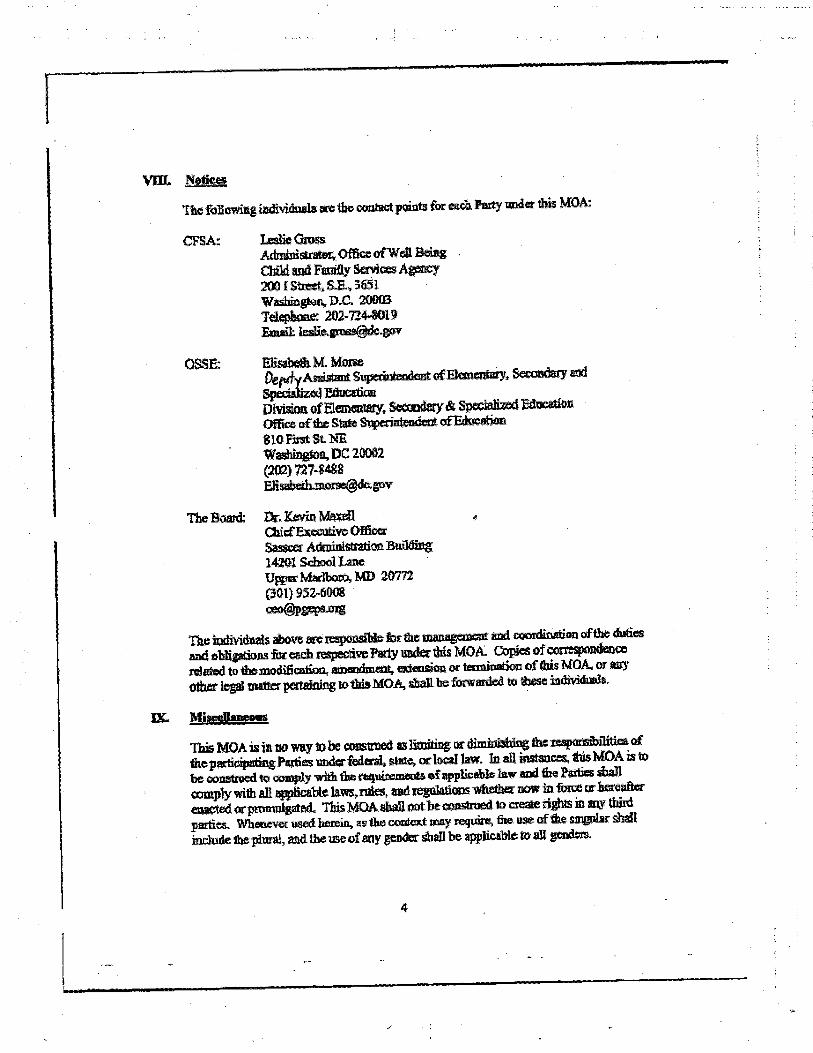
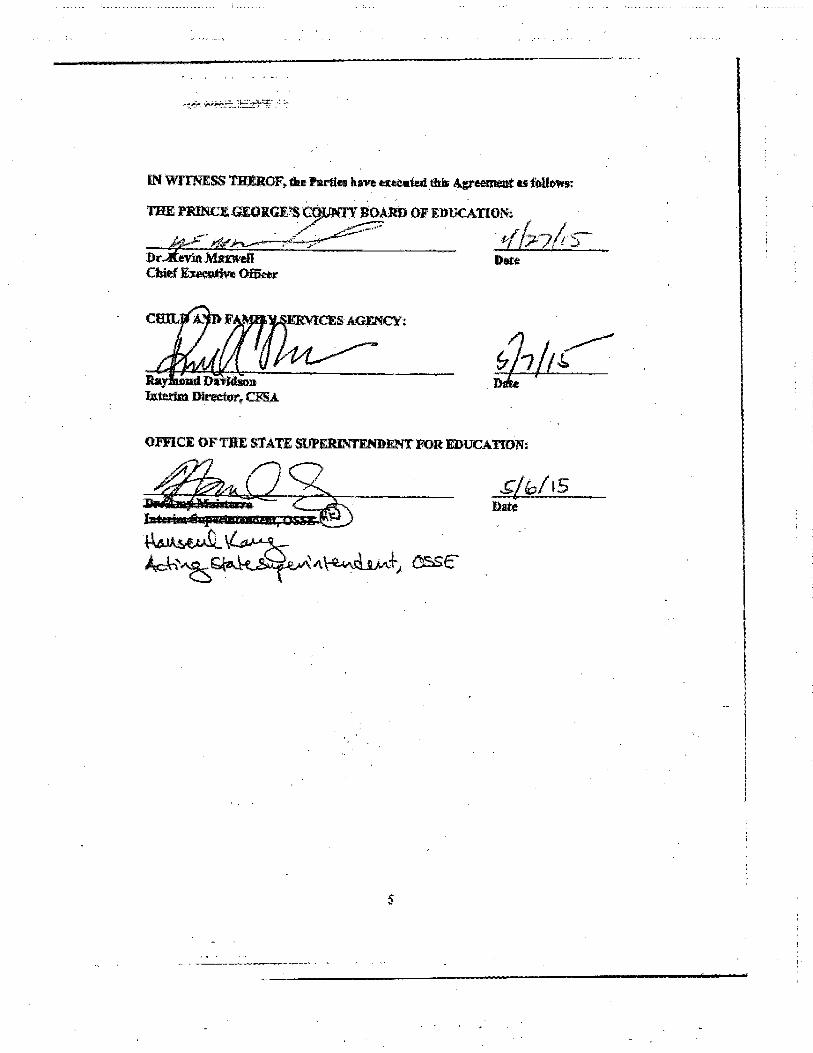

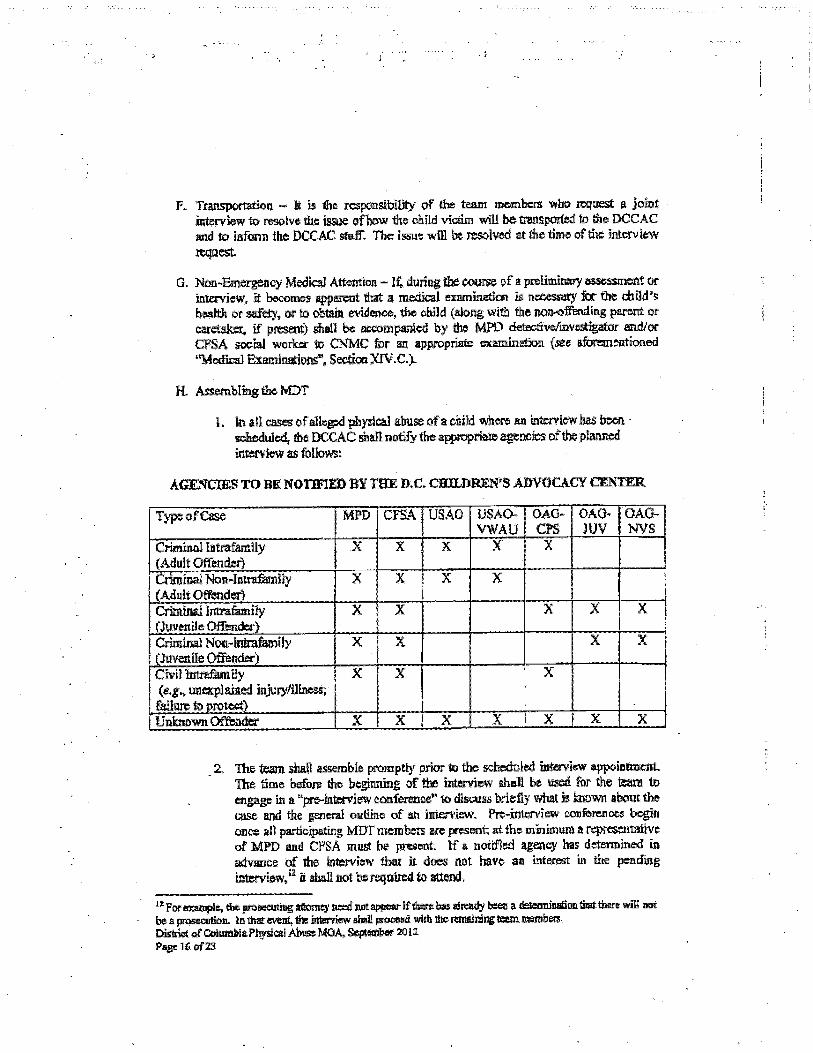

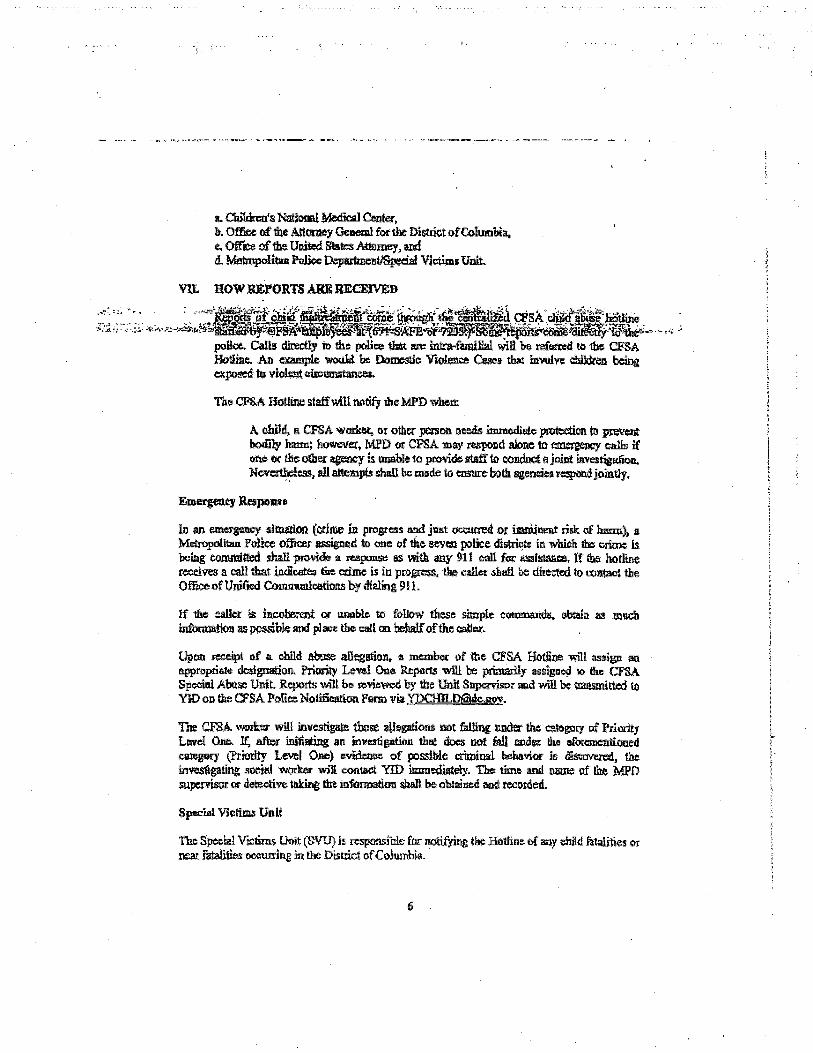
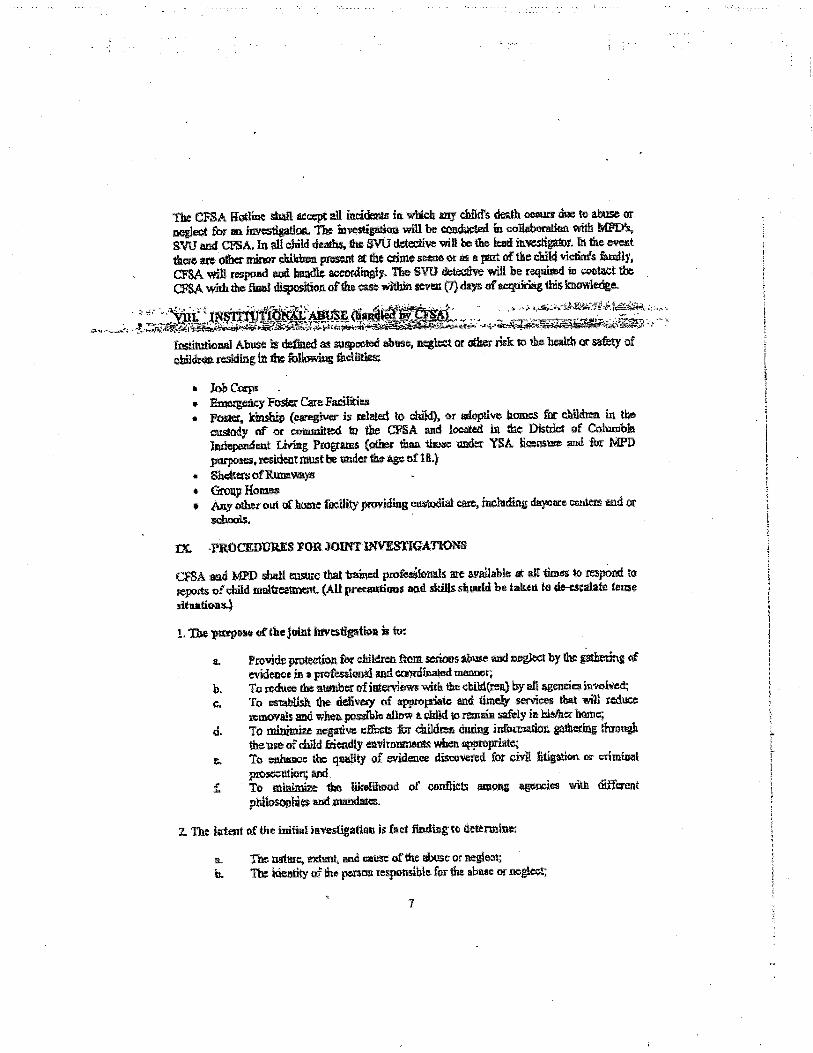
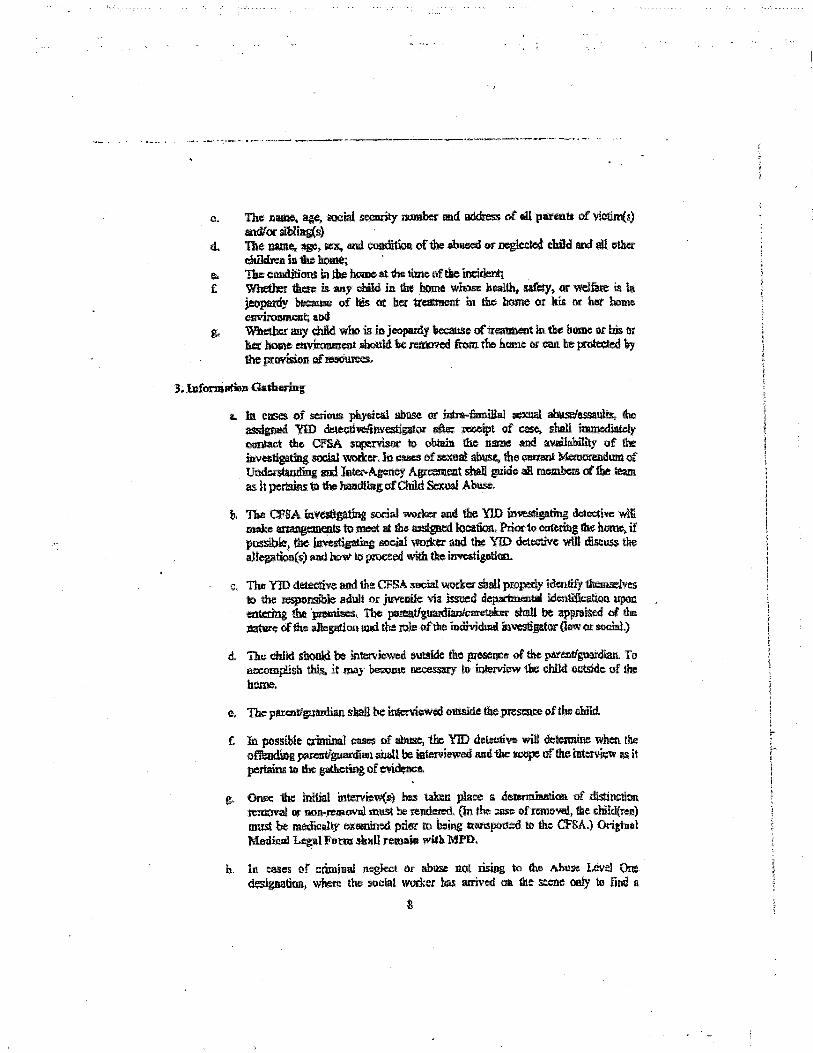
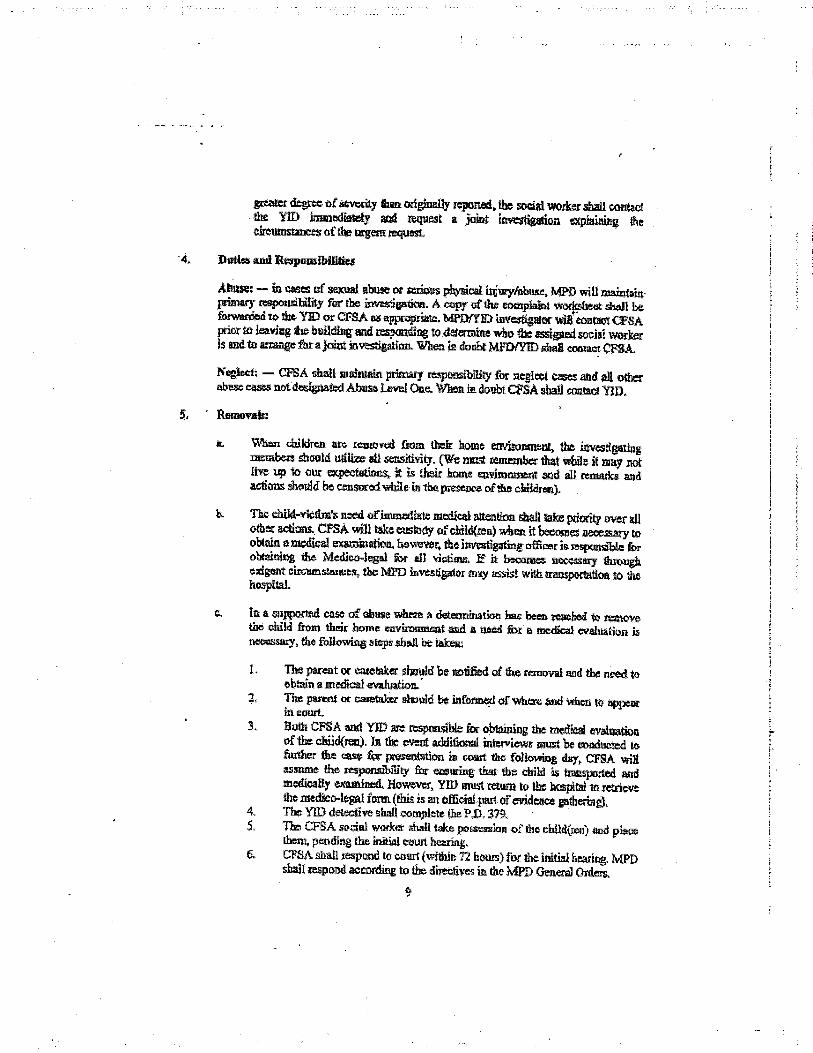
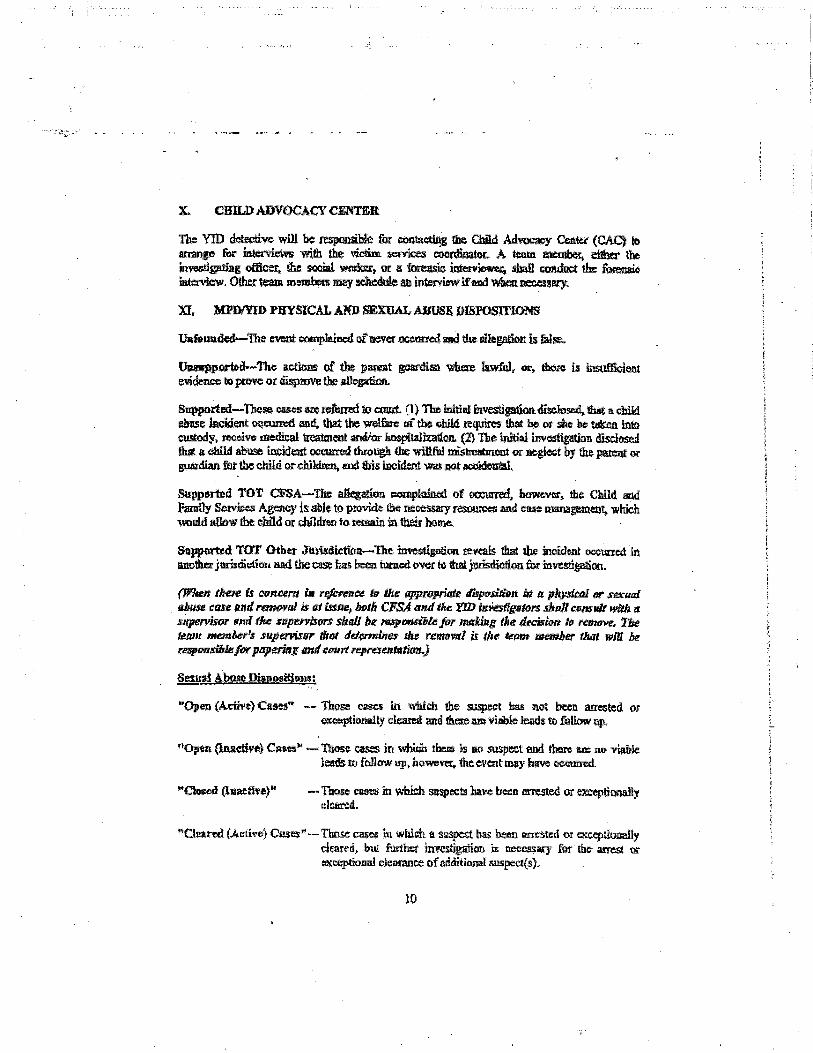
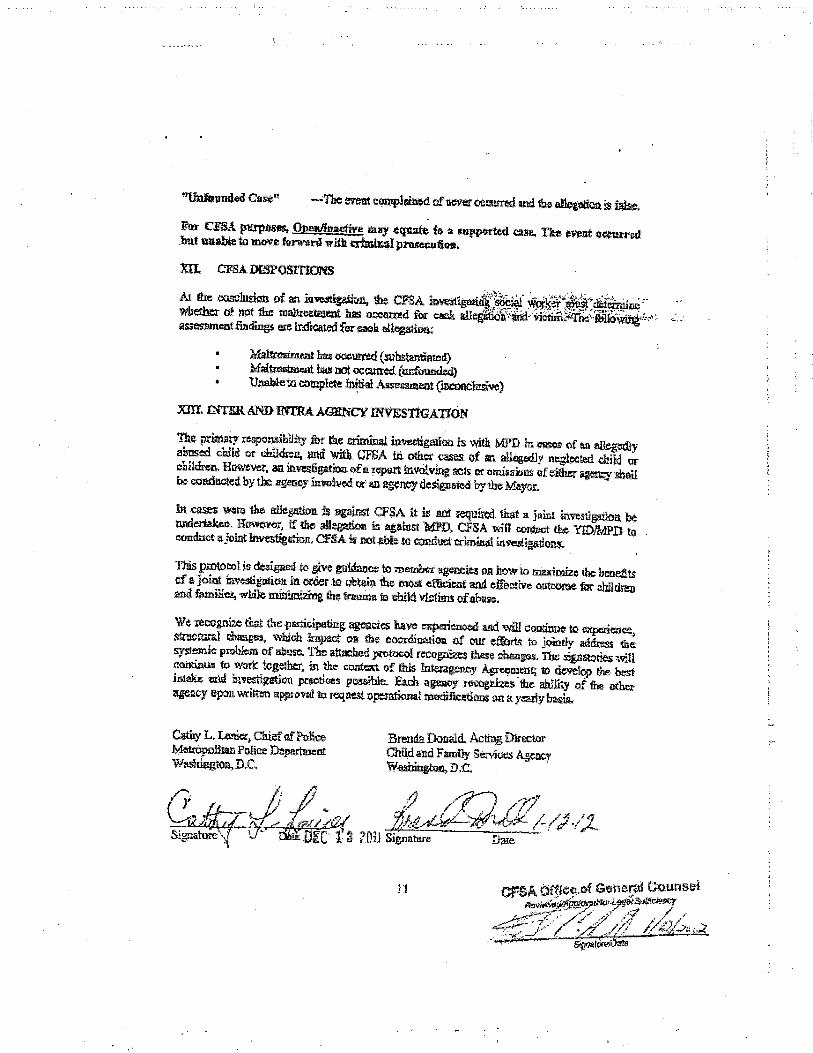

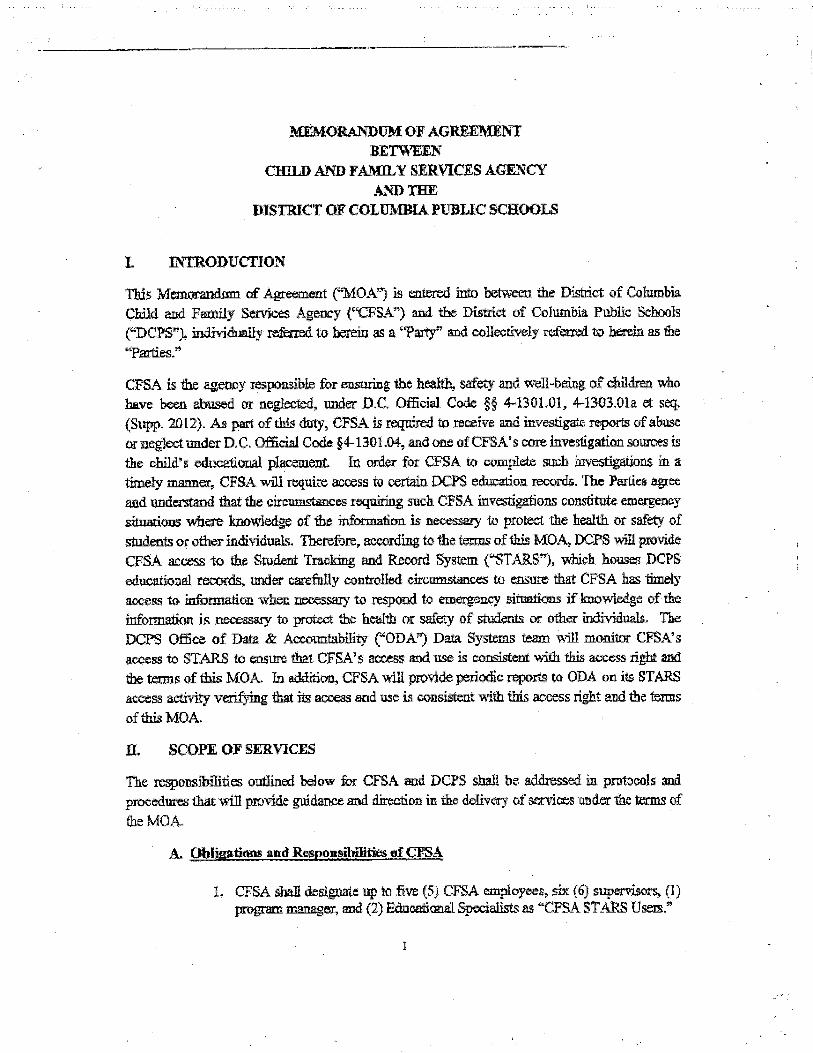
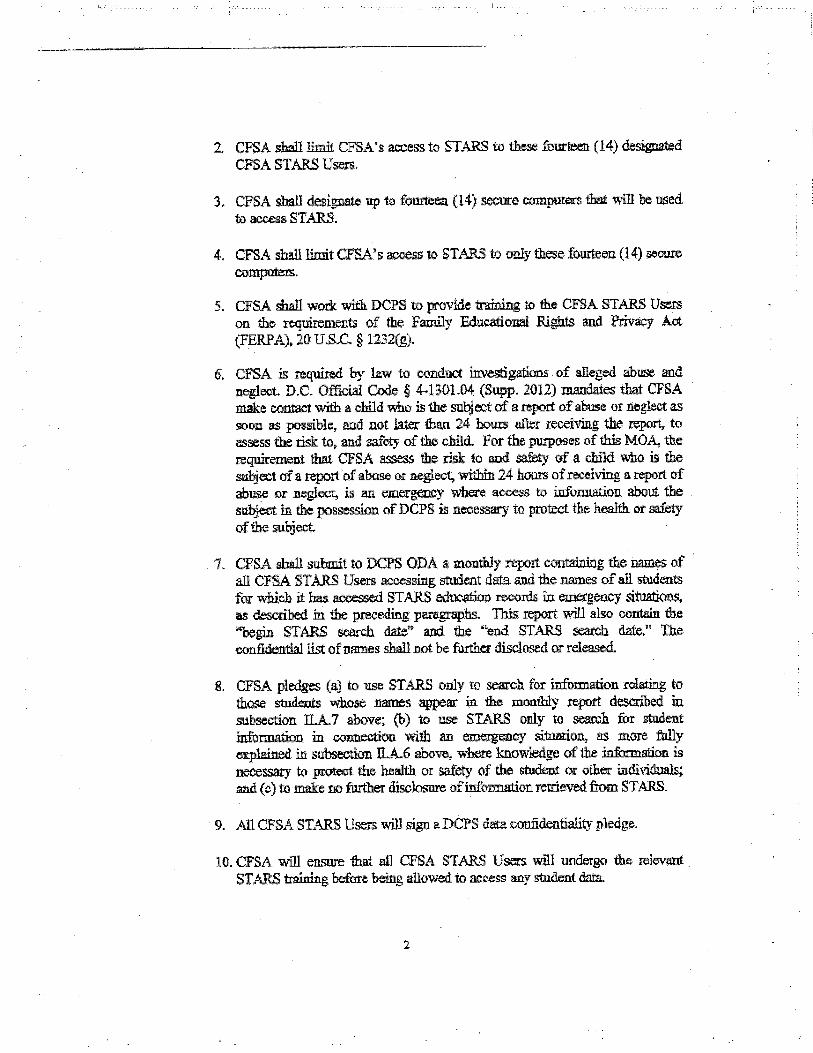
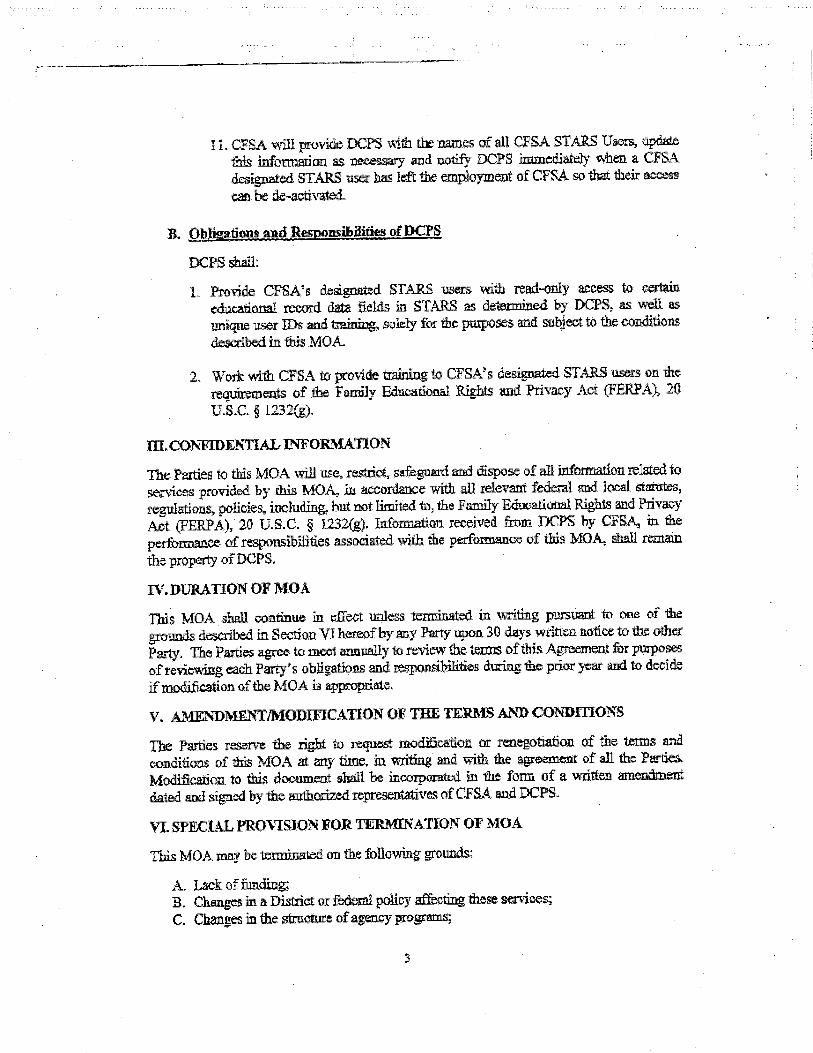
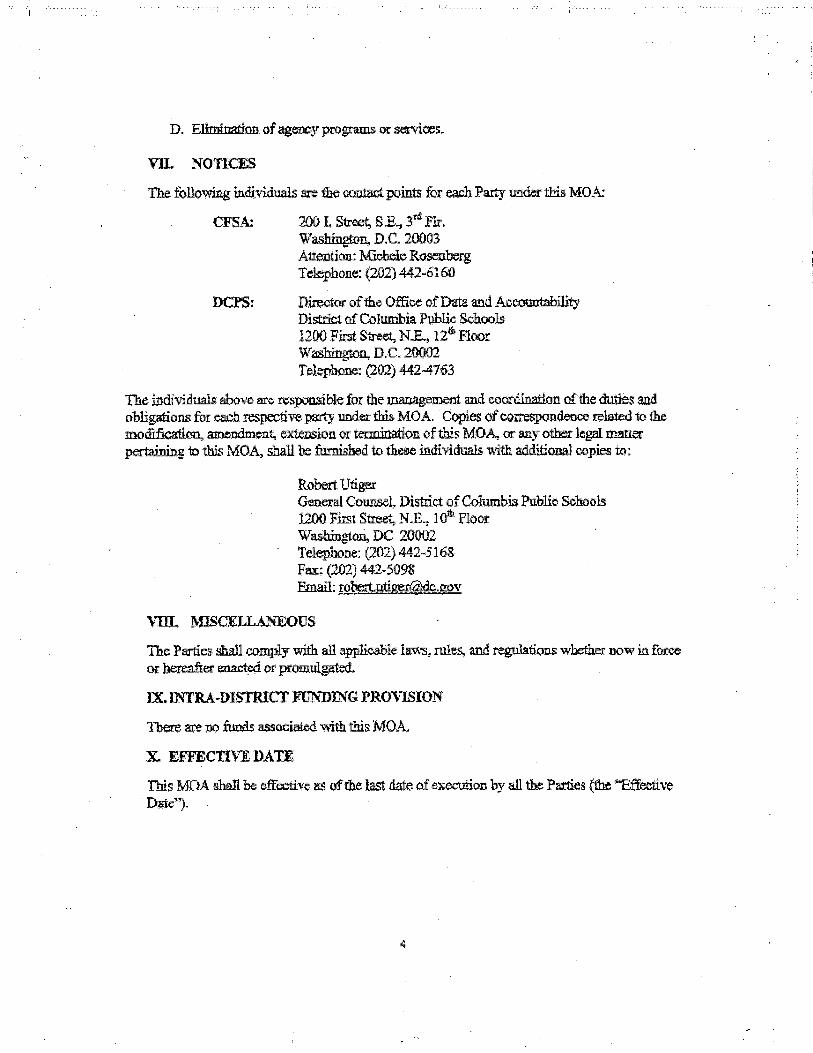

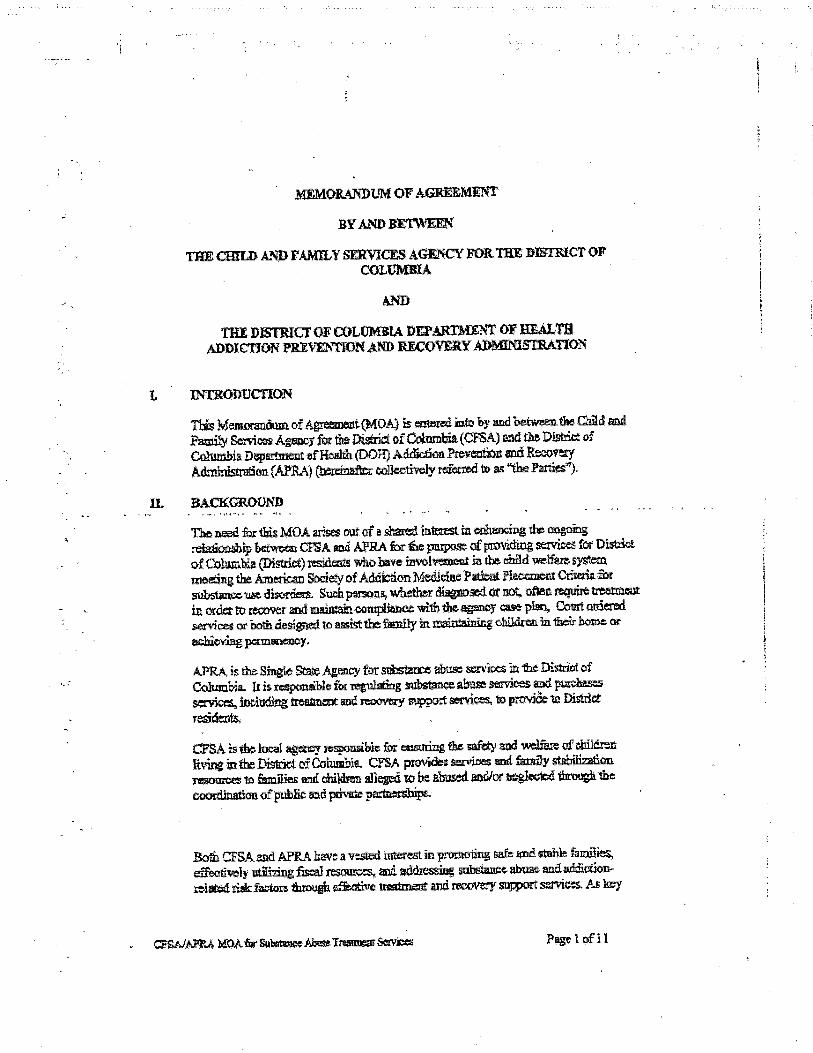
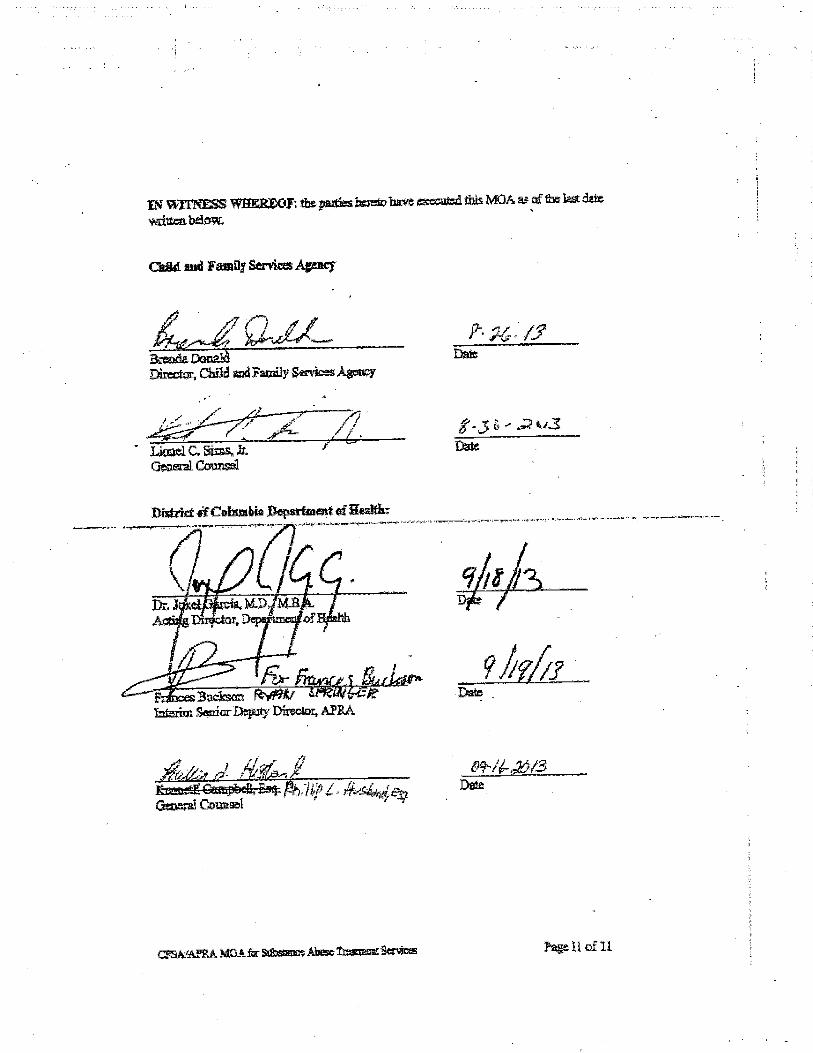

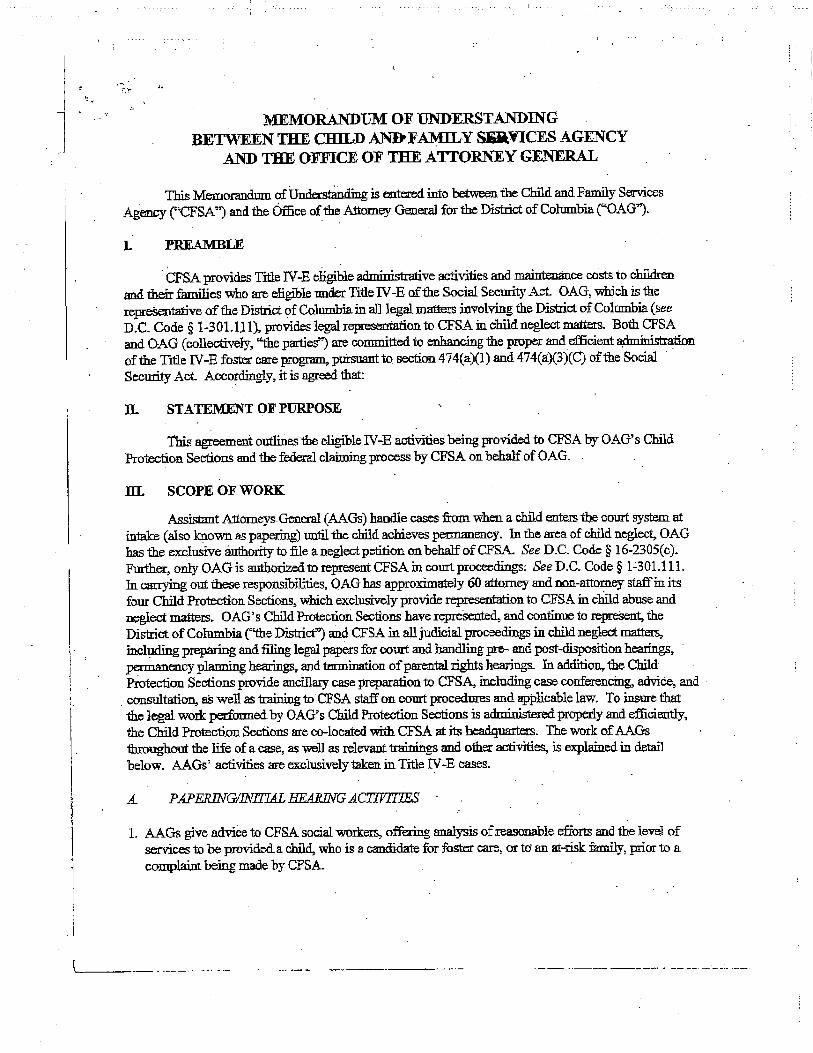
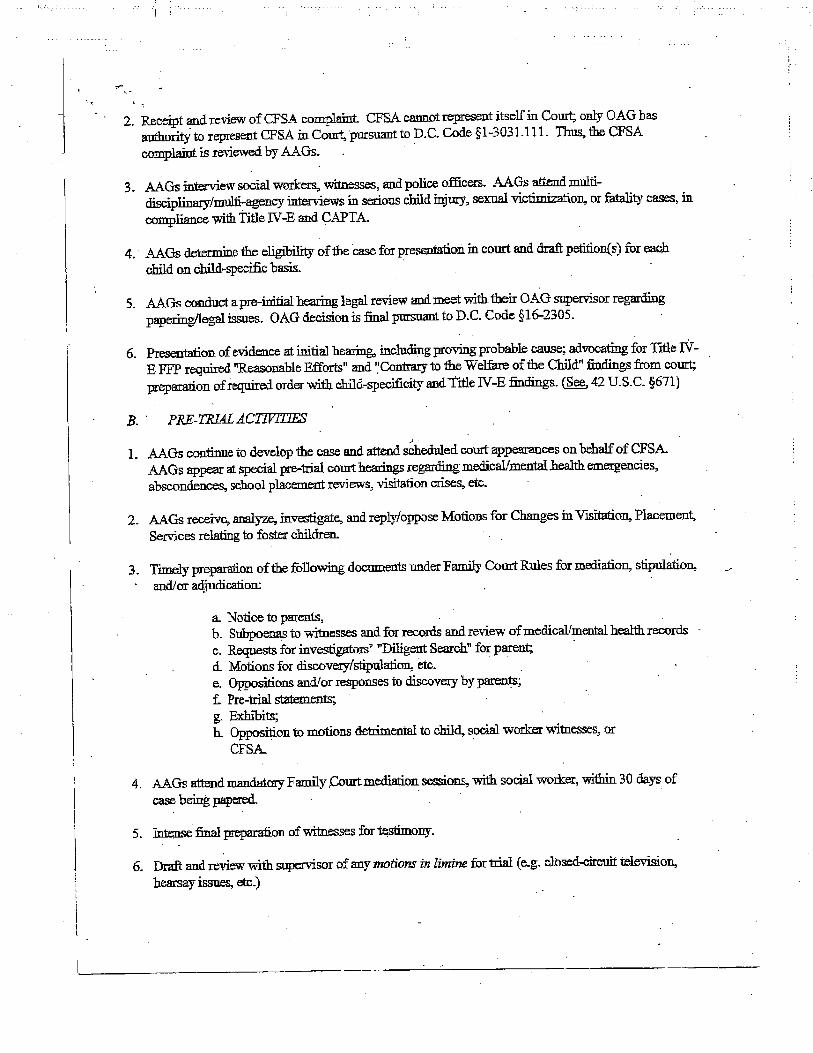
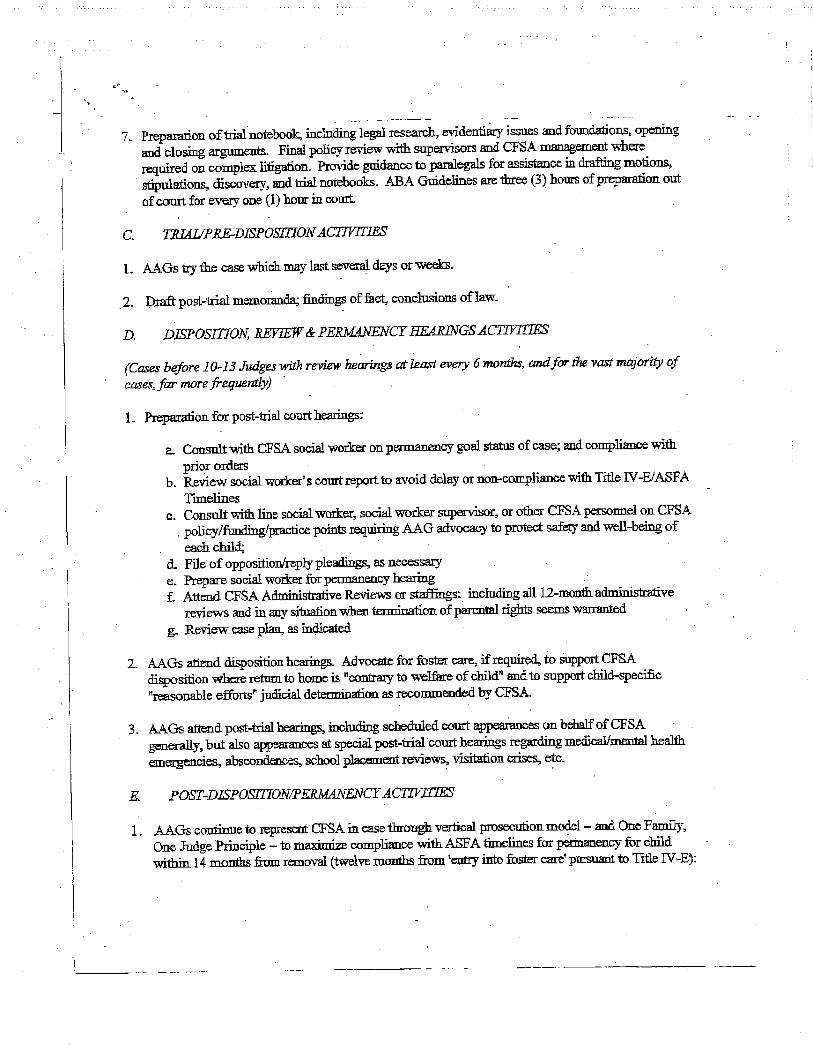
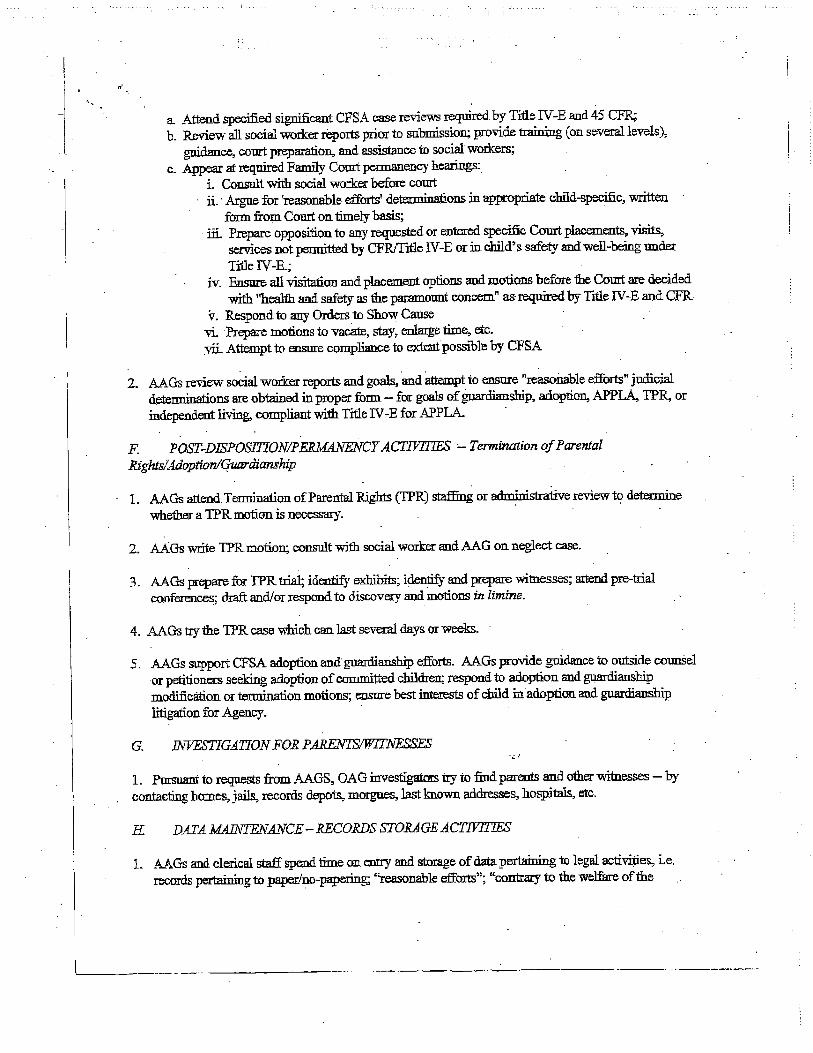
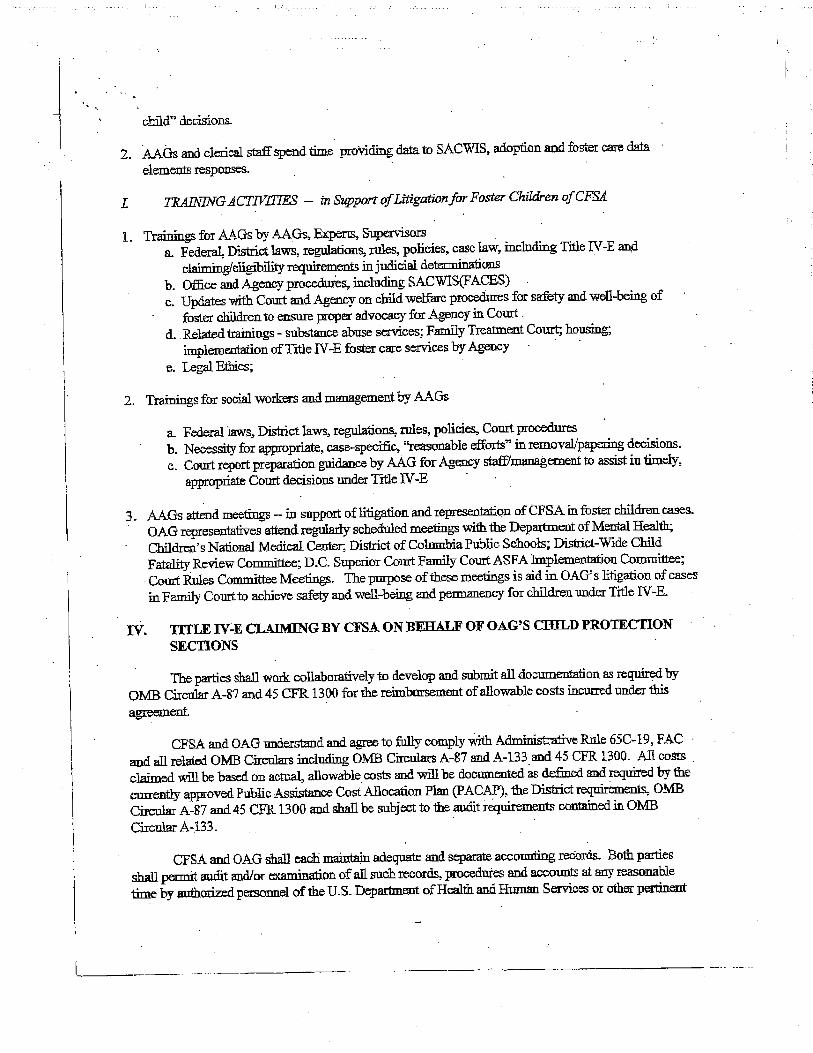
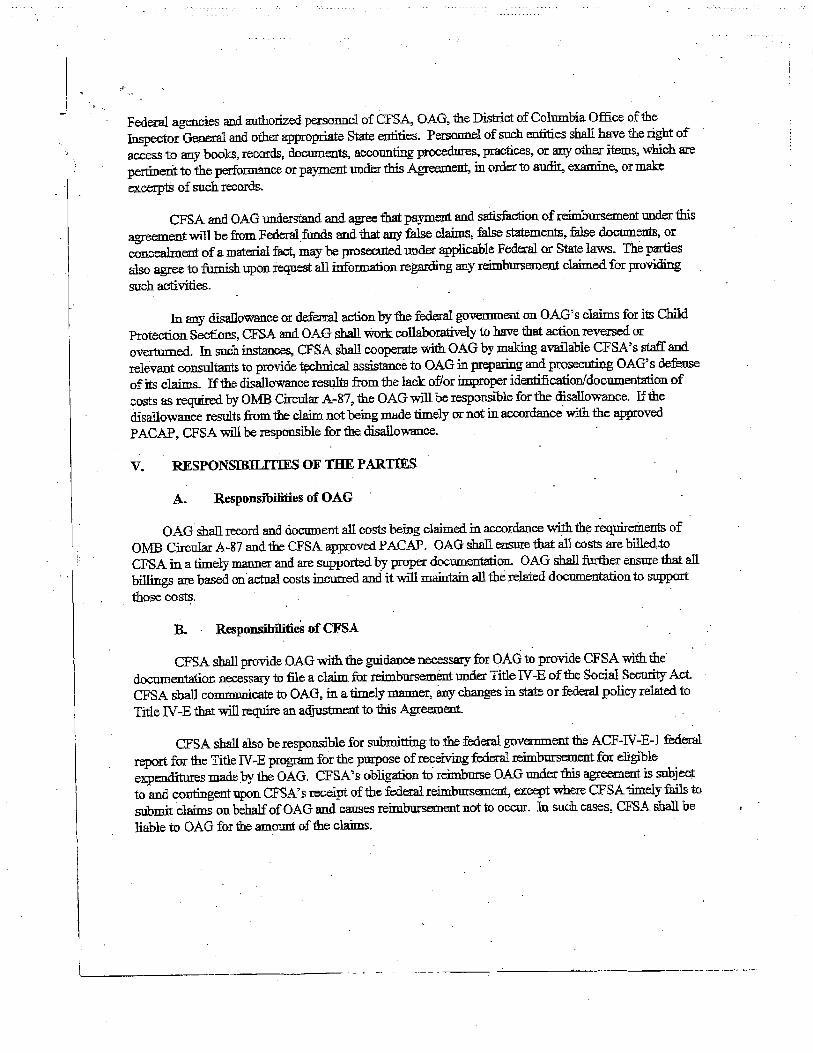
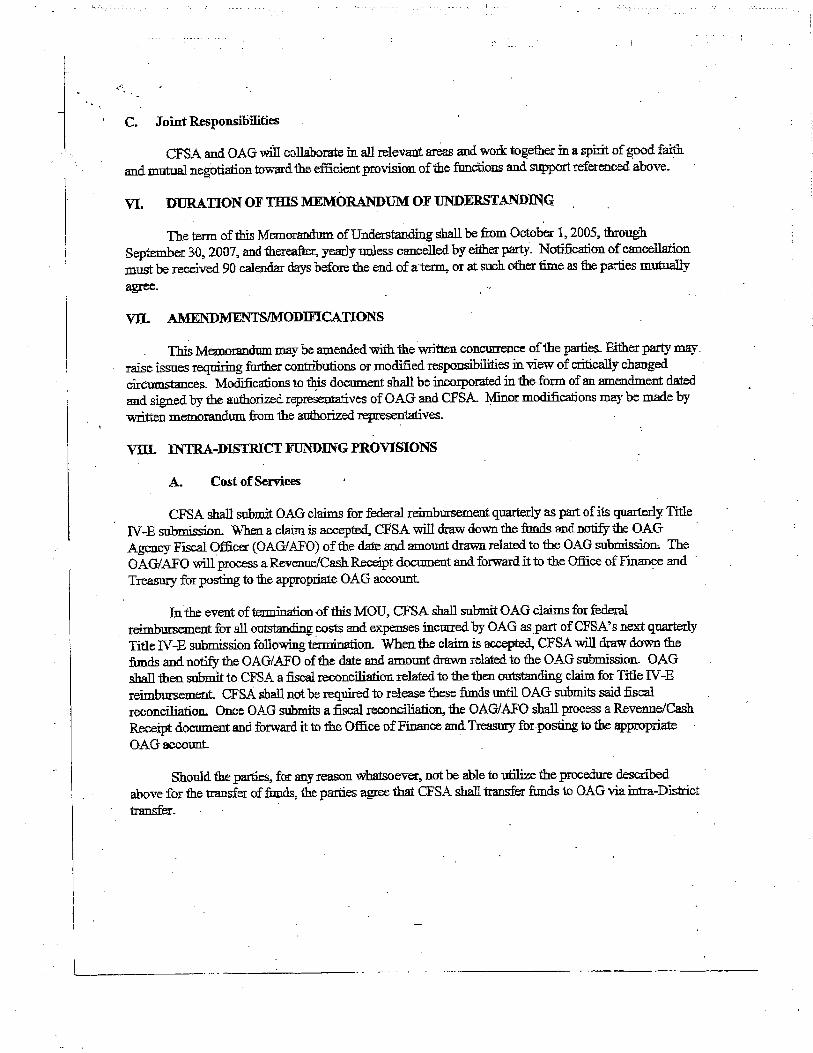
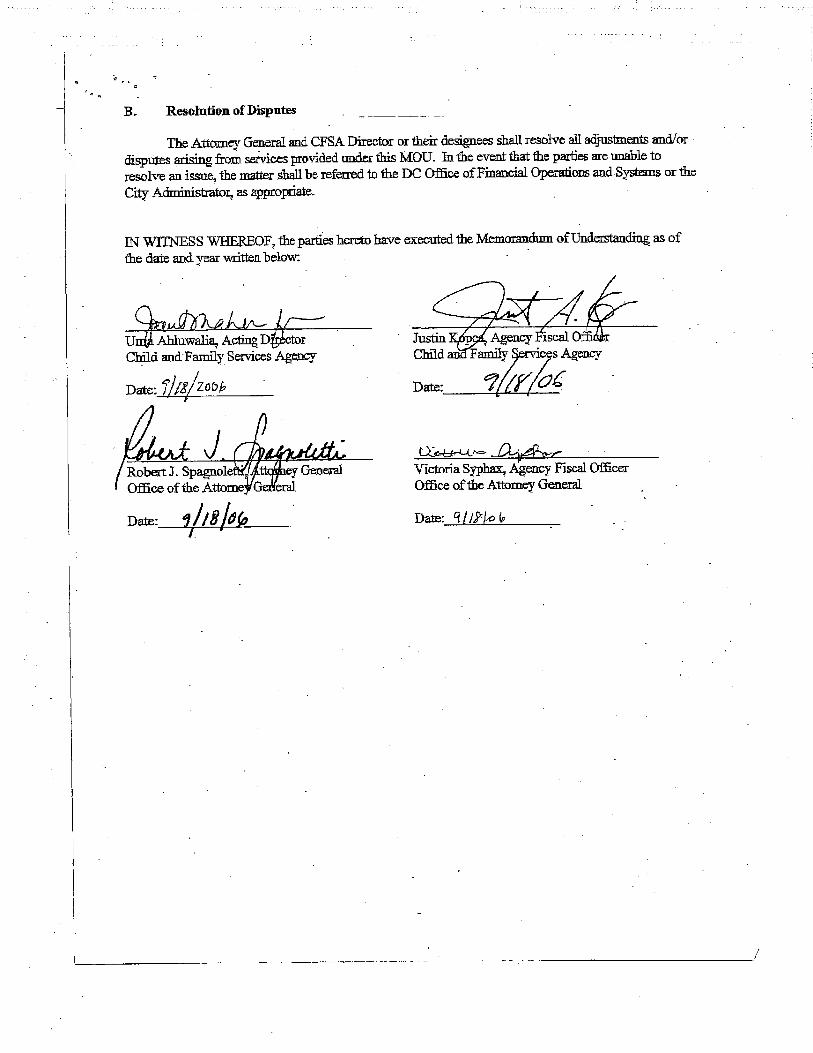

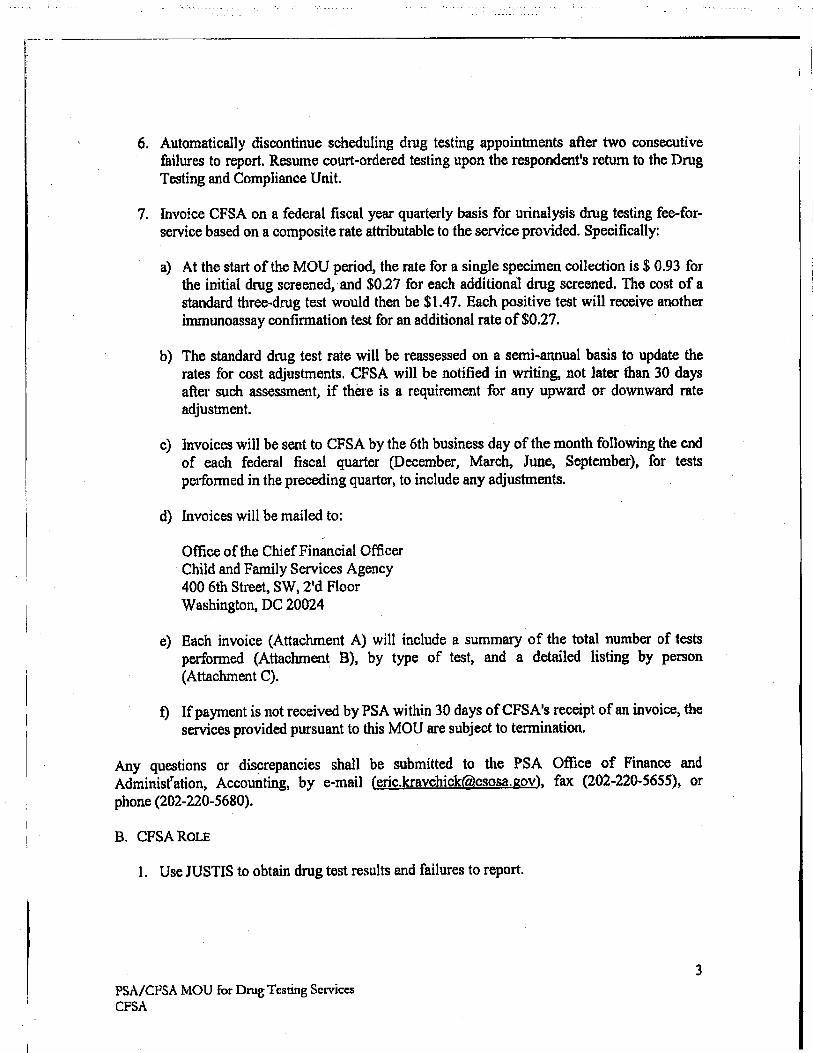
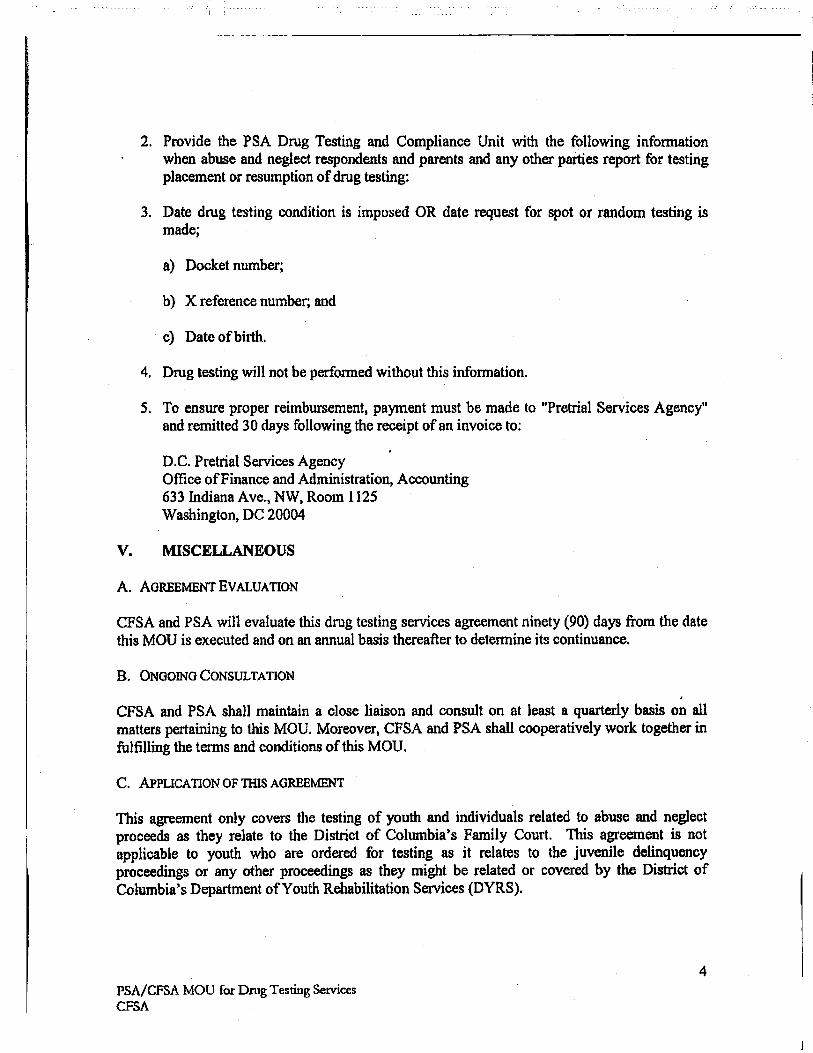
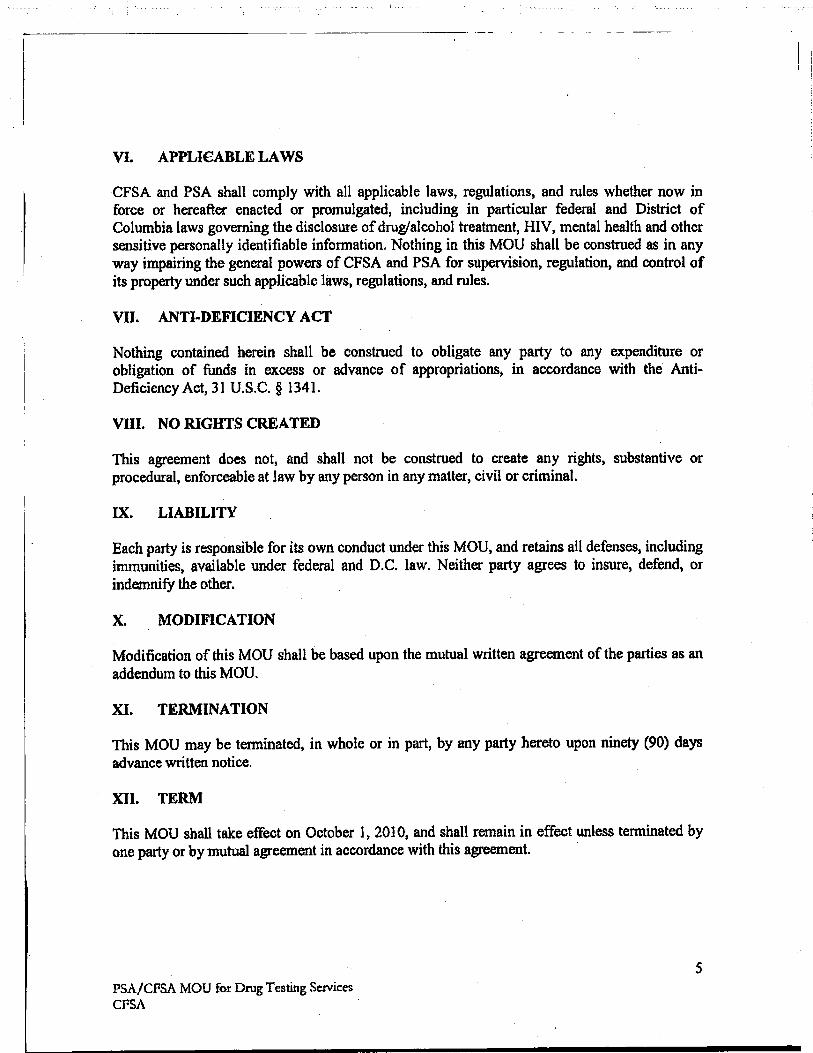
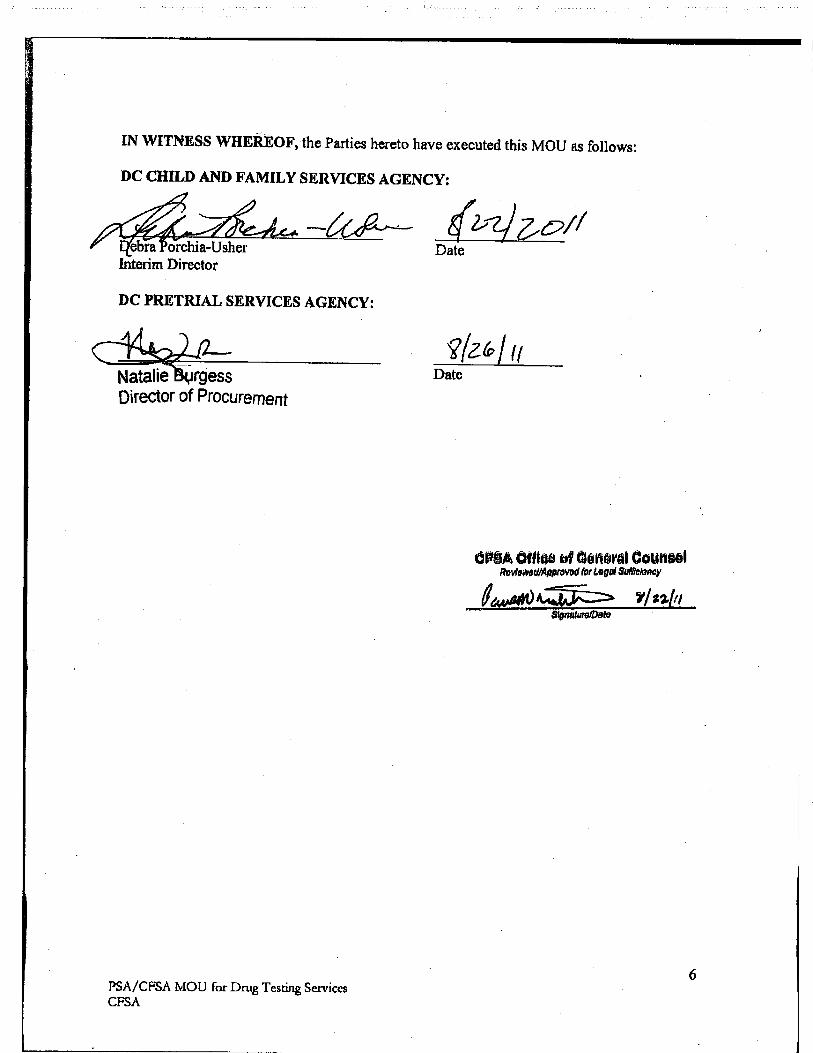

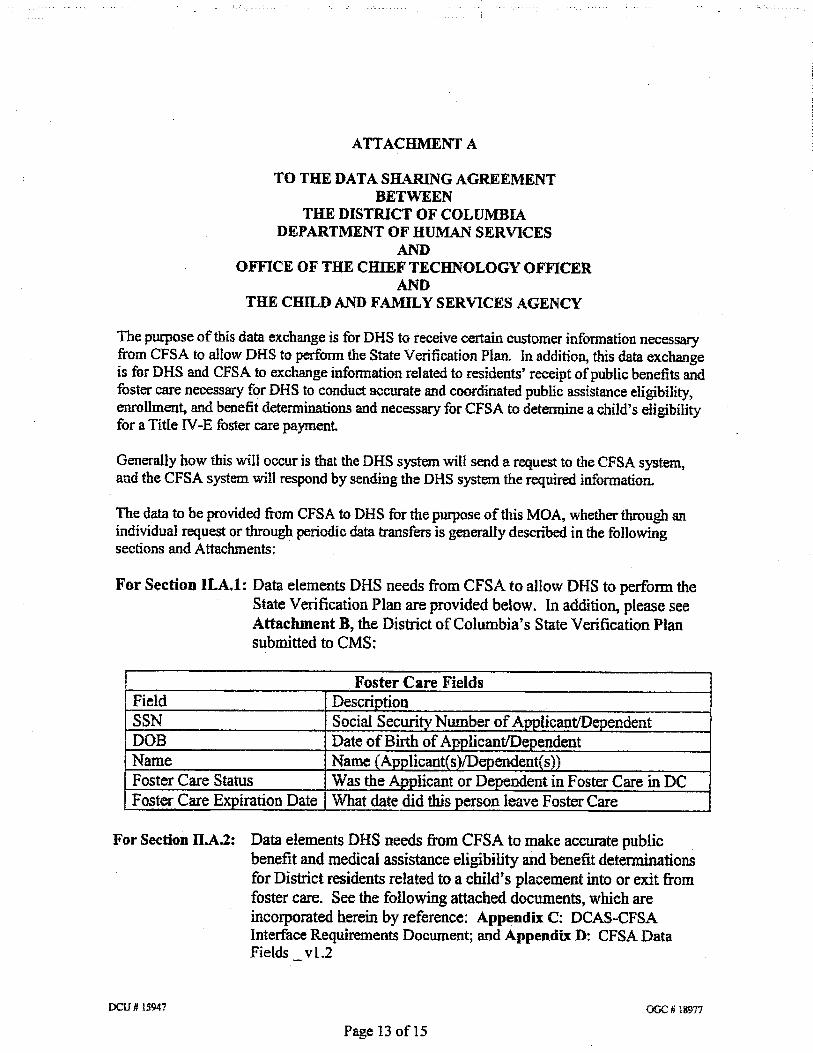
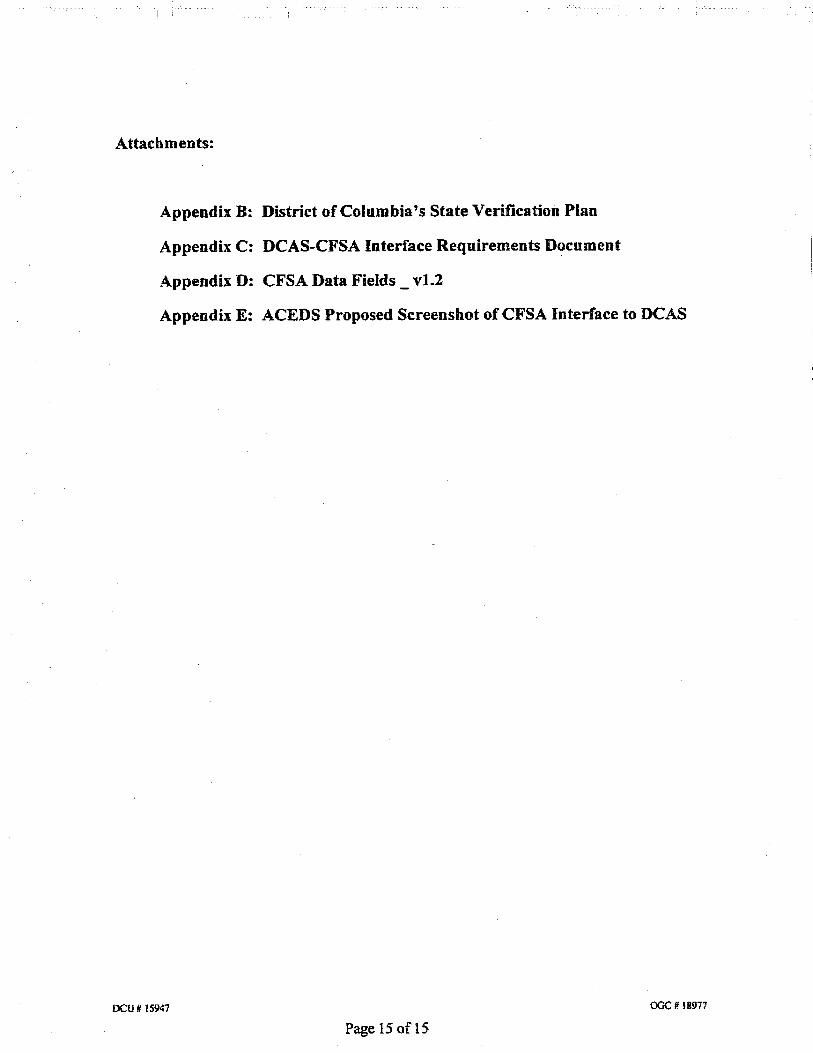
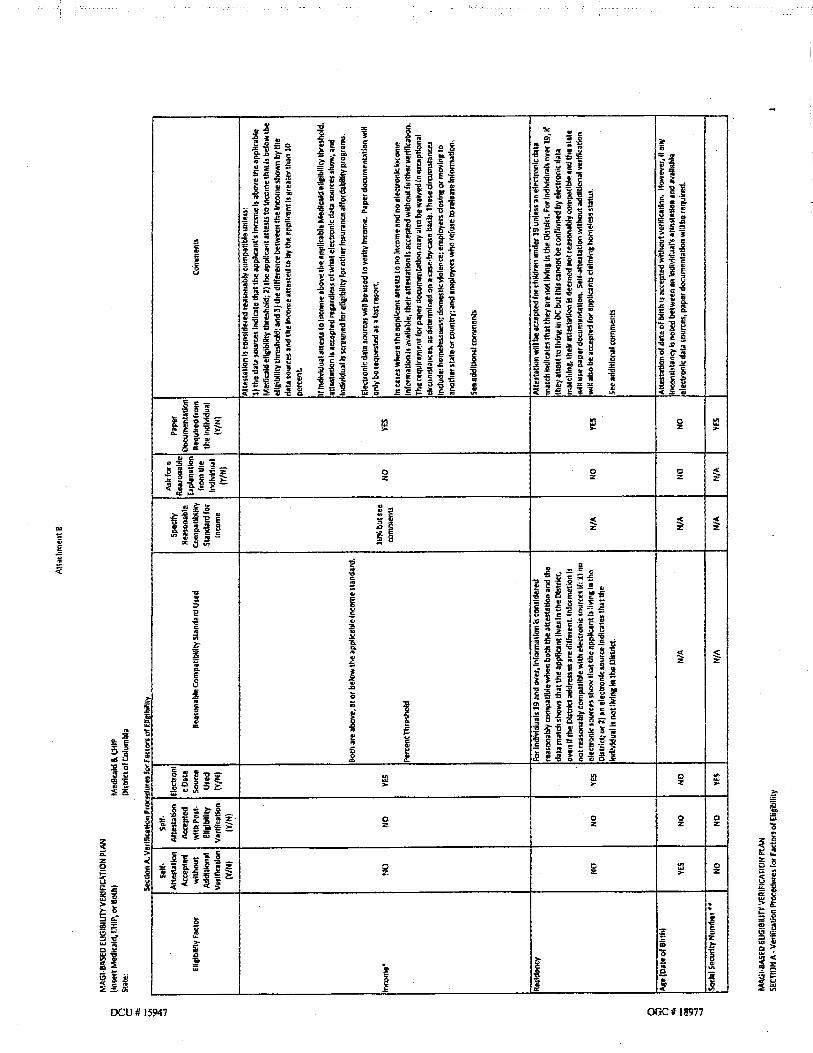
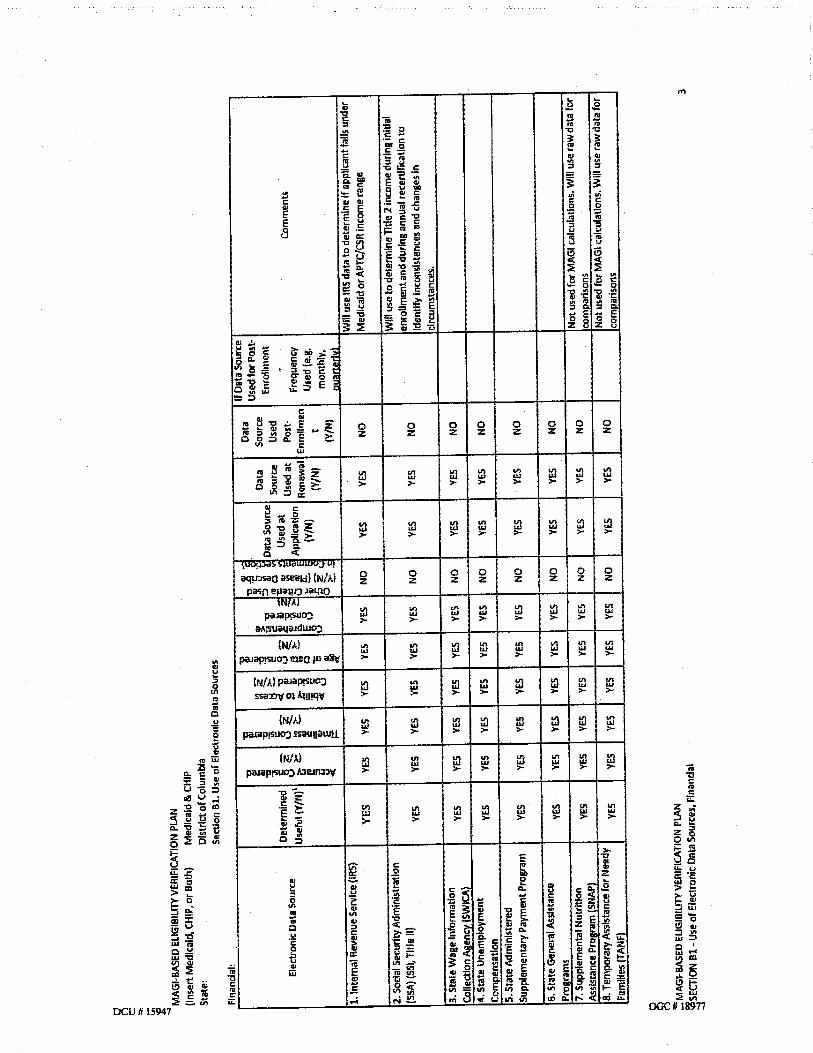
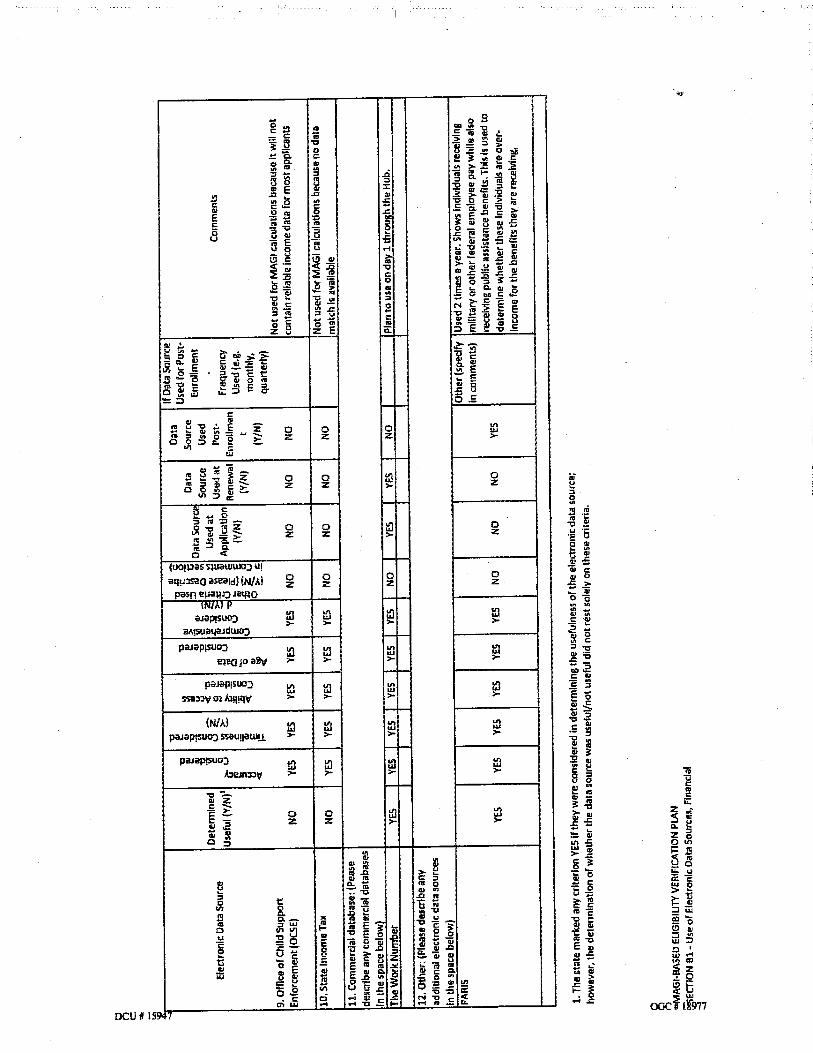
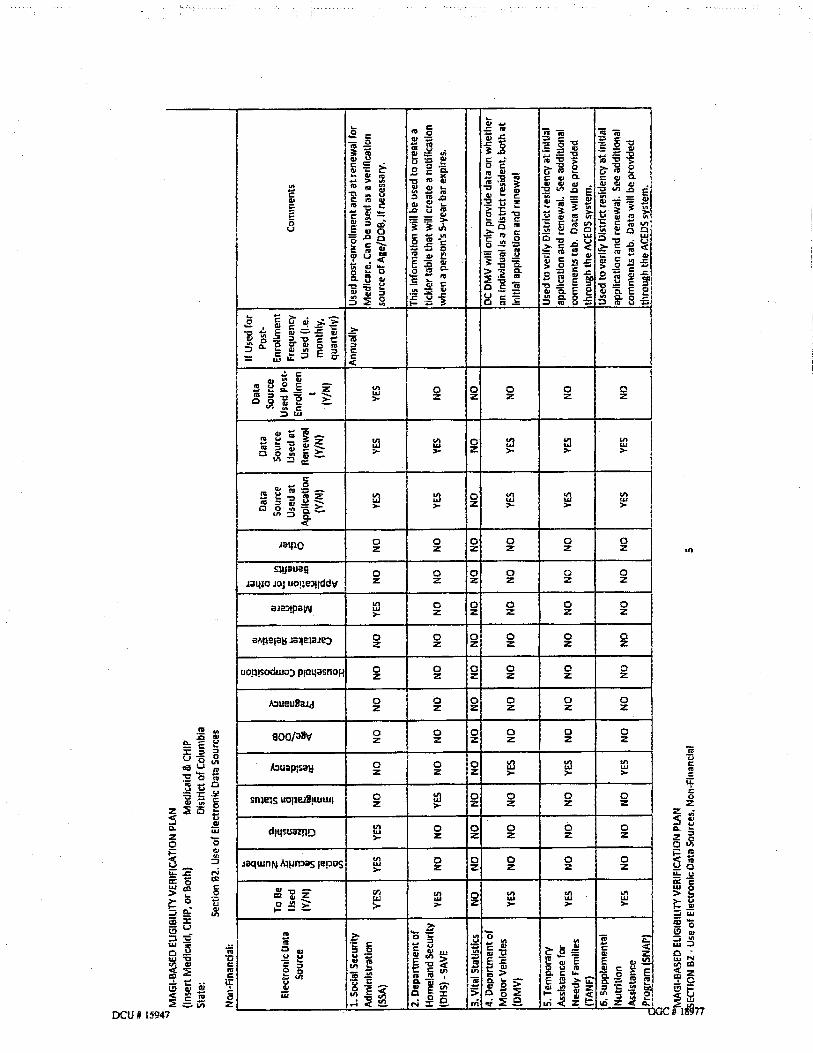
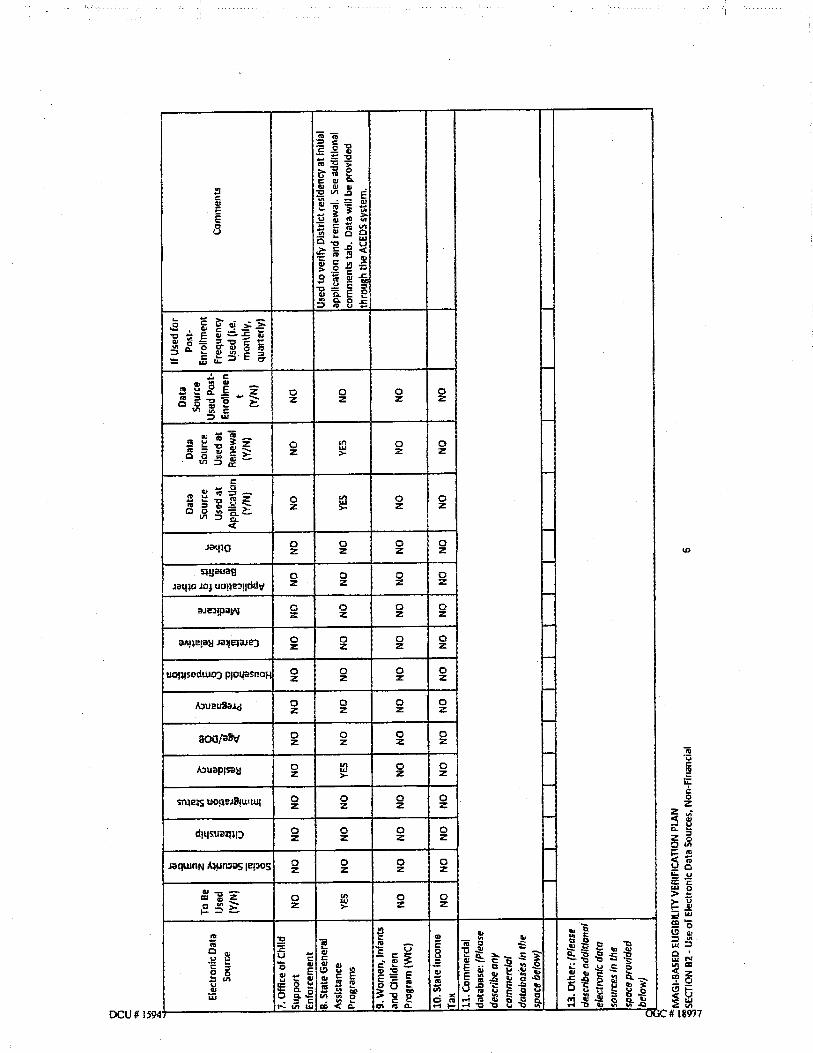
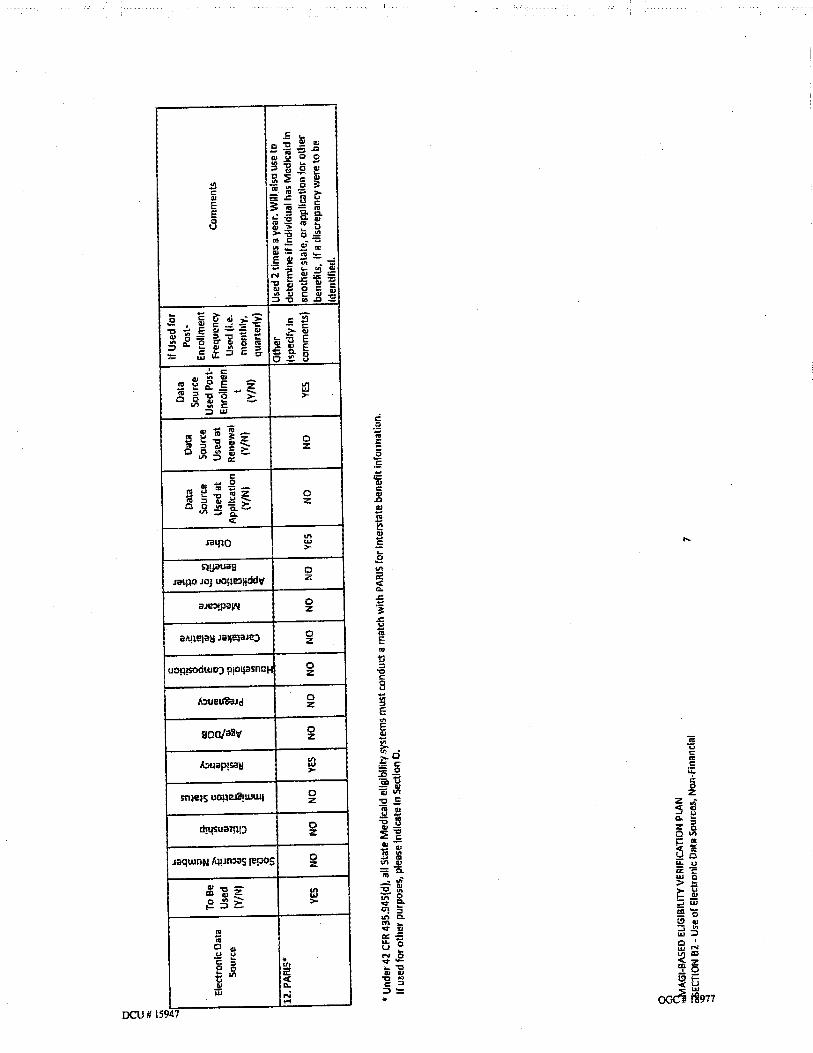
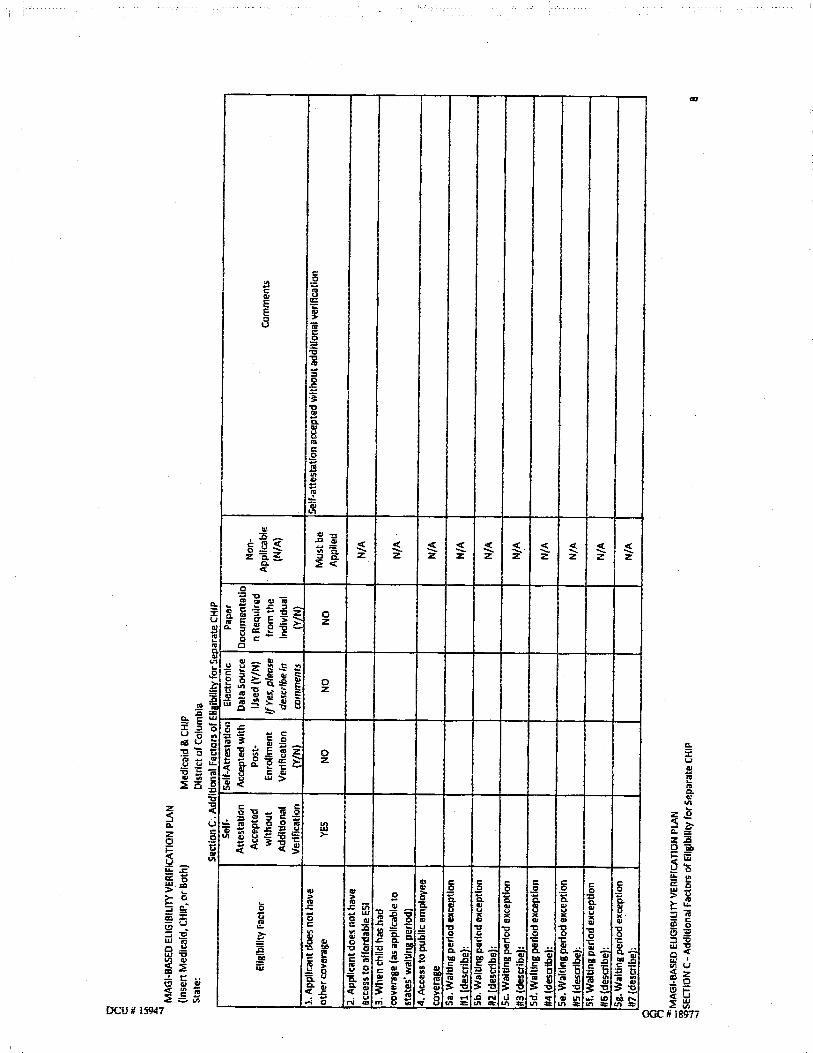
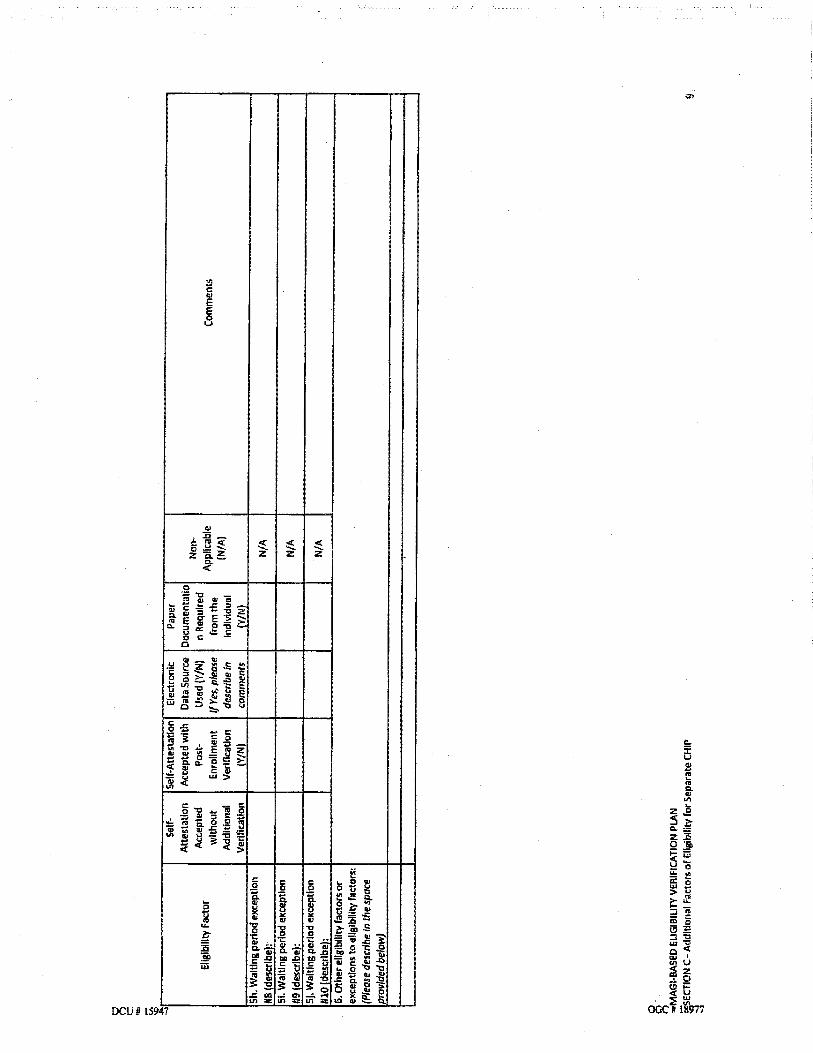
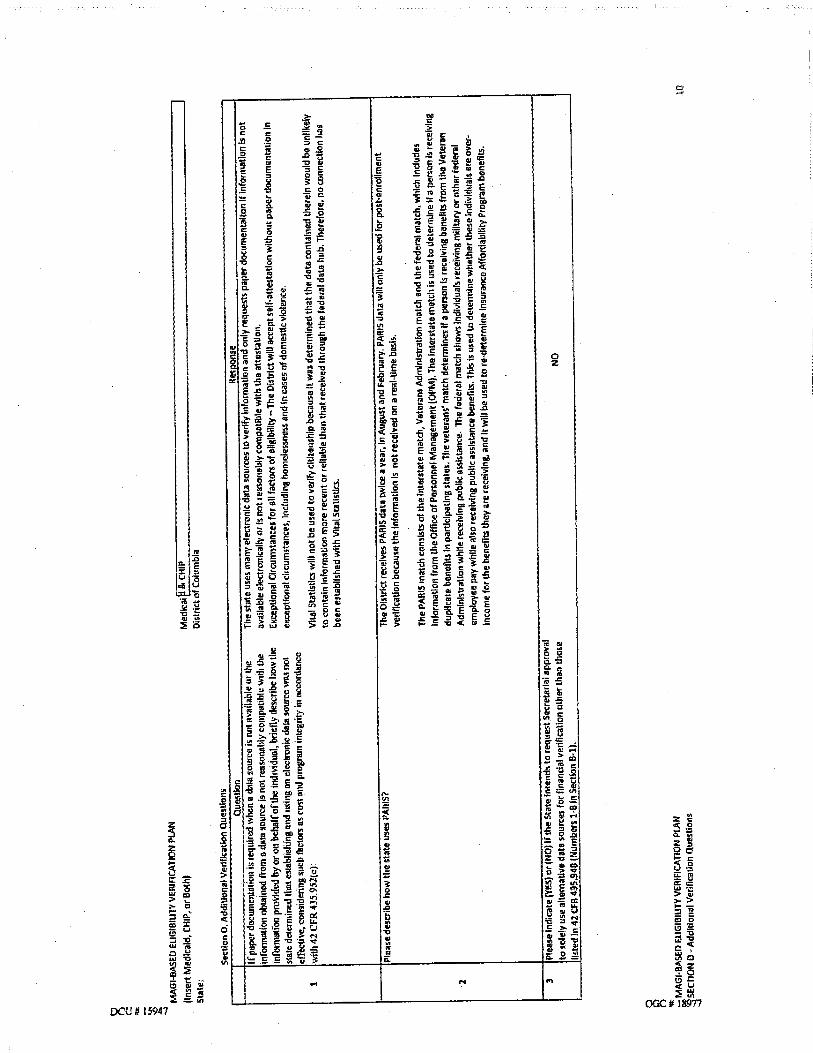
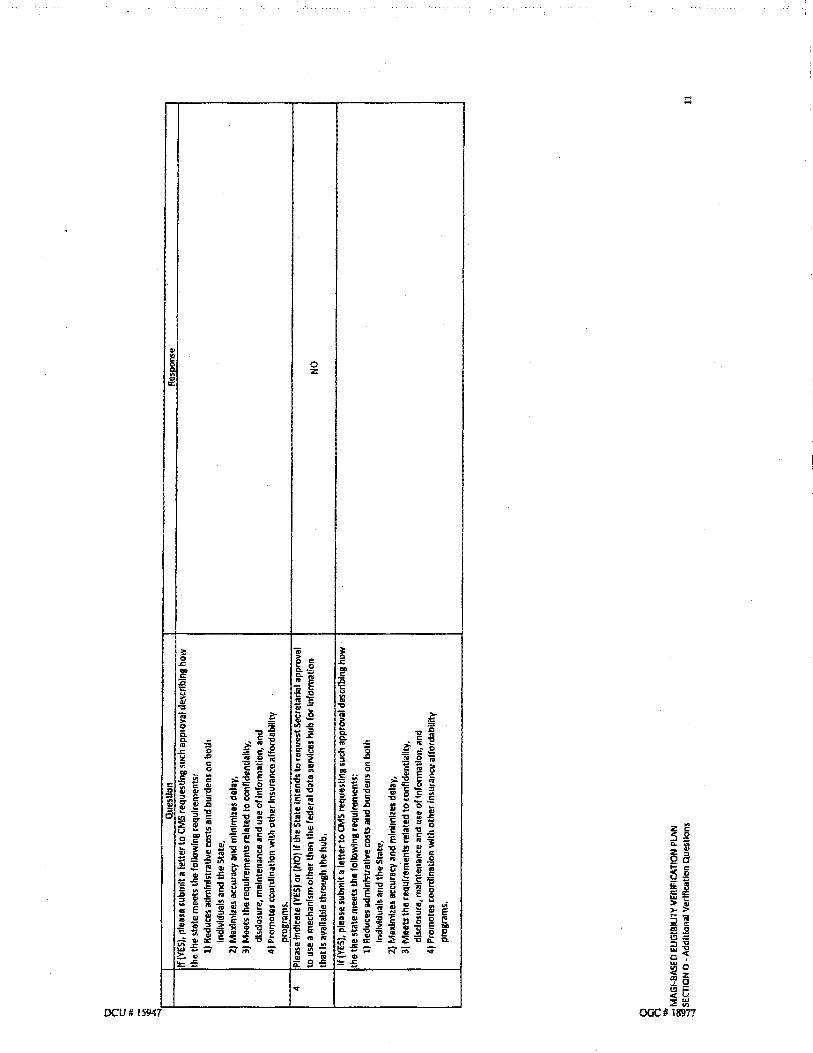
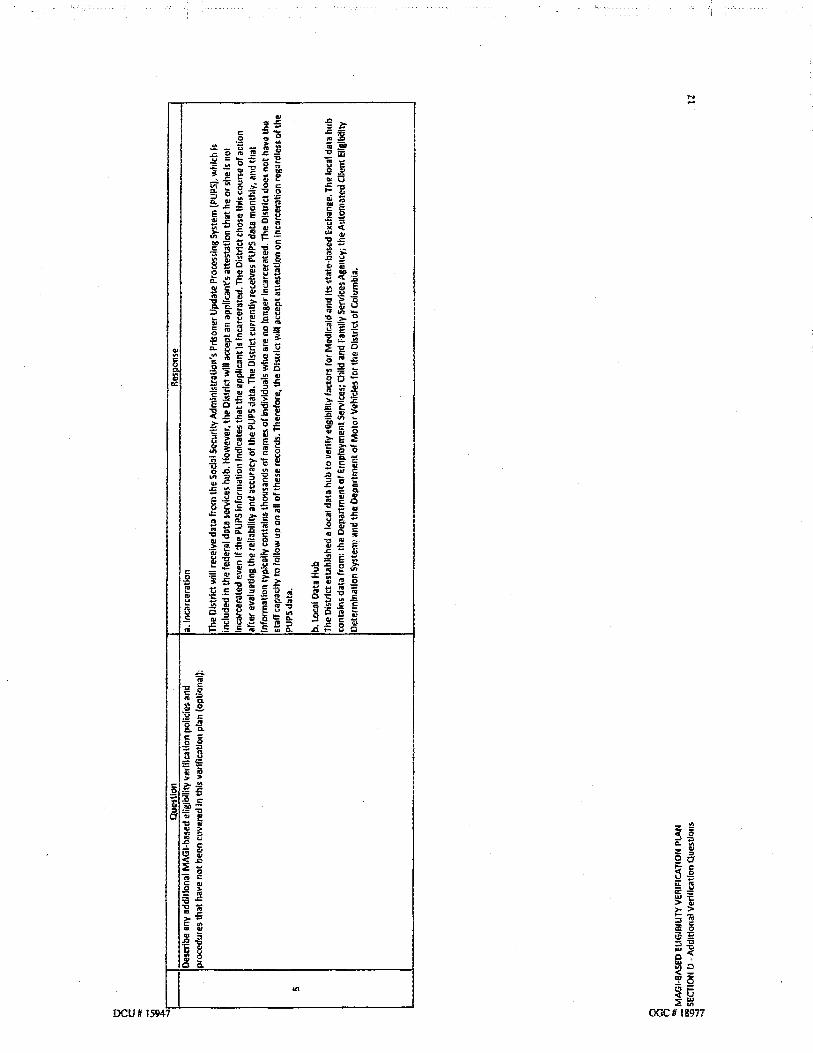
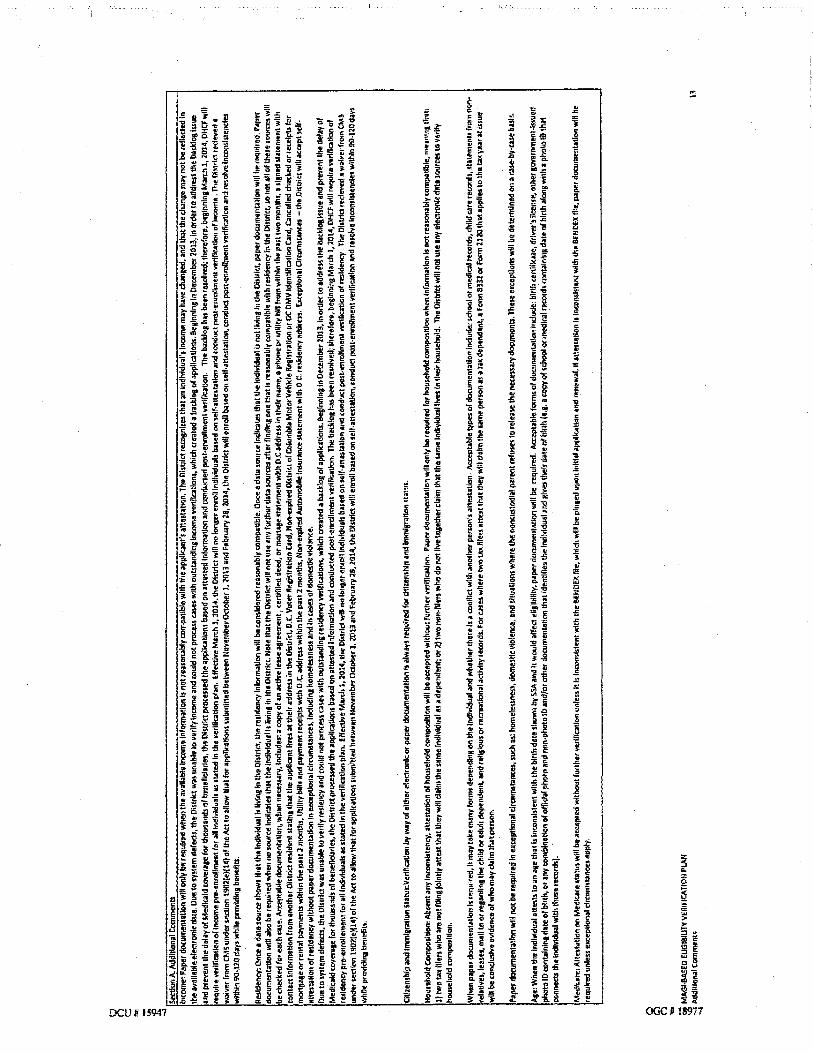
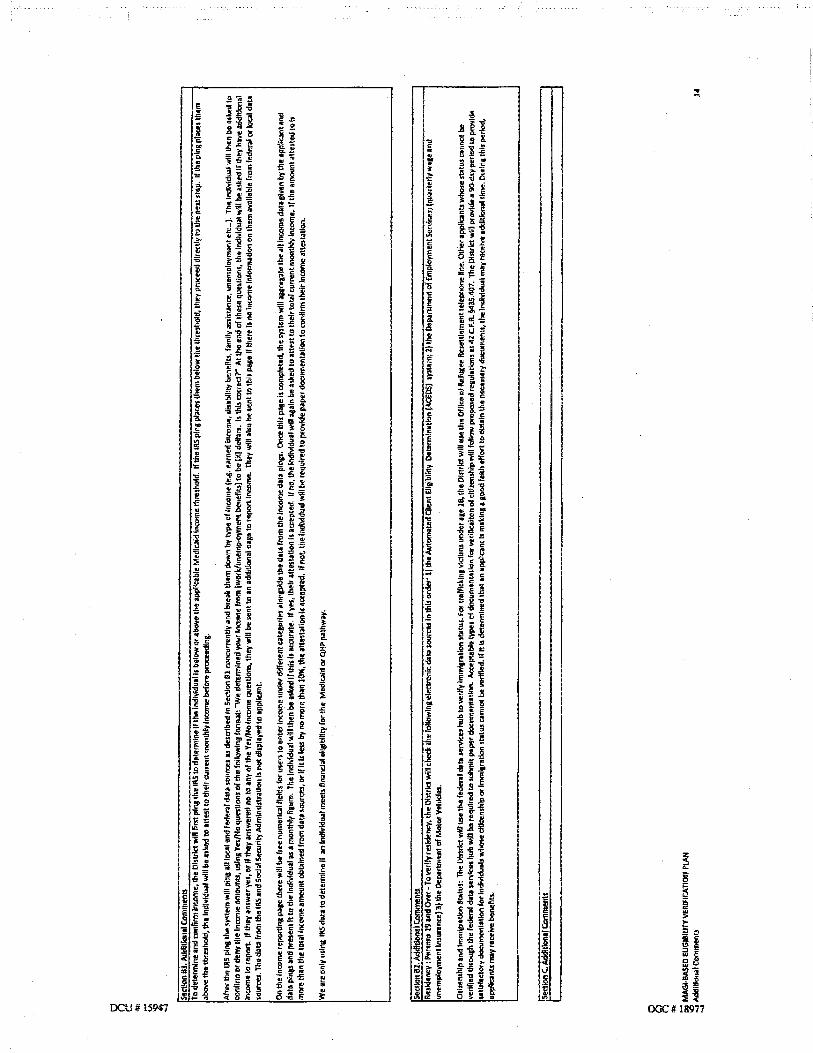
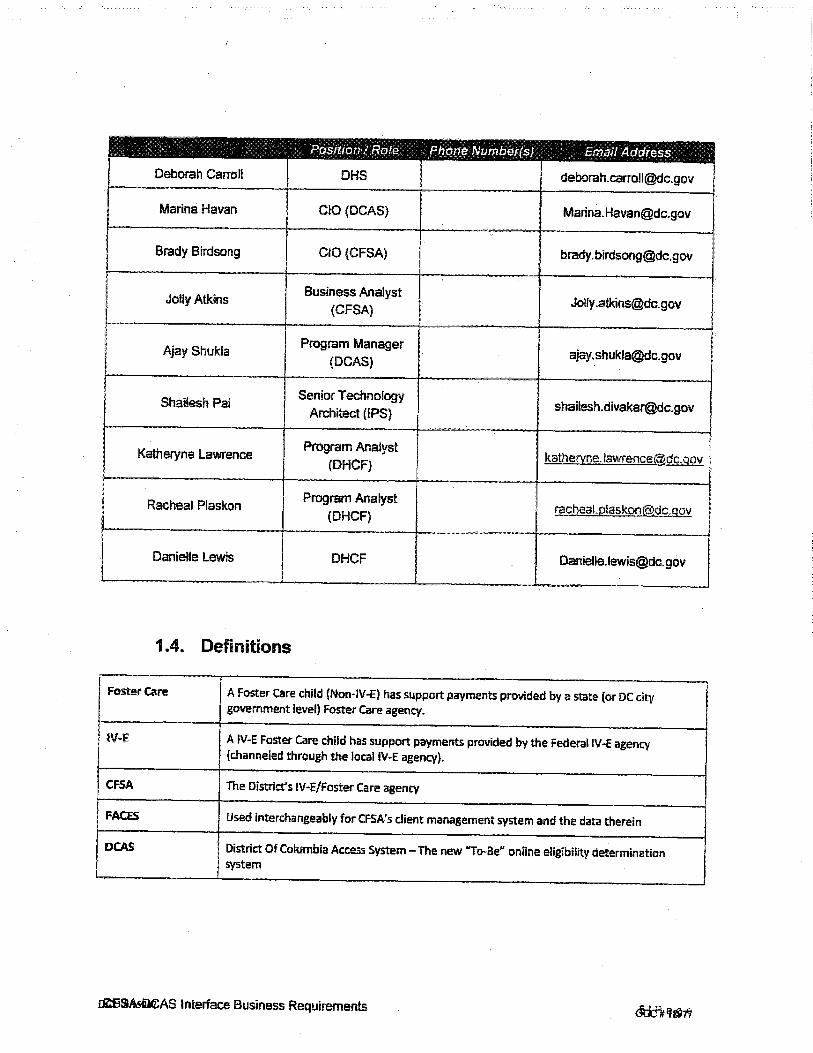
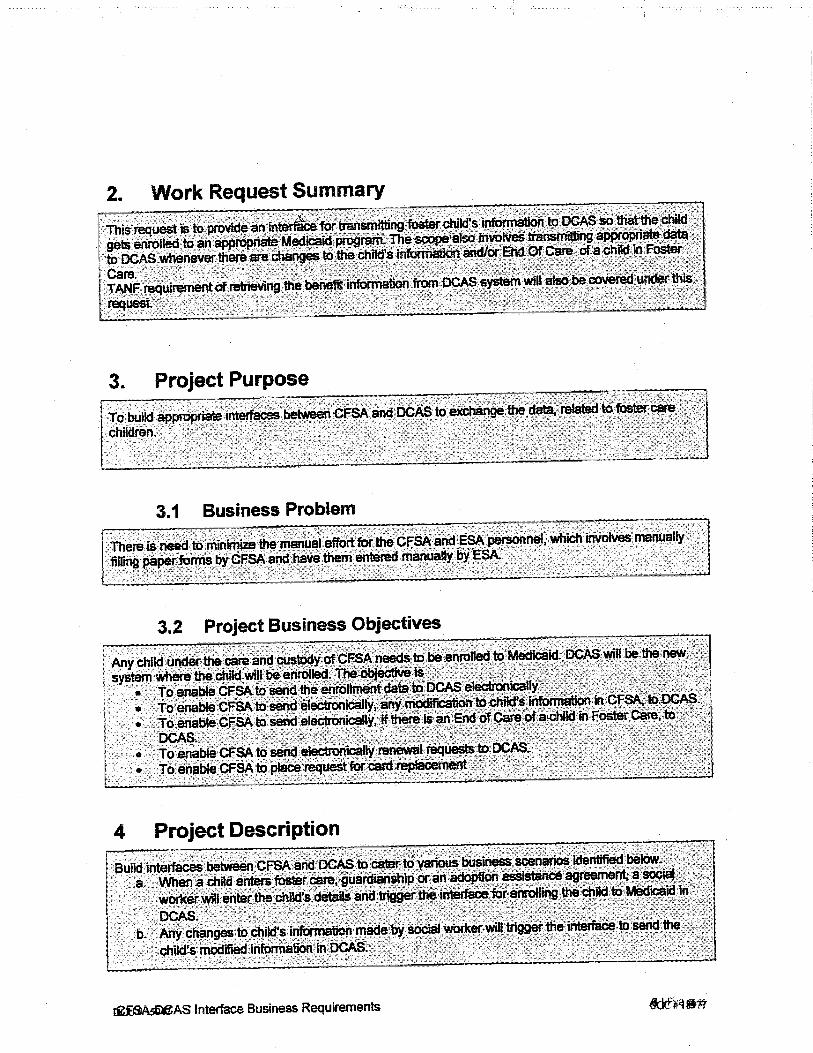
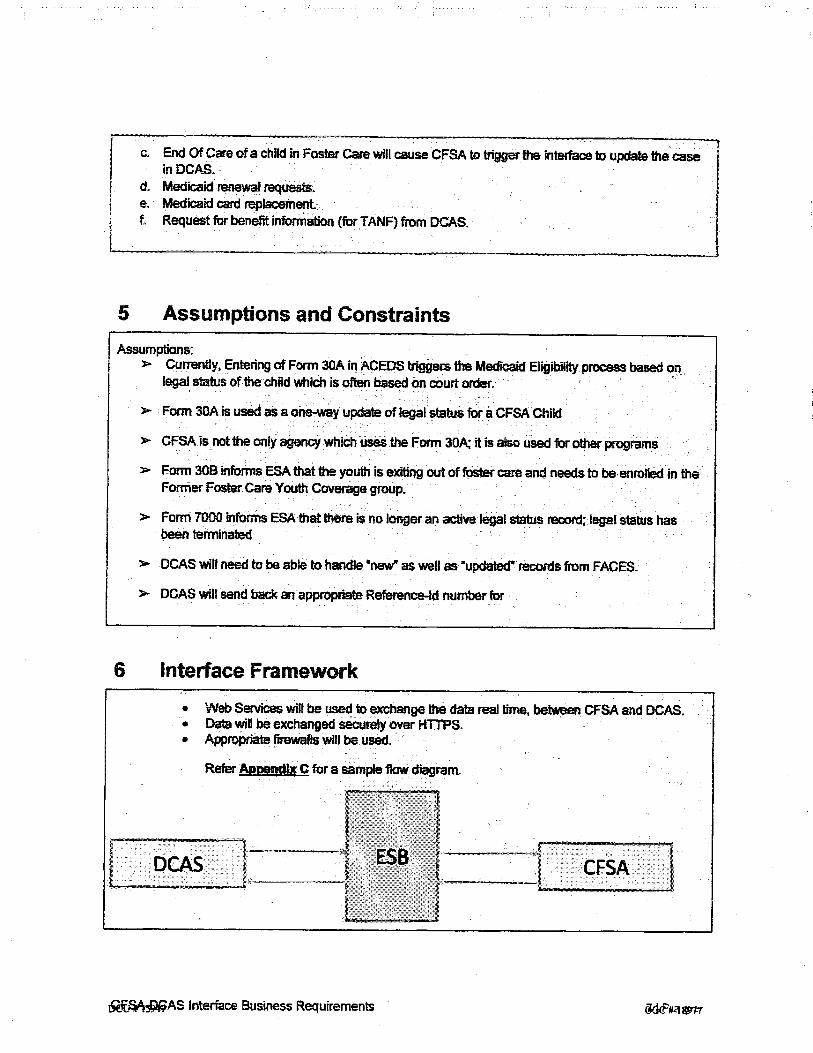
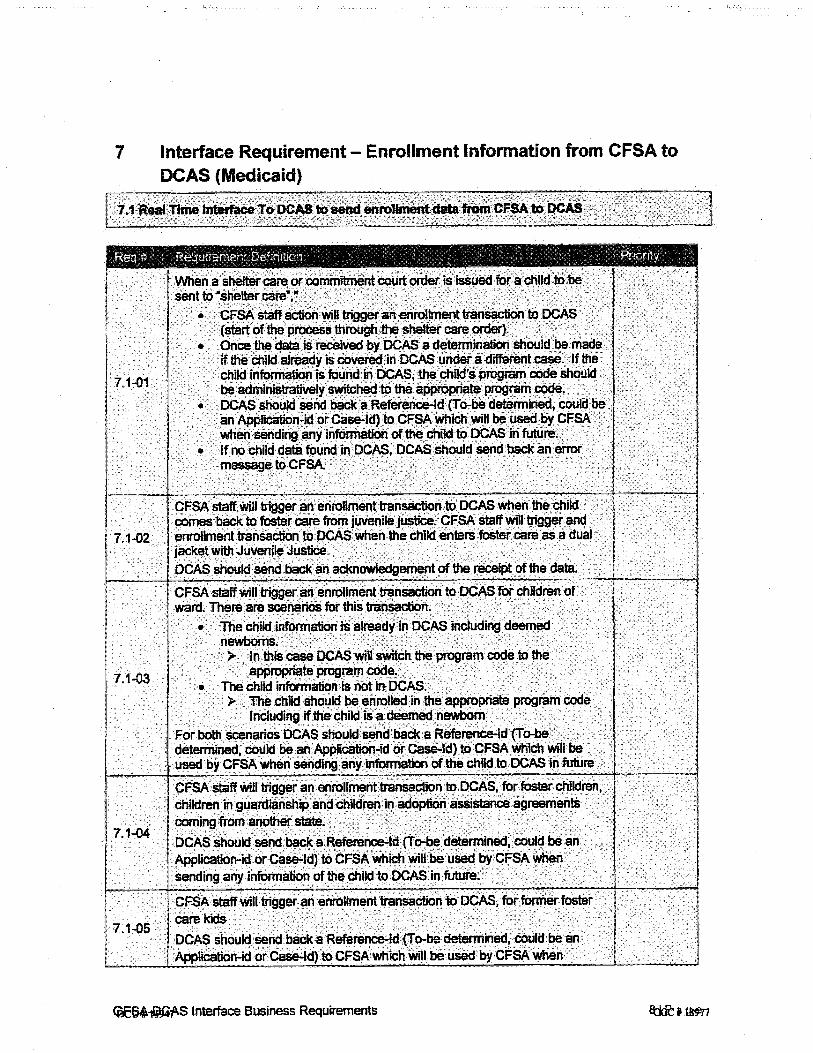
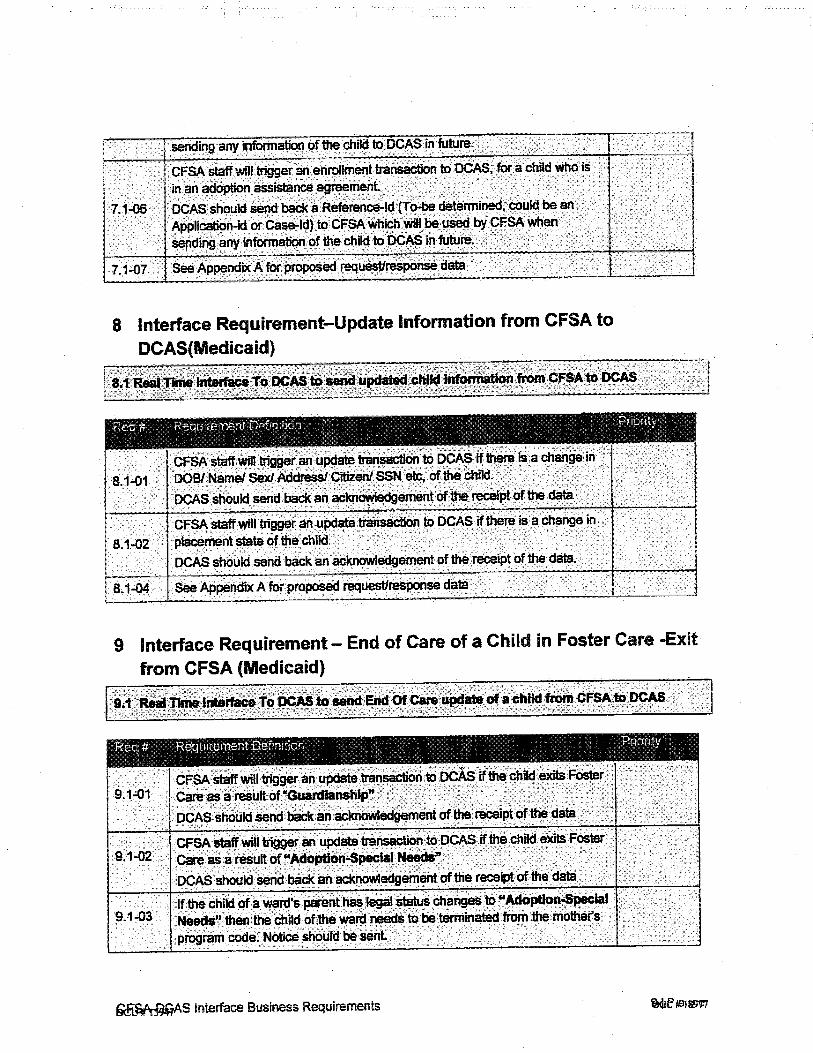
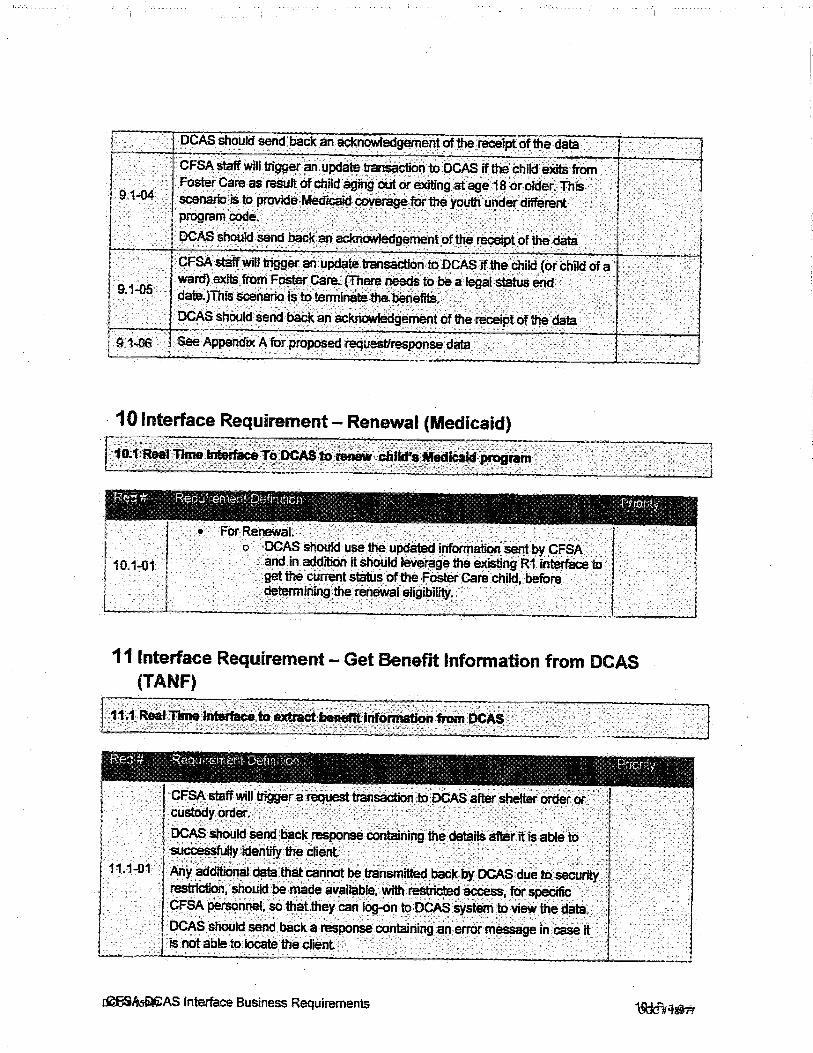
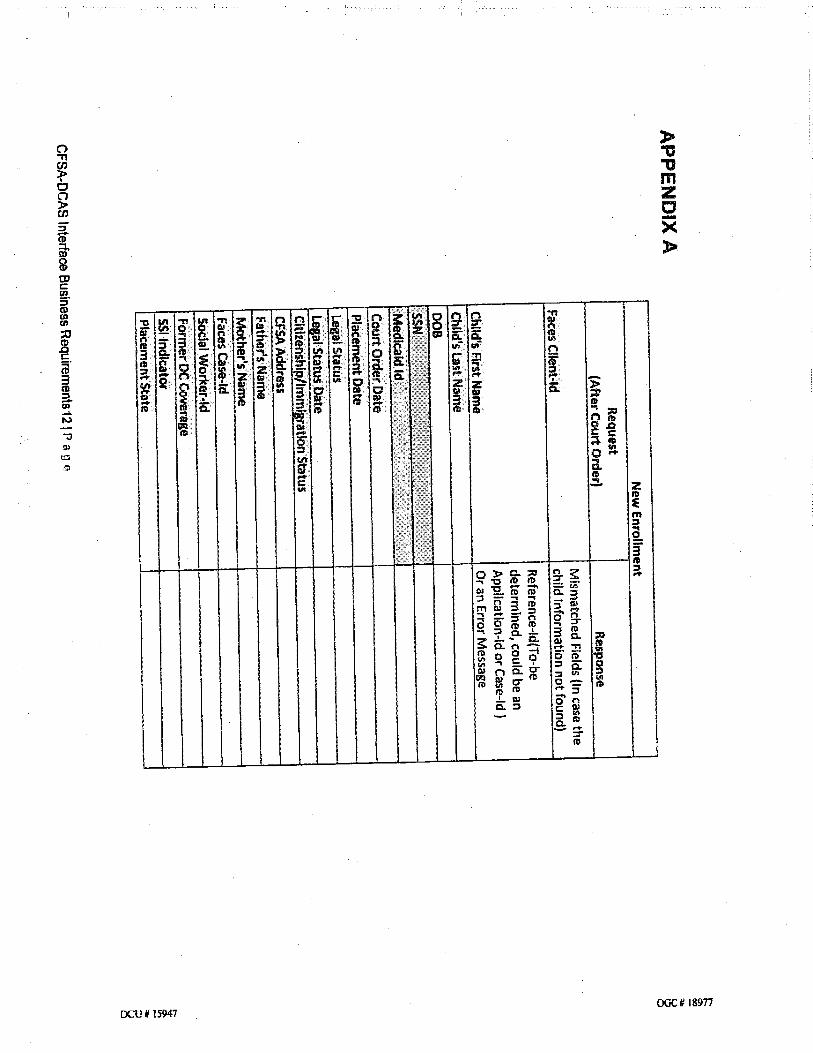
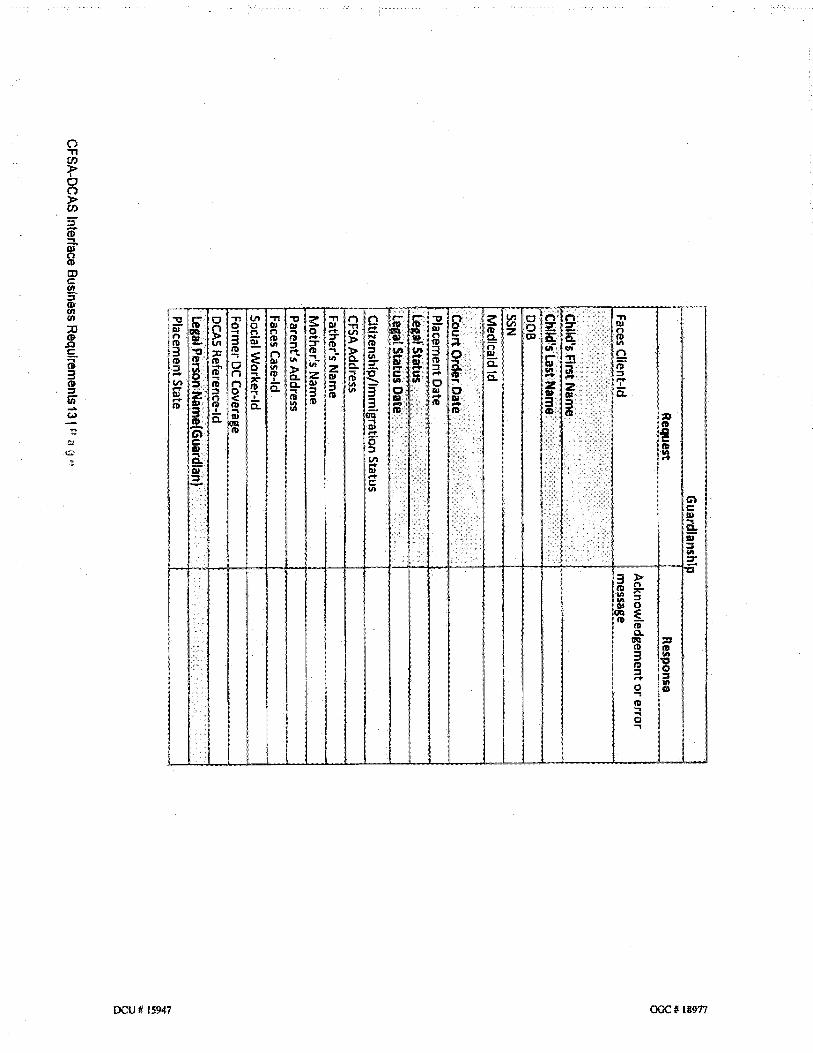
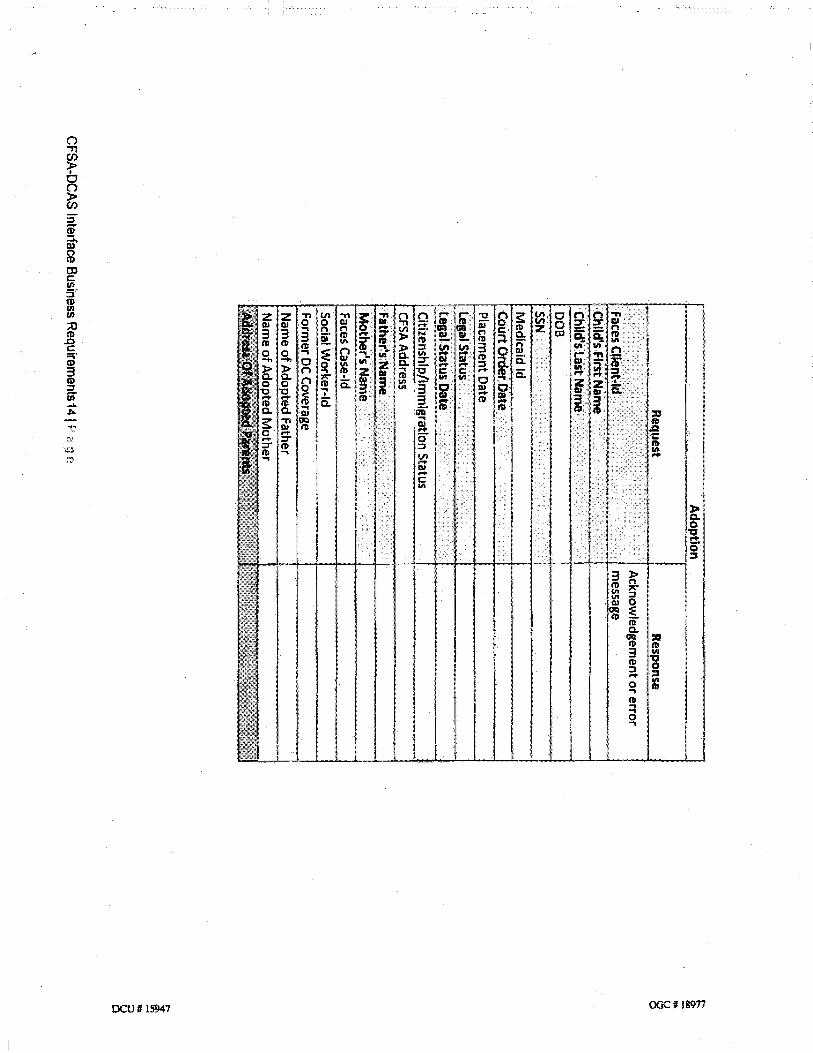
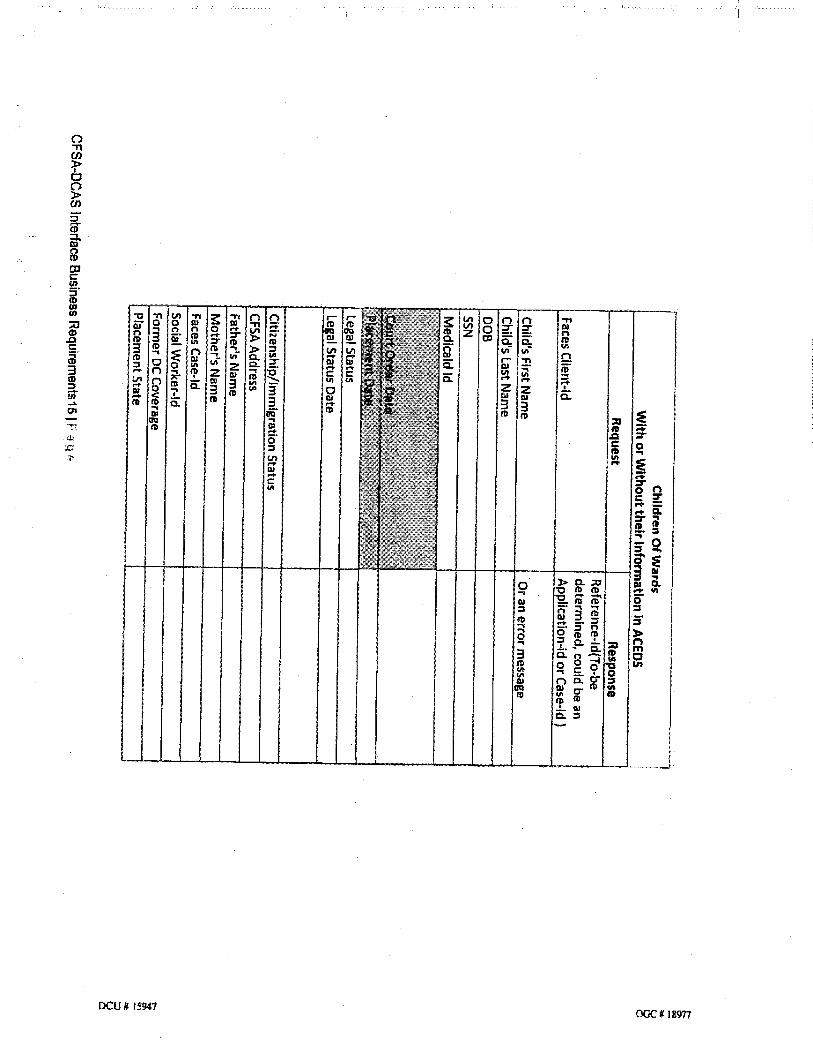
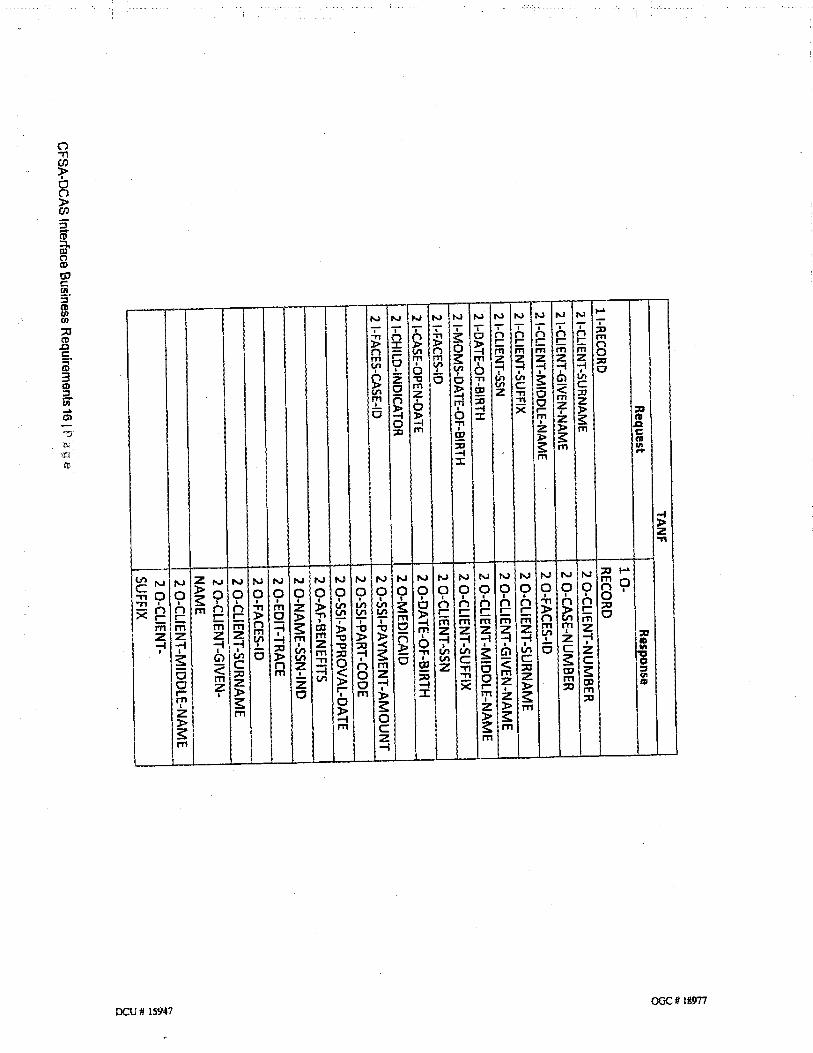
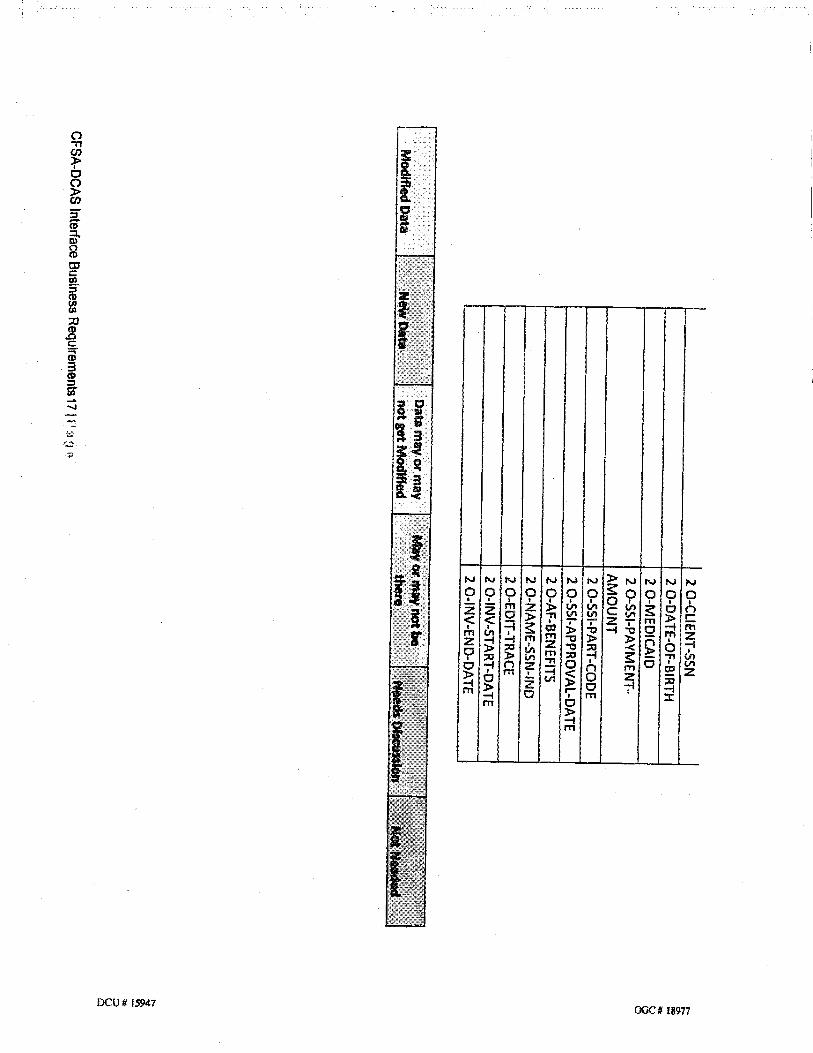
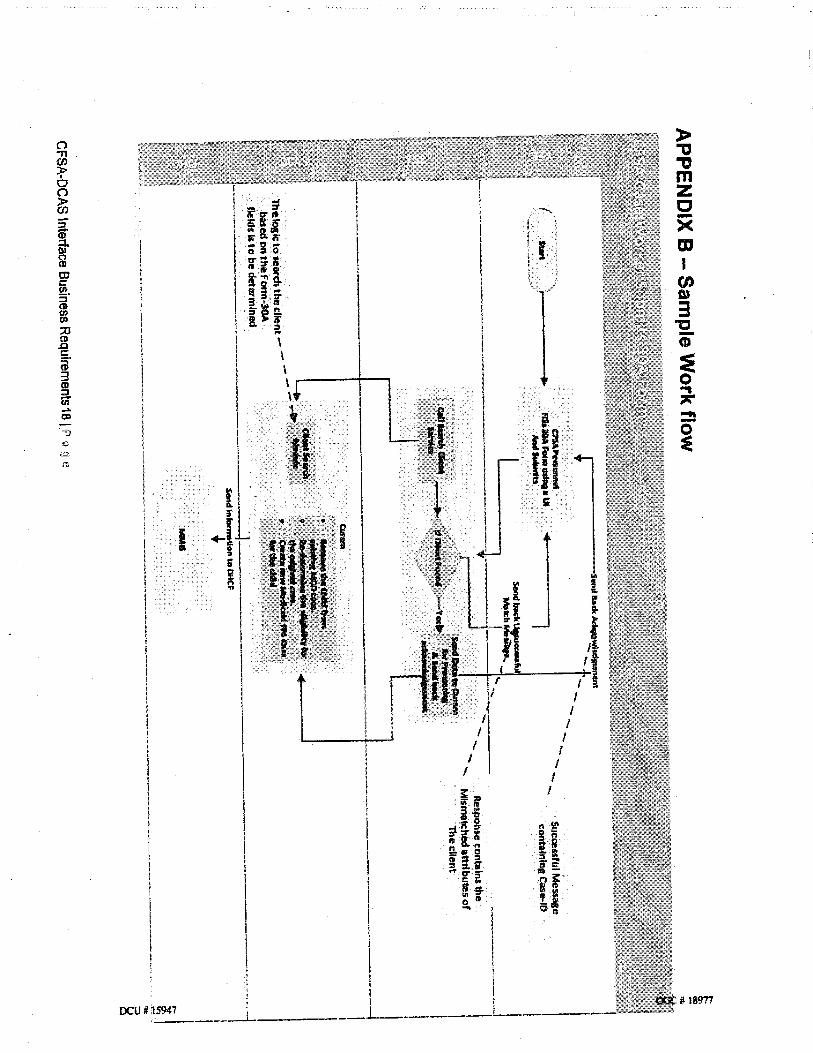
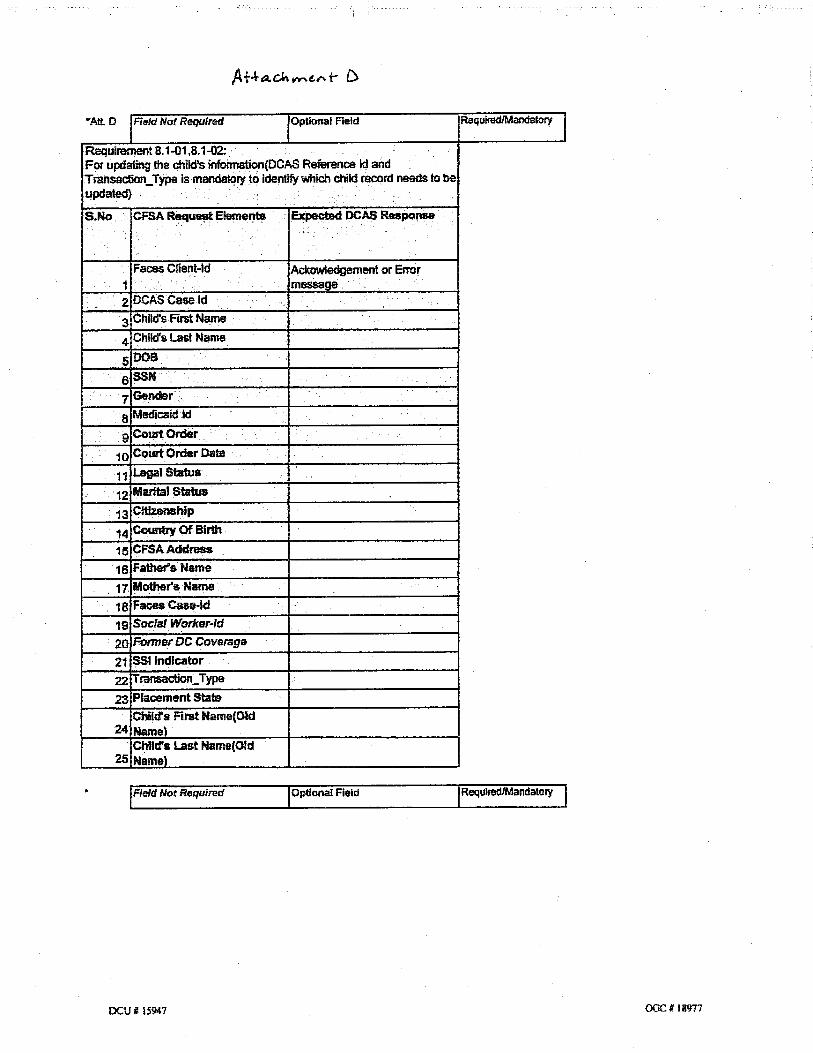
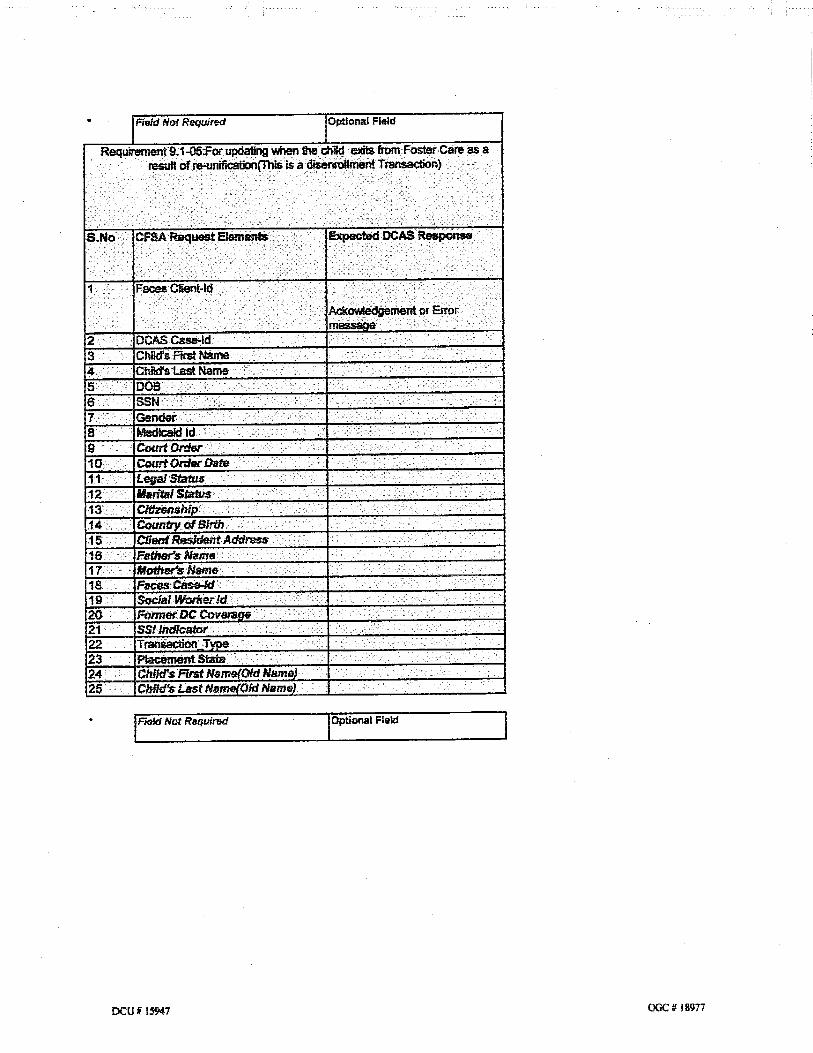
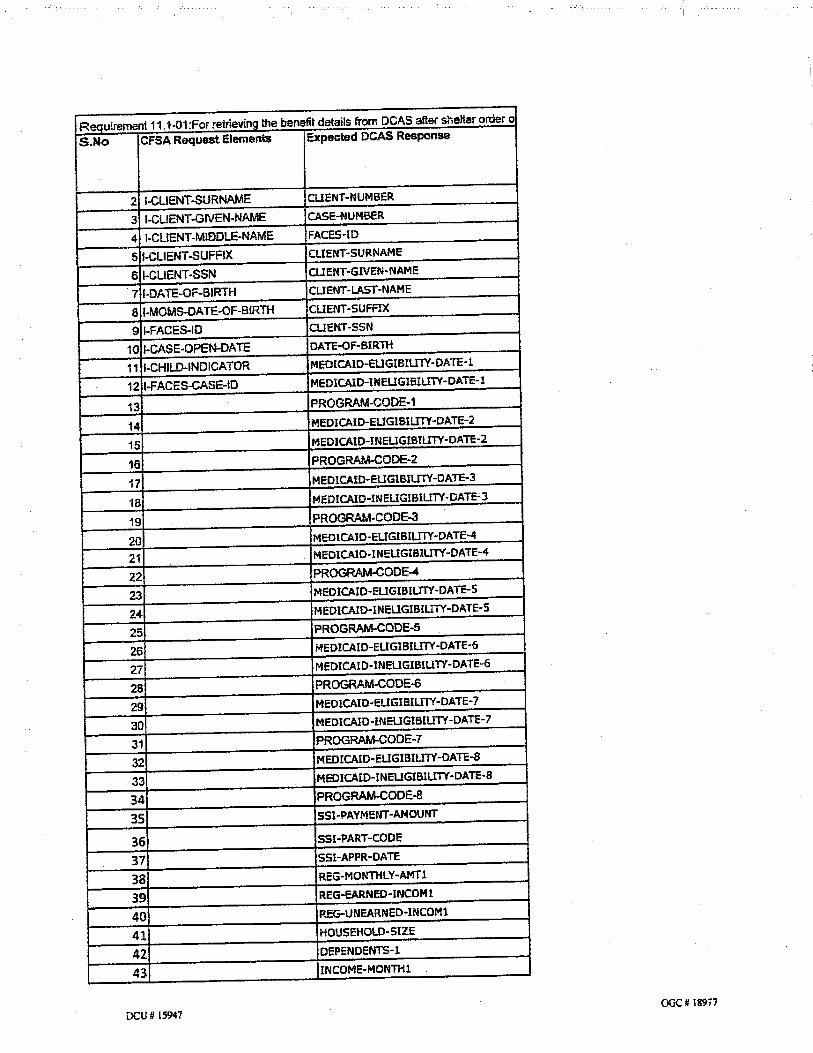
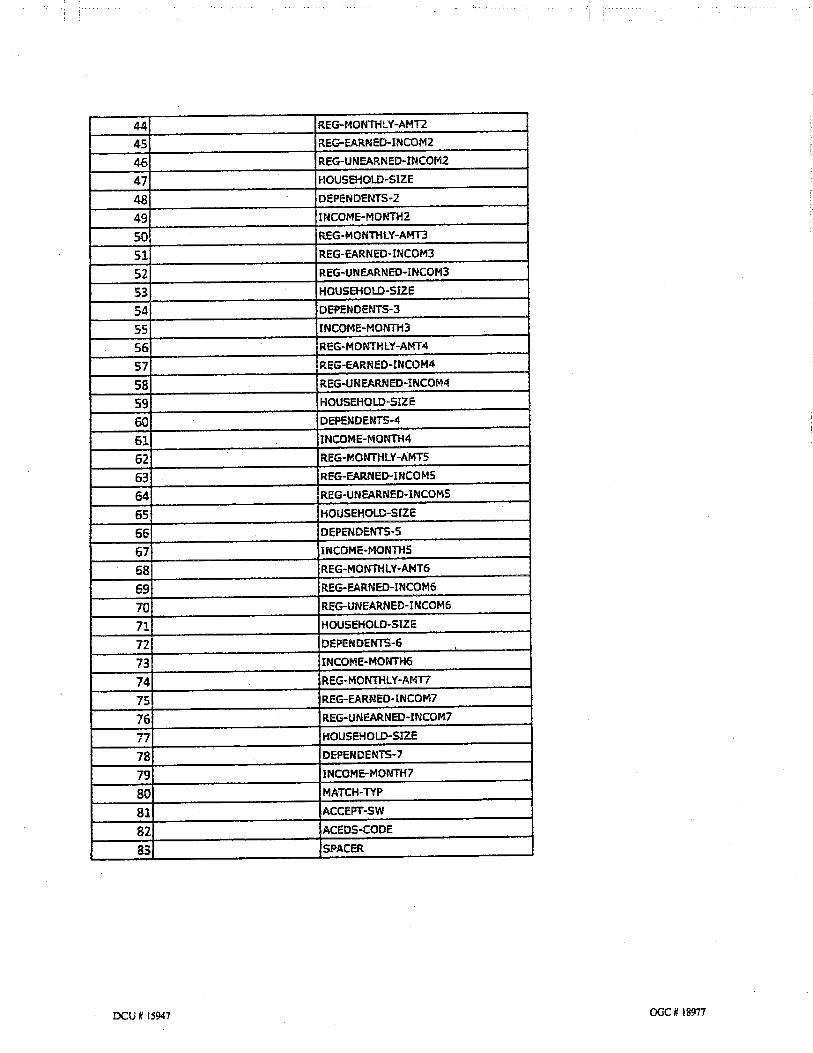
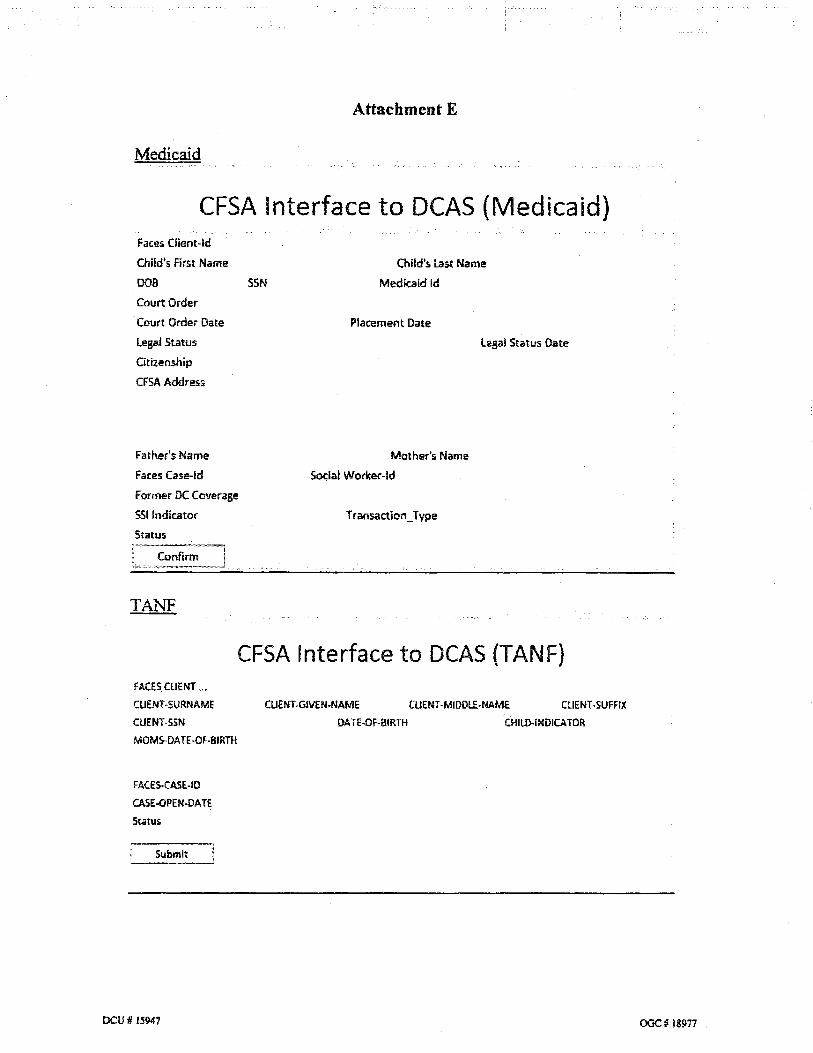
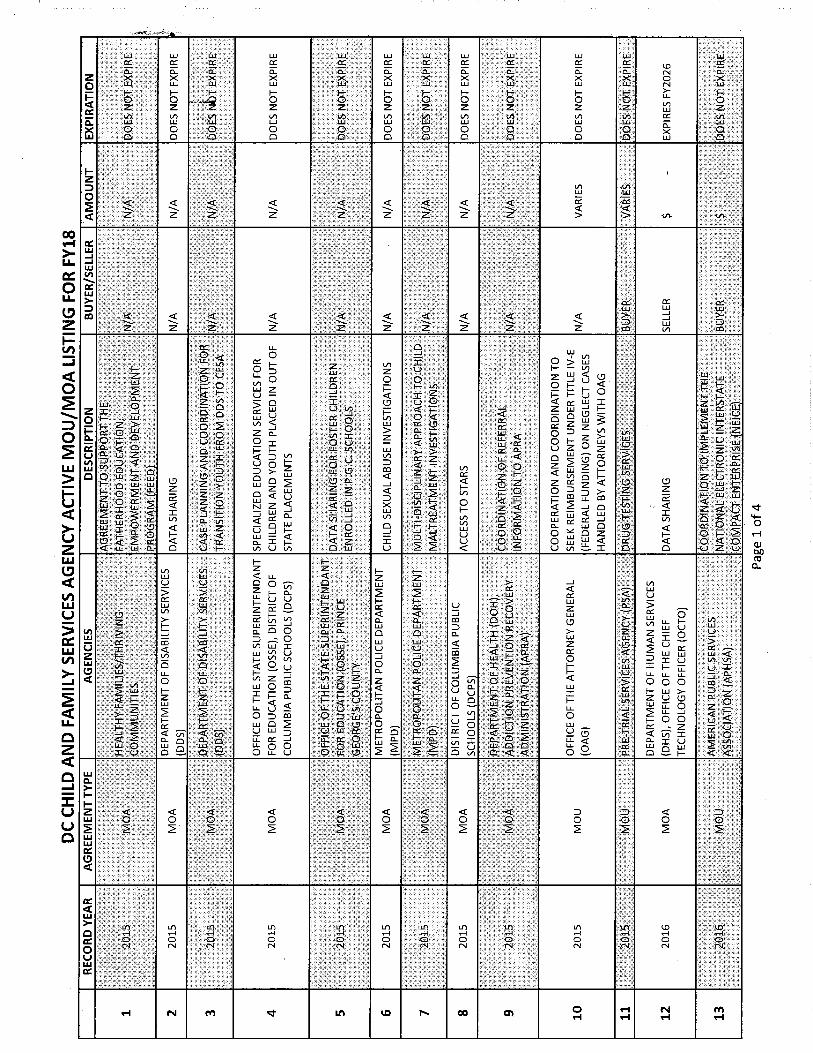
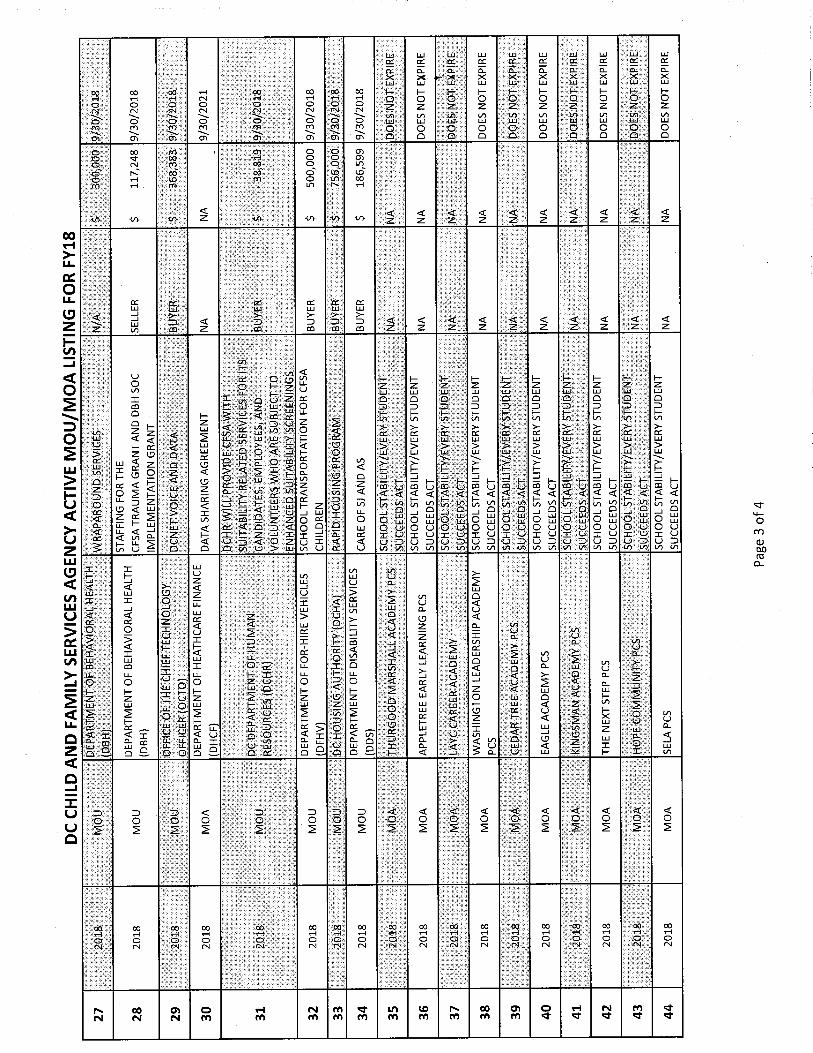
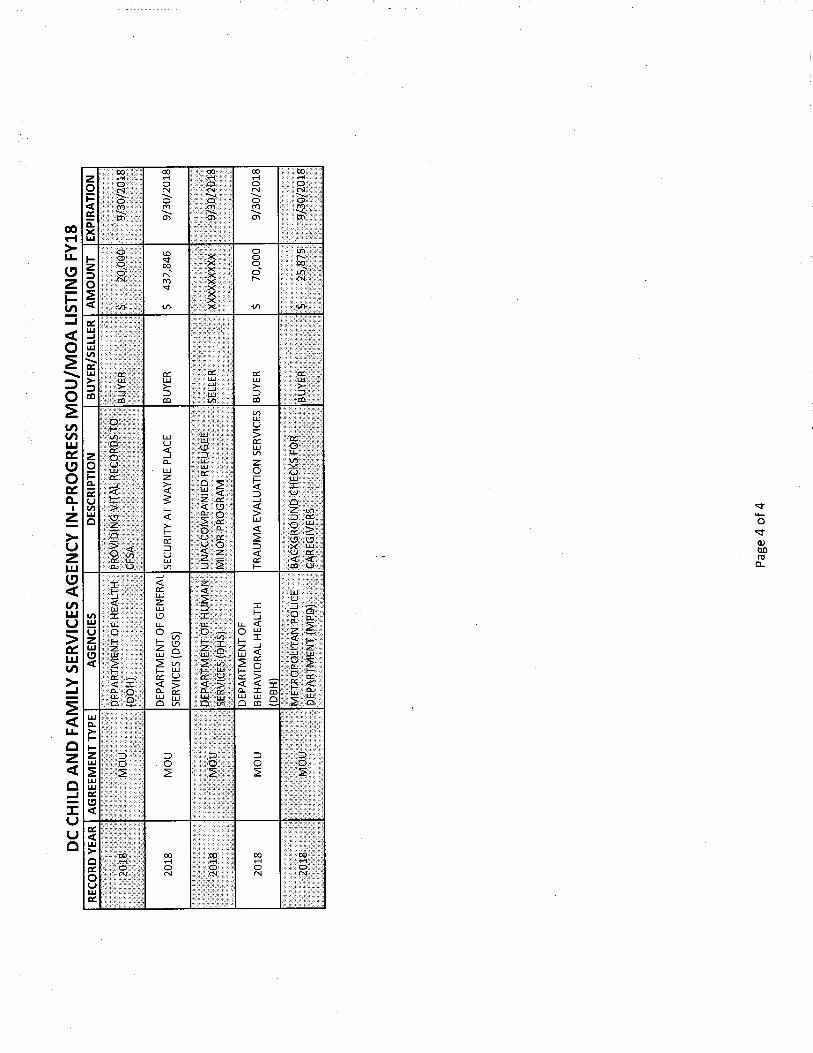

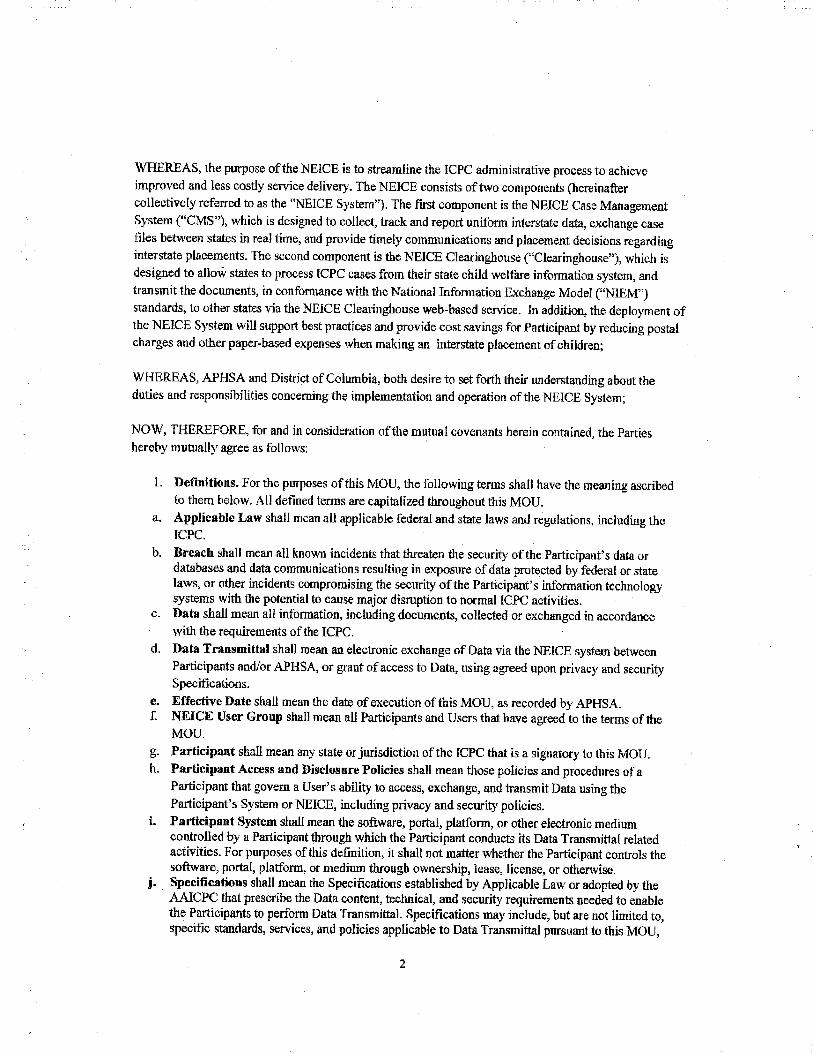
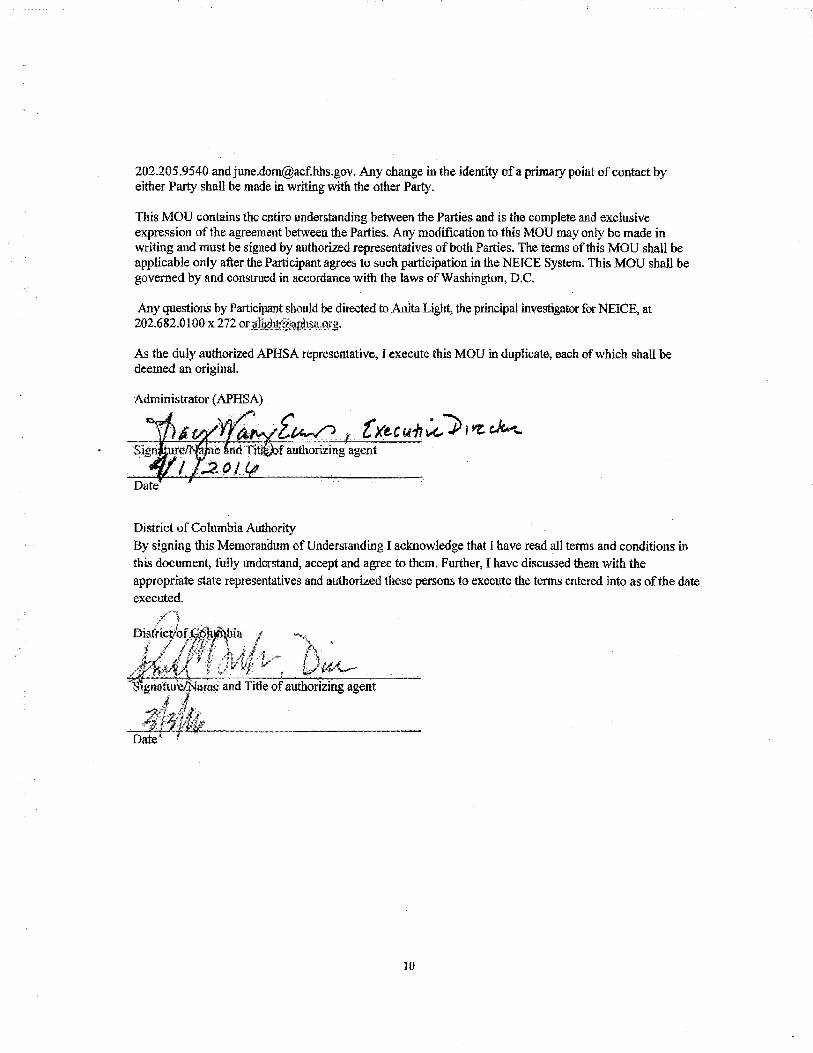


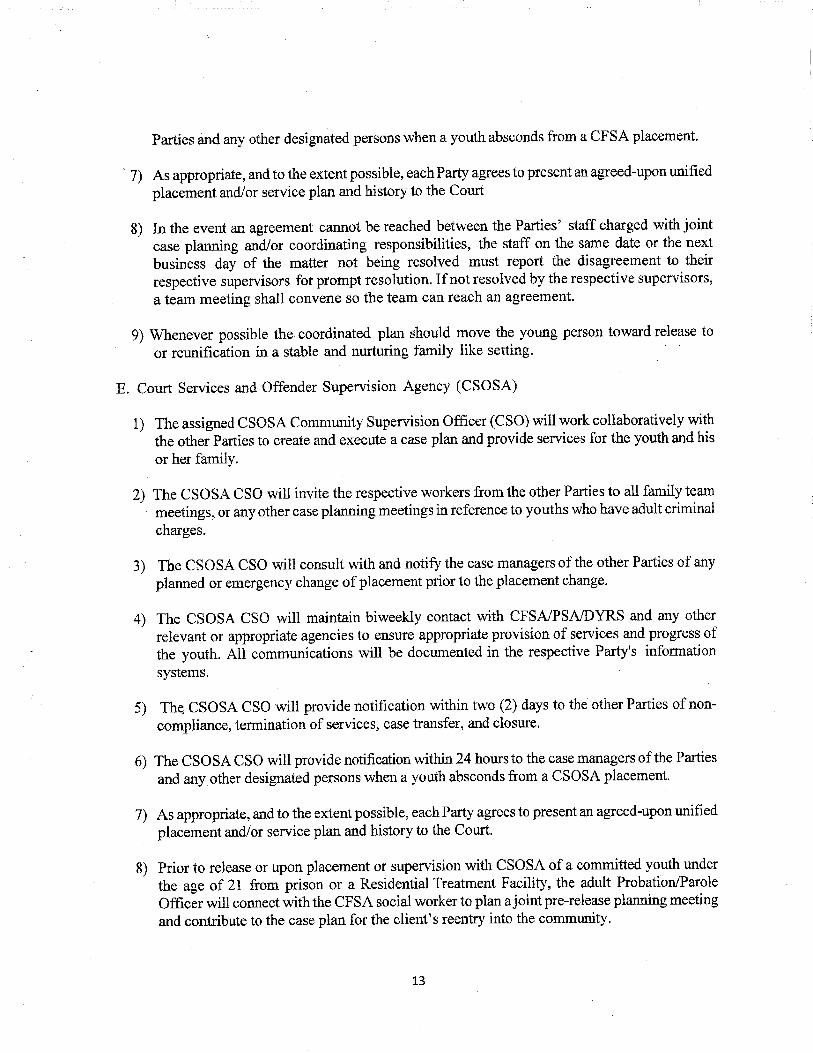
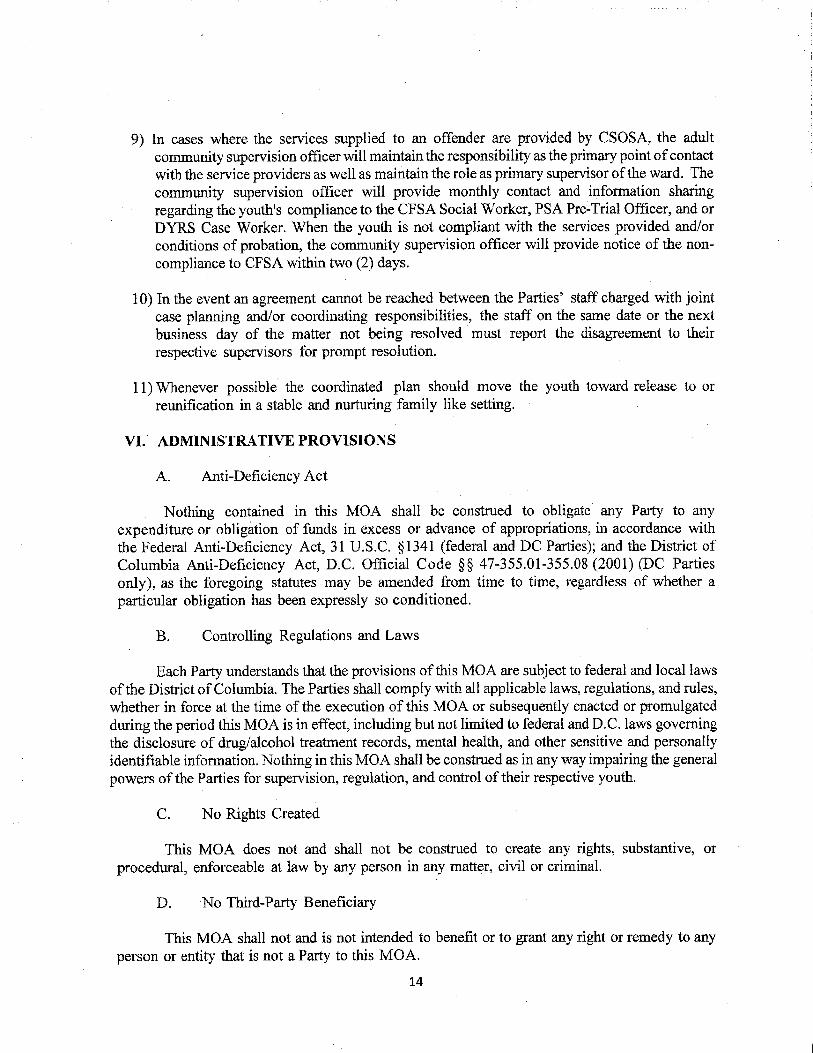

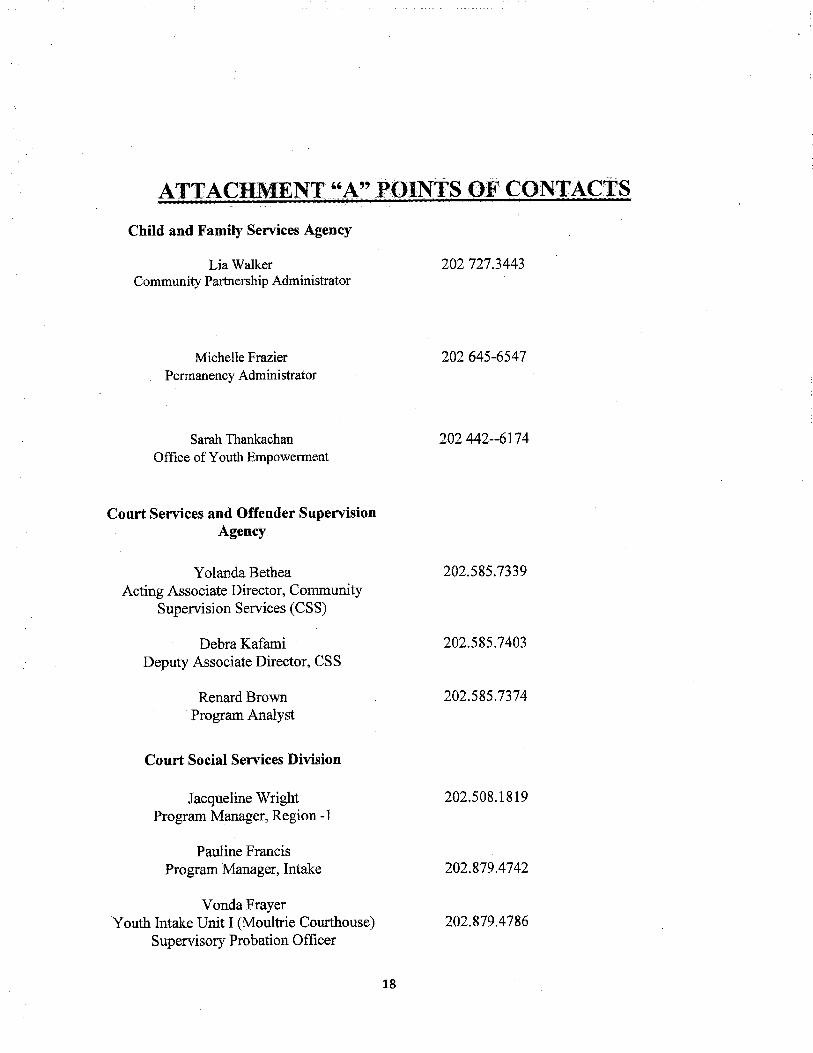
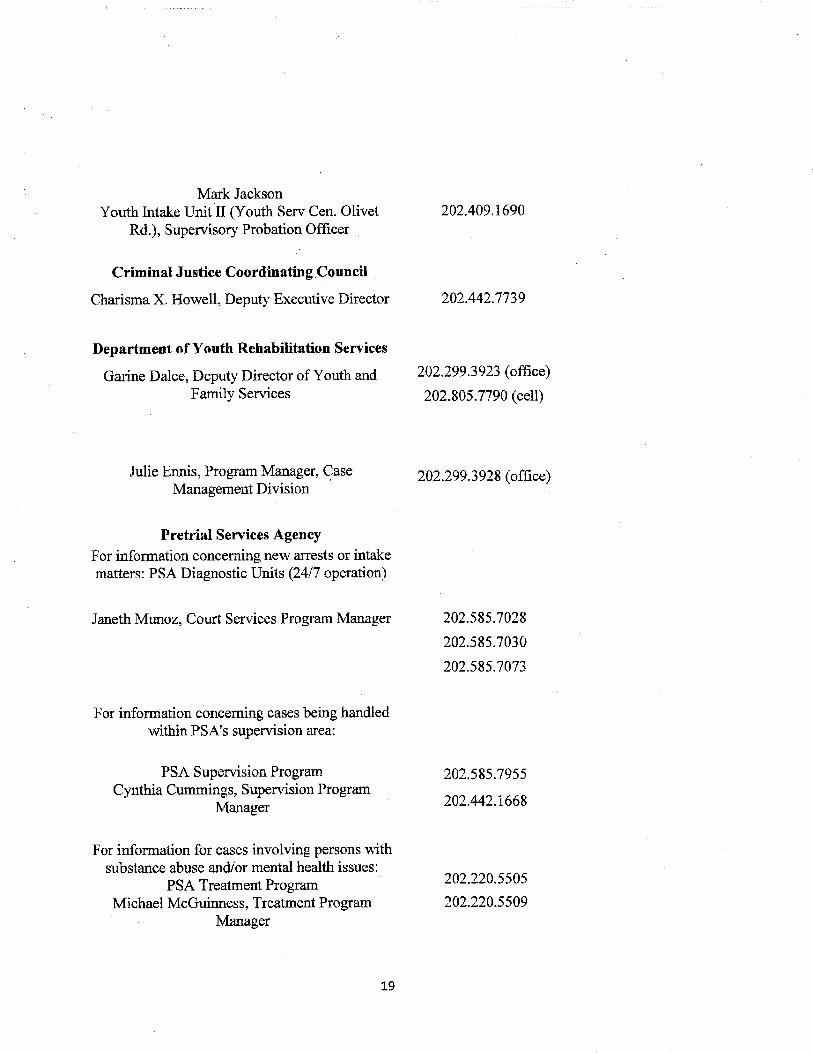

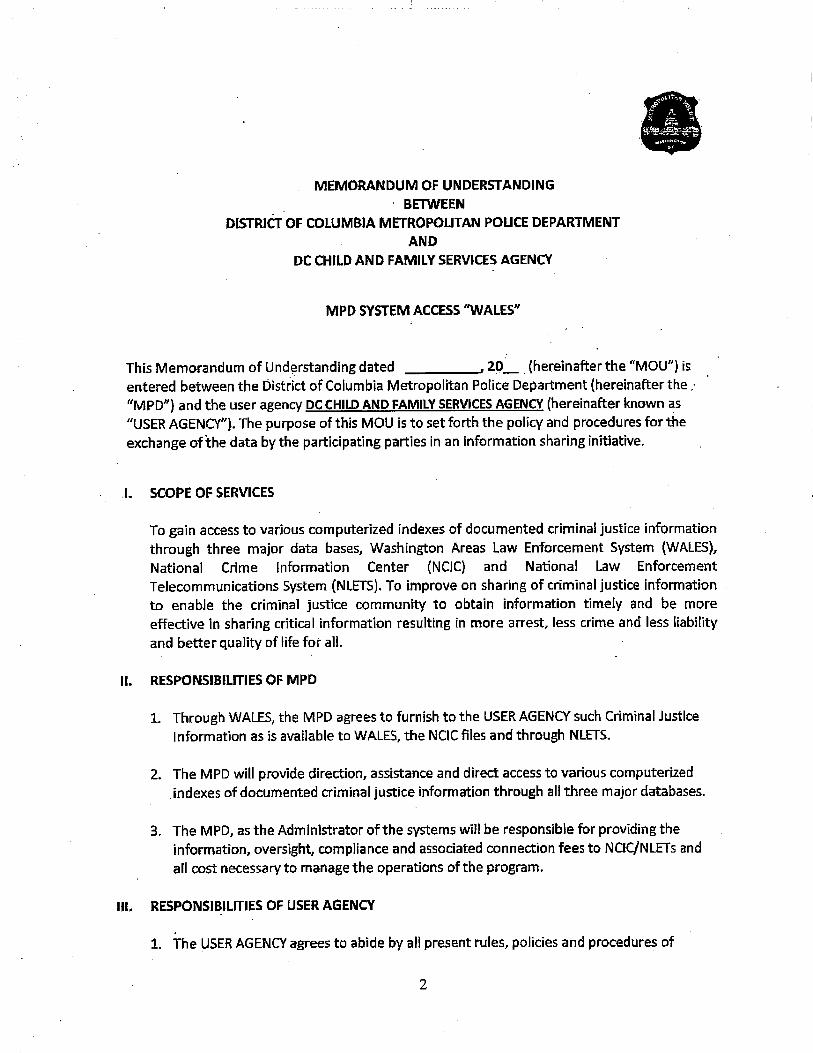


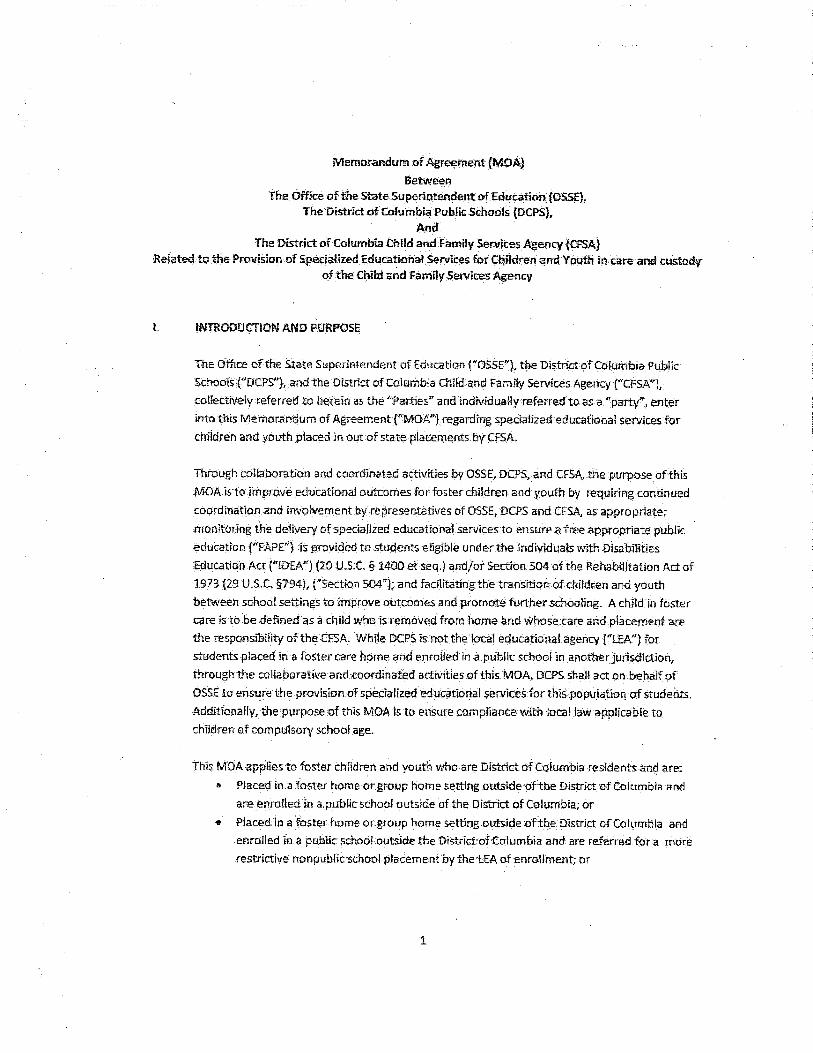
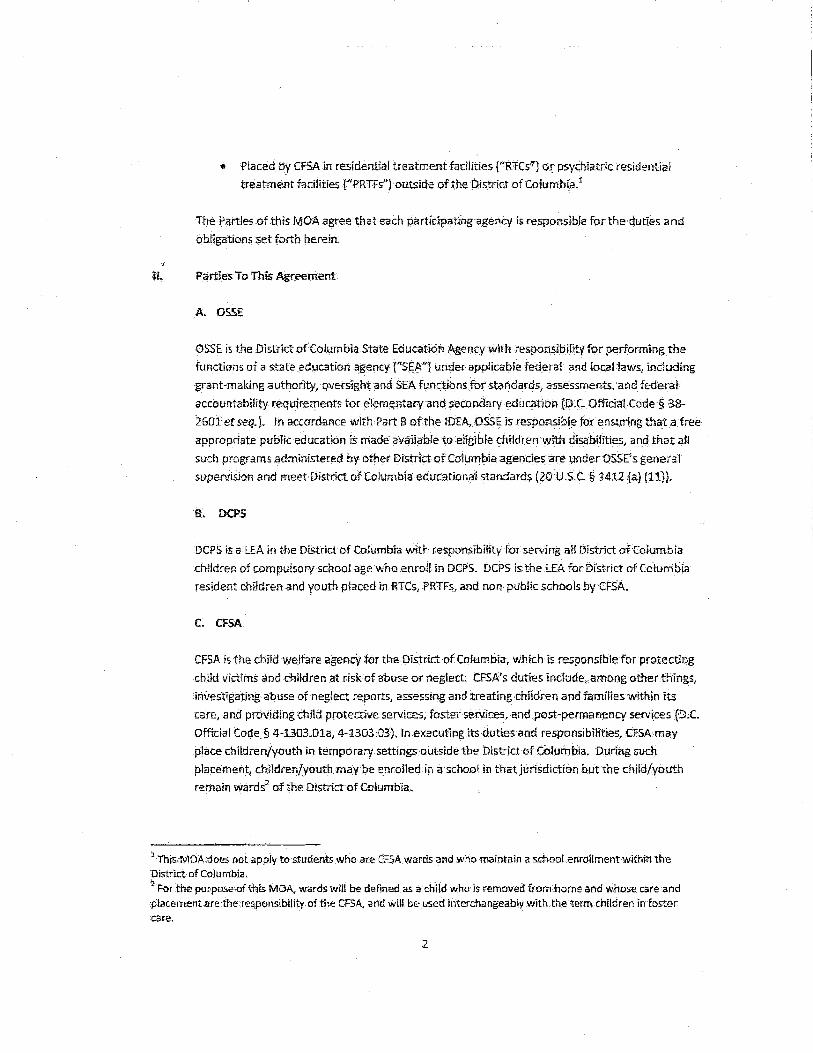
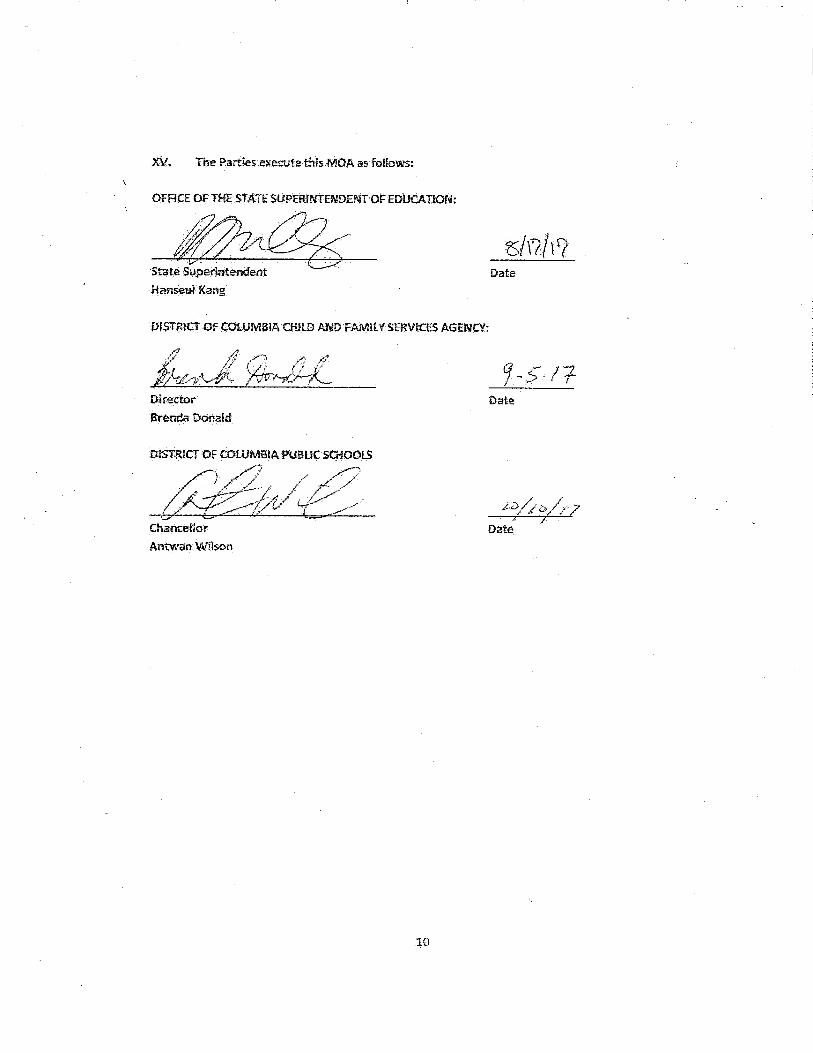

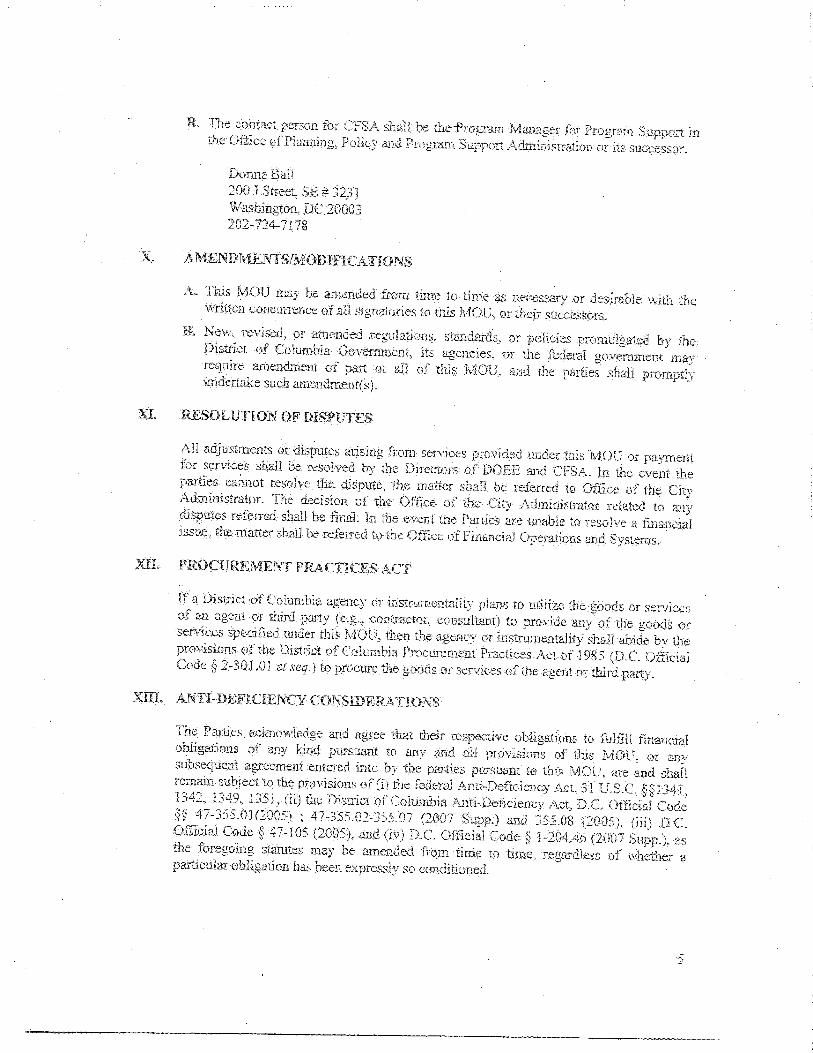
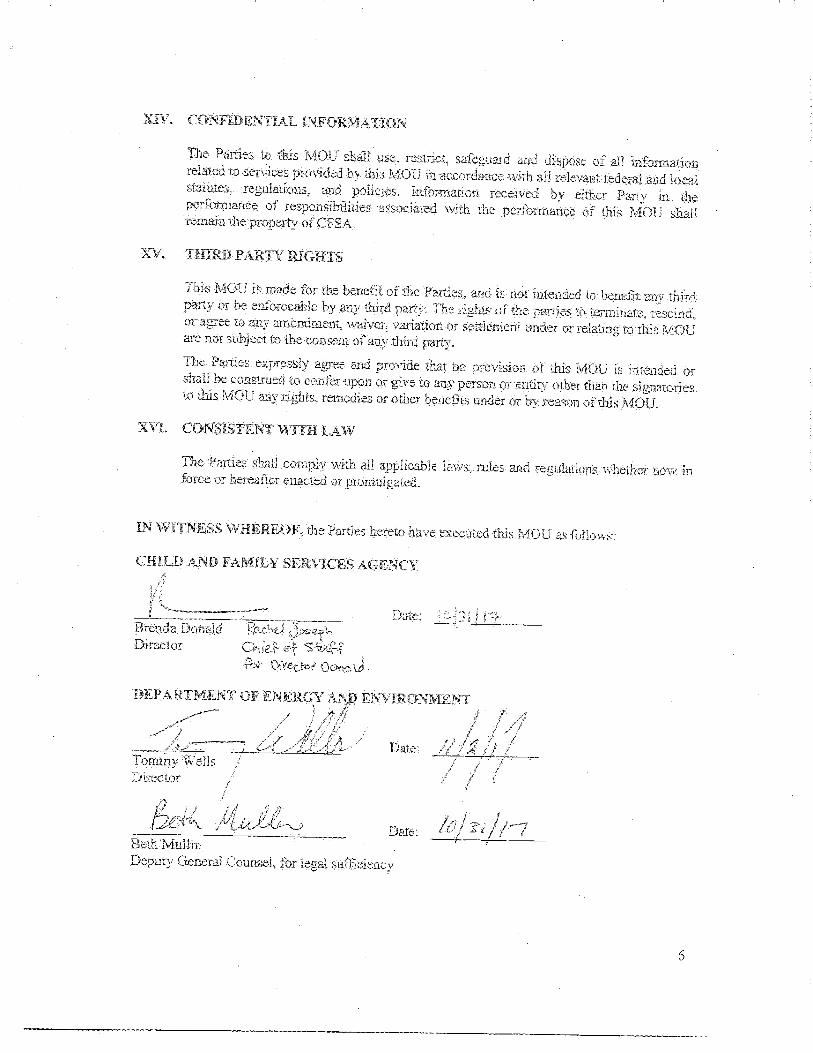
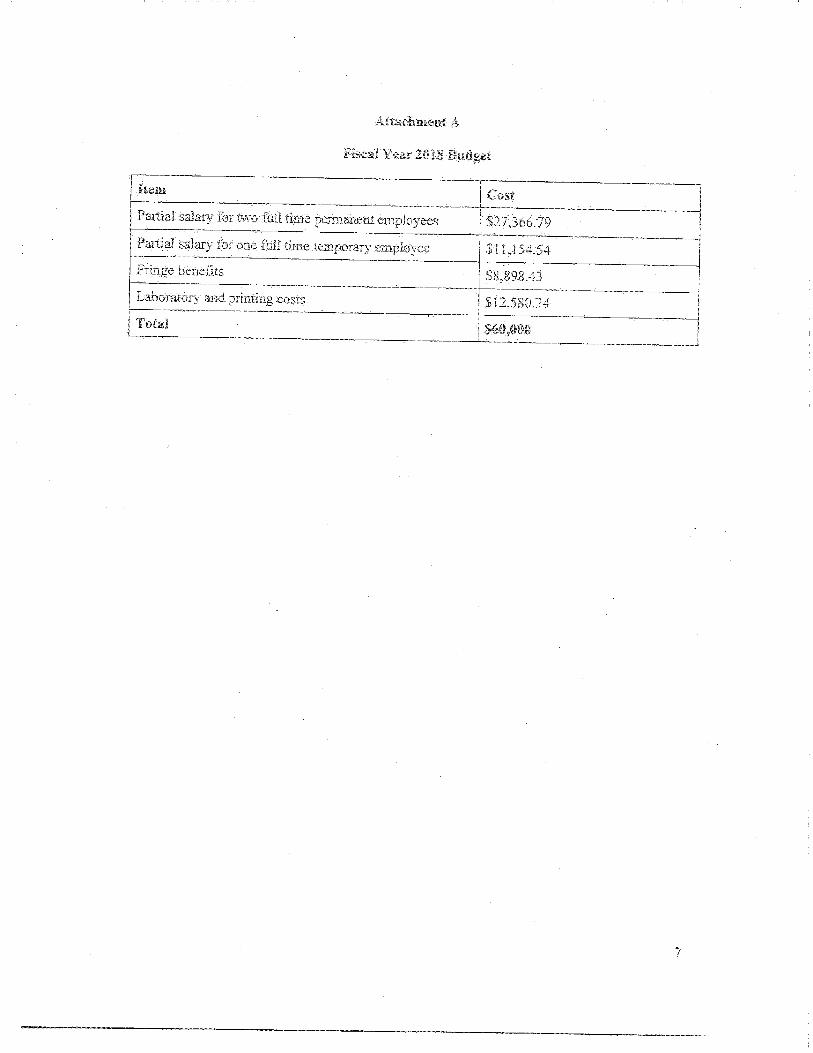

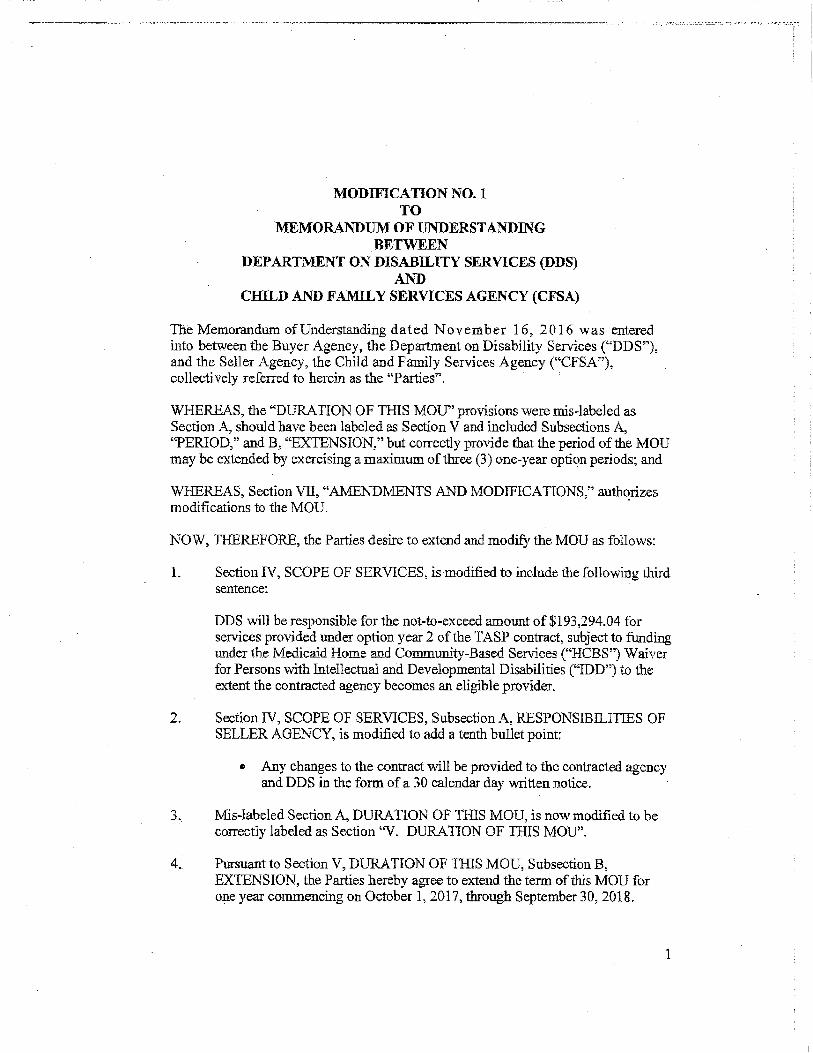
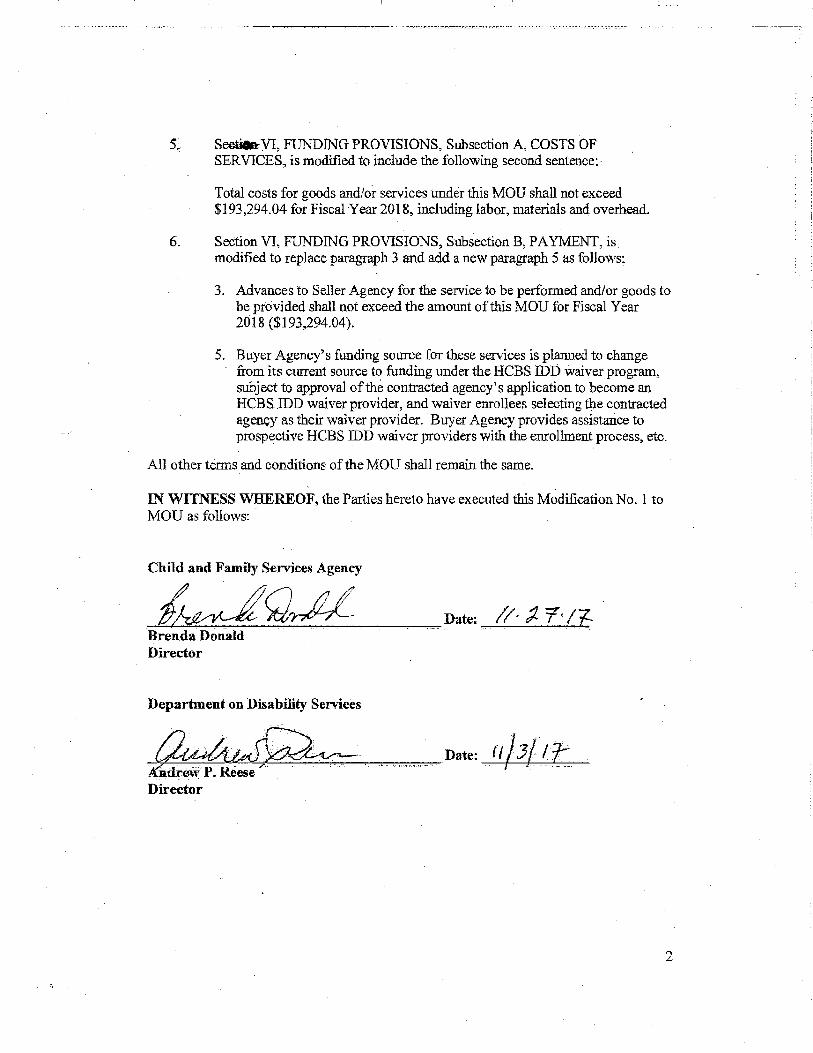
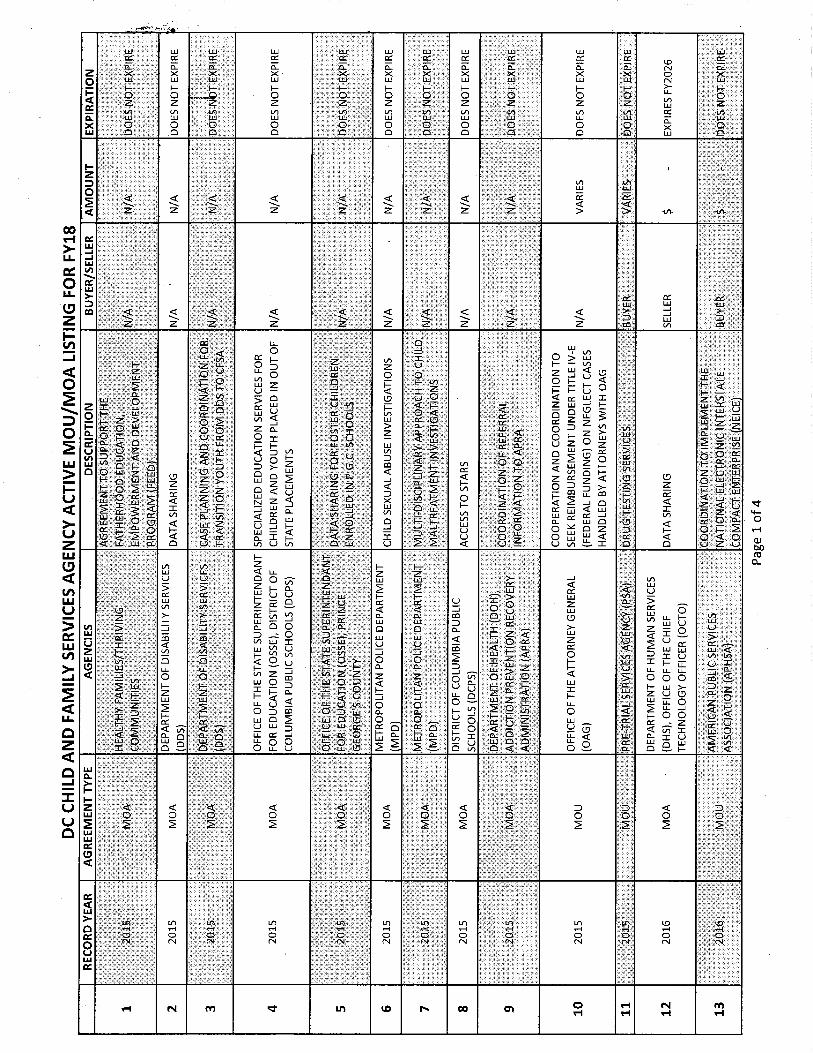
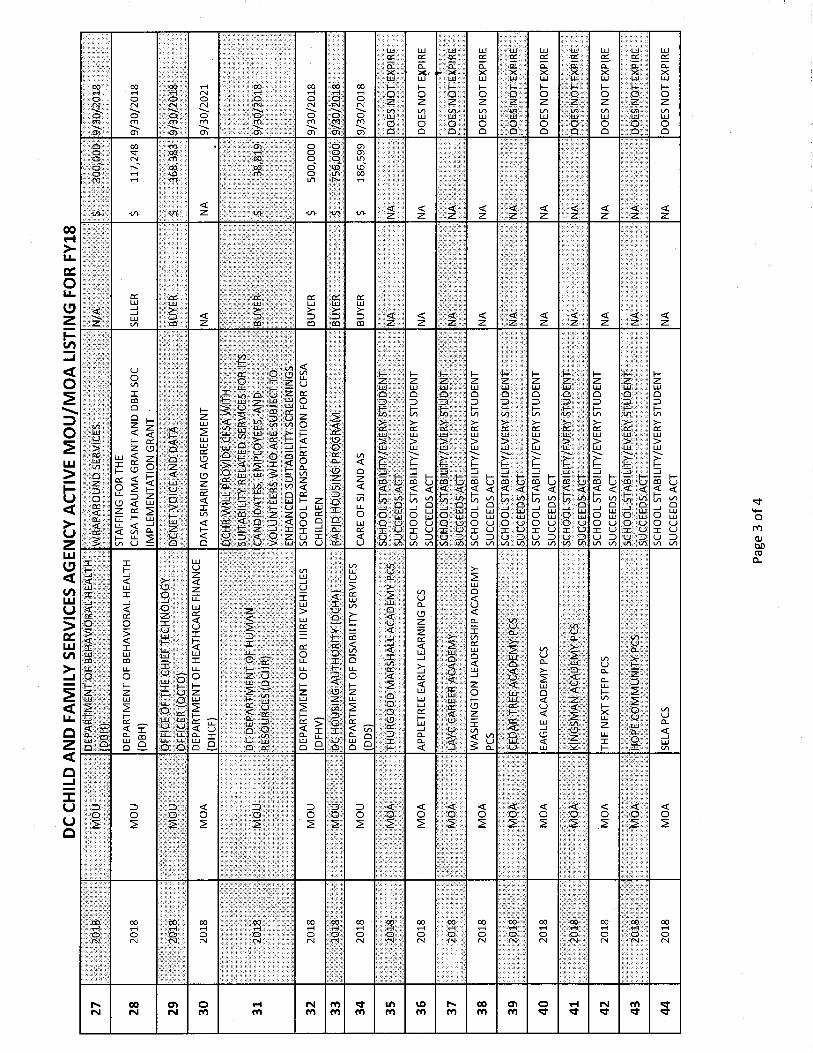
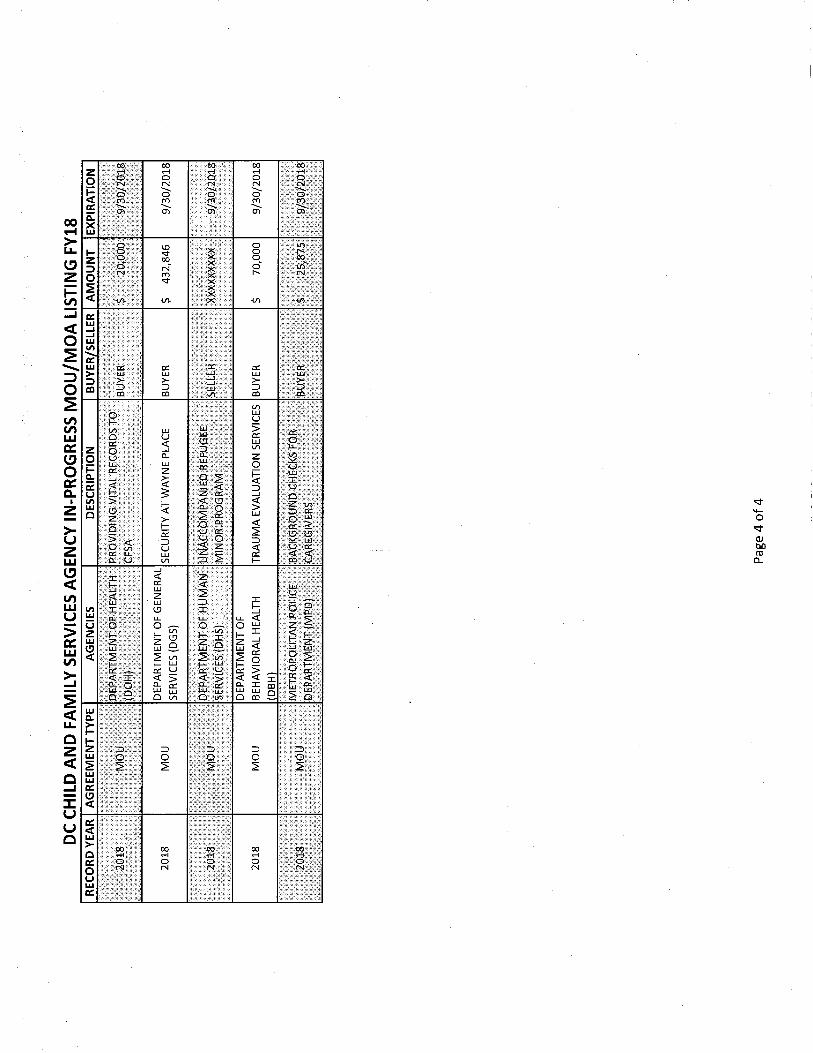


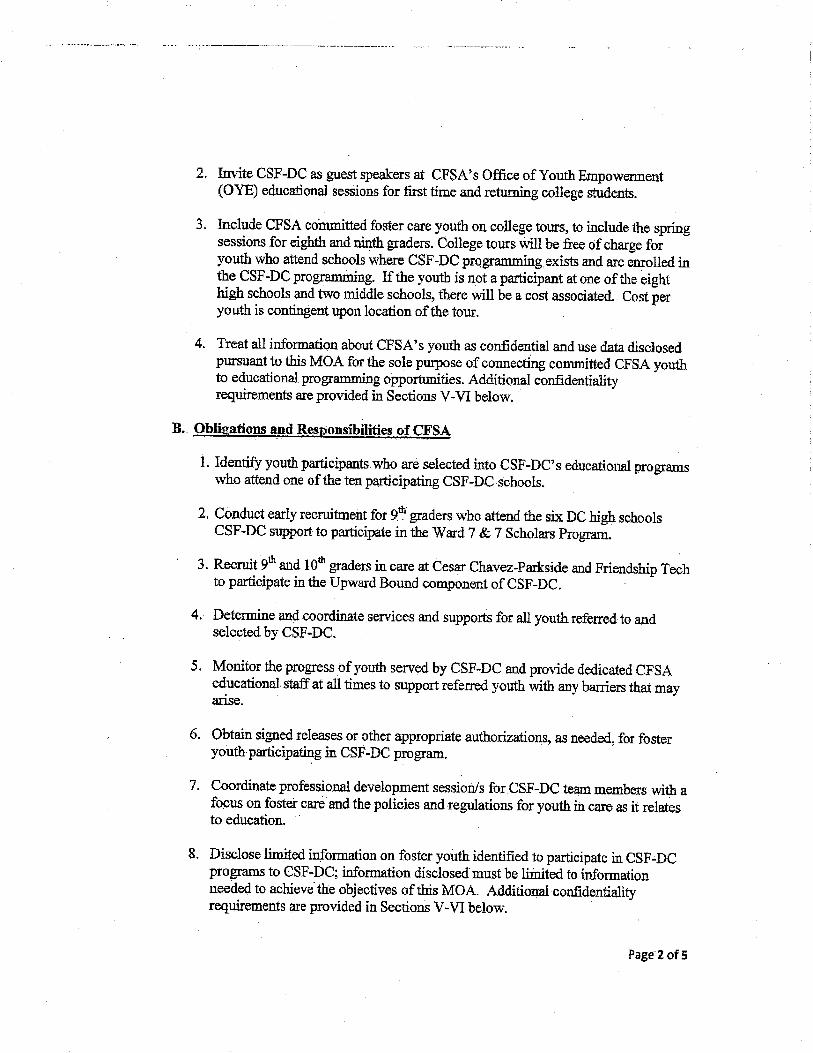
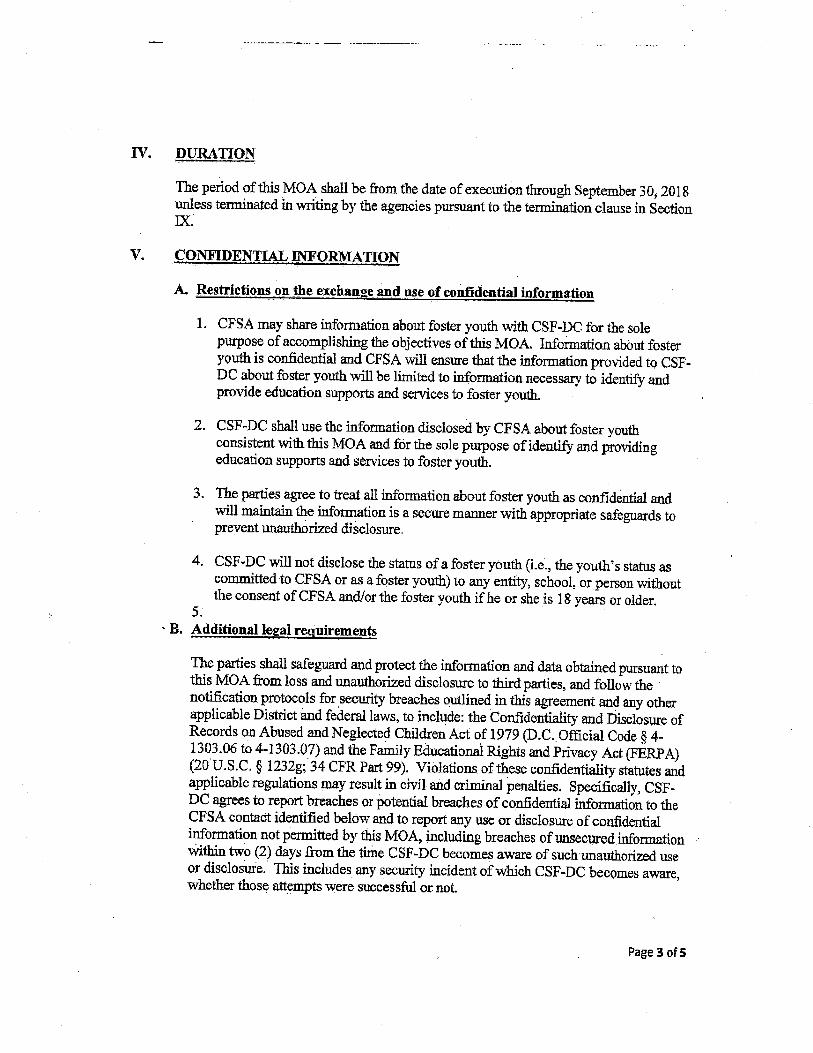
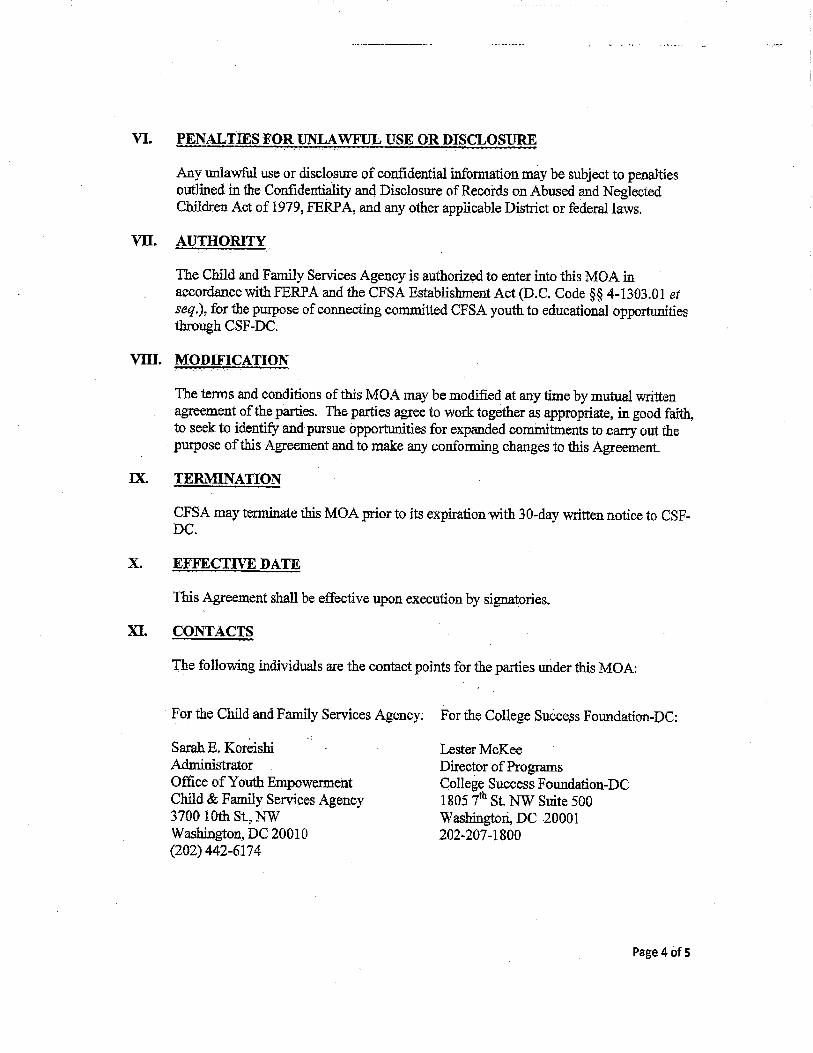
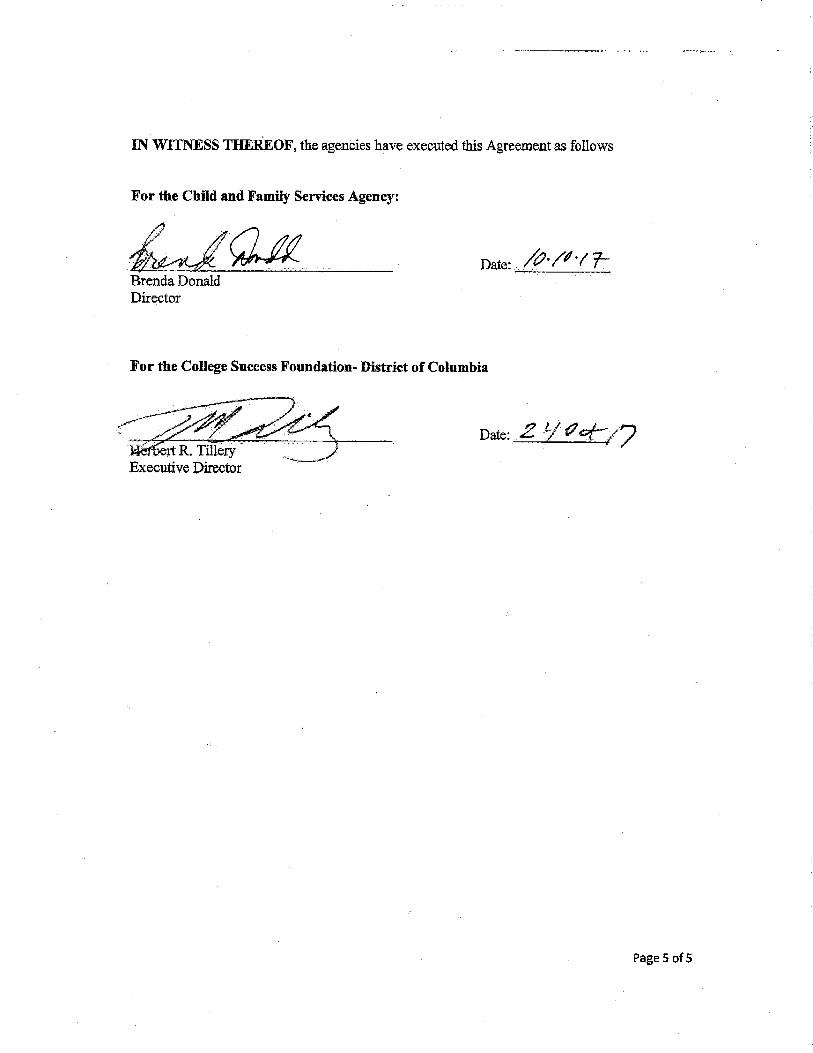


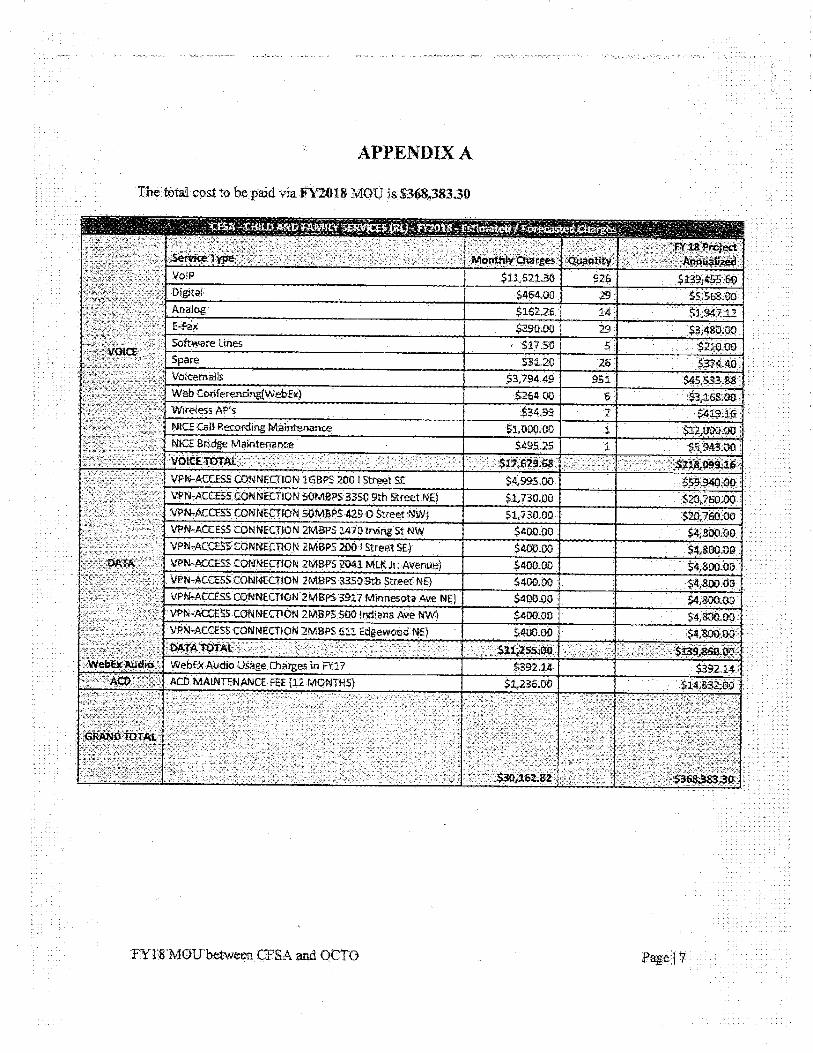


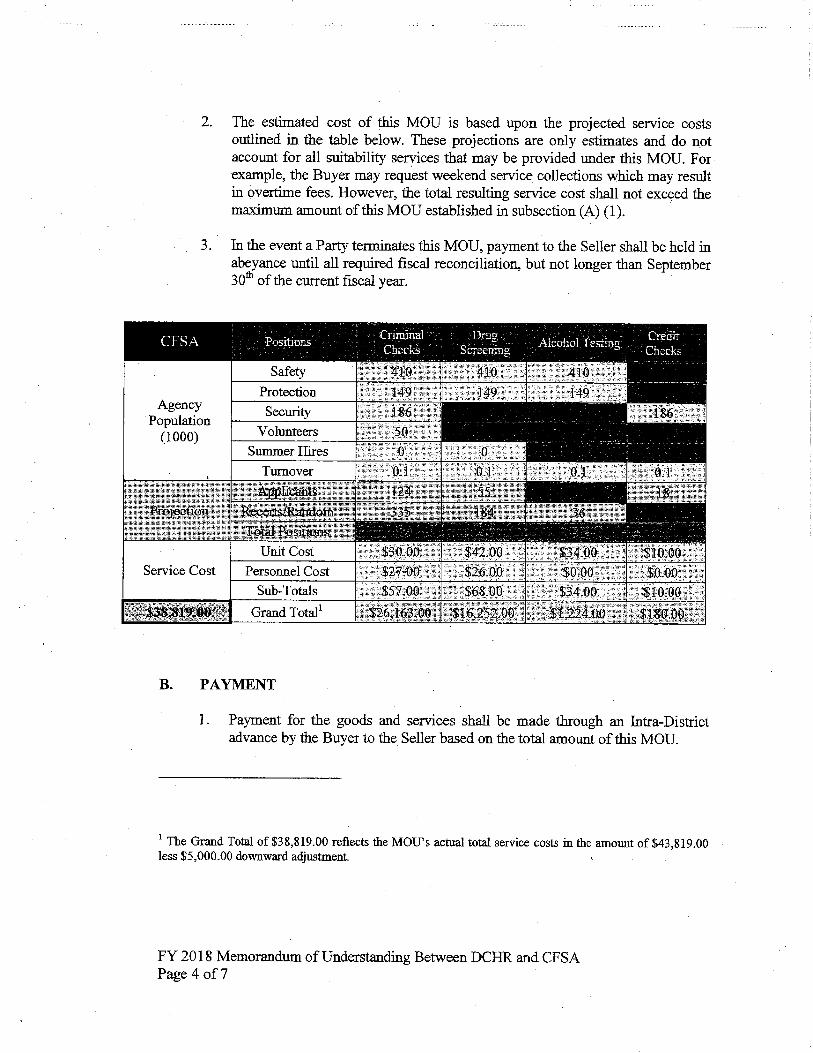

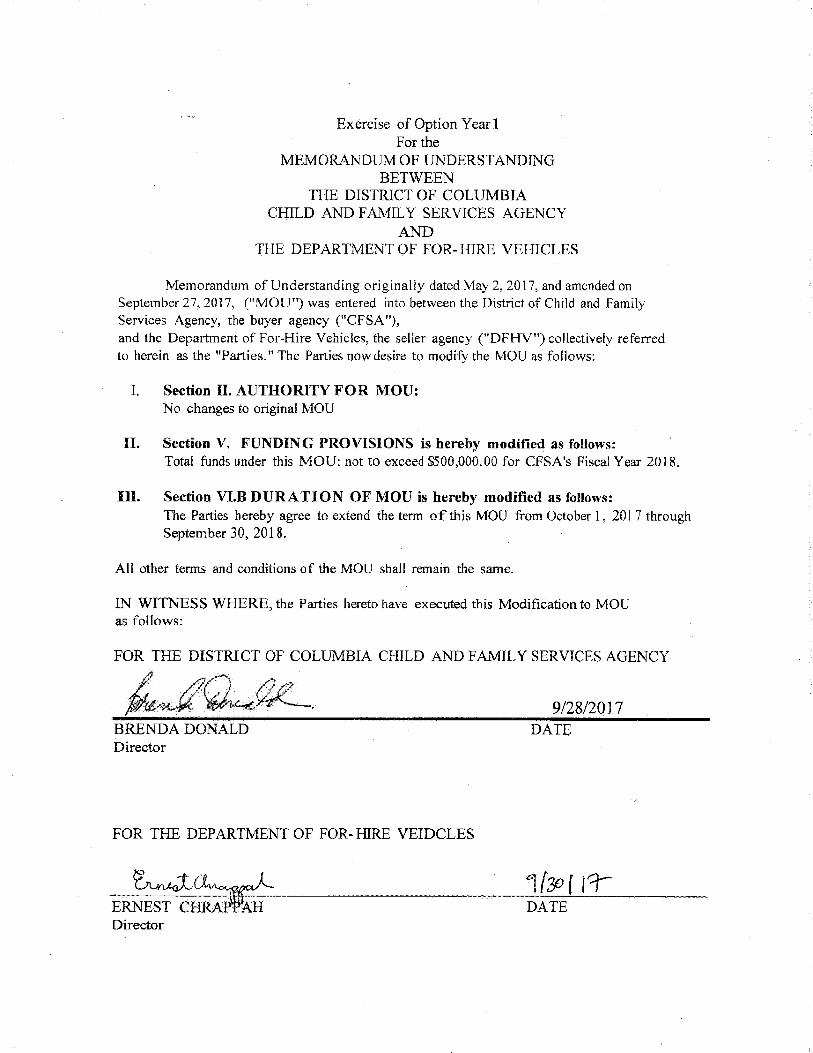


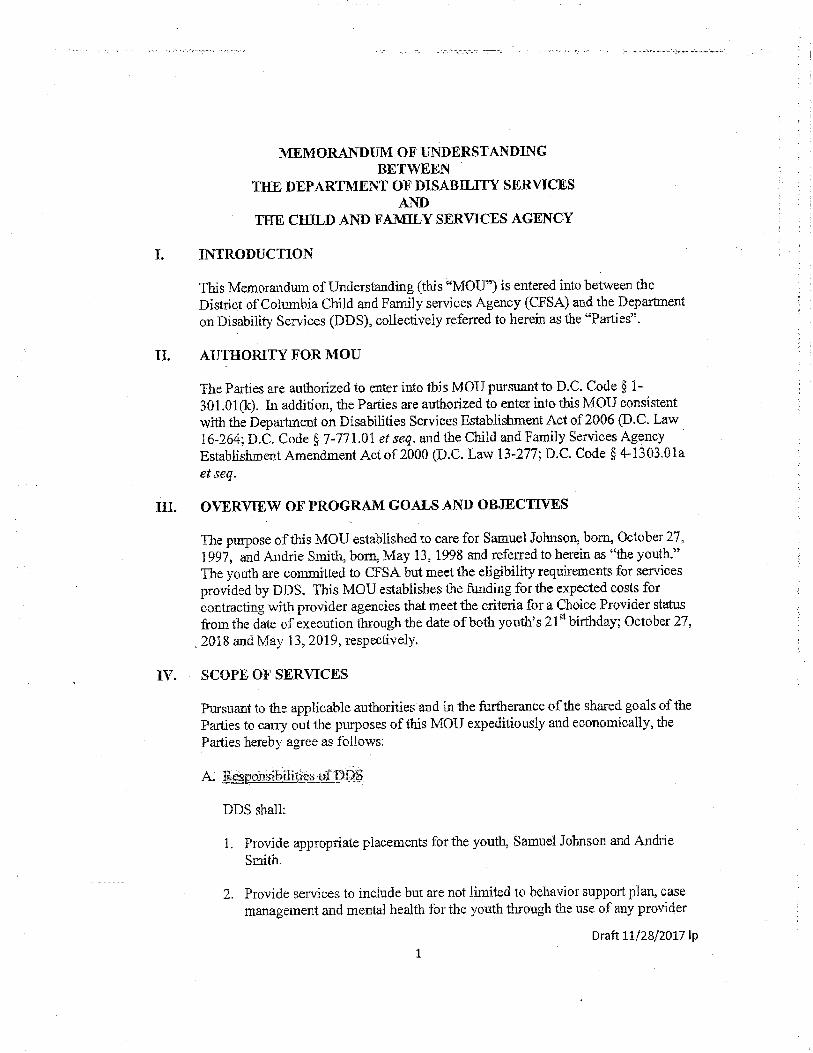
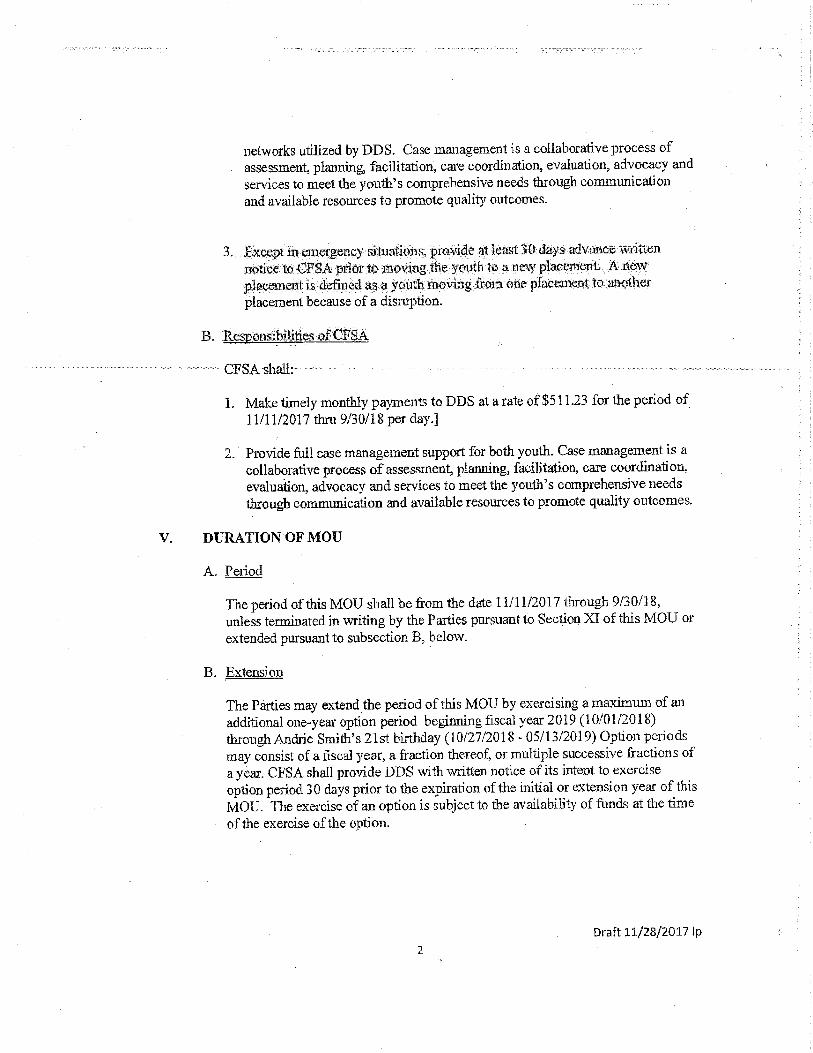
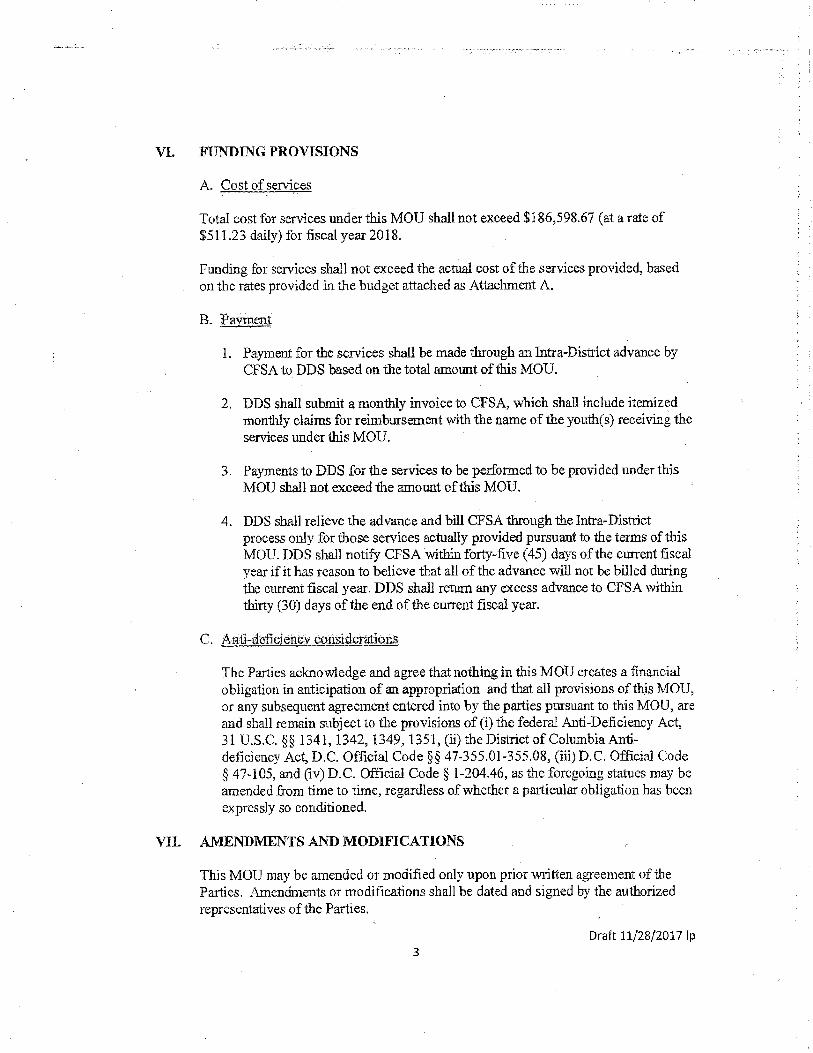
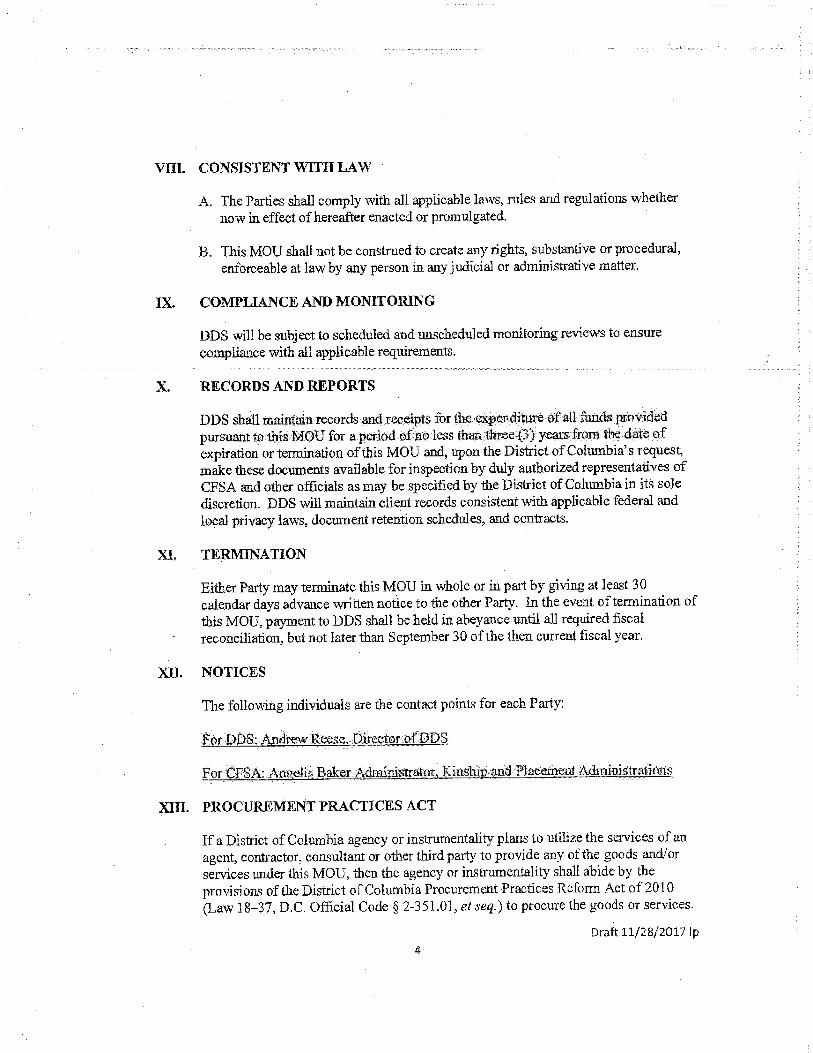
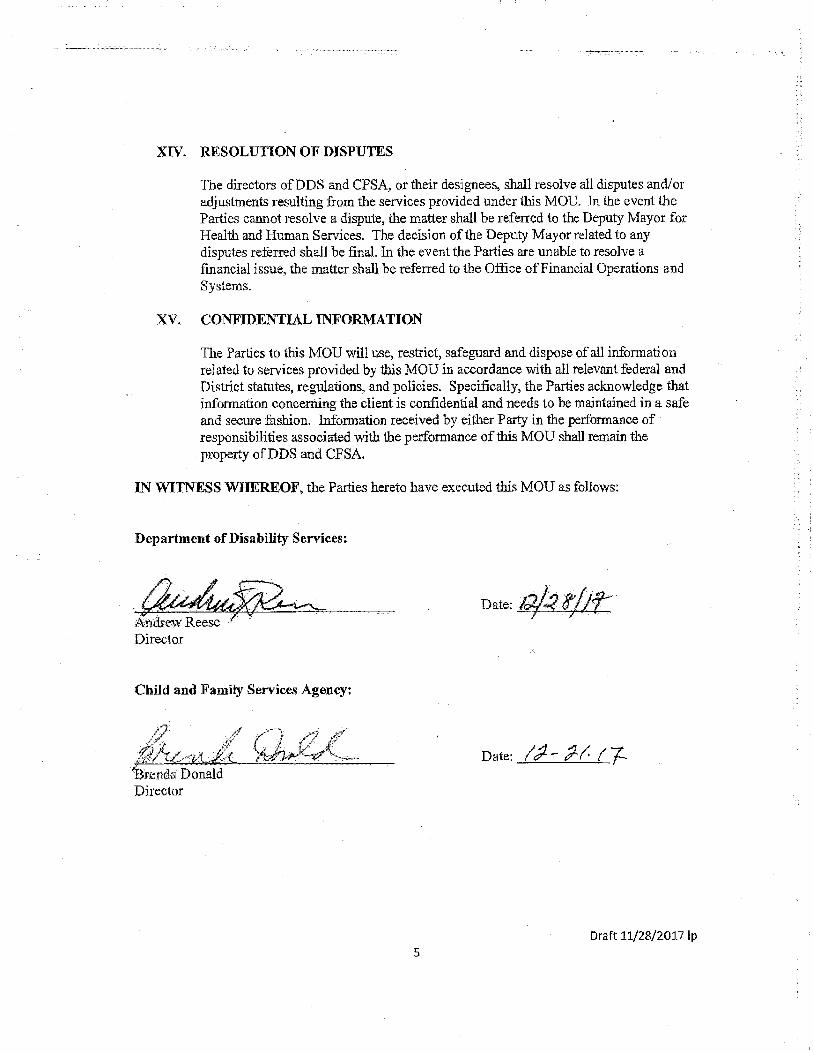

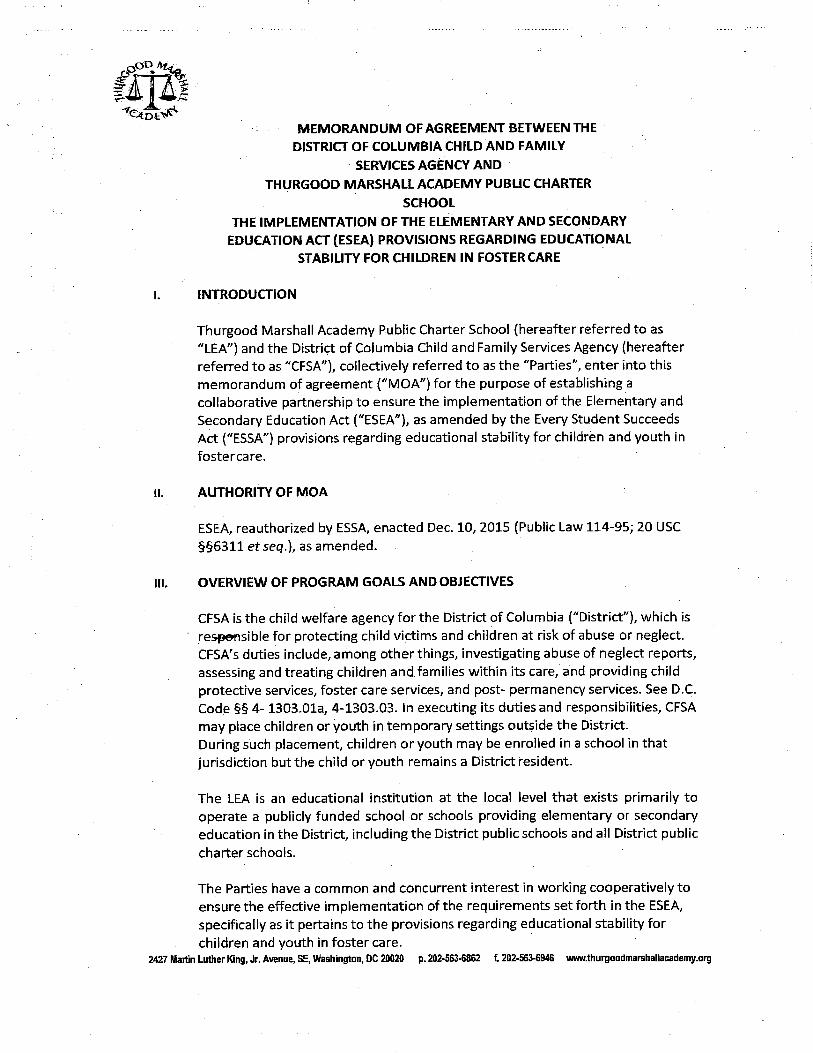
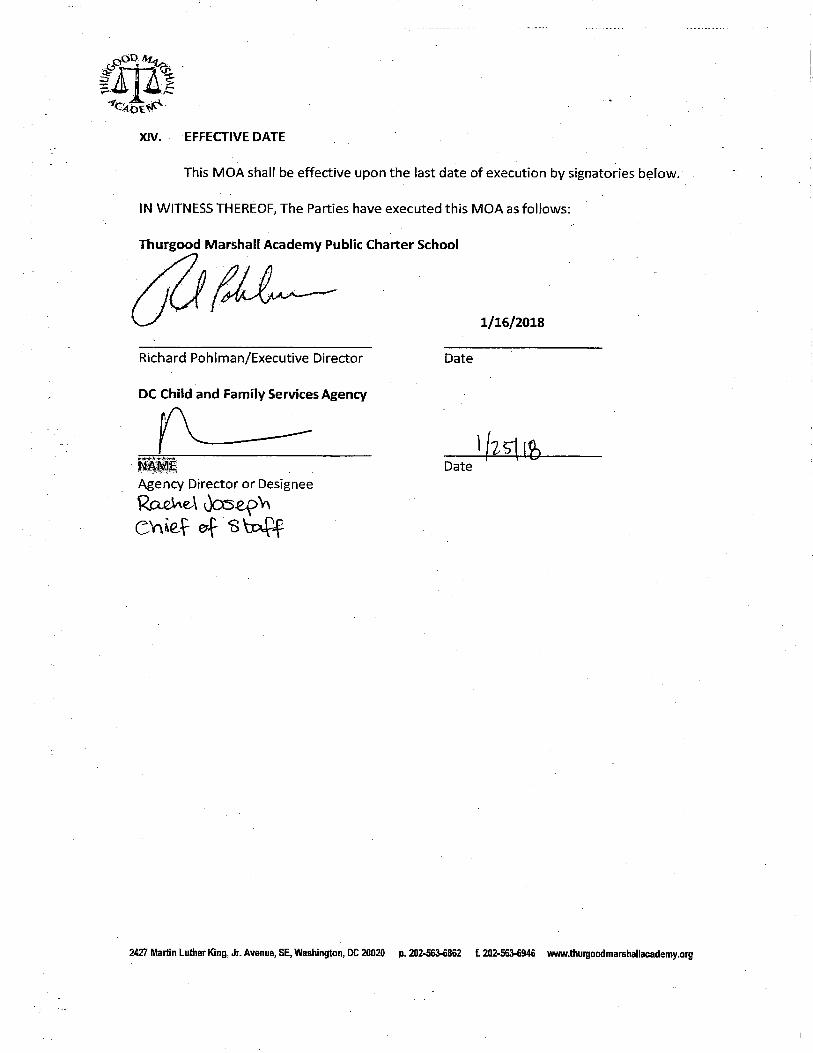

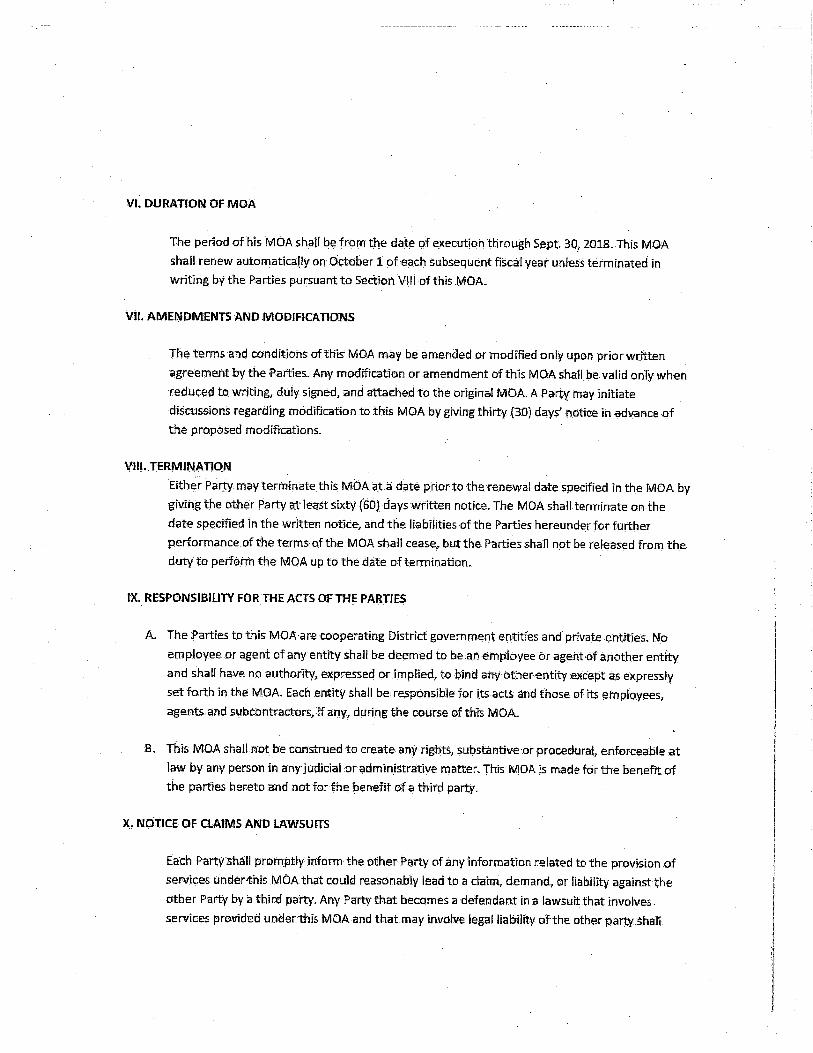
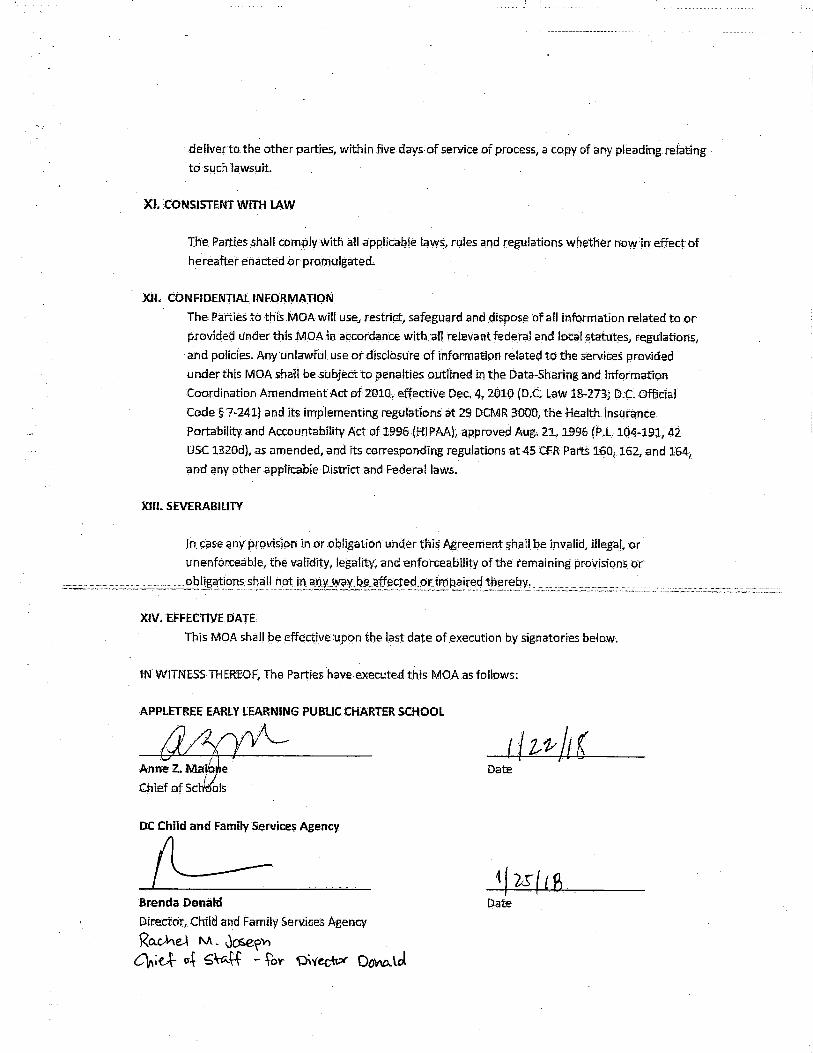

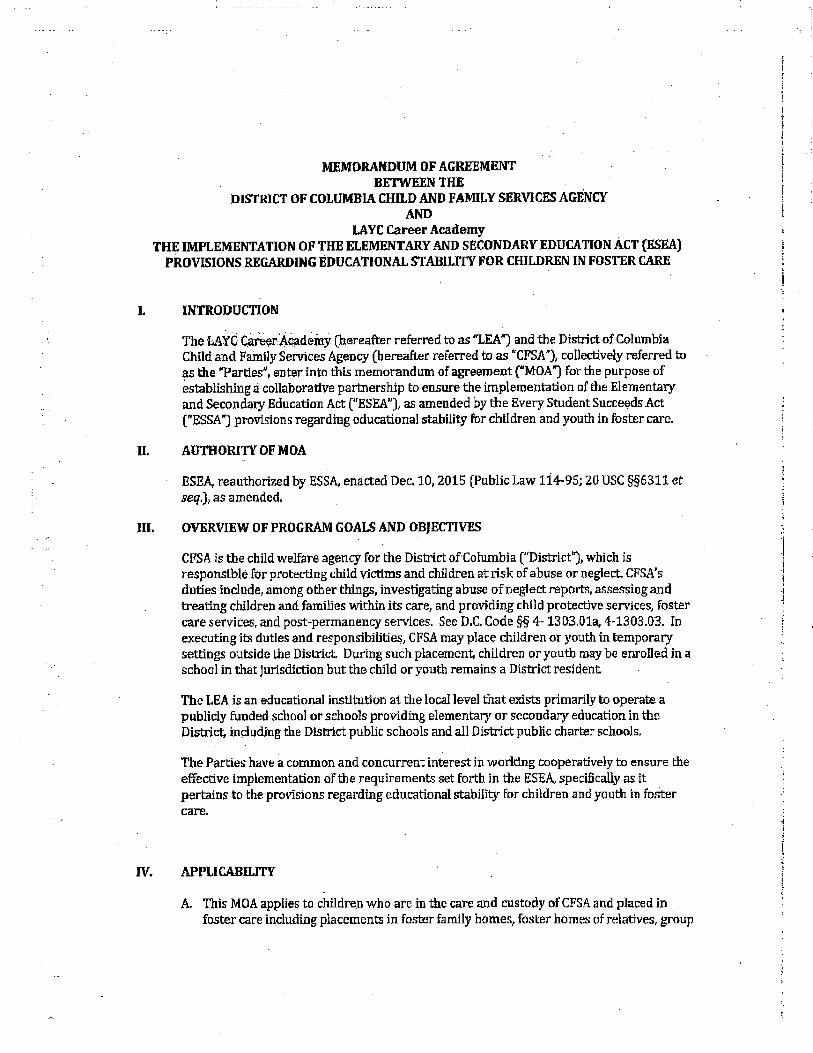
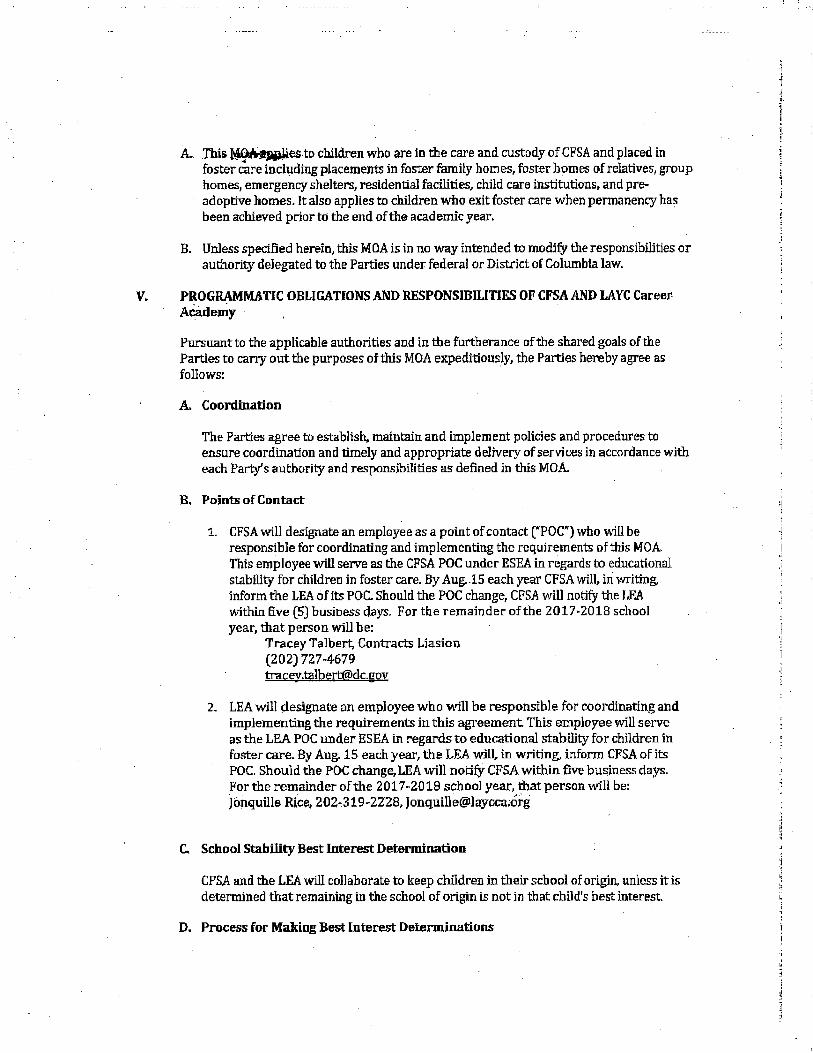
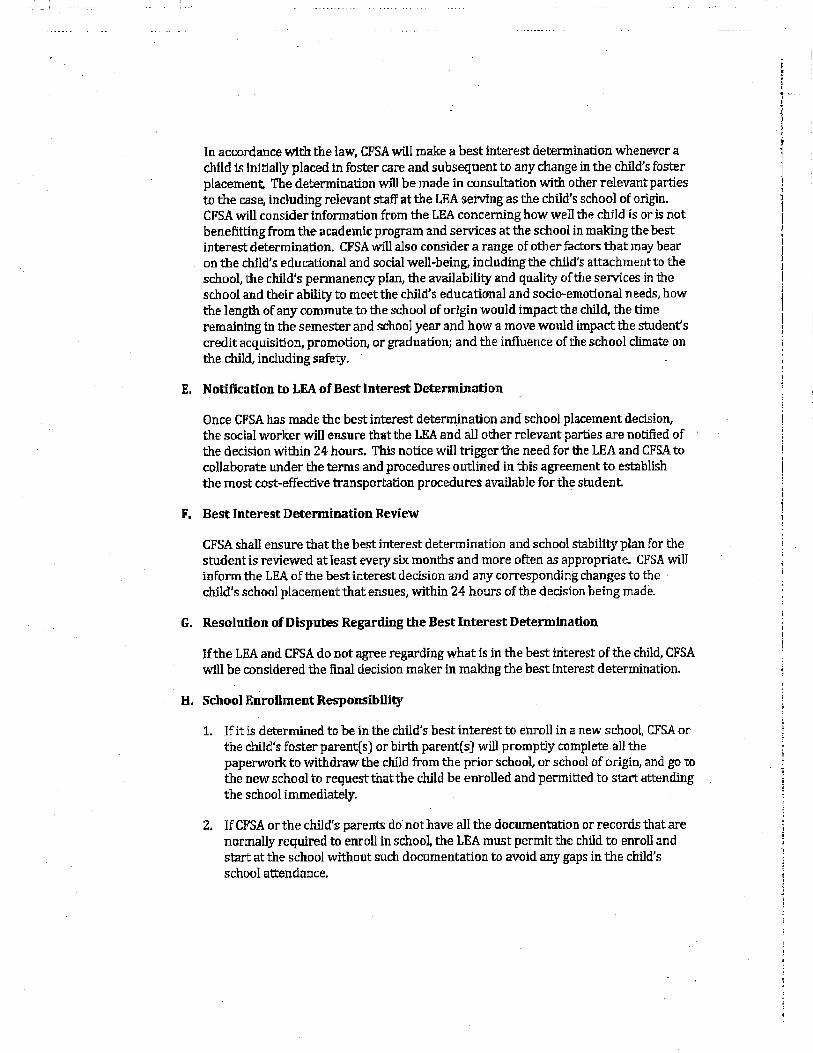
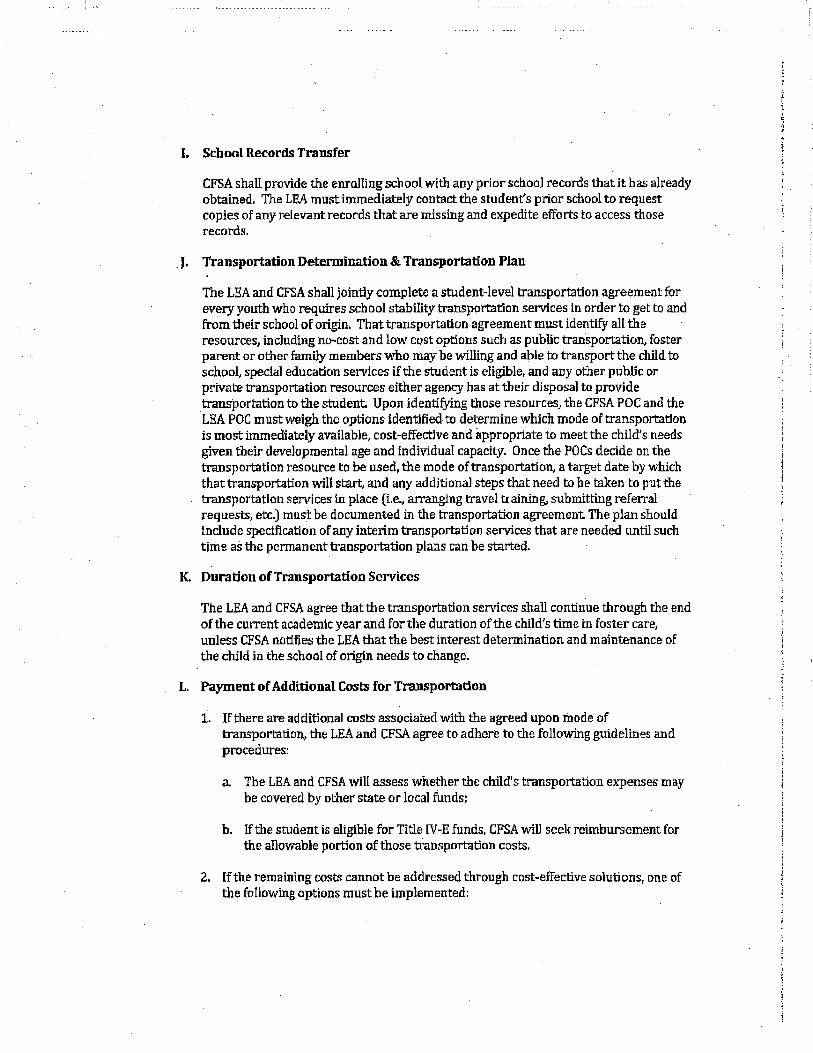
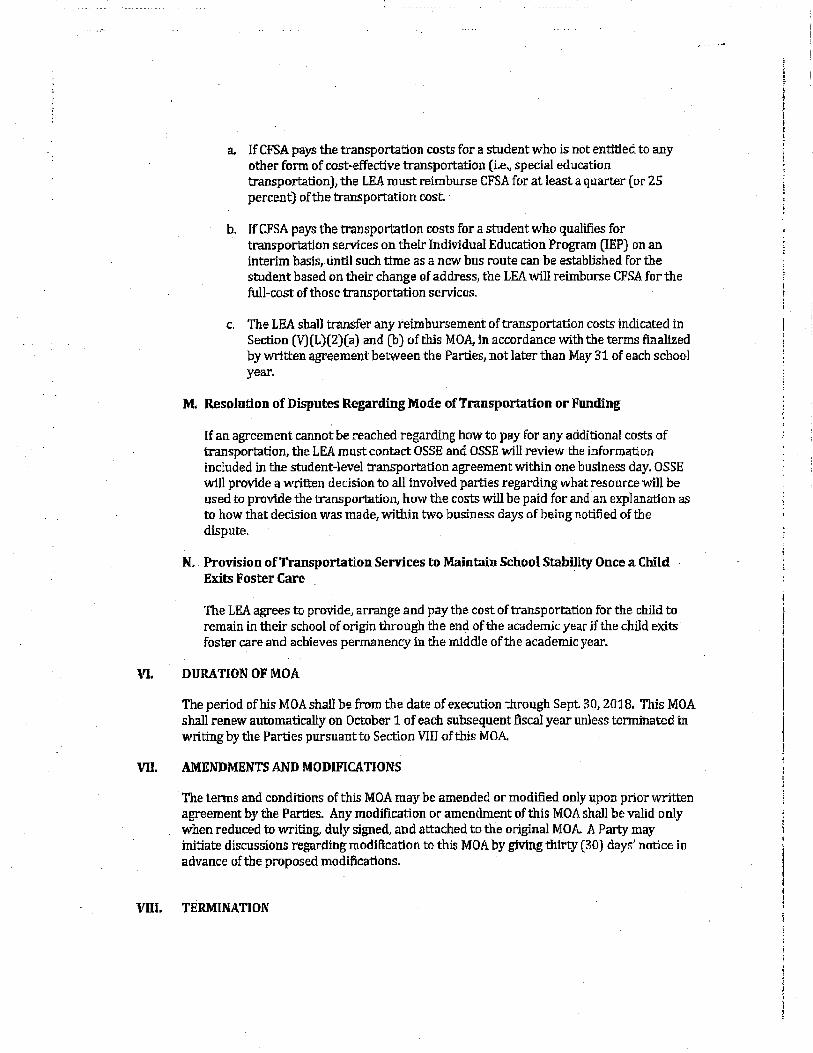
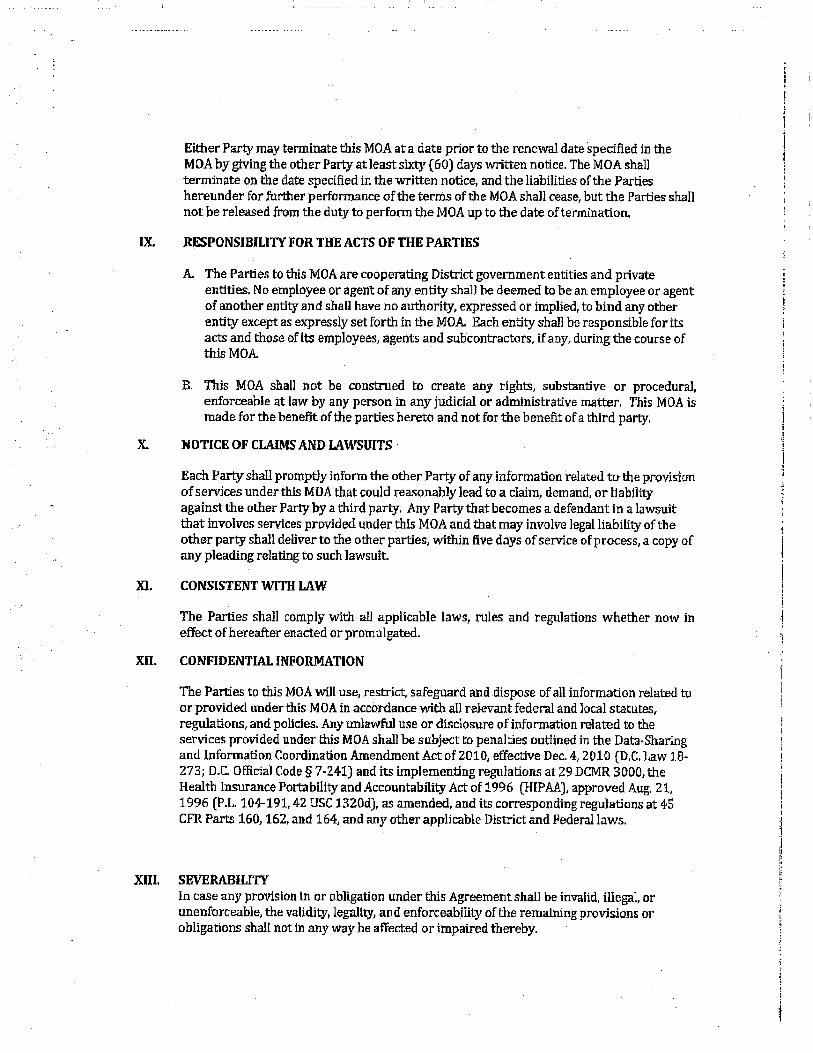

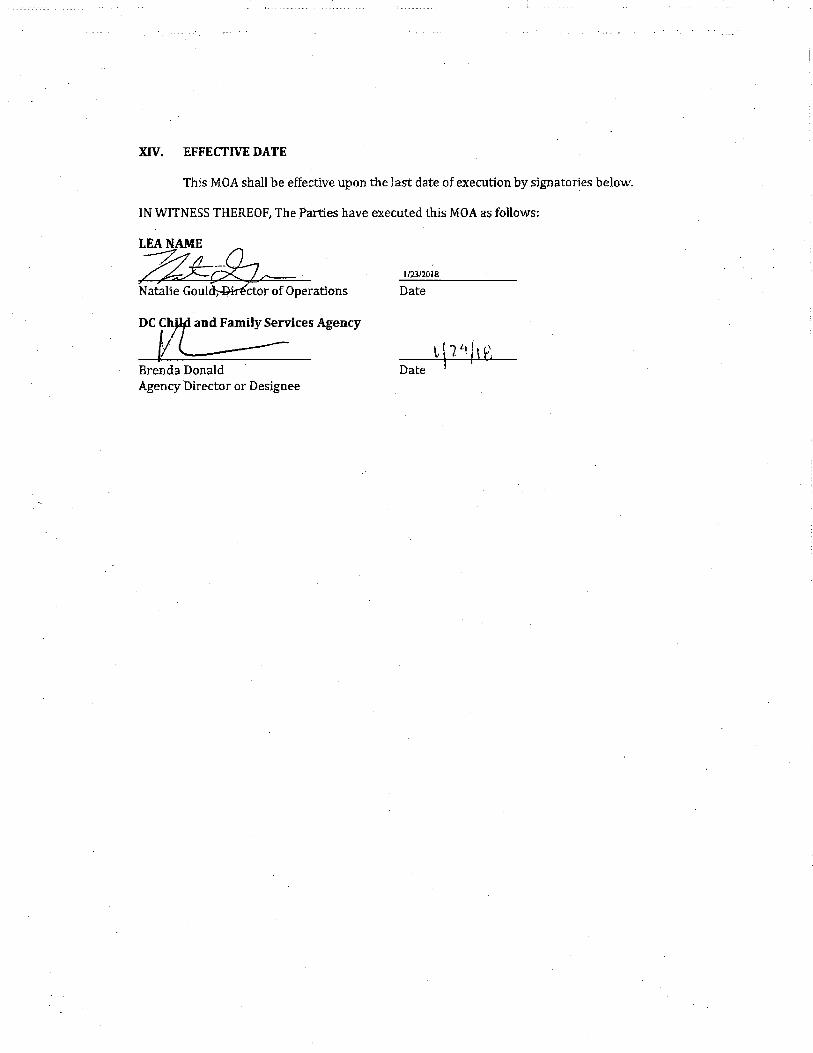


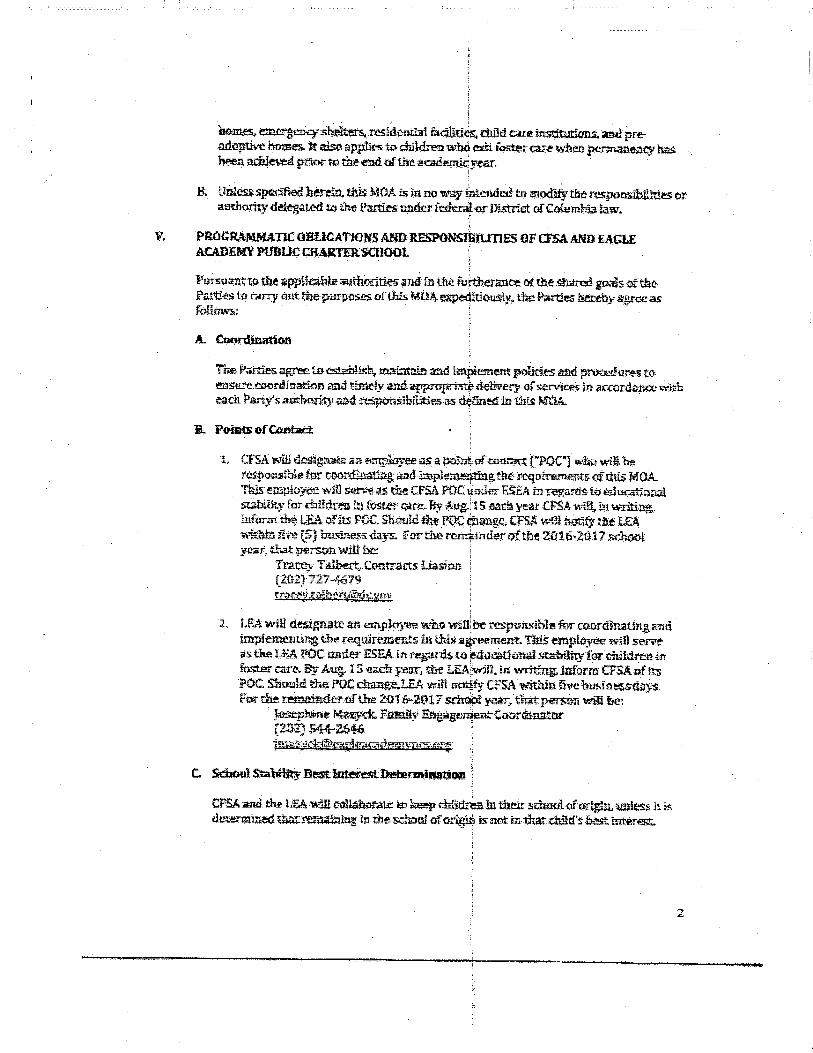
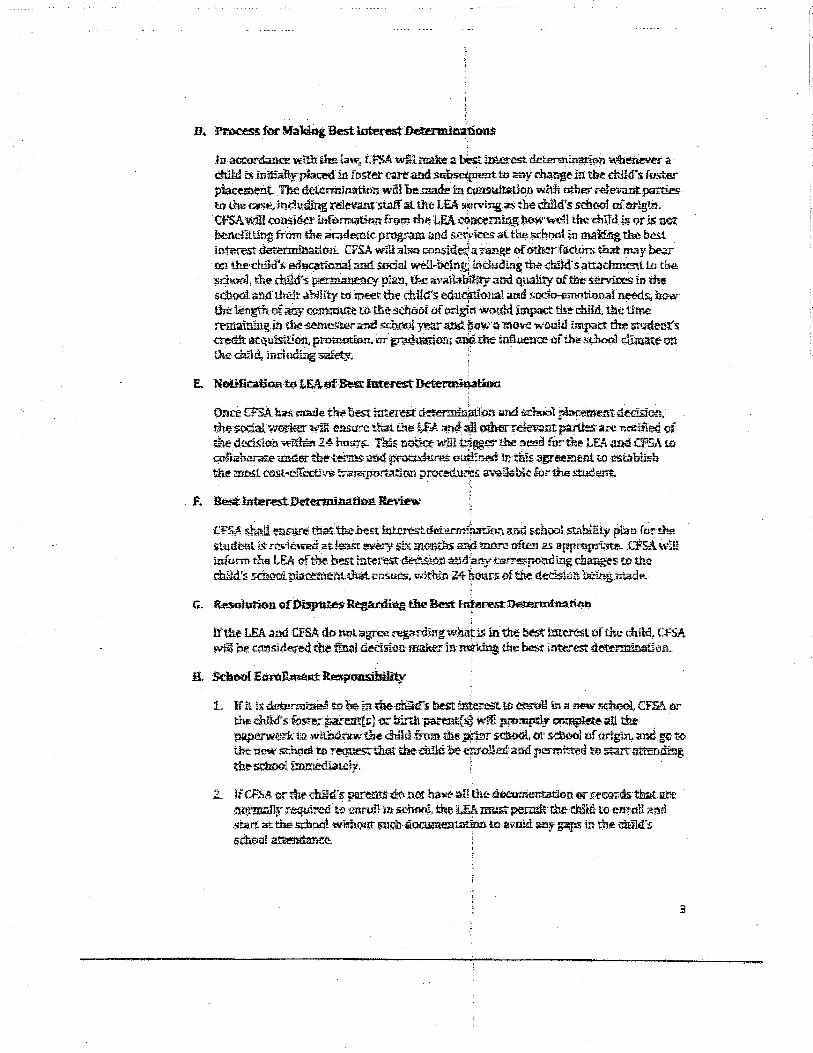
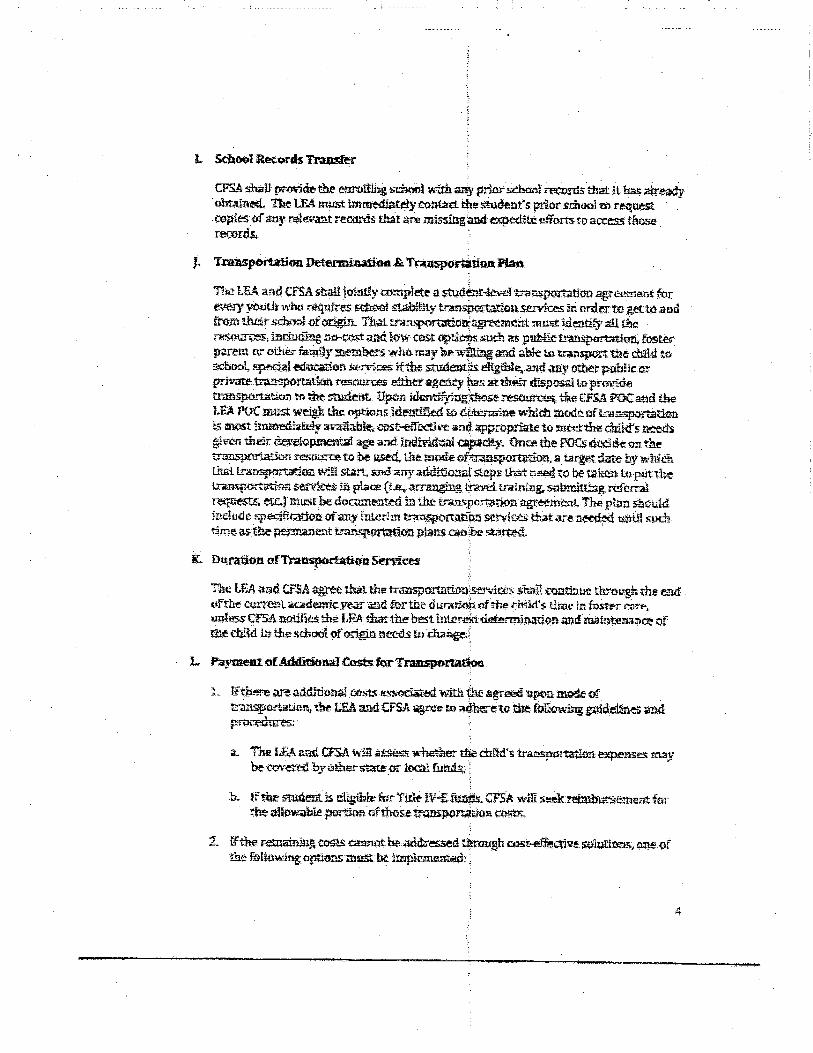
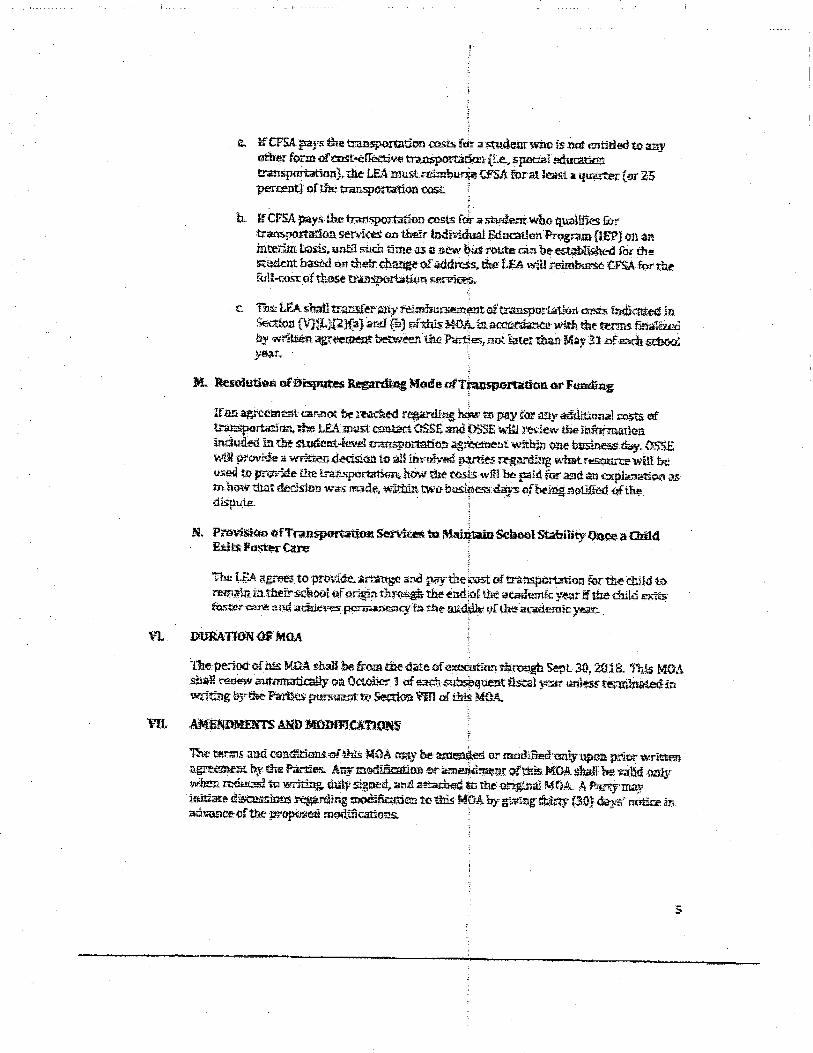
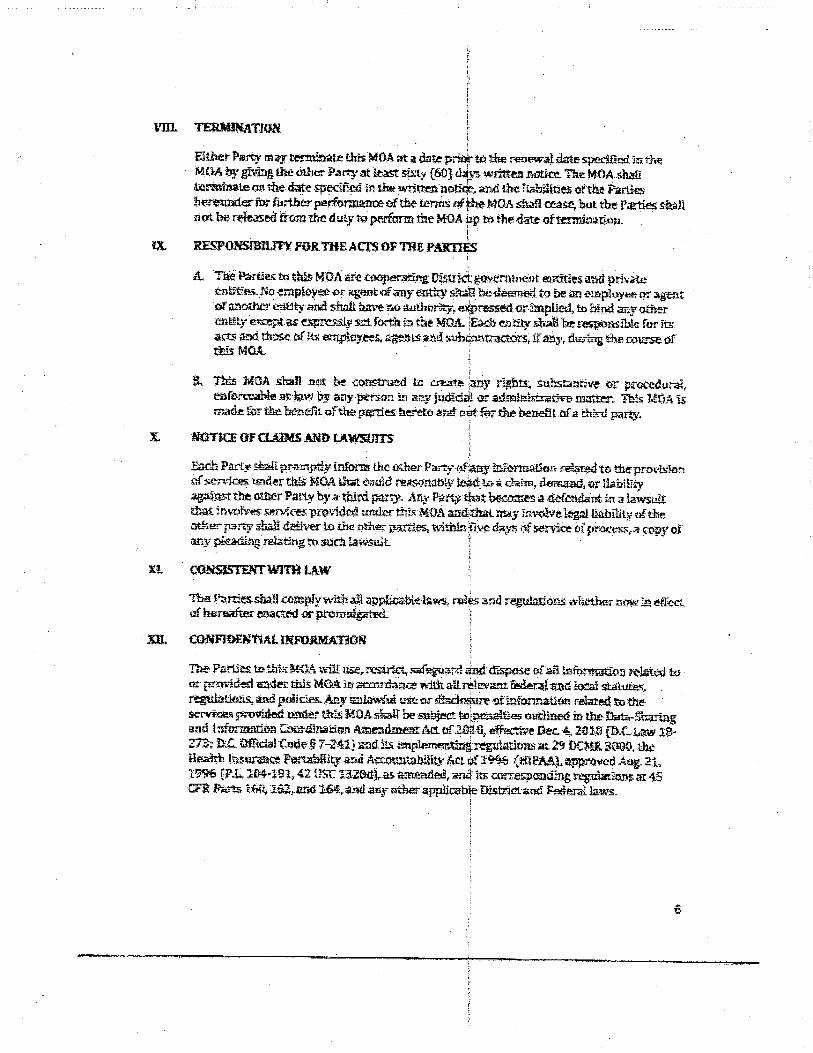
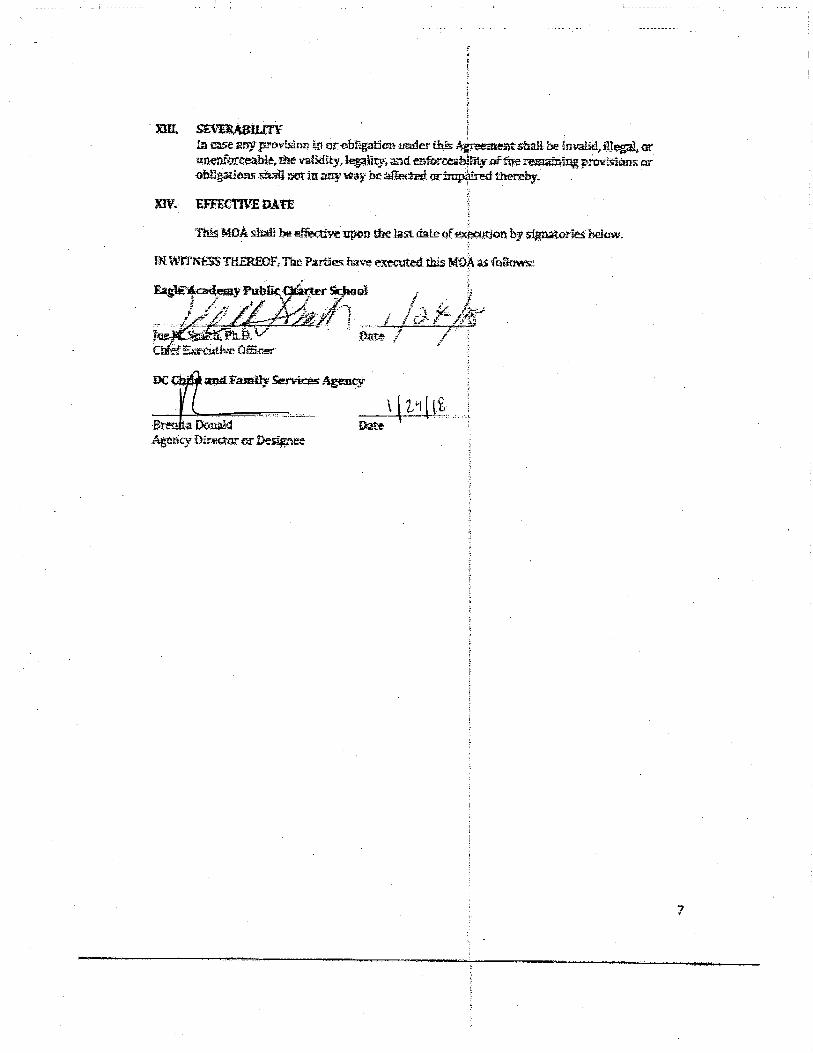


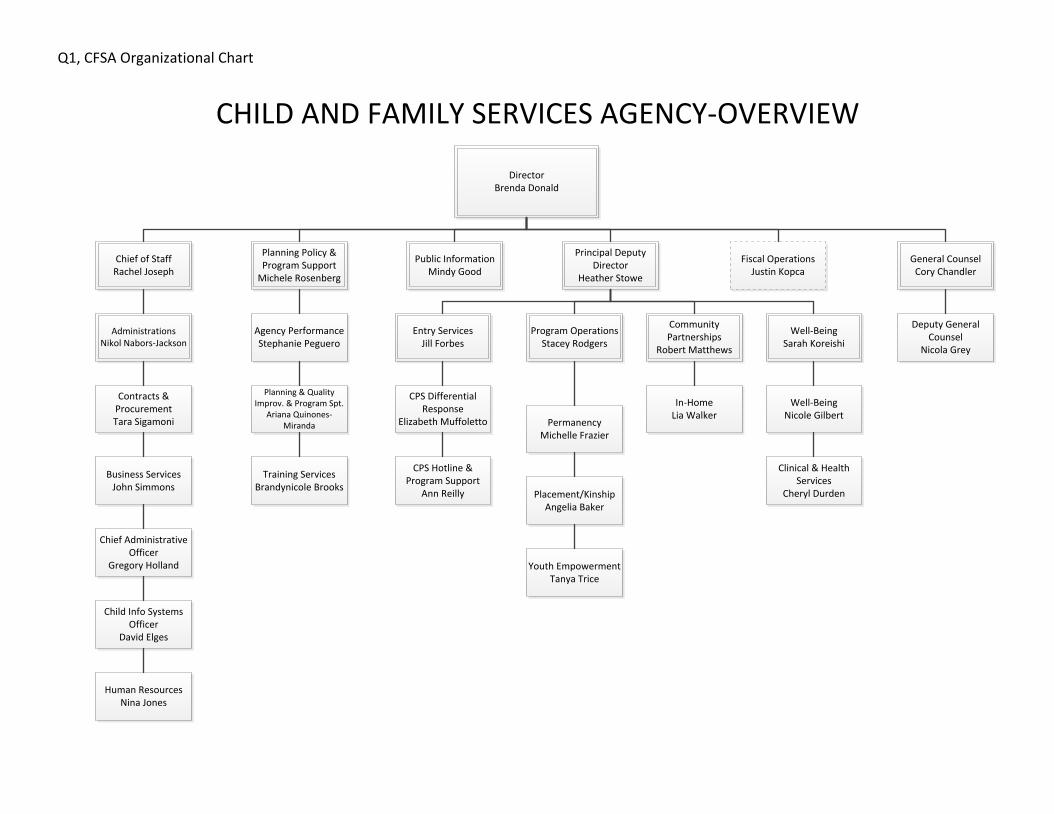
CHILD AND FAMILY SERVICES AGENCY-OVERVIEW
Director Brenda Donald
Public Information Mindy Good
Principal Deputy
Director Heather Stowe
Planning Policy & Program Support
Michele Rosenberg
Chief of StaffRachel Joseph
Fiscal OperationsJustin Kopca
AdministrationsNikol Nabors-Jackson
Contracts & Procurement Tara Sigamoni
Business ServicesJohn Simmons
Chief Administrative Officer
Gregory Holland
Child Info Systems Officer
David Elges
Human ResourcesNina Jones
Agency Performance Stephanie Peguero
Planning & Quality Improv. & Program Spt.
Ariana Quinones-Miranda
Training ServicesBrandynicole Brooks
Program OperationsStacey Rodgers
Community Partnerships
Robert Matthews
Entry ServicesJill Forbes
Well-BeingSarah Koreishi
CPS Differential Response
Elizabeth Muffoletto
CPS Hotline & Program Support
Ann Reilly
PermanencyMichelle Frazier
Placement/KinshipAngelia Baker
Youth EmpowermentTanya Trice
In-HomeLia Walker
General CounselCory Chandler
Well-BeingNicole Gilbert
Clinical & Health Services
Cheryl Durden
Deputy General Counsel
Nicola Grey
Q1, CFSA Organizational Chart
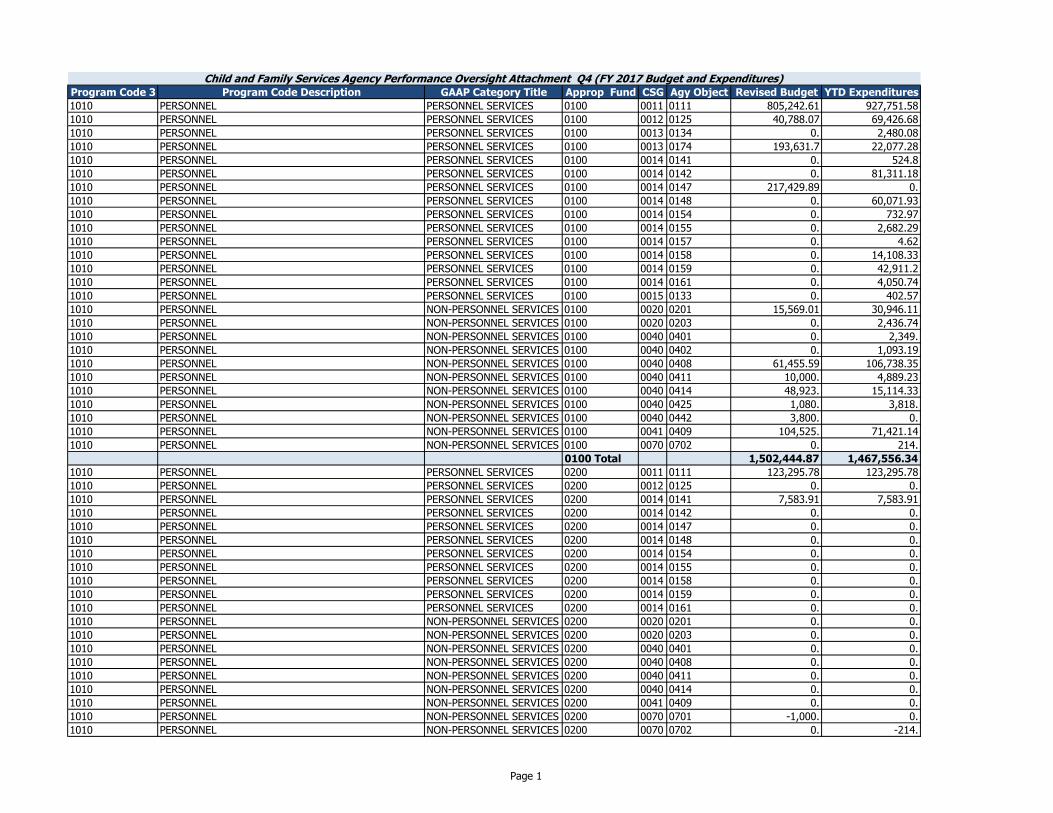
Program Code 3 Program Code Description GAAP Category Title Approp Fund CSG Agy Object Revised Budget YTD Expenditures
1010 PERSONNEL PERSONNEL SERVICES 0100 0011 0111 805,242.61 927,751.58
1010 PERSONNEL PERSONNEL SERVICES 0100 0012 0125 40,788.07 69,426.68
1010 PERSONNEL PERSONNEL SERVICES 0100 0013 0134 0. 2,480.08
1010 PERSONNEL PERSONNEL SERVICES 0100 0013 0174 193,631.7 22,077.28
1010 PERSONNEL PERSONNEL SERVICES 0100 0014 0141 0. 524.8
1010 PERSONNEL PERSONNEL SERVICES 0100 0014 0142 0. 81,311.18
1010 PERSONNEL PERSONNEL SERVICES 0100 0014 0147 217,429.89 0.
1010 PERSONNEL PERSONNEL SERVICES 0100 0014 0148 0. 60,071.93
1010 PERSONNEL PERSONNEL SERVICES 0100 0014 0154 0. 732.97
1010 PERSONNEL PERSONNEL SERVICES 0100 0014 0155 0. 2,682.29
1010 PERSONNEL PERSONNEL SERVICES 0100 0014 0157 0. 4.62
1010 PERSONNEL PERSONNEL SERVICES 0100 0014 0158 0. 14,108.33
1010 PERSONNEL PERSONNEL SERVICES 0100 0014 0159 0. 42,911.2
1010 PERSONNEL PERSONNEL SERVICES 0100 0014 0161 0. 4,050.74
1010 PERSONNEL PERSONNEL SERVICES 0100 0015 0133 0. 402.57
1010 PERSONNEL NON-PERSONNEL SERVICES 0100 0020 0201 15,569.01 30,946.11
1010 PERSONNEL NON-PERSONNEL SERVICES 0100 0020 0203 0. 2,436.74
1010 PERSONNEL NON-PERSONNEL SERVICES 0100 0040 0401 0. 2,349.
1010 PERSONNEL NON-PERSONNEL SERVICES 0100 0040 0402 0. 1,093.19
1010 PERSONNEL NON-PERSONNEL SERVICES 0100 0040 0408 61,455.59 106,738.35
1010 PERSONNEL NON-PERSONNEL SERVICES 0100 0040 0411 10,000. 4,889.23
1010 PERSONNEL NON-PERSONNEL SERVICES 0100 0040 0414 48,923. 15,114.33
1010 PERSONNEL NON-PERSONNEL SERVICES 0100 0040 0425 1,080. 3,818.
1010 PERSONNEL NON-PERSONNEL SERVICES 0100 0040 0442 3,800. 0.
1010 PERSONNEL NON-PERSONNEL SERVICES 0100 0041 0409 104,525. 71,421.14
1010 PERSONNEL NON-PERSONNEL SERVICES 0100 0070 0702 0. 214.
0100 Total 1,502,444.87 1,467,556.34
1010 PERSONNEL PERSONNEL SERVICES 0200 0011 0111 123,295.78 123,295.78
1010 PERSONNEL PERSONNEL SERVICES 0200 0012 0125 0. 0.
1010 PERSONNEL PERSONNEL SERVICES 0200 0014 0141 7,583.91 7,583.91
1010 PERSONNEL PERSONNEL SERVICES 0200 0014 0142 0. 0.
1010 PERSONNEL PERSONNEL SERVICES 0200 0014 0147 0. 0.
1010 PERSONNEL PERSONNEL SERVICES 0200 0014 0148 0. 0.
1010 PERSONNEL PERSONNEL SERVICES 0200 0014 0154 0. 0.
1010 PERSONNEL PERSONNEL SERVICES 0200 0014 0155 0. 0.
1010 PERSONNEL PERSONNEL SERVICES 0200 0014 0158 0. 0.
1010 PERSONNEL PERSONNEL SERVICES 0200 0014 0159 0. 0.
1010 PERSONNEL PERSONNEL SERVICES 0200 0014 0161 0. 0.
1010 PERSONNEL NON-PERSONNEL SERVICES 0200 0020 0201 0. 0.
1010 PERSONNEL NON-PERSONNEL SERVICES 0200 0020 0203 0. 0.
1010 PERSONNEL NON-PERSONNEL SERVICES 0200 0040 0401 0. 0.
1010 PERSONNEL NON-PERSONNEL SERVICES 0200 0040 0408 0. 0.
1010 PERSONNEL NON-PERSONNEL SERVICES 0200 0040 0411 0. 0.
1010 PERSONNEL NON-PERSONNEL SERVICES 0200 0040 0414 0. 0.
1010 PERSONNEL NON-PERSONNEL SERVICES 0200 0041 0409 0. 0.
1010 PERSONNEL NON-PERSONNEL SERVICES 0200 0070 0701 -1,000. 0.
1010 PERSONNEL NON-PERSONNEL SERVICES 0200 0070 0702 0. -214.
Child and Family Services Agency Performance Oversight Attachment Q4 (FY 2017 Budget and Expenditures)
Page 1
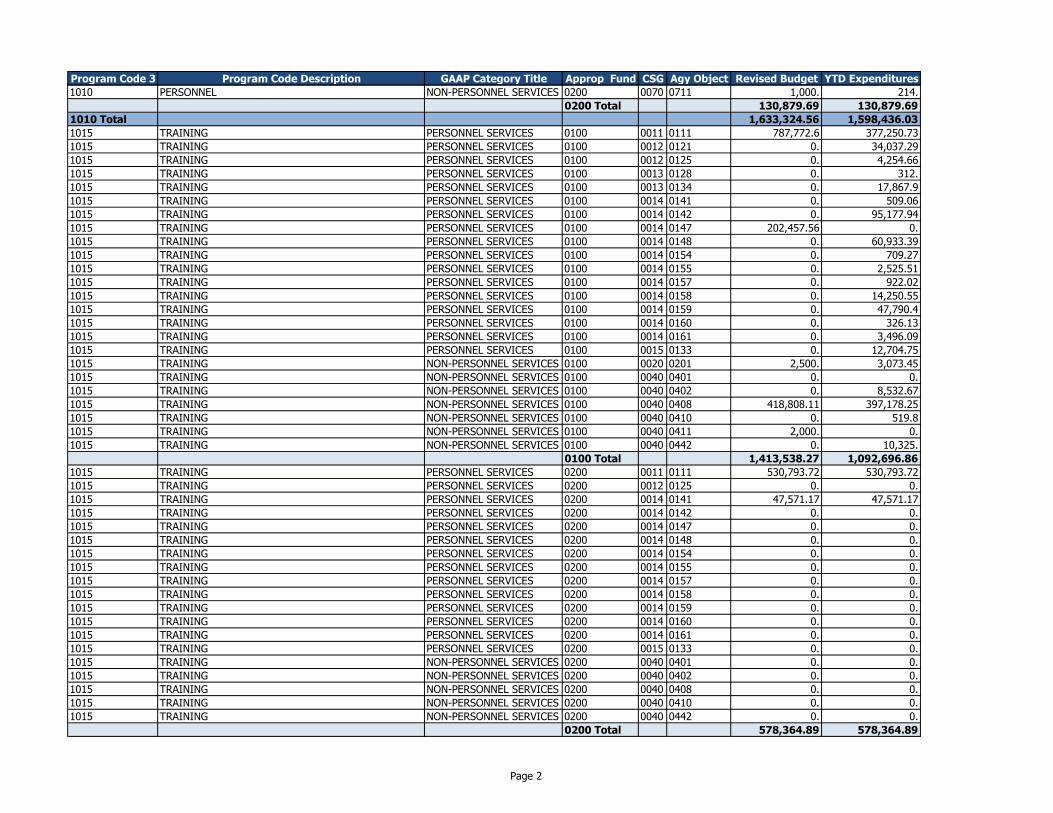
Program Code 3 Program Code Description GAAP Category Title Approp Fund CSG Agy Object Revised Budget YTD Expenditures
1010 PERSONNEL NON-PERSONNEL SERVICES 0200 0070 0711 1,000. 214.
0200 Total 130,879.69 130,879.69
1010 Total 1,633,324.56 1,598,436.03
1015 TRAINING PERSONNEL SERVICES 0100 0011 0111 787,772.6 377,250.73
1015 TRAINING PERSONNEL SERVICES 0100 0012 0121 0. 34,037.29
1015 TRAINING PERSONNEL SERVICES 0100 0012 0125 0. 4,254.66
1015 TRAINING PERSONNEL SERVICES 0100 0013 0128 0. 312.
1015 TRAINING PERSONNEL SERVICES 0100 0013 0134 0. 17,867.9
1015 TRAINING PERSONNEL SERVICES 0100 0014 0141 0. 509.06
1015 TRAINING PERSONNEL SERVICES 0100 0014 0142 0. 95,177.94
1015 TRAINING PERSONNEL SERVICES 0100 0014 0147 202,457.56 0.
1015 TRAINING PERSONNEL SERVICES 0100 0014 0148 0. 60,933.39
1015 TRAINING PERSONNEL SERVICES 0100 0014 0154 0. 709.27
1015 TRAINING PERSONNEL SERVICES 0100 0014 0155 0. 2,525.51
1015 TRAINING PERSONNEL SERVICES 0100 0014 0157 0. 922.02
1015 TRAINING PERSONNEL SERVICES 0100 0014 0158 0. 14,250.55
1015 TRAINING PERSONNEL SERVICES 0100 0014 0159 0. 47,790.4
1015 TRAINING PERSONNEL SERVICES 0100 0014 0160 0. 326.13
1015 TRAINING PERSONNEL SERVICES 0100 0014 0161 0. 3,496.09
1015 TRAINING PERSONNEL SERVICES 0100 0015 0133 0. 12,704.75
1015 TRAINING NON-PERSONNEL SERVICES 0100 0020 0201 2,500. 3,073.45
1015 TRAINING NON-PERSONNEL SERVICES 0100 0040 0401 0. 0.
1015 TRAINING NON-PERSONNEL SERVICES 0100 0040 0402 0. 8,532.67
1015 TRAINING NON-PERSONNEL SERVICES 0100 0040 0408 418,808.11 397,178.25
1015 TRAINING NON-PERSONNEL SERVICES 0100 0040 0410 0. 519.8
1015 TRAINING NON-PERSONNEL SERVICES 0100 0040 0411 2,000. 0.
1015 TRAINING NON-PERSONNEL SERVICES 0100 0040 0442 0. 10,325.
0100 Total 1,413,538.27 1,092,696.86
1015 TRAINING PERSONNEL SERVICES 0200 0011 0111 530,793.72 530,793.72
1015 TRAINING PERSONNEL SERVICES 0200 0012 0125 0. 0.
1015 TRAINING PERSONNEL SERVICES 0200 0014 0141 47,571.17 47,571.17
1015 TRAINING PERSONNEL SERVICES 0200 0014 0142 0. 0.
1015 TRAINING PERSONNEL SERVICES 0200 0014 0147 0. 0.
1015 TRAINING PERSONNEL SERVICES 0200 0014 0148 0. 0.
1015 TRAINING PERSONNEL SERVICES 0200 0014 0154 0. 0.
1015 TRAINING PERSONNEL SERVICES 0200 0014 0155 0. 0.
1015 TRAINING PERSONNEL SERVICES 0200 0014 0157 0. 0.
1015 TRAINING PERSONNEL SERVICES 0200 0014 0158 0. 0.
1015 TRAINING PERSONNEL SERVICES 0200 0014 0159 0. 0.
1015 TRAINING PERSONNEL SERVICES 0200 0014 0160 0. 0.
1015 TRAINING PERSONNEL SERVICES 0200 0014 0161 0. 0.
1015 TRAINING PERSONNEL SERVICES 0200 0015 0133 0. 0.
1015 TRAINING NON-PERSONNEL SERVICES 0200 0040 0401 0. 0.
1015 TRAINING NON-PERSONNEL SERVICES 0200 0040 0402 0. 0.
1015 TRAINING NON-PERSONNEL SERVICES 0200 0040 0408 0. 0.
1015 TRAINING NON-PERSONNEL SERVICES 0200 0040 0410 0. 0.
1015 TRAINING NON-PERSONNEL SERVICES 0200 0040 0442 0. 0.
0200 Total 578,364.89 578,364.89
Page 2
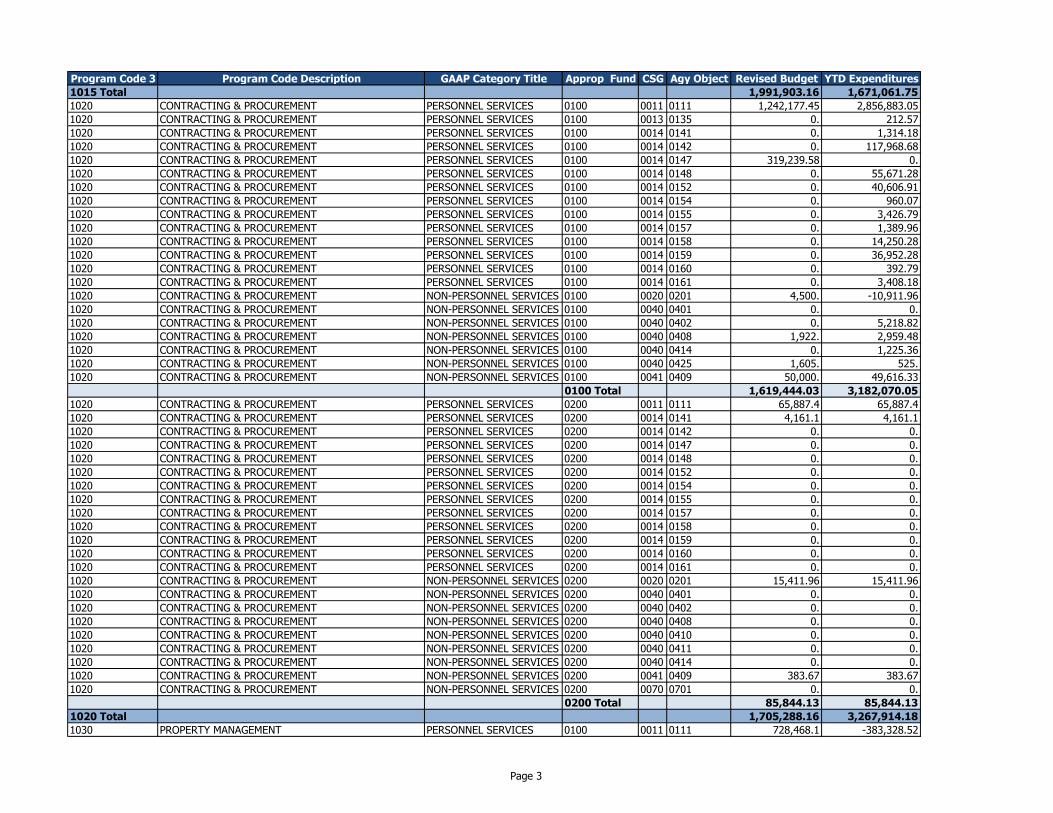
Program Code 3 Program Code Description GAAP Category Title Approp Fund CSG Agy Object Revised Budget YTD Expenditures
1015 Total 1,991,903.16 1,671,061.75
1020 CONTRACTING & PROCUREMENT PERSONNEL SERVICES 0100 0011 0111 1,242,177.45 2,856,883.05
1020 CONTRACTING & PROCUREMENT PERSONNEL SERVICES 0100 0013 0135 0. 212.57
1020 CONTRACTING & PROCUREMENT PERSONNEL SERVICES 0100 0014 0141 0. 1,314.18
1020 CONTRACTING & PROCUREMENT PERSONNEL SERVICES 0100 0014 0142 0. 117,968.68
1020 CONTRACTING & PROCUREMENT PERSONNEL SERVICES 0100 0014 0147 319,239.58 0.
1020 CONTRACTING & PROCUREMENT PERSONNEL SERVICES 0100 0014 0148 0. 55,671.28
1020 CONTRACTING & PROCUREMENT PERSONNEL SERVICES 0100 0014 0152 0. 40,606.91
1020 CONTRACTING & PROCUREMENT PERSONNEL SERVICES 0100 0014 0154 0. 960.07
1020 CONTRACTING & PROCUREMENT PERSONNEL SERVICES 0100 0014 0155 0. 3,426.79
1020 CONTRACTING & PROCUREMENT PERSONNEL SERVICES 0100 0014 0157 0. 1,389.96
1020 CONTRACTING & PROCUREMENT PERSONNEL SERVICES 0100 0014 0158 0. 14,250.28
1020 CONTRACTING & PROCUREMENT PERSONNEL SERVICES 0100 0014 0159 0. 36,952.28
1020 CONTRACTING & PROCUREMENT PERSONNEL SERVICES 0100 0014 0160 0. 392.79
1020 CONTRACTING & PROCUREMENT PERSONNEL SERVICES 0100 0014 0161 0. 3,408.18
1020 CONTRACTING & PROCUREMENT NON-PERSONNEL SERVICES 0100 0020 0201 4,500. -10,911.96
1020 CONTRACTING & PROCUREMENT NON-PERSONNEL SERVICES 0100 0040 0401 0. 0.
1020 CONTRACTING & PROCUREMENT NON-PERSONNEL SERVICES 0100 0040 0402 0. 5,218.82
1020 CONTRACTING & PROCUREMENT NON-PERSONNEL SERVICES 0100 0040 0408 1,922. 2,959.48
1020 CONTRACTING & PROCUREMENT NON-PERSONNEL SERVICES 0100 0040 0414 0. 1,225.36
1020 CONTRACTING & PROCUREMENT NON-PERSONNEL SERVICES 0100 0040 0425 1,605. 525.
1020 CONTRACTING & PROCUREMENT NON-PERSONNEL SERVICES 0100 0041 0409 50,000. 49,616.33
0100 Total 1,619,444.03 3,182,070.05
1020 CONTRACTING & PROCUREMENT PERSONNEL SERVICES 0200 0011 0111 65,887.4 65,887.4
1020 CONTRACTING & PROCUREMENT PERSONNEL SERVICES 0200 0014 0141 4,161.1 4,161.1
1020 CONTRACTING & PROCUREMENT PERSONNEL SERVICES 0200 0014 0142 0. 0.
1020 CONTRACTING & PROCUREMENT PERSONNEL SERVICES 0200 0014 0147 0. 0.
1020 CONTRACTING & PROCUREMENT PERSONNEL SERVICES 0200 0014 0148 0. 0.
1020 CONTRACTING & PROCUREMENT PERSONNEL SERVICES 0200 0014 0152 0. 0.
1020 CONTRACTING & PROCUREMENT PERSONNEL SERVICES 0200 0014 0154 0. 0.
1020 CONTRACTING & PROCUREMENT PERSONNEL SERVICES 0200 0014 0155 0. 0.
1020 CONTRACTING & PROCUREMENT PERSONNEL SERVICES 0200 0014 0157 0. 0.
1020 CONTRACTING & PROCUREMENT PERSONNEL SERVICES 0200 0014 0158 0. 0.
1020 CONTRACTING & PROCUREMENT PERSONNEL SERVICES 0200 0014 0159 0. 0.
1020 CONTRACTING & PROCUREMENT PERSONNEL SERVICES 0200 0014 0160 0. 0.
1020 CONTRACTING & PROCUREMENT PERSONNEL SERVICES 0200 0014 0161 0. 0.
1020 CONTRACTING & PROCUREMENT NON-PERSONNEL SERVICES 0200 0020 0201 15,411.96 15,411.96
1020 CONTRACTING & PROCUREMENT NON-PERSONNEL SERVICES 0200 0040 0401 0. 0.
1020 CONTRACTING & PROCUREMENT NON-PERSONNEL SERVICES 0200 0040 0402 0. 0.
1020 CONTRACTING & PROCUREMENT NON-PERSONNEL SERVICES 0200 0040 0408 0. 0.
1020 CONTRACTING & PROCUREMENT NON-PERSONNEL SERVICES 0200 0040 0410 0. 0.
1020 CONTRACTING & PROCUREMENT NON-PERSONNEL SERVICES 0200 0040 0411 0. 0.
1020 CONTRACTING & PROCUREMENT NON-PERSONNEL SERVICES 0200 0040 0414 0. 0.
1020 CONTRACTING & PROCUREMENT NON-PERSONNEL SERVICES 0200 0041 0409 383.67 383.67
1020 CONTRACTING & PROCUREMENT NON-PERSONNEL SERVICES 0200 0070 0701 0. 0.
0200 Total 85,844.13 85,844.13
1020 Total 1,705,288.16 3,267,914.18
1030 PROPERTY MANAGEMENT PERSONNEL SERVICES 0100 0011 0111 728,468.1 -383,328.52
Page 3
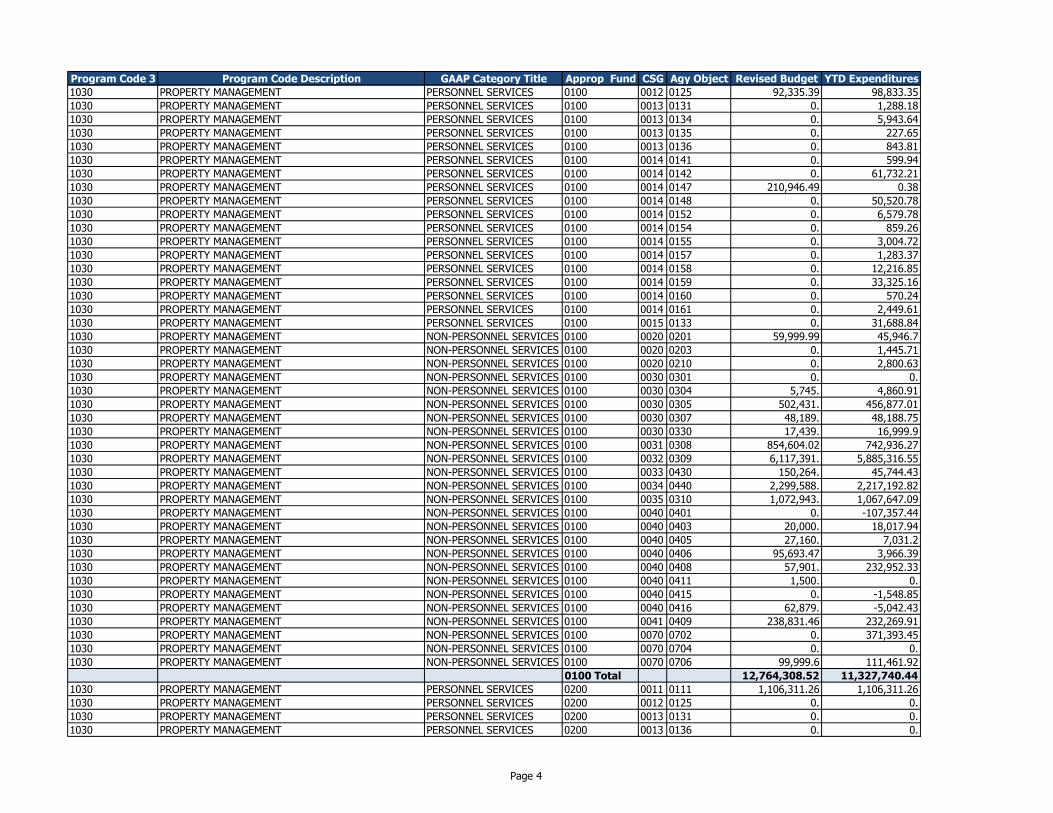
Program Code 3 Program Code Description GAAP Category Title Approp Fund CSG Agy Object Revised Budget YTD Expenditures
1030 PROPERTY MANAGEMENT PERSONNEL SERVICES 0100 0012 0125 92,335.39 98,833.35
1030 PROPERTY MANAGEMENT PERSONNEL SERVICES 0100 0013 0131 0. 1,288.18
1030 PROPERTY MANAGEMENT PERSONNEL SERVICES 0100 0013 0134 0. 5,943.64
1030 PROPERTY MANAGEMENT PERSONNEL SERVICES 0100 0013 0135 0. 227.65
1030 PROPERTY MANAGEMENT PERSONNEL SERVICES 0100 0013 0136 0. 843.81
1030 PROPERTY MANAGEMENT PERSONNEL SERVICES 0100 0014 0141 0. 599.94
1030 PROPERTY MANAGEMENT PERSONNEL SERVICES 0100 0014 0142 0. 61,732.21
1030 PROPERTY MANAGEMENT PERSONNEL SERVICES 0100 0014 0147 210,946.49 0.38
1030 PROPERTY MANAGEMENT PERSONNEL SERVICES 0100 0014 0148 0. 50,520.78
1030 PROPERTY MANAGEMENT PERSONNEL SERVICES 0100 0014 0152 0. 6,579.78
1030 PROPERTY MANAGEMENT PERSONNEL SERVICES 0100 0014 0154 0. 859.26
1030 PROPERTY MANAGEMENT PERSONNEL SERVICES 0100 0014 0155 0. 3,004.72
1030 PROPERTY MANAGEMENT PERSONNEL SERVICES 0100 0014 0157 0. 1,283.37
1030 PROPERTY MANAGEMENT PERSONNEL SERVICES 0100 0014 0158 0. 12,216.85
1030 PROPERTY MANAGEMENT PERSONNEL SERVICES 0100 0014 0159 0. 33,325.16
1030 PROPERTY MANAGEMENT PERSONNEL SERVICES 0100 0014 0160 0. 570.24
1030 PROPERTY MANAGEMENT PERSONNEL SERVICES 0100 0014 0161 0. 2,449.61
1030 PROPERTY MANAGEMENT PERSONNEL SERVICES 0100 0015 0133 0. 31,688.84
1030 PROPERTY MANAGEMENT NON-PERSONNEL SERVICES 0100 0020 0201 59,999.99 45,946.7
1030 PROPERTY MANAGEMENT NON-PERSONNEL SERVICES 0100 0020 0203 0. 1,445.71
1030 PROPERTY MANAGEMENT NON-PERSONNEL SERVICES 0100 0020 0210 0. 2,800.63
1030 PROPERTY MANAGEMENT NON-PERSONNEL SERVICES 0100 0030 0301 0. 0.
1030 PROPERTY MANAGEMENT NON-PERSONNEL SERVICES 0100 0030 0304 5,745. 4,860.91
1030 PROPERTY MANAGEMENT NON-PERSONNEL SERVICES 0100 0030 0305 502,431. 456,877.01
1030 PROPERTY MANAGEMENT NON-PERSONNEL SERVICES 0100 0030 0307 48,189. 48,188.75
1030 PROPERTY MANAGEMENT NON-PERSONNEL SERVICES 0100 0030 0330 17,439. 16,999.9
1030 PROPERTY MANAGEMENT NON-PERSONNEL SERVICES 0100 0031 0308 854,604.02 742,936.27
1030 PROPERTY MANAGEMENT NON-PERSONNEL SERVICES 0100 0032 0309 6,117,391. 5,885,316.55
1030 PROPERTY MANAGEMENT NON-PERSONNEL SERVICES 0100 0033 0430 150,264. 45,744.43
1030 PROPERTY MANAGEMENT NON-PERSONNEL SERVICES 0100 0034 0440 2,299,588. 2,217,192.82
1030 PROPERTY MANAGEMENT NON-PERSONNEL SERVICES 0100 0035 0310 1,072,943. 1,067,647.09
1030 PROPERTY MANAGEMENT NON-PERSONNEL SERVICES 0100 0040 0401 0. -107,357.44
1030 PROPERTY MANAGEMENT NON-PERSONNEL SERVICES 0100 0040 0403 20,000. 18,017.94
1030 PROPERTY MANAGEMENT NON-PERSONNEL SERVICES 0100 0040 0405 27,160. 7,031.2
1030 PROPERTY MANAGEMENT NON-PERSONNEL SERVICES 0100 0040 0406 95,693.47 3,966.39
1030 PROPERTY MANAGEMENT NON-PERSONNEL SERVICES 0100 0040 0408 57,901. 232,952.33
1030 PROPERTY MANAGEMENT NON-PERSONNEL SERVICES 0100 0040 0411 1,500. 0.
1030 PROPERTY MANAGEMENT NON-PERSONNEL SERVICES 0100 0040 0415 0. -1,548.85
1030 PROPERTY MANAGEMENT NON-PERSONNEL SERVICES 0100 0040 0416 62,879. -5,042.43
1030 PROPERTY MANAGEMENT NON-PERSONNEL SERVICES 0100 0041 0409 238,831.46 232,269.91
1030 PROPERTY MANAGEMENT NON-PERSONNEL SERVICES 0100 0070 0702 0. 371,393.45
1030 PROPERTY MANAGEMENT NON-PERSONNEL SERVICES 0100 0070 0704 0. 0.
1030 PROPERTY MANAGEMENT NON-PERSONNEL SERVICES 0100 0070 0706 99,999.6 111,461.92
0100 Total 12,764,308.52 11,327,740.44
1030 PROPERTY MANAGEMENT PERSONNEL SERVICES 0200 0011 0111 1,106,311.26 1,106,311.26
1030 PROPERTY MANAGEMENT PERSONNEL SERVICES 0200 0012 0125 0. 0.
1030 PROPERTY MANAGEMENT PERSONNEL SERVICES 0200 0013 0131 0. 0.
1030 PROPERTY MANAGEMENT PERSONNEL SERVICES 0200 0013 0136 0. 0.
Page 4
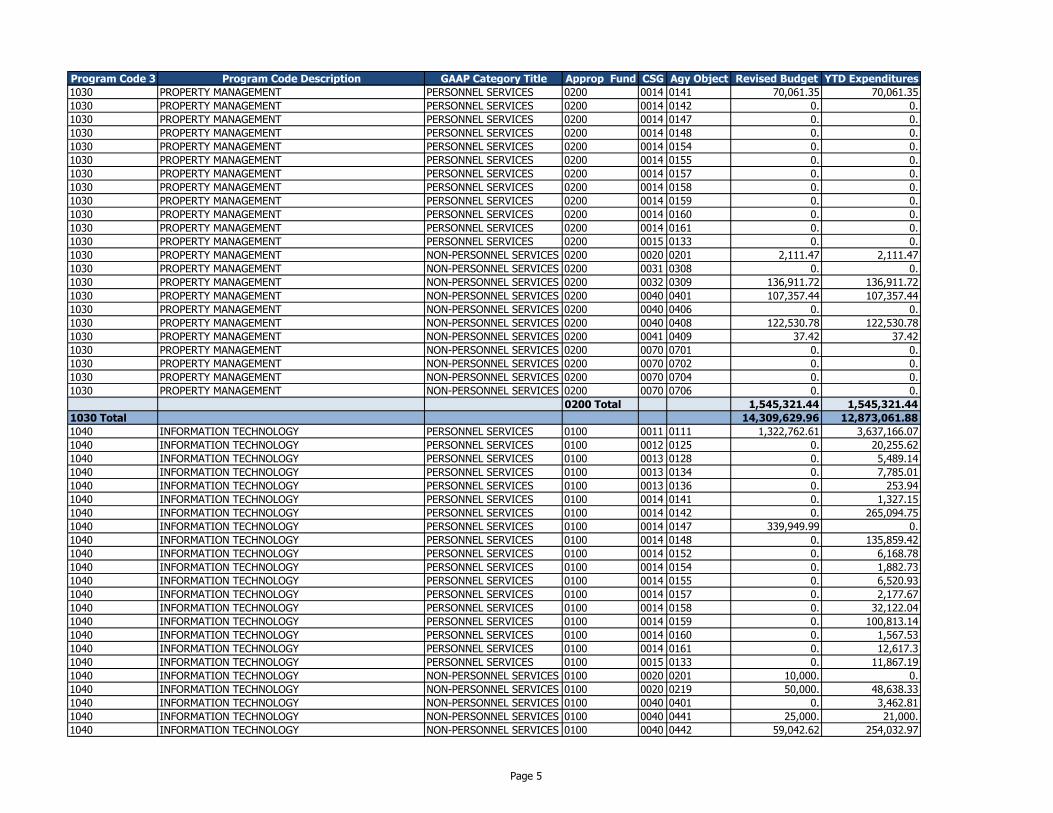
Program Code 3 Program Code Description GAAP Category Title Approp Fund CSG Agy Object Revised Budget YTD Expenditures
1030 PROPERTY MANAGEMENT PERSONNEL SERVICES 0200 0014 0141 70,061.35 70,061.35
1030 PROPERTY MANAGEMENT PERSONNEL SERVICES 0200 0014 0142 0. 0.
1030 PROPERTY MANAGEMENT PERSONNEL SERVICES 0200 0014 0147 0. 0.
1030 PROPERTY MANAGEMENT PERSONNEL SERVICES 0200 0014 0148 0. 0.
1030 PROPERTY MANAGEMENT PERSONNEL SERVICES 0200 0014 0154 0. 0.
1030 PROPERTY MANAGEMENT PERSONNEL SERVICES 0200 0014 0155 0. 0.
1030 PROPERTY MANAGEMENT PERSONNEL SERVICES 0200 0014 0157 0. 0.
1030 PROPERTY MANAGEMENT PERSONNEL SERVICES 0200 0014 0158 0. 0.
1030 PROPERTY MANAGEMENT PERSONNEL SERVICES 0200 0014 0159 0. 0.
1030 PROPERTY MANAGEMENT PERSONNEL SERVICES 0200 0014 0160 0. 0.
1030 PROPERTY MANAGEMENT PERSONNEL SERVICES 0200 0014 0161 0. 0.
1030 PROPERTY MANAGEMENT PERSONNEL SERVICES 0200 0015 0133 0. 0.
1030 PROPERTY MANAGEMENT NON-PERSONNEL SERVICES 0200 0020 0201 2,111.47 2,111.47
1030 PROPERTY MANAGEMENT NON-PERSONNEL SERVICES 0200 0031 0308 0. 0.
1030 PROPERTY MANAGEMENT NON-PERSONNEL SERVICES 0200 0032 0309 136,911.72 136,911.72
1030 PROPERTY MANAGEMENT NON-PERSONNEL SERVICES 0200 0040 0401 107,357.44 107,357.44
1030 PROPERTY MANAGEMENT NON-PERSONNEL SERVICES 0200 0040 0406 0. 0.
1030 PROPERTY MANAGEMENT NON-PERSONNEL SERVICES 0200 0040 0408 122,530.78 122,530.78
1030 PROPERTY MANAGEMENT NON-PERSONNEL SERVICES 0200 0041 0409 37.42 37.42
1030 PROPERTY MANAGEMENT NON-PERSONNEL SERVICES 0200 0070 0701 0. 0.
1030 PROPERTY MANAGEMENT NON-PERSONNEL SERVICES 0200 0070 0702 0. 0.
1030 PROPERTY MANAGEMENT NON-PERSONNEL SERVICES 0200 0070 0704 0. 0.
1030 PROPERTY MANAGEMENT NON-PERSONNEL SERVICES 0200 0070 0706 0. 0.
0200 Total 1,545,321.44 1,545,321.44
1030 Total 14,309,629.96 12,873,061.88
1040 INFORMATION TECHNOLOGY PERSONNEL SERVICES 0100 0011 0111 1,322,762.61 3,637,166.07
1040 INFORMATION TECHNOLOGY PERSONNEL SERVICES 0100 0012 0125 0. 20,255.62
1040 INFORMATION TECHNOLOGY PERSONNEL SERVICES 0100 0013 0128 0. 5,489.14
1040 INFORMATION TECHNOLOGY PERSONNEL SERVICES 0100 0013 0134 0. 7,785.01
1040 INFORMATION TECHNOLOGY PERSONNEL SERVICES 0100 0013 0136 0. 253.94
1040 INFORMATION TECHNOLOGY PERSONNEL SERVICES 0100 0014 0141 0. 1,327.15
1040 INFORMATION TECHNOLOGY PERSONNEL SERVICES 0100 0014 0142 0. 265,094.75
1040 INFORMATION TECHNOLOGY PERSONNEL SERVICES 0100 0014 0147 339,949.99 0.
1040 INFORMATION TECHNOLOGY PERSONNEL SERVICES 0100 0014 0148 0. 135,859.42
1040 INFORMATION TECHNOLOGY PERSONNEL SERVICES 0100 0014 0152 0. 6,168.78
1040 INFORMATION TECHNOLOGY PERSONNEL SERVICES 0100 0014 0154 0. 1,882.73
1040 INFORMATION TECHNOLOGY PERSONNEL SERVICES 0100 0014 0155 0. 6,520.93
1040 INFORMATION TECHNOLOGY PERSONNEL SERVICES 0100 0014 0157 0. 2,177.67
1040 INFORMATION TECHNOLOGY PERSONNEL SERVICES 0100 0014 0158 0. 32,122.04
1040 INFORMATION TECHNOLOGY PERSONNEL SERVICES 0100 0014 0159 0. 100,813.14
1040 INFORMATION TECHNOLOGY PERSONNEL SERVICES 0100 0014 0160 0. 1,567.53
1040 INFORMATION TECHNOLOGY PERSONNEL SERVICES 0100 0014 0161 0. 12,617.3
1040 INFORMATION TECHNOLOGY PERSONNEL SERVICES 0100 0015 0133 0. 11,867.19
1040 INFORMATION TECHNOLOGY NON-PERSONNEL SERVICES 0100 0020 0201 10,000. 0.
1040 INFORMATION TECHNOLOGY NON-PERSONNEL SERVICES 0100 0020 0219 50,000. 48,638.33
1040 INFORMATION TECHNOLOGY NON-PERSONNEL SERVICES 0100 0040 0401 0. 3,462.81
1040 INFORMATION TECHNOLOGY NON-PERSONNEL SERVICES 0100 0040 0441 25,000. 21,000.
1040 INFORMATION TECHNOLOGY NON-PERSONNEL SERVICES 0100 0040 0442 59,042.62 254,032.97
Page 5
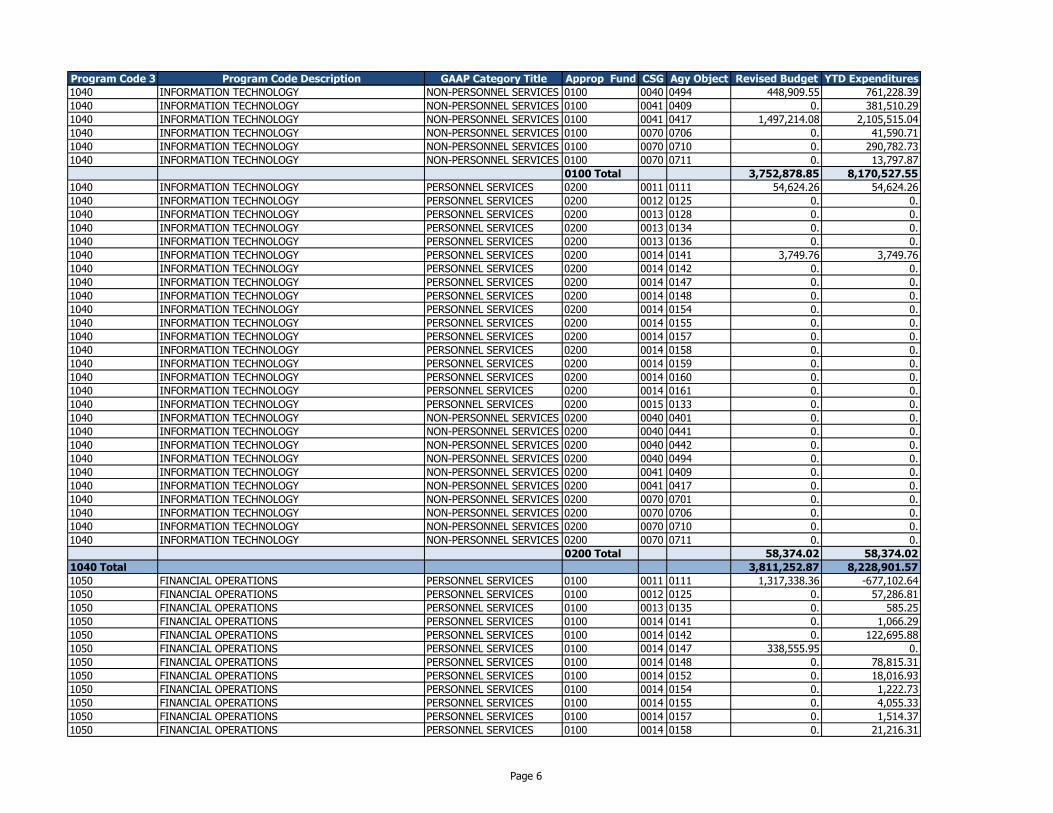
Program Code 3 Program Code Description GAAP Category Title Approp Fund CSG Agy Object Revised Budget YTD Expenditures
1040 INFORMATION TECHNOLOGY NON-PERSONNEL SERVICES 0100 0040 0494 448,909.55 761,228.39
1040 INFORMATION TECHNOLOGY NON-PERSONNEL SERVICES 0100 0041 0409 0. 381,510.29
1040 INFORMATION TECHNOLOGY NON-PERSONNEL SERVICES 0100 0041 0417 1,497,214.08 2,105,515.04
1040 INFORMATION TECHNOLOGY NON-PERSONNEL SERVICES 0100 0070 0706 0. 41,590.71
1040 INFORMATION TECHNOLOGY NON-PERSONNEL SERVICES 0100 0070 0710 0. 290,782.73
1040 INFORMATION TECHNOLOGY NON-PERSONNEL SERVICES 0100 0070 0711 0. 13,797.87
0100 Total 3,752,878.85 8,170,527.55
1040 INFORMATION TECHNOLOGY PERSONNEL SERVICES 0200 0011 0111 54,624.26 54,624.26
1040 INFORMATION TECHNOLOGY PERSONNEL SERVICES 0200 0012 0125 0. 0.
1040 INFORMATION TECHNOLOGY PERSONNEL SERVICES 0200 0013 0128 0. 0.
1040 INFORMATION TECHNOLOGY PERSONNEL SERVICES 0200 0013 0134 0. 0.
1040 INFORMATION TECHNOLOGY PERSONNEL SERVICES 0200 0013 0136 0. 0.
1040 INFORMATION TECHNOLOGY PERSONNEL SERVICES 0200 0014 0141 3,749.76 3,749.76
1040 INFORMATION TECHNOLOGY PERSONNEL SERVICES 0200 0014 0142 0. 0.
1040 INFORMATION TECHNOLOGY PERSONNEL SERVICES 0200 0014 0147 0. 0.
1040 INFORMATION TECHNOLOGY PERSONNEL SERVICES 0200 0014 0148 0. 0.
1040 INFORMATION TECHNOLOGY PERSONNEL SERVICES 0200 0014 0154 0. 0.
1040 INFORMATION TECHNOLOGY PERSONNEL SERVICES 0200 0014 0155 0. 0.
1040 INFORMATION TECHNOLOGY PERSONNEL SERVICES 0200 0014 0157 0. 0.
1040 INFORMATION TECHNOLOGY PERSONNEL SERVICES 0200 0014 0158 0. 0.
1040 INFORMATION TECHNOLOGY PERSONNEL SERVICES 0200 0014 0159 0. 0.
1040 INFORMATION TECHNOLOGY PERSONNEL SERVICES 0200 0014 0160 0. 0.
1040 INFORMATION TECHNOLOGY PERSONNEL SERVICES 0200 0014 0161 0. 0.
1040 INFORMATION TECHNOLOGY PERSONNEL SERVICES 0200 0015 0133 0. 0.
1040 INFORMATION TECHNOLOGY NON-PERSONNEL SERVICES 0200 0040 0401 0. 0.
1040 INFORMATION TECHNOLOGY NON-PERSONNEL SERVICES 0200 0040 0441 0. 0.
1040 INFORMATION TECHNOLOGY NON-PERSONNEL SERVICES 0200 0040 0442 0. 0.
1040 INFORMATION TECHNOLOGY NON-PERSONNEL SERVICES 0200 0040 0494 0. 0.
1040 INFORMATION TECHNOLOGY NON-PERSONNEL SERVICES 0200 0041 0409 0. 0.
1040 INFORMATION TECHNOLOGY NON-PERSONNEL SERVICES 0200 0041 0417 0. 0.
1040 INFORMATION TECHNOLOGY NON-PERSONNEL SERVICES 0200 0070 0701 0. 0.
1040 INFORMATION TECHNOLOGY NON-PERSONNEL SERVICES 0200 0070 0706 0. 0.
1040 INFORMATION TECHNOLOGY NON-PERSONNEL SERVICES 0200 0070 0710 0. 0.
1040 INFORMATION TECHNOLOGY NON-PERSONNEL SERVICES 0200 0070 0711 0. 0.
0200 Total 58,374.02 58,374.02
1040 Total 3,811,252.87 8,228,901.57
1050 FINANCIAL OPERATIONS PERSONNEL SERVICES 0100 0011 0111 1,317,338.36 -677,102.64
1050 FINANCIAL OPERATIONS PERSONNEL SERVICES 0100 0012 0125 0. 57,286.81
1050 FINANCIAL OPERATIONS PERSONNEL SERVICES 0100 0013 0135 0. 585.25
1050 FINANCIAL OPERATIONS PERSONNEL SERVICES 0100 0014 0141 0. 1,066.29
1050 FINANCIAL OPERATIONS PERSONNEL SERVICES 0100 0014 0142 0. 122,695.88
1050 FINANCIAL OPERATIONS PERSONNEL SERVICES 0100 0014 0147 338,555.95 0.
1050 FINANCIAL OPERATIONS PERSONNEL SERVICES 0100 0014 0148 0. 78,815.31
1050 FINANCIAL OPERATIONS PERSONNEL SERVICES 0100 0014 0152 0. 18,016.93
1050 FINANCIAL OPERATIONS PERSONNEL SERVICES 0100 0014 0154 0. 1,222.73
1050 FINANCIAL OPERATIONS PERSONNEL SERVICES 0100 0014 0155 0. 4,055.33
1050 FINANCIAL OPERATIONS PERSONNEL SERVICES 0100 0014 0157 0. 1,514.37
1050 FINANCIAL OPERATIONS PERSONNEL SERVICES 0100 0014 0158 0. 21,216.31
Page 6
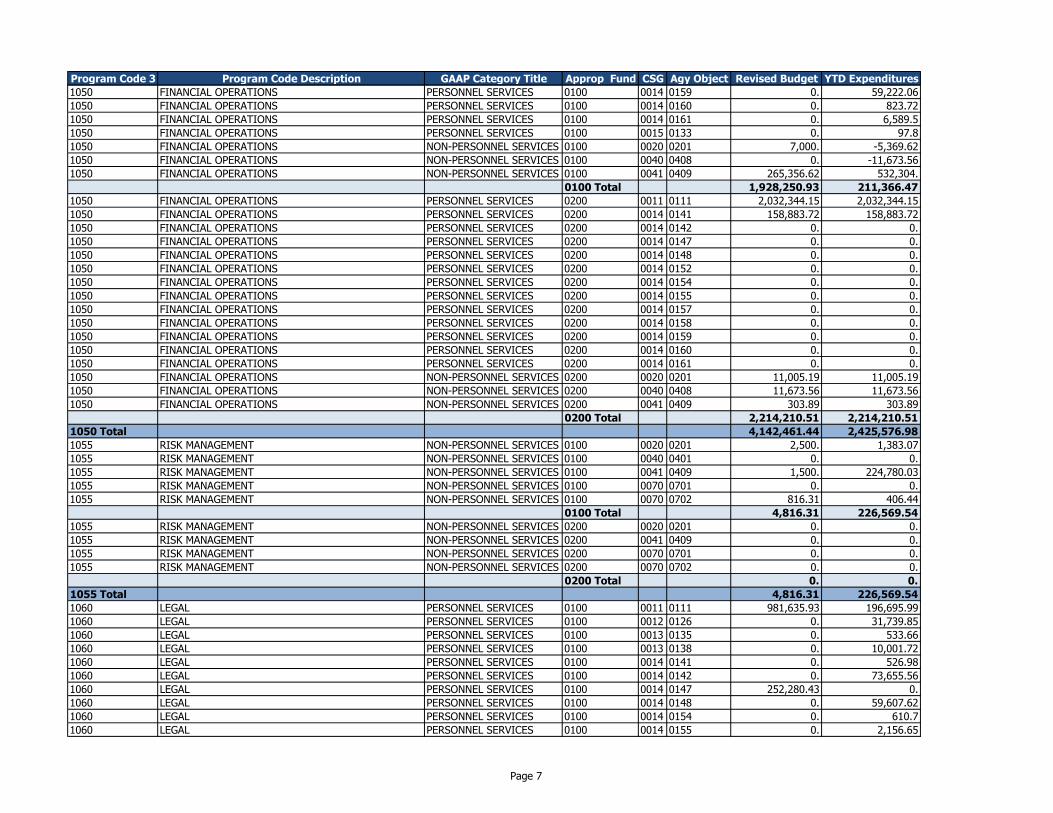
Program Code 3 Program Code Description GAAP Category Title Approp Fund CSG Agy Object Revised Budget YTD Expenditures
1050 FINANCIAL OPERATIONS PERSONNEL SERVICES 0100 0014 0159 0. 59,222.06
1050 FINANCIAL OPERATIONS PERSONNEL SERVICES 0100 0014 0160 0. 823.72
1050 FINANCIAL OPERATIONS PERSONNEL SERVICES 0100 0014 0161 0. 6,589.5
1050 FINANCIAL OPERATIONS PERSONNEL SERVICES 0100 0015 0133 0. 97.8
1050 FINANCIAL OPERATIONS NON-PERSONNEL SERVICES 0100 0020 0201 7,000. -5,369.62
1050 FINANCIAL OPERATIONS NON-PERSONNEL SERVICES 0100 0040 0408 0. -11,673.56
1050 FINANCIAL OPERATIONS NON-PERSONNEL SERVICES 0100 0041 0409 265,356.62 532,304.
0100 Total 1,928,250.93 211,366.47
1050 FINANCIAL OPERATIONS PERSONNEL SERVICES 0200 0011 0111 2,032,344.15 2,032,344.15
1050 FINANCIAL OPERATIONS PERSONNEL SERVICES 0200 0014 0141 158,883.72 158,883.72
1050 FINANCIAL OPERATIONS PERSONNEL SERVICES 0200 0014 0142 0. 0.
1050 FINANCIAL OPERATIONS PERSONNEL SERVICES 0200 0014 0147 0. 0.
1050 FINANCIAL OPERATIONS PERSONNEL SERVICES 0200 0014 0148 0. 0.
1050 FINANCIAL OPERATIONS PERSONNEL SERVICES 0200 0014 0152 0. 0.
1050 FINANCIAL OPERATIONS PERSONNEL SERVICES 0200 0014 0154 0. 0.
1050 FINANCIAL OPERATIONS PERSONNEL SERVICES 0200 0014 0155 0. 0.
1050 FINANCIAL OPERATIONS PERSONNEL SERVICES 0200 0014 0157 0. 0.
1050 FINANCIAL OPERATIONS PERSONNEL SERVICES 0200 0014 0158 0. 0.
1050 FINANCIAL OPERATIONS PERSONNEL SERVICES 0200 0014 0159 0. 0.
1050 FINANCIAL OPERATIONS PERSONNEL SERVICES 0200 0014 0160 0. 0.
1050 FINANCIAL OPERATIONS PERSONNEL SERVICES 0200 0014 0161 0. 0.
1050 FINANCIAL OPERATIONS NON-PERSONNEL SERVICES 0200 0020 0201 11,005.19 11,005.19
1050 FINANCIAL OPERATIONS NON-PERSONNEL SERVICES 0200 0040 0408 11,673.56 11,673.56
1050 FINANCIAL OPERATIONS NON-PERSONNEL SERVICES 0200 0041 0409 303.89 303.89
0200 Total 2,214,210.51 2,214,210.51
1050 Total 4,142,461.44 2,425,576.98
1055 RISK MANAGEMENT NON-PERSONNEL SERVICES 0100 0020 0201 2,500. 1,383.07
1055 RISK MANAGEMENT NON-PERSONNEL SERVICES 0100 0040 0401 0. 0.
1055 RISK MANAGEMENT NON-PERSONNEL SERVICES 0100 0041 0409 1,500. 224,780.03
1055 RISK MANAGEMENT NON-PERSONNEL SERVICES 0100 0070 0701 0. 0.
1055 RISK MANAGEMENT NON-PERSONNEL SERVICES 0100 0070 0702 816.31 406.44
0100 Total 4,816.31 226,569.54
1055 RISK MANAGEMENT NON-PERSONNEL SERVICES 0200 0020 0201 0. 0.
1055 RISK MANAGEMENT NON-PERSONNEL SERVICES 0200 0041 0409 0. 0.
1055 RISK MANAGEMENT NON-PERSONNEL SERVICES 0200 0070 0701 0. 0.
1055 RISK MANAGEMENT NON-PERSONNEL SERVICES 0200 0070 0702 0. 0.
0200 Total 0. 0.
1055 Total 4,816.31 226,569.54
1060 LEGAL PERSONNEL SERVICES 0100 0011 0111 981,635.93 196,695.99
1060 LEGAL PERSONNEL SERVICES 0100 0012 0126 0. 31,739.85
1060 LEGAL PERSONNEL SERVICES 0100 0013 0135 0. 533.66
1060 LEGAL PERSONNEL SERVICES 0100 0013 0138 0. 10,001.72
1060 LEGAL PERSONNEL SERVICES 0100 0014 0141 0. 526.98
1060 LEGAL PERSONNEL SERVICES 0100 0014 0142 0. 73,655.56
1060 LEGAL PERSONNEL SERVICES 0100 0014 0147 252,280.43 0.
1060 LEGAL PERSONNEL SERVICES 0100 0014 0148 0. 59,607.62
1060 LEGAL PERSONNEL SERVICES 0100 0014 0154 0. 610.7
1060 LEGAL PERSONNEL SERVICES 0100 0014 0155 0. 2,156.65
Page 7
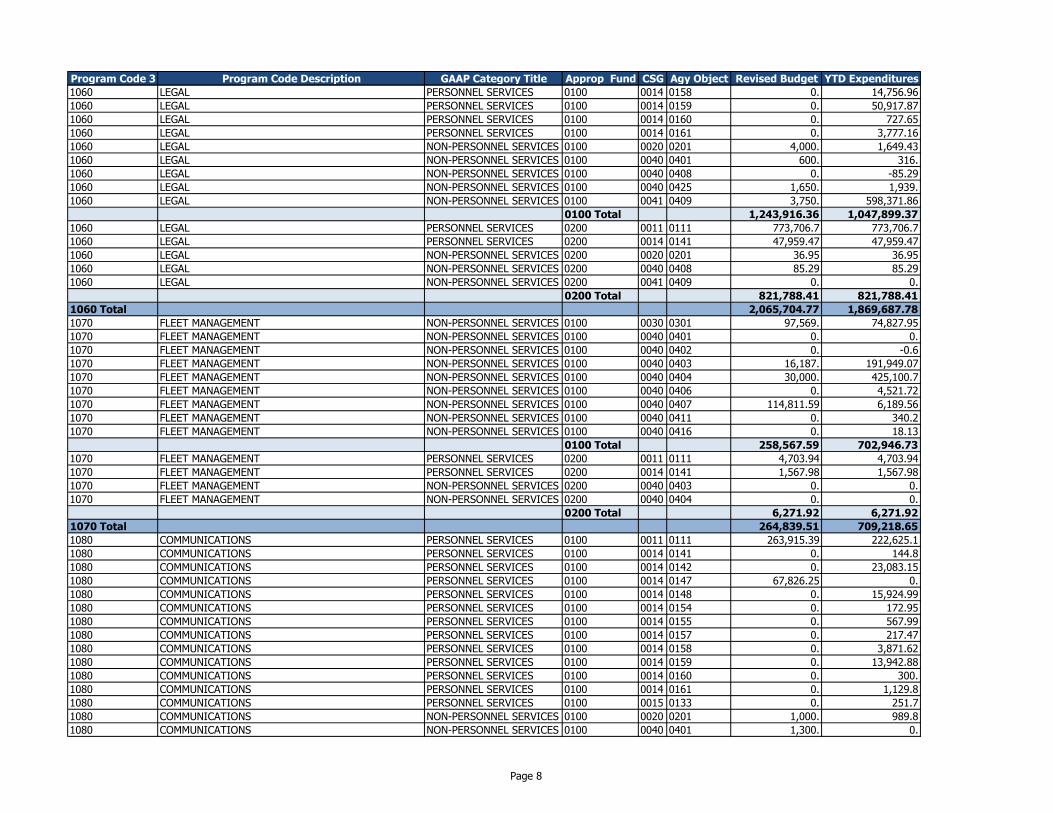
Program Code 3 Program Code Description GAAP Category Title Approp Fund CSG Agy Object Revised Budget YTD Expenditures
1060 LEGAL PERSONNEL SERVICES 0100 0014 0158 0. 14,756.96
1060 LEGAL PERSONNEL SERVICES 0100 0014 0159 0. 50,917.87
1060 LEGAL PERSONNEL SERVICES 0100 0014 0160 0. 727.65
1060 LEGAL PERSONNEL SERVICES 0100 0014 0161 0. 3,777.16
1060 LEGAL NON-PERSONNEL SERVICES 0100 0020 0201 4,000. 1,649.43
1060 LEGAL NON-PERSONNEL SERVICES 0100 0040 0401 600. 316.
1060 LEGAL NON-PERSONNEL SERVICES 0100 0040 0408 0. -85.29
1060 LEGAL NON-PERSONNEL SERVICES 0100 0040 0425 1,650. 1,939.
1060 LEGAL NON-PERSONNEL SERVICES 0100 0041 0409 3,750. 598,371.86
0100 Total 1,243,916.36 1,047,899.37
1060 LEGAL PERSONNEL SERVICES 0200 0011 0111 773,706.7 773,706.7
1060 LEGAL PERSONNEL SERVICES 0200 0014 0141 47,959.47 47,959.47
1060 LEGAL NON-PERSONNEL SERVICES 0200 0020 0201 36.95 36.95
1060 LEGAL NON-PERSONNEL SERVICES 0200 0040 0408 85.29 85.29
1060 LEGAL NON-PERSONNEL SERVICES 0200 0041 0409 0. 0.
0200 Total 821,788.41 821,788.41
1060 Total 2,065,704.77 1,869,687.78
1070 FLEET MANAGEMENT NON-PERSONNEL SERVICES 0100 0030 0301 97,569. 74,827.95
1070 FLEET MANAGEMENT NON-PERSONNEL SERVICES 0100 0040 0401 0. 0.
1070 FLEET MANAGEMENT NON-PERSONNEL SERVICES 0100 0040 0402 0. -0.6
1070 FLEET MANAGEMENT NON-PERSONNEL SERVICES 0100 0040 0403 16,187. 191,949.07
1070 FLEET MANAGEMENT NON-PERSONNEL SERVICES 0100 0040 0404 30,000. 425,100.7
1070 FLEET MANAGEMENT NON-PERSONNEL SERVICES 0100 0040 0406 0. 4,521.72
1070 FLEET MANAGEMENT NON-PERSONNEL SERVICES 0100 0040 0407 114,811.59 6,189.56
1070 FLEET MANAGEMENT NON-PERSONNEL SERVICES 0100 0040 0411 0. 340.2
1070 FLEET MANAGEMENT NON-PERSONNEL SERVICES 0100 0040 0416 0. 18.13
0100 Total 258,567.59 702,946.73
1070 FLEET MANAGEMENT PERSONNEL SERVICES 0200 0011 0111 4,703.94 4,703.94
1070 FLEET MANAGEMENT PERSONNEL SERVICES 0200 0014 0141 1,567.98 1,567.98
1070 FLEET MANAGEMENT NON-PERSONNEL SERVICES 0200 0040 0403 0. 0.
1070 FLEET MANAGEMENT NON-PERSONNEL SERVICES 0200 0040 0404 0. 0.
0200 Total 6,271.92 6,271.92
1070 Total 264,839.51 709,218.65
1080 COMMUNICATIONS PERSONNEL SERVICES 0100 0011 0111 263,915.39 222,625.1
1080 COMMUNICATIONS PERSONNEL SERVICES 0100 0014 0141 0. 144.8
1080 COMMUNICATIONS PERSONNEL SERVICES 0100 0014 0142 0. 23,083.15
1080 COMMUNICATIONS PERSONNEL SERVICES 0100 0014 0147 67,826.25 0.
1080 COMMUNICATIONS PERSONNEL SERVICES 0100 0014 0148 0. 15,924.99
1080 COMMUNICATIONS PERSONNEL SERVICES 0100 0014 0154 0. 172.95
1080 COMMUNICATIONS PERSONNEL SERVICES 0100 0014 0155 0. 567.99
1080 COMMUNICATIONS PERSONNEL SERVICES 0100 0014 0157 0. 217.47
1080 COMMUNICATIONS PERSONNEL SERVICES 0100 0014 0158 0. 3,871.62
1080 COMMUNICATIONS PERSONNEL SERVICES 0100 0014 0159 0. 13,942.88
1080 COMMUNICATIONS PERSONNEL SERVICES 0100 0014 0160 0. 300.
1080 COMMUNICATIONS PERSONNEL SERVICES 0100 0014 0161 0. 1,129.8
1080 COMMUNICATIONS PERSONNEL SERVICES 0100 0015 0133 0. 251.7
1080 COMMUNICATIONS NON-PERSONNEL SERVICES 0100 0020 0201 1,000. 989.8
1080 COMMUNICATIONS NON-PERSONNEL SERVICES 0100 0040 0401 1,300. 0.
Page 8
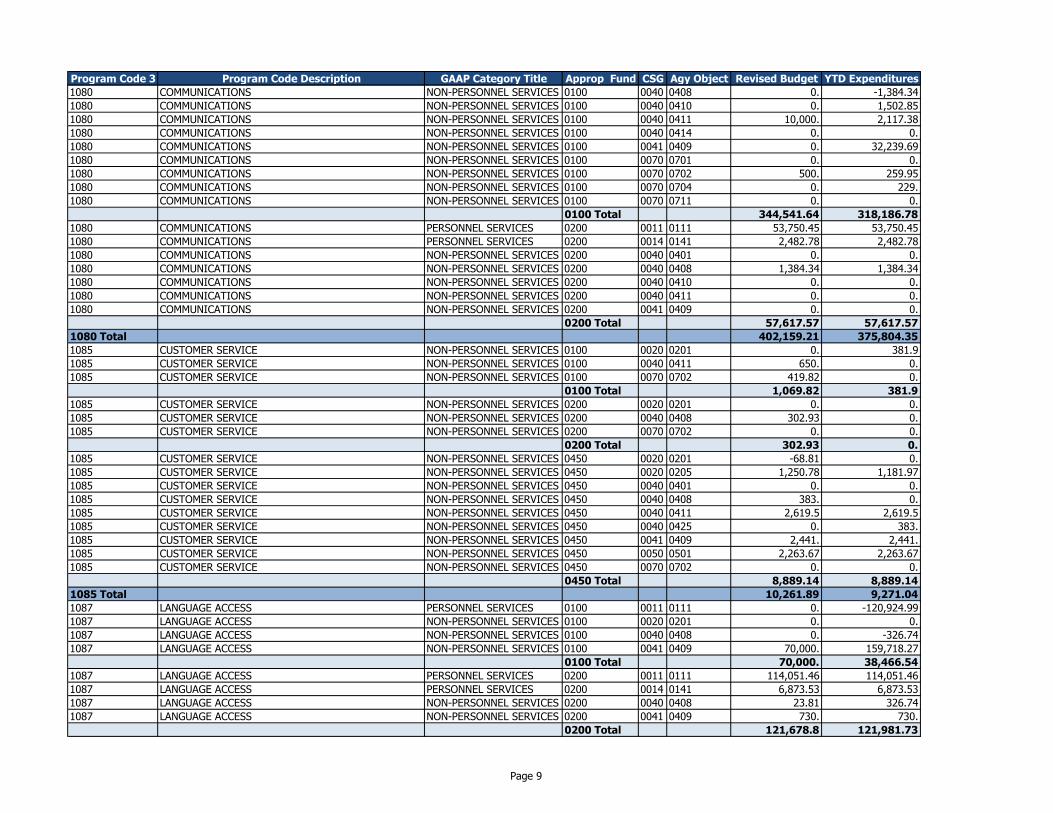
Program Code 3 Program Code Description GAAP Category Title Approp Fund CSG Agy Object Revised Budget YTD Expenditures
1080 COMMUNICATIONS NON-PERSONNEL SERVICES 0100 0040 0408 0. -1,384.34
1080 COMMUNICATIONS NON-PERSONNEL SERVICES 0100 0040 0410 0. 1,502.85
1080 COMMUNICATIONS NON-PERSONNEL SERVICES 0100 0040 0411 10,000. 2,117.38
1080 COMMUNICATIONS NON-PERSONNEL SERVICES 0100 0040 0414 0. 0.
1080 COMMUNICATIONS NON-PERSONNEL SERVICES 0100 0041 0409 0. 32,239.69
1080 COMMUNICATIONS NON-PERSONNEL SERVICES 0100 0070 0701 0. 0.
1080 COMMUNICATIONS NON-PERSONNEL SERVICES 0100 0070 0702 500. 259.95
1080 COMMUNICATIONS NON-PERSONNEL SERVICES 0100 0070 0704 0. 229.
1080 COMMUNICATIONS NON-PERSONNEL SERVICES 0100 0070 0711 0. 0.
0100 Total 344,541.64 318,186.78
1080 COMMUNICATIONS PERSONNEL SERVICES 0200 0011 0111 53,750.45 53,750.45
1080 COMMUNICATIONS PERSONNEL SERVICES 0200 0014 0141 2,482.78 2,482.78
1080 COMMUNICATIONS NON-PERSONNEL SERVICES 0200 0040 0401 0. 0.
1080 COMMUNICATIONS NON-PERSONNEL SERVICES 0200 0040 0408 1,384.34 1,384.34
1080 COMMUNICATIONS NON-PERSONNEL SERVICES 0200 0040 0410 0. 0.
1080 COMMUNICATIONS NON-PERSONNEL SERVICES 0200 0040 0411 0. 0.
1080 COMMUNICATIONS NON-PERSONNEL SERVICES 0200 0041 0409 0. 0.
0200 Total 57,617.57 57,617.57
1080 Total 402,159.21 375,804.35
1085 CUSTOMER SERVICE NON-PERSONNEL SERVICES 0100 0020 0201 0. 381.9
1085 CUSTOMER SERVICE NON-PERSONNEL SERVICES 0100 0040 0411 650. 0.
1085 CUSTOMER SERVICE NON-PERSONNEL SERVICES 0100 0070 0702 419.82 0.
0100 Total 1,069.82 381.9
1085 CUSTOMER SERVICE NON-PERSONNEL SERVICES 0200 0020 0201 0. 0.
1085 CUSTOMER SERVICE NON-PERSONNEL SERVICES 0200 0040 0408 302.93 0.
1085 CUSTOMER SERVICE NON-PERSONNEL SERVICES 0200 0070 0702 0. 0.
0200 Total 302.93 0.
1085 CUSTOMER SERVICE NON-PERSONNEL SERVICES 0450 0020 0201 -68.81 0.
1085 CUSTOMER SERVICE NON-PERSONNEL SERVICES 0450 0020 0205 1,250.78 1,181.97
1085 CUSTOMER SERVICE NON-PERSONNEL SERVICES 0450 0040 0401 0. 0.
1085 CUSTOMER SERVICE NON-PERSONNEL SERVICES 0450 0040 0408 383. 0.
1085 CUSTOMER SERVICE NON-PERSONNEL SERVICES 0450 0040 0411 2,619.5 2,619.5
1085 CUSTOMER SERVICE NON-PERSONNEL SERVICES 0450 0040 0425 0. 383.
1085 CUSTOMER SERVICE NON-PERSONNEL SERVICES 0450 0041 0409 2,441. 2,441.
1085 CUSTOMER SERVICE NON-PERSONNEL SERVICES 0450 0050 0501 2,263.67 2,263.67
1085 CUSTOMER SERVICE NON-PERSONNEL SERVICES 0450 0070 0702 0. 0.
0450 Total 8,889.14 8,889.14
1085 Total 10,261.89 9,271.04
1087 LANGUAGE ACCESS PERSONNEL SERVICES 0100 0011 0111 0. -120,924.99
1087 LANGUAGE ACCESS NON-PERSONNEL SERVICES 0100 0020 0201 0. 0.
1087 LANGUAGE ACCESS NON-PERSONNEL SERVICES 0100 0040 0408 0. -326.74
1087 LANGUAGE ACCESS NON-PERSONNEL SERVICES 0100 0041 0409 70,000. 159,718.27
0100 Total 70,000. 38,466.54
1087 LANGUAGE ACCESS PERSONNEL SERVICES 0200 0011 0111 114,051.46 114,051.46
1087 LANGUAGE ACCESS PERSONNEL SERVICES 0200 0014 0141 6,873.53 6,873.53
1087 LANGUAGE ACCESS NON-PERSONNEL SERVICES 0200 0040 0408 23.81 326.74
1087 LANGUAGE ACCESS NON-PERSONNEL SERVICES 0200 0041 0409 730. 730.
0200 Total 121,678.8 121,981.73
Page 9
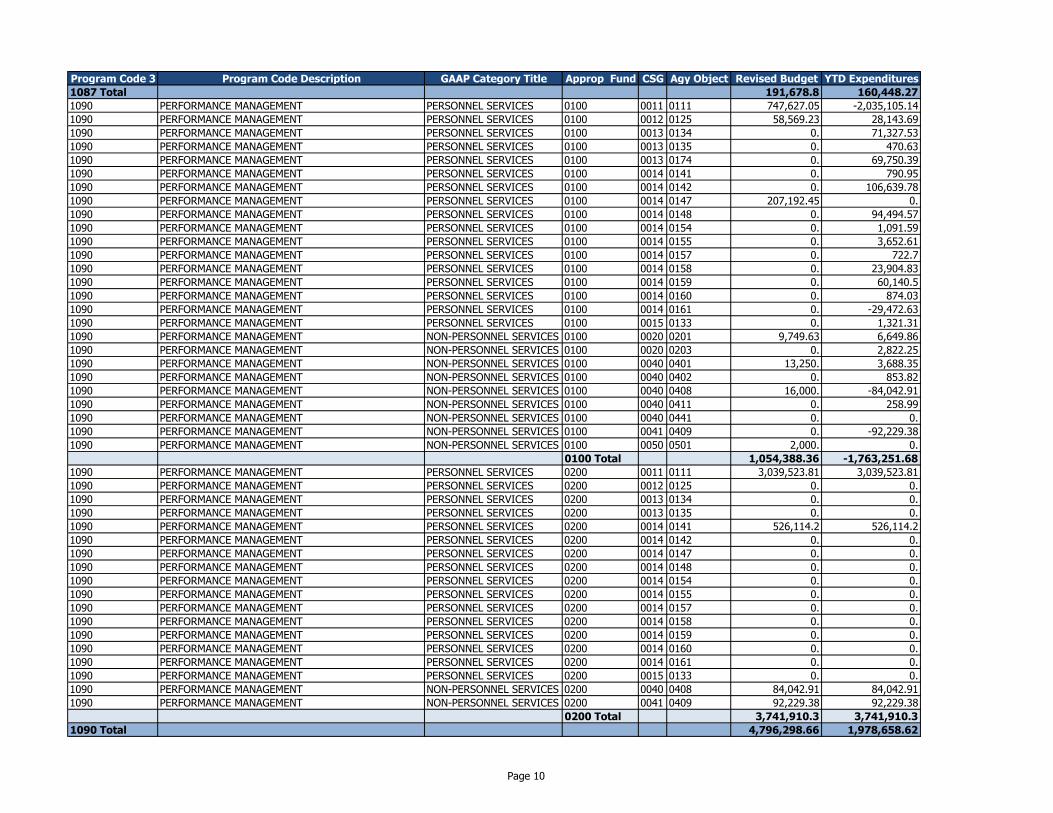
Program Code 3 Program Code Description GAAP Category Title Approp Fund CSG Agy Object Revised Budget YTD Expenditures
1087 Total 191,678.8 160,448.27
1090 PERFORMANCE MANAGEMENT PERSONNEL SERVICES 0100 0011 0111 747,627.05 -2,035,105.14
1090 PERFORMANCE MANAGEMENT PERSONNEL SERVICES 0100 0012 0125 58,569.23 28,143.69
1090 PERFORMANCE MANAGEMENT PERSONNEL SERVICES 0100 0013 0134 0. 71,327.53
1090 PERFORMANCE MANAGEMENT PERSONNEL SERVICES 0100 0013 0135 0. 470.63
1090 PERFORMANCE MANAGEMENT PERSONNEL SERVICES 0100 0013 0174 0. 69,750.39
1090 PERFORMANCE MANAGEMENT PERSONNEL SERVICES 0100 0014 0141 0. 790.95
1090 PERFORMANCE MANAGEMENT PERSONNEL SERVICES 0100 0014 0142 0. 106,639.78
1090 PERFORMANCE MANAGEMENT PERSONNEL SERVICES 0100 0014 0147 207,192.45 0.
1090 PERFORMANCE MANAGEMENT PERSONNEL SERVICES 0100 0014 0148 0. 94,494.57
1090 PERFORMANCE MANAGEMENT PERSONNEL SERVICES 0100 0014 0154 0. 1,091.59
1090 PERFORMANCE MANAGEMENT PERSONNEL SERVICES 0100 0014 0155 0. 3,652.61
1090 PERFORMANCE MANAGEMENT PERSONNEL SERVICES 0100 0014 0157 0. 722.7
1090 PERFORMANCE MANAGEMENT PERSONNEL SERVICES 0100 0014 0158 0. 23,904.83
1090 PERFORMANCE MANAGEMENT PERSONNEL SERVICES 0100 0014 0159 0. 60,140.5
1090 PERFORMANCE MANAGEMENT PERSONNEL SERVICES 0100 0014 0160 0. 874.03
1090 PERFORMANCE MANAGEMENT PERSONNEL SERVICES 0100 0014 0161 0. -29,472.63
1090 PERFORMANCE MANAGEMENT PERSONNEL SERVICES 0100 0015 0133 0. 1,321.31
1090 PERFORMANCE MANAGEMENT NON-PERSONNEL SERVICES 0100 0020 0201 9,749.63 6,649.86
1090 PERFORMANCE MANAGEMENT NON-PERSONNEL SERVICES 0100 0020 0203 0. 2,822.25
1090 PERFORMANCE MANAGEMENT NON-PERSONNEL SERVICES 0100 0040 0401 13,250. 3,688.35
1090 PERFORMANCE MANAGEMENT NON-PERSONNEL SERVICES 0100 0040 0402 0. 853.82
1090 PERFORMANCE MANAGEMENT NON-PERSONNEL SERVICES 0100 0040 0408 16,000. -84,042.91
1090 PERFORMANCE MANAGEMENT NON-PERSONNEL SERVICES 0100 0040 0411 0. 258.99
1090 PERFORMANCE MANAGEMENT NON-PERSONNEL SERVICES 0100 0040 0441 0. 0.
1090 PERFORMANCE MANAGEMENT NON-PERSONNEL SERVICES 0100 0041 0409 0. -92,229.38
1090 PERFORMANCE MANAGEMENT NON-PERSONNEL SERVICES 0100 0050 0501 2,000. 0.
0100 Total 1,054,388.36 -1,763,251.68
1090 PERFORMANCE MANAGEMENT PERSONNEL SERVICES 0200 0011 0111 3,039,523.81 3,039,523.81
1090 PERFORMANCE MANAGEMENT PERSONNEL SERVICES 0200 0012 0125 0. 0.
1090 PERFORMANCE MANAGEMENT PERSONNEL SERVICES 0200 0013 0134 0. 0.
1090 PERFORMANCE MANAGEMENT PERSONNEL SERVICES 0200 0013 0135 0. 0.
1090 PERFORMANCE MANAGEMENT PERSONNEL SERVICES 0200 0014 0141 526,114.2 526,114.2
1090 PERFORMANCE MANAGEMENT PERSONNEL SERVICES 0200 0014 0142 0. 0.
1090 PERFORMANCE MANAGEMENT PERSONNEL SERVICES 0200 0014 0147 0. 0.
1090 PERFORMANCE MANAGEMENT PERSONNEL SERVICES 0200 0014 0148 0. 0.
1090 PERFORMANCE MANAGEMENT PERSONNEL SERVICES 0200 0014 0154 0. 0.
1090 PERFORMANCE MANAGEMENT PERSONNEL SERVICES 0200 0014 0155 0. 0.
1090 PERFORMANCE MANAGEMENT PERSONNEL SERVICES 0200 0014 0157 0. 0.
1090 PERFORMANCE MANAGEMENT PERSONNEL SERVICES 0200 0014 0158 0. 0.
1090 PERFORMANCE MANAGEMENT PERSONNEL SERVICES 0200 0014 0159 0. 0.
1090 PERFORMANCE MANAGEMENT PERSONNEL SERVICES 0200 0014 0160 0. 0.
1090 PERFORMANCE MANAGEMENT PERSONNEL SERVICES 0200 0014 0161 0. 0.
1090 PERFORMANCE MANAGEMENT PERSONNEL SERVICES 0200 0015 0133 0. 0.
1090 PERFORMANCE MANAGEMENT NON-PERSONNEL SERVICES 0200 0040 0408 84,042.91 84,042.91
1090 PERFORMANCE MANAGEMENT NON-PERSONNEL SERVICES 0200 0041 0409 92,229.38 92,229.38
0200 Total 3,741,910.3 3,741,910.3
1090 Total 4,796,298.66 1,978,658.62
Page 10
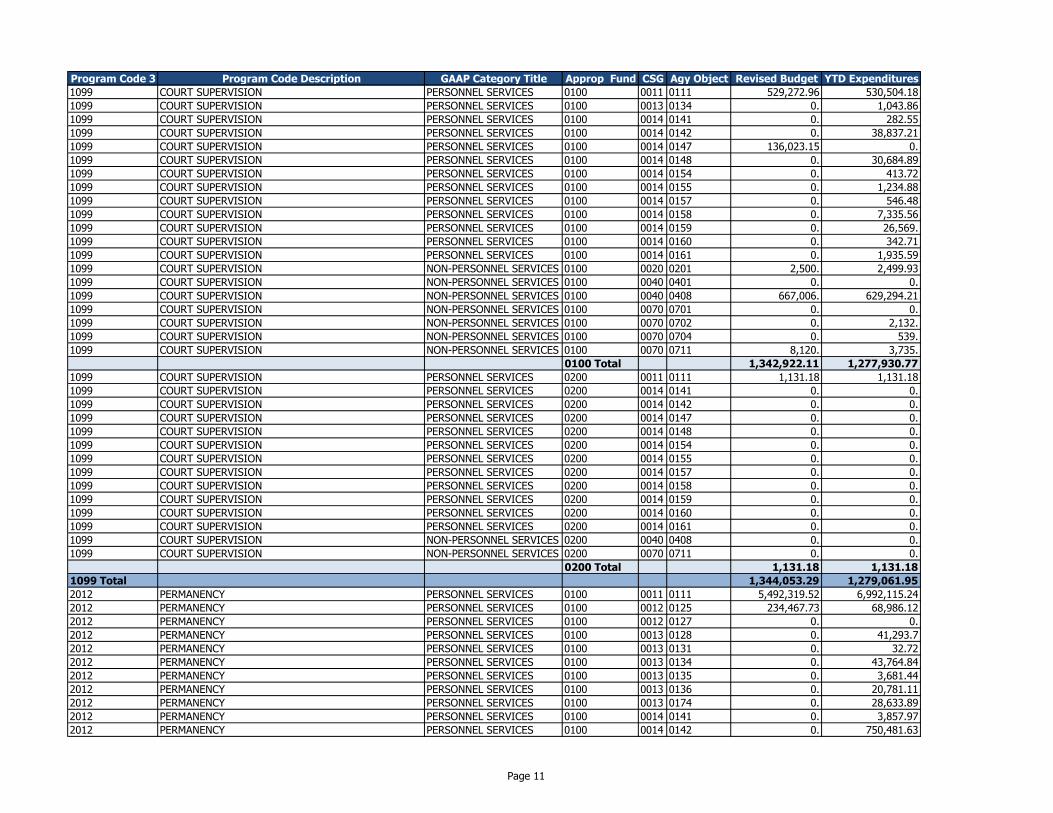
Program Code 3 Program Code Description GAAP Category Title Approp Fund CSG Agy Object Revised Budget YTD Expenditures
1099 COURT SUPERVISION PERSONNEL SERVICES 0100 0011 0111 529,272.96 530,504.18
1099 COURT SUPERVISION PERSONNEL SERVICES 0100 0013 0134 0. 1,043.86
1099 COURT SUPERVISION PERSONNEL SERVICES 0100 0014 0141 0. 282.55
1099 COURT SUPERVISION PERSONNEL SERVICES 0100 0014 0142 0. 38,837.21
1099 COURT SUPERVISION PERSONNEL SERVICES 0100 0014 0147 136,023.15 0.
1099 COURT SUPERVISION PERSONNEL SERVICES 0100 0014 0148 0. 30,684.89
1099 COURT SUPERVISION PERSONNEL SERVICES 0100 0014 0154 0. 413.72
1099 COURT SUPERVISION PERSONNEL SERVICES 0100 0014 0155 0. 1,234.88
1099 COURT SUPERVISION PERSONNEL SERVICES 0100 0014 0157 0. 546.48
1099 COURT SUPERVISION PERSONNEL SERVICES 0100 0014 0158 0. 7,335.56
1099 COURT SUPERVISION PERSONNEL SERVICES 0100 0014 0159 0. 26,569.
1099 COURT SUPERVISION PERSONNEL SERVICES 0100 0014 0160 0. 342.71
1099 COURT SUPERVISION PERSONNEL SERVICES 0100 0014 0161 0. 1,935.59
1099 COURT SUPERVISION NON-PERSONNEL SERVICES 0100 0020 0201 2,500. 2,499.93
1099 COURT SUPERVISION NON-PERSONNEL SERVICES 0100 0040 0401 0. 0.
1099 COURT SUPERVISION NON-PERSONNEL SERVICES 0100 0040 0408 667,006. 629,294.21
1099 COURT SUPERVISION NON-PERSONNEL SERVICES 0100 0070 0701 0. 0.
1099 COURT SUPERVISION NON-PERSONNEL SERVICES 0100 0070 0702 0. 2,132.
1099 COURT SUPERVISION NON-PERSONNEL SERVICES 0100 0070 0704 0. 539.
1099 COURT SUPERVISION NON-PERSONNEL SERVICES 0100 0070 0711 8,120. 3,735.
0100 Total 1,342,922.11 1,277,930.77
1099 COURT SUPERVISION PERSONNEL SERVICES 0200 0011 0111 1,131.18 1,131.18
1099 COURT SUPERVISION PERSONNEL SERVICES 0200 0014 0141 0. 0.
1099 COURT SUPERVISION PERSONNEL SERVICES 0200 0014 0142 0. 0.
1099 COURT SUPERVISION PERSONNEL SERVICES 0200 0014 0147 0. 0.
1099 COURT SUPERVISION PERSONNEL SERVICES 0200 0014 0148 0. 0.
1099 COURT SUPERVISION PERSONNEL SERVICES 0200 0014 0154 0. 0.
1099 COURT SUPERVISION PERSONNEL SERVICES 0200 0014 0155 0. 0.
1099 COURT SUPERVISION PERSONNEL SERVICES 0200 0014 0157 0. 0.
1099 COURT SUPERVISION PERSONNEL SERVICES 0200 0014 0158 0. 0.
1099 COURT SUPERVISION PERSONNEL SERVICES 0200 0014 0159 0. 0.
1099 COURT SUPERVISION PERSONNEL SERVICES 0200 0014 0160 0. 0.
1099 COURT SUPERVISION PERSONNEL SERVICES 0200 0014 0161 0. 0.
1099 COURT SUPERVISION NON-PERSONNEL SERVICES 0200 0040 0408 0. 0.
1099 COURT SUPERVISION NON-PERSONNEL SERVICES 0200 0070 0711 0. 0.
0200 Total 1,131.18 1,131.18
1099 Total 1,344,053.29 1,279,061.95
2012 PERMANENCY PERSONNEL SERVICES 0100 0011 0111 5,492,319.52 6,992,115.24
2012 PERMANENCY PERSONNEL SERVICES 0100 0012 0125 234,467.73 68,986.12
2012 PERMANENCY PERSONNEL SERVICES 0100 0012 0127 0. 0.
2012 PERMANENCY PERSONNEL SERVICES 0100 0013 0128 0. 41,293.7
2012 PERMANENCY PERSONNEL SERVICES 0100 0013 0131 0. 32.72
2012 PERMANENCY PERSONNEL SERVICES 0100 0013 0134 0. 43,764.84
2012 PERMANENCY PERSONNEL SERVICES 0100 0013 0135 0. 3,681.44
2012 PERMANENCY PERSONNEL SERVICES 0100 0013 0136 0. 20,781.11
2012 PERMANENCY PERSONNEL SERVICES 0100 0013 0174 0. 28,633.89
2012 PERMANENCY PERSONNEL SERVICES 0100 0014 0141 0. 3,857.97
2012 PERMANENCY PERSONNEL SERVICES 0100 0014 0142 0. 750,481.63
Page 11
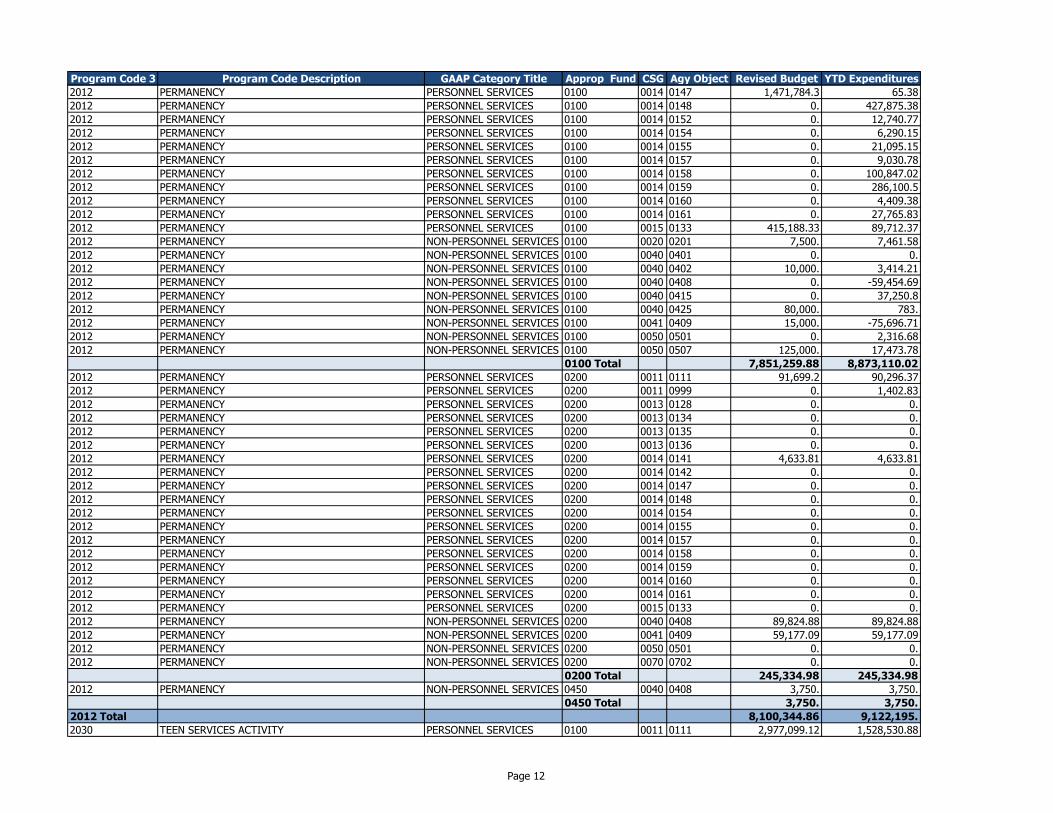
Program Code 3 Program Code Description GAAP Category Title Approp Fund CSG Agy Object Revised Budget YTD Expenditures
2012 PERMANENCY PERSONNEL SERVICES 0100 0014 0147 1,471,784.3 65.38
2012 PERMANENCY PERSONNEL SERVICES 0100 0014 0148 0. 427,875.38
2012 PERMANENCY PERSONNEL SERVICES 0100 0014 0152 0. 12,740.77
2012 PERMANENCY PERSONNEL SERVICES 0100 0014 0154 0. 6,290.15
2012 PERMANENCY PERSONNEL SERVICES 0100 0014 0155 0. 21,095.15
2012 PERMANENCY PERSONNEL SERVICES 0100 0014 0157 0. 9,030.78
2012 PERMANENCY PERSONNEL SERVICES 0100 0014 0158 0. 100,847.02
2012 PERMANENCY PERSONNEL SERVICES 0100 0014 0159 0. 286,100.5
2012 PERMANENCY PERSONNEL SERVICES 0100 0014 0160 0. 4,409.38
2012 PERMANENCY PERSONNEL SERVICES 0100 0014 0161 0. 27,765.83
2012 PERMANENCY PERSONNEL SERVICES 0100 0015 0133 415,188.33 89,712.37
2012 PERMANENCY NON-PERSONNEL SERVICES 0100 0020 0201 7,500. 7,461.58
2012 PERMANENCY NON-PERSONNEL SERVICES 0100 0040 0401 0. 0.
2012 PERMANENCY NON-PERSONNEL SERVICES 0100 0040 0402 10,000. 3,414.21
2012 PERMANENCY NON-PERSONNEL SERVICES 0100 0040 0408 0. -59,454.69
2012 PERMANENCY NON-PERSONNEL SERVICES 0100 0040 0415 0. 37,250.8
2012 PERMANENCY NON-PERSONNEL SERVICES 0100 0040 0425 80,000. 783.
2012 PERMANENCY NON-PERSONNEL SERVICES 0100 0041 0409 15,000. -75,696.71
2012 PERMANENCY NON-PERSONNEL SERVICES 0100 0050 0501 0. 2,316.68
2012 PERMANENCY NON-PERSONNEL SERVICES 0100 0050 0507 125,000. 17,473.78
0100 Total 7,851,259.88 8,873,110.02
2012 PERMANENCY PERSONNEL SERVICES 0200 0011 0111 91,699.2 90,296.37
2012 PERMANENCY PERSONNEL SERVICES 0200 0011 0999 0. 1,402.83
2012 PERMANENCY PERSONNEL SERVICES 0200 0013 0128 0. 0.
2012 PERMANENCY PERSONNEL SERVICES 0200 0013 0134 0. 0.
2012 PERMANENCY PERSONNEL SERVICES 0200 0013 0135 0. 0.
2012 PERMANENCY PERSONNEL SERVICES 0200 0013 0136 0. 0.
2012 PERMANENCY PERSONNEL SERVICES 0200 0014 0141 4,633.81 4,633.81
2012 PERMANENCY PERSONNEL SERVICES 0200 0014 0142 0. 0.
2012 PERMANENCY PERSONNEL SERVICES 0200 0014 0147 0. 0.
2012 PERMANENCY PERSONNEL SERVICES 0200 0014 0148 0. 0.
2012 PERMANENCY PERSONNEL SERVICES 0200 0014 0154 0. 0.
2012 PERMANENCY PERSONNEL SERVICES 0200 0014 0155 0. 0.
2012 PERMANENCY PERSONNEL SERVICES 0200 0014 0157 0. 0.
2012 PERMANENCY PERSONNEL SERVICES 0200 0014 0158 0. 0.
2012 PERMANENCY PERSONNEL SERVICES 0200 0014 0159 0. 0.
2012 PERMANENCY PERSONNEL SERVICES 0200 0014 0160 0. 0.
2012 PERMANENCY PERSONNEL SERVICES 0200 0014 0161 0. 0.
2012 PERMANENCY PERSONNEL SERVICES 0200 0015 0133 0. 0.
2012 PERMANENCY NON-PERSONNEL SERVICES 0200 0040 0408 89,824.88 89,824.88
2012 PERMANENCY NON-PERSONNEL SERVICES 0200 0041 0409 59,177.09 59,177.09
2012 PERMANENCY NON-PERSONNEL SERVICES 0200 0050 0501 0. 0.
2012 PERMANENCY NON-PERSONNEL SERVICES 0200 0070 0702 0. 0.
0200 Total 245,334.98 245,334.98
2012 PERMANENCY NON-PERSONNEL SERVICES 0450 0040 0408 3,750. 3,750.
0450 Total 3,750. 3,750.
2012 Total 8,100,344.86 9,122,195.
2030 TEEN SERVICES ACTIVITY PERSONNEL SERVICES 0100 0011 0111 2,977,099.12 1,528,530.88
Page 12
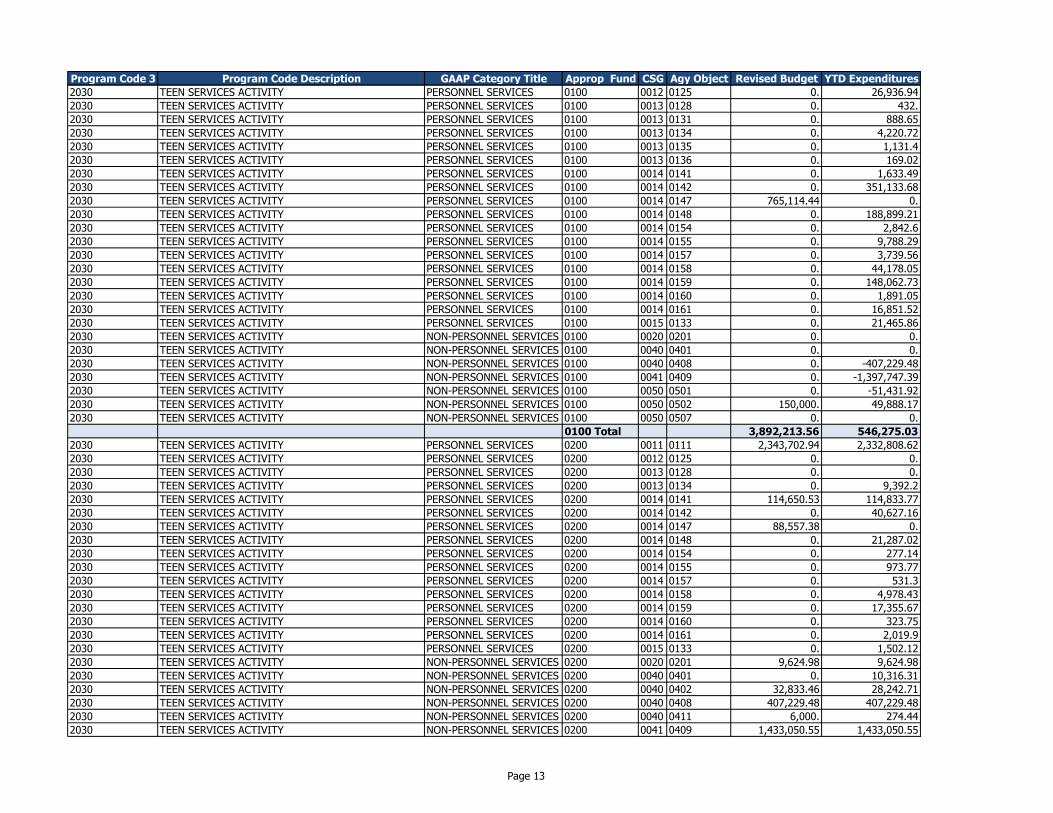
Program Code 3 Program Code Description GAAP Category Title Approp Fund CSG Agy Object Revised Budget YTD Expenditures
2030 TEEN SERVICES ACTIVITY PERSONNEL SERVICES 0100 0012 0125 0. 26,936.94
2030 TEEN SERVICES ACTIVITY PERSONNEL SERVICES 0100 0013 0128 0. 432.
2030 TEEN SERVICES ACTIVITY PERSONNEL SERVICES 0100 0013 0131 0. 888.65
2030 TEEN SERVICES ACTIVITY PERSONNEL SERVICES 0100 0013 0134 0. 4,220.72
2030 TEEN SERVICES ACTIVITY PERSONNEL SERVICES 0100 0013 0135 0. 1,131.4
2030 TEEN SERVICES ACTIVITY PERSONNEL SERVICES 0100 0013 0136 0. 169.02
2030 TEEN SERVICES ACTIVITY PERSONNEL SERVICES 0100 0014 0141 0. 1,633.49
2030 TEEN SERVICES ACTIVITY PERSONNEL SERVICES 0100 0014 0142 0. 351,133.68
2030 TEEN SERVICES ACTIVITY PERSONNEL SERVICES 0100 0014 0147 765,114.44 0.
2030 TEEN SERVICES ACTIVITY PERSONNEL SERVICES 0100 0014 0148 0. 188,899.21
2030 TEEN SERVICES ACTIVITY PERSONNEL SERVICES 0100 0014 0154 0. 2,842.6
2030 TEEN SERVICES ACTIVITY PERSONNEL SERVICES 0100 0014 0155 0. 9,788.29
2030 TEEN SERVICES ACTIVITY PERSONNEL SERVICES 0100 0014 0157 0. 3,739.56
2030 TEEN SERVICES ACTIVITY PERSONNEL SERVICES 0100 0014 0158 0. 44,178.05
2030 TEEN SERVICES ACTIVITY PERSONNEL SERVICES 0100 0014 0159 0. 148,062.73
2030 TEEN SERVICES ACTIVITY PERSONNEL SERVICES 0100 0014 0160 0. 1,891.05
2030 TEEN SERVICES ACTIVITY PERSONNEL SERVICES 0100 0014 0161 0. 16,851.52
2030 TEEN SERVICES ACTIVITY PERSONNEL SERVICES 0100 0015 0133 0. 21,465.86
2030 TEEN SERVICES ACTIVITY NON-PERSONNEL SERVICES 0100 0020 0201 0. 0.
2030 TEEN SERVICES ACTIVITY NON-PERSONNEL SERVICES 0100 0040 0401 0. 0.
2030 TEEN SERVICES ACTIVITY NON-PERSONNEL SERVICES 0100 0040 0408 0. -407,229.48
2030 TEEN SERVICES ACTIVITY NON-PERSONNEL SERVICES 0100 0041 0409 0. -1,397,747.39
2030 TEEN SERVICES ACTIVITY NON-PERSONNEL SERVICES 0100 0050 0501 0. -51,431.92
2030 TEEN SERVICES ACTIVITY NON-PERSONNEL SERVICES 0100 0050 0502 150,000. 49,888.17
2030 TEEN SERVICES ACTIVITY NON-PERSONNEL SERVICES 0100 0050 0507 0. 0.
0100 Total 3,892,213.56 546,275.03
2030 TEEN SERVICES ACTIVITY PERSONNEL SERVICES 0200 0011 0111 2,343,702.94 2,332,808.62
2030 TEEN SERVICES ACTIVITY PERSONNEL SERVICES 0200 0012 0125 0. 0.
2030 TEEN SERVICES ACTIVITY PERSONNEL SERVICES 0200 0013 0128 0. 0.
2030 TEEN SERVICES ACTIVITY PERSONNEL SERVICES 0200 0013 0134 0. 9,392.2
2030 TEEN SERVICES ACTIVITY PERSONNEL SERVICES 0200 0014 0141 114,650.53 114,833.77
2030 TEEN SERVICES ACTIVITY PERSONNEL SERVICES 0200 0014 0142 0. 40,627.16
2030 TEEN SERVICES ACTIVITY PERSONNEL SERVICES 0200 0014 0147 88,557.38 0.
2030 TEEN SERVICES ACTIVITY PERSONNEL SERVICES 0200 0014 0148 0. 21,287.02
2030 TEEN SERVICES ACTIVITY PERSONNEL SERVICES 0200 0014 0154 0. 277.14
2030 TEEN SERVICES ACTIVITY PERSONNEL SERVICES 0200 0014 0155 0. 973.77
2030 TEEN SERVICES ACTIVITY PERSONNEL SERVICES 0200 0014 0157 0. 531.3
2030 TEEN SERVICES ACTIVITY PERSONNEL SERVICES 0200 0014 0158 0. 4,978.43
2030 TEEN SERVICES ACTIVITY PERSONNEL SERVICES 0200 0014 0159 0. 17,355.67
2030 TEEN SERVICES ACTIVITY PERSONNEL SERVICES 0200 0014 0160 0. 323.75
2030 TEEN SERVICES ACTIVITY PERSONNEL SERVICES 0200 0014 0161 0. 2,019.9
2030 TEEN SERVICES ACTIVITY PERSONNEL SERVICES 0200 0015 0133 0. 1,502.12
2030 TEEN SERVICES ACTIVITY NON-PERSONNEL SERVICES 0200 0020 0201 9,624.98 9,624.98
2030 TEEN SERVICES ACTIVITY NON-PERSONNEL SERVICES 0200 0040 0401 0. 10,316.31
2030 TEEN SERVICES ACTIVITY NON-PERSONNEL SERVICES 0200 0040 0402 32,833.46 28,242.71
2030 TEEN SERVICES ACTIVITY NON-PERSONNEL SERVICES 0200 0040 0408 407,229.48 407,229.48
2030 TEEN SERVICES ACTIVITY NON-PERSONNEL SERVICES 0200 0040 0411 6,000. 274.44
2030 TEEN SERVICES ACTIVITY NON-PERSONNEL SERVICES 0200 0041 0409 1,433,050.55 1,433,050.55
Page 13
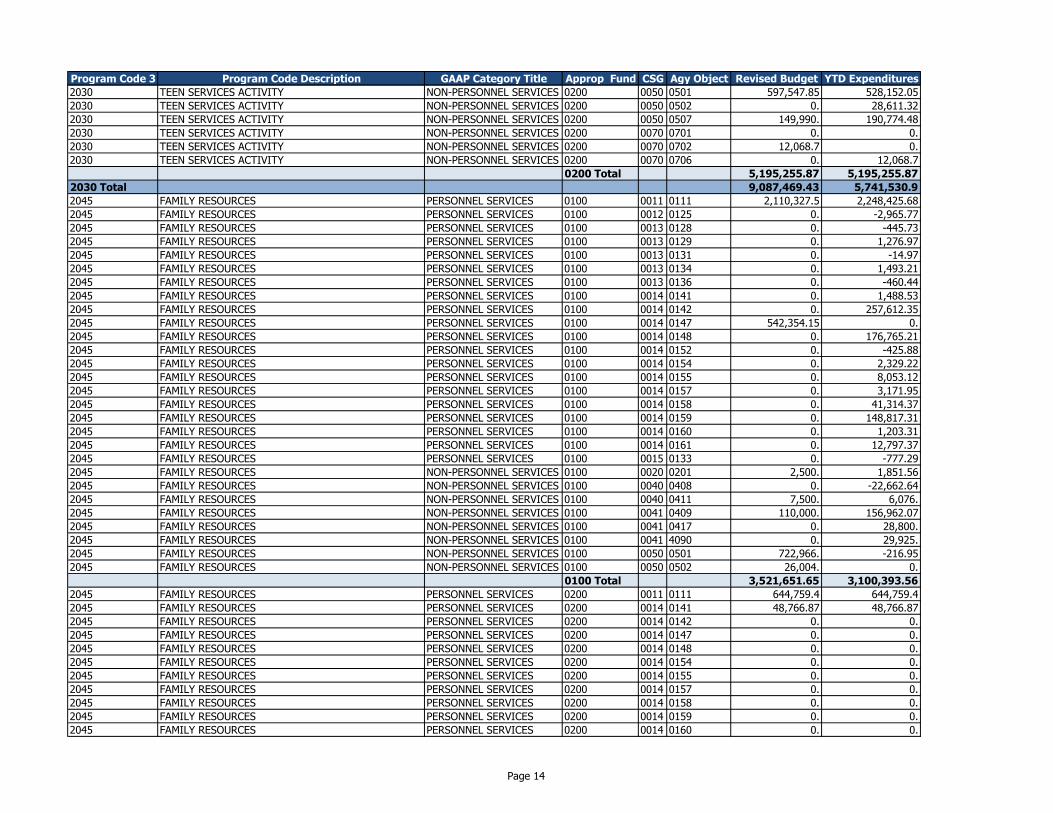
Program Code 3 Program Code Description GAAP Category Title Approp Fund CSG Agy Object Revised Budget YTD Expenditures
2030 TEEN SERVICES ACTIVITY NON-PERSONNEL SERVICES 0200 0050 0501 597,547.85 528,152.05
2030 TEEN SERVICES ACTIVITY NON-PERSONNEL SERVICES 0200 0050 0502 0. 28,611.32
2030 TEEN SERVICES ACTIVITY NON-PERSONNEL SERVICES 0200 0050 0507 149,990. 190,774.48
2030 TEEN SERVICES ACTIVITY NON-PERSONNEL SERVICES 0200 0070 0701 0. 0.
2030 TEEN SERVICES ACTIVITY NON-PERSONNEL SERVICES 0200 0070 0702 12,068.7 0.
2030 TEEN SERVICES ACTIVITY NON-PERSONNEL SERVICES 0200 0070 0706 0. 12,068.7
0200 Total 5,195,255.87 5,195,255.87
2030 Total 9,087,469.43 5,741,530.9
2045 FAMILY RESOURCES PERSONNEL SERVICES 0100 0011 0111 2,110,327.5 2,248,425.68
2045 FAMILY RESOURCES PERSONNEL SERVICES 0100 0012 0125 0. -2,965.77
2045 FAMILY RESOURCES PERSONNEL SERVICES 0100 0013 0128 0. -445.73
2045 FAMILY RESOURCES PERSONNEL SERVICES 0100 0013 0129 0. 1,276.97
2045 FAMILY RESOURCES PERSONNEL SERVICES 0100 0013 0131 0. -14.97
2045 FAMILY RESOURCES PERSONNEL SERVICES 0100 0013 0134 0. 1,493.21
2045 FAMILY RESOURCES PERSONNEL SERVICES 0100 0013 0136 0. -460.44
2045 FAMILY RESOURCES PERSONNEL SERVICES 0100 0014 0141 0. 1,488.53
2045 FAMILY RESOURCES PERSONNEL SERVICES 0100 0014 0142 0. 257,612.35
2045 FAMILY RESOURCES PERSONNEL SERVICES 0100 0014 0147 542,354.15 0.
2045 FAMILY RESOURCES PERSONNEL SERVICES 0100 0014 0148 0. 176,765.21
2045 FAMILY RESOURCES PERSONNEL SERVICES 0100 0014 0152 0. -425.88
2045 FAMILY RESOURCES PERSONNEL SERVICES 0100 0014 0154 0. 2,329.22
2045 FAMILY RESOURCES PERSONNEL SERVICES 0100 0014 0155 0. 8,053.12
2045 FAMILY RESOURCES PERSONNEL SERVICES 0100 0014 0157 0. 3,171.95
2045 FAMILY RESOURCES PERSONNEL SERVICES 0100 0014 0158 0. 41,314.37
2045 FAMILY RESOURCES PERSONNEL SERVICES 0100 0014 0159 0. 148,817.31
2045 FAMILY RESOURCES PERSONNEL SERVICES 0100 0014 0160 0. 1,203.31
2045 FAMILY RESOURCES PERSONNEL SERVICES 0100 0014 0161 0. 12,797.37
2045 FAMILY RESOURCES PERSONNEL SERVICES 0100 0015 0133 0. -777.29
2045 FAMILY RESOURCES NON-PERSONNEL SERVICES 0100 0020 0201 2,500. 1,851.56
2045 FAMILY RESOURCES NON-PERSONNEL SERVICES 0100 0040 0408 0. -22,662.64
2045 FAMILY RESOURCES NON-PERSONNEL SERVICES 0100 0040 0411 7,500. 6,076.
2045 FAMILY RESOURCES NON-PERSONNEL SERVICES 0100 0041 0409 110,000. 156,962.07
2045 FAMILY RESOURCES NON-PERSONNEL SERVICES 0100 0041 0417 0. 28,800.
2045 FAMILY RESOURCES NON-PERSONNEL SERVICES 0100 0041 4090 0. 29,925.
2045 FAMILY RESOURCES NON-PERSONNEL SERVICES 0100 0050 0501 722,966. -216.95
2045 FAMILY RESOURCES NON-PERSONNEL SERVICES 0100 0050 0502 26,004. 0.
0100 Total 3,521,651.65 3,100,393.56
2045 FAMILY RESOURCES PERSONNEL SERVICES 0200 0011 0111 644,759.4 644,759.4
2045 FAMILY RESOURCES PERSONNEL SERVICES 0200 0014 0141 48,766.87 48,766.87
2045 FAMILY RESOURCES PERSONNEL SERVICES 0200 0014 0142 0. 0.
2045 FAMILY RESOURCES PERSONNEL SERVICES 0200 0014 0147 0. 0.
2045 FAMILY RESOURCES PERSONNEL SERVICES 0200 0014 0148 0. 0.
2045 FAMILY RESOURCES PERSONNEL SERVICES 0200 0014 0154 0. 0.
2045 FAMILY RESOURCES PERSONNEL SERVICES 0200 0014 0155 0. 0.
2045 FAMILY RESOURCES PERSONNEL SERVICES 0200 0014 0157 0. 0.
2045 FAMILY RESOURCES PERSONNEL SERVICES 0200 0014 0158 0. 0.
2045 FAMILY RESOURCES PERSONNEL SERVICES 0200 0014 0159 0. 0.
2045 FAMILY RESOURCES PERSONNEL SERVICES 0200 0014 0160 0. 0.
Page 14
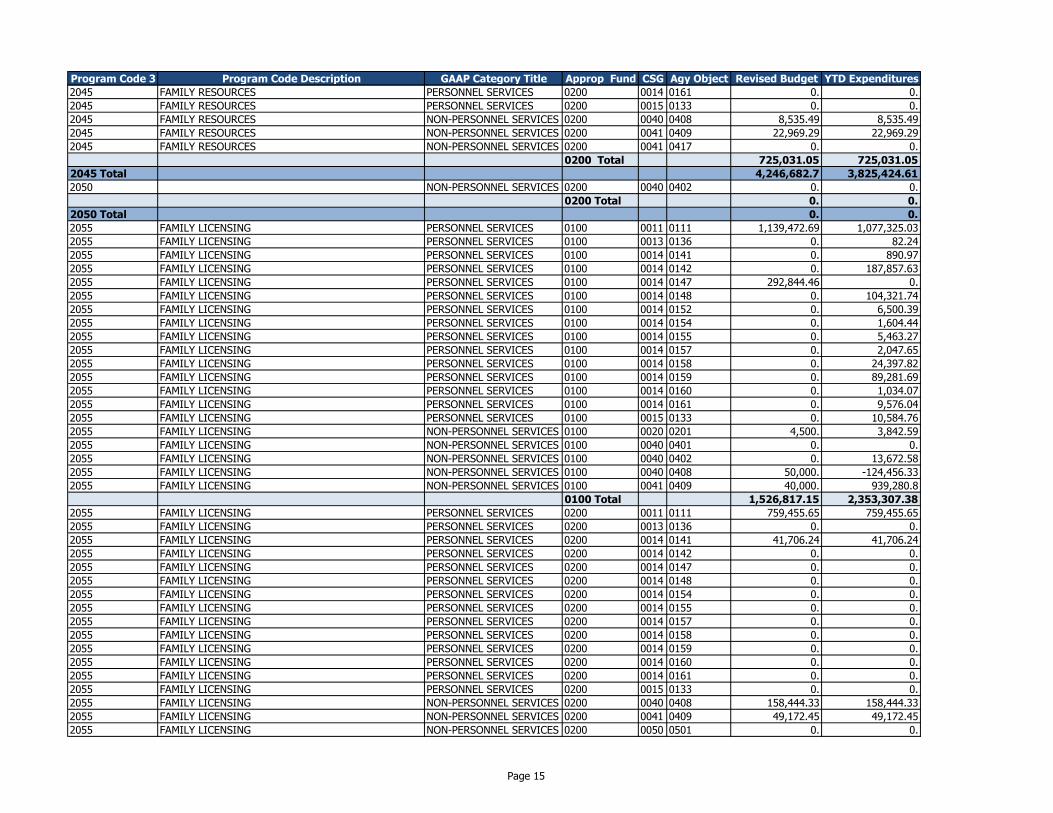
Program Code 3 Program Code Description GAAP Category Title Approp Fund CSG Agy Object Revised Budget YTD Expenditures
2045 FAMILY RESOURCES PERSONNEL SERVICES 0200 0014 0161 0. 0.
2045 FAMILY RESOURCES PERSONNEL SERVICES 0200 0015 0133 0. 0.
2045 FAMILY RESOURCES NON-PERSONNEL SERVICES 0200 0040 0408 8,535.49 8,535.49
2045 FAMILY RESOURCES NON-PERSONNEL SERVICES 0200 0041 0409 22,969.29 22,969.29
2045 FAMILY RESOURCES NON-PERSONNEL SERVICES 0200 0041 0417 0. 0.
0200 Total 725,031.05 725,031.05
2045 Total 4,246,682.7 3,825,424.61
2050 NON-PERSONNEL SERVICES 0200 0040 0402 0. 0.
0200 Total 0. 0.
2050 Total 0. 0.
2055 FAMILY LICENSING PERSONNEL SERVICES 0100 0011 0111 1,139,472.69 1,077,325.03
2055 FAMILY LICENSING PERSONNEL SERVICES 0100 0013 0136 0. 82.24
2055 FAMILY LICENSING PERSONNEL SERVICES 0100 0014 0141 0. 890.97
2055 FAMILY LICENSING PERSONNEL SERVICES 0100 0014 0142 0. 187,857.63
2055 FAMILY LICENSING PERSONNEL SERVICES 0100 0014 0147 292,844.46 0.
2055 FAMILY LICENSING PERSONNEL SERVICES 0100 0014 0148 0. 104,321.74
2055 FAMILY LICENSING PERSONNEL SERVICES 0100 0014 0152 0. 6,500.39
2055 FAMILY LICENSING PERSONNEL SERVICES 0100 0014 0154 0. 1,604.44
2055 FAMILY LICENSING PERSONNEL SERVICES 0100 0014 0155 0. 5,463.27
2055 FAMILY LICENSING PERSONNEL SERVICES 0100 0014 0157 0. 2,047.65
2055 FAMILY LICENSING PERSONNEL SERVICES 0100 0014 0158 0. 24,397.82
2055 FAMILY LICENSING PERSONNEL SERVICES 0100 0014 0159 0. 89,281.69
2055 FAMILY LICENSING PERSONNEL SERVICES 0100 0014 0160 0. 1,034.07
2055 FAMILY LICENSING PERSONNEL SERVICES 0100 0014 0161 0. 9,576.04
2055 FAMILY LICENSING PERSONNEL SERVICES 0100 0015 0133 0. 10,584.76
2055 FAMILY LICENSING NON-PERSONNEL SERVICES 0100 0020 0201 4,500. 3,842.59
2055 FAMILY LICENSING NON-PERSONNEL SERVICES 0100 0040 0401 0. 0.
2055 FAMILY LICENSING NON-PERSONNEL SERVICES 0100 0040 0402 0. 13,672.58
2055 FAMILY LICENSING NON-PERSONNEL SERVICES 0100 0040 0408 50,000. -124,456.33
2055 FAMILY LICENSING NON-PERSONNEL SERVICES 0100 0041 0409 40,000. 939,280.8
0100 Total 1,526,817.15 2,353,307.38
2055 FAMILY LICENSING PERSONNEL SERVICES 0200 0011 0111 759,455.65 759,455.65
2055 FAMILY LICENSING PERSONNEL SERVICES 0200 0013 0136 0. 0.
2055 FAMILY LICENSING PERSONNEL SERVICES 0200 0014 0141 41,706.24 41,706.24
2055 FAMILY LICENSING PERSONNEL SERVICES 0200 0014 0142 0. 0.
2055 FAMILY LICENSING PERSONNEL SERVICES 0200 0014 0147 0. 0.
2055 FAMILY LICENSING PERSONNEL SERVICES 0200 0014 0148 0. 0.
2055 FAMILY LICENSING PERSONNEL SERVICES 0200 0014 0154 0. 0.
2055 FAMILY LICENSING PERSONNEL SERVICES 0200 0014 0155 0. 0.
2055 FAMILY LICENSING PERSONNEL SERVICES 0200 0014 0157 0. 0.
2055 FAMILY LICENSING PERSONNEL SERVICES 0200 0014 0158 0. 0.
2055 FAMILY LICENSING PERSONNEL SERVICES 0200 0014 0159 0. 0.
2055 FAMILY LICENSING PERSONNEL SERVICES 0200 0014 0160 0. 0.
2055 FAMILY LICENSING PERSONNEL SERVICES 0200 0014 0161 0. 0.
2055 FAMILY LICENSING PERSONNEL SERVICES 0200 0015 0133 0. 0.
2055 FAMILY LICENSING NON-PERSONNEL SERVICES 0200 0040 0408 158,444.33 158,444.33
2055 FAMILY LICENSING NON-PERSONNEL SERVICES 0200 0041 0409 49,172.45 49,172.45
2055 FAMILY LICENSING NON-PERSONNEL SERVICES 0200 0050 0501 0. 0.
Page 15
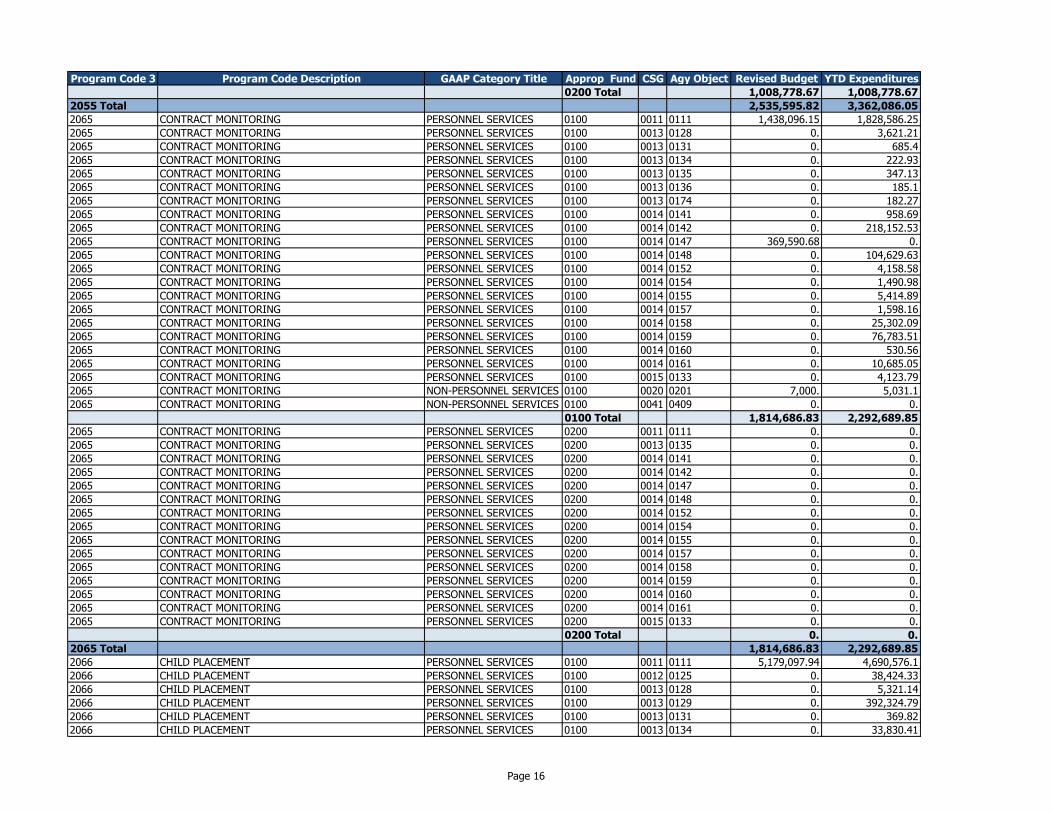
Program Code 3 Program Code Description GAAP Category Title Approp Fund CSG Agy Object Revised Budget YTD Expenditures
0200 Total 1,008,778.67 1,008,778.67
2055 Total 2,535,595.82 3,362,086.05
2065 CONTRACT MONITORING PERSONNEL SERVICES 0100 0011 0111 1,438,096.15 1,828,586.25
2065 CONTRACT MONITORING PERSONNEL SERVICES 0100 0013 0128 0. 3,621.21
2065 CONTRACT MONITORING PERSONNEL SERVICES 0100 0013 0131 0. 685.4
2065 CONTRACT MONITORING PERSONNEL SERVICES 0100 0013 0134 0. 222.93
2065 CONTRACT MONITORING PERSONNEL SERVICES 0100 0013 0135 0. 347.13
2065 CONTRACT MONITORING PERSONNEL SERVICES 0100 0013 0136 0. 185.1
2065 CONTRACT MONITORING PERSONNEL SERVICES 0100 0013 0174 0. 182.27
2065 CONTRACT MONITORING PERSONNEL SERVICES 0100 0014 0141 0. 958.69
2065 CONTRACT MONITORING PERSONNEL SERVICES 0100 0014 0142 0. 218,152.53
2065 CONTRACT MONITORING PERSONNEL SERVICES 0100 0014 0147 369,590.68 0.
2065 CONTRACT MONITORING PERSONNEL SERVICES 0100 0014 0148 0. 104,629.63
2065 CONTRACT MONITORING PERSONNEL SERVICES 0100 0014 0152 0. 4,158.58
2065 CONTRACT MONITORING PERSONNEL SERVICES 0100 0014 0154 0. 1,490.98
2065 CONTRACT MONITORING PERSONNEL SERVICES 0100 0014 0155 0. 5,414.89
2065 CONTRACT MONITORING PERSONNEL SERVICES 0100 0014 0157 0. 1,598.16
2065 CONTRACT MONITORING PERSONNEL SERVICES 0100 0014 0158 0. 25,302.09
2065 CONTRACT MONITORING PERSONNEL SERVICES 0100 0014 0159 0. 76,783.51
2065 CONTRACT MONITORING PERSONNEL SERVICES 0100 0014 0160 0. 530.56
2065 CONTRACT MONITORING PERSONNEL SERVICES 0100 0014 0161 0. 10,685.05
2065 CONTRACT MONITORING PERSONNEL SERVICES 0100 0015 0133 0. 4,123.79
2065 CONTRACT MONITORING NON-PERSONNEL SERVICES 0100 0020 0201 7,000. 5,031.1
2065 CONTRACT MONITORING NON-PERSONNEL SERVICES 0100 0041 0409 0. 0.
0100 Total 1,814,686.83 2,292,689.85
2065 CONTRACT MONITORING PERSONNEL SERVICES 0200 0011 0111 0. 0.
2065 CONTRACT MONITORING PERSONNEL SERVICES 0200 0013 0135 0. 0.
2065 CONTRACT MONITORING PERSONNEL SERVICES 0200 0014 0141 0. 0.
2065 CONTRACT MONITORING PERSONNEL SERVICES 0200 0014 0142 0. 0.
2065 CONTRACT MONITORING PERSONNEL SERVICES 0200 0014 0147 0. 0.
2065 CONTRACT MONITORING PERSONNEL SERVICES 0200 0014 0148 0. 0.
2065 CONTRACT MONITORING PERSONNEL SERVICES 0200 0014 0152 0. 0.
2065 CONTRACT MONITORING PERSONNEL SERVICES 0200 0014 0154 0. 0.
2065 CONTRACT MONITORING PERSONNEL SERVICES 0200 0014 0155 0. 0.
2065 CONTRACT MONITORING PERSONNEL SERVICES 0200 0014 0157 0. 0.
2065 CONTRACT MONITORING PERSONNEL SERVICES 0200 0014 0158 0. 0.
2065 CONTRACT MONITORING PERSONNEL SERVICES 0200 0014 0159 0. 0.
2065 CONTRACT MONITORING PERSONNEL SERVICES 0200 0014 0160 0. 0.
2065 CONTRACT MONITORING PERSONNEL SERVICES 0200 0014 0161 0. 0.
2065 CONTRACT MONITORING PERSONNEL SERVICES 0200 0015 0133 0. 0.
0200 Total 0. 0.
2065 Total 1,814,686.83 2,292,689.85
2066 CHILD PLACEMENT PERSONNEL SERVICES 0100 0011 0111 5,179,097.94 4,690,576.1
2066 CHILD PLACEMENT PERSONNEL SERVICES 0100 0012 0125 0. 38,424.33
2066 CHILD PLACEMENT PERSONNEL SERVICES 0100 0013 0128 0. 5,321.14
2066 CHILD PLACEMENT PERSONNEL SERVICES 0100 0013 0129 0. 392,324.79
2066 CHILD PLACEMENT PERSONNEL SERVICES 0100 0013 0131 0. 369.82
2066 CHILD PLACEMENT PERSONNEL SERVICES 0100 0013 0134 0. 33,830.41
Page 16
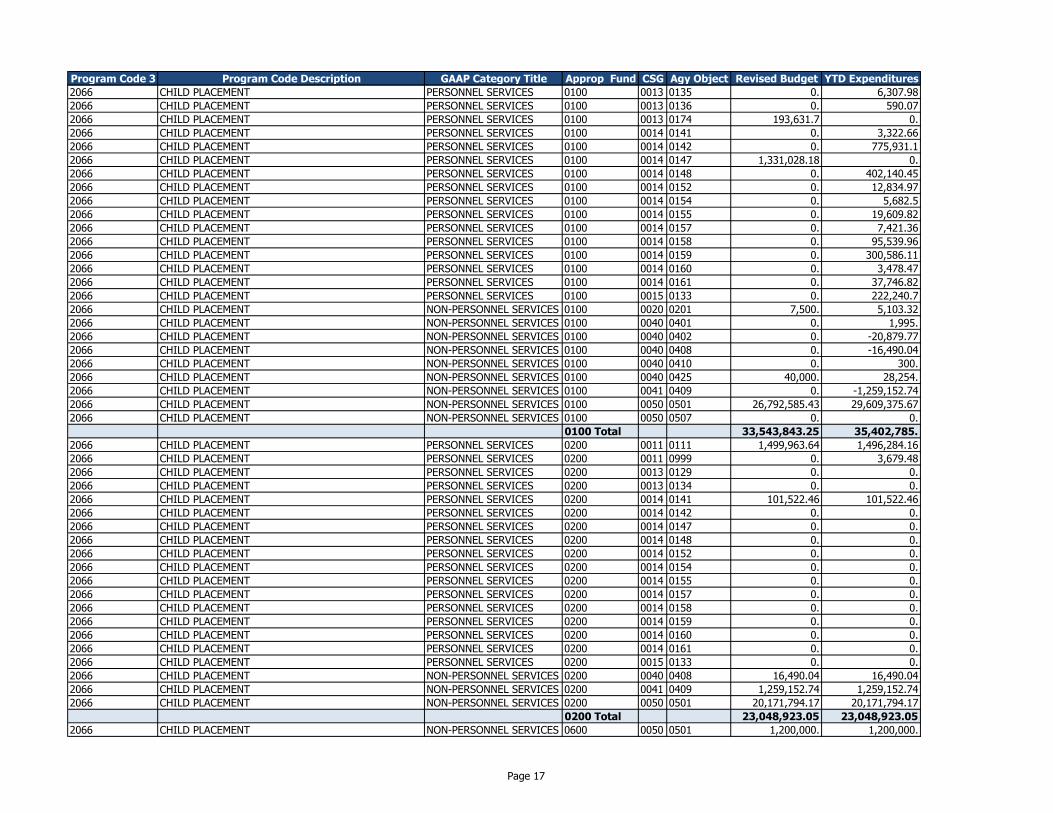
Program Code 3 Program Code Description GAAP Category Title Approp Fund CSG Agy Object Revised Budget YTD Expenditures
2066 CHILD PLACEMENT PERSONNEL SERVICES 0100 0013 0135 0. 6,307.98
2066 CHILD PLACEMENT PERSONNEL SERVICES 0100 0013 0136 0. 590.07
2066 CHILD PLACEMENT PERSONNEL SERVICES 0100 0013 0174 193,631.7 0.
2066 CHILD PLACEMENT PERSONNEL SERVICES 0100 0014 0141 0. 3,322.66
2066 CHILD PLACEMENT PERSONNEL SERVICES 0100 0014 0142 0. 775,931.1
2066 CHILD PLACEMENT PERSONNEL SERVICES 0100 0014 0147 1,331,028.18 0.
2066 CHILD PLACEMENT PERSONNEL SERVICES 0100 0014 0148 0. 402,140.45
2066 CHILD PLACEMENT PERSONNEL SERVICES 0100 0014 0152 0. 12,834.97
2066 CHILD PLACEMENT PERSONNEL SERVICES 0100 0014 0154 0. 5,682.5
2066 CHILD PLACEMENT PERSONNEL SERVICES 0100 0014 0155 0. 19,609.82
2066 CHILD PLACEMENT PERSONNEL SERVICES 0100 0014 0157 0. 7,421.36
2066 CHILD PLACEMENT PERSONNEL SERVICES 0100 0014 0158 0. 95,539.96
2066 CHILD PLACEMENT PERSONNEL SERVICES 0100 0014 0159 0. 300,586.11
2066 CHILD PLACEMENT PERSONNEL SERVICES 0100 0014 0160 0. 3,478.47
2066 CHILD PLACEMENT PERSONNEL SERVICES 0100 0014 0161 0. 37,746.82
2066 CHILD PLACEMENT PERSONNEL SERVICES 0100 0015 0133 0. 222,240.7
2066 CHILD PLACEMENT NON-PERSONNEL SERVICES 0100 0020 0201 7,500. 5,103.32
2066 CHILD PLACEMENT NON-PERSONNEL SERVICES 0100 0040 0401 0. 1,995.
2066 CHILD PLACEMENT NON-PERSONNEL SERVICES 0100 0040 0402 0. -20,879.77
2066 CHILD PLACEMENT NON-PERSONNEL SERVICES 0100 0040 0408 0. -16,490.04
2066 CHILD PLACEMENT NON-PERSONNEL SERVICES 0100 0040 0410 0. 300.
2066 CHILD PLACEMENT NON-PERSONNEL SERVICES 0100 0040 0425 40,000. 28,254.
2066 CHILD PLACEMENT NON-PERSONNEL SERVICES 0100 0041 0409 0. -1,259,152.74
2066 CHILD PLACEMENT NON-PERSONNEL SERVICES 0100 0050 0501 26,792,585.43 29,609,375.67
2066 CHILD PLACEMENT NON-PERSONNEL SERVICES 0100 0050 0507 0. 0.
0100 Total 33,543,843.25 35,402,785.
2066 CHILD PLACEMENT PERSONNEL SERVICES 0200 0011 0111 1,499,963.64 1,496,284.16
2066 CHILD PLACEMENT PERSONNEL SERVICES 0200 0011 0999 0. 3,679.48
2066 CHILD PLACEMENT PERSONNEL SERVICES 0200 0013 0129 0. 0.
2066 CHILD PLACEMENT PERSONNEL SERVICES 0200 0013 0134 0. 0.
2066 CHILD PLACEMENT PERSONNEL SERVICES 0200 0014 0141 101,522.46 101,522.46
2066 CHILD PLACEMENT PERSONNEL SERVICES 0200 0014 0142 0. 0.
2066 CHILD PLACEMENT PERSONNEL SERVICES 0200 0014 0147 0. 0.
2066 CHILD PLACEMENT PERSONNEL SERVICES 0200 0014 0148 0. 0.
2066 CHILD PLACEMENT PERSONNEL SERVICES 0200 0014 0152 0. 0.
2066 CHILD PLACEMENT PERSONNEL SERVICES 0200 0014 0154 0. 0.
2066 CHILD PLACEMENT PERSONNEL SERVICES 0200 0014 0155 0. 0.
2066 CHILD PLACEMENT PERSONNEL SERVICES 0200 0014 0157 0. 0.
2066 CHILD PLACEMENT PERSONNEL SERVICES 0200 0014 0158 0. 0.
2066 CHILD PLACEMENT PERSONNEL SERVICES 0200 0014 0159 0. 0.
2066 CHILD PLACEMENT PERSONNEL SERVICES 0200 0014 0160 0. 0.
2066 CHILD PLACEMENT PERSONNEL SERVICES 0200 0014 0161 0. 0.
2066 CHILD PLACEMENT PERSONNEL SERVICES 0200 0015 0133 0. 0.
2066 CHILD PLACEMENT NON-PERSONNEL SERVICES 0200 0040 0408 16,490.04 16,490.04
2066 CHILD PLACEMENT NON-PERSONNEL SERVICES 0200 0041 0409 1,259,152.74 1,259,152.74
2066 CHILD PLACEMENT NON-PERSONNEL SERVICES 0200 0050 0501 20,171,794.17 20,171,794.17
0200 Total 23,048,923.05 23,048,923.05
2066 CHILD PLACEMENT NON-PERSONNEL SERVICES 0600 0050 0501 1,200,000. 1,200,000.
Page 17
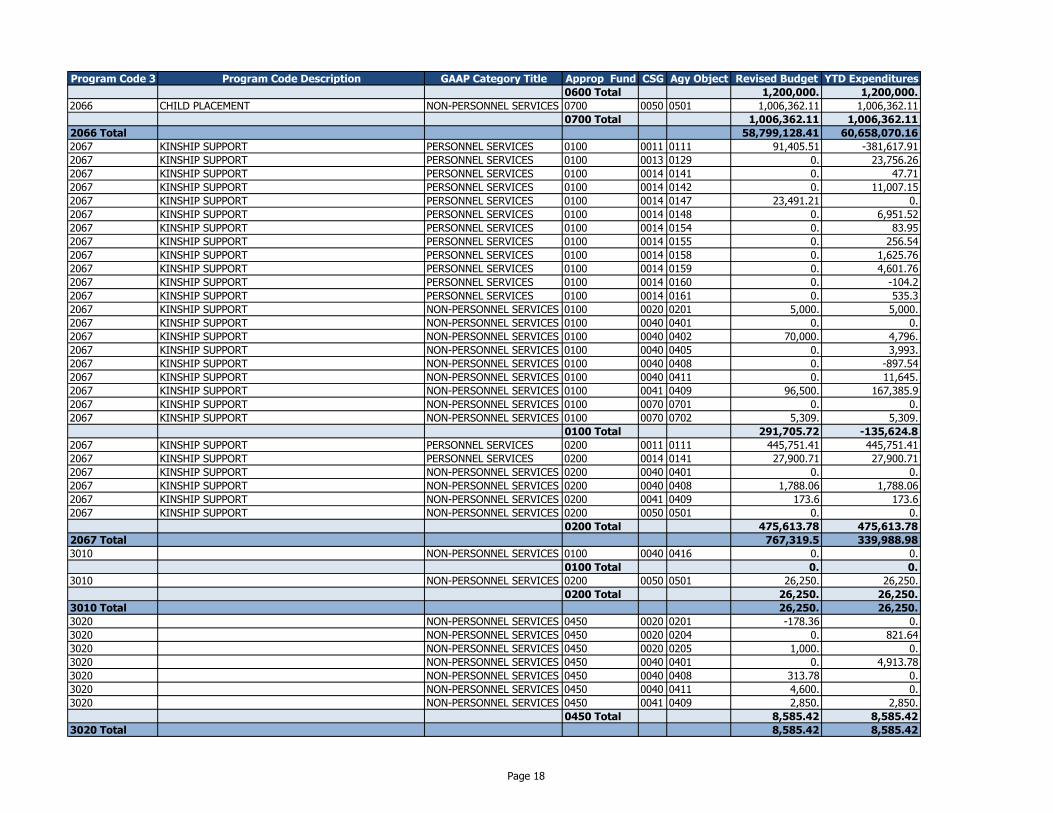
Program Code 3 Program Code Description GAAP Category Title Approp Fund CSG Agy Object Revised Budget YTD Expenditures
0600 Total 1,200,000. 1,200,000.
2066 CHILD PLACEMENT NON-PERSONNEL SERVICES 0700 0050 0501 1,006,362.11 1,006,362.11
0700 Total 1,006,362.11 1,006,362.11
2066 Total 58,799,128.41 60,658,070.16
2067 KINSHIP SUPPORT PERSONNEL SERVICES 0100 0011 0111 91,405.51 -381,617.91
2067 KINSHIP SUPPORT PERSONNEL SERVICES 0100 0013 0129 0. 23,756.26
2067 KINSHIP SUPPORT PERSONNEL SERVICES 0100 0014 0141 0. 47.71
2067 KINSHIP SUPPORT PERSONNEL SERVICES 0100 0014 0142 0. 11,007.15
2067 KINSHIP SUPPORT PERSONNEL SERVICES 0100 0014 0147 23,491.21 0.
2067 KINSHIP SUPPORT PERSONNEL SERVICES 0100 0014 0148 0. 6,951.52
2067 KINSHIP SUPPORT PERSONNEL SERVICES 0100 0014 0154 0. 83.95
2067 KINSHIP SUPPORT PERSONNEL SERVICES 0100 0014 0155 0. 256.54
2067 KINSHIP SUPPORT PERSONNEL SERVICES 0100 0014 0158 0. 1,625.76
2067 KINSHIP SUPPORT PERSONNEL SERVICES 0100 0014 0159 0. 4,601.76
2067 KINSHIP SUPPORT PERSONNEL SERVICES 0100 0014 0160 0. -104.2
2067 KINSHIP SUPPORT PERSONNEL SERVICES 0100 0014 0161 0. 535.3
2067 KINSHIP SUPPORT NON-PERSONNEL SERVICES 0100 0020 0201 5,000. 5,000.
2067 KINSHIP SUPPORT NON-PERSONNEL SERVICES 0100 0040 0401 0. 0.
2067 KINSHIP SUPPORT NON-PERSONNEL SERVICES 0100 0040 0402 70,000. 4,796.
2067 KINSHIP SUPPORT NON-PERSONNEL SERVICES 0100 0040 0405 0. 3,993.
2067 KINSHIP SUPPORT NON-PERSONNEL SERVICES 0100 0040 0408 0. -897.54
2067 KINSHIP SUPPORT NON-PERSONNEL SERVICES 0100 0040 0411 0. 11,645.
2067 KINSHIP SUPPORT NON-PERSONNEL SERVICES 0100 0041 0409 96,500. 167,385.9
2067 KINSHIP SUPPORT NON-PERSONNEL SERVICES 0100 0070 0701 0. 0.
2067 KINSHIP SUPPORT NON-PERSONNEL SERVICES 0100 0070 0702 5,309. 5,309.
0100 Total 291,705.72 -135,624.8
2067 KINSHIP SUPPORT PERSONNEL SERVICES 0200 0011 0111 445,751.41 445,751.41
2067 KINSHIP SUPPORT PERSONNEL SERVICES 0200 0014 0141 27,900.71 27,900.71
2067 KINSHIP SUPPORT NON-PERSONNEL SERVICES 0200 0040 0401 0. 0.
2067 KINSHIP SUPPORT NON-PERSONNEL SERVICES 0200 0040 0408 1,788.06 1,788.06
2067 KINSHIP SUPPORT NON-PERSONNEL SERVICES 0200 0041 0409 173.6 173.6
2067 KINSHIP SUPPORT NON-PERSONNEL SERVICES 0200 0050 0501 0. 0.
0200 Total 475,613.78 475,613.78
2067 Total 767,319.5 339,988.98
3010 NON-PERSONNEL SERVICES 0100 0040 0416 0. 0.
0100 Total 0. 0.
3010 NON-PERSONNEL SERVICES 0200 0050 0501 26,250. 26,250.
0200 Total 26,250. 26,250.
3010 Total 26,250. 26,250.
3020 NON-PERSONNEL SERVICES 0450 0020 0201 -178.36 0.
3020 NON-PERSONNEL SERVICES 0450 0020 0204 0. 821.64
3020 NON-PERSONNEL SERVICES 0450 0020 0205 1,000. 0.
3020 NON-PERSONNEL SERVICES 0450 0040 0401 0. 4,913.78
3020 NON-PERSONNEL SERVICES 0450 0040 0408 313.78 0.
3020 NON-PERSONNEL SERVICES 0450 0040 0411 4,600. 0.
3020 NON-PERSONNEL SERVICES 0450 0041 0409 2,850. 2,850.
0450 Total 8,585.42 8,585.42
3020 Total 8,585.42 8,585.42
Page 18
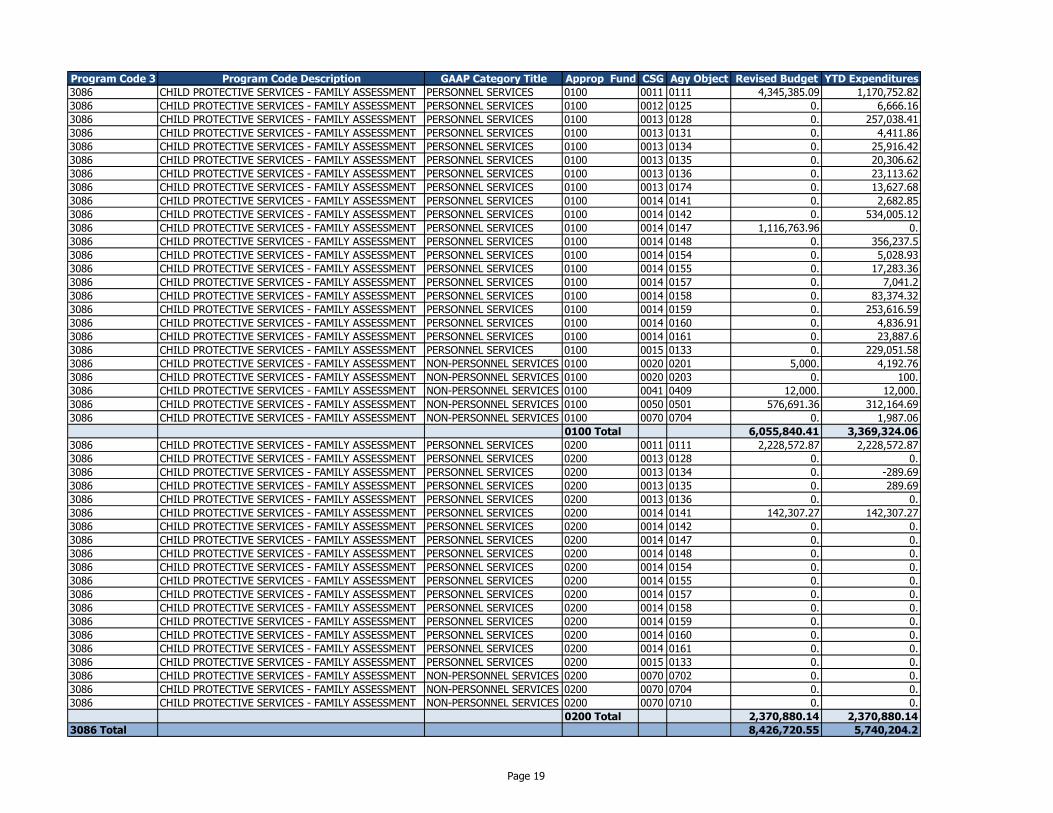
Program Code 3 Program Code Description GAAP Category Title Approp Fund CSG Agy Object Revised Budget YTD Expenditures
3086 CHILD PROTECTIVE SERVICES - FAMILY ASSESSMENT PERSONNEL SERVICES 0100 0011 0111 4,345,385.09 1,170,752.82
3086 CHILD PROTECTIVE SERVICES - FAMILY ASSESSMENT PERSONNEL SERVICES 0100 0012 0125 0. 6,666.16
3086 CHILD PROTECTIVE SERVICES - FAMILY ASSESSMENT PERSONNEL SERVICES 0100 0013 0128 0. 257,038.41
3086 CHILD PROTECTIVE SERVICES - FAMILY ASSESSMENT PERSONNEL SERVICES 0100 0013 0131 0. 4,411.86
3086 CHILD PROTECTIVE SERVICES - FAMILY ASSESSMENT PERSONNEL SERVICES 0100 0013 0134 0. 25,916.42
3086 CHILD PROTECTIVE SERVICES - FAMILY ASSESSMENT PERSONNEL SERVICES 0100 0013 0135 0. 20,306.62
3086 CHILD PROTECTIVE SERVICES - FAMILY ASSESSMENT PERSONNEL SERVICES 0100 0013 0136 0. 23,113.62
3086 CHILD PROTECTIVE SERVICES - FAMILY ASSESSMENT PERSONNEL SERVICES 0100 0013 0174 0. 13,627.68
3086 CHILD PROTECTIVE SERVICES - FAMILY ASSESSMENT PERSONNEL SERVICES 0100 0014 0141 0. 2,682.85
3086 CHILD PROTECTIVE SERVICES - FAMILY ASSESSMENT PERSONNEL SERVICES 0100 0014 0142 0. 534,005.12
3086 CHILD PROTECTIVE SERVICES - FAMILY ASSESSMENT PERSONNEL SERVICES 0100 0014 0147 1,116,763.96 0.
3086 CHILD PROTECTIVE SERVICES - FAMILY ASSESSMENT PERSONNEL SERVICES 0100 0014 0148 0. 356,237.5
3086 CHILD PROTECTIVE SERVICES - FAMILY ASSESSMENT PERSONNEL SERVICES 0100 0014 0154 0. 5,028.93
3086 CHILD PROTECTIVE SERVICES - FAMILY ASSESSMENT PERSONNEL SERVICES 0100 0014 0155 0. 17,283.36
3086 CHILD PROTECTIVE SERVICES - FAMILY ASSESSMENT PERSONNEL SERVICES 0100 0014 0157 0. 7,041.2
3086 CHILD PROTECTIVE SERVICES - FAMILY ASSESSMENT PERSONNEL SERVICES 0100 0014 0158 0. 83,374.32
3086 CHILD PROTECTIVE SERVICES - FAMILY ASSESSMENT PERSONNEL SERVICES 0100 0014 0159 0. 253,616.59
3086 CHILD PROTECTIVE SERVICES - FAMILY ASSESSMENT PERSONNEL SERVICES 0100 0014 0160 0. 4,836.91
3086 CHILD PROTECTIVE SERVICES - FAMILY ASSESSMENT PERSONNEL SERVICES 0100 0014 0161 0. 23,887.6
3086 CHILD PROTECTIVE SERVICES - FAMILY ASSESSMENT PERSONNEL SERVICES 0100 0015 0133 0. 229,051.58
3086 CHILD PROTECTIVE SERVICES - FAMILY ASSESSMENT NON-PERSONNEL SERVICES 0100 0020 0201 5,000. 4,192.76
3086 CHILD PROTECTIVE SERVICES - FAMILY ASSESSMENT NON-PERSONNEL SERVICES 0100 0020 0203 0. 100.
3086 CHILD PROTECTIVE SERVICES - FAMILY ASSESSMENT NON-PERSONNEL SERVICES 0100 0041 0409 12,000. 12,000.
3086 CHILD PROTECTIVE SERVICES - FAMILY ASSESSMENT NON-PERSONNEL SERVICES 0100 0050 0501 576,691.36 312,164.69
3086 CHILD PROTECTIVE SERVICES - FAMILY ASSESSMENT NON-PERSONNEL SERVICES 0100 0070 0704 0. 1,987.06
0100 Total 6,055,840.41 3,369,324.06
3086 CHILD PROTECTIVE SERVICES - FAMILY ASSESSMENT PERSONNEL SERVICES 0200 0011 0111 2,228,572.87 2,228,572.87
3086 CHILD PROTECTIVE SERVICES - FAMILY ASSESSMENT PERSONNEL SERVICES 0200 0013 0128 0. 0.
3086 CHILD PROTECTIVE SERVICES - FAMILY ASSESSMENT PERSONNEL SERVICES 0200 0013 0134 0. -289.69
3086 CHILD PROTECTIVE SERVICES - FAMILY ASSESSMENT PERSONNEL SERVICES 0200 0013 0135 0. 289.69
3086 CHILD PROTECTIVE SERVICES - FAMILY ASSESSMENT PERSONNEL SERVICES 0200 0013 0136 0. 0.
3086 CHILD PROTECTIVE SERVICES - FAMILY ASSESSMENT PERSONNEL SERVICES 0200 0014 0141 142,307.27 142,307.27
3086 CHILD PROTECTIVE SERVICES - FAMILY ASSESSMENT PERSONNEL SERVICES 0200 0014 0142 0. 0.
3086 CHILD PROTECTIVE SERVICES - FAMILY ASSESSMENT PERSONNEL SERVICES 0200 0014 0147 0. 0.
3086 CHILD PROTECTIVE SERVICES - FAMILY ASSESSMENT PERSONNEL SERVICES 0200 0014 0148 0. 0.
3086 CHILD PROTECTIVE SERVICES - FAMILY ASSESSMENT PERSONNEL SERVICES 0200 0014 0154 0. 0.
3086 CHILD PROTECTIVE SERVICES - FAMILY ASSESSMENT PERSONNEL SERVICES 0200 0014 0155 0. 0.
3086 CHILD PROTECTIVE SERVICES - FAMILY ASSESSMENT PERSONNEL SERVICES 0200 0014 0157 0. 0.
3086 CHILD PROTECTIVE SERVICES - FAMILY ASSESSMENT PERSONNEL SERVICES 0200 0014 0158 0. 0.
3086 CHILD PROTECTIVE SERVICES - FAMILY ASSESSMENT PERSONNEL SERVICES 0200 0014 0159 0. 0.
3086 CHILD PROTECTIVE SERVICES - FAMILY ASSESSMENT PERSONNEL SERVICES 0200 0014 0160 0. 0.
3086 CHILD PROTECTIVE SERVICES - FAMILY ASSESSMENT PERSONNEL SERVICES 0200 0014 0161 0. 0.
3086 CHILD PROTECTIVE SERVICES - FAMILY ASSESSMENT PERSONNEL SERVICES 0200 0015 0133 0. 0.
3086 CHILD PROTECTIVE SERVICES - FAMILY ASSESSMENT NON-PERSONNEL SERVICES 0200 0070 0702 0. 0.
3086 CHILD PROTECTIVE SERVICES - FAMILY ASSESSMENT NON-PERSONNEL SERVICES 0200 0070 0704 0. 0.
3086 CHILD PROTECTIVE SERVICES - FAMILY ASSESSMENT NON-PERSONNEL SERVICES 0200 0070 0710 0. 0.
0200 Total 2,370,880.14 2,370,880.14
3086 Total 8,426,720.55 5,740,204.2
Page 19
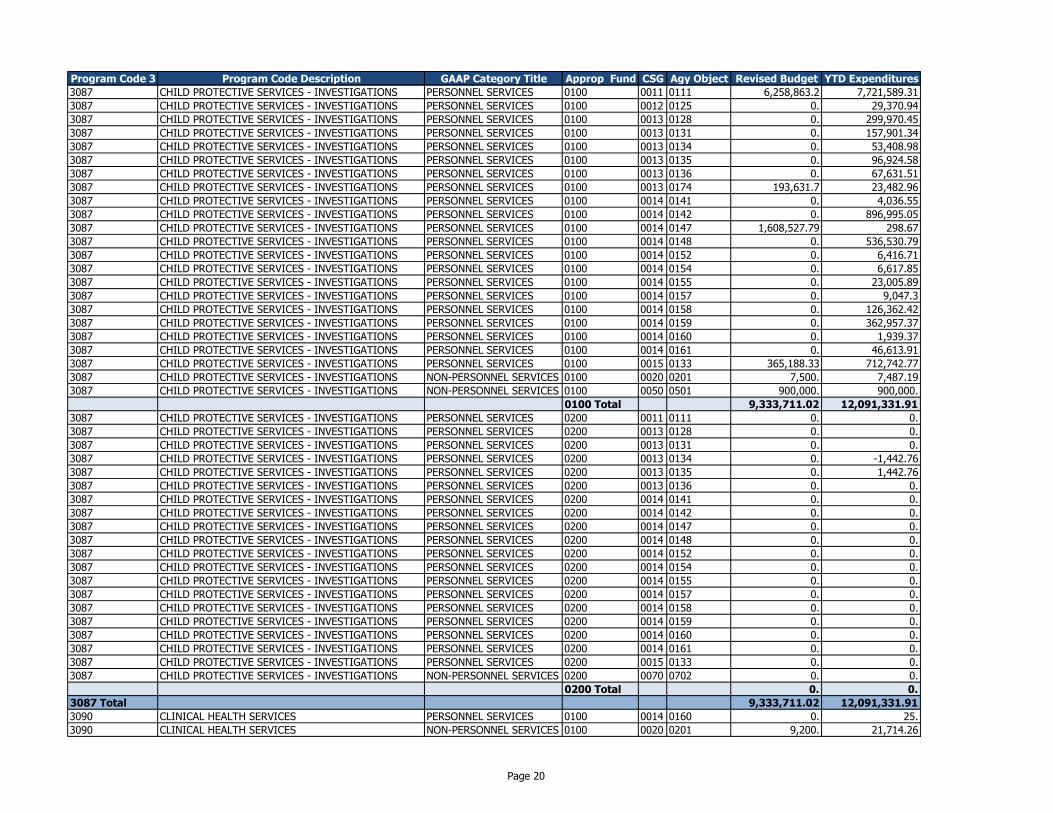
Program Code 3 Program Code Description GAAP Category Title Approp Fund CSG Agy Object Revised Budget YTD Expenditures
3087 CHILD PROTECTIVE SERVICES - INVESTIGATIONS PERSONNEL SERVICES 0100 0011 0111 6,258,863.2 7,721,589.31
3087 CHILD PROTECTIVE SERVICES - INVESTIGATIONS PERSONNEL SERVICES 0100 0012 0125 0. 29,370.94
3087 CHILD PROTECTIVE SERVICES - INVESTIGATIONS PERSONNEL SERVICES 0100 0013 0128 0. 299,970.45
3087 CHILD PROTECTIVE SERVICES - INVESTIGATIONS PERSONNEL SERVICES 0100 0013 0131 0. 157,901.34
3087 CHILD PROTECTIVE SERVICES - INVESTIGATIONS PERSONNEL SERVICES 0100 0013 0134 0. 53,408.98
3087 CHILD PROTECTIVE SERVICES - INVESTIGATIONS PERSONNEL SERVICES 0100 0013 0135 0. 96,924.58
3087 CHILD PROTECTIVE SERVICES - INVESTIGATIONS PERSONNEL SERVICES 0100 0013 0136 0. 67,631.51
3087 CHILD PROTECTIVE SERVICES - INVESTIGATIONS PERSONNEL SERVICES 0100 0013 0174 193,631.7 23,482.96
3087 CHILD PROTECTIVE SERVICES - INVESTIGATIONS PERSONNEL SERVICES 0100 0014 0141 0. 4,036.55
3087 CHILD PROTECTIVE SERVICES - INVESTIGATIONS PERSONNEL SERVICES 0100 0014 0142 0. 896,995.05
3087 CHILD PROTECTIVE SERVICES - INVESTIGATIONS PERSONNEL SERVICES 0100 0014 0147 1,608,527.79 298.67
3087 CHILD PROTECTIVE SERVICES - INVESTIGATIONS PERSONNEL SERVICES 0100 0014 0148 0. 536,530.79
3087 CHILD PROTECTIVE SERVICES - INVESTIGATIONS PERSONNEL SERVICES 0100 0014 0152 0. 6,416.71
3087 CHILD PROTECTIVE SERVICES - INVESTIGATIONS PERSONNEL SERVICES 0100 0014 0154 0. 6,617.85
3087 CHILD PROTECTIVE SERVICES - INVESTIGATIONS PERSONNEL SERVICES 0100 0014 0155 0. 23,005.89
3087 CHILD PROTECTIVE SERVICES - INVESTIGATIONS PERSONNEL SERVICES 0100 0014 0157 0. 9,047.3
3087 CHILD PROTECTIVE SERVICES - INVESTIGATIONS PERSONNEL SERVICES 0100 0014 0158 0. 126,362.42
3087 CHILD PROTECTIVE SERVICES - INVESTIGATIONS PERSONNEL SERVICES 0100 0014 0159 0. 362,957.37
3087 CHILD PROTECTIVE SERVICES - INVESTIGATIONS PERSONNEL SERVICES 0100 0014 0160 0. 1,939.37
3087 CHILD PROTECTIVE SERVICES - INVESTIGATIONS PERSONNEL SERVICES 0100 0014 0161 0. 46,613.91
3087 CHILD PROTECTIVE SERVICES - INVESTIGATIONS PERSONNEL SERVICES 0100 0015 0133 365,188.33 712,742.77
3087 CHILD PROTECTIVE SERVICES - INVESTIGATIONS NON-PERSONNEL SERVICES 0100 0020 0201 7,500. 7,487.19
3087 CHILD PROTECTIVE SERVICES - INVESTIGATIONS NON-PERSONNEL SERVICES 0100 0050 0501 900,000. 900,000.
0100 Total 9,333,711.02 12,091,331.91
3087 CHILD PROTECTIVE SERVICES - INVESTIGATIONS PERSONNEL SERVICES 0200 0011 0111 0. 0.
3087 CHILD PROTECTIVE SERVICES - INVESTIGATIONS PERSONNEL SERVICES 0200 0013 0128 0. 0.
3087 CHILD PROTECTIVE SERVICES - INVESTIGATIONS PERSONNEL SERVICES 0200 0013 0131 0. 0.
3087 CHILD PROTECTIVE SERVICES - INVESTIGATIONS PERSONNEL SERVICES 0200 0013 0134 0. -1,442.76
3087 CHILD PROTECTIVE SERVICES - INVESTIGATIONS PERSONNEL SERVICES 0200 0013 0135 0. 1,442.76
3087 CHILD PROTECTIVE SERVICES - INVESTIGATIONS PERSONNEL SERVICES 0200 0013 0136 0. 0.
3087 CHILD PROTECTIVE SERVICES - INVESTIGATIONS PERSONNEL SERVICES 0200 0014 0141 0. 0.
3087 CHILD PROTECTIVE SERVICES - INVESTIGATIONS PERSONNEL SERVICES 0200 0014 0142 0. 0.
3087 CHILD PROTECTIVE SERVICES - INVESTIGATIONS PERSONNEL SERVICES 0200 0014 0147 0. 0.
3087 CHILD PROTECTIVE SERVICES - INVESTIGATIONS PERSONNEL SERVICES 0200 0014 0148 0. 0.
3087 CHILD PROTECTIVE SERVICES - INVESTIGATIONS PERSONNEL SERVICES 0200 0014 0152 0. 0.
3087 CHILD PROTECTIVE SERVICES - INVESTIGATIONS PERSONNEL SERVICES 0200 0014 0154 0. 0.
3087 CHILD PROTECTIVE SERVICES - INVESTIGATIONS PERSONNEL SERVICES 0200 0014 0155 0. 0.
3087 CHILD PROTECTIVE SERVICES - INVESTIGATIONS PERSONNEL SERVICES 0200 0014 0157 0. 0.
3087 CHILD PROTECTIVE SERVICES - INVESTIGATIONS PERSONNEL SERVICES 0200 0014 0158 0. 0.
3087 CHILD PROTECTIVE SERVICES - INVESTIGATIONS PERSONNEL SERVICES 0200 0014 0159 0. 0.
3087 CHILD PROTECTIVE SERVICES - INVESTIGATIONS PERSONNEL SERVICES 0200 0014 0160 0. 0.
3087 CHILD PROTECTIVE SERVICES - INVESTIGATIONS PERSONNEL SERVICES 0200 0014 0161 0. 0.
3087 CHILD PROTECTIVE SERVICES - INVESTIGATIONS PERSONNEL SERVICES 0200 0015 0133 0. 0.
3087 CHILD PROTECTIVE SERVICES - INVESTIGATIONS NON-PERSONNEL SERVICES 0200 0070 0702 0. 0.
0200 Total 0. 0.
3087 Total 9,333,711.02 12,091,331.91
3090 CLINICAL HEALTH SERVICES PERSONNEL SERVICES 0100 0014 0160 0. 25.
3090 CLINICAL HEALTH SERVICES NON-PERSONNEL SERVICES 0100 0020 0201 9,200. 21,714.26
Page 20
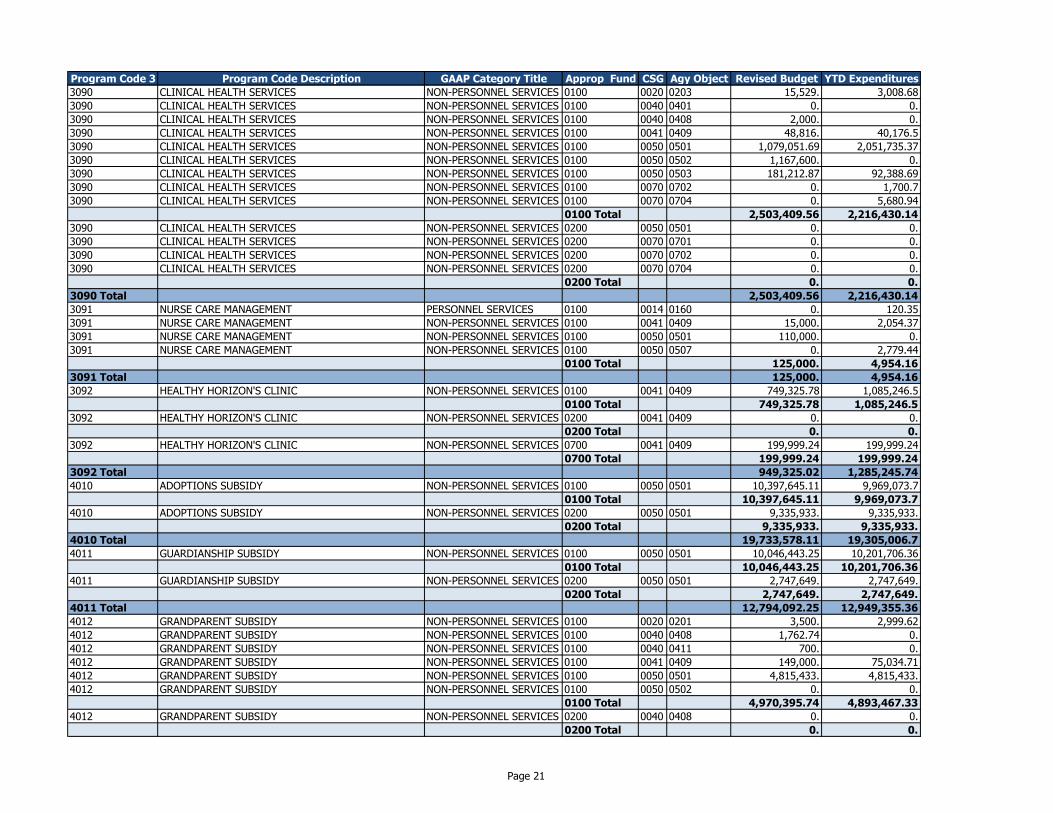
Program Code 3 Program Code Description GAAP Category Title Approp Fund CSG Agy Object Revised Budget YTD Expenditures
3090 CLINICAL HEALTH SERVICES NON-PERSONNEL SERVICES 0100 0020 0203 15,529. 3,008.68
3090 CLINICAL HEALTH SERVICES NON-PERSONNEL SERVICES 0100 0040 0401 0. 0.
3090 CLINICAL HEALTH SERVICES NON-PERSONNEL SERVICES 0100 0040 0408 2,000. 0.
3090 CLINICAL HEALTH SERVICES NON-PERSONNEL SERVICES 0100 0041 0409 48,816. 40,176.5
3090 CLINICAL HEALTH SERVICES NON-PERSONNEL SERVICES 0100 0050 0501 1,079,051.69 2,051,735.37
3090 CLINICAL HEALTH SERVICES NON-PERSONNEL SERVICES 0100 0050 0502 1,167,600. 0.
3090 CLINICAL HEALTH SERVICES NON-PERSONNEL SERVICES 0100 0050 0503 181,212.87 92,388.69
3090 CLINICAL HEALTH SERVICES NON-PERSONNEL SERVICES 0100 0070 0702 0. 1,700.7
3090 CLINICAL HEALTH SERVICES NON-PERSONNEL SERVICES 0100 0070 0704 0. 5,680.94
0100 Total 2,503,409.56 2,216,430.14
3090 CLINICAL HEALTH SERVICES NON-PERSONNEL SERVICES 0200 0050 0501 0. 0.
3090 CLINICAL HEALTH SERVICES NON-PERSONNEL SERVICES 0200 0070 0701 0. 0.
3090 CLINICAL HEALTH SERVICES NON-PERSONNEL SERVICES 0200 0070 0702 0. 0.
3090 CLINICAL HEALTH SERVICES NON-PERSONNEL SERVICES 0200 0070 0704 0. 0.
0200 Total 0. 0.
3090 Total 2,503,409.56 2,216,430.14
3091 NURSE CARE MANAGEMENT PERSONNEL SERVICES 0100 0014 0160 0. 120.35
3091 NURSE CARE MANAGEMENT NON-PERSONNEL SERVICES 0100 0041 0409 15,000. 2,054.37
3091 NURSE CARE MANAGEMENT NON-PERSONNEL SERVICES 0100 0050 0501 110,000. 0.
3091 NURSE CARE MANAGEMENT NON-PERSONNEL SERVICES 0100 0050 0507 0. 2,779.44
0100 Total 125,000. 4,954.16
3091 Total 125,000. 4,954.16
3092 HEALTHY HORIZON'S CLINIC NON-PERSONNEL SERVICES 0100 0041 0409 749,325.78 1,085,246.5
0100 Total 749,325.78 1,085,246.5
3092 HEALTHY HORIZON'S CLINIC NON-PERSONNEL SERVICES 0200 0041 0409 0. 0.
0200 Total 0. 0.
3092 HEALTHY HORIZON'S CLINIC NON-PERSONNEL SERVICES 0700 0041 0409 199,999.24 199,999.24
0700 Total 199,999.24 199,999.24
3092 Total 949,325.02 1,285,245.74
4010 ADOPTIONS SUBSIDY NON-PERSONNEL SERVICES 0100 0050 0501 10,397,645.11 9,969,073.7
0100 Total 10,397,645.11 9,969,073.7
4010 ADOPTIONS SUBSIDY NON-PERSONNEL SERVICES 0200 0050 0501 9,335,933. 9,335,933.
0200 Total 9,335,933. 9,335,933.
4010 Total 19,733,578.11 19,305,006.7
4011 GUARDIANSHIP SUBSIDY NON-PERSONNEL SERVICES 0100 0050 0501 10,046,443.25 10,201,706.36
0100 Total 10,046,443.25 10,201,706.36
4011 GUARDIANSHIP SUBSIDY NON-PERSONNEL SERVICES 0200 0050 0501 2,747,649. 2,747,649.
0200 Total 2,747,649. 2,747,649.
4011 Total 12,794,092.25 12,949,355.36
4012 GRANDPARENT SUBSIDY NON-PERSONNEL SERVICES 0100 0020 0201 3,500. 2,999.62
4012 GRANDPARENT SUBSIDY NON-PERSONNEL SERVICES 0100 0040 0408 1,762.74 0.
4012 GRANDPARENT SUBSIDY NON-PERSONNEL SERVICES 0100 0040 0411 700. 0.
4012 GRANDPARENT SUBSIDY NON-PERSONNEL SERVICES 0100 0041 0409 149,000. 75,034.71
4012 GRANDPARENT SUBSIDY NON-PERSONNEL SERVICES 0100 0050 0501 4,815,433. 4,815,433.
4012 GRANDPARENT SUBSIDY NON-PERSONNEL SERVICES 0100 0050 0502 0. 0.
0100 Total 4,970,395.74 4,893,467.33
4012 GRANDPARENT SUBSIDY NON-PERSONNEL SERVICES 0200 0040 0408 0. 0.
0200 Total 0. 0.
Page 21
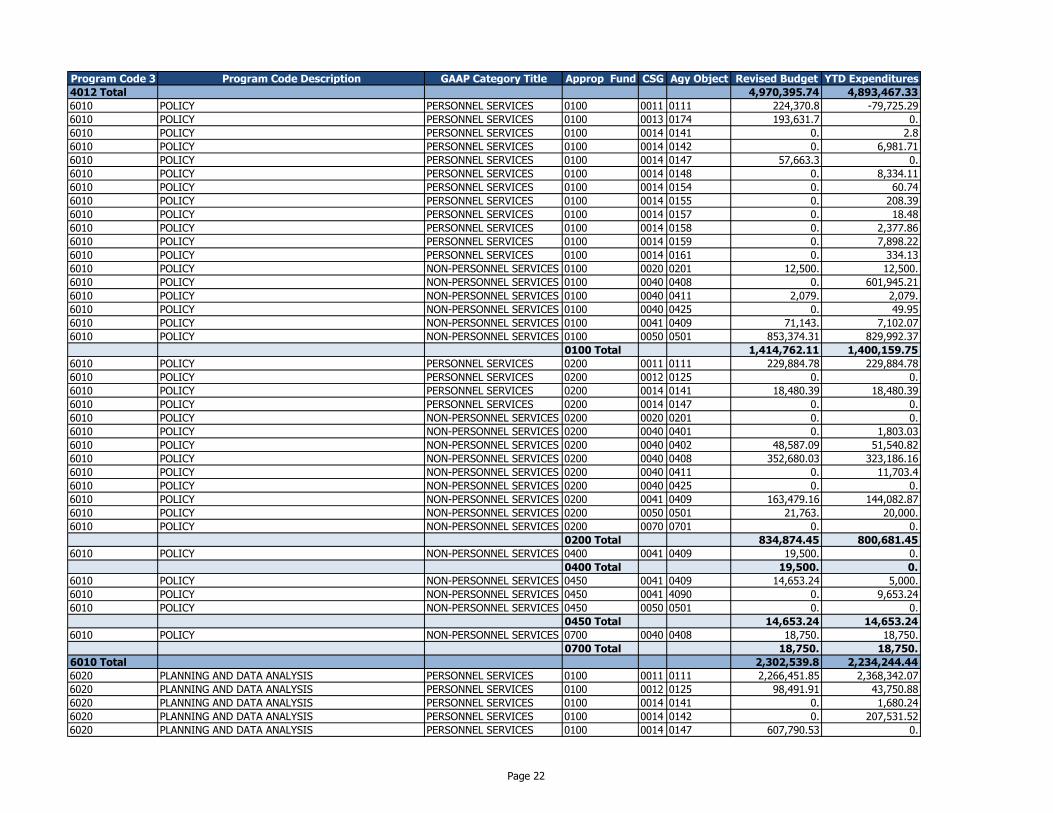
Program Code 3 Program Code Description GAAP Category Title Approp Fund CSG Agy Object Revised Budget YTD Expenditures
4012 Total 4,970,395.74 4,893,467.33
6010 POLICY PERSONNEL SERVICES 0100 0011 0111 224,370.8 -79,725.29
6010 POLICY PERSONNEL SERVICES 0100 0013 0174 193,631.7 0.
6010 POLICY PERSONNEL SERVICES 0100 0014 0141 0. 2.8
6010 POLICY PERSONNEL SERVICES 0100 0014 0142 0. 6,981.71
6010 POLICY PERSONNEL SERVICES 0100 0014 0147 57,663.3 0.
6010 POLICY PERSONNEL SERVICES 0100 0014 0148 0. 8,334.11
6010 POLICY PERSONNEL SERVICES 0100 0014 0154 0. 60.74
6010 POLICY PERSONNEL SERVICES 0100 0014 0155 0. 208.39
6010 POLICY PERSONNEL SERVICES 0100 0014 0157 0. 18.48
6010 POLICY PERSONNEL SERVICES 0100 0014 0158 0. 2,377.86
6010 POLICY PERSONNEL SERVICES 0100 0014 0159 0. 7,898.22
6010 POLICY PERSONNEL SERVICES 0100 0014 0161 0. 334.13
6010 POLICY NON-PERSONNEL SERVICES 0100 0020 0201 12,500. 12,500.
6010 POLICY NON-PERSONNEL SERVICES 0100 0040 0408 0. 601,945.21
6010 POLICY NON-PERSONNEL SERVICES 0100 0040 0411 2,079. 2,079.
6010 POLICY NON-PERSONNEL SERVICES 0100 0040 0425 0. 49.95
6010 POLICY NON-PERSONNEL SERVICES 0100 0041 0409 71,143. 7,102.07
6010 POLICY NON-PERSONNEL SERVICES 0100 0050 0501 853,374.31 829,992.37
0100 Total 1,414,762.11 1,400,159.75
6010 POLICY PERSONNEL SERVICES 0200 0011 0111 229,884.78 229,884.78
6010 POLICY PERSONNEL SERVICES 0200 0012 0125 0. 0.
6010 POLICY PERSONNEL SERVICES 0200 0014 0141 18,480.39 18,480.39
6010 POLICY PERSONNEL SERVICES 0200 0014 0147 0. 0.
6010 POLICY NON-PERSONNEL SERVICES 0200 0020 0201 0. 0.
6010 POLICY NON-PERSONNEL SERVICES 0200 0040 0401 0. 1,803.03
6010 POLICY NON-PERSONNEL SERVICES 0200 0040 0402 48,587.09 51,540.82
6010 POLICY NON-PERSONNEL SERVICES 0200 0040 0408 352,680.03 323,186.16
6010 POLICY NON-PERSONNEL SERVICES 0200 0040 0411 0. 11,703.4
6010 POLICY NON-PERSONNEL SERVICES 0200 0040 0425 0. 0.
6010 POLICY NON-PERSONNEL SERVICES 0200 0041 0409 163,479.16 144,082.87
6010 POLICY NON-PERSONNEL SERVICES 0200 0050 0501 21,763. 20,000.
6010 POLICY NON-PERSONNEL SERVICES 0200 0070 0701 0. 0.
0200 Total 834,874.45 800,681.45
6010 POLICY NON-PERSONNEL SERVICES 0400 0041 0409 19,500. 0.
0400 Total 19,500. 0.
6010 POLICY NON-PERSONNEL SERVICES 0450 0041 0409 14,653.24 5,000.
6010 POLICY NON-PERSONNEL SERVICES 0450 0041 4090 0. 9,653.24
6010 POLICY NON-PERSONNEL SERVICES 0450 0050 0501 0. 0.
0450 Total 14,653.24 14,653.24
6010 POLICY NON-PERSONNEL SERVICES 0700 0040 0408 18,750. 18,750.
0700 Total 18,750. 18,750.
6010 Total 2,302,539.8 2,234,244.44
6020 PLANNING AND DATA ANALYSIS PERSONNEL SERVICES 0100 0011 0111 2,266,451.85 2,368,342.07
6020 PLANNING AND DATA ANALYSIS PERSONNEL SERVICES 0100 0012 0125 98,491.91 43,750.88
6020 PLANNING AND DATA ANALYSIS PERSONNEL SERVICES 0100 0014 0141 0. 1,680.24
6020 PLANNING AND DATA ANALYSIS PERSONNEL SERVICES 0100 0014 0142 0. 207,531.52
6020 PLANNING AND DATA ANALYSIS PERSONNEL SERVICES 0100 0014 0147 607,790.53 0.
Page 22
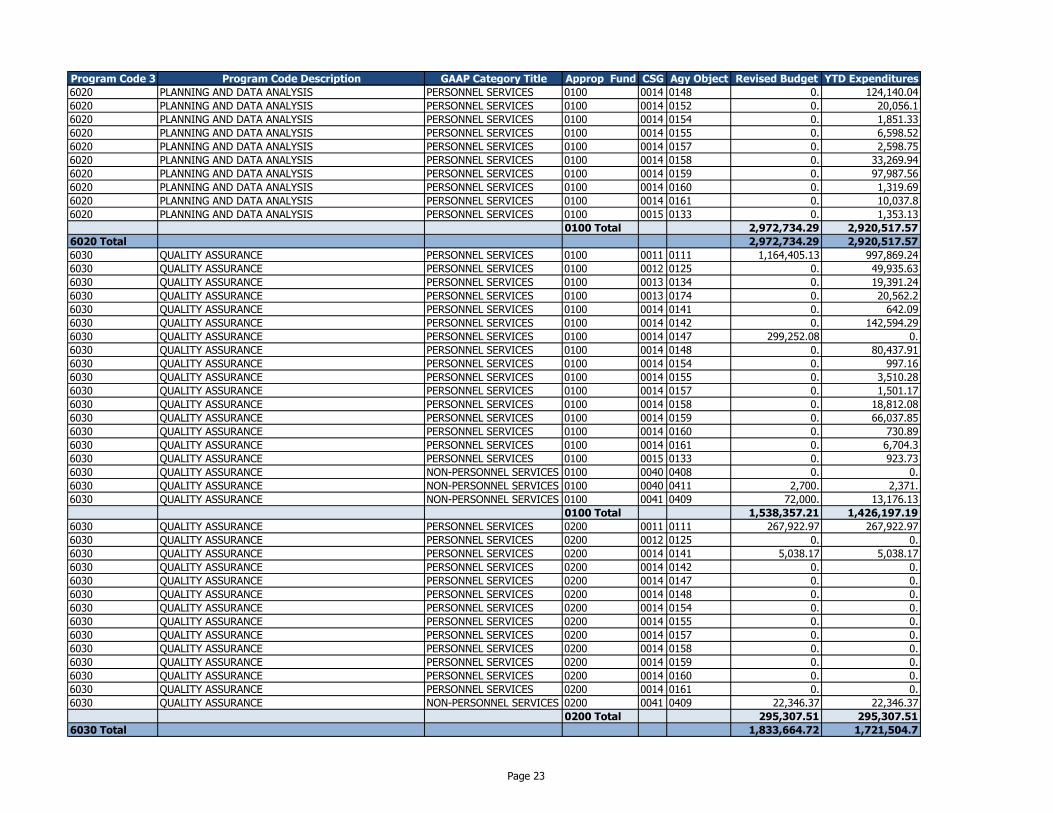
Program Code 3 Program Code Description GAAP Category Title Approp Fund CSG Agy Object Revised Budget YTD Expenditures
6020 PLANNING AND DATA ANALYSIS PERSONNEL SERVICES 0100 0014 0148 0. 124,140.04
6020 PLANNING AND DATA ANALYSIS PERSONNEL SERVICES 0100 0014 0152 0. 20,056.1
6020 PLANNING AND DATA ANALYSIS PERSONNEL SERVICES 0100 0014 0154 0. 1,851.33
6020 PLANNING AND DATA ANALYSIS PERSONNEL SERVICES 0100 0014 0155 0. 6,598.52
6020 PLANNING AND DATA ANALYSIS PERSONNEL SERVICES 0100 0014 0157 0. 2,598.75
6020 PLANNING AND DATA ANALYSIS PERSONNEL SERVICES 0100 0014 0158 0. 33,269.94
6020 PLANNING AND DATA ANALYSIS PERSONNEL SERVICES 0100 0014 0159 0. 97,987.56
6020 PLANNING AND DATA ANALYSIS PERSONNEL SERVICES 0100 0014 0160 0. 1,319.69
6020 PLANNING AND DATA ANALYSIS PERSONNEL SERVICES 0100 0014 0161 0. 10,037.8
6020 PLANNING AND DATA ANALYSIS PERSONNEL SERVICES 0100 0015 0133 0. 1,353.13
0100 Total 2,972,734.29 2,920,517.57
6020 Total 2,972,734.29 2,920,517.57
6030 QUALITY ASSURANCE PERSONNEL SERVICES 0100 0011 0111 1,164,405.13 997,869.24
6030 QUALITY ASSURANCE PERSONNEL SERVICES 0100 0012 0125 0. 49,935.63
6030 QUALITY ASSURANCE PERSONNEL SERVICES 0100 0013 0134 0. 19,391.24
6030 QUALITY ASSURANCE PERSONNEL SERVICES 0100 0013 0174 0. 20,562.2
6030 QUALITY ASSURANCE PERSONNEL SERVICES 0100 0014 0141 0. 642.09
6030 QUALITY ASSURANCE PERSONNEL SERVICES 0100 0014 0142 0. 142,594.29
6030 QUALITY ASSURANCE PERSONNEL SERVICES 0100 0014 0147 299,252.08 0.
6030 QUALITY ASSURANCE PERSONNEL SERVICES 0100 0014 0148 0. 80,437.91
6030 QUALITY ASSURANCE PERSONNEL SERVICES 0100 0014 0154 0. 997.16
6030 QUALITY ASSURANCE PERSONNEL SERVICES 0100 0014 0155 0. 3,510.28
6030 QUALITY ASSURANCE PERSONNEL SERVICES 0100 0014 0157 0. 1,501.17
6030 QUALITY ASSURANCE PERSONNEL SERVICES 0100 0014 0158 0. 18,812.08
6030 QUALITY ASSURANCE PERSONNEL SERVICES 0100 0014 0159 0. 66,037.85
6030 QUALITY ASSURANCE PERSONNEL SERVICES 0100 0014 0160 0. 730.89
6030 QUALITY ASSURANCE PERSONNEL SERVICES 0100 0014 0161 0. 6,704.3
6030 QUALITY ASSURANCE PERSONNEL SERVICES 0100 0015 0133 0. 923.73
6030 QUALITY ASSURANCE NON-PERSONNEL SERVICES 0100 0040 0408 0. 0.
6030 QUALITY ASSURANCE NON-PERSONNEL SERVICES 0100 0040 0411 2,700. 2,371.
6030 QUALITY ASSURANCE NON-PERSONNEL SERVICES 0100 0041 0409 72,000. 13,176.13
0100 Total 1,538,357.21 1,426,197.19
6030 QUALITY ASSURANCE PERSONNEL SERVICES 0200 0011 0111 267,922.97 267,922.97
6030 QUALITY ASSURANCE PERSONNEL SERVICES 0200 0012 0125 0. 0.
6030 QUALITY ASSURANCE PERSONNEL SERVICES 0200 0014 0141 5,038.17 5,038.17
6030 QUALITY ASSURANCE PERSONNEL SERVICES 0200 0014 0142 0. 0.
6030 QUALITY ASSURANCE PERSONNEL SERVICES 0200 0014 0147 0. 0.
6030 QUALITY ASSURANCE PERSONNEL SERVICES 0200 0014 0148 0. 0.
6030 QUALITY ASSURANCE PERSONNEL SERVICES 0200 0014 0154 0. 0.
6030 QUALITY ASSURANCE PERSONNEL SERVICES 0200 0014 0155 0. 0.
6030 QUALITY ASSURANCE PERSONNEL SERVICES 0200 0014 0157 0. 0.
6030 QUALITY ASSURANCE PERSONNEL SERVICES 0200 0014 0158 0. 0.
6030 QUALITY ASSURANCE PERSONNEL SERVICES 0200 0014 0159 0. 0.
6030 QUALITY ASSURANCE PERSONNEL SERVICES 0200 0014 0160 0. 0.
6030 QUALITY ASSURANCE PERSONNEL SERVICES 0200 0014 0161 0. 0.
6030 QUALITY ASSURANCE NON-PERSONNEL SERVICES 0200 0041 0409 22,346.37 22,346.37
0200 Total 295,307.51 295,307.51
6030 Total 1,833,664.72 1,721,504.7
Page 23
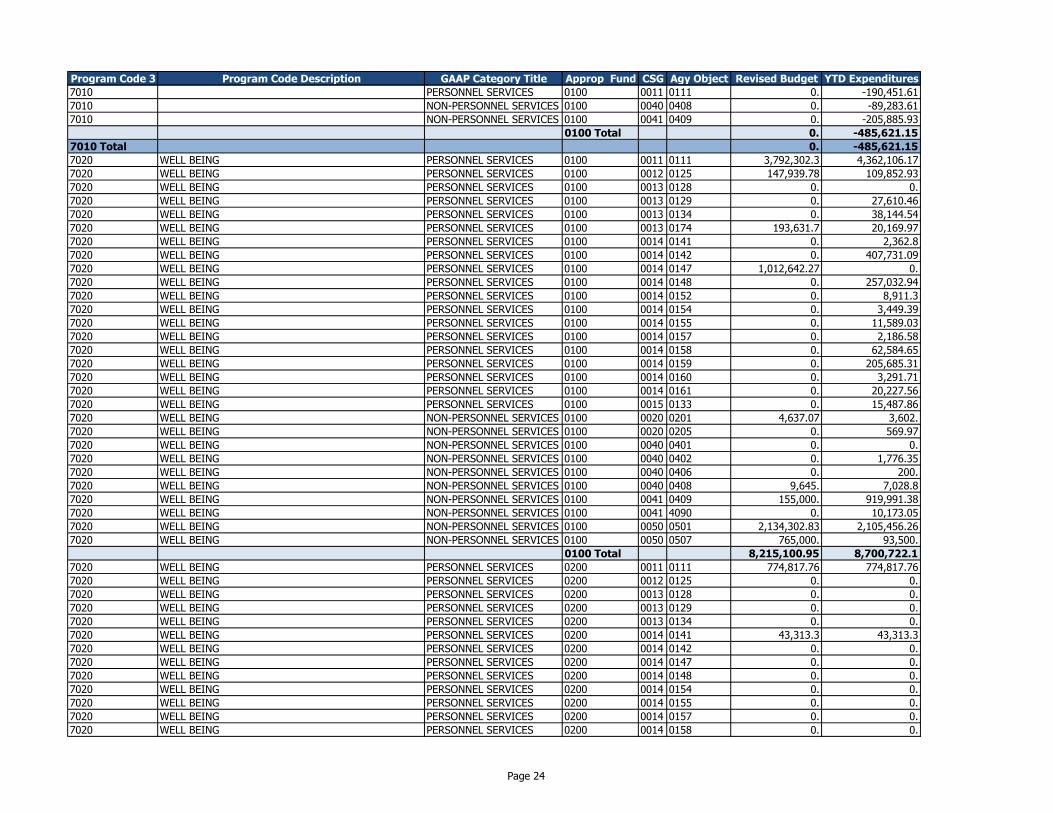
Program Code 3 Program Code Description GAAP Category Title Approp Fund CSG Agy Object Revised Budget YTD Expenditures
7010 PERSONNEL SERVICES 0100 0011 0111 0. -190,451.61
7010 NON-PERSONNEL SERVICES 0100 0040 0408 0. -89,283.61
7010 NON-PERSONNEL SERVICES 0100 0041 0409 0. -205,885.93
0100 Total 0. -485,621.15
7010 Total 0. -485,621.15
7020 WELL BEING PERSONNEL SERVICES 0100 0011 0111 3,792,302.3 4,362,106.17
7020 WELL BEING PERSONNEL SERVICES 0100 0012 0125 147,939.78 109,852.93
7020 WELL BEING PERSONNEL SERVICES 0100 0013 0128 0. 0.
7020 WELL BEING PERSONNEL SERVICES 0100 0013 0129 0. 27,610.46
7020 WELL BEING PERSONNEL SERVICES 0100 0013 0134 0. 38,144.54
7020 WELL BEING PERSONNEL SERVICES 0100 0013 0174 193,631.7 20,169.97
7020 WELL BEING PERSONNEL SERVICES 0100 0014 0141 0. 2,362.8
7020 WELL BEING PERSONNEL SERVICES 0100 0014 0142 0. 407,731.09
7020 WELL BEING PERSONNEL SERVICES 0100 0014 0147 1,012,642.27 0.
7020 WELL BEING PERSONNEL SERVICES 0100 0014 0148 0. 257,032.94
7020 WELL BEING PERSONNEL SERVICES 0100 0014 0152 0. 8,911.3
7020 WELL BEING PERSONNEL SERVICES 0100 0014 0154 0. 3,449.39
7020 WELL BEING PERSONNEL SERVICES 0100 0014 0155 0. 11,589.03
7020 WELL BEING PERSONNEL SERVICES 0100 0014 0157 0. 2,186.58
7020 WELL BEING PERSONNEL SERVICES 0100 0014 0158 0. 62,584.65
7020 WELL BEING PERSONNEL SERVICES 0100 0014 0159 0. 205,685.31
7020 WELL BEING PERSONNEL SERVICES 0100 0014 0160 0. 3,291.71
7020 WELL BEING PERSONNEL SERVICES 0100 0014 0161 0. 20,227.56
7020 WELL BEING PERSONNEL SERVICES 0100 0015 0133 0. 15,487.86
7020 WELL BEING NON-PERSONNEL SERVICES 0100 0020 0201 4,637.07 3,602.
7020 WELL BEING NON-PERSONNEL SERVICES 0100 0020 0205 0. 569.97
7020 WELL BEING NON-PERSONNEL SERVICES 0100 0040 0401 0. 0.
7020 WELL BEING NON-PERSONNEL SERVICES 0100 0040 0402 0. 1,776.35
7020 WELL BEING NON-PERSONNEL SERVICES 0100 0040 0406 0. 200.
7020 WELL BEING NON-PERSONNEL SERVICES 0100 0040 0408 9,645. 7,028.8
7020 WELL BEING NON-PERSONNEL SERVICES 0100 0041 0409 155,000. 919,991.38
7020 WELL BEING NON-PERSONNEL SERVICES 0100 0041 4090 0. 10,173.05
7020 WELL BEING NON-PERSONNEL SERVICES 0100 0050 0501 2,134,302.83 2,105,456.26
7020 WELL BEING NON-PERSONNEL SERVICES 0100 0050 0507 765,000. 93,500.
0100 Total 8,215,100.95 8,700,722.1
7020 WELL BEING PERSONNEL SERVICES 0200 0011 0111 774,817.76 774,817.76
7020 WELL BEING PERSONNEL SERVICES 0200 0012 0125 0. 0.
7020 WELL BEING PERSONNEL SERVICES 0200 0013 0128 0. 0.
7020 WELL BEING PERSONNEL SERVICES 0200 0013 0129 0. 0.
7020 WELL BEING PERSONNEL SERVICES 0200 0013 0134 0. 0.
7020 WELL BEING PERSONNEL SERVICES 0200 0014 0141 43,313.3 43,313.3
7020 WELL BEING PERSONNEL SERVICES 0200 0014 0142 0. 0.
7020 WELL BEING PERSONNEL SERVICES 0200 0014 0147 0. 0.
7020 WELL BEING PERSONNEL SERVICES 0200 0014 0148 0. 0.
7020 WELL BEING PERSONNEL SERVICES 0200 0014 0154 0. 0.
7020 WELL BEING PERSONNEL SERVICES 0200 0014 0155 0. 0.
7020 WELL BEING PERSONNEL SERVICES 0200 0014 0157 0. 0.
7020 WELL BEING PERSONNEL SERVICES 0200 0014 0158 0. 0.
Page 24
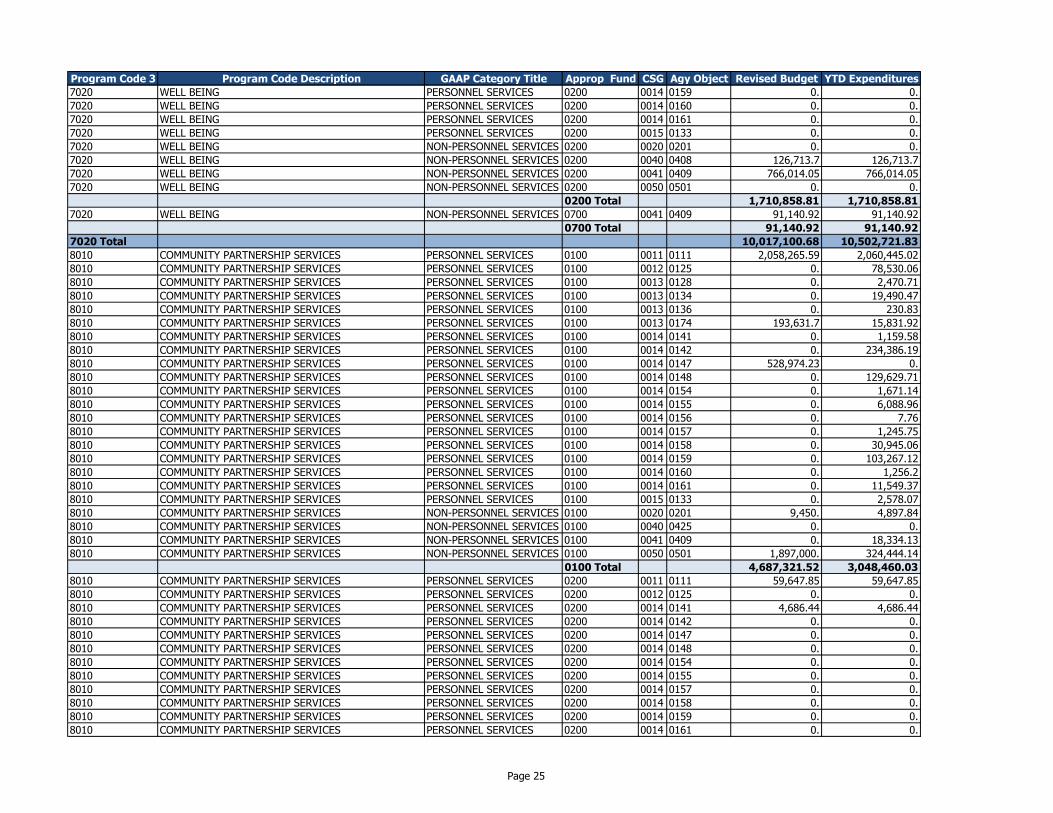
Program Code 3 Program Code Description GAAP Category Title Approp Fund CSG Agy Object Revised Budget YTD Expenditures
7020 WELL BEING PERSONNEL SERVICES 0200 0014 0159 0. 0.
7020 WELL BEING PERSONNEL SERVICES 0200 0014 0160 0. 0.
7020 WELL BEING PERSONNEL SERVICES 0200 0014 0161 0. 0.
7020 WELL BEING PERSONNEL SERVICES 0200 0015 0133 0. 0.
7020 WELL BEING NON-PERSONNEL SERVICES 0200 0020 0201 0. 0.
7020 WELL BEING NON-PERSONNEL SERVICES 0200 0040 0408 126,713.7 126,713.7
7020 WELL BEING NON-PERSONNEL SERVICES 0200 0041 0409 766,014.05 766,014.05
7020 WELL BEING NON-PERSONNEL SERVICES 0200 0050 0501 0. 0.
0200 Total 1,710,858.81 1,710,858.81
7020 WELL BEING NON-PERSONNEL SERVICES 0700 0041 0409 91,140.92 91,140.92
0700 Total 91,140.92 91,140.92
7020 Total 10,017,100.68 10,502,721.83
8010 COMMUNITY PARTNERSHIP SERVICES PERSONNEL SERVICES 0100 0011 0111 2,058,265.59 2,060,445.02
8010 COMMUNITY PARTNERSHIP SERVICES PERSONNEL SERVICES 0100 0012 0125 0. 78,530.06
8010 COMMUNITY PARTNERSHIP SERVICES PERSONNEL SERVICES 0100 0013 0128 0. 2,470.71
8010 COMMUNITY PARTNERSHIP SERVICES PERSONNEL SERVICES 0100 0013 0134 0. 19,490.47
8010 COMMUNITY PARTNERSHIP SERVICES PERSONNEL SERVICES 0100 0013 0136 0. 230.83
8010 COMMUNITY PARTNERSHIP SERVICES PERSONNEL SERVICES 0100 0013 0174 193,631.7 15,831.92
8010 COMMUNITY PARTNERSHIP SERVICES PERSONNEL SERVICES 0100 0014 0141 0. 1,159.58
8010 COMMUNITY PARTNERSHIP SERVICES PERSONNEL SERVICES 0100 0014 0142 0. 234,386.19
8010 COMMUNITY PARTNERSHIP SERVICES PERSONNEL SERVICES 0100 0014 0147 528,974.23 0.
8010 COMMUNITY PARTNERSHIP SERVICES PERSONNEL SERVICES 0100 0014 0148 0. 129,629.71
8010 COMMUNITY PARTNERSHIP SERVICES PERSONNEL SERVICES 0100 0014 0154 0. 1,671.14
8010 COMMUNITY PARTNERSHIP SERVICES PERSONNEL SERVICES 0100 0014 0155 0. 6,088.96
8010 COMMUNITY PARTNERSHIP SERVICES PERSONNEL SERVICES 0100 0014 0156 0. 7.76
8010 COMMUNITY PARTNERSHIP SERVICES PERSONNEL SERVICES 0100 0014 0157 0. 1,245.75
8010 COMMUNITY PARTNERSHIP SERVICES PERSONNEL SERVICES 0100 0014 0158 0. 30,945.06
8010 COMMUNITY PARTNERSHIP SERVICES PERSONNEL SERVICES 0100 0014 0159 0. 103,267.12
8010 COMMUNITY PARTNERSHIP SERVICES PERSONNEL SERVICES 0100 0014 0160 0. 1,256.2
8010 COMMUNITY PARTNERSHIP SERVICES PERSONNEL SERVICES 0100 0014 0161 0. 11,549.37
8010 COMMUNITY PARTNERSHIP SERVICES PERSONNEL SERVICES 0100 0015 0133 0. 2,578.07
8010 COMMUNITY PARTNERSHIP SERVICES NON-PERSONNEL SERVICES 0100 0020 0201 9,450. 4,897.84
8010 COMMUNITY PARTNERSHIP SERVICES NON-PERSONNEL SERVICES 0100 0040 0425 0. 0.
8010 COMMUNITY PARTNERSHIP SERVICES NON-PERSONNEL SERVICES 0100 0041 0409 0. 18,334.13
8010 COMMUNITY PARTNERSHIP SERVICES NON-PERSONNEL SERVICES 0100 0050 0501 1,897,000. 324,444.14
0100 Total 4,687,321.52 3,048,460.03
8010 COMMUNITY PARTNERSHIP SERVICES PERSONNEL SERVICES 0200 0011 0111 59,647.85 59,647.85
8010 COMMUNITY PARTNERSHIP SERVICES PERSONNEL SERVICES 0200 0012 0125 0. 0.
8010 COMMUNITY PARTNERSHIP SERVICES PERSONNEL SERVICES 0200 0014 0141 4,686.44 4,686.44
8010 COMMUNITY PARTNERSHIP SERVICES PERSONNEL SERVICES 0200 0014 0142 0. 0.
8010 COMMUNITY PARTNERSHIP SERVICES PERSONNEL SERVICES 0200 0014 0147 0. 0.
8010 COMMUNITY PARTNERSHIP SERVICES PERSONNEL SERVICES 0200 0014 0148 0. 0.
8010 COMMUNITY PARTNERSHIP SERVICES PERSONNEL SERVICES 0200 0014 0154 0. 0.
8010 COMMUNITY PARTNERSHIP SERVICES PERSONNEL SERVICES 0200 0014 0155 0. 0.
8010 COMMUNITY PARTNERSHIP SERVICES PERSONNEL SERVICES 0200 0014 0157 0. 0.
8010 COMMUNITY PARTNERSHIP SERVICES PERSONNEL SERVICES 0200 0014 0158 0. 0.
8010 COMMUNITY PARTNERSHIP SERVICES PERSONNEL SERVICES 0200 0014 0159 0. 0.
8010 COMMUNITY PARTNERSHIP SERVICES PERSONNEL SERVICES 0200 0014 0161 0. 0.
Page 25
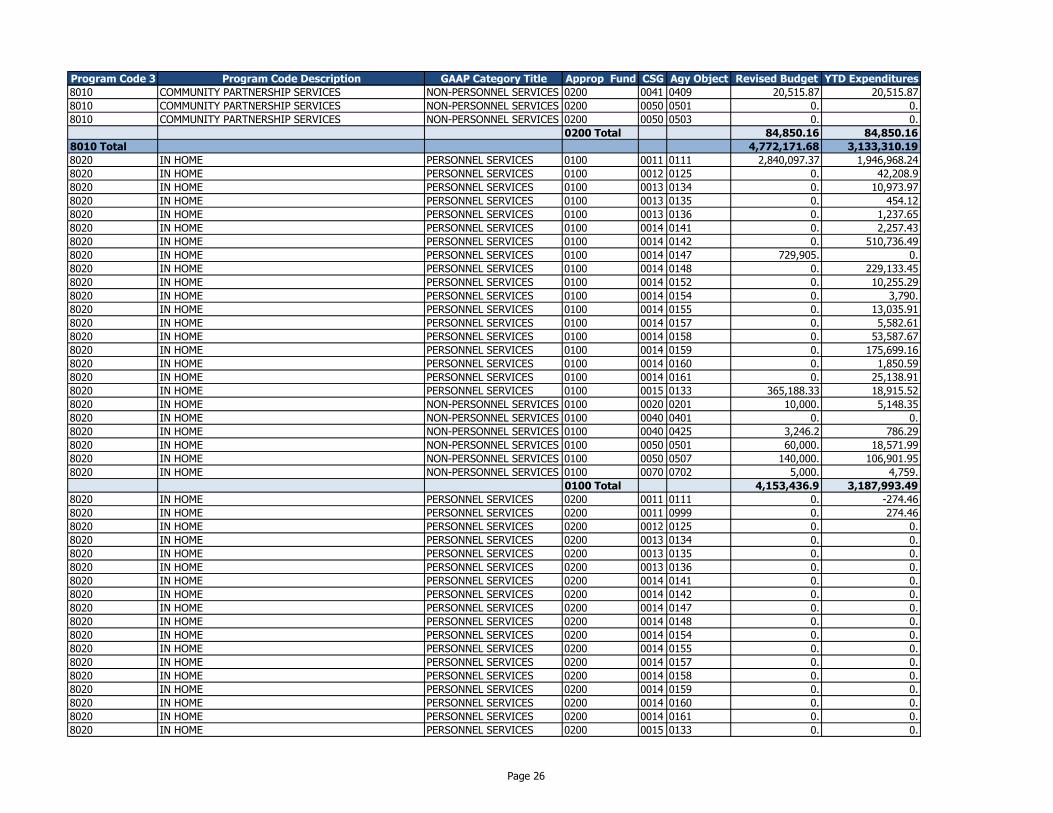
Program Code 3 Program Code Description GAAP Category Title Approp Fund CSG Agy Object Revised Budget YTD Expenditures
8010 COMMUNITY PARTNERSHIP SERVICES NON-PERSONNEL SERVICES 0200 0041 0409 20,515.87 20,515.87
8010 COMMUNITY PARTNERSHIP SERVICES NON-PERSONNEL SERVICES 0200 0050 0501 0. 0.
8010 COMMUNITY PARTNERSHIP SERVICES NON-PERSONNEL SERVICES 0200 0050 0503 0. 0.
0200 Total 84,850.16 84,850.16
8010 Total 4,772,171.68 3,133,310.19
8020 IN HOME PERSONNEL SERVICES 0100 0011 0111 2,840,097.37 1,946,968.24
8020 IN HOME PERSONNEL SERVICES 0100 0012 0125 0. 42,208.9
8020 IN HOME PERSONNEL SERVICES 0100 0013 0134 0. 10,973.97
8020 IN HOME PERSONNEL SERVICES 0100 0013 0135 0. 454.12
8020 IN HOME PERSONNEL SERVICES 0100 0013 0136 0. 1,237.65
8020 IN HOME PERSONNEL SERVICES 0100 0014 0141 0. 2,257.43
8020 IN HOME PERSONNEL SERVICES 0100 0014 0142 0. 510,736.49
8020 IN HOME PERSONNEL SERVICES 0100 0014 0147 729,905. 0.
8020 IN HOME PERSONNEL SERVICES 0100 0014 0148 0. 229,133.45
8020 IN HOME PERSONNEL SERVICES 0100 0014 0152 0. 10,255.29
8020 IN HOME PERSONNEL SERVICES 0100 0014 0154 0. 3,790.
8020 IN HOME PERSONNEL SERVICES 0100 0014 0155 0. 13,035.91
8020 IN HOME PERSONNEL SERVICES 0100 0014 0157 0. 5,582.61
8020 IN HOME PERSONNEL SERVICES 0100 0014 0158 0. 53,587.67
8020 IN HOME PERSONNEL SERVICES 0100 0014 0159 0. 175,699.16
8020 IN HOME PERSONNEL SERVICES 0100 0014 0160 0. 1,850.59
8020 IN HOME PERSONNEL SERVICES 0100 0014 0161 0. 25,138.91
8020 IN HOME PERSONNEL SERVICES 0100 0015 0133 365,188.33 18,915.52
8020 IN HOME NON-PERSONNEL SERVICES 0100 0020 0201 10,000. 5,148.35
8020 IN HOME NON-PERSONNEL SERVICES 0100 0040 0401 0. 0.
8020 IN HOME NON-PERSONNEL SERVICES 0100 0040 0425 3,246.2 786.29
8020 IN HOME NON-PERSONNEL SERVICES 0100 0050 0501 60,000. 18,571.99
8020 IN HOME NON-PERSONNEL SERVICES 0100 0050 0507 140,000. 106,901.95
8020 IN HOME NON-PERSONNEL SERVICES 0100 0070 0702 5,000. 4,759.
0100 Total 4,153,436.9 3,187,993.49
8020 IN HOME PERSONNEL SERVICES 0200 0011 0111 0. -274.46
8020 IN HOME PERSONNEL SERVICES 0200 0011 0999 0. 274.46
8020 IN HOME PERSONNEL SERVICES 0200 0012 0125 0. 0.
8020 IN HOME PERSONNEL SERVICES 0200 0013 0134 0. 0.
8020 IN HOME PERSONNEL SERVICES 0200 0013 0135 0. 0.
8020 IN HOME PERSONNEL SERVICES 0200 0013 0136 0. 0.
8020 IN HOME PERSONNEL SERVICES 0200 0014 0141 0. 0.
8020 IN HOME PERSONNEL SERVICES 0200 0014 0142 0. 0.
8020 IN HOME PERSONNEL SERVICES 0200 0014 0147 0. 0.
8020 IN HOME PERSONNEL SERVICES 0200 0014 0148 0. 0.
8020 IN HOME PERSONNEL SERVICES 0200 0014 0154 0. 0.
8020 IN HOME PERSONNEL SERVICES 0200 0014 0155 0. 0.
8020 IN HOME PERSONNEL SERVICES 0200 0014 0157 0. 0.
8020 IN HOME PERSONNEL SERVICES 0200 0014 0158 0. 0.
8020 IN HOME PERSONNEL SERVICES 0200 0014 0159 0. 0.
8020 IN HOME PERSONNEL SERVICES 0200 0014 0160 0. 0.
8020 IN HOME PERSONNEL SERVICES 0200 0014 0161 0. 0.
8020 IN HOME PERSONNEL SERVICES 0200 0015 0133 0. 0.
Page 26
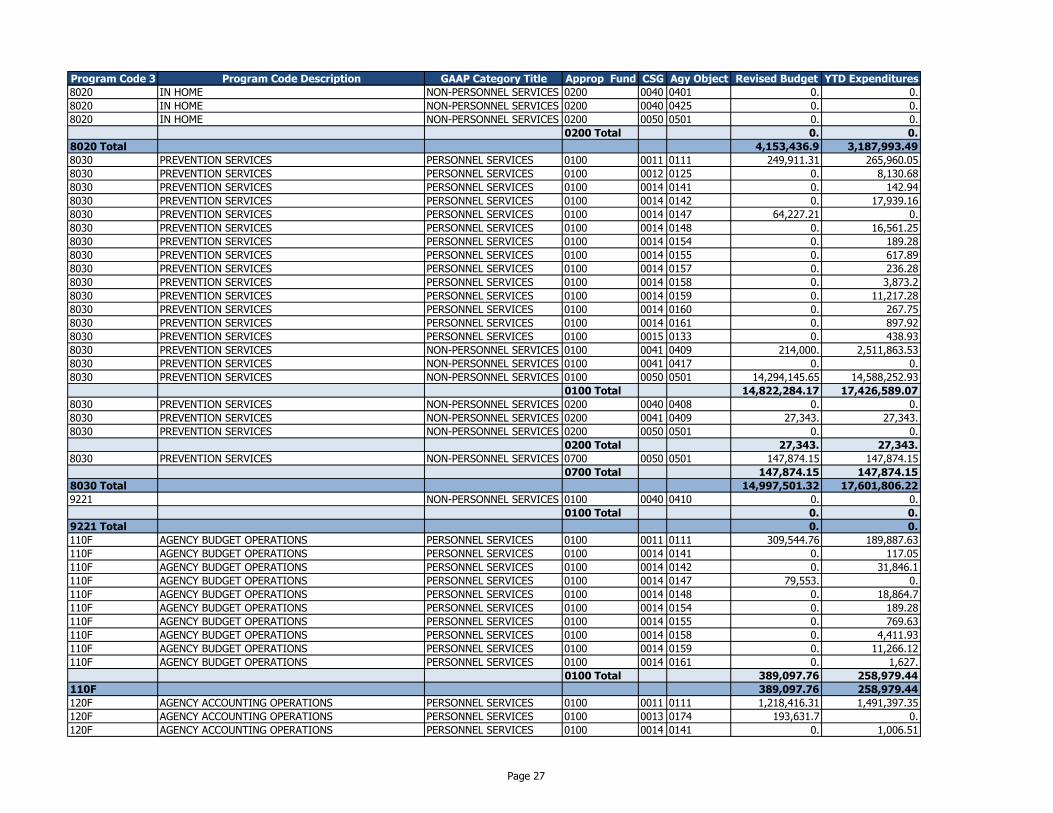
Program Code 3 Program Code Description GAAP Category Title Approp Fund CSG Agy Object Revised Budget YTD Expenditures
8020 IN HOME NON-PERSONNEL SERVICES 0200 0040 0401 0. 0.
8020 IN HOME NON-PERSONNEL SERVICES 0200 0040 0425 0. 0.
8020 IN HOME NON-PERSONNEL SERVICES 0200 0050 0501 0. 0.
0200 Total 0. 0.
8020 Total 4,153,436.9 3,187,993.49
8030 PREVENTION SERVICES PERSONNEL SERVICES 0100 0011 0111 249,911.31 265,960.05
8030 PREVENTION SERVICES PERSONNEL SERVICES 0100 0012 0125 0. 8,130.68
8030 PREVENTION SERVICES PERSONNEL SERVICES 0100 0014 0141 0. 142.94
8030 PREVENTION SERVICES PERSONNEL SERVICES 0100 0014 0142 0. 17,939.16
8030 PREVENTION SERVICES PERSONNEL SERVICES 0100 0014 0147 64,227.21 0.
8030 PREVENTION SERVICES PERSONNEL SERVICES 0100 0014 0148 0. 16,561.25
8030 PREVENTION SERVICES PERSONNEL SERVICES 0100 0014 0154 0. 189.28
8030 PREVENTION SERVICES PERSONNEL SERVICES 0100 0014 0155 0. 617.89
8030 PREVENTION SERVICES PERSONNEL SERVICES 0100 0014 0157 0. 236.28
8030 PREVENTION SERVICES PERSONNEL SERVICES 0100 0014 0158 0. 3,873.2
8030 PREVENTION SERVICES PERSONNEL SERVICES 0100 0014 0159 0. 11,217.28
8030 PREVENTION SERVICES PERSONNEL SERVICES 0100 0014 0160 0. 267.75
8030 PREVENTION SERVICES PERSONNEL SERVICES 0100 0014 0161 0. 897.92
8030 PREVENTION SERVICES PERSONNEL SERVICES 0100 0015 0133 0. 438.93
8030 PREVENTION SERVICES NON-PERSONNEL SERVICES 0100 0041 0409 214,000. 2,511,863.53
8030 PREVENTION SERVICES NON-PERSONNEL SERVICES 0100 0041 0417 0. 0.
8030 PREVENTION SERVICES NON-PERSONNEL SERVICES 0100 0050 0501 14,294,145.65 14,588,252.93
0100 Total 14,822,284.17 17,426,589.07
8030 PREVENTION SERVICES NON-PERSONNEL SERVICES 0200 0040 0408 0. 0.
8030 PREVENTION SERVICES NON-PERSONNEL SERVICES 0200 0041 0409 27,343. 27,343.
8030 PREVENTION SERVICES NON-PERSONNEL SERVICES 0200 0050 0501 0. 0.
0200 Total 27,343. 27,343.
8030 PREVENTION SERVICES NON-PERSONNEL SERVICES 0700 0050 0501 147,874.15 147,874.15
0700 Total 147,874.15 147,874.15
8030 Total 14,997,501.32 17,601,806.22
9221 NON-PERSONNEL SERVICES 0100 0040 0410 0. 0.
0100 Total 0. 0.
9221 Total 0. 0.
110F AGENCY BUDGET OPERATIONS PERSONNEL SERVICES 0100 0011 0111 309,544.76 189,887.63
110F AGENCY BUDGET OPERATIONS PERSONNEL SERVICES 0100 0014 0141 0. 117.05
110F AGENCY BUDGET OPERATIONS PERSONNEL SERVICES 0100 0014 0142 0. 31,846.1
110F AGENCY BUDGET OPERATIONS PERSONNEL SERVICES 0100 0014 0147 79,553. 0.
110F AGENCY BUDGET OPERATIONS PERSONNEL SERVICES 0100 0014 0148 0. 18,864.7
110F AGENCY BUDGET OPERATIONS PERSONNEL SERVICES 0100 0014 0154 0. 189.28
110F AGENCY BUDGET OPERATIONS PERSONNEL SERVICES 0100 0014 0155 0. 769.63
110F AGENCY BUDGET OPERATIONS PERSONNEL SERVICES 0100 0014 0158 0. 4,411.93
110F AGENCY BUDGET OPERATIONS PERSONNEL SERVICES 0100 0014 0159 0. 11,266.12
110F AGENCY BUDGET OPERATIONS PERSONNEL SERVICES 0100 0014 0161 0. 1,627.
0100 Total 389,097.76 258,979.44
110F 389,097.76 258,979.44
120F AGENCY ACCOUNTING OPERATIONS PERSONNEL SERVICES 0100 0011 0111 1,218,416.31 1,491,397.35
120F AGENCY ACCOUNTING OPERATIONS PERSONNEL SERVICES 0100 0013 0174 193,631.7 0.
120F AGENCY ACCOUNTING OPERATIONS PERSONNEL SERVICES 0100 0014 0141 0. 1,006.51
Page 27
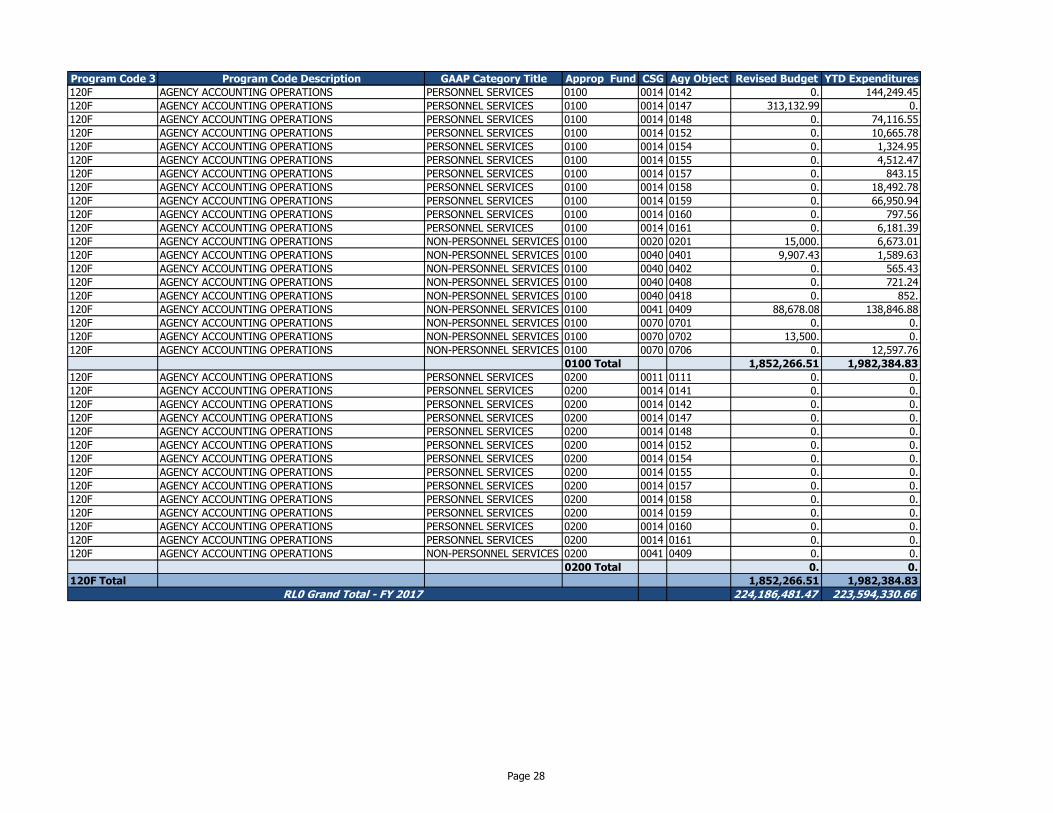
Program Code 3 Program Code Description GAAP Category Title Approp Fund CSG Agy Object Revised Budget YTD Expenditures
120F AGENCY ACCOUNTING OPERATIONS PERSONNEL SERVICES 0100 0014 0142 0. 144,249.45
120F AGENCY ACCOUNTING OPERATIONS PERSONNEL SERVICES 0100 0014 0147 313,132.99 0.
120F AGENCY ACCOUNTING OPERATIONS PERSONNEL SERVICES 0100 0014 0148 0. 74,116.55
120F AGENCY ACCOUNTING OPERATIONS PERSONNEL SERVICES 0100 0014 0152 0. 10,665.78
120F AGENCY ACCOUNTING OPERATIONS PERSONNEL SERVICES 0100 0014 0154 0. 1,324.95
120F AGENCY ACCOUNTING OPERATIONS PERSONNEL SERVICES 0100 0014 0155 0. 4,512.47
120F AGENCY ACCOUNTING OPERATIONS PERSONNEL SERVICES 0100 0014 0157 0. 843.15
120F AGENCY ACCOUNTING OPERATIONS PERSONNEL SERVICES 0100 0014 0158 0. 18,492.78
120F AGENCY ACCOUNTING OPERATIONS PERSONNEL SERVICES 0100 0014 0159 0. 66,950.94
120F AGENCY ACCOUNTING OPERATIONS PERSONNEL SERVICES 0100 0014 0160 0. 797.56
120F AGENCY ACCOUNTING OPERATIONS PERSONNEL SERVICES 0100 0014 0161 0. 6,181.39
120F AGENCY ACCOUNTING OPERATIONS NON-PERSONNEL SERVICES 0100 0020 0201 15,000. 6,673.01
120F AGENCY ACCOUNTING OPERATIONS NON-PERSONNEL SERVICES 0100 0040 0401 9,907.43 1,589.63
120F AGENCY ACCOUNTING OPERATIONS NON-PERSONNEL SERVICES 0100 0040 0402 0. 565.43
120F AGENCY ACCOUNTING OPERATIONS NON-PERSONNEL SERVICES 0100 0040 0408 0. 721.24
120F AGENCY ACCOUNTING OPERATIONS NON-PERSONNEL SERVICES 0100 0040 0418 0. 852.
120F AGENCY ACCOUNTING OPERATIONS NON-PERSONNEL SERVICES 0100 0041 0409 88,678.08 138,846.88
120F AGENCY ACCOUNTING OPERATIONS NON-PERSONNEL SERVICES 0100 0070 0701 0. 0.
120F AGENCY ACCOUNTING OPERATIONS NON-PERSONNEL SERVICES 0100 0070 0702 13,500. 0.
120F AGENCY ACCOUNTING OPERATIONS NON-PERSONNEL SERVICES 0100 0070 0706 0. 12,597.76
0100 Total 1,852,266.51 1,982,384.83
120F AGENCY ACCOUNTING OPERATIONS PERSONNEL SERVICES 0200 0011 0111 0. 0.
120F AGENCY ACCOUNTING OPERATIONS PERSONNEL SERVICES 0200 0014 0141 0. 0.
120F AGENCY ACCOUNTING OPERATIONS PERSONNEL SERVICES 0200 0014 0142 0. 0.
120F AGENCY ACCOUNTING OPERATIONS PERSONNEL SERVICES 0200 0014 0147 0. 0.
120F AGENCY ACCOUNTING OPERATIONS PERSONNEL SERVICES 0200 0014 0148 0. 0.
120F AGENCY ACCOUNTING OPERATIONS PERSONNEL SERVICES 0200 0014 0152 0. 0.
120F AGENCY ACCOUNTING OPERATIONS PERSONNEL SERVICES 0200 0014 0154 0. 0.
120F AGENCY ACCOUNTING OPERATIONS PERSONNEL SERVICES 0200 0014 0155 0. 0.
120F AGENCY ACCOUNTING OPERATIONS PERSONNEL SERVICES 0200 0014 0157 0. 0.
120F AGENCY ACCOUNTING OPERATIONS PERSONNEL SERVICES 0200 0014 0158 0. 0.
120F AGENCY ACCOUNTING OPERATIONS PERSONNEL SERVICES 0200 0014 0159 0. 0.
120F AGENCY ACCOUNTING OPERATIONS PERSONNEL SERVICES 0200 0014 0160 0. 0.
120F AGENCY ACCOUNTING OPERATIONS PERSONNEL SERVICES 0200 0014 0161 0. 0.
120F AGENCY ACCOUNTING OPERATIONS NON-PERSONNEL SERVICES 0200 0041 0409 0. 0.
0200 Total 0. 0.
120F Total 1,852,266.51 1,982,384.83
224,186,481.47 223,594,330.66RL0 Grand Total - FY 2017
Page 28
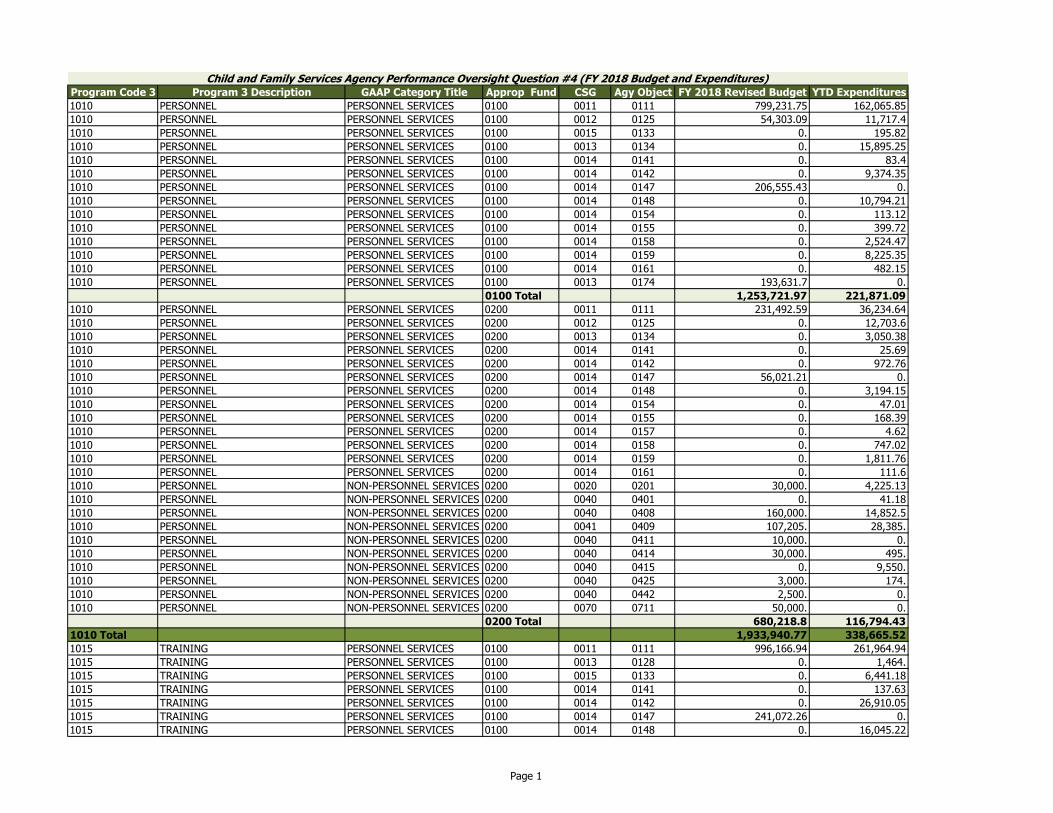
Program Code 3 Program 3 Description GAAP Category Title Approp Fund CSG Agy Object FY 2018 Revised Budget YTD Expenditures
1010 PERSONNEL PERSONNEL SERVICES 0100 0011 0111 799,231.75 162,065.85
1010 PERSONNEL PERSONNEL SERVICES 0100 0012 0125 54,303.09 11,717.4
1010 PERSONNEL PERSONNEL SERVICES 0100 0015 0133 0. 195.82
1010 PERSONNEL PERSONNEL SERVICES 0100 0013 0134 0. 15,895.25
1010 PERSONNEL PERSONNEL SERVICES 0100 0014 0141 0. 83.4
1010 PERSONNEL PERSONNEL SERVICES 0100 0014 0142 0. 9,374.35
1010 PERSONNEL PERSONNEL SERVICES 0100 0014 0147 206,555.43 0.
1010 PERSONNEL PERSONNEL SERVICES 0100 0014 0148 0. 10,794.21
1010 PERSONNEL PERSONNEL SERVICES 0100 0014 0154 0. 113.12
1010 PERSONNEL PERSONNEL SERVICES 0100 0014 0155 0. 399.72
1010 PERSONNEL PERSONNEL SERVICES 0100 0014 0158 0. 2,524.47
1010 PERSONNEL PERSONNEL SERVICES 0100 0014 0159 0. 8,225.35
1010 PERSONNEL PERSONNEL SERVICES 0100 0014 0161 0. 482.15
1010 PERSONNEL PERSONNEL SERVICES 0100 0013 0174 193,631.7 0.
0100 Total 1,253,721.97 221,871.09
1010 PERSONNEL PERSONNEL SERVICES 0200 0011 0111 231,492.59 36,234.64
1010 PERSONNEL PERSONNEL SERVICES 0200 0012 0125 0. 12,703.6
1010 PERSONNEL PERSONNEL SERVICES 0200 0013 0134 0. 3,050.38
1010 PERSONNEL PERSONNEL SERVICES 0200 0014 0141 0. 25.69
1010 PERSONNEL PERSONNEL SERVICES 0200 0014 0142 0. 972.76
1010 PERSONNEL PERSONNEL SERVICES 0200 0014 0147 56,021.21 0.
1010 PERSONNEL PERSONNEL SERVICES 0200 0014 0148 0. 3,194.15
1010 PERSONNEL PERSONNEL SERVICES 0200 0014 0154 0. 47.01
1010 PERSONNEL PERSONNEL SERVICES 0200 0014 0155 0. 168.39
1010 PERSONNEL PERSONNEL SERVICES 0200 0014 0157 0. 4.62
1010 PERSONNEL PERSONNEL SERVICES 0200 0014 0158 0. 747.02
1010 PERSONNEL PERSONNEL SERVICES 0200 0014 0159 0. 1,811.76
1010 PERSONNEL PERSONNEL SERVICES 0200 0014 0161 0. 111.6
1010 PERSONNEL NON-PERSONNEL SERVICES 0200 0020 0201 30,000. 4,225.13
1010 PERSONNEL NON-PERSONNEL SERVICES 0200 0040 0401 0. 41.18
1010 PERSONNEL NON-PERSONNEL SERVICES 0200 0040 0408 160,000. 14,852.5
1010 PERSONNEL NON-PERSONNEL SERVICES 0200 0041 0409 107,205. 28,385.
1010 PERSONNEL NON-PERSONNEL SERVICES 0200 0040 0411 10,000. 0.
1010 PERSONNEL NON-PERSONNEL SERVICES 0200 0040 0414 30,000. 495.
1010 PERSONNEL NON-PERSONNEL SERVICES 0200 0040 0415 0. 9,550.
1010 PERSONNEL NON-PERSONNEL SERVICES 0200 0040 0425 3,000. 174.
1010 PERSONNEL NON-PERSONNEL SERVICES 0200 0040 0442 2,500. 0.
1010 PERSONNEL NON-PERSONNEL SERVICES 0200 0070 0711 50,000. 0.
0200 Total 680,218.8 116,794.43
1010 Total 1,933,940.77 338,665.52
1015 TRAINING PERSONNEL SERVICES 0100 0011 0111 996,166.94 261,964.94
1015 TRAINING PERSONNEL SERVICES 0100 0013 0128 0. 1,464.
1015 TRAINING PERSONNEL SERVICES 0100 0015 0133 0. 6,441.18
1015 TRAINING PERSONNEL SERVICES 0100 0014 0141 0. 137.63
1015 TRAINING PERSONNEL SERVICES 0100 0014 0142 0. 26,910.05
1015 TRAINING PERSONNEL SERVICES 0100 0014 0147 241,072.26 0.
1015 TRAINING PERSONNEL SERVICES 0100 0014 0148 0. 16,045.22
Child and Family Services Agency Performance Oversight Question #4 (FY 2018 Budget and Expenditures)
Page 1
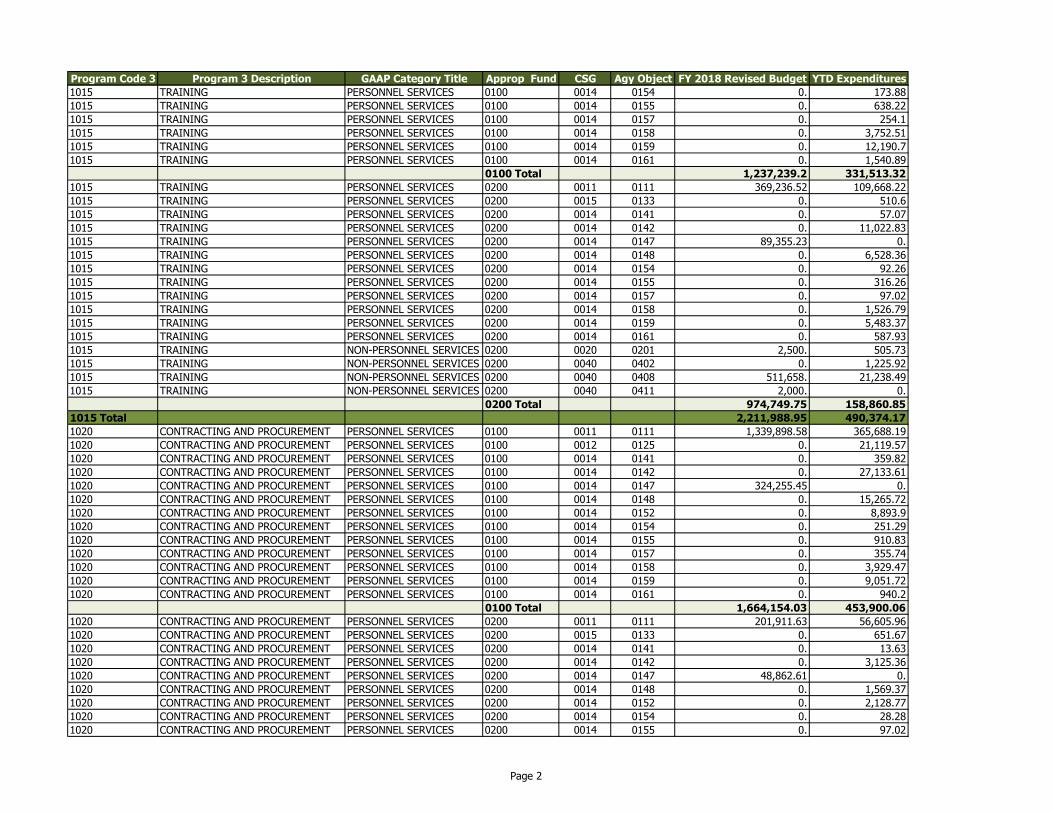
Program Code 3 Program 3 Description GAAP Category Title Approp Fund CSG Agy Object FY 2018 Revised Budget YTD Expenditures
1015 TRAINING PERSONNEL SERVICES 0100 0014 0154 0. 173.88
1015 TRAINING PERSONNEL SERVICES 0100 0014 0155 0. 638.22
1015 TRAINING PERSONNEL SERVICES 0100 0014 0157 0. 254.1
1015 TRAINING PERSONNEL SERVICES 0100 0014 0158 0. 3,752.51
1015 TRAINING PERSONNEL SERVICES 0100 0014 0159 0. 12,190.7
1015 TRAINING PERSONNEL SERVICES 0100 0014 0161 0. 1,540.89
0100 Total 1,237,239.2 331,513.32
1015 TRAINING PERSONNEL SERVICES 0200 0011 0111 369,236.52 109,668.22
1015 TRAINING PERSONNEL SERVICES 0200 0015 0133 0. 510.6
1015 TRAINING PERSONNEL SERVICES 0200 0014 0141 0. 57.07
1015 TRAINING PERSONNEL SERVICES 0200 0014 0142 0. 11,022.83
1015 TRAINING PERSONNEL SERVICES 0200 0014 0147 89,355.23 0.
1015 TRAINING PERSONNEL SERVICES 0200 0014 0148 0. 6,528.36
1015 TRAINING PERSONNEL SERVICES 0200 0014 0154 0. 92.26
1015 TRAINING PERSONNEL SERVICES 0200 0014 0155 0. 316.26
1015 TRAINING PERSONNEL SERVICES 0200 0014 0157 0. 97.02
1015 TRAINING PERSONNEL SERVICES 0200 0014 0158 0. 1,526.79
1015 TRAINING PERSONNEL SERVICES 0200 0014 0159 0. 5,483.37
1015 TRAINING PERSONNEL SERVICES 0200 0014 0161 0. 587.93
1015 TRAINING NON-PERSONNEL SERVICES 0200 0020 0201 2,500. 505.73
1015 TRAINING NON-PERSONNEL SERVICES 0200 0040 0402 0. 1,225.92
1015 TRAINING NON-PERSONNEL SERVICES 0200 0040 0408 511,658. 21,238.49
1015 TRAINING NON-PERSONNEL SERVICES 0200 0040 0411 2,000. 0.
0200 Total 974,749.75 158,860.85
1015 Total 2,211,988.95 490,374.17
1020 CONTRACTING AND PROCUREMENT PERSONNEL SERVICES 0100 0011 0111 1,339,898.58 365,688.19
1020 CONTRACTING AND PROCUREMENT PERSONNEL SERVICES 0100 0012 0125 0. 21,119.57
1020 CONTRACTING AND PROCUREMENT PERSONNEL SERVICES 0100 0014 0141 0. 359.82
1020 CONTRACTING AND PROCUREMENT PERSONNEL SERVICES 0100 0014 0142 0. 27,133.61
1020 CONTRACTING AND PROCUREMENT PERSONNEL SERVICES 0100 0014 0147 324,255.45 0.
1020 CONTRACTING AND PROCUREMENT PERSONNEL SERVICES 0100 0014 0148 0. 15,265.72
1020 CONTRACTING AND PROCUREMENT PERSONNEL SERVICES 0100 0014 0152 0. 8,893.9
1020 CONTRACTING AND PROCUREMENT PERSONNEL SERVICES 0100 0014 0154 0. 251.29
1020 CONTRACTING AND PROCUREMENT PERSONNEL SERVICES 0100 0014 0155 0. 910.83
1020 CONTRACTING AND PROCUREMENT PERSONNEL SERVICES 0100 0014 0157 0. 355.74
1020 CONTRACTING AND PROCUREMENT PERSONNEL SERVICES 0100 0014 0158 0. 3,929.47
1020 CONTRACTING AND PROCUREMENT PERSONNEL SERVICES 0100 0014 0159 0. 9,051.72
1020 CONTRACTING AND PROCUREMENT PERSONNEL SERVICES 0100 0014 0161 0. 940.2
0100 Total 1,664,154.03 453,900.06
1020 CONTRACTING AND PROCUREMENT PERSONNEL SERVICES 0200 0011 0111 201,911.63 56,605.96
1020 CONTRACTING AND PROCUREMENT PERSONNEL SERVICES 0200 0015 0133 0. 651.67
1020 CONTRACTING AND PROCUREMENT PERSONNEL SERVICES 0200 0014 0141 0. 13.63
1020 CONTRACTING AND PROCUREMENT PERSONNEL SERVICES 0200 0014 0142 0. 3,125.36
1020 CONTRACTING AND PROCUREMENT PERSONNEL SERVICES 0200 0014 0147 48,862.61 0.
1020 CONTRACTING AND PROCUREMENT PERSONNEL SERVICES 0200 0014 0148 0. 1,569.37
1020 CONTRACTING AND PROCUREMENT PERSONNEL SERVICES 0200 0014 0152 0. 2,128.77
1020 CONTRACTING AND PROCUREMENT PERSONNEL SERVICES 0200 0014 0154 0. 28.28
1020 CONTRACTING AND PROCUREMENT PERSONNEL SERVICES 0200 0014 0155 0. 97.02
Page 2

Program Code 3 Program 3 Description GAAP Category Title Approp Fund CSG Agy Object FY 2018 Revised Budget YTD Expenditures
1020 CONTRACTING AND PROCUREMENT PERSONNEL SERVICES 0200 0014 0157 0. 64.68
1020 CONTRACTING AND PROCUREMENT PERSONNEL SERVICES 0200 0014 0158 0. 367.02
1020 CONTRACTING AND PROCUREMENT PERSONNEL SERVICES 0200 0014 0159 0. 1,309.73
1020 CONTRACTING AND PROCUREMENT PERSONNEL SERVICES 0200 0014 0161 0. 83.93
1020 CONTRACTING AND PROCUREMENT NON-PERSONNEL SERVICES 0200 0020 0201 4,500. -2,058.
1020 CONTRACTING AND PROCUREMENT NON-PERSONNEL SERVICES 0200 0040 0401 0. 0.
1020 CONTRACTING AND PROCUREMENT NON-PERSONNEL SERVICES 0200 0040 0402 0. -1,235.04
1020 CONTRACTING AND PROCUREMENT NON-PERSONNEL SERVICES 0200 0040 0408 11,614.62 3,005.
1020 CONTRACTING AND PROCUREMENT NON-PERSONNEL SERVICES 0200 0041 0409 40,000. 0.
1020 CONTRACTING AND PROCUREMENT NON-PERSONNEL SERVICES 0200 0040 0414 2,000. 0.
1020 CONTRACTING AND PROCUREMENT NON-PERSONNEL SERVICES 0200 0040 0425 1,605. 0.
0200 Total 310,493.86 65,757.38
1020 Total 1,974,647.89 519,657.44
1030 PROPERTY MANAGEMENT PERSONNEL SERVICES 0100 0011 0111 816,145.61 230,002.69
1030 PROPERTY MANAGEMENT PERSONNEL SERVICES 0100 0012 0125 144,434.24 0.
1030 PROPERTY MANAGEMENT PERSONNEL SERVICES 0100 0013 0129 0. 122.04
1030 PROPERTY MANAGEMENT PERSONNEL SERVICES 0100 0013 0131 0. 15.52
1030 PROPERTY MANAGEMENT PERSONNEL SERVICES 0100 0015 0133 0. 5,455.72
1030 PROPERTY MANAGEMENT PERSONNEL SERVICES 0100 0013 0134 0. 14,194.54
1030 PROPERTY MANAGEMENT PERSONNEL SERVICES 0100 0014 0141 0. 149.61
1030 PROPERTY MANAGEMENT PERSONNEL SERVICES 0100 0014 0142 0. 17,315.8
1030 PROPERTY MANAGEMENT PERSONNEL SERVICES 0100 0014 0147 232,460.3 0.
1030 PROPERTY MANAGEMENT PERSONNEL SERVICES 0100 0014 0148 0. 12,849.69
1030 PROPERTY MANAGEMENT PERSONNEL SERVICES 0100 0014 0152 0. 1,539.27
1030 PROPERTY MANAGEMENT PERSONNEL SERVICES 0100 0014 0154 0. 219.93
1030 PROPERTY MANAGEMENT PERSONNEL SERVICES 0100 0014 0155 0. 721.8
1030 PROPERTY MANAGEMENT PERSONNEL SERVICES 0100 0014 0157 0. 263.34
1030 PROPERTY MANAGEMENT PERSONNEL SERVICES 0100 0014 0158 0. 3,262.78
1030 PROPERTY MANAGEMENT PERSONNEL SERVICES 0100 0014 0159 0. 9,233.99
1030 PROPERTY MANAGEMENT PERSONNEL SERVICES 0100 0014 0161 0. 742.94
1030 PROPERTY MANAGEMENT NON-PERSONNEL SERVICES 0100 0030 0304 1,974. 465.01
1030 PROPERTY MANAGEMENT NON-PERSONNEL SERVICES 0100 0030 0305 458,692. 68,109.28
1030 PROPERTY MANAGEMENT NON-PERSONNEL SERVICES 0100 0030 0307 31,534. 9,190.53
1030 PROPERTY MANAGEMENT NON-PERSONNEL SERVICES 0100 0031 0308 1,000,835.56 55,189.97
1030 PROPERTY MANAGEMENT NON-PERSONNEL SERVICES 0100 0032 0309 6,805,313. 2,147,083.49
1030 PROPERTY MANAGEMENT NON-PERSONNEL SERVICES 0100 0035 0310 372,089. 23,579.48
1030 PROPERTY MANAGEMENT NON-PERSONNEL SERVICES 0100 0030 0330 34,390. 0.
1030 PROPERTY MANAGEMENT NON-PERSONNEL SERVICES 0100 0033 0430 60,641. 13,078.4
1030 PROPERTY MANAGEMENT NON-PERSONNEL SERVICES 0100 0034 0440 936,256.11 170,818.35
0100 Total 10,894,764.82 2,783,604.17
1030 PROPERTY MANAGEMENT PERSONNEL SERVICES 0200 0011 0111 298,850.66 94,978.38
1030 PROPERTY MANAGEMENT PERSONNEL SERVICES 0200 0012 0125 42,883.74 0.
1030 PROPERTY MANAGEMENT PERSONNEL SERVICES 0200 0015 0133 0. 219.47
1030 PROPERTY MANAGEMENT PERSONNEL SERVICES 0200 0014 0141 0. 42.81
1030 PROPERTY MANAGEMENT PERSONNEL SERVICES 0200 0014 0142 0. 6,205.64
1030 PROPERTY MANAGEMENT PERSONNEL SERVICES 0200 0014 0147 82,699.71 0.
1030 PROPERTY MANAGEMENT PERSONNEL SERVICES 0200 0014 0148 0. 5,743.94
1030 PROPERTY MANAGEMENT PERSONNEL SERVICES 0200 0014 0154 0. 70.7
Page 3
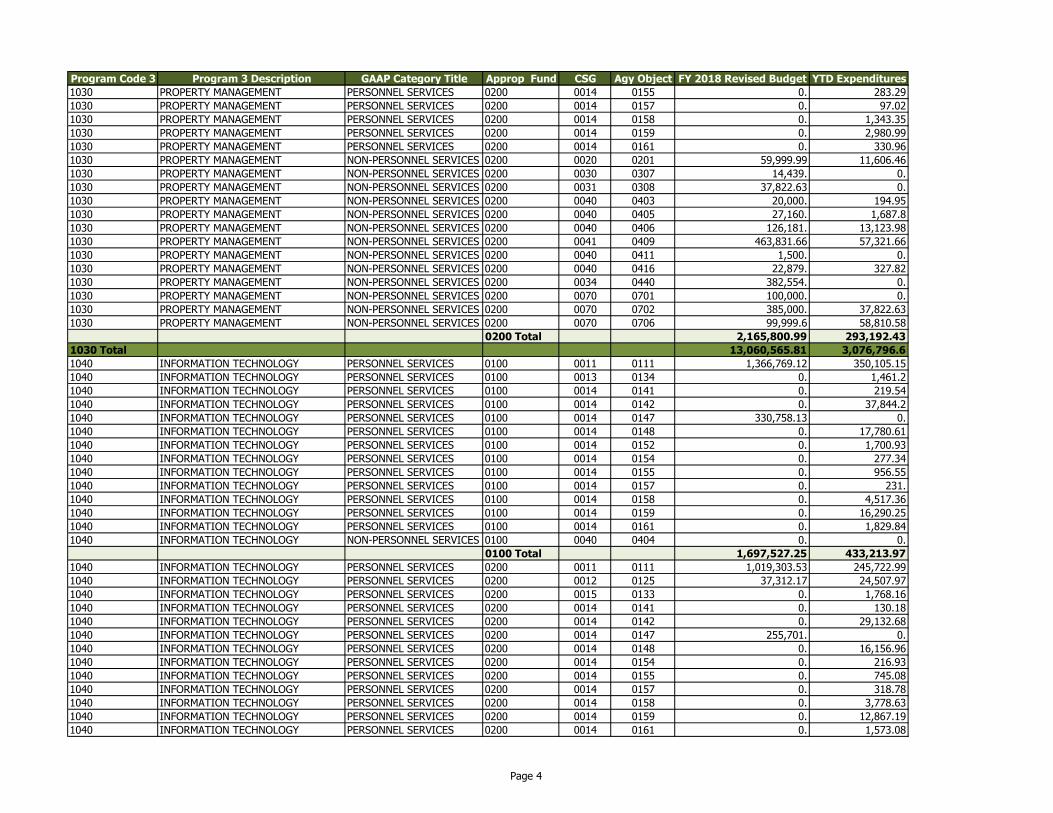
Program Code 3 Program 3 Description GAAP Category Title Approp Fund CSG Agy Object FY 2018 Revised Budget YTD Expenditures
1030 PROPERTY MANAGEMENT PERSONNEL SERVICES 0200 0014 0155 0. 283.29
1030 PROPERTY MANAGEMENT PERSONNEL SERVICES 0200 0014 0157 0. 97.02
1030 PROPERTY MANAGEMENT PERSONNEL SERVICES 0200 0014 0158 0. 1,343.35
1030 PROPERTY MANAGEMENT PERSONNEL SERVICES 0200 0014 0159 0. 2,980.99
1030 PROPERTY MANAGEMENT PERSONNEL SERVICES 0200 0014 0161 0. 330.96
1030 PROPERTY MANAGEMENT NON-PERSONNEL SERVICES 0200 0020 0201 59,999.99 11,606.46
1030 PROPERTY MANAGEMENT NON-PERSONNEL SERVICES 0200 0030 0307 14,439. 0.
1030 PROPERTY MANAGEMENT NON-PERSONNEL SERVICES 0200 0031 0308 37,822.63 0.
1030 PROPERTY MANAGEMENT NON-PERSONNEL SERVICES 0200 0040 0403 20,000. 194.95
1030 PROPERTY MANAGEMENT NON-PERSONNEL SERVICES 0200 0040 0405 27,160. 1,687.8
1030 PROPERTY MANAGEMENT NON-PERSONNEL SERVICES 0200 0040 0406 126,181. 13,123.98
1030 PROPERTY MANAGEMENT NON-PERSONNEL SERVICES 0200 0041 0409 463,831.66 57,321.66
1030 PROPERTY MANAGEMENT NON-PERSONNEL SERVICES 0200 0040 0411 1,500. 0.
1030 PROPERTY MANAGEMENT NON-PERSONNEL SERVICES 0200 0040 0416 22,879. 327.82
1030 PROPERTY MANAGEMENT NON-PERSONNEL SERVICES 0200 0034 0440 382,554. 0.
1030 PROPERTY MANAGEMENT NON-PERSONNEL SERVICES 0200 0070 0701 100,000. 0.
1030 PROPERTY MANAGEMENT NON-PERSONNEL SERVICES 0200 0070 0702 385,000. 37,822.63
1030 PROPERTY MANAGEMENT NON-PERSONNEL SERVICES 0200 0070 0706 99,999.6 58,810.58
0200 Total 2,165,800.99 293,192.43
1030 Total 13,060,565.81 3,076,796.6
1040 INFORMATION TECHNOLOGY PERSONNEL SERVICES 0100 0011 0111 1,366,769.12 350,105.15
1040 INFORMATION TECHNOLOGY PERSONNEL SERVICES 0100 0013 0134 0. 1,461.2
1040 INFORMATION TECHNOLOGY PERSONNEL SERVICES 0100 0014 0141 0. 219.54
1040 INFORMATION TECHNOLOGY PERSONNEL SERVICES 0100 0014 0142 0. 37,844.2
1040 INFORMATION TECHNOLOGY PERSONNEL SERVICES 0100 0014 0147 330,758.13 0.
1040 INFORMATION TECHNOLOGY PERSONNEL SERVICES 0100 0014 0148 0. 17,780.61
1040 INFORMATION TECHNOLOGY PERSONNEL SERVICES 0100 0014 0152 0. 1,700.93
1040 INFORMATION TECHNOLOGY PERSONNEL SERVICES 0100 0014 0154 0. 277.34
1040 INFORMATION TECHNOLOGY PERSONNEL SERVICES 0100 0014 0155 0. 956.55
1040 INFORMATION TECHNOLOGY PERSONNEL SERVICES 0100 0014 0157 0. 231.
1040 INFORMATION TECHNOLOGY PERSONNEL SERVICES 0100 0014 0158 0. 4,517.36
1040 INFORMATION TECHNOLOGY PERSONNEL SERVICES 0100 0014 0159 0. 16,290.25
1040 INFORMATION TECHNOLOGY PERSONNEL SERVICES 0100 0014 0161 0. 1,829.84
1040 INFORMATION TECHNOLOGY NON-PERSONNEL SERVICES 0100 0040 0404 0. 0.
0100 Total 1,697,527.25 433,213.97
1040 INFORMATION TECHNOLOGY PERSONNEL SERVICES 0200 0011 0111 1,019,303.53 245,722.99
1040 INFORMATION TECHNOLOGY PERSONNEL SERVICES 0200 0012 0125 37,312.17 24,507.97
1040 INFORMATION TECHNOLOGY PERSONNEL SERVICES 0200 0015 0133 0. 1,768.16
1040 INFORMATION TECHNOLOGY PERSONNEL SERVICES 0200 0014 0141 0. 130.18
1040 INFORMATION TECHNOLOGY PERSONNEL SERVICES 0200 0014 0142 0. 29,132.68
1040 INFORMATION TECHNOLOGY PERSONNEL SERVICES 0200 0014 0147 255,701. 0.
1040 INFORMATION TECHNOLOGY PERSONNEL SERVICES 0200 0014 0148 0. 16,156.96
1040 INFORMATION TECHNOLOGY PERSONNEL SERVICES 0200 0014 0154 0. 216.93
1040 INFORMATION TECHNOLOGY PERSONNEL SERVICES 0200 0014 0155 0. 745.08
1040 INFORMATION TECHNOLOGY PERSONNEL SERVICES 0200 0014 0157 0. 318.78
1040 INFORMATION TECHNOLOGY PERSONNEL SERVICES 0200 0014 0158 0. 3,778.63
1040 INFORMATION TECHNOLOGY PERSONNEL SERVICES 0200 0014 0159 0. 12,867.19
1040 INFORMATION TECHNOLOGY PERSONNEL SERVICES 0200 0014 0161 0. 1,573.08
Page 4
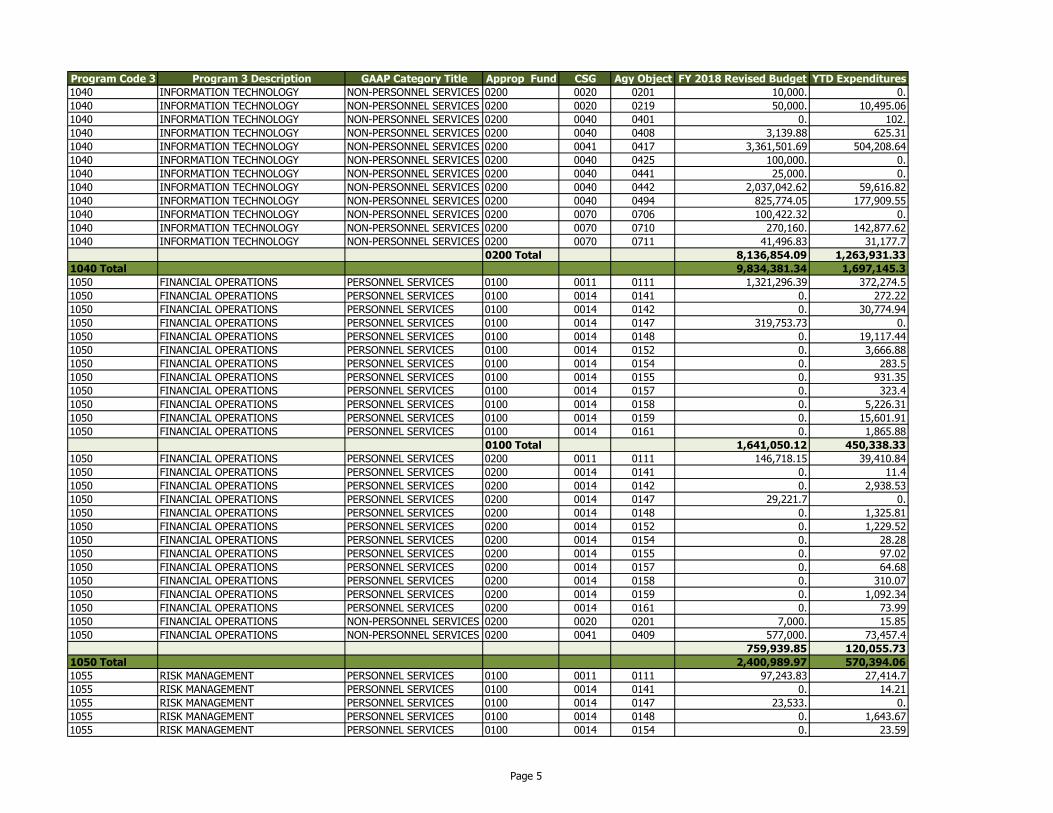
Program Code 3 Program 3 Description GAAP Category Title Approp Fund CSG Agy Object FY 2018 Revised Budget YTD Expenditures
1040 INFORMATION TECHNOLOGY NON-PERSONNEL SERVICES 0200 0020 0201 10,000. 0.
1040 INFORMATION TECHNOLOGY NON-PERSONNEL SERVICES 0200 0020 0219 50,000. 10,495.06
1040 INFORMATION TECHNOLOGY NON-PERSONNEL SERVICES 0200 0040 0401 0. 102.
1040 INFORMATION TECHNOLOGY NON-PERSONNEL SERVICES 0200 0040 0408 3,139.88 625.31
1040 INFORMATION TECHNOLOGY NON-PERSONNEL SERVICES 0200 0041 0417 3,361,501.69 504,208.64
1040 INFORMATION TECHNOLOGY NON-PERSONNEL SERVICES 0200 0040 0425 100,000. 0.
1040 INFORMATION TECHNOLOGY NON-PERSONNEL SERVICES 0200 0040 0441 25,000. 0.
1040 INFORMATION TECHNOLOGY NON-PERSONNEL SERVICES 0200 0040 0442 2,037,042.62 59,616.82
1040 INFORMATION TECHNOLOGY NON-PERSONNEL SERVICES 0200 0040 0494 825,774.05 177,909.55
1040 INFORMATION TECHNOLOGY NON-PERSONNEL SERVICES 0200 0070 0706 100,422.32 0.
1040 INFORMATION TECHNOLOGY NON-PERSONNEL SERVICES 0200 0070 0710 270,160. 142,877.62
1040 INFORMATION TECHNOLOGY NON-PERSONNEL SERVICES 0200 0070 0711 41,496.83 31,177.7
0200 Total 8,136,854.09 1,263,931.33
1040 Total 9,834,381.34 1,697,145.3
1050 FINANCIAL OPERATIONS PERSONNEL SERVICES 0100 0011 0111 1,321,296.39 372,274.5
1050 FINANCIAL OPERATIONS PERSONNEL SERVICES 0100 0014 0141 0. 272.22
1050 FINANCIAL OPERATIONS PERSONNEL SERVICES 0100 0014 0142 0. 30,774.94
1050 FINANCIAL OPERATIONS PERSONNEL SERVICES 0100 0014 0147 319,753.73 0.
1050 FINANCIAL OPERATIONS PERSONNEL SERVICES 0100 0014 0148 0. 19,117.44
1050 FINANCIAL OPERATIONS PERSONNEL SERVICES 0100 0014 0152 0. 3,666.88
1050 FINANCIAL OPERATIONS PERSONNEL SERVICES 0100 0014 0154 0. 283.5
1050 FINANCIAL OPERATIONS PERSONNEL SERVICES 0100 0014 0155 0. 931.35
1050 FINANCIAL OPERATIONS PERSONNEL SERVICES 0100 0014 0157 0. 323.4
1050 FINANCIAL OPERATIONS PERSONNEL SERVICES 0100 0014 0158 0. 5,226.31
1050 FINANCIAL OPERATIONS PERSONNEL SERVICES 0100 0014 0159 0. 15,601.91
1050 FINANCIAL OPERATIONS PERSONNEL SERVICES 0100 0014 0161 0. 1,865.88
0100 Total 1,641,050.12 450,338.33
1050 FINANCIAL OPERATIONS PERSONNEL SERVICES 0200 0011 0111 146,718.15 39,410.84
1050 FINANCIAL OPERATIONS PERSONNEL SERVICES 0200 0014 0141 0. 11.4
1050 FINANCIAL OPERATIONS PERSONNEL SERVICES 0200 0014 0142 0. 2,938.53
1050 FINANCIAL OPERATIONS PERSONNEL SERVICES 0200 0014 0147 29,221.7 0.
1050 FINANCIAL OPERATIONS PERSONNEL SERVICES 0200 0014 0148 0. 1,325.81
1050 FINANCIAL OPERATIONS PERSONNEL SERVICES 0200 0014 0152 0. 1,229.52
1050 FINANCIAL OPERATIONS PERSONNEL SERVICES 0200 0014 0154 0. 28.28
1050 FINANCIAL OPERATIONS PERSONNEL SERVICES 0200 0014 0155 0. 97.02
1050 FINANCIAL OPERATIONS PERSONNEL SERVICES 0200 0014 0157 0. 64.68
1050 FINANCIAL OPERATIONS PERSONNEL SERVICES 0200 0014 0158 0. 310.07
1050 FINANCIAL OPERATIONS PERSONNEL SERVICES 0200 0014 0159 0. 1,092.34
1050 FINANCIAL OPERATIONS PERSONNEL SERVICES 0200 0014 0161 0. 73.99
1050 FINANCIAL OPERATIONS NON-PERSONNEL SERVICES 0200 0020 0201 7,000. 15.85
1050 FINANCIAL OPERATIONS NON-PERSONNEL SERVICES 0200 0041 0409 577,000. 73,457.4
759,939.85 120,055.73
1050 Total 2,400,989.97 570,394.06
1055 RISK MANAGEMENT PERSONNEL SERVICES 0100 0011 0111 97,243.83 27,414.7
1055 RISK MANAGEMENT PERSONNEL SERVICES 0100 0014 0141 0. 14.21
1055 RISK MANAGEMENT PERSONNEL SERVICES 0100 0014 0147 23,533. 0.
1055 RISK MANAGEMENT PERSONNEL SERVICES 0100 0014 0148 0. 1,643.67
1055 RISK MANAGEMENT PERSONNEL SERVICES 0100 0014 0154 0. 23.59
Page 5
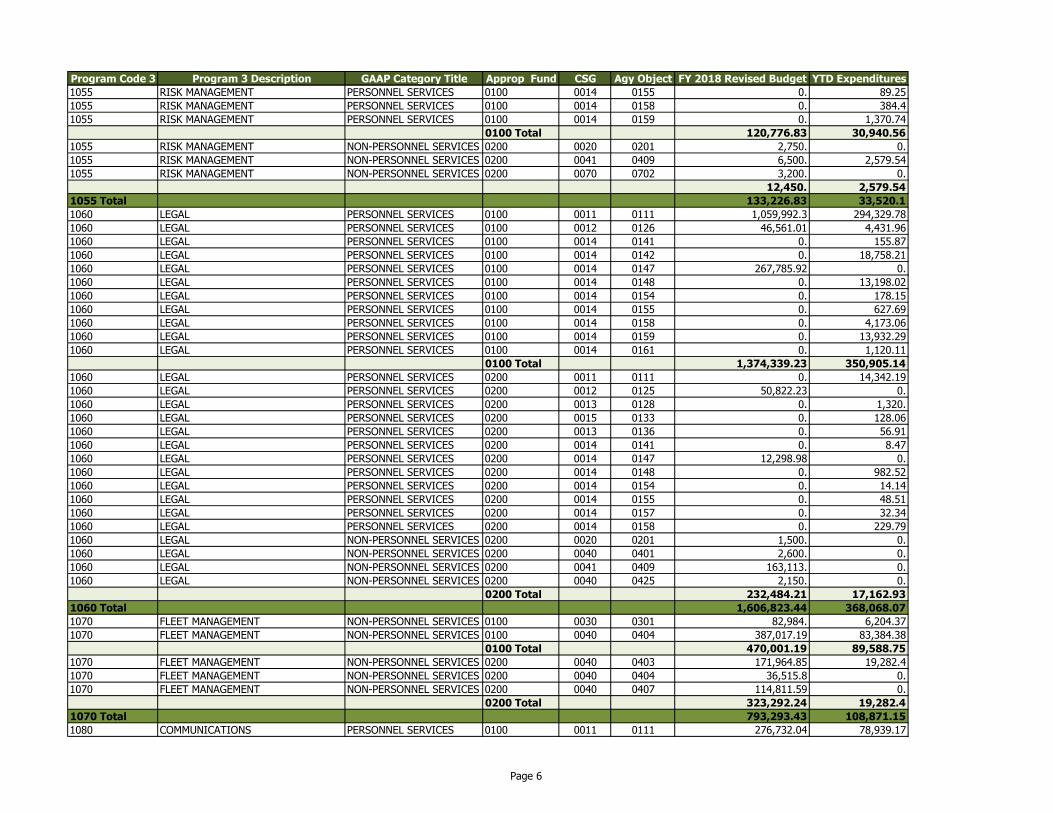
Program Code 3 Program 3 Description GAAP Category Title Approp Fund CSG Agy Object FY 2018 Revised Budget YTD Expenditures
1055 RISK MANAGEMENT PERSONNEL SERVICES 0100 0014 0155 0. 89.25
1055 RISK MANAGEMENT PERSONNEL SERVICES 0100 0014 0158 0. 384.4
1055 RISK MANAGEMENT PERSONNEL SERVICES 0100 0014 0159 0. 1,370.74
0100 Total 120,776.83 30,940.56
1055 RISK MANAGEMENT NON-PERSONNEL SERVICES 0200 0020 0201 2,750. 0.
1055 RISK MANAGEMENT NON-PERSONNEL SERVICES 0200 0041 0409 6,500. 2,579.54
1055 RISK MANAGEMENT NON-PERSONNEL SERVICES 0200 0070 0702 3,200. 0.
12,450. 2,579.54
1055 Total 133,226.83 33,520.1
1060 LEGAL PERSONNEL SERVICES 0100 0011 0111 1,059,992.3 294,329.78
1060 LEGAL PERSONNEL SERVICES 0100 0012 0126 46,561.01 4,431.96
1060 LEGAL PERSONNEL SERVICES 0100 0014 0141 0. 155.87
1060 LEGAL PERSONNEL SERVICES 0100 0014 0142 0. 18,758.21
1060 LEGAL PERSONNEL SERVICES 0100 0014 0147 267,785.92 0.
1060 LEGAL PERSONNEL SERVICES 0100 0014 0148 0. 13,198.02
1060 LEGAL PERSONNEL SERVICES 0100 0014 0154 0. 178.15
1060 LEGAL PERSONNEL SERVICES 0100 0014 0155 0. 627.69
1060 LEGAL PERSONNEL SERVICES 0100 0014 0158 0. 4,173.06
1060 LEGAL PERSONNEL SERVICES 0100 0014 0159 0. 13,932.29
1060 LEGAL PERSONNEL SERVICES 0100 0014 0161 0. 1,120.11
0100 Total 1,374,339.23 350,905.14
1060 LEGAL PERSONNEL SERVICES 0200 0011 0111 0. 14,342.19
1060 LEGAL PERSONNEL SERVICES 0200 0012 0125 50,822.23 0.
1060 LEGAL PERSONNEL SERVICES 0200 0013 0128 0. 1,320.
1060 LEGAL PERSONNEL SERVICES 0200 0015 0133 0. 128.06
1060 LEGAL PERSONNEL SERVICES 0200 0013 0136 0. 56.91
1060 LEGAL PERSONNEL SERVICES 0200 0014 0141 0. 8.47
1060 LEGAL PERSONNEL SERVICES 0200 0014 0147 12,298.98 0.
1060 LEGAL PERSONNEL SERVICES 0200 0014 0148 0. 982.52
1060 LEGAL PERSONNEL SERVICES 0200 0014 0154 0. 14.14
1060 LEGAL PERSONNEL SERVICES 0200 0014 0155 0. 48.51
1060 LEGAL PERSONNEL SERVICES 0200 0014 0157 0. 32.34
1060 LEGAL PERSONNEL SERVICES 0200 0014 0158 0. 229.79
1060 LEGAL NON-PERSONNEL SERVICES 0200 0020 0201 1,500. 0.
1060 LEGAL NON-PERSONNEL SERVICES 0200 0040 0401 2,600. 0.
1060 LEGAL NON-PERSONNEL SERVICES 0200 0041 0409 163,113. 0.
1060 LEGAL NON-PERSONNEL SERVICES 0200 0040 0425 2,150. 0.
0200 Total 232,484.21 17,162.93
1060 Total 1,606,823.44 368,068.07
1070 FLEET MANAGEMENT NON-PERSONNEL SERVICES 0100 0030 0301 82,984. 6,204.37
1070 FLEET MANAGEMENT NON-PERSONNEL SERVICES 0100 0040 0404 387,017.19 83,384.38
0100 Total 470,001.19 89,588.75
1070 FLEET MANAGEMENT NON-PERSONNEL SERVICES 0200 0040 0403 171,964.85 19,282.4
1070 FLEET MANAGEMENT NON-PERSONNEL SERVICES 0200 0040 0404 36,515.8 0.
1070 FLEET MANAGEMENT NON-PERSONNEL SERVICES 0200 0040 0407 114,811.59 0.
0200 Total 323,292.24 19,282.4
1070 Total 793,293.43 108,871.15
1080 COMMUNICATIONS PERSONNEL SERVICES 0100 0011 0111 276,732.04 78,939.17
Page 6
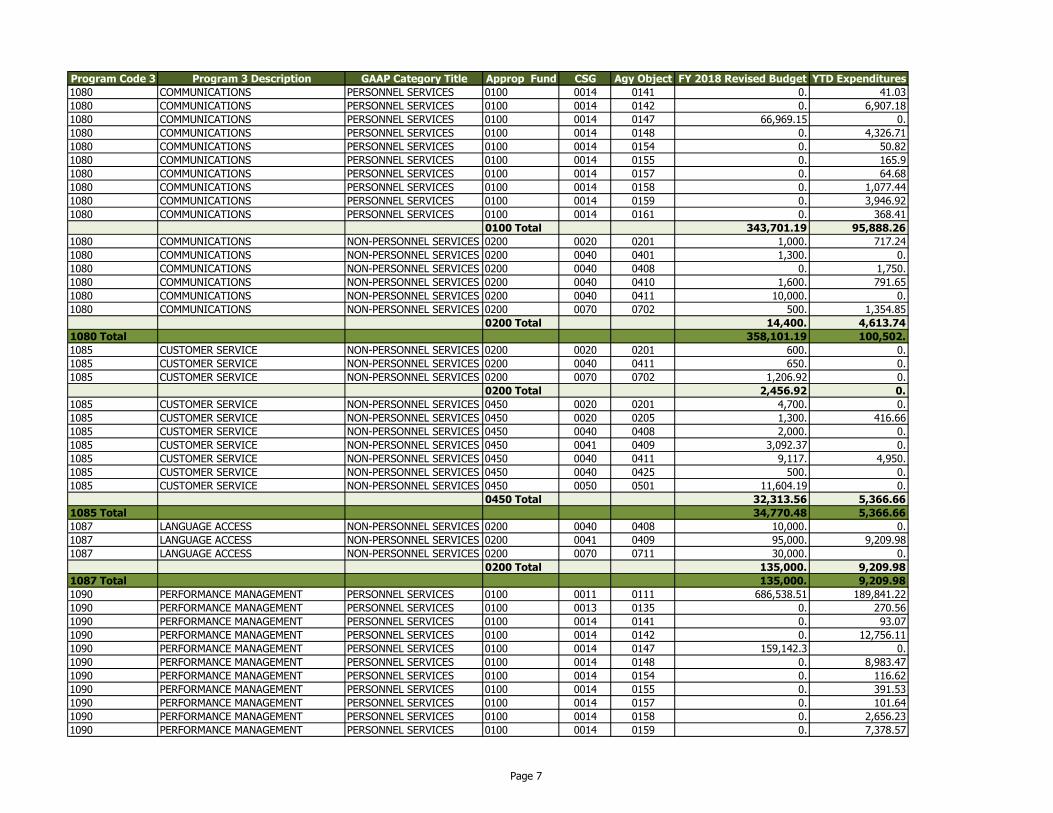
Program Code 3 Program 3 Description GAAP Category Title Approp Fund CSG Agy Object FY 2018 Revised Budget YTD Expenditures
1080 COMMUNICATIONS PERSONNEL SERVICES 0100 0014 0141 0. 41.03
1080 COMMUNICATIONS PERSONNEL SERVICES 0100 0014 0142 0. 6,907.18
1080 COMMUNICATIONS PERSONNEL SERVICES 0100 0014 0147 66,969.15 0.
1080 COMMUNICATIONS PERSONNEL SERVICES 0100 0014 0148 0. 4,326.71
1080 COMMUNICATIONS PERSONNEL SERVICES 0100 0014 0154 0. 50.82
1080 COMMUNICATIONS PERSONNEL SERVICES 0100 0014 0155 0. 165.9
1080 COMMUNICATIONS PERSONNEL SERVICES 0100 0014 0157 0. 64.68
1080 COMMUNICATIONS PERSONNEL SERVICES 0100 0014 0158 0. 1,077.44
1080 COMMUNICATIONS PERSONNEL SERVICES 0100 0014 0159 0. 3,946.92
1080 COMMUNICATIONS PERSONNEL SERVICES 0100 0014 0161 0. 368.41
0100 Total 343,701.19 95,888.26
1080 COMMUNICATIONS NON-PERSONNEL SERVICES 0200 0020 0201 1,000. 717.24
1080 COMMUNICATIONS NON-PERSONNEL SERVICES 0200 0040 0401 1,300. 0.
1080 COMMUNICATIONS NON-PERSONNEL SERVICES 0200 0040 0408 0. 1,750.
1080 COMMUNICATIONS NON-PERSONNEL SERVICES 0200 0040 0410 1,600. 791.65
1080 COMMUNICATIONS NON-PERSONNEL SERVICES 0200 0040 0411 10,000. 0.
1080 COMMUNICATIONS NON-PERSONNEL SERVICES 0200 0070 0702 500. 1,354.85
0200 Total 14,400. 4,613.74
1080 Total 358,101.19 100,502.
1085 CUSTOMER SERVICE NON-PERSONNEL SERVICES 0200 0020 0201 600. 0.
1085 CUSTOMER SERVICE NON-PERSONNEL SERVICES 0200 0040 0411 650. 0.
1085 CUSTOMER SERVICE NON-PERSONNEL SERVICES 0200 0070 0702 1,206.92 0.
0200 Total 2,456.92 0.
1085 CUSTOMER SERVICE NON-PERSONNEL SERVICES 0450 0020 0201 4,700. 0.
1085 CUSTOMER SERVICE NON-PERSONNEL SERVICES 0450 0020 0205 1,300. 416.66
1085 CUSTOMER SERVICE NON-PERSONNEL SERVICES 0450 0040 0408 2,000. 0.
1085 CUSTOMER SERVICE NON-PERSONNEL SERVICES 0450 0041 0409 3,092.37 0.
1085 CUSTOMER SERVICE NON-PERSONNEL SERVICES 0450 0040 0411 9,117. 4,950.
1085 CUSTOMER SERVICE NON-PERSONNEL SERVICES 0450 0040 0425 500. 0.
1085 CUSTOMER SERVICE NON-PERSONNEL SERVICES 0450 0050 0501 11,604.19 0.
0450 Total 32,313.56 5,366.66
1085 Total 34,770.48 5,366.66
1087 LANGUAGE ACCESS NON-PERSONNEL SERVICES 0200 0040 0408 10,000. 0.
1087 LANGUAGE ACCESS NON-PERSONNEL SERVICES 0200 0041 0409 95,000. 9,209.98
1087 LANGUAGE ACCESS NON-PERSONNEL SERVICES 0200 0070 0711 30,000. 0.
0200 Total 135,000. 9,209.98
1087 Total 135,000. 9,209.98
1090 PERFORMANCE MANAGEMENT PERSONNEL SERVICES 0100 0011 0111 686,538.51 189,841.22
1090 PERFORMANCE MANAGEMENT PERSONNEL SERVICES 0100 0013 0135 0. 270.56
1090 PERFORMANCE MANAGEMENT PERSONNEL SERVICES 0100 0014 0141 0. 93.07
1090 PERFORMANCE MANAGEMENT PERSONNEL SERVICES 0100 0014 0142 0. 12,756.11
1090 PERFORMANCE MANAGEMENT PERSONNEL SERVICES 0100 0014 0147 159,142.3 0.
1090 PERFORMANCE MANAGEMENT PERSONNEL SERVICES 0100 0014 0148 0. 8,983.47
1090 PERFORMANCE MANAGEMENT PERSONNEL SERVICES 0100 0014 0154 0. 116.62
1090 PERFORMANCE MANAGEMENT PERSONNEL SERVICES 0100 0014 0155 0. 391.53
1090 PERFORMANCE MANAGEMENT PERSONNEL SERVICES 0100 0014 0157 0. 101.64
1090 PERFORMANCE MANAGEMENT PERSONNEL SERVICES 0100 0014 0158 0. 2,656.23
1090 PERFORMANCE MANAGEMENT PERSONNEL SERVICES 0100 0014 0159 0. 7,378.57
Page 7
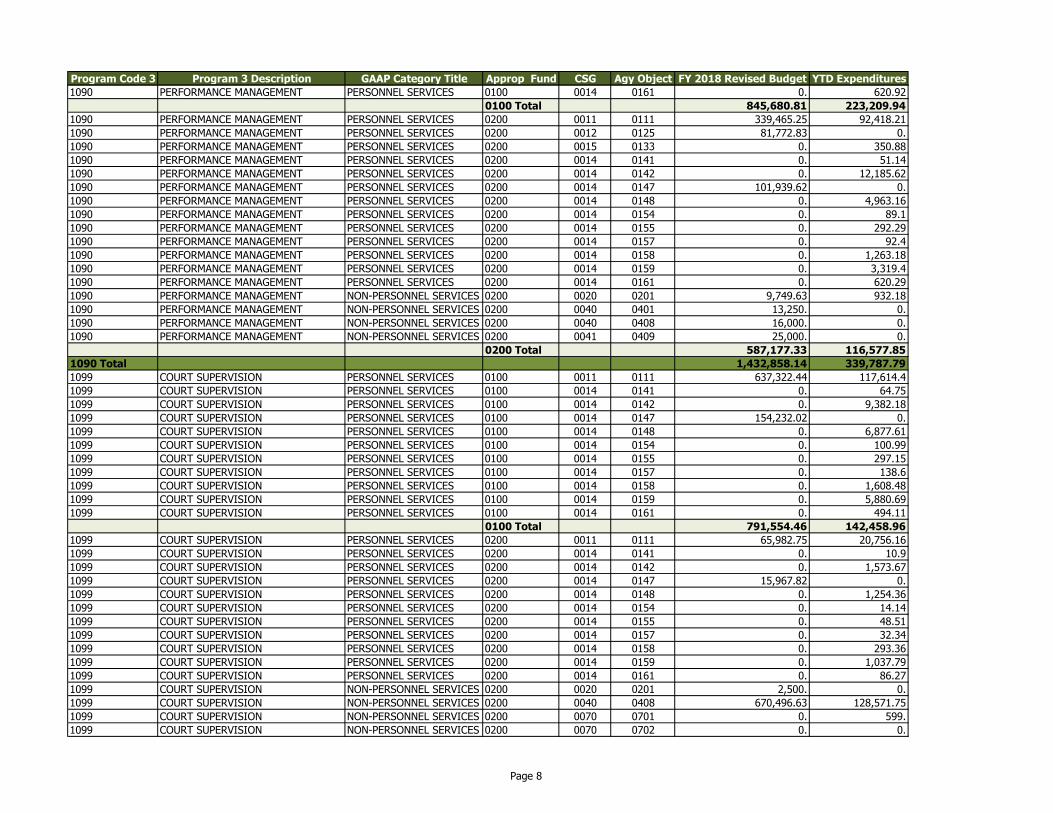
Program Code 3 Program 3 Description GAAP Category Title Approp Fund CSG Agy Object FY 2018 Revised Budget YTD Expenditures
1090 PERFORMANCE MANAGEMENT PERSONNEL SERVICES 0100 0014 0161 0. 620.92
0100 Total 845,680.81 223,209.94
1090 PERFORMANCE MANAGEMENT PERSONNEL SERVICES 0200 0011 0111 339,465.25 92,418.21
1090 PERFORMANCE MANAGEMENT PERSONNEL SERVICES 0200 0012 0125 81,772.83 0.
1090 PERFORMANCE MANAGEMENT PERSONNEL SERVICES 0200 0015 0133 0. 350.88
1090 PERFORMANCE MANAGEMENT PERSONNEL SERVICES 0200 0014 0141 0. 51.14
1090 PERFORMANCE MANAGEMENT PERSONNEL SERVICES 0200 0014 0142 0. 12,185.62
1090 PERFORMANCE MANAGEMENT PERSONNEL SERVICES 0200 0014 0147 101,939.62 0.
1090 PERFORMANCE MANAGEMENT PERSONNEL SERVICES 0200 0014 0148 0. 4,963.16
1090 PERFORMANCE MANAGEMENT PERSONNEL SERVICES 0200 0014 0154 0. 89.1
1090 PERFORMANCE MANAGEMENT PERSONNEL SERVICES 0200 0014 0155 0. 292.29
1090 PERFORMANCE MANAGEMENT PERSONNEL SERVICES 0200 0014 0157 0. 92.4
1090 PERFORMANCE MANAGEMENT PERSONNEL SERVICES 0200 0014 0158 0. 1,263.18
1090 PERFORMANCE MANAGEMENT PERSONNEL SERVICES 0200 0014 0159 0. 3,319.4
1090 PERFORMANCE MANAGEMENT PERSONNEL SERVICES 0200 0014 0161 0. 620.29
1090 PERFORMANCE MANAGEMENT NON-PERSONNEL SERVICES 0200 0020 0201 9,749.63 932.18
1090 PERFORMANCE MANAGEMENT NON-PERSONNEL SERVICES 0200 0040 0401 13,250. 0.
1090 PERFORMANCE MANAGEMENT NON-PERSONNEL SERVICES 0200 0040 0408 16,000. 0.
1090 PERFORMANCE MANAGEMENT NON-PERSONNEL SERVICES 0200 0041 0409 25,000. 0.
0200 Total 587,177.33 116,577.85
1090 Total 1,432,858.14 339,787.79
1099 COURT SUPERVISION PERSONNEL SERVICES 0100 0011 0111 637,322.44 117,614.4
1099 COURT SUPERVISION PERSONNEL SERVICES 0100 0014 0141 0. 64.75
1099 COURT SUPERVISION PERSONNEL SERVICES 0100 0014 0142 0. 9,382.18
1099 COURT SUPERVISION PERSONNEL SERVICES 0100 0014 0147 154,232.02 0.
1099 COURT SUPERVISION PERSONNEL SERVICES 0100 0014 0148 0. 6,877.61
1099 COURT SUPERVISION PERSONNEL SERVICES 0100 0014 0154 0. 100.99
1099 COURT SUPERVISION PERSONNEL SERVICES 0100 0014 0155 0. 297.15
1099 COURT SUPERVISION PERSONNEL SERVICES 0100 0014 0157 0. 138.6
1099 COURT SUPERVISION PERSONNEL SERVICES 0100 0014 0158 0. 1,608.48
1099 COURT SUPERVISION PERSONNEL SERVICES 0100 0014 0159 0. 5,880.69
1099 COURT SUPERVISION PERSONNEL SERVICES 0100 0014 0161 0. 494.11
0100 Total 791,554.46 142,458.96
1099 COURT SUPERVISION PERSONNEL SERVICES 0200 0011 0111 65,982.75 20,756.16
1099 COURT SUPERVISION PERSONNEL SERVICES 0200 0014 0141 0. 10.9
1099 COURT SUPERVISION PERSONNEL SERVICES 0200 0014 0142 0. 1,573.67
1099 COURT SUPERVISION PERSONNEL SERVICES 0200 0014 0147 15,967.82 0.
1099 COURT SUPERVISION PERSONNEL SERVICES 0200 0014 0148 0. 1,254.36
1099 COURT SUPERVISION PERSONNEL SERVICES 0200 0014 0154 0. 14.14
1099 COURT SUPERVISION PERSONNEL SERVICES 0200 0014 0155 0. 48.51
1099 COURT SUPERVISION PERSONNEL SERVICES 0200 0014 0157 0. 32.34
1099 COURT SUPERVISION PERSONNEL SERVICES 0200 0014 0158 0. 293.36
1099 COURT SUPERVISION PERSONNEL SERVICES 0200 0014 0159 0. 1,037.79
1099 COURT SUPERVISION PERSONNEL SERVICES 0200 0014 0161 0. 86.27
1099 COURT SUPERVISION NON-PERSONNEL SERVICES 0200 0020 0201 2,500. 0.
1099 COURT SUPERVISION NON-PERSONNEL SERVICES 0200 0040 0408 670,496.63 128,571.75
1099 COURT SUPERVISION NON-PERSONNEL SERVICES 0200 0070 0701 0. 599.
1099 COURT SUPERVISION NON-PERSONNEL SERVICES 0200 0070 0702 0. 0.
Page 8
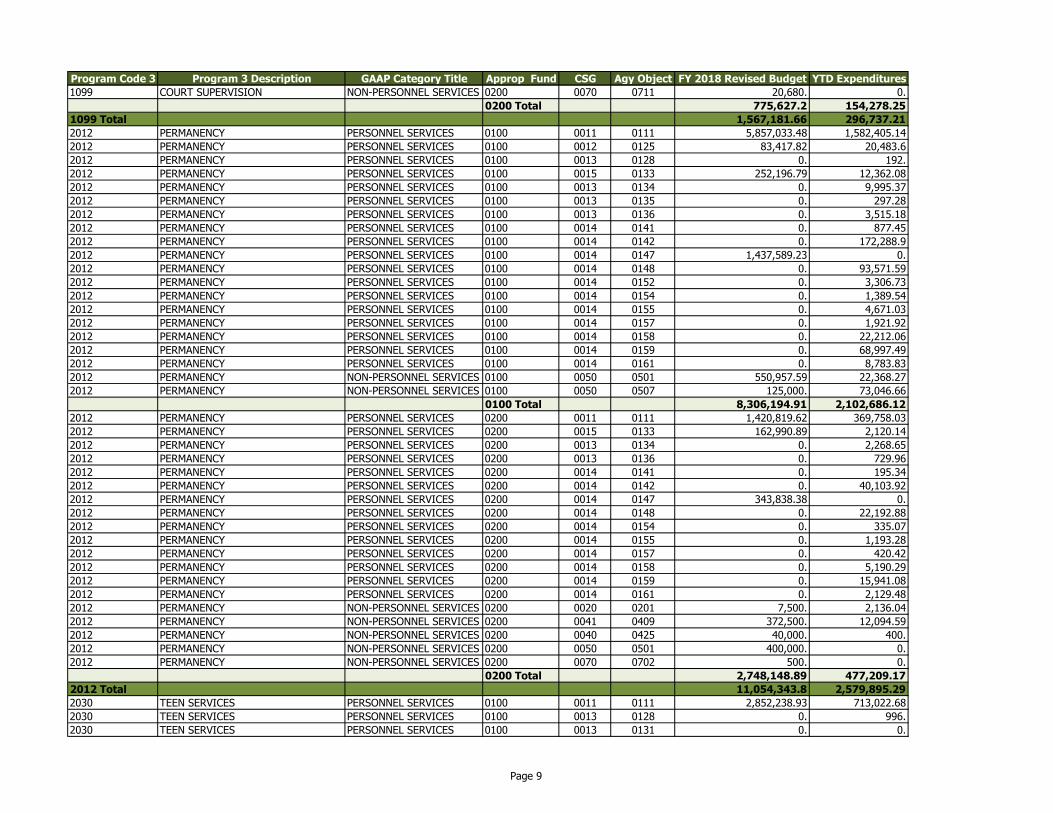
Program Code 3 Program 3 Description GAAP Category Title Approp Fund CSG Agy Object FY 2018 Revised Budget YTD Expenditures
1099 COURT SUPERVISION NON-PERSONNEL SERVICES 0200 0070 0711 20,680. 0.
0200 Total 775,627.2 154,278.25
1099 Total 1,567,181.66 296,737.21
2012 PERMANENCY PERSONNEL SERVICES 0100 0011 0111 5,857,033.48 1,582,405.14
2012 PERMANENCY PERSONNEL SERVICES 0100 0012 0125 83,417.82 20,483.6
2012 PERMANENCY PERSONNEL SERVICES 0100 0013 0128 0. 192.
2012 PERMANENCY PERSONNEL SERVICES 0100 0015 0133 252,196.79 12,362.08
2012 PERMANENCY PERSONNEL SERVICES 0100 0013 0134 0. 9,995.37
2012 PERMANENCY PERSONNEL SERVICES 0100 0013 0135 0. 297.28
2012 PERMANENCY PERSONNEL SERVICES 0100 0013 0136 0. 3,515.18
2012 PERMANENCY PERSONNEL SERVICES 0100 0014 0141 0. 877.45
2012 PERMANENCY PERSONNEL SERVICES 0100 0014 0142 0. 172,288.9
2012 PERMANENCY PERSONNEL SERVICES 0100 0014 0147 1,437,589.23 0.
2012 PERMANENCY PERSONNEL SERVICES 0100 0014 0148 0. 93,571.59
2012 PERMANENCY PERSONNEL SERVICES 0100 0014 0152 0. 3,306.73
2012 PERMANENCY PERSONNEL SERVICES 0100 0014 0154 0. 1,389.54
2012 PERMANENCY PERSONNEL SERVICES 0100 0014 0155 0. 4,671.03
2012 PERMANENCY PERSONNEL SERVICES 0100 0014 0157 0. 1,921.92
2012 PERMANENCY PERSONNEL SERVICES 0100 0014 0158 0. 22,212.06
2012 PERMANENCY PERSONNEL SERVICES 0100 0014 0159 0. 68,997.49
2012 PERMANENCY PERSONNEL SERVICES 0100 0014 0161 0. 8,783.83
2012 PERMANENCY NON-PERSONNEL SERVICES 0100 0050 0501 550,957.59 22,368.27
2012 PERMANENCY NON-PERSONNEL SERVICES 0100 0050 0507 125,000. 73,046.66
0100 Total 8,306,194.91 2,102,686.12
2012 PERMANENCY PERSONNEL SERVICES 0200 0011 0111 1,420,819.62 369,758.03
2012 PERMANENCY PERSONNEL SERVICES 0200 0015 0133 162,990.89 2,120.14
2012 PERMANENCY PERSONNEL SERVICES 0200 0013 0134 0. 2,268.65
2012 PERMANENCY PERSONNEL SERVICES 0200 0013 0136 0. 729.96
2012 PERMANENCY PERSONNEL SERVICES 0200 0014 0141 0. 195.34
2012 PERMANENCY PERSONNEL SERVICES 0200 0014 0142 0. 40,103.92
2012 PERMANENCY PERSONNEL SERVICES 0200 0014 0147 343,838.38 0.
2012 PERMANENCY PERSONNEL SERVICES 0200 0014 0148 0. 22,192.88
2012 PERMANENCY PERSONNEL SERVICES 0200 0014 0154 0. 335.07
2012 PERMANENCY PERSONNEL SERVICES 0200 0014 0155 0. 1,193.28
2012 PERMANENCY PERSONNEL SERVICES 0200 0014 0157 0. 420.42
2012 PERMANENCY PERSONNEL SERVICES 0200 0014 0158 0. 5,190.29
2012 PERMANENCY PERSONNEL SERVICES 0200 0014 0159 0. 15,941.08
2012 PERMANENCY PERSONNEL SERVICES 0200 0014 0161 0. 2,129.48
2012 PERMANENCY NON-PERSONNEL SERVICES 0200 0020 0201 7,500. 2,136.04
2012 PERMANENCY NON-PERSONNEL SERVICES 0200 0041 0409 372,500. 12,094.59
2012 PERMANENCY NON-PERSONNEL SERVICES 0200 0040 0425 40,000. 400.
2012 PERMANENCY NON-PERSONNEL SERVICES 0200 0050 0501 400,000. 0.
2012 PERMANENCY NON-PERSONNEL SERVICES 0200 0070 0702 500. 0.
0200 Total 2,748,148.89 477,209.17
2012 Total 11,054,343.8 2,579,895.29
2030 TEEN SERVICES PERSONNEL SERVICES 0100 0011 0111 2,852,238.93 713,022.68
2030 TEEN SERVICES PERSONNEL SERVICES 0100 0013 0128 0. 996.
2030 TEEN SERVICES PERSONNEL SERVICES 0100 0013 0131 0. 0.
Page 9
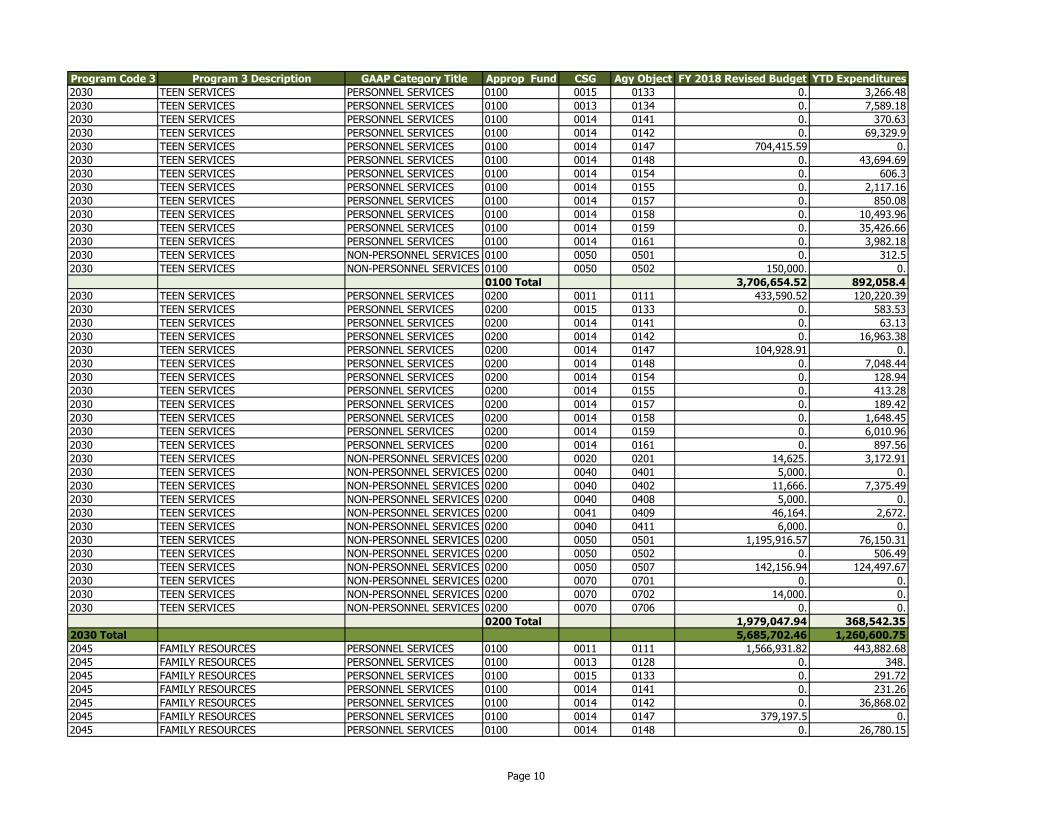
Program Code 3 Program 3 Description GAAP Category Title Approp Fund CSG Agy Object FY 2018 Revised Budget YTD Expenditures
2030 TEEN SERVICES PERSONNEL SERVICES 0100 0015 0133 0. 3,266.48
2030 TEEN SERVICES PERSONNEL SERVICES 0100 0013 0134 0. 7,589.18
2030 TEEN SERVICES PERSONNEL SERVICES 0100 0014 0141 0. 370.63
2030 TEEN SERVICES PERSONNEL SERVICES 0100 0014 0142 0. 69,329.9
2030 TEEN SERVICES PERSONNEL SERVICES 0100 0014 0147 704,415.59 0.
2030 TEEN SERVICES PERSONNEL SERVICES 0100 0014 0148 0. 43,694.69
2030 TEEN SERVICES PERSONNEL SERVICES 0100 0014 0154 0. 606.3
2030 TEEN SERVICES PERSONNEL SERVICES 0100 0014 0155 0. 2,117.16
2030 TEEN SERVICES PERSONNEL SERVICES 0100 0014 0157 0. 850.08
2030 TEEN SERVICES PERSONNEL SERVICES 0100 0014 0158 0. 10,493.96
2030 TEEN SERVICES PERSONNEL SERVICES 0100 0014 0159 0. 35,426.66
2030 TEEN SERVICES PERSONNEL SERVICES 0100 0014 0161 0. 3,982.18
2030 TEEN SERVICES NON-PERSONNEL SERVICES 0100 0050 0501 0. 312.5
2030 TEEN SERVICES NON-PERSONNEL SERVICES 0100 0050 0502 150,000. 0.
0100 Total 3,706,654.52 892,058.4
2030 TEEN SERVICES PERSONNEL SERVICES 0200 0011 0111 433,590.52 120,220.39
2030 TEEN SERVICES PERSONNEL SERVICES 0200 0015 0133 0. 583.53
2030 TEEN SERVICES PERSONNEL SERVICES 0200 0014 0141 0. 63.13
2030 TEEN SERVICES PERSONNEL SERVICES 0200 0014 0142 0. 16,963.38
2030 TEEN SERVICES PERSONNEL SERVICES 0200 0014 0147 104,928.91 0.
2030 TEEN SERVICES PERSONNEL SERVICES 0200 0014 0148 0. 7,048.44
2030 TEEN SERVICES PERSONNEL SERVICES 0200 0014 0154 0. 128.94
2030 TEEN SERVICES PERSONNEL SERVICES 0200 0014 0155 0. 413.28
2030 TEEN SERVICES PERSONNEL SERVICES 0200 0014 0157 0. 189.42
2030 TEEN SERVICES PERSONNEL SERVICES 0200 0014 0158 0. 1,648.45
2030 TEEN SERVICES PERSONNEL SERVICES 0200 0014 0159 0. 6,010.96
2030 TEEN SERVICES PERSONNEL SERVICES 0200 0014 0161 0. 897.56
2030 TEEN SERVICES NON-PERSONNEL SERVICES 0200 0020 0201 14,625. 3,172.91
2030 TEEN SERVICES NON-PERSONNEL SERVICES 0200 0040 0401 5,000. 0.
2030 TEEN SERVICES NON-PERSONNEL SERVICES 0200 0040 0402 11,666. 7,375.49
2030 TEEN SERVICES NON-PERSONNEL SERVICES 0200 0040 0408 5,000. 0.
2030 TEEN SERVICES NON-PERSONNEL SERVICES 0200 0041 0409 46,164. 2,672.
2030 TEEN SERVICES NON-PERSONNEL SERVICES 0200 0040 0411 6,000. 0.
2030 TEEN SERVICES NON-PERSONNEL SERVICES 0200 0050 0501 1,195,916.57 76,150.31
2030 TEEN SERVICES NON-PERSONNEL SERVICES 0200 0050 0502 0. 506.49
2030 TEEN SERVICES NON-PERSONNEL SERVICES 0200 0050 0507 142,156.94 124,497.67
2030 TEEN SERVICES NON-PERSONNEL SERVICES 0200 0070 0701 0. 0.
2030 TEEN SERVICES NON-PERSONNEL SERVICES 0200 0070 0702 14,000. 0.
2030 TEEN SERVICES NON-PERSONNEL SERVICES 0200 0070 0706 0. 0.
0200 Total 1,979,047.94 368,542.35
2030 Total 5,685,702.46 1,260,600.75
2045 FAMILY RESOURCES PERSONNEL SERVICES 0100 0011 0111 1,566,931.82 443,882.68
2045 FAMILY RESOURCES PERSONNEL SERVICES 0100 0013 0128 0. 348.
2045 FAMILY RESOURCES PERSONNEL SERVICES 0100 0015 0133 0. 291.72
2045 FAMILY RESOURCES PERSONNEL SERVICES 0100 0014 0141 0. 231.26
2045 FAMILY RESOURCES PERSONNEL SERVICES 0100 0014 0142 0. 36,868.02
2045 FAMILY RESOURCES PERSONNEL SERVICES 0100 0014 0147 379,197.5 0.
2045 FAMILY RESOURCES PERSONNEL SERVICES 0100 0014 0148 0. 26,780.15
Page 10
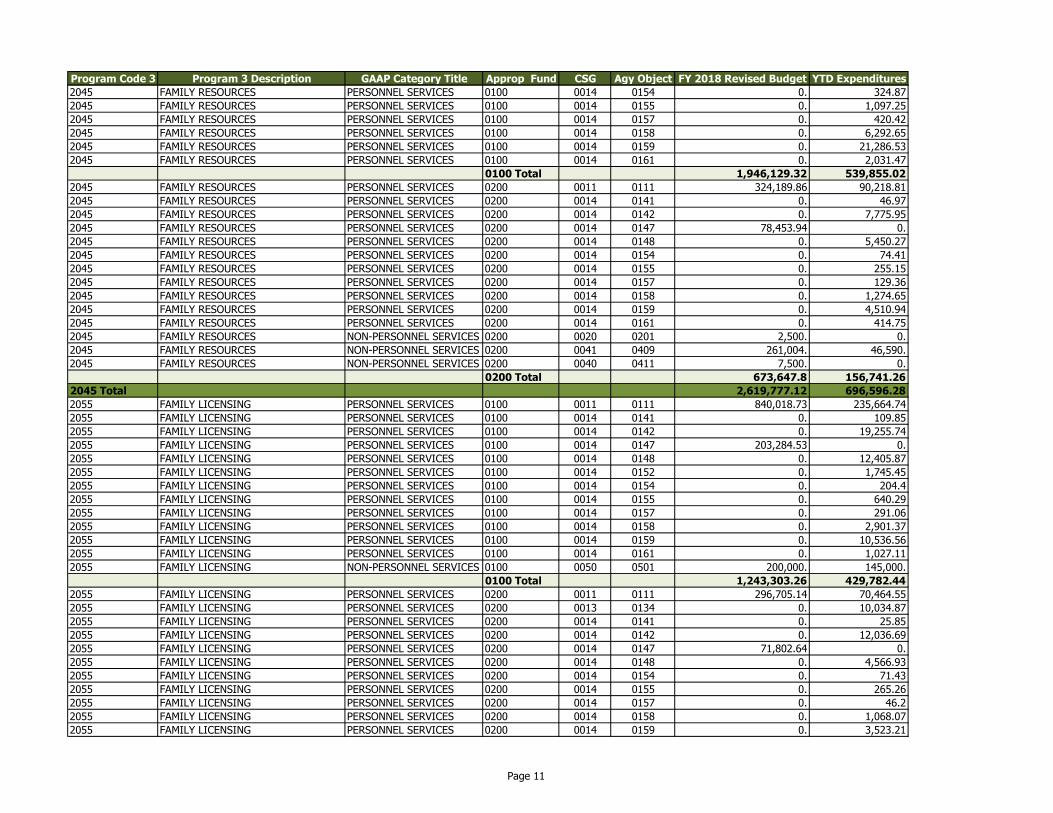
Program Code 3 Program 3 Description GAAP Category Title Approp Fund CSG Agy Object FY 2018 Revised Budget YTD Expenditures
2045 FAMILY RESOURCES PERSONNEL SERVICES 0100 0014 0154 0. 324.87
2045 FAMILY RESOURCES PERSONNEL SERVICES 0100 0014 0155 0. 1,097.25
2045 FAMILY RESOURCES PERSONNEL SERVICES 0100 0014 0157 0. 420.42
2045 FAMILY RESOURCES PERSONNEL SERVICES 0100 0014 0158 0. 6,292.65
2045 FAMILY RESOURCES PERSONNEL SERVICES 0100 0014 0159 0. 21,286.53
2045 FAMILY RESOURCES PERSONNEL SERVICES 0100 0014 0161 0. 2,031.47
0100 Total 1,946,129.32 539,855.02
2045 FAMILY RESOURCES PERSONNEL SERVICES 0200 0011 0111 324,189.86 90,218.81
2045 FAMILY RESOURCES PERSONNEL SERVICES 0200 0014 0141 0. 46.97
2045 FAMILY RESOURCES PERSONNEL SERVICES 0200 0014 0142 0. 7,775.95
2045 FAMILY RESOURCES PERSONNEL SERVICES 0200 0014 0147 78,453.94 0.
2045 FAMILY RESOURCES PERSONNEL SERVICES 0200 0014 0148 0. 5,450.27
2045 FAMILY RESOURCES PERSONNEL SERVICES 0200 0014 0154 0. 74.41
2045 FAMILY RESOURCES PERSONNEL SERVICES 0200 0014 0155 0. 255.15
2045 FAMILY RESOURCES PERSONNEL SERVICES 0200 0014 0157 0. 129.36
2045 FAMILY RESOURCES PERSONNEL SERVICES 0200 0014 0158 0. 1,274.65
2045 FAMILY RESOURCES PERSONNEL SERVICES 0200 0014 0159 0. 4,510.94
2045 FAMILY RESOURCES PERSONNEL SERVICES 0200 0014 0161 0. 414.75
2045 FAMILY RESOURCES NON-PERSONNEL SERVICES 0200 0020 0201 2,500. 0.
2045 FAMILY RESOURCES NON-PERSONNEL SERVICES 0200 0041 0409 261,004. 46,590.
2045 FAMILY RESOURCES NON-PERSONNEL SERVICES 0200 0040 0411 7,500. 0.
0200 Total 673,647.8 156,741.26
2045 Total 2,619,777.12 696,596.28
2055 FAMILY LICENSING PERSONNEL SERVICES 0100 0011 0111 840,018.73 235,664.74
2055 FAMILY LICENSING PERSONNEL SERVICES 0100 0014 0141 0. 109.85
2055 FAMILY LICENSING PERSONNEL SERVICES 0100 0014 0142 0. 19,255.74
2055 FAMILY LICENSING PERSONNEL SERVICES 0100 0014 0147 203,284.53 0.
2055 FAMILY LICENSING PERSONNEL SERVICES 0100 0014 0148 0. 12,405.87
2055 FAMILY LICENSING PERSONNEL SERVICES 0100 0014 0152 0. 1,745.45
2055 FAMILY LICENSING PERSONNEL SERVICES 0100 0014 0154 0. 204.4
2055 FAMILY LICENSING PERSONNEL SERVICES 0100 0014 0155 0. 640.29
2055 FAMILY LICENSING PERSONNEL SERVICES 0100 0014 0157 0. 291.06
2055 FAMILY LICENSING PERSONNEL SERVICES 0100 0014 0158 0. 2,901.37
2055 FAMILY LICENSING PERSONNEL SERVICES 0100 0014 0159 0. 10,536.56
2055 FAMILY LICENSING PERSONNEL SERVICES 0100 0014 0161 0. 1,027.11
2055 FAMILY LICENSING NON-PERSONNEL SERVICES 0100 0050 0501 200,000. 145,000.
0100 Total 1,243,303.26 429,782.44
2055 FAMILY LICENSING PERSONNEL SERVICES 0200 0011 0111 296,705.14 70,464.55
2055 FAMILY LICENSING PERSONNEL SERVICES 0200 0013 0134 0. 10,034.87
2055 FAMILY LICENSING PERSONNEL SERVICES 0200 0014 0141 0. 25.85
2055 FAMILY LICENSING PERSONNEL SERVICES 0200 0014 0142 0. 12,036.69
2055 FAMILY LICENSING PERSONNEL SERVICES 0200 0014 0147 71,802.64 0.
2055 FAMILY LICENSING PERSONNEL SERVICES 0200 0014 0148 0. 4,566.93
2055 FAMILY LICENSING PERSONNEL SERVICES 0200 0014 0154 0. 71.43
2055 FAMILY LICENSING PERSONNEL SERVICES 0200 0014 0155 0. 265.26
2055 FAMILY LICENSING PERSONNEL SERVICES 0200 0014 0157 0. 46.2
2055 FAMILY LICENSING PERSONNEL SERVICES 0200 0014 0158 0. 1,068.07
2055 FAMILY LICENSING PERSONNEL SERVICES 0200 0014 0159 0. 3,523.21
Page 11
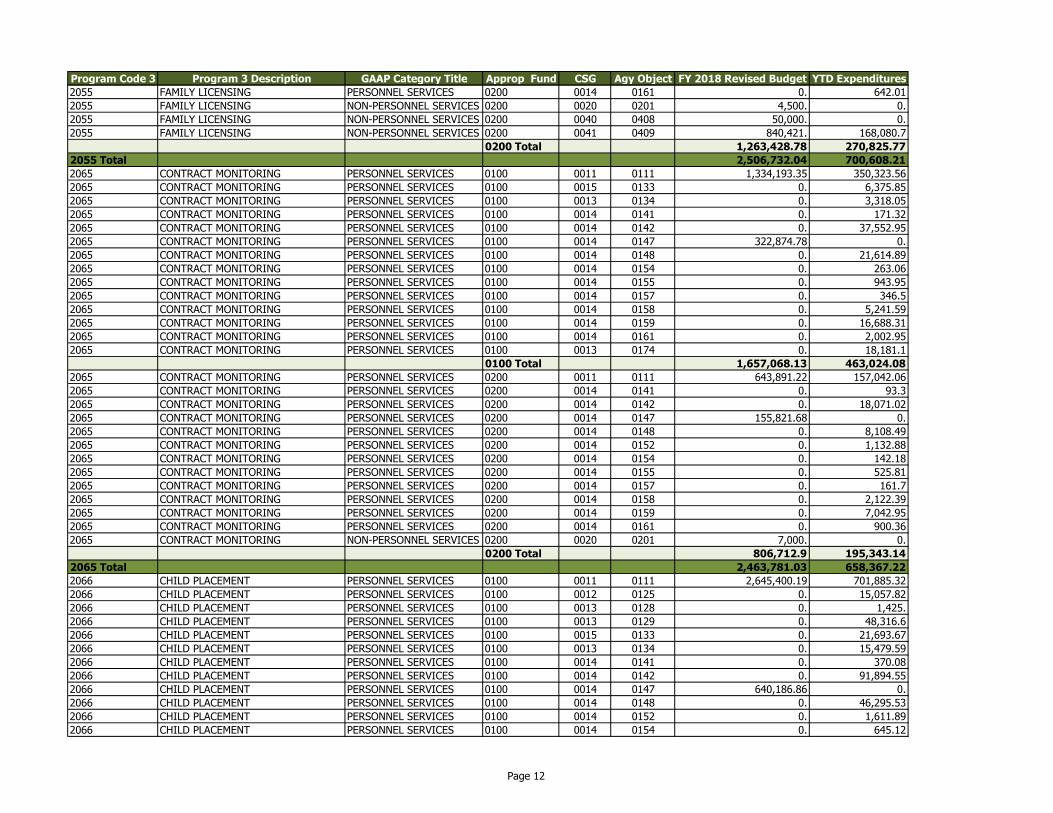
Program Code 3 Program 3 Description GAAP Category Title Approp Fund CSG Agy Object FY 2018 Revised Budget YTD Expenditures
2055 FAMILY LICENSING PERSONNEL SERVICES 0200 0014 0161 0. 642.01
2055 FAMILY LICENSING NON-PERSONNEL SERVICES 0200 0020 0201 4,500. 0.
2055 FAMILY LICENSING NON-PERSONNEL SERVICES 0200 0040 0408 50,000. 0.
2055 FAMILY LICENSING NON-PERSONNEL SERVICES 0200 0041 0409 840,421. 168,080.7
0200 Total 1,263,428.78 270,825.77
2055 Total 2,506,732.04 700,608.21
2065 CONTRACT MONITORING PERSONNEL SERVICES 0100 0011 0111 1,334,193.35 350,323.56
2065 CONTRACT MONITORING PERSONNEL SERVICES 0100 0015 0133 0. 6,375.85
2065 CONTRACT MONITORING PERSONNEL SERVICES 0100 0013 0134 0. 3,318.05
2065 CONTRACT MONITORING PERSONNEL SERVICES 0100 0014 0141 0. 171.32
2065 CONTRACT MONITORING PERSONNEL SERVICES 0100 0014 0142 0. 37,552.95
2065 CONTRACT MONITORING PERSONNEL SERVICES 0100 0014 0147 322,874.78 0.
2065 CONTRACT MONITORING PERSONNEL SERVICES 0100 0014 0148 0. 21,614.89
2065 CONTRACT MONITORING PERSONNEL SERVICES 0100 0014 0154 0. 263.06
2065 CONTRACT MONITORING PERSONNEL SERVICES 0100 0014 0155 0. 943.95
2065 CONTRACT MONITORING PERSONNEL SERVICES 0100 0014 0157 0. 346.5
2065 CONTRACT MONITORING PERSONNEL SERVICES 0100 0014 0158 0. 5,241.59
2065 CONTRACT MONITORING PERSONNEL SERVICES 0100 0014 0159 0. 16,688.31
2065 CONTRACT MONITORING PERSONNEL SERVICES 0100 0014 0161 0. 2,002.95
2065 CONTRACT MONITORING PERSONNEL SERVICES 0100 0013 0174 0. 18,181.1
0100 Total 1,657,068.13 463,024.08
2065 CONTRACT MONITORING PERSONNEL SERVICES 0200 0011 0111 643,891.22 157,042.06
2065 CONTRACT MONITORING PERSONNEL SERVICES 0200 0014 0141 0. 93.3
2065 CONTRACT MONITORING PERSONNEL SERVICES 0200 0014 0142 0. 18,071.02
2065 CONTRACT MONITORING PERSONNEL SERVICES 0200 0014 0147 155,821.68 0.
2065 CONTRACT MONITORING PERSONNEL SERVICES 0200 0014 0148 0. 8,108.49
2065 CONTRACT MONITORING PERSONNEL SERVICES 0200 0014 0152 0. 1,132.88
2065 CONTRACT MONITORING PERSONNEL SERVICES 0200 0014 0154 0. 142.18
2065 CONTRACT MONITORING PERSONNEL SERVICES 0200 0014 0155 0. 525.81
2065 CONTRACT MONITORING PERSONNEL SERVICES 0200 0014 0157 0. 161.7
2065 CONTRACT MONITORING PERSONNEL SERVICES 0200 0014 0158 0. 2,122.39
2065 CONTRACT MONITORING PERSONNEL SERVICES 0200 0014 0159 0. 7,042.95
2065 CONTRACT MONITORING PERSONNEL SERVICES 0200 0014 0161 0. 900.36
2065 CONTRACT MONITORING NON-PERSONNEL SERVICES 0200 0020 0201 7,000. 0.
0200 Total 806,712.9 195,343.14
2065 Total 2,463,781.03 658,367.22
2066 CHILD PLACEMENT PERSONNEL SERVICES 0100 0011 0111 2,645,400.19 701,885.32
2066 CHILD PLACEMENT PERSONNEL SERVICES 0100 0012 0125 0. 15,057.82
2066 CHILD PLACEMENT PERSONNEL SERVICES 0100 0013 0128 0. 1,425.
2066 CHILD PLACEMENT PERSONNEL SERVICES 0100 0013 0129 0. 48,316.6
2066 CHILD PLACEMENT PERSONNEL SERVICES 0100 0015 0133 0. 21,693.67
2066 CHILD PLACEMENT PERSONNEL SERVICES 0100 0013 0134 0. 15,479.59
2066 CHILD PLACEMENT PERSONNEL SERVICES 0100 0014 0141 0. 370.08
2066 CHILD PLACEMENT PERSONNEL SERVICES 0100 0014 0142 0. 91,894.55
2066 CHILD PLACEMENT PERSONNEL SERVICES 0100 0014 0147 640,186.86 0.
2066 CHILD PLACEMENT PERSONNEL SERVICES 0100 0014 0148 0. 46,295.53
2066 CHILD PLACEMENT PERSONNEL SERVICES 0100 0014 0152 0. 1,611.89
2066 CHILD PLACEMENT PERSONNEL SERVICES 0100 0014 0154 0. 645.12
Page 12
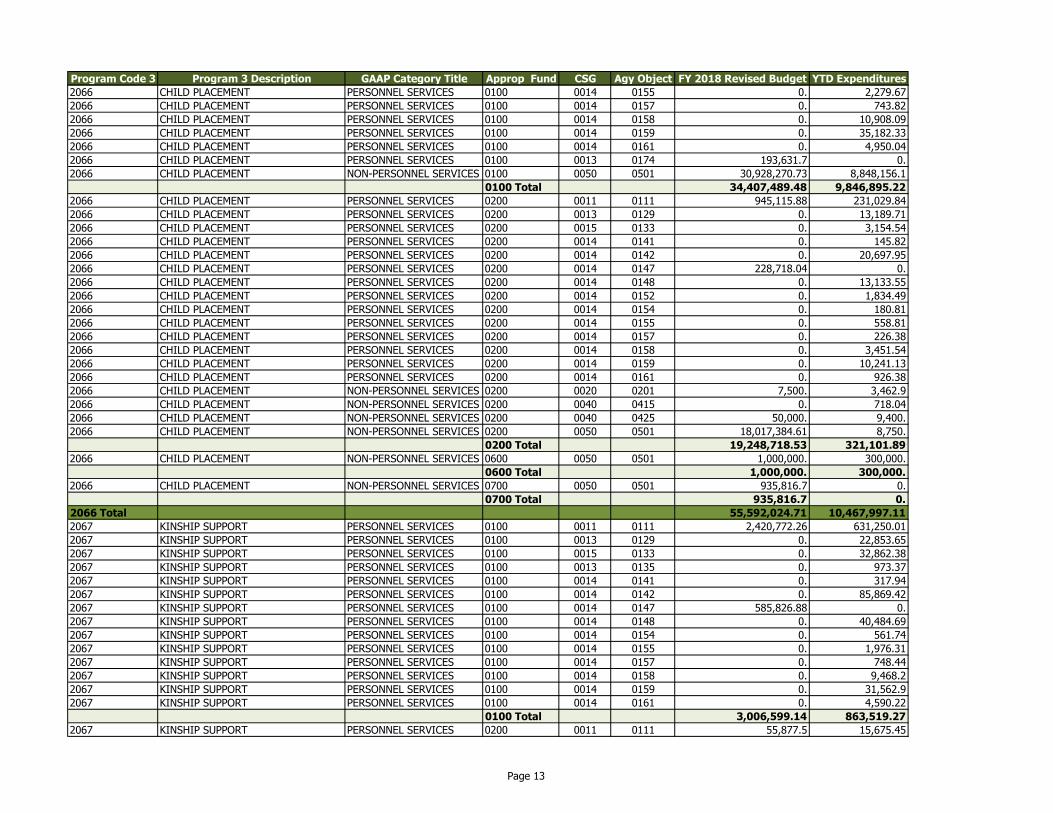
Program Code 3 Program 3 Description GAAP Category Title Approp Fund CSG Agy Object FY 2018 Revised Budget YTD Expenditures
2066 CHILD PLACEMENT PERSONNEL SERVICES 0100 0014 0155 0. 2,279.67
2066 CHILD PLACEMENT PERSONNEL SERVICES 0100 0014 0157 0. 743.82
2066 CHILD PLACEMENT PERSONNEL SERVICES 0100 0014 0158 0. 10,908.09
2066 CHILD PLACEMENT PERSONNEL SERVICES 0100 0014 0159 0. 35,182.33
2066 CHILD PLACEMENT PERSONNEL SERVICES 0100 0014 0161 0. 4,950.04
2066 CHILD PLACEMENT PERSONNEL SERVICES 0100 0013 0174 193,631.7 0.
2066 CHILD PLACEMENT NON-PERSONNEL SERVICES 0100 0050 0501 30,928,270.73 8,848,156.1
0100 Total 34,407,489.48 9,846,895.22
2066 CHILD PLACEMENT PERSONNEL SERVICES 0200 0011 0111 945,115.88 231,029.84
2066 CHILD PLACEMENT PERSONNEL SERVICES 0200 0013 0129 0. 13,189.71
2066 CHILD PLACEMENT PERSONNEL SERVICES 0200 0015 0133 0. 3,154.54
2066 CHILD PLACEMENT PERSONNEL SERVICES 0200 0014 0141 0. 145.82
2066 CHILD PLACEMENT PERSONNEL SERVICES 0200 0014 0142 0. 20,697.95
2066 CHILD PLACEMENT PERSONNEL SERVICES 0200 0014 0147 228,718.04 0.
2066 CHILD PLACEMENT PERSONNEL SERVICES 0200 0014 0148 0. 13,133.55
2066 CHILD PLACEMENT PERSONNEL SERVICES 0200 0014 0152 0. 1,834.49
2066 CHILD PLACEMENT PERSONNEL SERVICES 0200 0014 0154 0. 180.81
2066 CHILD PLACEMENT PERSONNEL SERVICES 0200 0014 0155 0. 558.81
2066 CHILD PLACEMENT PERSONNEL SERVICES 0200 0014 0157 0. 226.38
2066 CHILD PLACEMENT PERSONNEL SERVICES 0200 0014 0158 0. 3,451.54
2066 CHILD PLACEMENT PERSONNEL SERVICES 0200 0014 0159 0. 10,241.13
2066 CHILD PLACEMENT PERSONNEL SERVICES 0200 0014 0161 0. 926.38
2066 CHILD PLACEMENT NON-PERSONNEL SERVICES 0200 0020 0201 7,500. 3,462.9
2066 CHILD PLACEMENT NON-PERSONNEL SERVICES 0200 0040 0415 0. 718.04
2066 CHILD PLACEMENT NON-PERSONNEL SERVICES 0200 0040 0425 50,000. 9,400.
2066 CHILD PLACEMENT NON-PERSONNEL SERVICES 0200 0050 0501 18,017,384.61 8,750.
0200 Total 19,248,718.53 321,101.89
2066 CHILD PLACEMENT NON-PERSONNEL SERVICES 0600 0050 0501 1,000,000. 300,000.
0600 Total 1,000,000. 300,000.
2066 CHILD PLACEMENT NON-PERSONNEL SERVICES 0700 0050 0501 935,816.7 0.
0700 Total 935,816.7 0.
2066 Total 55,592,024.71 10,467,997.11
2067 KINSHIP SUPPORT PERSONNEL SERVICES 0100 0011 0111 2,420,772.26 631,250.01
2067 KINSHIP SUPPORT PERSONNEL SERVICES 0100 0013 0129 0. 22,853.65
2067 KINSHIP SUPPORT PERSONNEL SERVICES 0100 0015 0133 0. 32,862.38
2067 KINSHIP SUPPORT PERSONNEL SERVICES 0100 0013 0135 0. 973.37
2067 KINSHIP SUPPORT PERSONNEL SERVICES 0100 0014 0141 0. 317.94
2067 KINSHIP SUPPORT PERSONNEL SERVICES 0100 0014 0142 0. 85,869.42
2067 KINSHIP SUPPORT PERSONNEL SERVICES 0100 0014 0147 585,826.88 0.
2067 KINSHIP SUPPORT PERSONNEL SERVICES 0100 0014 0148 0. 40,484.69
2067 KINSHIP SUPPORT PERSONNEL SERVICES 0100 0014 0154 0. 561.74
2067 KINSHIP SUPPORT PERSONNEL SERVICES 0100 0014 0155 0. 1,976.31
2067 KINSHIP SUPPORT PERSONNEL SERVICES 0100 0014 0157 0. 748.44
2067 KINSHIP SUPPORT PERSONNEL SERVICES 0100 0014 0158 0. 9,468.2
2067 KINSHIP SUPPORT PERSONNEL SERVICES 0100 0014 0159 0. 31,562.9
2067 KINSHIP SUPPORT PERSONNEL SERVICES 0100 0014 0161 0. 4,590.22
0100 Total 3,006,599.14 863,519.27
2067 KINSHIP SUPPORT PERSONNEL SERVICES 0200 0011 0111 55,877.5 15,675.45
Page 13
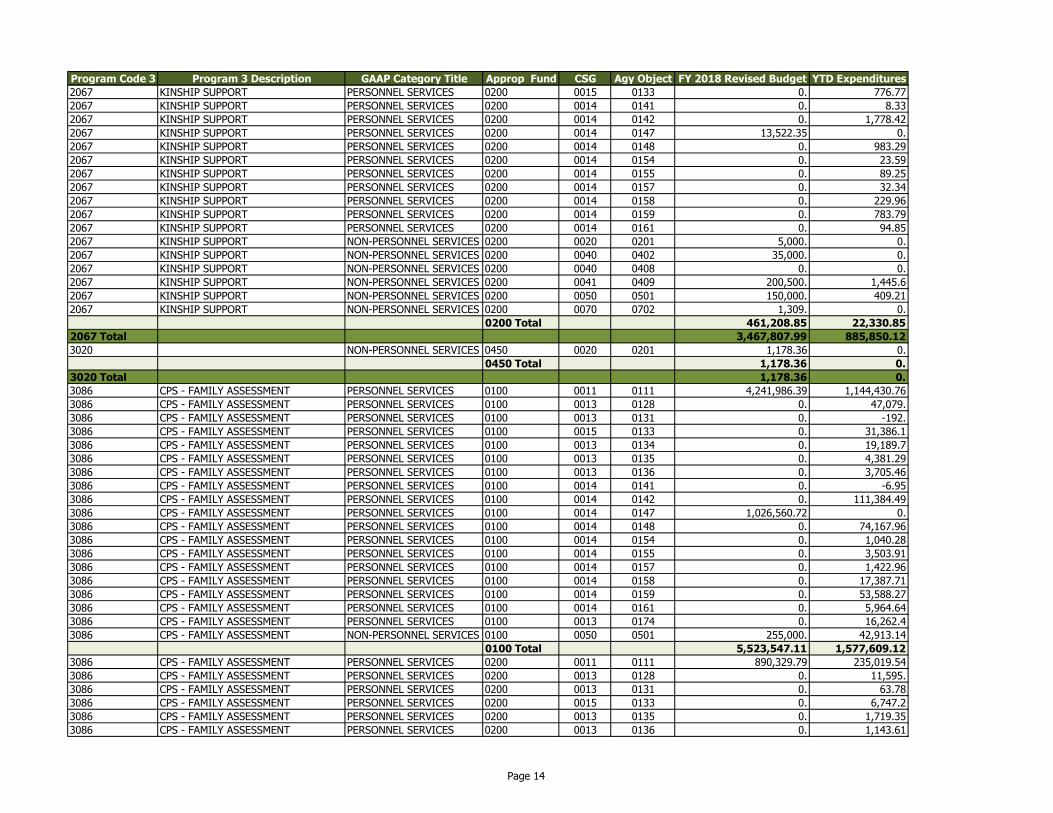
Program Code 3 Program 3 Description GAAP Category Title Approp Fund CSG Agy Object FY 2018 Revised Budget YTD Expenditures
2067 KINSHIP SUPPORT PERSONNEL SERVICES 0200 0015 0133 0. 776.77
2067 KINSHIP SUPPORT PERSONNEL SERVICES 0200 0014 0141 0. 8.33
2067 KINSHIP SUPPORT PERSONNEL SERVICES 0200 0014 0142 0. 1,778.42
2067 KINSHIP SUPPORT PERSONNEL SERVICES 0200 0014 0147 13,522.35 0.
2067 KINSHIP SUPPORT PERSONNEL SERVICES 0200 0014 0148 0. 983.29
2067 KINSHIP SUPPORT PERSONNEL SERVICES 0200 0014 0154 0. 23.59
2067 KINSHIP SUPPORT PERSONNEL SERVICES 0200 0014 0155 0. 89.25
2067 KINSHIP SUPPORT PERSONNEL SERVICES 0200 0014 0157 0. 32.34
2067 KINSHIP SUPPORT PERSONNEL SERVICES 0200 0014 0158 0. 229.96
2067 KINSHIP SUPPORT PERSONNEL SERVICES 0200 0014 0159 0. 783.79
2067 KINSHIP SUPPORT PERSONNEL SERVICES 0200 0014 0161 0. 94.85
2067 KINSHIP SUPPORT NON-PERSONNEL SERVICES 0200 0020 0201 5,000. 0.
2067 KINSHIP SUPPORT NON-PERSONNEL SERVICES 0200 0040 0402 35,000. 0.
2067 KINSHIP SUPPORT NON-PERSONNEL SERVICES 0200 0040 0408 0. 0.
2067 KINSHIP SUPPORT NON-PERSONNEL SERVICES 0200 0041 0409 200,500. 1,445.6
2067 KINSHIP SUPPORT NON-PERSONNEL SERVICES 0200 0050 0501 150,000. 409.21
2067 KINSHIP SUPPORT NON-PERSONNEL SERVICES 0200 0070 0702 1,309. 0.
0200 Total 461,208.85 22,330.85
2067 Total 3,467,807.99 885,850.12
3020 NON-PERSONNEL SERVICES 0450 0020 0201 1,178.36 0.
0450 Total 1,178.36 0.
3020 Total 1,178.36 0.
3086 CPS - FAMILY ASSESSMENT PERSONNEL SERVICES 0100 0011 0111 4,241,986.39 1,144,430.76
3086 CPS - FAMILY ASSESSMENT PERSONNEL SERVICES 0100 0013 0128 0. 47,079.
3086 CPS - FAMILY ASSESSMENT PERSONNEL SERVICES 0100 0013 0131 0. -192.
3086 CPS - FAMILY ASSESSMENT PERSONNEL SERVICES 0100 0015 0133 0. 31,386.1
3086 CPS - FAMILY ASSESSMENT PERSONNEL SERVICES 0100 0013 0134 0. 19,189.7
3086 CPS - FAMILY ASSESSMENT PERSONNEL SERVICES 0100 0013 0135 0. 4,381.29
3086 CPS - FAMILY ASSESSMENT PERSONNEL SERVICES 0100 0013 0136 0. 3,705.46
3086 CPS - FAMILY ASSESSMENT PERSONNEL SERVICES 0100 0014 0141 0. -6.95
3086 CPS - FAMILY ASSESSMENT PERSONNEL SERVICES 0100 0014 0142 0. 111,384.49
3086 CPS - FAMILY ASSESSMENT PERSONNEL SERVICES 0100 0014 0147 1,026,560.72 0.
3086 CPS - FAMILY ASSESSMENT PERSONNEL SERVICES 0100 0014 0148 0. 74,167.96
3086 CPS - FAMILY ASSESSMENT PERSONNEL SERVICES 0100 0014 0154 0. 1,040.28
3086 CPS - FAMILY ASSESSMENT PERSONNEL SERVICES 0100 0014 0155 0. 3,503.91
3086 CPS - FAMILY ASSESSMENT PERSONNEL SERVICES 0100 0014 0157 0. 1,422.96
3086 CPS - FAMILY ASSESSMENT PERSONNEL SERVICES 0100 0014 0158 0. 17,387.71
3086 CPS - FAMILY ASSESSMENT PERSONNEL SERVICES 0100 0014 0159 0. 53,588.27
3086 CPS - FAMILY ASSESSMENT PERSONNEL SERVICES 0100 0014 0161 0. 5,964.64
3086 CPS - FAMILY ASSESSMENT PERSONNEL SERVICES 0100 0013 0174 0. 16,262.4
3086 CPS - FAMILY ASSESSMENT NON-PERSONNEL SERVICES 0100 0050 0501 255,000. 42,913.14
0100 Total 5,523,547.11 1,577,609.12
3086 CPS - FAMILY ASSESSMENT PERSONNEL SERVICES 0200 0011 0111 890,329.79 235,019.54
3086 CPS - FAMILY ASSESSMENT PERSONNEL SERVICES 0200 0013 0128 0. 11,595.
3086 CPS - FAMILY ASSESSMENT PERSONNEL SERVICES 0200 0013 0131 0. 63.78
3086 CPS - FAMILY ASSESSMENT PERSONNEL SERVICES 0200 0015 0133 0. 6,747.2
3086 CPS - FAMILY ASSESSMENT PERSONNEL SERVICES 0200 0013 0135 0. 1,719.35
3086 CPS - FAMILY ASSESSMENT PERSONNEL SERVICES 0200 0013 0136 0. 1,143.61
Page 14
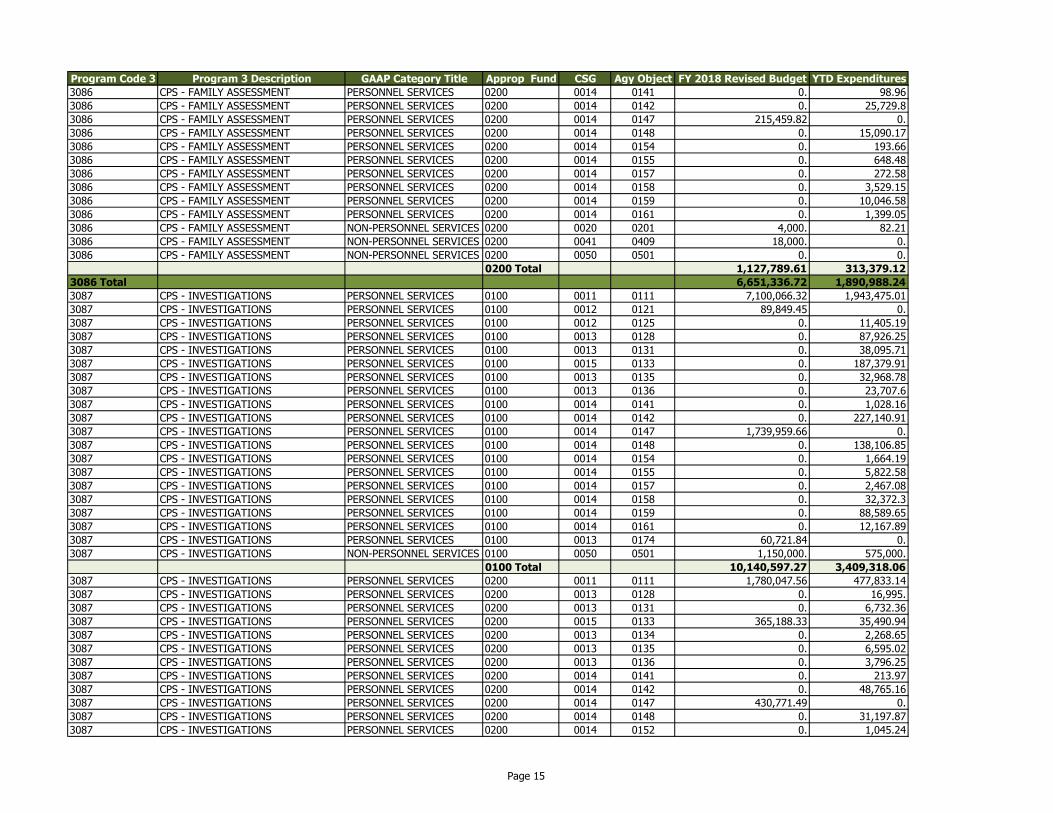
Program Code 3 Program 3 Description GAAP Category Title Approp Fund CSG Agy Object FY 2018 Revised Budget YTD Expenditures
3086 CPS - FAMILY ASSESSMENT PERSONNEL SERVICES 0200 0014 0141 0. 98.96
3086 CPS - FAMILY ASSESSMENT PERSONNEL SERVICES 0200 0014 0142 0. 25,729.8
3086 CPS - FAMILY ASSESSMENT PERSONNEL SERVICES 0200 0014 0147 215,459.82 0.
3086 CPS - FAMILY ASSESSMENT PERSONNEL SERVICES 0200 0014 0148 0. 15,090.17
3086 CPS - FAMILY ASSESSMENT PERSONNEL SERVICES 0200 0014 0154 0. 193.66
3086 CPS - FAMILY ASSESSMENT PERSONNEL SERVICES 0200 0014 0155 0. 648.48
3086 CPS - FAMILY ASSESSMENT PERSONNEL SERVICES 0200 0014 0157 0. 272.58
3086 CPS - FAMILY ASSESSMENT PERSONNEL SERVICES 0200 0014 0158 0. 3,529.15
3086 CPS - FAMILY ASSESSMENT PERSONNEL SERVICES 0200 0014 0159 0. 10,046.58
3086 CPS - FAMILY ASSESSMENT PERSONNEL SERVICES 0200 0014 0161 0. 1,399.05
3086 CPS - FAMILY ASSESSMENT NON-PERSONNEL SERVICES 0200 0020 0201 4,000. 82.21
3086 CPS - FAMILY ASSESSMENT NON-PERSONNEL SERVICES 0200 0041 0409 18,000. 0.
3086 CPS - FAMILY ASSESSMENT NON-PERSONNEL SERVICES 0200 0050 0501 0. 0.
0200 Total 1,127,789.61 313,379.12
3086 Total 6,651,336.72 1,890,988.24
3087 CPS - INVESTIGATIONS PERSONNEL SERVICES 0100 0011 0111 7,100,066.32 1,943,475.01
3087 CPS - INVESTIGATIONS PERSONNEL SERVICES 0100 0012 0121 89,849.45 0.
3087 CPS - INVESTIGATIONS PERSONNEL SERVICES 0100 0012 0125 0. 11,405.19
3087 CPS - INVESTIGATIONS PERSONNEL SERVICES 0100 0013 0128 0. 87,926.25
3087 CPS - INVESTIGATIONS PERSONNEL SERVICES 0100 0013 0131 0. 38,095.71
3087 CPS - INVESTIGATIONS PERSONNEL SERVICES 0100 0015 0133 0. 187,379.91
3087 CPS - INVESTIGATIONS PERSONNEL SERVICES 0100 0013 0135 0. 32,968.78
3087 CPS - INVESTIGATIONS PERSONNEL SERVICES 0100 0013 0136 0. 23,707.6
3087 CPS - INVESTIGATIONS PERSONNEL SERVICES 0100 0014 0141 0. 1,028.16
3087 CPS - INVESTIGATIONS PERSONNEL SERVICES 0100 0014 0142 0. 227,140.91
3087 CPS - INVESTIGATIONS PERSONNEL SERVICES 0100 0014 0147 1,739,959.66 0.
3087 CPS - INVESTIGATIONS PERSONNEL SERVICES 0100 0014 0148 0. 138,106.85
3087 CPS - INVESTIGATIONS PERSONNEL SERVICES 0100 0014 0154 0. 1,664.19
3087 CPS - INVESTIGATIONS PERSONNEL SERVICES 0100 0014 0155 0. 5,822.58
3087 CPS - INVESTIGATIONS PERSONNEL SERVICES 0100 0014 0157 0. 2,467.08
3087 CPS - INVESTIGATIONS PERSONNEL SERVICES 0100 0014 0158 0. 32,372.3
3087 CPS - INVESTIGATIONS PERSONNEL SERVICES 0100 0014 0159 0. 88,589.65
3087 CPS - INVESTIGATIONS PERSONNEL SERVICES 0100 0014 0161 0. 12,167.89
3087 CPS - INVESTIGATIONS PERSONNEL SERVICES 0100 0013 0174 60,721.84 0.
3087 CPS - INVESTIGATIONS NON-PERSONNEL SERVICES 0100 0050 0501 1,150,000. 575,000.
0100 Total 10,140,597.27 3,409,318.06
3087 CPS - INVESTIGATIONS PERSONNEL SERVICES 0200 0011 0111 1,780,047.56 477,833.14
3087 CPS - INVESTIGATIONS PERSONNEL SERVICES 0200 0013 0128 0. 16,995.
3087 CPS - INVESTIGATIONS PERSONNEL SERVICES 0200 0013 0131 0. 6,732.36
3087 CPS - INVESTIGATIONS PERSONNEL SERVICES 0200 0015 0133 365,188.33 35,490.94
3087 CPS - INVESTIGATIONS PERSONNEL SERVICES 0200 0013 0134 0. 2,268.65
3087 CPS - INVESTIGATIONS PERSONNEL SERVICES 0200 0013 0135 0. 6,595.02
3087 CPS - INVESTIGATIONS PERSONNEL SERVICES 0200 0013 0136 0. 3,796.25
3087 CPS - INVESTIGATIONS PERSONNEL SERVICES 0200 0014 0141 0. 213.97
3087 CPS - INVESTIGATIONS PERSONNEL SERVICES 0200 0014 0142 0. 48,765.16
3087 CPS - INVESTIGATIONS PERSONNEL SERVICES 0200 0014 0147 430,771.49 0.
3087 CPS - INVESTIGATIONS PERSONNEL SERVICES 0200 0014 0148 0. 31,197.87
3087 CPS - INVESTIGATIONS PERSONNEL SERVICES 0200 0014 0152 0. 1,045.24
Page 15
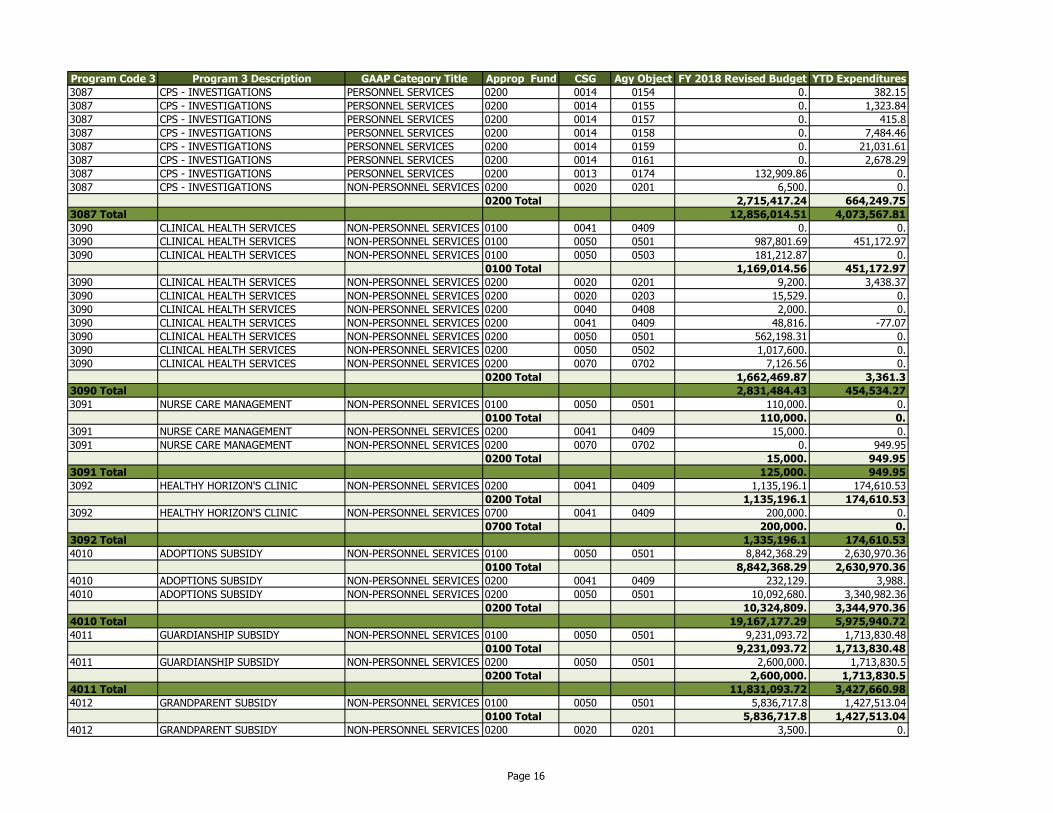
Program Code 3 Program 3 Description GAAP Category Title Approp Fund CSG Agy Object FY 2018 Revised Budget YTD Expenditures
3087 CPS - INVESTIGATIONS PERSONNEL SERVICES 0200 0014 0154 0. 382.15
3087 CPS - INVESTIGATIONS PERSONNEL SERVICES 0200 0014 0155 0. 1,323.84
3087 CPS - INVESTIGATIONS PERSONNEL SERVICES 0200 0014 0157 0. 415.8
3087 CPS - INVESTIGATIONS PERSONNEL SERVICES 0200 0014 0158 0. 7,484.46
3087 CPS - INVESTIGATIONS PERSONNEL SERVICES 0200 0014 0159 0. 21,031.61
3087 CPS - INVESTIGATIONS PERSONNEL SERVICES 0200 0014 0161 0. 2,678.29
3087 CPS - INVESTIGATIONS PERSONNEL SERVICES 0200 0013 0174 132,909.86 0.
3087 CPS - INVESTIGATIONS NON-PERSONNEL SERVICES 0200 0020 0201 6,500. 0.
0200 Total 2,715,417.24 664,249.75
3087 Total 12,856,014.51 4,073,567.81
3090 CLINICAL HEALTH SERVICES NON-PERSONNEL SERVICES 0100 0041 0409 0. 0.
3090 CLINICAL HEALTH SERVICES NON-PERSONNEL SERVICES 0100 0050 0501 987,801.69 451,172.97
3090 CLINICAL HEALTH SERVICES NON-PERSONNEL SERVICES 0100 0050 0503 181,212.87 0.
0100 Total 1,169,014.56 451,172.97
3090 CLINICAL HEALTH SERVICES NON-PERSONNEL SERVICES 0200 0020 0201 9,200. 3,438.37
3090 CLINICAL HEALTH SERVICES NON-PERSONNEL SERVICES 0200 0020 0203 15,529. 0.
3090 CLINICAL HEALTH SERVICES NON-PERSONNEL SERVICES 0200 0040 0408 2,000. 0.
3090 CLINICAL HEALTH SERVICES NON-PERSONNEL SERVICES 0200 0041 0409 48,816. -77.07
3090 CLINICAL HEALTH SERVICES NON-PERSONNEL SERVICES 0200 0050 0501 562,198.31 0.
3090 CLINICAL HEALTH SERVICES NON-PERSONNEL SERVICES 0200 0050 0502 1,017,600. 0.
3090 CLINICAL HEALTH SERVICES NON-PERSONNEL SERVICES 0200 0070 0702 7,126.56 0.
0200 Total 1,662,469.87 3,361.3
3090 Total 2,831,484.43 454,534.27
3091 NURSE CARE MANAGEMENT NON-PERSONNEL SERVICES 0100 0050 0501 110,000. 0.
0100 Total 110,000. 0.
3091 NURSE CARE MANAGEMENT NON-PERSONNEL SERVICES 0200 0041 0409 15,000. 0.
3091 NURSE CARE MANAGEMENT NON-PERSONNEL SERVICES 0200 0070 0702 0. 949.95
0200 Total 15,000. 949.95
3091 Total 125,000. 949.95
3092 HEALTHY HORIZON'S CLINIC NON-PERSONNEL SERVICES 0200 0041 0409 1,135,196.1 174,610.53
0200 Total 1,135,196.1 174,610.53
3092 HEALTHY HORIZON'S CLINIC NON-PERSONNEL SERVICES 0700 0041 0409 200,000. 0.
0700 Total 200,000. 0.
3092 Total 1,335,196.1 174,610.53
4010 ADOPTIONS SUBSIDY NON-PERSONNEL SERVICES 0100 0050 0501 8,842,368.29 2,630,970.36
0100 Total 8,842,368.29 2,630,970.36
4010 ADOPTIONS SUBSIDY NON-PERSONNEL SERVICES 0200 0041 0409 232,129. 3,988.
4010 ADOPTIONS SUBSIDY NON-PERSONNEL SERVICES 0200 0050 0501 10,092,680. 3,340,982.36
0200 Total 10,324,809. 3,344,970.36
4010 Total 19,167,177.29 5,975,940.72
4011 GUARDIANSHIP SUBSIDY NON-PERSONNEL SERVICES 0100 0050 0501 9,231,093.72 1,713,830.48
0100 Total 9,231,093.72 1,713,830.48
4011 GUARDIANSHIP SUBSIDY NON-PERSONNEL SERVICES 0200 0050 0501 2,600,000. 1,713,830.5
0200 Total 2,600,000. 1,713,830.5
4011 Total 11,831,093.72 3,427,660.98
4012 GRANDPARENT SUBSIDY NON-PERSONNEL SERVICES 0100 0050 0501 5,836,717.8 1,427,513.04
0100 Total 5,836,717.8 1,427,513.04
4012 GRANDPARENT SUBSIDY NON-PERSONNEL SERVICES 0200 0020 0201 3,500. 0.
Page 16
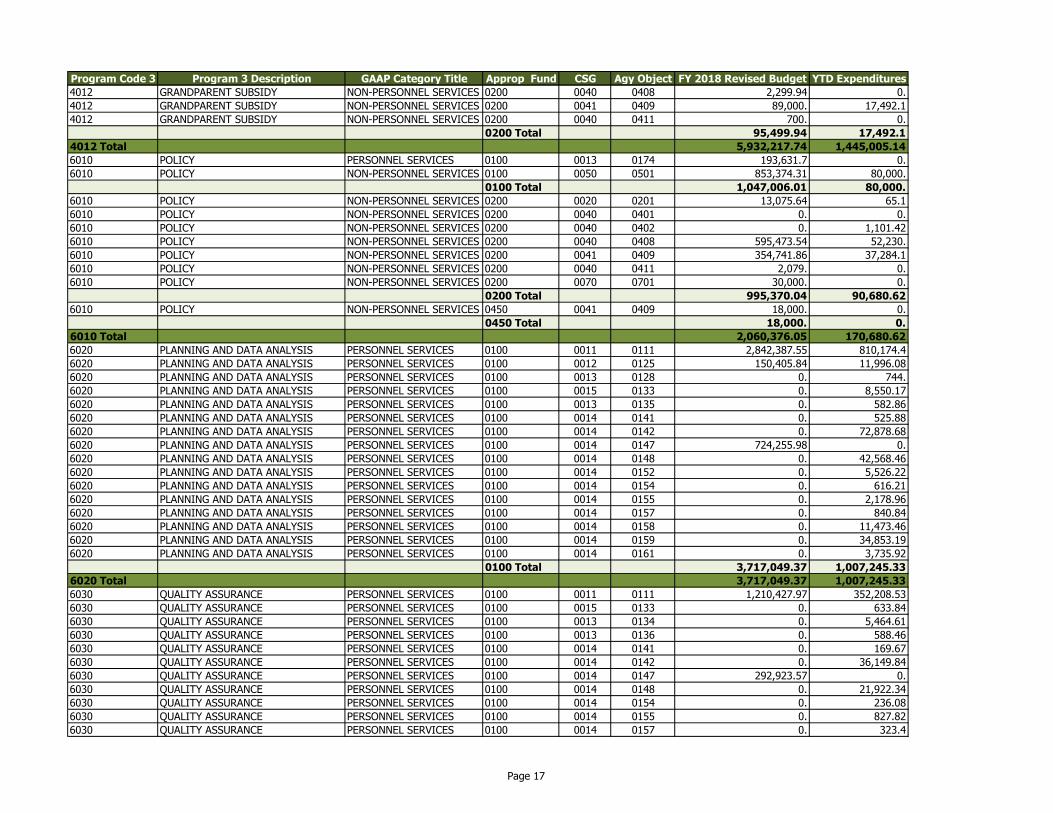
Program Code 3 Program 3 Description GAAP Category Title Approp Fund CSG Agy Object FY 2018 Revised Budget YTD Expenditures
4012 GRANDPARENT SUBSIDY NON-PERSONNEL SERVICES 0200 0040 0408 2,299.94 0.
4012 GRANDPARENT SUBSIDY NON-PERSONNEL SERVICES 0200 0041 0409 89,000. 17,492.1
4012 GRANDPARENT SUBSIDY NON-PERSONNEL SERVICES 0200 0040 0411 700. 0.
0200 Total 95,499.94 17,492.1
4012 Total 5,932,217.74 1,445,005.14
6010 POLICY PERSONNEL SERVICES 0100 0013 0174 193,631.7 0.
6010 POLICY NON-PERSONNEL SERVICES 0100 0050 0501 853,374.31 80,000.
0100 Total 1,047,006.01 80,000.
6010 POLICY NON-PERSONNEL SERVICES 0200 0020 0201 13,075.64 65.1
6010 POLICY NON-PERSONNEL SERVICES 0200 0040 0401 0. 0.
6010 POLICY NON-PERSONNEL SERVICES 0200 0040 0402 0. 1,101.42
6010 POLICY NON-PERSONNEL SERVICES 0200 0040 0408 595,473.54 52,230.
6010 POLICY NON-PERSONNEL SERVICES 0200 0041 0409 354,741.86 37,284.1
6010 POLICY NON-PERSONNEL SERVICES 0200 0040 0411 2,079. 0.
6010 POLICY NON-PERSONNEL SERVICES 0200 0070 0701 30,000. 0.
0200 Total 995,370.04 90,680.62
6010 POLICY NON-PERSONNEL SERVICES 0450 0041 0409 18,000. 0.
0450 Total 18,000. 0.
6010 Total 2,060,376.05 170,680.62
6020 PLANNING AND DATA ANALYSIS PERSONNEL SERVICES 0100 0011 0111 2,842,387.55 810,174.4
6020 PLANNING AND DATA ANALYSIS PERSONNEL SERVICES 0100 0012 0125 150,405.84 11,996.08
6020 PLANNING AND DATA ANALYSIS PERSONNEL SERVICES 0100 0013 0128 0. 744.
6020 PLANNING AND DATA ANALYSIS PERSONNEL SERVICES 0100 0015 0133 0. 8,550.17
6020 PLANNING AND DATA ANALYSIS PERSONNEL SERVICES 0100 0013 0135 0. 582.86
6020 PLANNING AND DATA ANALYSIS PERSONNEL SERVICES 0100 0014 0141 0. 525.88
6020 PLANNING AND DATA ANALYSIS PERSONNEL SERVICES 0100 0014 0142 0. 72,878.68
6020 PLANNING AND DATA ANALYSIS PERSONNEL SERVICES 0100 0014 0147 724,255.98 0.
6020 PLANNING AND DATA ANALYSIS PERSONNEL SERVICES 0100 0014 0148 0. 42,568.46
6020 PLANNING AND DATA ANALYSIS PERSONNEL SERVICES 0100 0014 0152 0. 5,526.22
6020 PLANNING AND DATA ANALYSIS PERSONNEL SERVICES 0100 0014 0154 0. 616.21
6020 PLANNING AND DATA ANALYSIS PERSONNEL SERVICES 0100 0014 0155 0. 2,178.96
6020 PLANNING AND DATA ANALYSIS PERSONNEL SERVICES 0100 0014 0157 0. 840.84
6020 PLANNING AND DATA ANALYSIS PERSONNEL SERVICES 0100 0014 0158 0. 11,473.46
6020 PLANNING AND DATA ANALYSIS PERSONNEL SERVICES 0100 0014 0159 0. 34,853.19
6020 PLANNING AND DATA ANALYSIS PERSONNEL SERVICES 0100 0014 0161 0. 3,735.92
0100 Total 3,717,049.37 1,007,245.33
6020 Total 3,717,049.37 1,007,245.33
6030 QUALITY ASSURANCE PERSONNEL SERVICES 0100 0011 0111 1,210,427.97 352,208.53
6030 QUALITY ASSURANCE PERSONNEL SERVICES 0100 0015 0133 0. 633.84
6030 QUALITY ASSURANCE PERSONNEL SERVICES 0100 0013 0134 0. 5,464.61
6030 QUALITY ASSURANCE PERSONNEL SERVICES 0100 0013 0136 0. 588.46
6030 QUALITY ASSURANCE PERSONNEL SERVICES 0100 0014 0141 0. 169.67
6030 QUALITY ASSURANCE PERSONNEL SERVICES 0100 0014 0142 0. 36,149.84
6030 QUALITY ASSURANCE PERSONNEL SERVICES 0100 0014 0147 292,923.57 0.
6030 QUALITY ASSURANCE PERSONNEL SERVICES 0100 0014 0148 0. 21,922.34
6030 QUALITY ASSURANCE PERSONNEL SERVICES 0100 0014 0154 0. 236.08
6030 QUALITY ASSURANCE PERSONNEL SERVICES 0100 0014 0155 0. 827.82
6030 QUALITY ASSURANCE PERSONNEL SERVICES 0100 0014 0157 0. 323.4
Page 17
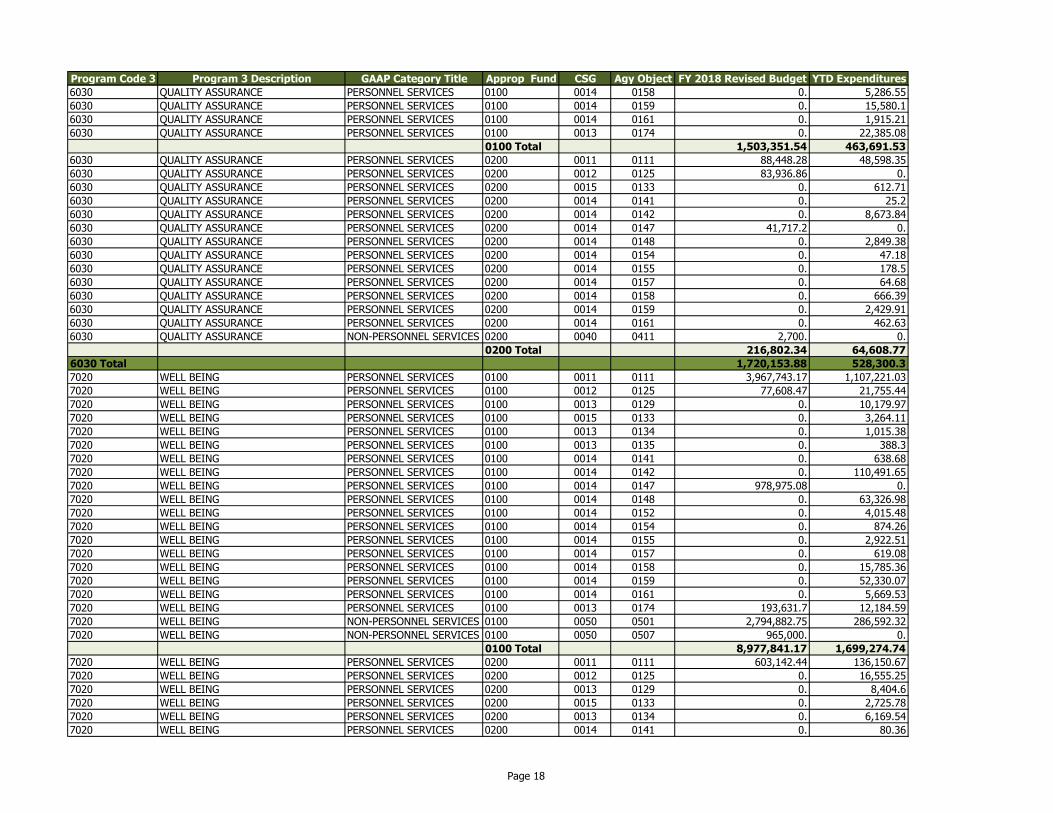
Program Code 3 Program 3 Description GAAP Category Title Approp Fund CSG Agy Object FY 2018 Revised Budget YTD Expenditures
6030 QUALITY ASSURANCE PERSONNEL SERVICES 0100 0014 0158 0. 5,286.55
6030 QUALITY ASSURANCE PERSONNEL SERVICES 0100 0014 0159 0. 15,580.1
6030 QUALITY ASSURANCE PERSONNEL SERVICES 0100 0014 0161 0. 1,915.21
6030 QUALITY ASSURANCE PERSONNEL SERVICES 0100 0013 0174 0. 22,385.08
0100 Total 1,503,351.54 463,691.53
6030 QUALITY ASSURANCE PERSONNEL SERVICES 0200 0011 0111 88,448.28 48,598.35
6030 QUALITY ASSURANCE PERSONNEL SERVICES 0200 0012 0125 83,936.86 0.
6030 QUALITY ASSURANCE PERSONNEL SERVICES 0200 0015 0133 0. 612.71
6030 QUALITY ASSURANCE PERSONNEL SERVICES 0200 0014 0141 0. 25.2
6030 QUALITY ASSURANCE PERSONNEL SERVICES 0200 0014 0142 0. 8,673.84
6030 QUALITY ASSURANCE PERSONNEL SERVICES 0200 0014 0147 41,717.2 0.
6030 QUALITY ASSURANCE PERSONNEL SERVICES 0200 0014 0148 0. 2,849.38
6030 QUALITY ASSURANCE PERSONNEL SERVICES 0200 0014 0154 0. 47.18
6030 QUALITY ASSURANCE PERSONNEL SERVICES 0200 0014 0155 0. 178.5
6030 QUALITY ASSURANCE PERSONNEL SERVICES 0200 0014 0157 0. 64.68
6030 QUALITY ASSURANCE PERSONNEL SERVICES 0200 0014 0158 0. 666.39
6030 QUALITY ASSURANCE PERSONNEL SERVICES 0200 0014 0159 0. 2,429.91
6030 QUALITY ASSURANCE PERSONNEL SERVICES 0200 0014 0161 0. 462.63
6030 QUALITY ASSURANCE NON-PERSONNEL SERVICES 0200 0040 0411 2,700. 0.
0200 Total 216,802.34 64,608.77
6030 Total 1,720,153.88 528,300.3
7020 WELL BEING PERSONNEL SERVICES 0100 0011 0111 3,967,743.17 1,107,221.03
7020 WELL BEING PERSONNEL SERVICES 0100 0012 0125 77,608.47 21,755.44
7020 WELL BEING PERSONNEL SERVICES 0100 0013 0129 0. 10,179.97
7020 WELL BEING PERSONNEL SERVICES 0100 0015 0133 0. 3,264.11
7020 WELL BEING PERSONNEL SERVICES 0100 0013 0134 0. 1,015.38
7020 WELL BEING PERSONNEL SERVICES 0100 0013 0135 0. 388.3
7020 WELL BEING PERSONNEL SERVICES 0100 0014 0141 0. 638.68
7020 WELL BEING PERSONNEL SERVICES 0100 0014 0142 0. 110,491.65
7020 WELL BEING PERSONNEL SERVICES 0100 0014 0147 978,975.08 0.
7020 WELL BEING PERSONNEL SERVICES 0100 0014 0148 0. 63,326.98
7020 WELL BEING PERSONNEL SERVICES 0100 0014 0152 0. 4,015.48
7020 WELL BEING PERSONNEL SERVICES 0100 0014 0154 0. 874.26
7020 WELL BEING PERSONNEL SERVICES 0100 0014 0155 0. 2,922.51
7020 WELL BEING PERSONNEL SERVICES 0100 0014 0157 0. 619.08
7020 WELL BEING PERSONNEL SERVICES 0100 0014 0158 0. 15,785.36
7020 WELL BEING PERSONNEL SERVICES 0100 0014 0159 0. 52,330.07
7020 WELL BEING PERSONNEL SERVICES 0100 0014 0161 0. 5,669.53
7020 WELL BEING PERSONNEL SERVICES 0100 0013 0174 193,631.7 12,184.59
7020 WELL BEING NON-PERSONNEL SERVICES 0100 0050 0501 2,794,882.75 286,592.32
7020 WELL BEING NON-PERSONNEL SERVICES 0100 0050 0507 965,000. 0.
0100 Total 8,977,841.17 1,699,274.74
7020 WELL BEING PERSONNEL SERVICES 0200 0011 0111 603,142.44 136,150.67
7020 WELL BEING PERSONNEL SERVICES 0200 0012 0125 0. 16,555.25
7020 WELL BEING PERSONNEL SERVICES 0200 0013 0129 0. 8,404.6
7020 WELL BEING PERSONNEL SERVICES 0200 0015 0133 0. 2,725.78
7020 WELL BEING PERSONNEL SERVICES 0200 0013 0134 0. 6,169.54
7020 WELL BEING PERSONNEL SERVICES 0200 0014 0141 0. 80.36
Page 18
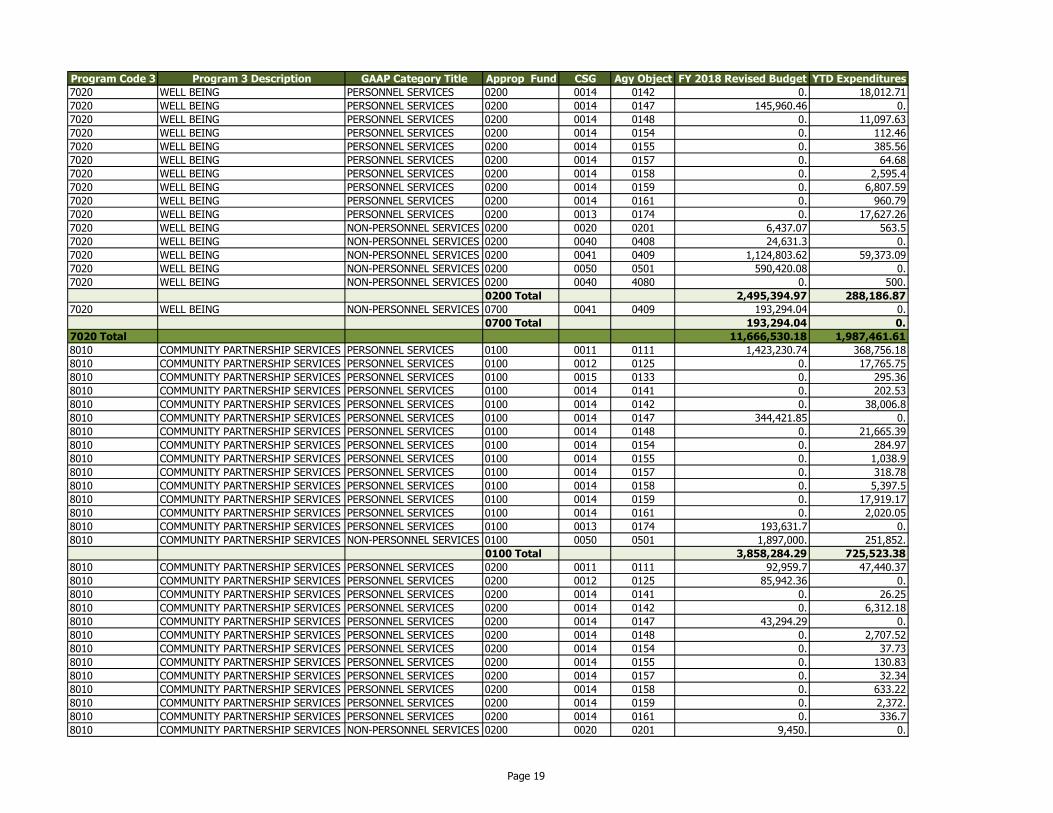
Program Code 3 Program 3 Description GAAP Category Title Approp Fund CSG Agy Object FY 2018 Revised Budget YTD Expenditures
7020 WELL BEING PERSONNEL SERVICES 0200 0014 0142 0. 18,012.71
7020 WELL BEING PERSONNEL SERVICES 0200 0014 0147 145,960.46 0.
7020 WELL BEING PERSONNEL SERVICES 0200 0014 0148 0. 11,097.63
7020 WELL BEING PERSONNEL SERVICES 0200 0014 0154 0. 112.46
7020 WELL BEING PERSONNEL SERVICES 0200 0014 0155 0. 385.56
7020 WELL BEING PERSONNEL SERVICES 0200 0014 0157 0. 64.68
7020 WELL BEING PERSONNEL SERVICES 0200 0014 0158 0. 2,595.4
7020 WELL BEING PERSONNEL SERVICES 0200 0014 0159 0. 6,807.59
7020 WELL BEING PERSONNEL SERVICES 0200 0014 0161 0. 960.79
7020 WELL BEING PERSONNEL SERVICES 0200 0013 0174 0. 17,627.26
7020 WELL BEING NON-PERSONNEL SERVICES 0200 0020 0201 6,437.07 563.5
7020 WELL BEING NON-PERSONNEL SERVICES 0200 0040 0408 24,631.3 0.
7020 WELL BEING NON-PERSONNEL SERVICES 0200 0041 0409 1,124,803.62 59,373.09
7020 WELL BEING NON-PERSONNEL SERVICES 0200 0050 0501 590,420.08 0.
7020 WELL BEING NON-PERSONNEL SERVICES 0200 0040 4080 0. 500.
0200 Total 2,495,394.97 288,186.87
7020 WELL BEING NON-PERSONNEL SERVICES 0700 0041 0409 193,294.04 0.
0700 Total 193,294.04 0.
7020 Total 11,666,530.18 1,987,461.61
8010 COMMUNITY PARTNERSHIP SERVICES PERSONNEL SERVICES 0100 0011 0111 1,423,230.74 368,756.18
8010 COMMUNITY PARTNERSHIP SERVICES PERSONNEL SERVICES 0100 0012 0125 0. 17,765.75
8010 COMMUNITY PARTNERSHIP SERVICES PERSONNEL SERVICES 0100 0015 0133 0. 295.36
8010 COMMUNITY PARTNERSHIP SERVICES PERSONNEL SERVICES 0100 0014 0141 0. 202.53
8010 COMMUNITY PARTNERSHIP SERVICES PERSONNEL SERVICES 0100 0014 0142 0. 38,006.8
8010 COMMUNITY PARTNERSHIP SERVICES PERSONNEL SERVICES 0100 0014 0147 344,421.85 0.
8010 COMMUNITY PARTNERSHIP SERVICES PERSONNEL SERVICES 0100 0014 0148 0. 21,665.39
8010 COMMUNITY PARTNERSHIP SERVICES PERSONNEL SERVICES 0100 0014 0154 0. 284.97
8010 COMMUNITY PARTNERSHIP SERVICES PERSONNEL SERVICES 0100 0014 0155 0. 1,038.9
8010 COMMUNITY PARTNERSHIP SERVICES PERSONNEL SERVICES 0100 0014 0157 0. 318.78
8010 COMMUNITY PARTNERSHIP SERVICES PERSONNEL SERVICES 0100 0014 0158 0. 5,397.5
8010 COMMUNITY PARTNERSHIP SERVICES PERSONNEL SERVICES 0100 0014 0159 0. 17,919.17
8010 COMMUNITY PARTNERSHIP SERVICES PERSONNEL SERVICES 0100 0014 0161 0. 2,020.05
8010 COMMUNITY PARTNERSHIP SERVICES PERSONNEL SERVICES 0100 0013 0174 193,631.7 0.
8010 COMMUNITY PARTNERSHIP SERVICES NON-PERSONNEL SERVICES 0100 0050 0501 1,897,000. 251,852.
0100 Total 3,858,284.29 725,523.38
8010 COMMUNITY PARTNERSHIP SERVICES PERSONNEL SERVICES 0200 0011 0111 92,959.7 47,440.37
8010 COMMUNITY PARTNERSHIP SERVICES PERSONNEL SERVICES 0200 0012 0125 85,942.36 0.
8010 COMMUNITY PARTNERSHIP SERVICES PERSONNEL SERVICES 0200 0014 0141 0. 26.25
8010 COMMUNITY PARTNERSHIP SERVICES PERSONNEL SERVICES 0200 0014 0142 0. 6,312.18
8010 COMMUNITY PARTNERSHIP SERVICES PERSONNEL SERVICES 0200 0014 0147 43,294.29 0.
8010 COMMUNITY PARTNERSHIP SERVICES PERSONNEL SERVICES 0200 0014 0148 0. 2,707.52
8010 COMMUNITY PARTNERSHIP SERVICES PERSONNEL SERVICES 0200 0014 0154 0. 37.73
8010 COMMUNITY PARTNERSHIP SERVICES PERSONNEL SERVICES 0200 0014 0155 0. 130.83
8010 COMMUNITY PARTNERSHIP SERVICES PERSONNEL SERVICES 0200 0014 0157 0. 32.34
8010 COMMUNITY PARTNERSHIP SERVICES PERSONNEL SERVICES 0200 0014 0158 0. 633.22
8010 COMMUNITY PARTNERSHIP SERVICES PERSONNEL SERVICES 0200 0014 0159 0. 2,372.
8010 COMMUNITY PARTNERSHIP SERVICES PERSONNEL SERVICES 0200 0014 0161 0. 336.7
8010 COMMUNITY PARTNERSHIP SERVICES NON-PERSONNEL SERVICES 0200 0020 0201 9,450. 0.
Page 19
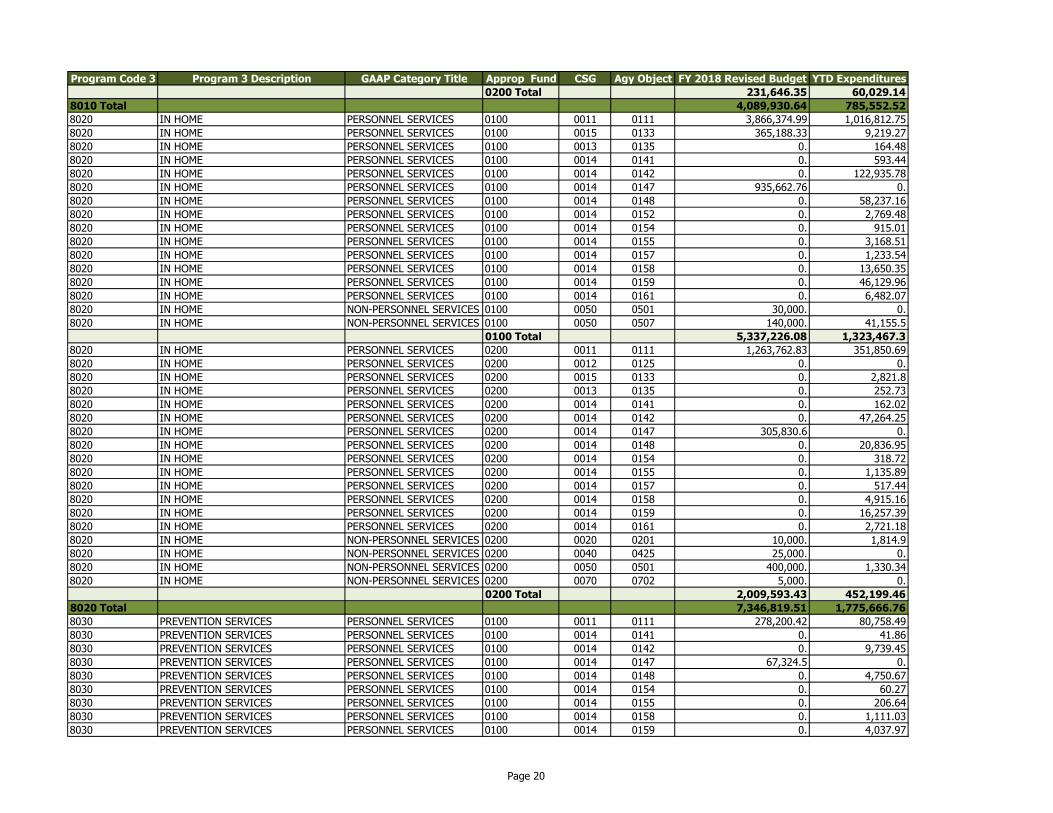
Program Code 3 Program 3 Description GAAP Category Title Approp Fund CSG Agy Object FY 2018 Revised Budget YTD Expenditures
0200 Total 231,646.35 60,029.14
8010 Total 4,089,930.64 785,552.52
8020 IN HOME PERSONNEL SERVICES 0100 0011 0111 3,866,374.99 1,016,812.75
8020 IN HOME PERSONNEL SERVICES 0100 0015 0133 365,188.33 9,219.27
8020 IN HOME PERSONNEL SERVICES 0100 0013 0135 0. 164.48
8020 IN HOME PERSONNEL SERVICES 0100 0014 0141 0. 593.44
8020 IN HOME PERSONNEL SERVICES 0100 0014 0142 0. 122,935.78
8020 IN HOME PERSONNEL SERVICES 0100 0014 0147 935,662.76 0.
8020 IN HOME PERSONNEL SERVICES 0100 0014 0148 0. 58,237.16
8020 IN HOME PERSONNEL SERVICES 0100 0014 0152 0. 2,769.48
8020 IN HOME PERSONNEL SERVICES 0100 0014 0154 0. 915.01
8020 IN HOME PERSONNEL SERVICES 0100 0014 0155 0. 3,168.51
8020 IN HOME PERSONNEL SERVICES 0100 0014 0157 0. 1,233.54
8020 IN HOME PERSONNEL SERVICES 0100 0014 0158 0. 13,650.35
8020 IN HOME PERSONNEL SERVICES 0100 0014 0159 0. 46,129.96
8020 IN HOME PERSONNEL SERVICES 0100 0014 0161 0. 6,482.07
8020 IN HOME NON-PERSONNEL SERVICES 0100 0050 0501 30,000. 0.
8020 IN HOME NON-PERSONNEL SERVICES 0100 0050 0507 140,000. 41,155.5
0100 Total 5,337,226.08 1,323,467.3
8020 IN HOME PERSONNEL SERVICES 0200 0011 0111 1,263,762.83 351,850.69
8020 IN HOME PERSONNEL SERVICES 0200 0012 0125 0. 0.
8020 IN HOME PERSONNEL SERVICES 0200 0015 0133 0. 2,821.8
8020 IN HOME PERSONNEL SERVICES 0200 0013 0135 0. 252.73
8020 IN HOME PERSONNEL SERVICES 0200 0014 0141 0. 162.02
8020 IN HOME PERSONNEL SERVICES 0200 0014 0142 0. 47,264.25
8020 IN HOME PERSONNEL SERVICES 0200 0014 0147 305,830.6 0.
8020 IN HOME PERSONNEL SERVICES 0200 0014 0148 0. 20,836.95
8020 IN HOME PERSONNEL SERVICES 0200 0014 0154 0. 318.72
8020 IN HOME PERSONNEL SERVICES 0200 0014 0155 0. 1,135.89
8020 IN HOME PERSONNEL SERVICES 0200 0014 0157 0. 517.44
8020 IN HOME PERSONNEL SERVICES 0200 0014 0158 0. 4,915.16
8020 IN HOME PERSONNEL SERVICES 0200 0014 0159 0. 16,257.39
8020 IN HOME PERSONNEL SERVICES 0200 0014 0161 0. 2,721.18
8020 IN HOME NON-PERSONNEL SERVICES 0200 0020 0201 10,000. 1,814.9
8020 IN HOME NON-PERSONNEL SERVICES 0200 0040 0425 25,000. 0.
8020 IN HOME NON-PERSONNEL SERVICES 0200 0050 0501 400,000. 1,330.34
8020 IN HOME NON-PERSONNEL SERVICES 0200 0070 0702 5,000. 0.
0200 Total 2,009,593.43 452,199.46
8020 Total 7,346,819.51 1,775,666.76
8030 PREVENTION SERVICES PERSONNEL SERVICES 0100 0011 0111 278,200.42 80,758.49
8030 PREVENTION SERVICES PERSONNEL SERVICES 0100 0014 0141 0. 41.86
8030 PREVENTION SERVICES PERSONNEL SERVICES 0100 0014 0142 0. 9,739.45
8030 PREVENTION SERVICES PERSONNEL SERVICES 0100 0014 0147 67,324.5 0.
8030 PREVENTION SERVICES PERSONNEL SERVICES 0100 0014 0148 0. 4,750.67
8030 PREVENTION SERVICES PERSONNEL SERVICES 0100 0014 0154 0. 60.27
8030 PREVENTION SERVICES PERSONNEL SERVICES 0100 0014 0155 0. 206.64
8030 PREVENTION SERVICES PERSONNEL SERVICES 0100 0014 0158 0. 1,111.03
8030 PREVENTION SERVICES PERSONNEL SERVICES 0100 0014 0159 0. 4,037.97
Page 20
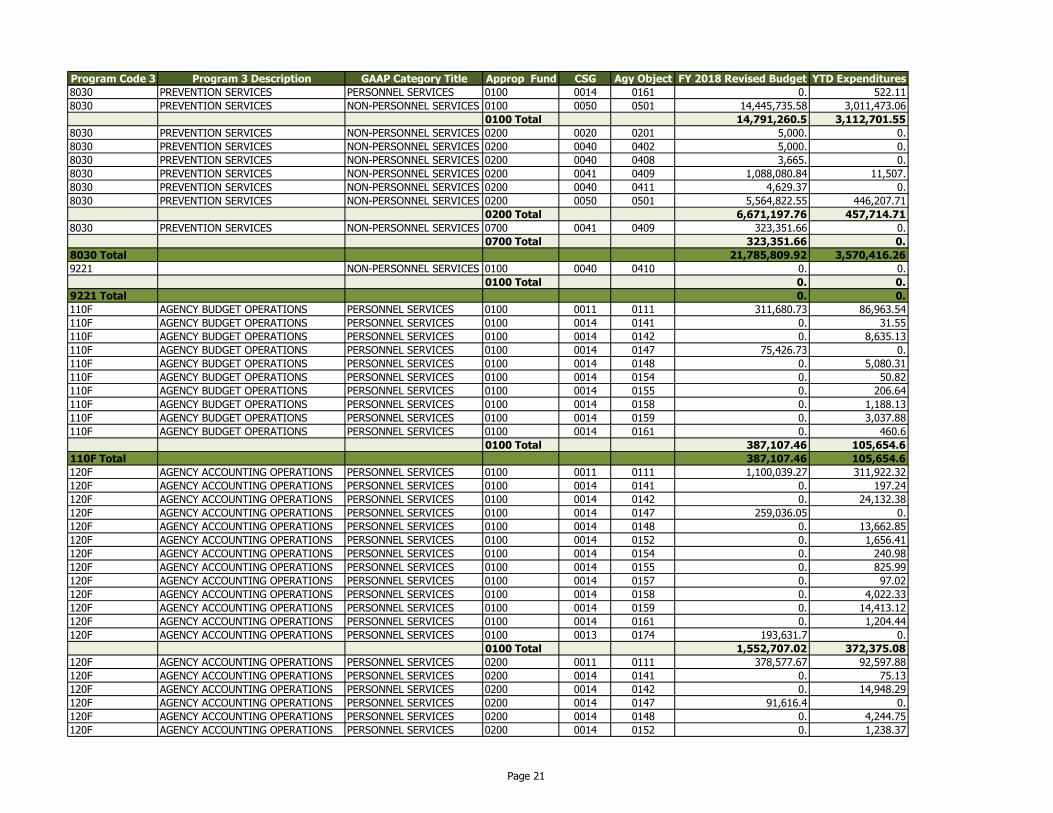
Program Code 3 Program 3 Description GAAP Category Title Approp Fund CSG Agy Object FY 2018 Revised Budget YTD Expenditures
8030 PREVENTION SERVICES PERSONNEL SERVICES 0100 0014 0161 0. 522.11
8030 PREVENTION SERVICES NON-PERSONNEL SERVICES 0100 0050 0501 14,445,735.58 3,011,473.06
0100 Total 14,791,260.5 3,112,701.55
8030 PREVENTION SERVICES NON-PERSONNEL SERVICES 0200 0020 0201 5,000. 0.
8030 PREVENTION SERVICES NON-PERSONNEL SERVICES 0200 0040 0402 5,000. 0.
8030 PREVENTION SERVICES NON-PERSONNEL SERVICES 0200 0040 0408 3,665. 0.
8030 PREVENTION SERVICES NON-PERSONNEL SERVICES 0200 0041 0409 1,088,080.84 11,507.
8030 PREVENTION SERVICES NON-PERSONNEL SERVICES 0200 0040 0411 4,629.37 0.
8030 PREVENTION SERVICES NON-PERSONNEL SERVICES 0200 0050 0501 5,564,822.55 446,207.71
0200 Total 6,671,197.76 457,714.71
8030 PREVENTION SERVICES NON-PERSONNEL SERVICES 0700 0041 0409 323,351.66 0.
0700 Total 323,351.66 0.
8030 Total 21,785,809.92 3,570,416.26
9221 NON-PERSONNEL SERVICES 0100 0040 0410 0. 0.
0100 Total 0. 0.
9221 Total 0. 0.
110F AGENCY BUDGET OPERATIONS PERSONNEL SERVICES 0100 0011 0111 311,680.73 86,963.54
110F AGENCY BUDGET OPERATIONS PERSONNEL SERVICES 0100 0014 0141 0. 31.55
110F AGENCY BUDGET OPERATIONS PERSONNEL SERVICES 0100 0014 0142 0. 8,635.13
110F AGENCY BUDGET OPERATIONS PERSONNEL SERVICES 0100 0014 0147 75,426.73 0.
110F AGENCY BUDGET OPERATIONS PERSONNEL SERVICES 0100 0014 0148 0. 5,080.31
110F AGENCY BUDGET OPERATIONS PERSONNEL SERVICES 0100 0014 0154 0. 50.82
110F AGENCY BUDGET OPERATIONS PERSONNEL SERVICES 0100 0014 0155 0. 206.64
110F AGENCY BUDGET OPERATIONS PERSONNEL SERVICES 0100 0014 0158 0. 1,188.13
110F AGENCY BUDGET OPERATIONS PERSONNEL SERVICES 0100 0014 0159 0. 3,037.88
110F AGENCY BUDGET OPERATIONS PERSONNEL SERVICES 0100 0014 0161 0. 460.6
0100 Total 387,107.46 105,654.6
110F Total 387,107.46 105,654.6
120F AGENCY ACCOUNTING OPERATIONS PERSONNEL SERVICES 0100 0011 0111 1,100,039.27 311,922.32
120F AGENCY ACCOUNTING OPERATIONS PERSONNEL SERVICES 0100 0014 0141 0. 197.24
120F AGENCY ACCOUNTING OPERATIONS PERSONNEL SERVICES 0100 0014 0142 0. 24,132.38
120F AGENCY ACCOUNTING OPERATIONS PERSONNEL SERVICES 0100 0014 0147 259,036.05 0.
120F AGENCY ACCOUNTING OPERATIONS PERSONNEL SERVICES 0100 0014 0148 0. 13,662.85
120F AGENCY ACCOUNTING OPERATIONS PERSONNEL SERVICES 0100 0014 0152 0. 1,656.41
120F AGENCY ACCOUNTING OPERATIONS PERSONNEL SERVICES 0100 0014 0154 0. 240.98
120F AGENCY ACCOUNTING OPERATIONS PERSONNEL SERVICES 0100 0014 0155 0. 825.99
120F AGENCY ACCOUNTING OPERATIONS PERSONNEL SERVICES 0100 0014 0157 0. 97.02
120F AGENCY ACCOUNTING OPERATIONS PERSONNEL SERVICES 0100 0014 0158 0. 4,022.33
120F AGENCY ACCOUNTING OPERATIONS PERSONNEL SERVICES 0100 0014 0159 0. 14,413.12
120F AGENCY ACCOUNTING OPERATIONS PERSONNEL SERVICES 0100 0014 0161 0. 1,204.44
120F AGENCY ACCOUNTING OPERATIONS PERSONNEL SERVICES 0100 0013 0174 193,631.7 0.
0100 Total 1,552,707.02 372,375.08
120F AGENCY ACCOUNTING OPERATIONS PERSONNEL SERVICES 0200 0011 0111 378,577.67 92,597.88
120F AGENCY ACCOUNTING OPERATIONS PERSONNEL SERVICES 0200 0014 0141 0. 75.13
120F AGENCY ACCOUNTING OPERATIONS PERSONNEL SERVICES 0200 0014 0142 0. 14,948.29
120F AGENCY ACCOUNTING OPERATIONS PERSONNEL SERVICES 0200 0014 0147 91,616.4 0.
120F AGENCY ACCOUNTING OPERATIONS PERSONNEL SERVICES 0200 0014 0148 0. 4,244.75
120F AGENCY ACCOUNTING OPERATIONS PERSONNEL SERVICES 0200 0014 0152 0. 1,238.37
Page 21
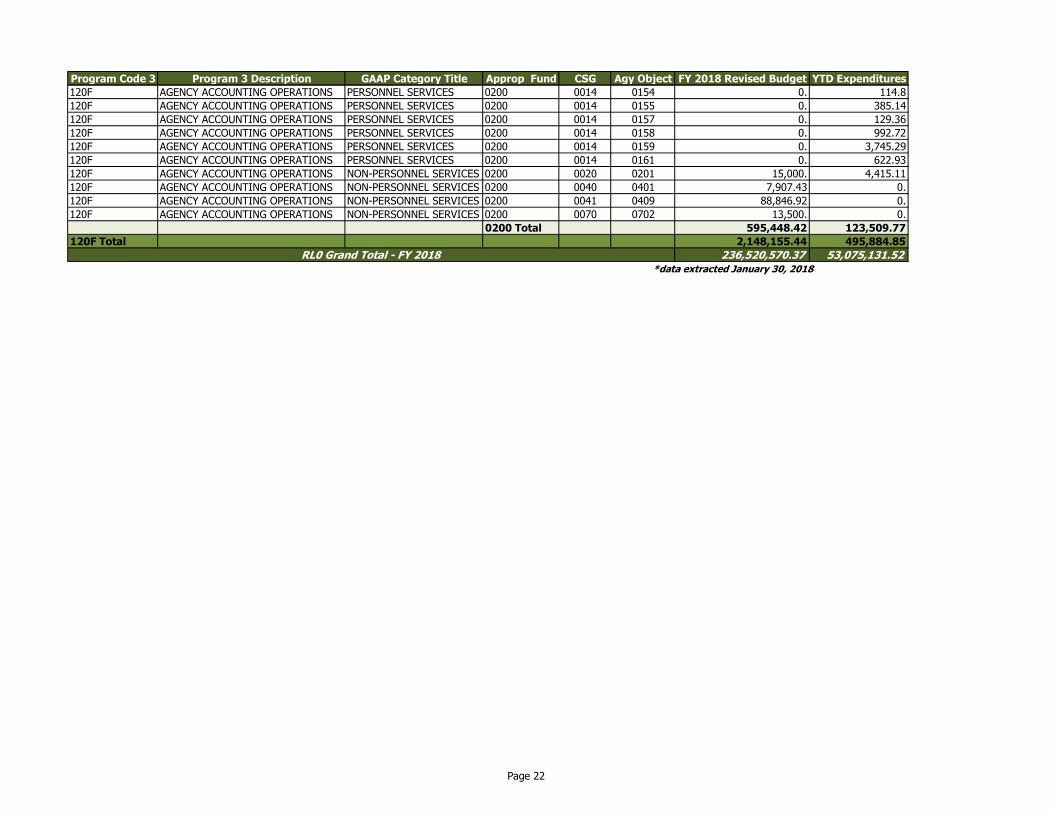
Program Code 3 Program 3 Description GAAP Category Title Approp Fund CSG Agy Object FY 2018 Revised Budget YTD Expenditures
120F AGENCY ACCOUNTING OPERATIONS PERSONNEL SERVICES 0200 0014 0154 0. 114.8
120F AGENCY ACCOUNTING OPERATIONS PERSONNEL SERVICES 0200 0014 0155 0. 385.14
120F AGENCY ACCOUNTING OPERATIONS PERSONNEL SERVICES 0200 0014 0157 0. 129.36
120F AGENCY ACCOUNTING OPERATIONS PERSONNEL SERVICES 0200 0014 0158 0. 992.72
120F AGENCY ACCOUNTING OPERATIONS PERSONNEL SERVICES 0200 0014 0159 0. 3,745.29
120F AGENCY ACCOUNTING OPERATIONS PERSONNEL SERVICES 0200 0014 0161 0. 622.93
120F AGENCY ACCOUNTING OPERATIONS NON-PERSONNEL SERVICES 0200 0020 0201 15,000. 4,415.11
120F AGENCY ACCOUNTING OPERATIONS NON-PERSONNEL SERVICES 0200 0040 0401 7,907.43 0.
120F AGENCY ACCOUNTING OPERATIONS NON-PERSONNEL SERVICES 0200 0041 0409 88,846.92 0.
120F AGENCY ACCOUNTING OPERATIONS NON-PERSONNEL SERVICES 0200 0070 0702 13,500. 0.
0200 Total 595,448.42 123,509.77
120F Total 2,148,155.44 495,884.85
236,520,570.37 53,075,131.52
*data extracted January 30, 2018
RL0 Grand Total - FY 2018
Page 22
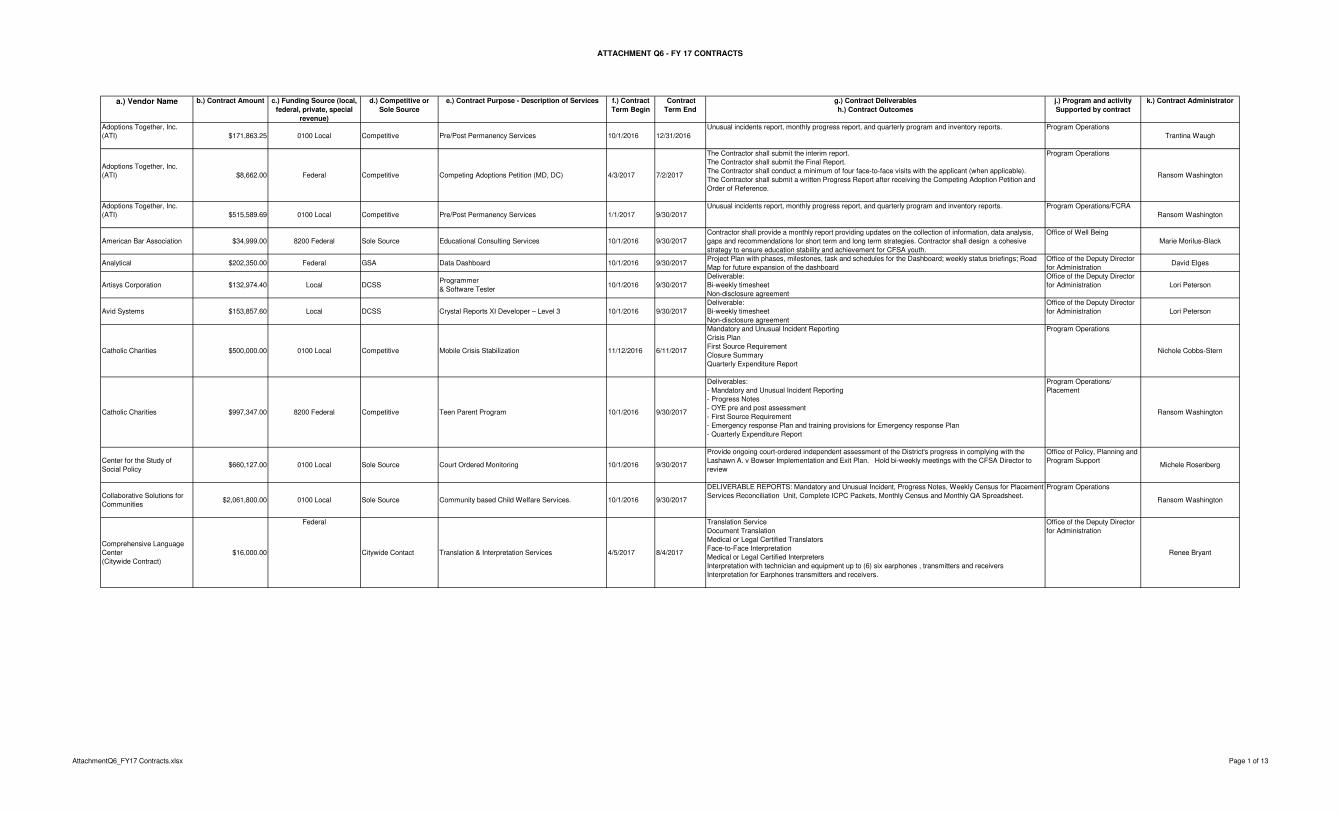
ATTACHMENT Q6 - FY 17 CONTRACTS
a.) Vendor Name b.) Contract Amount c.) Funding Source (local,
federal, private, special
revenue)
d.) Competitive or
Sole Source
e.) Contract Purpose - Description of Services f.) Contract
Term Begin
Contract
Term End
g.) Contract Deliverables
h.) Contract Outcomes
j.) Program and activity
Supported by contract
k.) Contract Administrator
Adoptions Together, Inc.
(ATI) $171,863.25 0100 Local Competitive Pre/Post Permanency Services 10/1/2016 12/31/2016
Unusual incidents report, monthly progress report, and quarterly program and inventory reports. Program Operations
Trantina Waugh
Adoptions Together, Inc.
(ATI) $8,662.00 Federal Competitive Competing Adoptions Petition (MD, DC) 4/3/2017 7/2/2017
The Contractor shall submit the interim report.
The Contractor shall submit the Final Report.
The Contractor shall conduct a minimum of four face-to-face visits with the applicant (when applicable).
The Contractor shall submit a written Progress Report after receiving the Competing Adoption Petition and
Order of Reference.
Program Operations
Ransom Washington
Adoptions Together, Inc.
(ATI) $515,589.69 0100 Local Competitive Pre/Post Permanency Services 1/1/2017 9/30/2017
Unusual incidents report, monthly progress report, and quarterly program and inventory reports. Program Operations/FCRA
Ransom Washington
American Bar Association $34,999.00 8200 Federal Sole Source Educational Consulting Services 10/1/2016 9/30/2017
Contractor shall provide a monthly report providing updates on the collection of information, data analysis,
gaps and recommendations for short term and long term strategies. Contractor shall design a cohesive
strategy to ensure education stability and achievement for CFSA youth.
Office of Well Being
Marie Morilus-Black
Analytical $202,350.00 Federal GSA Data Dashboard 10/1/2016 9/30/2017Project Plan with phases, milestones, task and schedules for the Dashboard; weekly status briefings; Road
Map for future expansion of the dashboard
Office of the Deputy Director
for AdministrationDavid Elges
Artisys Corporation $132,974.40 Local DCSSProgrammer
& Software Tester10/1/2016 9/30/2017
Deliverable:
Bi-weekly timesheet
Non-disclosure agreement
Office of the Deputy Director
for Administration Lori Peterson
Avid Systems $153,857.60 Local DCSS Crystal Reports XI Developer – Level 3 10/1/2016 9/30/2017
Deliverable:
Bi-weekly timesheet
Non-disclosure agreement
Office of the Deputy Director
for Administration Lori Peterson
Catholic Charities $500,000.00 0100 Local Competitive Mobile Crisis Stabilization 11/12/2016 6/11/2017
Mandatory and Unusual Incident Reporting
Crisis Plan
First Source Requirement
Closure Summary
Quarterly Expenditure Report
Program Operations
Nichole Cobbs-Stern
Catholic Charities $997,347.00 8200 Federal Competitive Teen Parent Program 10/1/2016 9/30/2017
Deliverables:
- Mandatory and Unusual Incident Reporting
- Progress Notes
- OYE pre and post assessment
- First Source Requirement
- Emergency response Plan and training provisions for Emergency response Plan
- Quarterly Expenditure Report
Program Operations/
Placement
Ransom Washington
Center for the Study of
Social Policy$660,127.00 0100 Local Sole Source Court Ordered Monitoring 10/1/2016 9/30/2017
Provide ongoing court-ordered independent assessment of the District's progress in complying with the
Lashawn A. v Bowser Implementation and Exit Plan. Hold bi-weekly meetings with the CFSA Director to
review
Office of Policy, Planning and
Program SupportMichele Rosenberg
Collaborative Solutions for
Communities$2,061,800.00 0100 Local Sole Source Community based Child Welfare Services. 10/1/2016 9/30/2017
DELIVERABLE REPORTS: Mandatory and Unusual Incident, Progress Notes, Weekly Census for Placement
Services Reconciliation Unit, Complete ICPC Packets, Monthly Census and Monthly QA Spreadsheet.
Program Operations
Ransom Washington
Comprehensive Language
Center
(Citywide Contract)
$16,000.00
Federal
Citywide Contact Translation & Interpretation Services 4/5/2017 8/4/2017
Translation Service
Document Translation
Medical or Legal Certified Translators
Face-to-Face Interpretation
Medical or Legal Certified Interpreters
Interpretation with technician and equipment up to (6) six earphones , transmitters and receivers
Interpretation for Earphones transmitters and receivers.
Office of the Deputy Director
for Administration
Renee Bryant
AttachmentQ6_FY17 Contracts.xlsx Page 1 of 13
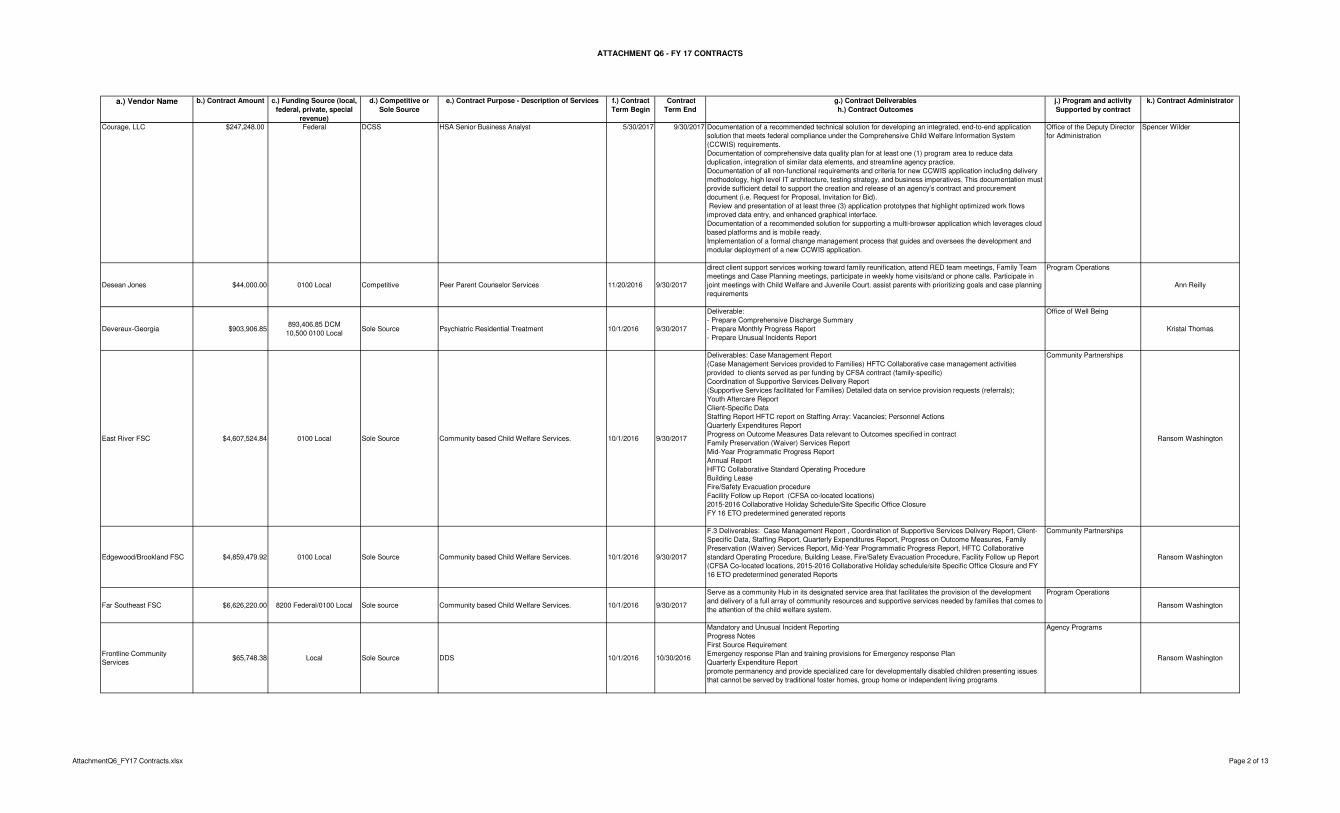
ATTACHMENT Q6 - FY 17 CONTRACTS
a.) Vendor Name b.) Contract Amount c.) Funding Source (local,
federal, private, special
revenue)
d.) Competitive or
Sole Source
e.) Contract Purpose - Description of Services f.) Contract
Term Begin
Contract
Term End
g.) Contract Deliverables
h.) Contract Outcomes
j.) Program and activity
Supported by contract
k.) Contract Administrator
Courage, LLC $247,248.00 Federal DCSS HSA Senior Business Analyst 5/30/2017 9/30/2017 Documentation of a recommended technical solution for developing an integrated, end-to-end application
solution that meets federal compliance under the Comprehensive Child Welfare Information System
(CCWIS) requirements.
Documentation of comprehensive data quality plan for at least one (1) program area to reduce data
duplication, integration of similar data elements, and streamline agency practice.
Documentation of all non-functional requirements and criteria for new CCWIS application including delivery
methodology, high level IT architecture, testing strategy, and business imperatives. This documentation must
provide sufficient detail to support the creation and release of an agency’s contract and procurement
document (i.e. Request for Proposal, Invitation for Bid).
Review and presentation of at least three (3) application prototypes that highlight optimized work flows
improved data entry, and enhanced graphical interface.
Documentation of a recommended solution for supporting a multi-browser application which leverages cloud
based platforms and is mobile ready.
Implementation of a formal change management process that guides and oversees the development and
modular deployment of a new CCWIS application.
Office of the Deputy Director
for Administration
Spencer Wilder
Desean Jones $44,000.00 0100 Local Competitive Peer Parent Counselor Services 11/20/2016 9/30/2017
direct client support services working toward family reunification, attend RED team meetings, Family Team
meetings and Case Planning meetings, participate in weekly home visits/and or phone calls. Participate in
joint meetings with Child Welfare and Juvenile Court. assist parents with prioritizing goals and case planning
requirements
Program Operations
Ann Reilly
Devereux-Georgia $903,906.85893,406.85 DCM
10,500 0100 LocalSole Source Psychiatric Residential Treatment 10/1/2016 9/30/2017
Deliverable:
- Prepare Comprehensive Discharge Summary
- Prepare Monthly Progress Report
- Prepare Unusual Incidents Report
Office of Well Being
Kristal Thomas
East River FSC $4,607,524.84 0100 Local Sole Source Community based Child Welfare Services. 10/1/2016 9/30/2017
Deliverables: Case Management Report
(Case Management Services provided to Families) HFTC Collaborative case management activities
provided to clients served as per funding by CFSA contract (family-specific)
Coordination of Supportive Services Delivery Report
(Supportive Services facilitated for Families) Detailed data on service provision requests (referrals);
Youth Aftercare Report
Client-Specific Data
Staffing Report HFTC report on Staffing Array: Vacancies; Personnel Actions
Quarterly Expenditures Report
Progress on Outcome Measures Data relevant to Outcomes specified in contract
Family Preservation (Waiver) Services Report
Mid-Year Programmatic Progress Report
Annual Report
HFTC Collaborative Standard Operating Procedure
Building Lease
Fire/Safety Evacuation procedure
Facility Follow up Report (CFSA co-located locations)
2015-2016 Collaborative Holiday Schedule/Site Specific Office Closure
FY 16 ETO predetermined generated reports
Community Partnerships
Ransom Washington
Edgewood/Brookland FSC $4,859,479.92 0100 Local Sole Source Community based Child Welfare Services. 10/1/2016 9/30/2017
F.3 Deliverables: Case Management Report , Coordination of Supportive Services Delivery Report, Client-
Specific Data, Staffing Report, Quarterly Expenditures Report, Progress on Outcome Measures, Family
Preservation (Waiver) Services Report, Mid-Year Programmatic Progress Report, HFTC Collaborative
standard Operating Procedure, Building Lease, Fire/Safety Evacuation Procedure, Facility Follow up Report
(CFSA Co-located locations, 2015-2016 Collaborative Holiday schedule/site Specific Office Closure and FY
16 ETO predetermined generated Reports
Community Partnerships
Ransom Washington
Far Southeast FSC $6,626,220.00 8200 Federal/0100 Local Sole source Community based Child Welfare Services. 10/1/2016 9/30/2017
Serve as a community Hub in its designated service area that facilitates the provision of the development
and delivery of a full array of community resources and supportive services needed by families that comes to
the attention of the child welfare system.
Program Operations
Ransom Washington
Frontline Community
Services$65,748.38 Local Sole Source DDS 10/1/2016 10/30/2016
Mandatory and Unusual Incident Reporting
Progress Notes
First Source Requirement
Emergency response Plan and training provisions for Emergency response Plan
Quarterly Expenditure Report
promote permanency and provide specialized care for developmentally disabled children presenting issues
that cannot be served by traditional foster homes, group home or independent living programs
Agency Programs
Ransom Washington
AttachmentQ6_FY17 Contracts.xlsx Page 2 of 13
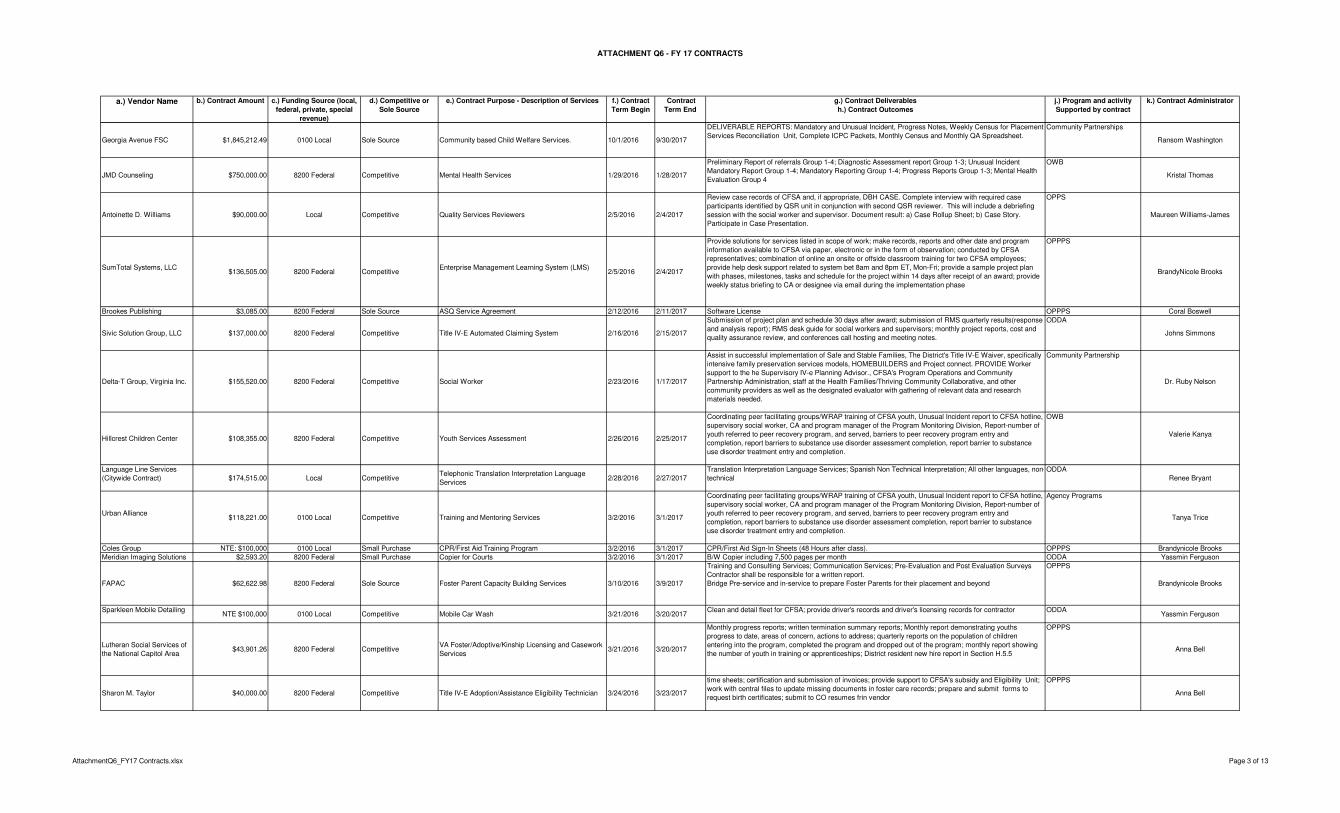
ATTACHMENT Q6 - FY 17 CONTRACTS
a.) Vendor Name b.) Contract Amount c.) Funding Source (local,
federal, private, special
revenue)
d.) Competitive or
Sole Source
e.) Contract Purpose - Description of Services f.) Contract
Term Begin
Contract
Term End
g.) Contract Deliverables
h.) Contract Outcomes
j.) Program and activity
Supported by contract
k.) Contract Administrator
Georgia Avenue FSC $1,845,212.49 0100 Local Sole Source Community based Child Welfare Services. 10/1/2016 9/30/2017
DELIVERABLE REPORTS: Mandatory and Unusual Incident, Progress Notes, Weekly Census for Placement
Services Reconciliation Unit, Complete ICPC Packets, Monthly Census and Monthly QA Spreadsheet.
Community Partnerships
Ransom Washington
JMD Counseling $750,000.00 8200 Federal Competitive Mental Health Services 1/29/2016 1/28/2017
Preliminary Report of referrals Group 1-4; Diagnostic Assessment report Group 1-3; Unusual Incident
Mandatory Report Group 1-4; Mandatory Reporting Group 1-4; Progress Reports Group 1-3; Mental Health
Evaluation Group 4
OWB
Kristal Thomas
Antoinette D. Williams $90,000.00 Local Competitive Quality Services Reviewers 2/5/2016 2/4/2017
Review case records of CFSA and, if appropriate, DBH CASE. Complete interview with required case
participants identified by QSR unit in conjunction with second QSR reviewer. This will include a debriefing
session with the social worker and supervisor. Document result: a) Case Rollup Sheet; b) Case Story.
Participate in Case Presentation.
OPPS
Maureen Williams-James
SumTotal Systems, LLC$136,505.00 8200 Federal Competitive
Enterprise Management Learning System (LMS)2/5/2016 2/4/2017
Provide solutions for services listed in scope of work; make records, reports and other date and program
information available to CFSA via paper, electronic or in the form of observation; conducted by CFSA
representatives; combination of online an onsite or offside classroom training for two CFSA employees;
provide help desk support related to system bet 8am and 8pm ET, Mon-Fri; provide a sample project plan
with phases, milestones, tasks and schedule for the project within 14 days after receipt of an award; provide
weekly status briefing to CA or designee via email during the implementation phase
OPPPS
BrandyNicole Brooks
Brookes Publishing $3,085.00 8200 Federal Sole Source ASQ Service Agreement 2/12/2016 2/11/2017 Software License OPPPS Coral Boswell
Sivic Solution Group, LLC $137,000.00 8200 Federal Competitive Title IV-E Automated Claiming System 2/16/2016 2/15/2017
Submission of project plan and schedule 30 days after award; submission of RMS quarterly results(response
and analysis report); RMS desk guide for social workers and supervisors; monthly project reports, cost and
quality assurance review, and conferences call hosting and meeting notes.
ODDA
Johns Simmons
Delta-T Group, Virginia Inc. $155,520.00 8200 Federal Competitive Social Worker 2/23/2016 1/17/2017
Assist in successful implementation of Safe and Stable Families, The District's Title IV-E Waiver, specifically
intensive family preservation services models, HOMEBUILDERS and Project connect. PROVIDE Worker
support to the he Supervisory IV-e Planning Advisor., CFSA's Program Operations and Community
Partnership Administration, staff at the Health Families/Thriving Community Collaborative, and other
community providers as well as the designated evaluator with gathering of relevant data and research
materials needed.
Community Partnership
Dr. Ruby Nelson
Hillcrest Children Center $108,355.00 8200 Federal Competitive Youth Services Assessment 2/26/2016 2/25/2017
Coordinating peer facilitating groups/WRAP training of CFSA youth, Unusual Incident report to CFSA hotline,
supervisory social worker, CA and program manager of the Program Monitoring Division, Report-number of
youth referred to peer recovery program, and served, barriers to peer recovery program entry and
completion, report barriers to substance use disorder assessment completion, report barrier to substance
use disorder treatment entry and completion.
OWB
Valerie Kanya
Language Line Services
(Citywide Contract) $174,515.00 Local CompetitiveTelephonic Translation Interpretation Language
Services2/28/2016 2/27/2017
Translation Interpretation Language Services; Spanish Non Technical Interpretation; All other languages, non-
technical
ODDA
Renee Bryant
Urban Alliance $118,221.00 0100 Local Competitive Training and Mentoring Services 3/2/2016 3/1/2017
Coordinating peer facilitating groups/WRAP training of CFSA youth, Unusual Incident report to CFSA hotline,
supervisory social worker, CA and program manager of the Program Monitoring Division, Report-number of
youth referred to peer recovery program, and served, barriers to peer recovery program entry and
completion, report barriers to substance use disorder assessment completion, report barrier to substance
use disorder treatment entry and completion.
Agency Programs
Tanya Trice
Coles Group NTE: $100,000 0100 Local Small Purchase CPR/First Aid Training Program 3/2/2016 3/1/2017 CPR/First Aid Sign-In Sheets (48 Hours after class). OPPPS Brandynicole Brooks
Meridian Imaging Solutions $2,593.20 8200 Federal Small Purchase Copier for Courts 3/2/2016 3/1/2017 B/W Copier including 7,500 pages per month ODDA Yassmin Ferguson
FAPAC $62,622.98 8200 Federal Sole Source Foster Parent Capacity Building Services 3/10/2016 3/9/2017
Training and Consulting Services; Communication Services; Pre-Evaluation and Post Evaluation Surveys
Contractor shall be responsible for a written report.
Bridge Pre-service and in-service to prepare Foster Parents for their placement and beyond
OPPPS
Brandynicole Brooks
Sparkleen Mobile DetailingNTE $100,000 0100 Local Competitive Mobile Car Wash 3/21/2016 3/20/2017
Clean and detail fleet for CFSA; provide driver's records and driver's licensing records for contractor ODDAYassmin Ferguson
Lutheran Social Services of
the National Capitol Area$43,901.26 8200 Federal Competitive
VA Foster/Adoptive/Kinship Licensing and Casework
Services3/21/2016 3/20/2017
Monthly progress reports; written termination summary reports; Monthly report demonstrating youths
progress to date, areas of concern, actions to address; quarterly reports on the population of children
entering into the program, completed the program and dropped out of the program; monthly report showing
the number of youth in training or apprenticeships; District resident new hire report in Section H.5.5
OPPPS
Anna Bell
Sharon M. Taylor $40,000.00 8200 Federal Competitive Title IV-E Adoption/Assistance Eligibility Technician 3/24/2016 3/23/2017
time sheets; certification and submission of invoices; provide support to CFSA's subsidy and Eligibility Unit;
work with central files to update missing documents in foster care records; prepare and submit forms to
request birth certificates; submit to CO resumes frin vendor
OPPPS
Anna Bell
AttachmentQ6_FY17 Contracts.xlsx Page 3 of 13
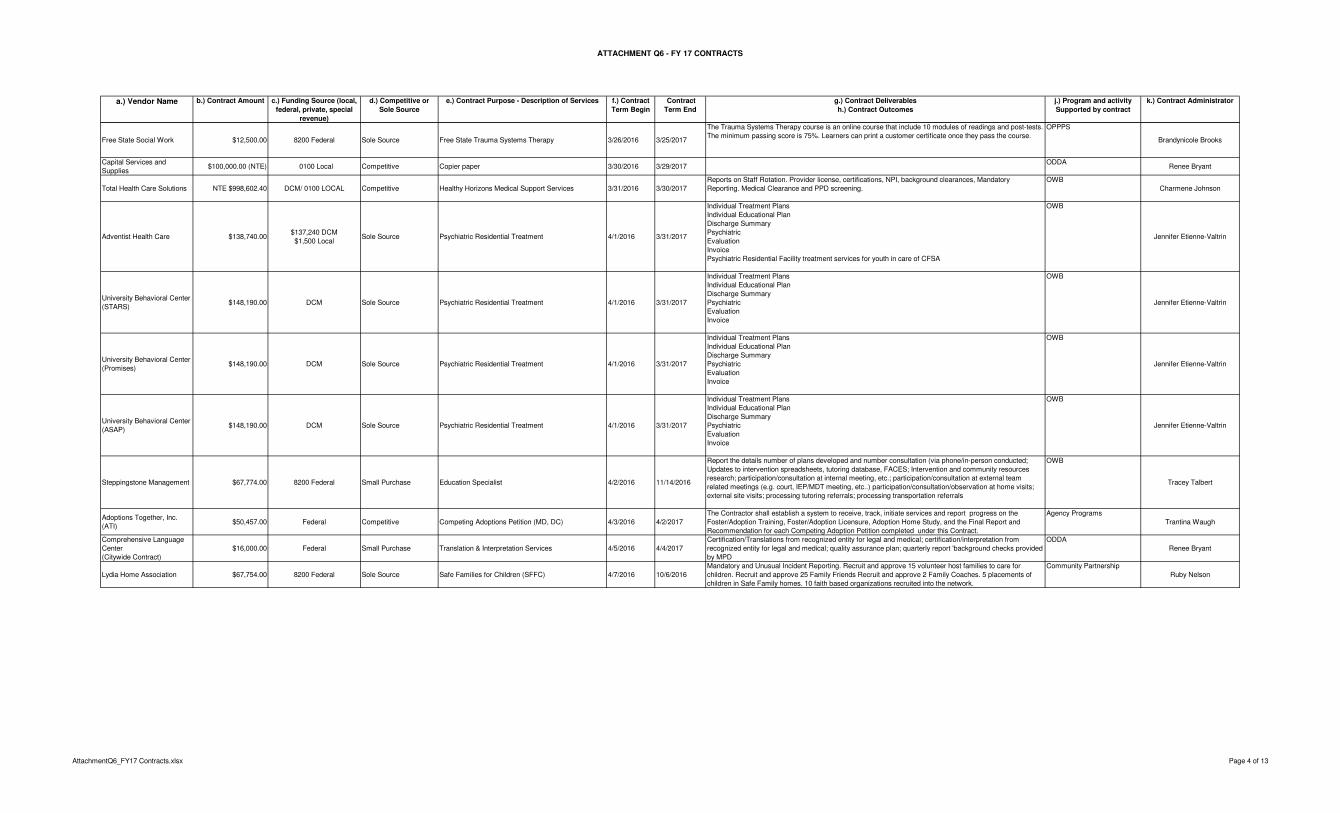
ATTACHMENT Q6 - FY 17 CONTRACTS
a.) Vendor Name b.) Contract Amount c.) Funding Source (local,
federal, private, special
revenue)
d.) Competitive or
Sole Source
e.) Contract Purpose - Description of Services f.) Contract
Term Begin
Contract
Term End
g.) Contract Deliverables
h.) Contract Outcomes
j.) Program and activity
Supported by contract
k.) Contract Administrator
Free State Social Work $12,500.00 8200 Federal Sole Source Free State Trauma Systems Therapy 3/26/2016 3/25/2017
The Trauma Systems Therapy course is an online course that include 10 modules of readings and post-tests.
The minimum passing score is 75%. Learners can print a customer certificate once they pass the course.
OPPPS
Brandynicole Brooks
Capital Services and
Supplies$100,000.00 (NTE) 0100 Local Competitive Copier paper 3/30/2016 3/29/2017
ODDARenee Bryant
Total Health Care Solutions NTE $998,602.40 DCM/ 0100 LOCAL Competitive Healthy Horizons Medical Support Services 3/31/2016 3/30/2017
Reports on Staff Rotation. Provider license, certifications, NPI, background clearances, Mandatory
Reporting. Medical Clearance and PPD screening.
OWB
Charmene Johnson
Adventist Health Care $138,740.00$137,240 DCM
$1,500 LocalSole Source Psychiatric Residential Treatment 4/1/2016 3/31/2017
Individual Treatment Plans
Individual Educational Plan
Discharge Summary
Psychiatric
Evaluation
Invoice
Psychiatric Residential Facility treatment services for youth in care of CFSA
OWB
Jennifer Etienne-Valtrin
University Behavioral Center
(STARS)$148,190.00 DCM Sole Source Psychiatric Residential Treatment 4/1/2016 3/31/2017
Individual Treatment Plans
Individual Educational Plan
Discharge Summary
Psychiatric
Evaluation
Invoice
OWB
Jennifer Etienne-Valtrin
University Behavioral Center
(Promises)$148,190.00 DCM Sole Source Psychiatric Residential Treatment 4/1/2016 3/31/2017
Individual Treatment Plans
Individual Educational Plan
Discharge Summary
Psychiatric
Evaluation
Invoice
OWB
Jennifer Etienne-Valtrin
University Behavioral Center
(ASAP)$148,190.00 DCM Sole Source Psychiatric Residential Treatment 4/1/2016 3/31/2017
Individual Treatment Plans
Individual Educational Plan
Discharge Summary
Psychiatric
Evaluation
Invoice
OWB
Jennifer Etienne-Valtrin
Steppingstone Management $67,774.00 8200 Federal Small Purchase Education Specialist 4/2/2016 11/14/2016
Report the details number of plans developed and number consultation (via phone/in-person conducted;
Updates to intervention spreadsheets, tutoring database, FACES; Intervention and community resources
research; participation/consultation at internal meeting, etc.; participation/consultation at external team
related meetings (e.g. court, IEP/MDT meeting, etc..) participation/consultation/observation at home visits;
external site visits; processing tutoring referrals; processing transportation referrals
OWB
Tracey Talbert
Adoptions Together, Inc.
(ATI)$50,457.00 Federal Competitive Competing Adoptions Petition (MD, DC) 4/3/2016 4/2/2017
The Contractor shall establish a system to receive, track, initiate services and report progress on the
Foster/Adoption Training, Foster/Adoption Licensure, Adoption Home Study, and the Final Report and
Recommendation for each Competing Adoption Petition completed under this Contract.
Agency Programs
Trantina Waugh
Comprehensive Language
Center
(Citywide Contract)
$16,000.00 Federal Small Purchase Translation & Interpretation Services 4/5/2016 4/4/2017
Certification/Translations from recognized entity for legal and medical; certification/interpretation from
recognized entity for legal and medical; quality assurance plan; quarterly report 'background checks provided
by MPD
ODDA
Renee Bryant
Lydia Home Association $67,754.00 8200 Federal Sole Source Safe Families for Children (SFFC) 4/7/2016 10/6/2016
Mandatory and Unusual Incident Reporting. Recruit and approve 15 volunteer host families to care for
children. Recruit and approve 25 Family Friends Recruit and approve 2 Family Coaches. 5 placements of
children in Safe Family homes. 10 faith based organizations recruited into the network.
Community Partnership
Ruby Nelson
AttachmentQ6_FY17 Contracts.xlsx Page 4 of 13
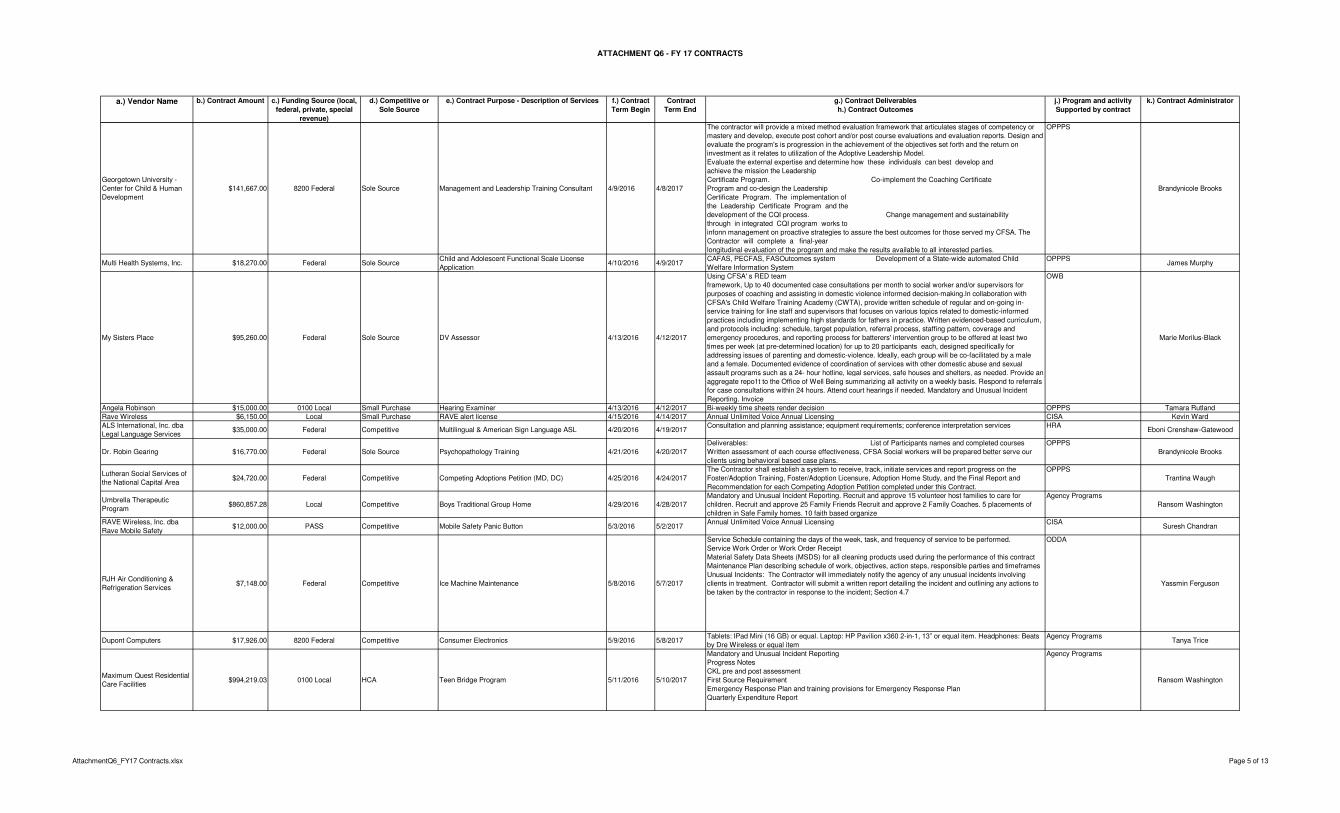
ATTACHMENT Q6 - FY 17 CONTRACTS
a.) Vendor Name b.) Contract Amount c.) Funding Source (local,
federal, private, special
revenue)
d.) Competitive or
Sole Source
e.) Contract Purpose - Description of Services f.) Contract
Term Begin
Contract
Term End
g.) Contract Deliverables
h.) Contract Outcomes
j.) Program and activity
Supported by contract
k.) Contract Administrator
Georgetown University -
Center for Child & Human
Development
$141,667.00 8200 Federal Sole Source Management and Leadership Training Consultant 4/9/2016 4/8/2017
The contractor will provide a mixed method evaluation framework that articulates stages of competency or
mastery and develop, execute post cohort and/or post course evaluations and evaluation reports. Design and
evaluate the program's is progression in the achievement of the objectives set forth and the return on
investment as it relates to utilization of the Adoptive Leadership Model.
Evaluate the external expertise and determine how these individuals can best develop and
achieve the mission the Leadership
Certificate Program. Co-implement the Coaching Certificate
Program and co-design the Leadership
Certificate Program. The implementation of
the Leadership Certificate Program and the
development of the CQI process. Change management and sustainability
through in integrated CQI program works to
infonn management on proactive strategies to assure the best outcomes for those served my CFSA. The
Contractor will complete a final-year
longitudinal evaluation of the program and make the results available to all interested parties.
OPPPS
Brandynicole Brooks
Multi Health Systems, Inc. $18,270.00 Federal Sole SourceChild and Adolescent Functional Scale License
Application4/10/2016 4/9/2017
CAFAS, PECFAS, FASOutcomes system Development of a State-wide automated Child
Welfare Information System
OPPPSJames Murphy
My Sisters Place $95,260.00 Federal Sole Source DV Assessor 4/13/2016 4/12/2017
Using CFSA' s RED team
framework, Up to 40 documented case consultations per month to social worker and/or supervisors for
purposes of coaching and assisting in domestic violence informed decision-making.ln collaboration with
CFSA's Child Welfare Training Academy (CWTA), provide written schedule of regular and on-going in-
service training for line staff and supervisors that focuses on various topics related to domestic-informed
practices including implementing high standards for fathers in practice. Written evidenced-based curriculum,
and protocols including: schedule, target population, referral process, staffing pattern, coverage and
emergency procedures, and reporting process for batterers' intervention group to be offered at least two
times per week (at pre-determined location) for up to 20 participants each, designed specifically for
addressing issues of parenting and domestic-violence. Ideally, each group will be co-facilitated by a male
and a female. Documented evidence of coordination of services with other domestic abuse and sexual
assault programs such as a 24- hour hotline, legal services, safe houses and shelters, as needed. Provide an
aggregate repo1t to the Office of Well Being summarizing all activity on a weekly basis. Respond to referrals
for case consultations within 24 hours. Attend court hearings if needed. Mandatory and Unusual Incident
Reporting. Invoice
OWB
Marie Morilus-Black
Angela Robinson $15,000.00 0100 Local Small Purchase Hearing Examiner 4/13/2016 4/12/2017 Bi-weekly time sheets render decision OPPPS Tamara Rutland
Rave Wireless $6,150.00 Local Small Purchase RAVE alert license 4/15/2016 4/14/2017 Annual Unlimited Voice Annual Licensing CISA Kevin Ward
ALS International, Inc. dba
Legal Language Services$35,000.00 Federal Competitive Multilingual & American Sign Language ASL 4/20/2016 4/19/2017
Consultation and planning assistance; equipment requirements; conference interpretation services HRAEboni Crenshaw-Gatewood
Dr. Robin Gearing $16,770.00 Federal Sole Source Psychopathology Training 4/21/2016 4/20/2017
Deliverables: List of Participants names and completed courses
Written assessment of each course effectiveness, CFSA Social workers will be prepared better serve our
clients using behavioral based case plans.
OPPPS
Brandynicole Brooks
Lutheran Social Services of
the National Capital Area$24,720.00 Federal Competitive Competing Adoptions Petition (MD, DC) 4/25/2016 4/24/2017
The Contractor shall establish a system to receive, track, initiate services and report progress on the
Foster/Adoption Training, Foster/Adoption Licensure, Adoption Home Study, and the Final Report and
Recommendation for each Competing Adoption Petition completed under this Contract.
OPPPS
Trantina Waugh
Umbrella Therapeutic
Program$860,857.28 Local Competitive Boys Traditional Group Home 4/29/2016 4/28/2017
Mandatory and Unusual Incident Reporting. Recruit and approve 15 volunteer host families to care for
children. Recruit and approve 25 Family Friends Recruit and approve 2 Family Coaches. 5 placements of
children in Safe Family homes. 10 faith based organize
Agency Programs
Ransom Washington
RAVE Wireless, Inc. dba
Rave Mobile Safety$12,000.00 PASS Competitive Mobile Safety Panic Button 5/3/2016 5/2/2017
Annual Unlimited Voice Annual Licensing CISASuresh Chandran
RJH Air Conditioning &
Refrigeration Services$7,148.00 Federal Competitive Ice Machine Maintenance 5/8/2016 5/7/2017
Service Schedule containing the days of the week, task, and frequency of service to be performed.
Service Work Order or Work Order Receipt
Material Safety Data Sheets (MSDS) for all cleaning products used during the performance of this contract
Maintenance Plan describing schedule of work, objectives, action steps, responsible parties and timeframes
Unusual Incidents: The Contractor will immediately notify the agency of any unusual incidents involving
clients in treatment. Contractor will submit a written report detailing the incident and outlining any actions to
be taken by the contractor in response to the incident; Section 4.7
ODDA
Yassmin Ferguson
Dupont Computers $17,926.00 8200 Federal Competitive Consumer Electronics 5/9/2016 5/8/2017Tablets: IPad Mini (16 GB) or equal. Laptop: HP Pavilion x360 2-in-1, 13” or equal item. Headphones: Beats
by Dre Wireless or equal item
Agency ProgramsTanya Trice
Maximum Quest Residential
Care Facilities$994,219.03 0100 Local HCA Teen Bridge Program 5/11/2016 5/10/2017
Mandatory and Unusual Incident Reporting
Progress Notes
CKL pre and post assessment
First Source Requirement
Emergency Response Plan and training provisions for Emergency Response Plan
Quarterly Expenditure Report
Agency Programs
Ransom Washington
AttachmentQ6_FY17 Contracts.xlsx Page 5 of 13
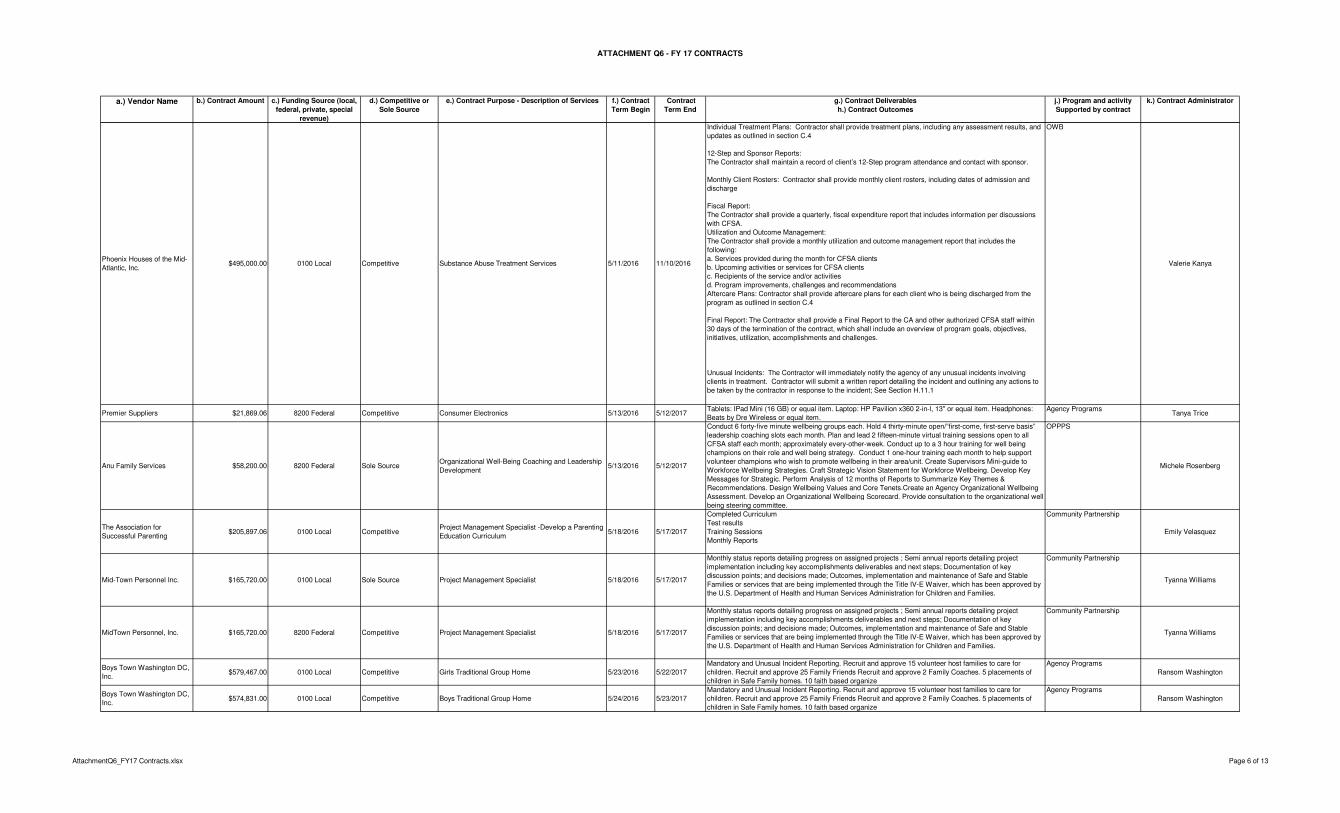
ATTACHMENT Q6 - FY 17 CONTRACTS
a.) Vendor Name b.) Contract Amount c.) Funding Source (local,
federal, private, special
revenue)
d.) Competitive or
Sole Source
e.) Contract Purpose - Description of Services f.) Contract
Term Begin
Contract
Term End
g.) Contract Deliverables
h.) Contract Outcomes
j.) Program and activity
Supported by contract
k.) Contract Administrator
Phoenix Houses of the Mid-
Atlantic, Inc.$495,000.00 0100 Local Competitive Substance Abuse Treatment Services 5/11/2016 11/10/2016
Individual Treatment Plans: Contractor shall provide treatment plans, including any assessment results, and
updates as outlined in section C.4
12-Step and Sponsor Reports:
The Contractor shall maintain a record of client’s 12-Step program attendance and contact with sponsor.
Monthly Client Rosters: Contractor shall provide monthly client rosters, including dates of admission and
discharge
Fiscal Report:
The Contractor shall provide a quarterly, fiscal expenditure report that includes information per discussions
with CFSA.
Utilization and Outcome Management:
The Contractor shall provide a monthly utilization and outcome management report that includes the
following:
a. Services provided during the month for CFSA clients
b. Upcoming activities or services for CFSA clients
c. Recipients of the service and/or activities
d. Program improvements, challenges and recommendations
Aftercare Plans: Contractor shall provide aftercare plans for each client who is being discharged from the
program as outlined in section C.4
Final Report: The Contractor shall provide a Final Report to the CA and other authorized CFSA staff within
30 days of the termination of the contract, which shall include an overview of program goals, objectives,
initiatives, utilization, accomplishments and challenges.
Unusual Incidents: The Contractor will immediately notify the agency of any unusual incidents involving
clients in treatment. Contractor will submit a written report detailing the incident and outlining any actions to
be taken by the contractor in response to the incident; See Section H.11.1
Transitional Housing. Within the first 30 days of treatment, the Contractor shall begin working with the client
OWB
Valerie Kanya
Premier Suppliers $21,869.06 8200 Federal Competitive Consumer Electronics 5/13/2016 5/12/2017Tablets: IPad Mini (16 GB) or equal item. Laptop: HP Pavilion x360 2-in-l, 13" or equal item. Headphones:
Beats by Dre Wireless or equal item.
Agency ProgramsTanya Trice
Anu Family Services $58,200.00 8200 Federal Sole SourceOrganizational Well-Being Coaching and Leadership
Development5/13/2016 5/12/2017
Conduct 6 forty-five minute wellbeing groups each. Hold 4 thirty-minute open/”first-come, first-serve basis”
leadership coaching slots each month. Plan and lead 2 fifteen-minute virtual training sessions open to all
CFSA staff each month; approximately every-other-week. Conduct up to a 3 hour training for well being
champions on their role and well being strategy. Conduct 1 one-hour training each month to help support
volunteer champions who wish to promote wellbeing in their area/unit. Create Supervisors Mini-guide to
Workforce Wellbeing Strategies. Craft Strategic Vision Statement for Workforce Wellbeing. Develop Key
Messages for Strategic. Perform Analysis of 12 months of Reports to Summarize Key Themes &
Recommendations. Design Wellbeing Values and Core Tenets.Create an Agency Organizational Wellbeing
Assessment. Develop an Organizational Wellbeing Scorecard. Provide consultation to the organizational well
being steering committee.
OPPPS
Michele Rosenberg
The Association for
Successful Parenting$205,897.06 0100 Local Competitive
Project Management Specialist -Develop a Parenting
Education Curriculum5/18/2016 5/17/2017
Completed Curriculum
Test results
Training Sessions
Monthly Reports
Community Partnership
Emily Velasquez
Mid-Town Personnel Inc. $165,720.00 0100 Local Sole Source Project Management Specialist 5/18/2016 5/17/2017
Monthly status reports detailing progress on assigned projects ; Semi annual reports detailing project
implementation including key accomplishments deliverables and next steps; Documentation of key
discussion points; and decisions made; Outcomes, implementation and maintenance of Safe and Stable
Families or services that are being implemented through the Title IV-E Waiver, which has been approved by
the U.S. Department of Health and Human Services Administration for Children and Families.
Community Partnership
Tyanna Williams
MidTown Personnel, Inc. $165,720.00 8200 Federal Competitive Project Management Specialist 5/18/2016 5/17/2017
Monthly status reports detailing progress on assigned projects ; Semi annual reports detailing project
implementation including key accomplishments deliverables and next steps; Documentation of key
discussion points; and decisions made; Outcomes, implementation and maintenance of Safe and Stable
Families or services that are being implemented through the Title IV-E Waiver, which has been approved by
the U.S. Department of Health and Human Services Administration for Children and Families.
Community Partnership
Tyanna Williams
Boys Town Washington DC,
Inc.$579,467.00 0100 Local Competitive Girls Traditional Group Home 5/23/2016 5/22/2017
Mandatory and Unusual Incident Reporting. Recruit and approve 15 volunteer host families to care for
children. Recruit and approve 25 Family Friends Recruit and approve 2 Family Coaches. 5 placements of
children in Safe Family homes. 10 faith based organize
Agency Programs
Ransom Washington
Boys Town Washington DC,
Inc.$574,831.00 0100 Local Competitive Boys Traditional Group Home 5/24/2016 5/23/2017
Mandatory and Unusual Incident Reporting. Recruit and approve 15 volunteer host families to care for
children. Recruit and approve 25 Family Friends Recruit and approve 2 Family Coaches. 5 placements of
children in Safe Family homes. 10 faith based organize
Agency Programs
Ransom Washington
AttachmentQ6_FY17 Contracts.xlsx Page 6 of 13
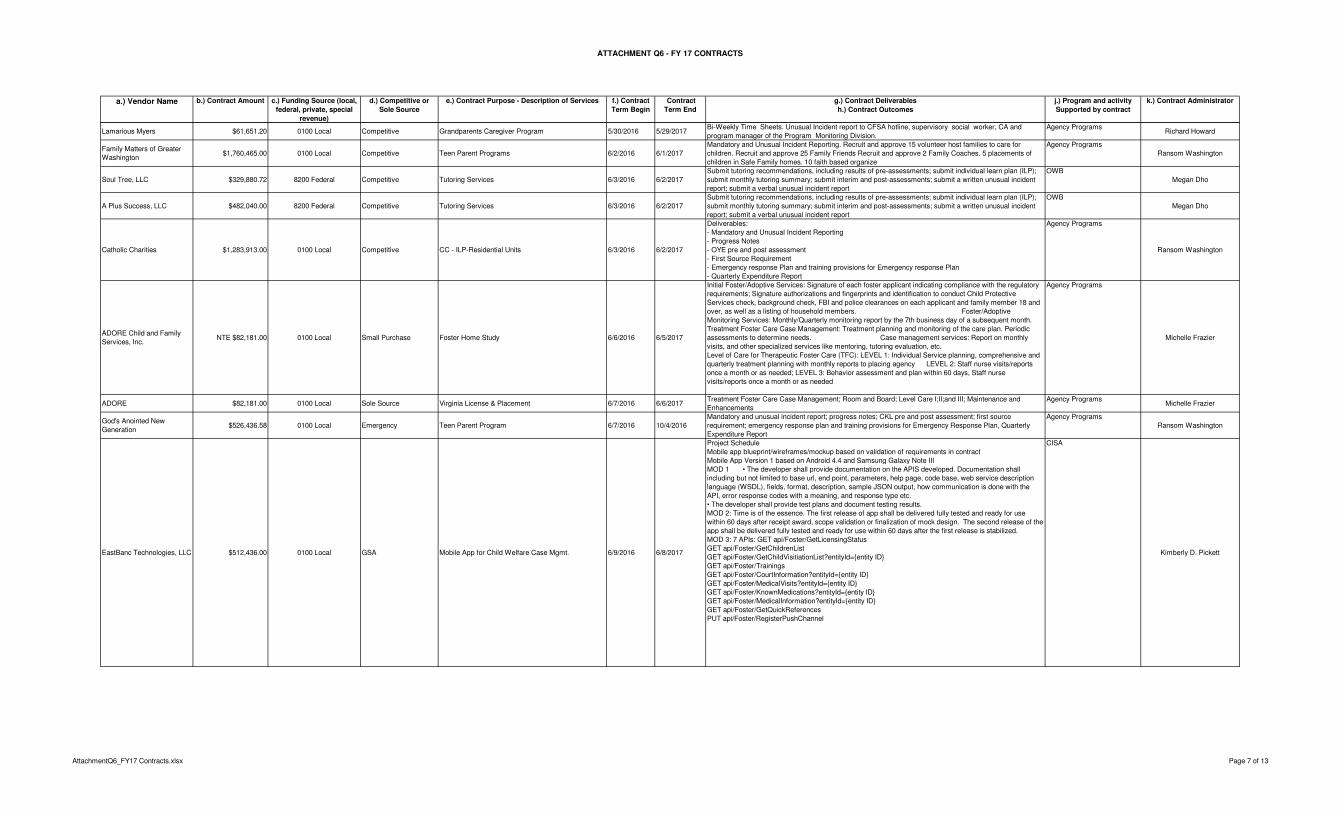
ATTACHMENT Q6 - FY 17 CONTRACTS
a.) Vendor Name b.) Contract Amount c.) Funding Source (local,
federal, private, special
revenue)
d.) Competitive or
Sole Source
e.) Contract Purpose - Description of Services f.) Contract
Term Begin
Contract
Term End
g.) Contract Deliverables
h.) Contract Outcomes
j.) Program and activity
Supported by contract
k.) Contract Administrator
Lamarious Myers $61,651.20 0100 Local Competitive Grandparents Caregiver Program 5/30/2016 5/29/2017Bi-Weekly Time Sheets. Unusual Incident report to CFSA hotline, supervisory social worker, CA and
program manager of the Program Monitoring Division.
Agency ProgramsRichard Howard
Family Matters of Greater
Washington$1,760,465.00 0100 Local Competitive Teen Parent Programs 6/2/2016 6/1/2017
Mandatory and Unusual Incident Reporting. Recruit and approve 15 volunteer host families to care for
children. Recruit and approve 25 Family Friends Recruit and approve 2 Family Coaches. 5 placements of
children in Safe Family homes. 10 faith based organize
Agency Programs
Ransom Washington
Soul Tree, LLC $329,880.72 8200 Federal Competitive Tutoring Services 6/3/2016 6/2/2017
Submit tutoring recommendations, including results of pre-assessments; submit individual learn plan (ILP);
submit monthly tutoring summary; submit interim and post-assessments; submit a written unusual incident
report; submit a verbal unusual incident report
OWB
Megan Dho
A Plus Success, LLC $482,040.00 8200 Federal Competitive Tutoring Services 6/3/2016 6/2/2017
Submit tutoring recommendations, including results of pre-assessments; submit individual learn plan (ILP);
submit monthly tutoring summary; submit interim and post-assessments; submit a written unusual incident
report; submit a verbal unusual incident report
OWB
Megan Dho
Catholic Charities $1,283,913.00 0100 Local Competitive CC - ILP-Residential Units 6/3/2016 6/2/2017
Deliverables:
- Mandatory and Unusual Incident Reporting
- Progress Notes
- OYE pre and post assessment
- First Source Requirement
- Emergency response Plan and training provisions for Emergency response Plan
- Quarterly Expenditure Report
Agency Programs
Ransom Washington
ADORE Child and Family
Services, Inc.NTE $82,181.00 0100 Local Small Purchase Foster Home Study 6/6/2016 6/5/2017
Initial Foster/Adoptive Services: Signature of each foster applicant indicating compliance with the regulatory
requirements; Signature authorizations and fingerprints and identification to conduct Child Protective
Services check, background check, FBI and police clearances on each applicant and family member 18 and
over, as well as a listing of household members. Foster/Adoptive
Monitoring Services: Monthly/Quarterly monitoring report by the 7th business day of a subsequent month.
Treatment Foster Care Case Management: Treatment planning and monitoring of the care plan. Periodic
assessments to determine needs. Case management services: Report on monthly
visits, and other specialized services like mentoring, tutoring evaluation, etc.
Level of Care for Therapeutic Foster Care (TFC): LEVEL 1: Individual Service planning, comprehensive and
quarterly treatment planning with monthly reports to placing agency LEVEL 2: Staff nurse visits/reports
once a month or as needed; LEVEL 3: Behavior assessment and plan within 60 days, Staff nurse
visits/reports once a month or as needed
Agency Programs
Michelle Frazier
ADORE $82,181.00 0100 Local Sole Source Virginia License & Placement 6/7/2016 6/6/2017Treatment Foster Care Case Management; Room and Board; Level Care I;II;and III; Maintenance and
Enhancements
Agency ProgramsMichelle Frazier
God's Anointed New
Generation$526,436.58 0100 Local Emergency Teen Parent Program 6/7/2016 10/4/2016
Mandatory and unusual incident report; progress notes; CKL pre and post assessment; first source
requirement; emergency response plan and training provisions for Emergency Response Plan, Quarterly
Expenditure Report
Agency Programs
Ransom Washington
EastBanc Technologies, LLC $512,436.00 0100 Local GSA Mobile App for Child Welfare Case Mgmt. 6/9/2016 6/8/2017
Project Schedule
Mobile app blueprint/wireframes/mockup based on validation of requirements in contract
Mobile App Version 1 based on Android 4.4 and Samsung Galaxy Note III
MOD 1 • The developer shall provide documentation on the APIS developed. Documentation shall
including but not limited to base url, end point, parameters, help page, code base, web service description
language (WSDL), fields, format, description, sample JSON output, how communication is done with the
API, error response codes with a meaning, and response type etc.
• The developer shall provide test plans and document testing results.
MOD 2: Time is of the essence. The first release of app shall be delivered fully tested and ready for use
within 60 days after receipt award, scope validation or finalization of mock design. The second release of the
app shall be delivered fully tested and ready for use within 60 days after the first release is stabilized.
MOD 3: 7 APIs: GET api/Foster/GetLicensingStatus
GET api/Foster/GetChildrenList
GET api/Foster/GetChildVisitiationList?entityId={entity ID}
GET api/Foster/Trainings
GET api/Foster/CourtInformation?entityId={entity ID}
GET api/Foster/MedicalVisits?entityId={entity ID}
GET api/Foster/KnownMedications?entityId={entity ID}
GET api/Foster/MedicalInformation?entityId={entity ID}
GET api/Foster/GetQuickReferences
PUT api/Foster/RegisterPushChannel
CISA
Kimberly D. Pickett
AttachmentQ6_FY17 Contracts.xlsx Page 7 of 13
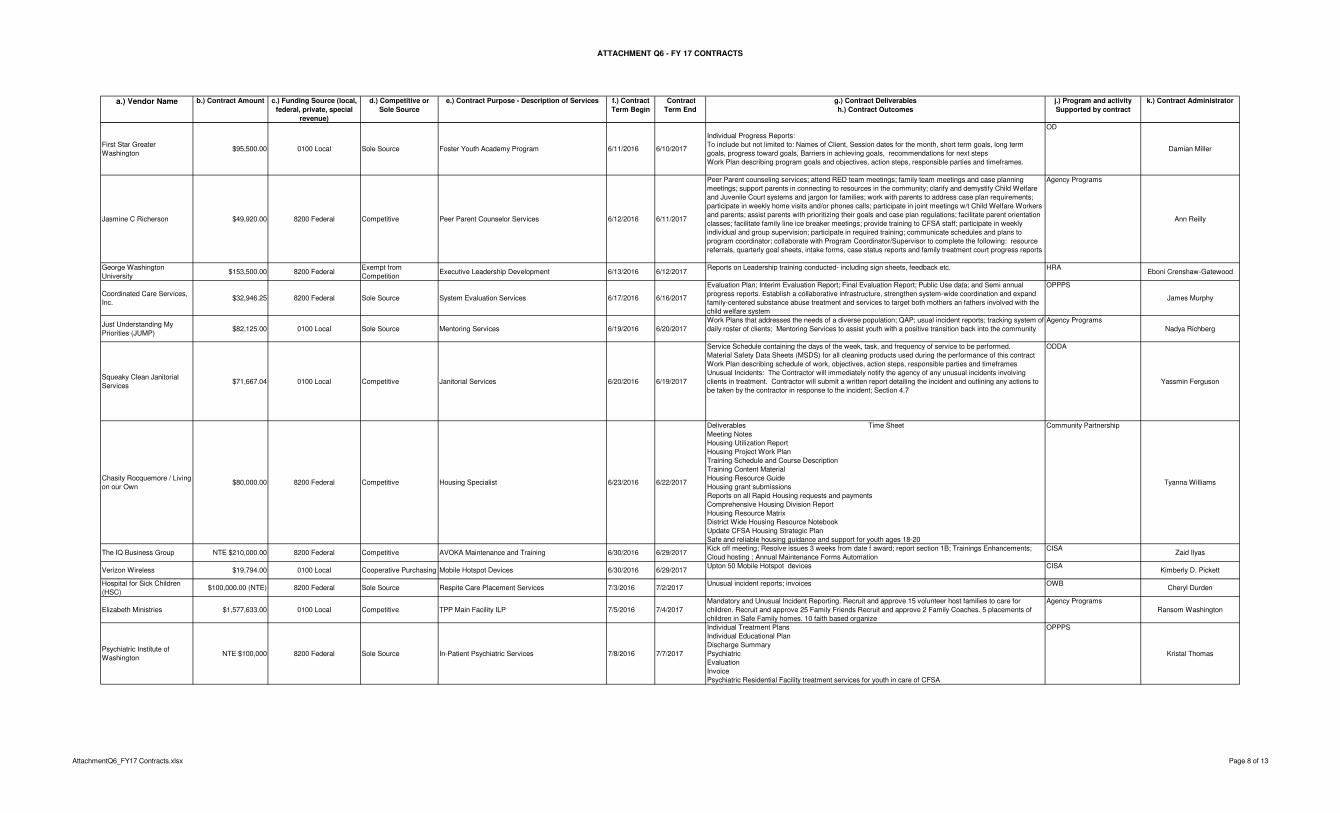
ATTACHMENT Q6 - FY 17 CONTRACTS
a.) Vendor Name b.) Contract Amount c.) Funding Source (local,
federal, private, special
revenue)
d.) Competitive or
Sole Source
e.) Contract Purpose - Description of Services f.) Contract
Term Begin
Contract
Term End
g.) Contract Deliverables
h.) Contract Outcomes
j.) Program and activity
Supported by contract
k.) Contract Administrator
First Star Greater
Washington$95,500.00 0100 Local Sole Source Foster Youth Academy Program 6/11/2016 6/10/2017
Individual Progress Reports:
To include but not limited to: Names of Client, Session dates for the month, short term goals, long term
goals, progress toward goals, Barriers in achieving goals, recommendations for next steps
Work Plan describing program goals and objectives, action steps, responsible parties and timeframes.
OD
Damian Miller
Jasmine C Richerson $49,920.00 8200 Federal Competitive Peer Parent Counselor Services 6/12/2016 6/11/2017
Peer Parent counseling services; attend RED team meetings; family team meetings and case planning
meetings; support parents in connecting to resources in the community; clarify and demystify Child Welfare
and Juvenile Court systems and jargon for families; work with parents to address case plan requirements;
participate in weekly home visits and/or phones calls; participate in joint meetings w/t Child Welfare Workers
and parents; assist parents with prioritizing their goals and case plan regulations; facilitate parent orientation
classes; facilitate family line ice breaker meetings; provide training to CFSA staff; participate in weekly
individual and group supervision; participate in required training; communicate schedules and plans to
program coordinator; collaborate with Program Coordinator/Supervisor to complete the following: resource
referrals, quarterly goal sheets, intake forms, case status reports and family treatment court progress reports
Agency Programs
Ann Reilly
George Washington
University$153,500.00 8200 Federal
Exempt from
CompetitionExecutive Leadership Development 6/13/2016 6/12/2017
Reports on Leadership training conducted- including sign sheets, feedback etc. HRAEboni Crenshaw-Gatewood
Coordinated Care Services,
Inc.$32,946.25 8200 Federal Sole Source System Evaluation Services 6/17/2016 6/16/2017
Evaluation Plan; Interim Evaluation Report; Final Evaluation Report; Public Use data; and Semi annual
progress reports. Establish a collaborative infrastructure, strengthen system-wide coordination and expand
family-centered substance abuse treatment and services to target both mothers an fathers involved with the
child welfare system
OPPPS
James Murphy
Just Understanding My
Priorities (JUMP)$82,125.00 0100 Local Sole Source Mentoring Services 6/19/2016 6/20/2017
Work Plans that addresses the needs of a diverse population; QAP; usual incident reports; tracking system of
daily roster of clients; Mentoring Services to assist youth with a positive transition back into the community
Agency Programs
Nadya Richberg
Squeaky Clean Janitorial
Services$71,667.04 0100 Local Competitive Janitorial Services 6/20/2016 6/19/2017
Service Schedule containing the days of the week, task, and frequency of service to be performed.
Material Safety Data Sheets (MSDS) for all cleaning products used during the performance of this contract
Work Plan describing schedule of work, objectives, action steps, responsible parties and timeframes
Unusual Incidents: The Contractor will immediately notify the agency of any unusual incidents involving
clients in treatment. Contractor will submit a written report detailing the incident and outlining any actions to
be taken by the contractor in response to the incident; Section 4.7
ODDA
Yassmin Ferguson
Chasity Rocquemore / Living
on our Own $80,000.00 8200 Federal Competitive Housing Specialist 6/23/2016 6/22/2017
Deliverables Time Sheet
Meeting Notes
Housing Utilization Report
Housing Project Work Plan
Training Schedule and Course Description
Training Content Material
Housing Resource Guide
Housing grant submissions
Reports on all Rapid Housing requests and payments
Comprehensive Housing Division Report
Housing Resource Matrix
District Wide Housing Resource Notebook
Update CFSA Housing Strategic Plan
Safe and reliable housing guidance and support for youth ages 18-20
Community Partnership
Tyanna Williams
The IQ Business Group NTE $210,000.00 8200 Federal Competitive AVOKA Maintenance and Training 6/30/2016 6/29/2017Kick off meeting; Resolve issues 3 weeks from date f award; report section 1B; Trainings Enhancements;
Cloud hosting ; Annual Maintenance Forms Automation
CISAZaid Ilyas
Verizon Wireless $19,794.00 0100 Local Cooperative Purchasing Mobile Hotspot Devices 6/30/2016 6/29/2017Upton 50 Mobile Hotspot devices CISA
Kimberly D. Pickett
Hospital for Sick Children
(HSC)$100,000.00 (NTE) 8200 Federal Sole Source Respite Care Placement Services 7/3/2016 7/2/2017
Unusual incident reports; invoices OWBCheryl Durden
Elizabeth Ministries $1,577,633.00 0100 Local Competitive TPP Main Facility ILP 7/5/2016 7/4/2017
Mandatory and Unusual Incident Reporting. Recruit and approve 15 volunteer host families to care for
children. Recruit and approve 25 Family Friends Recruit and approve 2 Family Coaches. 5 placements of
children in Safe Family homes. 10 faith based organize
Agency Programs
Ransom Washington
Psychiatric Institute of
WashingtonNTE $100,000 8200 Federal Sole Source In-Patient Psychiatric Services 7/8/2016 7/7/2017
Individual Treatment Plans
Individual Educational Plan
Discharge Summary
Psychiatric
Evaluation
Invoice
Psychiatric Residential Facility treatment services for youth in care of CFSA
OPPPS
Kristal Thomas
AttachmentQ6_FY17 Contracts.xlsx Page 8 of 13
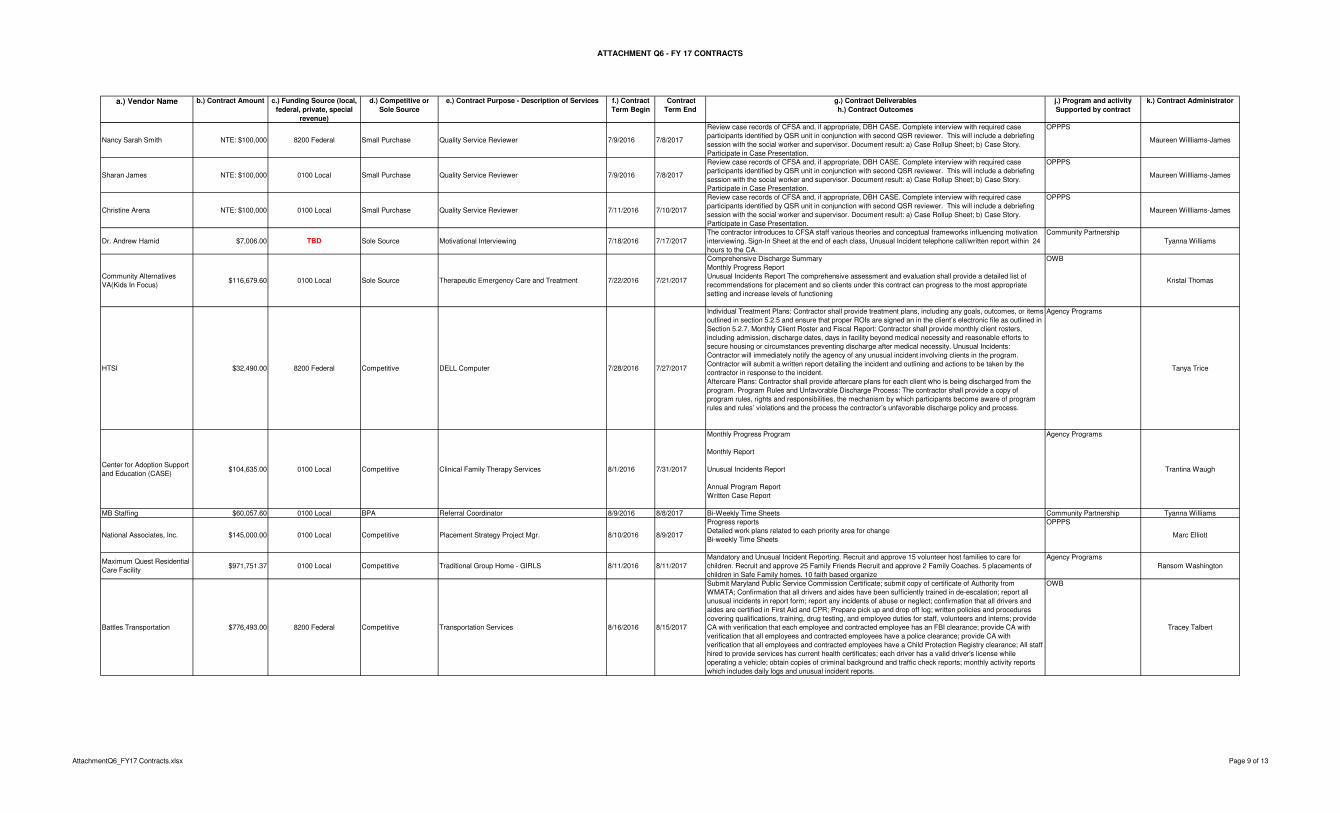
ATTACHMENT Q6 - FY 17 CONTRACTS
a.) Vendor Name b.) Contract Amount c.) Funding Source (local,
federal, private, special
revenue)
d.) Competitive or
Sole Source
e.) Contract Purpose - Description of Services f.) Contract
Term Begin
Contract
Term End
g.) Contract Deliverables
h.) Contract Outcomes
j.) Program and activity
Supported by contract
k.) Contract Administrator
Nancy Sarah Smith NTE: $100,000 8200 Federal Small Purchase Quality Service Reviewer 7/9/2016 7/8/2017
Review case records of CFSA and, if appropriate, DBH CASE. Complete interview with required case
participants identified by QSR unit in conjunction with second QSR reviewer. This will include a debriefing
session with the social worker and supervisor. Document result: a) Case Rollup Sheet; b) Case Story.
Participate in Case Presentation.
OPPPS
Maureen Willliams-James
Sharan James NTE: $100,000 0100 Local Small Purchase Quality Service Reviewer 7/9/2016 7/8/2017
Review case records of CFSA and, if appropriate, DBH CASE. Complete interview with required case
participants identified by QSR unit in conjunction with second QSR reviewer. This will include a debriefing
session with the social worker and supervisor. Document result: a) Case Rollup Sheet; b) Case Story.
Participate in Case Presentation.
OPPPS
Maureen Willliams-James
Christine Arena NTE: $100,000 0100 Local Small Purchase Quality Service Reviewer 7/11/2016 7/10/2017
Review case records of CFSA and, if appropriate, DBH CASE. Complete interview with required case
participants identified by QSR unit in conjunction with second QSR reviewer. This will include a debriefing
session with the social worker and supervisor. Document result: a) Case Rollup Sheet; b) Case Story.
Participate in Case Presentation.
OPPPS
Maureen Willliams-James
Dr. Andrew Hamid $7,006.00 TBD Sole Source Motivational Interviewing 7/18/2016 7/17/2017
The contractor introduces to CFSA staff various theories and conceptual frameworks influencing motivation
interviewing. Sign-In Sheet at the end of each class, Unusual Incident telephone call/written report within 24
hours to the CA.
Community Partnership
Tyanna Williams
Community Alternatives
VA(Kids In Focus)$116,679.60 0100 Local Sole Source Therapeutic Emergency Care and Treatment 7/22/2016 7/21/2017
Comprehensive Discharge Summary
Monthly Progress Report
Unusual Incidents Report The comprehensive assessment and evaluation shall provide a detailed list of
recommendations for placement and so clients under this contract can progress to the most appropriate
setting and increase levels of functioning
OWB
Kristal Thomas
HTSI $32,490.00 8200 Federal Competitive DELL Computer 7/28/2016 7/27/2017
Individual Treatment Plans: Contractor shall provide treatment plans, including any goals, outcomes, or items
outlined in section 5.2.5 and ensure that proper ROIs are signed an in the client’s electronic file as outlined in
Section 5.2.7. Monthly Client Roster and Fiscal Report: Contractor shall provide monthly client rosters,
including admission, discharge dates, days in facility beyond medical necessity and reasonable efforts to
secure housing or circumstances preventing discharge after medical necessity. Unusual Incidents:
Contractor will immediately notify the agency of any unusual incident involving clients in the program.
Contractor will submit a written report detailing the incident and outlining and actions to be taken by the
contractor in response to the incident.
Aftercare Plans: Contractor shall provide aftercare plans for each client who is being discharged from the
program. Program Rules and Unfavorable Discharge Process: The contractor shall provide a copy of
program rules, rights and responsibilities, the mechanism by which participants become aware of program
rules and rules’ violations and the process the contractor’s unfavorable discharge policy and process.
Agency Programs
Tanya Trice
Center for Adoption Support
and Education (CASE)$104,635.00 0100 Local Competitive Clinical Family Therapy Services 8/1/2016 7/31/2017
Monthly Progress Program
Monthly Report
Unusual Incidents Report
Annual Program Report
Written Case Report
Agency Programs
Trantina Waugh
MB Staffing $60,057.60 0100 Local BPA Referral Coordinator 8/9/2016 8/8/2017 Bi-Weekly Time Sheets Community Partnership Tyanna Williams
National Associates, Inc. $145,000.00 0100 Local Competitive Placement Strategy Project Mgr. 8/10/2016 8/9/2017
Progress reports
Detailed work plans related to each priority area for change
Bi-weekly Time Sheets
OPPPS
Marc Elliott
Maximum Quest Residential
Care Facility $971,751.37 0100 Local Competitive Traditional Group Home - GIRLS 8/11/2016 8/11/2017
Mandatory and Unusual Incident Reporting. Recruit and approve 15 volunteer host families to care for
children. Recruit and approve 25 Family Friends Recruit and approve 2 Family Coaches. 5 placements of
children in Safe Family homes. 10 faith based organize
Agency Programs
Ransom Washington
Battles Transportation $776,493.00 8200 Federal Competitive Transportation Services 8/16/2016 8/15/2017
Submit Maryland Public Service Commission Certificate; submit copy of certificate of Authority from
WMATA; Confirmation that all drivers and aides have been sufficiently trained in de-escalation; report all
unusual incidents in report form; report any incidents of abuse or neglect; confirmation that all drivers and
aides are certified in First Aid and CPR; Prepare pick up and drop off log; written policies and procedures
covering qualifications, training, drug testing, and employee duties for staff, volunteers and interns; provide
CA with verification that each employee and contracted employee has an FBI clearance; provide CA with
verification that all employees and contracted employees have a police clearance; provide CA with
verification that all employees and contracted employees have a Child Protection Registry clearance; All staff
hired to provide services has current health certificates; each driver has a valid driver's license while
operating a vehicle; obtain copies of criminal background and traffic check reports; monthly activity reports
which includes daily logs and unusual incident reports.
OWB
Tracey Talbert
AttachmentQ6_FY17 Contracts.xlsx Page 9 of 13
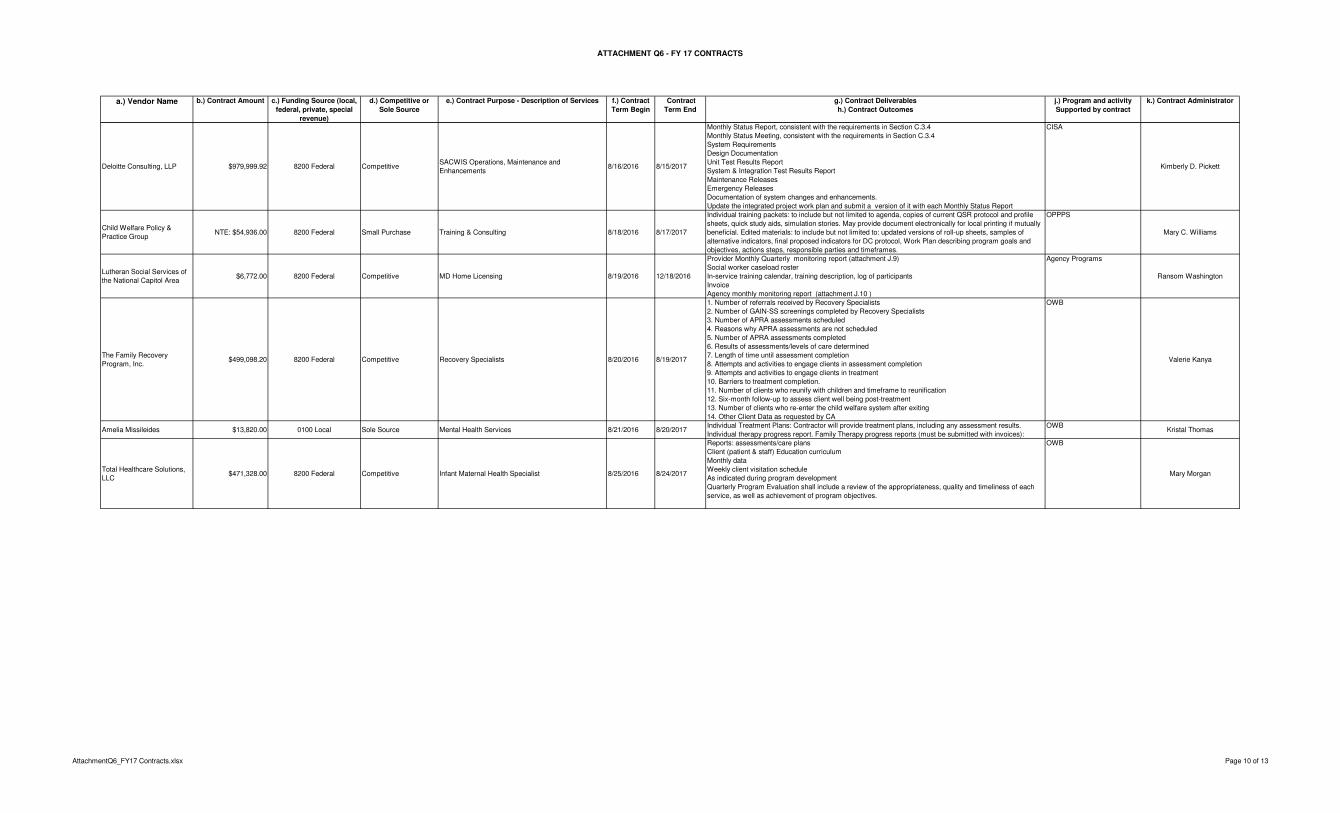
ATTACHMENT Q6 - FY 17 CONTRACTS
a.) Vendor Name b.) Contract Amount c.) Funding Source (local,
federal, private, special
revenue)
d.) Competitive or
Sole Source
e.) Contract Purpose - Description of Services f.) Contract
Term Begin
Contract
Term End
g.) Contract Deliverables
h.) Contract Outcomes
j.) Program and activity
Supported by contract
k.) Contract Administrator
Deloitte Consulting, LLP $979,999.92 8200 Federal CompetitiveSACWIS Operations, Maintenance and
Enhancements8/16/2016 8/15/2017
Monthly Status Report, consistent with the requirements in Section C.3.4
Monthly Status Meeting, consistent with the requirements in Section C.3.4
System Requirements
Design Documentation
Unit Test Results Report
System & Integration Test Results Report
Maintenance Releases
Emergency Releases
Documentation of system changes and enhancements.
Update the integrated project work plan and submit a version of it with each Monthly Status Report
CISA
Kimberly D. Pickett
Child Welfare Policy &
Practice GroupNTE: $54,936.00 8200 Federal Small Purchase Training & Consulting 8/18/2016 8/17/2017
Individual training packets: to include but not limited to agenda, copies of current QSR protocol and profile
sheets, quick study aids, simulation stories. May provide document electronically for local printing if mutually
beneficial. Edited materials: to include but not limited to: updated versions of roll-up sheets, samples of
alternative indicators, final proposed indicators for DC protocol, Work Plan describing program goals and
objectives, actions steps, responsible parties and timeframes.
OPPPS
Mary C. Williams
Lutheran Social Services of
the National Capitol Area$6,772.00 8200 Federal Competitive MD Home Licensing 8/19/2016 12/18/2016
Provider Monthly Quarterly monitoring report (attachment J.9)
Social worker caseload roster
In-service training calendar, training description, log of participants
Invoice
Agency monthly monitoring report (attachment J.10 )
Agency Programs
Ransom Washington
The Family Recovery
Program, Inc.$499,098.20 8200 Federal Competitive Recovery Specialists 8/20/2016 8/19/2017
1. Number of referrals received by Recovery Specialists
2. Number of GAIN-SS screenings completed by Recovery Specialists
3. Number of APRA assessments scheduled
4. Reasons why APRA assessments are not scheduled
5. Number of APRA assessments completed
6. Results of assessments/levels of care determined
7. Length of time until assessment completion
8. Attempts and activities to engage clients in assessment completion
9. Attempts and activities to engage clients in treatment
10. Barriers to treatment completion.
11. Number of clients who reunify with children and timeframe to reunification
12. Six-month follow-up to assess client well being post-treatment
13. Number of clients who re-enter the child welfare system after exiting
14. Other Client Data as requested by CA
OWB
Valerie Kanya
Amelia Missileides $13,820.00 0100 Local Sole Source Mental Health Services 8/21/2016 8/20/2017Individual Treatment Plans: Contractor will provide treatment plans, including any assessment results.
Individual therapy progress report. Family Therapy progress reports (must be submitted with invoices):
OWBKristal Thomas
Total Healthcare Solutions,
LLC$471,328.00 8200 Federal Competitive Infant Maternal Health Specialist 8/25/2016 8/24/2017
Reports: assessments/care plans
Client (patient & staff) Education curriculum
Monthly data
Weekly client visitation schedule
As indicated during program development
Quarterly Program Evaluation shall include a review of the appropriateness, quality and timeliness of each
service, as well as achievement of program objectives.
OWB
Mary Morgan
AttachmentQ6_FY17 Contracts.xlsx Page 10 of 13
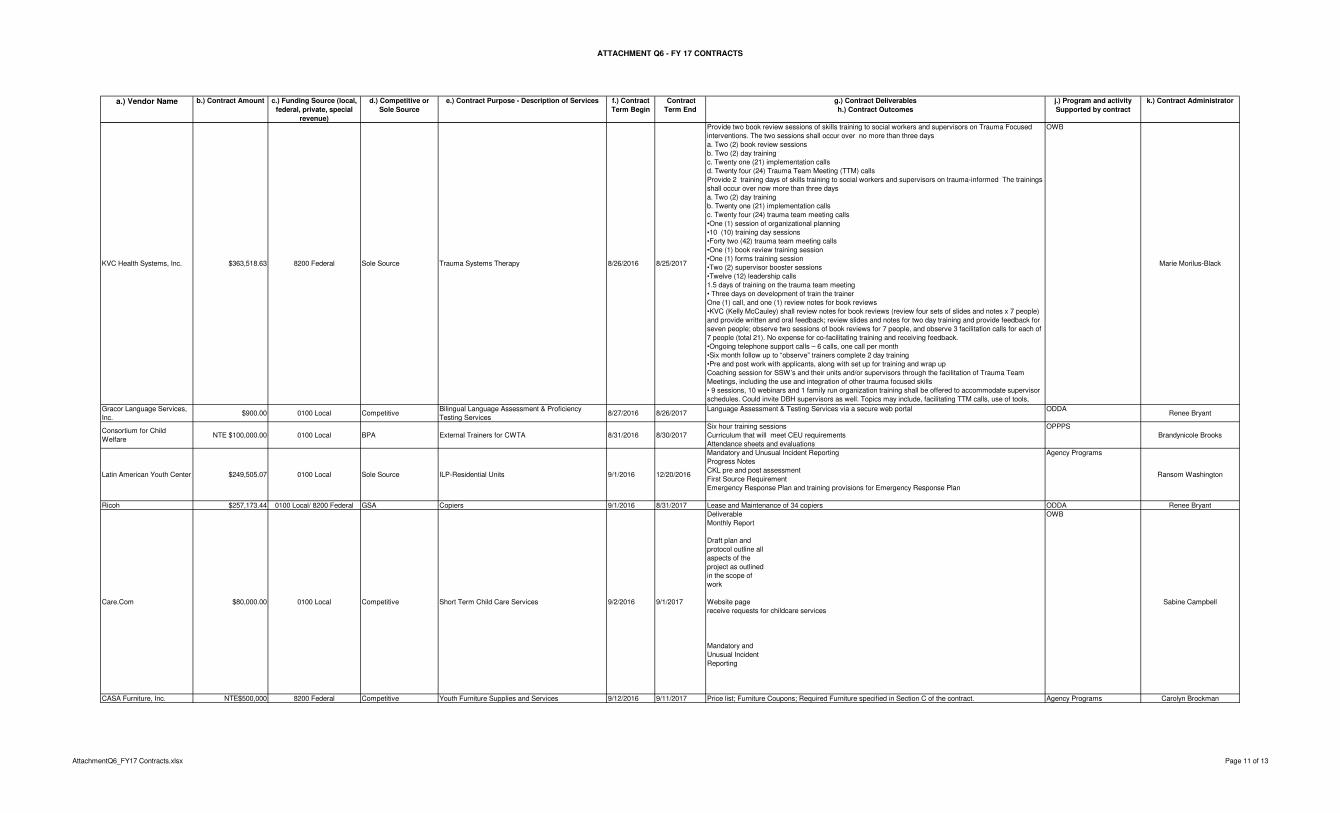
ATTACHMENT Q6 - FY 17 CONTRACTS
a.) Vendor Name b.) Contract Amount c.) Funding Source (local,
federal, private, special
revenue)
d.) Competitive or
Sole Source
e.) Contract Purpose - Description of Services f.) Contract
Term Begin
Contract
Term End
g.) Contract Deliverables
h.) Contract Outcomes
j.) Program and activity
Supported by contract
k.) Contract Administrator
KVC Health Systems, Inc. $363,518.63 8200 Federal Sole Source Trauma Systems Therapy 8/26/2016 8/25/2017
Provide two book review sessions of skills training to social workers and supervisors on Trauma Focused
interventions. The two sessions shall occur over no more than three days
a. Two (2) book review sessions
b. Two (2) day training
c. Twenty one (21) implementation calls
d. Twenty four (24) Trauma Team Meeting (TTM) calls
Provide 2 training days of skills training to social workers and supervisors on trauma-informed The trainings
shall occur over now more than three days
a. Two (2) day training
b. Twenty one (21) implementation calls
c. Twenty four (24) trauma team meeting calls
•One (1) session of organizational planning
•10 (10) training day sessions
•Forty two (42) trauma team meeting calls
•One (1) book review training session
•One (1) forms training session
•Two (2) supervisor booster sessions
•Twelve (12) leadership calls
1.5 days of training on the trauma team meeting
• Three days on development of train the trainer
One (1) call, and one (1) review notes for book reviews
•KVC (Kelly McCauley) shall review notes for book reviews (review four sets of slides and notes x 7 people)
and provide written and oral feedback; review slides and notes for two day training and provide feedback for
seven people; observe two sessions of book reviews for 7 people, and observe 3 facilitation calls for each of
7 people (total 21). No expense for co-facilitating training and receiving feedback.
•Ongoing telephone support calls – 6 calls, one call per month
•Six month follow up to “observe” trainers complete 2 day training
•Pre and post work with applicants, along with set up for training and wrap up
Coaching session for SSW’s and their units and/or supervisors through the facilitation of Trauma Team
Meetings, including the use and integration of other trauma focused skills
• 9 sessions, 10 webinars and 1 family run organization training shall be offered to accommodate supervisor
schedules. Could invite DBH supervisors as well. Topics may include, facilitating TTM calls, use of tools,
secondary trauma support for staff etc. Activities include: Topic development, scheduling with CFSA team,
OWB
Marie Morilus-Black
Gracor Language Services,
Inc.$900.00 0100 Local Competitive
Bilingual Language Assessment & Proficiency
Testing Services8/27/2016 8/26/2017
Language Assessment & Testing Services via a secure web portal ODDARenee Bryant
Consortium for Child
WelfareNTE $100,000.00 0100 Local BPA External Trainers for CWTA 8/31/2016 8/30/2017
Six hour training sessions
Curriculum that will meet CEU requirements
Attendance sheets and evaluations
OPPPS
Brandynicole Brooks
Latin American Youth Center $249,505.07 0100 Local Sole Source ILP-Residential Units 9/1/2016 12/20/2016
Mandatory and Unusual Incident Reporting
Progress Notes
CKL pre and post assessment
First Source Requirement
Emergency Response Plan and training provisions for Emergency Response Plan
Agency Programs
Ransom Washington
Ricoh $257,173.44 0100 Local/ 8200 Federal GSA Copiers 9/1/2016 8/31/2017 Lease and Maintenance of 34 copiers ODDA Renee Bryant
Care.Com $80,000.00 0100 Local Competitive Short Term Child Care Services 9/2/2016 9/1/2017
Deliverable
Monthly Report
Draft plan and
protocol outline all
aspects of the
project as outlined
in the scope of
work
Website page
receive requests for childcare services
Mandatory and
Unusual Incident
Reporting
OWB
Sabine Campbell
CASA Furniture, Inc. NTE$500,000 8200 Federal Competitive Youth Furniture Supplies and Services 9/12/2016 9/11/2017 Price list; Furniture Coupons; Required Furniture specified in Section C of the contract. Agency Programs Carolyn Brockman
AttachmentQ6_FY17 Contracts.xlsx Page 11 of 13
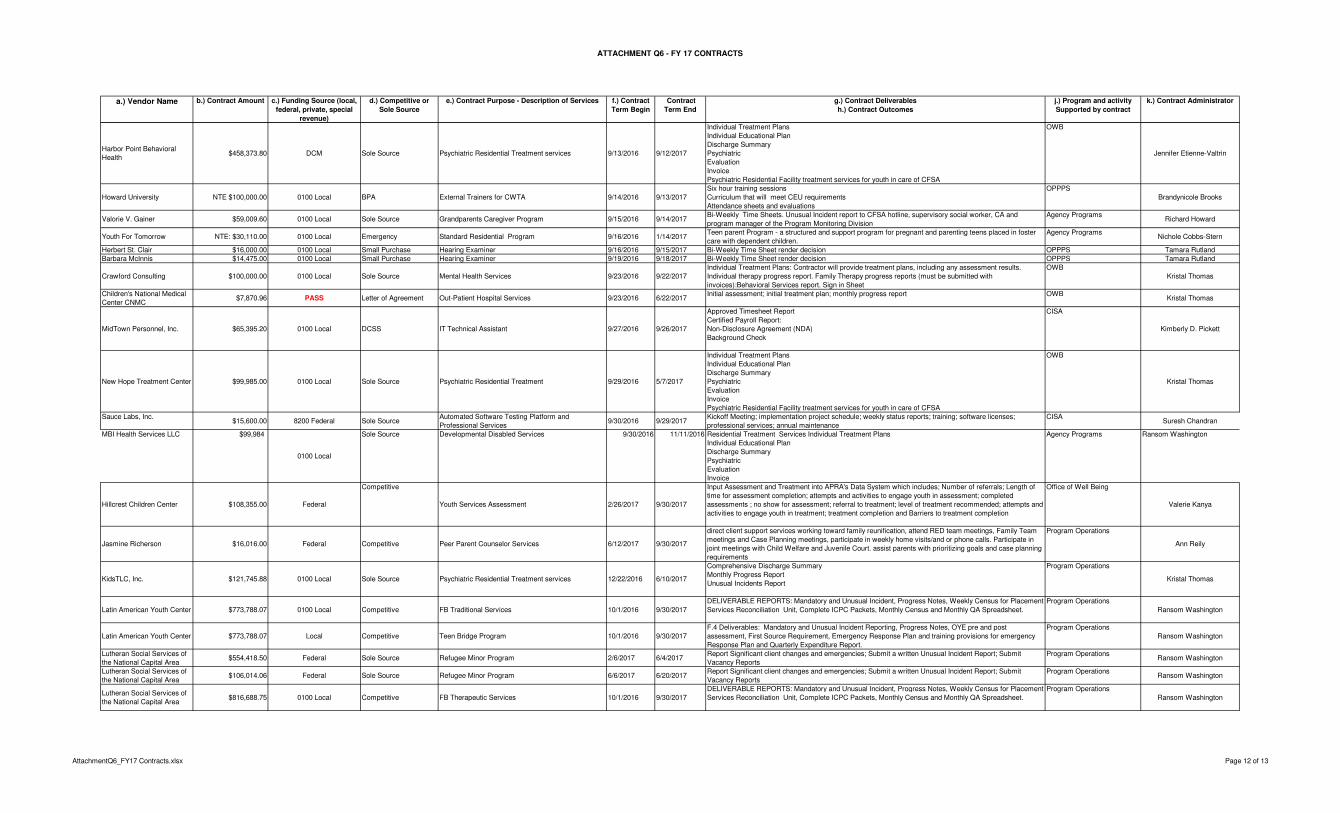
ATTACHMENT Q6 - FY 17 CONTRACTS
a.) Vendor Name b.) Contract Amount c.) Funding Source (local,
federal, private, special
revenue)
d.) Competitive or
Sole Source
e.) Contract Purpose - Description of Services f.) Contract
Term Begin
Contract
Term End
g.) Contract Deliverables
h.) Contract Outcomes
j.) Program and activity
Supported by contract
k.) Contract Administrator
Harbor Point Behavioral
Health$458,373.80 DCM Sole Source Psychiatric Residential Treatment services 9/13/2016 9/12/2017
Individual Treatment Plans
Individual Educational Plan
Discharge Summary
Psychiatric
Evaluation
Invoice
Psychiatric Residential Facility treatment services for youth in care of CFSA
OWB
Jennifer Etienne-Valtrin
Howard University NTE $100,000.00 0100 Local BPA External Trainers for CWTA 9/14/2016 9/13/2017
Six hour training sessions
Curriculum that will meet CEU requirements
Attendance sheets and evaluations
OPPPS
Brandynicole Brooks
Valorie V. Gainer $59,009.60 0100 Local Sole Source Grandparents Caregiver Program 9/15/2016 9/14/2017Bi-Weekly Time Sheets. Unusual Incident report to CFSA hotline, supervisory social worker, CA and
program manager of the Program Monitoring Division
Agency ProgramsRichard Howard
Youth For Tomorrow NTE: $30,110.00 0100 Local Emergency Standard Residential Program 9/16/2016 1/14/2017Teen parent Program - a structured and support program for pregnant and parenting teens placed in foster
care with dependent children.
Agency ProgramsNichole Cobbs-Stern
Herbert St. Clair $16,000.00 0100 Local Small Purchase Hearing Examiner 9/16/2016 9/15/2017 Bi-Weekly Time Sheet render decision OPPPS Tamara Rutland
Barbara McInnis $14,475.00 0100 Local Small Purchase Hearing Examiner 9/19/2016 9/18/2017 Bi-Weekly Time Sheet render decision OPPPS Tamara Rutland
Crawford Consulting $100,000.00 0100 Local Sole Source Mental Health Services 9/23/2016 9/22/2017
Individual Treatment Plans: Contractor will provide treatment plans, including any assessment results.
Individual therapy progress report. Family Therapy progress reports (must be submitted with
invoices):Behavioral Services report. Sign in Sheet
OWB
Kristal Thomas
Children's National Medical
Center CNMC$7,870.96 PASS Letter of Agreement Out-Patient Hospital Services 9/23/2016 6/22/2017
Initial assessment; initial treatment plan; monthly progress report OWBKristal Thomas
MidTown Personnel, Inc. $65,395.20 0100 Local DCSS IT Technical Assistant 9/27/2016 9/26/2017
Approved Timesheet Report
Certified Payroll Report:
Non-Disclosure Agreement (NDA)
Background Check
CISA
Kimberly D. Pickett
New Hope Treatment Center $99,985.00 0100 Local Sole Source Psychiatric Residential Treatment 9/29/2016 5/7/2017
Individual Treatment Plans
Individual Educational Plan
Discharge Summary
Psychiatric
Evaluation
Invoice
Psychiatric Residential Facility treatment services for youth in care of CFSA
OWB
Kristal Thomas
Sauce Labs, Inc.$15,600.00 8200 Federal Sole Source
Automated Software Testing Platform and
Professional Services9/30/2016 9/29/2017
Kickoff Meeting; implementation project schedule; weekly status reports; training; software licenses;
professional services; annual maintenance
CISASuresh Chandran
MBI Health Services LLC $99,984
0100 Local
Sole Source Developmental Disabled Services 9/30/2016 11/11/2016 Residential Treatment Services Individual Treatment Plans
Individual Educational Plan
Discharge Summary
Psychiatric
Evaluation
Invoice
Agency Programs Ransom Washington
Hillcrest Children Center $108,355.00 Federal
Competitive
Youth Services Assessment 2/26/2017 9/30/2017
Input Assessment and Treatment into APRA's Data System which includes; Number of referrals; Length of
time for assessment completion; attempts and activities to engage youth in assessment; completed
assessments ; no show for assessment; referral to treatment; level of treatment recommended; attempts and
activities to engage youth in treatment; treatment completion and Barriers to treatment completion
Office of Well Being
Valerie Kanya
Jasmine Richerson $16,016.00 Federal Competitive Peer Parent Counselor Services 6/12/2017 9/30/2017
direct client support services working toward family reunification, attend RED team meetings, Family Team
meetings and Case Planning meetings, participate in weekly home visits/and or phone calls. Participate in
joint meetings with Child Welfare and Juvenile Court. assist parents with prioritizing goals and case planning
requirements
Program Operations
Ann Reily
KidsTLC, Inc. $121,745.88 0100 Local Sole Source Psychiatric Residential Treatment services 12/22/2016 6/10/2017
Comprehensive Discharge Summary
Monthly Progress Report
Unusual Incidents Report
Program Operations
Kristal Thomas
Latin American Youth Center $773,788.07 0100 Local Competitive FB Traditional Services 10/1/2016 9/30/2017
DELIVERABLE REPORTS: Mandatory and Unusual Incident, Progress Notes, Weekly Census for Placement
Services Reconciliation Unit, Complete ICPC Packets, Monthly Census and Monthly QA Spreadsheet.
Program Operations
Ransom Washington
Latin American Youth Center $773,788.07 Local Competitive Teen Bridge Program 10/1/2016 9/30/2017
F.4 Deliverables: Mandatory and Unusual Incident Reporting, Progress Notes, OYE pre and post
assessment, First Source Requirement, Emergency Response Plan and training provisions for emergency
Response Plan and Quarterly Expenditure Report.
Program Operations
Ransom Washington
Lutheran Social Services of
the National Capital Area$554,418.50 Federal Sole Source Refugee Minor Program 2/6/2017 6/4/2017
Report Significant client changes and emergencies; Submit a written Unusual Incident Report; Submit
Vacancy Reports
Program OperationsRansom Washington
Lutheran Social Services of
the National Capital Area$106,014.06 Federal Sole Source Refugee Minor Program 6/6/2017 6/20/2017
Report Significant client changes and emergencies; Submit a written Unusual Incident Report; Submit
Vacancy Reports
Program Operations Ransom Washington
Lutheran Social Services of
the National Capital Area$816,688.75 0100 Local Competitive FB Therapeutic Services 10/1/2016 9/30/2017
DELIVERABLE REPORTS: Mandatory and Unusual Incident, Progress Notes, Weekly Census for Placement
Services Reconciliation Unit, Complete ICPC Packets, Monthly Census and Monthly QA Spreadsheet.
Program Operations
Ransom Washington
AttachmentQ6_FY17 Contracts.xlsx Page 12 of 13
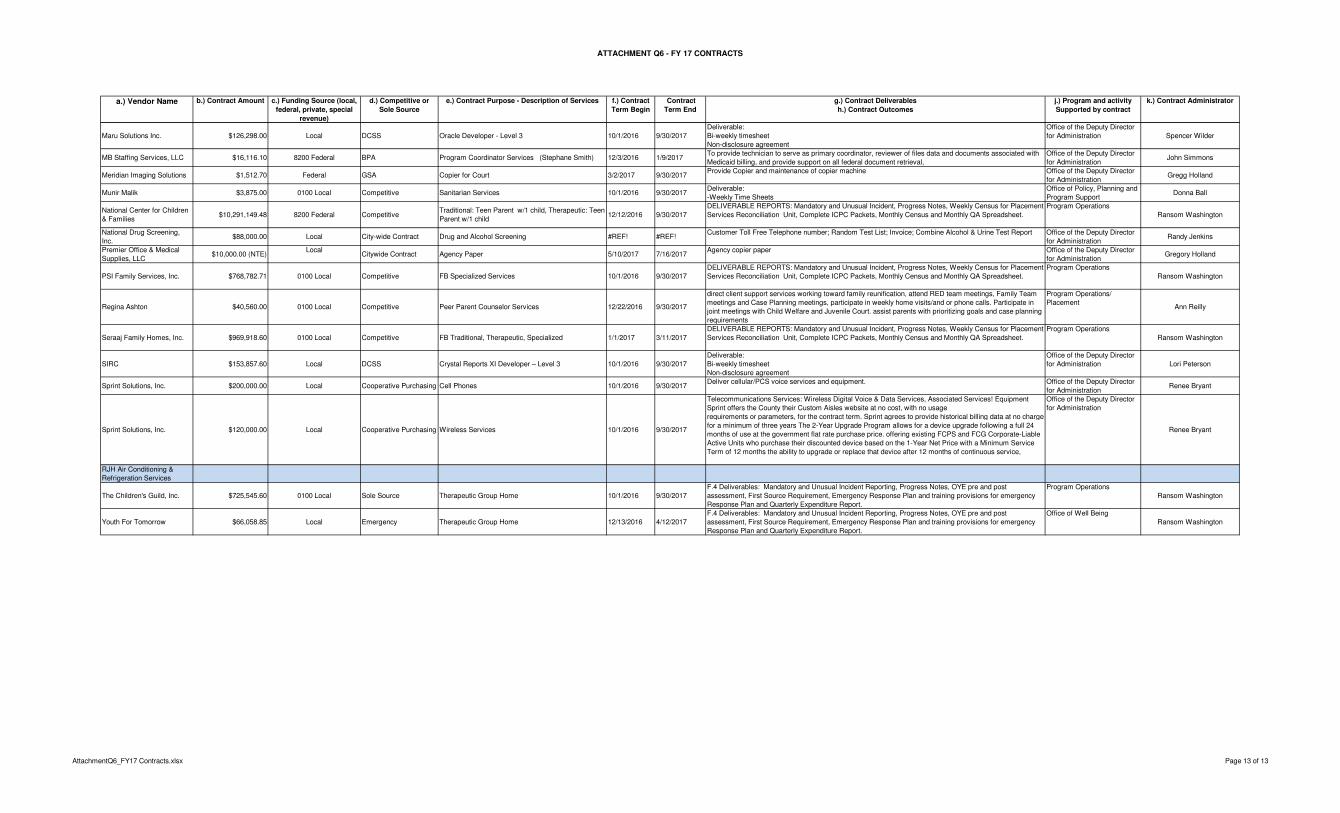
ATTACHMENT Q6 - FY 17 CONTRACTS
a.) Vendor Name b.) Contract Amount c.) Funding Source (local,
federal, private, special
revenue)
d.) Competitive or
Sole Source
e.) Contract Purpose - Description of Services f.) Contract
Term Begin
Contract
Term End
g.) Contract Deliverables
h.) Contract Outcomes
j.) Program and activity
Supported by contract
k.) Contract Administrator
Maru Solutions Inc. $126,298.00 Local DCSS Oracle Developer - Level 3 10/1/2016 9/30/2017
Deliverable:
Bi-weekly timesheet
Non-disclosure agreement
Office of the Deputy Director
for Administration Spencer Wilder
MB Staffing Services, LLC $16,116.10 8200 Federal BPA Program Coordinator Services (Stephane Smith) 12/3/2016 1/9/2017To provide technician to serve as primary coordinator, reviewer of files data and documents associated with
Medicaid billing, and provide support on all federal document retrieval,
Office of the Deputy Director
for AdministrationJohn Simmons
Meridian Imaging Solutions $1,512.70 Federal GSA Copier for Court 3/2/2017 9/30/2017Provide Copier and maintenance of copier machine Office of the Deputy Director
for AdministrationGregg Holland
Munir Malik $3,875.00 0100 Local Competitive Sanitarian Services 10/1/2016 9/30/2017Deliverable:
-Weekly Time Sheets
Office of Policy, Planning and
Program SupportDonna Ball
National Center for Children
& Families$10,291,149.48 8200 Federal Competitive
Traditional: Teen Parent w/1 child, Therapeutic: Teen
Parent w/1 child12/12/2016 9/30/2017
DELIVERABLE REPORTS: Mandatory and Unusual Incident, Progress Notes, Weekly Census for Placement
Services Reconciliation Unit, Complete ICPC Packets, Monthly Census and Monthly QA Spreadsheet.
Program Operations
Ransom Washington
National Drug Screening,
Inc.$88,000.00 Local City-wide Contract Drug and Alcohol Screening #REF! #REF!
Customer Toll Free Telephone number; Random Test List; Invoice; Combine Alcohol & Urine Test Report Office of the Deputy Director
for AdministrationRandy Jenkins
Premier Office & Medical
Supplies, LLC$10,000.00 (NTE)
LocalCitywide Contract Agency Paper 5/10/2017 7/16/2017
Agency copier paper Office of the Deputy Director
for AdministrationGregory Holland
PSI Family Services, Inc. $768,782.71 0100 Local Competitive FB Specialized Services 10/1/2016 9/30/2017
DELIVERABLE REPORTS: Mandatory and Unusual Incident, Progress Notes, Weekly Census for Placement
Services Reconciliation Unit, Complete ICPC Packets, Monthly Census and Monthly QA Spreadsheet.
Program Operations
Ransom Washington
Regina Ashton $40,560.00 0100 Local Competitive Peer Parent Counselor Services 12/22/2016 9/30/2017
direct client support services working toward family reunification, attend RED team meetings, Family Team
meetings and Case Planning meetings, participate in weekly home visits/and or phone calls. Participate in
joint meetings with Child Welfare and Juvenile Court. assist parents with prioritizing goals and case planning
requirements
Program Operations/
PlacementAnn Reilly
Seraaj Family Homes, Inc. $969,918.60 0100 Local Competitive FB Traditional, Therapeutic, Specialized 1/1/2017 3/11/2017
DELIVERABLE REPORTS: Mandatory and Unusual Incident, Progress Notes, Weekly Census for Placement
Services Reconciliation Unit, Complete ICPC Packets, Monthly Census and Monthly QA Spreadsheet.
Program Operations
Ransom Washington
SIRC $153,857.60 Local DCSS Crystal Reports XI Developer – Level 3 10/1/2016 9/30/2017
Deliverable:
Bi-weekly timesheet
Non-disclosure agreement
Office of the Deputy Director
for Administration Lori Peterson
Sprint Solutions, Inc. $200,000.00 Local Cooperative Purchasing Cell Phones 10/1/2016 9/30/2017Deliver cellular/PCS voice services and equipment. Office of the Deputy Director
for AdministrationRenee Bryant
Sprint Solutions, Inc. $120,000.00 Local Cooperative Purchasing Wireless Services 10/1/2016 9/30/2017
Telecommunications Services: Wireless Digital Voice & Data Services, Associated Services! Equipment
Sprint offers the County their Custom Aisles website at no cost, with no usage
requirements or parameters, for the contract term. Sprint agrees to provide historical billing data at no charge
for a minimum of three years The 2-Year Upgrade Program allows for a device upgrade following a full 24
months of use at the government flat rate purchase price. offering existing FCPS and FCG Corporate-Liable
Active Units who purchase their discounted device based on the 1-Year Net Price with a Minimum Service
Term of 12 months the ability to upgrade or replace that device after 12 months of continuous service,
Office of the Deputy Director
for Administration
Renee Bryant
RJH Air Conditioning &
Refrigeration Services
The Children's Guild, Inc. $725,545.60 0100 Local Sole Source Therapeutic Group Home 10/1/2016 9/30/2017
F.4 Deliverables: Mandatory and Unusual Incident Reporting, Progress Notes, OYE pre and post
assessment, First Source Requirement, Emergency Response Plan and training provisions for emergency
Response Plan and Quarterly Expenditure Report.
Program Operations
Ransom Washington
Youth For Tomorrow $66,058.85 Local Emergency Therapeutic Group Home 12/13/2016 4/12/2017
F.4 Deliverables: Mandatory and Unusual Incident Reporting, Progress Notes, OYE pre and post
assessment, First Source Requirement, Emergency Response Plan and training provisions for emergency
Response Plan and Quarterly Expenditure Report.
Office of Well Being
Ransom Washington
AttachmentQ6_FY17 Contracts.xlsx Page 13 of 13
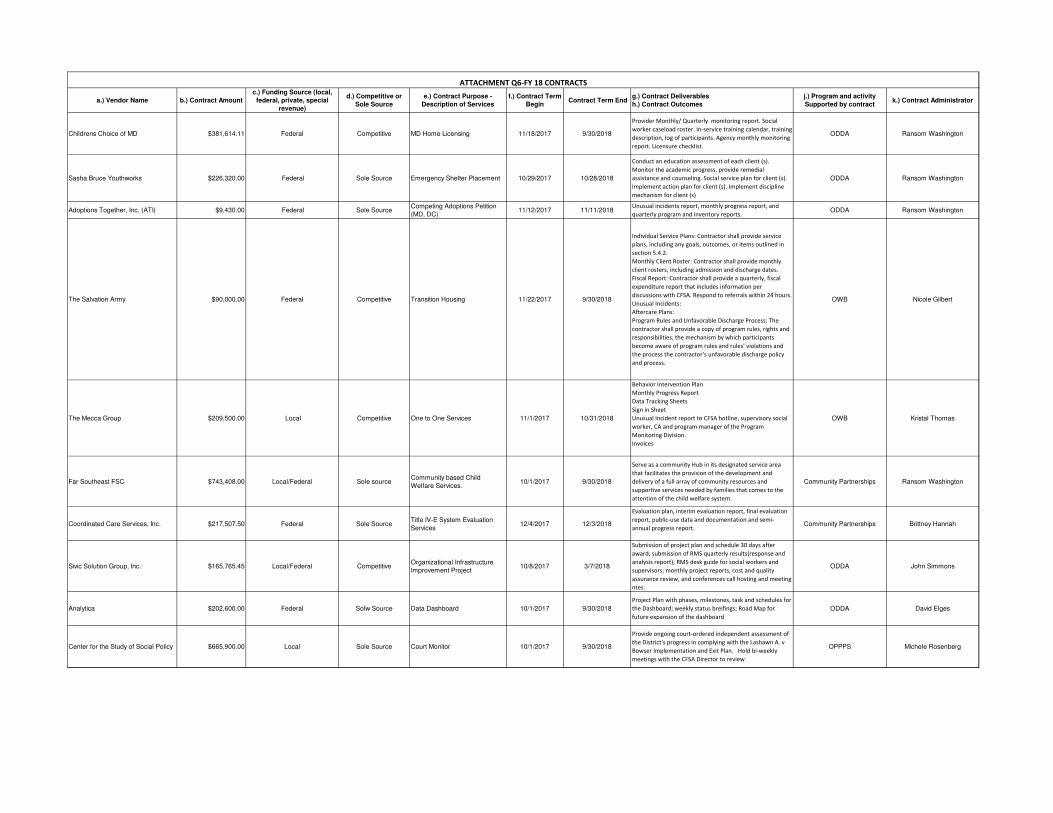
a.) Vendor Name b.) Contract Amount
c.) Funding Source (local,
federal, private, special
revenue)
d.) Competitive or
Sole Source
e.) Contract Purpose -
Description of Services
f.) Contract Term
Begin Contract Term End
g.) Contract Deliverables
h.) Contract Outcomes
j.) Program and activity
Supported by contractk.) Contract Administrator
Childrens Choice of MD $381,614.11 Federal Competitive MD Home Licensing 11/18/2017 9/30/2018
Provider Monthly/ Quarterly monitoring report. Social
worker caseload roster. In-service training calendar, training
description, log of participants. Agency monthly monitoring
report. Licensure checklist.
ODDA Ransom Washington
Sasha Bruce Youthworks $226,320.00 Federal Sole Source Emergency Shelter Placement 10/29/2017 10/28/2018
Conduct an education assessment of each client (s).
Monitor the academic progress, provide remedial
assistance and counseling. Social service plan for client (s).
Implement action plan for client (s). Implement discipline
mechanism for client (s)
ODDA Ransom Washington
Adoptions Together, Inc. (ATI) $9,430.00 Federal Sole SourceCompeting Adoptions Petition
(MD, DC)11/12/2017 11/11/2018
Unusual incidents report, monthly progress report, and
quarterly program and inventory reports.ODDA Ransom Washington
The Salvation Army $90,000.00 Federal Competitive Transition Housing 11/22/2017 9/30/2018
Individual Service Plans: Contractor shall provide service
plans, including any goals, outcomes, or items outlined in
section 5.4.2.
Monthly Client Roster: Contractor shall provide monthly
client rosters, including admission and discharge dates.
Fiscal Report: Contractor shall provide a quarterly, fiscal
expenditure report that includes information per
discussions with CFSA. Respond to referrals within 24 hours.
Unusual Incidents:
Aftercare Plans:
Program Rules and Unfavorable Discharge Process: The
contractor shall provide a copy of program rules, rights and
responsibilities, the mechanism by which participants
become aware of program rules and rules’ violations and
the process the contractor’s unfavorable discharge policy
and process.
OWB Nicole Gilbert
The Mecca Group $209,500.00 Local Competitive One to One Services 11/1/2017 10/31/2018
Behavior Intervention Plan
Monthly Progress Report
Data Tracking Sheets
Sign in Sheet
Unusual Incident report to CFSA hotline, supervisory social
worker, CA and program manager of the Program
Monitoring Division.
Invoices
OWB Kristal Thomas
Far Southeast FSC $743,408.00 Local/Federal Sole sourceCommunity based Child
Welfare Services.10/1/2017 9/30/2018
Serve as a community Hub in its designated service area
that facilitates the provision of the development and
delivery of a full array of community resources and
supportive services needed by families that comes to the
attention of the child welfare system.
Community Partnerships Ransom Washington
Coordinated Care Services, Inc. $217,507.50 Federal Sole SourceTitle IV-E System Evaluation
Services12/4/2017 12/3/2018
Evaluation plan, interim evaluation report, final evaluation
report, public-use data and documentation and semi-
annual progress report.Community Partnerships Brittney Hannah
Sivic Solution Group, Inc. $165,765.45 Local/Federal CompetitiveOrganizational Infrastructure
Improvement Project10/8/2017 3/7/2018
Submission of project plan and schedule 30 days after
award; submission of RMS quarterly results(response and
analysis report); RMS desk guide for social workers and
supervisors; monthly project reports, cost and quality
assurance review, and conferences call hosting and meeting
ntes.
ODDA John Simmons
Analytica $202,600.00 Federal Solw Source Data Dashboard 10/1/2017 9/30/2018
Project Plan with phases, milestones, task and schedules for
the Dashboard; weekly status breifings; Road Map for
future expansion of the dashboard
ODDA David Elges
Center for the Study of Social Policy $665,900.00 Local Sole Source Court Monitor 10/1/2017 9/30/2018
Provide ongoing court-ordered independent assessment of
the District's progress in complying with the Lashawn A. v
Bowser Implementation and Exit Plan. Hold bi-weekly
meetings with the CFSA Director to review
OPPPS Michele Rosenberg
ATTACHMENT Q6-FY 18 CONTRACTS
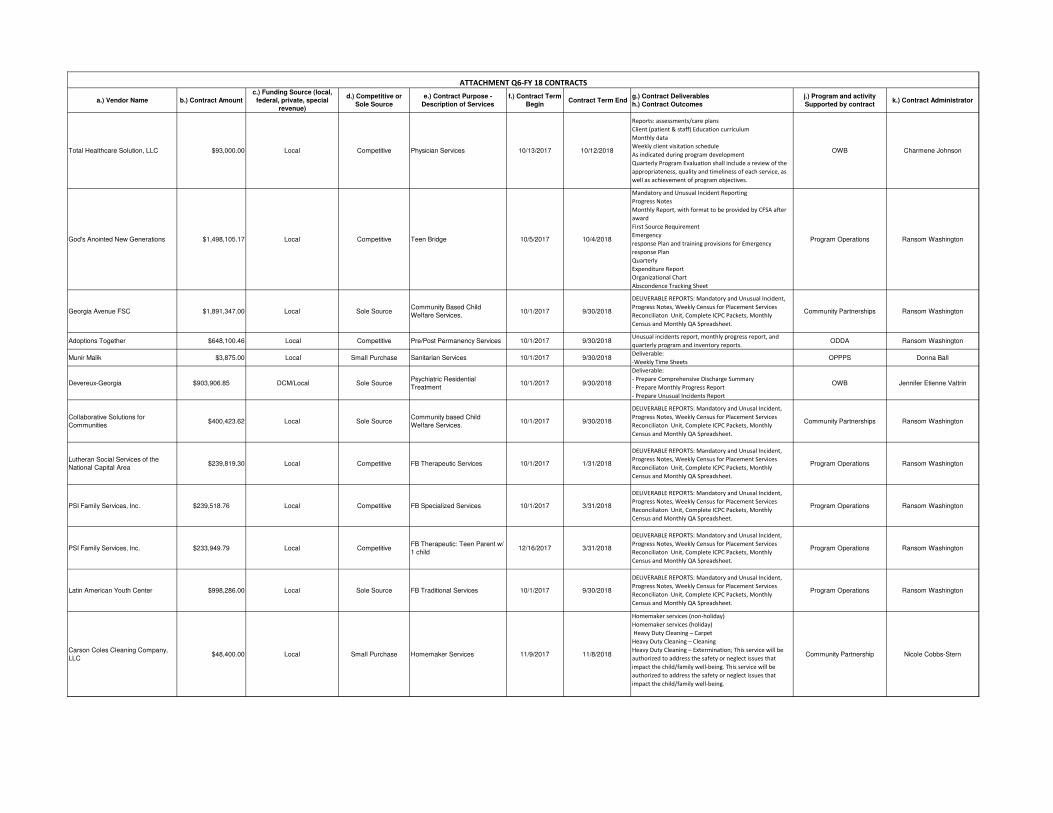
a.) Vendor Name b.) Contract Amount
c.) Funding Source (local,
federal, private, special
revenue)
d.) Competitive or
Sole Source
e.) Contract Purpose -
Description of Services
f.) Contract Term
Begin Contract Term End
g.) Contract Deliverables
h.) Contract Outcomes
j.) Program and activity
Supported by contractk.) Contract Administrator
ATTACHMENT Q6-FY 18 CONTRACTS
Total Healthcare Solution, LLC $93,000.00 Local Competitive Physician Services 10/13/2017 10/12/2018
Reports: assessments/care plans
Client (patient & staff) Education curriculum
Monthly data
Weekly client visitation schedule
As indicated during program development
Quarterly Program Evaluation shall include a review of the
appropriateness, quality and timeliness of each service, as
well as achievement of program objectives.
OWB Charmene Johnson
God's Anointed New Generations $1,498,105.17 Local Competitive Teen Bridge 10/5/2017 10/4/2018
Mandatory and Unusual Incident Reporting
Progress Notes
Monthly Report, with format to be provided by CFSA after
award
First Source Requirement
Emergency
response Plan and training provisions for Emergency
response Plan
Quarterly
Expenditure Report
Organizational Chart
Abscondence Tracking Sheet
Program Operations Ransom Washington
Georgia Avenue FSC $1,891,347.00 Local Sole SourceCommunity Based Child
Welfare Services.10/1/2017 9/30/2018
DELIVERABLE REPORTS: Mandatory and Unusual Incident,
Progress Notes, Weekly Census for Placement Services
Reconciliaton Unit, Complete ICPC Packets, Monthly
Census and Monthly QA Spreadsheet.
Community Partnerships Ransom Washington
Adoptions Together $648,100.46 Local Competitive Pre/Post Permanency Services 10/1/2017 9/30/2018Unusual incidents report, monthly progress report, and
quarterly program and inventory reports.ODDA Ransom Washington
Munir Malik $3,875.00 Local Small Purchase Sanitarian Services 10/1/2017 9/30/2018Deliverable:
-Weekly Time SheetsOPPPS Donna Ball
Devereux-Georgia $903,906.85 DCM/Local Sole SourcePsychiatric Residential
Treatment 10/1/2017 9/30/2018
Deliverable:
- Prepare Comprehensive Discharge Summary
- Prepare Monthly Progress Report
- Prepare Unusual Incidents Report
OWB Jennifer Etienne Valtrin
Collaborative Solutions for
Communities$400,423.62 Local Sole Source
Community based Child
Welfare Services.10/1/2017 9/30/2018
DELIVERABLE REPORTS: Mandatory and Unusal Incident,
Progress Notes, Weekly Census for Placement Services
Reconciliaton Unit, Complete ICPC Packets, Monthly
Census and Monthly QA Spreadsheet.
Community Partnerships Ransom Washington
Lutheran Social Services of the
National Capital Area$239,819.30 Local Competitive FB Therapeutic Services 10/1/2017 1/31/2018
DELIVERABLE REPORTS: Mandatory and Unusal Incident,
Progress Notes, Weekly Census for Placement Services
Reconciliaton Unit, Complete ICPC Packets, Monthly
Census and Monthly QA Spreadsheet.
Program Operations Ransom Washington
PSI Family Services, Inc. $239,518.76 Local Competitive FB Specialized Services 10/1/2017 3/31/2018
DELIVERABLE REPORTS: Mandatory and Unusal Incident,
Progress Notes, Weekly Census for Placement Services
Reconciliaton Unit, Complete ICPC Packets, Monthly
Census and Monthly QA Spreadsheet.
Program Operations Ransom Washington
PSI Family Services, Inc. $233,949.79 Local CompetitiveFB Therapeutic: Teen Parent w/
1 child12/16/2017 3/31/2018
DELIVERABLE REPORTS: Mandatory and Unusal Incident,
Progress Notes, Weekly Census for Placement Services
Reconciliaton Unit, Complete ICPC Packets, Monthly
Census and Monthly QA Spreadsheet.
Program Operations Ransom Washington
Latin American Youth Center $998,286.00 Local Sole Source FB Traditional Services 10/1/2017 9/30/2018
DELIVERABLE REPORTS: Mandatory and Unusal Incident,
Progress Notes, Weekly Census for Placement Services
Reconciliaton Unit, Complete ICPC Packets, Monthly
Census and Monthly QA Spreadsheet.
Program Operations Ransom Washington
Carson Coles Cleaning Company,
LLC$48,400.00 Local Small Purchase Homemaker Services 11/9/2017 11/8/2018
Homemaker services (non-holiday)
Homemaker services (holiday)
Heavy Duty Cleaning – Carpet
Heavy Duty Cleaning – Cleaning
Heavy Duty Cleaning – Extermination; This service will be
authorized to address the safety or neglect issues that
impact the child/family well-being. This service will be
authorized to address the safety or neglect issues that
impact the child/family well-being.
Community Partnership Nicole Cobbs-Stern
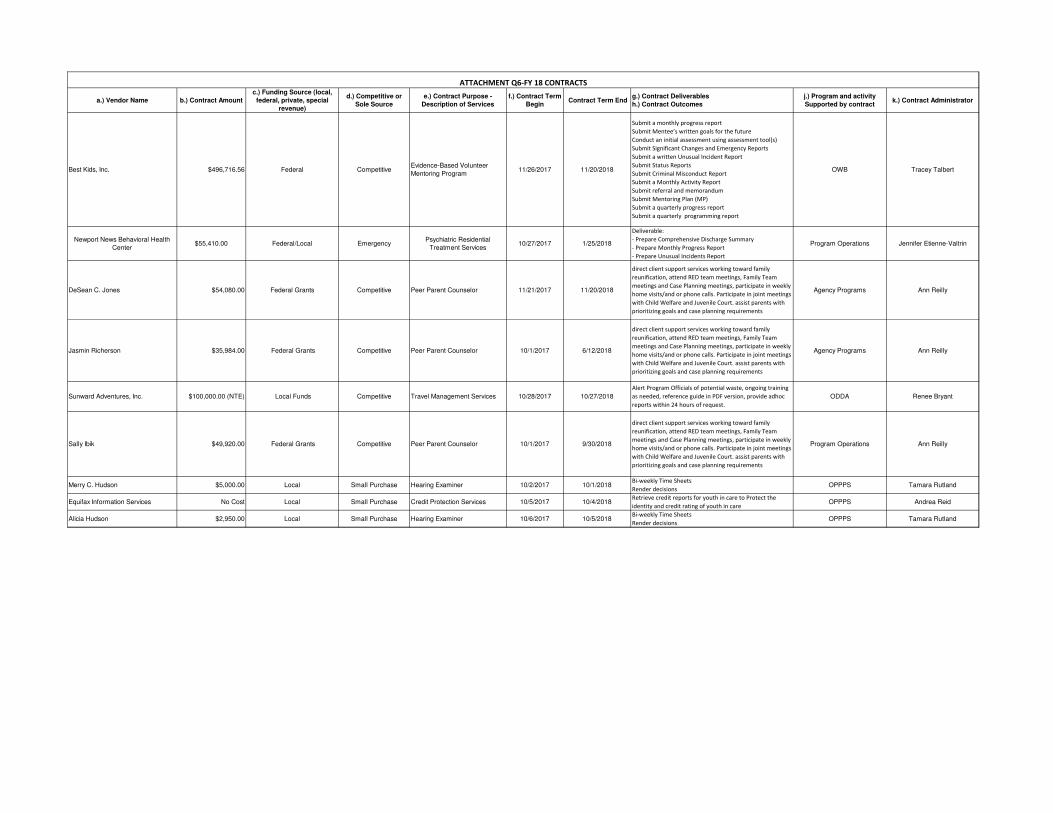
a.) Vendor Name b.) Contract Amount
c.) Funding Source (local,
federal, private, special
revenue)
d.) Competitive or
Sole Source
e.) Contract Purpose -
Description of Services
f.) Contract Term
Begin Contract Term End
g.) Contract Deliverables
h.) Contract Outcomes
j.) Program and activity
Supported by contractk.) Contract Administrator
ATTACHMENT Q6-FY 18 CONTRACTS
Best Kids, Inc. $496,716.56 Federal CompetitiveEvidence-Based Volunteer
Mentoring Program11/26/2017 11/20/2018
Submit a monthly progress report
Submit Mentee’s written goals for the future
Conduct an initial assessment using assessment tool(s)
Submit Significant Changes and Emergency Reports
Submit a written Unusual Incident Report
Submit Status Reports
Submit Criminal Misconduct Report
Submit a Monthly Activity Report
Submit referral and memorandum
Submit Mentoring Plan (MP)
Submit a quarterly progress report
Submit a quarterly programming report
OWB Tracey Talbert
Newport News Behavioral Health
Center$55,410.00 Federal/Local Emergency
Psychiatric Residential
Treatment Services10/27/2017 1/25/2018
Deliverable:
- Prepare Comprehensive Discharge Summary
- Prepare Monthly Progress Report
- Prepare Unusual Incidents Report
Program Operations Jennifer Etienne-Valtrin
DeSean C. Jones $54,080.00 Federal Grants Competitive Peer Parent Counselor 11/21/2017 11/20/2018
direct client support services working toward family
reunification, attend RED team meetings, Family Team
meetings and Case Planning meetings, participate in weekly
home visits/and or phone calls. Participate in joint meetings
with Child Welfare and Juvenile Court. assist parents with
prioritizing goals and case planning requirements
Agency Programs Ann Reilly
Jasmin Richerson $35,984.00 Federal Grants Competitive Peer Parent Counselor 10/1/2017 6/12/2018
direct client support services working toward family
reunification, attend RED team meetings, Family Team
meetings and Case Planning meetings, participate in weekly
home visits/and or phone calls. Participate in joint meetings
with Child Welfare and Juvenile Court. assist parents with
prioritizing goals and case planning requirements
Agency Programs Ann Reilly
Sunward Adventures, Inc. $100,000.00 (NTE) Local Funds Competitive Travel Management Services 10/28/2017 10/27/2018
Alert Program Officials of potential waste, ongoing training
as needed, reference guide in PDF version, provide adhoc
reports within 24 hours of request.
ODDA Renee Bryant
Sally Ibik $49,920.00 Federal Grants Competitive Peer Parent Counselor 10/1/2017 9/30/2018
direct client support services working toward family
reunification, attend RED team meetings, Family Team
meetings and Case Planning meetings, participate in weekly
home visits/and or phone calls. Participate in joint meetings
with Child Welfare and Juvenile Court. assist parents with
prioritizing goals and case planning requirements
Program Operations Ann Reilly
Merry C. Hudson $5,000.00 Local Small Purchase Hearing Examiner 10/2/2017 10/1/2018Bi-weekly Time Sheets
Render decisionsOPPPS Tamara Rutland
Equifax Information Services No Cost Local Small Purchase Credit Protection Services 10/5/2017 10/4/2018Retrieve credit reports for youth in care to Protect the
identity and credit rating of youth in careOPPPS Andrea Reid
Alicia Hudson $2,950.00 Local Small Purchase Hearing Examiner 10/6/2017 10/5/2018Bi-weekly Time Sheets
Render decisionsOPPPS Tamara Rutland
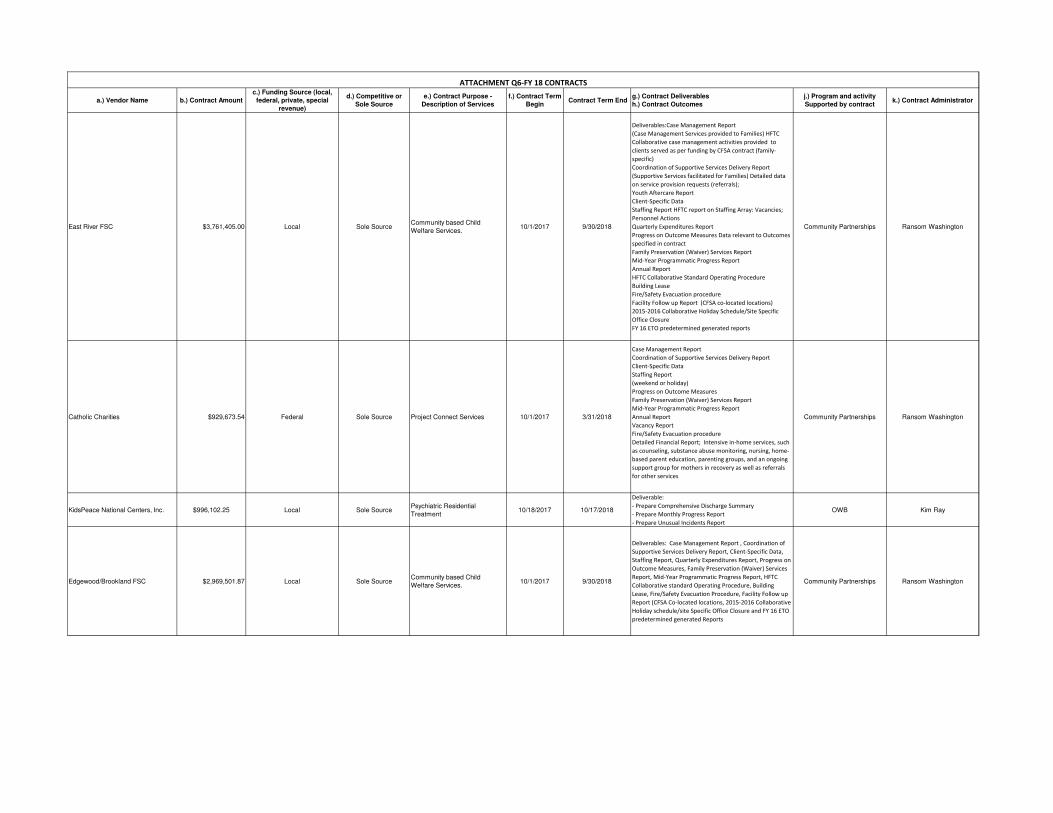
a.) Vendor Name b.) Contract Amount
c.) Funding Source (local,
federal, private, special
revenue)
d.) Competitive or
Sole Source
e.) Contract Purpose -
Description of Services
f.) Contract Term
Begin Contract Term End
g.) Contract Deliverables
h.) Contract Outcomes
j.) Program and activity
Supported by contractk.) Contract Administrator
ATTACHMENT Q6-FY 18 CONTRACTS
East River FSC $3,761,405.00 Local Sole SourceCommunity based Child
Welfare Services.10/1/2017 9/30/2018
Deliverables:Case Management Report
(Case Management Services provided to Families) HFTC
Collaborative case management activities provided to
clients served as per funding by CFSA contract (family-
specific)
Coordination of Supportive Services Delivery Report
(Supportive Services facilitated for Families) Detailed data
on service provision requests (referrals);
Youth Aftercare Report
Client-Specific Data
Staffing Report HFTC report on Staffing Array: Vacancies;
Personnel Actions
Quarterly Expenditures Report
Progress on Outcome Measures Data relevant to Outcomes
specified in contract
Family Preservation (Waiver) Services Report
Mid-Year Programmatic Progress Report
Annual Report
HFTC Collaborative Standard Operating Procedure
Building Lease
Fire/Safety Evacuation procedure
Facility Follow up Report (CFSA co-located locations)
2015-2016 Collaborative Holiday Schedule/Site Specific
Office Closure
FY 16 ETO predetermined generated reports
Community Partnerships Ransom Washington
Catholic Charities $929,673.54 Federal Sole Source Project Connect Services 10/1/2017 3/31/2018
Case Management Report
Coordination of Supportive Services Delivery Report
Client-Specific Data
Staffing Report
(weekend or holiday)
Progress on Outcome Measures
Family Preservation (Waiver) Services Report
Mid-Year Programmatic Progress Report
Annual Report
Vacancy Report
Fire/Safety Evacuation procedure
Detailed Financial Report; Intensive in-home services, such
as counseling, substance abuse monitoring, nursing, home-
based parent education, parenting groups, and an ongoing
support group for mothers in recovery as well as referrals
for other services
Community Partnerships Ransom Washington
KidsPeace National Centers, Inc. $996,102.25 Local Sole SourcePsychiatric Residential
Treatment 10/18/2017 10/17/2018
Deliverable:
- Prepare Comprehensive Discharge Summary
- Prepare Monthly Progress Report
- Prepare Unusual Incidents Report
OWB Kim Ray
Edgewood/Brookland FSC $2,969,501.87 Local Sole SourceCommunity based Child
Welfare Services.10/1/2017 9/30/2018
Deliverables: Case Management Report , Coordination of
Supportive Services Delivery Report, Client-Specific Data,
Staffing Report, Quarterly Expenditures Report, Progress on
Outcome Measures, Family Preservation (Waiver) Services
Report, Mid-Year Programmatic Progress Report, HFTC
Collaborative standard Operating Procedure, Building
Lease, Fire/Safety Evacuation Procedure, Facility Follow up
Report (CFSA Co-located locations, 2015-2016 Collaborative
Holiday schedule/site Specific Office Closure and FY 16 ETO
predetermined generated Reports
Community Partnerships Ransom Washington
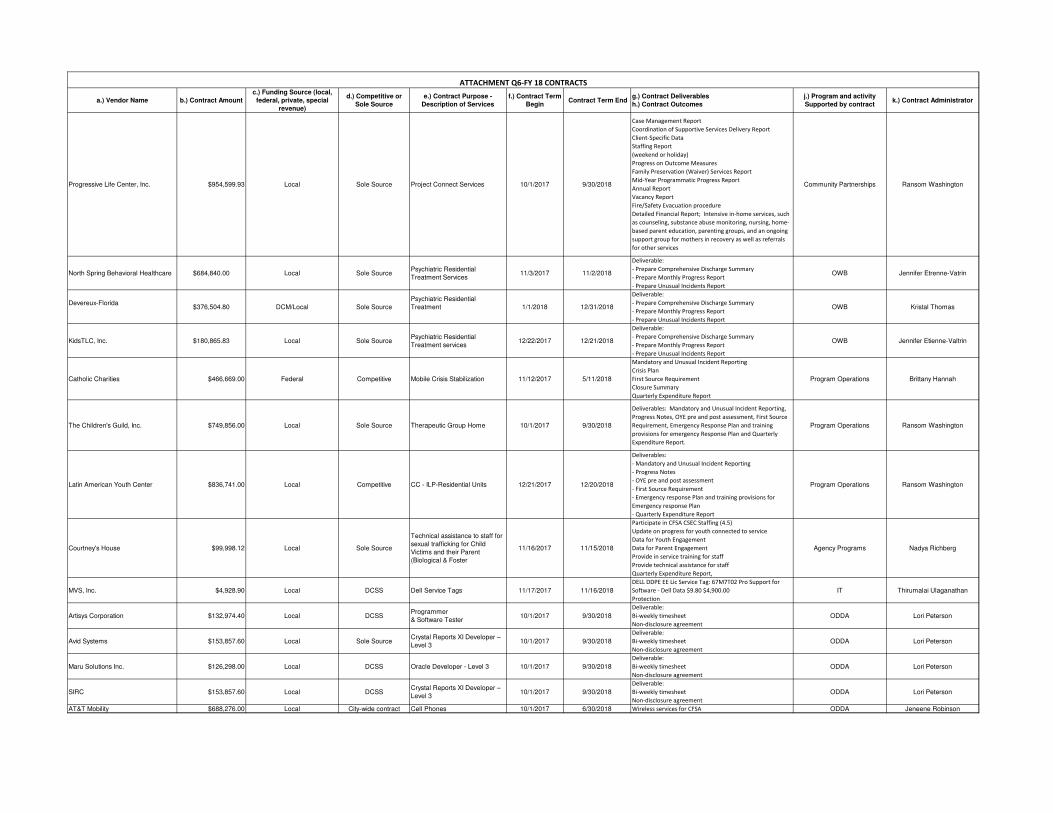
a.) Vendor Name b.) Contract Amount
c.) Funding Source (local,
federal, private, special
revenue)
d.) Competitive or
Sole Source
e.) Contract Purpose -
Description of Services
f.) Contract Term
Begin Contract Term End
g.) Contract Deliverables
h.) Contract Outcomes
j.) Program and activity
Supported by contractk.) Contract Administrator
ATTACHMENT Q6-FY 18 CONTRACTS
Progressive Life Center, Inc. $954,599.93 Local Sole Source Project Connect Services 10/1/2017 9/30/2018
Case Management Report
Coordination of Supportive Services Delivery Report
Client-Specific Data
Staffing Report
(weekend or holiday)
Progress on Outcome Measures
Family Preservation (Waiver) Services Report
Mid-Year Programmatic Progress Report
Annual Report
Vacancy Report
Fire/Safety Evacuation procedure
Detailed Financial Report; Intensive in-home services, such
as counseling, substance abuse monitoring, nursing, home-
based parent education, parenting groups, and an ongoing
support group for mothers in recovery as well as referrals
for other services
Community Partnerships Ransom Washington
North Spring Behavioral Healthcare $684,840.00 Local Sole SourcePsychiatric Residential
Treatment Services11/3/2017 11/2/2018
Deliverable:
- Prepare Comprehensive Discharge Summary
- Prepare Monthly Progress Report
- Prepare Unusual Incidents Report
OWB Jennifer Etrenne-Vatrin
Devereux-Florida$376,504.80 DCM/Local Sole Source
Psychiatric Residential
Treatment 1/1/2018 12/31/2018
Deliverable:
- Prepare Comprehensive Discharge Summary
- Prepare Monthly Progress Report
- Prepare Unusual Incidents Report
OWB Kristal Thomas
KidsTLC, Inc. $180,865.83 Local Sole SourcePsychiatric Residential
Treatment services12/22/2017 12/21/2018
Deliverable:
- Prepare Comprehensive Discharge Summary
- Prepare Monthly Progress Report
- Prepare Unusual Incidents Report
OWB Jennifer Etienne-Valtrin
Catholic Charities $466,669.00 Federal Competitive Mobile Crisis Stabilization 11/12/2017 5/11/2018
Mandatory and Unusual Incident Reporting
Crisis Plan
First Source Requirement
Closure Summary
Quarterly Expenditure Report
Program Operations Brittany Hannah
The Children's Guild, Inc. $749,856.00 Local Sole Source Therapeutic Group Home 10/1/2017 9/30/2018
Deliverables: Mandatory and Unusual Incident Reporting,
Progress Notes, OYE pre and post assessment, First Source
Requirement, Emergency Response Plan and training
provisions for emergency Response Plan and Quarterly
Expenditure Report.
Program Operations Ransom Washington
Latin American Youth Center $836,741.00 Local Competitive CC - ILP-Residential Units 12/21/2017 12/20/2018
Deliverables:
- Mandatory and Unusual Incident Reporting
- Progress Notes
- OYE pre and post assessment
- First Source Requirement
- Emergency response Plan and training provisions for
Emergency response Plan
- Quarterly Expenditure Report
Program Operations Ransom Washington
Courtney's House $99,998.12 Local Sole Source
Technical assistance to staff for
sexual trafficking for Child
Victims and their Parent
(Biological & Foster
11/16/2017 11/15/2018
Participate in CFSA CSEC Staffing (4.5)
Update on progress for youth connected to service
Data for Youth Engagement
Data for Parent Engagement
Provide in service training for staff
Provide technical assistance for staff
Quarterly Expenditure Report,
Agency Programs Nadya Richberg
MVS, Inc. $4,928.90 Local DCSS Dell Service Tags 11/17/2017 11/16/2018
DELL DDPE EE Lic Service Tag: 67M7T02 Pro Support for
Software - Dell Data $9.80 $4,900.00
Protection
IT Thirumalai Ulaganathan
Artisys Corporation $132,974.40 Local DCSSProgrammer
& Software Tester10/1/2017 9/30/2018
Deliverable:
Bi-weekly timesheet
Non-disclosure agreement
ODDA Lori Peterson
Avid Systems $153,857.60 Local Sole SourceCrystal Reports XI Developer –
Level 310/1/2017 9/30/2018
Deliverable:
Bi-weekly timesheet
Non-disclosure agreement
ODDA Lori Peterson
Maru Solutions Inc. $126,298.00 Local DCSS Oracle Developer - Level 3 10/1/2017 9/30/2018
Deliverable:
Bi-weekly timesheet
Non-disclosure agreement
ODDA Lori Peterson
SIRC $153,857.60 Local DCSSCrystal Reports XI Developer –
Level 310/1/2017 9/30/2018
Deliverable:
Bi-weekly timesheet
Non-disclosure agreement
ODDA Lori Peterson
AT&T Mobility $688,276.00 Local City-wide contract Cell Phones 10/1/2017 6/30/2018 Wireless services for CFSA ODDA Jeneene Robinson
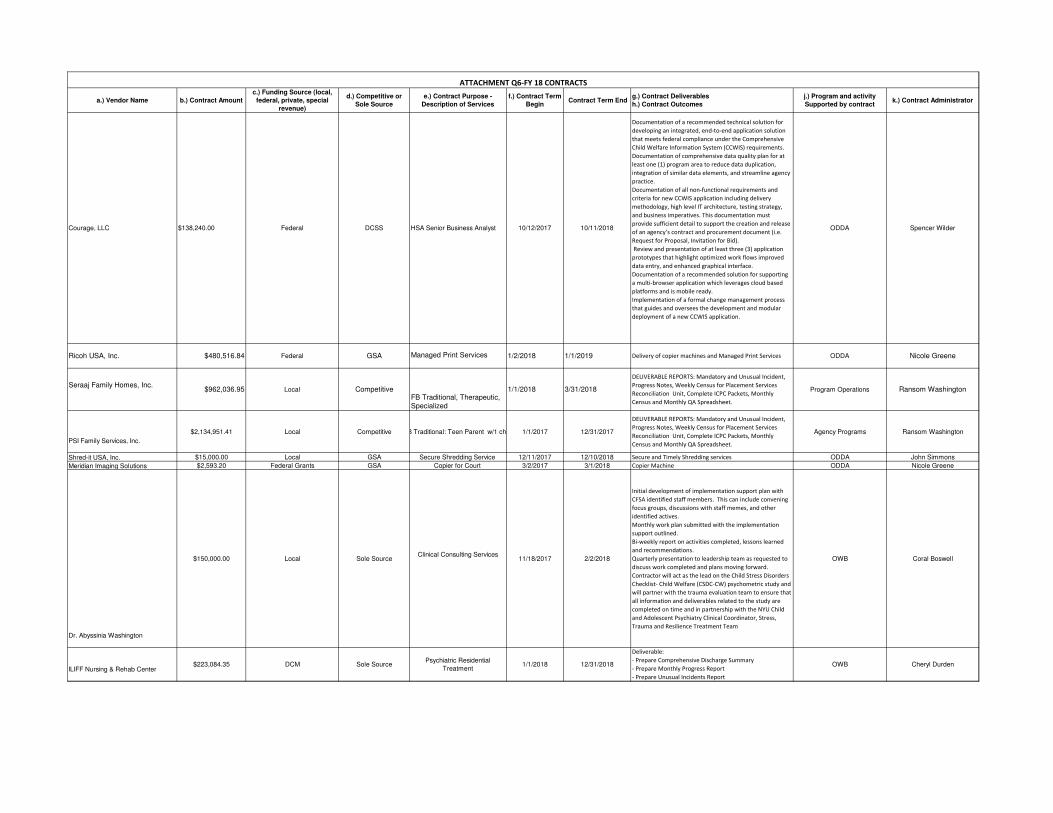
a.) Vendor Name b.) Contract Amount
c.) Funding Source (local,
federal, private, special
revenue)
d.) Competitive or
Sole Source
e.) Contract Purpose -
Description of Services
f.) Contract Term
Begin Contract Term End
g.) Contract Deliverables
h.) Contract Outcomes
j.) Program and activity
Supported by contractk.) Contract Administrator
ATTACHMENT Q6-FY 18 CONTRACTS
Courage, LLC $138,240.00 Federal DCSS HSA Senior Business Analyst 10/12/2017 10/11/2018
Documentation of a recommended technical solution for
developing an integrated, end-to-end application solution
that meets federal compliance under the Comprehensive
Child Welfare Information System (CCWIS) requirements.
Documentation of comprehensive data quality plan for at
least one (1) program area to reduce data duplication,
integration of similar data elements, and streamline agency
practice.
Documentation of all non-functional requirements and
criteria for new CCWIS application including delivery
methodology, high level IT architecture, testing strategy,
and business imperatives. This documentation must
provide sufficient detail to support the creation and release
of an agency’s contract and procurement document (i.e.
Request for Proposal, Invitation for Bid).
Review and presentation of at least three (3) application
prototypes that highlight optimized work flows improved
data entry, and enhanced graphical interface.
Documentation of a recommended solution for supporting
a multi-browser application which leverages cloud based
platforms and is mobile ready.
Implementation of a formal change management process
that guides and oversees the development and modular
deployment of a new CCWIS application.
ODDA Spencer Wilder
Ricoh USA, Inc. $480,516.84 Federal GSA Managed Print Services 1/2/2018 1/1/2019 Delivery of copier machines and Managed Print Services ODDA Nicole Greene
Seraaj Family Homes, Inc.$962,036.95 Local Competitive
FB Traditional, Therapeutic, Specialized
1/1/2018 3/31/2018
DELIVERABLE REPORTS: Mandatory and Unusual Incident,
Progress Notes, Weekly Census for Placement Services
Reconciliation Unit, Complete ICPC Packets, Monthly
Census and Monthly QA Spreadsheet.
Program Operations Ransom Washington
PSI Family Services, Inc.
$2,134,951.41 Local Competitive FB Traditional: Teen Parent w/1 child 1/1/2017 12/31/2017
DELIVERABLE REPORTS: Mandatory and Unusual Incident,
Progress Notes, Weekly Census for Placement Services
Reconciliation Unit, Complete ICPC Packets, Monthly
Census and Monthly QA Spreadsheet.
Agency Programs Ransom Washington
Shred-it USA, Inc. $15,000.00 Local GSA Secure Shredding Service 12/11/2017 12/10/2018 Secure and Timely Shredding services ODDA John Simmons
Meridian Imaging Solutions $2,593.20 Federal Grants GSA Copier for Court 3/2/2017 3/1/2018 Copier Machine ODDA Nicole Greene
Dr. Abyssinia Washington
$150,000.00 Local Sole SourceClinical Consulting Services
11/18/2017 2/2/2018
Initial development of implementation support plan with
CFSA identified staff members. This can include convening
focus groups, discussions with staff memes, and other
identified actives.
Monthly work plan submitted with the implementation
support outlined.
Bi-weekly report on activities completed, lessons learned
and recommendations.
Quarterly presentation to leadership team as requested to
discuss work completed and plans moving forward.
Contractor will act as the lead on the Child Stress Disorders
Checklist- Child Welfare (CSDC-CW) psychometric study and
will partner with the trauma evaluation team to ensure that
all information and deliverables related to the study are
completed on time and in partnership with the NYU Child
and Adolescent Psychiatry Clinical Coordinator, Stress,
Trauma and Resilience Treatment Team
OWB Coral Boswell
ILIFF Nursing & Rehab Center$223,084.35 DCM Sole Source
Psychiatric Residential
Treatment 1/1/2018 12/31/2018
Deliverable:
- Prepare Comprehensive Discharge Summary
- Prepare Monthly Progress Report
- Prepare Unusual Incidents Report
OWB Cheryl Durden
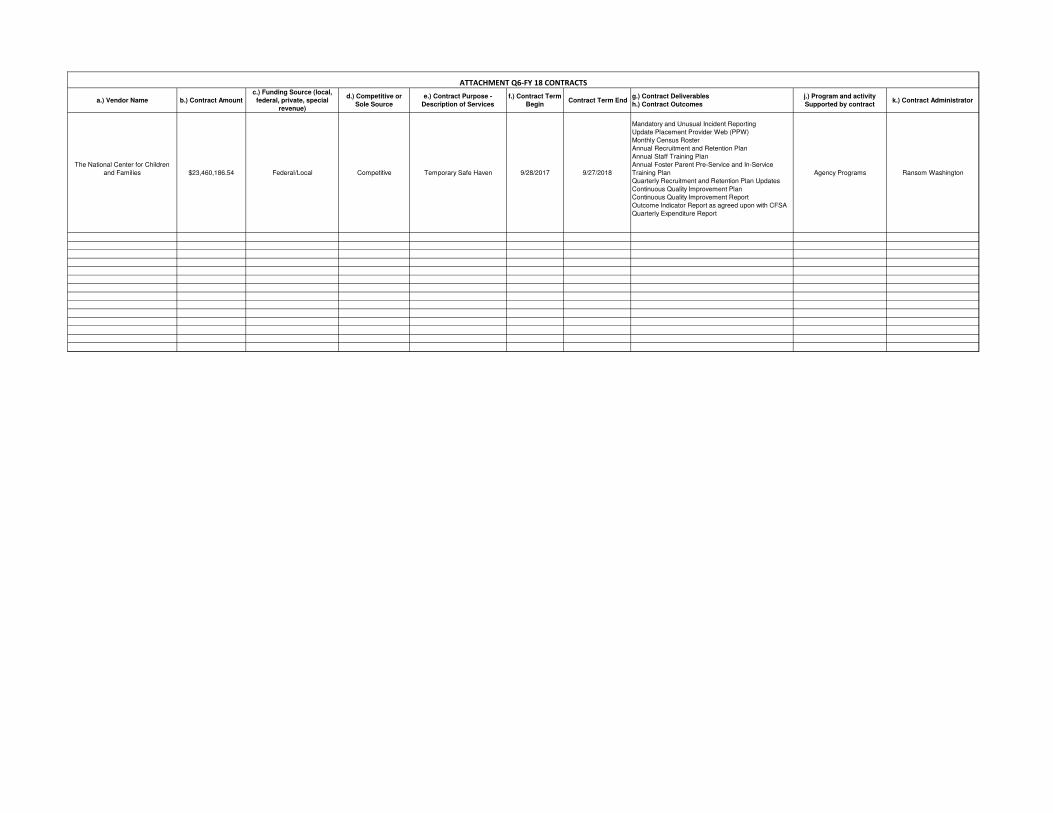
a.) Vendor Name b.) Contract Amount
c.) Funding Source (local,
federal, private, special
revenue)
d.) Competitive or
Sole Source
e.) Contract Purpose -
Description of Services
f.) Contract Term
Begin Contract Term End
g.) Contract Deliverables
h.) Contract Outcomes
j.) Program and activity
Supported by contractk.) Contract Administrator
ATTACHMENT Q6-FY 18 CONTRACTS
The National Center for Children
and Families $23,460,186.54 Federal/Local Competitive Temporary Safe Haven 9/28/2017 9/27/2018
Mandatory and Unusual Incident Reporting
Update Placement Provider Web (PPW)
Monthly Census Roster
Annual Recruitment and Retention Plan
Annual Staff Training Plan
Annual Foster Parent Pre-Service and In-Service
Training Plan
Quarterly Recruitment and Retention Plan Updates
Continuous Quality Improvement Plan
Continuous Quality Improvement Report
Outcome Indicator Report as agreed upon with CFSA
Quarterly Expenditure Report
Agency Programs Ransom Washington
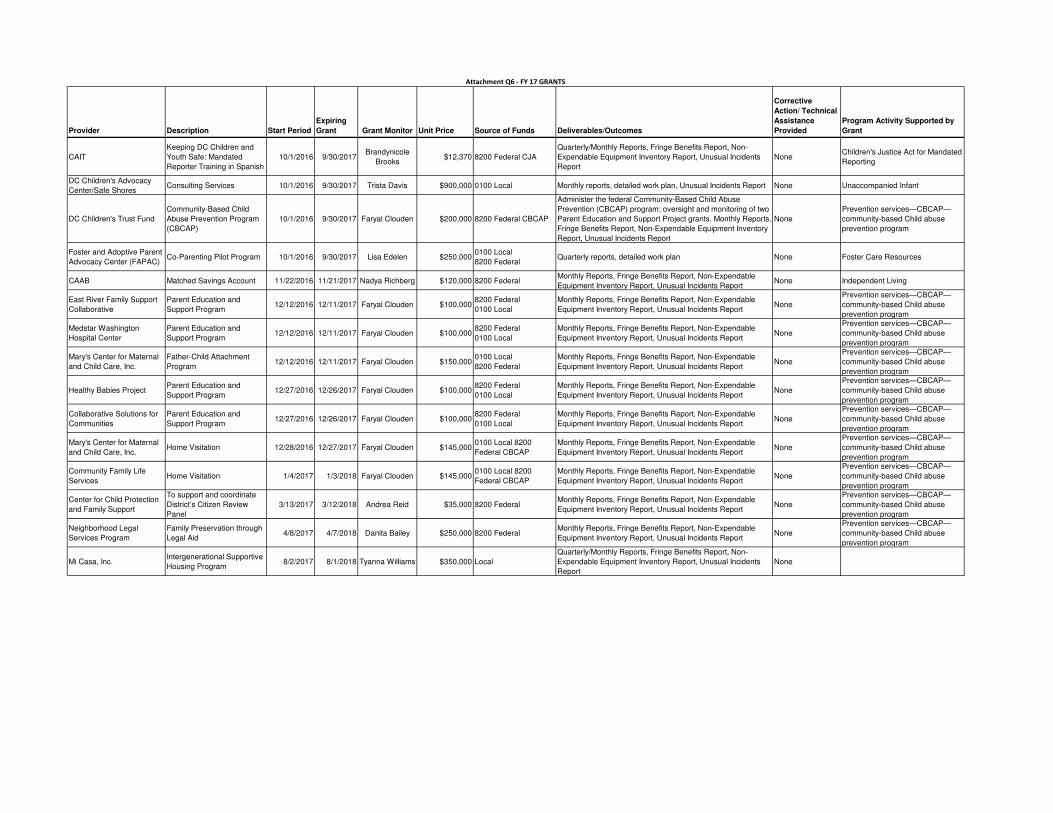
Provider Description Start Period
Expiring
Grant Grant Monitor Unit Price Source of Funds Deliverables/Outcomes
Corrective
Action/ Technical
Assistance
Provided
Program Activity Supported by
Grant
CAIT
Keeping DC Children and
Youth Safe: Mandated
Reporter Training in Spanish
10/1/2016 9/30/2017Brandynicole
Brooks$12,370 8200 Federal CJA
Quarterly/Monthly Reports, Fringe Benefits Report, Non-
Expendable Equipment Inventory Report, Unusual Incidents
Report
NoneChildren's Justice Act for Mandated
Reporting
DC Children's Advocacy
Center/Safe ShoresConsulting Services 10/1/2016 9/30/2017 Trista Davis $900,000 0100 Local Monthly reports, detailed work plan, Unusual Incidents Report None Unaccompanied Infant
DC Children's Trust Fund
Community-Based Child
Abuse Prevention Program
(CBCAP)
10/1/2016 9/30/2017 Faryal Clouden $200,000 8200 Federal CBCAP
Administer the federal Community-Based Child Abuse
Prevention (CBCAP) program; oversight and monitoring of two
Parent Education and Support Project grants. Monthly Reports,
Fringe Benefits Report, Non-Expendable Equipment Inventory
Report, Unusual Incidents Report
None
Prevention services—CBCAP—
community-based Child abuse
prevention program
Foster and Adoptive Parent
Advocacy Center (FAPAC)Co-Parenting Pilot Program 10/1/2016 9/30/2017 Lisa Edelen $250,000
0100 Local
8200 FederalQuarterly reports, detailed work plan None Foster Care Resources
CAAB Matched Savings Account 11/22/2016 11/21/2017 Nadya Richberg $120,000 8200 FederalMonthly Reports, Fringe Benefits Report, Non-Expendable
Equipment Inventory Report, Unusual Incidents ReportNone Independent Living
East River Family Support
Collaborative
Parent Education and
Support Program12/12/2016 12/11/2017 Faryal Clouden $100,000
8200 Federal
0100 Local
Monthly Reports, Fringe Benefits Report, Non-Expendable
Equipment Inventory Report, Unusual Incidents ReportNone
Prevention services—CBCAP—
community-based Child abuse
prevention program
Medstar Washington
Hospital Center
Parent Education and
Support Program12/12/2016 12/11/2017 Faryal Clouden $100,000
8200 Federal
0100 Local
Monthly Reports, Fringe Benefits Report, Non-Expendable
Equipment Inventory Report, Unusual Incidents ReportNone
Prevention services—CBCAP—
community-based Child abuse
prevention program
Mary's Center for Maternal
and Child Care, Inc.
Father-Child Attachment
Program12/12/2016 12/11/2017 Faryal Clouden $150,000
0100 Local
8200 Federal
Monthly Reports, Fringe Benefits Report, Non-Expendable
Equipment Inventory Report, Unusual Incidents ReportNone
Prevention services—CBCAP—
community-based Child abuse
prevention program
Healthy Babies ProjectParent Education and
Support Program12/27/2016 12/26/2017 Faryal Clouden $100,000
8200 Federal
0100 Local
Monthly Reports, Fringe Benefits Report, Non-Expendable
Equipment Inventory Report, Unusual Incidents ReportNone
Prevention services—CBCAP—
community-based Child abuse
prevention program
Collaborative Solutions for
Communities
Parent Education and
Support Program12/27/2016 12/26/2017 Faryal Clouden $100,000
8200 Federal
0100 Local
Monthly Reports, Fringe Benefits Report, Non-Expendable
Equipment Inventory Report, Unusual Incidents ReportNone
Prevention services—CBCAP—
community-based Child abuse
prevention program
Mary's Center for Maternal
and Child Care, Inc.Home Visitation 12/28/2016 12/27/2017 Faryal Clouden $145,000
0100 Local 8200
Federal CBCAP
Monthly Reports, Fringe Benefits Report, Non-Expendable
Equipment Inventory Report, Unusual Incidents ReportNone
Prevention services—CBCAP—
community-based Child abuse
prevention program
Community Family Life
ServicesHome Visitation 1/4/2017 1/3/2018 Faryal Clouden $145,000
0100 Local 8200
Federal CBCAP
Monthly Reports, Fringe Benefits Report, Non-Expendable
Equipment Inventory Report, Unusual Incidents ReportNone
Prevention services—CBCAP—
community-based Child abuse
prevention program
Center for Child Protection
and Family Support
To support and coordinate
District’s Citizen Review
Panel
3/13/2017 3/12/2018 Andrea Reid $35,000 8200 FederalMonthly Reports, Fringe Benefits Report, Non-Expendable
Equipment Inventory Report, Unusual Incidents ReportNone
Prevention services—CBCAP—
community-based Child abuse
prevention program
Neighborhood Legal
Services Program
Family Preservation through
Legal Aid4/8/2017 4/7/2018 Danita Bailey $250,000 8200 Federal
Monthly Reports, Fringe Benefits Report, Non-Expendable
Equipment Inventory Report, Unusual Incidents ReportNone
Prevention services—CBCAP—
community-based Child abuse
prevention program
Mi Casa, Inc.Intergenerational Supportive
Housing Program8/2/2017 8/1/2018 Tyanna Williams $350,000 Local
Quarterly/Monthly Reports, Fringe Benefits Report, Non-
Expendable Equipment Inventory Report, Unusual Incidents
Report
None
Attachment Q6 - FY 17 GRANTS
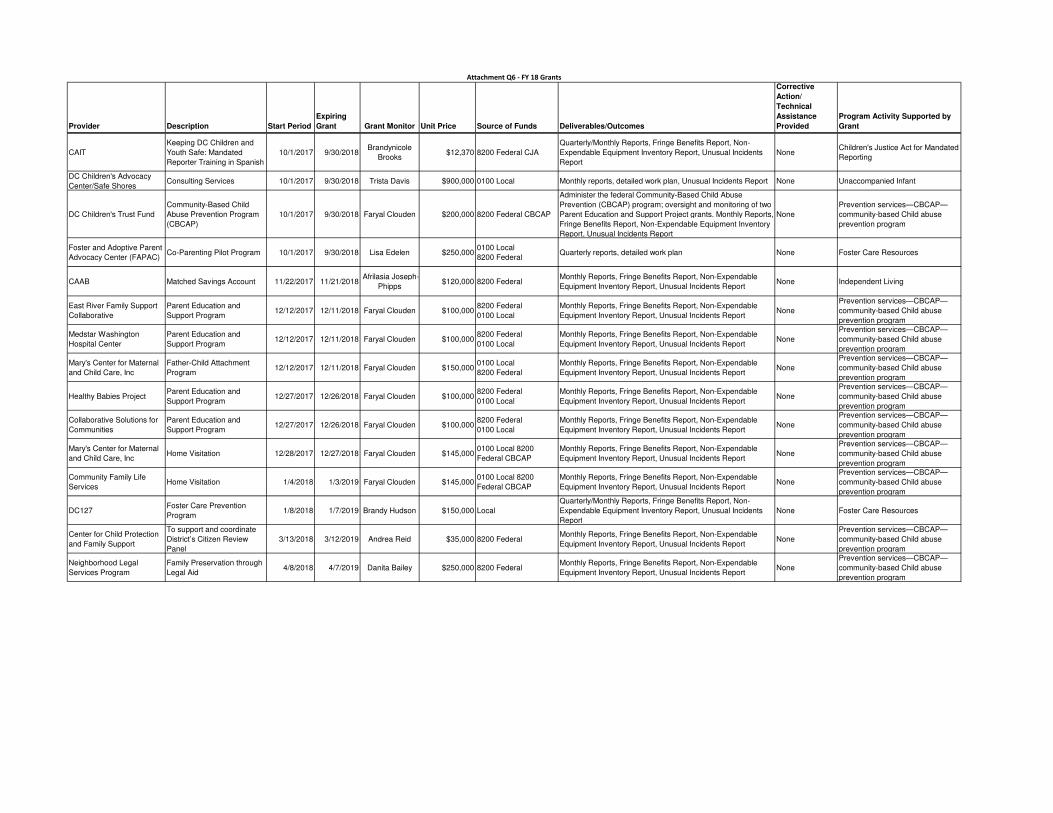
Provider Description Start Period
Expiring
Grant Grant Monitor Unit Price Source of Funds Deliverables/Outcomes
Corrective
Action/
Technical
Assistance
Provided
Program Activity Supported by
Grant
CAIT
Keeping DC Children and
Youth Safe: Mandated
Reporter Training in Spanish
10/1/2017 9/30/2018Brandynicole
Brooks$12,370 8200 Federal CJA
Quarterly/Monthly Reports, Fringe Benefits Report, Non-
Expendable Equipment Inventory Report, Unusual Incidents
Report
NoneChildren's Justice Act for Mandated
Reporting
DC Children's Advocacy
Center/Safe ShoresConsulting Services 10/1/2017 9/30/2018 Trista Davis $900,000 0100 Local Monthly reports, detailed work plan, Unusual Incidents Report None Unaccompanied Infant
DC Children's Trust Fund
Community-Based Child
Abuse Prevention Program
(CBCAP)
10/1/2017 9/30/2018 Faryal Clouden $200,000 8200 Federal CBCAP
Administer the federal Community-Based Child Abuse
Prevention (CBCAP) program; oversight and monitoring of two
Parent Education and Support Project grants. Monthly Reports,
Fringe Benefits Report, Non-Expendable Equipment Inventory
Report, Unusual Incidents Report
None
Prevention services—CBCAP—
community-based Child abuse
prevention program
Foster and Adoptive Parent
Advocacy Center (FAPAC)Co-Parenting Pilot Program 10/1/2017 9/30/2018 Lisa Edelen $250,000
0100 Local
8200 FederalQuarterly reports, detailed work plan None Foster Care Resources
CAAB Matched Savings Account 11/22/2017 11/21/2018Afrilasia Joseph-
Phipps$120,000 8200 Federal
Monthly Reports, Fringe Benefits Report, Non-Expendable
Equipment Inventory Report, Unusual Incidents ReportNone Independent Living
East River Family Support
Collaborative
Parent Education and
Support Program12/12/2017 12/11/2018 Faryal Clouden $100,000
8200 Federal
0100 Local
Monthly Reports, Fringe Benefits Report, Non-Expendable
Equipment Inventory Report, Unusual Incidents ReportNone
Prevention services—CBCAP—
community-based Child abuse
prevention program
Medstar Washington
Hospital Center
Parent Education and
Support Program12/12/2017 12/11/2018 Faryal Clouden $100,000
8200 Federal
0100 Local
Monthly Reports, Fringe Benefits Report, Non-Expendable
Equipment Inventory Report, Unusual Incidents ReportNone
Prevention services—CBCAP—
community-based Child abuse
prevention program
Mary's Center for Maternal
and Child Care, Inc
Father-Child Attachment
Program12/12/2017 12/11/2018 Faryal Clouden $150,000
0100 Local
8200 Federal
Monthly Reports, Fringe Benefits Report, Non-Expendable
Equipment Inventory Report, Unusual Incidents ReportNone
Prevention services—CBCAP—
community-based Child abuse
prevention program
Healthy Babies ProjectParent Education and
Support Program12/27/2017 12/26/2018 Faryal Clouden $100,000
8200 Federal
0100 Local
Monthly Reports, Fringe Benefits Report, Non-Expendable
Equipment Inventory Report, Unusual Incidents ReportNone
Prevention services—CBCAP—
community-based Child abuse
prevention program
Collaborative Solutions for
Communities
Parent Education and
Support Program12/27/2017 12/26/2018 Faryal Clouden $100,000
8200 Federal
0100 Local
Monthly Reports, Fringe Benefits Report, Non-Expendable
Equipment Inventory Report, Unusual Incidents ReportNone
Prevention services—CBCAP—
community-based Child abuse
prevention program
Mary's Center for Maternal
and Child Care, IncHome Visitation 12/28/2017 12/27/2018 Faryal Clouden $145,000
0100 Local 8200
Federal CBCAP
Monthly Reports, Fringe Benefits Report, Non-Expendable
Equipment Inventory Report, Unusual Incidents ReportNone
Prevention services—CBCAP—
community-based Child abuse
prevention program
Community Family Life
ServicesHome Visitation 1/4/2018 1/3/2019 Faryal Clouden $145,000
0100 Local 8200
Federal CBCAP
Monthly Reports, Fringe Benefits Report, Non-Expendable
Equipment Inventory Report, Unusual Incidents ReportNone
Prevention services—CBCAP—
community-based Child abuse
prevention program
DC127Foster Care Prevention
Program1/8/2018 1/7/2019 Brandy Hudson $150,000 Local
Quarterly/Monthly Reports, Fringe Benefits Report, Non-
Expendable Equipment Inventory Report, Unusual Incidents
Report
None Foster Care Resources
Center for Child Protection
and Family Support
To support and coordinate
District’s Citizen Review
Panel
3/13/2018 3/12/2019 Andrea Reid $35,000 8200 FederalMonthly Reports, Fringe Benefits Report, Non-Expendable
Equipment Inventory Report, Unusual Incidents ReportNone
Prevention services—CBCAP—
community-based Child abuse
prevention program
Neighborhood Legal
Services Program
Family Preservation through
Legal Aid4/8/2018 4/7/2019 Danita Bailey $250,000 8200 Federal
Monthly Reports, Fringe Benefits Report, Non-Expendable
Equipment Inventory Report, Unusual Incidents ReportNone
Prevention services—CBCAP—
community-based Child abuse
prevention program
Attachment Q6 - FY 18 Grants
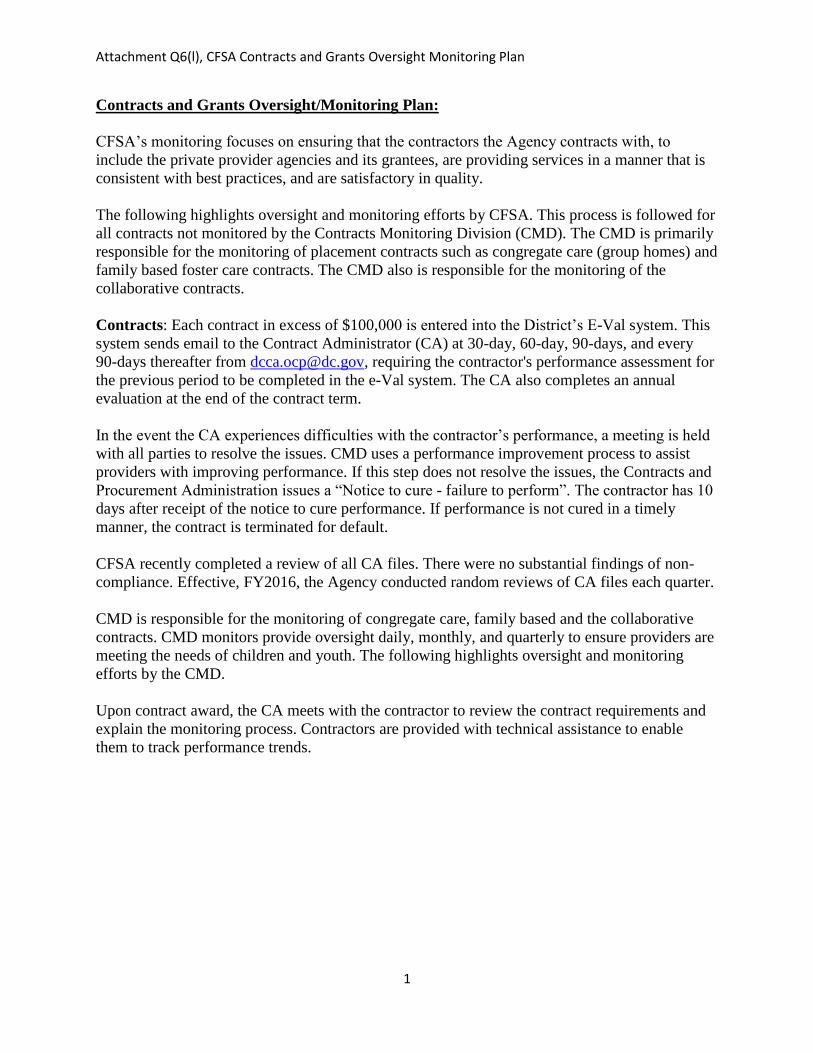
Attachment Q6(l), CFSA Contracts and Grants Oversight Monitoring Plan
1
Contracts and Grants Oversight/Monitoring Plan:
CFSA’s monitoring focuses on ensuring that the contractors the Agency contracts with, to
include the private provider agencies and its grantees, are providing services in a manner that is
consistent with best practices, and are satisfactory in quality.
The following highlights oversight and monitoring efforts by CFSA. This process is followed for
all contracts not monitored by the Contracts Monitoring Division (CMD). The CMD is primarily
responsible for the monitoring of placement contracts such as congregate care (group homes) and
family based foster care contracts. The CMD also is responsible for the monitoring of the
collaborative contracts.
Contracts: Each contract in excess of $100,000 is entered into the District’s E-Val system. This
system sends email to the Contract Administrator (CA) at 30-day, 60-day, 90-days, and every
90-days thereafter from [email protected], requiring the contractor's performance assessment for
the previous period to be completed in the e-Val system. The CA also completes an annual
evaluation at the end of the contract term.
In the event the CA experiences difficulties with the contractor’s performance, a meeting is held
with all parties to resolve the issues. CMD uses a performance improvement process to assist
providers with improving performance. If this step does not resolve the issues, the Contracts and
Procurement Administration issues a “Notice to cure - failure to perform”. The contractor has 10
days after receipt of the notice to cure performance. If performance is not cured in a timely
manner, the contract is terminated for default.
CFSA recently completed a review of all CA files. There were no substantial findings of non-
compliance. Effective, FY2016, the Agency conducted random reviews of CA files each quarter.
CMD is responsible for the monitoring of congregate care, family based and the collaborative
contracts. CMD monitors provide oversight daily, monthly, and quarterly to ensure providers are
meeting the needs of children and youth. The following highlights oversight and monitoring
efforts by the CMD.
Upon contract award, the CA meets with the contractor to review the contract requirements and
explain the monitoring process. Contractors are provided with technical assistance to enable
them to track performance trends.
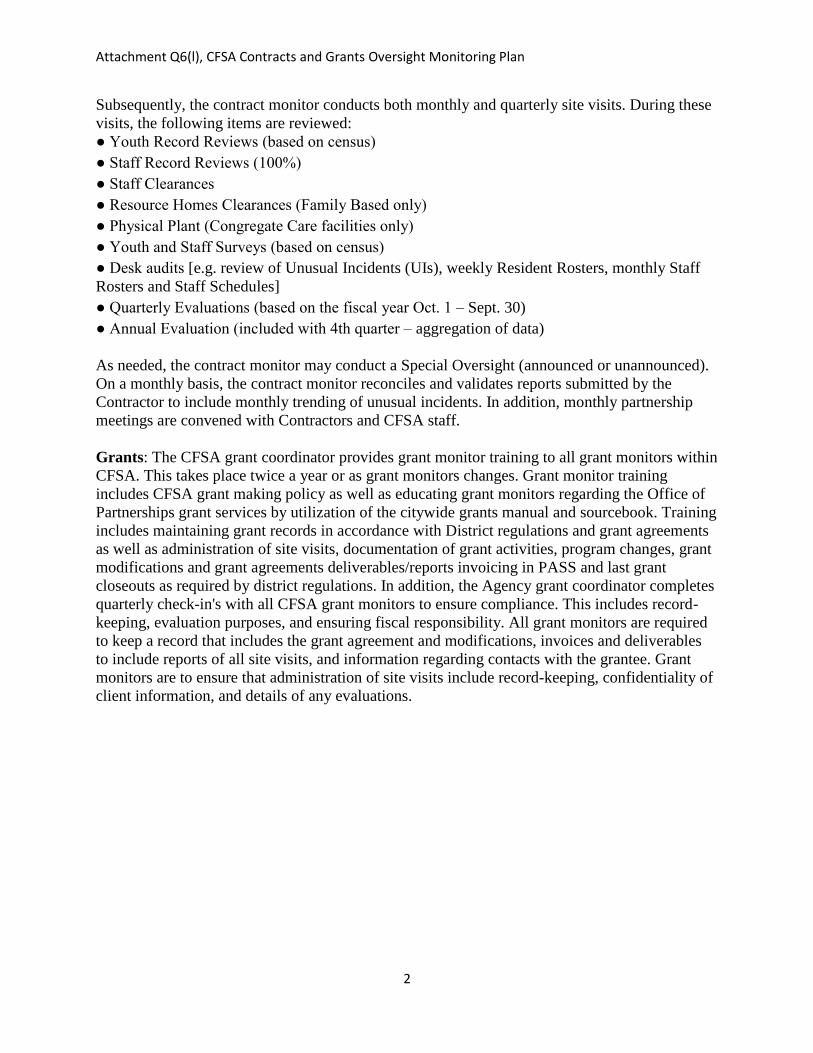
Attachment Q6(l), CFSA Contracts and Grants Oversight Monitoring Plan
2
Subsequently, the contract monitor conducts both monthly and quarterly site visits. During these
visits, the following items are reviewed:
● Youth Record Reviews (based on census)
● Staff Record Reviews (100%)
● Staff Clearances
● Resource Homes Clearances (Family Based only)
● Physical Plant (Congregate Care facilities only)
● Youth and Staff Surveys (based on census)
● Desk audits [e.g. review of Unusual Incidents (UIs), weekly Resident Rosters, monthly Staff
Rosters and Staff Schedules]
● Quarterly Evaluations (based on the fiscal year Oct. 1 – Sept. 30)
● Annual Evaluation (included with 4th quarter – aggregation of data)
As needed, the contract monitor may conduct a Special Oversight (announced or unannounced).
On a monthly basis, the contract monitor reconciles and validates reports submitted by the
Contractor to include monthly trending of unusual incidents. In addition, monthly partnership
meetings are convened with Contractors and CFSA staff.
Grants: The CFSA grant coordinator provides grant monitor training to all grant monitors within
CFSA. This takes place twice a year or as grant monitors changes. Grant monitor training
includes CFSA grant making policy as well as educating grant monitors regarding the Office of
Partnerships grant services by utilization of the citywide grants manual and sourcebook. Training
includes maintaining grant records in accordance with District regulations and grant agreements
as well as administration of site visits, documentation of grant activities, program changes, grant
modifications and grant agreements deliverables/reports invoicing in PASS and last grant
closeouts as required by district regulations. In addition, the Agency grant coordinator completes
quarterly check-in's with all CFSA grant monitors to ensure compliance. This includes record-
keeping, evaluation purposes, and ensuring fiscal responsibility. All grant monitors are required
to keep a record that includes the grant agreement and modifications, invoices and deliverables
to include reports of all site visits, and information regarding contacts with the grantee. Grant
monitors are to ensure that administration of site visits include record-keeping, confidentiality of
client information, and details of any evaluations.
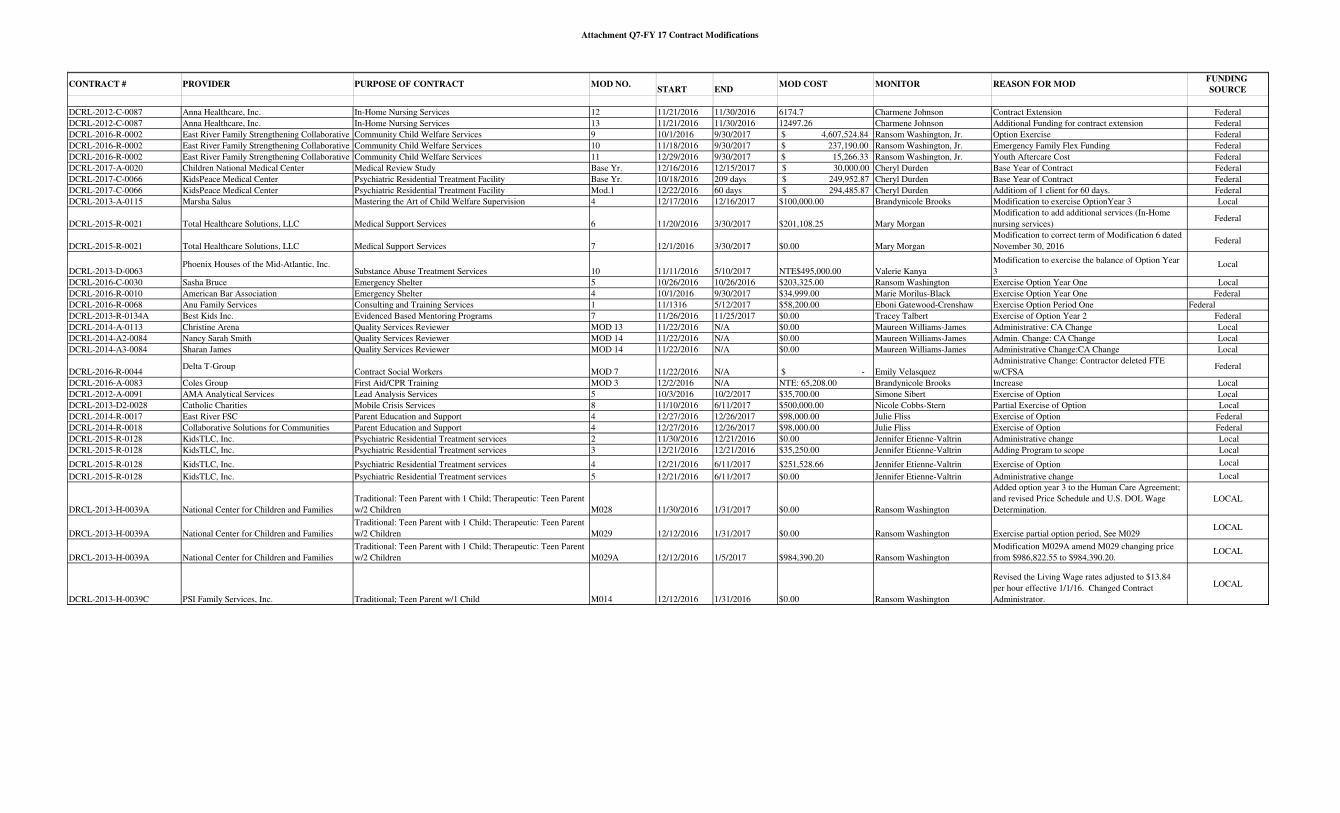
Attachment Q7-FY 17 Contract Modifications
CONTRACT # PROVIDER PURPOSE OF CONTRACT MOD NO.START END
MOD COST MONITOR REASON FOR MODFUNDING
SOURCE
DCRL-2012-C-0087 Anna Healthcare, Inc. In-Home Nursing Services 12 11/21/2016 11/30/2016 6174.7 Charmene Johnson Contract Extension Federal
DCRL-2012-C-0087 Anna Healthcare, Inc. In-Home Nursing Services 13 11/21/2016 11/30/2016 12497.26 Charmene Johnson Additional Funding for contract extension Federal
DCRL-2016-R-0002 East River Family Strengthening Collaborative Community Child Welfare Services 9 10/1/2016 9/30/2017 $ 4,607,524.84 Ransom Washington, Jr. Option Exercise Federal
DCRL-2016-R-0002 East River Family Strengthening Collaborative Community Child Welfare Services 10 11/18/2016 9/30/2017 $ 237,190.00 Ransom Washington, Jr. Emergency Family Flex Funding Federal
DCRL-2016-R-0002 East River Family Strengthening Collaborative Community Child Welfare Services 11 12/29/2016 9/30/2017 $ 15,266.33 Ransom Washington, Jr. Youth Aftercare Cost Federal
DCRL-2017-A-0020 Children National Medical Center Medical Review Study Base Yr. 12/16/2016 12/15/2017 30,000.00$ Cheryl Durden Base Year of Contract Federal
DCRL-2017-C-0066 KidsPeace Medical Center Psychiatric Residential Treatment Facility Base Yr. 10/18/2016 209 days 249,952.87$ Cheryl Durden Base Year of Contract Federal
DCRL-2017-C-0066 KidsPeace Medical Center Psychiatric Residential Treatment Facility Mod.1 12/22/2016 60 days 294,485.87$ Cheryl Durden Additiom of 1 client for 60 days. Federal
DCRL-2013-A-0115 Marsha Salus Mastering the Art of Child Welfare Supervision 4 12/17/2016 12/16/2017 $100,000.00 Brandynicole Brooks Modification to exercise OptionYear 3 Local
DCRL-2015-R-0021 Total Healthcare Solutions, LLC Medical Support Services 6 11/20/2016 3/30/2017 $201,108.25 Mary Morgan
Modification to add additional services (In-Home
nursing services)Federal
DCRL-2015-R-0021 Total Healthcare Solutions, LLC Medical Support Services 7 12/1/2016 3/30/2017 $0.00 Mary Morgan
Modification to correct term of Modification 6 dated
November 30, 2016Federal
DCRL-2013-D-0063Phoenix Houses of the Mid-Atlantic, Inc.
Substance Abuse Treatment Services 10 11/11/2016 5/10/2017 NTE$495,000.00 Valerie Kanya
Modification to exercise the balance of Option Year
3Local
DCRL-2016-C-0030 Sasha Bruce Emergency Shelter 5 10/26/2016 10/26/2016 $203,325.00 Ransom Washington Exercise Option Year One Local
DCRL-2016-R-0010 American Bar Association Emergency Shelter 4 10/1/2016 9/30/2017 $34,999.00 Marie Morilus-Black Exercise Option Year One Federal
DCRL-2016-R-0068 Anu Family Services Consulting and Training Services 1 11/1316 5/12/2017 $58,200.00 Eboni Gatewood-Crenshaw Exercise Option Period One Federal
DCRL-2013-R-0134A Best Kids Inc. Evidenced Based Mentoring Programs 7 11/26/2016 11/25/2017 $0.00 Tracey Talbert Exercise of Option Year 2 Federal
DCRL-2014-A-0113 Christine Arena Quality Services Reviewer MOD 13 11/22/2016 N/A $0.00 Maureen Williams-James Administrative: CA Change Local
DCRL-2014-A2-0084 Nancy Sarah Smith Quality Services Reviewer MOD 14 11/22/2016 N/A $0.00 Maureen Williams-James Admin. Change: CA Change Local
DCRL-2014-A3-0084 Sharan James Quality Services Reviewer MOD 14 11/22/2016 N/A $0.00 Maureen Williams-James Administrative Change:CA Change Local
DCRL-2016-R-0044Delta T-Group
Contract Social Workers MOD 7 11/22/2016 N/A $ - Emily Velasquez
Administrative Change: Contractor deleted FTE
w/CFSAFederal
DCRL-2016-A-0083 Coles Group First Aid/CPR Training MOD 3 12/2/2016 N/A NTE: 65,208.00 Brandynicole Brooks Increase Local
DCRL-2012-A-0091 AMA Analytical Services Lead Analysis Services 5 10/3/2016 10/2/2017 $35,700.00 Simone Sibert Exercise of Option Local
DCRL-2013-D2-0028 Catholic Charities Mobile Crisis Services 8 11/10/2016 6/11/2017 $500,000.00 Nicole Cobbs-Stern Partial Exercise of Option Local
DCRL-2014-R-0017 East River FSC Parent Education and Support 4 12/27/2016 12/26/2017 $98,000.00 Julie Fliss Exercise of Option Federal
DCRL-2014-R-0018 Collaborative Solutions for Communities Parent Education and Support 4 12/27/2016 12/26/2017 $98,000.00 Julie Fliss Exercise of Option Federal
DCRL-2015-R-0128 KidsTLC, Inc. Psychiatric Residential Treatment services 2 11/30/2016 12/21/2016 $0.00 Jennifer Etienne-Valtrin Administrative change Local
DCRL-2015-R-0128 KidsTLC, Inc. Psychiatric Residential Treatment services 3 12/21/2016 12/21/2016 $35,250.00 Jennifer Etienne-Valtrin Adding Program to scope Local
DCRL-2015-R-0128 KidsTLC, Inc. Psychiatric Residential Treatment services 4 12/21/2016 6/11/2017 $251,528.66 Jennifer Etienne-Valtrin Exercise of Option Local
DCRL-2015-R-0128 KidsTLC, Inc. Psychiatric Residential Treatment services 5 12/21/2016 6/11/2017 $0.00 Jennifer Etienne-Valtrin Administrative change Local
DRCL-2013-H-0039A National Center for Children and Families
Traditional: Teen Parent with 1 Child; Therapeutic: Teen Parent
w/2 Children M028 11/30/2016 1/31/2017 $0.00 Ransom Washington
Added option year 3 to the Human Care Agreement;
and revised Price Schedule and U.S. DOL Wage
Determination.
LOCAL
DRCL-2013-H-0039A National Center for Children and Families
Traditional: Teen Parent with 1 Child; Therapeutic: Teen Parent
w/2 Children M029 12/12/2016 1/31/2017 $0.00 Ransom Washington Exercise partial option period, See M029LOCAL
DRCL-2013-H-0039A National Center for Children and Families
Traditional: Teen Parent with 1 Child; Therapeutic: Teen Parent
w/2 Children M029A 12/12/2016 1/5/2017 $984,390.20 Ransom Washington
Modification M029A amend M029 changing price
from $986,822.55 to $984,390.20.LOCAL
DCRL-2013-H-0039C PSI Family Services, Inc. Traditional; Teen Parent w/1 Child M014 12/12/2016 1/31/2016 $0.00 Ransom Washington
Revised the Living Wage rates adjusted to $13.84
per hour effective 1/1/16. Changed Contract
Administrator.
LOCAL
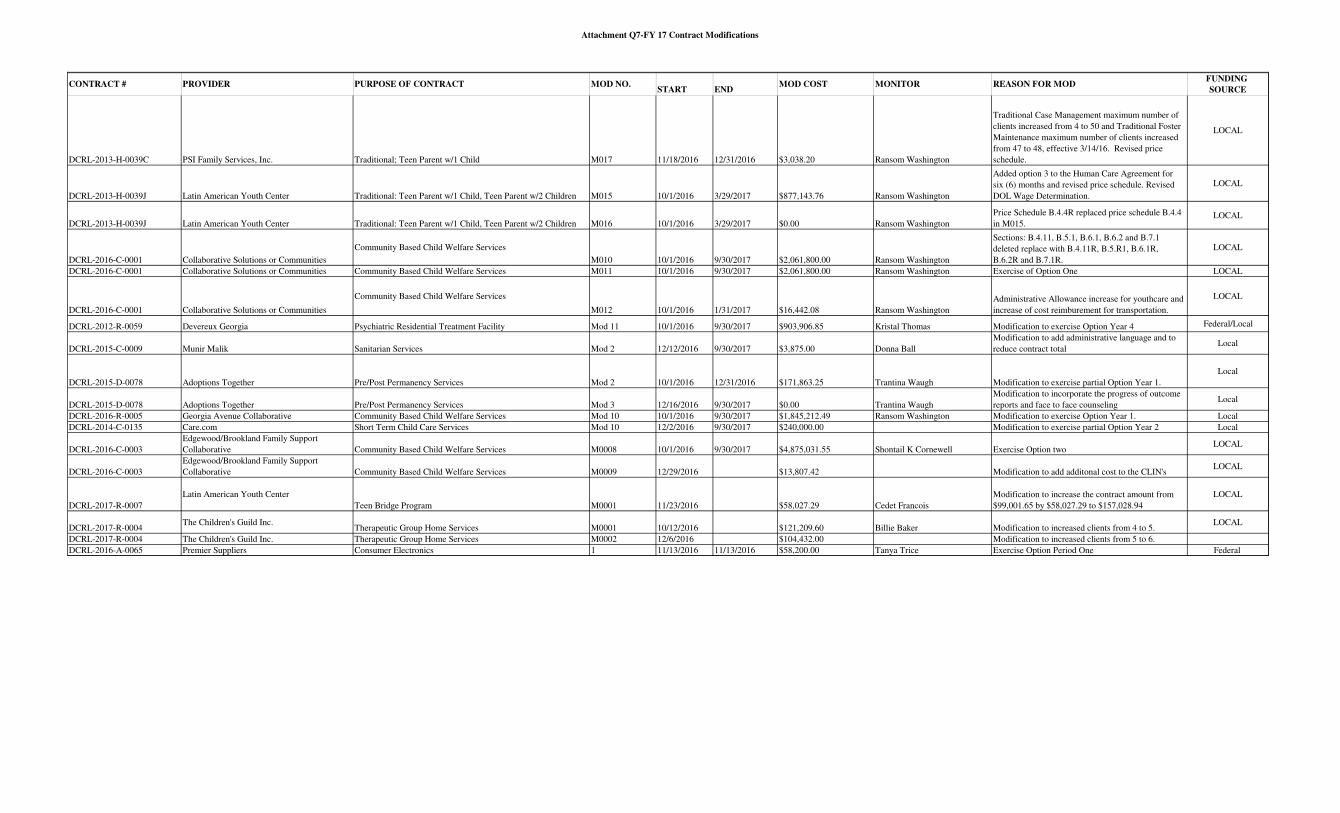
Attachment Q7-FY 17 Contract Modifications
CONTRACT # PROVIDER PURPOSE OF CONTRACT MOD NO.START END
MOD COST MONITOR REASON FOR MODFUNDING
SOURCE
DCRL-2013-H-0039C PSI Family Services, Inc. Traditional; Teen Parent w/1 Child M017 11/18/2016 12/31/2016 $3,038.20 Ransom Washington
Traditional Case Management maximum number of
clients increased from 4 to 50 and Traditional Foster
Maintenance maximum number of clients increased
from 47 to 48, effective 3/14/16. Revised price
schedule.
LOCAL
DCRL-2013-H-0039J Latin American Youth Center Traditional: Teen Parent w/1 Child, Teen Parent w/2 Children M015 10/1/2016 3/29/2017 $877,143.76 Ransom Washington
Added option 3 to the Human Care Agreement for
six (6) months and revised price schedule. Revised
DOL Wage Determination.
LOCAL
DCRL-2013-H-0039J Latin American Youth Center Traditional: Teen Parent w/1 Child, Teen Parent w/2 Children M016 10/1/2016 3/29/2017 $0.00 Ransom Washington
Price Schedule B.4.4R replaced price schedule B.4.4
in M015. LOCAL
DCRL-2016-C-0001 Collaborative Solutions or Communities
Community Based Child Welfare Services
M010 10/1/2016 9/30/2017 $2,061,800.00 Ransom Washington
Sections: B.4.11, B.5.1, B.6.1, B.6.2 and B.7.1
deleted replace with B.4.11R, B.5.R1, B.6.1R,
B.6.2R and B.7.1R.
LOCAL
DCRL-2016-C-0001 Collaborative Solutions or Communities Community Based Child Welfare Services M011 10/1/2016 9/30/2017 $2,061,800.00 Ransom Washington Exercise of Option One LOCAL
DCRL-2016-C-0001 Collaborative Solutions or Communities
Community Based Child Welfare Services
M012 10/1/2016 1/31/2017 $16,442.08 Ransom Washington
Administrative Allowance increase for youthcare and
increase of cost reimburement for transportation.
LOCAL
DCRL-2012-R-0059 Devereux Georgia Psychiatric Residential Treatment Facility Mod 11 10/1/2016 9/30/2017 $903,906.85 Kristal Thomas Modification to exercise Option Year 4 Federal/Local
DCRL-2015-C-0009 Munir Malik Sanitarian Services Mod 2 12/12/2016 9/30/2017 $3,875.00 Donna Ball
Modification to add administrative language and to
reduce contract totalLocal
DCRL-2015-D-0078 Adoptions Together Pre/Post Permanency Services Mod 2 10/1/2016 12/31/2016 $171,863.25 Trantina Waugh Modification to exercise partial Option Year 1.
Local
DCRL-2015-D-0078 Adoptions Together Pre/Post Permanency Services Mod 3 12/16/2016 9/30/2017 $0.00 Trantina Waugh
Modification to incorporate the progress of outcome
reports and face to face counselingLocal
DCRL-2016-R-0005 Georgia Avenue Collaborative Community Based Child Welfare Services Mod 10 10/1/2016 9/30/2017 $1,845,212.49 Ransom Washington Modification to exercise Option Year 1. Local
DCRL-2014-C-0135 Care.com Short Term Child Care Services Mod 10 12/2/2016 9/30/2017 $240,000.00 Modification to exercise partial Option Year 2 Local
DCRL-2016-C-0003
Edgewood/Brookland Family Support
Collaborative Community Based Child Welfare Services M0008 10/1/2016 9/30/2017 $4,875,031.55 Shontail K Cornewell Exercise Option twoLOCAL
DCRL-2016-C-0003
Edgewood/Brookland Family Support
Collaborative Community Based Child Welfare Services M0009 12/29/2016 $13,807.42 Modification to add additonal cost to the CLIN'sLOCAL
DCRL-2017-R-0007
Latin American Youth Center
Teen Bridge Program M0001 11/23/2016 $58,027.29 Cedet Francois
Modification to increase the contract amount from
$99,001.65 by $58,027.29 to $157,028.94
LOCAL
DCRL-2017-R-0004The Children's Guild Inc.
Therapeutic Group Home Services M0001 10/12/2016 $121,209.60 Billie Baker Modification to increased clients from 4 to 5.LOCAL
DCRL-2017-R-0004 The Children's Guild Inc. Therapeutic Group Home Services M0002 12/6/2016 $104,432.00 Modification to increased clients from 5 to 6.
DCRL-2016-A-0065 Premier Suppliers Consumer Electronics 1 11/13/2016 11/13/2016 $58,200.00 Tanya Trice Exercise Option Period One Federal
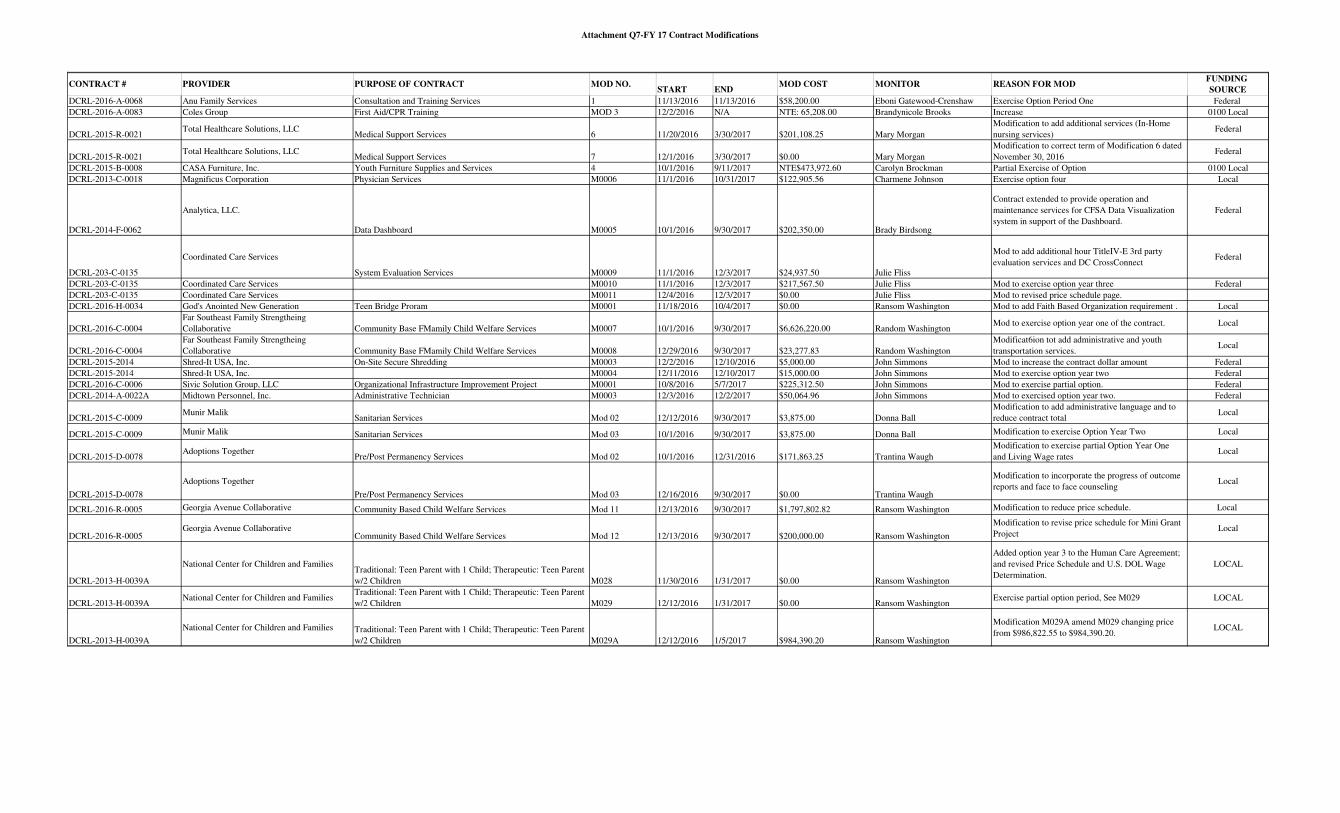
Attachment Q7-FY 17 Contract Modifications
CONTRACT # PROVIDER PURPOSE OF CONTRACT MOD NO.START END
MOD COST MONITOR REASON FOR MODFUNDING
SOURCE
DCRL-2016-A-0068 Anu Family Services Consultation and Training Services 1 11/13/2016 11/13/2016 $58,200.00 Eboni Gatewood-Crenshaw Exercise Option Period One Federal
DCRL-2016-A-0083 Coles Group First Aid/CPR Training MOD 3 12/2/2016 N/A NTE: 65,208.00 Brandynicole Brooks Increase 0100 Local
DCRL-2015-R-0021Total Healthcare Solutions, LLC
Medical Support Services 6 11/20/2016 3/30/2017 $201,108.25 Mary Morgan
Modification to add additional services (In-Home
nursing services)Federal
DCRL-2015-R-0021Total Healthcare Solutions, LLC
Medical Support Services 7 12/1/2016 3/30/2017 $0.00 Mary Morgan
Modification to correct term of Modification 6 dated
November 30, 2016Federal
DCRL-2015-B-0008 CASA Furniture, Inc. Youth Furniture Supplies and Services 4 10/1/2016 9/11/2017 NTE$473,972.60 Carolyn Brockman Partial Exercise of Option 0100 Local
DCRL-2013-C-0018 Magnificus Corporation Physician Services M0006 11/1/2016 10/31/2017 $122,905.56 Charmene Johnson Exercise option four Local
DCRL-2014-F-0062
Analytica, LLC.
Data Dashboard M0005 10/1/2016 9/30/2017 $202,350.00 Brady Birdsong
Contract extended to provide operation and
maintenance services for CFSA Data Visualization
system in support of the Dashboard.
Federal
DCRL-203-C-0135
Coordinated Care Services
System Evaluation Services M0009 11/1/2016 12/3/2017 $24,937.50 Julie Fliss
Mod to add additional hour TitleIV-E 3rd party
evaluation services and DC CrossConnectFederal
DCRL-203-C-0135 Coordinated Care Services M0010 11/1/2016 12/3/2017 $217,567.50 Julie Fliss Mod to exercise option year three Federal
DCRL-203-C-0135 Coordinated Care Services M0011 12/4/2016 12/3/2017 $0.00 Julie Fliss Mod to revised price schedule page.
DCRL-2016-H-0034 God's Anointed New Generation Teen Bridge Proram M0001 11/18/2016 10/4/2017 $0.00 Ransom Washington Mod to add Faith Based Organization requirement . Local
DCRL-2016-C-0004
Far Southeast Family Strengtheing
Collaborative Community Base FMamily Child Welfare Services M0007 10/1/2016 9/30/2017 $6,626,220.00 Random WashingtonMod to exercise option year one of the contract. Local
DCRL-2016-C-0004
Far Southeast Family Strengtheing
Collaborative Community Base FMamily Child Welfare Services M0008 12/29/2016 9/30/2017 $23,277.83 Random Washington
Modificat6ion tot add administrative and youth
transportation services.Local
DCRL-2015-2014 Shred-It USA, Inc. On-Site Secure Shredding M0003 12/2/2016 12/10/2016 $5,000.00 John Simmons Mod to increase the contract dollar amount Federal
DCRL-2015-2014 Shred-It USA, Inc. M0004 12/11/2016 12/10/2017 $15,000.00 John Simmons Mod to exercise option year two Federal
DCRL-2016-C-0006 Sivic Solution Group, LLC Organizational Infrastructure Improvement Project M0001 10/8/2016 5/7/2017 $225,312.50 John Simmons Mod to exercise partial option. Federal
DCRL-2014-A-0022A Midtown Personnel, Inc. Administrative Technician M0003 12/3/2016 12/2/2017 $50,064.96 John Simmons Mod to exercised option year two. Federal
DCRL-2015-C-0009Munir Malik
Sanitarian Services Mod 02 12/12/2016 9/30/2017 $3,875.00 Donna Ball
Modification to add administrative language and to
reduce contract totalLocal
DCRL-2015-C-0009 Munir Malik Sanitarian Services Mod 03 10/1/2016 9/30/2017 $3,875.00 Donna Ball Modification to exercise Option Year Two Local
DCRL-2015-D-0078Adoptions Together
Pre/Post Permanency Services Mod 02 10/1/2016 12/31/2016 $171,863.25 Trantina Waugh
Modification to exercise partial Option Year One
and Living Wage ratesLocal
DCRL-2015-D-0078
Adoptions Together
Pre/Post Permanency Services Mod 03 12/16/2016 9/30/2017 $0.00 Trantina Waugh
Modification to incorporate the progress of outcome
reports and face to face counselingLocal
DCRL-2016-R-0005 Georgia Avenue Collaborative Community Based Child Welfare Services Mod 11 12/13/2016 9/30/2017 $1,797,802.82 Ransom Washington Modification to reduce price schedule. Local
DCRL-2016-R-0005Georgia Avenue Collaborative
Community Based Child Welfare Services Mod 12 12/13/2016 9/30/2017 $200,000.00 Ransom Washington
Modification to revise price schedule for Mini Grant
ProjectLocal
DCRL-2013-H-0039A
National Center for Children and FamiliesTraditional: Teen Parent with 1 Child; Therapeutic: Teen Parent
w/2 Children M028 11/30/2016 1/31/2017 $0.00 Ransom Washington
Added option year 3 to the Human Care Agreement;
and revised Price Schedule and U.S. DOL Wage
Determination.
LOCAL
DCRL-2013-H-0039ANational Center for Children and Families
Traditional: Teen Parent with 1 Child; Therapeutic: Teen Parent
w/2 Children M029 12/12/2016 1/31/2017 $0.00 Ransom WashingtonExercise partial option period, See M029 LOCAL
DCRL-2013-H-0039A
National Center for Children and Families Traditional: Teen Parent with 1 Child; Therapeutic: Teen Parent
w/2 Children M029A 12/12/2016 1/5/2017 $984,390.20 Ransom Washington
Modification M029A amend M029 changing price
from $986,822.55 to $984,390.20.LOCAL
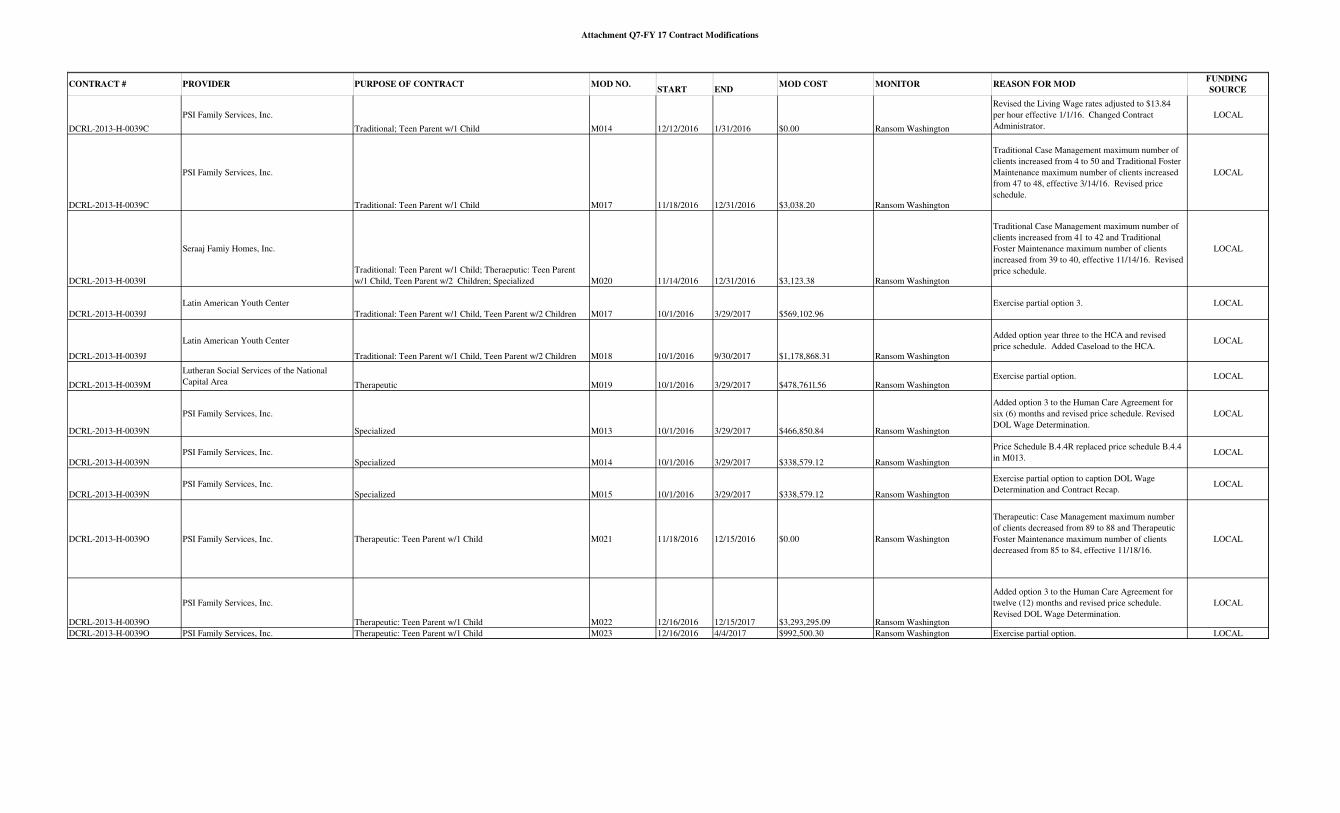
Attachment Q7-FY 17 Contract Modifications
CONTRACT # PROVIDER PURPOSE OF CONTRACT MOD NO.START END
MOD COST MONITOR REASON FOR MODFUNDING
SOURCE
DCRL-2013-H-0039C
PSI Family Services, Inc.
Traditional; Teen Parent w/1 Child M014 12/12/2016 1/31/2016 $0.00 Ransom Washington
Revised the Living Wage rates adjusted to $13.84
per hour effective 1/1/16. Changed Contract
Administrator.
LOCAL
DCRL-2013-H-0039C
PSI Family Services, Inc.
Traditional: Teen Parent w/1 Child M017 11/18/2016 12/31/2016 $3,038.20 Ransom Washington
Traditional Case Management maximum number of
clients increased from 4 to 50 and Traditional Foster
Maintenance maximum number of clients increased
from 47 to 48, effective 3/14/16. Revised price
schedule.
LOCAL
DCRL-2013-H-0039I
Seraaj Famiy Homes, Inc.
Traditional: Teen Parent w/1 Child; Theraeputic: Teen Parent
w/1 Child, Teen Parent w/2 Children; Specialized M020 11/14/2016 12/31/2016 $3,123.38 Ransom Washington
Traditional Case Management maximum number of
clients increased from 41 to 42 and Traditional
Foster Maintenance maximum number of clients
increased from 39 to 40, effective 11/14/16. Revised
price schedule.
LOCAL
DCRL-2013-H-0039J
Latin American Youth Center
Traditional: Teen Parent w/1 Child, Teen Parent w/2 Children M017 10/1/2016 3/29/2017 $569,102.96
Exercise partial option 3. LOCAL
DCRL-2013-H-0039J
Latin American Youth Center
Traditional: Teen Parent w/1 Child, Teen Parent w/2 Children M018 10/1/2016 9/30/2017 $1,178,868.31 Ransom Washington
Added option year three to the HCA and revised
price schedule. Added Caseload to the HCA.LOCAL
DCRL-2013-H-0039M
Lutheran Social Services of the National
Capital Area Therapeutic M019 10/1/2016 3/29/2017 $478,761l.56 Ransom WashingtonExercise partial option. LOCAL
DCRL-2013-H-0039N
PSI Family Services, Inc.
Specialized M013 10/1/2016 3/29/2017 $466,850.84 Ransom Washington
Added option 3 to the Human Care Agreement for
six (6) months and revised price schedule. Revised
DOL Wage Determination.
LOCAL
DCRL-2013-H-0039NPSI Family Services, Inc.
Specialized M014 10/1/2016 3/29/2017 $338,579.12 Ransom Washington
Price Schedule B.4.4R replaced price schedule B.4.4
in M013. LOCAL
DCRL-2013-H-0039NPSI Family Services, Inc.
Specialized M015 10/1/2016 3/29/2017 $338,579.12 Ransom Washington
Exercise partial option to caption DOL Wage
Determination and Contract Recap.LOCAL
DCRL-2013-H-0039O PSI Family Services, Inc. Therapeutic: Teen Parent w/1 Child M021 11/18/2016 12/15/2016 $0.00 Ransom Washington
Therapeutic: Case Management maximum number
of clients decreased from 89 to 88 and Therapeutic
Foster Maintenance maximum number of clients
decreased from 85 to 84, effective 11/18/16.
LOCAL
DCRL-2013-H-0039O
PSI Family Services, Inc.
Therapeutic: Teen Parent w/1 Child M022 12/16/2016 12/15/2017 $3,293,295.09 Ransom Washington
Added option 3 to the Human Care Agreement for
twelve (12) months and revised price schedule.
Revised DOL Wage Determination.
LOCAL
DCRL-2013-H-0039O PSI Family Services, Inc. Therapeutic: Teen Parent w/1 Child M023 12/16/2016 4/4/2017 $992,500.30 Ransom Washington Exercise partial option. LOCAL
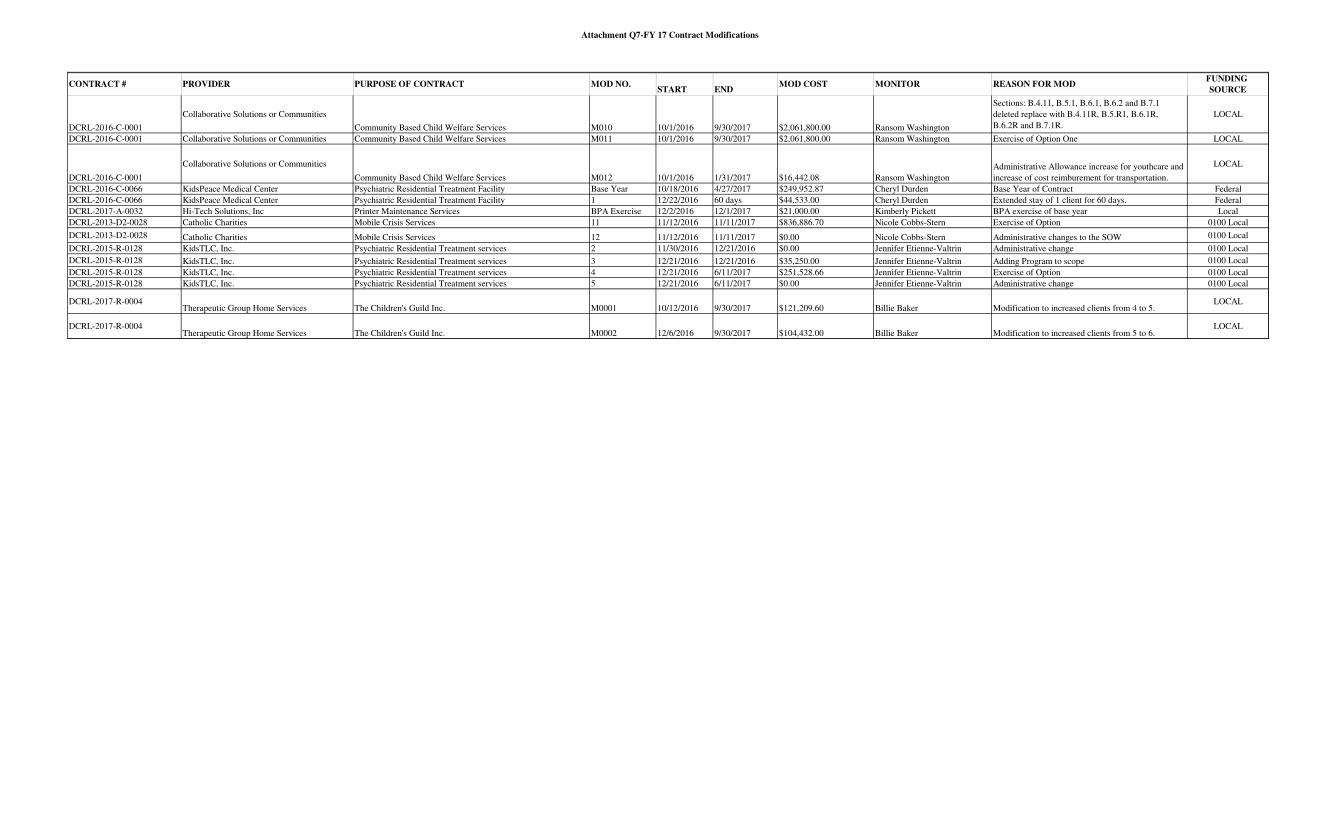
Attachment Q7-FY 17 Contract Modifications
CONTRACT # PROVIDER PURPOSE OF CONTRACT MOD NO.START END
MOD COST MONITOR REASON FOR MODFUNDING
SOURCE
DCRL-2016-C-0001
Collaborative Solutions or Communities
Community Based Child Welfare Services M010 10/1/2016 9/30/2017 $2,061,800.00 Ransom Washington
Sections: B.4.11, B.5.1, B.6.1, B.6.2 and B.7.1
deleted replace with B.4.11R, B.5.R1, B.6.1R,
B.6.2R and B.7.1R.
LOCAL
DCRL-2016-C-0001 Collaborative Solutions or Communities Community Based Child Welfare Services M011 10/1/2016 9/30/2017 $2,061,800.00 Ransom Washington Exercise of Option One LOCAL
DCRL-2016-C-0001
Collaborative Solutions or Communities
Community Based Child Welfare Services M012 10/1/2016 1/31/2017 $16,442.08 Ransom Washington
Administrative Allowance increase for youthcare and
increase of cost reimburement for transportation.
LOCAL
DCRL-2016-C-0066 KidsPeace Medical Center Psychiatric Residential Treatment Facility Base Year 10/18/2016 4/27/2017 $249,952.87 Cheryl Durden Base Year of Contract Federal
DCRL-2016-C-0066 KidsPeace Medical Center Psychiatric Residential Treatment Facility 1 12/22/2016 60 days $44,533.00 Cheryl Durden Extended stay of 1 client for 60 days. Federal
DCRL-2017-A-0032 Hi-Tech Solutions, Inc Printer Maintenance Services BPA Exercise 12/2/2016 12/1/2017 $21,000.00 Kimberly Pickett BPA exercise of base year Local
DCRL-2013-D2-0028 Catholic Charities Mobile Crisis Services 11 11/12/2016 11/11/2017 $836,886.70 Nicole Cobbs-Stern Exercise of Option 0100 Local
DCRL-2013-D2-0028 Catholic Charities Mobile Crisis Services 12 11/12/2016 11/11/2017 $0.00 Nicole Cobbs-Stern Administrative changes to the SOW 0100 Local
DCRL-2015-R-0128 KidsTLC, Inc. Psychiatric Residential Treatment services 2 11/30/2016 12/21/2016 $0.00 Jennifer Etienne-Valtrin Administrative change 0100 Local
DCRL-2015-R-0128 KidsTLC, Inc. Psychiatric Residential Treatment services 3 12/21/2016 12/21/2016 $35,250.00 Jennifer Etienne-Valtrin Adding Program to scope 0100 Local
DCRL-2015-R-0128 KidsTLC, Inc. Psychiatric Residential Treatment services 4 12/21/2016 6/11/2017 $251,528.66 Jennifer Etienne-Valtrin Exercise of Option 0100 Local
DCRL-2015-R-0128 KidsTLC, Inc. Psychiatric Residential Treatment services 5 12/21/2016 6/11/2017 $0.00 Jennifer Etienne-Valtrin Administrative change 0100 Local
DCRL-2017-R-0004Therapeutic Group Home Services The Children's Guild Inc. M0001 10/12/2016 9/30/2017 $121,209.60 Billie Baker Modification to increased clients from 4 to 5.
LOCAL
DCRL-2017-R-0004Therapeutic Group Home Services The Children's Guild Inc. M0002 12/6/2016 9/30/2017 $104,432.00 Billie Baker Modification to increased clients from 5 to 6.
LOCAL
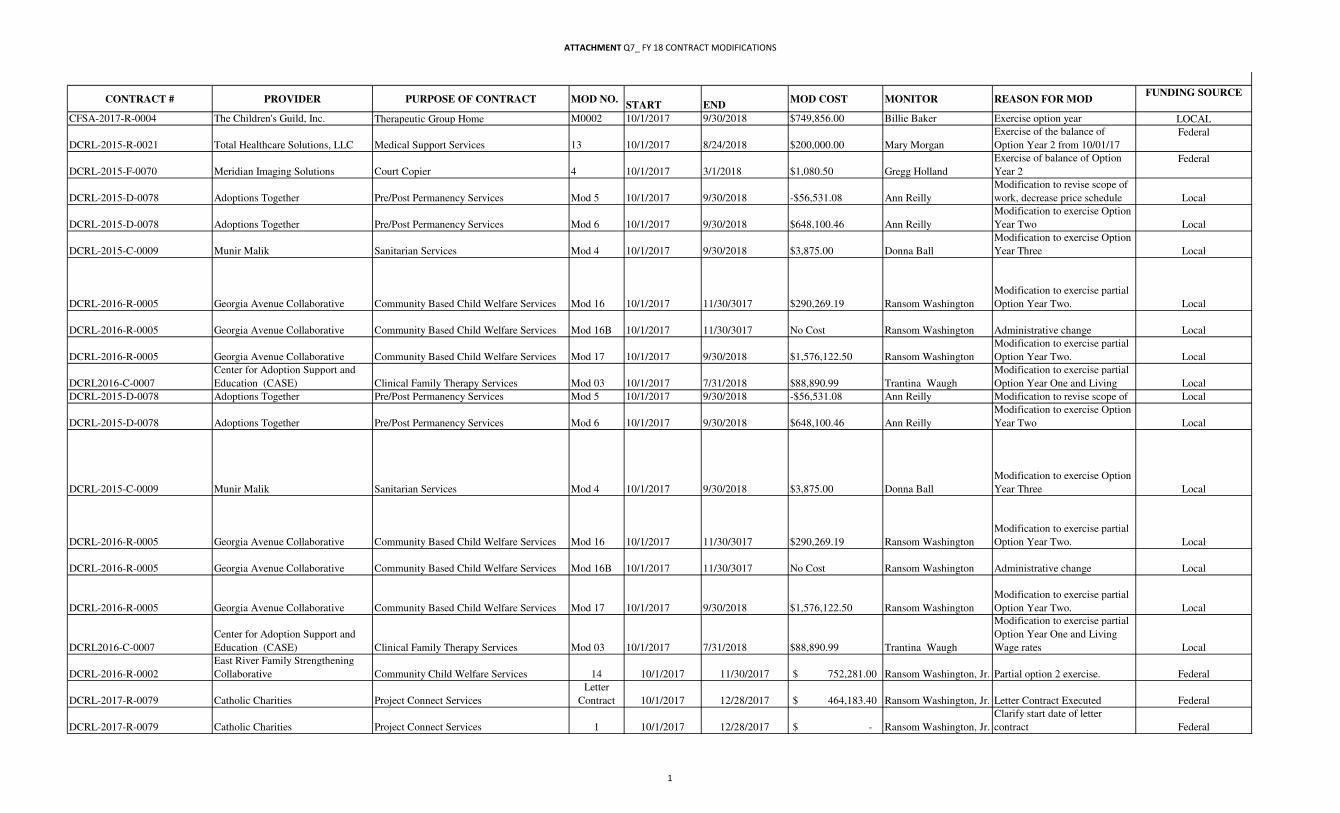
ATTACHMENT Q7_ FY 18 CONTRACT MODIFICATIONS
CONTRACT # PROVIDER PURPOSE OF CONTRACT MOD NO.START END
MOD COST MONITOR REASON FOR MODFUNDING SOURCE
CFSA-2017-R-0004 The Children's Guild, Inc. Therapeutic Group Home M0002 10/1/2017 9/30/2018 $749,856.00 Billie Baker Exercise option year LOCAL
DCRL-2015-R-0021 Total Healthcare Solutions, LLC Medical Support Services 13 10/1/2017 8/24/2018 $200,000.00 Mary Morgan
Exercise of the balance of
Option Year 2 from 10/01/17
Federal
DCRL-2015-F-0070 Meridian Imaging Solutions Court Copier 4 10/1/2017 3/1/2018 $1,080.50 Gregg Holland
Exercise of balance of Option
Year 2
Federal
DCRL-2015-D-0078 Adoptions Together Pre/Post Permanency Services Mod 5 10/1/2017 9/30/2018 -$56,531.08 Ann Reilly
Modification to revise scope of
work, decrease price schedule Local
DCRL-2015-D-0078 Adoptions Together Pre/Post Permanency Services Mod 6 10/1/2017 9/30/2018 $648,100.46 Ann Reilly
Modification to exercise Option
Year Two Local
DCRL-2015-C-0009 Munir Malik Sanitarian Services Mod 4 10/1/2017 9/30/2018 $3,875.00 Donna Ball
Modification to exercise Option
Year Three Local
DCRL-2016-R-0005 Georgia Avenue Collaborative Community Based Child Welfare Services Mod 16 10/1/2017 11/30/3017 $290,269.19 Ransom Washington
Modification to exercise partial
Option Year Two. Local
DCRL-2016-R-0005 Georgia Avenue Collaborative Community Based Child Welfare Services Mod 16B 10/1/2017 11/30/3017 No Cost Ransom Washington Administrative change Local
DCRL-2016-R-0005 Georgia Avenue Collaborative Community Based Child Welfare Services Mod 17 10/1/2017 9/30/2018 $1,576,122.50 Ransom Washington
Modification to exercise partial
Option Year Two. Local
DCRL2016-C-0007
Center for Adoption Support and
Education (CASE) Clinical Family Therapy Services Mod 03 10/1/2017 7/31/2018 $88,890.99 Trantina Waugh
Modification to exercise partial
Option Year One and Living Local
DCRL-2015-D-0078 Adoptions Together Pre/Post Permanency Services Mod 5 10/1/2017 9/30/2018 -$56,531.08 Ann Reilly Modification to revise scope of Local
DCRL-2015-D-0078 Adoptions Together Pre/Post Permanency Services Mod 6 10/1/2017 9/30/2018 $648,100.46 Ann Reilly
Modification to exercise Option
Year Two Local
DCRL-2015-C-0009 Munir Malik Sanitarian Services Mod 4 10/1/2017 9/30/2018 $3,875.00 Donna Ball
Modification to exercise Option
Year Three Local
DCRL-2016-R-0005 Georgia Avenue Collaborative Community Based Child Welfare Services Mod 16 10/1/2017 11/30/3017 $290,269.19 Ransom Washington
Modification to exercise partial
Option Year Two. Local
DCRL-2016-R-0005 Georgia Avenue Collaborative Community Based Child Welfare Services Mod 16B 10/1/2017 11/30/3017 No Cost Ransom Washington Administrative change Local
DCRL-2016-R-0005 Georgia Avenue Collaborative Community Based Child Welfare Services Mod 17 10/1/2017 9/30/2018 $1,576,122.50 Ransom Washington
Modification to exercise partial
Option Year Two. Local
DCRL2016-C-0007
Center for Adoption Support and
Education (CASE) Clinical Family Therapy Services Mod 03 10/1/2017 7/31/2018 $88,890.99 Trantina Waugh
Modification to exercise partial
Option Year One and Living
Wage rates Local
DCRL-2016-R-0002
East River Family Strengthening
Collaborative Community Child Welfare Services 14 10/1/2017 11/30/2017 $ 752,281.00 Ransom Washington, Jr. Partial option 2 exercise. Federal
DCRL-2017-R-0079 Catholic Charities Project Connect Services
Letter
Contract 10/1/2017 12/28/2017 $ 464,183.40 Ransom Washington, Jr. Letter Contract Executed Federal
DCRL-2017-R-0079 Catholic Charities Project Connect Services 1 10/1/2017 12/28/2017 $ - Ransom Washington, Jr.
Clarify start date of letter
contract Federal
1
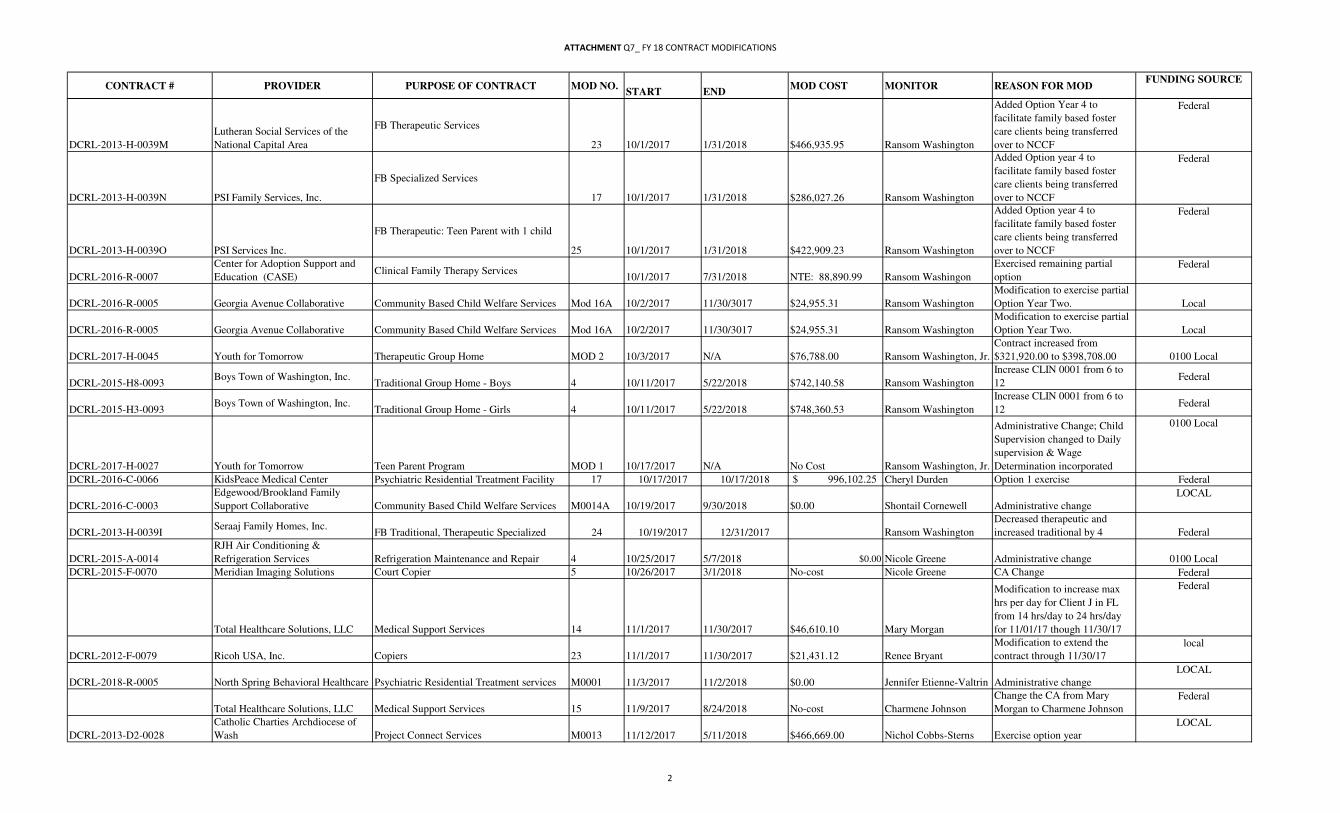
ATTACHMENT Q7_ FY 18 CONTRACT MODIFICATIONS
CONTRACT # PROVIDER PURPOSE OF CONTRACT MOD NO.START END
MOD COST MONITOR REASON FOR MODFUNDING SOURCE
DCRL-2013-H-0039M
Lutheran Social Services of the
National Capital Area
FB Therapeutic Services
23 10/1/2017 1/31/2018 $466,935.95 Ransom Washington
Added Option Year 4 to
facilitate family based foster
care clients being transferred
over to NCCF
Federal
DCRL-2013-H-0039N PSI Family Services, Inc.
FB Specialized Services
17 10/1/2017 1/31/2018 $286,027.26 Ransom Washington
Added Option year 4 to
facilitate family based foster
care clients being transferred
over to NCCF
Federal
DCRL-2013-H-0039O PSI Services Inc.
FB Therapeutic: Teen Parent with 1 child
25 10/1/2017 1/31/2018 $422,909.23 Ransom Washington
Added Option year 4 to
facilitate family based foster
care clients being transferred
over to NCCF
Federal
DCRL-2016-R-0007
Center for Adoption Support and
Education (CASE)Clinical Family Therapy Services
10/1/2017 7/31/2018 NTE: 88,890.99 Ransom Washingon
Exercised remaining partial
option
Federal
DCRL-2016-R-0005 Georgia Avenue Collaborative Community Based Child Welfare Services Mod 16A 10/2/2017 11/30/3017 $24,955.31 Ransom Washington
Modification to exercise partial
Option Year Two. Local
DCRL-2016-R-0005 Georgia Avenue Collaborative Community Based Child Welfare Services Mod 16A 10/2/2017 11/30/3017 $24,955.31 Ransom Washington
Modification to exercise partial
Option Year Two. Local
DCRL-2017-H-0045 Youth for Tomorrow Therapeutic Group Home MOD 2 10/3/2017 N/A $76,788.00 Ransom Washington, Jr.
Contract increased from
$321,920.00 to $398,708.00 0100 Local
DCRL-2015-H8-0093Boys Town of Washington, Inc.
Traditional Group Home - Boys 4 10/11/2017 5/22/2018 $742,140.58 Ransom Washington
Increase CLIN 0001 from 6 to
12Federal
DCRL-2015-H3-0093Boys Town of Washington, Inc.
Traditional Group Home - Girls 4 10/11/2017 5/22/2018 $748,360.53 Ransom Washington
Increase CLIN 0001 from 6 to
12Federal
DCRL-2017-H-0027 Youth for Tomorrow Teen Parent Program MOD 1 10/17/2017 N/A No Cost Ransom Washington, Jr.
Administrative Change; Child
Supervision changed to Daily
supervision & Wage
Determination incorporated
0100 Local
DCRL-2016-C-0066 KidsPeace Medical Center Psychiatric Residential Treatment Facility 17 10/17/2017 10/17/2018 $ 996,102.25 Cheryl Durden Option 1 exercise Federal
DCRL-2016-C-0003
Edgewood/Brookland Family
Support Collaborative Community Based Child Welfare Services M0014A 10/19/2017 9/30/2018 $0.00 Shontail Cornewell Administrative change
LOCAL
DCRL-2013-H-0039ISeraaj Family Homes, Inc.
FB Traditional, Therapeutic Specialized 24 10/19/2017 12/31/2017 Ransom Washington
Decreased therapeutic and
increased traditional by 4 Federal
DCRL-2015-A-0014
RJH Air Conditioning &
Refrigeration Services Refrigeration Maintenance and Repair 4 10/25/2017 5/7/2018 $0.00 Nicole Greene Administrative change 0100 Local
DCRL-2015-F-0070 Meridian Imaging Solutions Court Copier 5 10/26/2017 3/1/2018 No-cost Nicole Greene CA Change Federal
Total Healthcare Solutions, LLC Medical Support Services 14 11/1/2017 11/30/2017 $46,610.10 Mary Morgan
Modification to increase max
hrs per day for Client J in FL
from 14 hrs/day to 24 hrs/day
for 11/01/17 though 11/30/17
Federal
DCRL-2012-F-0079 Ricoh USA, Inc. Copiers 23 11/1/2017 11/30/2017 $21,431.12 Renee Bryant
Modification to extend the
contract through 11/30/17
local
DCRL-2018-R-0005 North Spring Behavioral Healthcare Psychiatric Residential Treatment services M0001 11/3/2017 11/2/2018 $0.00 Jennifer Etienne-Valtrin Administrative change
LOCAL
Total Healthcare Solutions, LLC Medical Support Services 15 11/9/2017 8/24/2018 No-cost Charmene Johnson
Change the CA from Mary
Morgan to Charmene Johnson
Federal
DCRL-2013-D2-0028
Catholic Charties Archdiocese of
Wash Project Connect Services M0013 11/12/2017 5/11/2018 $466,669.00 Nichol Cobbs-Sterns Exercise option year
LOCAL
2
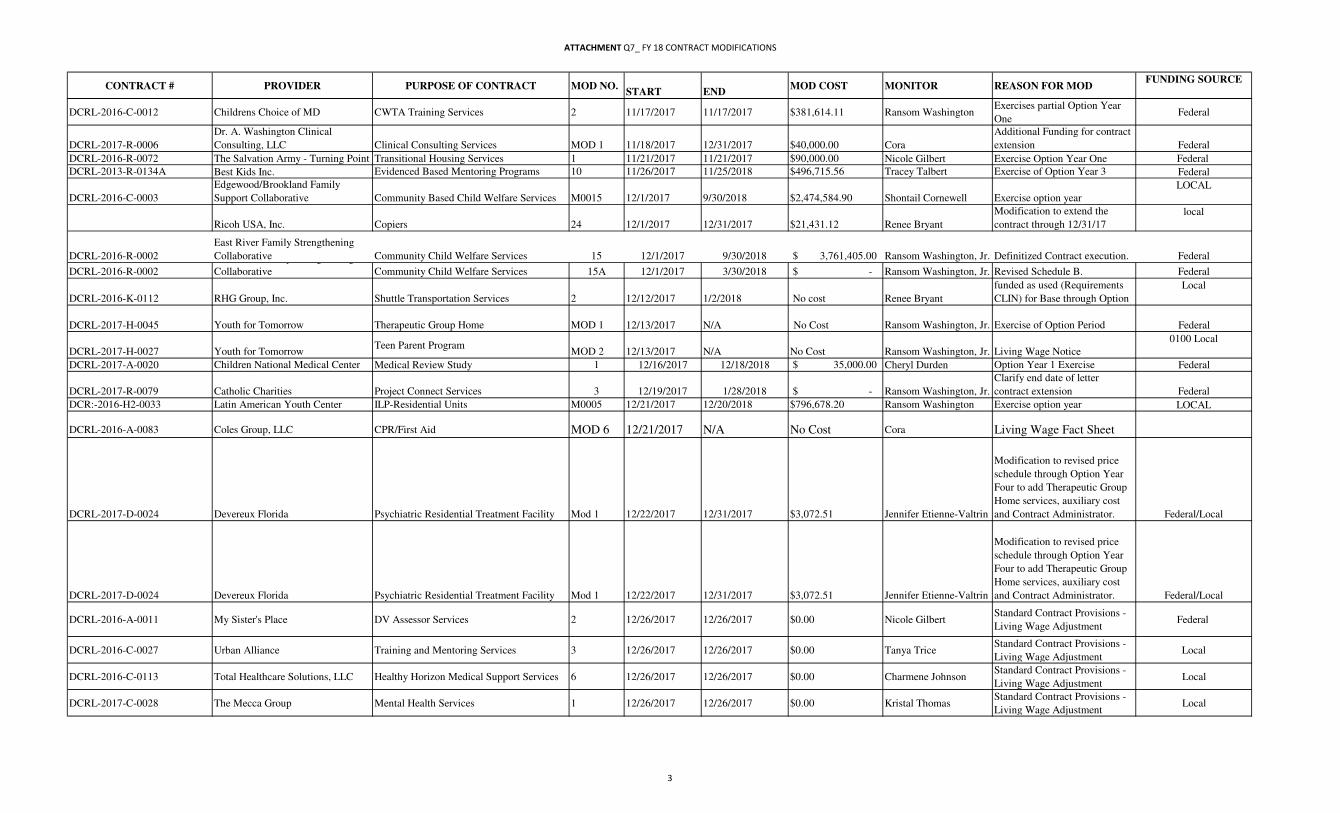
ATTACHMENT Q7_ FY 18 CONTRACT MODIFICATIONS
CONTRACT # PROVIDER PURPOSE OF CONTRACT MOD NO.START END
MOD COST MONITOR REASON FOR MODFUNDING SOURCE
DCRL-2016-C-0012 Childrens Choice of MD CWTA Training Services 2 11/17/2017 11/17/2017 $381,614.11 Ransom Washington Exercises partial Option Year
OneFederal
DCRL-2017-R-0006
Dr. A. Washington Clinical
Consulting, LLC Clinical Consulting Services MOD 1 11/18/2017 12/31/2017 $40,000.00 Cora
Additional Funding for contract
extension Federal
DCRL-2016-R-0072 The Salvation Army - Turning Point Transitional Housing Services 1 11/21/2017 11/21/2017 $90,000.00 Nicole Gilbert Exercise Option Year One Federal
DCRL-2013-R-0134A Best Kids Inc. Evidenced Based Mentoring Programs 10 11/26/2017 11/25/2018 $496,715.56 Tracey Talbert Exercise of Option Year 3 Federal
DCRL-2016-C-0003
Edgewood/Brookland Family
Support Collaborative Community Based Child Welfare Services M0015 12/1/2017 9/30/2018 $2,474,584.90 Shontail Cornewell Exercise option year
LOCAL
Ricoh USA, Inc. Copiers 24 12/1/2017 12/31/2017 $21,431.12 Renee Bryant
Modification to extend the
contract through 12/31/17
local
DCRL-2016-R-0002
East River Family Strengthening
Collaborative Community Child Welfare Services 15 12/1/2017 9/30/2018 $ 3,761,405.00 Ransom Washington, Jr. Definitized Contract execution. Federal
DCRL-2016-R-0002
East River Family Strengthening
Collaborative Community Child Welfare Services 15A 12/1/2017 3/30/2018 $ - Ransom Washington, Jr. Revised Schedule B. Federal
DCRL-2016-K-0112 RHG Group, Inc. Shuttle Transportation Services 2 12/12/2017 1/2/2018 No cost Renee Bryant
funded as used (Requirements
CLIN) for Base through Option
Local
DCRL-2017-H-0045 Youth for Tomorrow Therapeutic Group Home MOD 1 12/13/2017 N/A No Cost Ransom Washington, Jr. Exercise of Option Period Federal
DCRL-2017-H-0027 Youth for TomorrowTeen Parent Program
MOD 2 12/13/2017 N/A No Cost Ransom Washington, Jr. Living Wage Notice
0100 Local
DCRL-2017-A-0020 Children National Medical Center Medical Review Study 1 12/16/2017 12/18/2018 $ 35,000.00 Cheryl Durden Option Year 1 Exercise Federal
DCRL-2017-R-0079 Catholic Charities Project Connect Services 3 12/19/2017 1/28/2018 $ - Ransom Washington, Jr.
Clarify end date of letter
contract extension Federal
DCR:-2016-H2-0033 Latin American Youth Center ILP-Residential Units M0005 12/21/2017 12/20/2018 $796,678.20 Ransom Washington Exercise option year LOCAL
DCRL-2016-A-0083 Coles Group, LLC CPR/First Aid MOD 6 12/21/2017 N/A No Cost Cora Living Wage Fact Sheet
DCRL-2017-D-0024 Devereux Florida Psychiatric Residential Treatment Facility Mod 1 12/22/2017 12/31/2017 $3,072.51 Jennifer Etienne-Valtrin
Modification to revised price
schedule through Option Year
Four to add Therapeutic Group
Home services, auxiliary cost
and Contract Administrator. Federal/Local
DCRL-2016-A-0011 My Sister's Place DV Assessor Services 2 12/26/2017 12/26/2017 $0.00 Nicole Gilbert Standard Contract Provisions -
Living Wage Adjustment Federal
DCRL-2016-C-0027 Urban Alliance Training and Mentoring Services 3 12/26/2017 12/26/2017 $0.00 Tanya TriceStandard Contract Provisions -
Living Wage Adjustment Local
DCRL-2016-C-0113 Total Healthcare Solutions, LLC Healthy Horizon Medical Support Services 6 12/26/2017 12/26/2017 $0.00 Charmene JohnsonStandard Contract Provisions -
Living Wage Adjustment Local
DCRL-2017-C-0028 The Mecca Group Mental Health Services 1 12/26/2017 12/26/2017 $0.00 Kristal Thomas Standard Contract Provisions -
Living Wage Adjustment Local
3
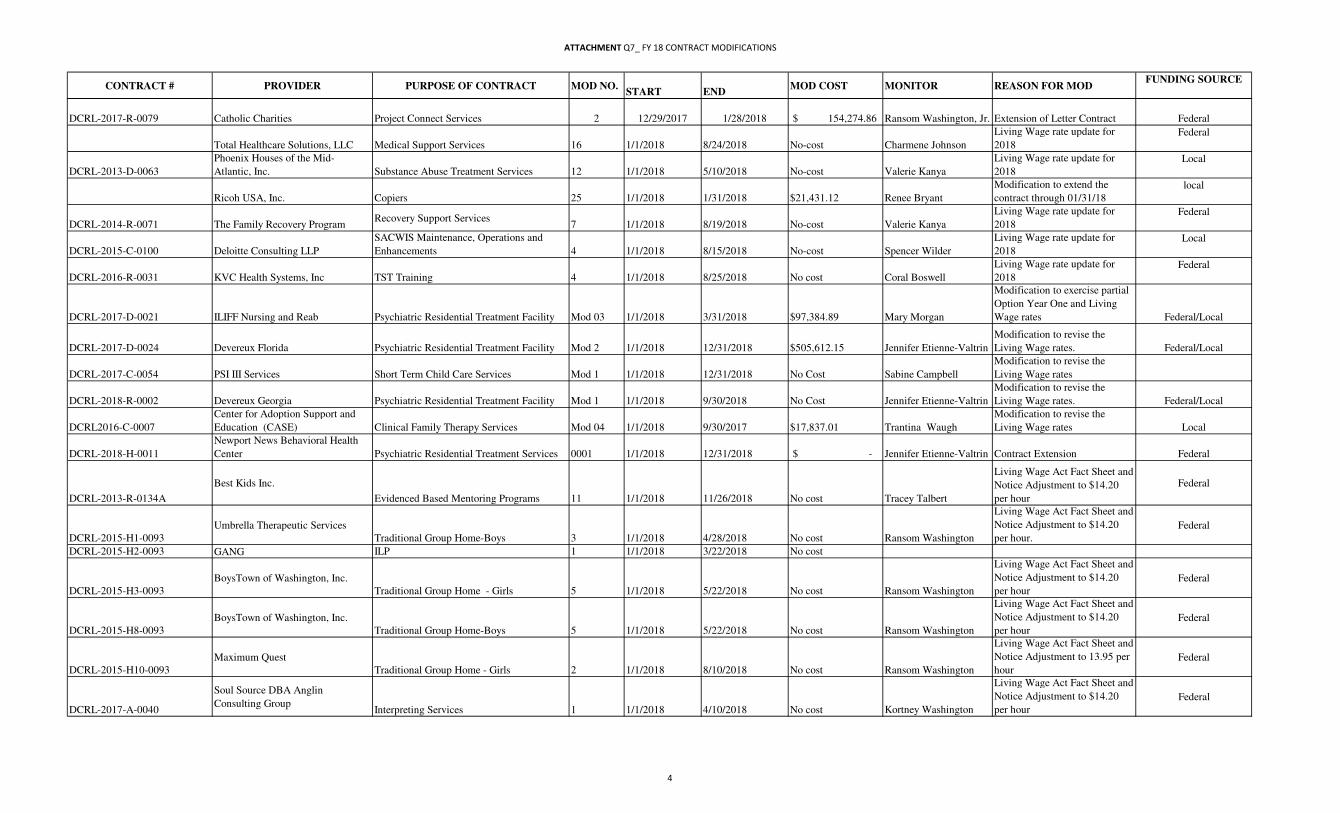
ATTACHMENT Q7_ FY 18 CONTRACT MODIFICATIONS
CONTRACT # PROVIDER PURPOSE OF CONTRACT MOD NO.START END
MOD COST MONITOR REASON FOR MODFUNDING SOURCE
DCRL-2017-R-0079 Catholic Charities Project Connect Services 2 12/29/2017 1/28/2018 $ 154,274.86 Ransom Washington, Jr. Extension of Letter Contract Federal
Total Healthcare Solutions, LLC Medical Support Services 16 1/1/2018 8/24/2018 No-cost Charmene Johnson
Living Wage rate update for
2018
Federal
DCRL-2013-D-0063
Phoenix Houses of the Mid-
Atlantic, Inc. Substance Abuse Treatment Services 12 1/1/2018 5/10/2018 No-cost Valerie Kanya
Living Wage rate update for
2018
Local
Ricoh USA, Inc. Copiers 25 1/1/2018 1/31/2018 $21,431.12 Renee Bryant
Modification to extend the
contract through 01/31/18
local
DCRL-2014-R-0071 The Family Recovery ProgramRecovery Support Services
7 1/1/2018 8/19/2018 No-cost Valerie Kanya
Living Wage rate update for
2018
Federal
DCRL-2015-C-0100 Deloitte Consulting LLP
SACWIS Maintenance, Operations and
Enhancements 4 1/1/2018 8/15/2018 No-cost Spencer Wilder
Living Wage rate update for
2018
Local
DCRL-2016-R-0031 KVC Health Systems, Inc TST Training 4 1/1/2018 8/25/2018 No cost Coral Boswell
Living Wage rate update for
2018
Federal
DCRL-2017-D-0021 ILIFF Nursing and Reab Psychiatric Residential Treatment Facility Mod 03 1/1/2018 3/31/2018 $97,384.89 Mary Morgan
Modification to exercise partial
Option Year One and Living
Wage rates Federal/Local
DCRL-2017-D-0024 Devereux Florida Psychiatric Residential Treatment Facility Mod 2 1/1/2018 12/31/2018 $505,612.15 Jennifer Etienne-Valtrin
Modification to revise the
Living Wage rates. Federal/Local
DCRL-2017-C-0054 PSI III Services Short Term Child Care Services Mod 1 1/1/2018 12/31/2018 No Cost Sabine Campbell
Modification to revise the
Living Wage rates
DCRL-2018-R-0002 Devereux Georgia Psychiatric Residential Treatment Facility Mod 1 1/1/2018 9/30/2018 No Cost Jennifer Etienne-Valtrin
Modification to revise the
Living Wage rates. Federal/Local
DCRL2016-C-0007
Center for Adoption Support and
Education (CASE) Clinical Family Therapy Services Mod 04 1/1/2018 9/30/2017 $17,837.01 Trantina Waugh
Modification to revise the
Living Wage rates Local
DCRL-2018-H-0011
Newport News Behavioral Health
Center Psychiatric Residential Treatment Services 0001 1/1/2018 12/31/2018 $ - Jennifer Etienne-Valtrin Contract Extension Federal
DCRL-2013-R-0134A
Best Kids Inc.
Evidenced Based Mentoring Programs 11 1/1/2018 11/26/2018 No cost Tracey Talbert
Living Wage Act Fact Sheet and
Notice Adjustment to $14.20
per hour
Federal
DCRL-2015-H1-0093
Umbrella Therapeutic Services
Traditional Group Home-Boys 3 1/1/2018 4/28/2018 No cost Ransom Washington
Living Wage Act Fact Sheet and
Notice Adjustment to $14.20
per hour.
Federal
DCRL-2015-H2-0093 GANG ILP 1 1/1/2018 3/22/2018 No cost
DCRL-2015-H3-0093
BoysTown of Washington, Inc.
Traditional Group Home - Girls 5 1/1/2018 5/22/2018 No cost Ransom Washington
Living Wage Act Fact Sheet and
Notice Adjustment to $14.20
per hour
Federal
DCRL-2015-H8-0093
BoysTown of Washington, Inc.
Traditional Group Home-Boys 5 1/1/2018 5/22/2018 No cost Ransom Washington
Living Wage Act Fact Sheet and
Notice Adjustment to $14.20
per hour
Federal
DCRL-2015-H10-0093
Maximum Quest
Traditional Group Home - Girls 2 1/1/2018 8/10/2018 No cost Ransom Washington
Living Wage Act Fact Sheet and
Notice Adjustment to 13.95 per
hour
Federal
DCRL-2017-A-0040
Soul Source DBA Anglin
Consulting GroupInterpreting Services 1 1/1/2018 4/10/2018 No cost Kortney Washington
Living Wage Act Fact Sheet and
Notice Adjustment to $14.20
per hour
Federal
4
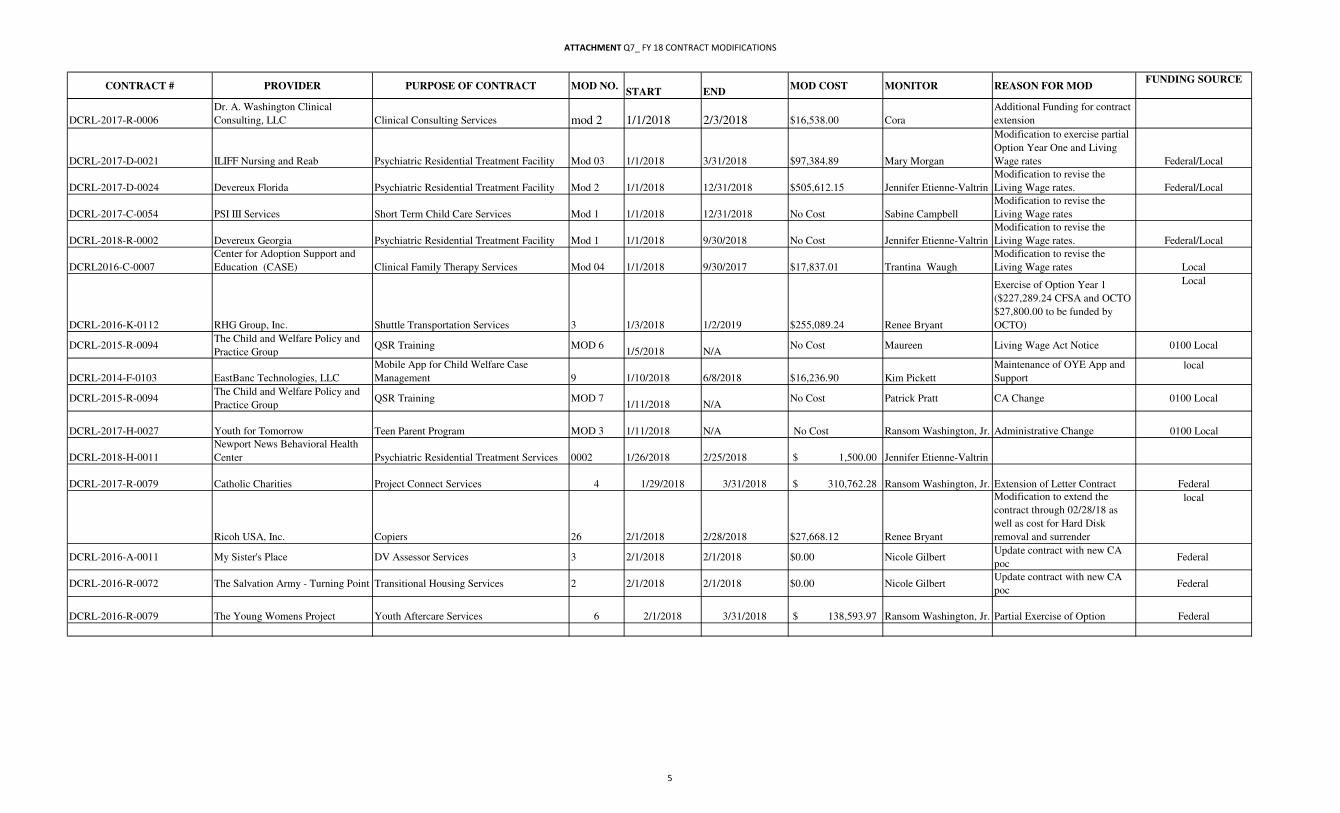
ATTACHMENT Q7_ FY 18 CONTRACT MODIFICATIONS
CONTRACT # PROVIDER PURPOSE OF CONTRACT MOD NO.START END
MOD COST MONITOR REASON FOR MODFUNDING SOURCE
DCRL-2017-R-0006
Dr. A. Washington Clinical
Consulting, LLC Clinical Consulting Services mod 2 1/1/2018 2/3/2018 $16,538.00 Cora
Additional Funding for contract
extension
DCRL-2017-D-0021 ILIFF Nursing and Reab Psychiatric Residential Treatment Facility Mod 03 1/1/2018 3/31/2018 $97,384.89 Mary Morgan
Modification to exercise partial
Option Year One and Living
Wage rates Federal/Local
DCRL-2017-D-0024 Devereux Florida Psychiatric Residential Treatment Facility Mod 2 1/1/2018 12/31/2018 $505,612.15 Jennifer Etienne-Valtrin
Modification to revise the
Living Wage rates. Federal/Local
DCRL-2017-C-0054 PSI III Services Short Term Child Care Services Mod 1 1/1/2018 12/31/2018 No Cost Sabine Campbell
Modification to revise the
Living Wage rates
DCRL-2018-R-0002 Devereux Georgia Psychiatric Residential Treatment Facility Mod 1 1/1/2018 9/30/2018 No Cost Jennifer Etienne-Valtrin
Modification to revise the
Living Wage rates. Federal/Local
DCRL2016-C-0007
Center for Adoption Support and
Education (CASE) Clinical Family Therapy Services Mod 04 1/1/2018 9/30/2017 $17,837.01 Trantina Waugh
Modification to revise the
Living Wage rates Local
DCRL-2016-K-0112 RHG Group, Inc. Shuttle Transportation Services 3 1/3/2018 1/2/2019 $255,089.24 Renee Bryant
Exercise of Option Year 1
($227,289.24 CFSA and OCTO
$27,800.00 to be funded by
OCTO)
Local
DCRL-2015-R-0094The Child and Welfare Policy and
Practice GroupQSR Training MOD 6
1/5/2018 N/ANo Cost Maureen Living Wage Act Notice 0100 Local
DCRL-2014-F-0103 EastBanc Technologies, LLC
Mobile App for Child Welfare Case
Management 9 1/10/2018 6/8/2018 $16,236.90 Kim Pickett
Maintenance of OYE App and
Support
local
DCRL-2015-R-0094The Child and Welfare Policy and
Practice GroupQSR Training MOD 7
1/11/2018 N/ANo Cost Patrick Pratt CA Change 0100 Local
DCRL-2017-H-0027 Youth for Tomorrow Teen Parent Program MOD 3 1/11/2018 N/A No Cost Ransom Washington, Jr. Administrative Change 0100 Local
DCRL-2018-H-0011
Newport News Behavioral Health
Center Psychiatric Residential Treatment Services 0002 1/26/2018 2/25/2018 $ 1,500.00 Jennifer Etienne-Valtrin
DCRL-2017-R-0079 Catholic Charities Project Connect Services 4 1/29/2018 3/31/2018 $ 310,762.28 Ransom Washington, Jr. Extension of Letter Contract Federal
Ricoh USA, Inc. Copiers 26 2/1/2018 2/28/2018 $27,668.12 Renee Bryant
Modification to extend the
contract through 02/28/18 as
well as cost for Hard Disk
removal and surrender
local
DCRL-2016-A-0011 My Sister's Place DV Assessor Services 3 2/1/2018 2/1/2018 $0.00 Nicole Gilbert Update contract with new CA
pocFederal
DCRL-2016-R-0072 The Salvation Army - Turning Point Transitional Housing Services 2 2/1/2018 2/1/2018 $0.00 Nicole Gilbert Update contract with new CA
pocFederal
DCRL-2016-R-0079 The Young Womens Project Youth Aftercare Services 6 2/1/2018 3/31/2018 $ 138,593.97 Ransom Washington, Jr. Partial Exercise of Option Federal
5
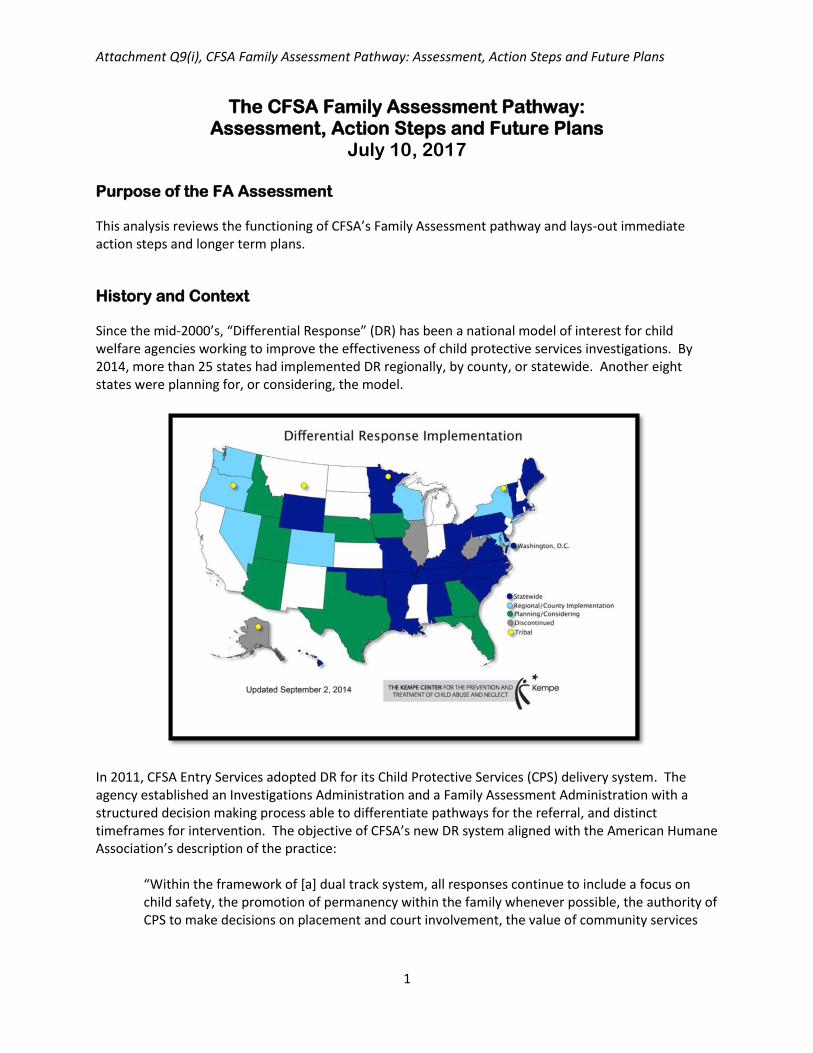
Attachment Q9(i), CFSA Family Assessment Pathway: Assessment, Action Steps and Future Plans
1
The CFSA Family Assessment Pathway: Assessment, Action Steps and Future Plans
July 10, 2017
Purpose of the FA Assessment
This analysis reviews the functioning of CFSA’s Family Assessment pathway and lays-out immediate action steps and longer term plans.
History and Context
Since the mid-2000’s, “Differential Response” (DR) has been a national model of interest for child welfare agencies working to improve the effectiveness of child protective services investigations. By 2014, more than 25 states had implemented DR regionally, by county, or statewide. Another eight states were planning for, or considering, the model.
In 2011, CFSA Entry Services adopted DR for its Child Protective Services (CPS) delivery system. The agency established an Investigations Administration and a Family Assessment Administration with a structured decision making process able to differentiate pathways for the referral, and distinct timeframes for intervention. The objective of CFSA’s new DR system aligned with the American Humane Association’s description of the practice:
“Within the framework of [a] dual track system, all responses continue to include a focus on child safety, the promotion of permanency within the family whenever possible, the authority of CPS to make decisions on placement and court involvement, the value of community services
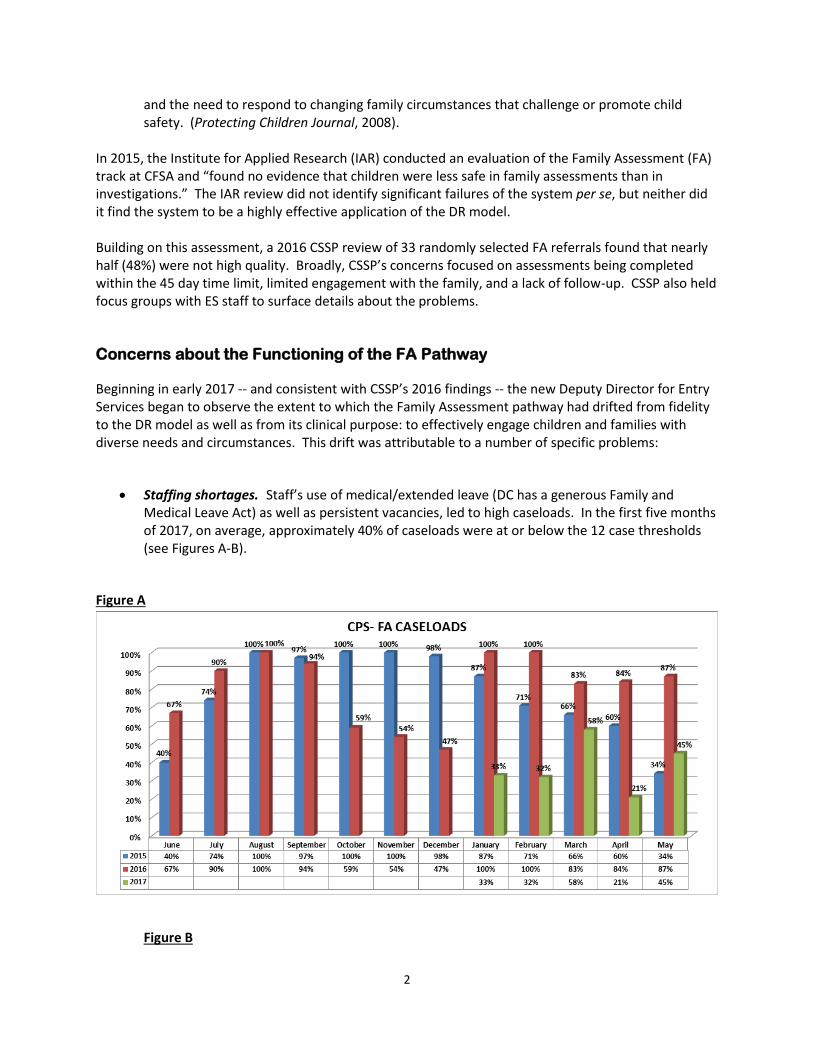
2
and the need to respond to changing family circumstances that challenge or promote child safety. (Protecting Children Journal, 2008).
In 2015, the Institute for Applied Research (IAR) conducted an evaluation of the Family Assessment (FA) track at CFSA and “found no evidence that children were less safe in family assessments than in investigations.” The IAR review did not identify significant failures of the system per se, but neither did it find the system to be a highly effective application of the DR model. Building on this assessment, a 2016 CSSP review of 33 randomly selected FA referrals found that nearly half (48%) were not high quality. Broadly, CSSP’s concerns focused on assessments being completed within the 45 day time limit, limited engagement with the family, and a lack of follow-up. CSSP also held focus groups with ES staff to surface details about the problems.
Concerns about the Functioning of the FA Pathway
Beginning in early 2017 -- and consistent with CSSP’s 2016 findings -- the new Deputy Director for Entry Services began to observe the extent to which the Family Assessment pathway had drifted from fidelity to the DR model as well as from its clinical purpose: to effectively engage children and families with diverse needs and circumstances. This drift was attributable to a number of specific problems:
Staffing shortages. Staff’s use of medical/extended leave (DC has a generous Family and Medical Leave Act) as well as persistent vacancies, led to high caseloads. In the first five months of 2017, on average, approximately 40% of caseloads were at or below the 12 case thresholds (see Figures A-B).
Figure A
Figure B
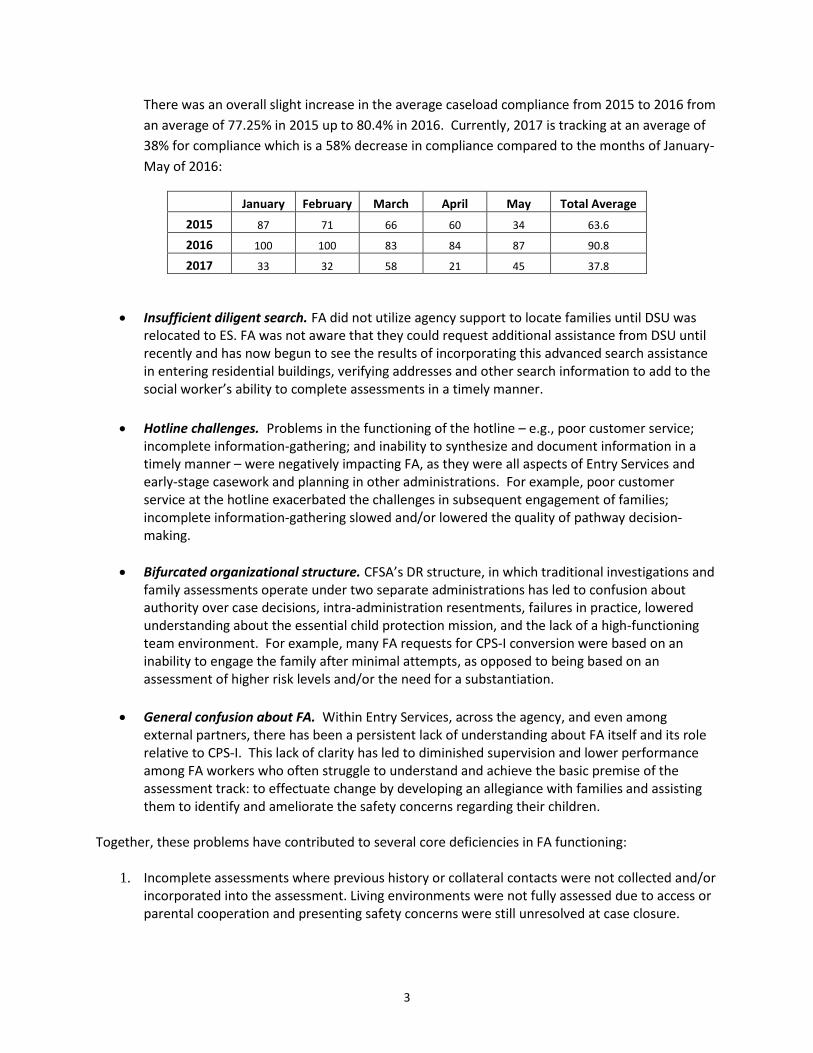
3
There was an overall slight increase in the average caseload compliance from 2015 to 2016 from
an average of 77.25% in 2015 up to 80.4% in 2016. Currently, 2017 is tracking at an average of
38% for compliance which is a 58% decrease in compliance compared to the months of January-
May of 2016:
January February March April May Total Average
2015 87 71 66 60 34 63.6
2016 100 100 83 84 87 90.8
2017 33 32 58 21 45 37.8
Insufficient diligent search. FA did not utilize agency support to locate families until DSU was relocated to ES. FA was not aware that they could request additional assistance from DSU until recently and has now begun to see the results of incorporating this advanced search assistance in entering residential buildings, verifying addresses and other search information to add to the social worker’s ability to complete assessments in a timely manner.
Hotline challenges. Problems in the functioning of the hotline – e.g., poor customer service; incomplete information-gathering; and inability to synthesize and document information in a timely manner – were negatively impacting FA, as they were all aspects of Entry Services and early-stage casework and planning in other administrations. For example, poor customer service at the hotline exacerbated the challenges in subsequent engagement of families; incomplete information-gathering slowed and/or lowered the quality of pathway decision-making.
Bifurcated organizational structure. CFSA’s DR structure, in which traditional investigations and family assessments operate under two separate administrations has led to confusion about authority over case decisions, intra-administration resentments, failures in practice, lowered understanding about the essential child protection mission, and the lack of a high-functioning team environment. For example, many FA requests for CPS-I conversion were based on an inability to engage the family after minimal attempts, as opposed to being based on an assessment of higher risk levels and/or the need for a substantiation.
General confusion about FA. Within Entry Services, across the agency, and even among external partners, there has been a persistent lack of understanding about FA itself and its role relative to CPS-I. This lack of clarity has led to diminished supervision and lower performance among FA workers who often struggle to understand and achieve the basic premise of the assessment track: to effectuate change by developing an allegiance with families and assisting them to identify and ameliorate the safety concerns regarding their children.
Together, these problems have contributed to several core deficiencies in FA functioning:
1. Incomplete assessments where previous history or collateral contacts were not collected and/or incorporated into the assessment. Living environments were not fully assessed due to access or parental cooperation and presenting safety concerns were still unresolved at case closure.
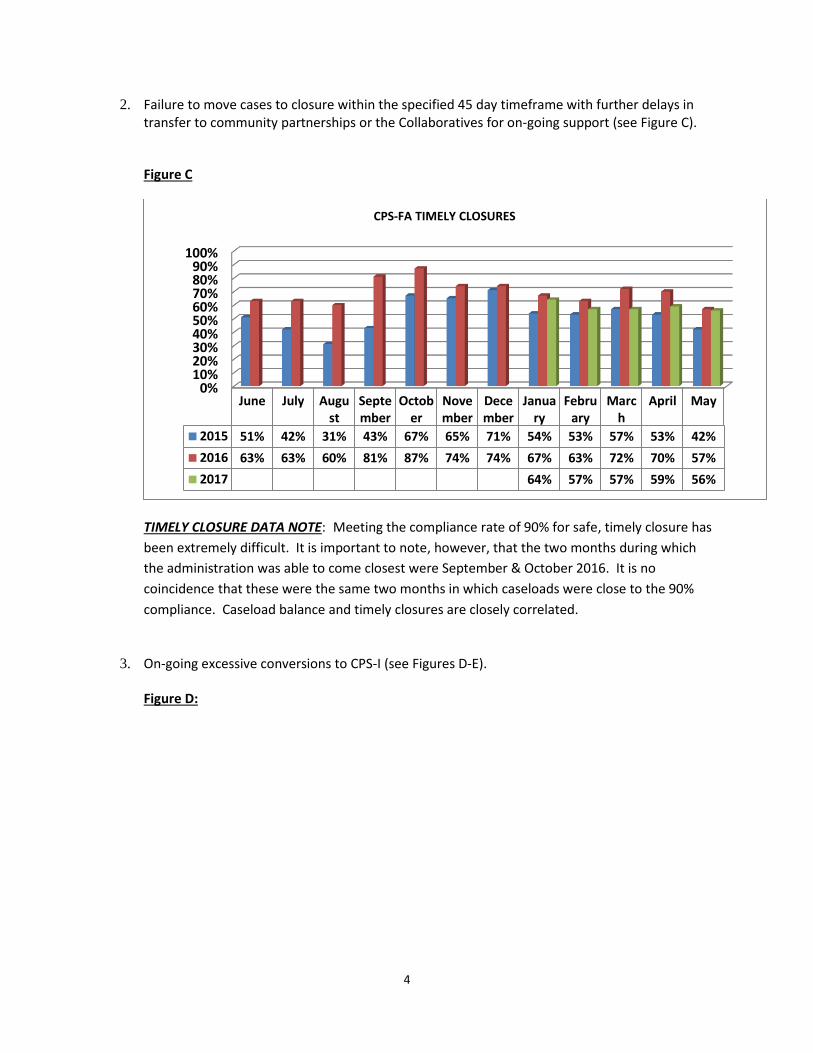
4
2. Failure to move cases to closure within the specified 45 day timeframe with further delays in transfer to community partnerships or the Collaboratives for on-going support (see Figure C).
Figure C
TIMELY CLOSURE DATA NOTE: Meeting the compliance rate of 90% for safe, timely closure has
been extremely difficult. It is important to note, however, that the two months during which
the administration was able to come closest were September & October 2016. It is no
coincidence that these were the same two months in which caseloads were close to the 90%
compliance. Caseload balance and timely closures are closely correlated.
3. On-going excessive conversions to CPS-I (see Figures D-E).
Figure D:
0%10%20%30%40%50%60%70%80%90%
100%
June July August
September
October
November
December
January
February
March
April May
2015 51% 42% 31% 43% 67% 65% 71% 54% 53% 57% 53% 42%
2016 63% 63% 60% 81% 87% 74% 74% 67% 63% 72% 70% 57%
2017 64% 57% 57% 59% 56%
CPS-FA TIMELY CLOSURES
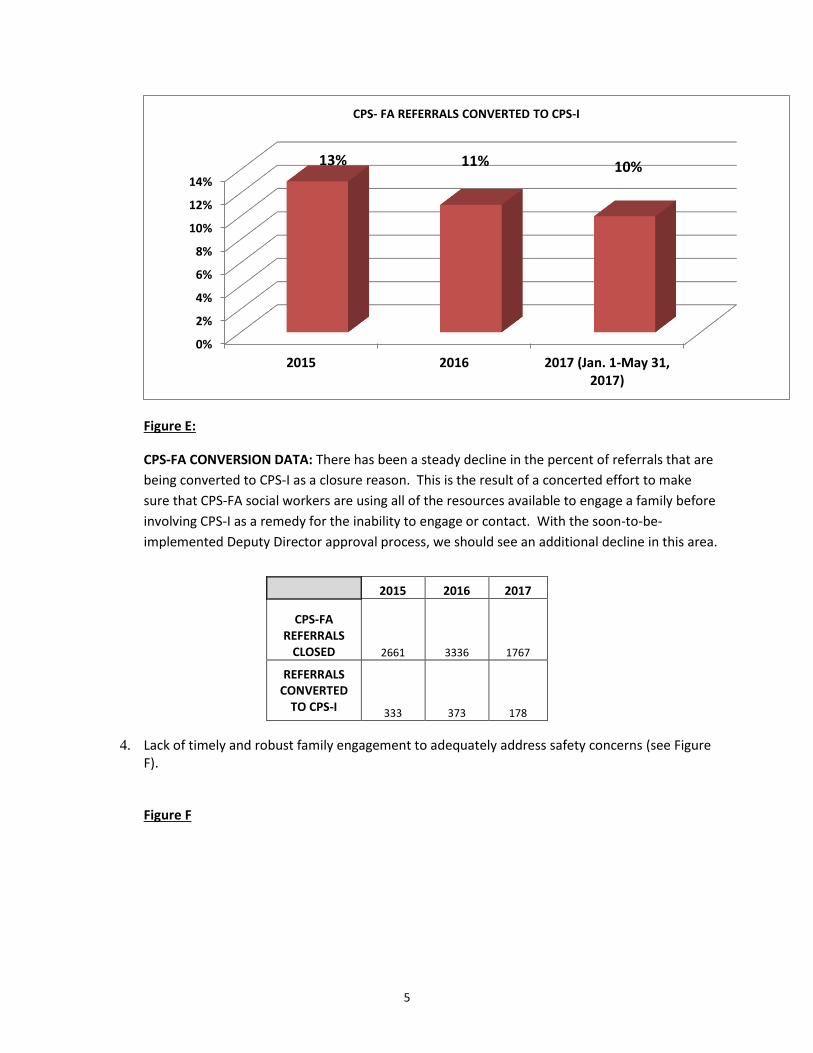
5
Figure E:
CPS-FA CONVERSION DATA: There has been a steady decline in the percent of referrals that are
being converted to CPS-I as a closure reason. This is the result of a concerted effort to make
sure that CPS-FA social workers are using all of the resources available to engage a family before
involving CPS-I as a remedy for the inability to engage or contact. With the soon-to-be-
implemented Deputy Director approval process, we should see an additional decline in this area.
4. Lack of timely and robust family engagement to adequately address safety concerns (see Figure
F).
Figure F
0%
2%
4%
6%
8%
10%
12%
14%
2015 2016 2017 (Jan. 1-May 31,2017)
13% 11% 10%
CPS- FA REFERRALS CONVERTED TO CPS-I
2015 2016 2017
CPS-FA REFERRALS
CLOSED 2661 3336 1767
REFERRALS CONVERTED
TO CPS-I 333 373 178
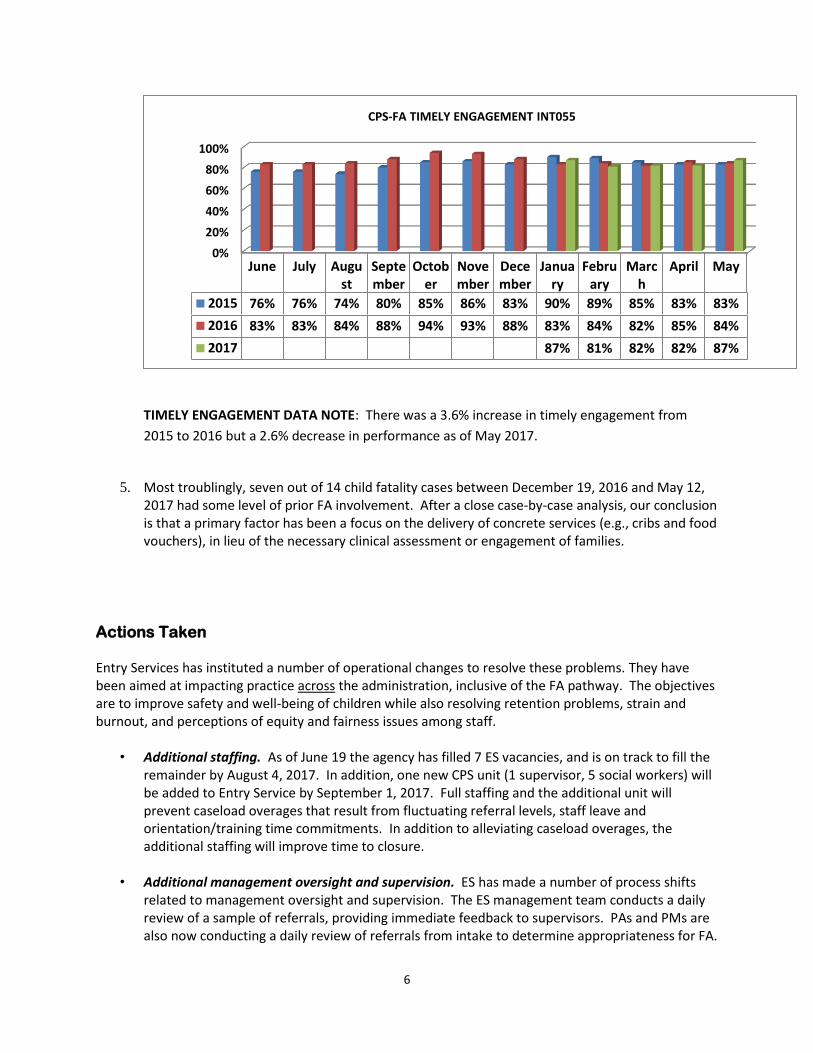
6
TIMELY ENGAGEMENT DATA NOTE: There was a 3.6% increase in timely engagement from
2015 to 2016 but a 2.6% decrease in performance as of May 2017.
5. Most troublingly, seven out of 14 child fatality cases between December 19, 2016 and May 12,
2017 had some level of prior FA involvement. After a close case-by-case analysis, our conclusion is that a primary factor has been a focus on the delivery of concrete services (e.g., cribs and food vouchers), in lieu of the necessary clinical assessment or engagement of families.
Actions Taken Entry Services has instituted a number of operational changes to resolve these problems. They have been aimed at impacting practice across the administration, inclusive of the FA pathway. The objectives are to improve safety and well-being of children while also resolving retention problems, strain and burnout, and perceptions of equity and fairness issues among staff.
• Additional staffing. As of June 19 the agency has filled 7 ES vacancies, and is on track to fill the remainder by August 4, 2017. In addition, one new CPS unit (1 supervisor, 5 social workers) will be added to Entry Service by September 1, 2017. Full staffing and the additional unit will prevent caseload overages that result from fluctuating referral levels, staff leave and orientation/training time commitments. In addition to alleviating caseload overages, the additional staffing will improve time to closure.
• Additional management oversight and supervision. ES has made a number of process shifts related to management oversight and supervision. The ES management team conducts a daily review of a sample of referrals, providing immediate feedback to supervisors. PAs and PMs are also now conducting a daily review of referrals from intake to determine appropriateness for FA.
0%
20%
40%
60%
80%
100%
June July August
September
October
November
December
January
February
March
April May
2015 76% 76% 74% 80% 85% 86% 83% 90% 89% 85% 83% 83%
2016 83% 83% 84% 88% 94% 93% 88% 83% 84% 82% 85% 84%
2017 87% 81% 82% 82% 87%
CPS-FA TIMELY ENGAGEMENT INT055
7
In addition, the DDES holds regular PA/PM meetings to review referrals. All of these efforts are aimed at increasing supervisory skills and consistency and improving family engagement practice.
• Additional training. All ES staff and supervisors are required to attend CWTA’s “Back-to-Basics” training focused on engagement, documentation and work process. In addition, MACWIS clinical supervision training has been mandated for all supervisors. The trainings will equip supervisors to provide support and direction to staff that: incorporates critical thinking and assessment skills; applies clinical principles and methods to engage and plan with families; and generates positive outcomes for children and families involved in the child welfare system.
• Screening and teaming protocol changes. As of June, 2017, all possible screen-out referrals are
sent to the Hotline RED Team; no screen-outs are completed by any individual staff member. (Note: this excludes non-caregiver assaults; victim child 18 years or older; out of jurisdiction; or no allegations reported/SDM Preliminary Screen Out). All babies with positive toxicology are also automatically screened-in. Previously, those positive for marijuana/THC were not. Finally, any reports with gray areas go to the Hotline R.E.D. Team for review. These changes increase the use of – and benefits derived from -- multi-disciplinary team decision-making at a critical juncture, while reducing the instance and impact of individual judgment.
• Expedited case transfer process. A new transfer process was initiated in May, 2017 to more
quickly and substantively connect closing CPS cases to the Community Partnership Administration’s In-Home services or to the Collaboratives. The new process better supports families and decreases the time of transfer, helping to lower caseloads.
• Diligent search unit relocated to ES. As of May, 2017 the Diligent Search Unit returned to ES and
members are now attending each 10/15 Day R.E.D. Team meeting to assist with search-related activities, and are going out with CPS workers. A significant proportion of FA workers had been reporting challenges with finding clients and entering locked or secure buildings. The addition of a diligent search staff member to the team helps ameliorate situations like this and also supports more expeditious location of family members both in and out of jurisdiction.
• Increased Attention to the Clinical Aspects of Practice. As described above, supervisors are
being trained and supported to develop and deploy better supervisory and critical thinking skills -- to model critical thinking and good clinical practice for staff. The use of the 4+ staffing criteria is one example of how expanded expectations for clinical conversation can become part of standard practice, ensuring greater consistency and more immediate flagging of risk factors (see Figure G)
Significant Declines in Conversions in 2017. Results from recent (Jan-Mar, 2017) QA reviews of
the Hotline and the Educational Neglect triage process are encouraging, demonstrating concrete
practice improvements. In these reviews, there was agreement with Hotline screening decisions
in 27 out of 30 calls and with the Ed Neglect screen-out decision for 112 (86%) of 126 referrals.
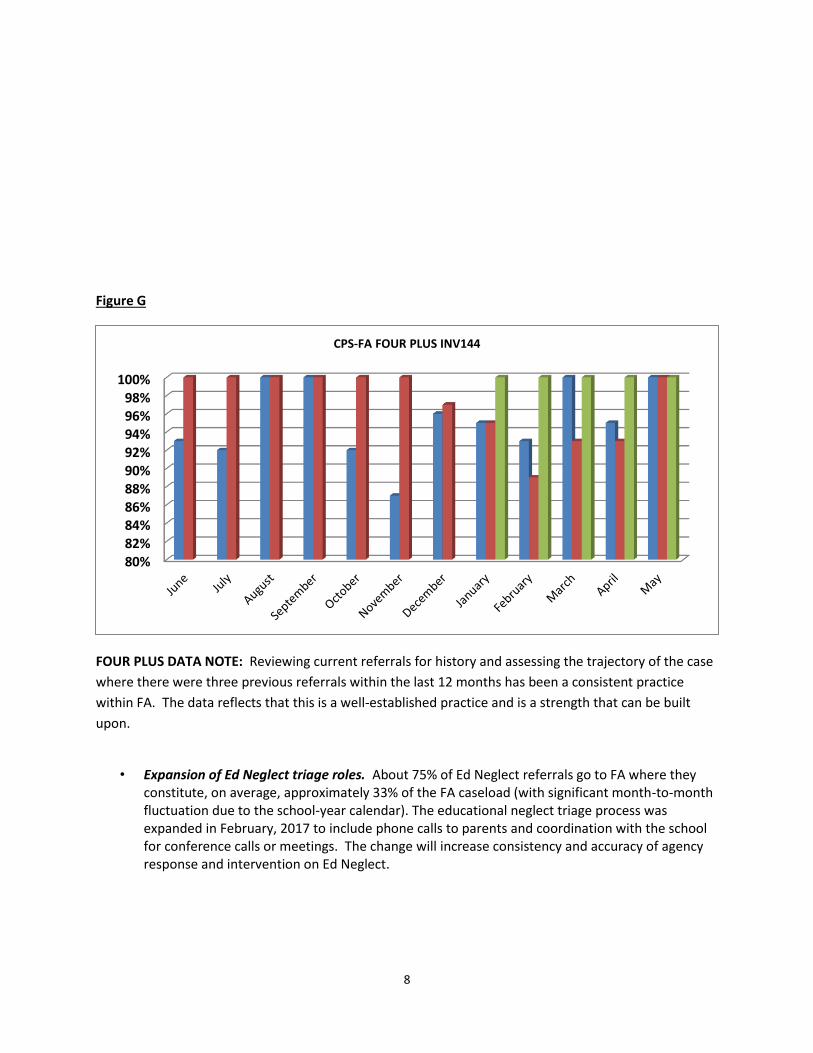
8
Figure G
FOUR PLUS DATA NOTE: Reviewing current referrals for history and assessing the trajectory of the case
where there were three previous referrals within the last 12 months has been a consistent practice
within FA. The data reflects that this is a well-established practice and is a strength that can be built
upon.
• Expansion of Ed Neglect triage roles. About 75% of Ed Neglect referrals go to FA where they
constitute, on average, approximately 33% of the FA caseload (with significant month-to-month fluctuation due to the school-year calendar). The educational neglect triage process was expanded in February, 2017 to include phone calls to parents and coordination with the school for conference calls or meetings. The change will increase consistency and accuracy of agency response and intervention on Ed Neglect.
80%82%84%86%88%90%92%94%96%98%
100%
CPS-FA FOUR PLUS INV144
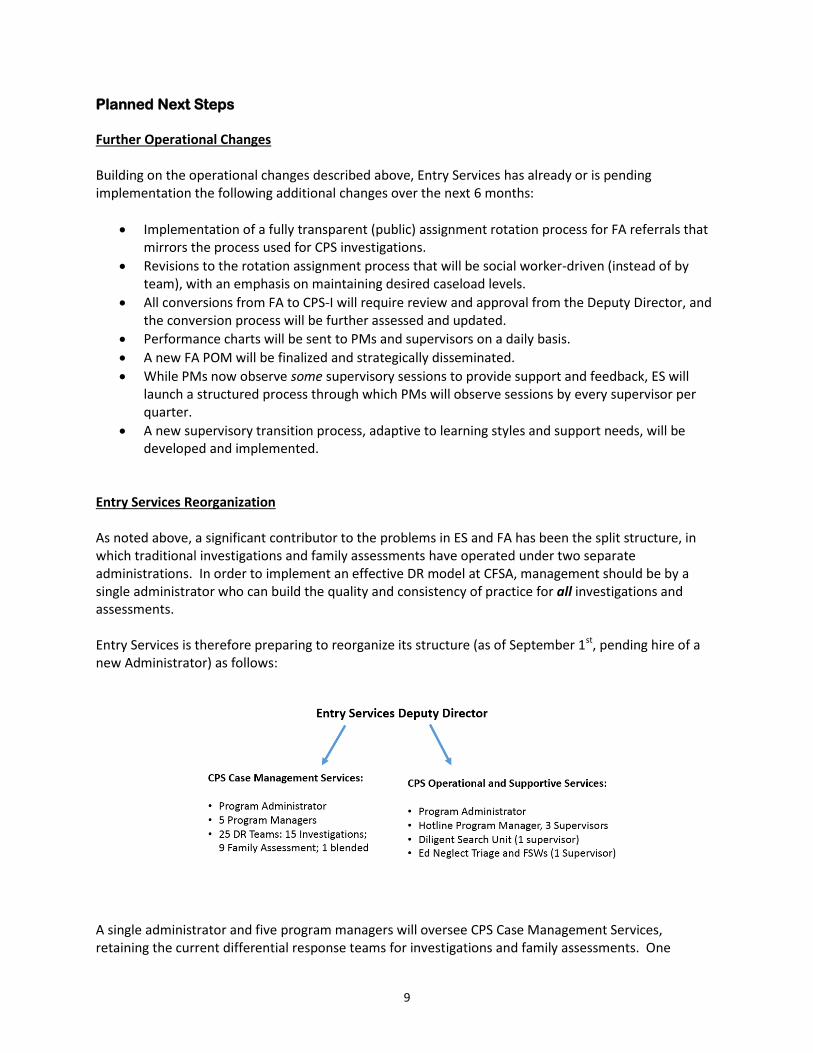
9
Planned Next Steps Further Operational Changes Building on the operational changes described above, Entry Services has already or is pending implementation the following additional changes over the next 6 months:
Implementation of a fully transparent (public) assignment rotation process for FA referrals that mirrors the process used for CPS investigations.
Revisions to the rotation assignment process that will be social worker-driven (instead of by team), with an emphasis on maintaining desired caseload levels.
All conversions from FA to CPS-I will require review and approval from the Deputy Director, and the conversion process will be further assessed and updated.
Performance charts will be sent to PMs and supervisors on a daily basis.
A new FA POM will be finalized and strategically disseminated.
While PMs now observe some supervisory sessions to provide support and feedback, ES will launch a structured process through which PMs will observe sessions by every supervisor per quarter.
A new supervisory transition process, adaptive to learning styles and support needs, will be developed and implemented.
Entry Services Reorganization As noted above, a significant contributor to the problems in ES and FA has been the split structure, in which traditional investigations and family assessments have operated under two separate administrations. In order to implement an effective DR model at CFSA, management should be by a single administrator who can build the quality and consistency of practice for all investigations and assessments. Entry Services is therefore preparing to reorganize its structure (as of September 1st, pending hire of a new Administrator) as follows:
A single administrator and five program managers will oversee CPS Case Management Services, retaining the current differential response teams for investigations and family assessments. One
10
blended team capable of responding to all referrals will be added to the administration in order to maximize responsiveness to the fluctuating caseload. The three non-case-carrying functions within Entry Services (the Hotline, Diligent Search and Educational Neglect Triage), which feed pertinent information to the DR case-management work, will be overseen by the Administrator for CPS Operational and Supportive Services. Entry Services Program Administrators and Managers will be assigned across these two divisions based on their oversight experience and areas of expertise. Together, they will forge better communication and cohesiveness between the two functional areas, creating an efficient and effective Child Protective Services Operation.
Looking Ahead It is anticipated that the range of operational and structural changes articulated here will have a significant positive impact on the work of Entry Services -- and with it, the FA pathway in particular -- all aimed at improving outcomes for the children and families served. We will adopt a CQI approach for assessing the effectiveness of these changes, reviewing progress on the process and outcomes metrics at three, six and 12 months. We look forward to the opportunity to report continued progress and improvement in the months ahead.

Attachment Q9(i), CFSA Family Assessment Pathway: Assessment, Action Steps and Future Plans
11
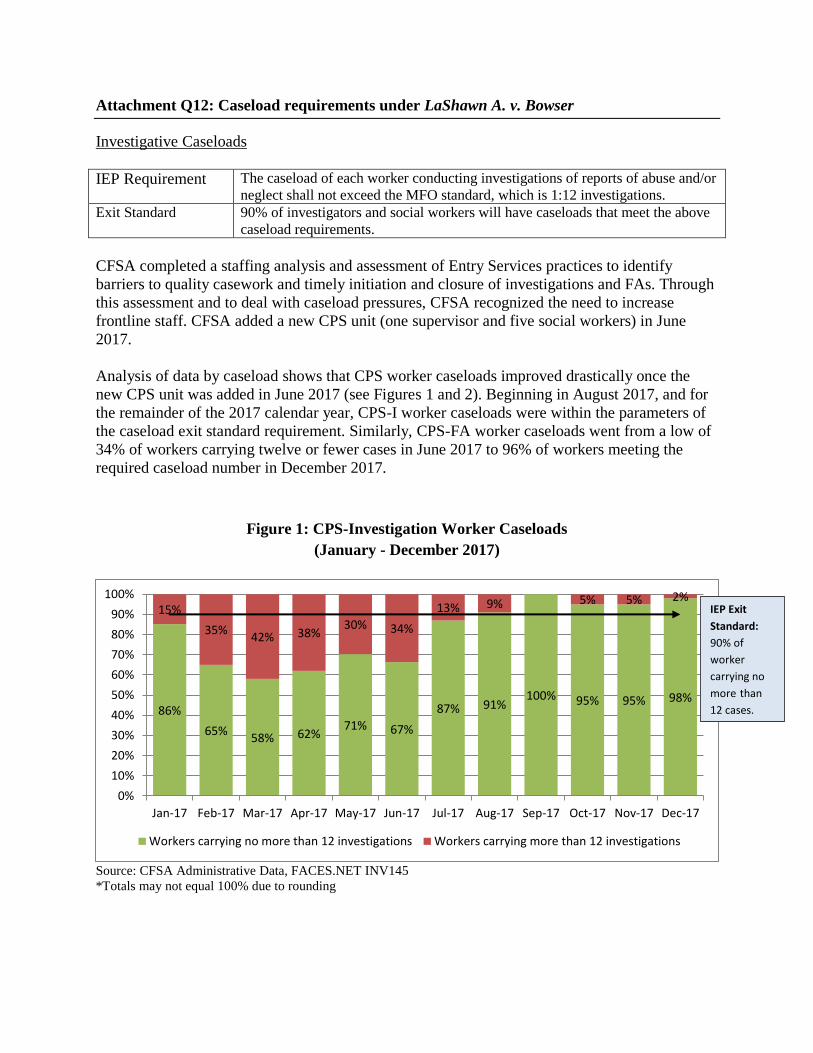
Attachment Q12: Caseload requirements under LaShawn A. v. Bowser
Investigative Caseloads
IEP Requirement The caseload of each worker conducting investigations of reports of abuse and/or
neglect shall not exceed the MFO standard, which is 1:12 investigations.
Exit Standard 90% of investigators and social workers will have caseloads that meet the above
caseload requirements.
CFSA completed a staffing analysis and assessment of Entry Services practices to identify
barriers to quality casework and timely initiation and closure of investigations and FAs. Through
this assessment and to deal with caseload pressures, CFSA recognized the need to increase
frontline staff. CFSA added a new CPS unit (one supervisor and five social workers) in June
2017.
Analysis of data by caseload shows that CPS worker caseloads improved drastically once the
new CPS unit was added in June 2017 (see Figures 1 and 2). Beginning in August 2017, and for
the remainder of the 2017 calendar year, CPS-I worker caseloads were within the parameters of
the caseload exit standard requirement. Similarly, CPS-FA worker caseloads went from a low of
34% of workers carrying twelve or fewer cases in June 2017 to 96% of workers meeting the
required caseload number in December 2017.
Figure 1: CPS-Investigation Worker Caseloads
(January - December 2017)
Source: CFSA Administrative Data, FACES.NET INV145
*Totals may not equal 100% due to rounding
86%
65% 58% 62%
71% 67%
87% 91% 100% 95% 95% 98%
15%
35% 42% 38%
30% 34%
13% 9% 5% 5% 2%
0%
10%
20%
30%
40%
50%
60%
70%
80%
90%
100%
Jan-17 Feb-17 Mar-17 Apr-17 May-17 Jun-17 Jul-17 Aug-17 Sep-17 Oct-17 Nov-17 Dec-17
Workers carrying no more than 12 investigations Workers carrying more than 12 investigations
IEP Exit
Standard:
90% of
worker
carrying no
more than
12 cases.
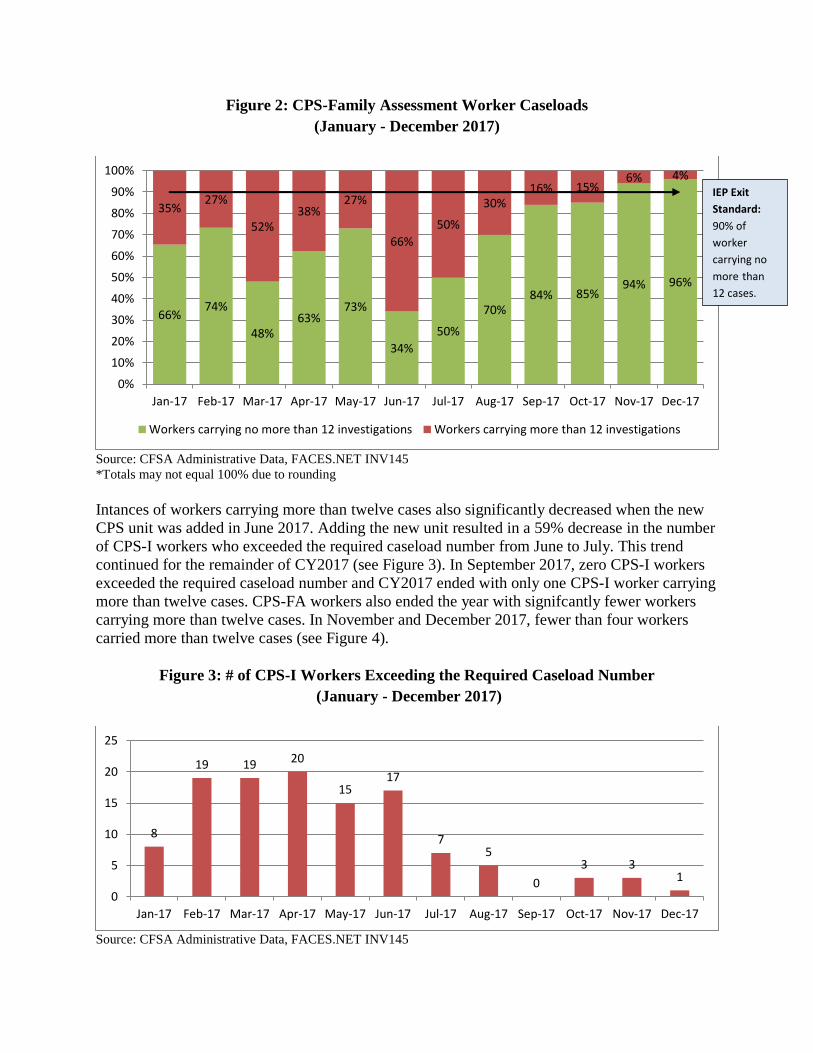
Figure 2: CPS-Family Assessment Worker Caseloads
(January - December 2017)
Source: CFSA Administrative Data, FACES.NET INV145
*Totals may not equal 100% due to rounding
Intances of workers carrying more than twelve cases also significantly decreased when the new
CPS unit was added in June 2017. Adding the new unit resulted in a 59% decrease in the number
of CPS-I workers who exceeded the required caseload number from June to July. This trend
continued for the remainder of CY2017 (see Figure 3). In September 2017, zero CPS-I workers
exceeded the required caseload number and CY2017 ended with only one CPS-I worker carrying
more than twelve cases. CPS-FA workers also ended the year with signifcantly fewer workers
carrying more than twelve cases. In November and December 2017, fewer than four workers
carried more than twelve cases (see Figure 4).
Figure 3: # of CPS-I Workers Exceeding the Required Caseload Number
(January - December 2017)
Source: CFSA Administrative Data, FACES.NET INV145
66% 74%
48% 63%
73%
34%
50%
70% 84% 85%
94% 96%
35% 27%
52% 38%
27%
66%
50%
30% 16% 15%
6% 4%
0%
10%
20%
30%
40%
50%
60%
70%
80%
90%
100%
Jan-17 Feb-17 Mar-17 Apr-17 May-17 Jun-17 Jul-17 Aug-17 Sep-17 Oct-17 Nov-17 Dec-17
Workers carrying no more than 12 investigations Workers carrying more than 12 investigations
8
19 19 20
15 17
7 5
0
3 3 1
0
5
10
15
20
25
Jan-17 Feb-17 Mar-17 Apr-17 May-17 Jun-17 Jul-17 Aug-17 Sep-17 Oct-17 Nov-17 Dec-17
IEP Exit
Standard:
90% of
worker
carrying no
more than
12 cases.
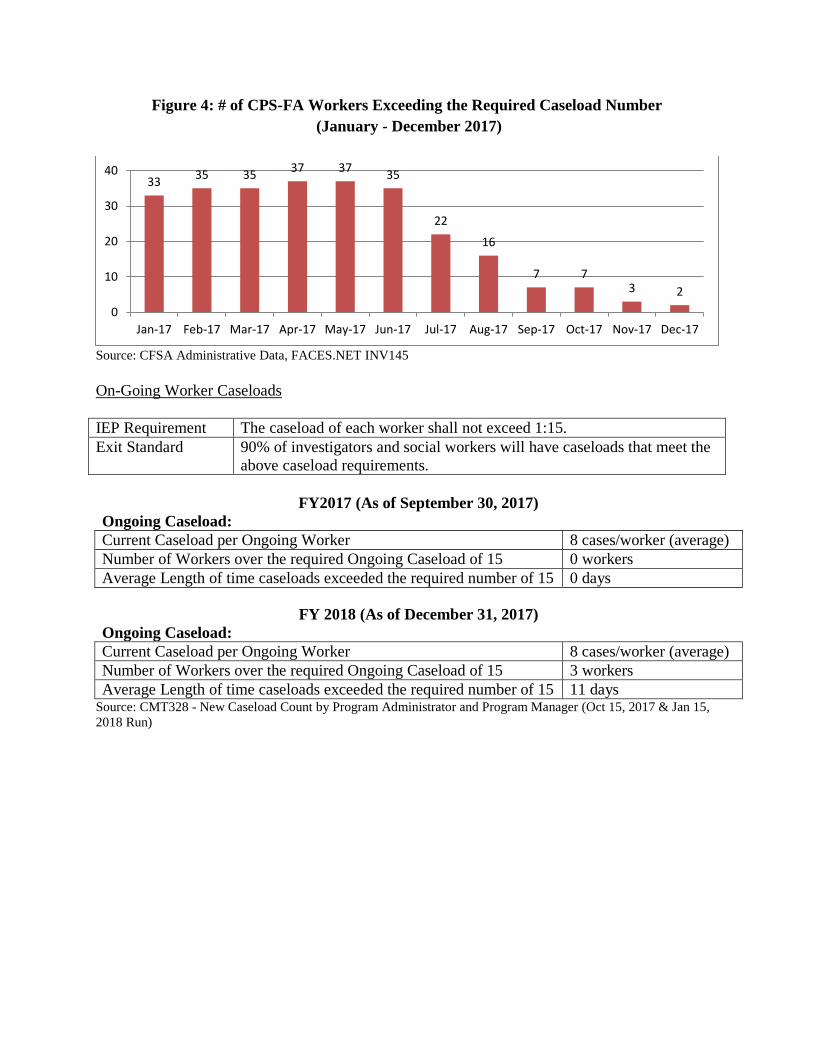
Figure 4: # of CPS-FA Workers Exceeding the Required Caseload Number
(January - December 2017)
Source: CFSA Administrative Data, FACES.NET INV145
On-Going Worker Caseloads
IEP Requirement The caseload of each worker shall not exceed 1:15.
Exit Standard 90% of investigators and social workers will have caseloads that meet the
above caseload requirements.
FY2017 (As of September 30, 2017)
Ongoing Caseload:
Current Caseload per Ongoing Worker 8 cases/worker (average)
Number of Workers over the required Ongoing Caseload of 15 0 workers
Average Length of time caseloads exceeded the required number of 15 0 days
FY 2018 (As of December 31, 2017)
Ongoing Caseload:
Current Caseload per Ongoing Worker 8 cases/worker (average)
Number of Workers over the required Ongoing Caseload of 15 3 workers
Average Length of time caseloads exceeded the required number of 15 11 days Source: CMT328 - New Caseload Count by Program Administrator and Program Manager (Oct 15, 2017 & Jan 15,
2018 Run)
33 35 35
37 37 35
22
16
7 7 3 2
0
10
20
30
40
Jan-17 Feb-17 Mar-17 Apr-17 May-17 Jun-17 Jul-17 Aug-17 Sep-17 Oct-17 Nov-17 Dec-17
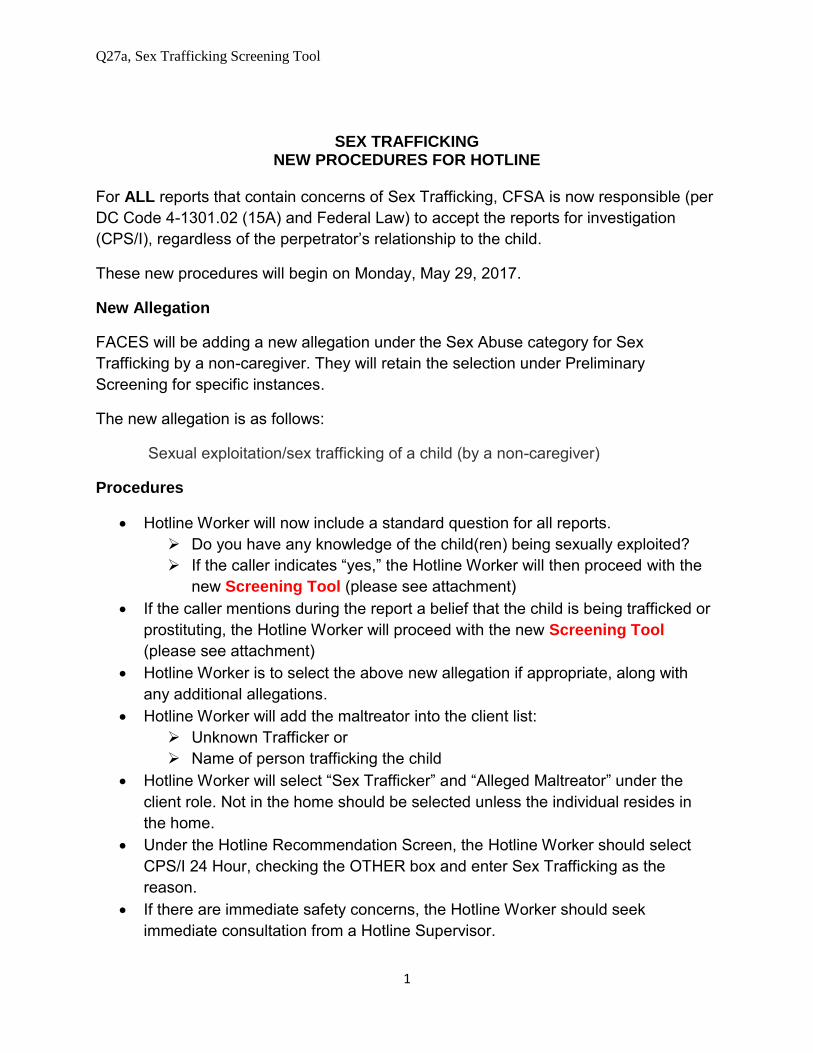
Q27a, Sex Trafficking Screening Tool
1
SEX TRAFFICKING NEW PROCEDURES FOR HOTLINE
For ALL reports that contain concerns of Sex Trafficking, CFSA is now responsible (per
DC Code 4-1301.02 (15A) and Federal Law) to accept the reports for investigation
(CPS/I), regardless of the perpetrator’s relationship to the child.
These new procedures will begin on Monday, May 29, 2017.
New Allegation
FACES will be adding a new allegation under the Sex Abuse category for Sex
Trafficking by a non-caregiver. They will retain the selection under Preliminary
Screening for specific instances.
The new allegation is as follows:
Sexual exploitation/sex trafficking of a child (by a non-caregiver)
Procedures
Hotline Worker will now include a standard question for all reports.
Do you have any knowledge of the child(ren) being sexually exploited?
If the caller indicates “yes,” the Hotline Worker will then proceed with the
new Screening Tool (please see attachment)
If the caller mentions during the report a belief that the child is being trafficked or
prostituting, the Hotline Worker will proceed with the new Screening Tool
(please see attachment)
Hotline Worker is to select the above new allegation if appropriate, along with
any additional allegations.
Hotline Worker will add the maltreator into the client list:
Unknown Trafficker or
Name of person trafficking the child
Hotline Worker will select “Sex Trafficker” and “Alleged Maltreator” under the
client role. Not in the home should be selected unless the individual resides in
the home.
Under the Hotline Recommendation Screen, the Hotline Worker should select
CPS/I 24 Hour, checking the OTHER box and enter Sex Trafficking as the
reason.
If there are immediate safety concerns, the Hotline Worker should seek
immediate consultation from a Hotline Supervisor.
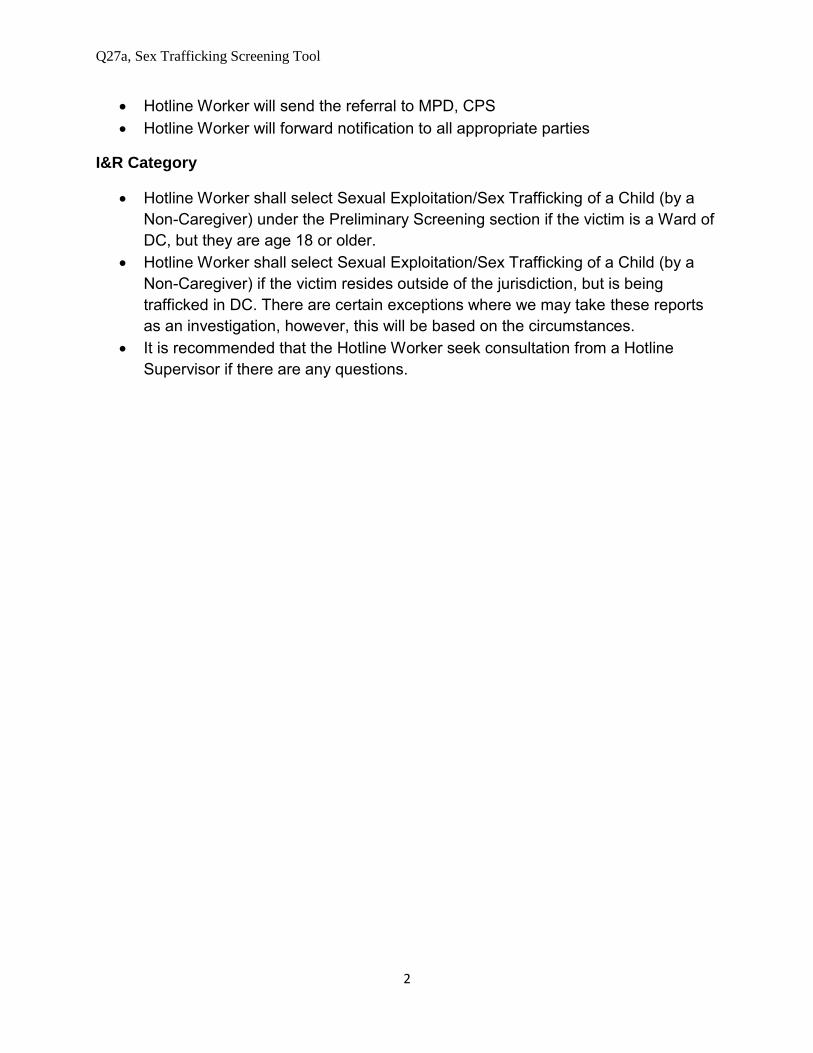
Q27a, Sex Trafficking Screening Tool
2
Hotline Worker will send the referral to MPD, CPS
Hotline Worker will forward notification to all appropriate parties
I&R Category
Hotline Worker shall select Sexual Exploitation/Sex Trafficking of a Child (by a
Non-Caregiver) under the Preliminary Screening section if the victim is a Ward of
DC, but they are age 18 or older.
Hotline Worker shall select Sexual Exploitation/Sex Trafficking of a Child (by a
Non-Caregiver) if the victim resides outside of the jurisdiction, but is being
trafficked in DC. There are certain exceptions where we may take these reports
as an investigation, however, this will be based on the circumstances.
It is recommended that the Hotline Worker seek consultation from a Hotline
Supervisor if there are any questions.
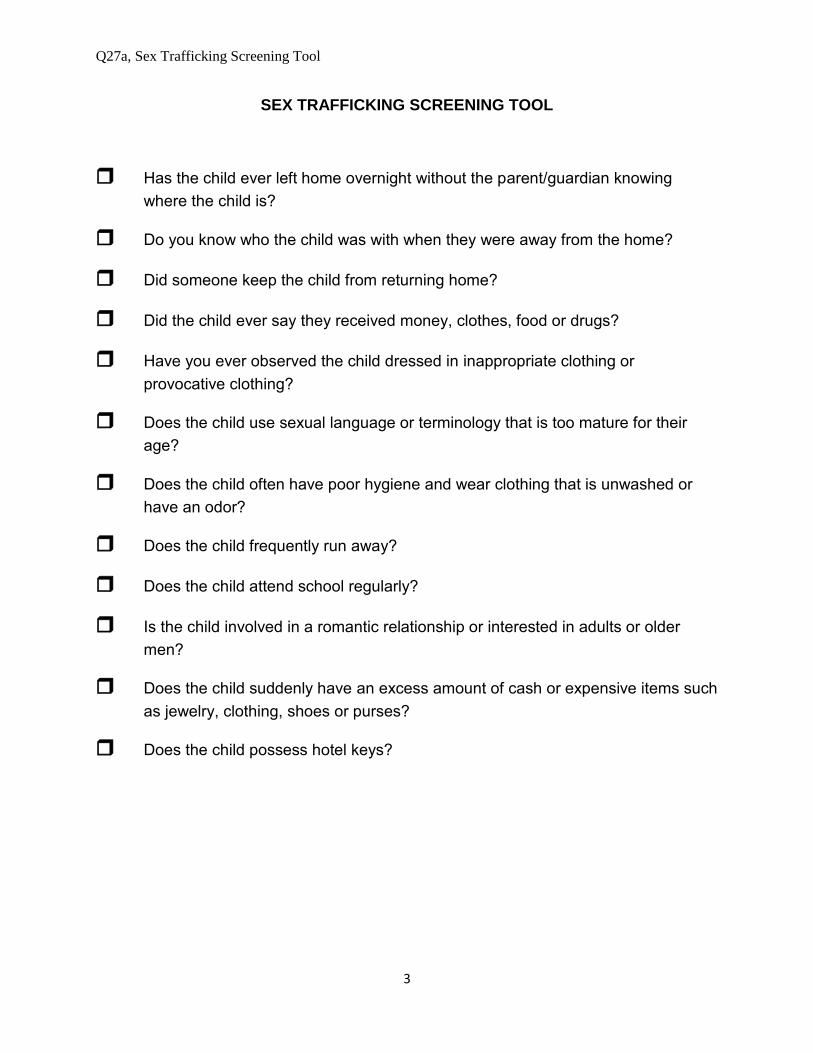
Q27a, Sex Trafficking Screening Tool
3
SEX TRAFFICKING SCREENING TOOL
Has the child ever left home overnight without the parent/guardian knowing
where the child is?
Do you know who the child was with when they were away from the home?
Did someone keep the child from returning home?
Did the child ever say they received money, clothes, food or drugs?
Have you ever observed the child dressed in inappropriate clothing or
provocative clothing?
Does the child use sexual language or terminology that is too mature for their
age?
Does the child often have poor hygiene and wear clothing that is unwashed or
have an odor?
Does the child frequently run away?
Does the child attend school regularly?
Is the child involved in a romantic relationship or interested in adults or older
men?
Does the child suddenly have an excess amount of cash or expensive items such
as jewelry, clothing, shoes or purses?
Does the child possess hotel keys?
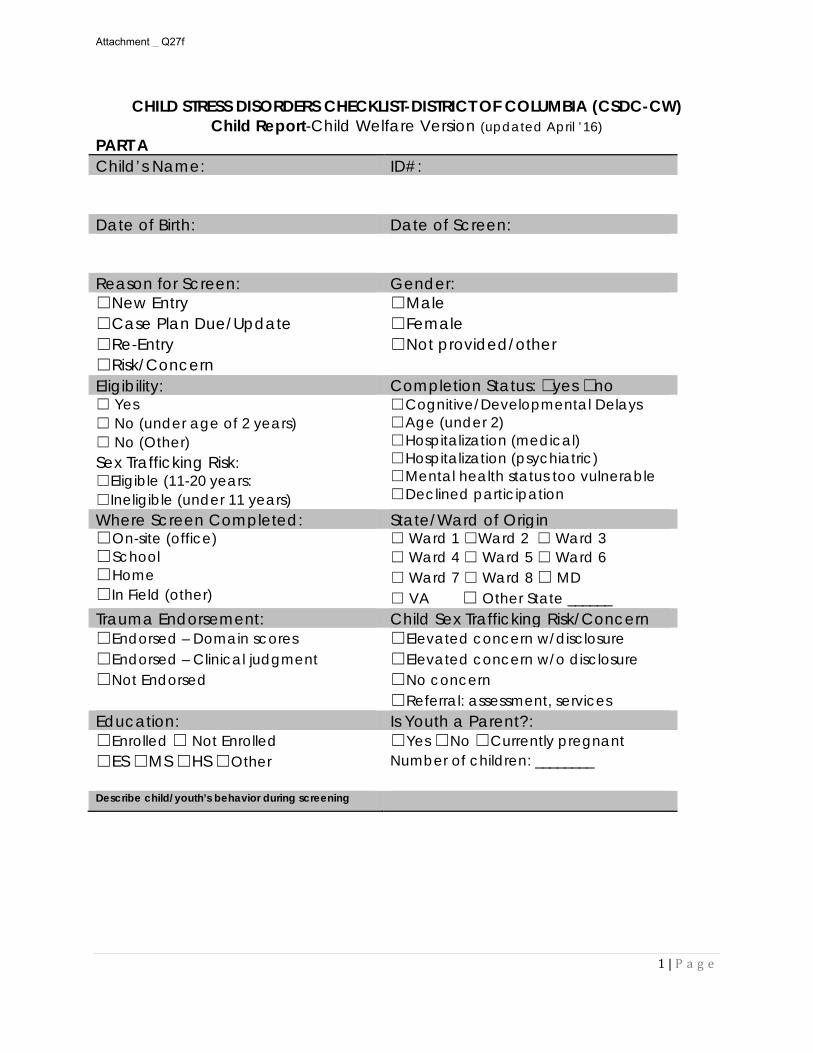
1 | P a g e
CHILD STRESS DISORDERS CHECKLIST-DISTRICT OF COLUMBIA (CSDC-CW) Child Report-Child Welfare Version (updated April ’16)
PART A Child’s Name: ID#:
Date of Birth: Date of Screen:
Reason for Screen: Gender: ☐New Entry ☐Case Plan Due/Update ☐Re-Entry ☐Risk/Concern
☐Male ☐Female ☐Not provided/other
Eligibility: Completion Status: ☐yes ☐no ☐ Yes ☐ No (under age of 2 years) ☐ No (Other) Sex Trafficking Risk: ☐Eligible (11-20 years: ☐Ineligible (under 11 years)
☐ Cognitive/Developmental Delays ☐ Age (under 2) ☐ Hospitalization (medical) ☐ Hospitalization (psychiatric) ☐ Mental health status too vulnerable ☐ Declined participation
Where Screen Completed: State/Ward of Origin ☐ On-site (office) ☐ School ☐ Home ☐In Field (other)
☐ Ward 1 ☐Ward 2 ☐ Ward 3 ☐ Ward 4 ☐ Ward 5 ☐ Ward 6 ☐ Ward 7 ☐ Ward 8 ☐ MD ☐ VA ☐ Other State ______
Trauma Endorsement: Child Sex Trafficking Risk/Concern ☐Endorsed – Domain scores ☐Endorsed – Clinical judgment ☐Not Endorsed
☐Elevated concern w/disclosure ☐Elevated concern w/o disclosure ☐No concern ☐Referral: assessment, services
Education: Is Youth a Parent?: ☐Enrolled ☐ Not Enrolled ☐ES ☐MS ☐HS ☐Other
☐Yes ☐No ☐Currently pregnant Number of children: ________
Describe child/youth’s behavior during screening
Attachment _ Q27f
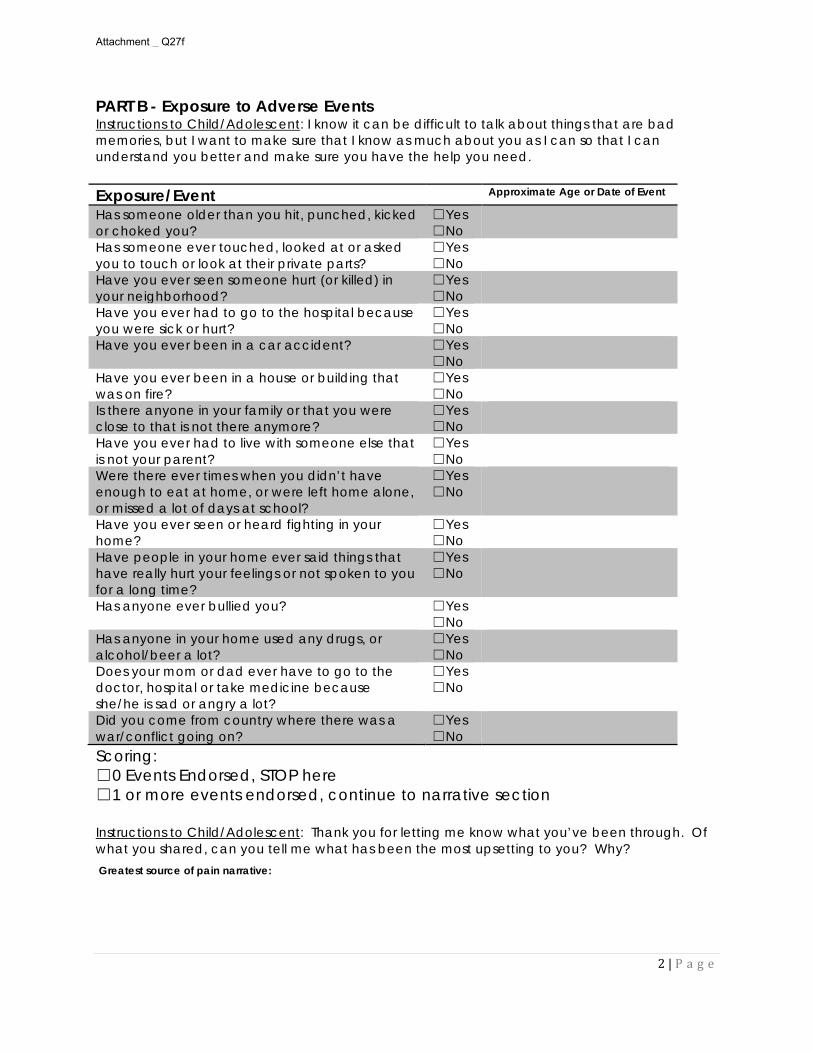
2 | P a g e
PART B - Exposure to Adverse Events Instructions to Child/Adolescent: I know it can be difficult to talk about things that are bad memories, but I want to make sure that I know as much about you as I can so that I can understand you better and make sure you have the help you need. Exposure/Event Approximate Age or Date of Event
Has someone older than you hit, punched, kicked or choked you?
☐ Yes ☐ No
Has someone ever touched, looked at or asked you to touch or look at their private parts?
☐ Yes ☐ No
Have you ever seen someone hurt (or killed) in your neighborhood?
☐ Yes ☐ No
Have you ever had to go to the hospital because you were sick or hurt?
☐ Yes ☐ No
Have you ever been in a car accident? ☐ Yes ☐ No
Have you ever been in a house or building that was on fire?
☐ Yes ☐ No
Is there anyone in your family or that you were close to that is not there anymore?
☐ Yes ☐ No
Have you ever had to live with someone else that is not your parent?
☐ Yes ☐ No
Were there ever times when you didn’t have enough to eat at home, or were left home alone, or missed a lot of days at school?
☐ Yes ☐ No
Have you ever seen or heard fighting in your home?
☐ Yes ☐ No
Have people in your home ever said things that have really hurt your feelings or not spoken to you for a long time?
☐ Yes ☐ No
Has anyone ever bullied you? ☐ Yes ☐ No
Has anyone in your home used any drugs, or alcohol/beer a lot?
☐ Yes ☐ No
Does your mom or dad ever have to go to the doctor, hospital or take medicine because she/he is sad or angry a lot?
☐ Yes ☐ No
Did you come from country where there was a war/conflict going on?
☐ Yes ☐ No
Scoring: ☐ 0 Events Endorsed, STOP here ☐ 1 or more events endorsed, continue to narrative section Instructions to Child/Adolescent: Thank you for letting me know what you’ve been through. Of what you shared, can you tell me what has been the most upsetting to you? Why?
Greatest source of pain narrative:
Attachment _ Q27f
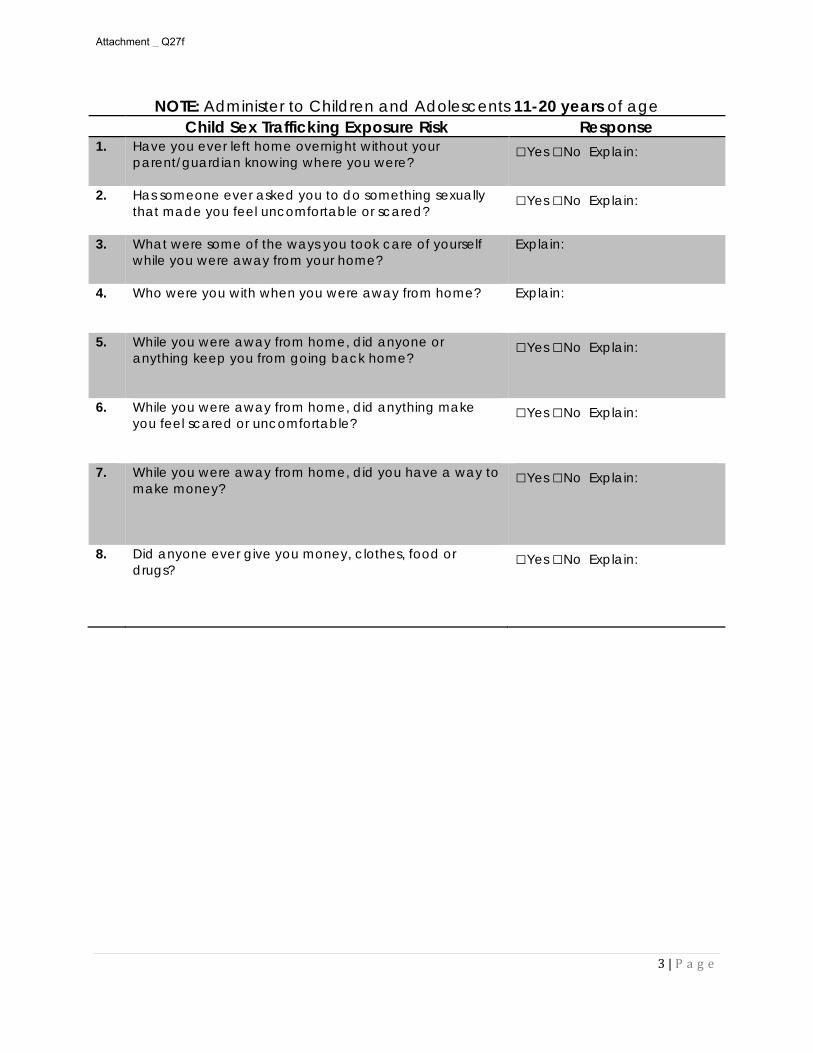
3 | P a g e
NOTE: Administer to Children and Adolescents 11-20 years of age Child Sex Trafficking Exposure Risk Response
1. Have you ever left home overnight without your parent/guardian knowing where you were?
□Yes □No Explain:
2. Has someone ever asked you to do something sexually that made you feel uncomfortable or scared?
□Yes □No Explain:
3. What were some of the ways you took care of yourself while you were away from your home?
Explain:
4. Who were you with when you were away from home?
Explain:
5. While you were away from home, did anyone or anything keep you from going back home?
□Yes □No Explain:
6. While you were away from home, did anything make you feel scared or uncomfortable?
□Yes □No Explain:
7. While you were away from home, did you have a way to make money?
□Yes □No Explain:
8. Did anyone ever give you money, clothes, food or drugs?
□Yes □No Explain:
Attachment _ Q27f
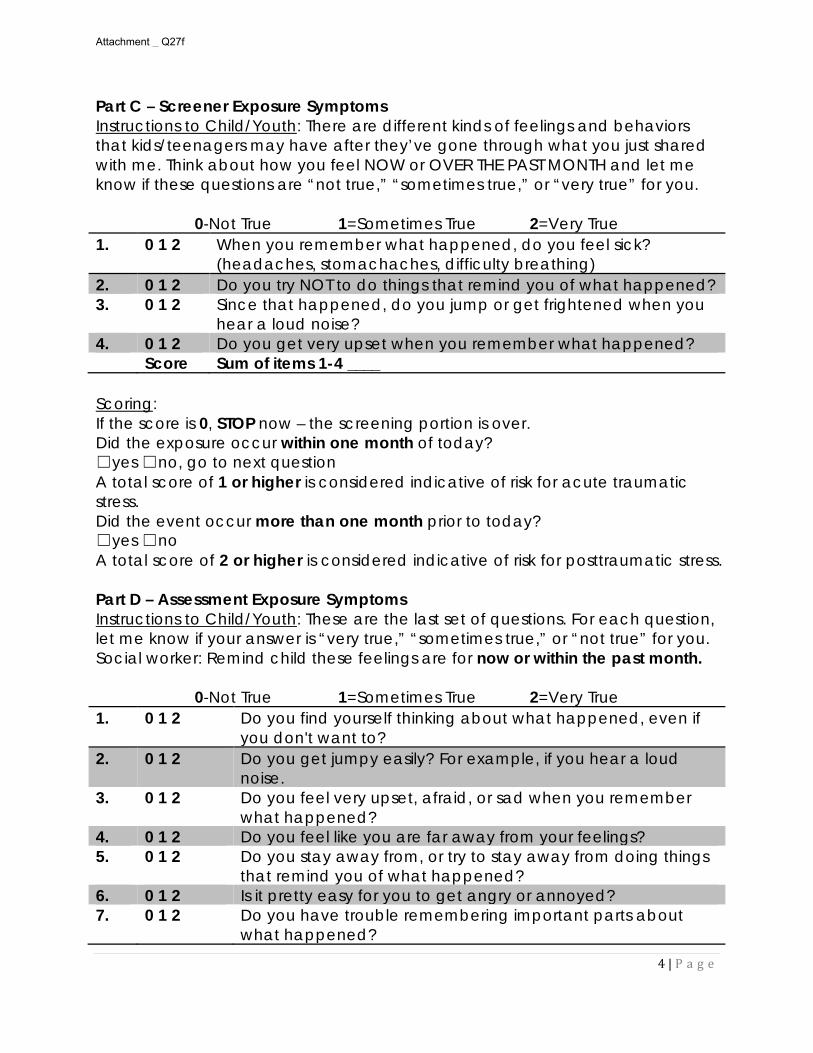
4 | P a g e
Part C – Screener Exposure Symptoms Instructions to Child/Youth: There are different kinds of feelings and behaviors that kids/teenagers may have after they’ve gone through what you just shared with me. Think about how you feel NOW or OVER THE PAST MONTH and let me know if these questions are “not true,” “sometimes true,” or “very true” for you.
0-Not True 1=Sometimes True 2=Very True
1. 0 1 2 When you remember what happened, do you feel sick? (headaches, stomachaches, difficulty breathing)
2. 0 1 2 Do you try NOT to do things that remind you of what happened? 3. 0 1 2 Since that happened, do you jump or get frightened when you
hear a loud noise? 4. 0 1 2 Do you get very upset when you remember what happened? Score Sum of items 1-4 ____ Scoring: If the score is 0, STOP now – the screening portion is over. Did the exposure occur within one month of today? ☐ yes ☐ no, go to next question A total score of 1 or higher is considered indicative of risk for acute traumatic stress. Did the event occur more than one month prior to today? ☐ yes ☐ no A total score of 2 or higher is considered indicative of risk for posttraumatic stress. Part D – Assessment Exposure Symptoms Instructions to Child/Youth: These are the last set of questions. For each question, let me know if your answer is “very true,” “sometimes true,” or “not true” for you. Social worker: Remind child these feelings are for now or within the past month.
0-Not True 1=Sometimes True 2=Very True 1. 0 1 2 Do you find yourself thinking about what happened, even if
you don't want to? 2. 0 1 2 Do you get jumpy easily? For example, if you hear a loud
noise. 3. 0 1 2 Do you feel very upset, afraid, or sad when you remember
what happened? 4. 0 1 2 Do you feel like you are far away from your feelings? 5. 0 1 2 Do you stay away from, or try to stay away from doing things
that remind you of what happened? 6. 0 1 2 Is it pretty easy for you to get angry or annoyed? 7. 0 1 2 Do you have trouble remembering important parts about
what happened?
Attachment _ Q27f
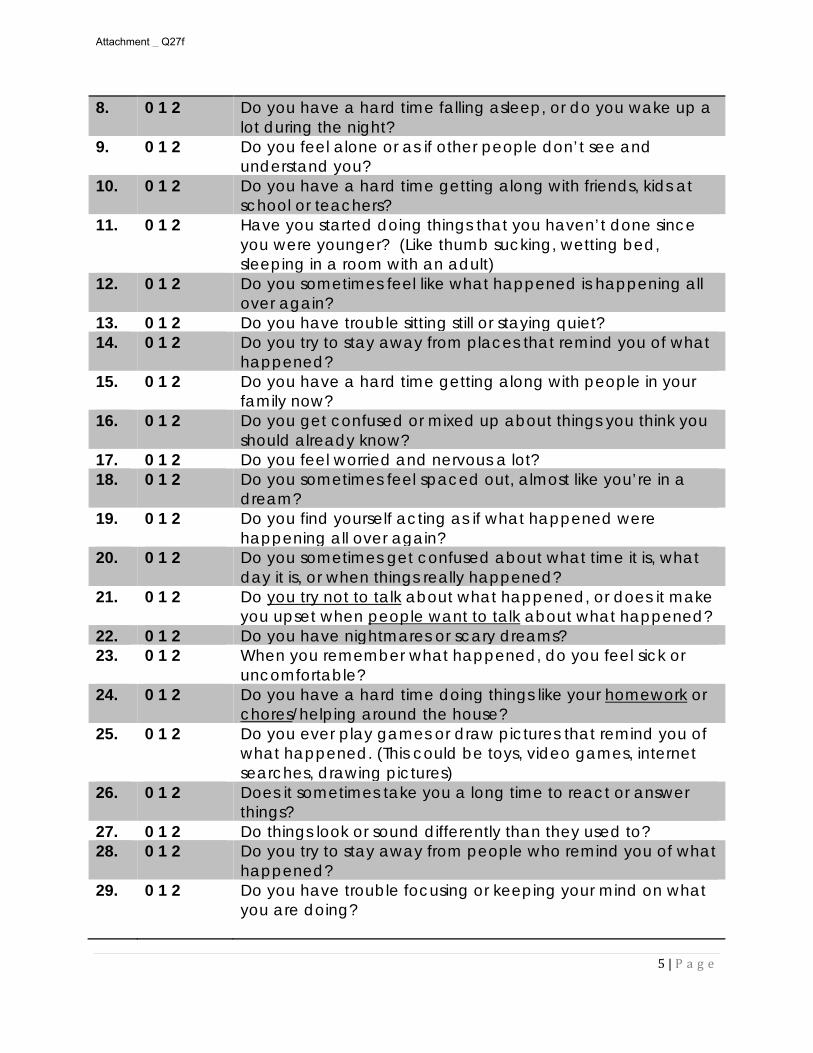
5 | P a g e
8. 0 1 2 Do you have a hard time falling asleep, or do you wake up a lot during the night?
9. 0 1 2 Do you feel alone or as if other people don’t see and understand you?
10. 0 1 2 Do you have a hard time getting along with friends, kids at school or teachers?
11. 0 1 2 Have you started doing things that you haven’t done since you were younger? (Like thumb sucking, wetting bed, sleeping in a room with an adult)
12. 0 1 2 Do you sometimes feel like what happened is happening all over again?
13. 0 1 2 Do you have trouble sitting still or staying quiet? 14. 0 1 2 Do you try to stay away from places that remind you of what
happened? 15. 0 1 2 Do you have a hard time getting along with people in your
family now? 16. 0 1 2 Do you get confused or mixed up about things you think you
should already know? 17. 0 1 2 Do you feel worried and nervous a lot? 18. 0 1 2 Do you sometimes feel spaced out, almost like you’re in a
dream? 19. 0 1 2 Do you find yourself acting as if what happened were
happening all over again? 20. 0 1 2 Do you sometimes get confused about what time it is, what
day it is, or when things really happened? 21. 0 1 2 Do you try not to talk about what happened, or does it make
you upset when people want to talk about what happened? 22. 0 1 2 Do you have nightmares or scary dreams? 23. 0 1 2 When you remember what happened, do you feel sick or
uncomfortable? 24. 0 1 2 Do you have a hard time doing things like your homework or
chores/helping around the house? 25. 0 1 2 Do you ever play games or draw pictures that remind you of
what happened. (This could be toys, video games, internet searches, drawing pictures)
26. 0 1 2 Does it sometimes take you a long time to react or answer things?
27. 0 1 2 Do things look or sound differently than they used to? 28. 0 1 2 Do you try to stay away from people who remind you of what
happened? 29. 0 1 2 Do you have trouble focusing or keeping your mind on what
you are doing?
Attachment _ Q27f
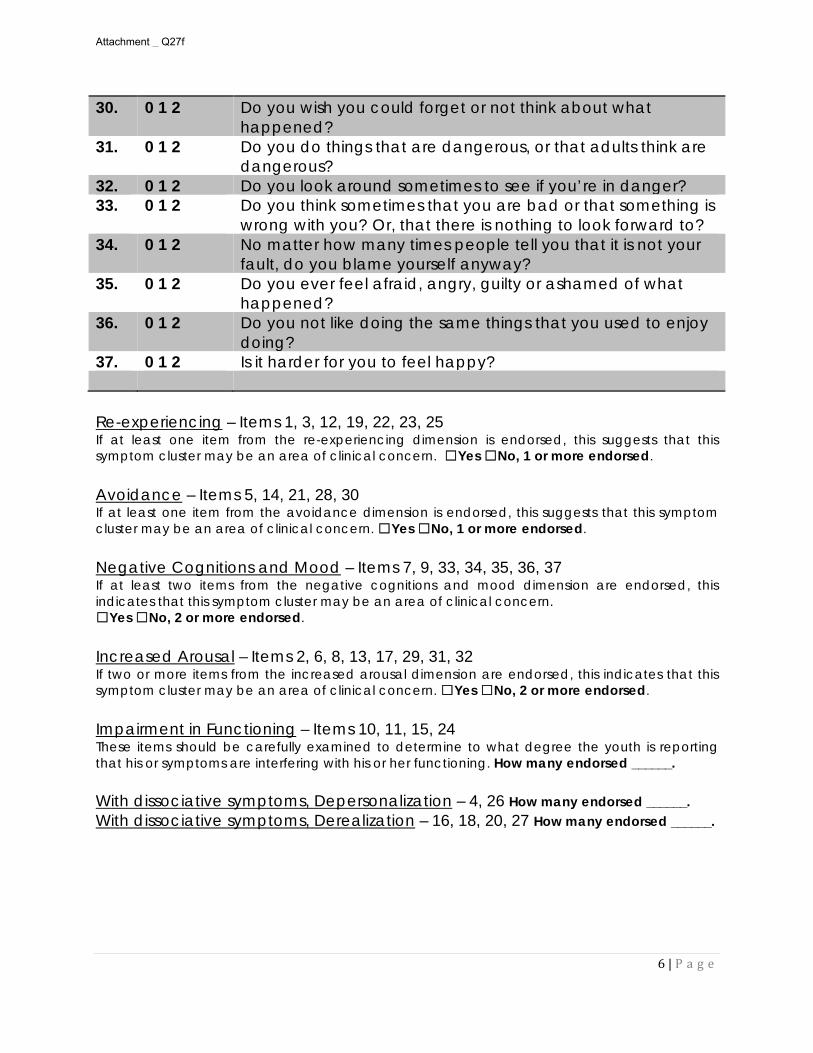
6 | P a g e
30. 0 1 2 Do you wish you could forget or not think about what happened?
31. 0 1 2 Do you do things that are dangerous, or that adults think are dangerous?
32. 0 1 2 Do you look around sometimes to see if you’re in danger? 33. 0 1 2 Do you think sometimes that you are bad or that something is
wrong with you? Or, that there is nothing to look forward to? 34. 0 1 2 No matter how many times people tell you that it is not your
fault, do you blame yourself anyway? 35. 0 1 2 Do you ever feel afraid, angry, guilty or ashamed of what
happened? 36. 0 1 2 Do you not like doing the same things that you used to enjoy
doing? 37. 0 1 2 Is it harder for you to feel happy? Re-experiencing – Items 1, 3, 12, 19, 22, 23, 25 If at least one item from the re-experiencing dimension is endorsed, this suggests that this symptom cluster may be an area of clinical concern. ☐Yes ☐No, 1 or more endorsed.
Avoidance – Items 5, 14, 21, 28, 30 If at least one item from the avoidance dimension is endorsed, this suggests that this symptom cluster may be an area of clinical concern. ☐Yes ☐No, 1 or more endorsed.
Negative Cognitions and Mood – Items 7, 9, 33, 34, 35, 36, 37 If at least two items from the negative cognitions and mood dimension are endorsed, this indicates that this symptom cluster may be an area of clinical concern. ☐Yes ☐No, 2 or more endorsed. Increased Arousal – Items 2, 6, 8, 13, 17, 29, 31, 32 If two or more items from the increased arousal dimension are endorsed, this indicates that this symptom cluster may be an area of clinical concern. ☐Yes ☐No, 2 or more endorsed. Impairment in Functioning – Items 10, 11, 15, 24 These items should be carefully examined to determine to what degree the youth is reporting that his or symptoms are interfering with his or her functioning. How many endorsed ______.
With dissociative symptoms, Depersonalization – 4, 26 How many endorsed ______. With dissociative symptoms, Derealization – 16, 18, 20, 27 How many endorsed ______.
Attachment _ Q27f
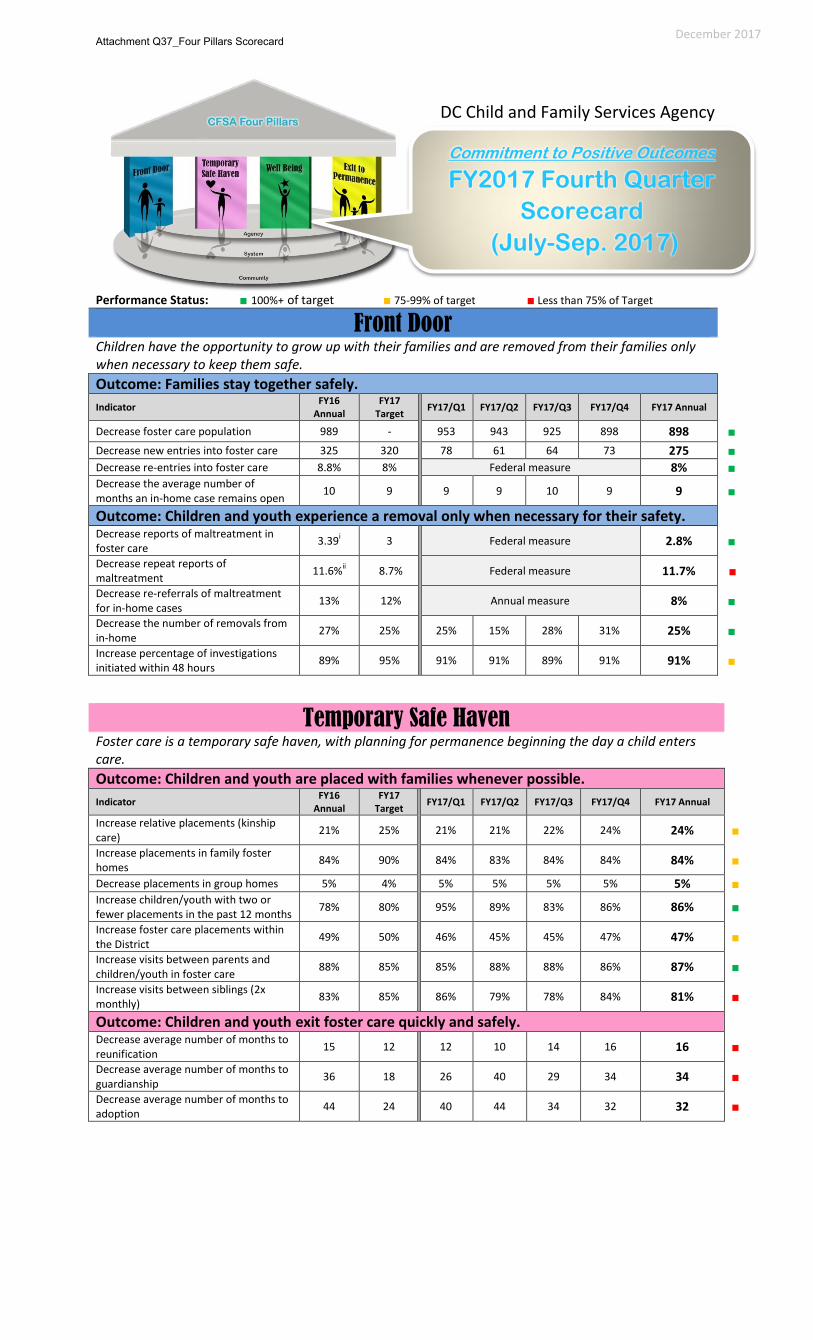
Performance Status: ■ 100%+ of target ■ 75-99% of target ■ Less than 75% of Target
Front Door Children have the opportunity to grow up with their families and are removed from their families only when necessary to keep them safe.
Outcome: Families stay together safely.
Indicator FY16
Annual FY17
Target FY17/Q1 FY17/Q2 FY17/Q3 FY17/Q4 FY17 Annual
Decrease foster care population 989 - 953 943 925 898 898 ■
Decrease new entries into foster care 325 320 78 61 64 73 275 ■ Decrease re-entries into foster care 8.8% 8% Federal measure 8% ■ Decrease the average number of months an in-home case remains open
10 9 9 9 10 9 9 ■
Outcome: Children and youth experience a removal only when necessary for their safety.
Decrease reports of maltreatment in foster care
3.39i 3 Federal measure 2.8% ■
Decrease repeat reports of maltreatment
11.6%ii 8.7% Federal measure 11.7% ■
Decrease re-referrals of maltreatment for in-home cases
13% 12% Annual measure 8% ■
Decrease the number of removals from in-home
27% 25% 25% 15% 28% 31% 25% ■
Increase percentage of investigations initiated within 48 hours
89% 95% 91% 91% 89% 91% 91% ■
Temporary Safe Haven Foster care is a temporary safe haven, with planning for permanence beginning the day a child enters care.
Outcome: Children and youth are placed with families whenever possible.
Indicator FY16
Annual FY17
Target FY17/Q1 FY17/Q2 FY17/Q3 FY17/Q4 FY17 Annual
Increase relative placements (kinship care)
21% 25% 21% 21% 22% 24% 24% ■
Increase placements in family foster homes
84% 90% 84% 83% 84% 84% 84% ■
Decrease placements in group homes 5% 4% 5% 5% 5% 5% 5% ■ Increase children/youth with two or fewer placements in the past 12 months
78% 80% 95% 89% 83% 86% 86% ■
Increase foster care placements within the District
49% 50% 46% 45% 45% 47% 47% ■
Increase visits between parents and children/youth in foster care
88% 85% 85% 88% 88% 86% 87% ■
Increase visits between siblings (2x monthly)
83% 85% 86% 79% 78% 84% 81% ■
Outcome: Children and youth exit foster care quickly and safely. Decrease average number of months to reunification
15 12 12 10 14 16 16 ■
Decrease average number of months to guardianship
36 18 26 40 29 34 34 ■
Decrease average number of months to adoption
44 24 40 44 34 32 32 ■
DC Child and Family Services Agency
December 2017
Commitment to Positive Outcomes
FY2017 Fourth Quarter
Scorecard
(July-Sep. 2017)
Attachment Q37_Four Pillars Scorecard
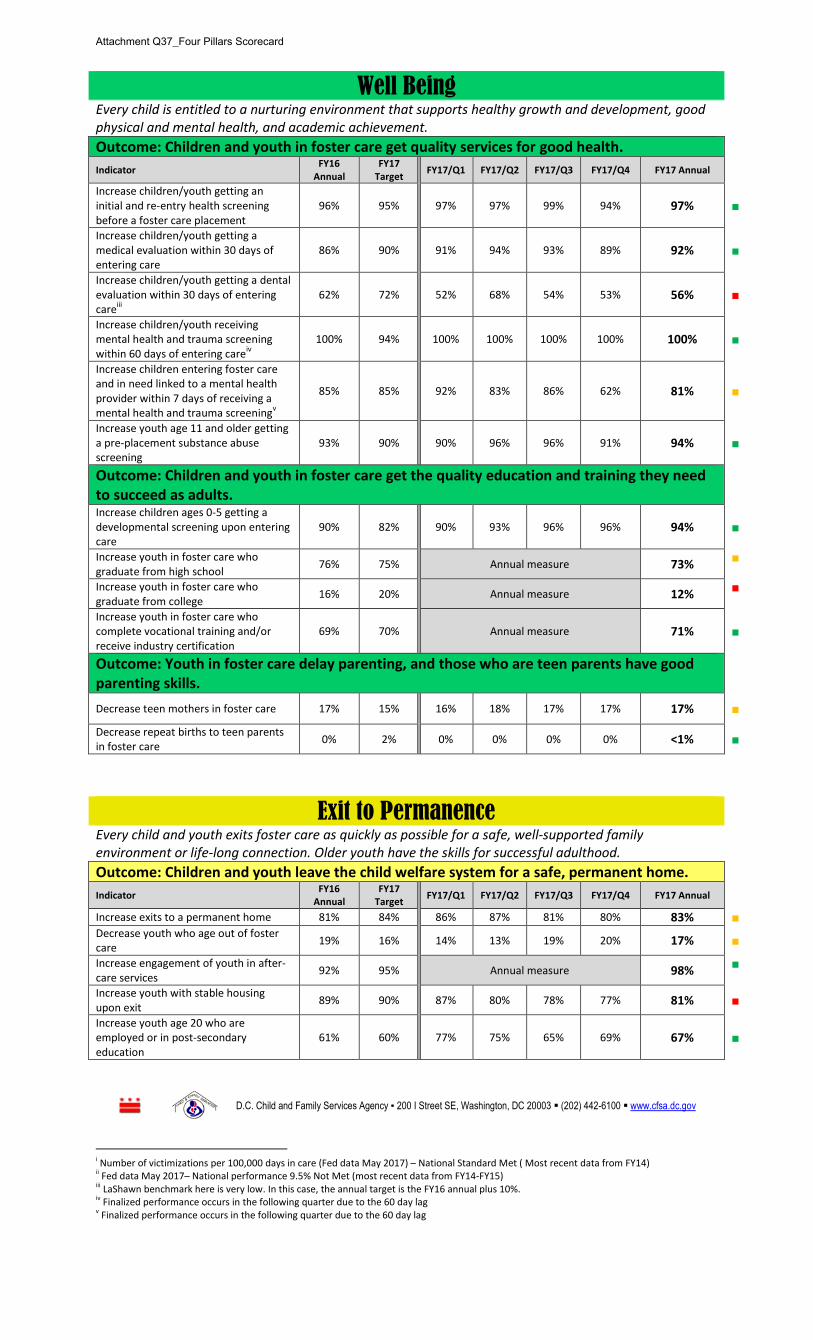
Well Being Every child is entitled to a nurturing environment that supports healthy growth and development, good physical and mental health, and academic achievement.
Outcome: Children and youth in foster care get quality services for good health.
Indicator FY16
Annual FY17
Target FY17/Q1 FY17/Q2 FY17/Q3 FY17/Q4 FY17 Annual
Increase children/youth getting an initial and re-entry health screening before a foster care placement
96% 95% 97% 97% 99% 94% 97% ■
Increase children/youth getting a medical evaluation within 30 days of entering care
86% 90% 91% 94% 93% 89% 92% ■
Increase children/youth getting a dental evaluation within 30 days of entering care
iii
62% 72% 52% 68% 54% 53% 56% ■
Increase children/youth receiving mental health and trauma screening within 60 days of entering care
iv
100% 94% 100% 100% 100% 100% 100% ■
Increase children entering foster care and in need linked to a mental health provider within 7 days of receiving a mental health and trauma screening
v
85% 85% 92% 83% 86% 62% 81% ■
Increase youth age 11 and older getting a pre-placement substance abuse screening
93% 90% 90% 96% 96% 91% 94% ■
Outcome: Children and youth in foster care get the quality education and training they need to succeed as adults.
Increase children ages 0-5 getting a developmental screening upon entering care
90% 82% 90% 93% 96% 96% 94% ■
Increase youth in foster care who graduate from high school
76% 75% Annual measure 73% ■
Increase youth in foster care who graduate from college
16% 20% Annual measure 12% ■
Increase youth in foster care who complete vocational training and/or receive industry certification
69% 70% Annual measure 71% ■
Outcome: Youth in foster care delay parenting, and those who are teen parents have good parenting skills.
Decrease teen mothers in foster care 17% 15% 16% 18% 17% 17% 17% ■
Decrease repeat births to teen parents in foster care
0% 2% 0% 0% 0% 0% <1% ■
Exit to Permanence Every child and youth exits foster care as quickly as possible for a safe, well-supported family environment or life-long connection. Older youth have the skills for successful adulthood.
Outcome: Children and youth leave the child welfare system for a safe, permanent home.
Indicator FY16
Annual FY17
Target FY17/Q1 FY17/Q2 FY17/Q3 FY17/Q4 FY17 Annual
Increase exits to a permanent home 81% 84% 86% 87% 81% 80% 83% ■ Decrease youth who age out of foster care
19% 16% 14% 13% 19% 20% 17% ■
Increase engagement of youth in after-care services
92% 95% Annual measure 98% ■
Increase youth with stable housing upon exit
89% 90% 87% 80% 78% 77% 81% ■
Increase youth age 20 who are employed or in post-secondary education
61% 60% 77% 75% 65% 69% 67% ■
D.C. Child and Family Services Agency ▪ 200 I Street SE, Washington, DC 20003 (202) 442-6100 www.cfsa.dc.gov
i Number of victimizations per 100,000 days in care (Fed data May 2017) – National Standard Met ( Most recent data from FY14) ii Fed data May 2017– National performance 9.5% Not Met (most recent data from FY14-FY15) iii LaShawn benchmark here is very low. In this case, the annual target is the FY16 annual plus 10%. iv Finalized performance occurs in the following quarter due to the 60 day lag v Finalized performance occurs in the following quarter due to the 60 day lag
Attachment Q37_Four Pillars Scorecard
Government of the District of Columbia
Child and Family Services Agency
Safe and Stable Families Semi-Annual Report
Government of the District of Columbia
Child and Family Services Agency
Safe and Stable Families
Semi-Annual Progress Report
November 20, 2017
Brenda Donald, Director
District of Columbia Child and Family Services Agency
200 I Street, SE, Washington, DC 20003
Government of the District of Columbia
Child and Family Services Agency
Safe and Stable Families Semi-Annual Report
October, 2017 1
Table of Contents I. Overview ...................................................................................................................................2
II. Demonstration Status, Activities, and Accomplishments........................................................5
HOMEBUILDERS® ................................................................................................................................. 5
Project Connect ......................................................................................................................................... 7
III. Evaluation Status ...................................................................................................................9
A. Numbers of children and families assigned to the demonstration ................................... 9
B. Major evaluation activities and events (e.g., primary and secondary data collection, data
analysis, database development). ........................................................................................................ 14
C. Challenges to the implementation of the evaluation and the steps taken to address them.
15
III. Significant Evaluation Findings to Date ............................................................................... 19
A. Child Welfare Outcomes ............................................................................................... 19
B. Family Functioning Outcomes ...................................................................................... 32
C. Fidelity data ................................................................................................................... 39
V. Limitations .............................................................................................................................. 43
VI. Recommendations and Activities Planned for Next Reporting Period ................................. 43
Government of the District of Columbia
Child and Family Services Agency
Safe and Stable Families Semi-Annual Report
October, 2017 2
I. Overview Significant Evaluation Findings
Major changes to the design of the evaluation
There have been no major changes to the design of the evaluation. However, as noted in
the Interim report, there has been a reduction in the number of Parent Education and
Support Programs and home visitation contractual services funded by the Title IV-E
Waiver programs and the expansion of the Project Connect eligibility to include in-home
families identified by CFSA to be experiencing chronic neglect. The District of Columbia
Child and Family Service Agency (CFSA) Waiver implementation team has asked the
evaluators to focus only on HOMEBUILDERS® and Project Connect following
submission of the Interim report. The evaluators have been working with the CFSA
Waiver implementation team to develop a formal proposal of the changes that will be
submitted to the Administration for Children and Families Federal Project Officers. In the
meantime, CFSA has asked the evaluators to include findings only from
HOMEBUILDERS® and Project Connect.
The evaluators have described how they will address these changes in Section III.
Evaluation Status-Section A, and Section IV Significant Evaluation Findings to Date-
Outcomes Data (c.Results of Matching Process for Waiver and Pre-Waiver Samples).
Findings Summary
Overall, evaluation findings for families served are based on family functional
assessments and child welfare outcomes. Small sample sizes for some analyses impede
our ability to draw strong conclusions regarding initial findings at this time.
Child Welfare Outcomes were analyzed this reporting period on both successfully
discharged families as well as unsuccessful discharges. The analysis assesses the extent
to which a family had a repeat report or foster care placement during their time receiving
the Title IV-E service, or following discharge. Changes in family functioning are
measured by either the North Carolina Functional Assessment Scale (NCFAS) or the
Risk Inventory for Substance Abuse-Affected Families (SARI). The NCFAS is used by
Project Connect and HOMEBUILDERS® prior to and throughout service provision.
HOMEBUILDERS® families choose one or more essential functional areas for
improvement.
Some families seems to be improving in terms of family functioning and the majority of
families who have been successfully discharged have not had substantiated cases or foster
care placements during services or within 365 days of discharge. A more detailed
description of child welfare outcomes and individual findings from family functioning
Government of the District of Columbia
Child and Family Services Agency
Safe and Stable Families Semi-Annual Report
October, 2017 3
scales are found in Section IV Significant Evaluation Findings to Date-Outcomes Data,
and a summary is provided below.
HOMEBUILDERS®
The majority (69%) of referrals were accepted this reporting period. With the majority of
denials caused by not meeting eligibility. HOMEBUILDERS® was able to hit 77% of
the target of families enrolled based on capacity estimates. Referrals were processed
timely (avg. 0 days) and the average days to enrollment was 1day. 81% of all approved
referrals were successfully enrolled in service. The remaining families (6) refused, were
non-compliant or non-responsive to outreach.
CFSA benchmark is that 90% of families will not have a substantiated report within 12
months of initiation of Waiver services was not met (46% successful and 39%
unsuccessful discharges). HOMEBUILDERS® benchmark, 75% of families will not
have a substantiated report during intervention has been met (83% successful and 0%
unsuccessful discharges). Enrollment in services seemed to increase both the likeness of a
substantiated CPS report within 12 months of enrollment, 12 months following discharge
as well as the amount of time between discharge and a substantiated CPS report
regardless of discharge outcome when compared to the Pre-Waiver Match Sample.
Successfully discharged families did better in these indicators than families that did not
successfully complete services.
CFSA benchmark is that 90% of families will not have an entry into out-of-home care
within 12 months of initiation of Waiver services was not met (73% successful and 50%
unsuccessful discharges). HOMEBUILDERS® benchmark, at least 70% of children
referred for HOMEBUILDERS® will not have an out-of-home placement 6 months
following closure of services was met for successfully discharged families (81%
successful and 52% unsuccessful discharges). When looking at foster care entries,
successfully discharged families did better than unsuccessfully discharged families on all
indicators. Successful discharged families did better than matched sample on two
indicators, “Families with a foster care entry during matched services date (2% vs. 4%)
and “Families with a foster care entry between 6-12 months following discharge” (3% vs.
7%). Successfully completing services increased the amount of time before a foster care
entry when compared to the Pre-Waiver Match Sample and the unsuccessful discharges.
CFSA benchmark for family functioning 80% of families improving at least one point
on the Family Safety domain (if deemed essential) has been achieved (88.6%), while the
standard of 80% of families improving at least one point on the Parental Capabilities
domain (if deemed essential) has not been met (72.9%). For the families whom the
domain was NOT essential, 73.3% improved on Parental Capabilities and 43.3%
improved on Family Safety. Only 58% of families had at least one of the two domains
Government of the District of Columbia
Child and Family Services Agency
Safe and Stable Families Semi-Annual Report
October, 2017 4
rated as essential. These low percentages suggest that needs surrounding safety and
parental capabilities may not be as critical as expected, and speak to the gaps in the
acceptable number of appropriate/eligible referrals. The majority of families improved at
least one point on the remaining domains, although the percentage of families improving
did not exceed 75%.
Project Connect
Almost all referrals (90%) were approved by Project Connect during this reporting
period. Project Connect was under the target number of families enrolled (64%) based
on capacity estimate. Average number of days from referral to enrollment was 12 days.
91% of all approved referrals were successfully enrolled in service. The remaining
families (2) were ineligible.
CFSA benchmark of 90% of families will not have a substantiated report within 12
months of initiation of Waiver services has been met by successfully discharged families
(94% successful and 86% unsuccessfully discharged families). Families served within
Project Connect were less likely to have a substantiated CPS report within 12 months of
enrollment, during services, or 12 months after discharge when compared to matched
families regardless of discharge outcome. Enrollment in services also increased the
amount of time before a substantiated CPS report regardless of discharge outcome when
compared to the Pre-Waiver Match Sample. Successfully discharged families did better
than unsuccessfully discharged families in all indicators regarding subsequent CPS
reports.
CFSA benchmark is that 90% of families who achieved reunification during their
involvement will not have a re-entry has been met (0% successful and unsuccessful
discharges). No enrolled families (successfully or unsuccessfully discharged) had any re-
entries during service. No successfully discharged families had any re-entries 12 months
following discharge. Successfully completing services increased the amount of time
before a foster care entry when compared to the Pre-Waiver Match Sample and the
unsuccessful discharges.
NCFAS results show that only 62.5% of successfully discharged families improved on at
least one domain regarding family functioning. For the Child Well-Being and Self-
Sufficiency domains, the percentage of families increasing were higher for unsuccessful
families compared to successful families, and for Child Well-Being, the percentages of
families increasing were the same. SARI scales with the highest percent of reduced risk
for successfully discharged families who had those scales completed were Self-Efficacy
and Support for Recovery, both at 50.0%. The scale with the lowest percent of
successfully discharged families indicating a decreased risk was Commitment to
Recovery at 11.1% of families. No families (successful or unsuccessful) showed
decreased risk on the Support for Recovery scale.
Government of the District of Columbia
Child and Family Services Agency
Safe and Stable Families Semi-Annual Report
October, 2017 5
II. Demonstration Status, Activities, and Accomplishments
HOMEBUILDERS® At the start of this reporting period, CFSA continued to work on maximizing the utilization of
the intensive family preservation model, HOMEBUILDERS®. Efforts continued to market
HOMEBUILDERS® services with a focus on distributing information on the services, and with
increased attention on building relationships with referring staff. This included participation
R.E.D. Team meetings, family team meetings and other case consultations to provide
information and guidance to social workers and supervisors on potential referrals for services.
Additionally, CFSA continued to implement strategies to increase referrals of eligible families to
services and effectively engage eligible families in services once the referral was accepted
however, referrals continued to decline and withdraw rates remained high.
In December 2016, CFSA underwent a Safe and Stable Families Redesign with a purpose to
work with the community-based organizations to build an expanded and higher quality system of
community-based supports and services for families. The redesign called for an in-depth look at
the services offered under the Title IV-E Waiver including HOMEBUILDERS®. As part of the
redesign, CFSA took stock of the waiver programs and the families served through GIS
mapping, case reviews, needs assessments, and an ad-hoc outcomes study.
During this reporting period, CFSA planned and conducted a case review for a sample of
HOMEBUILDERS® cases. Due to the limitations of resources and time constraints, CFSA
reviewed 45 cases. A total of 91 cases would have had to be reviewed for results to be
considered statistically significant. Consequently, the results of the case study were not deemed
statistically significant however observations from the study were used to produce pertinent
information for CFSA leadership. The purpose of the review was to learn lessons about how
HOMEBUILDERS® provided intensive in-home crisis intervention services and family
treatment. The objectives were to understand the needs of the HOMEBUILDERS® population
at a point in time, determine the appropriateness of the screening decision, to understand the
factors that contributed to a child entering out of home care after involvement with
HOMEBUILDERS®, to understand the correlation between the families barriers and level of
involvement, and to the understand the extent to which HOMEBUILDERS® recommendations
were followed after case closure.
Training on a survey tool to review HOMEBUILDERS® cases occurred January 25 – 26th. The
review of cases took place from January 27, 2017 – February 2017. Inter-Rater Reliability
testing methodology was used to determine reliability. As part of the process, 45 cases were
Government of the District of Columbia
Child and Family Services Agency
Safe and Stable Families Semi-Annual Report
October, 2017 6
reviewed by pairs of two reviewers. Reviewers were paired based on practice area with
consideration to availability. Each reviewer in a pair reviewed information found in the referral
summary, case notes, referral summary, assessment and closure summary prior to completing the
revised HOMEBUILDERS® survey tool administered online at surveymonkey.com. Once each
reviewer completed the survey, they met as pairs and discussed discrepancies in responses. In all
45 cases, the reviewers were able to make a final decision after discussion of their discrepancies
and did not need the aid of a third reviewer. Percentage of Agreement was used to estimate
inter-rater reliability. The percentage of agreement is calculated as the number of agreement
responses divided by the total number of responses. The average percentage of agreement was
80% for the 45 cases reviewed.
The case review revealed a large number of withdrawals. For those families that withdrew,
analysis revealed the following barriers: caregiver’s inability to manage their own emotions and
to parent their child – leading to severe anxiety, caregiver’s inability or unwillingness to
supervise children leading to neglect, children’s medical challenges, caregiver and children’s
mental health issues, and little to no outside supports. For those reviewed that successfully
completed HOMEBUILDERS®, analysis revealed that barriers with parenting skills and
disciplinary practices, mental health and child behavior problems. Strengths included the
caretaker’s willingness to participate in the intervention, stable housing and employment, strong
family bonding, and available outside supports. The successful cases reviewed also showed that
the social worker maintained contact with the family and therapist and collaborated with
community resources while the HOMEBUILDERS® case was open. In previous reporting
periods, it was noted that if a family fails to meet with the therapist and does not maintain
contact with him or her, the therapist reaches out to the referring social worker to seek assistance
with engaging the family and to discuss next steps should they not be able to make contact with
the family. Therapists expressed concerns about the timeliness of communication with the
referring social worker when families are not fully engaged in the services and support by the
referring worker is needed. Given the brevity (four weeks) and nature of the service (families in
imminent risk of removal), the HOMEBUILDERS® therapist has a short window to engage the
family and to ensure fidelity to the model, must consider closing it if the family fails to meet
with them within 24-48 hours. The case review supported that a timely connection with the
referring social worker is critical. Paired with the results of the process and outcomes study,
CFSA has decided to focus on developing a transition plan to phase HOMEBUILDERS® out
and acquire a new service to address the gaps in family preservation services in the next
reporting period.
Government of the District of Columbia
Child and Family Services Agency
Safe and Stable Families Semi-Annual Report
October, 2017 7
Project Connect
CFSA continued to work closely with FSFSC (the technical assistant support), Children’s Friend
(the parent organization of the model) and CCAW and PLC (the service providers) to reach full
capacity and achieve maximum utilization of Project Connect services this reporting period. This
included the identification and coordination of skill development and topic specific training for
the Project Connect teams, development of ancillary services available to families involved with
Project Connect, and the expansion of services to include certain families involved with CFSA’s
In-home Administration. Efforts to market services and partner with staff to ensure eligible
families are connected to Project Connect continued this reporting period. Carey Tompkins and
Angela White-clinical managers were trained in the Project Connect model by Children's Friend
February 13-15, 2017 in Rhode Island
Efforts continued to identify and coordinate additional training opportunities for the Project
Connect staff to further develop their skills and knowledge in working with substance affected
families. Though some staff had some experience in working with this population, many were
newer graduates, who would benefit from topic specific skills development. Below is a list of
trainings the Project Connect team completed this reporting period:
● Adolescent Development & Trauma
● Risk Management
● NTU Modality Training
● Self-Harm & Mutilation
● Generational Boundaries in the Work Place
● CPR & First Aid
In the September 2016 site review, the consultants from Children’s Friend noted that the
District’s system is complex based on the various levels and number of agencies involved with
the implementation of this service. Children’s Friend advised that this is not inherently a
challenge, if strategies are implemented to ensure effective communication across all agencies, in
particular amongst agency leadership. To address this recommendation, CFSA and FSFSC
decided to convene a governance team of representatives from executive leadership from the
relevant agencies (e.g. CFSA, all five of the Collaboratives, CCAW and PLC). The Governance
Team was put on hold this reporting period as CFSA worked on the Safe and Stable Families
redesign, requiring CFSA to take stock of all waiver programs.
During this reporting period, CFSA planned a case review for a sample of Project Connect cases.
The purpose of this review is to learn lessons about how we provide intensive in-home crisis
intervention services and family treatment, so that we can continue to keep children and families
Government of the District of Columbia
Child and Family Services Agency
Safe and Stable Families Semi-Annual Report
October, 2017 8
safe, prevent the unnecessary out of home placement of children and to safely reunify children
and families. The objectives are to understand the needs of the families referred to Project
Connect, determine the appropriateness of the screening decision, and understand what factors
contribute. While CFSA was only able to plan the case review this reporting period, they intend
to coordinate and conduct the case review during the next monitoring.
As noted in the last semi-annual report, CFSA continued working to expand the target population
of Project Connect services to include substance affected families involved with the In-home
services and experiencing chronic neglect. CFSA defines chronic neglect using the following
criteria:
● Within the previous 3 year period, the family experienced:
o 4 accepted CPS referrals and
o 1 or more open In Home cases
OR
● Within the previous 4 year period, the family experienced:
o 2 or more substantiated CPS investigations and
o 1 or more open FA/In Home cases
CFSA continued working with FSFSC and the providers to market the Project Connect services
to social worker and supervisors involved with the In-Home administration due to the expanded
target population. Project Connect has fully implemented the expanded scope but did not see a
large increase in referrals. CFSA will continue to market the new expansion in In-Home All
Staff meetings that occur quarterly.
Overall marketing of services continued to be a focus of the Project Connect team. CFSA
worked with the providers to develop a tip sheet that outlined the components of the model for
families and for referring social worker. Similar to HOMEBUILDERS®, CFSA continued office
hours for the Project Connect staff. Representatives from Project Connect were available onsite
on a daily basis to provide information and consultation to CFSA staff on the model and possible
referrals for services.
CFSA also did some direct outreach to social workers assigned to families identified as
substance affected. CFSA’s Program Operations Administration maintains a list of families who
have been identified as substance affected (based on the nature of the referral and removal) and
have been referred to a Recovery Specialist, who are certified addiction counselors and have
been hired to support the assigned social workers with engaging identified families in
assessments and recommended treatments. Efforts have been made to work with the Recovery
Government of the District of Columbia
Child and Family Services Agency
Safe and Stable Families Semi-Annual Report
October, 2017 9
Specialists to identify eligible families for services and to reach out to the CFSA social worker to
recommend the family be referred to Project Connect. The Safe and Stable Families Project
Management Specialist regularly reaches out to social workers assigned to these families to
provide information on Project Connect and how to make a referral.
III. Evaluation Status
A. Numbers of children and families assigned to the demonstration
Please note that unless otherwise specified, all data in this section reflects families who were
served October 1, 2016-February 28, 2017 - While the Semi-Annual Reporting period is
through April, the evaluators needed time to request data from programs and to analyze the
data prior to the Semi-Annual Report due date. Further, the previous Interim Report reflected
data through September 30, 2016. Therefore, this Semi-Annual Report includes data on
families who were served from October 1, 2016-February 28, 2017.
Data source for Title IV-E Waiver referral and program status
SSF implementation staff utilize an active spreadsheet that continuously tracks families
referred to and served by Title IV-E Waiver programs. The following data points are tracked
in the spreadsheet:
● CFSA case/referral number
● client last name
● client first name
● client date of birth
● number of children involved in the case/referral
● race/ethnicity
● client's ward
● referral source
● date referral received
● program being referred to
● date referral sent to provider
● referral outcome
● referral denial reason
● assigned support worker
● social worker name
● participation status
● discharge date
● discharge reason
● CFSA case status
● client’s role in CFSA case
Government of the District of Columbia
Child and Family Services Agency
Safe and Stable Families Semi-Annual Report
October, 2017 10
● initial assessment date (by provider)
● program enrollment date
● assigned worker name
● notes/important comments
This spreadsheet allows for an analysis of demonstration families served to date. By using the
case/referral number, it also allows for the SSF implementation team and the evaluators to be
able to match data on outcomes and assessments pertaining to families involved with SSF that
come from other data sources.
Number of families in demonstration
Table 1 below exhibits the current number of families served compared to the expected number
of families to be served by the Waiver to date (4/25/2014 - 2/28/2017). “Enrolled Participants”
is the number of families enrolled in services or discharged. The number of families expected
to be served during the time period as derived from projections established by Waiver
implementation staff during the first year of the Waiver. Using our established time period for
this report, we calculated the number of years the program was serving families. The number
of years was multiplied by the established number of families expected to serve in a single year.
The difference between expected to serve and enrolled is the number expected to serve minus
the number of enrolled participants. Positive numbers indicate more enrollments than what was
originally expected. Negative numbers indicate fewer enrollments than expected. The “Percent
of Goal” column indicates the percent of the expected enrollment numbers that has been served
as of 2/28/2017.
Overall, enrollment in Project Connect (94 families) as of this report is 64% of the expected to
serve goals. Enrollment for HOMEBUILDERS® (144 families) is 77% of its goal.
Table 1. Number of Families Served vs. Number of Families Expected to Serve During the
Waiver Period to Date (10/1/2016-2/28/2017)
Referrals - approved and denied
Table 2 and 3 below identifies the total number of referrals made to SSF by program within the
Waiver period (4/25/2014-2/28/2017), further broken down by approved and denied referrals.
Referrals by CFSA social workers to HOMEBUILDERSⓇ and Project Connect are sent to a
Families Enrolled (n )
Expected to Serve
(April 2014 -
February 2017)
Difference Between
Expected to Serve
and Enrolled
Percent of Goal
HOMEBUILDERS® 144 187 43 77%
Project Connect 94 146 52 64%
Grand Total 238 333 95 71%
Government of the District of Columbia
Child and Family Services Agency
Safe and Stable Families Semi-Annual Report
October, 2017 11
referral coordinator at CFSA. The CFSA referral coordinator then processes the referral by
confirming eligibility, and sends the referral to the providers. There were a total of 41 families
with 49 referrals made during this reporting period of which 34 referrals (69%) were approved
for 31 families. Fifteen referrals (31%) were denied for HOMEBUILDERS® referrals during
this time period.
Project Connect Referrals data was captured through program level data and therefore shows
number of accepted referrals and enrolled families. There were a total of 20 families with 21
referrals made during this reporting period of which 19 referrals (90%) were approved by
Project Connect. Only two referrals were denied.
Some examples of continued efforts to educate and collaborate with staff are as follows: 1. A
newsletter was sent to staff and to community stakeholders highlighting HOMEBUILDERSⓇ
and Project Connect; 2. HOMEBUILDERSⓇ and Project Connect have designated office
space and designated areas for signage to display office hours; 3. All SSF providers
participated in a resource fair to share the information with CFSA and private agency social
workers 4. Weekly meetings are held with CPS, Community Partnerships, and
HOMEBUILDERSⓇ staff to review removal data and to use the information to refine
marketing strategies with CFSA and private agency social workers.
Table 2. HOMEBUILDERSⓇ Referral Approval Rates Waiver Period (4/25/2014-
2/28/2017)
HOMEBUILDERSⓇ
SAPR PeriodTotal Referrals
(n )
Referrals by
Family (n )
Accepted
Referrals (n )
Accepted
Referrals/Enrolled
(%)
First: 04/25/2014 - 10/31/2014
(6 months)7 6 5 (5/7) = 71%
Second: 11/01/2014 - 03/31/2015
(5 months)22 20 12 (12/22) = 55%
Third: 04/01/2015 - 08/31/2015
(5 months)36 32 22 (22/35) = 63%
Fourth: 09/01/2015 - 01/31/2016
(5 months)61 50 36 (36/61) = 59%
Fifth: 02/01/2016 - 09/30/2016*
(9 months)123 103 87 (87/123) = 70%
Sixth: 10/01/2016 - 02/28/2017
(6 months)49 41 34 (34/49) = 69%
Grand Total
(04/25/2014 - 02/28/2017)298** 252 196 (196/298) = 66%
* This is a 9 month period- if equated to a 5 month period, 123/9 = 13.7 referrals per month x 5 = 68.3
** 5 referrals without Referral ID all denied
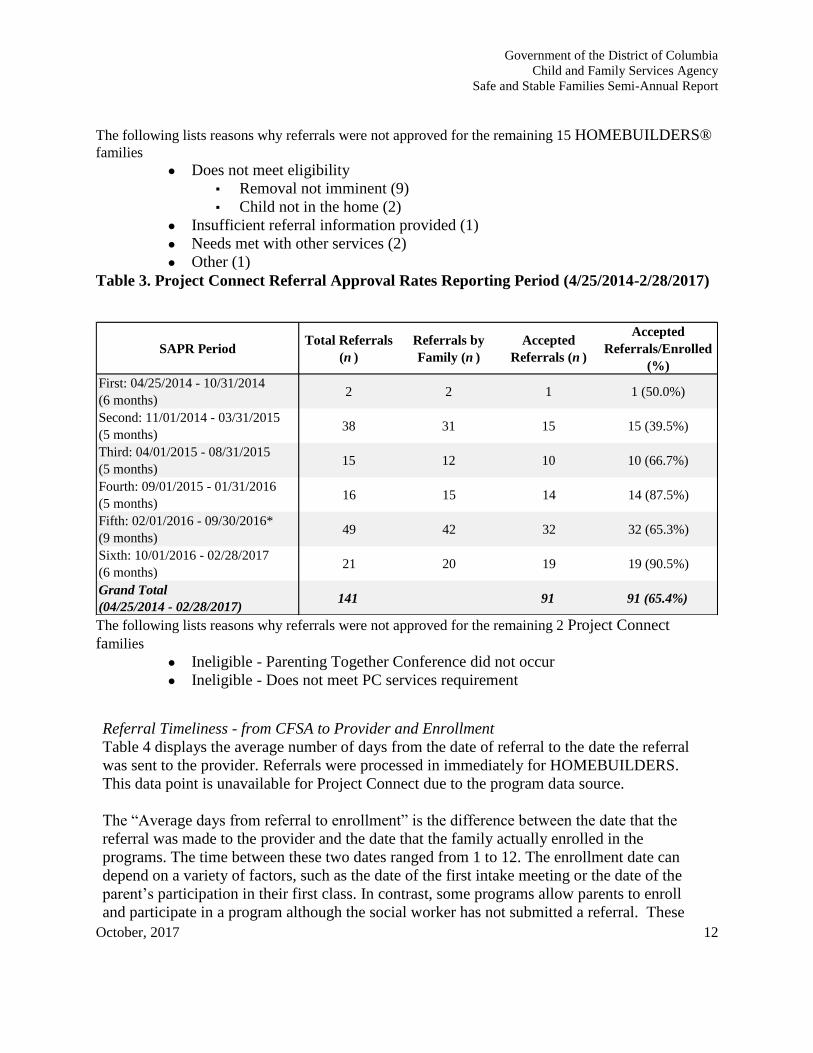
Government of the District of Columbia
Child and Family Services Agency
Safe and Stable Families Semi-Annual Report
October, 2017 12
The following lists reasons why referrals were not approved for the remaining 15 HOMEBUILDERS® families
● Does not meet eligibility
▪ Removal not imminent (9)
▪ Child not in the home (2)
● Insufficient referral information provided (1)
● Needs met with other services (2)
● Other (1)
Table 3. Project Connect Referral Approval Rates Reporting Period (4/25/2014-2/28/2017)
The following lists reasons why referrals were not approved for the remaining 2 Project Connect
families
● Ineligible - Parenting Together Conference did not occur
● Ineligible - Does not meet PC services requirement
Referral Timeliness - from CFSA to Provider and Enrollment
Table 4 displays the average number of days from the date of referral to the date the referral
was sent to the provider. Referrals were processed in immediately for HOMEBUILDERS.
This data point is unavailable for Project Connect due to the program data source.
The “Average days from referral to enrollment” is the difference between the date that the
referral was made to the provider and the date that the family actually enrolled in the
programs. The time between these two dates ranged from 1 to 12. The enrollment date can
depend on a variety of factors, such as the date of the first intake meeting or the date of the
parent’s participation in their first class. In contrast, some programs allow parents to enroll
and participate in a program although the social worker has not submitted a referral. These
SAPR PeriodTotal Referrals
(n )
Referrals by
Family (n )
Accepted
Referrals (n )
Accepted
Referrals/Enrolled
(%)
First: 04/25/2014 - 10/31/2014
(6 months)2 2 1 1 (50.0%)
Second: 11/01/2014 - 03/31/2015
(5 months)38 31 15 15 (39.5%)
Third: 04/01/2015 - 08/31/2015
(5 months)15 12 10 10 (66.7%)
Fourth: 09/01/2015 - 01/31/2016
(5 months)16 15 14 14 (87.5%)
Fifth: 02/01/2016 - 09/30/2016*
(9 months)49 42 32 32 (65.3%)
Sixth: 10/01/2016 - 02/28/2017
(6 months)21 20 19 19 (90.5%)
Grand Total
(04/25/2014 - 02/28/2017)141 91 91 (65.4%)
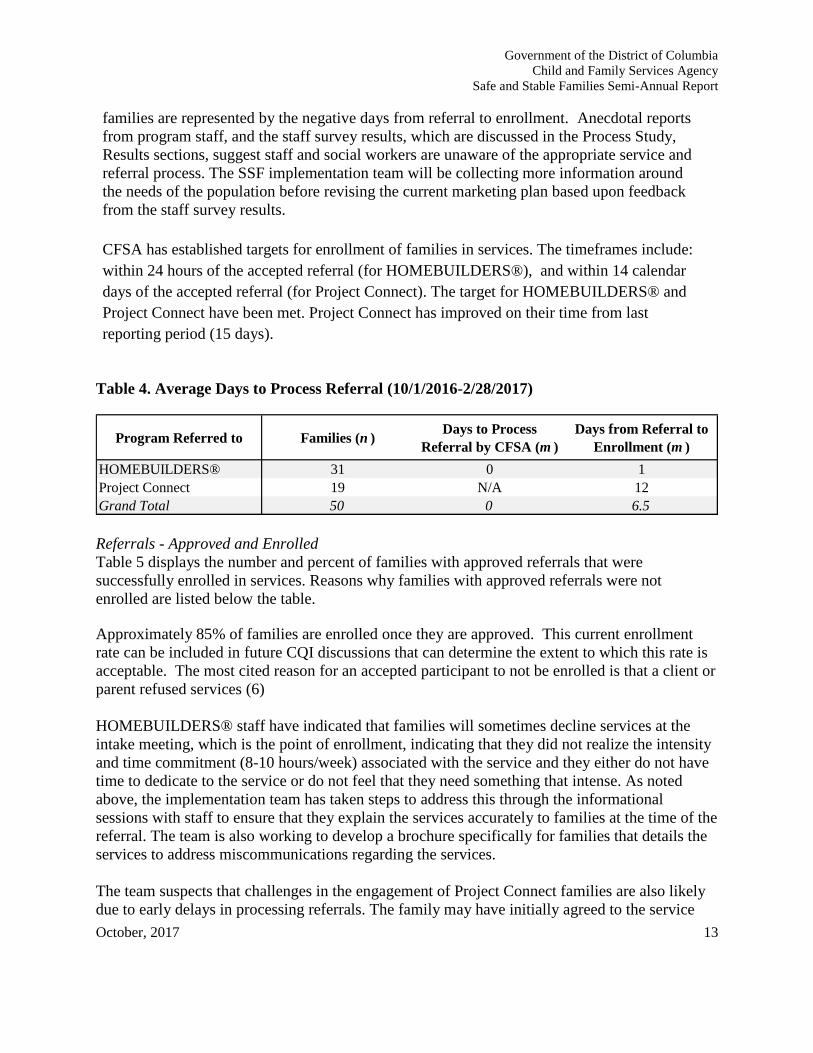
Government of the District of Columbia
Child and Family Services Agency
Safe and Stable Families Semi-Annual Report
October, 2017 13
families are represented by the negative days from referral to enrollment. Anecdotal reports
from program staff, and the staff survey results, which are discussed in the Process Study,
Results sections, suggest staff and social workers are unaware of the appropriate service and
referral process. The SSF implementation team will be collecting more information around
the needs of the population before revising the current marketing plan based upon feedback
from the staff survey results.
CFSA has established targets for enrollment of families in services. The timeframes include:
within 24 hours of the accepted referral (for HOMEBUILDERS®), and within 14 calendar
days of the accepted referral (for Project Connect). The target for HOMEBUILDERS® and
Project Connect have been met. Project Connect has improved on their time from last
reporting period (15 days).
Table 4. Average Days to Process Referral (10/1/2016-2/28/2017)
Referrals - Approved and Enrolled
Table 5 displays the number and percent of families with approved referrals that were
successfully enrolled in services. Reasons why families with approved referrals were not
enrolled are listed below the table.
Approximately 85% of families are enrolled once they are approved. This current enrollment
rate can be included in future CQI discussions that can determine the extent to which this rate is
acceptable. The most cited reason for an accepted participant to not be enrolled is that a client or
parent refused services (6)
HOMEBUILDERS® staff have indicated that families will sometimes decline services at the
intake meeting, which is the point of enrollment, indicating that they did not realize the intensity
and time commitment (8-10 hours/week) associated with the service and they either do not have
time to dedicate to the service or do not feel that they need something that intense. As noted
above, the implementation team has taken steps to address this through the informational
sessions with staff to ensure that they explain the services accurately to families at the time of the
referral. The team is also working to develop a brochure specifically for families that details the
services to address miscommunications regarding the services.
The team suspects that challenges in the engagement of Project Connect families are also likely
due to early delays in processing referrals. The family may have initially agreed to the service
Program Referred to Families (n )Days to Process
Referral by CFSA (m )
Days from Referral to
Enrollment (m )
HOMEBUILDERS® 31 0 1
Project Connect 19 N/A 12
Grand Total 50 0 6.5
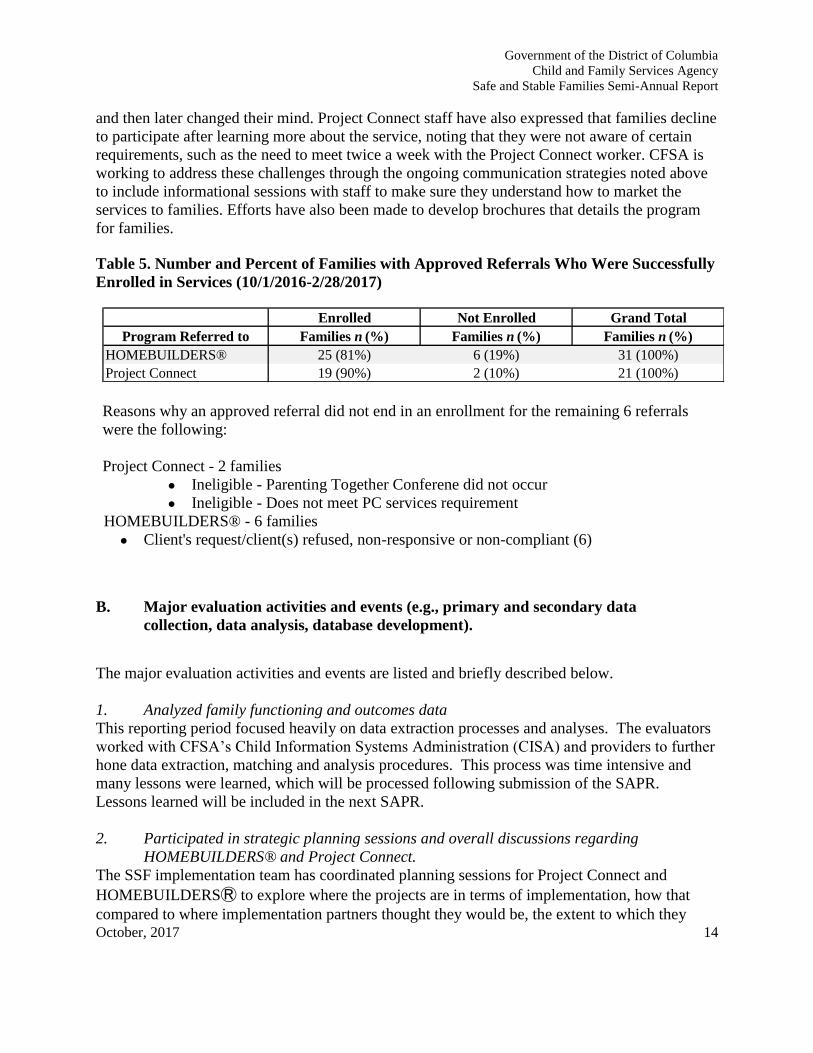
Government of the District of Columbia
Child and Family Services Agency
Safe and Stable Families Semi-Annual Report
October, 2017 14
and then later changed their mind. Project Connect staff have also expressed that families decline
to participate after learning more about the service, noting that they were not aware of certain
requirements, such as the need to meet twice a week with the Project Connect worker. CFSA is
working to address these challenges through the ongoing communication strategies noted above
to include informational sessions with staff to make sure they understand how to market the
services to families. Efforts have also been made to develop brochures that details the program
for families.
Table 5. Number and Percent of Families with Approved Referrals Who Were Successfully
Enrolled in Services (10/1/2016-2/28/2017)
Reasons why an approved referral did not end in an enrollment for the remaining 6 referrals
were the following:
Project Connect - 2 families
● Ineligible - Parenting Together Conferene did not occur
● Ineligible - Does not meet PC services requirement
HOMEBUILDERS® - 6 families
● Client's request/client(s) refused, non-responsive or non-compliant (6)
B. Major evaluation activities and events (e.g., primary and secondary data
collection, data analysis, database development).
The major evaluation activities and events are listed and briefly described below.
1. Analyzed family functioning and outcomes data
This reporting period focused heavily on data extraction processes and analyses. The evaluators
worked with CFSA’s Child Information Systems Administration (CISA) and providers to further
hone data extraction, matching and analysis procedures. This process was time intensive and
many lessons were learned, which will be processed following submission of the SAPR.
Lessons learned will be included in the next SAPR.
2. Participated in strategic planning sessions and overall discussions regarding
HOMEBUILDERS® and Project Connect.
The SSF implementation team has coordinated planning sessions for Project Connect and
HOMEBUILDERSⓇ to explore where the projects are in terms of implementation, how that
compared to where implementation partners thought they would be, the extent to which they
Enrolled Not Enrolled Grand Total
Program Referred to Families n (%) Families n (%) Families n (%)
HOMEBUILDERS® 25 (81%) 6 (19%) 31 (100%)
Project Connect 19 (90%) 2 (10%) 21 (100%)
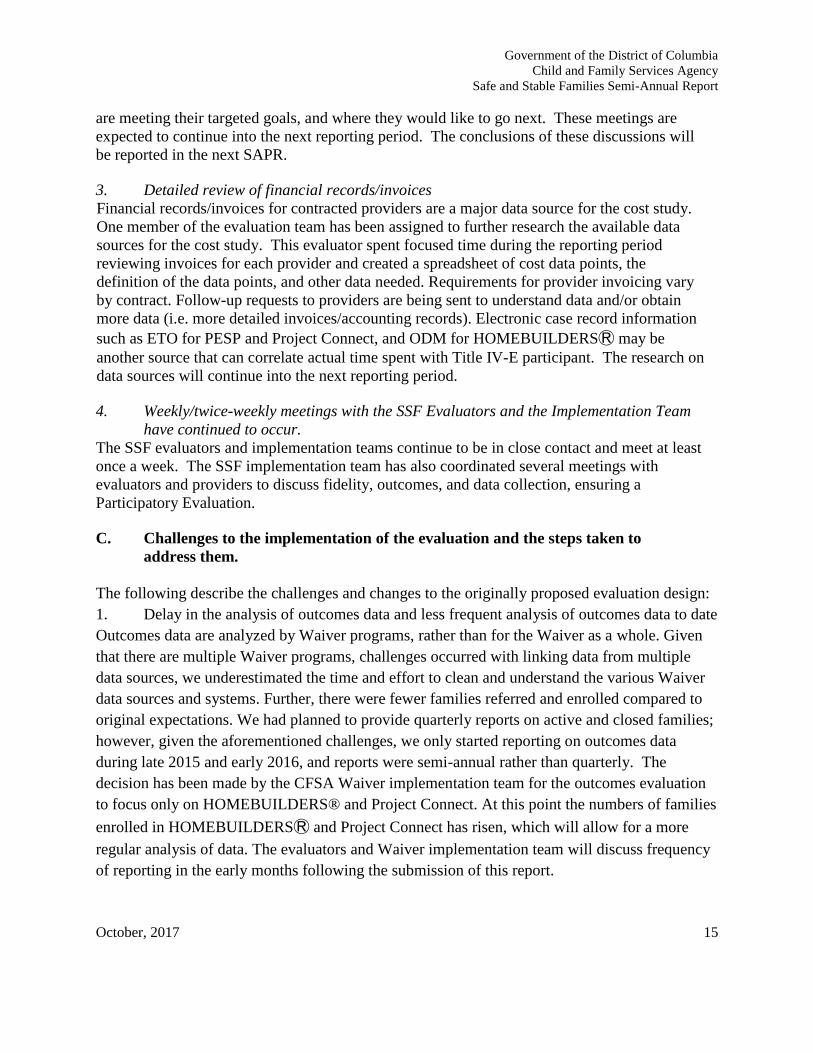
Government of the District of Columbia
Child and Family Services Agency
Safe and Stable Families Semi-Annual Report
October, 2017 15
are meeting their targeted goals, and where they would like to go next. These meetings are
expected to continue into the next reporting period. The conclusions of these discussions will
be reported in the next SAPR.
3. Detailed review of financial records/invoices
Financial records/invoices for contracted providers are a major data source for the cost study.
One member of the evaluation team has been assigned to further research the available data
sources for the cost study. This evaluator spent focused time during the reporting period
reviewing invoices for each provider and created a spreadsheet of cost data points, the
definition of the data points, and other data needed. Requirements for provider invoicing vary
by contract. Follow-up requests to providers are being sent to understand data and/or obtain
more data (i.e. more detailed invoices/accounting records). Electronic case record information
such as ETO for PESP and Project Connect, and ODM for HOMEBUILDERSⓇ may be
another source that can correlate actual time spent with Title IV-E participant. The research on
data sources will continue into the next reporting period.
4. Weekly/twice-weekly meetings with the SSF Evaluators and the Implementation Team
have continued to occur.
The SSF evaluators and implementation teams continue to be in close contact and meet at least
once a week. The SSF implementation team has also coordinated several meetings with
evaluators and providers to discuss fidelity, outcomes, and data collection, ensuring a
Participatory Evaluation.
C. Challenges to the implementation of the evaluation and the steps taken to
address them.
The following describe the challenges and changes to the originally proposed evaluation design:
1. Delay in the analysis of outcomes data and less frequent analysis of outcomes data to date
Outcomes data are analyzed by Waiver programs, rather than for the Waiver as a whole. Given
that there are multiple Waiver programs, challenges occurred with linking data from multiple
data sources, we underestimated the time and effort to clean and understand the various Waiver
data sources and systems. Further, there were fewer families referred and enrolled compared to
original expectations. We had planned to provide quarterly reports on active and closed families;
however, given the aforementioned challenges, we only started reporting on outcomes data
during late 2015 and early 2016, and reports were semi-annual rather than quarterly. The
decision has been made by the CFSA Waiver implementation team for the outcomes evaluation
to focus only on HOMEBUILDERS® and Project Connect. At this point the numbers of families
enrolled in HOMEBUILDERSⓇ and Project Connect has risen, which will allow for a more
regular analysis of data. The evaluators and Waiver implementation team will discuss frequency
of reporting in the early months following the submission of this report.
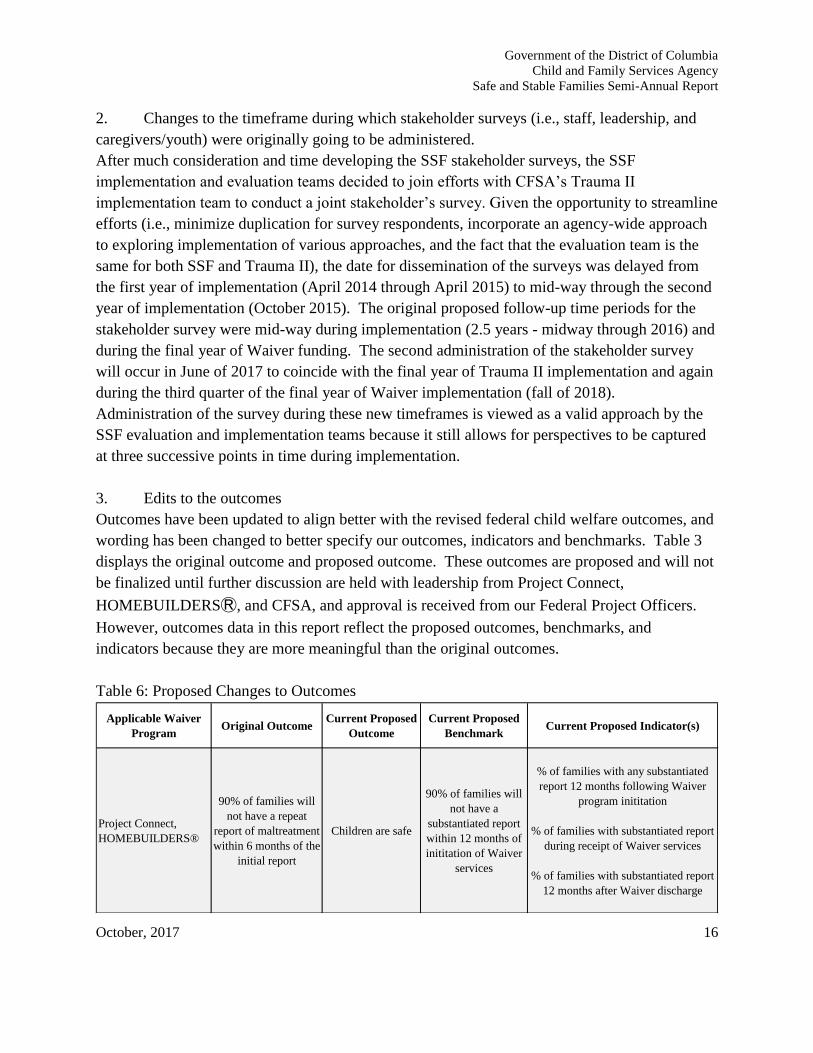
Government of the District of Columbia
Child and Family Services Agency
Safe and Stable Families Semi-Annual Report
October, 2017 16
2. Changes to the timeframe during which stakeholder surveys (i.e., staff, leadership, and
caregivers/youth) were originally going to be administered.
After much consideration and time developing the SSF stakeholder surveys, the SSF
implementation and evaluation teams decided to join efforts with CFSA’s Trauma II
implementation team to conduct a joint stakeholder’s survey. Given the opportunity to streamline
efforts (i.e., minimize duplication for survey respondents, incorporate an agency-wide approach
to exploring implementation of various approaches, and the fact that the evaluation team is the
same for both SSF and Trauma II), the date for dissemination of the surveys was delayed from
the first year of implementation (April 2014 through April 2015) to mid-way through the second
year of implementation (October 2015). The original proposed follow-up time periods for the
stakeholder survey were mid-way during implementation (2.5 years - midway through 2016) and
during the final year of Waiver funding. The second administration of the stakeholder survey
will occur in June of 2017 to coincide with the final year of Trauma II implementation and again
during the third quarter of the final year of Waiver implementation (fall of 2018).
Administration of the survey during these new timeframes is viewed as a valid approach by the
SSF evaluation and implementation teams because it still allows for perspectives to be captured
at three successive points in time during implementation.
3. Edits to the outcomes
Outcomes have been updated to align better with the revised federal child welfare outcomes, and
wording has been changed to better specify our outcomes, indicators and benchmarks. Table 3
displays the original outcome and proposed outcome. These outcomes are proposed and will not
be finalized until further discussion are held with leadership from Project Connect,
HOMEBUILDERSⓇ, and CFSA, and approval is received from our Federal Project Officers.
However, outcomes data in this report reflect the proposed outcomes, benchmarks, and
indicators because they are more meaningful than the original outcomes.
Table 6: Proposed Changes to Outcomes
Applicable Waiver
ProgramOriginal Outcome
Current Proposed
Outcome
Current Proposed
BenchmarkCurrent Proposed Indicator(s)
Project Connect,
HOMEBUILDERS®
90% of families will
not have a repeat
report of maltreatment
within 6 months of the
initial report
Children are safe
90% of families will
not have a
substantiated report
within 12 months of
inititation of Waiver
services
% of families with any substantiated
report 12 months following Waiver
program inititation
% of families with substantiated report
during receipt of Waiver services
% of families with substantiated report
12 months after Waiver discharge
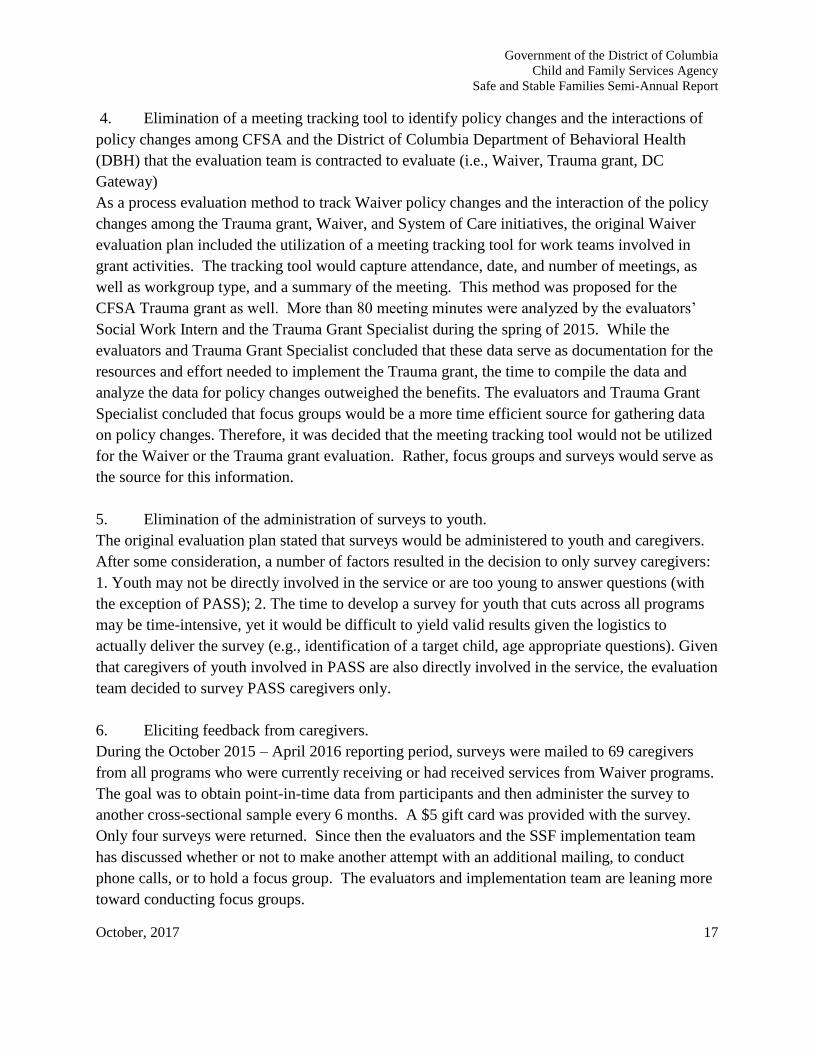
Government of the District of Columbia
Child and Family Services Agency
Safe and Stable Families Semi-Annual Report
October, 2017 17
4. Elimination of a meeting tracking tool to identify policy changes and the interactions of
policy changes among CFSA and the District of Columbia Department of Behavioral Health
(DBH) that the evaluation team is contracted to evaluate (i.e., Waiver, Trauma grant, DC
Gateway)
As a process evaluation method to track Waiver policy changes and the interaction of the policy
changes among the Trauma grant, Waiver, and System of Care initiatives, the original Waiver
evaluation plan included the utilization of a meeting tracking tool for work teams involved in
grant activities. The tracking tool would capture attendance, date, and number of meetings, as
well as workgroup type, and a summary of the meeting. This method was proposed for the
CFSA Trauma grant as well. More than 80 meeting minutes were analyzed by the evaluators’
Social Work Intern and the Trauma Grant Specialist during the spring of 2015. While the
evaluators and Trauma Grant Specialist concluded that these data serve as documentation for the
resources and effort needed to implement the Trauma grant, the time to compile the data and
analyze the data for policy changes outweighed the benefits. The evaluators and Trauma Grant
Specialist concluded that focus groups would be a more time efficient source for gathering data
on policy changes. Therefore, it was decided that the meeting tracking tool would not be utilized
for the Waiver or the Trauma grant evaluation. Rather, focus groups and surveys would serve as
the source for this information.
5. Elimination of the administration of surveys to youth.
The original evaluation plan stated that surveys would be administered to youth and caregivers.
After some consideration, a number of factors resulted in the decision to only survey caregivers:
1. Youth may not be directly involved in the service or are too young to answer questions (with
the exception of PASS); 2. The time to develop a survey for youth that cuts across all programs
may be time-intensive, yet it would be difficult to yield valid results given the logistics to
actually deliver the survey (e.g., identification of a target child, age appropriate questions). Given
that caregivers of youth involved in PASS are also directly involved in the service, the evaluation
team decided to survey PASS caregivers only.
6. Eliciting feedback from caregivers.
During the October 2015 – April 2016 reporting period, surveys were mailed to 69 caregivers
from all programs who were currently receiving or had received services from Waiver programs.
The goal was to obtain point-in-time data from participants and then administer the survey to
another cross-sectional sample every 6 months. A $5 gift card was provided with the survey.
Only four surveys were returned. Since then the evaluators and the SSF implementation team
has discussed whether or not to make another attempt with an additional mailing, to conduct
phone calls, or to hold a focus group. The evaluators and implementation team are leaning more
toward conducting focus groups.
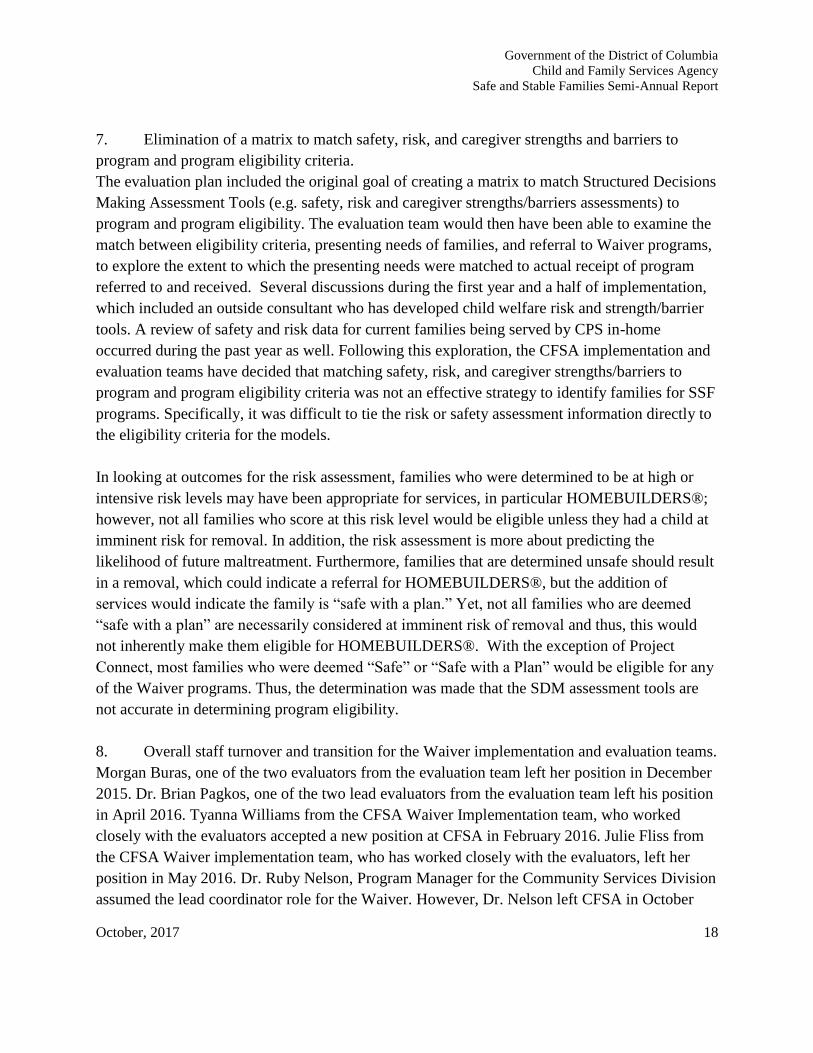
Government of the District of Columbia
Child and Family Services Agency
Safe and Stable Families Semi-Annual Report
October, 2017 18
7. Elimination of a matrix to match safety, risk, and caregiver strengths and barriers to
program and program eligibility criteria.
The evaluation plan included the original goal of creating a matrix to match Structured Decisions
Making Assessment Tools (e.g. safety, risk and caregiver strengths/barriers assessments) to
program and program eligibility. The evaluation team would then have been able to examine the
match between eligibility criteria, presenting needs of families, and referral to Waiver programs,
to explore the extent to which the presenting needs were matched to actual receipt of program
referred to and received. Several discussions during the first year and a half of implementation,
which included an outside consultant who has developed child welfare risk and strength/barrier
tools. A review of safety and risk data for current families being served by CPS in-home
occurred during the past year as well. Following this exploration, the CFSA implementation and
evaluation teams have decided that matching safety, risk, and caregiver strengths/barriers to
program and program eligibility criteria was not an effective strategy to identify families for SSF
programs. Specifically, it was difficult to tie the risk or safety assessment information directly to
the eligibility criteria for the models.
In looking at outcomes for the risk assessment, families who were determined to be at high or
intensive risk levels may have been appropriate for services, in particular HOMEBUILDERS®;
however, not all families who score at this risk level would be eligible unless they had a child at
imminent risk for removal. In addition, the risk assessment is more about predicting the
likelihood of future maltreatment. Furthermore, families that are determined unsafe should result
in a removal, which could indicate a referral for HOMEBUILDERS®, but the addition of
services would indicate the family is “safe with a plan.” Yet, not all families who are deemed
“safe with a plan” are necessarily considered at imminent risk of removal and thus, this would
not inherently make them eligible for HOMEBUILDERS®. With the exception of Project
Connect, most families who were deemed “Safe” or “Safe with a Plan” would be eligible for any
of the Waiver programs. Thus, the determination was made that the SDM assessment tools are
not accurate in determining program eligibility.
8. Overall staff turnover and transition for the Waiver implementation and evaluation teams.
Morgan Buras, one of the two evaluators from the evaluation team left her position in December
2015. Dr. Brian Pagkos, one of the two lead evaluators from the evaluation team left his position
in April 2016. Tyanna Williams from the CFSA Waiver Implementation team, who worked
closely with the evaluators accepted a new position at CFSA in February 2016. Julie Fliss from
the CFSA Waiver implementation team, who has worked closely with the evaluators, left her
position in May 2016. Dr. Ruby Nelson, Program Manager for the Community Services Division
assumed the lead coordinator role for the Waiver. However, Dr. Nelson left CFSA in October
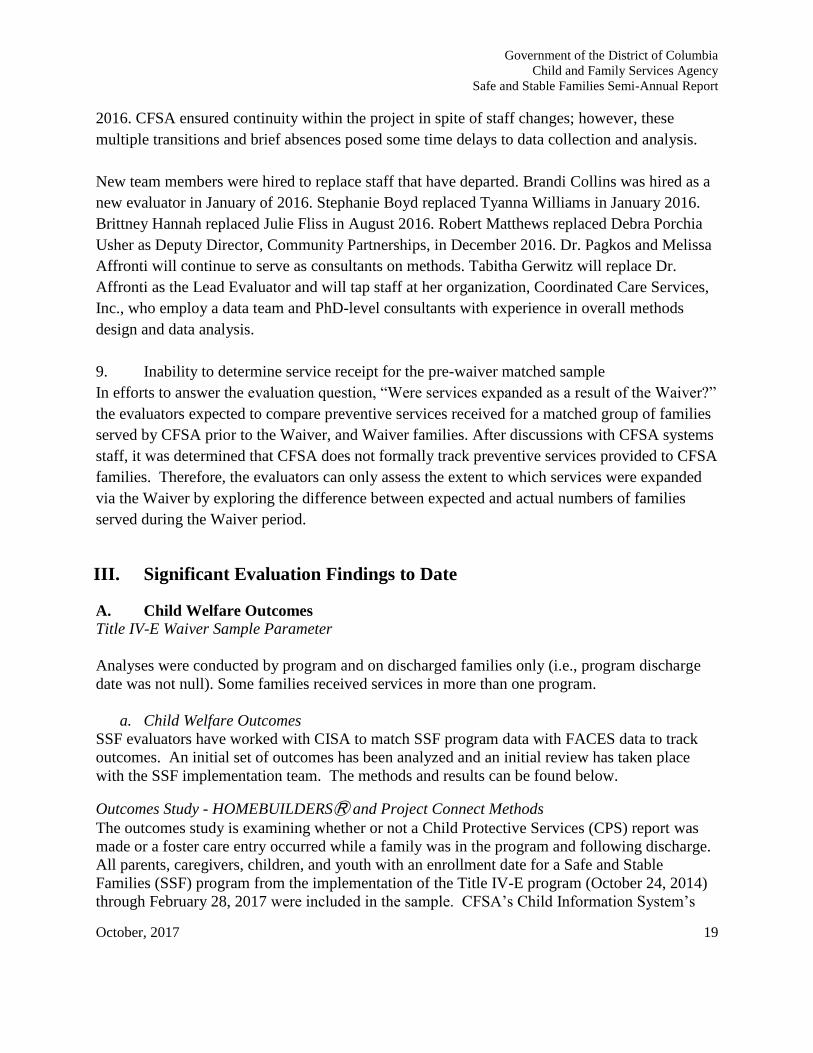
Government of the District of Columbia
Child and Family Services Agency
Safe and Stable Families Semi-Annual Report
October, 2017 19
2016. CFSA ensured continuity within the project in spite of staff changes; however, these
multiple transitions and brief absences posed some time delays to data collection and analysis.
New team members were hired to replace staff that have departed. Brandi Collins was hired as a
new evaluator in January of 2016. Stephanie Boyd replaced Tyanna Williams in January 2016.
Brittney Hannah replaced Julie Fliss in August 2016. Robert Matthews replaced Debra Porchia
Usher as Deputy Director, Community Partnerships, in December 2016. Dr. Pagkos and Melissa
Affronti will continue to serve as consultants on methods. Tabitha Gerwitz will replace Dr.
Affronti as the Lead Evaluator and will tap staff at her organization, Coordinated Care Services,
Inc., who employ a data team and PhD-level consultants with experience in overall methods
design and data analysis.
9. Inability to determine service receipt for the pre-waiver matched sample
In efforts to answer the evaluation question, “Were services expanded as a result of the Waiver?”
the evaluators expected to compare preventive services received for a matched group of families
served by CFSA prior to the Waiver, and Waiver families. After discussions with CFSA systems
staff, it was determined that CFSA does not formally track preventive services provided to CFSA
families. Therefore, the evaluators can only assess the extent to which services were expanded
via the Waiver by exploring the difference between expected and actual numbers of families
served during the Waiver period.
III. Significant Evaluation Findings to Date
A. Child Welfare Outcomes
Title IV-E Waiver Sample Parameter
Analyses were conducted by program and on discharged families only (i.e., program discharge
date was not null). Some families received services in more than one program.
a. Child Welfare Outcomes
SSF evaluators have worked with CISA to match SSF program data with FACES data to track
outcomes. An initial set of outcomes has been analyzed and an initial review has taken place
with the SSF implementation team. The methods and results can be found below.
Outcomes Study - HOMEBUILDERSⓇ and Project Connect Methods
The outcomes study is examining whether or not a Child Protective Services (CPS) report was
made or a foster care entry occurred while a family was in the program and following discharge.
All parents, caregivers, children, and youth with an enrollment date for a Safe and Stable
Families (SSF) program from the implementation of the Title IV-E program (October 24, 2014)
through February 28, 2017 were included in the sample. CFSA’s Child Information System’s
Government of the District of Columbia
Child and Family Services Agency
Safe and Stable Families Semi-Annual Report
October, 2017 20
Administration (CISA) matched the SSF sample to FACES records to gather information on the
parent, caregiver, child, or youth’s possible involvement with CFSA prior to, during, and within
12 months of the conclusion of their involvement with the SSF program.
CFSA involvement is defined as participating in an open case, or having an open or closed CPS
investigation. Waiver families were matched to families that were served by CFSA prior to the
Waiver. Criteria for the matched sample were as follows:
● Families served by CFSA
● Families served between January 25, 2012 and January 25, 2013
○ 90 day match periods prior to the referral date were granted
● Risk (high risk)
● Safety (unsafe)
● Gender
● Race
● Date of birth/age
● Number of CPS referrals
● Number of substantiated reports
For Project Connect, families may or may not have had a child in foster care at the time of entry.
Three primary data sources were used for HOMEBUILDERS® analysis:
● Data from the google spreadsheet used by CFSA to track referral process and program
activity including enrollments and discharges
● Data on CPS reports and Foster Care activity from DC CFSA CISA
● Data from ODM, the practice and reporting system used by HOMEBUILDERS® by East
River Family Strengthening Collaborative
○ General program information
○ North Carolina Family Assessment Scale (NCFAS), administered by
HOMEBUILDERS® staff upon enrollment and at discharge
Two primary data sources were used for Project Connect analysis:
● Data on CPS reports and Foster Care activity from DC CFSA CISA
● Data from ETO, the practice and reporting system used by Project Connect, by Far
Southeast Family Strengthening Collaborative
○ General program information
○ North Carolina Family Assessment Scale (NCFAS), administered by Project
Connect staff at enrollment, every 90 days thereafter, and at discharge
Based on the matching criteria listed above, the evaluation team was able to match 76 pre-waiver
families of the 90 waiver HOMEBUILDERS® sample families (84.4%)
Based on the matching criteria listed above, the evaluation team was able to match 16 pre-waiver
families of the 19 waiver Project Connect sample families (84.2%)
Analytics assess the extent to which a family had a CPS report of foster care placement during
their time receiving the Title IV-E service, or following discharge.
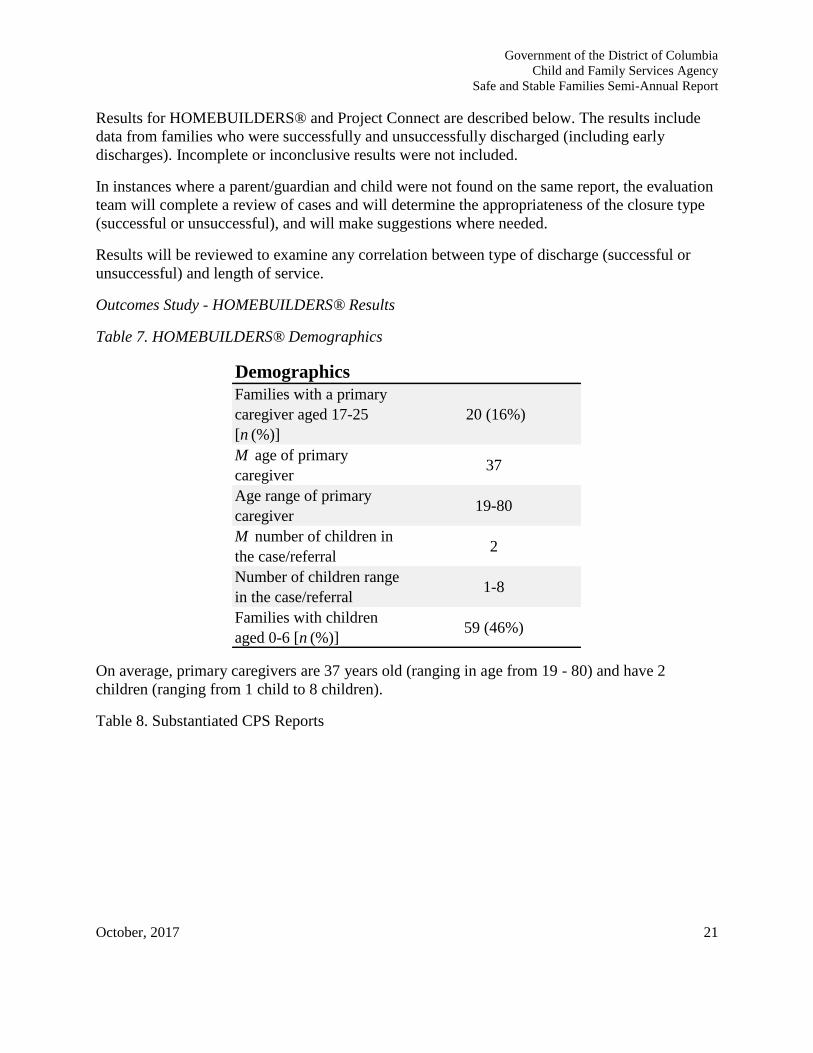
Government of the District of Columbia
Child and Family Services Agency
Safe and Stable Families Semi-Annual Report
October, 2017 21
Results for HOMEBUILDERS® and Project Connect are described below. The results include
data from families who were successfully and unsuccessfully discharged (including early
discharges). Incomplete or inconclusive results were not included.
In instances where a parent/guardian and child were not found on the same report, the evaluation
team will complete a review of cases and will determine the appropriateness of the closure type
(successful or unsuccessful), and will make suggestions where needed.
Results will be reviewed to examine any correlation between type of discharge (successful or
unsuccessful) and length of service.
Outcomes Study - HOMEBUILDERS® Results
Table 7. HOMEBUILDERS® Demographics
On average, primary caregivers are 37 years old (ranging in age from 19 - 80) and have 2
children (ranging from 1 child to 8 children).
Table 8. Substantiated CPS Reports
Families with a primary
caregiver aged 17-25
[n (%)]
20 (16%)
M age of primary
caregiver37
Age range of primary
caregiver19-80
M number of children in
the case/referral2
Number of children range
in the case/referral1-8
Families with children
aged 0-6 [n (%)]59 (46%)
Demographics
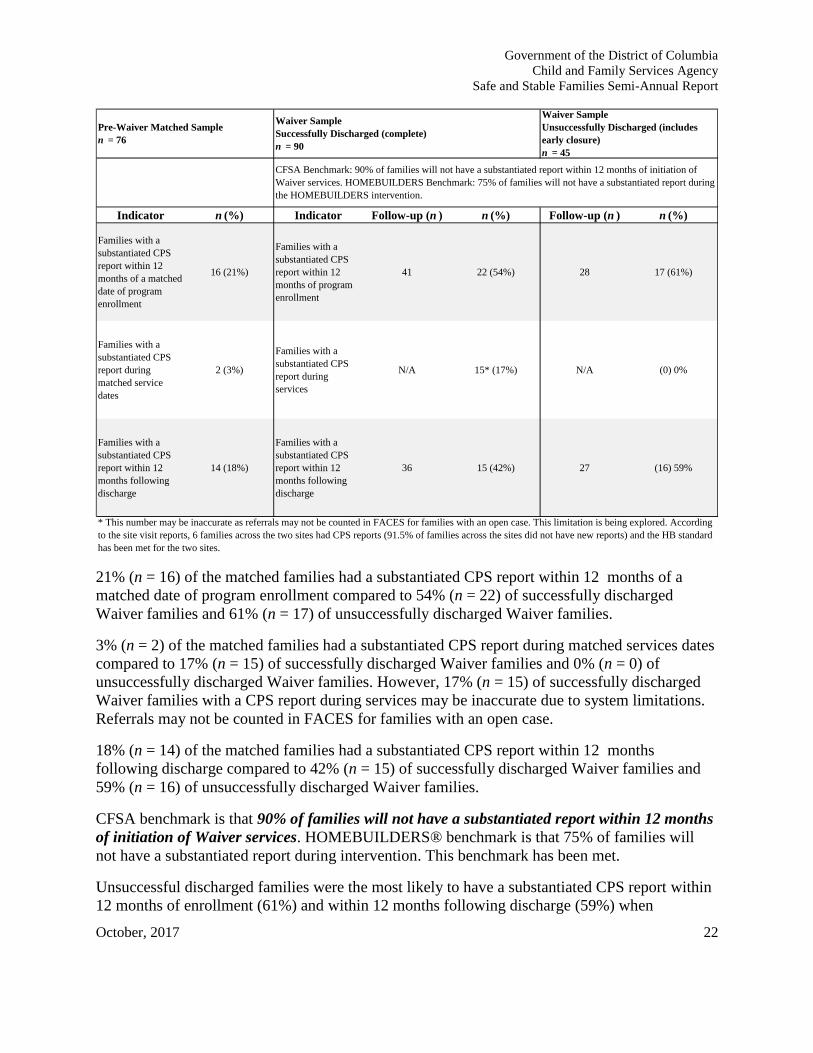
Government of the District of Columbia
Child and Family Services Agency
Safe and Stable Families Semi-Annual Report
October, 2017 22
21% (n = 16) of the matched families had a substantiated CPS report within 12 months of a
matched date of program enrollment compared to 54% (n = 22) of successfully discharged
Waiver families and 61% (n = 17) of unsuccessfully discharged Waiver families.
3% (n = 2) of the matched families had a substantiated CPS report during matched services dates
compared to 17% (n = 15) of successfully discharged Waiver families and 0% (n = 0) of
unsuccessfully discharged Waiver families. However, 17% (n = 15) of successfully discharged
Waiver families with a CPS report during services may be inaccurate due to system limitations.
Referrals may not be counted in FACES for families with an open case.
18% (n = 14) of the matched families had a substantiated CPS report within 12 months
following discharge compared to 42% (n = 15) of successfully discharged Waiver families and
59% (n = 16) of unsuccessfully discharged Waiver families.
CFSA benchmark is that 90% of families will not have a substantiated report within 12 months
of initiation of Waiver services. HOMEBUILDERS® benchmark is that 75% of families will
not have a substantiated report during intervention. This benchmark has been met.
Unsuccessful discharged families were the most likely to have a substantiated CPS report within
12 months of enrollment (61%) and within 12 months following discharge (59%) when
Indicator n (%) Indicator Follow-up (n ) n (%) Follow-up (n ) n (%)
Families with a
substantiated CPS
report within 12
months of a matched
date of program
enrollment
16 (21%)
Families with a
substantiated CPS
report within 12
months of program
enrollment
41 22 (54%) 28 17 (61%)
Families with a
substantiated CPS
report during
matched service
dates
2 (3%)
Families with a
substantiated CPS
report during
services
N/A 15* (17%) N/A (0) 0%
Families with a
substantiated CPS
report within 12
months following
discharge
14 (18%)
Families with a
substantiated CPS
report within 12
months following
discharge
36 15 (42%) 27 (16) 59%
Waiver Sample
Unsuccessfully Discharged (includes
early closure)
n = 45
CFSA Benchmark: 90% of families will not have a substantiated report within 12 months of initiation of
Waiver services. HOMEBUILDERS Benchmark: 75% of families will not have a substantiated report during
the HOMEBUILDERS intervention.
* This number may be inaccurate as referrals may not be counted in FACES for families with an open case. This limitation is being explored. According
to the site visit reports, 6 families across the two sites had CPS reports (91.5% of families across the sites did not have new reports) and the HB standard
has been met for the two sites.
Pre-Waiver Matched Sample
n = 76
Waiver Sample
Successfully Discharged (complete)
n = 90
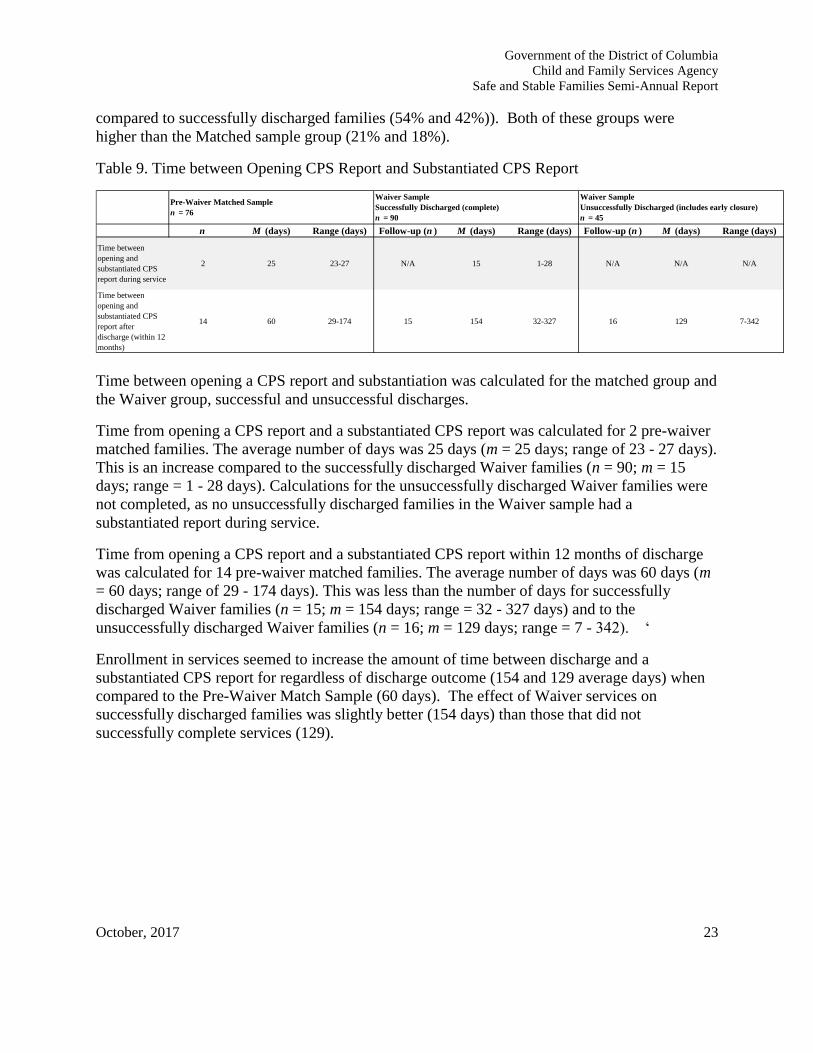
Government of the District of Columbia
Child and Family Services Agency
Safe and Stable Families Semi-Annual Report
October, 2017 23
compared to successfully discharged families (54% and 42%)). Both of these groups were
higher than the Matched sample group (21% and 18%).
Table 9. Time between Opening CPS Report and Substantiated CPS Report
Time between opening a CPS report and substantiation was calculated for the matched group and
the Waiver group, successful and unsuccessful discharges.
Time from opening a CPS report and a substantiated CPS report was calculated for 2 pre-waiver
matched families. The average number of days was 25 days (m = 25 days; range of 23 - 27 days).
This is an increase compared to the successfully discharged Waiver families (n = 90; m = 15
days; range = 1 - 28 days). Calculations for the unsuccessfully discharged Waiver families were
not completed, as no unsuccessfully discharged families in the Waiver sample had a
substantiated report during service.
Time from opening a CPS report and a substantiated CPS report within 12 months of discharge
was calculated for 14 pre-waiver matched families. The average number of days was 60 days (m
= 60 days; range of 29 - 174 days). This was less than the number of days for successfully
discharged Waiver families (n = 15; m = 154 days; range = 32 - 327 days) and to the
unsuccessfully discharged Waiver families (n = 16; m = 129 days; range = 7 - 342). ‘
Enrollment in services seemed to increase the amount of time between discharge and a
substantiated CPS report for regardless of discharge outcome (154 and 129 average days) when
compared to the Pre-Waiver Match Sample (60 days). The effect of Waiver services on
successfully discharged families was slightly better (154 days) than those that did not
successfully complete services (129).
n M (days) Range (days) Follow-up (n ) M (days) Range (days) Follow-up (n ) M (days) Range (days)
Time between
opening and
substantiated CPS
report during service
2 25 23-27 N/A 15 1-28 N/A N/A N/A
Time between
opening and
substantiated CPS
report after
discharge (within 12
months)
14 60 29-174 15 154 32-327 16 129 7-342
Waiver Sample
Successfully Discharged (complete)
n = 90
Waiver Sample
Unsuccessfully Discharged (includes early closure)
n = 45
Pre-Waiver Matched Sample
n = 76
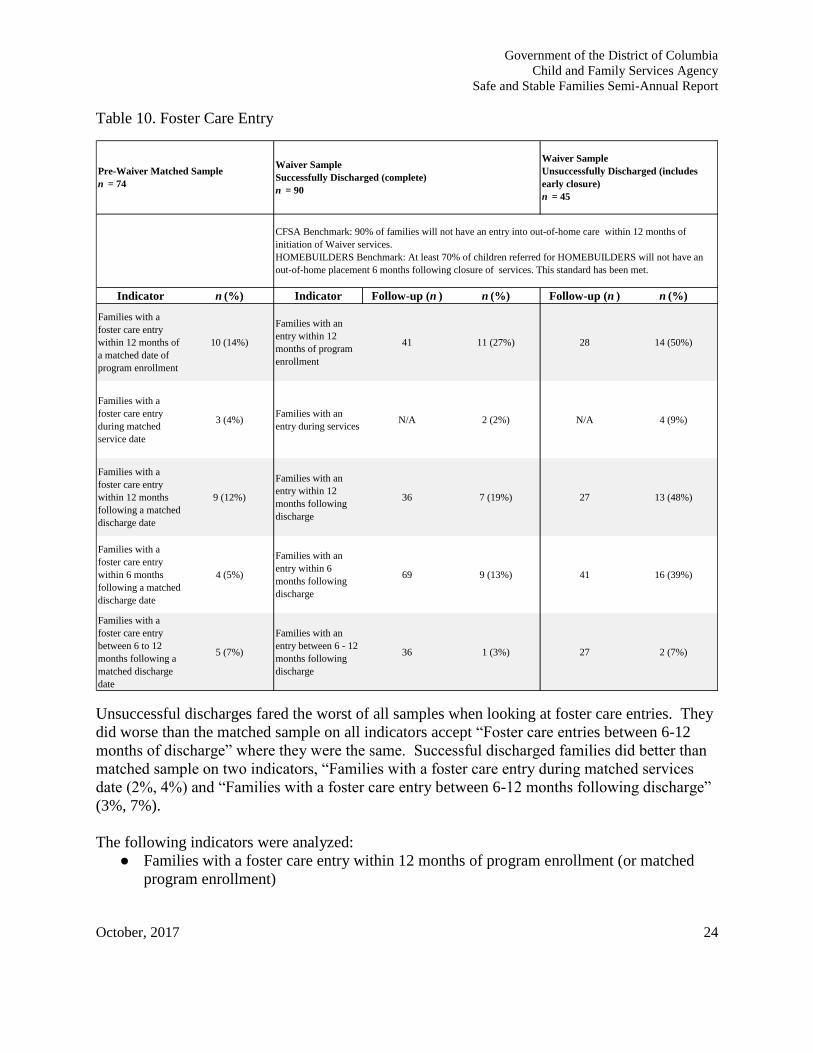
Government of the District of Columbia
Child and Family Services Agency
Safe and Stable Families Semi-Annual Report
October, 2017 24
Table 10. Foster Care Entry
Unsuccessful discharges fared the worst of all samples when looking at foster care entries. They
did worse than the matched sample on all indicators accept “Foster care entries between 6-12
months of discharge” where they were the same. Successful discharged families did better than
matched sample on two indicators, “Families with a foster care entry during matched services
date (2%, 4%) and “Families with a foster care entry between 6-12 months following discharge”
(3%, 7%).
The following indicators were analyzed:
● Families with a foster care entry within 12 months of program enrollment (or matched
program enrollment)
Indicator n (%) Indicator Follow-up (n ) n (%) Follow-up (n ) n (%)
Families with a
foster care entry
within 12 months of
a matched date of
program enrollment
10 (14%)
Families with an
entry within 12
months of program
enrollment
41 11 (27%) 28 14 (50%)
Families with a
foster care entry
during matched
service date
3 (4%)Families with an
entry during servicesN/A 2 (2%) N/A 4 (9%)
Families with a
foster care entry
within 12 months
following a matched
discharge date
9 (12%)
Families with an
entry within 12
months following
discharge
36 7 (19%) 27 13 (48%)
Families with a
foster care entry
within 6 months
following a matched
discharge date
4 (5%)
Families with an
entry within 6
months following
discharge
69 9 (13%) 41 16 (39%)
Families with a
foster care entry
between 6 to 12
months following a
matched discharge
date
5 (7%)
Families with an
entry between 6 - 12
months following
discharge
36 1 (3%) 27 2 (7%)
CFSA Benchmark: 90% of families will not have an entry into out-of-home care within 12 months of
initiation of Waiver services.
HOMEBUILDERS Benchmark: At least 70% of children referred for HOMEBUILDERS will not have an
out-of-home placement 6 months following closure of services. This standard has been met.
Pre-Waiver Matched Sample
n = 74
Waiver Sample
Successfully Discharged (complete)
n = 90
Waiver Sample
Unsuccessfully Discharged (includes
early closure)
n = 45
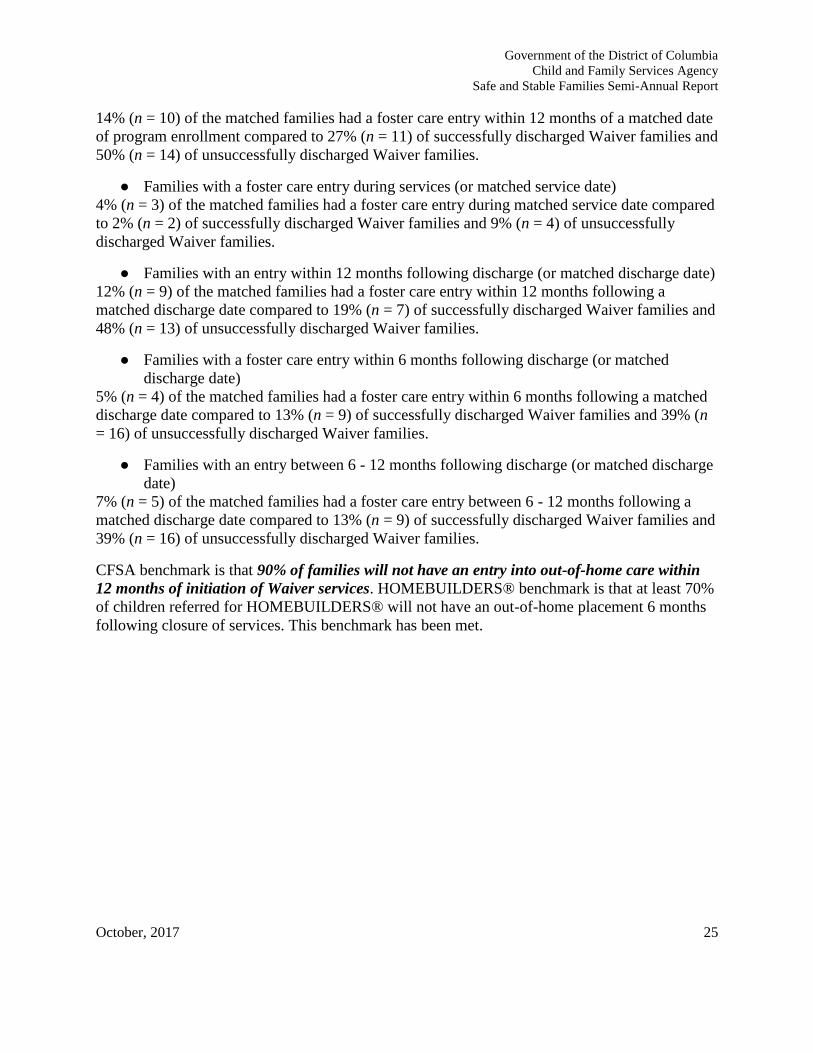
Government of the District of Columbia
Child and Family Services Agency
Safe and Stable Families Semi-Annual Report
October, 2017 25
14% (n = 10) of the matched families had a foster care entry within 12 months of a matched date
of program enrollment compared to 27% (n = 11) of successfully discharged Waiver families and
50% (n = 14) of unsuccessfully discharged Waiver families.
● Families with a foster care entry during services (or matched service date)
4% (n = 3) of the matched families had a foster care entry during matched service date compared
to 2% (n = 2) of successfully discharged Waiver families and 9% (n = 4) of unsuccessfully
discharged Waiver families.
● Families with an entry within 12 months following discharge (or matched discharge date)
12% (n = 9) of the matched families had a foster care entry within 12 months following a
matched discharge date compared to 19% (n = 7) of successfully discharged Waiver families and
48% (n = 13) of unsuccessfully discharged Waiver families.
● Families with a foster care entry within 6 months following discharge (or matched
discharge date)
5% (n = 4) of the matched families had a foster care entry within 6 months following a matched
discharge date compared to 13% (n = 9) of successfully discharged Waiver families and 39% (n
= 16) of unsuccessfully discharged Waiver families.
● Families with an entry between 6 - 12 months following discharge (or matched discharge
date)
7% (n = 5) of the matched families had a foster care entry between 6 - 12 months following a
matched discharge date compared to 13% (n = 9) of successfully discharged Waiver families and
39% (n = 16) of unsuccessfully discharged Waiver families.
CFSA benchmark is that 90% of families will not have an entry into out-of-home care within
12 months of initiation of Waiver services. HOMEBUILDERS® benchmark is that at least 70%
of children referred for HOMEBUILDERS® will not have an out-of-home placement 6 months
following closure of services. This benchmark has been met.
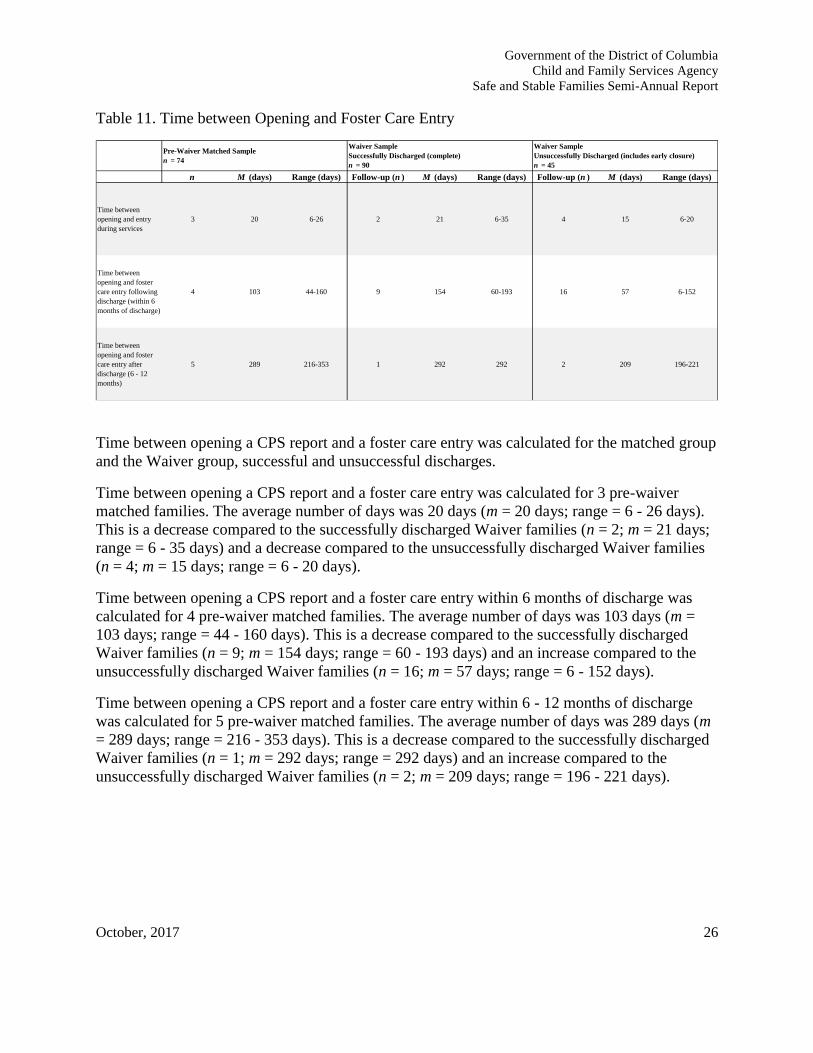
Government of the District of Columbia
Child and Family Services Agency
Safe and Stable Families Semi-Annual Report
October, 2017 26
Table 11. Time between Opening and Foster Care Entry
Time between opening a CPS report and a foster care entry was calculated for the matched group
and the Waiver group, successful and unsuccessful discharges.
Time between opening a CPS report and a foster care entry was calculated for 3 pre-waiver
matched families. The average number of days was 20 days (m = 20 days; range = 6 - 26 days).
This is a decrease compared to the successfully discharged Waiver families (n = 2; m = 21 days;
range = 6 - 35 days) and a decrease compared to the unsuccessfully discharged Waiver families
(n = 4; m = 15 days; range = 6 - 20 days).
Time between opening a CPS report and a foster care entry within 6 months of discharge was
calculated for 4 pre-waiver matched families. The average number of days was 103 days (m =
103 days; range = 44 - 160 days). This is a decrease compared to the successfully discharged
Waiver families (n = 9; m = 154 days; range = 60 - 193 days) and an increase compared to the
unsuccessfully discharged Waiver families (n = 16; m = 57 days; range = 6 - 152 days).
Time between opening a CPS report and a foster care entry within 6 - 12 months of discharge
was calculated for 5 pre-waiver matched families. The average number of days was 289 days (m
= 289 days; range = 216 - 353 days). This is a decrease compared to the successfully discharged
Waiver families (n = 1; m = 292 days; range = 292 days) and an increase compared to the
unsuccessfully discharged Waiver families (n = 2; m = 209 days; range = 196 - 221 days).
n M (days) Range (days) Follow-up (n ) M (days) Range (days) Follow-up (n ) M (days) Range (days)
Time between
opening and entry
during services
3 20 6-26 2 21 6-35 4 15 6-20
Time between
opening and foster
care entry following
discharge (within 6
months of discharge)
4 103 44-160 9 154 60-193 16 57 6-152
Time between
opening and foster
care entry after
discharge (6 - 12
months)
5 289 216-353 1 292 292 2 209 196-221
Pre-Waiver Matched Sample
n = 74
Waiver Sample
Successfully Discharged (complete)
n = 90
Waiver Sample
Unsuccessfully Discharged (includes early closure)
n = 45
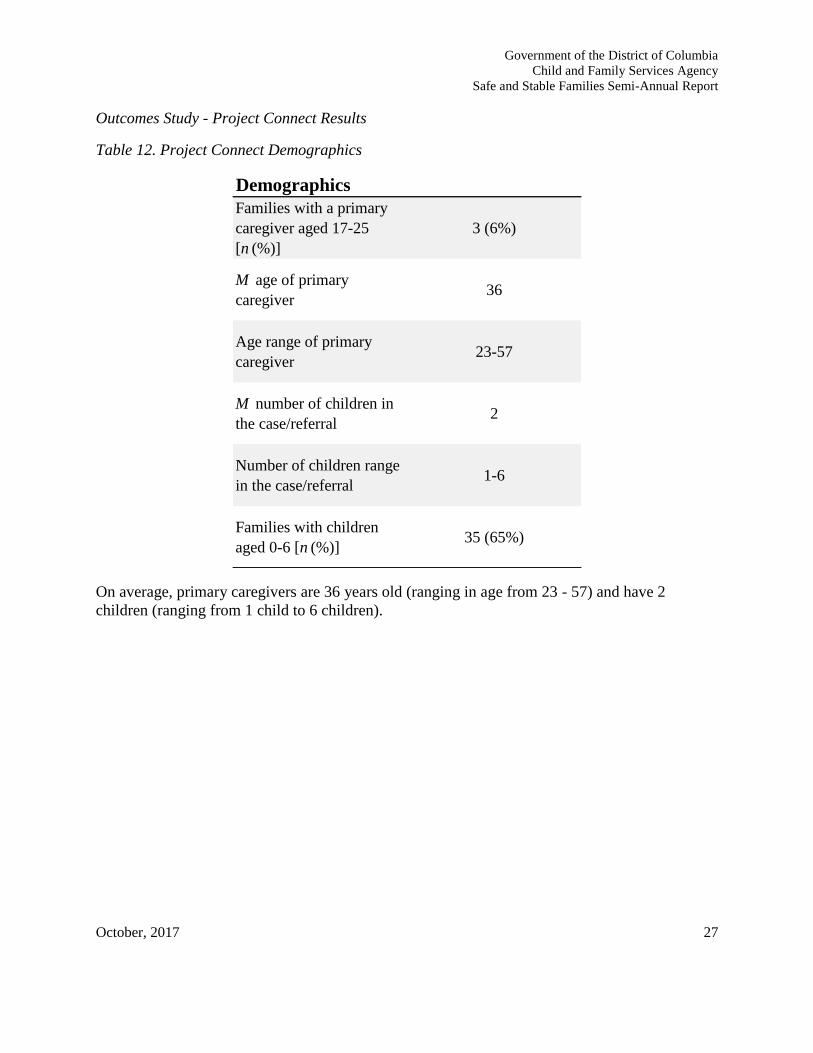
Government of the District of Columbia
Child and Family Services Agency
Safe and Stable Families Semi-Annual Report
October, 2017 27
Outcomes Study - Project Connect Results
Table 12. Project Connect Demographics
On average, primary caregivers are 36 years old (ranging in age from 23 - 57) and have 2
children (ranging from 1 child to 6 children).
Families with a primary
caregiver aged 17-25
[n (%)]
3 (6%)
M age of primary
caregiver36
Age range of primary
caregiver23-57
M number of children in
the case/referral2
Number of children range
in the case/referral1-6
Families with children
aged 0-6 [n (%)]35 (65%)
Demographics
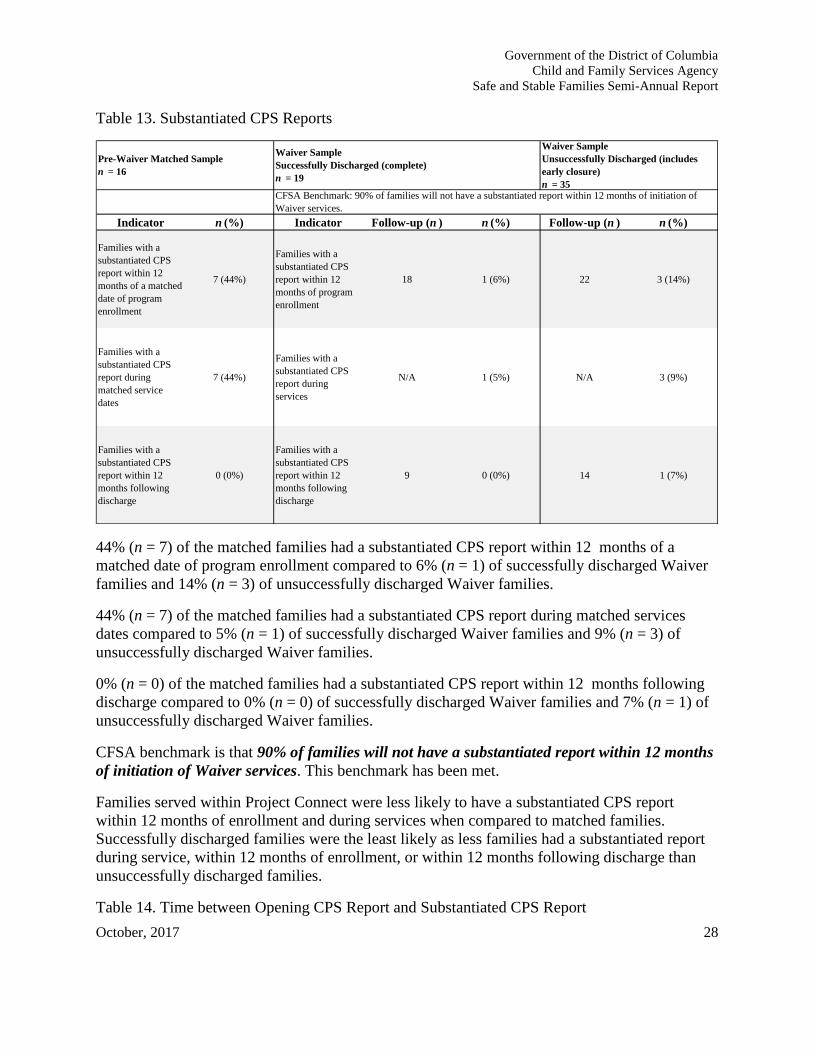
Government of the District of Columbia
Child and Family Services Agency
Safe and Stable Families Semi-Annual Report
October, 2017 28
Table 13. Substantiated CPS Reports
44% (n = 7) of the matched families had a substantiated CPS report within 12 months of a
matched date of program enrollment compared to 6% (n = 1) of successfully discharged Waiver
families and 14% (n = 3) of unsuccessfully discharged Waiver families.
44% (n = 7) of the matched families had a substantiated CPS report during matched services
dates compared to 5% (n = 1) of successfully discharged Waiver families and 9% (n = 3) of
unsuccessfully discharged Waiver families.
0% (n = 0) of the matched families had a substantiated CPS report within 12 months following
discharge compared to 0% (n = 0) of successfully discharged Waiver families and 7% (n = 1) of
unsuccessfully discharged Waiver families.
CFSA benchmark is that 90% of families will not have a substantiated report within 12 months
of initiation of Waiver services. This benchmark has been met.
Families served within Project Connect were less likely to have a substantiated CPS report
within 12 months of enrollment and during services when compared to matched families.
Successfully discharged families were the least likely as less families had a substantiated report
during service, within 12 months of enrollment, or within 12 months following discharge than
unsuccessfully discharged families.
Table 14. Time between Opening CPS Report and Substantiated CPS Report
Indicator n (%) Indicator Follow-up (n ) n (%) Follow-up (n ) n (%)
Families with a
substantiated CPS
report within 12
months of a matched
date of program
enrollment
7 (44%)
Families with a
substantiated CPS
report within 12
months of program
enrollment
18 1 (6%) 22 3 (14%)
Families with a
substantiated CPS
report during
matched service
dates
7 (44%)
Families with a
substantiated CPS
report during
services
N/A 1 (5%) N/A 3 (9%)
Families with a
substantiated CPS
report within 12
months following
discharge
0 (0%)
Families with a
substantiated CPS
report within 12
months following
discharge
9 0 (0%) 14 1 (7%)
Waiver Sample
Unsuccessfully Discharged (includes
early closure)
n = 35CFSA Benchmark: 90% of families will not have a substantiated report within 12 months of initiation of
Waiver services.
Pre-Waiver Matched Sample
n = 16
Waiver Sample
Successfully Discharged (complete)
n = 19
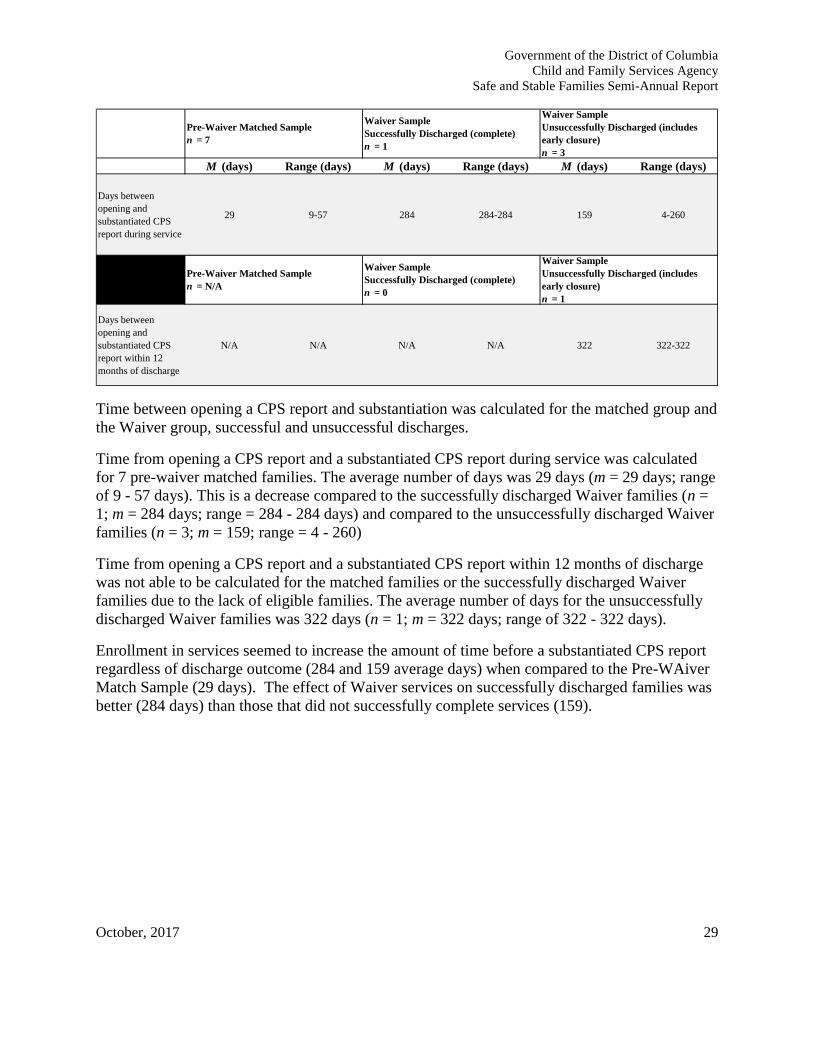
Government of the District of Columbia
Child and Family Services Agency
Safe and Stable Families Semi-Annual Report
October, 2017 29
Time between opening a CPS report and substantiation was calculated for the matched group and
the Waiver group, successful and unsuccessful discharges.
Time from opening a CPS report and a substantiated CPS report during service was calculated
for 7 pre-waiver matched families. The average number of days was 29 days (m = 29 days; range
of 9 - 57 days). This is a decrease compared to the successfully discharged Waiver families (n =
1; m = 284 days; range = 284 - 284 days) and compared to the unsuccessfully discharged Waiver
families (n = 3; m = 159; range = 4 - 260)
Time from opening a CPS report and a substantiated CPS report within 12 months of discharge
was not able to be calculated for the matched families or the successfully discharged Waiver
families due to the lack of eligible families. The average number of days for the unsuccessfully
discharged Waiver families was 322 days (n = 1; m = 322 days; range of 322 - 322 days).
Enrollment in services seemed to increase the amount of time before a substantiated CPS report
regardless of discharge outcome (284 and 159 average days) when compared to the Pre-WAiver
Match Sample (29 days). The effect of Waiver services on successfully discharged families was
better (284 days) than those that did not successfully complete services (159).
M (days) Range (days) M (days) Range (days) M (days) Range (days)
Days between
opening and
substantiated CPS
report during service
29 9-57 284 284-284 159 4-260
Days between
opening and
substantiated CPS
report within 12
months of discharge
N/A N/A N/A N/A 322 322-322
Waiver Sample
Successfully Discharged (complete)
n = 0
Waiver Sample
Successfully Discharged (complete)
n = 1
Waiver Sample
Unsuccessfully Discharged (includes
early closure)
n = 1
Waiver Sample
Unsuccessfully Discharged (includes
early closure)
n = 3
Pre-Waiver Matched Sample
n = 7
Pre-Waiver Matched Sample
n = N/A
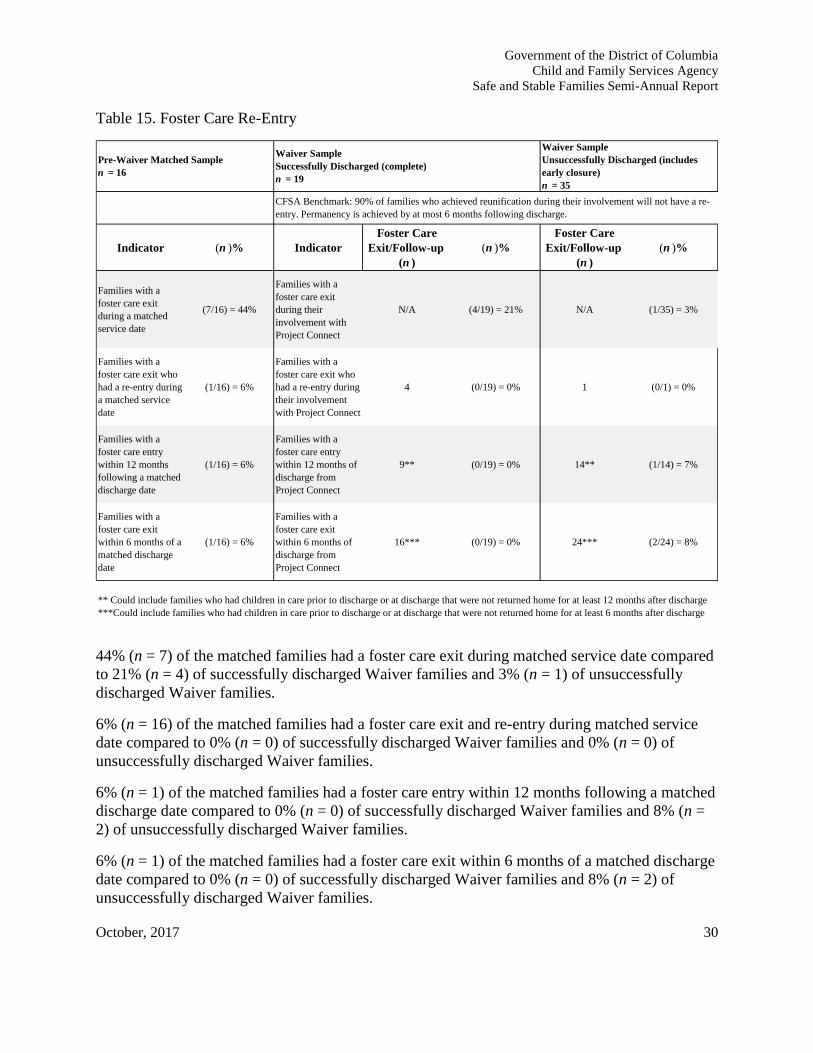
Government of the District of Columbia
Child and Family Services Agency
Safe and Stable Families Semi-Annual Report
October, 2017 30
Table 15. Foster Care Re-Entry
44% (n = 7) of the matched families had a foster care exit during matched service date compared
to 21% (n = 4) of successfully discharged Waiver families and 3% (n = 1) of unsuccessfully
discharged Waiver families.
6% (n = 16) of the matched families had a foster care exit and re-entry during matched service
date compared to 0% (n = 0) of successfully discharged Waiver families and 0% (n = 0) of
unsuccessfully discharged Waiver families.
6% (n = 1) of the matched families had a foster care entry within 12 months following a matched
discharge date compared to 0% (n = 0) of successfully discharged Waiver families and 8% (n =
2) of unsuccessfully discharged Waiver families.
6% (n = 1) of the matched families had a foster care exit within 6 months of a matched discharge
date compared to 0% (n = 0) of successfully discharged Waiver families and 8% (n = 2) of
unsuccessfully discharged Waiver families.
Indicator (n )% Indicator
Foster Care
Exit/Follow-up
(n )
(n )%
Foster Care
Exit/Follow-up
(n )
(n )%
Families with a
foster care exit
during a matched
service date
(7/16) = 44%
Families with a
foster care exit
during their
involvement with
Project Connect
N/A (4/19) = 21% N/A (1/35) = 3%
Families with a
foster care exit who
had a re-entry during
a matched service
date
(1/16) = 6%
Families with a
foster care exit who
had a re-entry during
their involvement
with Project Connect
4 (0/19) = 0% 1 (0/1) = 0%
Families with a
foster care entry
within 12 months
following a matched
discharge date
(1/16) = 6%
Families with a
foster care entry
within 12 months of
discharge from
Project Connect
9** (0/19) = 0% 14** (1/14) = 7%
Families with a
foster care exit
within 6 months of a
matched discharge
date
(1/16) = 6%
Families with a
foster care exit
within 6 months of
discharge from
Project Connect
16*** (0/19) = 0% 24*** (2/24) = 8%
** Could include families who had children in care prior to discharge or at discharge that were not returned home for at least 12 months after discharge
***Could include families who had children in care prior to discharge or at discharge that were not returned home for at least 6 months after discharge
Pre-Waiver Matched Sample
n = 16
Waiver Sample
Successfully Discharged (complete)
n = 19
Waiver Sample
Unsuccessfully Discharged (includes
early closure)
n = 35
CFSA Benchmark: 90% of families who achieved reunification during their involvement will not have a re-
entry. Permanency is achieved by at most 6 months following discharge.
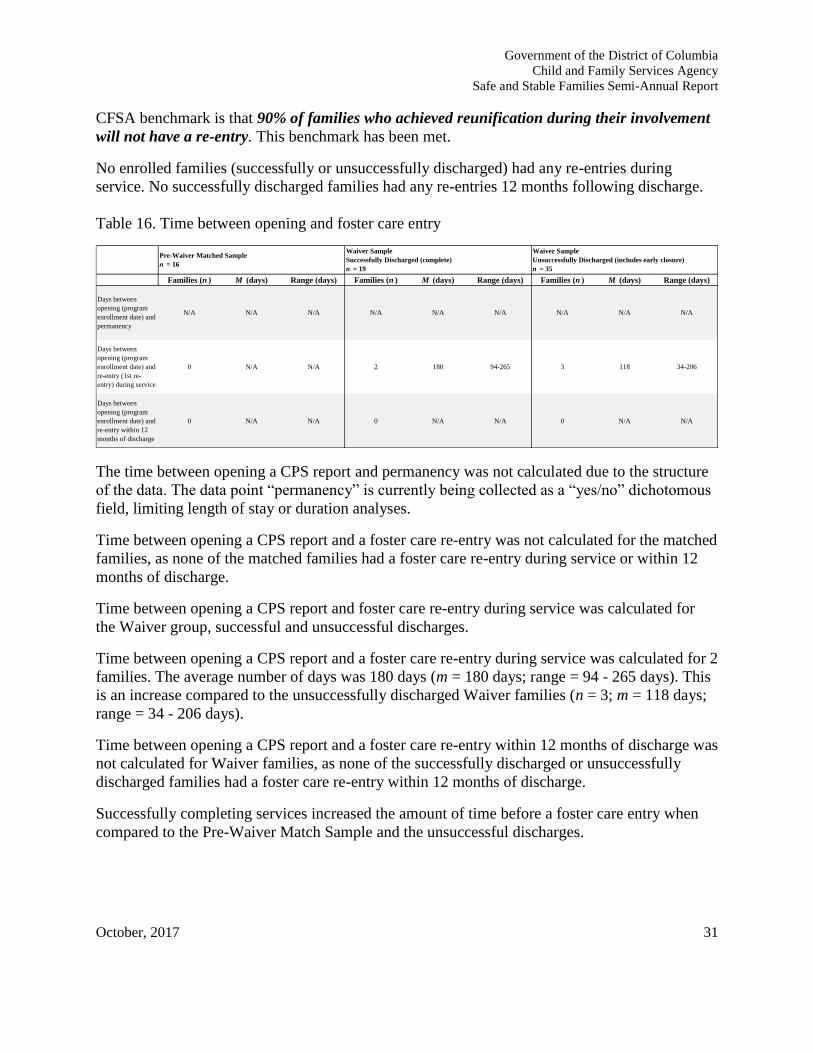
Government of the District of Columbia
Child and Family Services Agency
Safe and Stable Families Semi-Annual Report
October, 2017 31
CFSA benchmark is that 90% of families who achieved reunification during their involvement
will not have a re-entry. This benchmark has been met.
No enrolled families (successfully or unsuccessfully discharged) had any re-entries during
service. No successfully discharged families had any re-entries 12 months following discharge.
Table 16. Time between opening and foster care entry
The time between opening a CPS report and permanency was not calculated due to the structure
of the data. The data point “permanency” is currently being collected as a “yes/no” dichotomous
field, limiting length of stay or duration analyses.
Time between opening a CPS report and a foster care re-entry was not calculated for the matched
families, as none of the matched families had a foster care re-entry during service or within 12
months of discharge.
Time between opening a CPS report and foster care re-entry during service was calculated for
the Waiver group, successful and unsuccessful discharges.
Time between opening a CPS report and a foster care re-entry during service was calculated for 2
families. The average number of days was 180 days (m = 180 days; range = 94 - 265 days). This
is an increase compared to the unsuccessfully discharged Waiver families (n = 3; m = 118 days;
range = 34 - 206 days).
Time between opening a CPS report and a foster care re-entry within 12 months of discharge was
not calculated for Waiver families, as none of the successfully discharged or unsuccessfully
discharged families had a foster care re-entry within 12 months of discharge.
Successfully completing services increased the amount of time before a foster care entry when
compared to the Pre-Waiver Match Sample and the unsuccessful discharges.
Families (n ) M (days) Range (days) Families (n ) M (days) Range (days) Families (n ) M (days) Range (days)
Days between
opening (program
enrollment date) and
permanency
N/A N/A N/A N/A N/A N/A N/A N/A N/A
Days between
opening (program
enrollment date) and
re-entry (1st re-
entry) during service
0 N/A N/A 2 180 94-265 3 118 34-206
Days between
opening (program
enrollment date) and
re-entry within 12
months of discharge
0 N/A N/A 0 N/A N/A 0 N/A N/A
Pre-Waiver Matched Sample
n = 16
Waiver Sample
Successfully Discharged (complete)
n = 19
Waiver Sample
Unsuccessfully Discharged (includes early closure)
n = 35

Government of the District of Columbia
Child and Family Services Agency
Safe and Stable Families Semi-Annual Report
October, 2017 32
B. Family Functioning Outcomes
Family Functioning - North Carolina Functional Assessment Scale (NCFAS) - Project Connect
and HOMEBUILDERS®
The North Carolina Family Assessment Scales (NCFAS) is administered by
HOMEBUILDERS® at enrollment and at discharge to determine how a family is functioning on
various domains. The NCFAS is only administered to families who were “completed.” The
NCFAS is comprised of the following five domains: Environment, Parental Capabilities, Family
Interactions, Family Safety, and Child Well-Being. Each domain is assessed to be essential or
nonessential for children to remain in the home or to prevent placement. Almost all eligible
families should have Family Safety or Parental Capability as essential for safety or for the child
to remain in the home (i.e., essential for improvement). Each domain includes five to seven
individually rated items as well as an overall score for that domain. The domain and subscales
are scored as a strength or problem for the family along a six point continuum using the
following scale: +2 Clear Strength and +1 Mild Strength (Positive Range), 0 Baseline/Adequate
(Baseline), -1 Mild Problem, -2 Moderate Problem, and -3 Serious Problem (Negative Range).
The overall score for that domain is not an average of the subscales. Rather, the subscales are
used to inform the decision to rate an overall domain score.
The North Carolina Family Assessment Scale for General Services and Reunification (NCFAS G
+ R) is administered by Project Connect 6 weeks after enrollment, every 90 days thereafter1, and
at discharge, to determine how a family is functioning on various domains. The NCFAS G + R
includes the original five NCFAS domains (i.e., Environment, Parental Capabilities, Family
Interactions, Family Safety, Child Well-Being), two additional domains focusing on
reunification (i.e., Caregiver/Child Ambivalence, Readiness for Reunification), and three
additional general family assessment domains (i.e., Social/Community Life, Self-Sufficiency,
Family Health). Each domain includes five to seven individually rated items as well as an
overall score for that domain. The domain and subscales are scored as a strength or problem for
the family along a six point continuum using the following scale: +2 Clear Strength and +1 Mild
Strength (Positive Range), 0 Baseline/Adequate (Baseline), -1 Mild Problem, -2 Moderate
Problem, and -3 Serious Problem (Negative Range). The overall score for that domain is not an
average of the subscales. Rather, the subscales are used to inform the decision to rate an overall
domain score. Unlike HOMEBUILDERS®, Project Connect does not deem specific NCFAS
domains as essential for improvement.
HOMEBUILDERS® NCFAS findings
Ninety-five (95) of the 97 families who completed HOMEBUILDERS® had a NCFAS
administered at baseline and discharge. NCFAS baseline and discharge domain scores were
individually calculated for the essential for safety or for the child to remain in the home (i.e.,
1 The addition of the ongoing 90 day assessment began in FY 2017. No closed families will have these additional
assessments at this point.
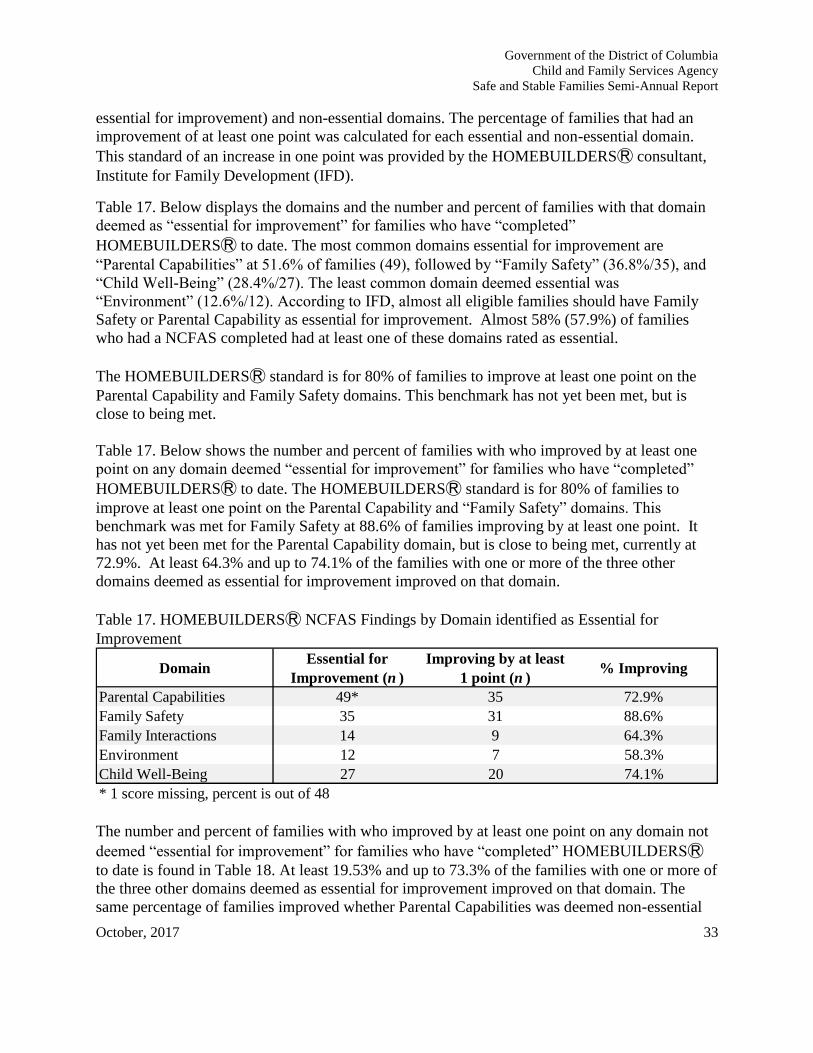
Government of the District of Columbia
Child and Family Services Agency
Safe and Stable Families Semi-Annual Report
October, 2017 33
essential for improvement) and non-essential domains. The percentage of families that had an
improvement of at least one point was calculated for each essential and non-essential domain.
This standard of an increase in one point was provided by the HOMEBUILDERSⓇ consultant,
Institute for Family Development (IFD).
Table 17. Below displays the domains and the number and percent of families with that domain
deemed as “essential for improvement” for families who have “completed”
HOMEBUILDERSⓇ to date. The most common domains essential for improvement are
“Parental Capabilities” at 51.6% of families (49), followed by “Family Safety” (36.8%/35), and
“Child Well-Being” (28.4%/27). The least common domain deemed essential was
“Environment” (12.6%/12). According to IFD, almost all eligible families should have Family
Safety or Parental Capability as essential for improvement. Almost 58% (57.9%) of families
who had a NCFAS completed had at least one of these domains rated as essential.
The HOMEBUILDERSⓇ standard is for 80% of families to improve at least one point on the
Parental Capability and Family Safety domains. This benchmark has not yet been met, but is
close to being met.
Table 17. Below shows the number and percent of families with who improved by at least one
point on any domain deemed “essential for improvement” for families who have “completed”
HOMEBUILDERSⓇ to date. The HOMEBUILDERSⓇ standard is for 80% of families to
improve at least one point on the Parental Capability and “Family Safety” domains. This
benchmark was met for Family Safety at 88.6% of families improving by at least one point. It
has not yet been met for the Parental Capability domain, but is close to being met, currently at
72.9%. At least 64.3% and up to 74.1% of the families with one or more of the three other
domains deemed as essential for improvement improved on that domain.
Table 17. HOMEBUILDERSⓇ NCFAS Findings by Domain identified as Essential for
Improvement
The number and percent of families with who improved by at least one point on any domain not
deemed “essential for improvement” for families who have “completed” HOMEBUILDERSⓇ
to date is found in Table 18. At least 19.53% and up to 73.3% of the families with one or more of
the three other domains deemed as essential for improvement improved on that domain. The
same percentage of families improved whether Parental Capabilities was deemed non-essential
DomainEssential for
Improvement (n )
Improving by at least
1 point (n )% Improving
Parental Capabilities 49* 35 72.9%
Family Safety 35 31 88.6%
Family Interactions 14 9 64.3%
Environment 12 7 58.3%
Child Well-Being 27 20 74.1%
* 1 score missing, percent is out of 48
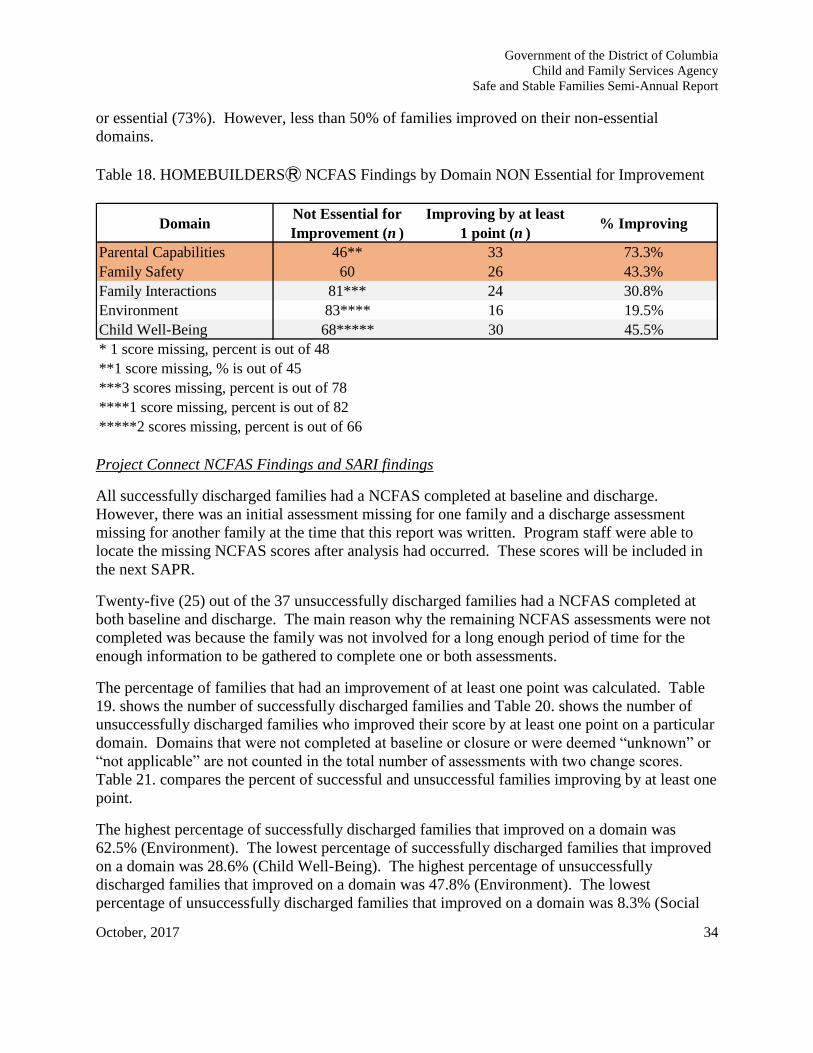
Government of the District of Columbia
Child and Family Services Agency
Safe and Stable Families Semi-Annual Report
October, 2017 34
or essential (73%). However, less than 50% of families improved on their non-essential
domains.
Table 18. HOMEBUILDERSⓇ NCFAS Findings by Domain NON Essential for Improvement
Project Connect NCFAS Findings and SARI findings
All successfully discharged families had a NCFAS completed at baseline and discharge.
However, there was an initial assessment missing for one family and a discharge assessment
missing for another family at the time that this report was written. Program staff were able to
locate the missing NCFAS scores after analysis had occurred. These scores will be included in
the next SAPR.
Twenty-five (25) out of the 37 unsuccessfully discharged families had a NCFAS completed at
both baseline and discharge. The main reason why the remaining NCFAS assessments were not
completed was because the family was not involved for a long enough period of time for the
enough information to be gathered to complete one or both assessments.
The percentage of families that had an improvement of at least one point was calculated. Table
19. shows the number of successfully discharged families and Table 20. shows the number of
unsuccessfully discharged families who improved their score by at least one point on a particular
domain. Domains that were not completed at baseline or closure or were deemed “unknown” or
“not applicable” are not counted in the total number of assessments with two change scores.
Table 21. compares the percent of successful and unsuccessful families improving by at least one
point.
The highest percentage of successfully discharged families that improved on a domain was
62.5% (Environment). The lowest percentage of successfully discharged families that improved
on a domain was 28.6% (Child Well-Being). The highest percentage of unsuccessfully
discharged families that improved on a domain was 47.8% (Environment). The lowest
percentage of unsuccessfully discharged families that improved on a domain was 8.3% (Social
DomainNot Essential for
Improvement (n )
Improving by at least
1 point (n )% Improving
Parental Capabilities 46** 33 73.3%
Family Safety 60 26 43.3%
Family Interactions 81*** 24 30.8%
Environment 83**** 16 19.5%
Child Well-Being 68***** 30 45.5%
* 1 score missing, percent is out of 48
**1 score missing, % is out of 45
***3 scores missing, percent is out of 78
****1 score missing, percent is out of 82
*****2 scores missing, percent is out of 66
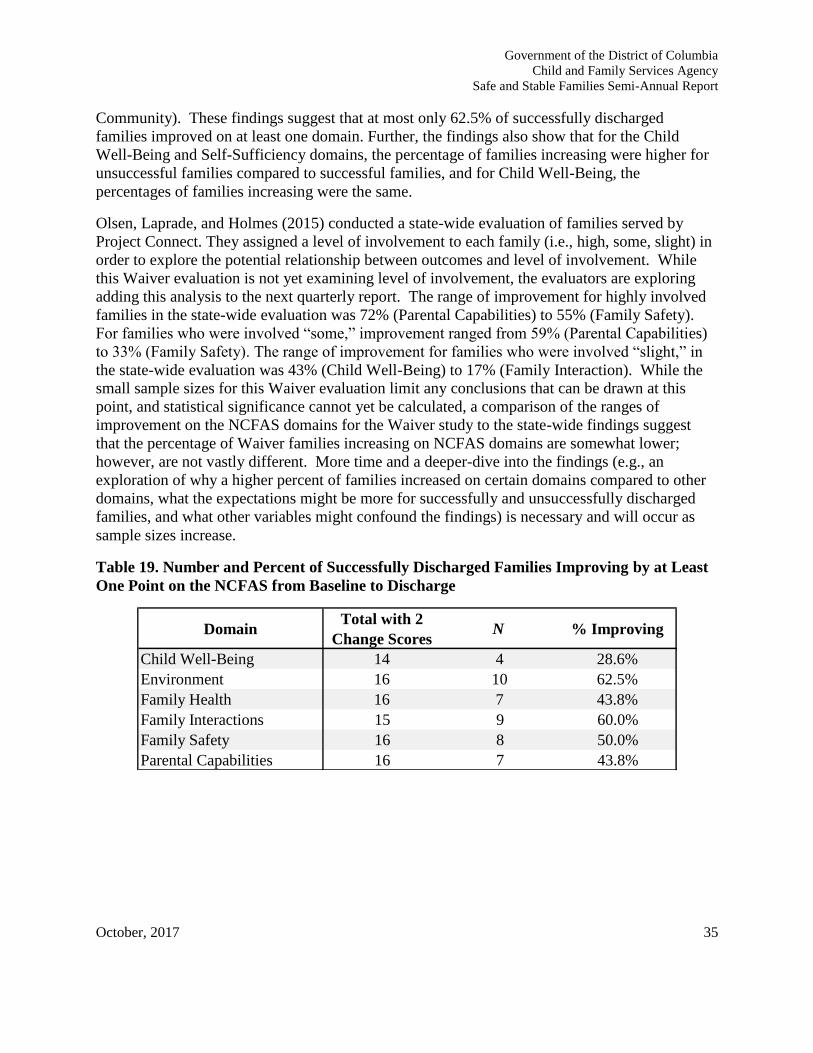
Government of the District of Columbia
Child and Family Services Agency
Safe and Stable Families Semi-Annual Report
October, 2017 35
Community). These findings suggest that at most only 62.5% of successfully discharged
families improved on at least one domain. Further, the findings also show that for the Child
Well-Being and Self-Sufficiency domains, the percentage of families increasing were higher for
unsuccessful families compared to successful families, and for Child Well-Being, the
percentages of families increasing were the same.
Olsen, Laprade, and Holmes (2015) conducted a state-wide evaluation of families served by
Project Connect. They assigned a level of involvement to each family (i.e., high, some, slight) in
order to explore the potential relationship between outcomes and level of involvement. While
this Waiver evaluation is not yet examining level of involvement, the evaluators are exploring
adding this analysis to the next quarterly report. The range of improvement for highly involved
families in the state-wide evaluation was 72% (Parental Capabilities) to 55% (Family Safety).
For families who were involved “some,” improvement ranged from 59% (Parental Capabilities)
to 33% (Family Safety). The range of improvement for families who were involved “slight,” in
the state-wide evaluation was 43% (Child Well-Being) to 17% (Family Interaction). While the
small sample sizes for this Waiver evaluation limit any conclusions that can be drawn at this
point, and statistical significance cannot yet be calculated, a comparison of the ranges of
improvement on the NCFAS domains for the Waiver study to the state-wide findings suggest
that the percentage of Waiver families increasing on NCFAS domains are somewhat lower;
however, are not vastly different. More time and a deeper-dive into the findings (e.g., an
exploration of why a higher percent of families increased on certain domains compared to other
domains, what the expectations might be more for successfully and unsuccessfully discharged
families, and what other variables might confound the findings) is necessary and will occur as
sample sizes increase.
Table 19. Number and Percent of Successfully Discharged Families Improving by at Least
One Point on the NCFAS from Baseline to Discharge
DomainTotal with 2
Change ScoresN % Improving
Child Well-Being 14 4 28.6%
Environment 16 10 62.5%
Family Health 16 7 43.8%
Family Interactions 15 9 60.0%
Family Safety 16 8 50.0%
Parental Capabilities 16 7 43.8%
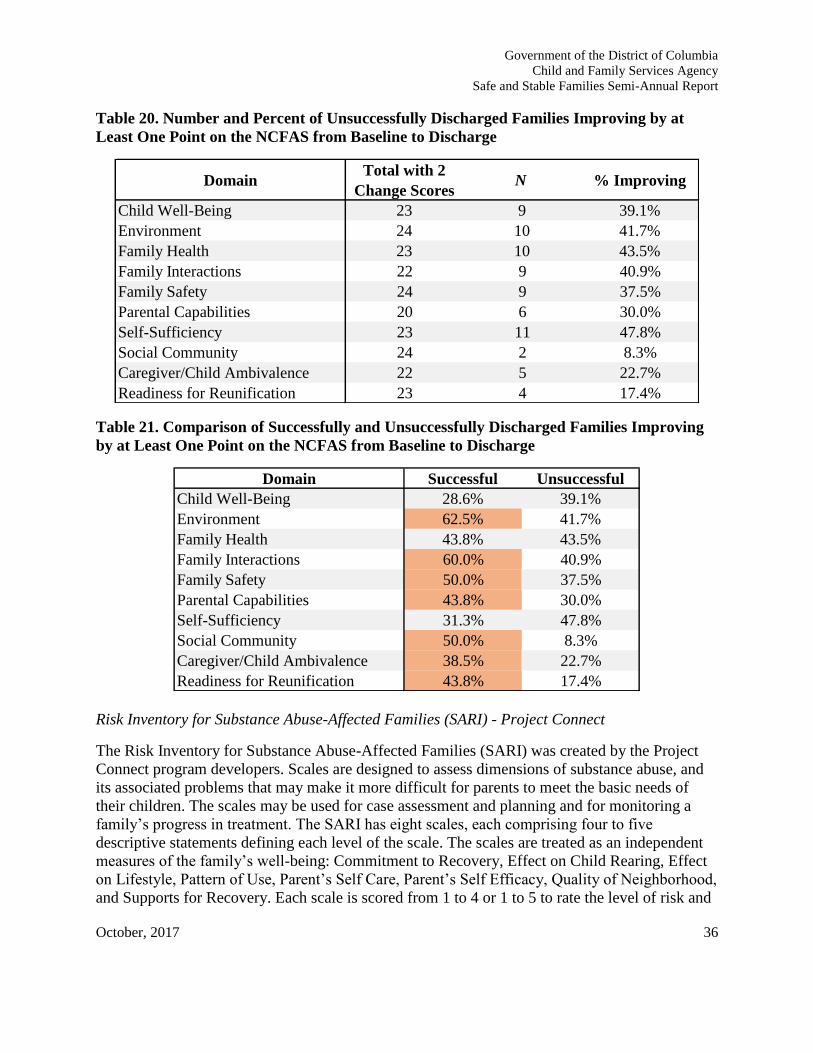
Government of the District of Columbia
Child and Family Services Agency
Safe and Stable Families Semi-Annual Report
October, 2017 36
Table 20. Number and Percent of Unsuccessfully Discharged Families Improving by at
Least One Point on the NCFAS from Baseline to Discharge
Table 21. Comparison of Successfully and Unsuccessfully Discharged Families Improving
by at Least One Point on the NCFAS from Baseline to Discharge
Risk Inventory for Substance Abuse-Affected Families (SARI) - Project Connect
The Risk Inventory for Substance Abuse-Affected Families (SARI) was created by the Project
Connect program developers. Scales are designed to assess dimensions of substance abuse, and
its associated problems that may make it more difficult for parents to meet the basic needs of
their children. The scales may be used for case assessment and planning and for monitoring a
family’s progress in treatment. The SARI has eight scales, each comprising four to five
descriptive statements defining each level of the scale. The scales are treated as an independent
measures of the family’s well-being: Commitment to Recovery, Effect on Child Rearing, Effect
on Lifestyle, Pattern of Use, Parent’s Self Care, Parent’s Self Efficacy, Quality of Neighborhood,
and Supports for Recovery. Each scale is scored from 1 to 4 or 1 to 5 to rate the level of risk and
DomainTotal with 2
Change ScoresN % Improving
Child Well-Being 23 9 39.1%
Environment 24 10 41.7%
Family Health 23 10 43.5%
Family Interactions 22 9 40.9%
Family Safety 24 9 37.5%
Parental Capabilities 20 6 30.0%
Self-Sufficiency 23 11 47.8%
Social Community 24 2 8.3%
Caregiver/Child Ambivalence 22 5 22.7%
Readiness for Reunification 23 4 17.4%
Domain Successful Unsuccessful
Child Well-Being 28.6% 39.1%
Environment 62.5% 41.7%
Family Health 43.8% 43.5%
Family Interactions 60.0% 40.9%
Family Safety 50.0% 37.5%
Parental Capabilities 43.8% 30.0%
Self-Sufficiency 31.3% 47.8%
Social Community 50.0% 8.3%
Caregiver/Child Ambivalence 38.5% 22.7%
Readiness for Reunification 43.8% 17.4%
Government of the District of Columbia
Child and Family Services Agency
Safe and Stable Families Semi-Annual Report
October, 2017 37
incapacity for the family based on general patterns observed by staff at the point of rating, not on
isolated or extreme occurrences. The score values 1 to 4 or 1 to 5 represent a customized set of
descriptions for each scale. The descriptive statements are used to inform an overall score for
each of the eight scales. The desirable outcome is for the family to move to a lower value on the
scale, ultimately reaching a score of 1 or 2. Sometimes it may not be possible to rate each scale.
For example, it the children have been removed from the home, the “not applicable” category
should be used on the Effect on Child Rearing scale. The scales are designed to be completed by
the staff responsible for that family after they have completed their initial assessment of the
family and collected all relevant data needed for case planning. Periodic scoring thereafter will
allow providers to monitor the family’s progress.
All but one of the successfully discharged families had a SARI completed at baseline and
discharge. Sixteen (16) out of the 37 unsuccessfully discharged families had both scores
completed at discharge. SARIs are also completed on a secondary caregiver if the secondary
caregiver is an active part of Project Connect. Four successfully discharged families had a
baseline and discharge SARI completed on a secondary caregiver; however, the change scores
were usable for only three families given that many scores were deemed unknown for one of the
families. Seven unsuccessfully discharged families had a baseline and discharge SARI
completed on a secondary caregiver; however, many change scores could not be completed on
all families because many of the scores were deemed “not applicable.” Change scores were
calculated for each domain when the baseline and discharge scores were available, and were not
deemed “not applicable” or “unavailable.”
A decrease in SARI scores is indicative of reduced risk. Table 22. below shows the number and
percent of successfully discharged families who had a decreased change score of at least one
point, indicating reduced risk on that scale. The scales with the highest percent of reduced risk
for successfully discharged families who had those scales completed were Self-Efficacy and
Support for Recovery, both at 50.0%. The scale with the lowest percent of successfully
discharged families indicating a decreased risk was Commitment to Recovery at 11.1% of
families. For unsuccessfully discharged families, the scale with the highest percentage of
families showing decreased risk was Quality of Neighborhood at 33.3%. No families showed
decreased risk on the Support for Recovery scale. When compared to the Olsen, Laprade, and
Holmes (2015) state-wide evaluation of families served by Project Connect mentioned in the
Project Connect NCFAS findings above, the range of improvement for highly involved families
in the state-wide evaluation was 72% (Parental Capabilities) to 55% (Family Safety), from 39%
(Quality of Neighborhood) to 54% (Effect on Child Rearing) for families who were involved
“some” and 27% (Effect on Child Rearing) to 40% (Effect on Lifestyle) for slightly involved
families. As mentioned in the NCFAS findings described above, a direct comparison from this
Waiver’s findings to the statewide findings cannot be made; however, a comparison can explore
how this Waiver’s families may be faring compared to other families who have completed
Project Connect, and may identify where this Waiver’s demonstration may need to focus its
efforts regarding the achievement of outcomes. For example, the percentage of families
improving on the SARI for Waiver families does not exceed 57%, and does not dip below 27%.
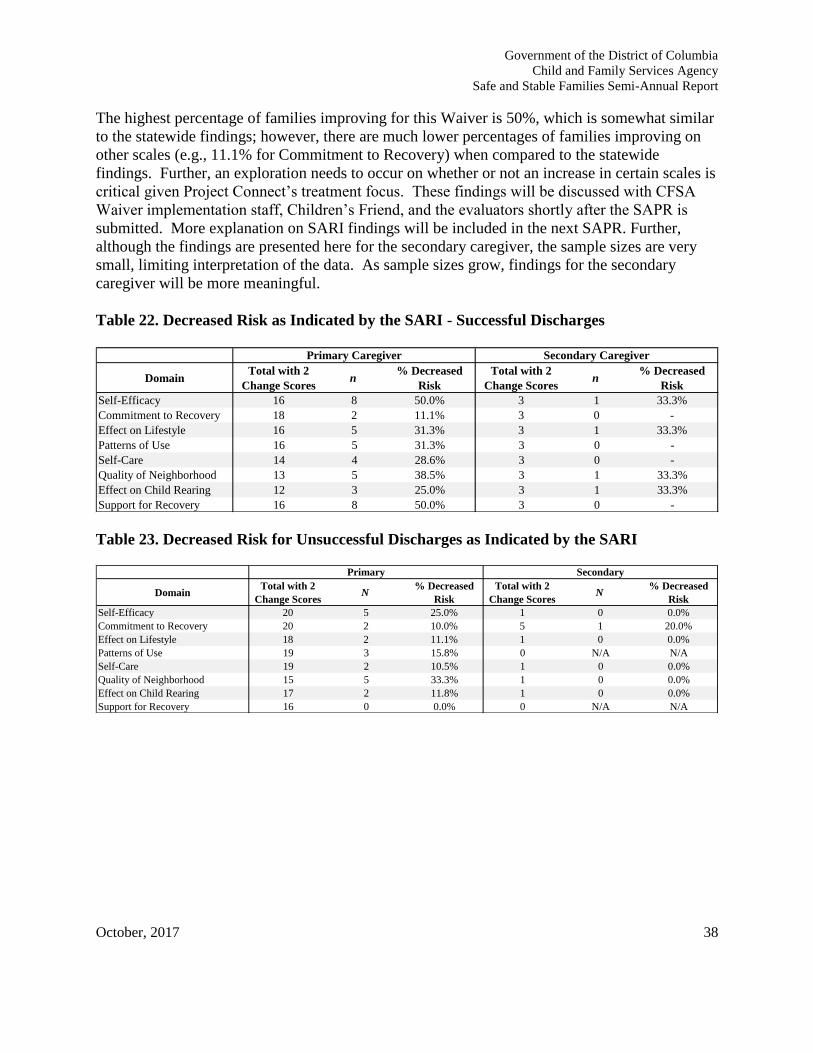
Government of the District of Columbia
Child and Family Services Agency
Safe and Stable Families Semi-Annual Report
October, 2017 38
The highest percentage of families improving for this Waiver is 50%, which is somewhat similar
to the statewide findings; however, there are much lower percentages of families improving on
other scales (e.g., 11.1% for Commitment to Recovery) when compared to the statewide
findings. Further, an exploration needs to occur on whether or not an increase in certain scales is
critical given Project Connect’s treatment focus. These findings will be discussed with CFSA
Waiver implementation staff, Children’s Friend, and the evaluators shortly after the SAPR is
submitted. More explanation on SARI findings will be included in the next SAPR. Further,
although the findings are presented here for the secondary caregiver, the sample sizes are very
small, limiting interpretation of the data. As sample sizes grow, findings for the secondary
caregiver will be more meaningful.
Table 22. Decreased Risk as Indicated by the SARI - Successful Discharges
Table 23. Decreased Risk for Unsuccessful Discharges as Indicated by the SARI
DomainTotal with 2
Change Scoresn
% Decreased
Risk
Total with 2
Change Scoresn
% Decreased
Risk
Self-Efficacy 16 8 50.0% 3 1 33.3%
Commitment to Recovery 18 2 11.1% 3 0 -
Effect on Lifestyle 16 5 31.3% 3 1 33.3%
Patterns of Use 16 5 31.3% 3 0 -
Self-Care 14 4 28.6% 3 0 -
Quality of Neighborhood 13 5 38.5% 3 1 33.3%
Effect on Child Rearing 12 3 25.0% 3 1 33.3%
Support for Recovery 16 8 50.0% 3 0 -
Primary Caregiver Secondary Caregiver
DomainTotal with 2
Change ScoresN
% Decreased
Risk
Total with 2
Change ScoresN
% Decreased
Risk
Self-Efficacy 20 5 25.0% 1 0 0.0%
Commitment to Recovery 20 2 10.0% 5 1 20.0%
Effect on Lifestyle 18 2 11.1% 1 0 0.0%
Patterns of Use 19 3 15.8% 0 N/A N/A
Self-Care 19 2 10.5% 1 0 0.0%
Quality of Neighborhood 15 5 33.3% 1 0 0.0%
Effect on Child Rearing 17 2 11.8% 1 0 0.0%
Support for Recovery 16 0 0.0% 0 N/A N/A
SecondaryPrimary
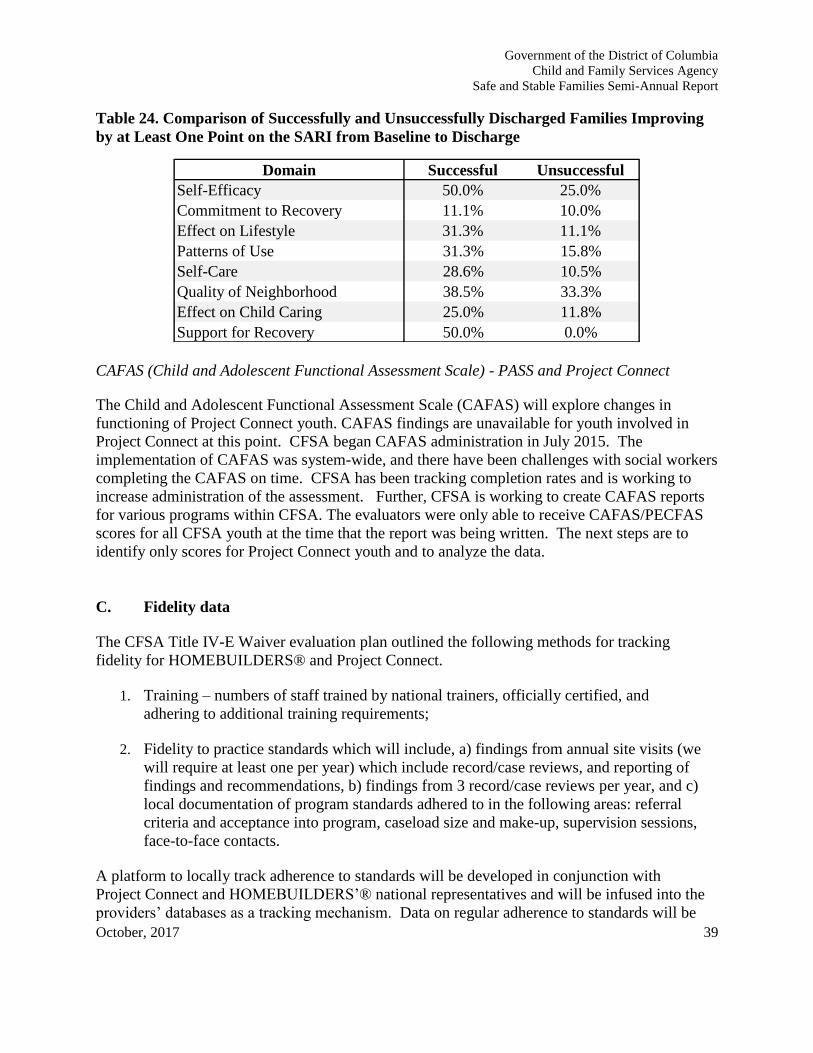
Government of the District of Columbia
Child and Family Services Agency
Safe and Stable Families Semi-Annual Report
October, 2017 39
Table 24. Comparison of Successfully and Unsuccessfully Discharged Families Improving
by at Least One Point on the SARI from Baseline to Discharge
CAFAS (Child and Adolescent Functional Assessment Scale) - PASS and Project Connect
The Child and Adolescent Functional Assessment Scale (CAFAS) will explore changes in
functioning of Project Connect youth. CAFAS findings are unavailable for youth involved in
Project Connect at this point. CFSA began CAFAS administration in July 2015. The
implementation of CAFAS was system-wide, and there have been challenges with social workers
completing the CAFAS on time. CFSA has been tracking completion rates and is working to
increase administration of the assessment. Further, CFSA is working to create CAFAS reports
for various programs within CFSA. The evaluators were only able to receive CAFAS/PECFAS
scores for all CFSA youth at the time that the report was being written. The next steps are to
identify only scores for Project Connect youth and to analyze the data.
C. Fidelity data
The CFSA Title IV-E Waiver evaluation plan outlined the following methods for tracking
fidelity for HOMEBUILDERS® and Project Connect.
1. Training – numbers of staff trained by national trainers, officially certified, and
adhering to additional training requirements;
2. Fidelity to practice standards which will include, a) findings from annual site visits (we
will require at least one per year) which include record/case reviews, and reporting of
findings and recommendations, b) findings from 3 record/case reviews per year, and c)
local documentation of program standards adhered to in the following areas: referral
criteria and acceptance into program, caseload size and make-up, supervision sessions,
face-to-face contacts.
A platform to locally track adherence to standards will be developed in conjunction with
Project Connect and HOMEBUILDERS’® national representatives and will be infused into the
providers’ databases as a tracking mechanism. Data on regular adherence to standards will be
Domain Successful Unsuccessful
Self-Efficacy 50.0% 25.0%
Commitment to Recovery 11.1% 10.0%
Effect on Lifestyle 31.3% 11.1%
Patterns of Use 31.3% 15.8%
Self-Care 28.6% 10.5%
Quality of Neighborhood 38.5% 33.3%
Effect on Child Caring 25.0% 11.8%
Support for Recovery 50.0% 0.0%
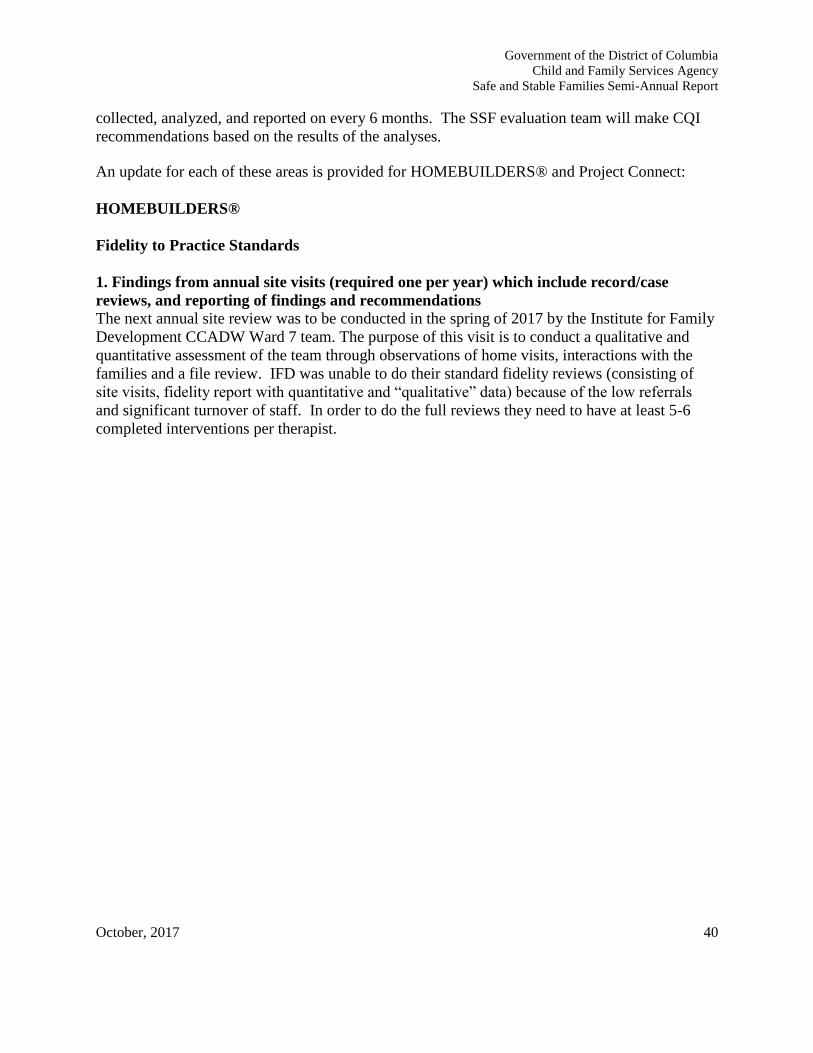
Government of the District of Columbia
Child and Family Services Agency
Safe and Stable Families Semi-Annual Report
October, 2017 40
collected, analyzed, and reported on every 6 months. The SSF evaluation team will make CQI
recommendations based on the results of the analyses.
An update for each of these areas is provided for HOMEBUILDERS® and Project Connect:
HOMEBUILDERS®
Fidelity to Practice Standards
1. Findings from annual site visits (required one per year) which include record/case
reviews, and reporting of findings and recommendations
The next annual site review was to be conducted in the spring of 2017 by the Institute for Family
Development CCADW Ward 7 team. The purpose of this visit is to conduct a qualitative and
quantitative assessment of the team through observations of home visits, interactions with the
families and a file review. IFD was unable to do their standard fidelity reviews (consisting of
site visits, fidelity report with quantitative and “qualitative” data) because of the low referrals
and significant turnover of staff. In order to do the full reviews they need to have at least 5-6
completed interventions per therapist.
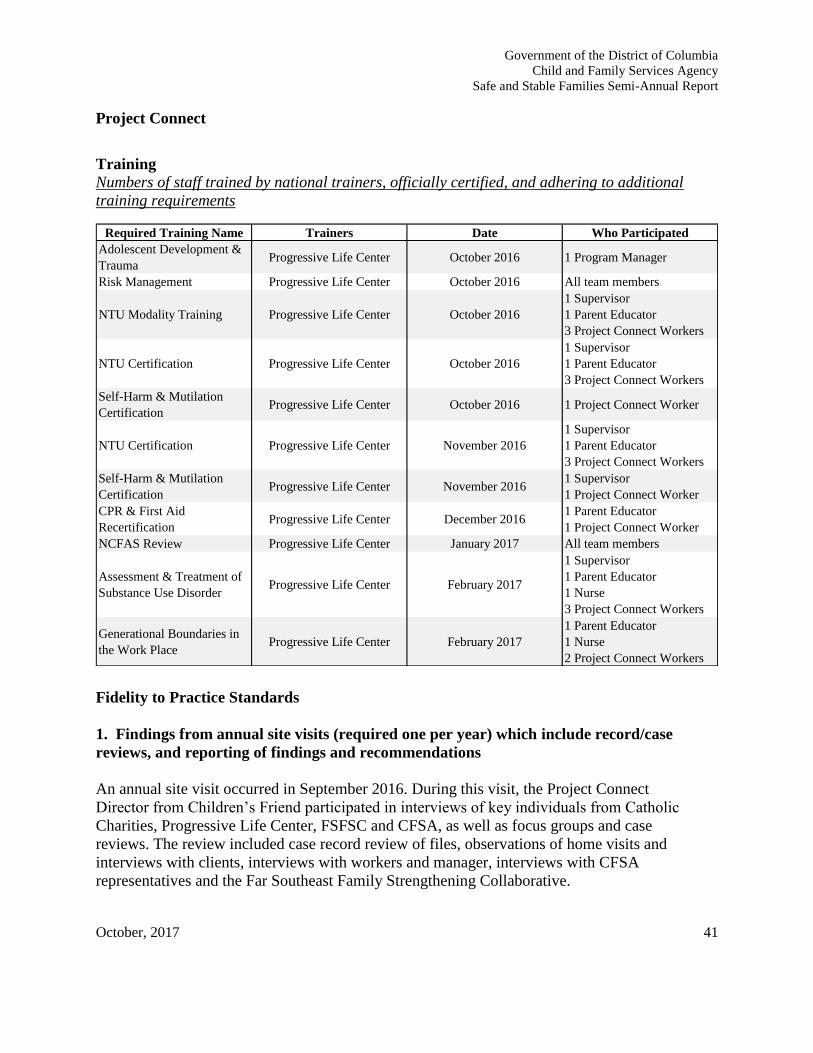
Government of the District of Columbia
Child and Family Services Agency
Safe and Stable Families Semi-Annual Report
October, 2017 41
Project Connect
Training Numbers of staff trained by national trainers, officially certified, and adhering to additional
training requirements
Fidelity to Practice Standards
1. Findings from annual site visits (required one per year) which include record/case
reviews, and reporting of findings and recommendations
An annual site visit occurred in September 2016. During this visit, the Project Connect
Director from Children’s Friend participated in interviews of key individuals from Catholic
Charities, Progressive Life Center, FSFSC and CFSA, as well as focus groups and case
reviews. The review included case record review of files, observations of home visits and
interviews with clients, interviews with workers and manager, interviews with CFSA
representatives and the Far Southeast Family Strengthening Collaborative.
Required Training Name Trainers Date Who Participated
Adolescent Development &
TraumaProgressive Life Center October 2016 1 Program Manager
Risk Management Progressive Life Center October 2016 All team members
NTU Modality Training Progressive Life Center October 2016
1 Supervisor
1 Parent Educator
3 Project Connect Workers
NTU Certification Progressive Life Center October 2016
1 Supervisor
1 Parent Educator
3 Project Connect Workers
Self-Harm & Mutilation
CertificationProgressive Life Center October 2016 1 Project Connect Worker
NTU Certification Progressive Life Center November 2016
1 Supervisor
1 Parent Educator
3 Project Connect Workers
Self-Harm & Mutilation
CertificationProgressive Life Center November 2016
1 Supervisor
1 Project Connect Worker
CPR & First Aid
RecertificationProgressive Life Center December 2016
1 Parent Educator
1 Project Connect Worker
NCFAS Review Progressive Life Center January 2017 All team members
Assessment & Treatment of
Substance Use DisorderProgressive Life Center February 2017
1 Supervisor
1 Parent Educator
1 Nurse
3 Project Connect Workers
Generational Boundaries in
the Work PlaceProgressive Life Center February 2017
1 Parent Educator
1 Nurse
2 Project Connect Workers
Government of the District of Columbia
Child and Family Services Agency
Safe and Stable Families Semi-Annual Report
October, 2017 42
An official report from IFD on the site will be included in the next SAPR. However, a summary
of preliminary findings is as follows:
1) The teams made good progress over the past year as to practice fidelity overall.
a) There are 3 teams nearly fully staffed and trained. They have increased their
caseloads and core services are being provided with good evidence as to
modeling, relationship and team.
b) There is some potential for drift in the structural and procedural domains regarding
the percent of the in-home chronic neglect cases. CFSA has responded to this
with a unit designed for better oversight by CFSA and limiting caseloads to 20%
per worker.
c) There is some inconsistency across the teams around the difference between
clinical case management versus case management services.
2) There is a need to revisit the SARI and NCFAS for better case logic with the teams.
a) There is some drift across teams as to the use of these tools.
3) There is still a need for a governance team.
a) IFD continues to identify this as a need particularly as they move toward a train the
trainer mechanism.
3. Fidelity-to-Practice Standards - Findings from 3 record/case reviews per year
As mentioned above, there was documentation of general adherence to structural and procedural
fidelity in the case records.
4. Fidelity-to-Practice Standards - Local documentation of program standards adhered to in the
following areas: referral criteria and acceptance into program, caseload size and make-up,
supervision sessions, face-to-face contacts.
Children’s Friend is in the process of finalizing their fidelity standards and methods to measure
these standards. A description of the draft standards is as follows:
The Project Connect Fidelity Measurement process is divided into two different but connected
elements.
● The first being a Functional Assessment which is more Subjective (observation,
description, opinion) in nature of the Models’ components of “Teamwork”,
“Relationship”, and “Modeling”.
● The second being a mostly objective (probably true facts) measurement of the Models’
components of “Structural Fidelity”, “Procedural Fidelity”, and “Family Engagement”.
● To address “Structural Fidelity” and “Family Engagement” stakeholders
from CFSA, FSFSC, ERFSC, EBFSC, CCADW and PLC developed the
Project Connect Aftercare protocol to include the development of support
Government of the District of Columbia
Child and Family Services Agency
Safe and Stable Families Semi-Annual Report
October, 2017 43
groups during program enrollment and post program enrollment such as
medicine management, parenting classes, nutrition, understanding
behavioral health diagnosis.
● The Aftercare protocol also established procedures for family engagement
once discharged from Project Connect which would include phone calls,
home visits conducted by the Project Connect worker to provide support
for an identified challenge.
The review process normally would include process observation, record and policy reviews,
individual staff as well as management interviews, key stakeholder interviews, stakeholder and
client satisfaction reviews, and group discussions across all involved parties including clients.
V. Limitations a. Project Connect data did not include race or ethnicity. This data point will be
requested for the next data pull.
b. The data point “permanency” is currently being collected as a “yes/no”
dichotomous field, limiting length of stay or duration analyses. Both a definition
of “Permanency” and a date will be requested in the next data pull.
c. Systems limitations regarding data collection in FACES of referrals for families
with open cases may be leading to inaccurate data regarding counting
substantiated CPS report during service date. The evaluation team will explore
this nuance with the IV-E Waiver team.
d. Small sample sizes for some analyses impede the ability to draw strong
conclusions regarding initial findings or calculate statistical significance.
VI. Recommendations and Activities Planned for Next Reporting Period
During this reporting period, CFSA went through a transition period of leadership where a new
Director, Deputy Director, Program Administrator, Program Manager, lead evaluator, IV-E
Waiver Planning Advisor were brought on board. The new leadership team immediately
assembled the Safe and Stable Families team to assess and evaluate the effectiveness of
programming for families served under the title IV-E waiver.
Through a case review, analysis of preliminary data, GIS Mapping and a needs assessment
administered to community partners and community services customers in the District, CFSA
learned that referrals to HOMEBUILDERS® were relatively low and the number of families
completing the programs successfully was even lower. Additionally, positive outcomes for
Government of the District of Columbia
Child and Family Services Agency
Safe and Stable Families Semi-Annual Report
October, 2017 44
families were marginal given the percentage of withdrawals from the programs, and data
integrity could be improved upon. Lastly, through GIS mapping, needs assessments and case
reviews, the SSF team found that services were of greatest need in the Wards 7 and 8, and
identified the specific barriers keeping families from staying engaged in the programs.
Moreover, results of the HOMEBUILDERS® case review and data analysis revealed the
following themes:
● Barriers with parenting skills and disciplinary practices, mental health, child behavior
problems, and unwillingness to supervise children.
● Strengths were the caretaker’s willingness to participate in the intervention, stable
housing and employment, strong family bonding, and outside supports.
Paired with the results of the process and outcomes study, CFSA has decided to focus on
developing a transition plan to phase HOMEBUILDERS out and acquire a new service to
address the gaps in family preservation services in the next reporting period. During the next
reporting period, CFSA will search for a replacement intervention that matches the
characteristics and needs of the target population and has already been tested with this
population.
Maximization of Project Connect Services.
CFSA will continue to focus on maximizing the use of Project Connect services to use this
service to its full capacity. This includes developing continuous quality improvement processes
and performance monitoring to enhance the use of data to improve practice. These processes
will consist of developing methodology to perform quarterly case reviews and monthly
utilization reports. CFSA believes this rigorous internal processes are key to the success of the
demonstration project.
Further Exploration of How to Revise the Early Intervention Services to Increase Effectiveness
CFSA will explore revising the capacity of the parent education and support programs due to the
poor results of HOMEBUILDERS. Since CFSA will be assessing options to discontinue the use
of HOMEBUILDERS®. CFSA will focus on maximizing the use of the early intervention
services such as PESP in an effort to decrease the number families in need of
HOMEBUILDERS®.
Full Implementation of Family Coaching Models
The Children and Family Services Agency will focus on developing the goals, objectives and
targets for the Family Peer Coaches Program as CFSA has been able to collect enough data to
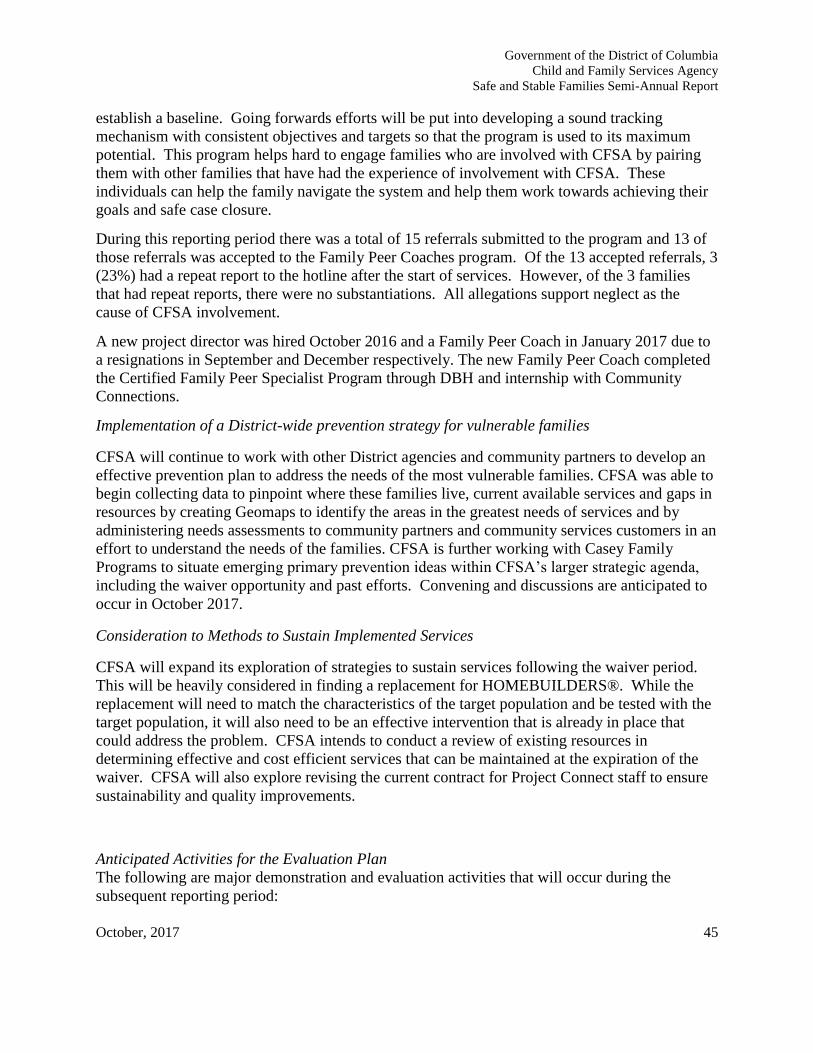
Government of the District of Columbia
Child and Family Services Agency
Safe and Stable Families Semi-Annual Report
October, 2017 45
establish a baseline. Going forwards efforts will be put into developing a sound tracking
mechanism with consistent objectives and targets so that the program is used to its maximum
potential. This program helps hard to engage families who are involved with CFSA by pairing
them with other families that have had the experience of involvement with CFSA. These
individuals can help the family navigate the system and help them work towards achieving their
goals and safe case closure.
During this reporting period there was a total of 15 referrals submitted to the program and 13 of
those referrals was accepted to the Family Peer Coaches program. Of the 13 accepted referrals, 3
(23%) had a repeat report to the hotline after the start of services. However, of the 3 families
that had repeat reports, there were no substantiations. All allegations support neglect as the
cause of CFSA involvement.
A new project director was hired October 2016 and a Family Peer Coach in January 2017 due to
a resignations in September and December respectively. The new Family Peer Coach completed
the Certified Family Peer Specialist Program through DBH and internship with Community
Connections.
Implementation of a District-wide prevention strategy for vulnerable families
CFSA will continue to work with other District agencies and community partners to develop an
effective prevention plan to address the needs of the most vulnerable families. CFSA was able to
begin collecting data to pinpoint where these families live, current available services and gaps in
resources by creating Geomaps to identify the areas in the greatest needs of services and by
administering needs assessments to community partners and community services customers in an
effort to understand the needs of the families. CFSA is further working with Casey Family
Programs to situate emerging primary prevention ideas within CFSA’s larger strategic agenda,
including the waiver opportunity and past efforts. Convening and discussions are anticipated to
occur in October 2017.
Consideration to Methods to Sustain Implemented Services
CFSA will expand its exploration of strategies to sustain services following the waiver period.
This will be heavily considered in finding a replacement for HOMEBUILDERS®. While the
replacement will need to match the characteristics of the target population and be tested with the
target population, it will also need to be an effective intervention that is already in place that
could address the problem. CFSA intends to conduct a review of existing resources in
determining effective and cost efficient services that can be maintained at the expiration of the
waiver. CFSA will also explore revising the current contract for Project Connect staff to ensure
sustainability and quality improvements.
Anticipated Activities for the Evaluation Plan
The following are major demonstration and evaluation activities that will occur during the
subsequent reporting period:
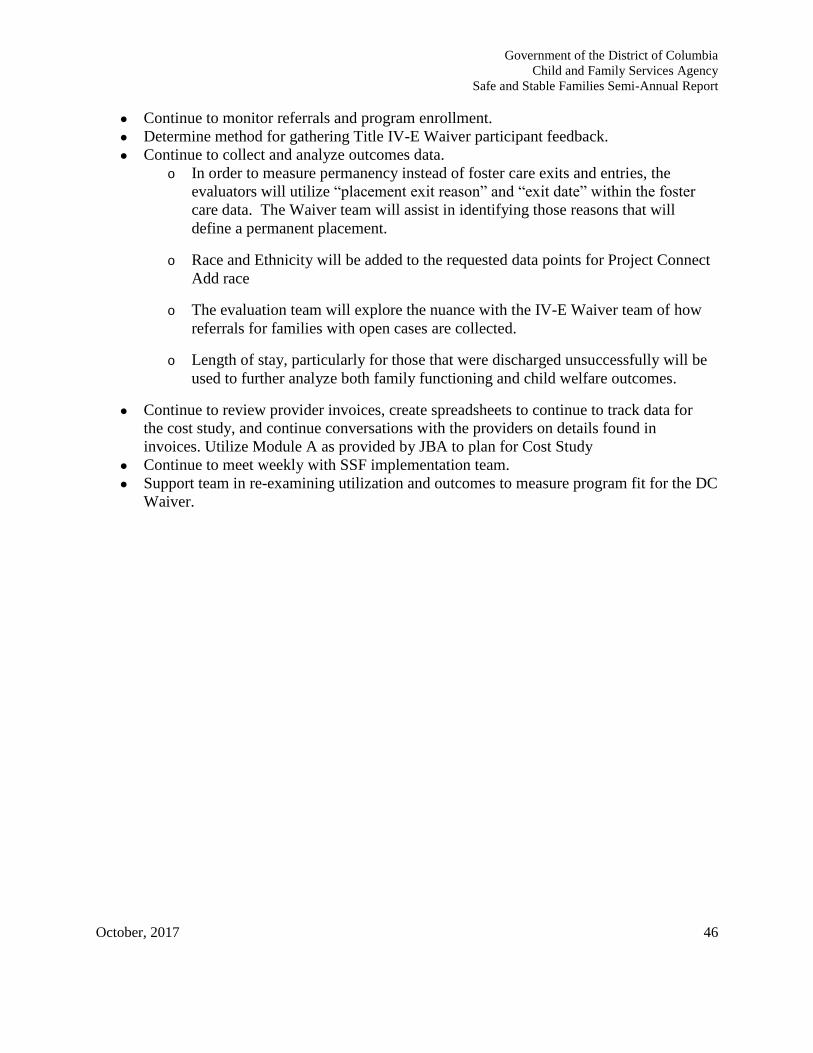
Government of the District of Columbia
Child and Family Services Agency
Safe and Stable Families Semi-Annual Report
October, 2017 46
● Continue to monitor referrals and program enrollment.
● Determine method for gathering Title IV-E Waiver participant feedback.
● Continue to collect and analyze outcomes data.
o In order to measure permanency instead of foster care exits and entries, the
evaluators will utilize “placement exit reason” and “exit date” within the foster
care data. The Waiver team will assist in identifying those reasons that will
define a permanent placement.
o Race and Ethnicity will be added to the requested data points for Project Connect
Add race
o The evaluation team will explore the nuance with the IV-E Waiver team of how
referrals for families with open cases are collected.
o Length of stay, particularly for those that were discharged unsuccessfully will be
used to further analyze both family functioning and child welfare outcomes.
● Continue to review provider invoices, create spreadsheets to continue to track data for
the cost study, and continue conversations with the providers on details found in
invoices. Utilize Module A as provided by JBA to plan for Cost Study
● Continue to meet weekly with SSF implementation team.
● Support team in re-examining utilization and outcomes to measure program fit for the DC
Waiver.
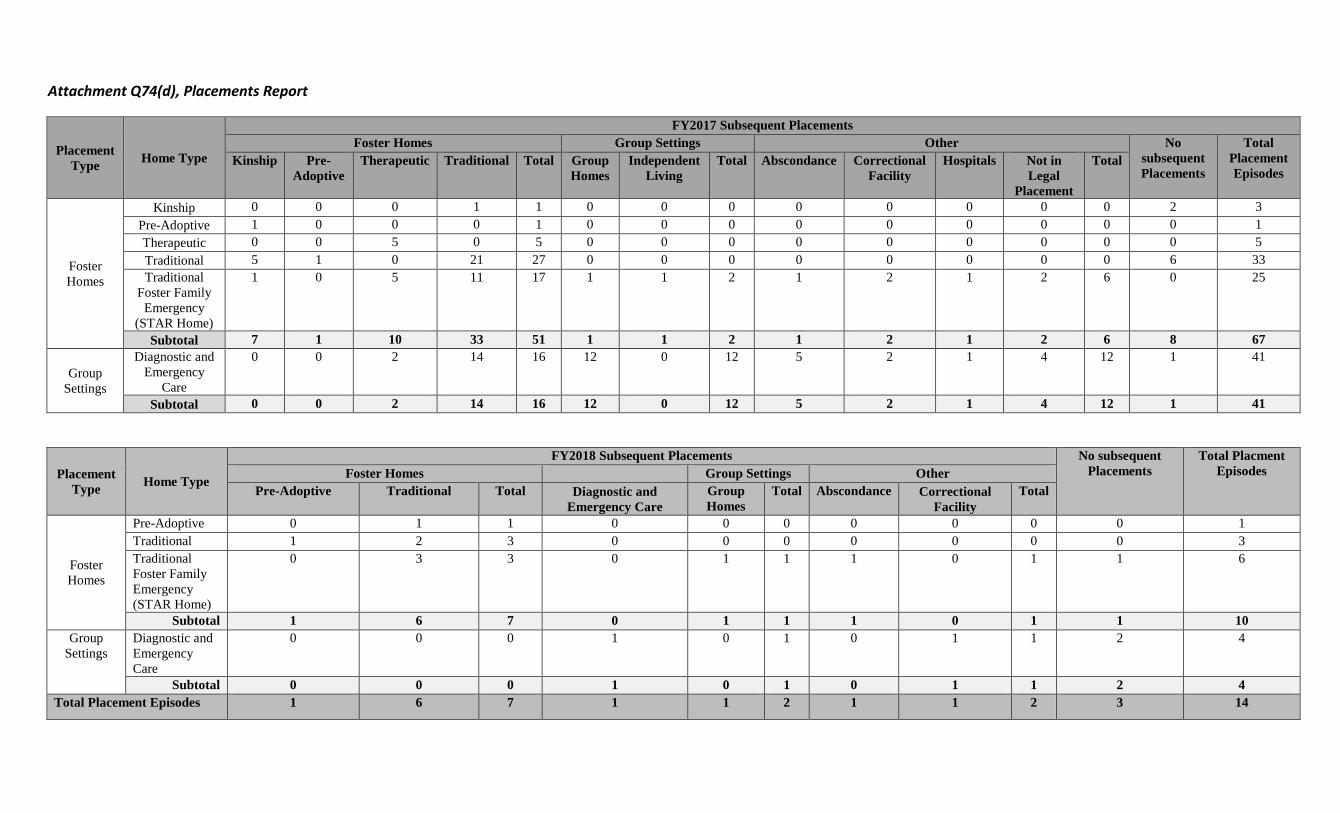
Attachment Q74(d), Placements Report
Placement
Type Home Type
FY2017 Subsequent Placements
Foster Homes Group Settings Other No
subsequent
Placements
Total
Placement
Episodes Kinship Pre-
Adoptive
Therapeutic Traditional Total Group
Homes
Independent
Living
Total Abscondance Correctional
Facility
Hospitals Not in
Legal
Placement
Total
Foster
Homes
Kinship 0 0 0 1 1 0 0 0 0 0 0 0 0 2 3
Pre-Adoptive 1 0 0 0 1 0 0 0 0 0 0 0 0 0 1
Therapeutic 0 0 5 0 5 0 0 0 0 0 0 0 0 0 5
Traditional 5 1 0 21 27 0 0 0 0 0 0 0 0 6 33
Traditional
Foster Family
Emergency
(STAR Home)
1 0 5 11 17 1 1 2 1 2 1 2 6 0 25
Subtotal 7 1 10 33 51 1 1 2 1 2 1 2 6 8 67
Group
Settings
Diagnostic and
Emergency
Care
0 0 2 14 16 12 0 12 5 2 1 4 12 1 41
Subtotal 0 0 2 14 16 12 0 12 5 2 1 4 12 1 41
Placement
Type Home Type
FY2018 Subsequent Placements No subsequent
Placements
Total Placment
Episodes Foster Homes Group Settings Other
Pre-Adoptive Traditional Total Diagnostic and
Emergency Care
Group
Homes
Total Abscondance Correctional
Facility
Total
Foster
Homes
Pre-Adoptive 0 1 1 0 0 0 0 0 0 0 1
Traditional 1 2 3 0 0 0 0 0 0 0 3
Traditional
Foster Family
Emergency
(STAR Home)
0 3 3 0 1 1 1 0 1 1 6
Subtotal 1 6 7 0 1 1 1 0 1 1 10
Group
Settings
Diagnostic and
Emergency
Care
0 0 0 1 0 1 0 1 1 2 4
Subtotal 0 0 0 1 0 1 0 1 1 2 4
Total Placement Episodes 1 6 7 1 1 2 1 1 2 3 14
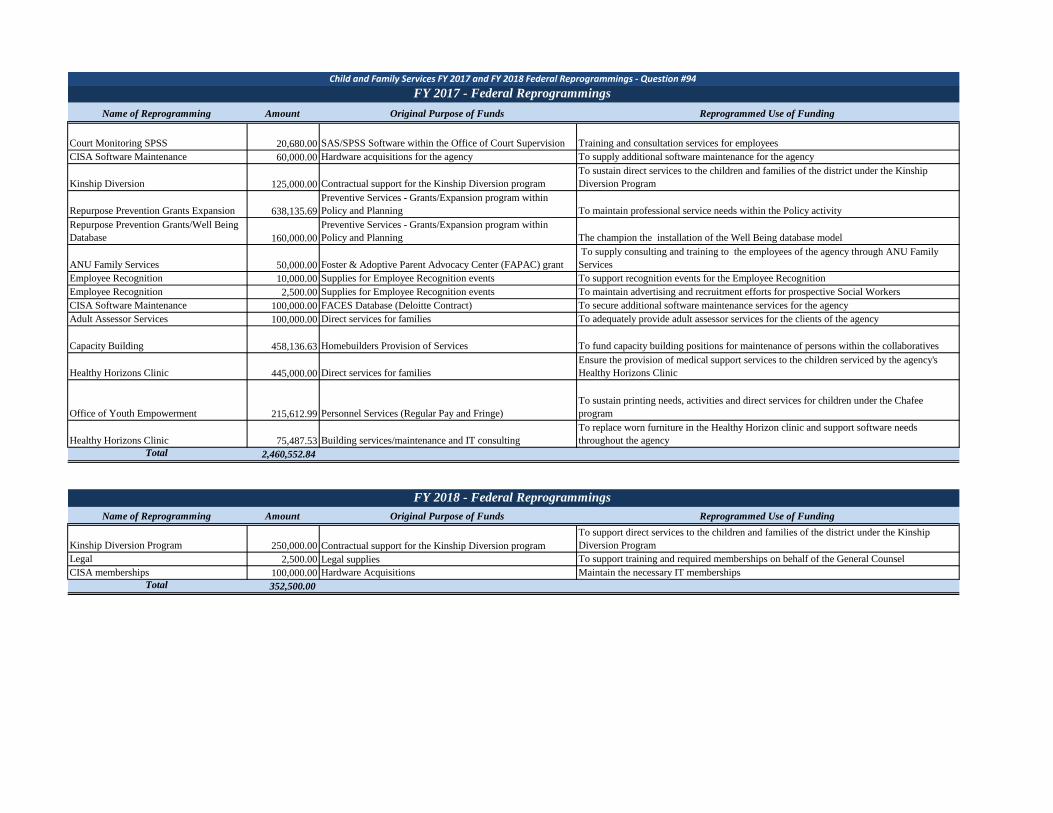
Name of Reprogramming Amount Original Purpose of Funds Reprogrammed Use of Funding
Court Monitoring SPSS 20,680.00 SAS/SPSS Software within the Office of Court Supervision Training and consultation services for employees
CISA Software Maintenance 60,000.00 Hardware acquisitions for the agency To supply additional software maintenance for the agency
Kinship Diversion 125,000.00 Contractual support for the Kinship Diversion program
To sustain direct services to the children and families of the district under the Kinship
Diversion Program
Repurpose Prevention Grants Expansion 638,135.69
Preventive Services - Grants/Expansion program within
Policy and Planning To maintain professional service needs within the Policy activity
Repurpose Prevention Grants/Well Being
Database 160,000.00
Preventive Services - Grants/Expansion program within
Policy and Planning The champion the installation of the Well Being database model
ANU Family Services 50,000.00 Foster & Adoptive Parent Advocacy Center (FAPAC) grant
To supply consulting and training to the employees of the agency through ANU Family
Services
Employee Recognition 10,000.00 Supplies for Employee Recognition events To support recognition events for the Employee Recognition
Employee Recognition 2,500.00 Supplies for Employee Recognition events To maintain advertising and recruitment efforts for prospective Social Workers
CISA Software Maintenance 100,000.00 FACES Database (Deloitte Contract) To secure additional software maintenance services for the agency
Adult Assessor Services 100,000.00 Direct services for families To adequately provide adult assessor services for the clients of the agency
Capacity Building 458,136.63 Homebuilders Provision of Services To fund capacity building positions for maintenance of persons within the collaboratives
Healthy Horizons Clinic 445,000.00 Direct services for families
Ensure the provision of medical support services to the children serviced by the agency's
Healthy Horizons Clinic
Office of Youth Empowerment 215,612.99 Personnel Services (Regular Pay and Fringe)
To sustain printing needs, activities and direct services for children under the Chafee
program
Healthy Horizons Clinic 75,487.53 Building services/maintenance and IT consulting
To replace worn furniture in the Healthy Horizon clinic and support software needs
throughout the agency
Total 2,460,552.84
Name of Reprogramming Amount Original Purpose of Funds Reprogrammed Use of Funding
Kinship Diversion Program 250,000.00 Contractual support for the Kinship Diversion program
To support direct services to the children and families of the district under the Kinship
Diversion Program
Legal 2,500.00 Legal supplies To support training and required memberships on behalf of the General Counsel
CISA memberships 100,000.00 Hardware Acquisitions Maintain the necessary IT memberships
Total 352,500.00
FY 2017 - Federal Reprogrammings
FY 2018 - Federal Reprogrammings
Child and Family Services FY 2017 and FY 2018 Federal Reprogrammings - Question #94
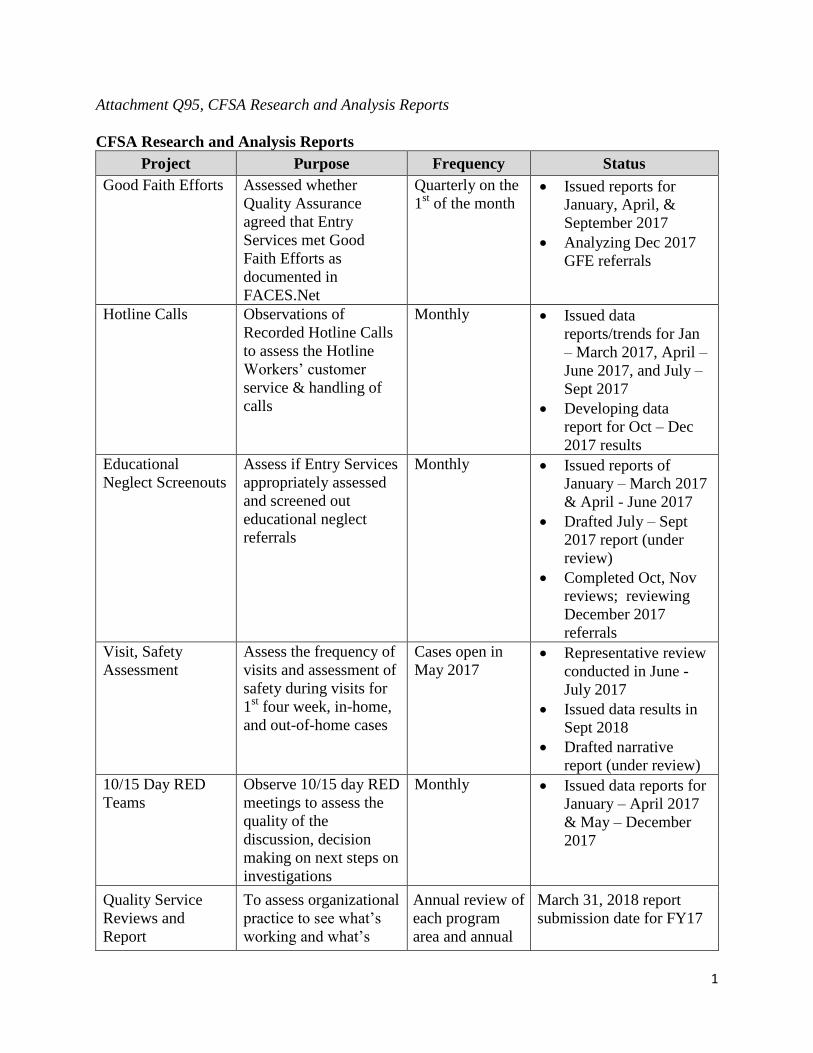
1
Attachment Q95, CFSA Research and Analysis Reports
CFSA Research and Analysis Reports
Project Purpose Frequency Status
Good Faith Efforts Assessed whether
Quality Assurance
agreed that Entry
Services met Good
Faith Efforts as
documented in
FACES.Net
Quarterly on the
1st of the month
Issued reports for
January, April, &
September 2017
Analyzing Dec 2017
GFE referrals
Hotline Calls Observations of
Recorded Hotline Calls
to assess the Hotline
Workers’ customer
service & handling of
calls
Monthly Issued data
reports/trends for Jan
– March 2017, April –
June 2017, and July –
Sept 2017
Developing data
report for Oct – Dec
2017 results
Educational
Neglect Screenouts
Assess if Entry Services
appropriately assessed
and screened out
educational neglect
referrals
Monthly Issued reports of
January – March 2017
& April - June 2017
Drafted July – Sept
2017 report (under
review)
Completed Oct, Nov
reviews; reviewing
December 2017
referrals
Visit, Safety
Assessment
Assess the frequency of
visits and assessment of
safety during visits for
1st four week, in-home,
and out-of-home cases
Cases open in
May 2017 Representative review
conducted in June -
July 2017
Issued data results in
Sept 2018
Drafted narrative
report (under review)
10/15 Day RED
Teams
Observe 10/15 day RED
meetings to assess the
quality of the
discussion, decision
making on next steps on
investigations
Monthly Issued data reports for
January – April 2017
& May – December
2017
Quality Service
Reviews and
Report
To assess organizational
practice to see what’s
working and what’s
Annual review of
each program
area and annual
March 31, 2018 report
submission date for FY17
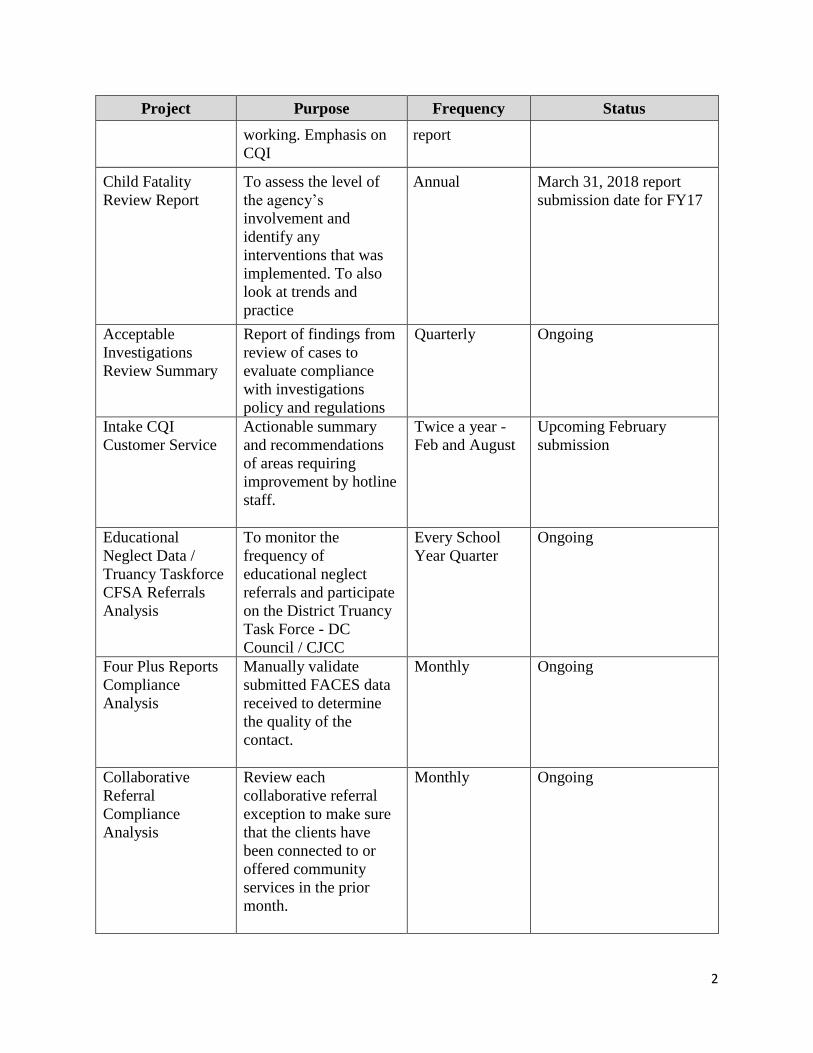
2
Project Purpose Frequency Status
working. Emphasis on
CQI
report
Child Fatality
Review Report
To assess the level of
the agency’s
involvement and
identify any
interventions that was
implemented. To also
look at trends and
practice
Annual March 31, 2018 report
submission date for FY17
Acceptable
Investigations
Review Summary
Report of findings from
review of cases to
evaluate compliance
with investigations
policy and regulations
Quarterly Ongoing
Intake CQI
Customer Service
Actionable summary
and recommendations
of areas requiring
improvement by hotline
staff.
Twice a year -
Feb and August
Upcoming February
submission
Educational
Neglect Data /
Truancy Taskforce
CFSA Referrals
Analysis
To monitor the
frequency of
educational neglect
referrals and participate
on the District Truancy
Task Force - DC
Council / CJCC
Every School
Year Quarter
Ongoing
Four Plus Reports
Compliance
Analysis
Manually validate
submitted FACES data
received to determine
the quality of the
contact.
Monthly Ongoing
Collaborative
Referral
Compliance
Analysis
Review each
collaborative referral
exception to make sure
that the clients have
been connected to or
offered community
services in the prior
month.
Monthly Ongoing
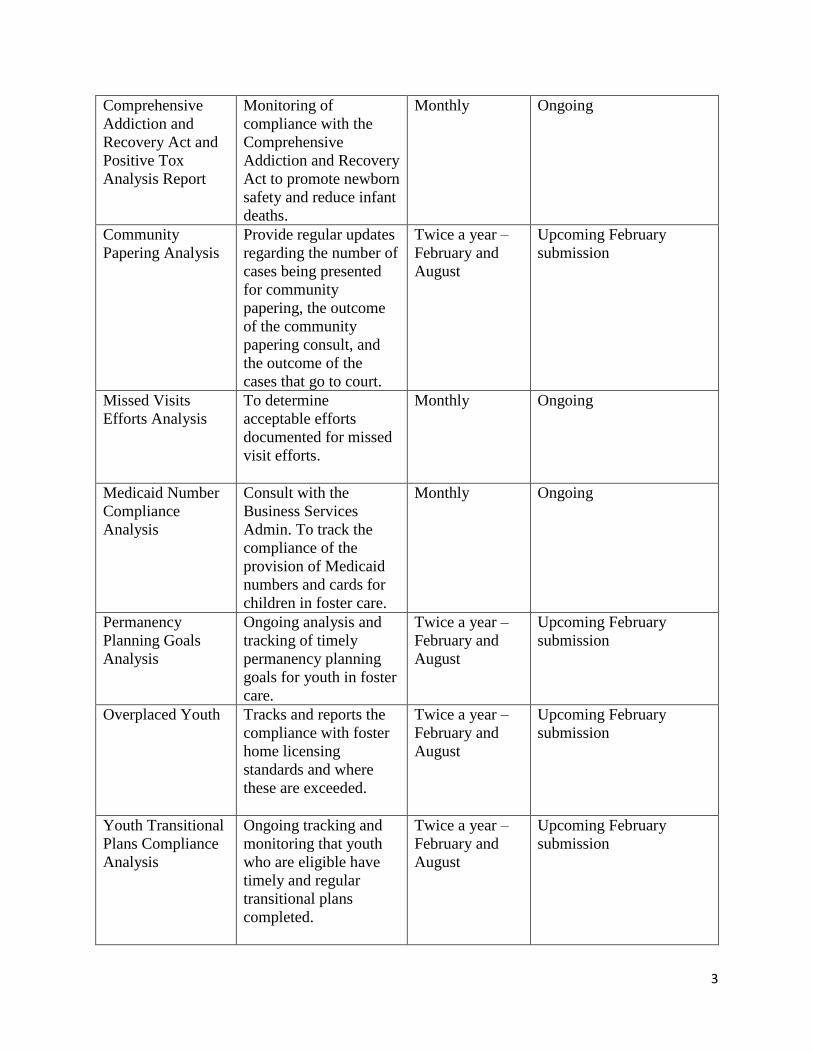
3
Comprehensive
Addiction and
Recovery Act and
Positive Tox
Analysis Report
Monitoring of
compliance with the
Comprehensive
Addiction and Recovery
Act to promote newborn
safety and reduce infant
deaths.
Monthly Ongoing
Community
Papering Analysis
Provide regular updates
regarding the number of
cases being presented
for community
papering, the outcome
of the community
papering consult, and
the outcome of the
cases that go to court.
Twice a year –
February and
August
Upcoming February
submission
Missed Visits
Efforts Analysis
To determine
acceptable efforts
documented for missed
visit efforts.
Monthly Ongoing
Medicaid Number
Compliance
Analysis
Consult with the
Business Services
Admin. To track the
compliance of the
provision of Medicaid
numbers and cards for
children in foster care.
Monthly Ongoing
Permanency
Planning Goals
Analysis
Ongoing analysis and
tracking of timely
permanency planning
goals for youth in foster
care.
Twice a year –
February and
August
Upcoming February
submission
Overplaced Youth Tracks and reports the
compliance with foster
home licensing
standards and where
these are exceeded.
Twice a year –
February and
August
Upcoming February
submission
Youth Transitional
Plans Compliance
Analysis
Ongoing tracking and
monitoring that youth
who are eligible have
timely and regular
transitional plans
completed.
Twice a year –
February and
August
Upcoming February
submission
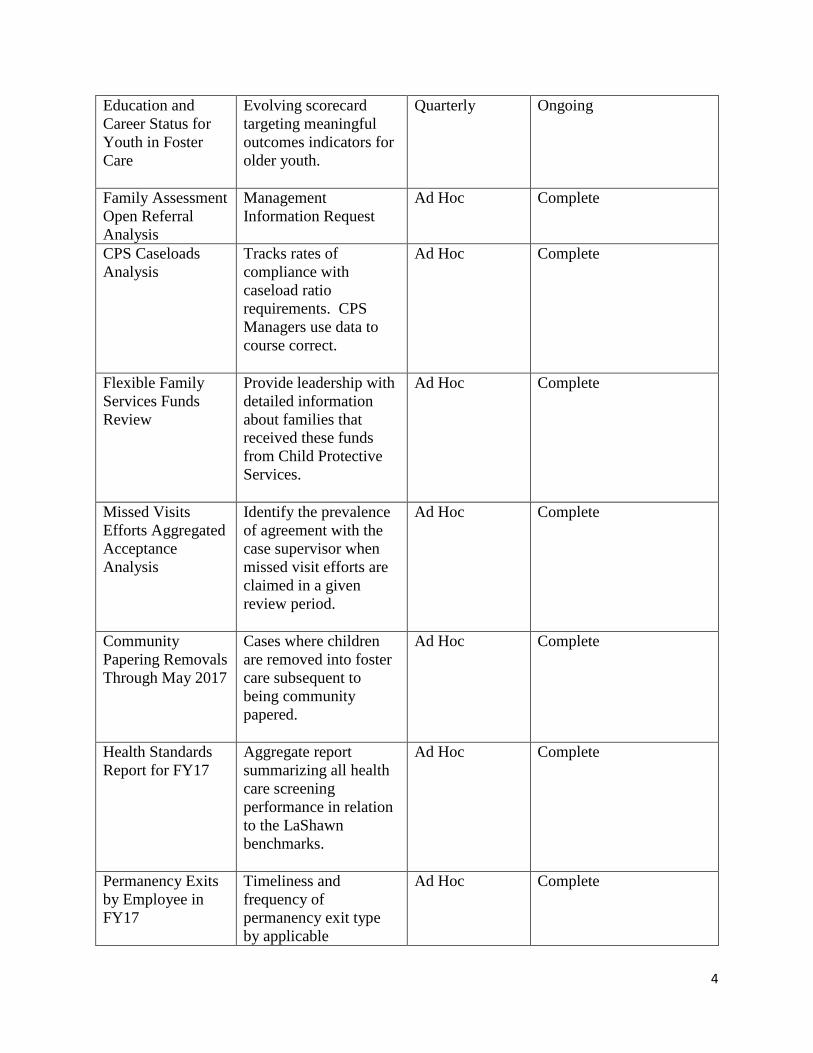
4
Education and
Career Status for
Youth in Foster
Care
Evolving scorecard
targeting meaningful
outcomes indicators for
older youth.
Quarterly Ongoing
Family Assessment
Open Referral
Analysis
Management
Information Request
Ad Hoc Complete
CPS Caseloads
Analysis
Tracks rates of
compliance with
caseload ratio
requirements. CPS
Managers use data to
course correct.
Ad Hoc Complete
Flexible Family
Services Funds
Review
Provide leadership with
detailed information
about families that
received these funds
from Child Protective
Services.
Ad Hoc Complete
Missed Visits
Efforts Aggregated
Acceptance
Analysis
Identify the prevalence
of agreement with the
case supervisor when
missed visit efforts are
claimed in a given
review period.
Ad Hoc Complete
Community
Papering Removals
Through May 2017
Cases where children
are removed into foster
care subsequent to
being community
papered.
Ad Hoc Complete
Health Standards
Report for FY17
Aggregate report
summarizing all health
care screening
performance in relation
to the LaShawn
benchmarks.
Ad Hoc Complete
Permanency Exits
by Employee in
FY17
Timeliness and
frequency of
permanency exit type
by applicable
Ad Hoc Complete
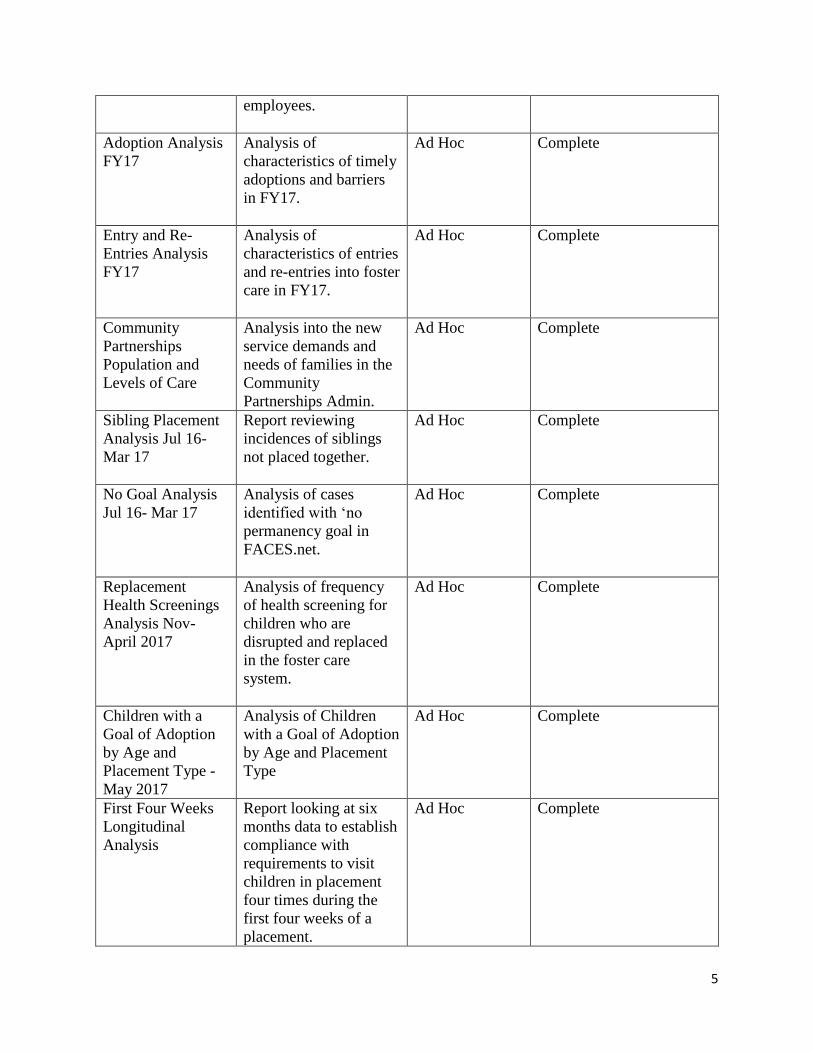
5
employees.
Adoption Analysis
FY17
Analysis of
characteristics of timely
adoptions and barriers
in FY17.
Ad Hoc Complete
Entry and Re-
Entries Analysis
FY17
Analysis of
characteristics of entries
and re-entries into foster
care in FY17.
Ad Hoc Complete
Community
Partnerships
Population and
Levels of Care
Analysis into the new
service demands and
needs of families in the
Community
Partnerships Admin.
Ad Hoc Complete
Sibling Placement
Analysis Jul 16-
Mar 17
Report reviewing
incidences of siblings
not placed together.
Ad Hoc Complete
No Goal Analysis
Jul 16- Mar 17
Analysis of cases
identified with ‘no
permanency goal in
FACES.net.
Ad Hoc Complete
Replacement
Health Screenings
Analysis Nov-
April 2017
Analysis of frequency
of health screening for
children who are
disrupted and replaced
in the foster care
system.
Ad Hoc Complete
Children with a
Goal of Adoption
by Age and
Placement Type -
May 2017
Analysis of Children
with a Goal of Adoption
by Age and Placement
Type
Ad Hoc Complete
First Four Weeks
Longitudinal
Analysis
Report looking at six
months data to establish
compliance with
requirements to visit
children in placement
four times during the
first four weeks of a
placement.
Ad Hoc Complete
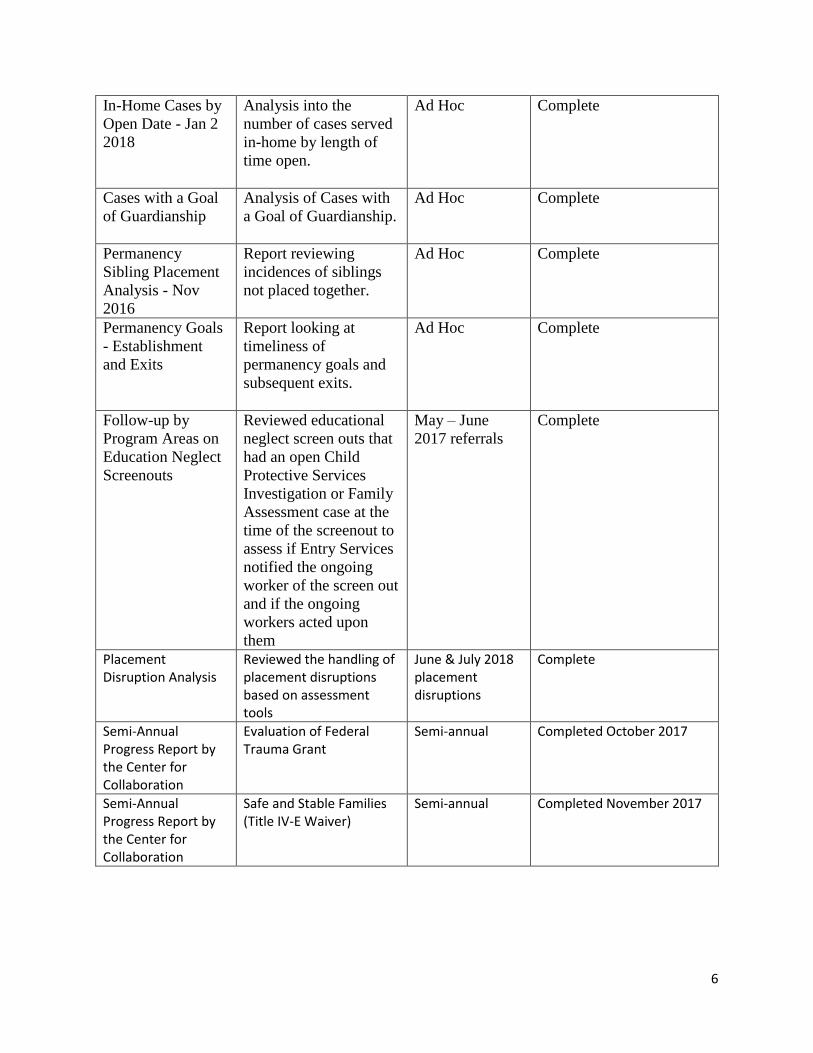
6
In-Home Cases by
Open Date - Jan 2
2018
Analysis into the
number of cases served
in-home by length of
time open.
Ad Hoc Complete
Cases with a Goal
of Guardianship
Analysis of Cases with
a Goal of Guardianship.
Ad Hoc Complete
Permanency
Sibling Placement
Analysis - Nov
2016
Report reviewing
incidences of siblings
not placed together.
Ad Hoc Complete
Permanency Goals
- Establishment
and Exits
Report looking at
timeliness of
permanency goals and
subsequent exits.
Ad Hoc Complete
Follow-up by
Program Areas on
Education Neglect
Screenouts
Reviewed educational
neglect screen outs that
had an open Child
Protective Services
Investigation or Family
Assessment case at the
time of the screenout to
assess if Entry Services
notified the ongoing
worker of the screen out
and if the ongoing
workers acted upon
them
May – June
2017 referrals
Complete
Placement Disruption Analysis
Reviewed the handling of placement disruptions based on assessment tools
June & July 2018 placement disruptions
Complete
Semi-Annual Progress Report by the Center for Collaboration
Evaluation of Federal Trauma Grant
Semi-annual Completed October 2017
Semi-Annual Progress Report by the Center for Collaboration
Safe and Stable Families (Title IV-E Waiver)
Semi-annual Completed November 2017
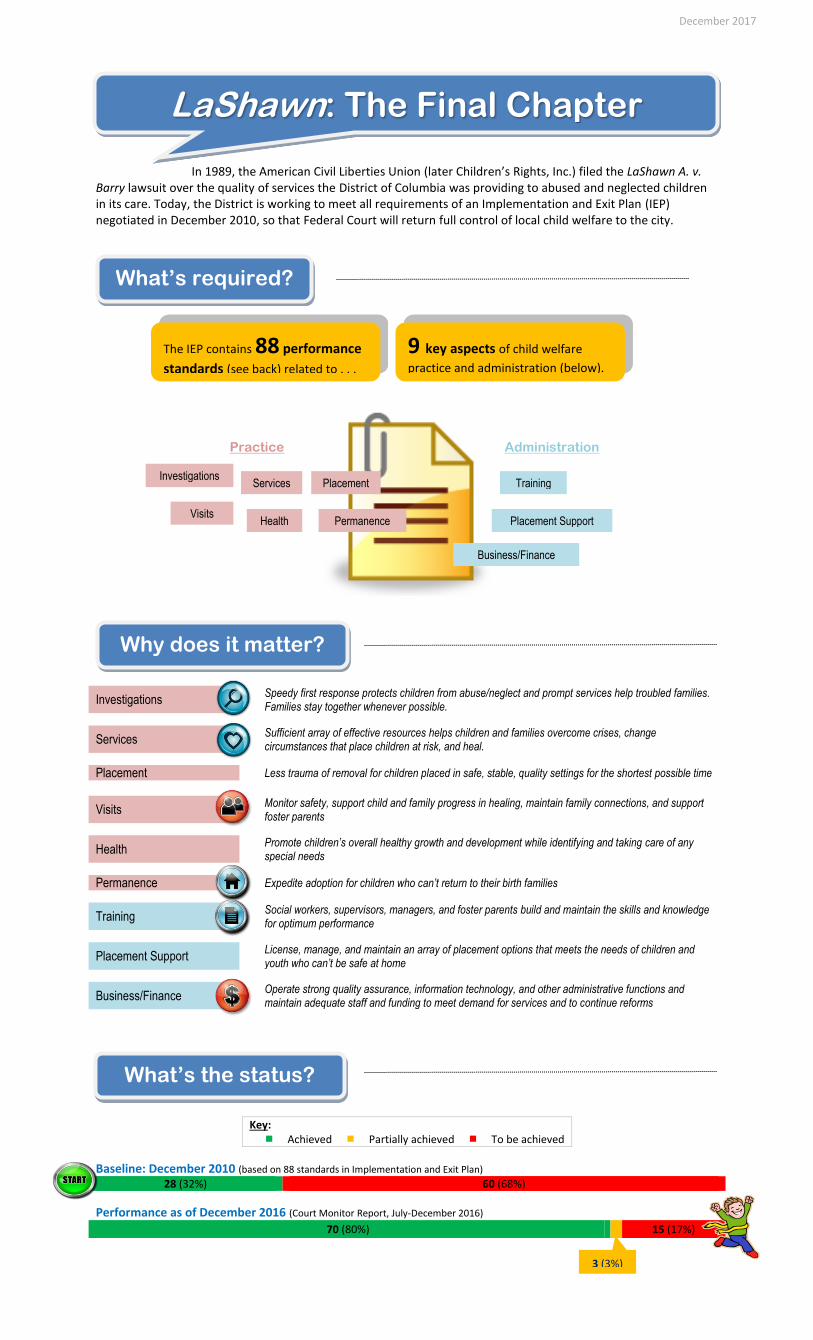
In 1989, the American Civil Liberties Union (later Children’s Rights, Inc.) filed the LaShawn A. v. Barry lawsuit over the quality of services the District of Columbia was providing to abused and neglected children in its care. Today, the District is working to meet all requirements of an Implementation and Exit Plan (IEP) negotiated in December 2010, so that Federal Court will return full control of local child welfare to the city.
Investigations Speedy first response protects children from abuse/neglect and prompt services help troubled families. Families stay together whenever possible.
Services Sufficient array of effective resources helps children and families overcome crises, change circumstances that place children at risk, and heal.
Placement Less trauma of removal for children placed in safe, stable, quality settings for the shortest possible time
Visits Monitor safety, support child and family progress in healing, maintain family connections, and support foster parents
Health Promote children’s overall healthy growth and development while identifying and taking care of any
special needs
Permanence Expedite adoption for children who can’t return to their birth families
Training Social workers, supervisors, managers, and foster parents build and maintain the skills and knowledge for optimum performance
Placement Support License, manage, and maintain an array of placement options that meets the needs of children and youth who can’t be safe at home
Business/Finance Operate strong quality assurance, information technology, and other administrative functions and
maintain adequate staff and funding to meet demand for services and to continue reforms
Key: Achieved Partially achieved To be achieved
Baseline: December 2010 (based on 88 standards in Implementation and Exit Plan)
28 (32%) 60 (68%)
Performance as of December 2016 (Court Monitor Report, July-December 2016)
70 (80%) 15 (17%)
LaShawn: The Final Chapter
What’s required?
The IEP contains 88 performance
standards (see back) related to . . .
9 key aspects of child welfare
practice and administration (below).
Investigations Services Placement
Visits Health Permanence
Training
Placement Support
Business/Finance
Practice Administration
Why does it matter?
What’s the status?
December 2017
3 (3%)
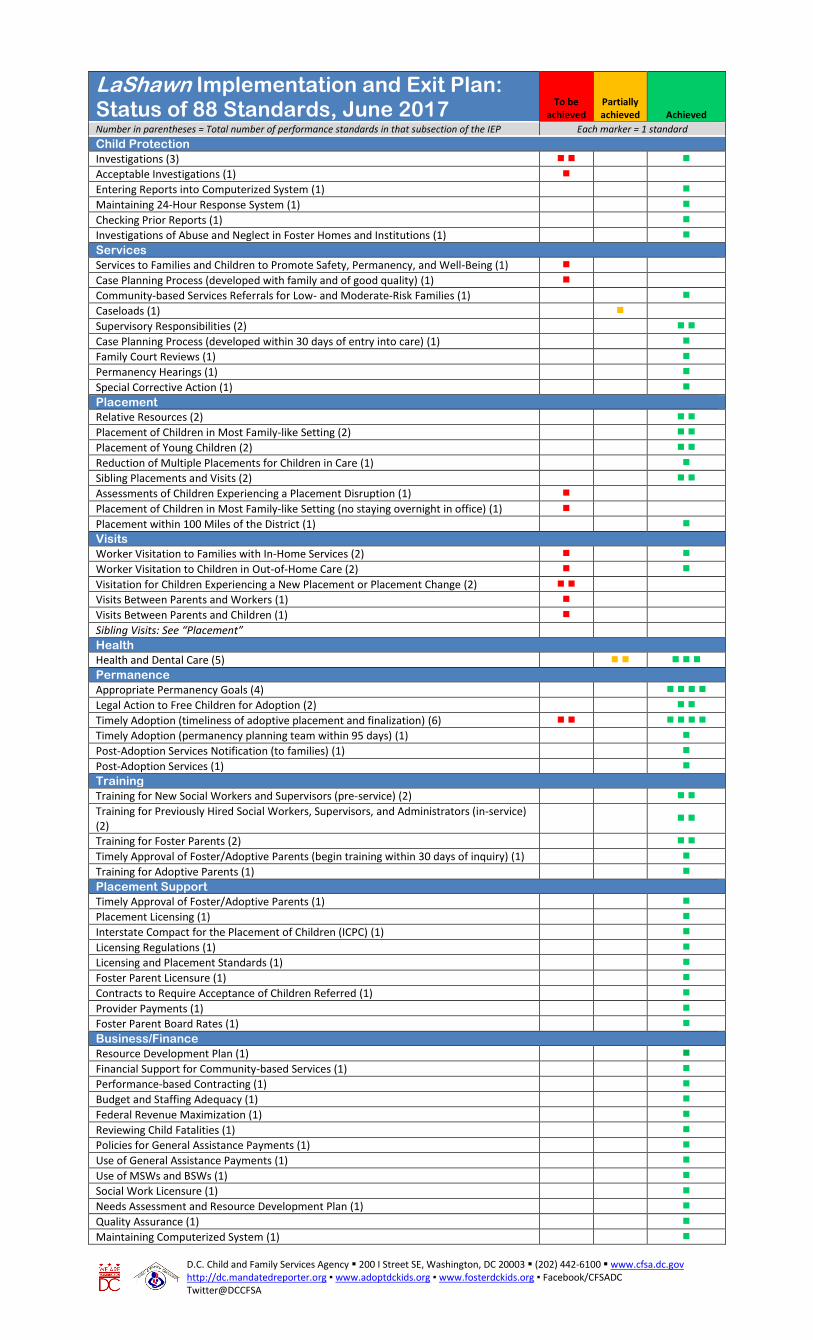
LaShawn Implementation and Exit Plan: Status of 88 Standards, June 2017
To be achieved
Partially achieved Achieved
Number in parentheses = Total number of performance standards in that subsection of the IEP Each marker = 1 standard
Child Protection Investigations (3)
Acceptable Investigations (1)
Entering Reports into Computerized System (1)
Maintaining 24-Hour Response System (1)
Checking Prior Reports (1)
Investigations of Abuse and Neglect in Foster Homes and Institutions (1)
Services Services to Families and Children to Promote Safety, Permanency, and Well-Being (1)
Case Planning Process (developed with family and of good quality) (1)
Community-based Services Referrals for Low- and Moderate-Risk Families (1)
Caseloads (1)
Supervisory Responsibilities (2)
Case Planning Process (developed within 30 days of entry into care) (1)
Family Court Reviews (1)
Permanency Hearings (1)
Special Corrective Action (1)
Placement Relative Resources (2)
Placement of Children in Most Family-like Setting (2)
Placement of Young Children (2)
Reduction of Multiple Placements for Children in Care (1)
Sibling Placements and Visits (2)
Assessments of Children Experiencing a Placement Disruption (1)
Placement of Children in Most Family-like Setting (no staying overnight in office) (1)
Placement within 100 Miles of the District (1)
Visits Worker Visitation to Families with In-Home Services (2)
Worker Visitation to Children in Out-of-Home Care (2)
Visitation for Children Experiencing a New Placement or Placement Change (2)
Visits Between Parents and Workers (1)
Visits Between Parents and Children (1)
Sibling Visits: See “Placement”
Health Health and Dental Care (5)
Permanence Appropriate Permanency Goals (4)
Legal Action to Free Children for Adoption (2)
Timely Adoption (timeliness of adoptive placement and finalization) (6)
Timely Adoption (permanency planning team within 95 days) (1)
Post-Adoption Services Notification (to families) (1)
Post-Adoption Services (1)
Training Training for New Social Workers and Supervisors (pre-service) (2)
Training for Previously Hired Social Workers, Supervisors, and Administrators (in-service) (2)
Training for Foster Parents (2)
Timely Approval of Foster/Adoptive Parents (begin training within 30 days of inquiry) (1)
Training for Adoptive Parents (1)
Placement Support Timely Approval of Foster/Adoptive Parents (1)
Placement Licensing (1)
Interstate Compact for the Placement of Children (ICPC) (1)
Licensing Regulations (1)
Licensing and Placement Standards (1)
Foster Parent Licensure (1)
Contracts to Require Acceptance of Children Referred (1)
Provider Payments (1)
Foster Parent Board Rates (1)
Business/Finance Resource Development Plan (1)
Financial Support for Community-based Services (1)
Performance-based Contracting (1)
Budget and Staffing Adequacy (1)
Federal Revenue Maximization (1)
Reviewing Child Fatalities (1)
Policies for General Assistance Payments (1)
Use of General Assistance Payments (1)
Use of MSWs and BSWs (1)
Social Work Licensure (1)
Needs Assessment and Resource Development Plan (1)
Quality Assurance (1)
Maintaining Computerized System (1)
D.C. Child and Family Services Agency 200 I Street SE, Washington, DC 20003 (202) 442-6100 www.cfsa.dc.gov http://dc.mandatedreporter.org ▪ www.adoptdckids.org ▪ www.fosterdckids.org ▪ Facebook/CFSADC Twitter@DCCFSA