CF PPT
34
CORPORATE FINANCE – II PRESENTATION
Transcript of CF PPT

CORPORATE FINANCE – IIPRESENTATION

Financial statement analysis

What is financial statement analysis?
Financial statement analysis is a method or process involving specific techniques for evaluating risks, performance, financial health, and future prospects of an organization.
It is the process of reviewing and analysing a company's financial statements to make better economic decisions.
Financial Statements are written reports that quantify the financial strength, performance and liquidity of a company. Financial Statements reflect the financial effects of business transactions and events on the entity.
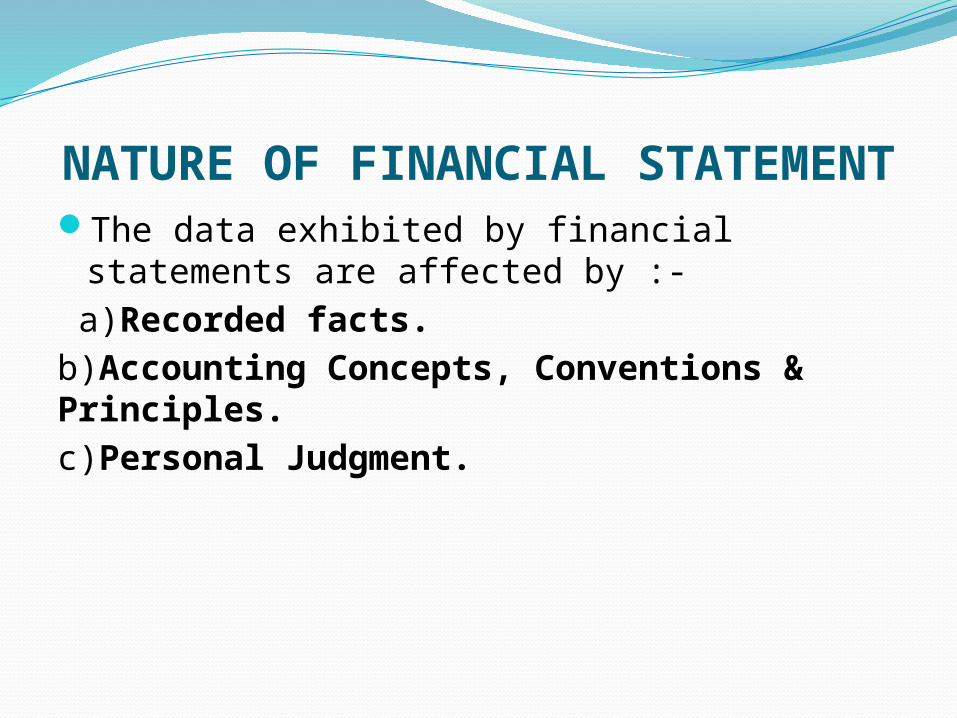
NATURE OF FINANCIAL STATEMENT The data exhibited by financial statements are affected by :-
a)Recorded facts.b)Accounting Concepts, Conventions & Principles.c)Personal Judgment.
Why Financial Statement Analysis?
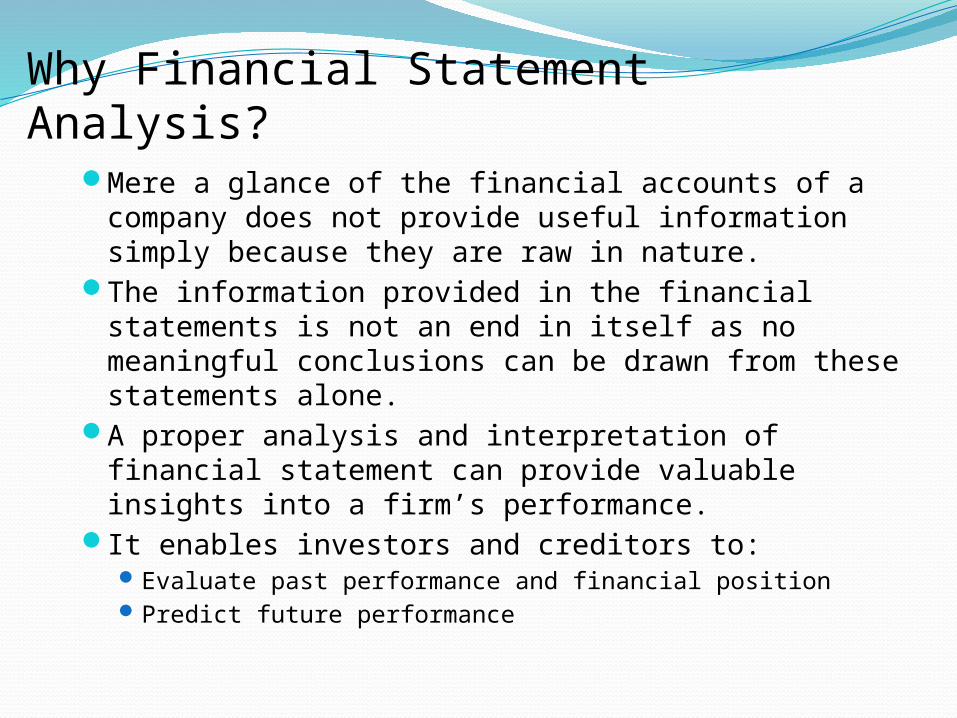
Mere a glance of the financial accounts of a company does not provide useful information simply because they are raw in nature.
The information provided in the financial statements is not an end in itself as no meaningful conclusions can be drawn from these statements alone.
A proper analysis and interpretation of financial statement can provide valuable insights into a firm’s performance.
It enables investors and creditors to:Evaluate past performance and financial positionPredict future performance

TOOLS OF FINANCIAL STATEMENT ANALYSIS
1. Comparative Statements 2. Common Size Statements3. Trend Analysis4. Ratio Analysis 5. Fund Flow Statement6. Cash Flow Statement

1. Comparative Financial Statements
Comparative Financial Statements is a statement of Financial Position of a business designed in such a way where a comparative study is undertaken of different accounting items, to measure the performance of a Business Activity.
They carry data relating to two or more years and facilitate the comparison of an item with previous years and even the future figures may be projected using time series / regression analysis.
The two comparative statements are:1. Balance Sheet2. Income Statement

Increase/Decrease (Am ount)
Rs
Increase/Decrease (% )
2006 (Rs) 2007(Rs)ASSETS
Current Assets:Cash in hand & at Bank 20,000 80,000 60,000 300Bills Receivables 1,50,000 90,000 -60,000 -40Sundry Debtors 2,00,000 2,50,000 50,000 25Stock 2,50,000 3,50,000 1,00,000 40Prepaid Expences 2,000 2,000
Total Current Assets 6,20,000 7,72,000 1,52,000 24.52Fixed Assets:
Land & Buildings 3,70,000 2,70,000 - 1,00,000 -27.03Plant & M achinery 4,00,000 6,00,000 2,00,000 50Furniture 20,000 25,000 5,000 25O ther Fixed Assets 25,000 30,000 5,000 20Total Fixed Assets 8,15,000 9,25,000 1,10,000 13.49Total Assets 14,35,000 16,97,000 2,62,000 18.26
LIABILITIES & CAPITALCurrent Liabilities:
Bills payable 50,000 45,000 -5,000 -10Sundry Creditors 1,00,000 1,20,000 20,000 20O ther Current Liabilities 5,000 10,000 5,000 100Total Current Liabilities 1,55,000 1,75,000 20,000 12.9Debentures 2,00l,000 3,00,000 1,00,000 50Long-term loans on M ortgage 1,50,000 2,00,000 50,000 33Total Liabilities 5,05,000 6,75,000 1,70,000 33.66Equity Share Capital 6,00,000 8,00,000 2,00,000 33Reserves & Surplus 3,30,000 2,22,000 -1,08,000 -32.73Total 14,35,000 16,97,000 2,62,000 18.26
Year ending 31 Dec.
Com parative Balance Sheet of a Com panyfor the year ending Decem ber 31, 2006 and 2007
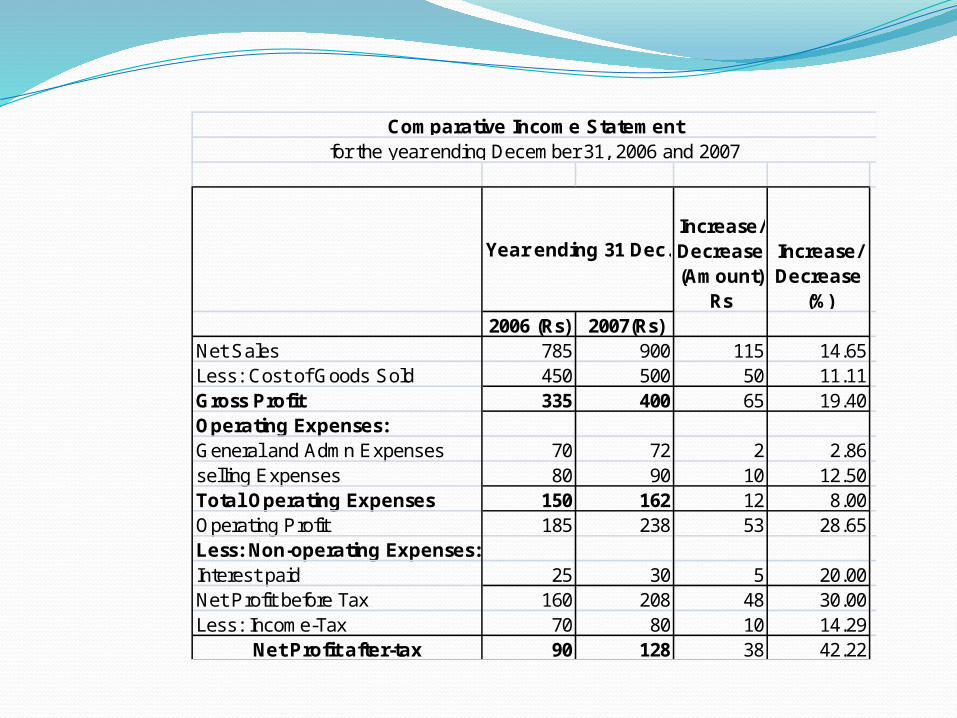
Increase/Decrease (Am ount)
Rs
Increase/Decrease
(%)2006 (Rs) 2007(Rs)
Net Sales 785 900 115 14.65Less: Cost of Goods Sold 450 500 50 11.11Gross Profit 335 400 65 19.40Operating Expenses:General and Adm n Expenses 70 72 2 2.86selling Expenses 80 90 10 12.50Total Operating Expenses 150 162 12 8.00Operating Profit 185 238 53 28.65Less: Non-operating Expenses:Interest paid 25 30 5 20.00Net Profit before Tax 160 208 48 30.00Less: Incom e-Tax 70 80 10 14.29
Net Profit after-tax 90 128 38 42.22
for the year ending Decem ber 31, 2006 and 2007
Year ending 31 Dec.
Com parative Incom e Statem ent
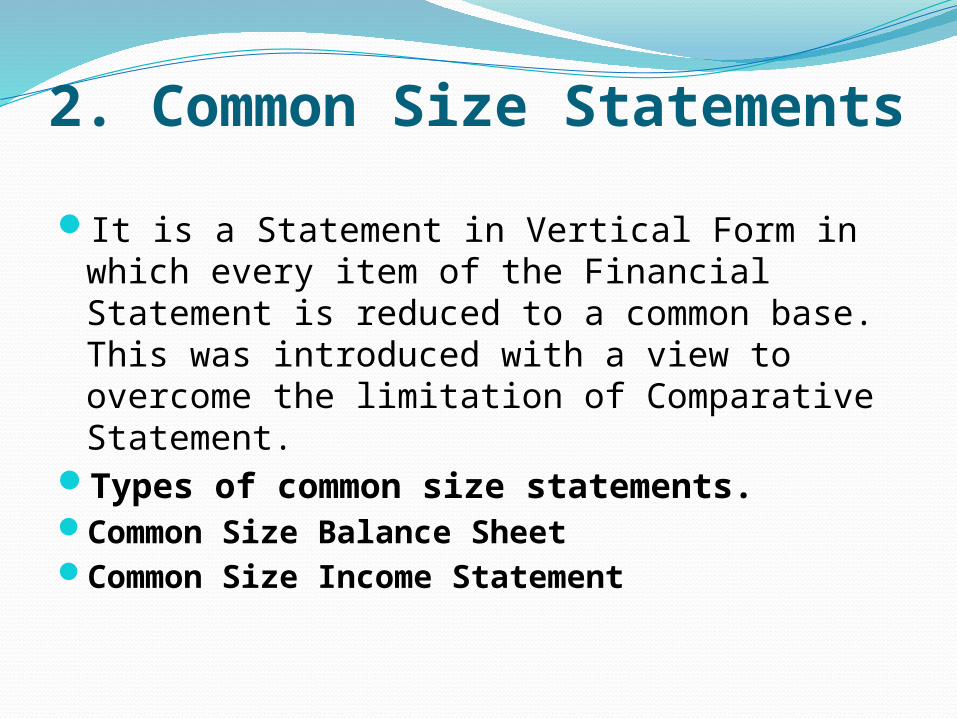
2. Common Size Statements It is a Statement in Vertical Form in which every item of the Financial Statement is reduced to a common base. This was introduced with a view to overcome the limitation of Comparative Statement.
Types of common size statements.Common Size Balance SheetCommon Size Income Statement

Rs % Rs %ASSETS
Current Assets:Cash in hand & at Bank 20,000 1.39 80,000 4.71 Bills Receivables 150,000 10.45 90,000 5.30 Sundry Debtors 200,000 13.94 250,000 14.73 Stock 250,000 17.42 350,000 20.62 Prepaid Expences - 2,000 0.12
Total Current Assets 620,000 43.21 772,000 45.49 Fixed Assets:
Land & Buildings 370,000 25.78 270,000 15.91 Plant & M achinery 400,000 27.87 600,000 35.36 Furniture 20,000 40.00 25,000 1.47 Other Fixed Assets 25,000 1.74 30,000 1.77 Total Fixed Assets 815,000 56.79 925,000 54.51 Total Assets 1,435,000 100.00 1,697,000 100.00
LIABILITIES & CAPITALCurrent Liabilities:
Bills payable 50,000 3.48 45,000 2.65 Sundry Creditors 100,000 6.97 120,000 7.07 Other Current Liabilities 5,000 0.35 10,000 0.59 Total Current Liabilities 155,000 10.80 175,000 10.31 Debentures 200,000 13.94 300,000 17.68 Long-term loans on M ortgage 150,000 10.45 200,000 11.79 Total Liabilities 505,000 35.19 675,000 39.78 Equity Share Capital 600,000 41.81 800,000 47.14 Reserves & Surplus 330,000 23.00 222,000 13.08 Total Liabilities 1,435,000 100.00 1,697,000 100.00
2006 2007
Com m on-size Balance Sheetas on Dec.31, 2007

Rs.(000) % Rs.(000) %Net Sales 785 100.00 900 100.00 Less: Cost of G oods Sold 450 57.32 500 55.56 G ross Profit 335 42.68 400 44.44 O perating Expenses:G eneral and Adm n Expenses 70 8.92 72 8.00 selling Expenses 80 10.19 90 10.00 Total O perating Expenses 150 19.11 162 18.00 O perating Profit 185 23.57 238 26.44 Less: Non-operating Expenses:Interest paid 25 3.18 30 3.33 Net Profit before Tax 160 20.38 208 23.11 Less: Incom e-Tax 70 8.92 80 8.89
Net Profit after-tax 90 11.46 128 14.22
2006 (Rs) 2007(Rs)
Com m on-size Incom e Statem entfor the years ending Dec. 2006 and 2007

3. Trend Analysis Trend Analysis is a statement in vertical form where the earliest year is taken as base year and the value of all the items in the financial statements will be related to the base year in terms of % where value of each item in base year will be considered as 100. Trend % analysis move in one directions either upward or downward progression or regression.
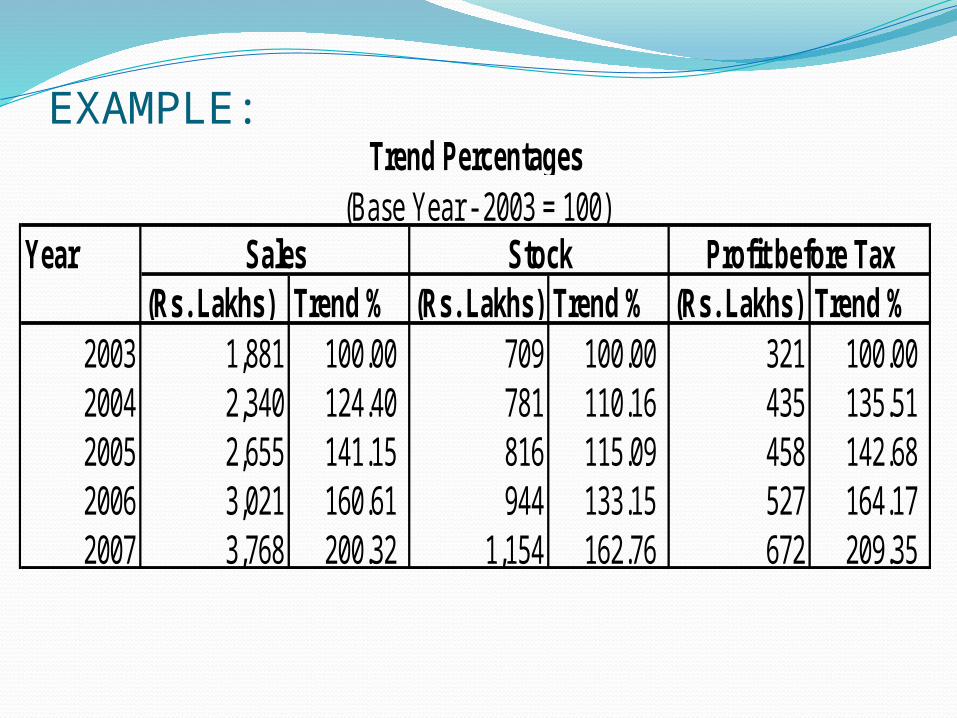
EXAMPLE:
Year(Rs. Lakhs) Trend % (Rs. Lakhs) Trend % (Rs. Lakhs) Trend %
2003 1,881 100.00 709 100.00 321 100.00 2004 2,340 124.40 781 110.16 435 135.51 2005 2,655 141.15 816 115.09 458 142.68 2006 3,021 160.61 944 133.15 527 164.17 2007 3,768 200.32 1,154 162.76 672 209.35
Sales Stock Profit before Tax
Trend Percentages(Base Year - 2003 = 100)

4.Ratio AnalysisA ratio is an arithmetic relationship between two figures.
Financial ratio analysis is a study of ratios between various items or group of items in financial statements.
Ratio analysis is used to evaluate various aspects of a company’s operating and financial performance such as its efficiency, liquidity, profitability and solvency.

Types of financial ratio analysisLiquidity ratio Asset utilization ratio Inventory ratioSolvency ratioProfitability ratio

5.Cash flow statementA Cash Flow Statement is a statement showing changes in cash position of the firm from one period to another. It explains the inflows (receipts) and outflows (disbursements) of cash over a period of time.
The inflows of cash may occur from sale of goods, sale of assets, interest, dividend, rent, short-term borrowing, etc. The cash outflows may occur on account of purchase of goods, purchase of assets, payment of tax and dividend, etc.

A Cash Flow Statement comprises information on following 3 activities:Operating-activities (sales of goods or services)
Investing-activities (sale or purchase of an asset)
Financing-activities (borrowings, or sale of common stock)
Together, these sections show the overall (net) change in the firm's cash-flow for the period the statement is prepared.


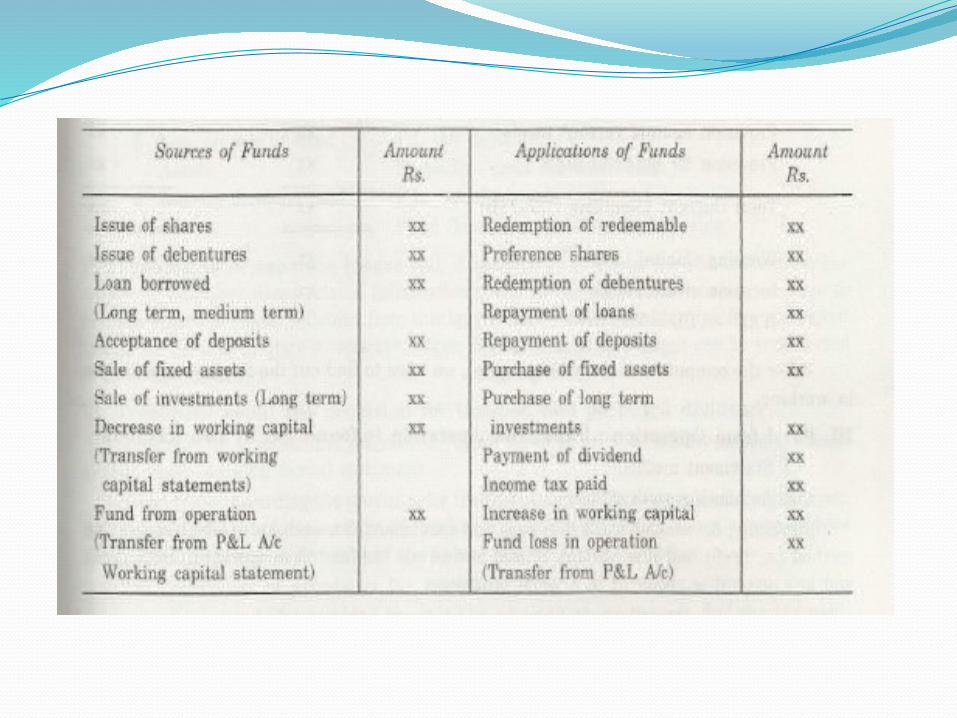
FUND FLOW STATEMENTFunds Flow Statement states the changes in the working capital of the business in relation to the operations in one time period.
The main components of Working Capital are:Current Assets 1. Cash 2. Receivables 3. InventoryCurrent Liabilities 1. PayablesNet working capital is the total change in the business's working capital, calculated as total change in current assets minus total change in current liabilities.

FUND FLOW STATEMENTThe net of all cash inflows and outflows in and out of various financial assets. Fund flow is usually measured on a monthly or quarterly basis. The performance of an asset or fund is not taken into account, only share redemptions (outflows) and share purchases (inflows).
Net inflows create excess cash for managers to invest, which theoretically creates demand for securities such as stocks and bonds.

advantagesHelps investors in decision making.Regulatory authorities like IASB can ensure the company following the required accounting standards.
Helpful to the government agencies in analysing the taxation owed to the firm.
Above all, the company is able to analyse its own performance over a specific time period.

LimitationsComparability of financial data and the need to look beyond ratios.
Although comparisons between two companies can provide valuable clues about a company’s financial health, alas, the differences between companies’ accounting methods make it, sometimes, difficult to compare the data of the two.
Many a times sufficient data are on hand in the form of foot notes to the financial statements so as to restate data to a comparable basis.
The analyst should remember the lack of data comparability before reaching any clear-cut conclusion. However, even with this limitation, comparisons between the key ratios of two companies along with industry averages often propose avenues for further investigation.

PRADHANMANTRI JAN DHAN YOJANA
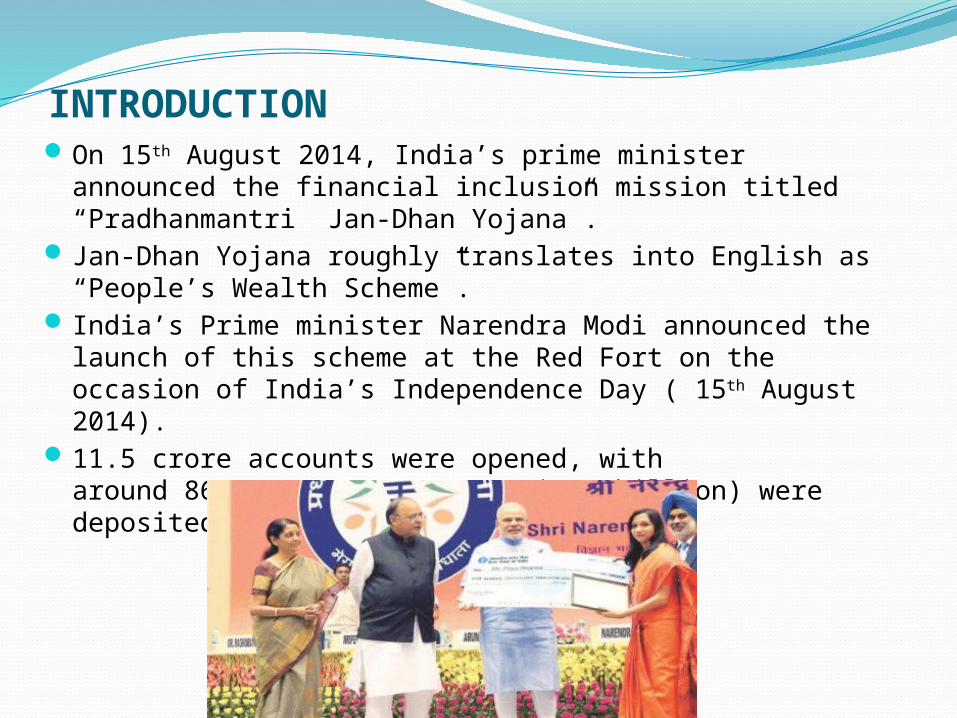
INTRODUCTIONOn 15th August 2014, India’s prime minister announced the financial inclusion mission titled “Pradhanmantri Jan-Dhan Yojana”.
Jan-Dhan Yojana roughly translates into English as “People’s Wealth Scheme”.
India’s Prime minister Narendra Modi announced the launch of this scheme at the Red Fort on the occasion of India’s Independence Day ( 15th August 2014).
11.5 crore accounts were opened, with around 8698 crore rupees (US$1.4 billion) were deposited under the scheme

About PMJDYThe name “Jan Dhan” was chosen through an Online Competition on the MyGov Platform, received more than 6000 suggestions from Indian citizens.
7 individuals was suggested “Jan Dhan”.Slogan – Mera Khata-Bhagya Vidhaatha.Primarily the PMJDY Scheme is meant for those who do not have a savings bank account.
Only 58% of Indian citizens are having a bank account.

Aim of PMJDYTo bring poor financially excluded people into banking system.
It covers both urban & rural areas.
Raise of Indian Economy.
To decrease corruption in Government subsidy schemes.
Digitalise India.
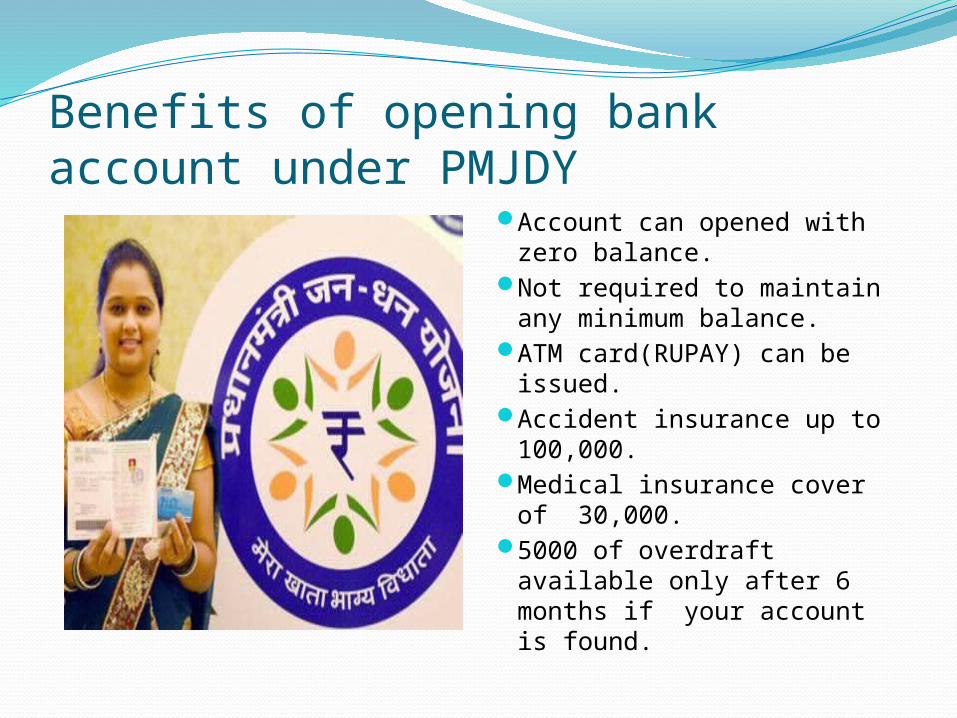
Benefits of opening bank account under PMJDY
Account can opened with zero balance.
Not required to maintain any minimum balance.
ATM card(RUPAY) can be issued.
Accident insurance up to 100,000.
Medical insurance cover of 30,000.
5000 of overdraft available only after 6 months if your account is found.
ParticipantsNationalized Banks Private –Sector BanksSBIBank of BarodaBank of IndiaCanara BankIDBI BankIndian BankPNBUnion Bank of IndiaOriental Bank of commerce
Axis Bank Federal BankHDFC BankICICI BankIndus BankING Vysha BankAndhra BankYES BankKotak Mahindra BankKarnataka Bank

PMJDY
50000
employees
7000 branches
20000
ATM’s

Reaching of Target with in a DayBank Number of accountsIDBIUnion BankDena BankICICIBank of MaharashtraSBI
3,62,0005,50,0003,00,0001,00,0002,90,00020,00,000(from Aug-16)

BIBLIOGRAPHYwww.businessdictionary.comwww.moneycontrol.comwww.myaccountingcourse.comwww.investopedia.comwww.thehindubusiness.comwww.pmjdy.gov.inwww.Indiamicrofinance.com
THANKYOU !A presentation by:-
Mithil kadam (21)Ishita maniar (31)rohan sawhney (45)
Anokhee vakharia (52)