The Molecular Basis of High-Altitude Adaptation in Deer Mice

This is an Accepted Article that has been peer-reviewed and approved for publication in the Experimental Physiology, but has yet to undergo copy-editing and proof correction. Please cite this article as an Accepted Article; doi: 10.1113/expphysiol.2014.082479. This article is protected by copyright. All rights reserved. 1
Cerebral autoregulation index at high altitude assessed by leg cuff and transfer
function analysis techniques
Andrew W. Subudhi1, 2, Katalin Grajzel3, Robert J. Langolf4, Robert C. Roach2, Ronney B.
Panerai5, John E. Davis4
1. University of Colorado Colorado Springs, Department of Biology, Colorado Springs,
Colorado USA
2. University of Colorado Altitude Research Center, Department of Emergency
Medicine, Aurora, Colorado USA
3. University of Colorado Colorado Springs, Department of Psychology, Colorado
Springs, Colorado USA
4. Alma College, Department of Integrative Physiology and Health Science, Alma,
Michigan USA
5. University of Leicester, Department of Cardiovascular Sciences and NIHR
Biomedical Research Unit, United Kingdom
Running Head: Cerebral autoregulation at altitude
Key Words: hypoxia, transcranial Doppler, cerebral blood flow, middle cerebral artery,
arterial blood pressure
Corresponding author:
Andrew W. Subudhi, PhD
Associate Professor
Department of Biology
1420 Austin Bluffs Parkway
Colorado Springs, Colorado 80918
Email: [email protected]
Phone: 719-255-3938
This article is protected by copyright. All rights reserved. 2
New Findings
What is the central question of this study?
Whether cerebral autoregulation (CA) is impaired at high altitude and associated with
acute mountain sickness remains controversial. We sought to compare two of the most
common methods to assess dynamic CA in subjects that ascended and acclimatized to
3424m.
What is the main finding of this study?
We found that CA was reduced at 3424m when assessed by the classic leg cuff
inflation/deflation technique, but not when evaluated by transfer function analysis.
These findings suggest that the cerebral vasculature of healthy individuals may become
less able to buffer a large, abrupt drop in ABP, while still maintaining the ability to
regulate slow rhythmical oscillations, during periods of moderate hypoxemia.
Abstract
The occurrence and implications of changes in cerebral autoregulation (CA) at high
altitude are controversial and confounded by differences in methods used to assess CA.
To compare two of the most common methods of dynamic CA assessment, we studied
11 young, healthy sea-level residents (6 female, 5 male; 20.5 ± 2.3 years) as they
ascended and acclimatized to 3424 m over 13 days. A common autoregulation index
(ARI) was calculated from 1) transfer function analysis (TFA ARI) of resting oscillations
in arterial blood pressure (ABP; finger plethysmography) and middle cerebral artery
blood velocity (MCAv; transcranial Doppler), and 2) MCAv responses following large,
abrupt drops in ABP using the classic leg cuff technique (Cuff ARI). Symptoms of acute
mountain sickness (AMS) were monitored using the Lake Louise AMS Questionnaire.
Cuff ARI scores decreased (P=0.021) as subjects ascended from low (4.7± 1.5) to high
altitude (3.2 ± 1.6) and did not change after 13 days of acclimatization (2.9 ± 1.3). TFA
ARI scores were not affected by ascent or acclimatization to 3424 m. Neither Cuff nor
TFA ARI scores were correlated with AMS symptoms. These findings suggest that the
cerebral vasculature of healthy individuals may become less able to buffer large step
changes in ABP, while still maintaining the ability to regulate slow rhythmical
oscillations, during periods of moderate hypoxemia. Given the inherent differences in
the autoregulatory stimulus between methods, multiple assessment techniques may be
needed to clarify the implications of changes in cerebrovascular regulation at high
altitude.

This article is protected by copyright. All rights reserved. 3
Introduction
Cerebral autoregulation (CA) describes the ability of cerebral blood vessels to maintain
relatively consistent blood flow despite changes in perfusion pressure (Paulson et al.,
1990). A reduction in CA reflects a more passive relation between perfusion pressure
and blood flow and has negative connotations because of its association with
cerebrovascular disorders (Steinmeier et al., 1996; Panerai et al., 1998; Aries et al.,
2010). However, reduced CA is not always associated with poor health. Independent
findings from several laboratories have reported reduced CA in healthy, active
individuals at high altitude (Jansen et al., 2000; Ainslie et al., 2008; Iwasaki et al., 2011;
Subudhi et al., 2014). These findings have raised the possibility that a more passive
pressure-flow relation in the brain may be a benign, or perhaps even a positive,
response to hypoxemia at high altitude (Bailey, 2010; Subudhi et al., 2014).
Unfortunately, progress in this area has been somewhat hampered by the lack of a gold
standard technique to assess and interpret cerebral pressure-flow relations.
Assessments of CA are generally classified as being static or dynamic . Static CA refers to steady-state relations between arterial blood pressure (ABP) and cerebral
blood flow (CBF), while dynamic CA characterizes changes in CBF relative to more
abrupt changes in ABP. Using phenylephrine to alter steady-state ABP, Jansen et al.
(Jansen et al., 2000) were the first to show proportional increases in ABP and CBF -
indicative of lost static CA - among healthy high-altitude natives living at 4243 m. Later,
using the same technique on residents of various altitudes, they reported that static CA
was unchanged up to ~3400 m, but lost at higher elevations without outward
complications on cerebrovascular health (Jansen et al., 2007). These studies suggested
that reduced static CA may be an inherent facet of life at high altitude, but the more
variable responses observed in newcomers to high altitude (Jansen et al., 2000) left
open the possibility that reduced CA might be involved in the development of acute
mountain sickness (AMS).
Due to the invasive nature of static CA techniques and contraindications of performing
phenylephrine injections in those suffering from AMS, others have used non-invasive
means to gauge dynamic CA. The most widely accepted of these methods is the leg cuff
This article is protected by copyright. All rights reserved. 4
test (Aaslid et al., 1989), which evaluates the CBF response following a large drop in
ABP induced by rapid cuff deflation. Results can be scored in terms of composite
autoregulation index (ARI) on a 10-point scale (Tiecks et al., 1995). Surprisingly, the
classic leg cuff test has only been used once at high altitude. Van Osta et al. (Van Osta et
al., 2005), reported no change in CA from sea level to 4559 m, but noted some indirect
evidence that ARI scores were related to AMS symptoms. More recently Cochand et al.
(Cochand et al., 2011) found that those with the lowest leg cuff ARI scores at sea level
appeared to be more prone to AMS during a subsequent mountain climbing expedition;
yet, no measures of CA at high altitude were reported (Cochand et al., 2011). It thus
remains to been seen if the classic leg cuff test reveals meaningful changes in CA at high
altitude.
The majority of studies reporting reduced CA at high altitude have applied transfer
function analysis (TFA) to spontaneous oscillations in ABP and CBF. This alternative
dynamic CA technique is appealing because it is non-invasive and requires only ~5 min
of resting data collection. In the frequency domain, the dynamic relation between the
ABP and CBF is expressed by their auto- and cross-spectra, leading to three different
metrics: coherence (similar to linear correlation), gain (relative ratio of CBF and ABP
spectra) and phase shift (delay between ABP and CBF). These metrics can be combined
to yield an ARI score (Panerai et al., 1998), akin to that of the cuff test. Theoretically,
decreased CA should be reflected by increased coherence and gain along with decreased
phase shift and ARI scores. In general, authors have reported reduced CA in hypoxic
conditions by TFA and little to no association with AMS, but results are not consistent.
Only three studies have shown hypoxia-induced changes in all CA metrics in the
aforementioned directions (Subudhi et al., 2010; Iwasaki et al., 2011; Subudhi et al.,
2014). Other studies have only found changes in subsets of the metrics (Ainslie et al.,
2008; Subudhi et al., 2009; Nishimura et al., 2010; Smirl et al., 2014), or no changes at
all (Ogoh et al., 2010). Differences in experimental designs (e.g. ascent rates, elevations
of study, timing of measurements), and technical settings used in the TFA (e.g. sampling
frequency, normalization, detrending, filtering, window size), make direct comparisons
between studies difficult (Meel-van den Abeelen et al., 2014) and cloud the
interpretation of TFA results at high altitude.

This article is protected by copyright. All rights reserved. 5
In the absence of a gold standard method to assess CA and with the understanding that
each assessment technique may reflect slightly different components of cerebral
pressure-flow regulation (Tzeng et al., 2012), it is unfortunate that no studies have
utilized both leg cuff and TFA methods of assessing CA at high altitude. Evaluating how
different methods respond to hypoxia may further our understanding of cerebral
pressure-flow relations in healthy and ill individuals. In this study, we compared leg cuff
and TFA CA assessments in subjects who ascended and acclimatized to high altitude
over a two-week period. We hypothesized that the ARI calculated from both methods
would be reduced upon ascent and after acclimatization, but not related to AMS
symptoms.
Methods
Subjects
Following institutional ethical board approval, twelve volunteers from the staff and
student body of Alma College gave their written consent to participate in the study in
accordance with the Declaration of Helsinki. All subjects were healthy and physically fit
with no exposure to altitudes above 1500 m in the past 3 months.
Design
Subjects were transported by car from near sea level (Alma, Michigan: elevation 224 m)
to low altitude (Denver, Colorado: elevation 1,650 m) over 24 hours. Following a 24-
hour stay at low altitude, subjects ascended by car to high altitude (Vail Pass: elevation
3251m) over 3 hours, then snowshoed to the Shrine Mountain Inn (elevation 3424 m;
39 ’ 8. N, ’ . W) over 1.5 hours. Subjects resided at the Shrine
Mountain Inn for 14 days and participated in recreational activities, such as
snowshoeing and skiing, at altitudes ranging from 3250 to 4349 m. Longitudinal
assessments of CA were made at low altitude (Baseline) and on the second (ALT2) and
13th (ALT13) day at the Shrine Mountain Inn. Measurements on each subject were
performed at the same time of day to limit the influence of activity, diet, and diurnal
variations.
This article is protected by copyright. All rights reserved. 6
Protocol
Subjects were seated upright with their heads, arms and feet supported throughout the
~40 min protocol. Resting data were collected for a minimum of 6 min. Bilateral thigh
cuffs were then inflated (>30 mmHg above systolic blood pressure) to partially occlude
leg blood flow (E20 AG101 Rapid Cuff Inflation System with CC22 contoured cuffs, D.E.
Hokanson, Bellview, WA USA). Subjects were instructed to remain relaxed and were not
given feedback regarding elapsed time during cuff occlusion. After 3 min of occlusion,
the cuffs were rapidly deflated and physiologic responses were monitored for an
additional 1 min while subjects remained still. The cuff procedure was repeated 2 or 3
times with 5 min breaks between trials.
Measurements
Physiologic variables Continuous measurements of arterial blood pressure (ABP) were
obtained by finger plethysmography (Nexfin HD, Edwards Lifesciences, Irvine, CA USA).
Corresponding blood velocity measurements were taken in the left middle cerebral
artery (MCAv) by transcranial Doppler (EZ-Dop, DWL USA, San Juan Capistrano, CA
USA) at depths ranging from 45 to 55 mm. Subsequent repositioning of the 2 MHz
Doppler probe was facilitated by photographs documenting the position and angle
relative to the supporting headset (Spencer technologies, Seattle, WA USA). Partial
pressures of end-tidal oxygen (PETO2) and carbon dioxide (PETCO2) were determined
from air sampled through a nasal cannula by a fast-response gas analyzer (O2cap,
Oxigraf, Mountain View, CA USA). Arterial oxygen saturation was monitored by finger
pulse oximetry (SpO2; Nellcor N-200, Covidien, Mansfield, MA USA). Heart rate was
measured by lead II electrocardiography (Bioamp, ADInstruments, Colorado Springs, CO
USA). Analog signals from all instruments were recorded at 200 Hz for offline analysis
(Powerlab 26T ADInstruments, Colorado Springs, CO USA).
Acute Mountain Sickness Self-reported sections of the Lake Louise AMS Questionnaire
(LLQ) were used to assess symptoms of AMS as subjects ascended and acclimatized to
high altitude. Composite LLQ scores ≥ , which included at least a mild headache, were
considered positive for AMS (Roach et al., 1993).
This article is protected by copyright. All rights reserved. 7
Analyses
Cuff tests The MCAv response relative to the drop in ABP following cuff deflation was
quantified using the ARI (Tiecks et al., 1995). Briefly, if CA is completely absent, the
initial drop and subsequent recovery of ABP will be reflected by parallel changes in
MCAv and assigned a Cuff ARI score of 0. Incremental improvements in CA are assigned
values up to 9, as the drop in MCAv is blunted and its recovery is hastened. Cuff ARI
analyses were performed using custom software (Cerebral Hemodynamic Analysis
written by R. Aaslid). Continuous recordings of ABP and MCAv were down sampled
from 200 to 100 Hz and low-pass filtered with a cut-off frequency of 0.5 Hz prior to ARI
curve fitting. Trials in which the drop in ABP was < 15 mmHg were excluded from
analysis (Tiecks et al., 1995). The remaining Cuff ARI values for each individual were
averaged across each time point (Baseline, ALT2, ALT13) for statistical analyses.
Transfer function analysis Spontaneous fluctuations in ABP and MCAv across the last 6
min of the resting period were used to derive TFA ARI scores using custom software
(written by R.B. Panerai), as previously described (Subudhi et al., 2009, 2010). Briefly,
data were cleaned to remove spikes in the Doppler spectrum by linear interpolation and
normalized to characterize percent change from the beginning of the recording period,
thereby minimizing potential effects of changes in ABP and MCAv over the study. Beat-
by-beat averages of ABP and MCAv were resampled at 5 Hz and transformed into the
frequency domain by Fast Fourier Transformations (512 point window, 40% overlap).
The dynamic relation between the resulting ABP to MCAv spectra was expressed in
terms of coherence, gain, and phase shift in the very low frequency range (0.02 - 0.07
Hz), where dynamic CA is most active, as well as in low (0.07 to 0.20 Hz) and high (0.20
to 0.40 Hz) frequency ranges. The inverse transformation of the resulting gain and
phase shift was used to express results in the time domain as a step function that was
fitted to one of the 10 ARI curves described above. This process yielded TFA ARI scores
that were conceptually similar to the Cuff ARI scores.

This article is protected by copyright. All rights reserved. 8
Statistics
Data were analyzed by repeated measures ANOVAs with planned pairwise Sidak-Holm
contrasts to control for Type I error. Relations between Cuff and TFA ARI
measurements were evaluated by Pearson product moment correlations. Relations
between ARI measurements and LLQ scores were evaluated by Spearman correlations.
Statistical significance was considered when P < 0.05. Data are presented as mean ±
standard deviation.
Results
Resting data
Of the 12 consenting volunteers, one was excluded from the study at Baseline because
of an insufficient acoustic window for Doppler measurements. The remaining 11
subjects (6 females, 5 males; 20.5 ± 2.3 years; 172.0 ± 6.7 cm; 68.5 ± 10 kg) showed
typical responses upon ascent to high altitude at ALT2, including increased heart rate
and reduced SpO2 and PETCO2 (all P < 0.001; Table 1), without changes in ABP or MCAv.
Two subjects reported mild AMS (LLQ of 3 and 5 with headaches) at ALT2. Over 11 days
of high-altitude residence, AMS symptoms resolved and subjects showed clear signs of
ventilatory acclimatization, reflected by increased SpO2 and reduced PETCO2 without
changes in ABP or MCAv from ALT2 to ALT13 (both P < 0.001).
Leg cuff tests
Data from one additional subject were excluded from statistical analysis because of
insufficient reductions in ABP following cuff deflation (< 10 mmHg on three trials) at
Baseline. Rapid cuff deflation reduced ABP by 22 ± 6, 23 ± 4, and 23 ± 6 mmHg at
Baseline, ALT2, and ALT13, respectively. Overall Cuff ARI responses were indicative of
reduced CA at high altitude (P=0.021). Cuff ARI was reduced ~30% from Baseline to
ALT2 (P=0.037). This response was consistent after acclimatization, as the change from
Baseline to ALT13 was also ~30% (P=0.037; Table 1; Figure 1).

This article is protected by copyright. All rights reserved. 9
Transfer function analysis
The TFA analysis did not show evidence of reduced CA from Baseline to high altitude in
any of the frequency ranges analyzed. Although the repeated measures ANOVA for TFA
ARI approached significance (P = 0.065), no changes in underlying measures of
coherence, gain or phase shift were detected (Table 1, Figure 2).
Relations between ARI and AMS scores
There was a moderately strong relation between Cuff and TFA ARI assessments (r =
0.45, P < 0.01, Figure 3). Cuff and TFA ARI scores measured at either Baseline or ALT2
were not related to LLQ scores at ALT2 (r range -0.40 to 0.08, all P > 0.10). The two
subjects with mild AMS at ALT2 had mid range Cuff (3.4 and 4.8) and TFA (3.2 and 4.1)
ARI scores.
Discussion
The key new findings of this study were that 1) the classic leg cuff technique detected
reductions in dynamic CA upon ascent and after acclimatization to 3424 m, while 2) the
TFA method did not, and 3) neither Cuff nor TFA ARI scores were associated with mild
symptoms of AMS. These findings imply that cerebral vasculature of healthy individuals
may become less able to buffer large step changes in ABP, while still maintaining the
ability to regulate slow rhythmical oscillations during periods of moderate hypoxemia.
The leg cuff technique may thus offer insight into hypoxia-induced changes in the
cerebral pressure-flow relation that are not captured with TFA alone.
Autoregulation index assessed by leg cuff tests
Our results demonstrate that the leg cuff test is a sensitive method for assessing
changes in dynamic CA at high altitude. The mid-range Cuff ARI scores observed at low
altitude (4.7± 1.5) were in accordance with average values (4.9 ± 1) originally reported
in individuals at sea level (Tiecks et al., 1995) and support the assumption that travel
from near sea level to low altitude had little effect on Baseline CA assessments. The
consistently large drops in ABP following rapid leg cuff deflation (~23 mmHg) provided
a standard stimulus by which to evaluate changes in the cerebral pressure-flow relation
between altitudes. A greater drop and/or delayed recovery in MCAv was observed in 9
of 10 individuals upon ascent to 3424 m and explained the ~30% reduction in Cuff ARI

This article is protected by copyright. All rights reserved. 10
scores. These effects were consistent in 8 of 10 subjects after two weeks of
acclimatization. Together, these results clearly demonstrate a more passive response in
MCAv for a given step change in ABP, indicative of reduced, but not lost, dynamic CA at
3424 m.
Our findings extend those from laboratory studies showing that acute inhalation of
hypoxic gas (< 10 min) reduces cuff derived CA scores during moderate (PIO2 ~ 100
mmHg) (Ogoh et al., 2010) and severe hypoxia (PIO2 ~ 70 mmHg) (Subudhi et al., 2009).
The similarity in findings between laboratory and field studies implies that the Cuff ARI
response in simulated altitude (normobaric hypoxia) may be comparable to that at
terrestrial altitudes (hypobaric hypoxia). More detailed laboratory studies may thus be
designed to unravel the underlying mechanisms of the response without having to go to
the field. Our results differ from the only other field study to use the leg cuff technique
(Van Osta et al., 2005). Although their application of the leg cuff technique and analysis
of data were similar to ours, the lack of reduction in their subjects’ ARI scores upon
ascent to high altitude may have been confounded by prior administration of tadalafil
and dexamethasone, two drugs shown to improve ARI (Van Osta et al., 2005). Thus,
despite a limited number of observations at high altitude, or with hypoxic gas mixtures,
the leg cuff test appears to be sensitive to changes in the regulation of cerebral blood
flow during acute periods of moderate and severe hypoxia. Our observation that the
reduction in Cuff ARI persists after two weeks of acclimatization is a testament to the
reliability of the measurement and supports the notion that reduced CA is a hallmark
characteristic of life at high altitude (Jansen et al., 2000; Subudhi et al., 2014). Why this
is so and whether reduced CA may promote successful acclimatization remain to be
answered. While our study was not designed to elucidate the mechanism of reduced CA
at high altitude, the sensitivity and reliability of Cuff ARI scores make the leg cuff test an
attractive test for future investigations.
Autoregulation index assessed by transfer function analysis
The TFA results did not show evidence of reduced CA in this study. TFA ARI scores
exhibited a downward trend when subjects were acutely exposed and acclimatized to
high altitude, but the individual metrics of coherence, gain and phase were not different
from Baseline. While there is some debate on the relative importance of changes in

This article is protected by copyright. All rights reserved. 11
individual metrics, a robust reduction in CA should result in increased coherence and
gain and decreased phase and ARI scores. The lack of change in these metrics in the
present study is in contrast to previous reports showing significant changes in all
metrics when subjects traveled between sea level and 5260 m (Iwasaki et al., 2011;
Subudhi et al., 2014) as well as between 1650 m and 4878 m (Subudhi et al., 2010). We
speculate that differences between the present and prior studies may be related to the
altitudes at which the studies were conducted. Two previous reports suggested that CA
remains intact until a threshold elevation is crossed, somewhere between 2600 and
3440 m (Iwasaki et al., 2007; Jansen et al., 2007). In the present study, we observed
relatively mild hypoxemia upon arrival at high altitude (SpO2 ~90%) compared to
studies at higher elevations (SpO2 ~75%). Thus, the degree of hypoxemia at 3424 m
may have been insufficient to cause significant changes in the relation between resting
oscillations in ABP and MCAv. Alternatively, it is possible that our small sample size
yielded insufficient statistical power to detect reduced CA (Subudhi et al., 2009), yet we
have recently shown significant changes in each metric with a similar sample size at
higher altitude (Subudhi et al., 2014). The consistency of each metric and maintenance
of mid-range ARI scores across the study indicate that autoregulatory mechanisms that
offset small oscillations in ABP remained intact at 3424 m.
General differences between leg cuff and transfer function assessments
Together, our results suggest that the leg cuff and TFA methods may capture different
components of the overall autoregulatory response to hypoxia. Previous studies have
shown strong agreement between these methods in patients with cardiovascular
disease (Panerai et al., 1998; Saeed et al., 2013). However, in the present study of young,
disease-free subjects, the two measurements only shared ~20% of their variance
(square of the correlation coefficient, r=0.45), meaning the techniques had relatively
little in common when CA was altered by hypoxia. These findings are similar to our
previous comparison of Cuff and TFA ARI scores in healthy individuals exposed to
hypobaric hypoxia (Subudhi et al., 2009) and likely reflect the discrepancies in the
nature of the ABP stimuli evaluated by each test. While the cuff test monitors the
response to a single, large and rapid drop in ABP, TFA evaluates rhythmical, small
amplitude oscillations in ABP over a longer timeframe. Our results imply that one may
lose the ability to maintain CBF when challenged by large, abrupt changes in ABP, while

This article is protected by copyright. All rights reserved. 12
still preserving the ability to handle smaller, rhythmical changes in ABP during
moderate levels of hypoxemia experienced at 3424 m. Our findings are somewhat in
contrast to a recent study in which TFA was used to evaluate CA at rest and while
subjects performed repeated squatting motions to induce larger, rhythmical
fluctuations in ABP (Smirl et al., 2014). They reported reductions in CA from sea level to
5050 m when measured at rest, but no changes when measured during the repeated
squat test. Inequalities in the nature of the ABP stimuli (single drop vs. rhythmical
fluctuations), altitudes of study, and analysis techniques make direct comparisons
difficult, but the differential responses to small and large fluctuations in ABP should be
noted. Whether a threshold exists in the magnitude and/or frequency of the ABP
stimulus needed to affect CA and whether such a threshold is altitude specific remain to
be determined. Given such differences in responses between techniques, we advocate
that future investigations use multiple methods of assessing CA at multiple altitudes to
provide a more comprehensive view of CA in hypoxia.
Significance
Whether the CBF responses to these varied stimuli have practical relevance remains to
be determined. For example, we question whether the reduction in Cuff ARI might be
associated with increased incidence of syncope at high altitude (Nicholas et al., 1992;
Blaber et al., 2003), but remain skeptical that CA measurements based solely on drops
in pressure will reveal much about the potential impact of heightened perfusion, such as
has been hypothesized in the etiology of AMS and high-altitude cerebral edema (Lassen
& Harper, 1975). Given the multifactorial nature of AMS, it was not surprising that our
baseline Cuff ARI data showed no predictive ability to forecast mild AMS at 3424 m, nor
were Cuff ARI scores on arrival related to AMS. These findings are in contrast to the
results of two previous studies (Van Osta et al., 2005; Cochand et al., 2011), but could be
attributed to the low incidence and severity of AMS symptoms in our subjects. It is also
possible that reduced CA may be a permissive element predisposing one to AMS when
combined with other as-yet-unidentified factors (Subudhi et al., 2014). With respect to
TFA, although resting oscillations in ABP and CBF are real, the absolute changes are
small (~10 mmHg) and slow (~20 s/cycle) and thus may not pose a threat to healthy
individuals at these altitudes. Even at higher altitudes, where TFA analyses reveal a
more passive pressure-flow relation, no studies have demonstrated that reduced resting

This article is protected by copyright. All rights reserved. 13
CA has any detrimental effects. In general it appears that measured reductions in
dynamic CA at high altitude do not have outward negative effects on cerebrovascular
health.
Limitations
Assessments of dynamic CA in this study were based on blood flow velocity, using the
assumption that MCA diameter was unchanged from low to high altitude. We believe
this was a reasonable assumption since changes in MCA diameter have not been
reported below 5,300 m (Wilson et al., 2011), but acknowledge the need to consider
even small changes in vessel diameter in future studies to more accurately describe
responses in volumetric blood flow. Likewise, although finger plethysmography is a
suitable method of assessing systemic blood pressure, more direct methods that can
capture pulse pressure in the cerebral arteries is needed to truly characterize CA.
We did not attempt to control for changes in PETO2 or PETCO2 that occurred with ascent
and acclimatization to 3424 m because we wanted to evaluate functional changes in CA
resulting from integrated physiological responses to high altitude. In general, CA
worsens as PETO2 falls, but improves as PETCO2 falls (Paulson et al., 1990). It is thus
possible that some of the reduction in CA expected from low PETO2 at high altitude was
offset by reduced PETCO2 subsequent to increased ventilatory drive. Future multivariate
studies that experimentally control PETO2 and PETCO2 are needed to determine the
isolated mechanisms underlying integrative CA response at high altitude.
Conclusions
Hypoxemia associated with travel to 3424 m reduces dynamic CA at rest as assessed by
the leg cuff technique, but not by TFA. We interpret these findings to suggest that the
cerebral vasculature may become relatively less able to protect against large, abrupt
changes in ABP, but still has the ability to maintain CBF across resting oscillations in
ABP. The consistency of these findings across acclimatization and the lack of correlation
with AMS symptoms lead us to believe that these changes are relatively innocuous
effects of mild hypoxemia. Given the differences between the two dynamic CA
techniques, we encourage others to consider multiple means of assessment to better
understand implications of altered CA at high altitude.

This article is protected by copyright. All rights reserved. 14
Funding
This project was funded in part by the Medical Education Research Institute of Colorado
to AWS.
Author contributions
AWS and JED conceived and designed the experiments. AWS, KG, RJL, and JED collected,
analyzed, and interpreted the data. All authors contributed to writing and revising the
manuscript.
Acknowledgements
The authors express their sincere gratitude to the students and staff at Alma College for
their participation.
References
Aaslid R, Lindegaard KF, Sorteberg W & Nornes H (1989). Cerebral autoregulation
dynamics in humans. Stroke 20, 45-52.
Ainslie PN, Ogoh S, Burgess K, Celi L, McGrattan K, Peebles K, Murrell C, Subedi P &
Burgess KR (2008). Differential effects of acute hypoxia and high altitude on
cerebral blood flow velocity and dynamic cerebral autoregulation: alterations
with hyperoxia. J Appl Physiol 104, 490-498.
Aries MJ, Elting JW, De Keyser J, Kremer BP & Vroomen PC (2010). Cerebral
autoregulation in stroke: a review of transcranial Doppler studies. Stroke 41,
2697-2704.
Bailey DM (2010). Impaired cerebral autoregulation in acute mountain sickness:
incidental yet adaptive? Stroke 41, e571; author reply e572.
Blaber AP, Hartley T & Pretorius PJ (2003). Effect of acute exposure to 3660 m altitude
on orthostatic responses and tolerance. J Appl Physiol (1985) 95, 591-601.
Cochand NJ, Wild M, Brugniaux JV, Davies PJ, Evans KA, Wise RG & Bailey DM (2011).
Sea-level assessment of dynamic cerebral autoregulation predicts susceptibility
to acute mountain sickness at high altitude. Stroke 42, 3628-3630.
Iwasaki K, Ogawa Y, Shibata S & Aoki K (2007). Acute exposure to normobaric mild
hypoxia alters dynamic relationships between blood pressure and cerebral blood
flow at very low frequency. J Cereb Blood Flow Metab 27, 776-784.

This article is protected by copyright. All rights reserved. 15
Iwasaki K, Zhang R, Zuckerman JH, Ogawa Y, Hansen LH & Levine BD (2011). Impaired
dynamic cerebral autoregulation at extreme high altitude even after
acclimatization. J Cereb Blood Flow Metab 31, 283-292.
Jansen GF, Krins A, Basnyat B, Bosch A & Odoom JA (2000). Cerebral autoregulation in
subjects adapted and not adapted to high altitude. Stroke 31, 2314-2318.
Jansen GF, Krins A, Basnyat B, Odoom JA & Ince C (2007). Role of the altitude level on
cerebral autoregulation in residents at high altitude. J Appl Physiol 103, 518-523.
Lassen NA & Harper AM (1975). Letter: High-altitude cerebral oedema. Lancet 2, 1154.
Meel-van den Abeelen AS, Simpson DM, Wang LJ, Slump CH, Zhang R, Tarumi T, Rickards
CA, Payne S, Mitsis GD, Kostoglou K, Marmarelis V, Shin D, Tzeng YC, Ainslie PN,
Gommer E, Muller M, Dorado AC, Smielewski P, Yelicich B, Puppo C, Liu X,
Czosnyka M, Wang CY, Novak V, Panerai RB & Claassen JA (2014). Between-
centre variability in transfer function analysis, a widely used method for linear
quantification of the dynamic pressure-flow relation: the CARNet study. Med Eng
Phys 36, 620-627.
Nicholas R, O'Meara PD & Calonge N (1992). Is syncope related to moderate altitude
exposure? JAMA 268, 904-906.
Nishimura N, Iwasaki K, Ogawa Y & Aoki K (2010). Decreased steady-state cerebral
blood flow velocity and altered dynamic cerebral autoregulation during 5-h
sustained 15% O2 hypoxia. J Appl Physiol (1985) 108, 1154-1161.
Ogoh S, Nakahara H, Ainslie PN & Miyamoto T (2010). The effect of oxygen on dynamic
cerebral autoregulation: critical role of hypocapnia. J Appl Physiol 108, 538-543.
Panerai RB, White RP, Markus HS & Evans DH (1998). Grading of cerebral dynamic
autoregulation from spontaneous fluctuations in arterial blood pressure. Stroke
29, 2341-2346.
Paulson OB, Strandgaard S & Edvinsson L (1990). Cerebral autoregulation. Cerebrovasc
Brain Metab Rev 2, 161-192.
Roach RC, Bartsch P, Hackett PH & Oelz O (1993). The Lake Louise acute mountain
sickness scoring system. In Hypoxia and Molecular Medicine. ed. Sutton JR, Coates
J & Houston CS, pp. 272–274. Queen City Printers, Burlinton, VT.
Saeed NP, Panerai RB, Horsfield MA & Robinson TG (2013). Does stroke subtype and
measurement technique influence estimation of cerebral autoregulation in acute
ischaemic stroke? Cerebrovasc Dis 35, 257-261.
Smirl JD, Lucas SJ, Lewis NC, duManoir GR, Smith KJ, Bakker A, Basnyat AS & Ainslie PN
(2014). Cerebral pressure-flow relationship in lowlanders and natives at high
altitude. J Cereb Blood Flow Metab 34, 248-257.

This article is protected by copyright. All rights reserved. 16
Steinmeier R, Bauhuf C, Hubner U, Bauer RD, Fahlbusch R, Laumer R & Bondar I (1996).
Slow rhythmic oscillations of blood pressure, intracranial pressure,
microcirculation, and cerebral oxygenation. Dynamic interrelation and time
course in humans. Stroke 27, 2236-2243.
Subudhi AW, Fan JL, Evero O, Bourdillon N, Kayser B, Julian CG, Lovering AT, Panerai RB
& Roach RC (2014). AltitudeOmics: cerebral autoregulation during ascent,
acclimatization, and re-exposure to high altitude and its relation with acute
mountain sickness. J Appl Physiol (1985) 116, 724-729.
Subudhi AW, Panerai RB & Roach RC (2009). Acute hypoxia impairs dynamic cerebral
autoregulation: results from two independent techniques. J Appl Physiol 107,
1165-1171.
Subudhi AW, Panerai RB & Roach RC (2010). Effects of hypobaric hypoxia on cerebral
autoregulation. Stroke 41, 641-646.
Tiecks FP, Lam AM, Aaslid R & Newell DW (1995). Comparison of static and dynamic
cerebral autoregulation measurements. Stroke 26, 1014-1019.
Tzeng YC, Ainslie PN, Cooke WH, Peebles KC, Willie CK, MacRae BA, Smirl JD, Horsman
HM & Rickards CA (2012). Assessment of cerebral autoregulation: the quandary
of quantification. Am J Physiol Heart Circ Physiol 303, H658-671.
Van Osta A, Moraine JJ, Melot C, Mairbaurl H, Maggiorini M & Naeije R (2005). Effects of
high altitude exposure on cerebral hemodynamics in normal subjects. Stroke 36,
557-560.
Wilson MH, Edsell ME, Davagnanam I, Hirani SP, Martin DS, Levett DZ, Thornton JS,
Golay X, Strycharczuk L, Newman SP, Montgomery HE, Grocott MP & Imray CH
(2011). Cerebral artery dilatation maintains cerebral oxygenation at extreme
altitude and in acute hypoxia--an ultrasound and MRI study. J Cereb Blood Flow
Metab 31, 2019-2029.

This article is protected by copyright. All rights reserved. 17
Table 1. Physiological responses after two (ALT2) and 13 (ALT13) days at 3424 m
Variable Baseline ALT2 ALT13
HR bpm 70 ± 9 86 ± 10* 72 ± 8^
ABP mmHg 91 ± 11 89 ± 9 90 ± 10
MCAv cm/s 47 ± 10 48 ± 7 42 ± 8*
SpO2 mmHg 98 ± 2 90 ± 3* 93 ± 2*^
PETO2 mmHg 78 ± 4 57 ± 3* 63 ± 2*^
PETCO2 mmHg 38 ± 3 33 ± 4* 27 ± 2*^
Cuff ARI
4.7 ± 1.5 3.2 ± 1.6* 2.9 ± 1.3*
TFA ARI
5.6 ± 1.1 4.7 ± 1.3 4.5 ± 1.1
PSD ABP %^2/Hz 7.7 ± 5.1 8.2 ± 6.0 9.0 ± 8.7
PSD MCAv %^2/Hz 11.9 ± 8.1 14.4 ± 9.2 15.8 ± 17.3
Coherence
0.43 ± 0.14 0.50 ± 0.20 0.48 ± 0.17
Gain %/% 0.84 ± 0.33 1.01 ± 0.47 0.89 ± 0.26
Phase Shift radians 0.61 ± 0.22 0.48 ± 0.47 0.43 ± 0.27
Different from Baseline (*) and/or ALT2 (^) at P < 0.05. Heart rate (HR), mean arterial
blood pressure (ABP), mean middle cerebral artery blood velocity (MCAv), arterial
pulse oxygen saturation (SpO2), partial pressures of end tidal oxygen and carbon
dioxide (PETO2, PETCO2), cuff and transfer function analysis (TFA) autoregulation
indexes (ARI), very low frequency (0.02 to 0.07 Hz) power spectral density (PSD),
coherence, gain, and phase shift.

This article is protected by copyright. All rights reserved. 18
Figure 1. Individual changes (n=11) in the autoregulation index (ARI) assessed by the
leg cuff technique (Cuff) and transfer function analysis of resting data (TFA) at low
altitude (Baseline; 1650 m), and after ascent (ALT2) and 13 days of acclimatization
(ALT13) to high altitude (3424 m). * Average Cuff ARI values at ALT2 an ALT13 were
lower than Baseline (P < 0.05).
This article is protected by copyright. All rights reserved. 19
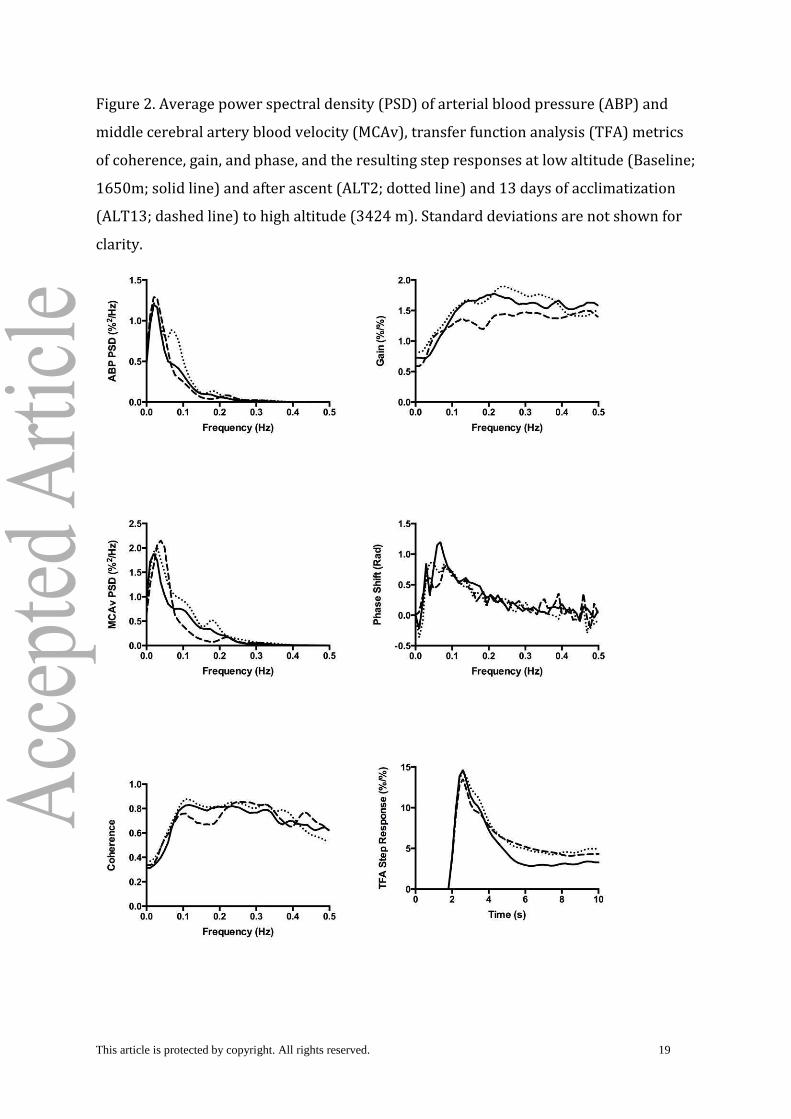
Figure 2. Average power spectral density (PSD) of arterial blood pressure (ABP) and
middle cerebral artery blood velocity (MCAv), transfer function analysis (TFA) metrics
of coherence, gain, and phase, and the resulting step responses at low altitude (Baseline;
1650m; solid line) and after ascent (ALT2; dotted line) and 13 days of acclimatization
(ALT13; dashed line) to high altitude (3424 m). Standard deviations are not shown for
clarity.

This article is protected by copyright. All rights reserved. 20
Figure 3. Correlation between autoregulation index (ARI) assessed by the leg cuff
technique (Cuff) and transfer function analysis of resting data (TFA). The plot
represents combined measurements at low altitude (1650 m) and after 2 and 13 days at
high altitude (3424 m).
Copyright © 2022 FDOKUMEN