CEPED / Education et Savoirs au Sud
275
Université Paris Descartes Ecole doctorale 180 CEPED / Education et Savoirs au Sud EVOLUTION OF INEQUALITIES IN ACCESS TO SECONDARY SCHOOLING IN UGANDA Par Christian KAKUBA Thèse de doctorat de Socio-démographie Dirigée par Marc PILON Présentée et soutenue publiquement le 25/11/2014 Devant un jury composé de : M. BOURDON Jean, Docteur Emérite, CNRS (IREDU) Université de Bourgogne, Rapporteur Mme CUSSO Roser, Professeure, Université Paris 1 Panthéon-Sorbonne, Rapporteure Mme GOLAZ Valérie, Chargée de Recherche, Institut National d’Etudes Démographiques M. PILON Marc, Directeur de Recherche, Institut de Recherche pour le Développement M. RUTAREMWA Gideon, Associate Professor, Makerere University, Kampala, Uganda
-
Upload
khangminh22 -
Category
Documents
-
view
0 -
download
0
Transcript of CEPED / Education et Savoirs au Sud
Université Paris Descartes
Ecole doctorale 180
CEPED / Education et Savoirs au Sud
EVOLUTION OF INEQUALITIES IN ACCESS
TO SECONDARY SCHOOLING IN UGANDA
Par Christian KAKUBA
Thèse de doctorat de Socio-démographie
Dirigée par Marc PILON
Présentée et soutenue publiquement le 25/11/2014
Devant un jury composé de :
M. BOURDON Jean, Docteur Emérite, CNRS (IREDU) Université de Bourgogne, Rapporteur
Mme CUSSO Roser, Professeure, Université Paris 1 Panthéon-Sorbonne, Rapporteure
Mme GOLAZ Valérie, Chargée de Recherche, Institut National d’Etudes Démographiques
M. PILON Marc, Directeur de Recherche, Institut de Recherche pour le Développement
M. RUTAREMWA Gideon, Associate Professor, Makerere University, Kampala, Uganda

2
TABLE OF CONTENTS
LIST OF FIGURES .............................................................................................................................. 7
LIST OF TABLES ................................................................................................................................ 8
LIST OF ACRONYMS ........................................................................................................................ 9
ACKNOWLEDGEMENTS ............................................................................................................... 10
ABSTRACT ......................................................................................................................................... 11
RÉSUMÉ ............................................................................................................................................. 12
INTRODUCTION ............................................................................................................................... 13
CHAPTER ONE: THE ROLE OF DEMAND AND SUPPLY FACTORS IN INFLUENCING SCHOOLING OUTCOMES .............................................................................................................. 23
1.1 Child factors and primary schooling ..................................................................................... 24
1.1.1 Sex of child ................................................................................................................... 25
1.1.2 Age of Child .................................................................................................................. 26
1.1.3 Relationship to household head .................................................................................... 27
1.1.4 Orphanhood status......................................................................................................... 29
1.2 Household level factors and primary schooling .................................................................... 29
1.2.1 Household wealth or income ......................................................................................... 29
1.2.2 Parents’ education ......................................................................................................... 31
1.2.3 Family size .................................................................................................................... 33
1.2.4 Sex of household head .................................................................................................. 33
1.2.5 Household size and structure ........................................................................................ 34
1.2.6 Religion and ethnicity ................................................................................................... 35
1.2.7 Employment of parents ................................................................................................. 36
1.2.8 Marital status ................................................................................................................. 37
1.3 Community factors and primary schooling ........................................................................... 38
1.3.1 Place of residence.......................................................................................................... 38
1.3.2 Region of residence ....................................................................................................... 40
1.3.3 Distance to school ......................................................................................................... 41
1.4 The role of demand and supply factors in secondary schooling ........................................... 42
1.4.1 Individual factors and secondary schooling .................................................................. 42
1.4.1.1 Sex of child ............................................................................................................... 42
1.4.1.2 Age of child ............................................................................................................... 43
1.4.1.3 Relationship to household head ................................................................................ 43
1.4.2 Household factors and secondary schooling ................................................................. 44
1.4.2.1 Household wealth or income ..................................................................................... 44
1.4.2.2 Education of Parents ................................................................................................. 45
1.4.2.3 Household size and structure .................................................................................... 45

3
1.4.2.4 Religion of head ........................................................................................................ 46
1.4.2.5 Employment of parents ............................................................................................. 46
1.4.3 Community factors and secondary schooling ............................................................... 46
1.4.3.1 Place of residence...................................................................................................... 47
1.4.3.2 Distance to school ..................................................................................................... 47
1.5 Emerging issues from the review of Literature ..................................................................... 47
CHAPTER TWO :THE PROBLEMATIC, METHODOLOGY AND COUNT RY CONTEXT 53
2.1 Growth of schooling populations .......................................................................................... 56
2.2 Survival to the end of primary and transition to secondary .................................................. 58
2.3 Quality of Education ............................................................................................................. 60
2.4 Privatization of Education ..................................................................................................... 62
2.5 The Role of Government....................................................................................................... 64
2.6 Other structural challenges to accessing secondary schooling.............................................. 66
2.7 Conceptual Framework ......................................................................................................... 67
2.8 Objectives and hypotheses of the Study ............................................................................... 71
2.9 Data and Methodology .......................................................................................................... 72
2.9.1 Uganda National Household Survey data ..................................................................... 72
2.9.2 Independent Variables as used in Modelling ................................................................ 74
2.9.3 Qualitative Data from the field ..................................................................................... 80
2.10 Data Analysis and Modelling ................................................................................................ 82
2.10.1 Other methodological considerations ............................................................................ 84
2.11 Demographic and Economic Context of Uganda .................................................................. 86
2.11.1 Demographic context .................................................................................................... 87
2.11.1.1 Population growth and dependency ...................................................................... 90
2.11.2 Economic Context ......................................................................................................... 92
2.11.2.1 Economy and Education Financing ...................................................................... 95
2.12 Concluding Remarks ............................................................................................................. 96
CHAPTER THREE: EDUCATION POLICY AND EVOLUTION OF SU PPLY AND DEMAND FOR EDUCATION SINCE INDEPENDENCE ............................................................ 99
3.1 The 1963 Castle Commission ............................................................................................. 100
3.2 The 1977 Education Policy Review Commission ............................................................... 101
3.3 The 1989 Education Policy Review Commission ............................................................... 102
3.4 The 1992 Government White Paper .................................................................................... 105
3.5 The advent of Universal Primary and Secondary education ............................................... 107
3.6 Education Strategic Investment Plan-ESIP (1998-2003) .................................................... 109
3.7 Education Sector Strategic Plan- ESSP (2004-2015) .......................................................... 110
3.8 The 2008 Education Act ..................................................................................................... 112

4
3.9 Structure of Uganda’s education system ............................................................................ 113
3.10 Supply of Primary Education .............................................................................................. 114
3.11 Supply of Secondary Education .......................................................................................... 115
3.11.1 Secondary schools by ownership and foundation body .............................................. 116
3.11.2 Secondary schools by boarding type ........................................................................... 120
3.11.3 Secondary schools by number, boarding type and region ........................................... 121
3.12 Evolution of School Enrolments and Rates since Independence ........................................ 127
3.12.1 Evolution of Inequalities by sex and region ................................................................ 129
3.12.2 Growth in gender equity in education at various levels .............................................. 129
3.12.3 Evolution of Enrolment Rates by region at Secondary ............................................... 132
3.13 Emerging issues on Education Policy, Supply and Demand since Independence .............. 134
CHAPTER FOUR : EDUCATIONAL ATTAINMENT BY BACKGROUND CHARACTERISTICS OF INDIVIDUALS AGED 13-24 YEARS. .. ........................................... 139
4.1 Individual Characteristics and Educational Attainment ...................................................... 144
4.1.1 Age of Child ................................................................................................................ 145
4.1.2 Sex of Child ................................................................................................................ 145
4.1.3 Relationship to the Household Head ........................................................................... 146
4.2 Characteristics of the household head and Educational Attainment ................................... 147
4.2.1 Education of household head ...................................................................................... 148
4.2.2 Sex of household head ................................................................................................ 148
4.2.3 Age of household head ................................................................................................ 149
4.2.4 Marital Status of household head ................................................................................ 150
4.3 Characteristics of other household members and Educational Attainment ......................... 150
4.3.1 Household size ............................................................................................................ 152
4.3.2 Proportion of Older adults ........................................................................................... 152
4.3.3 Proportion of children under five ................................................................................ 152
4.3.4 Presence of natural father in household ...................................................................... 153
4.3.5 Presence of natural mother in household .................................................................... 153
4.4 Household Characteristics and Educational Attainment ..................................................... 154
4.4.1 Household Wealth ....................................................................................................... 154
4.4.2 Main Source of Income for Household ....................................................................... 155
4.5 Community Characteristics and Educational Attainment ................................................... 156
4.5.1 Place of Residence ...................................................................................................... 156
4.5.2 Region of Residence ................................................................................................... 157
4.6 Concluding Remarks ........................................................................................................... 158
5
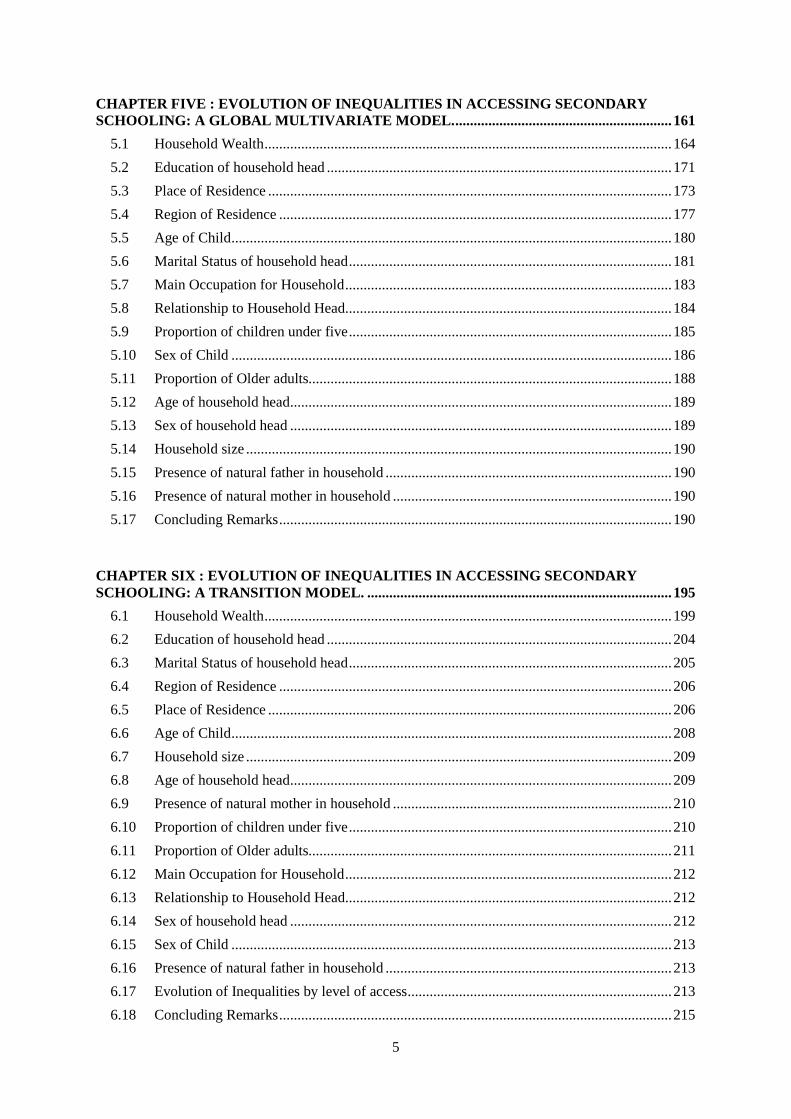
CHAPTER FIVE : EVOLUTION OF INEQUALITIES IN ACCESSI NG SECONDARY SCHOOLING: A GLOBAL MULTIVARIATE MODEL. ........... ................................................ 161
5.1 Household Wealth ............................................................................................................... 164
5.2 Education of household head .............................................................................................. 171
5.3 Place of Residence .............................................................................................................. 173
5.4 Region of Residence ........................................................................................................... 177
5.5 Age of Child ........................................................................................................................ 180
5.6 Marital Status of household head ........................................................................................ 181
5.7 Main Occupation for Household ......................................................................................... 183
5.8 Relationship to Household Head ......................................................................................... 184
5.9 Proportion of children under five ........................................................................................ 185
5.10 Sex of Child ........................................................................................................................ 186
5.11 Proportion of Older adults................................................................................................... 188
5.12 Age of household head ........................................................................................................ 189
5.13 Sex of household head ........................................................................................................ 189
5.14 Household size .................................................................................................................... 190
5.15 Presence of natural father in household .............................................................................. 190
5.16 Presence of natural mother in household ............................................................................ 190
5.17 Concluding Remarks ........................................................................................................... 190
CHAPTER SIX : EVOLUTION OF INEQUALITIES IN ACCESSIN G SECONDARY SCHOOLING: A TRANSITION MODEL. ................................................................................... 195
6.1 Household Wealth ............................................................................................................... 199
6.2 Education of household head .............................................................................................. 204
6.3 Marital Status of household head ........................................................................................ 205
6.4 Region of Residence ........................................................................................................... 206
6.5 Place of Residence .............................................................................................................. 206
6.6 Age of Child ........................................................................................................................ 208
6.7 Household size .................................................................................................................... 209
6.8 Age of household head ........................................................................................................ 209
6.9 Presence of natural mother in household ............................................................................ 210
6.10 Proportion of children under five ........................................................................................ 210
6.11 Proportion of Older adults................................................................................................... 211
6.12 Main Occupation for Household ......................................................................................... 212
6.13 Relationship to Household Head ......................................................................................... 212
6.14 Sex of household head ........................................................................................................ 212
6.15 Sex of Child ........................................................................................................................ 213
6.16 Presence of natural father in household .............................................................................. 213
6.17 Evolution of Inequalities by level of access ........................................................................ 213
6.18 Concluding Remarks ........................................................................................................... 215
6
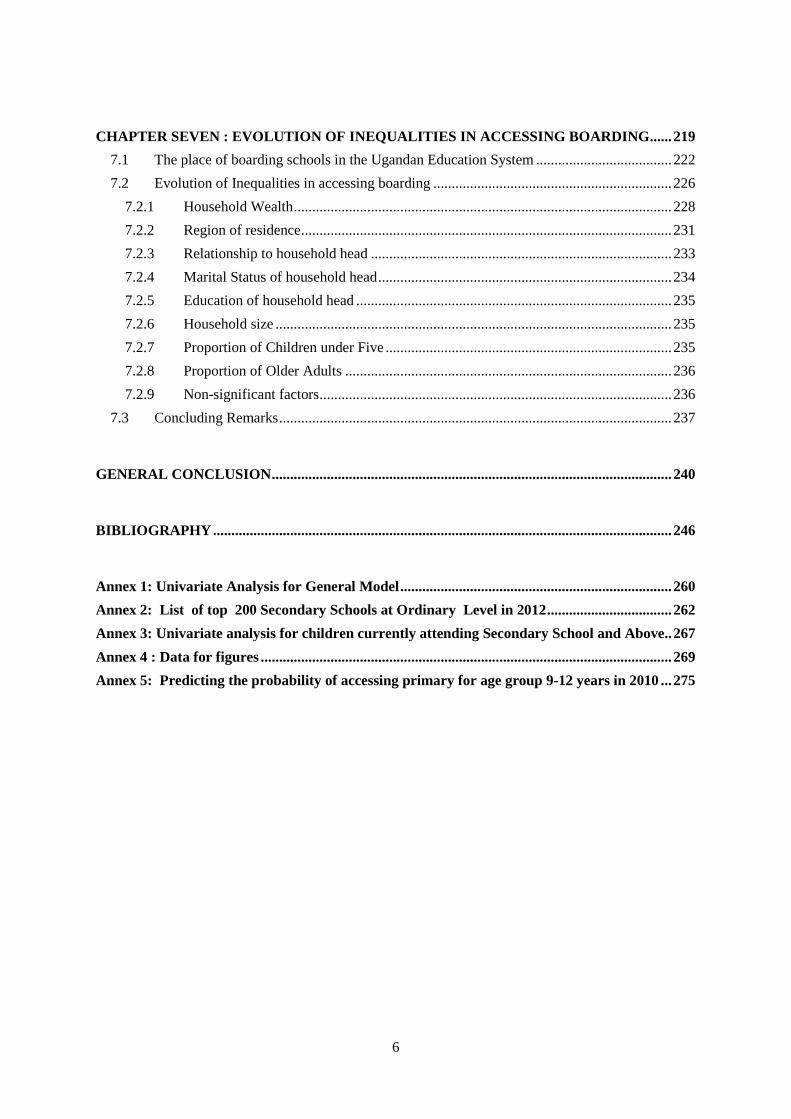
CHAPTER SEVEN : EVOLUTION OF INEQUALITIES IN ACCESS ING BOARDING ...... 219
7.1 The place of boarding schools in the Ugandan Education System ..................................... 222
7.2 Evolution of Inequalities in accessing boarding ................................................................. 226
7.2.1 Household Wealth ....................................................................................................... 228
7.2.2 Region of residence ..................................................................................................... 231
7.2.3 Relationship to household head .................................................................................. 233
7.2.4 Marital Status of household head ................................................................................ 234
7.2.5 Education of household head ...................................................................................... 235
7.2.6 Household size ............................................................................................................ 235
7.2.7 Proportion of Children under Five .............................................................................. 235
7.2.8 Proportion of Older Adults ......................................................................................... 236
7.2.9 Non-significant factors ................................................................................................ 236
7.3 Concluding Remarks ........................................................................................................... 237
GENERAL CONCLUSION ............................................................................................................. 240
BIBLIOGRAPHY ............................................................................................................................. 246
Annex 1: Univariate Analysis for General Model .......................................................................... 260
Annex 2: List of top 200 Secondary Schools at Ordinary Level in 2012 .................................. 262
Annex 3: Univariate analysis for children currently attending Secondary School and Above .. 267
Annex 4 : Data for figures ................................................................................................................ 269
Annex 5: Predicting the probability of accessing primary for age group 9-12 years in 2010 ... 275
7
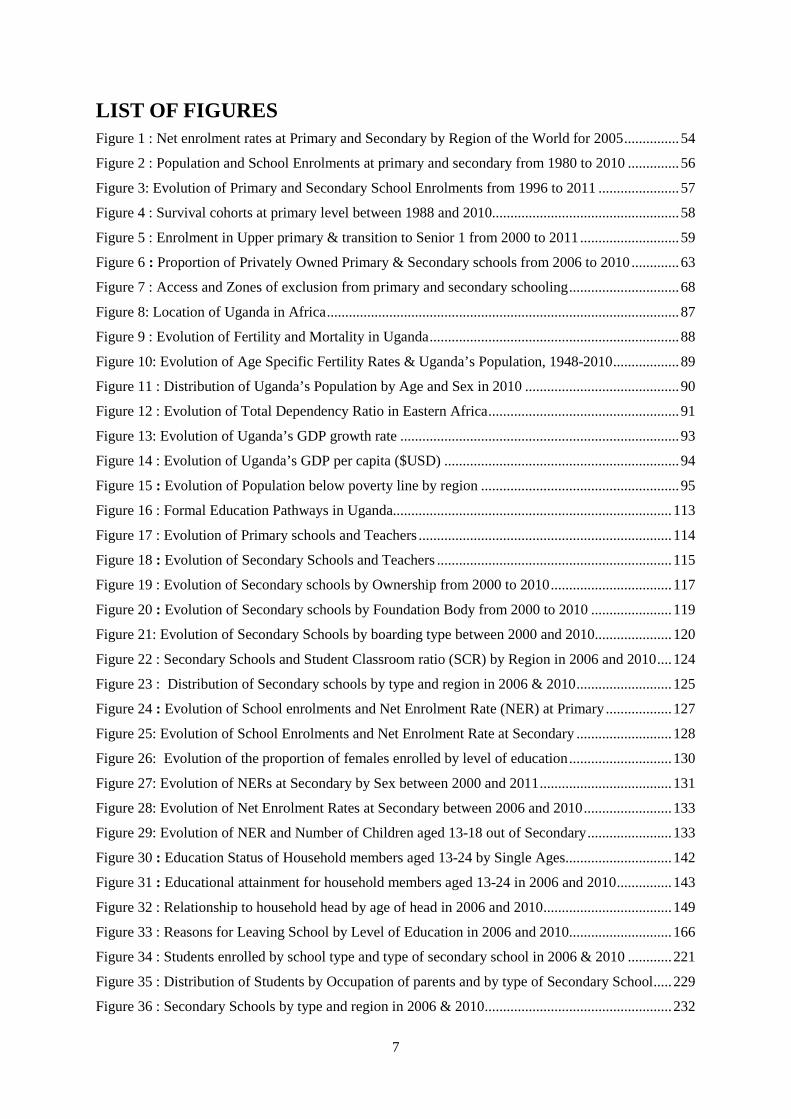
LIST OF FIGURES Figure 1 : Net enrolment rates at Primary and Secondary by Region of the World for 2005 ............... 54
Figure 2 : Population and School Enrolments at primary and secondary from 1980 to 2010 .............. 56
Figure 3: Evolution of Primary and Secondary School Enrolments from 1996 to 2011 ...................... 57
Figure 4 : Survival cohorts at primary level between 1988 and 2010................................................... 58
Figure 5 : Enrolment in Upper primary & transition to Senior 1 from 2000 to 2011 ........................... 59
Figure 6 : Proportion of Privately Owned Primary & Secondary schools from 2006 to 2010 ............. 63
Figure 7 : Access and Zones of exclusion from primary and secondary schooling .............................. 68
Figure 8: Location of Uganda in Africa ................................................................................................ 87
Figure 9 : Evolution of Fertility and Mortality in Uganda .................................................................... 88
Figure 10: Evolution of Age Specific Fertility Rates & Uganda’s Population, 1948-2010 .................. 89
Figure 11 : Distribution of Uganda’s Population by Age and Sex in 2010 .......................................... 90
Figure 12 : Evolution of Total Dependency Ratio in Eastern Africa .................................................... 91
Figure 13: Evolution of Uganda’s GDP growth rate ............................................................................ 93
Figure 14 : Evolution of Uganda’s GDP per capita ($USD) ................................................................ 94
Figure 15 : Evolution of Population below poverty line by region ...................................................... 95
Figure 16 : Formal Education Pathways in Uganda............................................................................ 113
Figure 17 : Evolution of Primary schools and Teachers ..................................................................... 114
Figure 18 : Evolution of Secondary Schools and Teachers ................................................................ 115
Figure 19 : Evolution of Secondary schools by Ownership from 2000 to 2010 ................................. 117
Figure 20 : Evolution of Secondary schools by Foundation Body from 2000 to 2010 ...................... 119
Figure 21: Evolution of Secondary Schools by boarding type between 2000 and 2010..................... 120
Figure 22 : Secondary Schools and Student Classroom ratio (SCR) by Region in 2006 and 2010 .... 124
Figure 23 : Distribution of Secondary schools by type and region in 2006 & 2010 .......................... 125
Figure 24 : Evolution of School enrolments and Net Enrolment Rate (NER) at Primary .................. 127
Figure 25: Evolution of School Enrolments and Net Enrolment Rate at Secondary .......................... 128
Figure 26: Evolution of the proportion of females enrolled by level of education ............................ 130
Figure 27: Evolution of NERs at Secondary by Sex between 2000 and 2011 .................................... 131
Figure 28: Evolution of Net Enrolment Rates at Secondary between 2006 and 2010 ........................ 133
Figure 29: Evolution of NER and Number of Children aged 13-18 out of Secondary ....................... 133
Figure 30 : Education Status of Household members aged 13-24 by Single Ages............................. 142
Figure 31 : Educational attainment for household members aged 13-24 in 2006 and 2010 ............... 143
Figure 32 : Relationship to household head by age of head in 2006 and 2010 ................................... 149
Figure 33 : Reasons for Leaving School by Level of Education in 2006 and 2010 ............................ 166
Figure 34 : Students enrolled by school type and type of secondary school in 2006 & 2010 ............ 221
Figure 35 : Distribution of Students by Occupation of parents and by type of Secondary School ..... 229
Figure 36 : Secondary Schools by type and region in 2006 & 2010 ................................................... 232
8
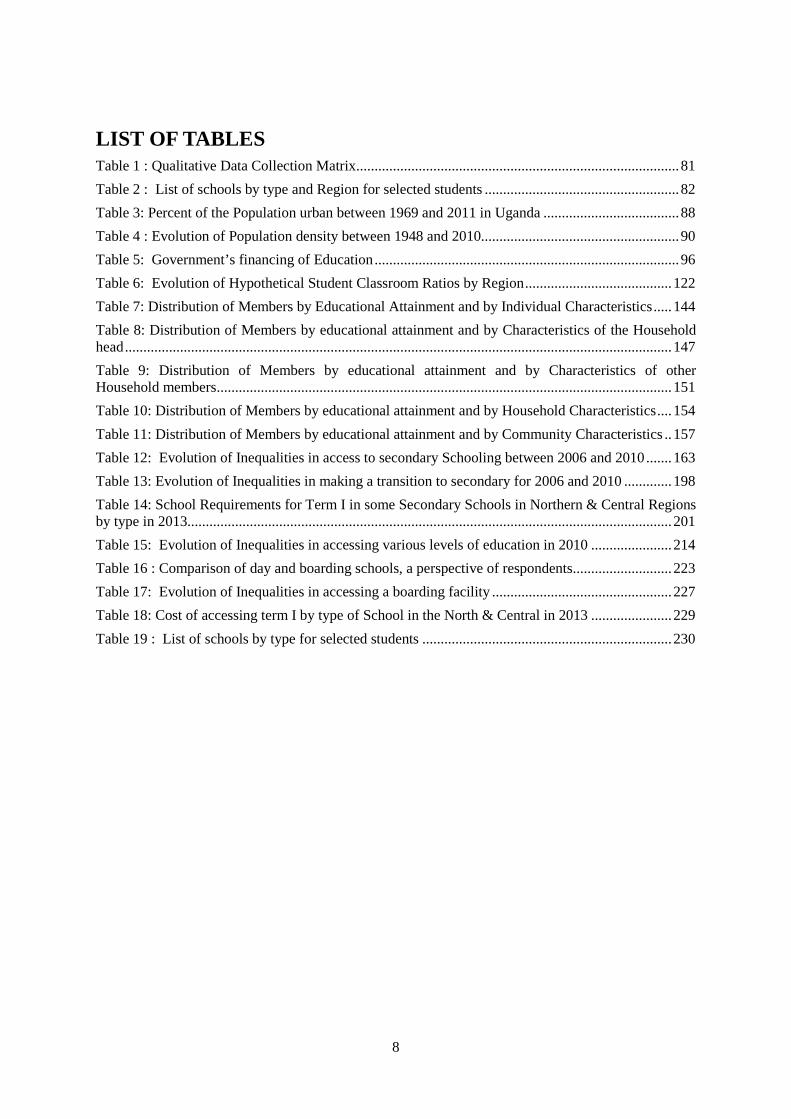
LIST OF TABLES Table 1 : Qualitative Data Collection Matrix ........................................................................................ 81
Table 2 : List of schools by type and Region for selected students ..................................................... 82
Table 3: Percent of the Population urban between 1969 and 2011 in Uganda ..................................... 88
Table 4 : Evolution of Population density between 1948 and 2010...................................................... 90
Table 5: Government’s financing of Education ................................................................................... 96
Table 6: Evolution of Hypothetical Student Classroom Ratios by Region ........................................ 122
Table 7: Distribution of Members by Educational Attainment and by Individual Characteristics ..... 144
Table 8: Distribution of Members by educational attainment and by Characteristics of the Household head ..................................................................................................................................................... 147
Table 9: Distribution of Members by educational attainment and by Characteristics of other Household members ............................................................................................................................ 151
Table 10: Distribution of Members by educational attainment and by Household Characteristics .... 154
Table 11: Distribution of Members by educational attainment and by Community Characteristics .. 157
Table 12: Evolution of Inequalities in access to secondary Schooling between 2006 and 2010 ....... 163
Table 13: Evolution of Inequalities in making a transition to secondary for 2006 and 2010 ............. 198
Table 14: School Requirements for Term I in some Secondary Schools in Northern & Central Regions by type in 2013.................................................................................................................................... 201
Table 15: Evolution of Inequalities in accessing various levels of education in 2010 ...................... 214
Table 16 : Comparison of day and boarding schools, a perspective of respondents ........................... 223
Table 17: Evolution of Inequalities in accessing a boarding facility ................................................. 227
Table 18: Cost of accessing term I by type of School in the North & Central in 2013 ...................... 229
Table 19 : List of schools by type for selected students .................................................................... 230
9
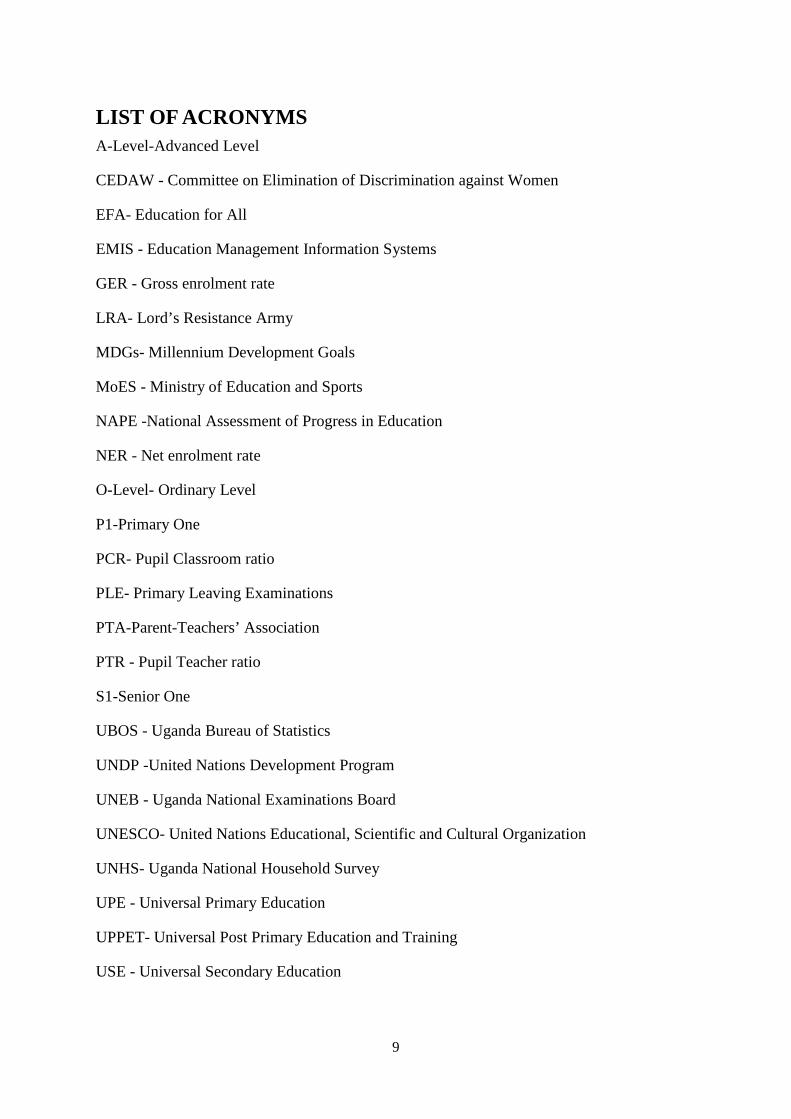
LIST OF ACRONYMS A-Level-Advanced Level
CEDAW - Committee on Elimination of Discrimination against Women
EFA- Education for All
EMIS - Education Management Information Systems
GER - Gross enrolment rate
LRA- Lord’s Resistance Army
MDGs- Millennium Development Goals
MoES - Ministry of Education and Sports
NAPE -National Assessment of Progress in Education
NER - Net enrolment rate
O-Level- Ordinary Level
P1-Primary One
PCR- Pupil Classroom ratio
PLE- Primary Leaving Examinations
PTA-Parent-Teachers’ Association
PTR - Pupil Teacher ratio
S1-Senior One
UBOS - Uganda Bureau of Statistics
UNDP -United Nations Development Program
UNEB - Uganda National Examinations Board
UNESCO- United Nations Educational, Scientific and Cultural Organization
UNHS- Uganda National Household Survey
UPE - Universal Primary Education
UPPET- Universal Post Primary Education and Training
USE - Universal Secondary Education

10
ACKNOWLEDGEMENTS
I am very greatly indebted to my Supervisor, Marc Pilon for having accepted to
supervise my PhD work. I thank him most especially for his professional guidance, timely
response in case I submitted any work to him, patience with me and his parental approach
while working with me. I am equally grateful to Valerie Golaz, for having enabled me to
meet Marc Pilon and Gideon Rutaremwa that had linked me to Valerie Golaz. The guidance
of Valerie before and during this PhD work was helpful. I thank her for her time and
professional guidance for this long and for being able to respond to any of my other
challenges whether professional or not, all of which enabled me complete this scholarly
work. I want to take this opportunity to thank Professor Keith Lewin of the University of
Sussex for accepting to share some professional information with me through email although
he did not know me.
I thank my wife Joselyne for encouraging me to do a PhD and for her being patient
with me during the course of this work. Equally patient and understanding were my children,
Charlene, Collin, Charlotte and Calvin. They equally deserve a pat on the back. I cannot
forget to thank my parents but more so my surviving mother, Mrs. Magdalene Ngonzi for
having taken me to school and for her support all through my life.
I also hereby thank the French government which through the French Embassy in
Uganda funded my first three stays in Paris. I also thank INED (Institut National d’études
démographiques) for having funded my fourth stay in Paris and given me an office to be able
to write this thesis. I am also grateful to CEPED (Centre Population et Développement) for
hosting me for most of this time and its management for being parental and caring.
I would also like to express my gratitude to the Carnegie Corporation of New York
which through Makerere University Graduate School, funded my fieldwork as well as the
fifth and sixth stays in Paris. I cannot forget IRD (Institut de Recherche pour le
Développement) which hosted me at Bondy and funded my travel to Paris at some point.
I would like to thank all friends at CEPED, INED, BONDY and those in Kampala
that encouraged, guided and comforted me in the course of this work. Last but not least, my
thanks also go the families of Marc and Valerie for the affection they exhibited towards me.
11
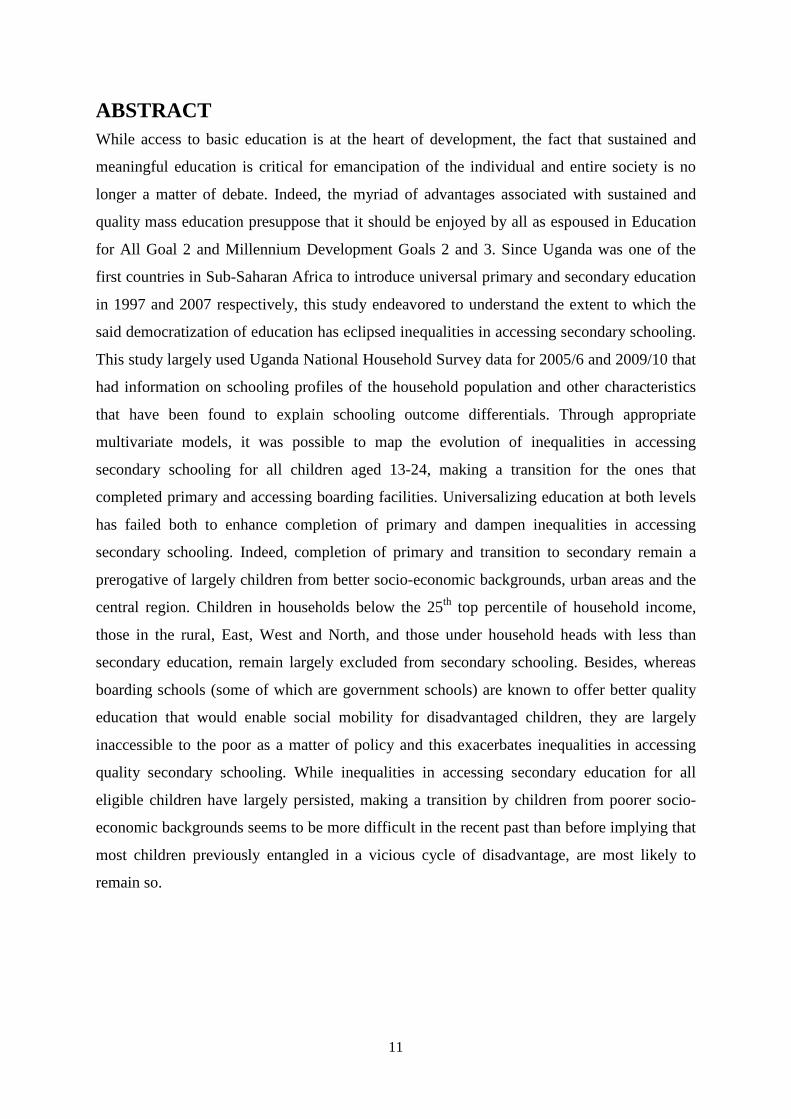
ABSTRACT While access to basic education is at the heart of development, the fact that sustained and
meaningful education is critical for emancipation of the individual and entire society is no
longer a matter of debate. Indeed, the myriad of advantages associated with sustained and
quality mass education presuppose that it should be enjoyed by all as espoused in Education
for All Goal 2 and Millennium Development Goals 2 and 3. Since Uganda was one of the
first countries in Sub-Saharan Africa to introduce universal primary and secondary education
in 1997 and 2007 respectively, this study endeavored to understand the extent to which the
said democratization of education has eclipsed inequalities in accessing secondary schooling.
This study largely used Uganda National Household Survey data for 2005/6 and 2009/10 that
had information on schooling profiles of the household population and other characteristics
that have been found to explain schooling outcome differentials. Through appropriate
multivariate models, it was possible to map the evolution of inequalities in accessing
secondary schooling for all children aged 13-24, making a transition for the ones that
completed primary and accessing boarding facilities. Universalizing education at both levels
has failed both to enhance completion of primary and dampen inequalities in accessing
secondary schooling. Indeed, completion of primary and transition to secondary remain a
prerogative of largely children from better socio-economic backgrounds, urban areas and the
central region. Children in households below the 25th top percentile of household income,
those in the rural, East, West and North, and those under household heads with less than
secondary education, remain largely excluded from secondary schooling. Besides, whereas
boarding schools (some of which are government schools) are known to offer better quality
education that would enable social mobility for disadvantaged children, they are largely
inaccessible to the poor as a matter of policy and this exacerbates inequalities in accessing
quality secondary schooling. While inequalities in accessing secondary education for all
eligible children have largely persisted, making a transition by children from poorer socio-
economic backgrounds seems to be more difficult in the recent past than before implying that
most children previously entangled in a vicious cycle of disadvantage, are most likely to
remain so.
12
RÉSUMÉ Alors que l’accès à l’éducation est au cœur du développement, le fait qu’une éducation
soutenue et de qualité soit un facteur critique pour l’émancipation d’individus et de sociétés
entières ne fait plus l’objet de débats. En effet, la myriade d’avantages liés à une éducation de
masse soutenue et de qualité présuppose qu’elle soit à la portée de tous, comme il est décrit
dans l’objectif 2 de l’Education pour tous et les buts 2 et 3 des Objectifs du millénaire pour le
développement. L’Ouganda étant l’un des premiers pays d’Afrique Subsaharienne à
introduire l’éducation primaire et secondaire universelle, respectivement en 1997 et 2007,
cette thèse s’attache à comprendre jusqu’à quel point ces politiques de démocratisation de
l’éducation ont permis de réduire les inégalités d’accès à l’école secondaire. Ce travail utilise
principalement les données des enquêtes nationales de ménages de 2005/2006 et 2009/2010
qui procurent des informations sur le profil éducatif des membres du ménage ainsi que
d’autres caractéristiques qui selon les études préalables influent sur les parcours scolaires. Par
le moyen de modèles multivariés pertinents, il a été possible de décrire l’évolution des
inégalités d’accès à l’école secondaire, de transition du primaire au secondaire, et d’accès aux
internats, ce pour l’ensemble des enfants de 13 à 24 ans. L’universalisation de l’éducation au
niveau primaire comme secondaire n’a ni pu améliorer l’achèvement du cycle primaire ni
réduire les inégalités d’accès au secondaire. En effet, achever le cycle primaire et accéder au
secondaire demeurent principalement la prérogative d’enfants issus de milieux socio-
économiques privilégiés, de zones urbaines et de la région centrale. Lorsque le chef de
ménage n’est pas lui-même allé au secondaire, ou que le ménage se situe en deçà du 25e
percentile de revenus, lorsqu’il est en milieu rural, ou situé dans l’Est, l’Ouest ou le Nord du
pays, ses jeunes membres demeurent largement exclus du cycle secondaire. En outre, alors
que les internats (dont certains sont des écoles publiques) sont connus pour offrir une
éducation de meilleure qualité qui permettrait la mobilité sociale pour les enfants défavorisés,
ils sont généralement inaccessibles aux pauvres selon la politique sur les internats ce qui
accroît les inégalités d'accès à l'enseignement secondaire de qualité. Alors que les inégalités
d’accès au niveau secondaire pour tous les enfants persistent, la transition du primaire au
secondaire, pour les enfants de milieux socio-économiques les moins aisés, semble plus
difficile dans le passé récent qu’auparavant, ce qui implique que la plupart des enfants qui se
trouvaient dans un cercle vicieux du désavantage, très probablement y demeureront.
13
INTRODUCTION
While access to basic education lies at the heart of development, sustained and
meaningful access to education is critical for, inter alia, long term improvements in
productivity, expansion of the tax base, reduction in inequality and intergenerational cycles of
poverty, demographic transition, preventive health care, women emancipation and
democratisation (Charbit & Kébé, 2006; Cremin & Nakabugo, 2012; Henaff, 2006; Lewin,
2007c; Majgaard & Mingat, 2012; Pilon, 2006; Wilkinson & Pickett, 2009).
Today, human development perspectives are increasingly redefining development
away from the view of the neo-classical economists that often tended to emphasize economic
growth and thought that once this was achieved, then the problems of humanity would be
solved. The concept of development is no longer equated to growth but rather seen as an all-
encompassing phenomenon (Cremin & Nakabugo, 2012).
Indeed, achievement of growth in the 1970s and 80s did not stop an increase in misery
and this was due to persistent inequality and unevenness between and within regions (Cremin
& Nakabugo, 2012) but also the effect of structural adjustment programs especially in Sub-
Saharan Africa (Henaff, 2006). There was increased realisation that development was bigger
than growth and needed to be seen through a multidisciplinary angle.
It is in light of this reconfigured definition of development that UNDP initiated the
production of Human Development Reports. According to these reports, human development
is seen from a larger perspective that encompasses, inter alia, human rights and social
development indicators. By using the Human Development Index (measuring life expectancy
at birth, educational attainment and income per capita), the approach has moved from
measuring economic development in form of GDP per capita to social related indicators
(Cremin & Nakabugo, 2012) that may imply better distribution of income and “spread”
benefits of growth.
This evolved conceptualisation of development partly explains the redefinition of
other concepts like education (and its role) that is increasingly seen not only as for increasing
individual productivity and income but also as a precursor to a wider range of advantages that
are beneficial to the individual and society. This view is echoed by Henaff when she states
14
that « l’éducation est donc aussi une condition indispensable sinon suffisante au
développement de l’individu et de la société » (Henaff, 2006 p.69).
It is this reformed definition of development that was behind the global development
agenda espoused in Jomtien in 1990, reaffirmed in Dakar in 2000 and in New York through
the adoption of the Millennium Development Goals. Indeed the centrality of education saw
world leaders emphasize in 2008 at a high level meeting to set out concrete plans for action,
that although the eight MDGs were quite interdependent, investment in education (and
health) would play a major role in achievement of all the rest (Cremin & Nakabugo, 2012).
In the context of the new definition of development therefore, if education is to cause
changes in society, it must be spread to include even the ones that are most often excluded
(that happen to be the majority in poor countries) as is unambiguously espoused in Education
For All goal 2 and Millennium Development Goals 2 and 3. It thus implies that development
is not only inextricably linked to equity (or equality), but that any definition of development,
especially sustainable development must exhibit equity dimensions.
While the notion of education being “a right for all ” was clearly put in the preamble
of the EFA founding document as cited by Pilon (2006), the post Dakar period has witnessed
greater prominence of “rights based approaches” to educational service provision. Otherwise
failure to redress inequalities is likely to lead to a situation where conflict will become more
likely, capabilities will be underutilised and the tragedy of the commons (as espoused by
Hardin Garret, an American human ecologist) will act to generate individually desirable
outcomes for some, but collective disadvantages for many (Lewin, 2007c). Indeed more
recent work by Wilkinson & Pickett (2009) has shown that more unequal societies are more
likely to manifest with, inter alia, low levels of trust, more cases of mental illness, increased
crime, lower life expectancy, higher cases of obesity and lower social mobility that tend to
affect all.
Despite the long held view by the World bank that the highest social returns of
education are with regard to primary education (although this is not a matter of unanimity as
evidenced by works of some scholars; (Cremin & Nakabugo, 2012), this study is particularly
interested in access to secondary education as the advantages of education like its impact on
productivity of individuals and the entire economy, income redistribution and
intergenerational social mobility, the demographic dynamics, most of the health indicators,
women emancipation and democratic governance tend to be associated with secondary, if not
higher levels of education, than with primary education.
15
Globally, secondary education is of increasing interest to academia, policy makers
as well International organizations. It is in this spirit that the 2011 Edition of Global
Education Digest by UNESCO Institute of Statistics is entitled “Focus on secondary
education: the next great challenge”
Uganda is one of the first countries in Sub-Saharan Africa to introduce Universal
Primary Education in 1997 and Universal Secondary Education in 2007. Indeed the main
emphasis of the 2004-2015 Education Sector Strategic Plan was not only to improve access to
quality education at primary but also ensure that primary school graduates go on to access
post primary education and progress in the school system.
The role of secondary schooling in a country’s development was best summarised by
Lewin (2007a), at a Commonwealth conference in Uganda, thus:
• Universal Primary Education depends on adequate flow of secondary school
graduates into primary teaching and this is hard to ensure where secondary school
enrollments are low.
• HIV/AIDS and conflicts have decimated labor force that needs to be replenished
through secondary and probably higher levels of schooling.
• Secondary schooling that generally excludes the poor and vulnerable is one of the
opportunities at the hands of policy to redistribute wealth and enable social mobility
out of poverty.
• Competitiveness in the modern era depends on knowledge, skills, competencies
associated with abstract reasoning, analysis, language communication skills and
application of science and technology that are most efficiently acquired through
secondary education and finally.
• Failure to satisfy increased demand for secondary schooling is likely to be source of
social and political unrest.
Access to secondary schooling remains one of the challenges of policy despite efforts
by government as already seen. Indeed, while at primary the net enrolment rate improved
from 86% to 96% between 2000 and 2012, at secondary level the equivalent indicators for
the two data points were 13% and 23% respectively, based on Ministry of Education data
(MoES, 2013). Secondary schooling continues to be a “no go area” for more than three-
quarters of children in the relevant age group.

16
Besides, there are other structural challenges that militate against universalising
secondary schooling as elucidated: first, pupils have to pass a competitive Primary Leaving
Examination to go to secondary in which better performance has been an almost exclusive
privilege of children from private and or boarding (expensive) primary schools. Secondly,
about 70% of all schools at the secondary level are privately owned. Thirdly, some
government schools, especially the old prestigious schools are boarding schools whose costs
(largely exorbitant) are by policy borne by parents. Fourthly, selection to join these old
prestigious schools is so discriminative in favor of children whose parents have better social,
political and religious connections and finally, there are still a number of sub counties
without a secondary school despite government commitment to construct a secondary school
per sub-county.
This study largely bases on Uganda National Household Survey data collected in
2005/6 and 2009/10 to map the evolution of inequalities in accessing secondary schooling
before and after the Universal Secondary education Policy of 2007. These surveys collected
information on schooling profiles of the household population and several other individual,
household and community level variables that are hypothesized in this study like in many
others to influence schooling outcomes.
The study of inequalities in accessing education (secondary schooling in this case) has
previously been a preoccupation of many scholars in various domains. These have largely
studied household level factors (broadly speaking) and their effect on access to basic
education and or retention in the school system. The interest in this kind of study can be
traced to the work of economists when they coined the term “demand for education” to
determine factors outside the school confines, and especially at the household but also
community levels that affect several schooling outcomes. The work of economists has since
been greatly enriched by, inter alia, sociologists or anthropologists, demographers and
educationists.
The following brief overview is to explore the contributions of different professions to
this subject in order to put into perspective this study but also with an aim of judiciously
blending these perspectives in explaining the research findings. The place of interdisciplinary
research in providing a holistic understanding to most of social science phenomena is
increasingly more of a norm than an exception. The approaches seen are those by economists,
sociologists, demographers and educationists in that order.
17
The term “demand for education” that is now popularly used to refer to household
level factors as correlates of schooling outcomes is borrowed from economics where the
notion of demand is used to refer to the willingness and ability to buy goods or services at a
given price. The contribution of economists is rooted in the Human Capital theory that was
started by Schultz in 1970 and expounded upon by Becker and others in the mid-seventies
and thereafter (Becker & Lewis, 1973; Becker & Tomes, 1976). This was after the realization
that growth of physical capital had little impact on growth of income hence interest in
improving skills and training. Education is regarded as an economic good because it is scarce
and needs to be apportioned. It is a consumer good and offers utility, as well as, a producer
good that is used to produce other goods. As a capital good, it can be used to develop human
resources necessary for economic and social transformation. Indeed, the wholesome adoption
of education in development policies is strongly rooted in the Human Capital theory
(Olaniyan & Okemakinde, 2008). Education is for the purpose of improvement of one’s
human capital in terms of knowledge, skills and social capital and is thus an investment for
future benefits in form of income. An individual thus consumes part of his time and other
goods to go to school in anticipation of economic benefits.
At the household level, parents make economically rational decisions in investing in
children, i.e. they look at the net present value of costs and benefits from such investment.
They would preferably invest in children with higher academic promise or more of boys as
they may expect better income opportunities for the boys than the girls. The theory is
premised on altruism of parents whereby they invest in their children to improve their
lifetime income, but also that the children may help them in their old age. The theory assumes
perfect markets that denote free entry into the market and wage as a function of human
capital. The altruism of parents is hampered by resource constraints and in this case, quality
and quantity tradeoffs come in whereby an increase in quality is more expensive if there are
more children and an increase in quantity (number of children) is harder if children are of
higher quality. This then leads to the fact that a higher number of children, implies, less
capacity by the household to educate them in which case they may educate few of them as a
coping strategy.
The theory by economists has been criticized for assuming the perfection of markets
that is not common in Africa where access to credit is limited, ignoring the fact that a child
can work and study, underestimating the uncertainty of future salaried employment,
downplaying the connection between benefits of education and one’s background,
18
disregarding the role of the extended family in cushioning the effects of having many
children and above all, ignoring cultural and religious considerations that have been found to
affect schooling decisions (Buchmann, 2000; Kobiané, 2006; Olaniyan & Okemakinde,
2008).
The work of sociologists indeed shows that the theories of economics have some
weaknesses. The contribution of sociologists is with regard to their unit of analysis, more
interactive methods like observations and focus group discussions and theories of sociology
of education. Demand for education is also related to norms and values in society. It is true
that the constraints to education may be monetary but they are quite often also social or
cultural and examples in Africa show how economic and cultural factors combine to explain
the choice to send children to school and keep them there. While economists, demographers
and statisticians have come up with figures to explain the “what” of situations, the questions
of “why” and “how” have been answered better by sociologists and anthropologists. The
following examples vindicate the role of socio-cultural factors in children’s education:
In the northern part of Nigeria that is largely Muslim, education of the girl child has
lagged behind because of the Islamic fundamentalist laws that promote early marriages and
discourage the mixing of boys and girls (Lincove, 2009). In some cultures in Uganda, where
bride price is a preliquisite for marriage, some parents have exhibited more interest in the
“pay” from the girls than their education after all “they will end up in the kitchen” and this
explains why in some communities, the girl child is still disadvantaged (Tumushabe, Barasa,
Muhanguzi, & Otim-Nape, 1999). In India (Siddhu, 2011), the fear for the safety of girls
negatively affected access to secondary schooling by the girls while in Indonesia, Takahashi
(2011) talks of “peer and neighborhood effects” in which case children were likely to be
enrolled if they were in areas with high enrollment, something related more with social
behavior than costs and benefits of education.
Whereas in terms of theory the contribution of demography is so little, recently
especially in the francophone world, education is increasingly of interest to demographers. In
traditional Demography, that had since emphasized the three population dynamics of fertility,
mortality and migration, education was of interest in as far as it impacted nuptiality,
morbidity, mortality, fertility and migration. Recently, with increasing realization of the
importance of interdisciplinary research and following the 1994 International Conference on
Population and Development that brings to the fore, interactions between population,

19
education and development and the impact of education on sustainable development,
education is increasingly looked at as a standalone topic of study by demographers.
One novel and noble contribution of demographers is the pioneering into the use of
Household Survey and Census Data (hitherto underutilized) to investigate correlates of access
to schooling as these datasets include information on the schooling status of children and
other factors that have been found to impact children’s schooling outcomes (Pilon, 1995;
UIS, 2004 ; Marcoux & Pilon, 2003). This comes after the realization that the traditionally
collected statistics at the school level, i.e. enrolment, sex and age of child by class, in
Education Management Information Systems (EMIS) data of most countries were shallow
and ignored the role of household related factors in sending children to school and keeping
them there. Indeed, one of the reasons why the traditionally used enrolment statistics have not
been able to measure the progress towards EFA and MDGs is the fact that measurement is in
school and on limited variables (Gérald & Pilon, 2005). It is indeed true that school factors
are key, although household factors are not, in any way, less critical. In this vein, despite free
education initiatives, some households have not been able to enroll their children in school
but, most importantly, households have reacted differently in the face of universalized
education to the extent that factors at the household level remain critical in measuring the
aptitude with which households can react and the extent to which children that enroll progress
in school and or transit to subsequent levels. In addition, demographers have come up with
retrospective studies that are longitudinal and help overcome the challenges of cross sectional
data. Studies in this line are: « Scolarisation et travail des enfants à Ouagadougou » carried
out in 1993, « Dynamiques familiales et éducation des enfants à Bamako » done in 1996
« Dynamiques familiales et éducation des enfants au Mali » of 1999, all as cited in Kobiané,
(2006), and more recently, a study on parental death and children’s schooling in Burkina Faso
(Kobiané, Calvès, & Marcoux, 2005).
The work of educationists can be seen through the creation of the Consortium of
Research on Educational Access, Transition and Equity (CREATE) at the Centre for
International Education , University of Sussex whose mandate was to investigate into issues
of access, equity and transitions in the aftermath of EFA and MDGs. These have endeavored
to link the issues of enrolment with the indicators of internal efficiency and hence
emphasizing and redefining access in the context of real learning and achievement but not
just physical access (Lewin, 2011b). These scholars are emphasizing not only enrolment but
meaningful learning that should translate into access to the subsequent levels. They have
20
come up with a model on “zones of exclusion” (to be seen in detail later) that illustrates how
typically, enrolments decline steeply through the primary grades in poor countries and how
children attending irregularly and or achieving poorly fall into the “at risk” zones. Zone 1
looks at children that never enroll in school, zone 2 is about children that enroll just only to
drop out before the end of primary, zone 3 concerns children in primary but silently excluded
i.e. likely to drop out due to overage entry, absenteeism and recurrent repetitions, zone 4 is
about children who complete primary and do not transit to secondary school, zone 5 describes
children that drop out of secondary, and zone 6 looks at children that are in secondary but at
the risk of drop out due to “silent exclusion”.
In addition to being interested in issues of equity, transition and the impact of real
learning at the lower levels on access to subsequent levels, this framework is a guide to
researchers that may conduct studies in respect to any one or several of the exclusion zones,
but most importantly, scholars increasingly interested in access to secondary schooling.
Having looked at the contributions of various scholars in studying access to
schooling, it may be important to see in a greater detail what has been done in this regard in
especially Sub-Saharan Africa and this is the main subject matter of the first chapter.
In this chapter, literature on factors impacting access to basic education, retention at
primary, and or access to secondary in largely greater Sub-Saharan Africa is extensively
reviewed. The review of factors related to primary schooling is justified because all children
must go through primary to access secondary. Besides, some children may not be enrolled at
secondary because they never enrolled at primary in the first place or they never completed
primary or simply because they did not make a transition to secondary that discussing
inequalities in accessing secondary without understanding inequalities at the lower level
would be missing the point.
Chapter two presents the problematic, data and methods to be used as well the
demographic and economic context on Uganda.
In chapter three, evolution of education policy since independence is explored.
Besides, an attempt is made to examine the impact of education policy on both demand and
supply of education at primary, but most importantly, secondary level.
Chapter four is an exploratory chapter in preparation for multivariate analysis in the
subsequent chapters. It maps education profiles of the household population aged 13-24 by
individual, household and community level factors for 2006 and 2010.
21
In chapter five, this study investigates the role of individual, household and
community variables on impacting the probability of ever accessing secondary schooling for
all children aged 13-24 years and their evolution after the USE Policy of 2007. It is called a
global multivariate model because it is preoccupied with ever accessing secondary school as
opposed to (i) never being enrolled at primary, (ii) ever being enrolled but dropping out of
primary, (iii) still being enrolled at primary despite attaining the age for secondary and (iv)
completing primary but never making a transition to secondary.
In chapter six, emphasis is laid on making a transition to secondary schooling for
children that may have completed primary. Here, the effect of individual, household and
community levels variables on ever making a transition to secondary and their evolution
between 2006 and 2010 is explored.
It is one thing to access secondary schooling and yet another to access quality (as
defined by performance) secondary schooling. It is in this spirit that the last chapter (seven)
investigates the role of individual, household and community level factors on impacting
access to boarding facilities (some of which are government schools) that generally provide
better quality education although policy dictates that their costs be borne by parents.

22

23
CHAPTER ONE: THE ROLE OF DEMAND AND SUPPLY FACTORS IN INFLUENCING SCHOOLING OUTCOMES
This chapter explores into studies done on inequalities in accessing school, retention
in the school system and progression to secondary level in largely Sub-Saharan Africa. In line
with the work of economists and later other scholars, these have taken the appellation
“demand and supply factors” and have been tackled at the individual, household and
community level.
In Sub-Saharan Africa, literature on education and especially with regard to access,
equity and educational attainment in general, has largely focused on primary education in line
with the 1990 Education For All commitments at Jomtien, reaffirmed in Dakar in 2000 and
the Millennium Development Goals (Nakabugo, Byamugisha & Bithaghalire, 2008). In other
parts of the developing world like Asia and South America, academics, policy makers and
researchers are increasingly getting interested in access or transition to secondary education
after the realization that attrition at the primary level is high and that survival rates to the end
of the primary cycle are low (Lewin, 2011a ; Ahmadi, Hussain & Bose, 2005; Siddhu, 2011).
Generally, universalizing education has been characterized by dampening quality due
to bourgeoning school-age going cohorts on one hand and increased costs on the part of
governments on the other hand, which in turn explain overcrowding of classes, reduced
numbers of trained teachers and overburdened school infrastructure (Ssewamala, Wang,
Karimli & Nabunya, 2011; Lewin & Akyeampong, 2009; Somerset, 2011; Akyeampong,
2009; Somerset, 2011;Chimombo, 2009 ; Deininger, 2003; Oketch & Somerset, 2010) that
have led to increasing inequalities (Zuze & Leibbrandt, 2011) which are exacerbated at the
secondary level (Akyeampong, 2009; Henaff & Lange, 2011; Lewin, 2011b; Rolleston, 2009;
Oketch & Rolleston, 2007).
Looking at access to secondary, in a way, involves looking at issues of internal
efficiency and wastage at the primary level for primary education is a cost to governments
(MoES, 2004) who invest colossal sums of money in buildings, scholastics, teacher
education, teacher salaries and capitation grants. It is also a cost to parents that would hope to
reap a lot from their children once they have completed and are working. It is equally a cost
to the children that invest a lot of time and energy. Besides, an inefficient school system

24
would be a great cost to society in general as an increase in the proportion of children out of
school may have negative social, economic and political consequences (Lewin, 2007c; Pilon,
2002a).
Issues of access to the secondary cycle should be appreciated in the context of the
current education indicators of Gross and Net (Attendance or Enrolment) rates used to date,
to monitor milestones towards the attainment of MDGs and EFA commitments, that have
been found to have numerous deficiencies (Gérald & Pilon, 2005; Lewin, 2011b; Marcoux &
Pilon, 2003; Pilon, 2005 ; Bernard, 2010).
It flows from the foregoing that the review of literature on access to secondary
schooling cannot be done in isolation of factors related to accessing primary, retention and or
dropouts at that level and completion of the primary school cycle. This is true because: (i)
some children may not access secondary since they did not enter primary but also because;
(ii) access to secondary may be determined by a multiplicity of factors that impact retention
(or dropouts) at the primary level. While some authors have found out that the factors
explaining access to primary, completion of primary and access to secondary are only
slightly different (Kabubo-mariara & Mwabu, 2007; Bajracharya, 2010), it would be wrong
to assume that they are always so, over time and space. Besides, the pathways through which
these factors operate to impact access and or retention may also vary in time and space.
For this reason, factors related to equity, access, dropout, and grade attainment at the
primary level and access or transition to secondary level shall be reviewed separately and
those common to both cycles highlighted while different ones and the extent of their
difference explored. These are largely factors that explain demand for education and are
therefore tackled from the perspective of the consumers (parents and children). They can be
categorized as individual (child related), household, household head, other household
members and community level factors or characteristics (Marcoux & Pilon, 2003; Pilon,
2002b; UIS et al., 2004).
1.1 Child factors and primary schooling
The factors explored here are sex and age of the child, his/her relationship to the
household head and orphanhood status.

25
1.1.1 Sex of child
Several studies have found out that female children were more disadvantaged with
regard to primary schooling as compared to their male counterparts. This was found to be true
in Ghana (Fentiman, Hall, & Bundy, 1999; Rolleston, 2009), Peru (Ilon & Moock, 1991),
Kenya (Kabubo-mariara & Mwabu, 2007), Burkina Faso (Kobiané, 2006) and its capital
Ouagadougou (Pilon, 2002a) as well as Nepal (Bajracharya, 2010). In the case of Kenya,
while girls were more disadvantaged at enrolment, grade attainment was not gender selective,
once enrolled.
On the other hand, other studies in Uganda (Kakuba, 2012) and Bangladesh (Maitra,
2003) have found no gender gaps with regard to initial enrolment and retention at primary.
Important to note is that where gender parity has been achieved at national level, this
has continued to mask inequities for the poorer strata of society (Henaff & Lange, 2011) in
the countries of the South in general, and at regional, district or even lower levels in Uganda,
in particular (UNICEF, 2005). Indeed, recent literature shows that the gender gap with regard
to accessing and completion of primary has greatly narrowed in Uganda (Deininger, 2003);
Kakuba, 2006; UBOS and Macro International Inc, 2007 ; UNICEF, 2005) although gender
inequities still remain in the for-long unstable regions of the north, pastoralist communities of
the north-east and especially the Karamoja region as well as the far southwest, particularly
Bundibugyo (MoES , 2011; UNICEF, 2005). In these areas, girl child education was found to
be affected by child labor in households, early marriages and teenage pregnancies (UBOS,
2010) all exacerbated by the low value attached to the girl child in the cultures of the
concerned communities (Roach, 2009). Over and above the mentioned challenges, other
scholars also point out lack of female teachers to work as role models in most of the rural
schools, skepticism by some parents about labor market possibilities for their daughters and
some cultural and religious beliefs (Nassali, 1998; Buchmann, 2000; Fentiman et al., 1999;
Lincove, 2009) as some of the other challenges that stand in the way of girls’ education.
Other concerns that are increasingly interesting scholars are gender differentials in
achievement (performance) and age appropriate enrolment at the subsequent level. In this
case, Wells (2009) found out that girls were more likely to be enrolled later at secondary
level than the official age in Uganda, and that this was associated with dropouts and less
success in their secondary schooling, for those that remained.

26
1.1.2 Age of Child
Besides being introduced in many models as a control variable, age is a critical
determinant of enrolment because it may impact the ease with which a child may; do the
learning, progress in school and conversely, the probability of dropout. In most countries, age
at enrolment is fixed, although in most of the developing world, children start later than
scheduled for various reasons.
Most children were found to enroll in school later than the officially prescribed ages
in Uganda (Wells, 2009; Tumushabe et al., 1999; Uganda Bureau of Statistics, 2010b), Kenya
(Kabubo-mariara & Mwabu, 2007), Tanzania (Ainsworth, Beegle, & Koda, 2005), Ghana
(Fentiman et al , 1999), Burkina Faso (Kobiané, 2006), Malawi (Chimombo, 2009) and
Madagascar (Lewin & Sabates, 2011). In Uganda, the reasons for late entry included long
distance to school, school being too expensive, bad terrain in hilly areas and in areas with
rivers, need for labor at home, illness and a child being too young given poor feeding at home
and in school where a young child could not withstand the hunger (UBOS, 2010a; UBOS &
ORC Macro, 2001).
In Ghana, while girls were likely to enroll at the right age as compared to their boy
counterparts, old age entry into school led to dropouts as the value of a child’s time increases
with age and this was more true in the rural and poorer households. Equally, children were
found not to enroll on time because of ill health, poor nutrition and long distance to school in
some regions. A good number of respondents said their children were not enrolled because
they were too young (despite having the right age), because they (the children) lacked the
social or cognitive skills to enroll or had poor physical development due to poor nutrition.
Variations in age at entry were found to be bad as this impeded learning since older children
tended to harass younger ones.
On the basis of the literature reviewed, it was found that age at enrolment exhibited a
curvilinear pattern i.e. the probability of enrolment increased with age at a decreasing rate
and this was true in Kenya (Kabubo-mariara & Mwabu , 2007), rural India (Siddhu, 2011),
Uganda (UBOS & Macro International Inc, 2007), Bangladesh (Maitra, 2003), Ghana
(Akyeampong, 2009), and Burkina Faso (Kobiané, 2006), among other countries.
While underage children may not easily cope because of older children that may
harass them (Fentiman et al., 1999), children who enroll late are most likely to drop out
27
(Akyeampong, 2009; Ohba, 2009) because the value of their labor appreciates with age. For
the girls, an additional challenge is that they reach puberty while still in primary and this
coupled with long distance to school, peer pressure and wrong attitudes to girl education in
some communities (UNICEF, 2005), often explains sexual harassment from both peers and
teachers, teenage pregnancies, elopement, early marriages and hence dropouts (New Vision,
2011).
The effect of overage enrolment on learning outcomes and the possibility of dropout
is best summarized by Lewin & Sabates, thus:
First, children who enroll above the normal age will miss learning
experiences at a time when they are most receptive to learning basic skills,
and establishing secure foundations for subsequent cognitive
development. Secondly, the more overage a child is for a grade, the more it
is likely that they will underachieve. Thirdly, where children are taught with
older children, there are likely to be psycho-social issues (self-esteem,
bullying, sexual harassment) and challenges in learning more so since these
children are mostly in monograde teaching systems. And lastly, overage
children will be the last to arrive at the end of the primary cycle and in
many societies, these are the ages of entry into labor or marriage (Lewin &
Sabates, 2011 p.12).
1.1.3 Relationship to household head
In the African context, children do not exclusively live in households of their
biological parents for some reasons. Some may be orphaned and taken over by relatives,
some often live in other households that are closer to better schools in search for better
education while others go to work as maids or houseboys in other households, especially in
the urban areas in the context of increased female labor force participation and the demands
of salaried employment.
Most studies that have largely used secondary census or survey data are increasingly
getting interested in the relationship between children surveyed in households with the
household head and its implications for schooling outcomes.
28
Studies have found that a child that is a biological offspring of the household head is
more likely to enroll and progress in school than relatives, non-relatives and other children
and this was true in Kenya, (Kabubo-mariara & Mwabu 2007), Uganda (Kakuba, 2012),
Burkina Faso (Kobiané, 2006) and its capital Ouagadougou (Wayack-Pambè & Pilon, 2011),
Togo (Pilon, 1995), Tanzania (Ainsworth et al., 2005), Ghana (Rolleston, 2009) and several
countries [Burkina Faso, Cote d’Ivoire, Ghana, Guinea, Mali, Niger, Senegal and Togo] in
West Africa (Pilon, 2005).
What seems to come out from the relationship between foster hood and schooling was
summarized by Pilon following several studies in several countries in West Africa. Generally,
children fostered in other households in villages, indicative of rural-urban differentials in
school supply, were more likely to be enrolled in school compared to children of household
heads while in towns, foster hood tended to disfavor more of girls than boys and was more
prevalent in richer households where girls were often employed as house helpers (Bruyninckx
& Pilon, 2010; Pilon, 2005, 1995, 2002a). This however does not preclude that some
children in the urban areas would indeed come to get education but end up performing badly,
repeating classes and dropping out of school due to much domestic work in the receiving
households (Bruyninckx & Pilon, 2010; Pilon, 2005, 1995, 2002a).
The effect of the relationship between the child and the household head on schooling
was found to be moderated by, inter alia, the financial involvement of the sending household
in the upkeep of the fostered child, the degree of closeness between the two households, the
place of the child in the new home (Pilon, 2005) and the motive for the coming of the child
into the receiving household as elucidated by Pilon (1995) in the case of Togo. In the latter
case, if a household had its own children (children of the head), then fostered children were
less likely to be enrolled than children of the head. On the other hand, children fostered in
households with no children of the household head, were more likely to be enrolled and this
points to some children coming in as house helpers while others come in to get better
education.

29
1.1.4 Orphanhood status
Orphans are expected to be disadvantaged with education following the death of the
bread winner but also because they take on more responsibilities during sickness, especially if
it is long sickness, and after the death of one, and worse still, both parents.
In seven countries in Sub-Saharan Africa (Lloyd & Blanc, 1996) and North Western
Tanzania (Ainsworth et al., 2005), orphanhood did not affect school enrolment although in
the case of Tanzania, loss of a mother, and worse still, both parents affected the number of
hours of school attendance during sickness and within the few months following the death of
either mother or both parents.
Some scholars have gone ahead to look at the effect of maternal, paternal and double
orphanhood on school enrolment in the urban and the rural areas and or for boys and girls,
separately. In Burkina Faso, Kobiané et al. (2005) found out that double orphans were more
disadvantaged in the rural than urban areas and that orphanhood tended to affect girls more
than boys. The effect of orphanhood on education was generally found to be ambivalent
given the role of the extended family and NGOs in cushioning the otherwise detrimental
effects. It also varied by place of residence, type of orphanhood, sex of the orphan and the
willingness and ability of the relatives to care for the orphans.
1.2 Household level factors and primary schooling
These factors include household wealth or income, parents’ education, family size,
sex, religion, ethnicity, marital and employment status of household head as well as
household size and structure.
1.2.1 Household wealth or income
In situations where there is no readily available data on household expenditure or
income, principle component analysis and or multiple cluster analysis (Filmer & Pritchett,
2001; Kobiané, 2004) have been devised to categorize households according to various
wealth or poverty levels.
30
Household wealth seems to be a very strong factor explaining access to basic
education, progression in school and educational attainment, in most of the developing
countries. The relationship between the level of household wealth and access to basic
education was found to be consistently positive as vindicated by studies in Uganda (Balihuta
& Semogerere, 1995; Roach, 2009; UBOS and Macro International Inc, 2007; UBOS, 2011;
UNICEF, 2005), Tanzania (Ainsworth et al., 2005), Kenya (Kabubo-mariara & Mwabu,
2007), Peru (Ilon & Moock, 1991), Cameroun (Wakam, 2003), Malawi (Chimombo, 2009),
Ghana (Rolleston, 2009; Fentiman et al. 1999), Conakry in Guinea (Glick & Sahn, 2000),
Nepal (Bajracharya, 2010), Burkina Faso (Kobiané, 2006), Ouagadougou, the capital of
Burkina Faso (Wayack-Pambè & Pilon, 2011), Nigeria (Lincove, 2009), the Democratic
Republic of Congo (Mabika Mabika & Shapiro, 2012) and seven countries in Sub-Saharan
Africa (Kenya, Tanzania, Cameroun, Niger, Malawi, Namibia and Zambia) (Lloyd & Blanc;
1996).
Recent literature, in the aftermath of various universal education initiatives, seems to
indicate no improvement since household wealth remains the strongest predictor of access to
basic education as found out in six Anglophone (Kenya, Malawi, Nigeria, Tanzania, Uganda
and Zambia) and seven francophone countries (Benin, Burkina Faso, Cameroun, Madagascar,
Mali, Niger and Senegal) in Sub-Saharan Africa (Lewin & Sabates, 2011), while comparing
the pre and post universal primary education implementation years.
The effect of household wealth on education can be tackled from two perspectives: (i)
the ability (or inability) to foot direct costs like fees and indirect costs like feeding of
children, scholastic materials, uniforms, transport to school, building fund, among others but
also (ii) opportunity costs i.e. the labor of children missed if they are to enroll in school,
which largely affects poorer, rural based and peasant households but more disproportionately
the girls as was the case in Kenya (Kabubo-mariara & Mwabu, 2007), Uganda (UNICEF,
2005), Burkina Faso (Kobiané, 2006), Nigeria (Lincove, 2009) and Ghana (Akyeampong,
2009).
To expound on the effect of costs, despite the existence of universal primary
education in Uganda since 1997, the Uganda Eddata Survey documents that “monetary
reasons” stood out as the main factor why children had never been enrolled and for dropouts,
four years into the implementation of the program (UBOS and ORC Macro, 2001). The
situation seems not to have improved in the recent past since again “school being too
expensive”, was advanced as the main reason for school dropouts in 2005/6 and 2009/10,

31
following a panel study of the same households at two data points by the Uganda Bureau of
Statistics (UBOS, 2011).
In Uganda, costs on books, other supplies and uniforms (UBOS, 2010a), other fees
charged by some schools to cover salaries of teachers since the government often delayed to
pay (Zuze & Leibbrandt, 2011) as well as lack of interest in school (Ssewamala et al.,
2011(Deininger, 2003; Kalule, 2000) were still some reasons for non-enrolment and poor
retention of some children. Studies elsewhere have in addition made mention of building
fund, sports and water bills, costs on clothing, accommodation, feeding and PTA fees, still
being charged by some schools as posing a challenge to education of mostly the very poor
household population as was reported in Ghana (Akyeampong, 2009), Kenya (Kabubo-
mariara & Mwabu, 2007; Somerset, 2011), Malawi (Chimombo, 2009; Kadzamira & Rose,
2003), rural Madagascar (Deleigne & Kail, 2010) and Burkina Faso (Pilon, 2010). This is
despite great efforts to subsidize primary education through either provision of registration
fees and school kits to all children, provision of capitation grants and school facilitation
grants or the removal of fees thereby making primary education “universal and free” in these
countries. To illustrate this point, Kabubo-mariara (2007) points out that despite introducing
free primary education in Kenya in 2003, high levels of poverty and other expenses on
uniforms, books and transport were still affecting enrolment of close to 10% of the eligible
age-group.
1.2.2 Parents’ education
Education of both father and mother, have an impact on the enrolment status of
children but also their progression in school. Generally, the level of education of
parents/household heads has been positively associated with higher chances of enrolment and
attainment for children and this was found to be true in Uganda (Deininger, 2003; Kakuba,
2006), Tanzania (Ainsworth et al., 2005), Nepal (Bajracharya, 2010), Guinea (Glick & Sahn,
2000), Togo (Pilon, 1995), Ouagadougou (Pilon, 2002b ; Wayack-Pambè & Pilon, 2011),
Burkina Faso as a whole (Kobiané, 2006), Nigeria (Lincove, 2009) and in seven countries in
Sub-Saharan Africa (Lloyd & Blanc 1996).
Some authors have gone ahead to look at the differential effect of paternal or maternal
education on schooling outcomes of girls, boys and both girls and boys.

32
In rural Peru (Ilon and Moock 1991), Bangladesh (Maitra, 2003) and six countries in
Sub-Saharan Africa (Pilon, 1996), mothers’ education was found to be a bigger factor than
fathers’ education with regard to school participation and had a bigger impact on children’s
education, even for the next generation. In the case of Sub-Saharan Africa, Pilon illustrates
this point thus:
La configuration "père non instruit/mère ayant été scolarisée" procure dans
la plupart des cas des chances de scolarisation un peu plus élevées que la
situation inverse "père ayant été scolarisé/mère non instruite". Cela se
vérifie dans tous les pays pour les garçons, et dans trois des six pays pour
les filles (au Kenya, à Madagascar et au Malawi) (Pilon, 1996, p.30).
On the contrary, in Kenya (Kabubo-mariara & Mwabu, 2007), father’s education was
more important for children’s enrolment than mothers’ education and in Kinshasa, (Shapiro,
2003), increased paternal education was associated with increased education of especially the
daughters. It is evident that education of parents, in the same capacity as the wealth status of
households is a key factor in children’s education. It is therefore important that the
mechanisms through which parental education operates to impact children education be
hypothetically explored. In the first place, there is a strong correlation between education and
wealth status so that the positive effect of parents’ education on children’s education may be
confounded by the effect of income on education. Secondly, an educated parent is more
liberated from backward attitudes that down play the role of education and more so that of the
girl child. An educated parent has the cognitive abilities and can mobilize time (because of
the importance they attach to education) to help the children with class work (Deininger,
2003), which enhances learning, retention and progression in school. Since educated parents
will most likely be engaged in off farm activities, their children are, most likely, not to
engage in constraining domestic work, that may lead to lack of time for revision,
absenteeism, poor performance and ultimately, dropouts.
The differing effects of paternal and maternal education on both boys and girls could
be linked to the real and perceived market value of the labor for both sexes on the market, the
expectations of the parents about the probability of being looked after in their old age
(Buchmann, 2000) and the cognitive abilities of the children in question.

33
1.2.3 Family size
According to studies in the West (Blake, 1981;Booth & Hiau Joo Kee, 2009), there
seems to exist a negative effect of family size on children’s education. In other countries,
especially in the developing world, the relationship ranges from being nonexistent to
sometimes positive.
This relationship has been found to be non-existent in Uganda (Kakuba, 2006; Roach,
2009) and Kenya (Buchmann, 2000). In Cameroun, it was generally nonexistent in the rural
but existent and negative in the central region and urban areas (Eloundou & Williams, 2006).
In Indonesia, it was nonexistent in the rural areas for the older and younger cohorts while
positive for older cohorts and negative for younger ones in urban areas (Maralani, 2008).
On the other hand, in a more recent study in Kenya, Kabubo-mariara & Mwabu
(2007) found the relationship to be negative whereby an increase in the number of children
and working adults reduced the probability of enrolment implying competition for resources.
In the same reasoning in Ghana (Lloyd & Gage-Brandon,1994), high fertility had a negative
impact on the education of girls, in terms of, dropout rates and grade attainment.
In a study in Botswana (Chernichovsky, 1985) and a prior study in Kenya (Gomes,
1984), there was a positive relationship between family size and children’s schooling and in
the case of Kenya, this was attributed to the role of elder children in supporting the education
of younger ones.
It appears from this literature that these studies did not clearly differentiate family size
from household size and that the relationship is ephemeral and ambivalent both in one
country at any one point and overtime as well as across countries. Important to note is that
increasing urbanization seems to be moderating the effect of family size on education as time
goes by, to the extent that in more urbanized communities, it is increasingly tending to be
negative while in the rural, it is largely nonexistent.
1.2.4 Sex of household head
Sex of the household head is a big determinant in the schooling of children. Female
headed households are hypothesized to be less advantaged since traditionally, mothers lack
34
adequate resources like land, enough education as compared to their brothers, and social
capital hence less ability to invest in the education of their children.
Contrary to this long held view, recent literature seems to present that children under
female heads were more likely to be enrolled in school than those under male household
heads as vindicated in Uganda, (Kakuba, 2012), rural Burkina Faso (Kabore, Lairez, & Pilon,
2003), Ouagadougou (Wayack-Pambè & Pilon, 2011), Togo (Pilon, 1995), Ghana (Rolleston,
2009) and in seven countries in Sub-Saharan Africa (Lloyd & Blanc, 1996).
Several studies have justified that mothers are known to budget better than fathers and
invest more in education and welfare of children. Besides, they can invest more time, love
and attention in children, all of which enhance academic achievement and attainment. Female
heads also expect more from their children in old age, given their prior vulnerability in terms
of poor education and limited access to resources (Lloyd and Brandon as cited in Kabore et
al., 2003; Lloyd & Gage-Brandon, 1994; Pilon, 1996 ; Kobiané, 2006).
Kobiané nuances better management of household resources by female heads thus :
« ...Ce résultat suggère que c’est particulièrement dans le contexte de pénurie des ressources
économiques que les femmes chefs-de-ménage font preuve d’un meilleur investissement dans
la scolarisation des enfants» (Kobiané, 2006 p.139).
1.2.5 Household size and structure
Recent research is increasingly concerned about the effect of the size and
demographic structure of the household on children’s education. In this case, the proportion
of the under-fives/six in the household, the number of male and female adults, the proportion
of children of school going age and the total size of the household and their impact on
education of children have been explored.
Studies have found a negative relationship between the proportion of children (below
five or six years) in a household and education of children in that household. This was found
to be true in Uganda (Kakuba, 2012), Cameroun (Wakam, 2003), Nepal (Bajracharya, 2010),
Guinea (Glick & Sahn, 2000), Ougadougou (Wayack-Pambè & Pilon, 2011), Ghana
(Rolleston, 2009), Nigeria (Lincove, 2009) and among the poor in Burkina Faso (Kobiané,
2003).

35
While in Peru (Ilon & Moock , 1991) the presence of a young child had no impact on
enrolment, attainment and dropout, in Bangladesh (Maitra, 2003) an increase in the
proportion of children aged 0-5 was associated with higher probability of enrolment.
Presence of old men and women has been found to have differing effects on education
of both boys and girls. In this case, Wakam (2003) found out that the presence of old females
enhanced enrolment of boys and girls while that of old males tended to disfavor enrolment of
the girl child in Cameroun. In this case, while the old women would help in household chores
and free time for the girl child to enroll and progress once enrolled, men would tend to
depend on family labor of women and girls hence a negative relationship.
In Kenya Kabubo-mariara & Mwabu (2007) found that an increase in the number of
adult females increased enrolment for boys but not for girls.
While in Bangladesh (Maitra, 2003) and Kenya (Kabubo-mariara & Mwabu, 2007),
the relationship between household size and enrolment status of children was not significant,
in Cameroun (Wakam, 2003) and Burkina Faso (Kobiané, 2006), there was a positive
relationship between household size and children’s enrolment status, more so in the urban
areas, indicative of employment of house helpers of school going age to help in household
chores. In Nigeria, while the proportion aged 6-14 was not associated with enrolment of boys,
it enhanced the enrolment of girls (Lincove, 2009).
1.2.6 Religion and ethnicity
These may be put together because they are both cultural factors that may affect
schooling decisions. For reasons related to history, geography or even internal politics of a
country, education supply and demand factors may vary from one region to another or one
district to another, hence affecting ethnic groups differently.
In Uganda, between 1877 and 1925 , when the Church missionary society of England
and the White Fathers from France introduced Christianity, education was run and controlled
by missionaries (Nkata, 1999). This led to the creation of catholic schools alongside
protestant schools and in light of indoctrinatory ideologies imparted by missionaries that each
of those faiths was superior to the other, some rivalry developed among the two faiths. While
the colonial government tried to weaken the influence of churches in education, laxity of
36
government in the Amin era of 1971 to 1979, enabled churches to regain control of the
education system. This implies that there were religious inequities in access to education
since children would mostly attend schools of their faiths to the extent that two different
schools belonging to two different faiths, would be each 30% full and children of one faith
would walk long distances to attend a school of their faith (Tiberondwa, 1999). In the
meantime, Muslims were almost out of the education equation. Not only did religion impact
supply of education and hence differing access by different faiths, it was also a form of
ideology and the role of ideology in shaping attitudes about things like demand for education
cannot be underestimated.
Studies elsewhere have found that children of Christians were more likely to be
enrolled in Togo (Pilon, 1995), Kinshasa (Shapiro, 2003), Ouagadougou (Wayack-Pambè &
Pilon, 2011) and Burkina Faso as a whole (Kobiané, 2006), as compared to those of Muslims,
animists and other religions. In Nigeria (Lincove, 2009), while Christian children were not
necessarily more likely to be enrolled, boys and girls from Muslim households and girls from
traditionalist religions were less likely to be enrolled.
In Bangladesh (Maitra, 2003) on the contrary, Muslim children were more likely to be
enrolled than those of all the other religions.
Ethnicity is also a determinant of children’s schooling. Following a retrospective
study in Kinshasa, Shapiro (2003) found out that, Bakongo women were more likely to have
been educated in their childhood days than all the other ethnicities. In Burkina Faso, children
of Peul and Lobi were less likely to be enrolled than those of other ethnicities while those of
Samo and Gouronsi were more likely to be in school (Kobiané, 2006). The Peul are largely
cattle keepers, and this as seen elsewhere, has negative implications for schooling. They also
were at the forefront of resisting colonialism and any foreign (especially western) influence
including christianity and this resulted in less provision of schools in their areas in the
colonial era. This has continued to haunt the education of children in the concerned
communities. The reverse was true for the Samo and Gouronsi.
1.2.7 Employment of parents
Employment of parents, impacts type and quality of income, is influenced by level of
education and has a bearing on things like the opportunity cost for schooling of children. It

37
dictates the socio-economic status of the household and this has an impact on children’s
education.
Literature in Africa and other parts of the developing world seems to present a
negative effect of agriculture (largely labor intensive peasant farming) and conversely, a
positive effect of salaried employment, as the main occupation of the household head on
schooling of children. This was found to be true in rural Peru (Ilon & Moock, 1991), Mexico
(Camarena Cordova, 2003), Uganda (Roach, 2009), Togo (Pilon, 1995), Ouagadougou
(Wayack-Pambè & Pilon, 2011), Burkina Faso as a whole (Kobiané, 2006), Ghana
(Rolleston, 2009) and Nepal (Bajracharya, 2010).
In Kenya, maternal employment (salaried) was found to increase children’s (boys and
girls) enrolment while paternal employment increased enrolment for boys and not for girls
(Kabubo-mariara & Mwabu, 2007).
Peasant agriculture impacts negatively on schooling because it is labor intensive and
the labor from the children is much needed to sustain these mainly poor and large households.
Children are found to be engaged in tilling the land, cattle rearing, firewood collection,
fetching of water and other indoor household chores all of which may affect the age at
enrollment, regularity of attendance, concentration in class, the time to do home revision and
hence learning, retention and progression in school. In addition to being related to higher
incomes, salaried employment is source of cultural and social capital that is not only critical
for the schooling of children but also for their holistic growth and development.
1.2.8 Marital status
Marital status is hypothesized to affect education in which case widowhood is
associated with the family being robbed of the bread winner, psychosocial effects and
increased work for children in the household. Separation or divorce may equally be
associated with psychosocial effects on the children which affect learning and retention in
school. In Uganda, a statistical analysis of Demographic and Health Survey data for the
western region revealed no relationship between marital status of parents or caretakers and
children’s education (Kakuba, 2006). On the other hand, the qualitative module of the
national household survey done recently and over the whole country pointed out that divorce
of parents led children to engage in small businesses and girls to be married off at an early
38
age, hence affecting their education (UBOS, 2010c). Other studies in this regard have looked
at the effect of polygamy on education of children and in this case, in Kenya children from
polygamous marriages were less likely to be enrolled than those from monogamous ones and
this was found to be the worst scenario of the resource dilution effect (Buchmann, 2000).
1.3 Community factors and primary schooling
The community factors looked at here are: place of residence (rural-urban), region
and distance to school.
1.3.1 Place of residence
Place of residence dictates differences in school quality and distribution, the supply of
teachers, the types and sources of household incomes and other cultural factors that affect
education of children. Children in the urban areas were found to be at an advantage with
regard to primary schooling in Uganda (Roach, 2009; UNICEF, 2005), Kinshasa (Shapiro,
2003), Malawi (Chimombo, 2009), Ghana (Fentiman et al., 1999) and Togo (Pilon, 1995).
This urban-rural dichotomy seems not to have been eclipsed by the numerous
universal education initiatives that were undertaken by several countries in Sub-Saharan
Africa, in the spirit of the 1990 Education for All commitments and the Millennium
Development Goals. Following a study of thirteen countries of which six were Anglophone
(Kenya, Malawi, Nigeria, Tanzania, Uganda and Zambia) and seven (Benin, Burkina Faso,
Cameroun, Madagascar, Mali, Niger and Senegal) francophone at two data points, i.e. before
and after the implementation of Universal primary education initiates, Lewin & Sabates
( 2011) arrived at this conclusion:
In all Francophone countries, we found that children living in rural areas are
more likely to be out of school relative to children living in urban areas. But
this was not the case for Anglophone countries. Only in Malawi we found
that children living in rural areas were 7.9% more likely to be out of school
relative to those living in urban areas. In fact, in two Anglophone countries
(Kenya and Uganda) we found that children living in rural areas were less
likely to be out of school than those in urban areas and in the rest of these

39
Anglophone countries (Nigeria, Tanzania and Zambia) we did not find
significant differences in the likelihood of children being out of school by
location (Lewin & Sabates, 2011 p.35).
These findings imply that far from reducing location related inequalities with regard
to retention in school, completion of primary and continuation to secondary, children from
the rural areas in the studied francophone countries were worse off with regard to being
enrolled than they were a decade before. In addition, more Anglophone countries had not
improved despite the basic education universalizing initiatives that have continued to take
relatively significant proportions of government expenditure and preoccupy international
donors. This may also point to the fact that, at the secondary level, the situation may not be
better.
Urban areas have more evenly distributed schools than rural areas and it is not
uncommon to find good and experienced teachers concentrated in the urban areas where
returns to their investment seem to be highest leaving the villages with very few and often
less experienced teachers as was the case in rural Madagascar (Deleigne & Kail, 2010). In
addition, urban dwellers tend to be more educated, have better jobs and higher incomes than
rural dwellers. In the recent past, studies are now linking this to the “neighborhood and peer”
effect (Takahashi, 2011) where children in affluent milieus and with many schooling young
people, are more likely to be in school for their parents would feel out of place if their
children were not enrolled. The challenge here is whether these children are enrolled because
they are in affluent environments or they are in affluent environments in order to be enrolled
and requires further investigation.
The hitherto acclaimed urban advantage should however not mask the existence of
problems of access to education in urban areas, especially in the periphery and slums. In
Ouagadougou (the Capital of Burkina Faso), Pilon (2002a) brings to the fore, enrolment
differentials linked to sex of child, socio-economic status and relationship to the household
head, as well as, the nature of employment. Children, whose parents were mainly in
agriculture, were still disadvantaged. In the same vein, distance to school was still a factor
exacerbated by traffic jams, pollution and accidents in the context of a poorly organized
public transport system and the fact that some of the geographically nearby schools were
40
private and therefore unaffordable to some households. The privatization of education and its
implications for access to education by especially the poor, are reechoed in a recent study in
the same capital (Baux, 2010).
It should be noted that the private sector attracts better teachers, pays them better and
has better infrastructure and more manageable numbers of students per teacher, all of which
enhance learning, retention and progression in school for those who can afford. Conversely,
the majority in the public school system are left to learn in a largely crowded environment,
with few learning aids, and unskilled or even demoralized teachers. All these subsequently
lead to a decline in quality not only affecting achievement (true learning) but is also a
precursor for dropouts.
1.3.2 Region of residence
Due to reasons related to history, geography (Uitto, 1989), the nature of economic
activities as well as insecurity in some areas, some regions are more disadvantaged with
regard to schooling of children than others. In Ghana, the northern region was more at a
disadvantage than other regions although disparities were diminishing over time (Rolleston,
2009). In Uganda, children in the northern region were less likely to be enrolled than those in
other regions (Deininger, 2003) and this was more true for the rural areas (Kakuba, 2012).
UNICEF (2005) links disparities in access to education to pastoralist and fishing activities
and conflict in some areas. Indeed the north-eastern part of Uganda is inhabited by the
pastoralist Karimajong for whom the opportunity cost of schooling seems to be higher than
grazing cattle and whose nomadic nature seems to be incompatible with formal schooling.
Besides, a bigger part of northern Uganda was plunged into a civil war for more than 20 years
and this affected the supply of schools and other scholastics but also household incomes as
almost all people were confined in camps and could not engage in meaningful agriculture
(main economic activity) for a long time. The supply and demand for education were thus
greatly hampered.
In Malawi, children in the southern region were more disadvantaged than those in the
northern region (Chimombo, 2009) while in Nigeria, those in the north-east and north-
western regions were more likely to be disadvantaged (Lincove, 2009). In the latter two
scenarios, both authors talk of historical factors as being the main reason for the differences

41
as was seen, with regard to the question of ethnicity. The regions that were at a disadvantage
had access to fewer schools and infrastructure in the colonial times because Christian
missionaries (who were the vanguards of education then) did not target them for reasons of
proximity. In the case of Malawi, the missionaries intentionally designed a curriculum that
emphasized morals and religious education for the southern regions as opposed to the one
that emphasized literacy, numeracy, agriculture and artisan skills in the northern areas. For
Nigeria, the locals (in the affected regions) were hostile to westernization and by implication
Christianity that they closed doors to all western influence including formal education in
favor of traditional systems or Islam that had come earlier. While it would be wrong to
continue to blame colonialism and Christianity on these differences half a century after
independence, it would not be appropriate either to downplay these historical perspectives
while looking at spatial differences in supply and demand for education today.
1.3.3 Distance to school
Distance to school negatively affects school participation for children although the
effect may vary by sex of the child. In the first place, it may be a disincentive to enrolment
but may also affect the age at enrolment which has a bearing on the frequency of attendance
and the level of concentration in class all of which may in turn affect learning and
progression in the school system.
An increase in distance to school has been found to negatively affect access to
primary school in rural Ghana (Fentiman et al., 1999), Kenya (Kabubo-mariara & Mwabu,
2007), Uganda (UBOS, 2010a ; Zuze & Leibbrandt, 2011), Burkina Faso (Kobiané, 2006)
and rural Madagascar (Deleigne & Kail, 2010). In all these studies, distance was not only a
factor for different enrolment patterns of children but also for late enrolment because children
found it hard to access distantly located schools in some regions.
In North Western Tanzania, distance to secondary school was associated with less
probability of enrolment at the primary level (Ainsworth et al., 2005) and in the same vein in
rural Peru, absence of a secondary school in the community adversely affected progression of
children in school and this particularly discouraged enrolment of girls at the primary level
(Ilon & Moock, 1991).
42
In other studies, time to school has been used to measure access and in this case,
Lincove (2009), found out that an increase in the time to primary and secondary school
negatively affected the probability of enrolment for all children (boys and girls), but more so
girls in Nigeria.
1.4 The role of demand and supply factors in secondary schooling
As discussed in the previous sections, these factors at the individual, household and
community levels shall be tackled in this section.
1.4.1 Individual factors and secondary schooling
As already stated, researchers are increasingly interested in access to secondary
schooling and this serves to understand better concepts of wastage and internal efficiency at
the primary level. In this vein, although much work has not been done on correlates of access
to this level, the literature that follows looks at what has been done by the few authors. In line
with the literature review at the primary level, individual, household and community factors
are reviewed, in that order.
1.4.1.1 Sex of child
In Uganda access to secondary education was found to be equitable for boys and girls
and this was true for urban and rural areas (Kakuba, 2012). To expound on this, while the
survival rate to primary seven (end of the primary cycle) was 31% for boys and 30.3% for
girls as per 2011, the transition rate to senior one was 67% for boys and 64.2% for the girls
in the same year (MoES, 2011b). This is indicative of near gender parity not only in
completion of the primary cycle but also transition to the secondary level. In Indonesia
(Takahashi, 2011), the gender gap that existed in the recent past has equally disappeared.
On the other hand, in Ghana (Rolleston, 2009), Dakar (Moguérou, 2011) the capital of
Senegal and Rural India (Siddhu, 2011), girls were less likely than boys to be enrolled in

43
secondary school. Reasons for the disadvantages against the girls are summarized by Siddhu
in the case of rural India as: puberty that was associated with early pregnancy and increased
protectionism on the part of parents, exacerbated by distance to school and poverty in
households. The fear of parents for the safety and reputation of their girls, increased as the
girls grew older. In this case, late age at entry in school and subsequent late completion of
primary as well as long distance to school in some rural areas compounded the problem of
girls’ access to secondary education.
As was the case with primary schooling, even where gender parity has been achieved,
this is likely to be masking gender differences in performance at the end of primary that may
dictate the quality of secondary school to be accessed. It may equally conceal gender
differences at lower levels like regions and districts and among marginalized groups like the
poor, small ethnic groups and migrants. Indeed, a recent study in Uganda shows that girls
enroll at secondary later than boys and that this negatively impacts their performance at lower
secondary and subsequent progression in school (Wells, 2009).
1.4.1.2 Age of child
It was earlier remarked that most children start school late in Uganda (Uganda Bureau
of Statistics, 2010), Kenya (Kabubo-mariara & Mwabu, 2007), Ghana (Fentiman et al.,
1999), Burkina Faso (Kobiané, 2006) and in many other countries in Sub-Saharan Africa.
While late entry into school was likely to increase dropouts at primary level in Uganda
(Grogan, 2009), Burkina Faso (Kobiané, 2006) and India (Siddhu, 2011), it was also found to
be negatively related with accessing secondary schooling in rural India (Siddhu, 2011),
Indonesia (Takahashi, 2011), Uganda (Wells, 2009) and Burkina Faso (Kobiané, 2006), but
more particularly on the part of girls in the case of Uganda and Burkina Faso.
1.4.1.3 Relationship to household head
Similar to the findings at the primary level, children of the household head were more
likely to access secondary schooling than other children in Kenya (Kabubo-mariara &

44
Mwabu, 2007), Ouagadougou (Wayack-Pambè & Pilon, 2011), Ghana (Rolleston, 2009) and
Uganda (Kakuba, 2012).
1.4.2 Household factors and secondary schooling
These factors at the household level are presented in the following sections.
1.4.2.1 Household wealth or income
Like at the primary level, literature consistently shows a strong positive relationship
between the level of household income/welfare and the probability of accessing secondary
schooling. This is corroborated by studies in Uganda (Kakuba, 2012; Kakuba, 2006;
Tumushabe et al., 1999; Wells,2009; Nishimura, Yamano, & Sasaoka, 2008; Ssewanyana,
Okoboi, & Kasirye, 2011), Kenya (Kabubo-mariara & Mwabu, 2007; Ohba, 2009, 2011;
Ngware, Onsomu, Muthaka, & Manda, 2006), rural India, (Siddhu, 2011), Bangladesh
(Ahmadi et al., 2005), Indonesia (Takahashi, 2011), Dakar (Moguérou, 2011), Ouagadougou
(Wayack-Pambè & Pilon, 2011), Ghana (Akyeampong, 2009; Rolleston, 2009) and Sub-
Saharan Africa in general (Lewin & Akyeampong, 2009). This implies that the poor are most
likely to be excluded from secondary schooling and the situation is not necessarily better
even where secondary education has been made free, as vindicated in the case of Uganda
(MoES, 2011b) and illustrated by Ohba in the case of Kenya:
The costs for sending a child to the first year of day secondary school are
about eight times the monthly income for employed parents, 12 to 17 times
for self-employed parents and 19 to 20 times for peasant parents engaged in
casual work. In the case of boarding schools, the costs for sending a child to
the first year of boarding secondary school are 15 times the monthly income
for employed parents, 23 to 33 times for self-employed parents and 38 to 40
times for peasant parents engaged in casual work (Ohba, 2009 p.30).
While it is true that in less-monetary economies, households do depend on other
sources of income other than the salary or have other businesses to live on, it should be noted
that paying school bills is one of the very many responsibilities of households, that most

45
households have several children in school and that income from the main occupation greatly
determines the consumption patterns of most households.
1.4.2.2 Education of Parents
Education of parents/household heads was strongly associated with enrolment of
children at secondary as documented in Ouagadougou (Wayack-Pambè & Pilon, 2011),
Bangladesh (Ahmadi et al., 2005), Indonesia (Takahashi, 2011) and Africa in general (Otieno
& K’Oliech, 2007). In Kenya (Kabubo-mariara & Mwabu, 2007; Ngware et al., 2006), while
an increase in maternal education favored enrolment of girls than that of boys at secondary
level, better paternal education favored more of boys’ than girls’ secondary school enrolment
implying same sex gender bias.
1.4.2.3 Household size and structure
In Thailand, Knodel & Wongsith(1991) found out that a larger family size negatively
affected enrolment at secondary level hence vindicating the quantity-quality tradeoff theory
In Ghana (Rolleston, 2009) and Uganda (Kakuba, 2012), an increase in the proportion
of children aged less than 6 and 5 years, respectively, reduced the probability of enrolment at
secondary level. Similarly in Indonesia (Takahashi, 2011), an increase in the number of
dependants defined as the proportion of the household population aged 6 and below and 65
and above, negatively affected access to senior secondary but not junior secondary.
In Indonesia (Takahashi, 2011) and Kenya (Kabubo-mariara & Mwabu, 2007), the
number of school aged household population had no effect on access to secondary education
by children in that household.
In Bangladesh (Ahmadi et al., 2005) an increase in the population aged 1-14 in a
household increased enrolment at secondary level and this was equally true in Cameroun
(Wakam, 2003) and Ouagadougou (Wayack-Pambè & Pilon, 2011), where an increase in the
number of children of school going age increased the probability of enrolment at secondary
level, hence contradicting the quantity-quality tradeoff theory.
46
1.4.2.4 Religion of head
Children from other religions other than Muslims were more likely to be enrolled in
secondary school in Bangladesh (Ahmadi et al., 2005) and rural India (Siddhu, 2011). In
Indonesia , religion was not a factor (Takahashi, 2011).
1.4.2.5 Employment of parents
As was the case in primary schooling, agricultural workers were less likely to enroll
their children at secondary level as was found out in Bangladesh (Ahmadi et al., 2005),
Ghana (Rolleston, 2009) and Ouagadougou (Wayack-Pambè & Pilon, 2011). This could be
related to high opportunity costs of sending the now older children to school and low returns
to peasant farming in the context of heightened costs of school at the secondary level (Ohba,
2009; Rolleston, 2009) and hence inadequate capacity to cater for school requirements. It is
the children of salaried parents that were most likely to be enrolled in secondary school as
compared to the children of parents in agriculture, other businesses and those engaged in
casual labor. In Kenya, parental employment had no impact on the probability that children
would access secondary school (Kabubo-mariara & Mwabu, 2007)
1.4.3 Community factors and secondary schooling
These factors are place of residence and distance to school.

47
1.4.3.1 Place of residence
Place of residence dictates the supply of schools by both government and the private
sector, the quality of infrastructure in the schools, distribution of teachers, distance to school
to be covered by children and teachers, the level and quality of parental involvement in
children’s affairs, the age at enrolment and many factors that place children in the urban areas
at an advantage as compared to their rural counterparts.
In this vein, in Uganda (Kakuba, 2012), Kenya, (Kabubo-mariara & Mwabu, 2007),
Tanzania (Bonini, 2011), Ghana (Rolleston, 2009) and Bangladesh (Ahmadi et al., 2005)
rural children were found to be more disadvantaged compared to urban children, with regard
to access to secondary education. An earlier study in Kenya using 1997 data found that urban
children were less likely to access secondary education than the rural ones (Ngware et al.,
2006). They attributed this to higher opportunity costs for schooling in towns given the
existence of many non-formal jobs, inadequacy of supply of schools due to an increase in the
urban population and challenges of child labor in towns. In the case of Bangladesh, most
secondary schools were private and established according to demand (higher among the
urban elite) and this affected access for the rural poor.
1.4.3.2 Distance to school
In Africa in general (Otieno & K’Oliech, 2007) and in rural India (Siddhu, 2011) long
distances to secondary schools especially in underdeveloped remote areas, were an
impediment to accessing secondary education for both boys and girls . In Kenya, distance to
school negatively affected access to secondary school but this factor was less important for
girls than for boys (Kabubo-mariara & Mwabu, 2007).
1.5 Emerging issues from the review of Literature
The post 1990 Universal education initiatives that were undertaken by many
governments especially in Sub-Saharan Africa resulted in increased enrolments of the

48
relevant age groups and greatly reduced the gender, rural-urban and wealth gaps at
enrolment. Indeed, the Net and Gross Enrolment rates have continued to exhibit impressive
milestones in this regard. That many children got enrolled in school was not a mean
achievement given that many children of school going age had never stepped in school
(Easterly, 2009).
The increase in enrolments after the free education initiatives was closely related to
the enrolment of especially the hitherto marginalized groups like females, the poor and rural
populations who were generally overage for entry into school (Lewin & Sabates, 2012),
which in turn impacted their retention in school and progression to higher levels. In addition,
increased enrolments cannot be explained outside the context of bourgeoning populations of
many countries in the south, rooted in high population growth rates, that explains,
increasingly bigger successive cohorts of school age populations.
In the context of high fertility, high adulthood mortality, and a small, poorly trained /
skilled and largely peasant labor force, the tax base is small and the states may not mobilize
enough revenue to sustain the ever growing school age population cohorts.
The effect of increasing school age cohorts and inability of the states to mobilize
enough resources have partly been responsible for uneven distribution of schools, high pupil
teacher ratios, congested classrooms, inadequacy of scholastics, demoralized teaching staff,
lack of libraries and laboratories amidst increasing non-involvement of most illiterate parents
on one hand, and too much involvement of “better off” parents that have shifted their children
to private schools, on the other hand. The increased numbers thus caused “enrolment shocks”
to which parents and caretakers have responded differently and their aptitude to respond
remains closely linked to their socio-economic background and several other factors at the
household level.
While enrolment greatly increased and continues to increase, universalizing education
has not answered questions as to why some children of school age do not access the
otherwise “free education” and why the majority, ranging from about 50% to 70%, continue
to drop out of primary in much of Sub-Saharan Africa while some sizable proportions fail to
transit to the secondary level. Surprisingly, in some countries, not only did survival to the end
of the primary cycle fall in relative terms (i.e. from 74% in 2000 to 31% in 2011) after
universalizing education like in Uganda (Ministry of Education and Sports, 2011), but also in

49
absolute terms like the case of Malawi (Chimombo, 2009), in the context of ever increasing
populations and hence school age going cohorts.
While the fact that completion of the primary cycle was unequivocally stated as the
indicator for measuring the goal on primary schooling and education of good quality was
pointed out as what all nations should strive for as per goal 2 of the EFA Goals, the indicators
of Gross and Net enrolment rates used to measure the progress were neither bringing to the
fore the proportions of children that were not enrolled, the quality of education dispensed and
the proportions that would survive to the end of primary. These indicators, especially the
GER were so confusing to the extent that a higher GER (100 % and above), despite being a
sign of an inefficient system because of repetitions and overage enrolment (strong predictor
of dropouts), paradoxically portrayed that all was well to the semiliterate, the literate but non-
professionals in education, the political leadership and the donor community. It is in this vein
that some scholars are now embarking on indicators that look at the proportion of children in
grade one that survive to the end of the cycle (Gérald & Pilon, 2005), completion rates that
incorporate the age aspect in both progression and completion, thereby talking of the “on
schedule completion rates” (Lewin, 2011b) or indicators that incorporate performance at the
end of the cycle and survival hence “taux de validation1” (Bernard, 2010), that can be applied
jointly.
A critical analysis of enrolment patterns and trends brings out the fact most children
enroll in school, albeit late, but the majority drop out of school before completion of the
primary cycle. It thus logically follows that investigation into the correlates of enrolment of
the corresponding age group at secondary level, cannot be done in isolation of the factors for
non-enrolment and those for non-completion or dropouts. In other words, the children aged
13-18 in Uganda, may most likely not be in secondary school because they did not enroll at
primary, but most importantly, because they : dropped out of primary or are still enrolled in
primary and lastly because they did not transit from primary to secondary school.
In this context, very little has been done on factors affecting access to secondary
schooling especially in Sub-Saharan Africa and where attempts have been done, the focus has
been on transition to the secondary level partly because survival rates to end of the primary
are relatively high, like in the case of Asia. Besides most of the studies have remained silent 1 This indicator looks at the proportion of children that enroll in the first grade of primary that is able to reach the last grade of primary but also pass the end of primary examinations. It thus combines survival and quality learning outcomes.

50
on the factors that explain exclusion from secondary because of dropouts or just failure to
make a transition and the extent to which each of these two exclusion dimensions is a reality
in any one country.
A perusal of the factors affecting primary and secondary schooling brings to the fore
that indeed, they are not very different. The individual, household and community factors that
stand out as determinants of enrolment at primary are similar to factors that explain access to
secondary in general and transition, in particular. Despite universal primary education efforts,
most of these factors have continued to determine enrolment overtime in any one country and
across countries and are even stronger at secondary level implying that while they may be
similar between levels, the degree of their effect on enrolment may vary significantly in time
and space. In addition, some factors may be stronger than others with regard to transition and
not so with regard to general access (when incorporating dropouts) and others may operate
through various pathways to impact access that may be context determined.
The reviewed factors, approached from the unit of analysis, i.e. individual, household
and community can also be categorized as economic (wealth, education, employment of
parents etc.), demographic (sex and age of children and household head, household size and
structure etc.), socio-cultural factors(religion, marital status of household head) as well as
community factors (region, rural-urban residence, distance to school). At the national level, a
community factor like place of residence stands out as a strong variable in determination of
access to school and this together with other factors like region and distance to school are
used as proxies to measure the supply of education.
At the household level, economic factors such as, household wealth, parents’
education, especially that of the mother and nature of employment remain strong predictors
of not only enrolment in school before and after “universal education” but also completion of
the primary cycle and progression to the secondary level. Demographic factors such as sex of
child and head, age of child, household size and structure seem to be other strong predictors
of schooling after the economic factors. Cultural factors like religion and marital status and
school factors seem to play a less critical role. For the latter case, this may be because most of
the studies reviewed are household-based and little is collected at school level other than
using proxies at an aggregate level, like pupil teacher ratio, pupil classroom ratio for a
district, etc.

51
In most of the countries, gender gaps at enrolment have greatly reduced but are
exacerbated at the secondary level. Besides, where gender parity has been achieved,
differences continue to manifest in some subpopulations and at lower geographical units, but
also in terms of performance and age at enrolment that has an inverse relationship with not
only progression to the secondary level but also the possibility of continuation with studies
thereafter.
Old age entry into primary school has continued to characterize most of the countries
in Sub-Saharan Africa, largely due to long distances to school, need for child labor, costs of
school and arguments that children “are not of age”. Important to note is that this
phenomenon largely explains dropouts at primary as demand for child labor increases with
age and entry into puberty sets in. This impedes most of these children from entering
secondary school hence the observed consistently inverse relationship between age and
access to secondary school.
Although many governments and donors have invested heavily in the construction of
schools, this has not eclipsed the rural-urban dichotomy in the distribution and quality of
schools. In this vein, many rural children remain disadvantaged and this, in Uganda, is
exacerbated by a disproportionately bigger increase in private schools at secondary level as
compared to the primary level and high costs of boarding fees, even in public or universal
secondary schools that, far from complementing efforts of government in provision of
education, have increased inequalities in terms of access and quality of learning.
Demographers like Pilon (1995) and others were among the pioneers in studying
access to education through analysis of secondary data sources like census and household
surveys. Since these sources did not collect data on child work or labor, these scholars
endeavored to estimate the extent of child labor from variables on (i) relationship to
household head (ii) proportion of under-fives (iii) proportion of older adults and (iv) main
economic activity of household. Many more studies have since adopted these variables to
indirectly measure the extent of child labor.
Among the demographic factors, a high proportion of children (lower than 5 or 6),
stands out as one factor that consistently explains less probability of enrolment at the primary
level and progression to the secondary level. This, in the context of children from agricultural
households and those unrelated to household head being disadvantaged with regard to
schooling, points to child labor that may be a reality in households in Sub-Saharan Africa.

52
While the effect of family size on schooling has largely been ambivalent, some of the
ambivalence was more of a methodological creation related to the definition of a family and a
household. More recent studies by demographers are looking more at household size given
the importance of extended family living arrangements, the practice of child fostering and
employment of maids in the wake of female labor force participation and increased
urbanization, in Sub-Saharan Africa. These studies, which use census or Household Survey
data, have studied issues related to household size, membership and relationship to head and
come up with different conclusions that largely point to an increase in household size being
associated with an increase in chances of enrolment. This is true because largely, other people
come in to do work, within and outside the household that not only improves household
income but also liberates time for the children of the household head to enroll and progress in
school.
Also, female household heads appear to be more likely to educate their children than
male household heads at all levels, and most interestingly even where resources seem to be
inadequate.
Some other factors like access to land, type of school attended (whether boarding or
day or even public or private), cost of school and birth order are less discussed. Cost of
school has been found to present confusing results. In Nigeria (Lincove, 2009), cost of school
was not a significant factor explaining enrolment while in Kenya it was positively associated
with accessing secondary schooling (Kabubo-mariara & Mwabu, 2007). All in all, no study
has been done on Uganda about determinants of accessing secondary schooling, leave alone
looking at the temporal aspect, in the context of the Universal secondary education Policy of
2007.
In conclusion, while free education policies have enabled the majority to enroll,
progression in school and access to secondary remain not only selective and eliminative but
more so, highly selectively eliminative to the extent that children of the poor, illiterate,
peasants and those from remote rural communities are more likely to remain entangled in
their viscous cycle of disadvantage, notwithstanding “universalizing” education.
53
CHAPTER TWO :THE PROBLEMATIC, METHODOLOGY AND COUNTRY CONTEXT
As we approach the year 2015, when all countries ought to take stock of what has
been done in view of both the EFA and MDGs, it is increasingly pertinent that steps towards
attaining the goal of “Ensuring that by 2015 all children, particularly girls, children in
difficult circumstances and those belonging to ethnic minorities, have access to, and
complete, free and compulsory primary education of good quality”, be reexamined and the
progression of primary school graduates to the secondary cycle be studied as most of the
advantages of education like its impact on human capital and labor productivity, fertility,
morbidity, mortality and social behavior, are a result of secondary, if not higher education.
Indeed secondary education2 is critical as summarized by Lewin (2007a), at a
Commonwealth conference in Uganda, thus:
• Universal Primary Education depends on adequate flow of secondary school
graduates into primary teaching and this is hard to ensure where secondary school
enrolments are low. It also depends on sustained demand for secondary schooling
that may falter if transition rates into secondary are low.
• HIV/AIDS and conflicts have decimated labor force that needs to be replenished.
• Poverty alleviation will stall unless growth and distribution are considered and
while access and completion of secondary education have become major
mechanisms of allocation of life chances in developing countries, secondary
school excludes the lowest 20 percentile of income in low enrolment countries and
this must be avoided to enable social mobility out of poverty.
• Competitiveness in high value added knowledge sectors depends on knowledge,
skills, competencies associated with abstract reasoning, analysis, language
communication skills and application of science and technology and these are
most efficiently acquired through secondary education and finally
2The Ugandan Education System involves 7years of Primary education, 6 years of Secondary education and 3/5years of University education, with most courses at University ranging between 3 and 5 years. At the end of primary, a Primary Leaving Examination (PLE) is done while after the first four years of secondary and the next two years of upper secondary a Uganda Certificate of Education (UCE) and Uganda Advanced Certificate of Education (UACE) examination respectively, is done to enable successful candidates progress to the next level.

54
• If the increased demand for secondary education is not met, those excluded may be
source of social and political unrest and greater equity will prove elusive.
In the same spirit, the increasing interest in secondary education is vindicated by a
recent publication of the 2011 edition of Global Education Digest by UNESCO Institute of
Statistics entitled « Focus on secondary education : the next great challenge » (UIS, 2011).
World over, there are more children of the relevant age group enrolled at primary than
at secondary level. According figure 1, for most countries above the world average, there are
slightly less children enrolled at secondary than at primary but for Sub-Saharan Africa, the
Net enrolment rate that is about 70% at primary level, falls to a dismal 26% at the secondary
level, with of course great variations between and within countries. It thus implies that indeed
many children enroll in school but for some reasons do not remain in school and progress to
the secondary level. Why then do most children, not enroll at secondary?
Figure 1 : Net enrolment rates at Primary and Secondary by Region of the World for 2005
Source: Constructed from Statistical tables of UNESCO EFA Monitoring Report of 2008 (UNESCO, 2007)
At the global level, there seems to be a relationship between the level of development
of a country and the probability that most of its children will be enrolled at secondary as
Developed countries top the list of high secondary school enrolment (figure 1) and
Developing countries, top the list of those that fall below the world average. Could this
0 20 40 60 80 100 120
Sub-Saharan Africa
Caribbean
Arab States
South and West Asia
Developing countries
World
Pacific Countries in transition
Central Asia
Central/Eastern Europe
Latin America/Caribbean East Asia and the Pacific
East Asia Latin America
N. America/W. Europe
Developed countries
NER, Primary NER, Secondary
55
hypothesis then be brought to the national level in which case variations in secondary school
enrolment could be tagged to the economic strength of countries? Is the problem more to do
with lack of political commitment, deficient policies, inappropriate institutional and legal
frameworks, budgetary constraints, fast growing populations or challenges at the household,
school and community levels?
This thesis therefore attempts to understand the reasons why most of Ugandan
children do not enroll at the secondary level through, inter alia, a secondary analysis of
household level survey data. In order to respond to some of the questions posed previously,
the national context in form of policies in place, its economy and demography, the level of
political commitment, the extent of funding of education etc., shall be seen as a way to
provide a background to the issues to be studied.
Uganda was among the first countries in Sub-Saharan Africa to implement Universal
Primary Education (UPE) in 1997 in the spirit of Education for All goals and Universal Post
Primary Education and Training (UPPET) or Universal Secondary Education (USE) as it has
come to be popularly known in 2007, in order to absorb graduates of UPE implemented ten
years earlier.
According to article 30 of the Ugandan Constitution, “All persons have a right to
education” and as per article 34(2), “A child is entitled to basic education that shall be the
responsibility of the state and parents of the child” (Government of Uganda, 1995). Again in
terms of policy and legal framework, Uganda is signatory to the Committee on Elimination of
Discrimination against Women (CEDAW), that calls for equal rights to education in article
10. Other Ugandan Policy documents like: The 1992 Government White Paper on education,
Vision 2025, Education Sector Strategic Plan 2004-2015, Poverty Eradication Action Plan
2004/5 to 2007/8 and the National Development Plan 2010 recognize education as key in
fighting poverty.
Indeed as can be seen, the challenge of Uganda cannot be lack of policies, for not only
has it put in place polices and or ratified international covenants, it has also gone ahead to
enact policy and strategic frameworks to implement the agreed upon commitments. It should
be noted that being signatory to the covenants legally obliges member states to implement the
requirements of the agreements according to the principle of pacta sunt servanda, a known
principle in International Law.
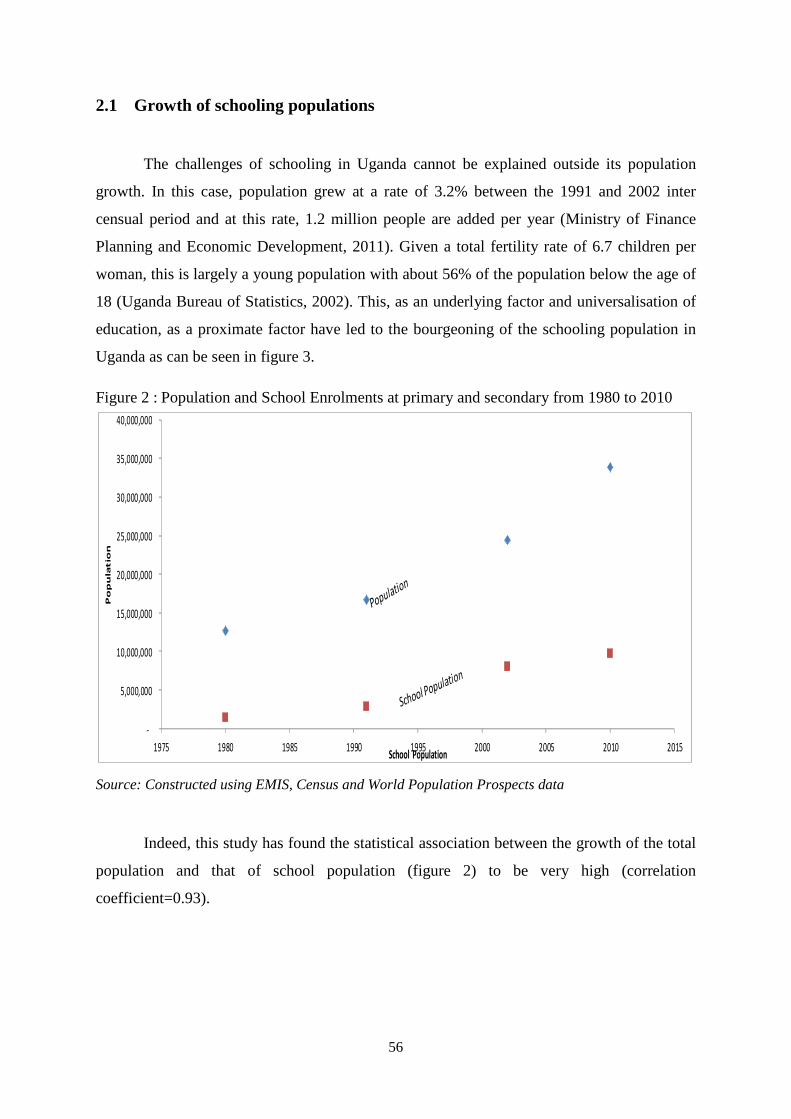
56
-
5,000,000
10,000,000
15,000,000
20,000,000
25,000,000
30,000,000
35,000,000
40,000,000
1975 1980 1985 1990 1995 2000 2005 2010 2015
Po
pu
latio
n
School Population
2.1 Growth of schooling populations
The challenges of schooling in Uganda cannot be explained outside its population
growth. In this case, population grew at a rate of 3.2% between the 1991 and 2002 inter
censual period and at this rate, 1.2 million people are added per year (Ministry of Finance
Planning and Economic Development, 2011). Given a total fertility rate of 6.7 children per
woman, this is largely a young population with about 56% of the population below the age of
18 (Uganda Bureau of Statistics, 2002). This, as an underlying factor and universalisation of
education, as a proximate factor have led to the bourgeoning of the schooling population in
Uganda as can be seen in figure 3.
Figure 2 : Population and School Enrolments at primary and secondary from 1980 to 2010
Source: Constructed using EMIS, Census and World Population Prospects data
Indeed, this study has found the statistical association between the growth of the total
population and that of school population (figure 2) to be very high (correlation
coefficient=0.93).
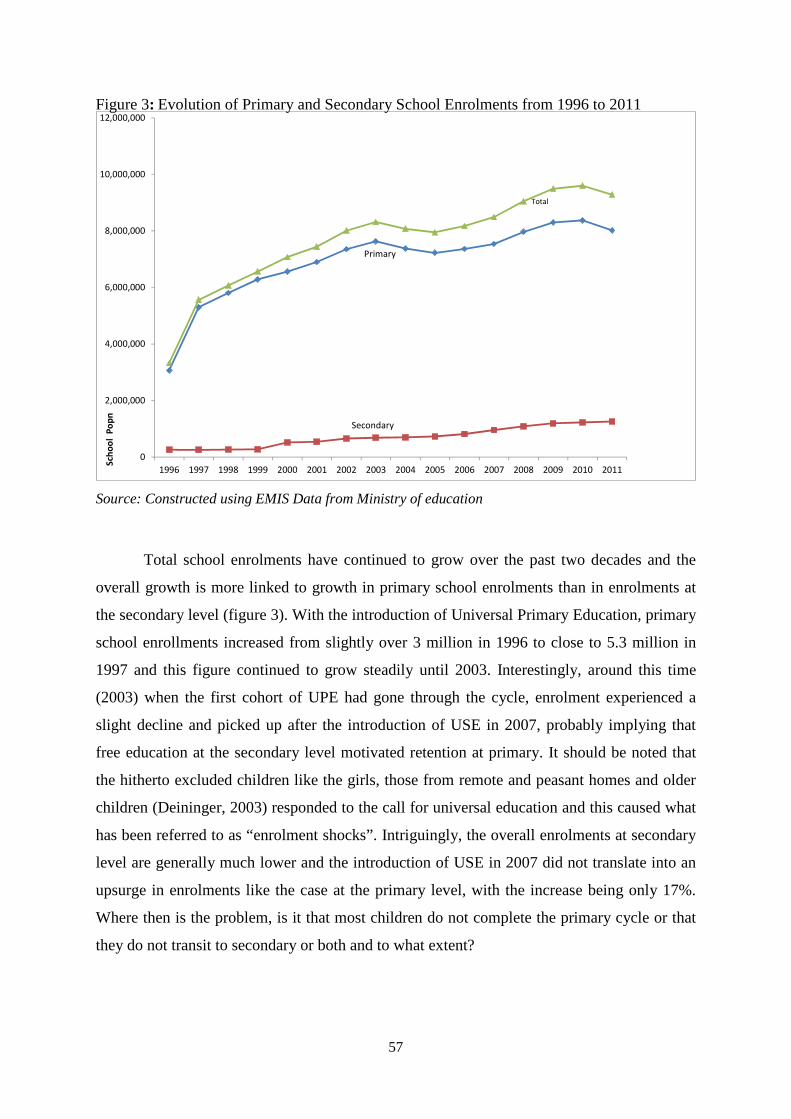
57
Primary
Secondary
Total
0
2,000,000
4,000,000
6,000,000
8,000,000
10,000,000
12,000,000
1996 1997 1998 1999 2000 2001 2002 2003 2004 2005 2006 2007 2008 2009 2010 2011
Sch
oo
l P
op
n
Figure 3: Evolution of Primary and Secondary School Enrolments from 1996 to 2011
Source: Constructed using EMIS Data from Ministry of education
Total school enrolments have continued to grow over the past two decades and the
overall growth is more linked to growth in primary school enrolments than in enrolments at
the secondary level (figure 3). With the introduction of Universal Primary Education, primary
school enrollments increased from slightly over 3 million in 1996 to close to 5.3 million in
1997 and this figure continued to grow steadily until 2003. Interestingly, around this time
(2003) when the first cohort of UPE had gone through the cycle, enrolment experienced a
slight decline and picked up after the introduction of USE in 2007, probably implying that
free education at the secondary level motivated retention at primary. It should be noted that
the hitherto excluded children like the girls, those from remote and peasant homes and older
children (Deininger, 2003) responded to the call for universal education and this caused what
has been referred to as “enrolment shocks”. Intriguingly, the overall enrolments at secondary
level are generally much lower and the introduction of USE in 2007 did not translate into an
upsurge in enrolments like the case at the primary level, with the increase being only 17%.
Where then is the problem, is it that most children do not complete the primary cycle or that
they do not transit to secondary or both and to what extent?
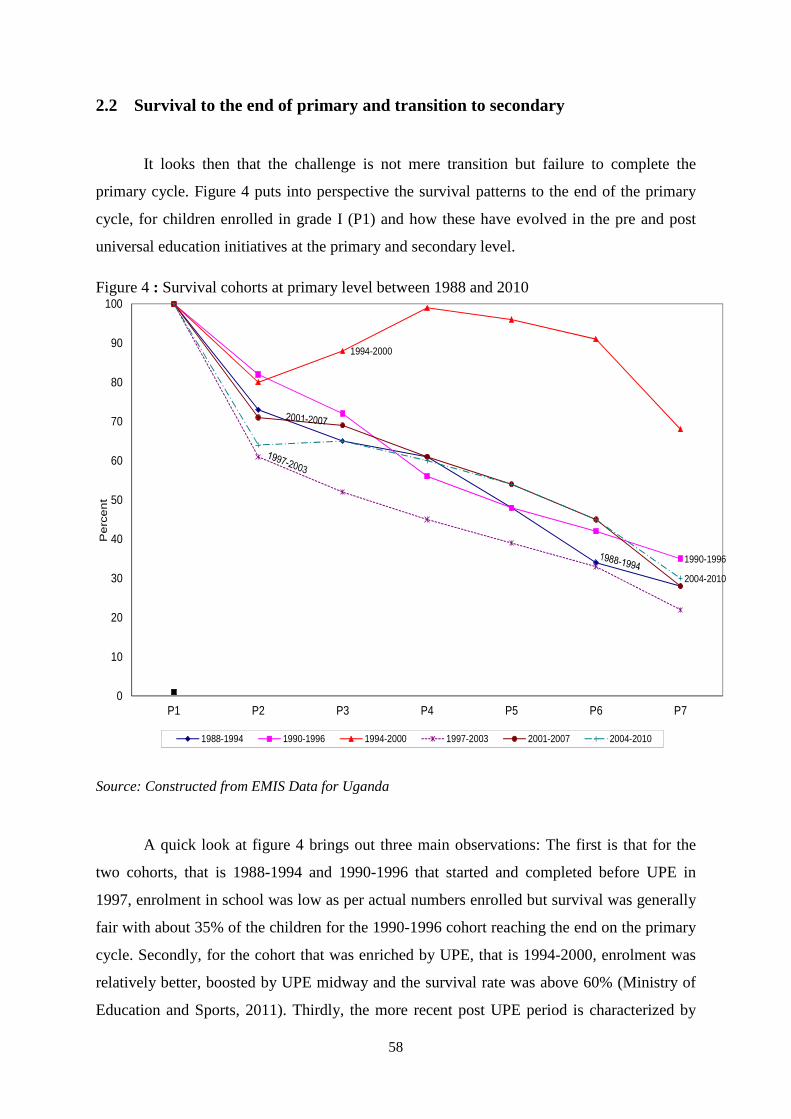
58
1990-1996
1994-2000
2004-2010
0
10
20
30
40
50
60
70
80
90
100
P1 P2 P3 P4 P5 P6 P7
Pe
rce
nt
1988-1994 1990-1996 1994-2000 1997-2003 2001-2007 2004-2010
2.2 Survival to the end of primary and transition to secondary
It looks then that the challenge is not mere transition but failure to complete the
primary cycle. Figure 4 puts into perspective the survival patterns to the end of the primary
cycle, for children enrolled in grade I (P1) and how these have evolved in the pre and post
universal education initiatives at the primary and secondary level.
Figure 4 : Survival cohorts at primary level between 1988 and 2010
Source: Constructed from EMIS Data for Uganda
A quick look at figure 4 brings out three main observations: The first is that for the
two cohorts, that is 1988-1994 and 1990-1996 that started and completed before UPE in
1997, enrolment in school was low as per actual numbers enrolled but survival was generally
fair with about 35% of the children for the 1990-1996 cohort reaching the end on the primary
cycle. Secondly, for the cohort that was enriched by UPE, that is 1994-2000, enrolment was
relatively better, boosted by UPE midway and the survival rate was above 60% (Ministry of
Education and Sports, 2011). Thirdly, the more recent post UPE period is characterized by
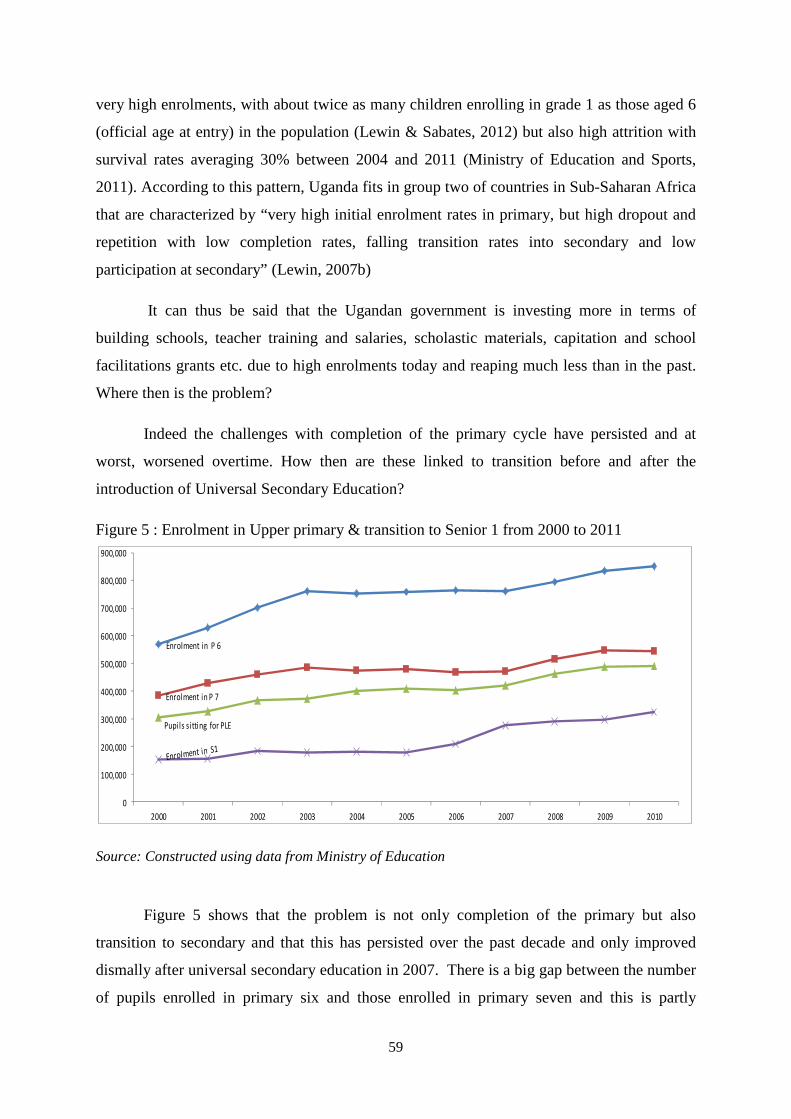
59
Enrolment in P 6
Enrolment in P 7
Pupils sitting for PLE
0
100,000
200,000
300,000
400,000
500,000
600,000
700,000
800,000
900,000
2000 2001 2002 2003 2004 2005 2006 2007 2008 2009 2010
very high enrolments, with about twice as many children enrolling in grade 1 as those aged 6
(official age at entry) in the population (Lewin & Sabates, 2012) but also high attrition with
survival rates averaging 30% between 2004 and 2011 (Ministry of Education and Sports,
2011). According to this pattern, Uganda fits in group two of countries in Sub-Saharan Africa
that are characterized by “very high initial enrolment rates in primary, but high dropout and
repetition with low completion rates, falling transition rates into secondary and low
participation at secondary” (Lewin, 2007b)
It can thus be said that the Ugandan government is investing more in terms of
building schools, teacher training and salaries, scholastic materials, capitation and school
facilitations grants etc. due to high enrolments today and reaping much less than in the past.
Where then is the problem?
Indeed the challenges with completion of the primary cycle have persisted and at
worst, worsened overtime. How then are these linked to transition before and after the
introduction of Universal Secondary Education?
Figure 5 : Enrolment in Upper primary & transition to Senior 1 from 2000 to 2011
Source: Constructed using data from Ministry of Education
Figure 5 shows that the problem is not only completion of the primary but also
transition to secondary and that this has persisted over the past decade and only improved
dismally after universal secondary education in 2007. There is a big gap between the number
of pupils enrolled in primary six and those enrolled in primary seven and this is partly

60
explained by queuing, to prepare better for Primary Seven Leaving Examinations (MoES,
2010). In addition, about 50% of children enrolled in primary six have continued to drop out
or repeat to prepare better and hence not sitting for PLE between 2000 and 2011. The
proportions that enroll in senior one have averaged about one quarter of those in primary six,
improving slightly, to over one- third, after 2007. Similarly, about one half of the pupils that
sat PLE would transit to secondary and this slightly improved to about two thirds after 2007.
Two general remarks can be made here: first, improvement in enrolment at secondary
level in 2007 seems to have motivated higher enrolment in primary six and seven ; secondly
but most importantly, the challenges to expanding secondary schooling are more to do with
combating high attrition at the primary level and less of encouraging transition between the
two levels. In other words, if the children aged 13-18/24 are not enrolled at secondary, it is
more because they did not enroll in school in the first place, but more so because they did not
complete primary (survival rate to end of primary is 30%) and less because they did not
transit to secondary (transition rate averaged about 65% after 2007).
Where then could the problem be? Could it be at the school level in terms of the
quality of education dispensed, at the government level in terms of financing of education, or
at the household level, if not at all the levels?
2.3 Quality of Education
With the introduction of UPE, an upsurge in enrolments led to shortages in
classrooms, teachers’ accommodation, furniture, instructional materials, teachers and other
challenges like the need to equip teachers with skills and techniques to handle multi-aged
pupils in a situation of scarcity of facilities (Tumushabe et al., 1999 ; Tiberondwa, 1999).
While the pupil-teacher and pupil-classroom ratios at primary have slightly improved
between 2000 and 2013 (MoES, 2013), they remain above the Internationally recommended
standards of 40:1 in all government schools but are within comfortable ranges in all private
schools. In government schools, the situation should be worse than portrayed because the
numerator (number of pupils) reduces greatly in the upper classes due to attrition, thus giving
an underestimate of Pupil Teacher Ratio or Pupil Classroom Ratio especially for the lower
61
classes. It should be noted that high PCR or PTR may negatively impact retention for most of
the children in the lower primary classes.
An upsurge in enrolments combined with a demotivated but overstretched teaching
staff (vindicated by incessant threats to strike and absenteeism) have led to a decline in the
quality of education as evidenced by poor numeracy and literacy levels in, especially
government schools. Indeed as observed by Oketch & Rolleston (2007), the results of the
National Assessment of Primary Education (NAPE) between 1996 and 2000 suggest that
performance deteriorated following the introduction of UPE. With regard to numeracy,
Kasirye summarizes the situation thus:
Based on test scores of National Assessment of Progress in Education in
1999, 46% of males and 36% of female grade six pupils obtained the
desired level of proficiency in numeracy. By 2006, the corresponding rate
had declined to 26% and 15%, respectively according to Uganda National
Examinations Board (Kasirye, 2009 p.6).
The decline in quality affected children in the northern (Saito, Ssenabulya & Lubega,
2011) and eastern (UWEZO-Uganda, 2010) regions more than those in the central region,
more of those in the rural than in urban areas and those from poorer households (Byamugisha
& Ssenabulya, 2005).
A more recent study on proficiency in English and numeracy affirms the continued
decline in quality thus: “Only three out of ten (29.7%) pupils of all classes (P3-P7) could both
read and understand an English story text of P2 level difficulty as well as solve numerical
written sums of P2 level difficulty correctly” (UWEZO-Uganda, 2011 p. 17). Intriguingly,
these statistics remained unchanged one year later as reported in a follow up survey
(UWEZO-Uganda, 2012).
Decline in quality has several implications for retention in school and exacerbating
inequalities in both progression and transiting to secondary schooling. With the majority of
children in especially public schools not being able to master basic skills after some years of
primary education, this predisposes them to dropping out as school becomes a “burden” to
them. This is compounded by the fact that parents, largely semi-literate and engaged in labor
intensive peasant agriculture, are discouraged by the fact that their children are “learning
nothing” and yet their labor is urgently needed to sustain their households of origin, that
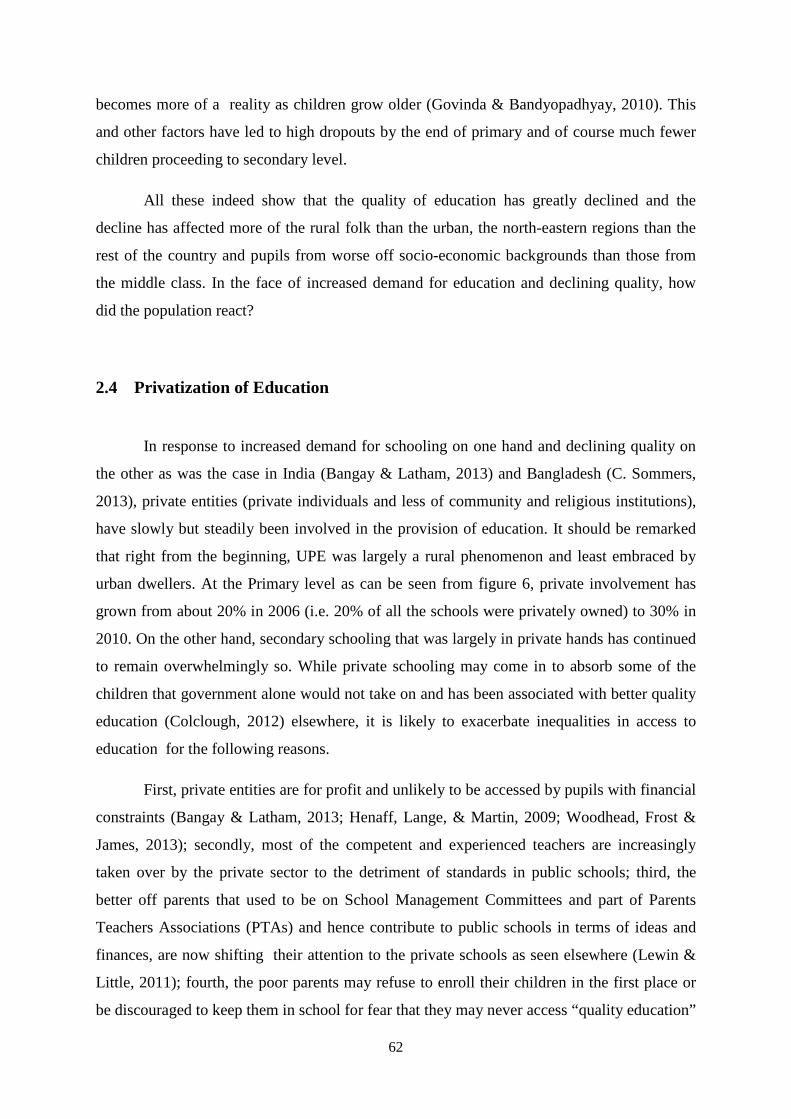
62
becomes more of a reality as children grow older (Govinda & Bandyopadhyay, 2010). This
and other factors have led to high dropouts by the end of primary and of course much fewer
children proceeding to secondary level.
All these indeed show that the quality of education has greatly declined and the
decline has affected more of the rural folk than the urban, the north-eastern regions than the
rest of the country and pupils from worse off socio-economic backgrounds than those from
the middle class. In the face of increased demand for education and declining quality, how
did the population react?
2.4 Privatization of Education
In response to increased demand for schooling on one hand and declining quality on
the other as was the case in India (Bangay & Latham, 2013) and Bangladesh (C. Sommers,
2013), private entities (private individuals and less of community and religious institutions),
have slowly but steadily been involved in the provision of education. It should be remarked
that right from the beginning, UPE was largely a rural phenomenon and least embraced by
urban dwellers. At the Primary level as can be seen from figure 6, private involvement has
grown from about 20% in 2006 (i.e. 20% of all the schools were privately owned) to 30% in
2010. On the other hand, secondary schooling that was largely in private hands has continued
to remain overwhelmingly so. While private schooling may come in to absorb some of the
children that government alone would not take on and has been associated with better quality
education (Colclough, 2012) elsewhere, it is likely to exacerbate inequalities in access to
education for the following reasons.
First, private entities are for profit and unlikely to be accessed by pupils with financial
constraints (Bangay & Latham, 2013; Henaff, Lange, & Martin, 2009; Woodhead, Frost &
James, 2013); secondly, most of the competent and experienced teachers are increasingly
taken over by the private sector to the detriment of standards in public schools; third, the
better off parents that used to be on School Management Committees and part of Parents
Teachers Associations (PTAs) and hence contribute to public schools in terms of ideas and
finances, are now shifting their attention to the private schools as seen elsewhere (Lewin &
Little, 2011); fourth, the poor parents may refuse to enroll their children in the first place or
be discouraged to keep them in school for fear that they may never access “quality education”

63
0
10
20
30
40
50
60
70
80
2006 2007 2008 2009 2010
Perc
ent
Primary Secondary
(Bennell, 2002) anyway; fifth, faced with high costs of private schooling and increasing
demands of modernizing economies, less and less affluent parents may be willing to assist in
educating children of their less privileged friends or relatives (Eloundou-Enyegue &
Davanzo, 2003) and finally; in a country where issues of social justice are merely on paper
and taxation regimes are largely retrogressive, the public-private school dichotomy may
engender, perpetuate and exacerbate social class cleavages.
Figure 6 : Proportion of Privately Owned Primary & Secondary schools from 2006 to 2010
Source: Constructed from Statistical Abstract Data for 2006-2010.
Recent Ministry of Education reports that have looked at quality issues in the light of
private schooling and USE have found out that, in universal primary (UNEB, 2010a) and
universal secondary (UNEB, 2010b) schools most children were less proficient in the
competences tested than in government and private non USE Schools.
Besides, there are by far more primary schools than secondary schools and some sub-
counties still lack secondary schools. In such a situation, parents may be obliged to send their
children to relatives that may be located closer to secondary schools or resort to placing them
in boarding schools. In both cases, it may have implications for access in which case in the
first option, the receiving households may engage the received child into household work or
not provide a favorable environment for learning and in the second case, boarding costs that
are normally high (Ohba, 2011) may be prohibitive thus excluding most households that may
be financially disadvantaged. It should be remembered that quality education is almost
synonymous with private schooling and an almost exclusive privilege of students in boarding
schools.
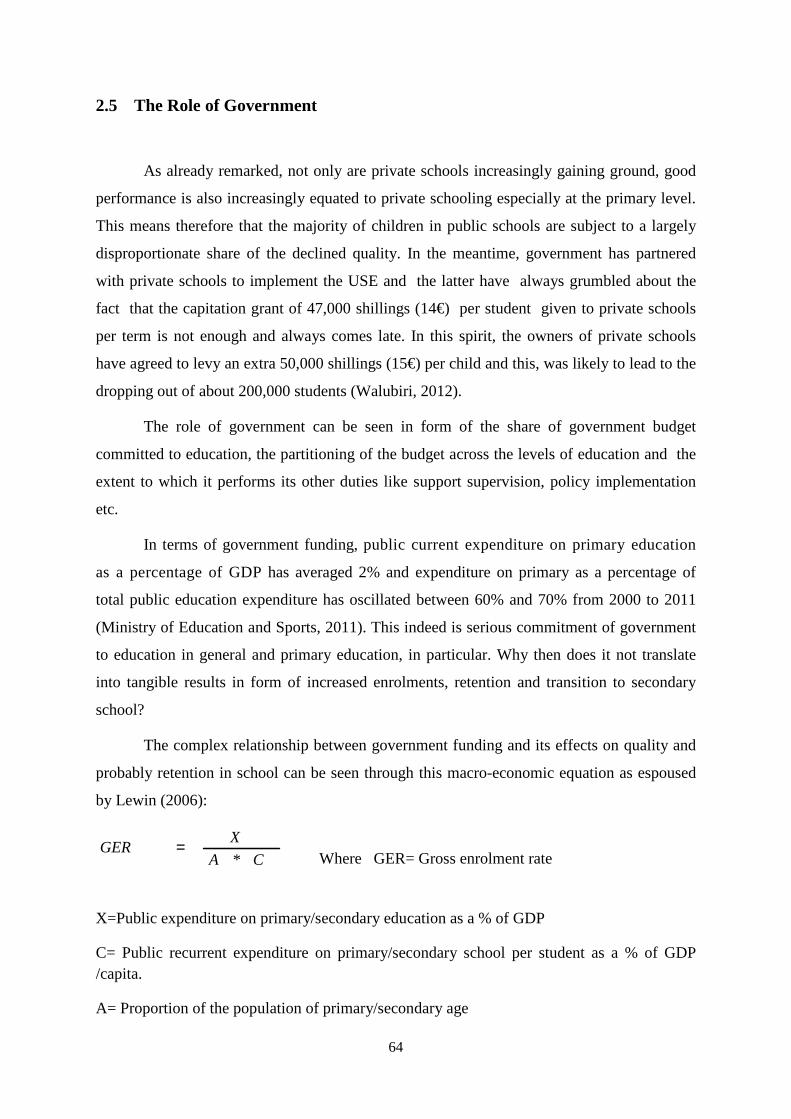
64
2.5 The Role of Government
As already remarked, not only are private schools increasingly gaining ground, good
performance is also increasingly equated to private schooling especially at the primary level.
This means therefore that the majority of children in public schools are subject to a largely
disproportionate share of the declined quality. In the meantime, government has partnered
with private schools to implement the USE and the latter have always grumbled about the
fact that the capitation grant of 47,000 shillings (14€) per student given to private schools
per term is not enough and always comes late. In this spirit, the owners of private schools
have agreed to levy an extra 50,000 shillings (15€) per child and this, was likely to lead to the
dropping out of about 200,000 students (Walubiri, 2012).
The role of government can be seen in form of the share of government budget
committed to education, the partitioning of the budget across the levels of education and the
extent to which it performs its other duties like support supervision, policy implementation
etc.
In terms of government funding, public current expenditure on primary education
as a percentage of GDP has averaged 2% and expenditure on primary as a percentage of
total public education expenditure has oscillated between 60% and 70% from 2000 to 2011
(Ministry of Education and Sports, 2011). This indeed is serious commitment of government
to education in general and primary education, in particular. Why then does it not translate
into tangible results in form of increased enrolments, retention and transition to secondary
school?
The complex relationship between government funding and its effects on quality and
probably retention in school can be seen through this macro-economic equation as espoused
by Lewin (2006):
CA
XGER
*=
Where GER= Gross enrolment rate
X=Public expenditure on primary/secondary education as a % of GDP
C= Public recurrent expenditure on primary/secondary school per student as a % of GDP /capita.
A= Proportion of the population of primary/secondary age

65
On the basis of this formula, Lewin comments about funding the Ugandan education system thus:
If the current education system is projected to a configuration where GER
at primary is 100%, Senior 1 to Senior 4 is 100% and Senior 5 to Senior 6 is
50%, then 13% of GDP would be needed, equivalent to the entire
government domestic revenue and with demography and cost structure, that
would be unattainable (Lewin, 2006 p. 19 ).
It should be noted that as of 2011, the proportion of the school age children was about
28 %, among the highest in Sub-Saharan Africa, GER at primary was 117% and 28% at
secondary and the proportion spent on schooling as a percent of GDP was less than 4%. It
implies therefore that the high population of the school age children, rooted in high
population growth rates has an impact on how much government will spend per pupil and the
total amount government will commit to schooling.
On the basis of the equation one can talk of an increase in the number of school age
cohorts that is closely related to a high dependency burden explained by many young people
on one hand (figure 11) and an increasing proportion of older people (Antoine & Golaz,
2010) on the other that pose great challenges at household and national level (Lam &
Marteleto, 2008). At the household, there is less productivity as most children are in school
and not “contributing meaningfully”, hence less incomes. On the part of government, it has a
reduced tax base from the perspective of quantity and quality. With regard to quantity, the
labor force is numerically smaller while in terms of quality, the Ugandan labor force is
largely semi-literate and generally engaged in non-taxable and poorly remunerating ventures
and a combination of these plus the existence of a weak tax administration system explain
why Uganda collects only 13.7% of its GDP in taxes (Ssewanyana et al., 2011).
As a result government can only get less revenue in form of income and indirect taxes
and consequently, its ability to invest in this largely young and demanding population is
greatly compromised. In other words reducing quality may be explained by bourgeoning
schooling populations that imply, less funding per student and generally, in terms of, inter
alia, scholastic materials, buildings, furniture, teacher training and adequate teacher
remuneration. This assertion is unambiguously reechoed by Uitto when he states that “the
provision of social services like education becomes an insupportable burden for governments
of the poor countries under conditions of high population increase” (Uitto, 1989 p. 10), in

66
reference to Kenya then. It should be understood against the backdrop of less and less aid
from the developed world (Bennell, 2002) and corruption and embezzlement of funds in most
countries in Sub-Saharan Africa. The inability of government to adequately fund education;
leads to structural challenges that still pose a threat to universalizing education and
addressing issues of social justice as seen in the next section.
2.6 Other structural challenges to accessing secondary schooling
Uganda was the first country in Sub-Saharan Africa to introduce Universal secondary
education in 2007 and this was a good gesture as it encouraged retention of some children
who would otherwise have failed to make a transition. However, at the secondary level, there
are several structural challenges that may affect access to secondary schooling as elucidated:
• Pupils have to pass the Primary Leaving Examination to go to secondary and yet
better performance at this level has been an almost exclusive privilege of children that
have largely attended private and or boarding primary schools in the urban areas.
• About 70% of all the schools at this level are privately owned.
• Government schools, especially the old prestigious schools are boarding schools and
given that all costs especially, the costs of boarding are borne by parents, these
schools are often almost as expensive as private schools.
• Selection to join these old prestigious schools is so discriminative that it is children of
the middle class that have largely attended urban private and or expensive boarding
primary schools and performed well that join these schools.
• Finally, there are still some sub-counties (smaller local government units in a district)
without a secondary school.
In the face of universalized education but of declining quality, which households
educate their children at the secondary level, which children, and in which schools (day or
boarding)? Is their reaction to declining quality tagged to socio-economic status of
households, does it vary by region and do some households enroll some children in secondary
and leave out others? Has universalized secondary education since 2007 reduced inequalities
in accessing secondary schooling? Was universalizing education more beneficial through

67
encouraging retention at primary or improving transition? These, and several others, as to be
seen shortly, are some of the questions that triggered interest into this kind of study.
The contribution of this study to the body of knowledge is that, in the first place it is,
to the best of my knowledge, the first study to investigate into equity issues in accessing
secondary schooling in Uganda, before and after USE. In addition while other studies have
either investigated factors explaining transition and or general access to secondary, this study
investigates general access and transition concurrently. An attempt is made to justify to what
extent attrition at primary and or inability to make a transition are responsible for low rates of
secondary schooling. Besides, factors that are more associated with any of the two exclusion
categories as well as the pathways through which they operate to impact access are studied.
Finally this study is among the pioneer studies into the phenomenon of boarding schools and
its implications for access and equity.
2.7 Conceptual Framework
This study adopts the CREATE conceptual framework on access, equity and
transitions. It illustrates how enrolments decline through the primary grades especially in low
enrolment countries and how those attending irregularly and achieving (performing) poorly
fall into the “at risk” zones. It is a cross-sectional model that locates children who are losing
or have lost access to conventional education systems (Lewin, 2007c)

68
Figure 7 : Access and Zones of exclusion from primary and secondary schooling
This framework maps 6 zones that are called “zones of exclusion” and provides
insights into the probability that irregular attendance, repetitions and low achievement (poor
performance) at a given level do not only impact retention at that level but negatively affect
progression to the next level.
Zone 1 comprises children who never attend school. It includes those who could
attend existing schools but do not, and those who are excluded by livelihoods, location, civil
status, disability, social stigma or other vulnerabilities. Zone 2 includes the majority of
children who are excluded after initial entry, who drop out of school and fail to complete a
full cycle. Zone 3 includes those in school but at risk of dropping out, most obviously as a
result of; being overage for grade, low achievement and poor attendance. These children can
be described as “silently excluded” since they are enrolled but may learn little, attend
irregularly, and/ or are overage. Zone 4 contains those who fail to transit to secondary
education as a result of failing to be selected, being unable to afford costs, or located far from
a secondary school, or otherwise excluded. Zone 5 includes those dropping out of secondary
grades. Zone 6 contains those at risk of dropping out from secondary school for reasons
given under Zone 3. Zone 0 captures those excluded from pre-school.
This framework seems to be relevant to this study as it approaches access to
secondary schooling not as a one-time event affected by factors at that time but as a result of

69
several other factors at the lower levels that may be related to, inter alia, age at initial access
for those who manage to enroll, regularity of attendance, meaningful learning, retention etc.
This framework does resonate with the literature reviewed in most of Sub-Saharan Africa and
greatly guided the methodology used in this study.
With regard to the selection of variables, this study was guided by the framework in
the work coordinated by UNESCO Institute of Statistics (UIS et al., 2004) entitled Guide to
Analysis and Use of Household Survey and Census Education Data. It hypotheses
characteristics of the child, household head, other household members, the household itself
and community factors as correlates of schooling in general. I have adopted this to my study
in line with the availability of the variables in the datasets to be used. The dependent variable
was enrolment of a child at secondary. This framework presents the following categories of
factors as correlates of access to education in general and by implication secondary
schooling, in particular.
Characteristics of Children
These include: age, sex, orphanhood status, child work, relationship to household head,
migration status and disability status.
Characteristics of Household head
These are age, sex, education level, type of employment, marital status and religion.
Characteristics of other Household Members
Here, the Guide mainly presents characteristics of the spouse i.e. - level of education and type
of employment of spouse to household head.
Characteristics of Household
These include: household income or wealth status, land ownership status, expenditure on
schooling, frequency of meals, household size, household structure, age and household sex
composition.

70
Characteristics of the community
These include region of residence, rural-urban residence, distance to school, school
ownership status (public or private) and type of school (boarding or day).
While the categories of the characteristics used in this study are similar to those
presented in the conceptual framework by UNESCO, in the present study the variables used
under each category were presented on the basis of their availability in the datasets used. In
general, community factors operate through household factors that in turn operate through
child factors to influence access to secondary schooling in Uganda. The framework by
UNESCO is a comprehensive tool to study determinants of accessing education while using
secondary data sources although it is not explicit on possible interactions between
independent variables themselves.
Decisions to send and keep children in school may affect different children differently
i.e. some household may decide to educate more of boys than girls, more of their own
children than relatives, more of talented children than average ones, etc. These inequalities at
the individual level may also exist between households i.e. richer households are more likely
to keep their children in school than poorer ones, households headed by females may be more
likely to educate their children than male headed ones, households with educated parents may
be more likely to educate their children than those with less educated parents, etc. At a higher
level differences may exist between regions, rural-urban residences etc. In conclusion, while
inequalities in accessing secondary schooling may vary by child, household and in turn
region, the net effect of all these factors brought together would give a bigger picture on the
subject understudy.
71
2.8 Objectives and hypotheses of the Study
This study was guided by a general objective that translates into specific objectives thus:-
General Objective
The general objective of this study was to map the evolution of inequalities in
accessing secondary schooling before and after the introduction of Universal Secondary
Education in 2007.
Specific Objectives
i. To establish how individual, household and community factors impact the probability
of ever accessing secondary schooling and their evolution between 2006 and 2010.
ii. To examine the effect of individual, household and community factors on the
probability of making a transition from primary to secondary and how they evolved
between 2006 and 2010.
iii. To investigate the role of individual, household and community factors on the
probability of accessing a boarding facility and their evolution between 2006 and
2010.
iv. To establish whether inequalities related to ever accessing secondary schooling for all
children of the relevant age group were similar to those related to making a transition.
v. To map pathways through which inequalities operate to impact general access and or
transition.
vi. To document the evolution of inequalities in accessing secondary schooling by sex.
To focus the analysis better, these objectives were further developed into hypotheses, which
are tentative postulations based on available literature, that may be accepted or rejected
following the analysis.

72
Hypotheses
i. Inequalities in accessing secondary schooling based on individual, household and
community factors are more likely to have disappeared following Universal secondary
education.
ii. Most children are more likely to have made a transition to secondary in 2010 than
before irrespective of their differences by individual, household and community level
characteristics.
iii. Most children are more likely to access all types of schools including boarding
schools irrespective of their differences at individual, household and community
levels.
iv. Inequalities related to ever accessing secondary schooling for all children of the
relevant age group are more likely to be similar to those related to making a transition.
v. Inequalities related to accessing secondary schooling for children of the relevant age
group and those related to making a transition are more likely to operate through
similar pathways.
vi. Evolution of inequalities between 2006 and 2010 is more likely to be different for
boys as compared to girls.
2.9 Data and Methodology
The study used three sources of data i.e. the Uganda National Household survey data,
Education Management Information Systems (EMIS) data and qualitative data collected
largely from Northern Uganda. The three data sources are briefly described in the sections
that follow.
2.9.1 Uganda National Household Survey data
This study largely used data from the nationally representative Uganda National
Household Surveys (UNHS) carried out by Uganda Bureau of Statistics in 2005/6 and
73
2009/10. The UNHS is a multi-purpose survey modelled along the lines of the World Bank’s
Living Standards Measurement Surveys (LSMS). It is normally conducted every three years
to track changes in household welfare status.
The 2005/6 Uganda National Household Survey data had been collected from 43,624
individuals found in 7,400 households, spread over the Central, Eastern, Western and
Northern regions of Uganda. The 2009/10 Uganda National Household Survey collected data
from 36,432 individuals found in 6,800 households, again spread over all the regions as
mentioned already.
While the main objective of the surveys was to gather data on socio-economic profiles
of households for better planning, the data collected was found to be useful to this study. The
Surveys collected data on “current and previous education status” of all household members
especially those aged 5 years and above. In this case the ages considered were 6 (for all
possible models run) as this is the official age for entry into school and 24 as the latter is the
age when children are expected to have completed tertiary education. Current education
status and educational attainment were combined to come up with a dependent variable that
comprised three categories, i.e. (i) children aged 6 to 24 that never enrolled in school (ii)
children in the same age slab that had dropped out of school and (iii) those that were enrolled
in school as at survey time.
Because the interest of this study was to look at children’s access to secondary
schooling, data was filtered to comprise all children aged 13 (the minimum age for entry into
secondary) to 24(the maximum age by which official schooling has been completed), in
which case they fall under these categories: (i) never enrolled, (ii) ever enrolled but dropped
out at primary, (iii) ever enrolled but dropped out at secondary, (iv) completed the desired
level of education, (v) “currently” enrolled but still at primary and (vi) “currently” enrolled at
secondary level and above. The dependent variable therefore ought to have been, “current”
enrolment status at secondary level for children aged 13-18. Due to the small number of
observations for children “currently” enrolled at secondary, the dependent variable (at least
for the general model) was made to comprise all the children aged 13 to 24 that ever and or
were “currently” enrolled at secondary level and above as opposed to all the other children
aged 13-24 in the dataset. These same surveys provided data on child, household and
community level factors (variables), which this study, like prior studies, hypothesises, will

74
make possible the mapping of inequalities in accessing secondary schooling. These are
presented in the section that follows.
2.9.2 Independent Variables as used in Modelling
The analysis (at all levels) used the following variables that were arrived at after a
careful review of literature about factors associated with access to education, in general and
secondary schooling, in this particular case. These are categorized under individual,
household head, other household members and household as well as community level factors.
They are explained hereunder in that order.
Individual/Child level factors
These are age of child, sex and relationship to the household head.
Age
For the purpose of this study a household member aged 13-24 was defined as a child
as they were still expected to be in school and or under the care of their parents/caretakers. In
Uganda where education is largely not free, most of the individuals that are still in school are
indeed dependent on their parents or other caretakers. For this reason, the word child and
individual or even individual household member may be used interchangeably. Age that was
captured as a continuous variable at survey time was defined as the age of the respondent as
at the last birthday (Uganda Bureau of Statistics, 2009).
The question on education status of individuals was asked from individuals aged 5
years and above but this study delimited the age to 6 to 24 years (for all the models), with the
former being the official age of enrolment in school and the latter being the age at which
individuals are expected to complete tertiary education.
For the preliminary analysis, age was categorized as 13-18 and 19-24, representing
the official age slabs for secondary and tertiary schooling in Uganda, respectively. At the
75
model level, it was entered as a continuous variable as this was found to be a better option
after trying out various modeling procedures.
Sex
Sex was captured and run as Male or Female.
Relationship to household head
The relationship of household members to the head of the household has been found
to have implications for schooling outcomes of the members, among other things. At survey
time, this variable had categories such as: Head, Spouse, Son/daughter, Grandchild, Step
child, Parent of head or spouse, Sister/brother of head or spouse, Nephew/niece, other
relative, Servant, Non relative and others.
On the basis of the literature reviewed, the number of observations required for
further analysis and the distribution of observations across the categories, this study
reconfigured this variable to comprise: Own child, Other Relative then Non-relative.
Household heads’ characteristics
Here the household head was taken to be the main person who manages the income
earned and expenses incurred by the household. He/she was expected to be most
knowledgeable about other household members and most recognized by others as the head of
the household (Uganda Bureau of Statistics, 2009).
76
Education of household head
The education of members, including the head was captured on the basis of highest
level of education completed (Uganda Bureau of Statistics, 2009). While this was captured by
class completed for each individual, here it was reconfigured to appear as: None, Primary,
and Secondary and above. It was derived using the variables; education of household
member, relationship to household head and the unique identifier in the dataset.
Marital Status of household head
Marital status was captured as such on the date of the interview. In addition, being
married implied marital union through all types of marriages like civil, traditional and church
marriages as long as the marriages had legal, religious and or cultural obligations. People
cohabiting were also taken to be married as long as they considered themselves so (Uganda
Bureau of Statistics, 2009). This variable had the following categories: Married
monogamously, Married polygamous, Divorced/separated, Widow/widower and Never
married . The variable was also arrived at using the variables; marital status of household
member, relationship to household head and the unique identifier.
Sex of household head
This, depending on whether the person mainly controlled income and expenditure of
the household and was largely recognized as the head was captured as Male or Female. It
was also derived from sex of household member relationship to household head and the
unique identifier.
Age of household head
Age, as already pointed out, was captured as the age at the last birth day. In this study,
age of household head was categorized as: Less than 30 years, 31-59 years and 60 years

77
and above to take into consideration the implications of both young and older persons’
headship for schooling outcomes.
Other Household members’ characteristics
These include household size, number of children aged below five, number of adults
aged above 60, and presence or absence of father or mother in a household.
Household size
While the definition of household size is clear, it may be more cumbersome to define
a household and this may vary from survey to survey. In the National household surveys, a
household was defined as “a group of people who have been living and eating their meals
together for at least 6 of the 12 months preceding the interview” (Uganda Bureau of
Statistics, 2009). In addition, the following persons were considered as household members
even though they had lived for less than 6 months in the 12 months preceding the survey: (i)
infants who were less than 6 months old (ii) the newly married who had been living together
for less than 6 months (iii) students and seasonal workers who had not been living in or were
part of another household (iv) other persons living in the household for less than 6 months but
were expected to live there permanently (v) servants, farm workers and other individuals who
were living and taking meals in the household. Household size had been presented as a
continuous variable but in this study it was categorized as; “1-4”, “5-9” and “10 and above”.
Number of Children aged below five.
This variable was generated using the variable “age of household members” and the
unique identifier in the data set. It was categorized as: “0-1”, “ 2”, and then, “3 and above”
and entered as such for analysis at the various levels of analysis done.

78
Number of Adults (aged 60 and above).
Like the variable in the previous section, this variable was generated using the
variable “age of household members” and the unique identifier in the data set. It was
categorized and used as; “None”, “ 1” then “2 and above”.
If natural father/mother is living in household
These questions (variables) were asked from all household members in 2005/6 but in
2009/10, they were asked from only household members below the age of 18. This study
reconfigured the variable in 2005/6 so that the same population is targeted as this would also
help measure the effect of orphanhood on schooling outcomes. The resultant variables have
the following categories: “Yes”, “ No but Alive”, “ No but Dead”.
Household characteristics
Among these are household wealth status/welfare and the main income source for the
household.
Household wealth status
The survey team had captured a variable on household expenditure that was used as a
proxy for household income. In the dataset got from the Uganda bureau of Statistics, a
variable on household wealth status/income had been created with the categories: Poor and
Non-poor to represent households below the poverty line and those above, respectively.
Because Income or Wealth (as defined by expenditure) is normally highly positively
skewed, this study took the households in the first 50th percentile (those whose expenditure
was between the minimum and the median) as Poor, those in the next 25th percentile

79
(between the median and 75th percentile of expenditure) as Middle and the ones in the last
25th percentile (between the 75th percentile and the maximum) as Rich. Even within the
presumably homogenous categories of Poor versus Non-poor, there is some heterogeneity
whose implications for schooling outcomes may vary greatly.
Main occupation of household
This was captured as the household’s most important source of earnings during the 12
months preceding the survey. It had the following categories: Subsistence farming,
Commercial farming, Wage employment, Non–agricultural enterprises, Property income,
Transfers (pension allowances, social security benefits, etc.), Remittances, and
Organizational support (food aid WFP, NGOs etc). While in 2005/6 “remittances” was
included in transfers, in 2009/10 it was taken as an independent category. In this study,
property income, transfers and remittances were collapsed into one category in both cases for
easier comparability and analysis. The surveys defined remittances as income originating
from both within and out of the country. The resultant variable used in the analysis therefore
had the following categories: Subsistence farming, Commercial farming, Wage
employment, Non–agricultural enterprises, “Property income, remittances and
transfers” and finally, Organizational support.
Community level characteristics
These comprise place and region of residence and have been found to influence both
the supply and demand for education.
Place of residence
Place of residence may dictate; the distribution of schools, school teachers and other
facilities like electricity, water, the internet, telephone services as well as the “quality” of

80
parents and school administrators all of which may have implications for the supply and
demand for school. This variable was captured as Urban and Rural .
Region of residence
Like Place of residence, region of residence has implications for demand and supply
of education. It was captured and used as Central, Eastern, Northern and Western. While
the Northern and Central regions comprised 13 districts each, the Eastern and Western
regions had 15 districts each as per Annex 6 of the 2009/10 UNHS Manual of Instructions
(Uganda Bureau of Statistics, 2009).
In addition to using the Uganda National Household Survey data, this study used
EMIS data from the Ministry of Education and Sports. The ministry routinely collects data
on, inter alia, enrolment by age, sex, class, level of education, region, type of school attended
etc. This data was important to measure the level of demand and supply of education at
regional level, track enrolments over time, estimate the level of provision of education by
government, ascertain the prevalence of the phenomenon of boarding schools and above all,
compare some statistics provided by EMIS data with those in the datasets used.
2.9.3 Qualitative Data from the field
In addition, it was possible to collect data largely from Northern (but also from
Central to some extent) Uganda, a region that is the poorest and most educationally excluded
to understand some of the issues that could not be fully answered by quantitative data. The
issues investigated in the field, methods of data collection and sources are summarized in
table 1.
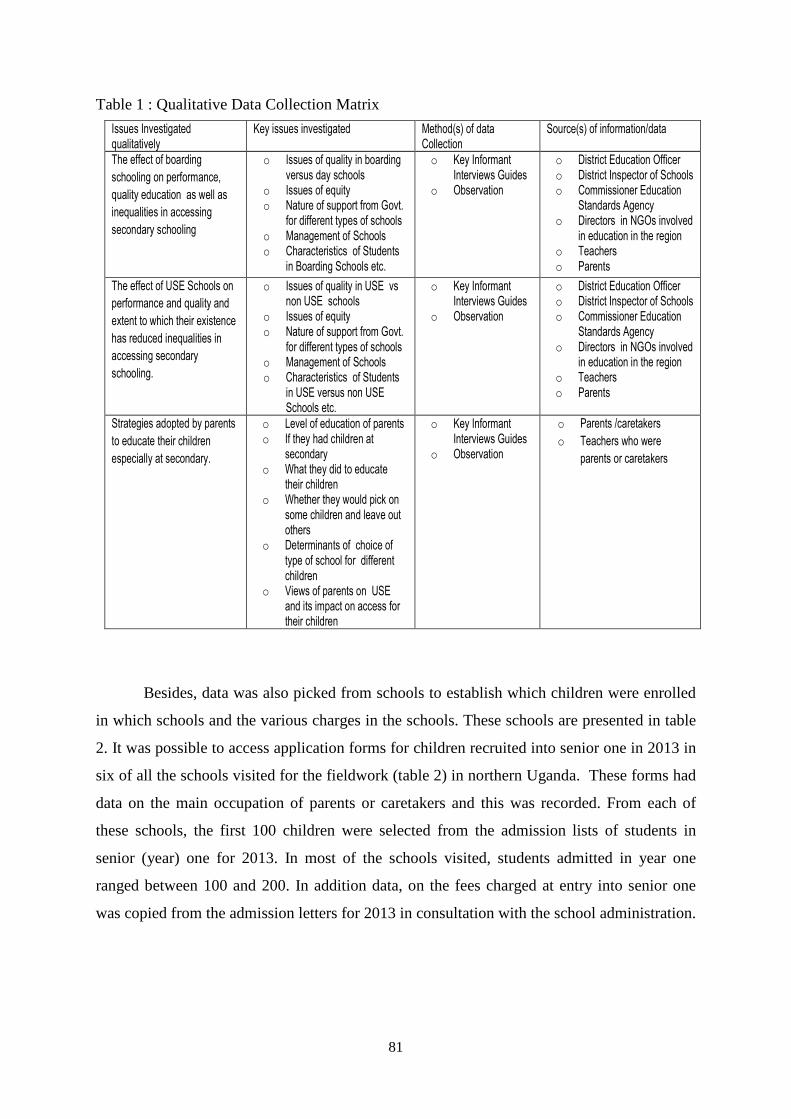
81
Issues Investigated qualitatively
Key issues investigated Method(s) of data Collection
Source(s) of information/data
The effect of boarding
schooling on performance,
quality education as well as
inequalities in accessing
secondary schooling
o Issues of quality in boarding versus day schools
o Issues of equity o Nature of support from Govt.
for different types of schools o Management of Schools o Characteristics of Students
in Boarding Schools etc.
o Key Informant Interviews Guides
o Observation
o District Education Officer o District Inspector of Schools o Commissioner Education
Standards Agency o Directors in NGOs involved
in education in the region o Teachers o Parents
The effect of USE Schools on
performance and quality and
extent to which their existence
has reduced inequalities in
accessing secondary
schooling.
o Issues of quality in USE vs non USE schools
o Issues of equity o Nature of support from Govt.
for different types of schools o Management of Schools o Characteristics of Students
in USE versus non USE Schools etc.
o Key Informant Interviews Guides
o Observation
o District Education Officer o District Inspector of Schools o Commissioner Education
Standards Agency o Directors in NGOs involved
in education in the region o Teachers o Parents
Strategies adopted by parents
to educate their children
especially at secondary.
o Level of education of parents o If they had children at
secondary o What they did to educate
their children o Whether they would pick on
some children and leave out others
o Determinants of choice of type of school for different children
o Views of parents on USE and its impact on access for their children
o Key Informant Interviews Guides
o Observation
o Parents /caretakers
o Teachers who were
parents or caretakers
Table 1 : Qualitative Data Collection Matrix
Besides, data was also picked from schools to establish which children were enrolled
in which schools and the various charges in the schools. These schools are presented in table
2. It was possible to access application forms for children recruited into senior one in 2013 in
six of all the schools visited for the fieldwork (table 2) in northern Uganda. These forms had
data on the main occupation of parents or caretakers and this was recorded. From each of
these schools, the first 100 children were selected from the admission lists of students in
senior (year) one for 2013. In most of the schools visited, students admitted in year one
ranged between 100 and 200. In addition data, on the fees charged at entry into senior one
was copied from the admission letters for 2013 in consultation with the school administration.
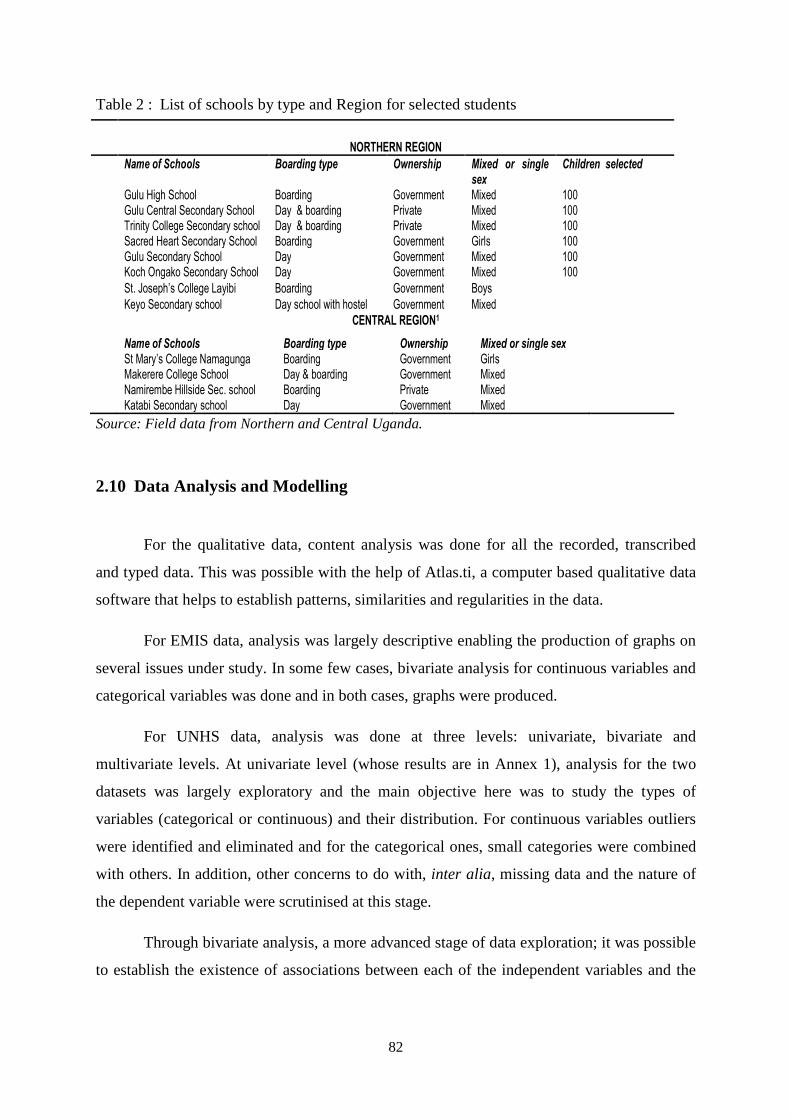
82
NORTHERN REGION
Name of Schools Boarding type Ownership Mixed or single sex
Children selected
Gulu High School Boarding Government Mixed 100 Gulu Central Secondary School Day & boarding Private Mixed 100 Trinity College Secondary school Day & boarding Private Mixed 100 Sacred Heart Secondary School Boarding Government Girls 100 Gulu Secondary School Day Government Mixed 100 Koch Ongako Secondary School Day Government Mixed 100
St. Joseph’s College Layibi Boarding Government Boys
Keyo Secondary school Day school with hostel Government Mixed
CENTRAL REGION1
Name of Schools Boarding type Ownership Mixed or single sex St Mary’s College Namagunga Boarding Government Girls Makerere College School Day & boarding Government Mixed Namirembe Hillside Sec. school Boarding Private Mixed Katabi Secondary school Day Government Mixed
Table 2 : List of schools by type and Region for selected students
Source: Field data from Northern and Central Uganda.
2.10 Data Analysis and Modelling
For the qualitative data, content analysis was done for all the recorded, transcribed
and typed data. This was possible with the help of Atlas.ti, a computer based qualitative data
software that helps to establish patterns, similarities and regularities in the data.
For EMIS data, analysis was largely descriptive enabling the production of graphs on
several issues under study. In some few cases, bivariate analysis for continuous variables and
categorical variables was done and in both cases, graphs were produced.
For UNHS data, analysis was done at three levels: univariate, bivariate and
multivariate levels. At univariate level (whose results are in Annex 1), analysis for the two
datasets was largely exploratory and the main objective here was to study the types of
variables (categorical or continuous) and their distribution. For continuous variables outliers
were identified and eliminated and for the categorical ones, small categories were combined
with others. In addition, other concerns to do with, inter alia, missing data and the nature of
the dependent variable were scrutinised at this stage.
Through bivariate analysis, a more advanced stage of data exploration; it was possible
to establish the existence of associations between each of the independent variables and the

83
dependent variable. Cross tabulations between each of the independent variables (having
made all categorical) and the dependent variable were performed.
A cross tabulation is a contingency table that distributes observations of two
categorical variables by rows and columns and by the use of a Chi-Square test it was possible
to establish if there existed a statistically significant relationship between each of the
independent variables and the dependent variable.
While with bivariate analysis we can only establish associations, this is not adequate
because (i) in the first place two variables may be associated but at this level we are not sure
what affects the other and secondly, (ii) some variables may show association because of the
absence of other factors e.g. older children may seem to be more educated because they are
older, anyway.
To avoid the challenges mentioned, multivariate analysis was done and here, all the
variables were entered into the same model to determine their aggregate net effect on the
dependent variable. Three models were run. Because the biggest challenge with regard to
accessing secondary school is related to dropouts at primary, (i) the first model looked at the
probability that a child aged 13-24 was enrolled or ever enrolled at secondary and above as
opposed to never being enrolled, previously dropping out of school or still being enrolled at
primary. The second model looked at (ii) the probability that a child aged 13-24 who
completed primary ever made a transition to secondary as opposed to failing to make the
transition, the third model (iii) mapped the probability that a child enrolled at secondary as at
survey time was enrolled in a boarding facility as opposed to being in a day facility. These
models were run for 2006 and 2010 to estimate whether the introduction of USE in 2007 had
had an effect on inequalities in accessing secondary schooling in general, making a transition
or accessing a boarding facility.
I used the multiple logistic regression model3 because the dependent variable was
binary (Bressoux, 2010) in all the scenarios as seen already. At this level, the contribution of
3 The logistic regression model or logit model generally takes the form
ikk
i
i exbxbxbxbbp
p +++++=−
.....)1
log(3322110
taking the general model, pi is the
probability that a child is or was ever enrolled at secondary and above as opposed to never being enrolled (1- pi) given a set of explanatory variables, the xi s
. The contribution of the variables is explained by bi s; the strength of the coefficients. ei is the error term. For this study we used odds ratios, which are exponentials of coefficients to be able to explain better.

84
each predictor (i) to accessing secondary, (ii) making a transition and (iii) enrolling in a
boarding facility was investigated, while controlling for all the others.
Through data triangulation, findings from UNHS data, EMIS data, field data and
documentary literature on the subject in Uganda were all appropriately used in order to
validate any one source but also enrich the arguments in this thesis.
2.10.1 Other methodological considerations
Other methodological considerations that were taken care of in this study are:
(i) Familiarisation with the variables: before the main analysis was carried out,
great care was taken to understand the variables better through exploratory univariate
analysis. Some of the statistics produced were compared with the ones in the UNHS Report
to be sure that all data was well merged and the values from the analysis did not depart from
those in the reports.
(ii) Ensuring that education status of children included the entire target group:
for these surveys, data on household members was captured on the basis of, inter alia,
“regular membership”, i.e. the people that normally stay in the household but could have
been away for even more than six months as at survey time for many reasons including, being
in boarding schools. Similarly on the question of “currently attending school”, the survey
included children that were out of school for holiday purposes or due to school closure and
those that were temporarily absent due to illness or other unavoidable circumstances (UBOS,
2009).
(iii) Multicolinearity : some independent variables may be highly correlated amongst
themselves and this may weaken the goodness of fit of the model. An exploration of
correlations between some variables was done to ensure that independent variables were not
highly correlated (i.e. where cor =.90+).
(iv) Weighting: the UNHS surveys used a two stage sampling survey design. In
survey sampling, clusters are randomly selected like individual elements are in simple
random sampling. Because the clusters are not of the same size or do not represent the
sampled phenomenon in equal proportions, this introduces some errors. In fact, selecting

85
some clusters and leaving out others, some households and not others or even some
individuals and not others increases the errors in the due process and part of the solution is to
weight the survey data using the weighting variable provided in datasets. Another probable
source of sampling errors is non-response. Weighting was done in the analyses carried out in
this study.
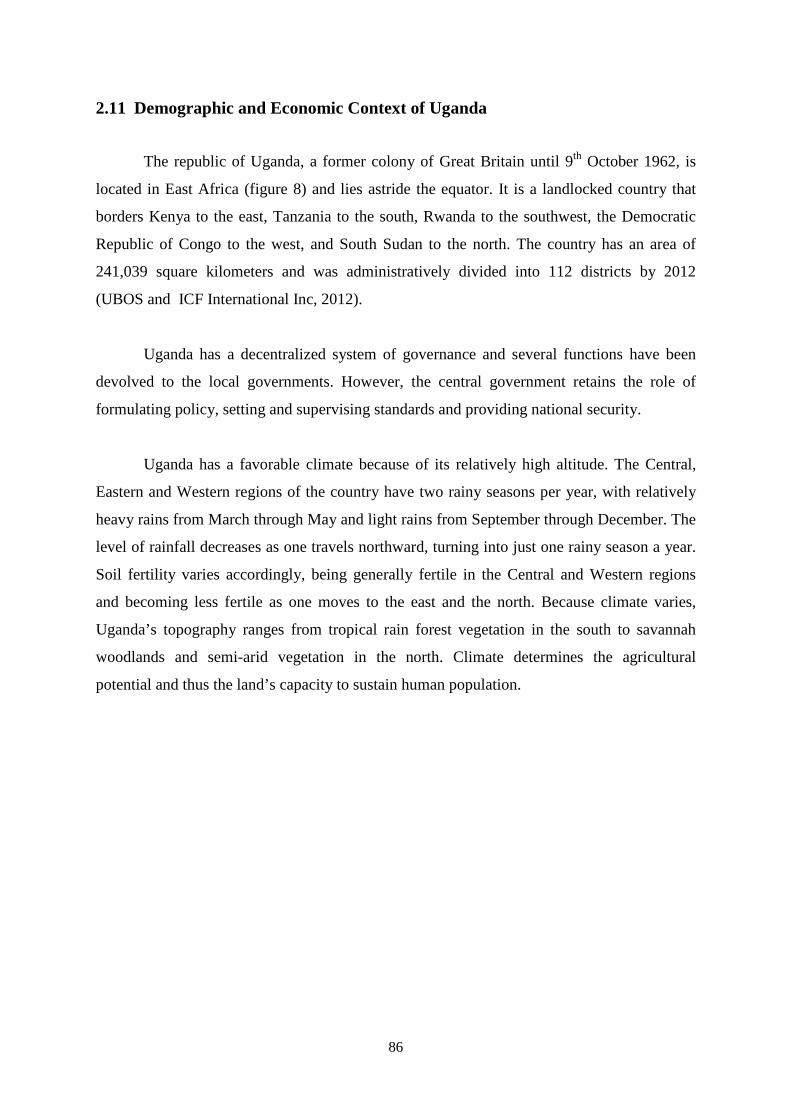
86
2.11 Demographic and Economic Context of Uganda
The republic of Uganda, a former colony of Great Britain until 9th October 1962, is
located in East Africa (figure 8) and lies astride the equator. It is a landlocked country that
borders Kenya to the east, Tanzania to the south, Rwanda to the southwest, the Democratic
Republic of Congo to the west, and South Sudan to the north. The country has an area of
241,039 square kilometers and was administratively divided into 112 districts by 2012
(UBOS and ICF International Inc, 2012).
Uganda has a decentralized system of governance and several functions have been
devolved to the local governments. However, the central government retains the role of
formulating policy, setting and supervising standards and providing national security.
Uganda has a favorable climate because of its relatively high altitude. The Central,
Eastern and Western regions of the country have two rainy seasons per year, with relatively
heavy rains from March through May and light rains from September through December. The
level of rainfall decreases as one travels northward, turning into just one rainy season a year.
Soil fertility varies accordingly, being generally fertile in the Central and Western regions
and becoming less fertile as one moves to the east and the north. Because climate varies,
Uganda’s topography ranges from tropical rain forest vegetation in the south to savannah
woodlands and semi-arid vegetation in the north. Climate determines the agricultural
potential and thus the land’s capacity to sustain human population.
87
Figure 8: Location of Uganda in Africa
2.11.1 Demographic context
Uganda’s population that is largely rural based (table 3) is one of the fastest growing
in the world (World Bank, 2011) although this growth is largely due to a decline in child
mortality and persistently high fertility and less of an effect of international migration. Today
on average, a woman gives birth to about 6 children and this has declined only slightly from
over 7 children between 1960 and 1995 as per figure 9 (United Nations, 2013). Fertility has
continued to peak in a young age group of 20-24, over decades (figure 10).
On the other hand, the under-five mortality rate (comprising child and infant
mortality) that remains high by international standards has declined significantly from 271
deaths per 1000 births in 1950-1955 to 102 deaths per 1000 births in 2005-2010 (United
Nations, 2013).
The significant decline in under-five mortality and persistent high fertility, have led
to a high population growth rate averaging 3.3% in the 1991-2002 inter censual period
(UBOS and ICF International Inc, 2012) and an exponential growth of Uganda’s total
population (figure 10).

88
Under Five Mortality Rate
Total Fertility Rate
6.00
6.20
6.40
6.60
6.80
7.00
7.20
0
50
100
150
200
250
300
Tota
l Fer
tilit
y R
ate
Un
der
Fiv
e M
ort
alit
y R
ate
Figure 9 : Evolution of Fertility and Mortality in Uganda
Source: Constructed from World Population Prospects, the 2012 Revision, CD-ROM Edition
With these fertility and mortality trends, Uganda is in the first phase of the
demographic transition characterized by competition for resources at the family and
population levels, which may hamper adequate investment in children at both levels (Lam &
Marteleto, 2008). The effect of population growth on the development of education is echoed
in the rest of Sub-Saharan Africa thus “En effet, la croissance démographique, favorisée par
une fécondité demeurée très forte prend le pas sur les progrès réalisés en matière de
scolarisation” (Charbit & Kébé, 2006 p. 26).
Table 3: Percent of the Population urban between 1969 and 2011 in Uganda
Year 1969 1980 1991 2002 2011(estimate) Urban Population (%) 6.6 6.7 9.9 12.3 15.6 Source: Uganda Population & Housing Census Report 2002 and UN World Population Prospects, CD-ROM Edition

89
0
50
100
150
200
250
300
350A
SF
Rs
1950-1955 1985-1990 2005-2010
56.5
9.5
12.6
16.7
24.4
33.9
0
5
10
15
20
25
30
35
40
Popn
Figure 10: Evolution of Age Specific Fertility Rates & Uganda’s Population, 1948-2010
Source: Constructed from World Population Prospects, the 2012 Revision, CD-ROM Edition
A fast growing population may have several implications for development, in general
and the growth of education, in this particular case. It may imply competition for resources,
destruction of the environment, increased dependency, food scarcity, heightened land
wrangles, high rural-urban migration etc.
As per table 4, the number of people per square kilometer has increased from 25 in
1948 to 124 in 2002 (Uganda Bureau of Statistics, 2002) and finally to 141 in 2010 (United
Nations, 2013). While countries with a high carrying capacity are not necessarily poorer, high
population density in the context of land being the main source of livelihood for the majority,
low levels of off farm employment (World Bank, 2012b) and urbanization as well as
inadequate use of improved farming methods, may have adverse implications for production
and productivity, that may in turn affect household incomes. In addition, land conflicts are
likely to be a common occurrence as is the case in Uganda today contrary to what used to
happen decades ago.
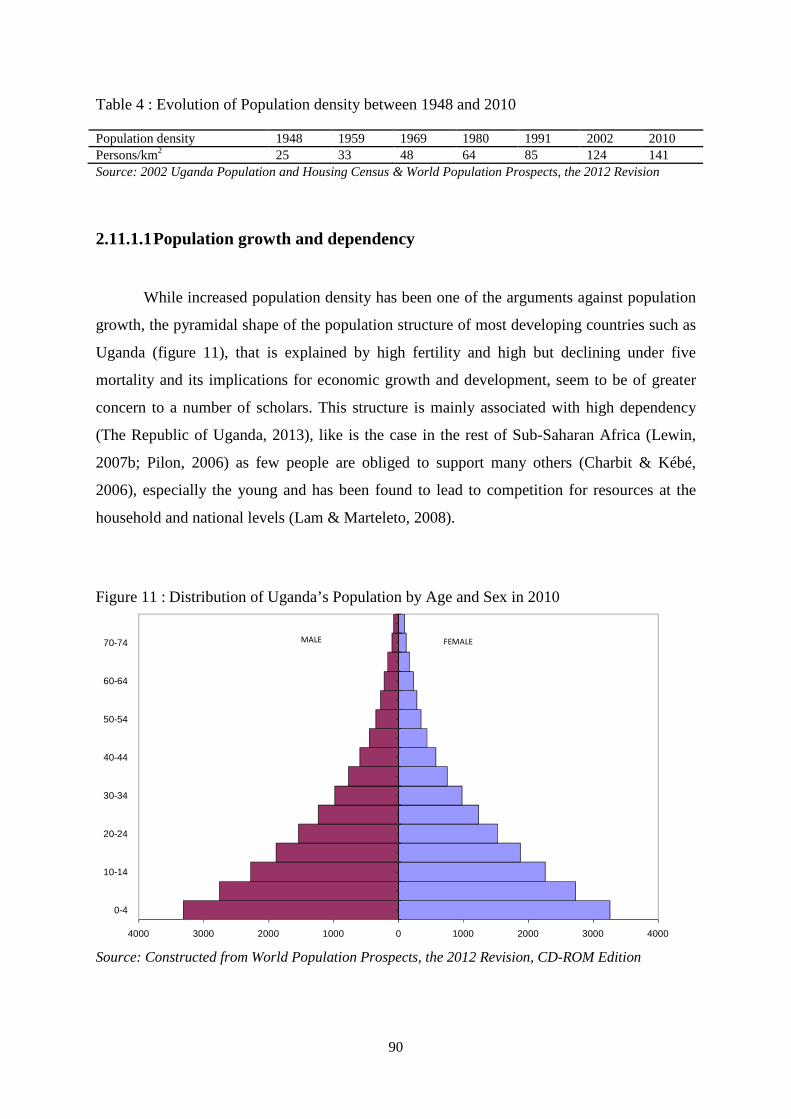
90
4000 3000 2000 1000 0 1000 2000 3000 4000
0-4
10-14
20-24
30-34
40-44
50-54
60-64
70-74 MALE FEMALE
Table 4 : Evolution of Population density between 1948 and 2010
Population density 1948 1959 1969 1980 1991 2002 2010 Persons/km2 25 33 48 64 85 124 141 Source: 2002 Uganda Population and Housing Census & World Population Prospects, the 2012 Revision
2.11.1.1 Population growth and dependency
While increased population density has been one of the arguments against population
growth, the pyramidal shape of the population structure of most developing countries such as
Uganda (figure 11), that is explained by high fertility and high but declining under five
mortality and its implications for economic growth and development, seem to be of greater
concern to a number of scholars. This structure is mainly associated with high dependency
(The Republic of Uganda, 2013), like is the case in the rest of Sub-Saharan Africa (Lewin,
2007b; Pilon, 2006) as few people are obliged to support many others (Charbit & Kébé,
2006), especially the young and has been found to lead to competition for resources at the
household and national levels (Lam & Marteleto, 2008).
Figure 11 : Distribution of Uganda’s Population by Age and Sex in 2010
Source: Constructed from World Population Prospects, the 2012 Revision, CD-ROM Edition
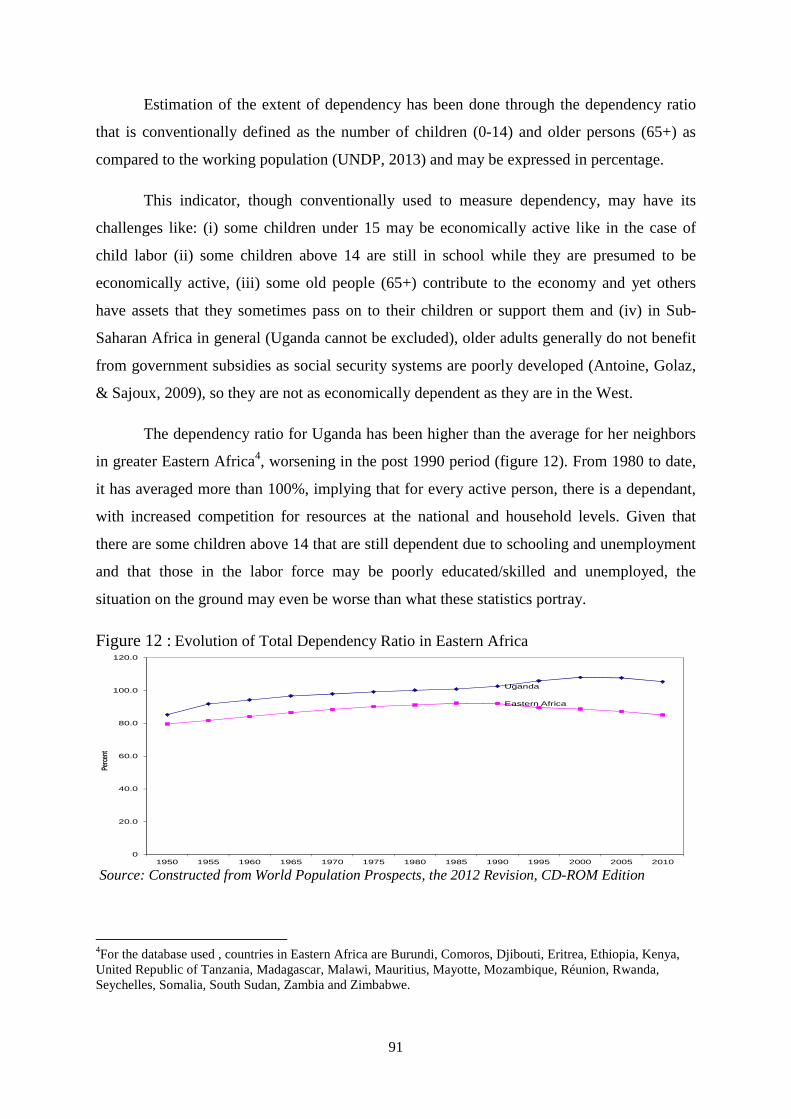
91
Uganda
Eastern Africa
0
20.0
40.0
60.0
80.0
100.0
120.0
1950 1955 1960 1965 1970 1975 1980 1985 1990 1995 2000 2005 2010
Perc
ent
Estimation of the extent of dependency has been done through the dependency ratio
that is conventionally defined as the number of children (0-14) and older persons (65+) as
compared to the working population (UNDP, 2013) and may be expressed in percentage.
This indicator, though conventionally used to measure dependency, may have its
challenges like: (i) some children under 15 may be economically active like in the case of
child labor (ii) some children above 14 are still in school while they are presumed to be
economically active, (iii) some old people (65+) contribute to the economy and yet others
have assets that they sometimes pass on to their children or support them and (iv) in Sub-
Saharan Africa in general (Uganda cannot be excluded), older adults generally do not benefit
from government subsidies as social security systems are poorly developed (Antoine, Golaz,
& Sajoux, 2009), so they are not as economically dependent as they are in the West.
The dependency ratio for Uganda has been higher than the average for her neighbors
in greater Eastern Africa4, worsening in the post 1990 period (figure 12). From 1980 to date,
it has averaged more than 100%, implying that for every active person, there is a dependant,
with increased competition for resources at the national and household levels. Given that
there are some children above 14 that are still dependent due to schooling and unemployment
and that those in the labor force may be poorly educated/skilled and unemployed, the
situation on the ground may even be worse than what these statistics portray.
Figure 12 : Evolution of Total Dependency Ratio in Eastern Africa
Source: Constructed from World Population Prospects, the 2012 Revision, CD-ROM Edition
4For the database used , countries in Eastern Africa are Burundi, Comoros, Djibouti, Eritrea, Ethiopia, Kenya, United Republic of Tanzania, Madagascar, Malawi, Mauritius, Mayotte, Mozambique, Réunion, Rwanda, Seychelles, Somalia, South Sudan, Zambia and Zimbabwe.

92
It is one thing to have a small labor force as compared to dependants, it is yet another
that the labor force is of quality as evidenced by its level of education and or skills as well as
sector/type of employment it is engaged in.
In this vein, the share of Uganda’s working age population with education beyond
primary was only 28% by 2010 explaining why agriculture and self-employment have
remained the main employer (World Bank, 2012b). In addition, Uganda has a weak tax
administration system and a combination of this with the previous point explains why it
collects only 13.7% of its GDP in taxes (Ssewanyana et al., 2011), pointing to the inability of
government to adequately finance social services including education.
Paradoxically, and as has been found in the rest of Sub-Saharan Africa (Bourdon,
2006; Henaff, 2006), these weak countries (Uganda is not an exception) that have very little
capacity to invest in social services like education, urgently need this investment to accelerate
the demographic transition and cause sustainable development. The way out is likely to
involve engendering cost cutting reforms in the education sector, forging healthier
partnerships with private providers, re-aligning other policies and negotiating for more
foreign aid as well as managing it better.
2.11.2 Economic Context
The economy is predominantly agricultural, with the majority of the population
dependent on subsistence farming and light agro-based industries. The country is self-
sufficient in food, although its distribution is uneven over all areas. Coffee remains the main
foreign exchange earner for the country (UBOS and ICF International Inc, 2012) .
During the period immediately following independence (from 1962 to 1970) Uganda
had a flourishing economy with an annual GDP growth rate of 5% that contrasted with a
population growth rate of 2.6%. In the 1970s through the early 1980s, Uganda faced a period
of civil and military unrest, resulting in the destruction of the economic and social
infrastructure and hence poor economic performance (figure 13). The growth of the economy
and the provision of social services such as education and health care were seriously affected.

93
Eastern Arica
Uganda
-15.0
-10.0
-5.0
0.0
5.0
10.0
15.0
GD
P G
row
th R
ate(
%)
After 1986 however, the new National Resistance Movement government and its
development partners introduced and implemented several structural adjustment policy
packages that have steadily reversed prior setbacks and realigned the country towards
economic prosperity. These included, but were not limited to: trade liberalization,
privatization and divestiture of public enterprise, foreign exchange liberalization,
reorganization of tax revenue collection, civil service reform, reduction in the size of the
army, decentralization, streamlining of investment policy and rehabilitation of the socio-
economic infrastructure (De Kemp & Eilor, 2008).
The recovery of the economy in 1986 is clearly observable from figure 13. It is clear
that Uganda’s GDP growth rate has generally remained above the Eastern African average
and only declined to about 4.1% in 2011/12 due to high global and commodity prices,
drought in parts of the country, power shortages, exchange rate volatility and weak external
demand (MOFPED, 2012).
Figure 13: Evolution of Uganda’s GDP growth rate
Source: Constructed United Nations National Accounts Database.
In line with the growth rate of the economy, GDP per capita for Uganda (figure 14)
was generally lower than the Eastern African average until the mid-90s when it was almost at
par with that of her geographical neighbors. It then declined and picked up in the late 1990s
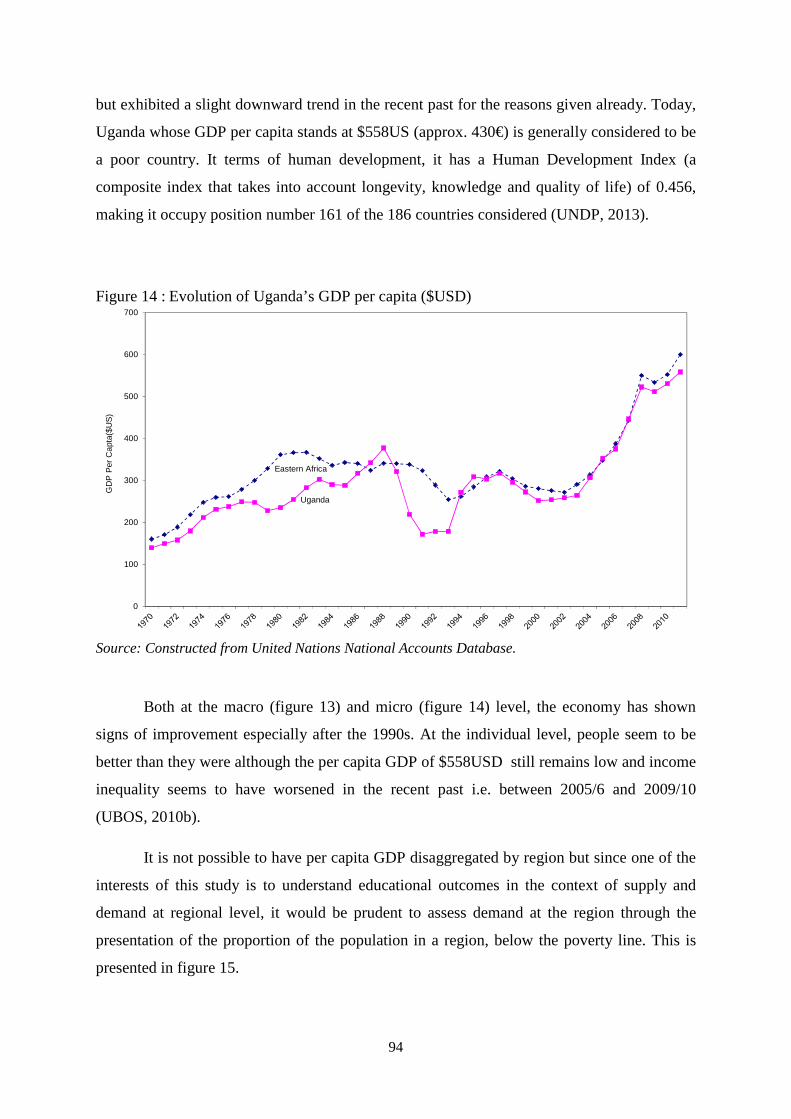
94
Eastern Africa
Uganda
0
100
200
300
400
500
600
700
GD
P P
er C
apta
($U
S)
but exhibited a slight downward trend in the recent past for the reasons given already. Today,
Uganda whose GDP per capita stands at $558US (approx. 430€) is generally considered to be
a poor country. It terms of human development, it has a Human Development Index (a
composite index that takes into account longevity, knowledge and quality of life) of 0.456,
making it occupy position number 161 of the 186 countries considered (UNDP, 2013).
Figure 14 : Evolution of Uganda’s GDP per capita ($USD)
Source: Constructed from United Nations National Accounts Database.
Both at the macro (figure 13) and micro (figure 14) level, the economy has shown
signs of improvement especially after the 1990s. At the individual level, people seem to be
better than they were although the per capita GDP of $558USD still remains low and income
inequality seems to have worsened in the recent past i.e. between 2005/6 and 2009/10
(UBOS, 2010b).
It is not possible to have per capita GDP disaggregated by region but since one of the
interests of this study is to understand educational outcomes in the context of supply and
demand at regional level, it would be prudent to assess demand at the region through the
presentation of the proportion of the population in a region, below the poverty line. This is
presented in figure 15.
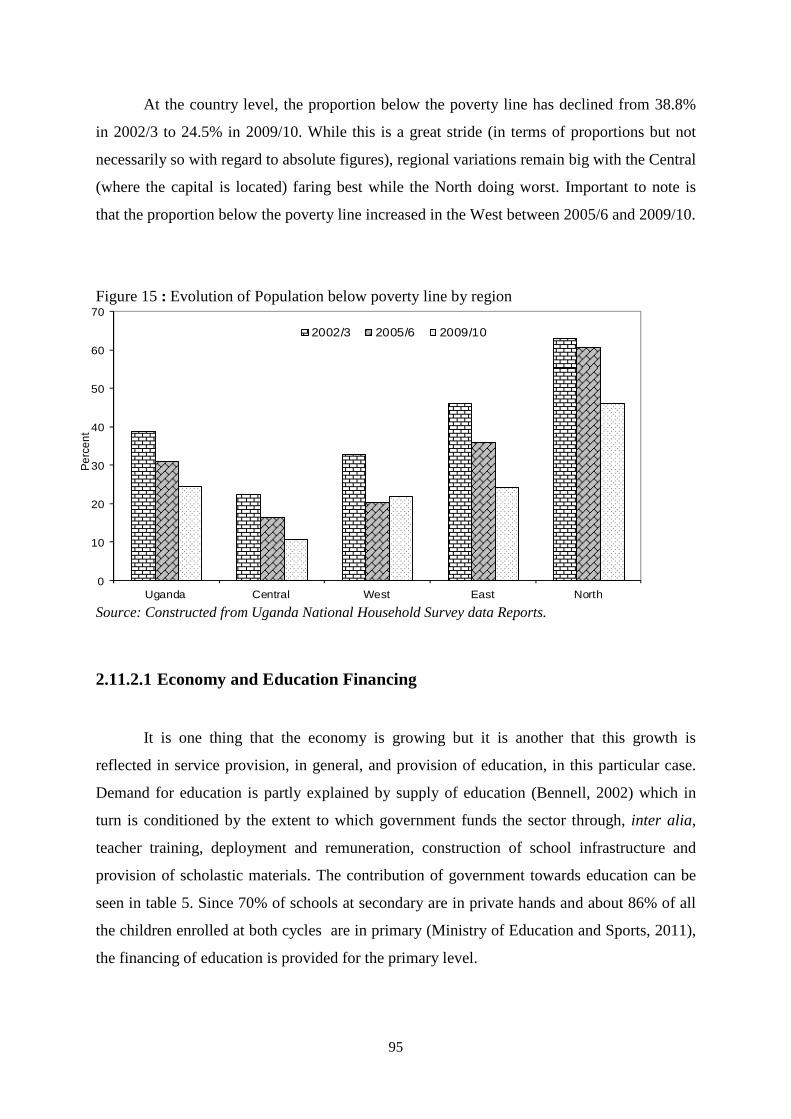
95
0
10
20
30
40
50
60
70
Uganda Central West East North
Per
cent
2002/3 2005/6 2009/10
At the country level, the proportion below the poverty line has declined from 38.8%
in 2002/3 to 24.5% in 2009/10. While this is a great stride (in terms of proportions but not
necessarily so with regard to absolute figures), regional variations remain big with the Central
(where the capital is located) faring best while the North doing worst. Important to note is
that the proportion below the poverty line increased in the West between 2005/6 and 2009/10.
Figure 15 : Evolution of Population below poverty line by region
Source: Constructed from Uganda National Household Survey data Reports.
2.11.2.1 Economy and Education Financing
It is one thing that the economy is growing but it is another that this growth is
reflected in service provision, in general, and provision of education, in this particular case.
Demand for education is partly explained by supply of education (Bennell, 2002) which in
turn is conditioned by the extent to which government funds the sector through, inter alia,
teacher training, deployment and remuneration, construction of school infrastructure and
provision of scholastic materials. The contribution of government towards education can be
seen in table 5. Since 70% of schools at secondary are in private hands and about 86% of all
the children enrolled at both cycles are in primary (Ministry of Education and Sports, 2011),
the financing of education is provided for the primary level.
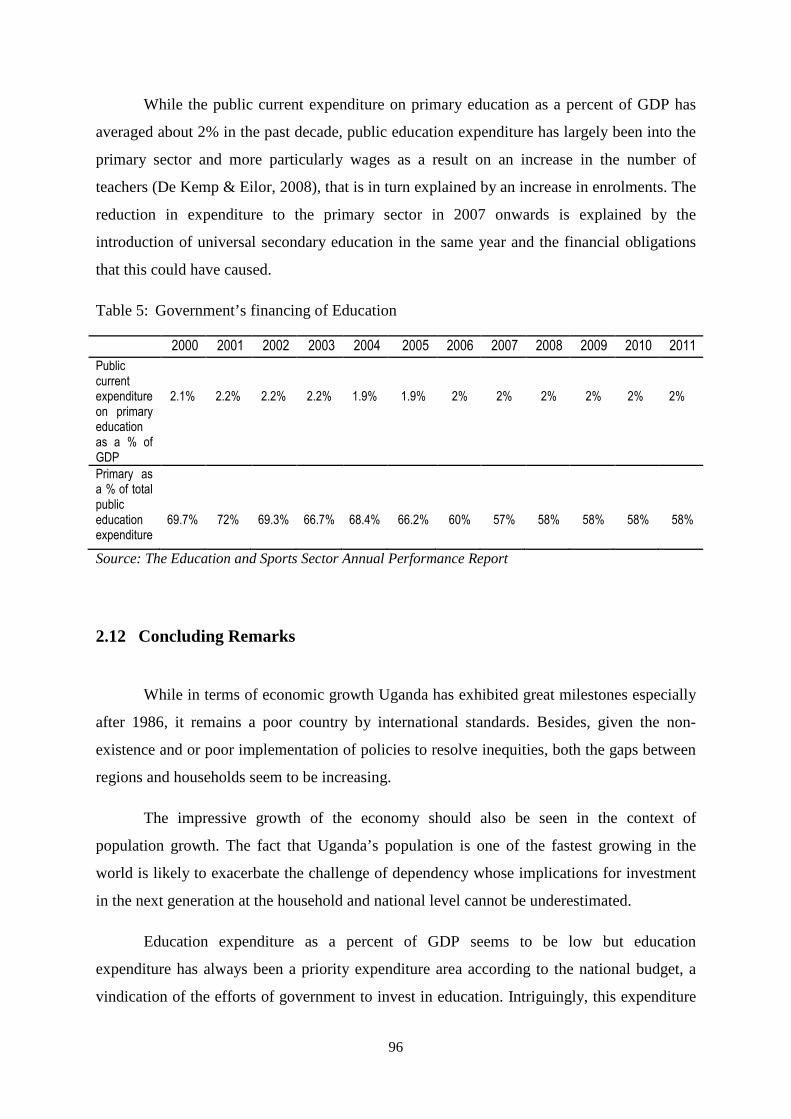
96
While the public current expenditure on primary education as a percent of GDP has
averaged about 2% in the past decade, public education expenditure has largely been into the
primary sector and more particularly wages as a result on an increase in the number of
teachers (De Kemp & Eilor, 2008), that is in turn explained by an increase in enrolments. The
reduction in expenditure to the primary sector in 2007 onwards is explained by the
introduction of universal secondary education in the same year and the financial obligations
that this could have caused.
Table 5: Government’s financing of Education
2000 2001 2002 2003 2004 2005 2006 2007 2008 2009 2010 2011
Public current expenditure on primary education as a % of GDP
2.1%
2.2%
2.2%
2.2%
1.9%
1.9%
2%
2%
2%
2%
2%
2%
Primary as a % of total public education expenditure
69.7%
72%
69.3%
66.7%
68.4%
66.2%
60%
57%
58%
58%
58%
58%
Source: The Education and Sports Sector Annual Performance Report
2.12 Concluding Remarks
While in terms of economic growth Uganda has exhibited great milestones especially
after 1986, it remains a poor country by international standards. Besides, given the non-
existence and or poor implementation of policies to resolve inequities, both the gaps between
regions and households seem to be increasing.
The impressive growth of the economy should also be seen in the context of
population growth. The fact that Uganda’s population is one of the fastest growing in the
world is likely to exacerbate the challenge of dependency whose implications for investment
in the next generation at the household and national level cannot be underestimated.
Education expenditure as a percent of GDP seems to be low but education
expenditure has always been a priority expenditure area according to the national budget, a
vindication of the efforts of government to invest in education. Intriguingly, this expenditure
97
has largely been on the primary sector and towards the payment of wages. While the latter
would imply that teachers are well paid (in fact they keep complaining and threatening to
strike), it may be due to the fact that they are many, also related to mass enrolments
especially after the universal education initiatives.
In a nutshell, the study of inequalities in access to education in Uganda cannot be
done outside the economic and demographic circumstances in which the country finds itself.
These seem to impact the ability to invest in social services in general, and education, in this
particular case in an attempt to transform the next generation. But before inequalities in
accessing secondary schooling can be studied, it may be important to look at education policy
in Uganda and how this has evolved overtime but also its implications on supply and demand
for education as to be seen in the next chapter.

98
99
CHAPTER THREE: EDUCATION POLICY AND EVOLUTION OF SUPPLY AND DEMAND FOR EDUCATION SINCE INDEPENDENCE
This chapter explores education policy since independence and how this has impacted
supply and demand for education at primary but most importantly, secondary level.
The formal education system that exists in Uganda today and probably in the greater
part of Africa was introduced by Christian Missionaries. In Uganda in particular, European
missionaries came in response to a letter from a journalist Henry Morton Stanley published in
England in the Daily telegraph newspaper on 15th November 1875. He called upon Christians
in England to send missionaries in Uganda to King Mutesa 1 on whose initiative the
invitation had been sent. Stanley’s letter read in part:
Oh , that some pious practical missionary would come here . ….. would be
the savior of Africa. Nowhere is there, in the entire pagan world a more
promising field for a mission than in Uganda. Here, gentlemen, is your
opportunity. Embrace it. The people of the shore of Nyanza (Lake Victoria)
call upon you. (Oliver and Atmore, 1967 p. 76) as cited by Tiberondwa
(1999, p. 4).
In response to Stanley’s letter, the Church Missionary society of England and the
White Fathers’ mission based in France sent missionaries that arrived in Uganda in 1877 and
1879 (Ssekamwa, 1997), respectively. Indeed it came to pass that between 1877 and 1925,
education in Uganda was under the control and direction of Christian missionaries.
While the Uganda protectorate government was established in 1894, the department
of education in the country was established in 1925. This was after the recommendation of
the Phelps-Stokes Report of 1922 that encouraged government to participate in education
through supervision and financial assistance to strengthen and control missionary efforts.
Indeed, the first education policy in Uganda can be traced to this report. It should also be
noted that in the 1920s and 30s, education was available to a small group of people, mainly
children of the aristocracy, clergy and tribal chiefs (Syngellakis & Arudo, 2006).
100
3.1 The 1963 Castle Commission
Policy on education in the post-independence period cannot be discussed outside the
developments on the international scene. In 1960, the UN declared the 1960s “the
development decade” during which the majority of mankind was to be liberated from
poverty, ignorance and disease (Tumushabe et al., 1999). The first UNESCO sponsored
conference of Ministers for education of independent states in Africa had just reaffirmed its
faith in the power of education.
In Uganda, like elsewhere in Africa (Pilon & Wayack-Pambè, 2002) the demand for
high level manpower to take over the running and management of both public and private
sectors was high after independence. Although the need for expanding primary education was
recognized, it was felt that there were not enough resources for both primary level and higher
levels (Syngellakis & Arudo, 2006). In order to respond to this demand, government set up
the Castle commission in 1963 with the following aims: (i) to examine, in light of the
recommendations of the International Bank Survey missions report, Uganda’s financial
position and future manpower requirements, the content and structure of education as well as
(ii) identify mechanisms for improving and adapting education to the needs of the country.
The commission recommended large scale expansion of post primary education as a
means towards training of high level manpower to manage newly gained independence
(Oketch & Rolleston, 2007). Also among its recommendations was the expansion of girls’
education, emphasis on secondary education and advocacy for increased parental contribution
to education (Tumushabe et al., 1999).
It should be noted that despite the move by government to exercise control over
education since 1925, missions were still exercising enough control on education institutions.
It is in this regard that the 1964 and 1970 Education Acts transferred the management and
running of education from missions and other foundation bodies to government. In addition,
after the 1964 Education Act, there was massive capital investment in secondary education by
government and the construction/expansion of schools throughout Uganda. A large
proportion of the education budget went to post primary institutions and this continued for
two more decades after independence.

101
Although the Castle Commission Report had noted poor enrolment (proportion of
girls enrolled being 35% and 24% at primary and secondary, respectively as per EMIS data)
and retention of girls in school, none of the documents or development plans advocated for
any specific gender based focus on education.
As already mentioned, the first and second Five Year Development Plans (1961-66
and 1966-71), laid emphasis on high level manpower development reflecting strategies of
international agencies and education development experts of the time. There was need to
replace colonial civil servants with Ugandan personnel and this required training at the post
primary level. Education Policy was thus shaped by this larger policy environment with
emphasis on secondary education and investment in high level training for economic
development. Following the 1971 coup d’état by Amin, there was a decline in educational
service provision, an exodus of key personnel including teachers and deterioration of existing
infrastructure.
The third five year development plan (1972-76) was the first plan to express concern
about the neglect of primary education as at the time, the net enrolment rate at primary was
about 50% (Tumushabe et al., 1999). It proposed a more rigorous policy to overcome this
deficiency by making primary education available to a rapidly increasing proportion of the
school age group. The planned target for achieving Universal Primary Education was 2000. It
is in this light that government put in place the 1977 Education Policy Review commission to
review in detail the neglect of primary education and come up with relevant
recommendations as seen in the next section.
3.2 The 1977 Education Policy Review Commission
In 1977, the government appointed a commission to review existing policies since the
Castle commission of 15 years earlier. The new commission confirmed the proposal of the
3rd Five Year Development Plan (1972-76) to introduce universal primary education by the
year 2000. To make this a reality, the following were to be implemented: i) intakes in
Primary 1 were to be increased, (ii) free universal primary education in age group 6-10 was to
be achieved by 1990 and (iii) by 1990, after largely achieving free universal primary
102
education for classes P1 to P5, there would be an expansion so that upper primary would
attain universal enrolment in classes up to P7.
While these seemed good recommendations to bolster universal access to primary
education, the report of the commission was never considered by government and was not
published for wider circulation, due to the 1979 liberation war between Uganda and
Tanzania.
The continued marginalization of primary education persisted despite two attempts to
promote universal primary education through the Five Year Development Plan (1972-76) and
the education Policy Review Commission of 1977. The major constraint to achieving
Universal Primary Education was the negative political climate that culminated into the
1978/9 war which in turn led to massive destruction of educational infrastructure and
deterioration of facilities (MoES, 1989). This was coupled with poor economic growth that
characterized that period.
Following elections and change of government in 1980, a recovery program covering
different sectors of national development was designed. This had, as one of its aims, an
ultimate goal of achieving Universal Primary education (UPE). Another period of insurgency
ensued and government was preoccupied with the guerilla war between 1981 and 1985. The
negative effect of war on education in form of increased military expenditure and reduced
expenditure on social services in general, and education in particular, has been documented
elsewhere especially in Sub-Saharan (Poirier, 2012). In line with what has happened
elsewhere, both the attention and or resources were directed to the war to the detriment of
education. It can thus be noted that for close to 3 decades of independence, UPE remained out
of reach for Ugandans although all governments recognized its “urgency”. New reforms in
education came to be instituted after Museveni came to power and this was through the
Education Policy Review Commission of 1989 as elucidated in the following section.
3.3 The 1989 Education Policy Review Commission
The Post conflict period saw the National Resistance Movement (NRM) government
institute a series of commissions to investigate the state of affairs in all areas of government
103
among which was education. In this vein, the government appointed the Education Policy
Review Commission under Professor Senteza Kajubi in 1987 and gave the commission the
following terms: (i) recommending policies at all levels i.e. primary, secondary and tertiary,
(ii) making policies about aims and objectives of education, (iii) coming up with policies
about the structure of the education system and (iv) integrating the role of the private sector
in education. The professor led a team of high profile people to do the job for which he was
appointed and after thorough consultations with all stakeholders, the commission came up
with, inter alia, the recommendations that: (i) Universal Primary Education (UPE) for
children of age group 6-10 should be achieved by the year 2000, (ii) by the year 2000, it
should be ensured that children enter school at the right age of 6 years and that (iii)
Universalization of primary education for children aged 6-13 should be achieved soon after
2000 and not later than 2010.
The spirit of the framers of the Education Review Policy Commission Report was that
the goal for UPE should be that all children aged 6-10 years are enrolled and that they
complete at least five years of schooling in order to be equipped with essential literacy,
numeracy and other skills envisaged in the package of basic education. Once this was
achieved, the next target was achieving full universalization of primary education covering
all children of the age group 6-13 corresponding to grades 1 to 8 (MoES, 1989).
Otherwise the pre-1990 education system was characterized by poor quality, poor
enrolment, high attrition rates, differential enrolment by geographical location and by school
and very low efficiency in terms of cost per child. Parental contribution to school
maintenance accounted for 50-70% of all school financial requirements (Appleton, 2001;
MoES, 2001). Despite low government fees, Parents Teachers Association (PTA) dues
resulted into poor parents not being able to enroll all or any of their children in school. In
addition, the formal primary school system was rigid preventing children involved in petty
trade or household activities from attending school (MoES, 2001).
The Commission made several recommendations and some that seem relevant to this
study need to be mentioned as follows:
As per recommendation 24 also referred to as R24 in the report of the commission,
suitable measures were to be taken, based on system studies of causes of wastage (repetition
and dropping out) to ensure that : (i) children should not leave school without completing at
least 5 years of schooling and (ii) repetitions and dropouts in different grades are reduced.
104
Democratization of primary education is contained in recommendation 25 (R25)
whereby there was not supposed to be tuition fees in classes P1 to P4 from 1991 onwards, P5
to P6 from 1995 onwards and P7 to P8 from 1999 onwards.
About the cost of maintaining a child at school, the commission recommended (R34)
that all new publicly funded primary schools were to be only day schools and that where
boarding facilities were provided; these were to be funded entirely by the parents or
beneficiaries.
The commission noted that geographical location of educational facilities was one
most important aspect of educational planning but at the time, there were either too many or
too few secondary schools in an area. In addition, there were many boarding secondary
schools and a greater part of their operational costs was met by government. In
recommendation 52, the existing boarding secondary schools were to continue but the total
boarding school costs were to be borne by the parents as in the case of primary schools. It
continues in R53, that “In future, all new government aided general secondary schools
were to be day schools” (MoES, 1989) .
It was also noted that, then, the education system paid little attention to the needs of
the mentally weak, physically handicapped and socially disabled persons including those
from disadvantaged areas and groups. It encouraged universal enrolment, introduction of
vocational training at secondary level and non-formal education.
Poor enrolment of girls as compared to boys was pointed out as one critical inequity
that needed urgent redress. The Commission noted that this was due to cultural reasons in the
context of a patrilineal society where parents preferred to enroll boys, poor facilities for girls
in the schools (lack of sanitary pads, absence of exclusive toilets for girls etc.), the traditional
division of labor at home that was more in disfavor of the girls and teenage pregnancies as
well as early marriages.
In its efforts towards the democratization of education, the commission took into
account the girls, disabled, gifted children, children from disadvantaged ethnicities like the
Karimajong , those from fishing villages and remote areas. It was convinced that education is
a basic human right of all Ugandans regardless of their social status, physical form, mental
ability, sex, age, birth place or ethnic group.
105
In order to bolster enrolment of girls, recommendation 163, points out that in co-
educational schools, the head or deputy was to be a woman in order to pay adequate attention
to the needs of girls and that adequate facilities for girls were to be provided in post primary
institutions. In addition, the commission outlined strategies aimed at enhancing the education
of the hitherto disadvantaged groups of children like the disabled and gifted children, young
soldiers, refugees, Aids orphans, children in Islands, those in remote areas and the Karamoja
region. One other important recommendation that needs to be mentioned was that primary
education was to last 8 instead of 7 years as had been the case.
The Report of the education Policy Review Commission was debated by government
which consolidated the latter into the Government White Paper as can be seen in the next
section.
3.4 The 1992 Government White Paper
In response to the Education Policy Review Commission Report, government
appointed the White Paper committee to examine the report and identify recommendations
which would be acceptable and feasible to implement and make amendments where
necessary.
The White Paper Committee largely accepted the recommendations of the Education
Policy Review Commission with a slight modification. It shifted the target of achieving UPE
from 2000 as per Education Policy Review Commission to “as soon as possible” but not later
than 2001/2 (MoES, 1992) according to the White Paper. In this regard, the white paper
recommended the introduction of free compulsory primary education starting in 1992/93 in
which case fees would be eliminated in phases through the following manner:
1992/93: abolishing fees for Primary four (P4) in all schools in Uganda.
1993/94: abolishing fees for P5 in all schools and continuing to add one class upwards
per year until P8 would be reached in 1996/7.
1997/8: abolishing fees for P3 in all schools and continuing to add one class
downwards per year until the whole primary cycle would be covered (P1-P8) in 1999/2000.
106
Making school attendance compulsory for every class in which free education was
introduced and all basic education, free and compulsory by the year 2000/1. The White Paper
also recommended increasing educational facilities, instructional materials and teachers
rapidly to speed up implementation of the UPE Policy.
Adopting strategies for minimization of wastage through mounting a campaign to
enhance retention of enrolled primary school pupils, adopting a double shift system so as to
enroll more pupils and maximize the use of facilities and teachers, adopting the system of
automatic promotion from one class to another. It also recommended reviewing the primary
school curriculum to make education relevant to children and Uganda’s needs as well as
interesting and conducive for easier upward mobility in school and remunerating teachers
properly for any extra teaching load.
It should be noted that there was considerable delay in finalizing the draft White
Paper and hence recommendations to achieve the envisaged targets could not easily be
implemented. While the Report of the Castle Commission was the main policy document in
the area of education in the first three decades of independence, the Education Policy Review
Commission report and by implication, the Government White Paper has remained the main
education Policy document in the area of education to date.
In the period that followed the Government White Paper, several other legal or
strategy documents have been put in place to operationalize the recommendations of the
White Paper.
In this regard, article 30 of the National Constitution stipulates that “education is a
right for every Ugandan” and in article 34(2), “the provision of education lies in the hands of
the state and the parents of the child” (Government of Uganda, 1995). The Local Government
Act 1997, transferred primary and secondary education services to local Governments and the
Revised School Management Committee Regulations 2000, updates the framework for
managing education in Uganda. The first step to operationalize the recommendations of the
Government white paper came to pass in 1997 when Universal primary education was
announced as can be seen in the following section.
107
3.5 The advent of Universal Primary and Secondary education
While plans for UPE had been finalized by 1992 as per Government White Paper, the
implementation came to pass in 1997 after Museveni (the President of Uganda) announced
that free education for 4 children per family would commence in January 1997 amidst the
1996 presidential election campaigns. The key objectives of UPE as summarized by Hedger,
Williamson, Muzoora, & Stroh (2010) were:
• making basic education accessible to the learners and relevant to their needs as
well as meeting national goals;
• making education equitable in order to eliminate disparities and inequalities;
• establishing, providing and maintaining quality education as the basis for
promoting the necessary human resource development
• initiating a fundamental positive transformation of society in the social, economic
and political fields and
• ensuring that education is affordable by the majority of Ugandans by providing,
initially, the minimum necessary facilities and resources, and progressively the
optimal facilities, to enable every child enter and remain in school until they complete
the primary school education cycle.
While President Museveni’s initiative was pragmatic and well received, it was at
variance with what government had accepted in the White Paper (the phasing of UPE
implementation) for not only weren’t there enough teachers, instructional materials and
physical facilities to accommodate the surge in enrolments, it also became a sudden financial
burden to government. In addition, the definition of the family was also problematic and
compounded by polygamy and single parenthood. It was later accepted that all children could
enroll in school under UPE.
This haphazard implementation of the UPE policy, in the context of high population
growth rates and declining public resources has caused “enrolment shocks” that have led to
the decline of quality in schools (Deininger, 2003; Lewin, 2009; Oketch & Rolleston, 2007).
108
Intriguingly, the post UPE period has failed to recover from this shock as evidenced by high
attrition rates and some parents have tended to abdicate the responsibility of looking after
their children arguing that, they (the children) are Museveni’s, ostensibly in return for the
votes that they gave him in 1996 and those they have continued to give him to date.
Tiberondwa (1999) summarizes the challenges of UPE in the first two years of
implementation thus: (i) high pupil teacher-ratios (100:1) while many qualified grade 3, grade
5 and graduate teachers were not employed; (ii) increased enrolments at primary that were
not catered for at post primary level; (iii) big classes, smaller rooms and few teachers; (iv)
teachers had lost income through the abolition of PTA fees; (v) shortage of latrines at schools
to cater for increased numbers; (vi) shortage of water supplies in schools; (vii) increased
wage bill on the part of government and (viii) expected fall in quality due to high pupil
teacher ratios.
As part of the implementation of the Poverty Eradication Action Plan 2005-2010
(PEAP), the Ugandan government introduced the Universal post primary education and
training Policy in 2007. Through the policy that has taken on the appellation “Universal
Secondary Education (USE) Policy”, government was to provide free tuition to secondary
school students starting with 300,000 primary school graduates in 2007. Parents, on the other
hand, were to provide exercise books, accommodation, medical care, meals and other
scholastics. In addition, government was to ensure that every sub-county gets a secondary
school although by 2008, 271 sub-counties had neither a public nor private secondary school
and this has been blamed on the inadequacy of Uganda’s budget.
Following the Government White Paper on education, several other laws and strategy
documents were put in place to enforce the recommendations by the government Policy
document. The important ones that need to be elaborated on are The Education Strategic
Investment Plan (1998-2003), The Education Sector Strategic Plan (2004-2015) and the 2008
Education Act.

109
3.6 Education Strategic Investment Plan-ESIP (1998-2003)
This was meant to operationalize the white Paper Recommendations. It intended to
shift educational planning from a project to a program approach focusing on broad policy and
strategic objectives. The ESIP framework document outlines a medium term strategy for the
development of the education sector which would guide all stakeholders in determining
priority areas of action and investment. According the Ministry of Education and Sports
(1998), the plan’s five broad priorities over the target period included (i) assuring universal
access to primary education focusing on increasing net enrolment ratio, transition rates,
improving attendance and making instructional time more effective; (ii) ensuring equity by
eliminating disparities in access and performance, emphasis was on removing gender,
regional and social inequity over the period; (iii) provision of an enabling environment for
public-private partnerships in delivery of educational services at all levels, especially in post
primary subsectors; (iv) strengthening the role of central government as the policy
powerhouse for education development, collaborating with national stakeholders in
formulation of strategic priorities and negotiating with donors on most effective means of
support and (v) building the capacity of the district to provide public services and effectively
enable private sector delivery.
With regard to access and equity, the specific strategies and or targets, were: (i)
universal enrolment of primary age children with NER approaching 100%, including
enrolment of females and the then disadvantaged by geographical location; (ii) transition to
public, private and technical schooling reaching at least 65% of primary school completers;
(iii) establishing skills development opportunities for primary school leavers who would not
have access to secondary or technical institution; and (iv) significant increases in
participation of females, disadvantaged groups and children with special needs in all sub
sectors.
The strategic plan envisaged improving access through, inter alia, encouraging double
shifts to ensure optimal utilization of available resources, and adopting multigrade teaching
where children of different classes (grades) would be taught by one specifically trained
teacher at the same time and in the same room. The Education Sector Investment Plan was
later succeeded by the Education Sector Strategic Plan (2004-2015) that comes in to, inter
alia, give direction towards the universalization of secondary education.

110
3.7 Education Sector Strategic Plan- ESSP (2004-2015)
The ESSP covers the fiscal years 2004/05 to 2014/15 and succeeds the Education
Strategic Investment Plan (ESIP 1998-2003). It commits government to assuring universal
access to primary education as the highest priority, points to removal of financial
impediments and pays particular attention to gender and regional equity. Putting the plan into
action was envisaged through shared contribution by the public and private sector,
households and communities (Ministry of Education and Sports, 2004)
This plan pointed out that the ESIP had paid more attention to access and less of
quality and as such it was noted that children were not learning the basic skills. It was thus to
focus on (i) making the curriculum feasible and practical; (ii) adopting efficient methods of
instruction and training teachers in their use; (iii) devoting more instructional time,
consolidating vocational and other subjects into less time; and (iv) examining pupils in
reading, writing and mathematics.
The plan also noted that students were not acquiring the skills and knowledge that
they needed for work or further education. In this regard, the ministry of education plans to
revise the curriculum to improve instruction and assessment, make more efficient use of
resources and reconfigure post primary and Business Technical and Vocational Education
and Training (BTVET) on qualification framework.
The fact that the products of UPE would enter secondary and tertiary education in this
period and that most parents would not afford to continue paying for them was also pointed
out in the plan. Indeed, the challenge of this plan is to accommodate more students at the
post primary and tertiary levels and reach equitable levels of participation among families of
all economic status as well as in rural and urban areas.
The plan envisages an education system that is relevant to Uganda’s national
development goals. With regard to access and equity the plan targets, ensuring increased and
equitable participation in a coherent and flexible post primary system.
111
Relationship between ESIP and ESSP
The Education Sector Strategic Plan differs from the Education Sector
Investment Plan in some key aspects: first, ESIP covered the period 1998-2003 and ESSP
covers the period 2004-2015; (ii) the current plan is costed and linked to department work
plans and the medium term budget framework for it to be used as a critical basis for medium
term and annual planning and budgeting; (iii) the ESSP shifts emphasis (attention and
resources) from Universal Primary Education to post primary and other subsectors in addition
to primary; and (iv) while the ESIP emphasized enrolment, the ESSP looks at improving
quality of education i.e. what participants learn and how they learn it.

112
3.8 The 2008 Education Act
This Act is very critical as it gave force to some recommendations by the Government
White Paper and the Strategic Plans as seen already. In particular, it makes education
compulsory (enforceable according to law) and puts measures to reprimand the parents and or
providers of education services in case they contravened both the UPE and Universal Post
Primary Education and Training (UPPET/USE) Policy guidelines. Some of the important
clauses of the Act (Government of Uganda, 2008) need to be pointed out here:
According to section 4 (1), provision of education and training is the responsibility of the
state, the parent or guardian and other stakeholders. This reinforces article 34(2) of the
Constitution and recommendation 34 and 53 of the Education Policy Review Commission of
1989.
While section 4 (2) stipulates that “ basic education is a right to be enjoyed by all and that
government shall ensure equitable distribution of education institutions”, section 9 (1) points
out that no person or agency is supposed to levy or order another person to levy any charge
for purposes of education in any primary or post primary institution implementing UPE or
UPPET Program.
As per section 10 (3) a; primary education which lasts 7 years is universal and compulsory
for pupils aged 6 years and above and in section 10 (3) b; all children of school going age are
supposed to enter and complete the formal education cycle of 7 years.
According to section 51(1), a person, organization or agency who refuses to enroll or deters
a child from enrolling for UPE in accordance with section 10(3) commits an offence. In line
with the previous provision, as per section 51(2); a person or agency who levies charges
beyond the maximum charges provided by the minister under section 57(g) or who
wrongfully denies access to education to a pupil or student who is a beneficiary of UPE or
UPPET for failure to pay extra charges also commits an offence.
It should be noted that despite an attempt to change the years spent at primary from
seven to eight by the Education Policy Review commission, this was not implemented and
the current structure of the Ugandan Education System is described in the following section.
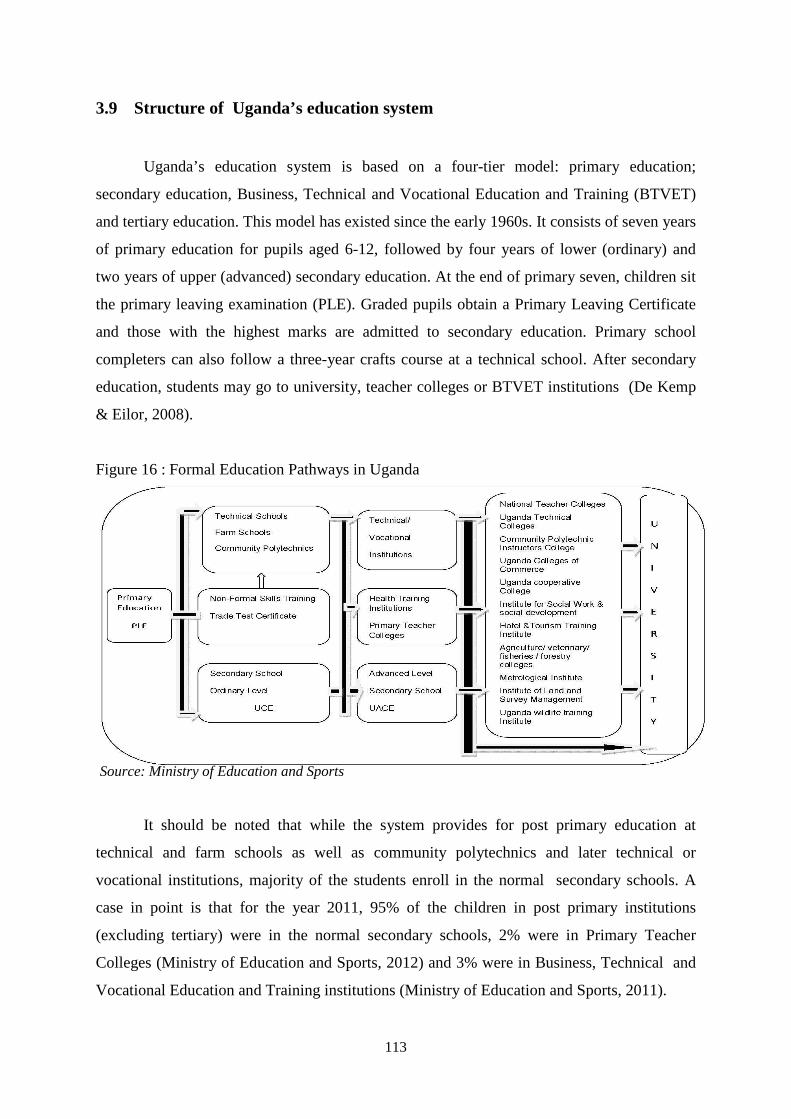
113
3.9 Structure of Uganda’s education system
Uganda’s education system is based on a four-tier model: primary education;
secondary education, Business, Technical and Vocational Education and Training (BTVET)
and tertiary education. This model has existed since the early 1960s. It consists of seven years
of primary education for pupils aged 6-12, followed by four years of lower (ordinary) and
two years of upper (advanced) secondary education. At the end of primary seven, children sit
the primary leaving examination (PLE). Graded pupils obtain a Primary Leaving Certificate
and those with the highest marks are admitted to secondary education. Primary school
completers can also follow a three-year crafts course at a technical school. After secondary
education, students may go to university, teacher colleges or BTVET institutions (De Kemp
& Eilor, 2008).
Figure 16 : Formal Education Pathways in Uganda
Source: Ministry of Education and Sports
It should be noted that while the system provides for post primary education at
technical and farm schools as well as community polytechnics and later technical or
vocational institutions, majority of the students enroll in the normal secondary schools. A
case in point is that for the year 2011, 95% of the children in post primary institutions
(excluding tertiary) were in the normal secondary schools, 2% were in Primary Teacher
Colleges (Ministry of Education and Sports, 2012) and 3% were in Business, Technical and
Vocational Education and Training institutions (Ministry of Education and Sports, 2011).

114
0
20,000
40,000
60,000
80,000
100,000
120,000
140,000
160,000
180,000
200,000
0
2,000
4,000
6,000
8,000
10,000
12,000
14,000
16,000
18,000
20,000Te
ache
rs (N
)
Scho
ols
(N) UPE
USE
Lack of interest in technical education dates back to the colonial period as technical
studies were perceived as courses for less bright students and their graduates earned less on
the job market (Ssekamwa, 1997). General resentment for technical studies has continued to
date despite various efforts to avert the situation through policy.
It is evident that policies have been made and they look impressive. While it is one
thing to have a policy, that the policy is implemented (or even well implemented) and yields
the outcomes for which it was intended is yet another thing. What then has been the effect of
these policies and strategies in terms of the supply of Education overtime? This is to be
looked at in following section.
3.10 Supply of Primary Education
Demand for education can be conditioned by supply of education and the demand at
secondary level may be influenced by supply at both the primary and secondary level. At
primary level, supply may include the number and distribution of schools, teachers,
classrooms, etc. This section looks at the supply of primary education from the perspective of
schools and teachers and how this has evolved since independence.
Figure 17 : Evolution of Primary schools and Teachers
Source: Constructed using raw data from Ministry of Education and Sports
The number of schools and teachers has tremendously increased in the past four
decades. Spectacular increases can be noticed in 1997, when Universal primary education
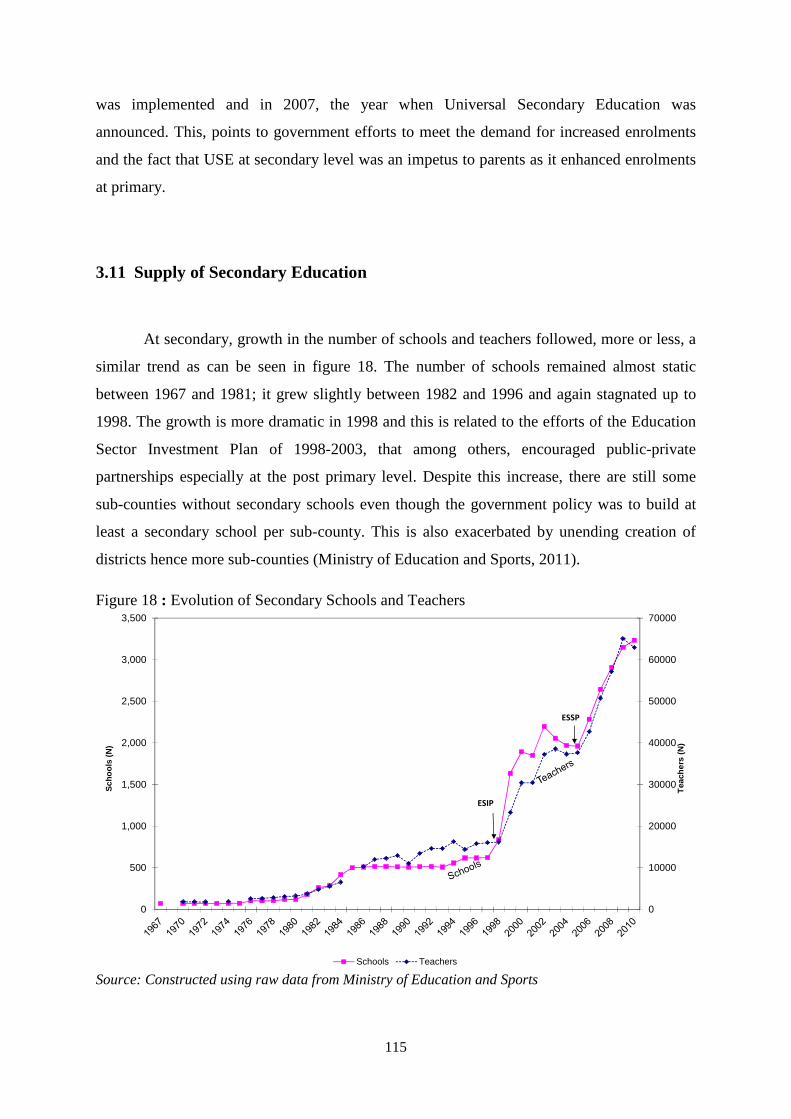
115
0
10000
20000
30000
40000
50000
60000
70000
0
500
1,000
1,500
2,000
2,500
3,000
3,500
Tea
cher
s (N
)
Sch
oo
ls (
N)
Schools Teachers
ESIP
ESSP
was implemented and in 2007, the year when Universal Secondary Education was
announced. This, points to government efforts to meet the demand for increased enrolments
and the fact that USE at secondary level was an impetus to parents as it enhanced enrolments
at primary.
3.11 Supply of Secondary Education
At secondary, growth in the number of schools and teachers followed, more or less, a
similar trend as can be seen in figure 18. The number of schools remained almost static
between 1967 and 1981; it grew slightly between 1982 and 1996 and again stagnated up to
1998. The growth is more dramatic in 1998 and this is related to the efforts of the Education
Sector Investment Plan of 1998-2003, that among others, encouraged public-private
partnerships especially at the post primary level. Despite this increase, there are still some
sub-counties without secondary schools even though the government policy was to build at
least a secondary school per sub-county. This is also exacerbated by unending creation of
districts hence more sub-counties (Ministry of Education and Sports, 2011).
Figure 18 : Evolution of Secondary Schools and Teachers
Source: Constructed using raw data from Ministry of Education and Sports
116
The number of teachers has also greatly increased as can be seen. In 1999 and 2005,
there were more teachers recruited and again this is linked to the implementation of the
Education Sector Investment Plan (ESIP) of 1998-2003 and the Education Sector Strategic
Plan (ESSP) of 2004-2015, respectively both of which encouraged public-private
partnerships.
It is one thing to register an increase in the number of teachers and schools and it is
another that they are well distributed across the regions of the country. In addition, issues of
access are also affected by ownership of the schools and the following section looks at the
evolution of schools by ownership and foundation body.
3.11.1 Secondary schools by ownership and foundation body
Whether education is in the hands of government or private individuals, has a bearing
on access to schooling, more so for children from the rural and or disadvantaged socio-
economic backgrounds (Bangay & Latham, 2013; Pilon, 2004; Woodhead et al., 2013). In
addition, whether a school is day or boarding may also have implications for access given
that boarding fees are by policy met by parents and against the background that performance
of children in boarding schools is better than that for day students. Figure 19 presents
evolution of secondary schools by ownership although the data accessed is between 2000 and
2010.

117
7467 68 65
61 5965 67 69 70 69
0%
10%
20%
30%
40%
50%
60%
70%
80%
90%
100%
2000 2001 2002 2003 2004 2005 2006 2007 2008 2009 2010
Government
Non-Government
1,892 1,850 2,198 2,055 1,969 1,961 2,286 2,644 2,908 3,149 3,234
Figure 19 : Evolution of Secondary schools by Ownership from 2000 to 2010
Source: Constructed using raw data from Ministry of Education and Sports
It is important to note that the apparent reduction in the proportion of non-government
schools prior to 2006 was a result of non-response by Private schools in reaction to a question
on the fees charged by the school that had been included in the school questionnaire. This
was removed in 2006 and the response rate among private schools improved.
As can be seen from figure 19, secondary education has largely been in the hands of
non-government actors in the past ten years. With regard to enrolment though, 52% of
students at secondary (versus 48%) are in government schools (MoES, 2011a) implying that
children in government schools are congested in classes, dormitories and have relatively
fewer teachers given their numbers.
After the USE policy of 2007, non-government providers seem to be more active in
secondary school provision as the proportion of schools owned and run by non-government
actors increased from 65% in 2006 to 69% in 2010. It can be said then; that more of non-
government actors came in to respond to the demand caused by universalizing education. In
addition, government has also partnered with the private sector to take on “USE” students in
return for a capitation grant of 47,000shs (14€) per child per term from government (MoES,
2011b). Through the field interviews conducted, there are complaints from government
school officials and the private providers that the money is so little, comes late and these have
been compounded by inflation:
118
“I think with the current problem we have in the country, government has to
reconsider the amount given otherwise the burden will still come back to parents.
And then, the time for disbursement should be worked upon. They should send it in
time to make planning easier. Otherwise running the school may be very difficult.”
(Male Graduate, Deputy Head teacher of a Private Secondary School partnering with
government to Implement USE)
It was also reported that because money comes late, some private schools oblige parents to
pay the whole amount at the beginning and then they are refunded once government has sent
the capitation grant. In addition, the capitation grant sent has not been revised over the years
and this hampers smooth operation of both government and private schools as elucidated:
“Money sent is not enough and can you imagine 41,000Shs (12€) started coming
when a ream of paper was at 6000Shs (2€) and now it is going at 15,000Shs (5€), so
the money that was paying for 3 reams of paper is now buying one ream. The money
is little and there is inflation also.”(Graduate Deputy Head teacher, in a Government
Mixed, Day USE School)
All these imply that despite the efforts of government to support the education of
especially the children from disadvantaged backgrounds in both public and private schools,
there are institutional impediments that tend to work in disfavour of the poor parents.
As already remarked, the provision of education was in the hands of missionaries
between 1877 and 1925. While government tried to dampen the control and monopoly of
churches in the running of education by taking over the previously largely church owned
schools, it later left with these bodies the power to manage the schools (MoES, 1992). In
practice, this has translated into foundation bodies presiding over the board of governors and
hence implementing all policy in the schools, picking a head teacher of their faith to head the
school, maintaining priests (chaplains) to preside over church ceremonies in the school,
fixing the fees to be paid by the students, etc. It is therefore important that the evolution of
schools by foundation body be presented as leadership and management of schools has
implications for discipline which in turn greatly influences performance (Chapman, Burton,
& Werner, 2010; De Kemp & Eilor, 2008; Mestry, Moloi, & Mahomed, 2007). Management
of schools may also have implications for access as the amount of tuition and other school
dues to pay as well as other requirements are decided almost exclusively by foundation

119
25 24 27 29 28 28 29 29 31 32 35
20 2020 16 17 15 16 15 15 14
17
19 2018 19 19 20 19 17 16 16
16
17 18 17 18 18 17 18 17 17 17
16
9 8 8 7 89 8 9 10 10
5
5 5 5 5 5 5 4 5 4 4 4
4 4 4 4 4 5 5 5 5 5 62 2 1 1 1 1 1 1 1 1 2
0%
10%
20%
30%
40%
50%
60%
70%
80%
90%
100%
2000 2001 2002 2003 2004 2005 2006 2007 2008 2009 2010
Entrepreneurs Parents Church of Uganda Catholic Other Islamic Gov't Seventh Day Adventist
bodies without any control from government.
As can be seen from figure 20, foundation bodies comprise largely entrepreneurs,
parents (the case of community schools), churches and less of government. Some quick
observations can be made about the figure: first, entrepreneurs are the largest providers of
secondary education more so after the USE Policy; secondly, parents and the main stream
churches i.e. Church of Uganda (Anglican) and the Catholic church have also played a big
role in provision of secondary education; finally, the role of government in starting its own
schools has remained minimal over the entire decade.
Figure 20 : Evolution of Secondary schools by Foundation Body from 2000 to 2010
Source: Constructed using raw data from Ministry of Education and Sports
One conclusion that can be drawn from this figure is that supply of education is more
of a preoccupation of the parents through the community schools and contributions to build
and sustain the private schools and less of government’s concern. While this is in
contravention of the provisions of Section 4(2) of the 2008 Education Act, one would
wonder, how government will fully and equitably implement the universal education policy if
it has very little control over the provision of schools.

120
9 9 9 10 10 11 10 9 9 9 10
32 29 3133 34 32 36 37
3431 31
59 62 60 57 56 5754 54
5760 59
0%
10%
20%
30%
40%
50%
60%
70%
80%
90%
100%
2000 2001 2002 2003 2004 2005 2006 2007 2008 2009 2010
Day School
Partly Boarding
Full Boarding
It should be remembered that since these foundation bodies are in charge of the
management of the schools, they often fix charges like PTA and boarding fees for the
“smooth running” of the schools and that all these are borne by parents. This may diminish
chances of accessing secondary schooling by children from disadvantaged backgrounds.
3.11.2 Secondary schools by boarding type
Due to insufficiency in the number and distribution of secondary schools, boarding
schools have emerged to accommodate children whose homes are distant from secondary
schools. This has a bearing on access and equity as both the Education Policy Review
Commission (MoES, 1989) and Government White paper (MoES, 1992) stipulate in
Recommendation 34 and 53, for primary and secondary respectively, that where boarding
facilities are provided; they should be funded entirely by parents or beneficiaries.
Figure 21: Evolution of Secondary Schools by boarding type between 2000 and 2010
Source: Constructed using raw data from Ministry of Education and Sports

121
The Ministry of education categorizes schools by boarding type into full boarding,
partly boarding and day schools. Overall, there are more day schools, followed by partly
boarding schools and less of full boarding schools in the country. Partly boarding schools
increased between 2001 and 2006 as most school owners realized that good performance
was associated with boarding and so introduced boarding sections in their hitherto day
schools. The increase in day schools was more dramatic after 2007 with government building
several seed5 schools that were necessarily day schools since government policy is that all
schools should be day.
While boarding schools are few, it should be noted that they are both expensive and
highly preferred by most parents as their performance is on average better than that of day
schools. This is corroborated by field findings:
“ I think not that all parents can afford because a boarding school is very expensive.
I see from my counterparts whose children are walking from home, they are paying
a half of what I am paying in boarding. For example, in Intensive Academy, am
paying 400,000/= (121€) per term while my counterparts in the day section are
paying 200,000/= (61€), so boarding is very expensive” (Male, Graduate, Senior
Government Official in Gulu district.)
Another respondent added in support of boarding schools:-
“………………So what am saying is that many parents like boarding schools because when you go to many boarding schools around, you will find a much bigger
population compared to the day schools”. (Male Graduate Head teacher of a rural mixed day Government School)
3.11.3 Secondary schools by number, boarding type and region
While in the previous section evolution of schools by number and type is looked at
the national level, there exists differentials in demand for education at regional level and this
could partly be explained by spatial differentials in supply. The supply of schools (to be
looked at shortly), their location and boarding type have a bearing on demand for schooling.
5 Seed schools were built by Government in sub-counties with no secondary school. This was equated to planting the seed for education in areas that were in great need.

122
As can be seen in figure 22, there are, by far, more secondary schools in the Central
region (where the capital is) than anywhere else. This is followed by the West, the East and
lastly the North. Interestingly, these variations have persisted even after the 2007 Policy.
This pattern of performance in terms of supply of education is corroborated by
corresponding patterns of demand whereby the Central had the highest NER while the north
had the lowest (UBOS and ICF International Inc, 2012).
Relying on the number of schools in a region to measure supply may not be adequate
for (i) the number of schools in an area may be determined by the target population to be
served, (ii) meaningful access may depend on the quality, ownership and geographical
distribution of schools in the region, and (iii) there may be few schools but with many
streams.
Because of the above reasons and given the data got from the Ministry of education
and Sports, this study was able to look at the hypothetical Student Classroom ratios by
examining the target population (that ought to be served) and the streams in a region and this
is done before and after the USE initiative. The hypothetical ratios are computed as per table
6 and presented in figure 22 together with the number of schools per region as already seen.
Table 6: Evolution of Hypothetical Student Classroom Ratios by Region
Region Population (13-16 Yrs) Streams 6Student Classroom Ratio
2006 2008 2010 2006 2008 2010 2006 2008 2010
Central
792,530
825,580
851,240
6,319
7,784
8,754
125
106
97
West
727,320
757,880
781,440
4,247
6,593
6,373
171
115
122
North
588,240
631,720
671,330
2,057
2,431
2,861
286
260
234
East
604,130
636,420
662,960
3,885
4,690
6,053
155
136
110
Source: Derived from raw data by The Ministry of Education and Sports
6 This is hypothetical taking in the numerator the population aged 13-16 in a region and dividing it by the available streams for the first cycle of secondary education(S1-S4) in that region. It is hypothetical because the population figures are projections that are subject to error since the last census was conducted in 2002. Besides interregional migrations for schooling purposes may not be taken into consideration. It also does not consider the spread of schools, the quality of education and school ownership that may have implications for meaningful access.
123
Supply of secondary education from the perspective of the hypothetical student
classroom ratio does not significantly depart from the findings on regional supply of schools.
If all children aged 13-16, i.e. those supposed to enroll at the ordinary level of secondary
education were to do so, then inadequacy of classrooms would mostly be felt in the North,
West, East and Central in that order. In 2008 though, the West seems to have done better than
the East but this is again reversed in 2010. The apparent discrepancy could be due to non-
response from private school owners especially in the West.

124
Figure 22 : Secondary Schools and Student Classroom ratio (SCR) by Region in 2006 and 2010
Source: Drawn using EMIS Data on Schools and Student Classroom ratios as calculated in Table 6
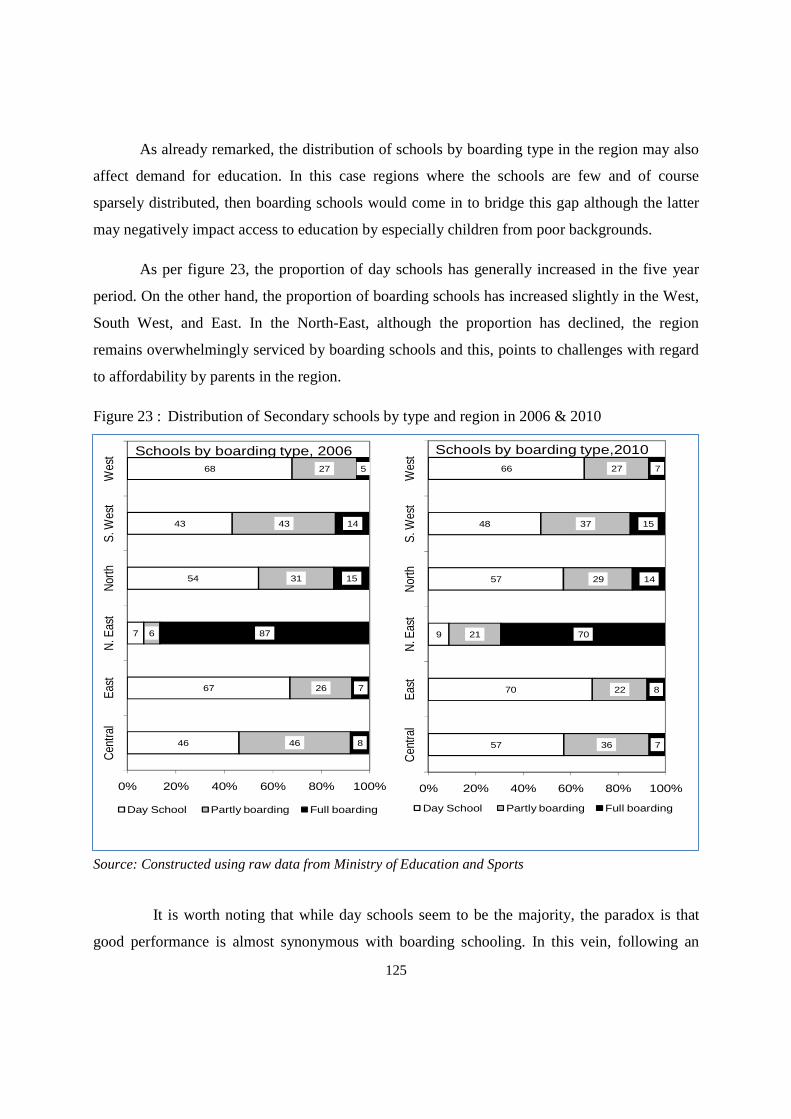
125
46
67
7
54
43
68
46
26
6
31
43
27
8
7
87
15
14
5
0% 20% 40% 60% 80% 100%
Cen
tral
East
N. E
ast
Nor
thS.
Wes
tW
est Schools by boarding type, 2006
Day School Partly boarding Full boarding
57
70
9
57
48
66
36
22
21
29
37
27
7
8
70
14
15
7
0% 20% 40% 60% 80% 100%
Cen
tral
East
N. E
ast
Nor
thS.
Wes
tW
est Schools by boarding type,2010
Day School Partly boarding Full boarding
As already remarked, the distribution of schools by boarding type in the region may also
affect demand for education. In this case regions where the schools are few and of course
sparsely distributed, then boarding schools would come in to bridge this gap although the latter
may negatively impact access to education by especially children from poor backgrounds.
As per figure 23, the proportion of day schools has generally increased in the five year
period. On the other hand, the proportion of boarding schools has increased slightly in the West,
South West, and East. In the North-East, although the proportion has declined, the region
remains overwhelmingly serviced by boarding schools and this, points to challenges with regard
to affordability by parents in the region.
Figure 23 : Distribution of Secondary schools by type and region in 2006 & 2010
Source: Constructed using raw data from Ministry of Education and Sports
It is worth noting that while day schools seem to be the majority, the paradox is that
good performance is almost synonymous with boarding schooling. In this vein, following an

126
analysis of the 2012 Ordinary level results, the best 34 schools in the country were found to be
boarding schools (Talemwa, 2012). Performance was measured by the percentage of candidates
who passed in first grade for all the students that sat for the O-level Examination in the school.
The passing of policies, construction of schools and training as well as deployment of
teachers would only have meaning if they impacted enrolment. The implications would include
impacting positively on enrolments in absolute and relative terms. It is in this spirit that the
following section tackles trends in enrolments and enrolment rates at primary and secondary
overtime.
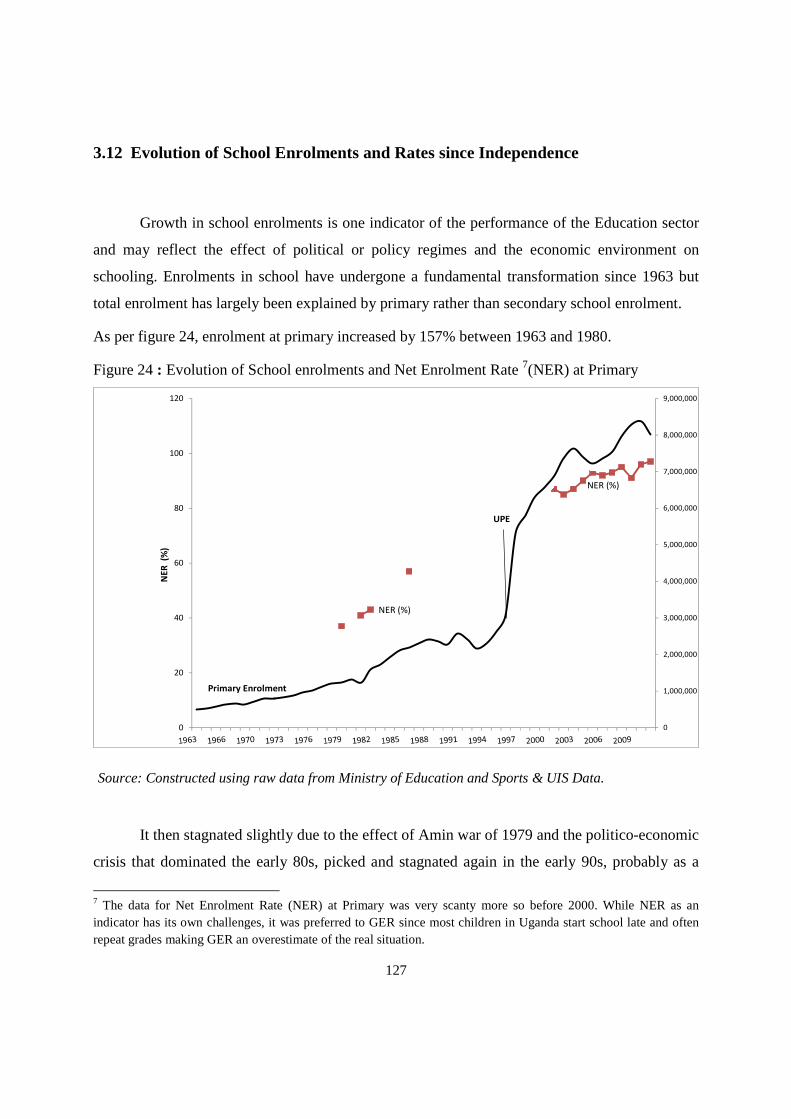
127
NER (%)
NER (%)
Primary Enrolment
0
1,000,000
2,000,000
3,000,000
4,000,000
5,000,000
6,000,000
7,000,000
8,000,000
9,000,000
0
20
40
60
80
100
120
NE
R
(%)
UPE
3.12 Evolution of School Enrolments and Rates since Independence
Growth in school enrolments is one indicator of the performance of the Education sector
and may reflect the effect of political or policy regimes and the economic environment on
schooling. Enrolments in school have undergone a fundamental transformation since 1963 but
total enrolment has largely been explained by primary rather than secondary school enrolment.
As per figure 24, enrolment at primary increased by 157% between 1963 and 1980.
Figure 24 : Evolution of School enrolments and Net Enrolment Rate 7(NER) at Primary
Source: Constructed using raw data from Ministry of Education and Sports & UIS Data.
It then stagnated slightly due to the effect of Amin war of 1979 and the politico-economic
crisis that dominated the early 80s, picked and stagnated again in the early 90s, probably as a
7 The data for Net Enrolment Rate (NER) at Primary was very scanty more so before 2000. While NER as an indicator has its own challenges, it was preferred to GER since most children in Uganda start school late and often repeat grades making GER an overestimate of the real situation.

128
NER (%)
NER (%)
Sec enrolment
-
200,000
400,000
600,000
800,000
1,000,000
1,200,000
1,400,000
0
2
4
6
8
10
12
14
16
18
Enro
lmen
t
NER
(%)
USE
result of the Structural Adjustment Programs. It increased by 73% between 1996 and 1997
following the implementation of the UPE policy, again fell around 2004 and picked after 2007,
when USE was introduced implying that universalizing secondary education was an impetus to
parents and children as it improved enrolments at the lower level. In the same vein, the NER at
primary that was below 50% before 1980 has averaged above 85% between 2000 and 2011.
At the secondary level, enrolments are generally lower in absolute terms and net
enrolment rates. As was the case with primary, following the announcement of universal
secondary education in 2006 and its implementation in 2007, secondary school enrolments
increased but this time by only 17%. This, points to the fact that successful universalization of
secondary education is a necessary corollary of a successful primary education system in terms
of quality of education and strategies to enhance retention.
As per figure 25, while enrolment in numbers has grown significantly over the period in
question, the proportion of children enrolled at secondary as a percentage of children of
secondary school age (13-18) in the population (NER) has exhibited modest growth from 4% in
1970 to 25% in 2011. The situation seems to be more worrying in the context of high population
growth rate in Uganda that makes every successive younger cohort larger than the previous one.
Figure 25: Evolution of School Enrolments and Net Enrolment Rate at Secondary
Source: Constructed using raw data from Ministry of Education and Sports and UIS Data

129
Growth in enrolments has not been equitable in many ways and with data from the
Ministry of Education; it was possible to map gender and regional variations in the growth
patterns as to be seen in the following sections.
3.12.1 Evolution of Inequalities by sex and region
Like supply of education was not uniform across regions, demand was equally varied by
region. In the same vein, not equal proportions of boys and girls were able to enroll at the
different levels overtime. These differentiated trends in demand for education are discussed in
detail hereunder.
3.12.2 Growth in gender equity in education at various levels
As already observed, most policies targeting education endeavored to address inequities
in access among which was gender. This notwithstanding, it is evident from figure 26 that there
were more males enrolled at primary, then ordinary level (the first four-year cycle of secondary
education) than at the advanced level (second two-year cycle of secondary education) for
inequities in access to education tend to be exacerbated, as one goes up the education ladder
(Majgaard & Mingat, 2012; Pilon, 2004). This is can be explained generally, by high attrition
within the cycle and at different transition stages (Mare, 1980), but more particularly, teenage
pregnancy, early marriages and increased household demand for female labor in the largely
patrilineal communities (Ministry of Education and Sports, 1989) as well as higher direct costs
of schooling for girls (Majgaard & Mingat, 2012), that tend to worsen as girls grow older
(Govinda & Bandyopadhyay, 2010; Lewin, 2009). While the proportion of females enrolled at
primary was better and improved faster over the years, the percentage of females enrolled at
ordinary level (first four years of secondary school) has oscillated between 24% and 30% from
1967 to 1980, 31-40% between 1981 and 1995 and 42 to 47% between 1996 and 2010.
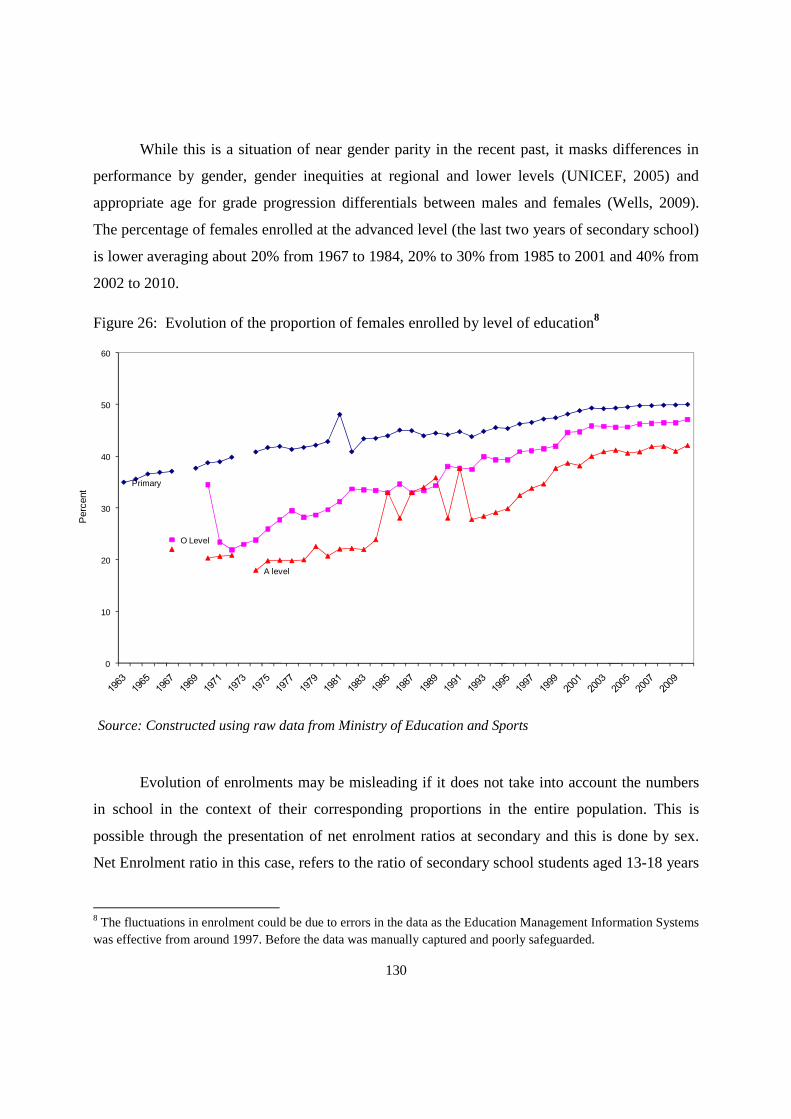
130
Primary
O Level
A level
0
10
20
30
40
50
60
Per
cent
While this is a situation of near gender parity in the recent past, it masks differences in
performance by gender, gender inequities at regional and lower levels (UNICEF, 2005) and
appropriate age for grade progression differentials between males and females (Wells, 2009).
The percentage of females enrolled at the advanced level (the last two years of secondary school)
is lower averaging about 20% from 1967 to 1984, 20% to 30% from 1985 to 2001 and 40% from
2002 to 2010.
Figure 26: Evolution of the proportion of females enrolled by level of education8
Source: Constructed using raw data from Ministry of Education and Sports
Evolution of enrolments may be misleading if it does not take into account the numbers
in school in the context of their corresponding proportions in the entire population. This is
possible through the presentation of net enrolment ratios at secondary and this is done by sex.
Net Enrolment ratio in this case, refers to the ratio of secondary school students aged 13-18 years
8 The fluctuations in enrolment could be due to errors in the data as the Education Management Information Systems was effective from around 1997. Before the data was manually captured and poorly safeguarded.
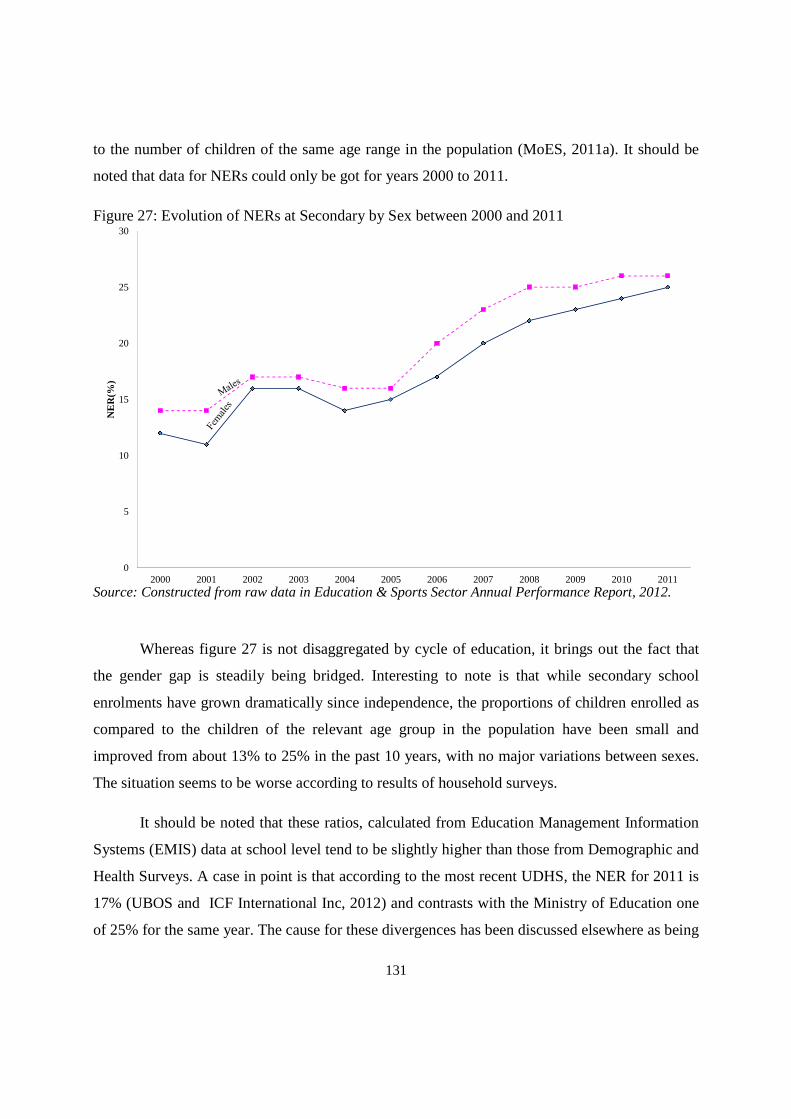
131
0
5
10
15
20
25
30
2000 2001 2002 2003 2004 2005 2006 2007 2008 2009 2010 2011
NE
R(%
)
to the number of children of the same age range in the population (MoES, 2011a). It should be
noted that data for NERs could only be got for years 2000 to 2011.
Figure 27: Evolution of NERs at Secondary by Sex between 2000 and 2011
Source: Constructed from raw data in Education & Sports Sector Annual Performance Report, 2012.
Whereas figure 27 is not disaggregated by cycle of education, it brings out the fact that
the gender gap is steadily being bridged. Interesting to note is that while secondary school
enrolments have grown dramatically since independence, the proportions of children enrolled as
compared to the children of the relevant age group in the population have been small and
improved from about 13% to 25% in the past 10 years, with no major variations between sexes.
The situation seems to be worse according to results of household surveys.
It should be noted that these ratios, calculated from Education Management Information
Systems (EMIS) data at school level tend to be slightly higher than those from Demographic and
Health Surveys. A case in point is that according to the most recent UDHS, the NER for 2011 is
17% (UBOS and ICF International Inc, 2012) and contrasts with the Ministry of Education one
of 25% for the same year. The cause for these divergences has been discussed elsewhere as being

132
related to estimation errors in the denominator given that censuses are held at relatively long
intervals, the time of holding the survey, the definition of school attendance (the case of Koranic
schools) and sampling related errors (Gérald & Pilon, 2005). In the case of Uganda, the time of
holding the survey does not apply because the statistics bureau includes among children,
“currently attending school” those out of school on holidays, vacation, and due to sickness or to
temporary closure of school. In addition, children in boarding school are considered as regular
members (and considered to be schooling), i.e. members that were living in a household for more
than 6 months in the preceding 12 months but were away for education purposes at survey time
(UBOS, 2009). While these other reasons cannot be underestimated, the more plausible
explanation for higher EMIS rates is the inflation of enrolments by head teachers (De Kemp &
Eilor, 2008) as these numbers are the basis on which government gives capitation grants to
schools.
3.12.3 Evolution of Enrolment Rates by region at Secondary
Like the growth in enrolments has not been so equitable in terms of gender, so hasn’t it
been in terms of region. In this case, like the supply of schools varied at regional level, the
demand, denoted by Net enrolment rates was also varied.
Looking at figure 28, it is evident that more children in the age group 13-18 were
enrolled in school in 2010 than in 2006. Increase in enrolments was registered more in the
Central and Eastern regions than in the North. Last and most importantly, there seems to be a
strong correlation between the supply of schools in a region as per figure 22 and demand
(denoted by NER) for secondary education as per figure 28. It would thus not be out of place to
deduce that low demand for secondary schooling is constrained by, inter alia, challenges of
supply as noted elsewhere (Lange & Pilon, 2009; Oketch & Rolleston, 2007) and that regional
differentials in demand are exacerbated by limited supply in some regions.

133
NER
0
5
10
15
20
25
30
-
500,000
1,000,000
1,500,000
2,000,000
2,500,000
3,000,000
3,500,000
4,000,000
2000 2001 2002 2003 2004 2005 2006 2007 2008 2009 2010
NER
(%)
Elig
ible
Chi
ldre
n ou
t of
Sec
onda
ry (N
)
26%
19%
11%
17%
33%
28%
13%
23%
0%
5%
10%
15%
20%
25%
30%
35%
Central East North West
NERs
2006 2010
Figure 28: Evolution of Net Enrolment Rates at Secondary between 2006 and 2010
Source: Constructed using raw data from Ministry of Education and Sports
In a nutshell, it looks like the number of children enrolled at secondary has grown
significantly although secondary schooling has failed to embrace a significant proportion of the
eligible age group as evidenced by slowly rising but low net enrolment rates overtime. In the
context of bourgeoning school populations rooted in high fertility and hence high population
growth rates, the situation is often worse (Rolleston, 2009) than portrayed as can be seen in
figure 29.
Figure 29: Evolution of NER and Number of Children aged 13-18 out of Secondary
Source: Constructed using raw data from Ministry of Education and Sports
134
It should be noted that the intersection of these lines has no meaning as the two variables
are measured at different scales. As can be seen and has been found elsewhere in Sub-Saharan
(Charbit & Kébé, 2006, 2010; UNESCO, 2011), an increase in enrolment rates has not precluded
an increase in the number of eligible (13-18 years) children out of school (secondary in this
case). While this may be related to estimation errors of the population (denominator in the
computations) at a given time, it may largely be explained by the high population growth rate of
Uganda’s population. In conclusion therefore, while the presented rates may be higher than the
situation on the ground as evidenced by rates according to DHS, they also underestimate the
situation of retention in school or access to secondary school in absolute terms.
3.13 Emerging issues on Education Policy, Supply and Demand since Independence
As can be seen, Uganda has not been deficient of policy since independence and the
policies have come up after thorough research by competent bodies and adequate consultations
with stakeholders. They have also been followed, albeit late, by legal texts to implement their
recommendations.
The Report of the Castle Commission of 1963 dictated all policy around education in the
first three decades of independence while the Government White Paper has been the
predominant policy guideline since 1992.
While most of these policies were not specific to a particular level of education, the
Report of the Castle Commission of 1963 emphasized secondary education in line with the
preoccupations of the International community and the worries of the newly independent
governments in Africa, namely “training manpower to step in the shoes of the colonialists”. This
is vindicated by dramatic increases in secondary school enrolments between in 1963 and 1980
that are higher than those at primary over the same period.
Political instability and economic uncertainty have largely been responsible for not
implementing the recommendations of most of the policies’ recommendations. As a result, while
most of the reports and policy documents pointed out: poor education quality, poor enrolments
135
and inequities in access to education by geographical region and by other household and
individual level characteristics, this problem, exacerbated at higher levels, seems to go
unresolved up to the present day.
The implementation of UPE by the president in 1997 in contravention of the wise
recommendations of the Education Policy review Commission partly explains why the policy has
largely not been successful in terms of retention of children in school and quality learning
outcomes and this continues to haunt the program to date.
One critical difference between the Education Sector Investment Plan and the Education
Sector Strategic Plan is that the latter shifts emphasis from only Universal Primary Education to
post primary and other subsectors in addition to the primary. It also looks at improving quality of
education i.e. what participants learn and how they learn it as opposed to the ESIP that
emphasized access (enrolment).
The current Education Sector Strategic Plan (2004-2015) seems to be an ambitious plan
that prescribes strong solutions to inequities in access and quality learning outcomes at all levels.
This study could feed into the plan as it may come up with the different types of the excluded
children at the individual, household and regional levels.
The 2008 Education Act is a novel development as it comes in to enforce the policies and
strategies at both the Primary and Secondary levels. It makes education compulsory and
prescribes punitive measures against parents that wouldn’t want to enroll their children in school
as well as school owners and administrators who would want to charge extra fees from the
pupils/ students under the free education system. The Extent to which this has been implemented
is yet another question and field findings show that almost all schools, including the Seed
schools, charged extra fees beyond what is prescribed by government.
The fact that founding bodies still exercise sizable control on schools and that costs of
boarding are met by parents as prescribed in the Government White Paper (R34ii for primary and
R52 for secondary) and reiterated in the USE Policy document, has made the otherwise public
schools (teachers paid by government, supervision done by government and school facilitation
grants provided by government and partners) inaccessible to most students as the costs for
136
boarding are so high as compared to tuition that is often set by government. This, compounded
by the fact that selection into the old prestigious government schools is so eliminative and in
favor of children that have attended largely private primary schools, leaves the prestigious,
otherwise “government” schools as an exclusive prerogative of children for largely the privileged
urban elite.
While boarding schools constitute about 10% of all the schools in the country, they are
paradoxically the best schools as the top 34 schools in the 2012 Uganda Certificate of Education
(UCE) exams were all boarding schools. It thus implies that good performance is a preserve of
the middle class while the majority of children are enrolled in schools that perform averagely.
How then will redistribution of wealth be achieved and how will children from disadvantaged
backgrounds harness the opportunity of social mobility?
Enrolments at primary and secondary have grown significantly since independence
although the growth was more pronounced at primary than at secondary. This growth has not
been uniform in many aspects but with the help of the Ministry of Education data, it was possible
to track the growth by gender and region.
While with regard to gender, the gaps that are exacerbated at the secondary level in
disfavor of females are slowly being narrowed, regional inequities seem to be rooted in, inter
alia, inequities in supply of education.
Whereas in terms of numbers, enrolments have grown over time, secondary education has
failed to embrace about three quarters of the eligible age group to date. Against the backdrop of
ever increasing populations rooted in high total fertility rates, there were more eligible children
out of secondary school in 2010 than there were ten years earlier although the net enrolment rate
at secondary seems to have doubled over the same period.
With the Ministry data, it was possible to look at issues of supply of and demand for
education but at a macro level. Besides, while supply of schools is important, the decision to take
children to school and keep them there is more explained by demand (Bennell, 2002; Sabates,
Hossain, & Lewin, 2013) that can be measured at the household level. A vivid example is that
despite the education universalizing initiatives everywhere is Sub-Saharan Africa, about 10% or
137
even more (in most of francophone West Africa) of eligible children are still not enrolled in
school. Even for the many who enroll, there are factors at the household level that dictate the
children that continue and those that drop out and on the basis of literature reviewed; this pattern
seems to be so consistent that it cannot be haphazard. In addition, different types of households,
in different regions may enroll different kinds of children at various levels of education and this
can be studied by looking at the factors that may be at community but most importantly
household and individual levels.
It is in this spirit that this study endeavors to understand the factors at the individual,
household and community levels that are associated with access to secondary schooling and how
these have evolved after universal secondary education as to be seen in the next chapter.

138

139
CHAPTER FOUR : EDUCATIONAL ATTAINMENT BY BACKGROUND CHARACTERISTICS OF INDIVIDUALS AGED 13-24 YEARS.
This chapter is largely exploratory. It endeavors to explore the relationship between
educational attainment of the household population aged 13-24 and other factors that have been
found to explain educational outcomes on the basis of the literature studied. This is done
concurrently for 2006 and 2010 to establish patterns over the five year period. In this chapter,
contingency tables, known as cross tabulations shall be run to try and establish if the distribution
of observations across columns and rows follows a certain discernible pattern.
The need to establish patterns between variables aims to establish the existence of
associations or relationships between educational attainment and each of the other hypothesized
explanatory factors. While this can be observed with a naked eye if it is obvious, statistical
methods like the Pearson Chi Square test have been used both to confirm the existence or non-
existence of a statistically significant relationship and or measure the strength of the relationship.
Because univariate analysis is not presented in this thesis, this level of analysis also
serves to understand the variables better, this in itself being critical prior to the multivariate
analysis to be carried out in the subsequent chapters.
At this level, the main variable of interest is educational attainment of the household
population aged 13-24 years and this has been found to be influenced by other factors or
characteristics that can be categorized as individual characteristics which comprise age, sex and
relationship of a household member to the household head, household level characteristics that
include age, sex, marital status and education of household head, presence/absence and or
survival status of natural father, presence/absence and or survival status of natural mother,
household wealth status, main source of income for the household, household size, proportion of
the under-fives and proportion of the old (aged 60+) in these households. In addition, educational
attainment can be determined by community level factors that include place (rural-urban) and
region of residence that are often used to measure the extent of supply of education.
140
While this study is largely interested in access to secondary education, it would appear
prudent to understand the detailed education status of the population under study by age as the
latter is a very important explanatory factor for educational outcomes. It should be remembered
that if any child aged between 13 and 24 was picked at random, he/she would belong to any of
the following educational outcomes: He/ She (i) would never have enrolled in school, (ii) would
have dropped out of primary, (iii) would have completed primary but not made a transition to
secondary, (iv) would have dropped out of secondary, (v) would still be enrolled at primary, (vi)
would be enrolled at secondary, (vii) would have completed secondary and failed to enroll
anywhere else, (viii) would be enrolled at a post-secondary institution (e.g. a teacher training
college, nursing school, university for the few that enroll and complete early) and finally (ix)
would have completed studies at a post-secondary institution (e.g. a teacher training college ,
nursing school, university for the few that enroll and complete early).
The first four scenarios correspond to those in the CREATE framework on zones of
exclusion with regard to educational outcomes (Lewin, 2007c) and resonate with Mares’ logic
(Mare, 1980) where transition between stages were found to be points of highest attrition. It is
therefore logical to understand where dropouts are highest, over and above looking at access to
secondary, to inform policy where most efforts need to be put in order to enhance access to
secondary schooling.
In line with the objectives of this study, the nature of the dataset, the number of
observations in question and the type of questions found in the questionnaires used, the
educational outcomes of household members aged 13-24 were generally categorized as (i) never
enrolled in school, (ii) dropped out of primary, (iii) completed the last grade of primary, (iv) left
at secondary, (iv) completed their education carrier at an institution (teachers’ college, nursing
school etc.), (v) are still enrolled at primary and, (vi) are enrolled at secondary and above.
These categorizations are illustrated in figure 30 and done by age of the household members for
the population under study.
On looking at the figure closely, one may make the following remarks: first ; there were
more household members aged 13-24 that had never been to school in 2010 than in 2006 and
illiteracy tended to decline with age; secondly, universalization of secondary education has failed

141
to eclipse dropouts at primary; thirdly, there is a sizable proportion of children of secondary
school age that are still at primary although this declines with age and fourthly, the proportion of
children “currently attending” secondary and above increases with age at a declining rate and
seems not to have significantly changed over the five year period.
The first observation is corroborated by findings of the Uganda National Household
Survey Report where the proportion of children (6-24) that had never been to school had
increased from 6.2% in 2006 to 9.8% in 2010 and the proportion of children attending school as
at survey time had slightly declined from 73.3% in 2006 to 69% five years later (UBOS, 2010b).
Most of the household members of secondary school age were still at primary and this
may be due to late enrolment and repetitions that are prevalent in most of Sub-Saharan Africa
(Lewin & Sabates, 2012) in general and Uganda, in this particular case (Wells, 2009; Ministry
of Education and Sports, 2010). Late enrolment is a precursor for dropouts because as children
get older, there is increased demand for their labor and additionally, old age for grade is strongly
negatively correlated with achievement (Wamala, Omala, & Jjemba, 2013). For the girls,
reaching puberty while in primary where they often walk long distances to school also
predisposes them to early pregnancies and early marriages.
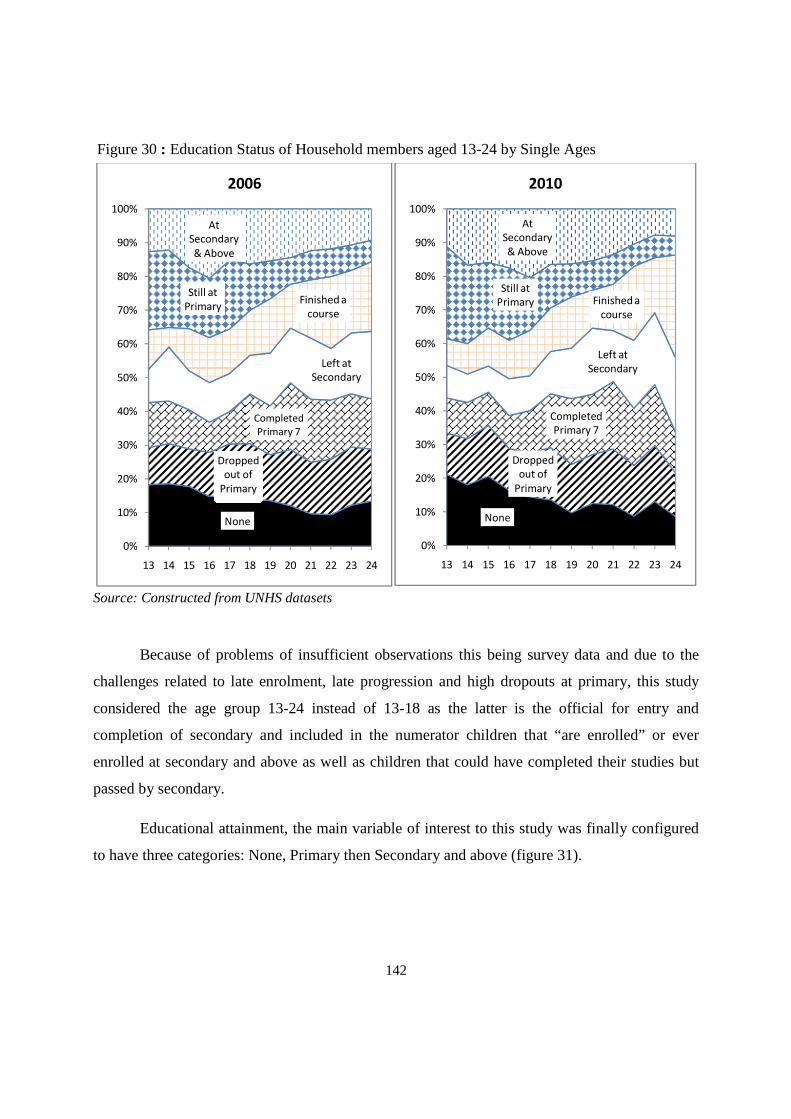
142
None
Dropped
out of
Primary
Completed
Primary 7
Left at
Secondary
Finished a
course
Still at
Primary
At
Secondary
& Above
0%
10%
20%
30%
40%
50%
60%
70%
80%
90%
100%
13 14 15 16 17 18 19 20 21 22 23 24
2006
None
Dropped
out of
Primary
Completed
Primary 7
Left at
Secondary
Finished a
course
Still at
Primary
At
Secondary
& Above
0%
10%
20%
30%
40%
50%
60%
70%
80%
90%
100%
13 14 15 16 17 18 19 20 21 22 23 24
2010
Figure 30 : Education Status of Household members aged 13-24 by Single Ages
Source: Constructed from UNHS datasets
Because of problems of insufficient observations this being survey data and due to the
challenges related to late enrolment, late progression and high dropouts at primary, this study
considered the age group 13-24 instead of 13-18 as the latter is the official for entry and
completion of secondary and included in the numerator children that “are enrolled” or ever
enrolled at secondary and above as well as children that could have completed their studies but
passed by secondary.
Educational attainment, the main variable of interest to this study was finally configured
to have three categories: None, Primary then Secondary and above (figure 31).

143
12
64
24
14
60
26
0
10
20
30
40
50
60
70
None Primary Secondary & Above
%
2006 2010
Figure 31 : Educational attainment for household members aged 13-24 in 2006 and 2010
Source: Constructed from Uganda National Household Survey Datasets
It is clear from figure 31 that the proportion of children that “are enrolled” or ever
enrolled at secondary, registered a modest growth as observed before (Ssewanyana, Okoboi, &
Kasirye, 2011). It increased from 24% to 26%, thereby registering a growth of 2 percent points
over the five year period. Again, to reecho the concern observed in figure 30, there were more
children that had never been to school in 2010 than 5 years earlier.
Subsequent sections look at the distribution of the household population under study (13-
24) by educational attainment and by individual, household and community level characteristics.
In line with the guidelines on the use of Household Survey and Census data to study
determinants of educational outcomes, this study presented the findings according to the
characteristics /factors related to the household member (individual), the household head, other
household members, the household itself and the community (CEPED, UEPA, & UNESCO,
1999; UIS et al., 2004).

144
4.1 Individual Characteristics and Educational Attainment
In this subsection, the interactions between individual factors like age, sex and
relationship of the individual to the household head and educational attainment are explored.
Table 7: Distribution of Members by Educational Attainment and by Individual Characteristics
2006 2010
Educational Attainment Educational Attainment
Individual
Characteristics
None
(%9)
Prim.
(%)
Sec. &+
(%)
N P value None
(%)
Prim
(%)
Sec. &+
(%)
N P value
Age 7495 0.000 7940 0.000
13-18 13 66 21 4448 16 63 21 4695
19-24 11 61 28 3047 12 55 33 3245
Sex 7495 0.020 7940 0.430
Male 12 65 23 3634 14 61 25 3727
Female 12 63 25 3861 14 59 27 4213
Relationship to head 7495 0.000 7940 0.000
Own Child 13 64 23 4012 15 62 23 4383
Other Relative 11 64 25 3247 13 57 30 3344
Non Relative 8 56 36 237 16 44 40 214
Proportion (%) 12 64 24 7495 14 60 26 7940
Prim= Primary, Sec & += Secondary and Above.
9 For all the tables in this chapter, we consider row percentages that add up to 100%.

145
4.1.1 Age of Child
Age that was originally captured as a continuous variable was categorized into two age
groups i.e. 13-18, that corresponds to the official age bracket for secondary school attendance
and 19-24, that is ideally the age slab for post-secondary schooling. Age and educational
attainment were found to be strongly statistically related (p =0.000) in both 2006 and 2010. As
previously stated, about two thirds of children aged 13-18 and therefore supposed to be in
secondary were still in primary or had primary level of education in 2006 and five years later.
This phenomenon is so serious that it extends to older children aged 19-24. The older the
population under study was, the more it was likely to have accessed some secondary education.
It should be noted (as seen in figure 30) that educational attainment increases with age at a
decreasing rate as children who enroll much later and or progress more slowly tend to drop out
of the school system.
4.1.2 Sex of Child
Generally, the sex of a child seems not to guarantee him or her any advantage or
disadvantage with regard to educational outcomes. In this vein, the proportions of females and
males that ever enrolled at secondary or never attended school do not seem to vary significantly
in 2006 and 2010. This is corroborated by findings that the gender gap in schooling in Uganda
has been greatly diminished (UBOS and ICF International Inc, 2012; Wells, 2009) although not
necessarily eliminated more so at lower geographical levels, among ethnic minorities and other
socio-economic groups.

146
4.1.3 Relationship to the Household Head
In the context of increased demand for schooling and insufficient supply of schools ,
parents have had to place their children in households of their “friends” and or “relatives” for
them to be able to access school within the vicinity of the receiving households (Pilon, 2005).
While the motives of sending children to other households may vary, some studies have
found an ambivalent relationship between “fostered children” and schooling outcomes. This
relationship has been found to be moderated by, inter alia , place of residence, the motive for
sending the child as well as the relationship between the sending and receiving households
(Pilon, 2005,1995).
Non-relatives and then other relatives were more likely to have accessed secondary
education than the children of the household head. Additionally, the proportions of the household
population aged 13-24 that had never been to school seem not to vary significantly across the
three categories. Apparently at this level, “fostered” members seem to be doing better with
regard to accessing secondary education than those of the household head and this reinforces the
argument of the ambivalence between child fostering and schooling outcomes.
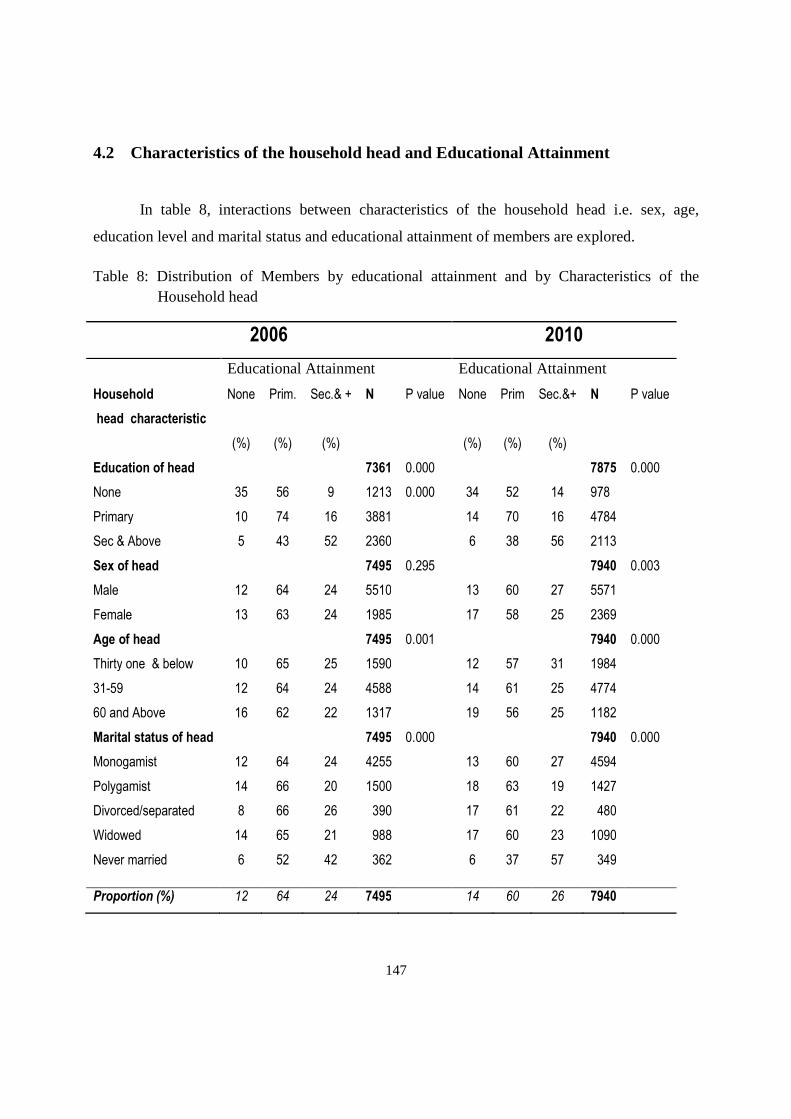
147
4.2 Characteristics of the household head and Educational Attainment
In table 8, interactions between characteristics of the household head i.e. sex, age,
education level and marital status and educational attainment of members are explored.
Table 8: Distribution of Members by educational attainment and by Characteristics of the Household head
2006 2010
Educational Attainment Educational Attainment
Household
head characteristic
None
(%)
Prim.
(%)
Sec.& +
(%)
N P value None
(%)
Prim
(%)
Sec.&+
(%)
N P value
Education of head 7361 0.000 7875 0.000
None 35 56 9 1213 0.000 34 52 14 978
Primary 10 74 16 3881 14 70 16 4784
Sec & Above 5 43 52 2360 6 38 56 2113
Sex of head 7495 0.295 7940 0.003
Male 12 64 24 5510 13 60 27 5571
Female 13 63 24 1985 17 58 25 2369
Age of head 7495 0.001 7940 0.000
Thirty one & below 10 65 25 1590 12 57 31 1984
31-59 12 64 24 4588 14 61 25 4774
60 and Above 16 62 22 1317 19 56 25 1182
Marital status of head 7495 0.000 7940 0.000
Monogamist 12 64 24 4255 13 60 27 4594
Polygamist 14 66 20 1500 18 63 19 1427
Divorced/separated 8 66 26 390 17 61 22 480
Widowed 14 65 21 988 17 60 23 1090
Never married 6 52 42 362 6 37 57 349
Proportion (%) 12 64 24 7495 14 60 26 7940

148
4.2.1 Education of household head
Education level of the household head was captured on the basis of the highest grade
completed/attained (UBOS, 2009). In this study, the categories of “Secondary” and “Higher”
were collapsed to make one category renamed “Secondary and above” as observations in the
category “Higher” were relatively few.
Education of the household head and children’s educational attainment were found to be
strongly associated before and after the introduction of Universal Secondary Education
(p=0.000). Indeed the proportion of children that had never been to school decreased with an
increase in education level of the household head. In the same vein, the proportion of children
that ever enrolled at secondary and above, increased proportionately with the education level of
the household head and this seems to be stronger in 2010, than five years earlier. While this may
be confirmed at the subsequent level of analysis, it seems to point to intergenerational recycling
of educational opportunities or curses to the detriment of first “generation students”.
4.2.2 Sex of household head
While traditionally, it was believed that household members under female heads were
relatively more disadvantaged than those under male heads, an increasing body of literature
seems to point to the contrary especially with regard to children’s’ educational attainment
(Kabore et al., 2003; Lloyd & Blanc, 1996; Pilon, 2005,1995; Rolleston, 2009; Wayack-Pambè
& Pilon, 2011).
In 2006, the sex of the household head seems not to guarantee any advantage or
disadvantage with regard to children’s schooling outcomes (p=0.295). Indeed, both the
proportion of children that had never been to school and ever enrolled at secondary and above
appeared to be generally similar, the sex of the household head, notwithstanding. In 2010,
children under male heads were found to be at an advantage with regard to educational
attainment (p=0.000) as there were more children that had never been to school and slightly less

149
0
10
20
30
40
50
60
70
80
90
100
2006 2010 2006 2010 2006 2010
Own Child Other Relative Non-Relative
%
Less than 30 31-59 60+
children that ever attended secondary school under female heads than under their male
counterparts. This seems to contradict the body of literature as seen but may be confirmed at the
multivariate level.
4.2.3 Age of household head
Results from univariate analysis (see Annex 1) show that household heads were largely,
though not exclusively, parents (fathers or mothers). Data on the age of the household head was
captured as a continuous variable although in this study it was categorized as; “thirty and below”,
“31-59” and “sixty and above”.
Age of the household head and children’s educational attainment were found to be
strongly related in 2006 and five years later. In both situations, the proportion of children that
had never been to school increased with the age of the head. In the same logic, the proportion of
children that ever enrolled at “secondary and above” decreased with an increase in age of the
household head. Could this be related to the role of elder children in staying with and educating
their younger siblings? Indeed, as figure 32 shows, most of the other relatives among members
in our cohort of interest (13-24) were surveyed under heads aged below 30. Important to note is
that a good proportion of “other relatives” was surveyed in households headed by old people.
Figure 32 : Relationship to household head by age of head in 2006 and 2010
150
4.2.4 Marital Status of household head
These surveys captured the variable on marital status as married monogamously, married
polygamously, divorced/separated, widow/widower and never married. The distinction between
polygamous and monogamous marriage arrangements seems to be of great interest to this study
as polygamy has been found to impact children’s schooling opportunities (Buchmann, 2000;
Kobiané, 2006).
Marital status of the household head and children’s educational attainment were found to
be strongly related (p=0.000). In line with what was observed in the previous section, the
proportion of children that ever attended secondary was highest in households whose heads were
never married. In the same logic, it is in these households where children under study manifested
with the lowest levels of illiteracy. Further analysis reveals that 24% of brothers and sisters were
indeed staying with unmarried household heads. These heads had mainly secondary and above
level of education (54%) and were largely rural based (64%). This implies that older brothers or
sisters help in staying with younger siblings and educating them. Children under polygamous
heads were found to be most disadvantaged with regard to both enrolment in school and access
to secondary education in 2006 and 2010.
4.3 Characteristics of other household members and Educational Attainment
These factors that have been hypothesized in this study and found to influence schooling
outcomes in other studies include the presence or absence and survival status of the father and or
the mother as well as household size and structure. The latter can be broken down into the
proportion of children under five and adults aged sixty years and above.
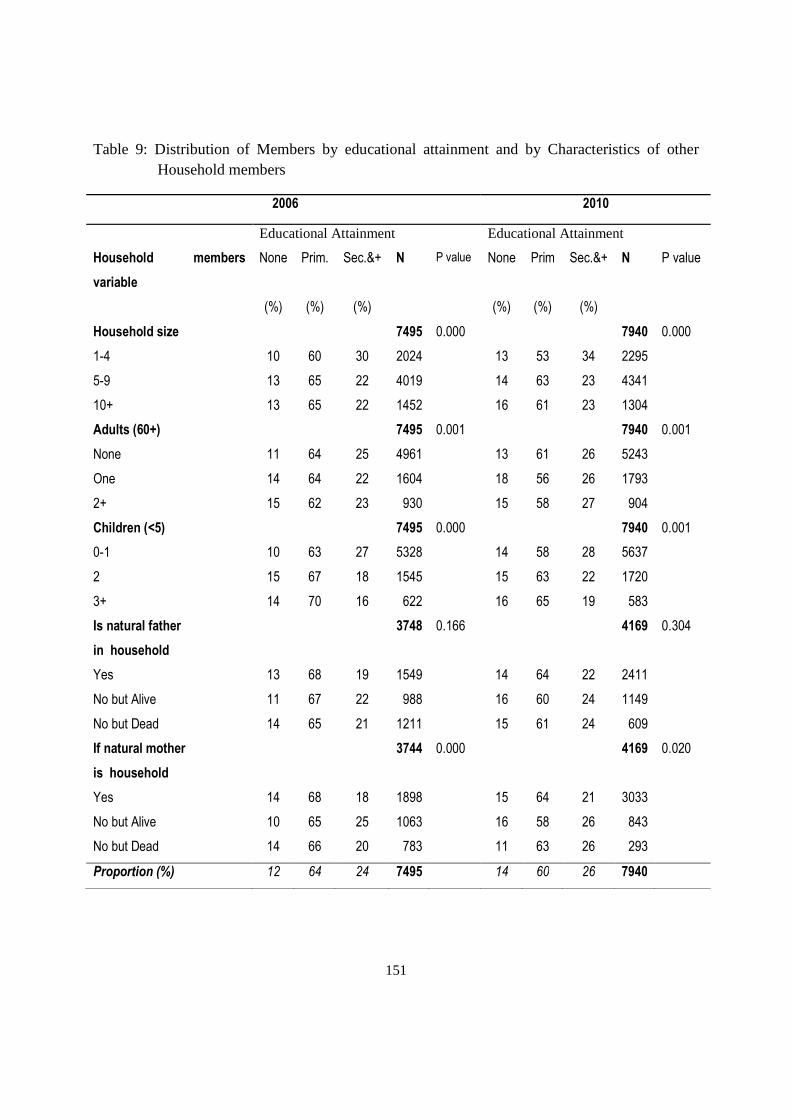
151
Table 9: Distribution of Members by educational attainment and by Characteristics of other Household members
2006 2010
Educational Attainment Educational Attainment
Household members
variable
None
(%)
Prim.
(%)
Sec.&+
(%)
N P value None
(%)
Prim
(%)
Sec.&+
(%)
N P value
Household size 7495 0.000 7940 0.000
1-4 10 60 30 2024 13 53 34 2295
5-9 13 65 22 4019 14 63 23 4341
10+ 13 65 22 1452 16 61 23 1304
Adults (60+) 7495 0.001 7940 0.001
None 11 64 25 4961 13 61 26 5243
One 14 64 22 1604 18 56 26 1793
2+ 15 62 23 930 15 58 27 904
Children (<5) 7495 0.000 7940 0.001
0-1 10 63 27 5328 14 58 28 5637
2 15 67 18 1545 15 63 22 1720
3+ 14 70 16 622 16 65 19 583
Is natural father
in household
3748 0.166 4169 0.304
Yes 13 68 19 1549 14 64 22 2411
No but Alive 11 67 22 988 16 60 24 1149
No but Dead 14 65 21 1211 15 61 24 609
If natural mother
is household
3744 0.000 4169 0.020
Yes 14 68 18 1898 15 64 21 3033
No but Alive 10 65 25 1063 16 58 26 843
No but Dead 14 66 20 783 11 63 26 293
Proportion (%) 12 64 24 7495 14 60 26 7940

152
4.3.1 Household size
Household size was captured as a continuous variable but in this study it was categorized
as seen in table 9. Household size has been found to influence schooling outcomes but this is
greatly moderated by other factors like place of residence and status of the household members
in relation to the household head (Kobiané, 2006; Wakam, 2003). Although not consistently, the
proportion of children that had never enrolled in school increased with household size. In
addition, the chances of enrolment at secondary reduced with household size. Could this be
pointing to the dilution of resources at the household level that may work in disfavor of bigger
households? At this stage it may be too early to conclude as other factors may have a role to
play.
4.3.2 Proportion of Older adults
The number of adults (aged 60+ or 65+) has been found to influence children’s
schooling outcomes and again, this has been found to depend on the sex of the adults and that of
the children in question, among other factors (Takahashi, 2011). The proportion of the children
that never enrolled in school increased with the proportion of the old people, though not
consistently. While in 2006 the chances of enrolment at secondary reduced with an increase in
the proportion of the old people, they manifested a slight increase in 2010 thereby presenting
ambivalent interactions between the two variables, overall.
4.3.3 Proportion of children under five
In some studies, the proportion of the under-fives in a household has been used to
estimate the extent of child overwork/labor as an increase in the number of these children may
imply older children being obliged to take care of the young ones that may in turn have far
reaching implications for, inter alia, children’s education. While the chances of being illiterate
increased with the proportion of the under-fives, the probability of secondary school enrolment
was consistently negatively related with the proportion of the under-fives.

153
4.3.4 Presence of natural father in household
With regard to the presence/absence or survival status of parents, data was collected from
different groups of individuals. While in the 2005/6 survey, this data was collected from all
household members (UBOS, 2006), in 2009/10, it was collected from only those members below
18 (UBOS, 2010b). For easier comparison, this study created variables on the presence/absence
or survival status of parents in 2006 for only household members below the age of 18.
The relationship between the presence and or survival status of the father and educational
attainment was insignificant in 2006 and 2010. Both the proportions of children that never
enrolled and ever accessed secondary schooling were found not to vary significantly across
categories. It also seems to appear that children with fathers in the households were more at a
disadvantage compared to the other categories of children.
4.3.5 Presence of natural mother in household
Children whose mothers were living outside the surveyed households were more likely to
access secondary education than those whose mothers were in the households or dead, although
this exhibits inconstancies over the five year period. While the proportion of children that never
went to school in 2006 was highest for maternal orphans and present mothers, this was neither
true nor consistent in 2010. Maternal orphans and children whose mothers weren’t in the
households were found to be at an advantage with regard to secondary schooling in 2010. This
probably points to other societal mechanisms to help orphans (Ntozi, 1997) and may imply that
these absent mothers send money to help in their children’s schooling .
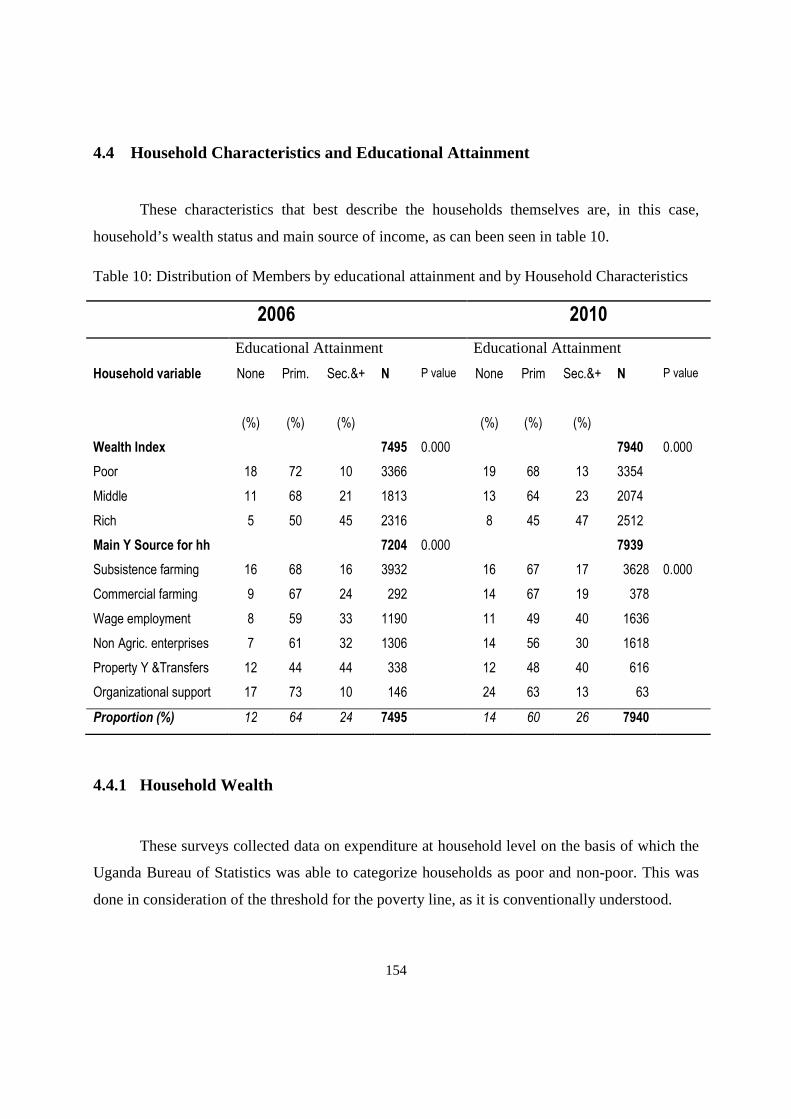
154
4.4 Household Characteristics and Educational Attainment
These characteristics that best describe the households themselves are, in this case,
household’s wealth status and main source of income, as can been seen in table 10.
Table 10: Distribution of Members by educational attainment and by Household Characteristics
2006 2010
Educational Attainment Educational Attainment
Household variable None
(%)
Prim.
(%)
Sec.&+
(%)
N P value None
(%)
Prim
(%)
Sec.&+
(%)
N P value
Wealth Index 7495 0.000 7940 0.000
Poor 18 72 10 3366 19 68 13 3354
Middle 11 68 21 1813 13 64 23 2074
Rich 5 50 45 2316 8 45 47 2512
Main Y Source for hh 7204 0.000 7939
Subsistence farming 16 68 16 3932 16 67 17 3628 0.000
Commercial farming 9 67 24 292 14 67 19 378
Wage employment 8 59 33 1190 11 49 40 1636
Non Agric. enterprises 7 61 32 1306 14 56 30 1618
Property Y &Transfers 12 44 44 338 12 48 40 616
Organizational support 17 73 10 146 24 63 13 63
Proportion (%) 12 64 24 7495 14 60 26 7940
4.4.1 Household Wealth
These surveys collected data on expenditure at household level on the basis of which the
Uganda Bureau of Statistics was able to categorize households as poor and non-poor. This was
done in consideration of the threshold for the poverty line, as it is conventionally understood.

155
While the categories created by UBOS may seem to exhibit “internal homogeneity”, they are
also quite internally heterogeneous, that keeping the categories as created in the dataset, would
mask differences within each of them. This particular study preferred to regroup the variable on
household expenditure into three categories i.e. poor, middle and rich.
Because Income or Wealth (as defined by expenditure) is normally highly positively
skewed, this study took the households in the first 50th percentile (those whose expenditure was
between the minimum and the median) as poor, those in the next 25th percentile (between the
median and 75th percent of expenditure) as middle and the ones in the last 25th percentile
(between the 75th percentile and the maximum) as rich.
Household wealth/ income, has been found to be one of the factors that strongly explain
educational outcomes globally and in Sub-Saharan Africa, in particular. This has been found to
be true even after the “free education” initiatives (Kakuba, 2012; Lewin & Sabates, 2011; Ohba,
2009; Ssewanyana et al., 2011) in the light of EFA and MDG goals.
The proportion of children that had never been to school decreased with an increase in
household wealth in 2006 and 2010. In the same vein, enrolment at secondary was strongly
positively associated with household welfare/income. Despite the universalization of Primary
and Secondary Education in 1997 and 2007, respectively, the possibility that poverty continues
to be recycled and that children from poor households may fail to move out of poverty, seems
not to be less certain in 2010 than 5 years earlier.
4.4.2 Main Source of Income for Household
The variable on the main source of income for the household was one of the most
elaborate of all the variables. This may be related to the welfare level of the household but also
other things like child labor as children in agricultural households may be solicited for labor that
may infringe on their right to attend school and or concentrate on studies. Most of the categories
look clear but this study would like to expound on two, i.e. property income & transfers and
organizational support. Property income is the income from renting out of property but
“transfers” is broad including pension, allowances, social security benefits and remittances from

156
abroad and within the country (UBOS, 2009). Organizational support refers to aid given to
vulnerable households, more so in a war situation i.e. food, clothes, etc.
Children found in households largely engaged in subsistence farming or dependent on
organizational support were more likely to be illiterate and less likely to access secondary
education. On the other hand, children from households that largely depended on wage (salaried)
employment were least vulnerable with regard to illiteracy and more likely to have accessed
secondary schooling. Households that largely earned from property and remittances present the
highest opportunities to educate their children at secondary level but surprisingly they are not
equally less vulnerable with regard to illiteracy. On further analysis, this was linked to “other
children” employed in the households of the rich.
4.5 Community Characteristics and Educational Attainment
Factors at the community level that may impact both supply and demand for education
are place of residence and region of residence.
4.5.1 Place of Residence
Urban or rural residence may dictate differential patterns in the supply of schools in form
of numbers and distribution, the supply of teachers, other infrastructure like electricity, water,
roads, telephone networks, etc. The availability of these other infrastructure may also affect
investments in schools, especially by the private sector that is increasingly involved in supply of
education, especially at the post primary level.
In addition, since the urbanization process is selective, it is more likely that the educated
and rich that provide higher demand for children’s education, are urban based. It is thus not a
surprise that place of residence has been found to strongly influence schooling outcomes for
children.

157
As per table 11, being illiterate was more of a corollary of staying in the rural than in the
urban areas. While about one half of all the children surveyed in urban areas had secondary level
of education, this was true for about one-fifth of all the children in rural households. It is more
worrying as the gap seems to have worsened over the five year period and against the
background that the proportion urban is less than 20% (see Annex 1), overall.
Table 11: Distribution of Members by educational attainment and by Community Characteristics
2006 2010
Educational Attainment Educational Attainment
Community variable None
(%)
Prim.
(%)
Sec. & +
(%)
N P value None
(%)
Prim
(%)
Sec. & +
(%)
N P value
Residence 7495 0.000 7940 0.000
Urban 4 49 47 1405 6 40 54 1434
Rural 14 67 19 6090 16 64 20 6506
Region 7495 0.000 7940 0.000
Central 6 58 36 2329 8 50 42 2275
Eastern 12 67 21 1756 15 63 22 2195
Northern 18 68 14 1325 18 63 19 1521
Western 15 66 19 2085 18 63 19 1949
Proportion (%) 12 64 24 7495 14 60 26 7940
4.5.2 Region of Residence
In the same way as place of residence (rural vs. urban), region of residence was also
found to be closely related to the supply of schools and teachers. In addition, regions are
endowed differently in terms of soil fertility, mineral and other natural resources, vegetation and
topography all of which may influence different economic activities in these areas that may in
turn impact schooling outcomes. Situations of conflict and cultural beliefs and attitudes prevalent
in these regions may also influence schooling outcomes.
158
The Central region (where the capital city is located) was found to have the least
proportion of children with no education as well as the highest proportion of children with
secondary education at the two data points. The Northern region that appeared to be most
disadvantaged in 2006 turns out to be at parity with the Western region in terms of non-
enrolment and access to secondary education. The latter observation implies that the Northern
region has improved as it recently got out of war where most people that had been in camps
returned home and started engaging in productive work. In addition, the role of the many NGOs
in the region in the post war period cannot be underestimated. The Western region seems to be
deteriorating.
4.6 Concluding Remarks
While educational attainment seems to be associated with individual household and
community level factors, universalization of secondary education in 2007 improved access to
secondary education by only two percent points. In the same vein, the proportion of the
household population under study that had never gone to school seems to have worsened over
the five year period.
Among individual factors, age and relationship of the individual to the household head
and less of sex were strong determinants of educational attainment in general, and access to
secondary education, in particular. An increase in the age of the individual was associated with
an increase in the chances of accessing secondary although this relationship was curvilinear
implying that as children grow much older; this then reduces the chances of secondary school
enrolment. Contrary to literature found elsewhere, other children (relatives and non-relatives to
the head) were more likely to access secondary school than the ones of the head.
While the education of the household head was strongly associated with access to
secondary education by children, the sex of the head seems not to play a big role in influencing
access to secondary education.
Whereas children surveyed under older or polygamous household heads seemed
disadvantaged with regard to accessing secondary education, those under young and or

159
unmarried heads manifested with the highest chances of accessing secondary schooling. The
young and or unmarried heads were found to be educated brothers/sisters to the individuals under
study that not only helped in staying with their siblings but also educating them and this practice
seems to have gained ground in 2010 than five years earlier.
An increase in household size, the proportion of the adults and children aged below five
years had a negative effect on accessing secondary schooling, pointing to competition for
resources at the household level and or increased demand for children’s labor that may interfere
with their education, among other things.
While orphanhood status seems not to have any impact on access to secondary schooling,
the economic status of the household seems to be one strongest factor that influences access to
secondary education and the influence seems to be stronger in 2010 than before the USE Policy.
In terms of region, children in the Central were more likely to have accessed secondary
and those in the North and West were most disadvantaged. In the same vein, the rural urban
inequalities seem to have worsened in the five year period in favor of urban based children, who
happen to be the minority in the country.
Far from being eclipsed, inequalities in accessing secondary schooling that existed before
the USE Policy of 2007 seem to be persisting, at best while some have worsened overtime, at
worst.
But as mentioned earlier, this level of analysis was exploratory and attempted to establish
the existence of an association between each of the hypothesized explanatory factors and
educational attainment. The challenge with this level of analysis is that it neither shows the
direction of the relationship nor the simultaneous effect of other explanatory variables onto
educational attainment. This then requires that another step is taken to explore the net effect of
all these variables onto access to secondary schooling through multivariate analysis as to be seen
in the next chapter.

160
161
CHAPTER FIVE : EVOLUTION OF INEQUALITIES IN ACCESSING SECONDARY SCHOOLING: A GLOBAL MULTIVARIATE MODEL.
In this chapter, evolution of inequalities in accessing secondary schooling is tackled from
a broader perspective, hence the appellation, “Global Multivariate Model”. In this model, we
have children ever accessing secondary schooling in the numerator as opposed to (i) never
enrolling in school, (ii) dropping out of primary, (iii) failing to transit to secondary after
completion of primary and (iv) still being enrolled at primary despite attaining the official age
for secondary schooling. Indeed as has been seen with Ministry data, the majority of children do
not enroll at secondary level because they do not complete primary (survival to the end of
primary was about 30% between 2004 and 2011) (MoES, 2012b) although a great proportion
would have enrolled at primary. What has been seen in Uganda and in other countries in the
region resonates with the remarks of Lewin when he states that “in most of poor countries , out
of school children are overwhelmingly drawn from those who have enrolled but have
subsequently dropped out before completion for many reasons” (Lewin, 2007c p. 6).
It is very true that some children never enroll in school at all and others do enroll,
complete primary but do not continue to secondary but a good number of the children aged 13-24
in this case are not at secondary because they dropped out of primary or are still enrolled at
primary (figure 30). The latter scenario is not good news because these children are “silently
excluded” to borrow the term by Lewin (2007c), i.e. they are overage for their grade due to late
initial enrolment or repetitions and achieve averagely less than their counterparts that have
progressed at the right ages. For the reasons given, they are very likely to drop out and indeed do
normally drop out before the end of the primary cycle. To vindicate this point, while Wamala,
Omala & Jjemba (2013) found out that the median age for children in primary six in Uganda
was 16 years (instead of 11 assuming they started at the official age of 6 and progressed
normally), according to the Ministry data, about 71% of new entrants in senior one were aged 12
to 15 years (MoES, 2011a), giving credence to the argument that most of the children that were
overage by primary six had dropped out between that level and entry into senior one.
162
Here, the discussion will be centered on why children of secondary school age (13-24
years) may not have completed primary while in the next chapter, inequalities in transiting to
secondary shall be discussed. Access to secondary and transition to secondary are different, the
difference is more real where attrition at primary is very high and policy would be guided better
by distinguishing the two as well as the mechanisms through which they operate to influence
access to this level.
While most studies that have looked at access to education have used household survey
data and come up with quantitative indicators denoting the extent of exclusion (household
wealth, place of residence, education of household head etc.), this study attempts to combine
findings from the quantitative data with other qualitative study findings elsewhere and especially
in Uganda, to enrich the discussion. Indeed in the subsequent discussion, dropping out of school
is not presented as a distinct event but rather a process of events, situations and contexts which
interact in different ways to influence dropouts or retention (Shapiro & Oleko Tambashe, 2001).
To borrow the argument by Hunt “knowing the why without the how places the emphasis on a
distinct event/opportunity where evidence suggests, it is an interplay of factors which pushes
children out of school” (Hunt, 2008 p.4).
Unlike in the previous chapter where variables/ factors were presented by category (i.e.
individual level, household level factors, etc.) here findings are presented in order of their
importance in predicting access to secondary schooling. Socio-economic factors like household
wealth and education status of the household head shall be explained first and these are followed
by community level factors like place and region of residence. Last in the queue are other factors
like age and sex of the household head, household size and the survival as well as residential
status of parents. Important to note also is that the universalization of secondary education in
2007 seems not to have eclipsed inequalities in access to secondary schooling as the categories
of children that were excluded in 2006 remained so in 2010. The results of a logit model are
presented for all children and then by sex as seen in table 12 and interpretation of findings
mainly centers on Odds Ratios for the variables/categories that were found to be statistically
significant.
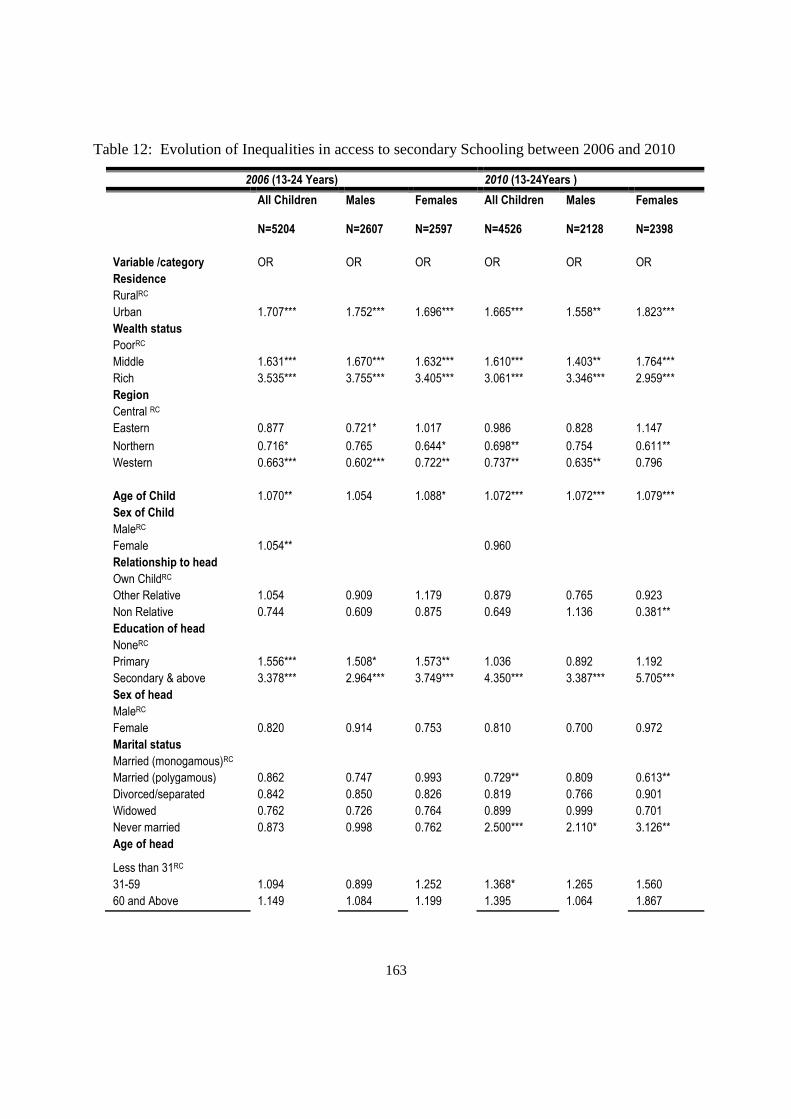
163
Table 12: Evolution of Inequalities in access to secondary Schooling between 2006 and 2010
2006 (13-24 Years) 2010 (13-24Years )
All Children Males Females All Children Males Females
N=5204 N=2607 N=2597 N=4526 N=2128 N=2398
Variable /category OR OR OR OR OR OR
Residence
RuralRC
Urban 1.707*** 1.752*** 1.696*** 1.665*** 1.558** 1.823***
Wealth status
PoorRC
Middle 1.631*** 1.670*** 1.632*** 1.610*** 1.403** 1.764***
Rich 3.535*** 3.755*** 3.405*** 3.061*** 3.346*** 2.959***
Region
Central RC
Eastern 0.877 0.721* 1.017 0.986 0.828 1.147
Northern 0.716* 0.765 0.644* 0.698** 0.754 0.611**
Western 0.663*** 0.602*** 0.722** 0.737** 0.635** 0.796
Age of Child 1.070** 1.054 1.088* 1.072*** 1.072*** 1.079***
Sex of Child
MaleRC
Female 1.054** 0.960
Relationship to head
Own ChildRC
Other Relative 1.054 0.909 1.179 0.879 0.765 0.923
Non Relative 0.744 0.609 0.875 0.649 1.136 0.381**
Education of head
NoneRC
Primary 1.556*** 1.508* 1.573** 1.036 0.892 1.192
Secondary & above 3.378*** 2.964*** 3.749*** 4.350*** 3.387*** 5.705***
Sex of head
MaleRC
Female 0.820 0.914 0.753 0.810 0.700 0.972
Marital status
Married (monogamous)RC
Married (polygamous) 0.862 0.747 0.993 0.729** 0.809 0.613**
Divorced/separated 0.842 0.850 0.826 0.819 0.766 0.901
Widowed 0.762 0.726 0.764 0.899 0.999 0.701
Never married 0.873 0.998 0.762 2.500*** 2.110* 3.126**
Age of head
Less than 31RC
31-59 1.094 0.899 1.252 1.368* 1.265 1.560
60 and Above 1.149 1.084 1.199 1.395 1.064 1.867

164
If natural father is in hh
All Children
Males
Females
All Children
Males
Females
YesRC
No, Alive 1.107 0.899 1.211 1.108 1.402 0.930
No , Dead 1.153 1.447 0.940 1.072 1.631* 0.790
If Natural mother is in hh
YesRC
No, Alive 1.035 1.248 0.889 0.998 0.818 1.177
No , Dead 0.947 0.845 1.075 1.032 0.813 1.433
Main occupation of hh
Subsistence farmingRC
Commercial farming 0.907 0.893 0.939 0.873 1.244 0.494*
Wage employment 1.134 1.082 1.168 1.673*** 1.624*** 1.636***
Non agric. enterprises 1.060 0.915 1.218 1.025 1.189 0.839
Property Y & Transfers 1.3256 1.036 1.445 1.088 1.330 0.902
Organizational support 0.964 1.232 0.9841 0.702 0.164 1.378
Household size
1-4RC
5-9 0.838 0.858 0.843 1.012 1.140 0.907
10 & Above 1.050 1.171 0.962 1.257 1.667** 0.976
Children below 5 Years
0-1RC
2 0.930 0.904 0.992 0.960 0.802 1.093
3 & Above 0.796 0.719 0.883 0.791 0.616* 0.906
Adults (60Yrs & Above)
NoneRC
One
2 and Above
0.786*
0.717*
0.625***
0.691*
0.965
0.725
1.047
1.163
1.077
1.628**
1.047
0.857
RC, Reference Category, ***significant at 1% , **significant at 5% : * significant at 10%
5.1 Household Wealth
Household income or wealth or welfare is one factor that consistently influences access
to secondary schooling for girls and boys in 2006 and 2010. In 2006, a child from a household
with middle level of income was about two times (OR=1.631) more likely to have enrolled at
secondary than the one from the poorest household (i.e. 50th bottom percentile of household
wealth according to this study). In the same logic, a child from the 25th top quintile of household
income was four times (OR=3.535) more likely to access secondary education than the one from
the poorest household.

165
In 2010, the situation was not any different. Again, a child from an average household (in
terms of income) was about two times (OR=1.610) while the one from the richest household was
three times (OR=3.061) more likely to have enrolled at secondary than the one from the poorest
household. In both cases, income seems to be a stronger factor with regard to the education of
boys than girls. These findings lead to questioning the rationale for universalizing education in
2007 and the extent to which issues of equity at the center of the policy are likely to be redressed.
Income is a factor that has continued to influence educational outcomes at different levels
everywhere in Sub-Saharan Africa (Majgaard & Mingat, 2012) and of course in Uganda, in this
particular case. This has continued to happen despite the education universalizing initiatives in
several countries (Kabubo-mariara & Mwabu, 2007; Kakuba, 2012; Lewin & Sabates, 2011;
MoES, 2011b; Ohba, 2009; Lewin, Wasanga, Wanderi, & Somerset, 2011) . To expound on this
in the case of Uganda, five years into the implementation of Universal primary education, 67%
of households’ income was still spent on schooling (Boyle, Brock, Mace, & Sibbons, 2002).
It is therefore important that mechanisms also termed as “manifestations of poverty” to
borrow the appellation of Hossain & Zeitlyn (2010) or maybe “proximate determinants of
access” through which income operates to influence educational attainment be understood so that
policy can apply the right remedies at the right point in order to enhance retention in school and
subsequent access to secondary education. It should be recalled that dropping out of school is
more of a process than an event and that several factors often interact to cause it.
Despite universalizing education at primary and secondary level, other costs still exist at
both levels although emphasis here shall be put on costs that cause dropouts (at the primary)
while the ones at secondary shall be tackled in detail in the next chapter. In this vein, school
being too expensive was the main reason why children had dropped out of school before and
after the USE initiative of 2007 and this was exacerbated at secondary as per figure 33.
At primary, an earlier study in Uganda had identified other costs like PTA fees more so
in urban schools, development fund, examination fees for mock exams and holiday work, school
supplies (textbooks, exercise books, pens and pencils, school bags, geometry sets etc.), transport
to school, money for feeding at school and private tutoring (Uganda Bureau of Statistics and
ORC Macro, 2001) as the financial barriers to the universalized primary education then. A recent
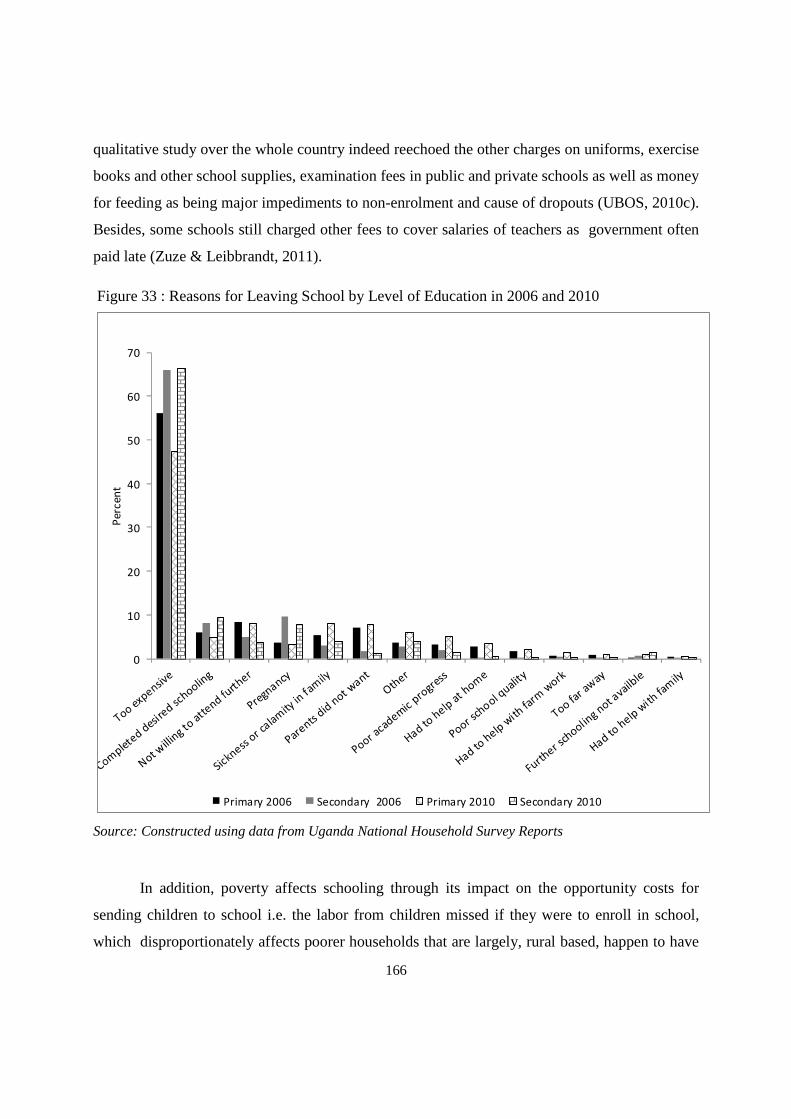
166
0
10
20
30
40
50
60
70
Pe
rce
nt
Primary 2006 Secondary 2006 Primary 2010 Secondary 2010
qualitative study over the whole country indeed reechoed the other charges on uniforms, exercise
books and other school supplies, examination fees in public and private schools as well as money
for feeding as being major impediments to non-enrolment and cause of dropouts (UBOS, 2010c).
Besides, some schools still charged other fees to cover salaries of teachers as government often
paid late (Zuze & Leibbrandt, 2011).
Figure 33 : Reasons for Leaving School by Level of Education in 2006 and 2010
Source: Constructed using data from Uganda National Household Survey Reports
In addition, poverty affects schooling through its impact on the opportunity costs for
sending children to school i.e. the labor from children missed if they were to enroll in school,
which disproportionately affects poorer households that are largely, rural based, happen to have
167
larger families and predominantly engaged in peasant agriculture (Hossain & Zeitlyn, 2010;
UNICEF, 2005) but also more of girls than boys (Colclough, Rose, & Tembon, 2000). These
households badly need the support of their children to engage in household chores, work in
gardens or markets in order to raise income to support these already “largely vulnerable
families”.
The effect of income on access to education may also be a bit more indirect as it may
determine when children enroll, the regularity of attendance and when they are temporarily
withdrawn all of which affect retention (Boyle et al., 2002). While its influence can be direct, it
may also explain retention through its impact on manifestations of “silent exclusion” i.e. late
enrolment, irregular attendance and poor achievement (Lewin, 2007c). Poverty may have
implications for the type of school attended, access to school equipment, age at entry, attendance
of pre-primary school and the health and nutritional status of children, all of which impact
learning and retention in school as to be expounded on in hereunder.
An increase in demand for education in the context of limited supply from government as
well as “enrolment shocks” in public schools caused by universalizing education led to the
emergence of private providers in education provision especially at secondary level. As has been
found elsewhere, because costs of private schools are highly prohibitive, these schools are
unlikely to be attended by especially children of the poor (Bangay & Latham, 2013; Henaff et
al., 2009; Pilon, 2004; Woodhead et al., 2013).
In Uganda, private schools tend to perform better than government schools both in terms
of their children mastering basic competencies and performance in the Primary Leaving
examinations. A recent study found out that 80% of pupils reaching the desired proficiency in
numeracy at Primary Six were in private schools as compared to 40% in government schools.
Equally so, 87% of pupils reaching the desired proficiency in English literacy were in private
schools as compared to 34% in government schools (UNEB, 2012). This same study went ahead
to look into reasons for differentials in performance in both systems and these can be
summarized as:- better time management, more reading materials, competition for clientele in
private schools and most private schools being urban and hence more exposure by children. In
government schools, laxity in teaching, lack of lunch for pupils and teachers, high rates of
168
absenteeism for pupils and teachers and high pupil teacher ratios (UNEB, 2012) were the main
justifications for poor performance. In addition, a documentary by the World bank citing
statistics from UBOS found out that while each school should be supervised (visited by
inspectors) at least once a term , only one quarter of the public schools surveyed were visited at
least once a year (World Bank, 2012a) implying that poor supervision is also one of the biggest
causes of poor performance in public schools.
In Uganda, it is the rich that are able to enroll their children in private or boarding schools
that perform better and hence their children can progress to the next level with ease while the
poor will keep their children in largely public schools where they are likely to be “silently
excluded”, that most often leads to dropouts.
Income may influence retention through attendance or non-attendance of pre-primary
education. Indeed, there is considerable evidence that attending pre-primary school helps provide
a foundation for learning and that children who attend pre-primary school are better prepared for
primary school and for learning throughout life (Majgaard & Mingat, 2012; Tsujita, 2013);
Uganda Bureau of Statistics and ORC Macro, 2001; UNICEF, 2005) . An increase in the time of
exposure to pre-primary education was found to be positively correlated with achievement at
primary six in Uganda (Wamala et al., 2013) but was also associated with improved attention
and effort, better class participation and discipline among third grade pupils in Argentina
(Berlinski, Galiani, & Gertler, 2009). Pre-schooling is however largely in private hands and an
almost exclusive privilege of the rich as has been seen elsewhere (Lewin, 2007c; Wayack-
Pambè, 2012) and Uganda is not an exception either (MoES, 2011a; Uganda Bureau of Statistics
and ORC Macro, 2001). Indeed according to the most recent DHS Report the Net Enrolment
Rate at pre-primary was found to increase substantially with household wealth (UBOS and ICF
International Inc, 2012).
Income may also influence schooling outcomes through the age at entry into the school
system that may be related to the previous point. It should also be remembered that late entry in
school is strongly associated with poor achievement and dropouts (Lewin, 2007c; Wamala et al.,
2013) although this tends to disfavor girls more disproportionately than boys (UNICEF, 2005;

169
Wells, 2009). While the proportion of children who started school late was highest among the
poor and declined with household wealth (Uganda Bureau of Statistics and ORC Macro, 2001;
Wells, 2009), late enrolment and repetitions were strongly associated with dropouts at Primary 6
or 7 (Kyeyune, 2012; UNICEF, 2005; Wells, 2009). In addition, late enrolment was found to
have far reaching implications for dropouts amongst girls as it was associated with onset of
puberty, early marriages, teenage pregnancy and increased involvement in paid or unpaid
domestic work. For the boys, physiological changes like growth of beards (when still at primary)
whereby other people would laugh at them often discouraged the boys from continuing with
education. A more recent qualitative survey outlined the reasons for starting school late
especially among the poor as long distance to school, children being young (despite attainment
of the official age of 6), the fact that some parents did not know the right age of entry in school,
demand for labor at home, negligence of parents, etc. (UBOS, 2010c)
Income may dictate differences in feeding of children that may in turn impact learning
but also retention in school. Under the 2008 Education Act, government provides capitation
grants, instructional materials and infrastructural support while providing food for children is the
responsibility of the parents or local communities.
Feeding has been found to have an impact on learning achievement and improved
cogitative abilities of children (Acham, Kikafunda, Malde, Oldewage-Theron, & Egal, 2012;
Adelman, Alderman, Gilligan, & Lehrer, 2008; Mulindwa Najjumba, Lwanga Bunjo,
Kyaddondo, & Misinde, 2013). Indeed, malnourished children always have brains that are not
fully developed; have problems with concentration and memorizing what they have studied , are
likely to make mistakes often and manifest with less levels of immunity and hence more
likelihood of being sick which may cause absenteeism, low achievement and dropouts (Adelman
et al., 2008; C. Sommers, 2013; UBOS, 2010c; UWEZO-Uganda, 2011).
While feeding is very critical for learning as seen, the 2009/10 UNHS Report found out
that 92% of the rural children who attended primary schools did not have breakfast at home
while 73% of the day scholars in public schools often spent the day without lunch and that the
percentage without the said meals declined with an increase in household income as cited by
Mulindwa Najjumba et al.( 2013). Whereas Uganda is not a country that generally lacks food, for
the poor households it may be an issue more so in times of poor harvest, some may lack the

170
packing utensils, others may not have the fast means to prepare a meal in the morning while for
others the time to do it may not be adequate since children have to walk long distances to schools
and yet the mechanisms for preservation in the event that it is prepared in the night are largely
nonexistent.
Like feeding, income may influence educational outcomes through the health status of
children. The poor health of children is not only a result of a poor health care system in a country
but also poverty in households where hunger and lack of certain micronutrients (iron, iodine and
vitamins) in the diet have negative implications for health and consequently the learning of
children (Bruyninckx & Pilon, 2010; Hossain & Zeitlyn, 2010). In addition, most causes of child
morbidity like diarrhea, worms and malaria are related to poor hygiene and sanitation in the
home as well as the inability to sleep under a mosquito net that are more of corollaries of
poverty. Children who were often sick were found to attend less frequently, achieve less, have
poor attention and low motivation, poor “cognitive function” and were more likely to repeat
grades and drop out of school (Boyle et al., 2002; Colclough et al., 2000; Fentiman et al., 1999;
Pridmore, 2007; UNICEF, 2005).
Finally, while lack of scholastics was a reason for dropouts as seen already i.e. children
were not allowed in school because they did not have the required scholastic materials, it may
also indirectly influence retention through learning outcomes. As was the case in Bangladesh,
having a school bag and a geometry set, books, pencils and pens was associated with regular
attendance, better achievement and less repetition (Hossain & Zeitlyn, 2010). In the case of
Uganda it is not uncommon to see children in class, more so in the rural public schools without
geometry sets, textbooks and other required scholastics. In this vein, a recent documentary by the
World Bank in Uganda indeed found that many children had nothing to read, write on and write
with and that this led to low coverage of the curriculum and poor learning outcomes (World
Bank, 2012a).
171
5.2 Education of household head
Education of the household head seems to be a very strong factor explaining differentials
in educational outcomes for children in 2006 and 2010. In 2006, a child whose head had primary
level of education was about two times (OR=1.556) more likely to have enrolled at secondary
than a child whose head had no education. In the same vein, a child whose head had at least
secondary education was about 4 times (OR=3.378) more likely to enroll at secondary than
his/her counterpart whose head had never been to school. While in 2010, children whose heads
had at least secondary education were about four times more likely to be enrolled than children
of uneducated heads (OR=4.350), children under heads with primary education do not seem to be
doing better than those under heads without any education. This could probably be explained by
increasing income inequalities as education was found to be a key determinant for the
inequalities (Ssewanyana & Kasirye, 2012) and the fact that secondary education is increasingly
managed and run by non-state actors.
Important to note also is that better education for the household head translated into
higher opportunities of accessing secondary by girls than boys and this was true in 2006 and five
years later. Otherwise put, girls under less educated heads were more likely to be excluded (from
secondary education) than the ones whose heads were more educated. Why are children under
educated heads more at an advantage or why are the ones under less educated ones more likely to
be excluded? This can be explained by several factors as to be elucidated hereunder.
Since access to education at all levels and household welfare are highly strongly
correlated, the influence of education of the head on that of children is very likely to be
moderated by the effect of income as education and level of income were found to be strong
corollaries in Uganda (Ssewanyana & Kasirye, 2012; UBOS, 2010b) and elsewhere (Lewin,
2007c). Indeed educated parents were found to be more able to buy the necessary scholastic
materials for their children like pens, books, uniforms, geometry sets etc (UNEB, 2012) that in
turn, would enhance achievement and retention in school. However the fact that in a multivariate
model, education level of the head and household income/welfare stand out as distinct covariates
172
(without being affected by multicolinearity) shows that education of head is an independent
predictor of children’s schooling outcomes.
Education of head is likely to explain children’s schooling outcomes because it is
strongly associated with achievement. Indeed, children whose parents were more educated were
found to perform better than those whose parents had less levels of education (UWEZO-Uganda,
2011, 2012; Wamala et al., 2013). Since in the Ugandan education system movement from one
class to another and especially one cycle to another is conditional on passing examinations and
given a deficiency of supply at the post primary level, retention in school is strongly determined
by achievement in two ways: first, promotion from one class to another is dependent on
achievement (performance) and secondly, the ability to learn and follow in the subsequent
classes is determined by competencies mastered earlier in the system. It means therefore that one
reason why children from less educated heads tend to be excluded is that they achieve poorly and
find it difficult to be retained in the “competitive system” more so when they are supposed to
transit to the post primary level. It should be remembered that exclusion or dropout is more of a
process than an event.
Educated parents or heads are more likely to be involved in the education of their
children by supervising and guiding them with homework, discussing with them about school
progress, buying textbooks and providing an enabling environment for learning (Fan & Chen,
2001). On the other hand, if parents are illiterate, not in the home or very busy, this is likely to
affect their ability to follow up children and has negative implications for children’s achievement
(Mestry et al., 2007) and of course retention in school. Indeed these findings are corroborated by
a recent report by the Ministry of education where lack of zeal by parents to foster good
performance was found to be the main cause of repetition and dropouts (MoES, 2012a).
Because educated parents are more confident, have the ability to involve in school
management and may value the education of their children, there is likely to be more interaction
between educated heads or parents and the schools. This instills discipline and makes the child to
know that he/she is being closely monitored which in turn improves achievement. Indeed,
children whose parents visited school and discussed about learning of their children were found
to perform better than those whose parents did not(UWEZO-Uganda, 2011, 2012).The reverse

173
may be true as found in South Africa where lack of cooperation between parents and schools
often led to late registration of children and poor discipline. In addition, ensuring that children
arrive at school on time and behave appropriately that had a positive impact on achievement
were more associated with educated parents than with uneducated ones (Mestry et al., 2007).
Mestry adds that parents with less education than that of the children felt intimidated and
couldn’t reprimand the children and this affected discipline and achievement. It should be
remembered that low achievement is one form of “silent exclusion”, in other words, children
who perform poorly are most likely to drop out of school.
Dubow, Boxer, & Huesmann (2009) contend that the education of parents impacts that of
children through children’s aspirations while Fan & Chen (2001) argue that the strongest
determinant that moderates the relationship between parents’ education and that of children is
parental aspirations/expectations for children’s education and less of parental supervision at
home. Either way, whether it is higher aspirations by parents that motivates children to progress
in school or higher aspirations by children themselves borrowing an example from parents, the
bottom line is that it is more educated parents that will have higher aspirations because they
know what education is in the first place or that the children will most likely be inspired by more
educated parents.
5.3 Place of Residence
In the developing world in general (Lewin, 2007c) and Sub-Saharan Africa (Majgaard &
Mingat, 2012) in particular, urban-rural differences in secondary schooling outcomes have been
found striking especially where secondary school provision is largely urban or peri-urban.
Findings of this study do not significantly differ from what has been observed elsewhere
as children in the urban areas were two times more likely to be have enrolled at secondary than
the ones in the rural for 2006 (OR=1.707) and 2010 (OR=1.665). This factor seems to be
stronger for males in 2006 but stronger for females in 2010 implying that in the recent past
females in the rural areas were more likely to be excluded from secondary education.
Since income has been found to be a strong determinant of schooling and learning
outcomes, this could be related to differentials in incomes as the average monthly incomes of
174
households were found to be higher in the urban than in the rural areas (Ssewanyana & Kasirye,
2012; UBOS, 2010b). Income has been found to impact age at first enrolment, attendance or
non-attendance of pre-school, type of school attended, accessing the necessary scholastic
materials, frequency of attendance and the health as well as nutritional status of children, all of
which have implications for learning and schooling outcomes. Besides, the differentials in
schooling outcomes between the urban and the rural may be explained by differentials in
distribution and quality of schools as to be seen shortly.
In relation to the previous point, most of the schools in urban areas are run by non-state
actors especially at the secondary level and tend to be of better quality. This observation is
indeed vindicated by field findings thus: - “……….for example, in Gulu district we have 24
private schools and out of the 24 only 4 are located outside the municipality” (Male, Graduate
Head teacher for an Urban Mixed, Day & boarding, Private Secondary School implementing
USE)
While at primary, the privatization of education provision is less prevalent (30% of
primary schools were private versus 69% of secondary schools as per figure 6), it is of course by
far, much more prevalent in towns than in villages. Most private schools tend to be urban based
because of higher demand for education (explained by a bigger and “quality” population in a
small area), the fact that better and more experienced teachers are urban based and better
infrastructural facilities in the urban i.e. roads, piped water, electricity, a better telephone
network and the internet, all of which greatly reduce the costs of starting and running a school in
the context of better demand than in the rural areas.
Besides, the 2008 Education Act allows that parents in the urban areas can contribute
towards “administrative and utility expenses” even in public schools (Government of Uganda,
2008). Indeed UPE and USE were and continue to be largely a rural phenomenon. While the
advantages of private schools over public schools have been adequately discussed, the
contributions of parents towards teacher remuneration (or motivation), children’s feeding, sports
activities and scholastics in the public schools have been found to have stronger effects on
learning outcomes and retention in school. With regard to feeding as already seen, the negative
implications of poor feeding or lack of food for school going children cannot be overemphasized.

175
Citing the 2009/10 socio economic module of the UNHS Report, Mulindwa Najjumba et al.
(2013) report that 92% of the rural children who attended primary schools did not have breakfast
at home while in the urban areas these constituted only 5.8%.
Differentials in access to secondary schooling could also be related to differences in
performance between rural and urban schools. Indeed a recent survey to monitor learning
outcomes in primary by the Ministry of education found out that urban schools had a
significantly higher proportion of children reaching the required proficiency (73%) levels in
English than rural schools (30%). Equally so, the proportion of children reaching the required
proficiency levels in numeracy was higher (66%) in the urban than in the rural schools (41%)
(UNEB, 2012). The report enumerated why urban children did better than their rural counterparts
and the reasons given included:-more exposure amongst children in the urban, better facilities in
homes in the urban areas hence children keep learning through television, radio and internet, the
effect of more educated parents that are largely urban based and hence able to buy the necessary
equipment for their children and higher support supervision (UNEB, 2012), all of which put
children in the urban areas at an edge over their rural counterparts.
In addition, the fact that schools tend to be concentrated in the urban areas with the rural
largely being underserved, is likely to have an impact on distance to school that makes children
tired as they have to walk long distances, disproportionately affecting more of girls (Colclough
et al., 2000) than boys. It also partly explains late age at entry in school (Kamuli, Younger, &
Warrington, 2012) that in turn has negative implications for achievement (Wamala et al., 2013)
and consequent retention at school. In the same logic since lack of a secondary school had
implications for schooling at the primary as was the case in Peru (Ilon & Moock, 1991) and
Western Tanzania (Ainsworth et al., 2005), the existence of few secondary schools more so in
the villages may discourage progression in school at the lower levels as it may dwarf children’s
hopes of progression and imply fewer role models in the community.
Because most people in the village are likely to be poor, illiterate or school dropouts,
school age children in the villages are likely to suffer what has been termed as “neighborhood
effects”. In this case, if the majority in an area do not value education, then they may discourage
attendance by a child and the parent’s reaction to stop this has been found to depend on his
176
level of education (Anugula, 2010). Indeed the qualitative report of the Uganda National
Household Survey found out that a combination of distance to school (where most rural children
walk and are not dropped at school or ferried by buses) and distracting factors like video halls,
pool tables, sports betting points and karaoke that are an increasingly common occurrence in the
rural trading centers were responsible for dropouts in Uganda (UBOS, 2010c). In the same logic,
while most “able” respondents in Gulu where the qualitative field survey was done reported
educating their children in Kampala for better quality reasons, a good number of the same
parents also raised the issue of avoiding “bad groups” that would affect children’s education
within their communities.
Again in the rural areas, there are more cases of learner and teacher absenteeism (The
World Bank, 2013). The former was found to be a serious problem as one for every three
children in Ugandan primary schools would not attend school daily and 47% of the children had
been out of school one month prior to the survey conducted by Boyle et al.(2002). Because of
demand for child labor at the household level, a common feature in the rural areas, learner
absenteeism, one of the “manifestations” of silent exclusion as described by Lewin (2007c) and
Hunt (2008) was more of a rural than an urban phenomenon (UBOS, 2011) and has been found
to have implications for learning outcomes and retention in school (Hossain & Zeitlyn, 2010;
Karugaba, 2013).
Given that the urban advantage benefits only 20% of all the children as seen at univariate
level (Annex1), improving retention at primary and consequent access to secondary for the rural
folk should be the main preoccupation of policy makers and implementers given the
demographic preponderance of the rural children and the extent of their vulnerability. In the
spirit of equity that is at the heart of EFA Goals, better policies to enhance enrolment, retention
and progression to secondary should target the rural children that tend to be more vulnerable than
their urban counterparts. In the event that this is not realized, the advantages of education such as
its impact on labor productivity and human capital, morbidity, mortality and fertility as well as
enhancing social mobility out of poverty, all of which may enhance the demographic transition
and engender sustainable development, risk not being realized.
177
The urban advantage seen in the previous section does however, not preclude situations
of educational exclusion even in towns. Indeed studies in Uganda and elsewhere show that in the
urban areas, some children are educationally excluded. In the case of Uganda, Kyeyune (2012)
documents challenges to children’s schooling in the urban areas as lack of secondary schools in
some urban suburbs, crowded classrooms, poor feeding and regular absenteeism to earn a living
for children of the poor. Other challenges included distractions like film shows, city idlers and
petty businesses that impacted retention in school for especially disadvantaged children and
progression to the upper levels.
In the slums of Kenya and especially Nairobi, higher cases of dropouts at primary than
the situation in rural Kenya, was a result of poor quality schools, child labor, limited access to
secondary schools and risky behaviors like consumption of drugs, alcohol and sexual activity
(Mugisha, 2006). In Ouagadougou (the Capital of Burkina Faso), Pilon (2002a) found out that
there were intra-urban differences in supply and demand for education whereby the outskirts
were both inhabited by peasants and migrants and largely served by private providers in terms of
schools and that, this greatly affected schooling of children. Because most of the parents in the
outskirts could not afford the schools in their vicinity, their children would move longer
distances to access schools affordable by parents and hence distance to school was still a main
factor. The latter was additionally exacerbated by traffic jams, pollution and accidents in the
context of a poorly organized public transport system.
5.4 Region of Residence
Different regions are endowed differently in terms of climate, fertility of soils,
topography, rainfall patterns and other natural resources all of which may determine the main
economic activity that may also have implications for incomes and labor demand at the
household level hence determining schooling outcomes. In addition, various regions have
various historical experiences such as early exposure to western education by Christian
missionaries, which has been found to impact school supply in the early colonial times, and
hence give a historical advantage to some regions over others.
178
Region of residence was a strong factor determining access to secondary schooling for
boys and girls in 2006 and 2010. In 2006, children in the North (OR=0.716) and West
(OR=0.663) were less likely to have accessed secondary education than the ones in the Central.
The ones in the East were equally less likely to have enrolled at secondary than those in the
Central but this was not statistically significant. While boys in especially the Eastern and
Western Regions were less likely to have accessed secondary education than their male
counterparts in the Central, it is the girls in Northern and Western Uganda that were less likely to
have enrolled at secondary than their female counterparts in the Central.
The patterns observed already are not very different in 2010 whereby children in the
North (OR=0.698) and West (OR=0.737) were less likely to have accessed secondary education
than the ones in the Central. Looking at this by sex, males were more likely to be excluded in the
West (OR=0.635) while it is females in the North that were the most disadvantaged (OR=0.610).
Since the reasons for educational exclusion of females shall be discussed under section
5.10, the emphasis of the discussion here shall be on reasons for exclusion of children in
especially the North, versus those in the Central
This study endeavored to understand and justify differentials in demand for education on
the basis of some studies done in Uganda and other developing countries as to be seen hereunder.
Income being one of the strongest correlates of access to education, differentials in
demand at the regional level is most likely related to differentials in incomes or poverty levels
between the regions. As per 2010 (figure 15), 46% of the population in northern Uganda was
below the poverty line, contrasting sharply with 24% in East, 22% in West and 11 % in the
Central Region (UBOS, 2010b).The direct and subtle effects of income or wealth on educational
outcomes need not be overemphasized.
Differences in demand could also be related to differences in the supply of schools. As
was seen in chapter three, the northern region was deficient both in terms of supply of schools
(figure 22) and classrooms (table 6). While this is a more complex problem where the supply of
education is in the hands of non-state actors like the situation in Uganda, it also has implications
for distance to school. Indeed, Kampala (the capital located in Central) was found to have the
179
shortest distance to all educational facilities while the North had the longest distance to
especially private schools (UBOS, 2010b). Distance may in turn affect age at enrolment whose
implications for achievement and retention are well discussed. In this same logic, the proportion
of children who started school late was highest in the North and lowest in the Central (Uganda
Bureau of Statistics and ORC Macro, 2001).
In terms of quality of schools as vindicated by achievement of students in numeracy and
literacy, the Central Region had the best schools as evidenced by the highest proportion of
children with the required competencies while the north had the worst schools (UNEB, 2012,
UWEZO; UWEZO-Uganda, 2011).
One other reason why the northern region has lagged behind generally and in terms of
education is due to the Civil War by the Lord’s Resistance Army that raged on in the area for
about 20 years. This war that broke down the economic and social fabric of the region, had of
course, far reaching implications for education in northern Uganda. The implications of war for
education are indeed enormous as some studies have documented.
In this regard, following an analysis of 43 countries in Sub-Saharan Africa between 1950
and 2010, Poirier (2012) summaries the implications of war for education as death of children
and teachers, loss of income due to displacement, disability and therefore lessened activity by
household heads, child soldiering, displacements, destructions of school infrastructure and a
lessened budget for social services at the national level. In addition, even when children were in
camps, forced recruitment and abductions were found to directly affect the education of boys and
girls as they were responsible for low attendance and poor teacher retention (Colclough et al.,
2000; M. Sommers, 2005).
Some of the effects of war are long-term and cannot be solved overnight. Findings from
the field show that a good number of students that were previously abducted manifested with
Post Traumatic Stress Disorders that affected their concentration and learning at school. Other
effects that stood out from the field findings were: - higher levels of poverty because of
prolonged low production at household level, an increased proportion of child headed
households, more cases of land conflicts sometimes resulting in deaths of parents, a higher
“dependency syndrome” among the people because they were used to handouts in camps, higher
180
rates of HIV/Aids, teenage pregnancies and early marriages because of a prior permissive
lifestyle in the camps, etc. All these have implications for learning and schooling outcomes in
general and access to secondary schooling, in particular.
The extent of post war trauma can be seen in this response by a teacher after being asked
what could be done to improve access to secondary education in Northern Uganda:
“……… I think psychosocial support is one of them because many of these students still
suffer trauma as a result of the war. There is a girl who was born when parents were
fleeing and placed by the mother near one of the homes. Other people later landed on
her because she was crying and took her and now this child is in Seiner two. One day,
one of the children in the family where she lives told her that “why are you also
ordering us around, do you know that this is not your home?” The girl became so mad
about the statement that she wanted to end her life. She later shared her problem with
me after which I tried to talk to her and discuss the matter with her guardians and other
stakeholders. We all came together and the guardians opened up to her and told her
how they had picked her when she was a baby. We convinced her that she was lucky
because the guardians loved her and that is why they were educating her” (Male,
Graduate Teacher, Director of Studies at a Rural Mixed Secondary School, Age 47)
5.5 Age of Child
In several studies, age has been found to be negatively related with access to education in
general, and secondary education, in this particular case (Kobiané, 2006; Siddhu, 2011;
Takahashi, 2011; Wells, 2009).
In this study however, an increase in the age of a child was associated with a higher
likelihood of ever enrolling at secondary and this was generally true for all children in 2006 and
2010, but more so for females than males. The probable explanation for this is that this study did
not look at “current enrolment status at secondary” but rather educational attainment due to the
challenges of having very few observations in the event of considering “current enrolment”.
Indeed among the children in the numerator were, inter alia, children that had completed

181
secondary, dropped out of secondary or at post-secondary institutions that were likely to be
older.
5.6 Marital Status of household head
While the marital status of the household head was found to have no impact on access to
secondary education by members in his/her household in 2006, it was a strong factor five years
later. Indeed in 2010, children under polygamous heads were less likely to access secondary
education than those under monogamous heads (OR=0.729) and this affected more of girls.
These findings are corroborated by a study in Ghana where Lloyd & Gage-Brandon
(1994) found out that the number of “same father” younger siblings had a negative effect on
educational outcomes of children while the number of “same mother” siblings had no effect.
Could the negative effect be a result of resource dilution as found out by Buchmann (2000) in
Kenya where children from polygamous marriages were less likely to be enrolled due to “more
needs and less resources”? Buchman termed this “the worst case scenario of the resource dilution
effect”?
Besides, polygamy that is often characterized by marital conflicts that have implications
for children’s discipline (Mestry et al., 2007), hatred as well as envy between the wives and or
children, may not provide a conducive atmosphere for learning and progression in school.
While children under divorced, separated or widowed heads seem to be less likely to
access secondary education, these categories are not statistically significant.
As was observed at the bivariate level, children whose heads were never married were
about three times (OR=2.500) more likely to access secondary education than the ones under
monogamous household heads and again this effect was stronger for females (OR=3.126) than
for males (OR=2.110). At bivariate analysis, these were found to be largely rural based older
brothers or sisters and with at least secondary education. These results resonate with Pilon’s
findings in Togo where children “fostered” in households without other children had higher
182
chances of accessing primary education than households where there was at least a child of the
household head (Pilon, 1995).
Could it be that parents exercise control over the incomes of their older children for them
to educate their younger siblings as was found out in Kenya (Gomes, 1984)? Findings from the
field study indeed show that the phenomenon of staying with and educating (paying fees for) a
younger brother or sister or close relative like a nephew or niece was not uncommon. What stood
out also is that these relatives would be educated in cheaper schools compared to the children of
the head, in a situation where the head was married.
Important to note is that, not all elder children support the education of younger siblings
or relatives. This phenomenon is strongly dependent on an interaction of several factors on the
side of the “sponsor” i.e. birth order, willingness and ability of the person to educate others,
preparedness to postpone his/her own marriage and the level of cooperation between the
“sponsor” and the parents. If it happens that the first or second born is willing to postpone
marrying and or help, has had some level of education and some level of ability and most likely
appreciates the role of parents towards his education, then this will benefit younger siblings and
be a good precedent that may be replicated in the family. The benefits would be much less if the
probable “sponsor” is lower in birth order even when he/she has the ability and willingness
because most of the children in the family may have dropped out. On the other hand even if
he/she is the first born but not well educated and most likely not able, this will not help as this
individual may not appreciate the role of education or have the means to educate others besides
the fact that he/she is likely to marry fast.
183
5.7 Main Occupation for Household
The main source of income for the household is another variable that may determine
socio-economic status and influence schooling outcomes. Generally in 2006, the main source of
income seems not to have much influence on access to secondary education.
The effect of the main source of income is more evident in 2010 for all children as well
as males and females, separately. What seems to stand out from this analysis is that children
whose heads largely earned from wages (or salaries) were about twice (OR=1.673) as more
likely to be have enrolled at secondary than those under subsistence farmers and this was true for
male children (OR=1.624) as well as their female (OR=1.636) counterparts.
A situation of better or worse schooling outcomes for children under salaried employees
and subsistence farmers, respectively is corroborated by earlier findings in developing countries
and Sub-Saharan Africa, in particular (Bajracharya, 2010; Kobiané, 2006; Pilon, 1995; Roach,
2009; Rolleston, 2009; Wayack-Pambè & Pilon, 2011).
Household heads that were employed were more likely to be more educated, earning
better and having more stable incomes, more resident in the urban areas and more appreciative
of the value of education as already discussed, all of which enhance better schooling outcomes
for children. Since the point of departure for this study is more of why some children are
excluded and not necessarily why some are retained, the reasons for why children of subsistence
farmers were less likely to access secondary education are elucidated hereunder.
Children of peasants are more likely to be resident in villages, be located further from
schools, enroll late and more unlikely to have all the required school necessities, all of which
influence retention in school and progression to the next level. As has been found elsewhere,
children of peasants are quite often called upon to provide labor especially during the times of
harvest and this, impacts attendance, achievement and dropout (Colclough et al., 2000). In
peasant households, while girls are generally trained to look after their siblings, fetch water,
collect firewood, peel bananas, sweep the house etc., boys are often oriented towards looking
after cattle and doing other extramural tasks. Because of what has been explained already, the
184
opportunity costs of schooling are higher for children of subsistence farmers to the extent that the
probable long term benefits from formal education may be outweighed by the short term gains in
form of labor largely needed to support the largely poor households (UNICEF, 2005).
5.8 Relationship to Household Head
The relationship of a child to the household head has been found to impact chances of
accessing education for children. In several studies, biological children of the household head
have been found to have better chances of accessing secondary education than other relatives
and non-related household members (Kakuba, 2012; Rolleston, 2009; Wayack-Pambè & Pilon,
2011).
For this study, the relationship between a child and the household head and its impact on
children’s access to secondary education is largely both insignificant and ambivalent. In 2010
however, females unrelated to the household head were less likely to have enrolled at secondary
(OR=0.381) than the daughters of the household head and other relatives and this was significant
at 5%. Further analysis of the data indeed reveals that 46% of female non-relatives were
surveyed in the urban areas as compared to only 16% of the male non-relatives. These results are
corroborated by findings according to Pilon (2005) following a study of several countries in
West Africa (Burkina Faso, Cote d’Ivoire, Ghana, Guinea, Mali, Niger, Senegal and Togo)
where chances of primary schooling were highly compromised for especially girls in the urban
areas of the countries studied.
Indeed in Uganda, with increased urbanization, better opportunities of education for
women/girls, more possibilities of off farm employment and higher chances of female labor
force participation, it is increasingly common for households (especially urban because they are
more in need and or have the means) to employ girls of school going age as “house girls” as they
are popularly known to help in babysitting and other household chores.
Even though these young girls come into urban areas to look for work and usually after
dropping out of school, Platform for labor rights, a labor rights organization in Uganda reported

185
that they are often made to work for long hours for their age, are normally poorly remunerated or
not paid at all and subjected to assault but also sexual abuse within the employing households
(Daily Monitor, 2013). In addition, the work they engage in infringes on their right to education
in light of UNICEF’s definition of child exploitation as cited by Bruyninckx & Pilon (2010).
This calls for policy to address the challenges of why they are not retained in school in the first
place and the suffering they endure in the employing households as, they are supposed to enjoy
their rights as children like any other.
Experience from other countries shows that indeed not all children unrelated to the
household head or spouse are house helpers. In the context of poor quality and unevenly
distributed schools in the rural areas, some parents may send some of their children (more so
girls given the negative impact of distance to school for their safety and education) to their
“friends” or “relatives” in anticipation for the children accessing better education, just only for
the latter to be subjected to much domestic responsibilities and or exploitation often leading to
their right to education being compromised as has been found in Haiti (Bruyninckx & Pilon,
2010) . This scenario cannot be denied in the case of Uganda and more research needs to be done
to confirm the extent to which it is a reality.
5.9 Proportion of children under five
Most quantitative studies that have used census or household survey data have often
made use of the proportion of children in the household that is under five (or six) to estimate the
extent of child work but also the commitment of resources to the care of the children, all of
which may negatively affect schooling outcomes. Although the effect of the proportion under
five on schooling outcomes is not so consistent, some studies have found a negative effect of a
higher proportion of the under-fives on access to secondary education (Kakuba, 2012; Rolleston,
2009; Takahashi, 2011; Wayack-Pambè, 2012).
Though not statistically significant, children surveyed in households with a bigger
number of the under-fives were less likely to have accessed secondary education than the ones in
186
households with no child or with one child aged below five years. The negative effect of the
proportion of the under-fives on access to secondary was particularly significant at 10% for
males in 2010 (OR=0.616).
5.10 Sex of Child
Findings at this level resonate with the ones at the bivariate level. Indeed while females
were only slightly more likely to be enrolled in 2006 (OR=1.054) than their male counterparts,
the gender gap seems to disappear in 2010 and this is corroborated by prior studies in the same
country (Kakuba, 2012; UBOS and ICF International Inc, 2012; Wells, 2009).
As has been seen elsewhere, gender gaps tend to narrow where overall enrolments are
generally high (Colclough, Rose, & Tembon, 2000; Lewin, 2007b;Easterly, 2009; Lewin,
Wasanga, Wanderi, & Somerset, 2011) but additionally for the case of Uganda, the efforts of the
Girls Education Movement (GEM) that has sensitized communities about the role of educating
the girl child (UNICEF, 2005) cannot be underestimated.
While the general picture seems to be fine with regard to enrolling at secondary for girls,
this masks challenges with regard to retention at that level where girls are more disfavored
(UNICEF, 2005), this being more true in the north and north east parts of the country than
elsewhere (MoES, 2012a). In addition, with regard to achievement (performance), girls generally
lag behind boys (UNEB, 2012; Wamala et al., 2013).
One strong aspect that is often concealed by country level statistics is gender inequity at
the regional level. Indeed, looking at access to secondary level by region brings out the fact that
girls in northern Uganda were more likely to be excluded from secondary education in
2006(OR=0.644) and five years later (OR=0.611) and this contrasts with findings from most of
the other regions. Several reasons could explain this as to be seen hereunder.
Since the northern region was found to be the poorest in terms of average incomes of
household heads and the proportion of the people below the poverty line (UBOS, 2010b), it may
187
not be wrong to argue that girls’ education is constrained by poverty as was the case in Malawi
(Kadzamira & Rose, 2003). Indeed in cases of scarcity, it is the education of the girl child that
suffers most as found out by Boyle, Brock, Mace, & Sibbons (2002), following a comprehensive
study of six low income countries (i.e. Uganda, Zambia, Bangladesh, Nepal, Kenya and Sri
Lanka).
While poverty could partly be the explanation for poor education outcomes for the girls,
Colclough et al. (2000) contend that gendered outcomes of under enrolment is a product of
culture than poverty.
This study made efforts to understand region specific reasons why girls were
disadvantaged with regard to accessing secondary education in the north. This was not very easy
because no comprehensive study of this nature has been carried out throughout northern Uganda.
With the help of isolated qualitative studies done in some parts of northern Uganda though, this
study was able to isolate causes like:-culture where education of girls was blamed for making
them “prostitutes”, negative community attitudes where parents often preferred to marry off their
daughters in return for bride price, lack of separate stances for girls in schools and lack of
sanitary pads for girls, especially in the early stages of their menstruation (Kakuba & Kahunga,
2008; Kakuba, Katsirabo & Katunguka, 2011).
In addition, other studies have linked the problem to the fact that girls have to walk long
distances to school and hence are exposed to harassment and rape by wrong people on the way
and a gendered division of labor at the household level where girls are often involved in fetching
water, firewood and doing most of the household chores (Kamuli et al., 2012). This often leads
to fatigue, poor achievement and abandonment of school.
Distance to school is a challenge in two ways; in the first place men harass girls and
sometimes rape them leading them to become pregnant and or get disgusted with schooling but
secondly, the fear that their daughters may be harassed and or impregnated makes parents
reluctant to send “old” girls to school as being impregnated is culturally regarded as a sign of
poor upbringing especially by the mothers and a shame to the parents.
188
The culture of valuing cows (especially in the north-east) and hence promoting early
marriages in a situation where abortion is illegal, culturally unacceptable and mechanisms to do
it are largely wanting (Boyle et al., 2002; Kamuli et al., 2012) were also other reasons explaining
higher dropouts for girls in the north east part of Uganda.
These results are corroborated by field findings where several respondents pointed to
teenage pregnancy and early marriages as the main reasons for girls’ dropouts. To elucidate this,
an official working for an NGO sponsoring children in greater northern Uganda at secondary,
pointed out that even where fees of the children were met by the NGO, most of the girls who
dropped out of the program did so because of early marriages, teenage pregnancy and poor
academic performance, in that order.
5.11 Proportion of Older adults
In 2006, an increase in the number of older adults (60 and above) in a household was
associated with reduced chances of accessing secondary education by children in that household
although this was largely significant for males. In 2010, while this factor is still significant for
males, the results seem to contradict what was observed in 2006 as an increase in the number of
older adults was associated with increased chances of enrolment at secondary for the males.
In a situation of high adulthood mortality especially for males, could these old people
enhancing the education of boys be females that come in to supplement household income and
improve educational outcomes as was the case in Kenya (Kabubo-mariara & Mwabu, 2007)?
The contradiction in the results over the two periods may also be related to the quality of data,
especially in 2010.

189
5.12 Age of household head
Both extremes on the continuum of age of the household head may influence access to
secondary education negatively. Young household heads may themselves be vulnerable and have
no resources to invest in education of their siblings while the very old heads may be too weak to
work and invest in the education of their children or people under their roof. These results seem
to show that generally, older heads were more likely to have their children enrolled at secondary
than younger ones although this was significant in 2010. Indeed, the chances for accessing
secondary were higher for middle aged heads (OR=1.368) although this was significant at 10%.
Given that the dependent variable was educational attainment and due to issues related to
late entry into school and late progression, the positive correlation between age of the heads and
educational attainment may be explained by this fact.
5.13 Sex of household head
While some studies have found that children under female heads have better chances of
education, sex of the household head as for this study was found to have no influence on access
to secondary education by children. This was true for 2006 and 2010 as well as for males and
females. Interestingly, a prior study that used Uganda Demographic and Health Survey data for
2006 and 2011, found that children under females heads were more likely to access secondary
education than those under their male counterparts (Kakuba, 2012). While this study considered
the youth aged 18-24 years, the general deviance in the findings points to data quality issues
these being results of survey data.
190
5.14 Household size
The effect of household size on access to secondary education seems to be ambivalent
and only significant for males in 2010. Indeed, in 2010, an increase in household size seems to
increase the chances of males’ enrolment at secondary.
5.15 Presence of natural father in household
Both the presence /absence of the natural father in the household hood and or paternal
orphanhood status of children had no effect on their chances of accessing secondary education in
2006 and 2010. While in 2010 paternal male orphans seemed to be slightly at an advantage, this
was only significant at 10%.
5.16 Presence of natural mother in household
As seen in section 5.15, the presence /absence of the natural mother in a household as well as
maternal orphanhood status of children had no effect on their chances of accessing secondary
education in 2006 and 2010. These findings are corroborated by those by Lloyd & Blanc (1996)
where orphanhood was found to have no effect on schooling outcomes in seven countries in
Sub-Saharan Africa. In the same logic, the effect of orphanhood on education was found to be
ambivalent given the role of the extended family (Ntozi, 1997) and or Non-Governmental
Organizations, in cushioning the otherwise detrimental effects (Kobiané et al., 2005). This
however may mask the effects of orphanhood on schooling at the regional, district or even lower
levels.
5.17 Concluding Remarks
As has been seen, the reasons why the majority of children do not access secondary
school are more related to dropouts at primary than failing to enroll in school in the first place

191
and making a transition from primary to secondary. This implies therefore that efforts to work
towards the attainment of the MDGS and EFA goals and probably accessing secondary
schooling, should be geared more towards fighting dropouts and less of improving access to
basic education and transition to secondary.
Socio-economic factors like household income, main source of employment and
education level of the household head remain strong correlates of retention in school and
progression to the next level, before and after the universal secondary education initiative of
2007 leading to questioning the “equity and social justice considerations” at the center of the
policy. If a child continues to access secondary school because he/she is from a better placed
household, then the role of the policy that will not cause social mobility out of poverty for
especially “first generation students” that badly need it for themselves, their younger siblings and
to kick start the breaking of the viscous cycle of disadvantage, is in question.
The effects of socio-economic factors on accessing secondary schooling may be direct
and indirect. While the direct ones are clearly discernible and can therefore be more easily dealt
with, the indirect ones may be both long term and are likely to operate through what has been
termed as “manifestations of poverty” to influence learning outcomes e.g. achievement and
schooling outcomes like retention in school and progression to higher levels.
Household income or welfare may influence access to secondary education through
dictating, inter alia, age at entry into basic education, the chances of attending pre-primary
education, type of school attended, the health and nutritional status of children, regularity of
school attendance and the type of school equipment a child may have access to, all of which have
far reaching implications for learning and therefore schooling outcomes. Indeed most of the
income related factors that influence schooling do so through their impact on achievement
(performance).
Rural-urban and regional differentials in demand for secondary schooling may also be
related to differentials in income levels given a range of income related factors that still influence
primary schooling and that secondary school provision is increasingly in the hands of non-
regulated non-state providers. Contrary to the prognosis of stakeholders in education at the EFA
summit in Dakar, that private providers would help provide an alternative and hence reduce

192
pressure on public educational infrastructure, they are largely urban based and attended by the
children of the “minority rich”, have taken up a disproportionate share of the best teachers,
school administrators and quality parents that would help improve conditions in the public
schools. This rural-urban (or even private-public) dichotomy, risks recycling advantage or
disadvantage and exacerbating the gap between the rich and the poor whose implications for
social and political stability and sustainable development leave a lot to desire.
Besides, spatial differences in demand for education seem to be rooted in inequities in
supply of education as evidenced by differences in the number of schools and or classrooms at
the regional level. This is vindicated by the fact that the initiative to establish new schools
(especially at secondary level) is almost an exclusive responsibility of private actors that rely on
either demand and or the vigilance of parents (in case of community or church schools). How
then will underserved communities be brought on board if government does not take the
initiative to build schools, badly needed to redress these spatial differences, in the spirit of
“universalizing education”?
Besides, the “concentration” of good education in the central and especially Kampala and
bad education in the periphery, especially in the north and north-east, are two realities on both
sides of the same coin. As it is true that education is one major determinant of income and hence
personal and societal growth and development, then this phenomenon will trigger (if it has not)
an unnecessary dichotomy where being in the central will be associated with being better-off
socio-economically speaking while being in the rural and more so in the north will be equated to
being condemned to perpetual doom. The massive rural urban migration by especially boda-
boda (motor cycles commonly used for transport in the urban areas) riders into the city
(something the middle class is disgusted with) is partly a consequence of spatial inequities in
educational opportunities that risk being exacerbated if policy doesn’t redress them.
Whereas gender differences in access to secondary schooling seem to have been eclipsed,
other issues like retention of females at secondary, poor achievement of girls and inequities at
lower geographical levels especially in the northern part of the country need to be redressed. The
need is more real especially given the role of women’s education in enhancing fertility decline,
193
better health, nutritional and educational outcomes for children, all of which may accelerate the
demographic transition and cause economic development.
While an increase in the number of the under-fives was associated with less chances for
secondary schooling, the role of elder children in educating their younger siblings, that probably
moderates, the impact of family size on children’s education cannot be underestimated. Its
sustainability however is questionable in a context of increased urbanization, modernization and
nuclearisation of families.
Whereas there is a strong debate on why the poor cannot educate their children with one
side arguing that they are not able and the other contending that they do not care, this study
agrees with the argument of Boyle et al. (2002) when they state that “the poorest and their
children indeed value education and usually have clear and rational reasons for not participating
or participating infrequently” (p.45) following a study of six countries (i.e. Uganda, Zambia,
Bangladesh, Nepal, Kenya and Sri Lanka). Indeed, the fact that universalization of education has
been followed by massive enrolments, especially by children of the poor and or illiterate parents,
just only for them to drop out thereafter, gives credence to these authors’ argument. It also
implies that the solution to enhancing retention in school and consequent access to secondary
schooling has more to do with further subsiding education and or economically empowering
households and less of “sensitizing” parents on the importance of education.
In the final analysis, dropping out (or retention) of school is a complex matter for not
only does it operate through many intermediate factors and over a long time, but also because it
can be more of a result of a combination of the main factors. To expound on the last point, a girl
child, from the rural, born to illiterate and poor parents and in a community that is biased against
education of girls, will almost never dream of attaining some reasonable level of education
because of the unfortunate combination of all those factors. Solutions to dropouts and improving
access to secondary therefore involve understanding and internalizing the complexities
surrounding the interactions among intermediate factors as well as the main factors influencing
learning and educational outcomes but also the “long term” dimensions they may exhibit.
Since the main thrust of this study was “access” to secondary education that of course
may be constrained by dropouts at primary as discussed, the next chapter will tackle access from

194
the perspective of transition. Who is likely to transit to the next level and what factors influence
transition? Are they different from the ones seen? Do they operate through similar intermediate
factors etc.? These and others are the questions to be responded to in the next chapter.
195
CHAPTER SIX : EVOLUTION OF INEQUALITIES IN ACCESSING SECONDARY SCHOOLING: A TRANSITION MODEL.
While the previous chapter tackled access to secondary schooling from a global
perspective and emphasized reasons for dropouts for children of secondary school age that were
not at secondary, this chapter tackles access to secondary from a “transition perspective”. Indeed
it would be a strong assumption to imagine that all children do not access secondary because
they did not complete primary. The other novelty in this approach is that it endeavors to
understand whether the factors that influence access to secondary generally and transition in
particular, are different, but also whether they operate through similar or dissimilar pathways to
affect access to secondary schooling.
After the primary cycle and as has been observed in the rest of Sub-Saharan Africa
(Lewin, 2007; Ohba, 2012), the number of children admitted to the next level in Uganda is
limited to the number of places available. This is compounded by the fact that about 69% of
secondary schools (as opposed to 30% of primary schools) are privately owned (figure 6), a good
number of government schools are boarding schools and therefore almost as expensive as
private schools and that most of these schools do not implement the Universal Secondary
education Program. After sitting a nationally managed Primary Leaving Examination (PLE),
children are selected to access various schools that include the old prestigious church founded
but also called “government schools”, other schools founded, run and managed by church
organizations, the for-profit privately owned schools, community schools that are largely
founded and managed by the communities and the “USE” schools, that are largely locally
(district or sub-county) based newly founded government day schools.

196
In principle, any pupil who obtains aggregates 104 to 28 is eligible for secondary school.
However, due to inadequacy in supply of secondary schools, even obtaining the first grade (from
aggregate 4 to 12) is not enough for a child to enroll in especially the old prestigious government
schools. Taking the example of Primary Leaving Examination results for 2013 released in
January 2014, of all the 560,784 candidates who sat for the final exams, only 52,786 (9.4%)
passed in division (grade) one (New Vision, 2014) and yet even for these, getting a place in a top
or even middle level secondary school is quite often not obvious.
Whereas there is a national selection exercise to determine who should go to which
school, the practice is that immediately after the PLE results are out, parents (mostly the urban
elite) move from school to school trying to get vacancies for their children. The selection often
takes some children on merit but the majority of children, especially in the prestigious
government schools, are taken through “backdoor methods”. Indeed, over and above the good
performance of the pupil, obtaining a vacancy, especially in the “old church founded
government” schools is largely influenced by parents’ social and political connections, their
ability to pay and to some extent, their religious affiliation.
According to Ministry data, transition between primary and lower secondary has indeed
improved from 51% in 2006 to 65% in 2011(MoES, 2012b). While this is an impressive
milestone with regard to improving transition, it does not take into consideration the increase in
absolute number of children that have been completing primary seven over the years (despite low
survival rates to primary 7 in relative terms) that may in turn be related to the annual growth rate
of the population in general, and the growth rate of the schooling population, in particular.
In this study it was not very possible to measure transition (from the etymological sense
of the term) on the basis of the datasets available. In the first place those who transit should have
sat and passed PLE but we did not have a question on this important piece of information in the
datasets. Besides, while in 2010 a question was asked on the grade attended in the preceding
10 Aggregate 4 implies that the pupil has obtained distinctions 1 in each of the four examinable subjects i.e. English, Mathematics, Science and Social Studies. On the other hand 28, implies obtaining at least “pass” 7 in each of the subjects. Beyond 28, the pupil has failed and is not supposed to progress to the next level and or benefit from the “USE” subsidy. In practice though, some of these pupils are admitted in some private schools.
197
year as well as at survey time, these two questions were not asked in 2006 and so comparability
was not possible. In addition, in the case of 2010, the observations were so few that any
meaningful multivariate analysis could not be done.
As a way out, this study looked at the children aged 13-24 who had completed Primary 7
(last grade of the primary cycle) as opposed to children in the same age cohort who had enrolled
past the primary level. A binary outcome where “having ever enrolled at a post-primary
institution” was thus created taking the value 1, while “completing P7 and not going beyond”
took the value 0. Whereas this scenario may not measure transition over a two year period, it is
the closest possible alternative to exploring determinants of transition.
Like in the previous chapter presentation of findings in this chapter is on the basis of the
strength of variables in explaining transition to secondary. In this regard, socioeconomic factors
like household wealth and education of the head come first followed by a socio-demographic
factor like marital status of household head and then community level factors like region and
place or residence. Factors that are least significant like sex of child and head, residential and
survival status of the father and relationship to the household head come last.
Results of a logit model for all children and then by sex are presented in table 13 and the
discussion follows thereafter. As seen in the previous chapter, interpretation of results is by use
of Odds Ratios for categories or variables that were statistically significant.
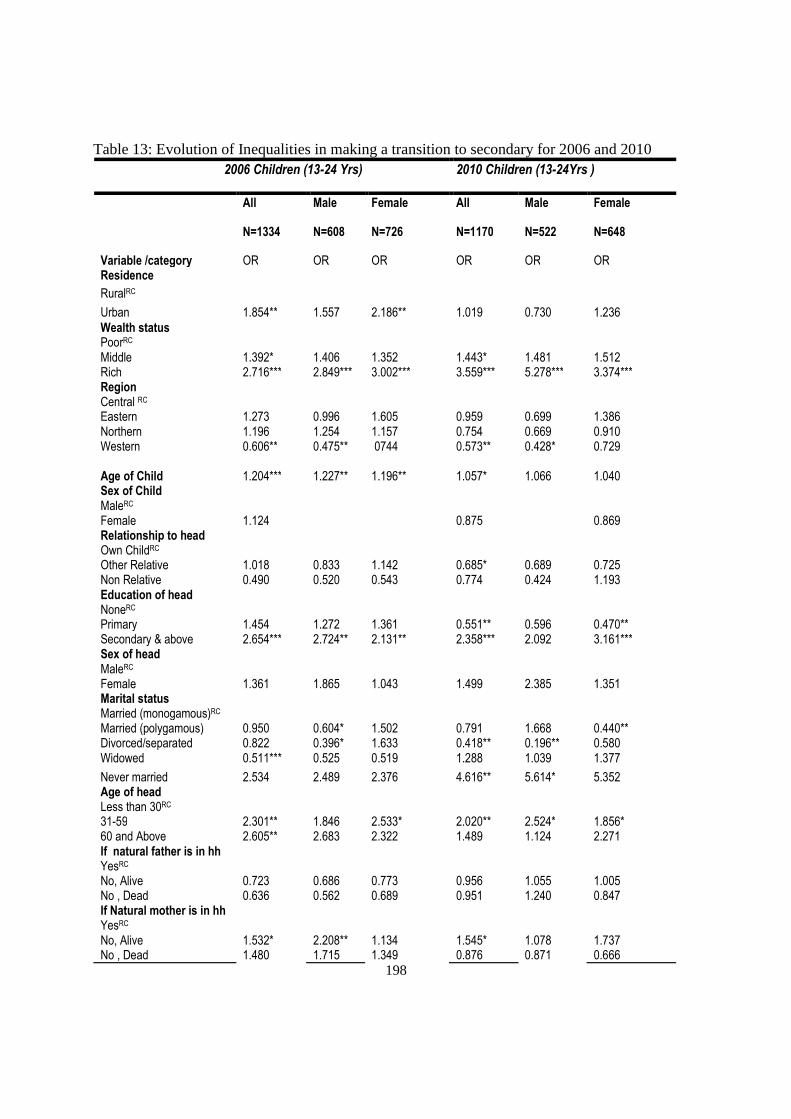
198
2006 Children (13-24 Yrs) 2010 Children (13-24Yrs )
All Male Female All Male Female
N=1334 N=608 N=726 N=1170 N=522 N=648
Variable /category OR OR OR OR OR OR Residence
RuralRC
Urban 1.854** 1.557 2.186** 1.019 0.730 1.236
Wealth status PoorRC Middle 1.392* 1.406 1.352 1.443* 1.481 1.512 Rich 2.716*** 2.849*** 3.002*** 3.559*** 5.278*** 3.374*** Region Central RC Eastern 1.273 0.996 1.605 0.959 0.699 1.386 Northern 1.196 1.254 1.157 0.754 0.669 0.910 Western 0.606** 0.475** 0744 0.573** 0.428* 0.729 Age of Child 1.204*** 1.227** 1.196** 1.057* 1.066 1.040 Sex of Child MaleRC Female 1.124 0.875 0.869 Relationship to head Own ChildRC Other Relative 1.018 0.833 1.142 0.685* 0.689 0.725 Non Relative 0.490 0.520 0.543 0.774 0.424 1.193 Education of head NoneRC Primary 1.454 1.272 1.361 0.551** 0.596 0.470** Secondary & above 2.654*** 2.724** 2.131** 2.358*** 2.092 3.161*** Sex of head MaleRC Female 1.361 1.865 1.043 1.499 2.385 1.351 Marital status Married (monogamous)RC Married (polygamous) 0.950 0.604* 1.502 0.791 1.668 0.440** Divorced/separated 0.822 0.396* 1.633 0.418** 0.196** 0.580 Widowed 0.511*** 0.525 0.519 1.288 1.039 1.377
Never married 2.534 2.489 2.376 4.616** 5.614* 5.352 Age of head Less than 30RC 31-59 2.301** 1.846 2.533* 2.020** 2.524* 1.856* 60 and Above 2.605** 2.683 2.322 1.489 1.124 2.271 If natural father is in hh YesRC No, Alive 0.723 0.686 0.773 0.956 1.055 1.005 No , Dead 0.636 0.562 0.689 0.951 1.240 0.847 If Natural mother is in hh YesRC No, Alive 1.532* 2.208** 1.134 1.545* 1.078 1.737 No , Dead 1.480 1.715 1.349 0.876 0.871 0.666
Table 13: Evolution of Inequalities in making a transition to secondary for 2006 and 2010
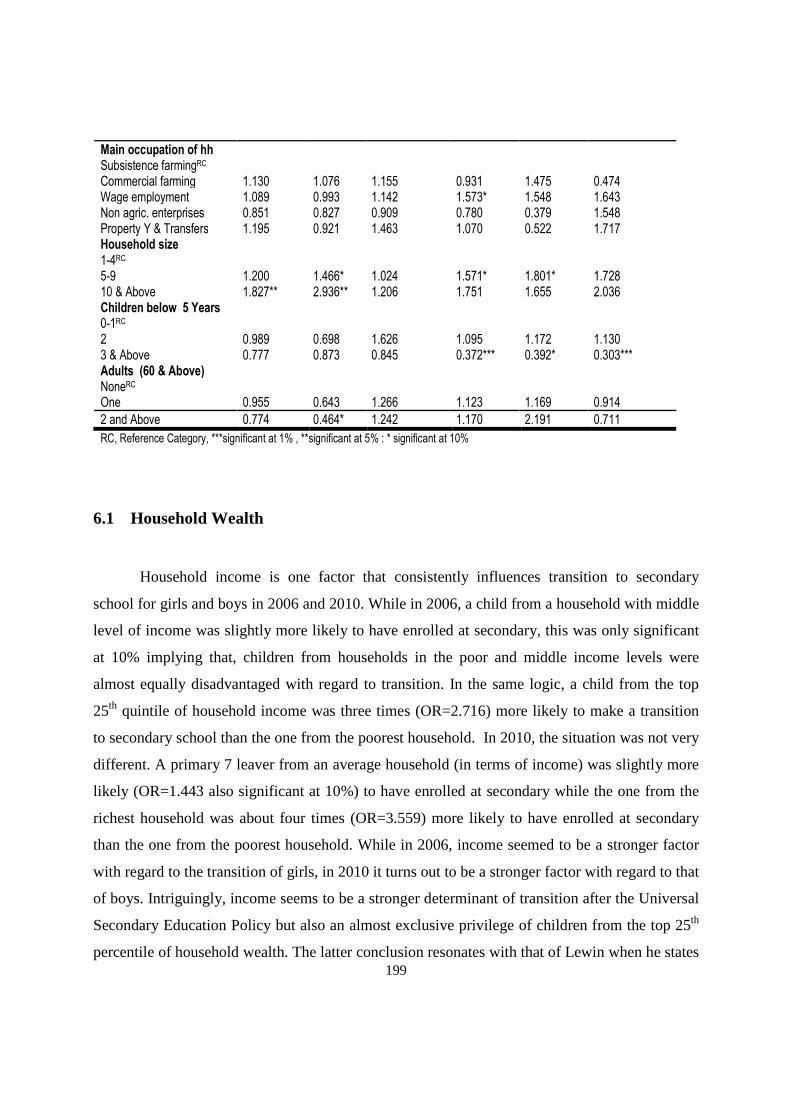
199
Main occupation of hh Subsistence farmingRC Commercial farming 1.130 1.076 1.155 0.931 1.475 0.474 Wage employment 1.089 0.993 1.142 1.573* 1.548 1.643 Non agric. enterprises 0.851 0.827 0.909 0.780 0.379 1.548 Property Y & Transfers 1.195 0.921 1.463 1.070 0.522 1.717 Household size 1-4RC 5-9 1.200 1.466* 1.024 1.571* 1.801* 1.728 10 & Above 1.827** 2.936** 1.206 1.751 1.655 2.036 Children below 5 Years 0-1RC 2 0.989 0.698 1.626 1.095 1.172 1.130 3 & Above 0.777 0.873 0.845 0.372*** 0.392* 0.303*** Adults (60 & Above) NoneRC One 0.955 0.643 1.266 1.123 1.169 0.914
2 and Above 0.774 0.464* 1.242 1.170 2.191 0.711
RC, Reference Category, ***significant at 1% , **significant at 5% : * significant at 10%
6.1 Household Wealth
Household income is one factor that consistently influences transition to secondary
school for girls and boys in 2006 and 2010. While in 2006, a child from a household with middle
level of income was slightly more likely to have enrolled at secondary, this was only significant
at 10% implying that, children from households in the poor and middle income levels were
almost equally disadvantaged with regard to transition. In the same logic, a child from the top
25th quintile of household income was three times (OR=2.716) more likely to make a transition
to secondary school than the one from the poorest household. In 2010, the situation was not very
different. A primary 7 leaver from an average household (in terms of income) was slightly more
likely (OR=1.443 also significant at 10%) to have enrolled at secondary while the one from the
richest household was about four times (OR=3.559) more likely to have enrolled at secondary
than the one from the poorest household. While in 2006, income seemed to be a stronger factor
with regard to the transition of girls, in 2010 it turns out to be a stronger factor with regard to that
of boys. Intriguingly, income seems to be a stronger determinant of transition after the Universal
Secondary Education Policy but also an almost exclusive privilege of children from the top 25th
percentile of household wealth. The latter conclusion resonates with that of Lewin when he states
200
that “secondary schooling excludes most children from below the 20th percentile of household
income in low enrolment countries” (Lewin, 2007b p.4).
Challenges with transition are most likely to be related to the cost of secondary schools
more so in the era of increased privatization of secondary education provision and the fact that
most of the good schools at this level are boarding schools. With the help of field data, this study
was able look at the costs involved in making a transition to various secondary schools in the
Northern (most educationally deprived) and Central Regions (most educationally endowed) of
Uganda as can be seen in table 14.

201
Table 14: School Requirements for Term I in some Secondary Schools in Northern & Central Regions by type in 2013 Northern Region Central Region
11 These costs exclude transport to school, expenses on uniform, other scholastics, clothing etc.
11Requirements Government, Catholic founded Girls , Boarding school
Private for profit Boarding Mixed School
Government Universal Secondary Education Mixed ,Day School
Private, Mixed day & boarding school implementing “USE”.
Government Catholic founded Girls, Boarding school
Private for profit Boarding Mixed School
Government Universal Secondary Education Mixed, Day School
Government, Makerere University founded Mixed, Day& Boarding school
Tuition fees 4,400 520,000 198,200 41,000 858,000 661,400
Uganda Martyrs University 500
Library/Textbooks 6,000 128,000
Utilities (Electricity/Water) 10,000 103,000
Bridge Financing 10,000
Capital Development /Construction 46,500 70,000 12,000 10,000 534,750 20,000 180,000
Teachers‘ Resource Centre 500 1,500
Uganda National Students’ Association
800 300 2,000
Food fee /lunch 180,000 70,000 85,000 207,600 30,000
Church Contribution 1,000 1,000
Practical Subjects 12,000
School Bus /transport 30,000 8,000 16,000
Parents Teachers Association fees/Administration
75,700 60,000 144,000
30,000
Secondary School Science and Mathematics Teachers
1,000 1,000 1,000 1,000
Co-curricular 10,100
ICT Digital Science 7,500 8,000
Maintenance 5,500
Sports Activities 1,000 5,000 5,000
National Association of Secondary School Teachers of Uganda 500 500
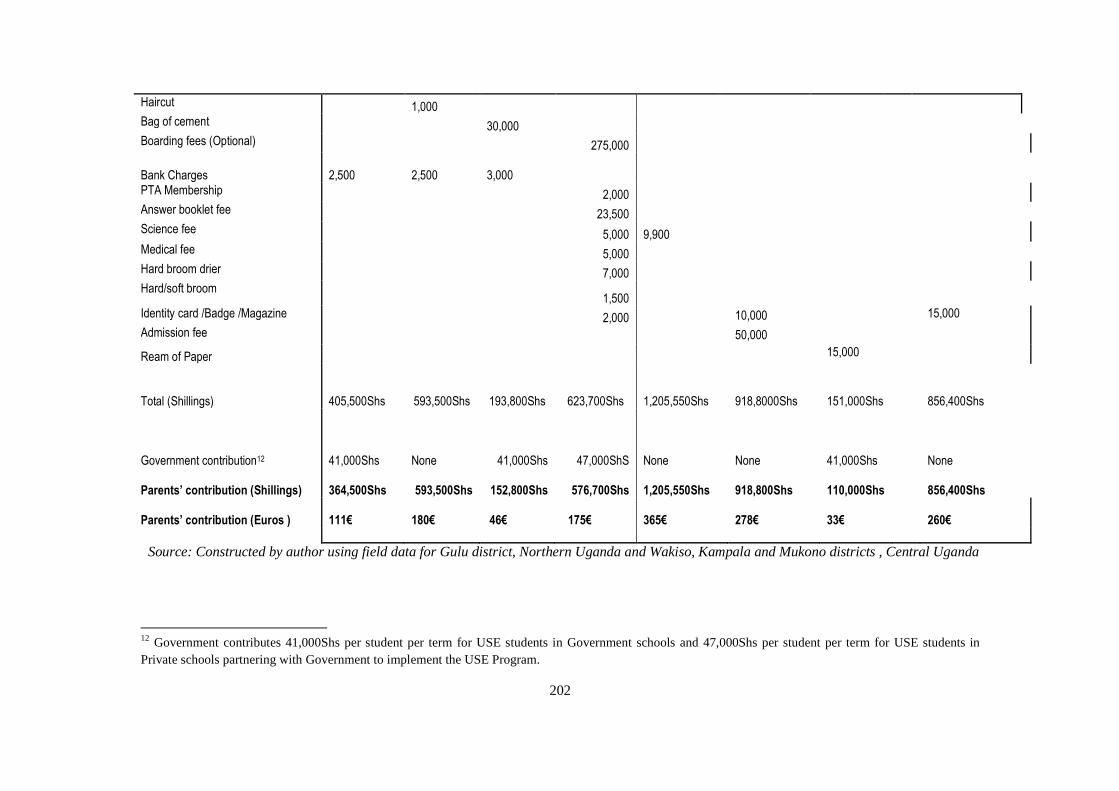
202
Source: Constructed by author using field data for Gulu district, Northern Uganda and Wakiso, Kampala and Mukono districts , Central Uganda
12 Government contributes 41,000Shs per student per term for USE students in Government schools and 47,000Shs per student per term for USE students in Private schools partnering with Government to implement the USE Program.
Haircut 1,000
Bag of cement 30,000
Boarding fees (Optional) 275,000
Bank Charges
2,500 2,500 3,000 9,900
PTA Membership 2,000
Answer booklet fee 23,500
Science fee 5,000
Medical fee 5,000
Hard broom drier 7,000
Hard/soft broom 1,500
Identity card /Badge /Magazine 2,000 10,000 15,000
Admission fee 50,000
Ream of Paper 15,000
Total (Shillings) 405,500Shs 593,500Shs 193,800Shs 623,700Shs
1,205,550Shs
918,8000Shs
151,000Shs
856,400Shs
Government contribution12 41,000Shs None 41,000Shs 47,000ShS
None
None
41,000Shs
None
Parents’ contribution (Shillings) 364,500Shs 593,500Shs 152,800Shs 576,700Shs 1,205,550Shs
918,800Shs
110,000Shs
856,400Shs
Parents’ contribution (Euros ) 111€ 180€ 46€ 175€
365€
278€
33€
260€

203
Table 14 presents the average costs (for term I) of accessing secondary education in
Northern and Central Uganda. While these statistics may not be representative for the whole
country and exclude costs on uniforms, stationery and other personal effects for the students
at the beginning of the year, they give insights into the extent of the burden in making a
transition to secondary in non-government and “government” schools in the country. It
should be noted that the north is a region that is most educationally deprived and the poorest,
while the Central region is the richest and presents with the best educational outcomes. As
per 2010, the average monthly household income for the north was about 141,400Shs(43€)
while that for the central was 389,600Shs (118€) (UBOS, 2010b).
Some conclusions may be drawn from the data in table 14 thus (i) an average
northerner (from northern Uganda) would need an equivalent of his/her four months income
to pay for one child in a private for profit secondary school for term I; (ii) an equivalent of
close to three months income to pay for one child’s first term’s school requirements in a
government boarding secondary school; (iii) slightly more than his/her monthly income to
enable a child access education in a USE, presumably “free secondary school” ; and (iv)
while average monthly incomes were higher in the central region, the costs of accessing
secondary school were equally higher than in the north.
For the case of the Central region, on average, a parent would need to mobilize an
equivalent of his/her three months’ salary to enable one child make a transition to a top
government school (ranked by performance), an equivalent of his/her two months’ salary to
enable their child enroll for first term in both an averagely good government or private
secondary school and approximately one third of their salary to enable a child transit to a 13USE school. A closer look at the tables brings out the fact that not all government schools
are Universal Secondary Education (or free) schools and that where government shares the
responsibility with parents, the contribution of parents is by far higher than that of
government in all the schools including the purely USE schools where it is about three to
four times that of government.
The last point is corroborated by remarks of a head teacher in a rural USE school thus:
13 The charges for accessing a USE school for the Central Region appear to be unusually low implying that the respondent could have hidden some costs from the researcher for fear of being interrogated by government officials.
204
“I think USE is adding very little and indeed very little because when you look at
the government contribution, you find that parents are paying 3-4 times than what
the government is giving.” (Head teacher in a USE Rural Mixed School, Graduate,
and 52 Years Old)
The situation of making a transition to secondary is more complex than these
statistics may portray because of the following reasons. First, there are other requirements to
meet like uniforms14, scholastics, transport to school, personal effects, clothing and
sometimes medical care. Secondly most households have several children to look after (total
fertility rate for Uganda was about 6.2 (UBOS and ICF International Inc, 2012). Thirdly,
there are more demands at the household level like feeding, school dues for other children,
medical care, rent, fuel and energy, transport and communication, household and personal
effects etc. Finally because most people are engaged in peasant agriculture, income is
dependent on seasons and hence not stable as these seasons do not necessarily correspond to
school opening.
6.2 Education of household head
Education of the household head seems to be a very strong factor explaining
differentials in transition outcomes for children in 2006 and 2010. In 2006, a child whose
head had at least secondary education was about three times (OR=2.654) more likely to
transit to secondary than his/her counterpart whose head had never been to school. While in
2010, children whose heads had primary education were less likely to transit than children of
uneducated heads (OR=0.551), again children under heads with at least secondary education
were about two times (OR=2.358) more likely to have transited than the ones of uneducated
heads. Three important remarks need to be made here i.e. (i) in the recent past, education of
the head seems to be a stronger factor for females’ transition than that of males;(ii)
inequalities in making a transition by education of head seem to have slightly diminished
and finally; (iii) despite the previous point, educational chances continue to be largely
recycled since children under both illiterate and primary level heads (who never accessed
secondary) seem to be equally disadvantaged with regard to making a transition. The last
14 It was not possible to get data on the cost of school uniforms for all the schools under comparison.
205
point could probably be explained by increasing income inequalities in Uganda in the recent
past given that education was found to be a key determinant for the inequalities
(Ssewanyana & Kasirye, 2012), constraints of education supply at the post primary level, the
issue of boarding schools and the fact that secondary education is increasingly managed and
run by non-state actors.
Educated parents are more likely to be urban based and enjoy advantages of supply
of secondary schools, have their children study in private primary schools and hence
perform better, have the financial means to meet the scholastics and probably private
tutoring of their children and provide the right environment for their performance. In
addition, because of the lobbying that takes place to get a vacancy at the post-primary level,
chances of getting a vacancy are higher for the educated owing to their political, social and
economic capital.
6.3 Marital Status of household head
In 2006, all children under widowed heads were less likely (OR=0.511) to have
made a transition to secondary whereas for the boys, failure to transit was largely due to
divorce or separation of parents (OR=0.396). In the more recent past (2010), all children
were less likely to transit due to divorce/separation of parents (OR=0.418) although this was
a stronger factor for the male children (OR=0.196) while for the females, the chances of
transition were largely dwarfed by polygamy (OR=0.440). As already seen in the previous
chapter, children under heads that were never married were about five times (OR=4.616)
more likely to transit than the ones under monogamous heads and this was more beneficial
to boys (OR=5.614) than girls. Both the negative effects of polygamy and positive effects of
especially single male headship on secondary schooling had been documented in a prior
study (Wayack-Pambè & Pilon, 2011).
While polygamy may imply “resource dilution” (Buchmann, 2000) and hence less
affordability of secondary education, its nuanced effect on girls’ transition could be due to
the fact that in the event of scarce resources, it is often education of the girl child that is
mostly affected (Boyle, Brock, Mace, & Sibbons, 2002).

206
The Qualitative Module of the Uganda National Household survey indeed reported
that divorce of parents was one of the reasons for not being in school as at survey time and
that this often led children to engage in small businesses hence affecting their education
(UBOS, 2010c).
The role of elder children in looking after younger ones was found to be a common
phenomenon according to field findings. While this phenomenon may be moderating the
otherwise negative relationship between “sibship size” and children’s schooling, it is
dependent on several factors such as:- education level of elder children, their willingness
both to help and postpone their own marriage as well as their ability (as denoted by having
a stable income) to pay for others. Anecdotal evidence seems to present that it is more
common among older generations that grew up in the village and less common among the
young generations that have been born and bred in towns.
6.4 Region of Residence
In the previous chapter children in the West and the North (especially girls) were
generally excluded from secondary education as discussed. At this level, findings show that
while children from all the other regions were not necessarily less likely to make a transition
to secondary than their counterparts in the Central, children in the West and more so males
were less likely to transit to secondary than all children in the other regions in 2006 and five
years later. This is surprising given that the west was not as deficient as say the East in
terms of school supply and wealth potential as seen already but given that the exclusion is
also gendered (affecting largely the boys) could be related to some challenges in the region
like work outside homes and other distractions that affect retention of the boys in school.
6.5 Place of Residence
In 2006, children surveyed in urban areas were more likely (OR=1.854) to have
made a transition to secondary than the ones in rural areas and urban residence was a
stronger factor for girls’ (OR=2.186) than boys’ transition. In 2010, place of residence
207
seems to have no influence on transition as children in both rural and urban areas were
almost equally likely to make a transition. The advantages of urban residents with regard to
better educational outcomes (and transition in this case) were adequately discussed in the
previous chapter. The rural-urban differentials in educational outcomes were related to
differences in , inter alia, incomes and household investment in schooling; number,
distribution and quality of teachers and schools, “quality” of parents and degree of parental
involvement ; quality and frequency of school supervision and home environments.
That children in the rural areas were not any more disadvantaged may be because of
the fact that the “Universal Secondary Education” Program had been implemented slightly
more than 2 years before and as has been seen elsewhere, such initiatives are normally
followed by “mass enrolments” especially by the formerly excluded although experience
shows that these same children have a higher tendency of dropping out.
The rural advantage could also be related to government’s effort of building
government founded secondary schools commonly known as “Seed Schools” largely in the
rural areas and targeting the underserved sub-counties with the help of an African
Development Bank loan of US$85 million (Ssewanyana et al., 2011). While all sub-
counties are yet to be served (by 2008, 271 sub-counties did not have a public or private
secondary school) as reported by Ssewanyana et al.(2011), and the quality in these schools is
largely wanting (MoES, 2012a), this indeed enabled children, in the previously underserved
areas to access some school within their vicinity.
Improvement in transition to secondary schooling because of the USE Policy is
attested to by a female parent, a Ministry of Education official in Gulu district and an
official of an NGO supporting children in secondary school in northern Uganda, in that
order:
“Oh …I think USE has somehow helped the formerly disadvantaged because I can
see many people have enrolled in school. Now, even those who could not afford
secondary education can at least try to raise something small to send their children
to school”. (Female Parent, Market Vendor, Primary 4 dropout, Widow)
“USE has at least improved access because according to the government policy,
208
these USE schools, especially day schools are not supposed to charge fees beyond
a certain limit”. (Ministry of Education Official, Graduate)
“Yes, it has helped children who are focused but for students who are not focused it
has not helped so much. It has helped those who could not access in any way
through the small payments that they could not have afforded”. (Official working
for an NGO in the region, requested that the NGO and his identity remain
anonymous)
Challenges with regard to the quality of education in the USE schools, was reiterated
by one Ministry official in the district thus:
“The issue is quality because now if you take your child to the UPE or USE
schools, the child may try but may not really achieve much”. (Ministry of
Education Official at the District Official, Graduate, also parent)
The other explanation is that the rural-urban dichotomy in educational outcomes may
largely be due to children’s failure to enroll into basic education in the rural areas but more
so, high dropouts especially among the rural children for reasons that were adequately
discussed in the previous chapter. In other words, if the rural children can complete Primary
seven, then they are likely to proceed to secondary and therefore tackling the rural–urban
education divide may involve more of combating dropouts and less of being preoccupied
with transition.
6.6 Age of Child
Several studies have found a negative relationship between age of a child and access
to secondary school as already seen in the previous chapter. In addition, even studies that
have focused on transition, age has also been found to be negatively related to transition
(Siddhu, 2011). In this study however, the general discernible pattern is that the chances of
transition increase with a slight increase in the age of a child. While this is true for all
children in 2006 (OR=1.204) and 2010 (OR=1.057), it is particularly significant for both
males and females in 2006. The positive association between age and transition could be
209
explained by the fact that in this model, the focus was “ever having transited” and not
“current transition status”. It means that in the numerator we have, inter alia, children that
completed secondary and those that were still, enrolled at post-secondary institutions that
were likely to be older.
6.7 Household size
An increase in household size seems to be associated with higher chances for
children’s transition to secondary in 2006 and 2010. In 2006, a child who was surveyed in a
household with (10 & above) members was approximately twice as more likely to have
transited than the one from a household of less than five members. Household size was
particularly beneficial for boy’s transition. In 2010, still a child that was found in an
averagely sized household (5-9 people) was more likely to transit (OR=1.571) and this again
was more beneficial to boys as had been documented in Burkina Faso, albeit with regard to
accessing primary school (Kobiané, 2006).
The positive effect of household size on secondary schooling is well documented
following studies in Cameroun (Wakam, 2003), Bangladesh (Ahmadi et al., 2005) and
Ouagadougou, the capital of Burkina Faso (Wayack-Pambè & Pilon, 2011) although in the
latter case it was largely true for male headed households. This positive effect could be
related to the fact that other members come into the household to help in household and
other work that may in turn improve household income, thus enabling some children
(especially those of the biological head) to progress with education (Kobiané, 2006). It
could also be related to the fact that work in the home is spread amongst siblings hence
improving attendance as was the case in Ethiopia (Colclough et al., 2000) and hypothesized
to be true following a quantitative study of Demographic and Health Survey data for 26
countries in Sub-Saharan Africa (Kravdal, Kodzi & Sigle-Rushton, 2013).
6.8 Age of household head
Both extremes on the continuum of the age of household head may influence access
to secondary education negatively. While young household heads may have no resources to
210
invest in the education of their younger siblings, the very old heads may be too weak to
work and invest in the education of people under their roof. Indeed these results tend to
agree with the above assertion as children under middle aged heads (31-59) tend to have
more chances of transition than the ones under younger heads or the older ones. Besides, in
2006 children, especially females under older heads (60 and above) were equally more
likely to transit. Could this be related to improved ability of the heads as they were likely to
have accumulated assets?
6.9 Presence of natural mother in household
Children whose mothers were alive but elsewhere, i.e. not in the household were
more likely to have made a transition to secondary than the ones with mothers present in
2006 and 2010. While in 2010, this was true for all children (OR=1.545), in 2006 it was
largely true for boys (OR=2.208).
The fact that mothers outside the home help educate their children resonates with
literature found elsewhere where despite access to fewer resources; mothers are known to
invest more in their children’s wellbeing. This could be related to the mothers working in a
different area such as a city, another region or district or even abroad and sending assistance
to the children. Indeed, the second most important reason as to why remittances (both from
within and abroad) were sent /received was to cover education expenses (UBOS, 2010b).
The fact that the assistance is more directed to the boys may imply that these mothers have
more confidence in the returns of boys’ education that in turn may benefit them, more so in
old age as remarked already.
6.10 Proportion of children under five
There is a general tendency of a decline in the chances of making a transition to
secondary with an increase in the proportion of children aged below 5 years in a household
although this is statistically significant in 2010. Indeed the probability of making a transition
is lowered for all children (OR=0.372) but a slightly bigger factor for girls (OR=0.303) than
boys (OR=0.392). Otherwise put, girls are slightly less likely (odds reduce by 70%) to

211
transit to secondary than boys (odds reduce by 60%) with an increase in the number of
children under five in a household (3& above in this case).
The negative effect of the proportion of under-fives on access (not necessarily
transition) to secondary schooling is corroborated by prior studies in Uganda and elsewhere
(Kakuba, 2012; Rolleston, 2009; Takahashi, 2011; Wayack-Pambè, 2012). In addition, a
more recent study involving a statistical analysis of DHS data for 26 countries in Sub-
Saharan Africa indeed found that an increase in the number of “preschool aged children”
tended to reduce both; transition to secondary and post primary educational attainment and
that this affected girls more than boys (Kravdal et al., 2013).
The fact that some of the older children are at the point of transiting to secondary
while others are very young (despite some few cases that these are children of other people)
is but reminiscent of high fertility in a situation where child spacing is very limited and
uptake of contraceptives is very low (only 24% of all women in the reproductive age group
of 15-49 were using some method of contraception) (UBOS and ICF International Inc,
2012).
While increased demand for labor to care for the under-fives more so by the girls cannot be
dismissed as a probable explanatory factor, the more plausible explanation for this negative
relationship may be the “dilution” of household resources because of, inter alia, high levels
of morbidity among the under-fives and hence increased expenditure on health in a country
where health service provision is largely private and therefore costly. It should also be
remembered that poorer households also tend to have more children (UBOS and ICF
International Inc, 2012).
6.11 Proportion of Older adults
Unlike in the previous chapter where an increase in older adults was associated with
better chances of education especially in 2010, in this case this factor was, statistically
speaking, not associated with transition to secondary in both 2006 and 2010.

212
6.12 Main Occupation for Household
The main source of income for the household does not seem to have strong
implications for children’s transition in 2006 and 2010. While children under households
earning largely from salaried jobs were more likely to make a transition in 2010
(OR=1.573), this was significant at 10%. This could be related to the fact that the
observations were generally few given that this variable had many categories and that
“transition was defined” in accordance with the data that was available.
6.13 Relationship to Household Head
The effect of the relationship of a child to the household head on transition to
secondary school is largely non-significant. As has been found elsewhere, relatives to the
household head as well as non-relatives were largely less likely to have transited to
secondary than the children of the household head but this was only significant for “other
relatives” and only in 2010 (OR=0.685). The fact that “other relatives” that had completed
primary 7 were less likely to transit may be related to the fact that they came into the
receiving households to study but could not probably due to financial constraints in the
sending and or receiving households. It may also be due to the fact that they just came to
stay in the new households after they could not enroll at any post primary institution.
6.14 Sex of household head
In line with other findings that have attempted to look at correlates of access to
secondary schooling (Kakuba, 2012; Rolleston, 2009), children under female household
heads were more likely to have made a transition to the secondary level than the ones under
male heads although in this study, this was largely not significant.

213
6.15 Sex of Child
Sex of the child does not seem to affect his/her chances of transition to secondary
school, at least at the national level. These findings are in agreement with results in the prior
chapters as well as other studies in the same country as seen already and point to the fact
that indeed the gender gap in education is increasingly being bridged. As already seen
however, retention of girls at the post primary level is more problematic more so in the
north and north east parts of the country (MoES, 2012a). This is partly due to late entry into
secondary (Wells, 2009), which, in the context of long distances to school, a gendered
division of labor at household level, poor facilities for girls at school level and negative
attitudes to girls’ education in some of the communities, often leads to dropouts. Early
marriages and teenage pregnancies, partly related to some of the factors mentioned, are also
responsible for poor retention of girls at the post primary level as found out from the field
interviews.
6.16 Presence of natural father in household
Both the presence /absence of the natural father in the household and or paternal
orphanhood status of children had no effect on their chances of making a transition to
secondary education in 2006 and 2010.
Having looked at factors affecting transition and overall access to secondary, it may
be important to understand where most challenges are, which in turn may guide policy on
where to put most emphasis while redressing education inequalities. To get a more global
picture, the main significant variables across various models are looked at in the subsequent
section.
6.17 Evolution of Inequalities by level of access
As already pointed out, here we are interested in seeing how inequalities evolve
along the education ladder. To make this possible, this study includes a model on access to
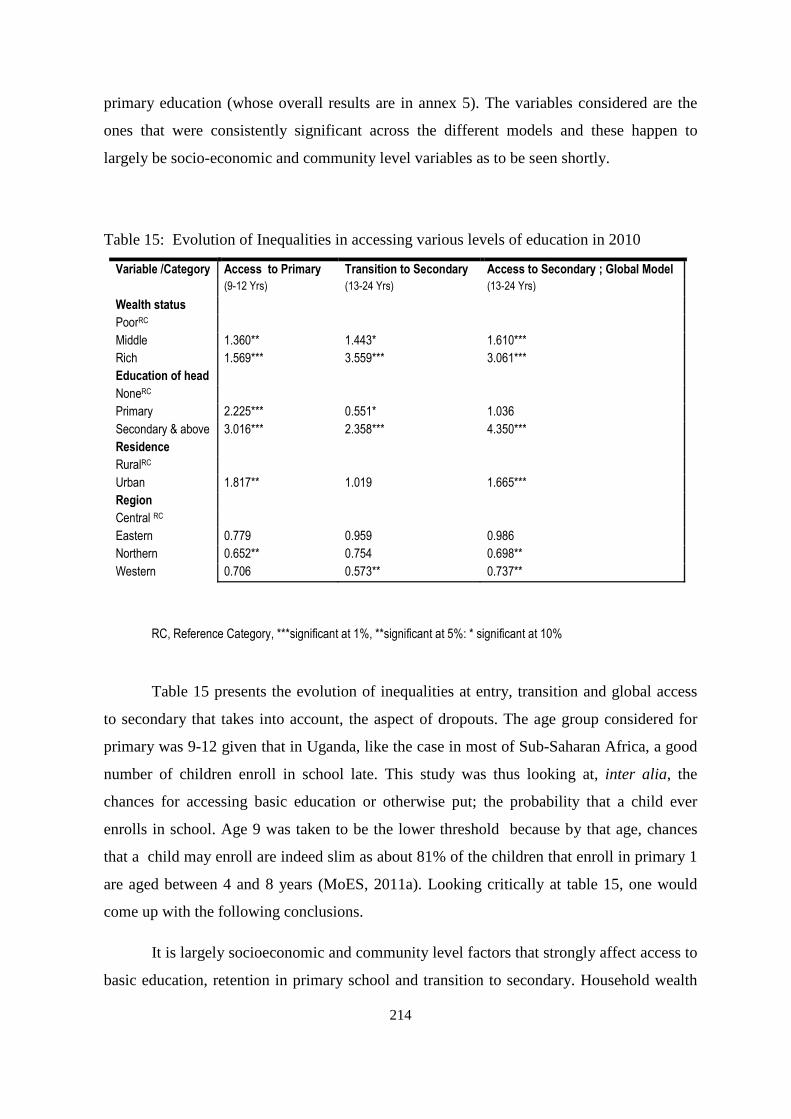
214
Variable /Category Access to Primary Transition to Secondary Access to Secondary ; Global Model
(9-12 Yrs) (13-24 Yrs) (13-24 Yrs)
Wealth status
PoorRC
Middle 1.360** 1.443* 1.610***
Rich 1.569*** 3.559*** 3.061***
Education of head
NoneRC
Primary 2.225*** 0.551* 1.036
Secondary & above 3.016*** 2.358*** 4.350***
Residence
RuralRC
Urban 1.817** 1.019 1.665***
Region
Central RC
Eastern 0.779 0.959 0.986
Northern 0.652** 0.754 0.698**
Western 0.706 0.573** 0.737**
primary education (whose overall results are in annex 5). The variables considered are the
ones that were consistently significant across the different models and these happen to
largely be socio-economic and community level variables as to be seen shortly.
Table 15: Evolution of Inequalities in accessing various levels of education in 2010
RC, Reference Category, ***significant at 1%, **significant at 5%: * significant at 10%
Table 15 presents the evolution of inequalities at entry, transition and global access
to secondary that takes into account, the aspect of dropouts. The age group considered for
primary was 9-12 given that in Uganda, like the case in most of Sub-Saharan Africa, a good
number of children enroll in school late. This study was thus looking at, inter alia, the
chances for accessing basic education or otherwise put; the probability that a child ever
enrolls in school. Age 9 was taken to be the lower threshold because by that age, chances
that a child may enroll are indeed slim as about 81% of the children that enroll in primary 1
are aged between 4 and 8 years (MoES, 2011a). Looking critically at table 15, one would
come up with the following conclusions.
It is largely socioeconomic and community level factors that strongly affect access to
basic education, retention in primary school and transition to secondary. Household wealth

215
is a factor that determines access to basic education, retention in primary and transition but
also a stronger factor the higher the level of education.
Education of the household head is equally a more important factor at the higher
levels of education but seems to influence retention more than transition. Rural children
seem to be most disadvantaged with regard to; both initial enrolment and retention in school
but not transition to secondary. While with regard to region the pattern is not so consistent,
one may say that children in Western Uganda who were not necessarily excluded at initial
enrolment, were less likely to be retained at primary (had 26% less chances of progression)
but most importantly to transit to secondary (had 43% less chances of transition).
On the basis of household level-socioeconomic variables i.e. household wealth and
education of the household head one can deduce with a high degree of confidence that
inequalities in access tend to be exacerbated as one ascends the education ladder.
6.18 Concluding Remarks
While older children were more likely to have transited from primary to secondary,
the sex of a child had no influence on transition outcomes, before and after USE, confirming
an earlier observation that indeed the sex gap has increasingly been bridged. At the post
primary level however, girls were still more likely to dropout than boys for reasons
explained in this chapter.
Household income remains one of the main stumbling blocks to transition even after
the democratization of secondary education. In addition, it is clearly discernible that
children whose parents were both in the bottom 50th and middle 25th percentiles of
household income were equally disadvantaged with regard to transition to secondary. A
more intriguing remark is that household income seems to be a stronger factor influencing
transition in the aftermath of USE than before leading to question the equity and social
justice dimensions of the “universalized access” to secondary education. The latter
observation could partly be explained by deficiency of supply in secondary school provision,
increased privatization of secondary education supply as well as income inequalities and
much higher costs of secondary schooling even in the so called “government” (public)
216
schools. Affordability becomes more complex in a situation where there are several children
to look after, more needs to settle for children in school and at home and the main income
source for the majority is subsistence agriculture. It should be remembered that the latter is
subject both to: vagaries of nature, averagely low incomes due to poor methods of farming
and seasonality of harvest, hence unpredictability of income.
In line with the previous point, it is clear that children whose parents never attended
secondary school were equally disadvantaged with regard to transition to secondary.
Parents’ education was found to influence transition through income that often determines
attendance of a private primary school hence better performance in PLE, the parents’ ability
to afford requirements for secondary education and the socio-political networks that
influence obtaining a place in especially good secondary schools.
While polygamy, widowhood and especially divorce or separation were strong
factors impeding transition, elder brothers/sisters were found to play a big role in helping
their younger siblings to transit to secondary schooling. Besides, mothers that were staying
away from home were instrumental in funding secondary education for their children,
especially boys.
While household size was generally positively related with transition, this being
related to employment of other members into these households and or sharing of work
among the many children, children in households with a higher number of children aged
below five years were less likely to make a transition.
Whereas children resident in the rural areas were more disadvantaged with regard to
transition in 2006, this gap seems to have been bridged five years later. This could be related
to a policy to build “seed” schools in the rural areas in the recent past but may also be due
to the fact rural children are largely affected by dropouts at the lower level, than transition.
Besides, children but especially boys in Western Uganda had the biggest challenges with
transition. As observed in the previous chapter, socio-economic factors and to some extent
socio-demographic factors remain instrumental in influencing transition.
Other than rural–urban residence, most of the categories of children (those of the
poor, illiterate, from the West of the country, in socially unstable homes, etc.) that were
excluded from transition to secondary before the USE policy of 2007 remained so in 2010.
217
In fact, the poor seem to be worse off after the Policy than before implying that the Policy
did not help them.
In the final analysis, factors affecting access to secondary education globally are not
very different from those affecting transition although the pathways through which they
operate may differ. Indeed general access is greatly affected by dropouts at primary that are
triggered by a multiplicity of proximate determinants that may also have a temporal
dimension, while transition has more to do with issues related to affordability of secondary
school. Finally, although the net benefits of education are associated with higher, rather
than, lower levels of education, challenges in accessing education tend to be exacerbated
with the level of education.
Accessing secondary education is one thing and accessing quality secondary
education is yet another. As already seen, some schools especially the prestigious catholic
founded boarding schools tend to offer better quality education than other types of schools.
This study therefore shall endeavor to understand inequalities surrounding access to
boarding versus day schools in order to integrate dimensions of “physical access” with
“meaningful access” as to be seen in the next chapter.

218

219
CHAPTER SEVEN : EVOLUTION OF INEQUALITIES IN ACCESSING BOARDING
This chapter explores the phenomenon of boarding schools, the extent to which it is
prevalent, how boarding facilities are rated and which children access them. Besides, on the
basis of quantitative data, the study explores the evolution of inequalities in accessing
boarding facilities by individual, household and community level factors. This study is
interested in understanding more the phenomenon of boarding schools as they are relatively
fewer, more expensive, attended by fewer students and believed to be of better quality as
defined by academic performance in this case.
While several scholars have explored issues of access to several levels of education
and the effect of privatization of education on access, little has been done with regard to
accessing boarding schools, more so in Sub-Saharan Africa. For the studies that have used
secondary data (mainly Census and DHS data), it was not possible to study the issue of
accessing boarding schools as this question is rarely included in the questionnaires of the
surveys mentioned.
The phenomenon of boarding schools is not widespread in the West i.e. Europe and
the United States and where it exists, reasons for placing some children in boarding facilities
are varied. They include being, inter alia, an appropriate place for disadvantaged and or
struggling children, an opportunity where gifted children interact and share more amongst
themselves and avenue to accommodate children staying far from schools (Ginoglu, 2012;
Katrina, 1997; Lewin & Lu, 2011; Bass, 2013; Cookson & Persell, 1985). The latter
scenario was more prevalent in China as a result of reduced schooling cohorts (caused by
fertility decline) and hence closure of some schools, massive rural-urban migration and or
the absence of a well-developed rural transport network (Lewin & Lu, 2011).
In the United States or the United Kingdom, boarding or residential schools,
especially the elite ones are both highly selective at entry and have been found to create and
maintain social class differences as well as exacerbate class cleavages (Cookson & Persell,
1985).

220
In Africa (Uganda in this case), boarding schools were designed according to
European (British in this case) models of education. Having been established by largely
Christian missionaries, one school of thought postulates that they were meant to Christianize
the indigenous people but also impart colonial language and culture and hence “emancipate”
the young generation from “backward” cultures (Smith, 2009). Indeed in most of these
schools, speaking English and not the mother languages, was and still is strictly enforced
and the education they dispense is widely criticized for being largely based on the colonial
model.
Before “inequalities in accessing boarding facilities” is tackled, it may be important
to understand them a bit further i.e. What are they? What is government policy about them,
to what extent are they prevalent, how are they valued in terms of academic performance
and generally, and which children are more likely to access them?
In the Ugandan education System, especially at the secondary level, students may
enroll in a day school, boarding school or day and boarding school. From the perspective of
students, they can either be boarders (stay at school) or day students. Boarders are brought
to school at the beginning of the term, stay and feed at school and normally go back home at
the end of the term. The common practice is that their parents or caretakers can visit them
once a term (on visitation day), that is also a moment for the parents to discuss with the
children and their teachers the academic performance of the children.
Prior to 1989, a greater part of operational costs for boarding schools was met by
government. It is in this vein that the Education Policy Review commission recommended
(Recommendations 52 & 53) that all government aided secondary schools were to be day
schools and that where they were boarding (as some were already), the costs of boarding
were to be met by parents (MoES, 1989). This prior recommendation that was later endorsed
by cabinet through the Education White paper (MoES, 1992) is indeed reinforced by the
Ugandan Constitution and Education Act that unambiguously pronounce themselves that the
provision of education and training is the responsibility of the state, the parent or guardian
and other stakeholders (Government of Uganda, 1995, 2008). Indeed the practice is that all
costs in boarding schools (some of which are called government schools) are an exclusive
responsibility of parents.

221
In order to study inequalities with regard to accessing boarding, it is important to
look at the extent to which this phenomenon is prevalent. Basing on data by the Ministry of
education, it was not possible to estimate the number of boarders versus day students at
secondary level. It was however possible to estimate the proportions enrolled in each type of
school or the proportion of schools that were; day, boarding and then day and boarding as
seen in figure 34.
Figure 34 : Students enrolled by school type and type of secondary school in 2006 & 2010
Source: Drawn using data from the Ministry of Education and Sports
Both in 2006 and five years later, it can be seen that there were more students
enrolled in day secondary schools, followed by day and boarding schools and lastly, full
boarding schools. This pattern is also true tackling this issue from the supply perspective.
Indeed, there were largely day schools, followed by day and boarding schools and lastly, full
boarding schools. It can also be said (as per Ministry data) that while day schooling seems to
have gained momentum, boarding schooling seems to have remained marginal over the five
year period.
Building from the previous chapters that largely explored inequalities in accessing
secondary schooling, this chapter goes further to look at inequalities in accessing a boarding
facility. Since some boarding schools have been known to create and perpetuate social
classes elsewhere, is there likelihood that this is being replicated in Uganda? Are boarding
schools necessarily better than day schools? Since boarding schools are generally fewer, is
there a selective process to attend them? Is this process equally eliminative against some
children and if so, which children does it take on and which ones does it eliminate? How
has this evolved after the Universal Secondary Education Policy of 2007?

222
Qualitative and quantitative data are used to respond to most of the questions raised.
On the quantitative side, the Uganda National Household Survey collected data on the
“current school attendance status” of children and type of school attended for the various
levels of education.
For the purpose of this study it was possible to delineate the children aged 13-24 that
were attending secondary school and above at the time of the surveys and, the type of school
attended. These types included; day, boarding and day and boarding secondary schools.
With the help of data on the variable “distance to school” that was collected only from day
students, it was possible to identify children in category three that were day pupils/students
versus those who were boarders. Consequently, a variable with a binary outcome; boarders
versus day students, was created. Indeed on the basis of these datasets and with reference to
children aged 13-24 attending secondary and above, most of the children were day
scholars/students in both 2006 (54%) and 2010 (60%) and the proportion of boarders
registered a slight decline over the 5 year period (Annex 3).
7.1 The place of boarding schools in the Ugandan Education System
On the basis of qualitative data, it was possible to understand further the
phenomenon of boarding schools and possibly respond to some of the questions posed
earlier. In Uganda, most of the purely boarding schools are largely old schools established
in the colonial times and within the first 20 years of independence. They are also largely
missionary founded, but were taken over by government and so are called “government”
schools. Foundation bodies still play a big role in the running and management of the
schools and they determine who comes into the schools, the amount of fees to be paid, who
they can employ as a teacher, how much they can pay them (if they have to top up their
salaries as government pay is usually small and sometimes delays), etc. Government, on the
other hand, provides the curriculum to be taught, is the source of and manages national
examinations, pays teachers’ salaries, sometimes provides textbooks, helps or solicits
funding to help in construction of some buildings in the schools and is in charge of
monitoring and overseeing standards through support supervision.
Through field interviews, it was possible to understand further, from the perspective
of various stakeholders (parents, teachers, head teachers, district school administrators,
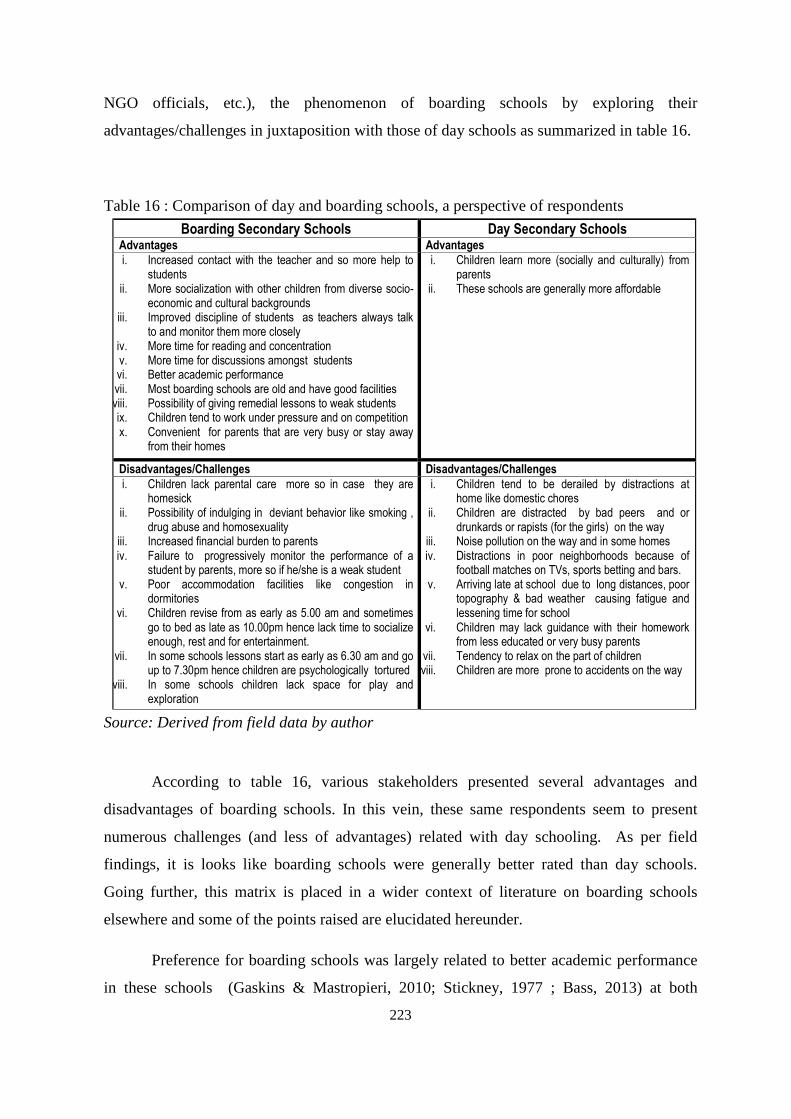
223
Boarding Secondary Schools Day Secondary Schools Advantages Advantages
i. Increased contact with the teacher and so more help to students
ii. More socialization with other children from diverse socio-economic and cultural backgrounds
iii. Improved discipline of students as teachers always talk to and monitor them more closely
iv. More time for reading and concentration v. More time for discussions amongst students vi. Better academic performance vii. Most boarding schools are old and have good facilities viii. Possibility of giving remedial lessons to weak students ix. Children tend to work under pressure and on competition x. Convenient for parents that are very busy or stay away
from their homes
i. Children learn more (socially and culturally) from parents
ii. These schools are generally more affordable
Disadvantages/Challenges Disadvantages/Challenges
i. Children lack parental care more so in case they are homesick
ii. Possibility of indulging in deviant behavior like smoking , drug abuse and homosexuality
iii. Increased financial burden to parents iv. Failure to progressively monitor the performance of a
student by parents, more so if he/she is a weak student v. Poor accommodation facilities like congestion in
dormitories vi. Children revise from as early as 5.00 am and sometimes
go to bed as late as 10.00pm hence lack time to socialize enough, rest and for entertainment.
vii. In some schools lessons start as early as 6.30 am and go up to 7.30pm hence children are psychologically tortured
viii. In some schools children lack space for play and exploration
i. Children tend to be derailed by distractions at home like domestic chores
ii. Children are distracted by bad peers and or drunkards or rapists (for the girls) on the way
iii. Noise pollution on the way and in some homes iv. Distractions in poor neighborhoods because of
football matches on TVs, sports betting and bars. v. Arriving late at school due to long distances, poor
topography & bad weather causing fatigue and lessening time for school
vi. Children may lack guidance with their homework from less educated or very busy parents
vii. Tendency to relax on the part of children viii. Children are more prone to accidents on the way
NGO officials, etc.), the phenomenon of boarding schools by exploring their
advantages/challenges in juxtaposition with those of day schools as summarized in table 16.
Table 16 : Comparison of day and boarding schools, a perspective of respondents
Source: Derived from field data by author
According to table 16, various stakeholders presented several advantages and
disadvantages of boarding schools. In this vein, these same respondents seem to present
numerous challenges (and less of advantages) related with day schooling. As per field
findings, it is looks like boarding schools were generally better rated than day schools.
Going further, this matrix is placed in a wider context of literature on boarding schools
elsewhere and some of the points raised are elucidated hereunder.
Preference for boarding schools was largely related to better academic performance
in these schools (Gaskins & Mastropieri, 2010; Stickney, 1977 ; Bass, 2013) at both
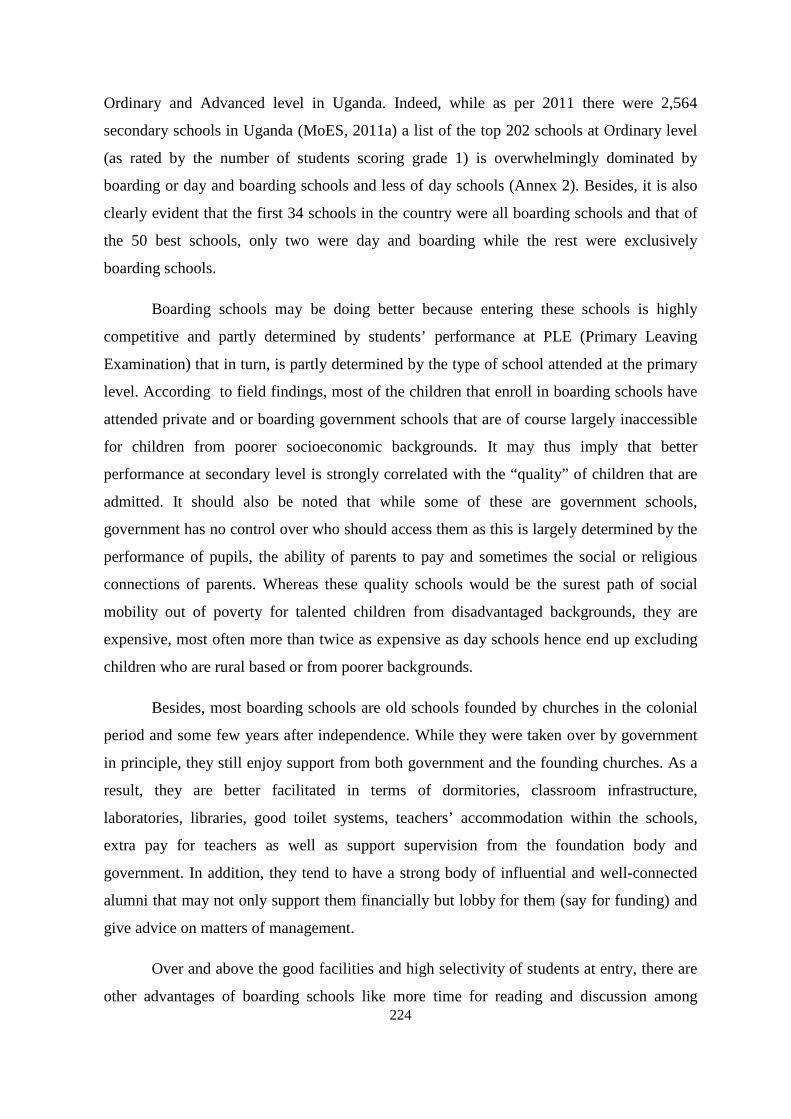
224
Ordinary and Advanced level in Uganda. Indeed, while as per 2011 there were 2,564
secondary schools in Uganda (MoES, 2011a) a list of the top 202 schools at Ordinary level
(as rated by the number of students scoring grade 1) is overwhelmingly dominated by
boarding or day and boarding schools and less of day schools (Annex 2). Besides, it is also
clearly evident that the first 34 schools in the country were all boarding schools and that of
the 50 best schools, only two were day and boarding while the rest were exclusively
boarding schools.
Boarding schools may be doing better because entering these schools is highly
competitive and partly determined by students’ performance at PLE (Primary Leaving
Examination) that in turn, is partly determined by the type of school attended at the primary
level. According to field findings, most of the children that enroll in boarding schools have
attended private and or boarding government schools that are of course largely inaccessible
for children from poorer socioeconomic backgrounds. It may thus imply that better
performance at secondary level is strongly correlated with the “quality” of children that are
admitted. It should also be noted that while some of these are government schools,
government has no control over who should access them as this is largely determined by the
performance of pupils, the ability of parents to pay and sometimes the social or religious
connections of parents. Whereas these quality schools would be the surest path of social
mobility out of poverty for talented children from disadvantaged backgrounds, they are
expensive, most often more than twice as expensive as day schools hence end up excluding
children who are rural based or from poorer backgrounds.
Besides, most boarding schools are old schools founded by churches in the colonial
period and some few years after independence. While they were taken over by government
in principle, they still enjoy support from both government and the founding churches. As a
result, they are better facilitated in terms of dormitories, classroom infrastructure,
laboratories, libraries, good toilet systems, teachers’ accommodation within the schools,
extra pay for teachers as well as support supervision from the foundation body and
government. In addition, they tend to have a strong body of influential and well-connected
alumni that may not only support them financially but lobby for them (say for funding) and
give advice on matters of management.
Over and above the good facilities and high selectivity of students at entry, there are
other advantages of boarding schools like more time for reading and discussion among

225
children, better control of discipline by teachers, an increased spirit of competition and less
distraction, that tend to improve their performance (Bass, 2013). To vindicate this point,
even where children were under the same management, learning environment and entered
with closely similar marks like in the case of “day and boarding schools, children in the
boarding section were found to outperform their counterparts in the day section as remarked
in the excerpt that follows;
“I have not tried to analyse that and compare but I always see only about 1 or 2
children who are in the boarding section not doing all that well compared to day
students. The majority (in the boarding) perform well.” (Head Teacher, Day and
boarding Private Secondary School partnering with Government to implement
USE)
On the other hand, one main reason why most parents did not enrol their children in
boarding schools was the costs associated with them (table 18). It should be remembered
that boarding schools are by far more expensive than day schools and that most children that
enter them have largely attended private and or boarding facilities at primary that are almost
as expensive as boarding secondary schools. This may imply that boarding schools are, not
only, likely to create social classes, but also perpetuate the reproduction of social elites.
Boarding schools were also presented (albeit by few but more educated respondents)
as not being good for especially students that would get homesick as the latter often lacked
parental love and care to comfort them. Besides, some respondents associated being in
boarding with indulging in deviant behavior like smoking, excessive drinking, drug abuse
and homosexuality. This phenomenon was seen to negatively impact emotional, behavioural
and psychosocial development of children as documented elsewhere (Gaskins &
Mastropieri, 2010; Ginoglu, 2012; Rollins & Cross, 2014).
Against the backdrop of very little support supervision from the Ministry of
education and given that secondary education is increasingly in the hands of a less regulated
non-government sector, children (in a good number of schools) are subjected to too much
reading and often wake up as early as 4 or 5:00 am and go to bed as late as 10:00 pm with
virtually no time for sports, recreation, manual work and interpersonal socialisation. This is
compounded by the fact that some schools have very little space for extracurricular
activities.

226
Congestion in dormitories, increased insecurity due a recent wave of fires in some
boarding schools in Uganda and poor feeding practices (Luo et al., 2009) in some boarding
schools, were some of the other challenges raised through interactions with various
stakeholders.
In conclusion, while boarding schooling seems to be associated with some
challenges that impact the emotional and psychosocial development of a child, boarding
schools are highly regarded as per field interviews and in the entire country, owing to their
outstanding academic performance and probably because of a wide range of distance and
home environment related factors that negatively impact learning in day schools.
In light of what has been said, this study was able to investigate the factors linked to
accessing boarding facilities by sex and how these have evolved after the introduction of
USE in 2007. Which children are able to access boarding and how has this changed over
time? Are the correlates of accessing boarding facilities similar for boys and girls? Are these
factors more at individual, household or community level? What is the role of the boarding
school system in reducing or increasing inequalities in accessing “good” education?
7.2 Evolution of Inequalities in accessing boarding
This study is predicting the probability of being a boarder as compared to being a
day student at post primary level and the extent to which this has evolved between 2006 and
2010. As already said, the reference population is all children aged 13-24 who were
attending secondary school and above at the time of the surveys. This is done on the basis of
individual, household and community level factors as in the previous chapters.
Besides, factors that were found to be largely insignificant at preliminary modeling
stage were eliminated from the final model and results are presented by order of importance
with the most significant variables being explained first. Quantitative data is triangulated
with field data to enrich the argument.

227
2006 Children (13-24 Years) 2010 Children (13-24Years) All Male Female All Male Female N=1349 N=666 N=683 N=947 N=508 N= 439 Variable /category OR OR OR OR OR OR Residence RuralRC Urban 0.806 0.846 0.730 0.675* 0.597 0.749 Wealth status PoorRC Middle 1.929*** 1.949* 2.237** 2.471** 2.433** 2.830** Rich 6.018*** 5.700*** 7.831*** 4.609*** 5.710*** 3.977*** Region Central RC Eastern 1.623*** 1.371 2.001** 1.348 1.052 1.638 Northern 6.484*** 10.164*** 4.243*** 8.976*** 8.663*** 9.319*** Western 1.925*** 1.927** 1.913** 1.757* 1.666 1.699 Sex of Child MaleRC Female 1.162 0.813 Relationship to head Own ChildRC Other Relative 0.697** 0.536*** 0.787 0.618** 0.842 0.443*** Non Relative 0.622 0.668 0.629 0.838 1.276 0.431 Education of head NoneRC Some education 0.728 1.381 0.405** 2.021** 1.458 3.187* Sex of head MaleRC Female 1.375 1.253 1.447 1.325 1.349 1.407 Marital status Married (monogamous)RC Married (polygamous) 0.815 0.864 0.841 0.883 1.265 0.555 Divorced/separated 1.156 2.134 0.741 1.334 1.205 1.285 Widowed 0.733 0.524* 1.161 0.824 0.881 0.659 Never married 0.404*** 0.568 0.353* 0.158*** 0.129*** 0.216** Household size 1-4RC 5-9 0.759 0.944 0.695 0.692 1.036 0.487 10 & Above 0.629 0.650 0.694 0.828 1.040 0.621 Children below 5 Years 0-1RC 2 0.632** 1.015
0.466*** 1.025 1.084 0.997
3 & Above 0.879 1.200 0.730 0.555 0.885 0.320 Adults (60 & Above) NoneRC One 0.871 0.970 0.729 1.350 1.035 1.679* 2 and Above 0.683 0.861 0.460** 1.399 1.028 1.674
Table 17: Evolution of Inequalities in accessing a boarding facility
RC, Reference Category, ***significant at 1%, **significant at 5%: * significant at 10%

228
7.2.1 Household Wealth
In 2006, a child from a household with middle level income was more likely
(OR=1.929) to access a boarding facility than the one from the poorest household while the
one from the richest household was six times (OR=6.018) more likely to access boarding
than the one from the poorest household. In 2010, a child from a household with middle
level income was about three times (OR=2.471) more likely to access boarding than the one
from the poorest household while the one from the richest household was five times
(OR=4.609) more likely to be a boarder. It should also be noted that while household
income was a stronger factor for females than males in 2006, it was a stronger factor for
males five years later.
Indeed, as with regard to the effect of household income on other schooling
outcomes, this factor seems to be one of the strongest determinants of accessing a boarding
facility. It was possible to obtain raw statistics on the costs of accessing various types of
secondary schools and as can be seen in table 18, boarding schools were the most expensive
in both Northern and Central Uganda. Although these findings are not representative for the
entire country, they portray the extent to which boarding schools are “inaccessible” as
corroborated by quantitative data at national level. In fact in the Central region, it is more
problematic to access a government boarding school than a private for profit one implying
that the phenomenon of boarding schooling may be more responsible for recycling
disadvantage than private schooling. In the Central region, the cost of accessing a
prestigious boarding government secondary school is about 8 times higher than that of
accessing a day school.
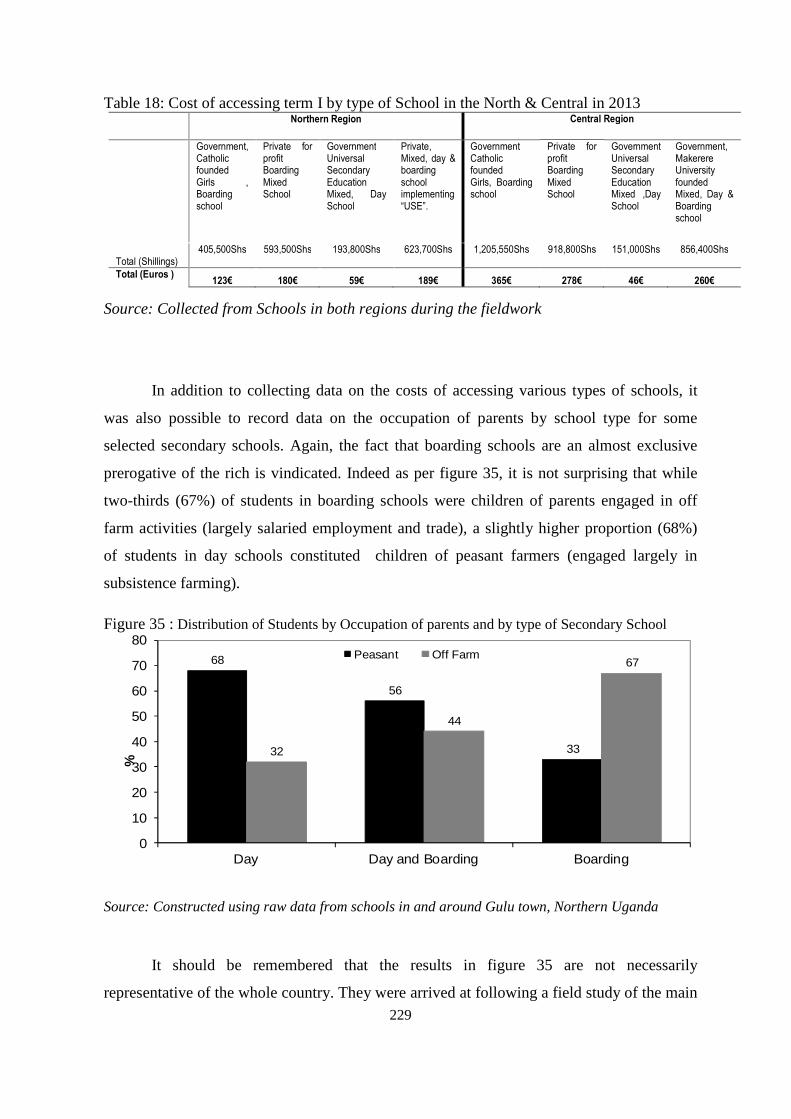
229
68
56
3332
44
67
0
10
20
30
40
50
60
70
80
Day Day and Boarding Boarding
%
Peasant Off Farm
Northern Region Central Region
Government, Catholic founded Girls , Boarding school
Private for profit Boarding Mixed School
Government Universal Secondary Education Mixed, Day School
Private, Mixed, day & boarding school implementing “USE”.
Government Catholic founded Girls, Boarding school
Private for profit Boarding Mixed School
Government Universal Secondary Education Mixed ,Day School
Government, Makerere University founded Mixed, Day & Boarding school
Total (Shillings)
405,500Shs 593,500Shs 193,800Shs 623,700Shs 1,205,550Shs 918,800Shs 151,000Shs 856,400Shs
Total (Euros ) 123€ 180€ 59€ 189€ 365€ 278€ 46€ 260€
Table 18: Cost of accessing term I by type of School in the North & Central in 2013
Source: Collected from Schools in both regions during the fieldwork
In addition to collecting data on the costs of accessing various types of schools, it
was also possible to record data on the occupation of parents by school type for some
selected secondary schools. Again, the fact that boarding schools are an almost exclusive
prerogative of the rich is vindicated. Indeed as per figure 35, it is not surprising that while
two-thirds (67%) of students in boarding schools were children of parents engaged in off
farm activities (largely salaried employment and trade), a slightly higher proportion (68%)
of students in day schools constituted children of peasant farmers (engaged largely in
subsistence farming).
Figure 35 : Distribution of Students by Occupation of parents and by type of Secondary School
Source: Constructed using raw data from schools in and around Gulu town, Northern Uganda
It should be remembered that the results in figure 35 are not necessarily
representative of the whole country. They were arrived at following a field study of the main

230
SN Name of Schools Boarding type Ownership Mixed or single
sex
Children selected
1 Gulu High School Boarding Government Mixed 100
2 Gulu Central Secondary School Day & boarding Private Mixed 100
3 Trinity College Secondary school Day & boarding Private Mixed 100
4 Sacred Heart Secondary School Boarding Government Girls 100
5 Gulu Secondary School Day Government Mixed 100
6 Koch Ongako Secondary School Day Government Mixed 100
secondary schools in and around Gulu town in Northern Uganda. The field interviewer was
able to access application forms for children recruited into year one in 2013 in six of all the
schools visited for the fieldwork as presented in table 19. These forms had data on, inter
alia, the main occupation of parents or caretakers and it is this data that is presented here. In
each of these schools, the first 100 children were selected from the admission lists of
students in year (senior) one for 2013. In most of the schools visited, students admitted in
year one ranged between 100 and 200.
Table 19 : List of schools by type for selected students
Source: Field Data
As already seen in the previous chapter and on the basis of field findings, boarding
schools are both more expensive than day schools and more selective at entry. This implies
that they are largely accessed by parents who are able to enroll their children in good
primary schools (most likely private and or boarding that are themselves expensive) for
them to obtain the grades to access the good boarding schools.
In addition, with almost no regulation and control from government, most of these
schools fix charges at their discretion sometimes to top up teachers’ salaries. The net effect
of this is that a child from a poor background is likely to remain excluded from accessing
boarding.
Besides, parents are required to provide a long list of other needs (clothing,
beddings, personal effects, pocket money, etc.) that the child must take to school. In most
cases, students are checked at entry to ensure that most, if not all, the items have been
brought.

231
7.2.2 Region of residence
In 2006, children surveyed in all the other regions were more likely to access a
boarding facility than the ones from the Central region. Accessing boarding was more
pronounced for children in the Northern region, than for the rest of the regions. In 2010,
while children in all the other regions seemed to have been at an advantage with regard to
accessing boarding, once again this was largely true for children in Northern Uganda.
Besides, in the more recent past (2010), parents from the north seem to be increasingly
embracing boarding schooling for their children and this was more true for girls than boys,
vindicating field findings where most parents were against day schooling for especially
adolescent girls. The fact that boarding schooling is largely a non-central region
phenomenon, could be related to inadequacies in supply and distribution of schools in a
context of a poorly developed transport network system as has been found elsewhere
(Ginoglu, 2012; Katrina, 1997; Lewin & Lu, 2011).
As per figure 36 the Northern region (especially the north east) seems to boast of a
comparatively large proportion of boarding schools than the rest of the regions. This should
be understood against the background that it had/has the smallest population (22% of the
total vs 27% for the central) as per 2002 Population and Housing Census (UBOS, 2002) and
that the net enrolment rate at secondary was lowest in the north (i.e. 15% vs 40% for the
Central region) as per Annex 3 and as corroborated by results in the preceding three
chapters.
Besides given that the north is largely sparsely populated as the distance to education
facilities was shortest in the Central region and longest in all other regions, especially the
North (UBOS, 2010b), parents have no option but to place their children in boarding
facilities.
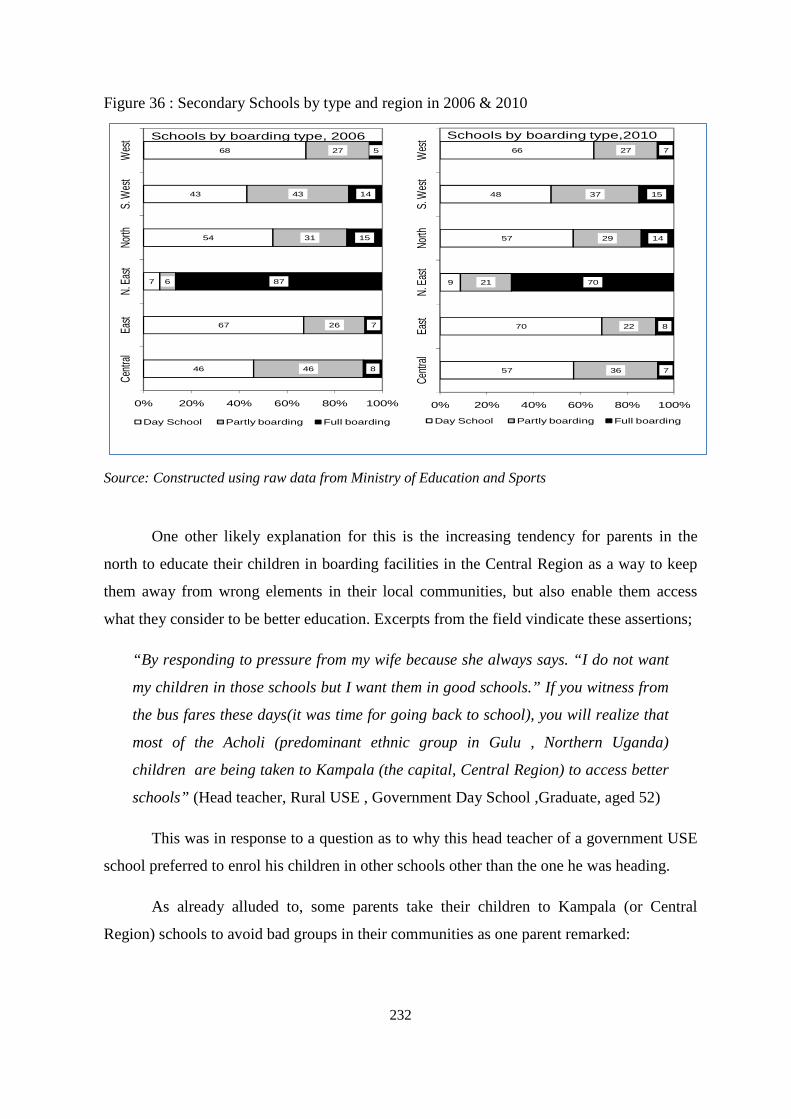
232
46
67
7
54
43
68
46
26
6
31
43
27
8
7
87
15
14
5
0% 20% 40% 60% 80% 100%
Centr
alEa
stN.
Eas
tNo
rthS.
Wes
tW
est Schools by boarding type, 2006
Day School Partly boarding Full boarding
57
70
9
57
48
66
36
22
21
29
37
27
7
8
70
14
15
7
0% 20% 40% 60% 80% 100%
Centr
alEa
stN.
Eas
tNo
rthS.
Wes
tW
est Schools by boarding type,2010
Day School Partly boarding Full boarding
Figure 36 : Secondary Schools by type and region in 2006 & 2010
Source: Constructed using raw data from Ministry of Education and Sports
One other likely explanation for this is the increasing tendency for parents in the
north to educate their children in boarding facilities in the Central Region as a way to keep
them away from wrong elements in their local communities, but also enable them access
what they consider to be better education. Excerpts from the field vindicate these assertions;
“By responding to pressure from my wife because she always says. “I do not want
my children in those schools but I want them in good schools.” If you witness from
the bus fares these days(it was time for going back to school), you will realize that
most of the Acholi (predominant ethnic group in Gulu , Northern Uganda)
children are being taken to Kampala (the capital, Central Region) to access better
schools” (Head teacher, Rural USE , Government Day School ,Graduate, aged 52)
This was in response to a question as to why this head teacher of a government USE
school preferred to enrol his children in other schools other than the one he was heading.
As already alluded to, some parents take their children to Kampala (or Central
Region) schools to avoid bad groups in their communities as one parent remarked:

233
“When he was a day scholar in Gulu Secondary School, I talked to him to keep
away from bad peer groups which he tried but I was still worried and that is why
after his “O” level here, I decided to transfer him to Kampala” (Widowed female
parent, business woman, Gulu Municipality)
It should be remembered that in this chapter we are looking at the chances of being a
boarder as compared to being a day student and not accessing secondary or not. It thus
implies that the few children in the north that manage to access secondary (Annex 3) are
largely enrolled in boarding facilities as a result of, inter alia , having less and unevenly
distributed secondary schools, but also that parents in the north are increasingly enrolling
their children in Kampala (the Central region) boarding schools for better education.
7.2.3 Relationship to household head
In 2006 and 2010, both relatives and non-relatives to the household head were less
likely to enroll in a boarding facility than children of the household head, although it is the
former category that was statistically significant. In the previous chapters, household
members that were related or unrelated to the household head were less likely to have
accessed secondary schooling than the biological children of the household head although
most of these categories were not significant. In this case, children of the household head
still present with more chances of being boarders while relatives to the head (for those that
have an opportunity to access secondary) are less likely to be boarders but rather day
students. At this level, and following a bivariate analysis between relationship to the head
and current secondary school enrolment status, it is clear that relatives of the household head
are not necessarily excluded from secondary education but rather access some form of
secondary schooling (as day students). Increased costs involved in sending and keeping a
child in a boarding facility imply that households may decide to enroll only their children at
secondary especially in boarding, and or enroll their relatives in cheaper day schools or
even employ them in family businesses to be able to raise fees for their biological children
in boarding schools.
Indeed according to field findings, other children (largely relatives to the head) that
were enrolled in especially secondary school were largely attending the “more affordable”

234
day schools in which case they would also be able to do some work for the receiving
household before and or after school.
7.2.4 Marital Status of household head
While we have previously seen that children under single household heads were
more likely to be enrolled at secondary than all the other categories of children, we see here
that they have the least chances of enrolling in a boarding facility in 2006 and five years
later. Besides, males under widowed parents were less likely to be boarders in 2006 than
their female counterparts. These findings resonate with the idea presented in section 7.2.3
and point to a phenomenon where some children stay in other homes and access some
schooling in those households.
Indeed this study has documented in the previous chapters that a good number of
children were staying with their elder unmarried relatives, that were largely with secondary
level of education and rural based. In line with the previous argument, it may mean that a
good number of children stay with and access day secondary schooling under the roof of
unmarried heads. Looking at the quantitative data, one may not be sure that these non-
relatives to the head were sent to their elder relatives to access some secondary education or
were invited by their relatives to attend secondary schooling at the cost of the elder brother
or sister. Findings from the field though tend to show that indeed it is very common for elder
children to look after their younger siblings or relatives and doing so in a cheaper day school
is often preferred more so if the relative has to pay for several children. This excerpt may
elucidate this point:
“Actually relatives whom I am supporting are many and I can only bring them to
boarding when they are in candidate classes (senior 4 or 6). I am doing this
because I am overwhelmed since I have many students that I am supporting and I
am also a student” (Head teacher, Graduate, Day and Boarding Private School in
Gulu Town, married, with one Child in Primary 1)
Indeed, a good number of single household heads who were looking after some
children at the time of fieldwork, pointed out that they were paying for the education of their

235
siblings, cousins, nephews and nieces in nearby day schools as these are generally cheaper,
hence being able to take on more than one relative, in need.
7.2.5 Education of household head
Education of the household head as a predictor of children’s schooling outcomes did
stand out prominently in the previous chapters. In this case, it does not appear to be a
straight forward predictor of accessing boarding. While in 2006, females whose parents had
some education were less at an advantage with regard to enrolling in a boarding facility, in
2010, all children (OR=2.021), but more so females (OR=3.187) whose parents had some
education were more likely to have been boarders. The contradictions in the direction of
coefficients may be related to the number of observations generally and missing data in this
variable, given than it was derived from other variables.
7.2.6 Household size
Though not generally significant, an increase in household size seems to be related
with lowered chances of being a boarder for children in the household in question. This
observation could be related to dilution of household resources given that boarding schools
are by far more expensive than day schools as seen already.
7.2.7 Proportion of Children under Five
As has been seen in many other studies previously, an increase in the proportion of
children under five years in a household is associated with less opportunities for accessing a
boarding facility although this is statistically significant for all children in 2006 (OR=0.639)
but more particularly, females (OR=0.479). In 2010, this factor is largely not significant
although the differential disadvantage for girls that existed in 2006 seems to have
disappeared. As already seen, having many under-fives is associated with increased costs
236
and expenditure towards the health and nutrition of these children as well as higher labor
demands to look after the children.
The negative implication of this factor for especially access to boarding by females
may be explained by two things : lessened household resources whose negative differential
impact on girls’ education has been documented in prior studies (Boyle et al., 2002) and
increased household labor demands from “grown up girls” in a context of a gendered
division of labor at the household level.
7.2.8 Proportion of Older Adults
The proportion of adults aged 60 and above in a household seems to present
ambivalent implications for access to boarding in 2006 and five years later. While in 2006 it
is generally associated with lessened chances of accessing a boarding facility but significant
for females (OR=0.454), in 2010 is seems to be associated with increased chances of
accessing boarding for especially females, although this is significant at only 10%. This
problem can be explained by differences in the number of observations in the different
categories over the five year period.
7.2.9 Non-significant factors
Other factors like place of residence, sex of the child and sex of the household head
seem not to predict access to a boarding facility in 2006 and 2010. The fact that the sex of a
child is not a strong determinant of accessing boarding resonates with earlier findings that
the sex gap in education has largely been diminished. With regard to the sex of the
household head, females seem to be more likely to have their children enrolled in boarding
facilities than males although this variable is not statistically significant.
Though largely not significant, children in the urban areas were less likely to be
boarders than the ones in the rural areas. As already seen, this could be related to the fact
that in the rural areas, secondary schools are fewer and of course unevenly distributed given
the absence of a good road transport network to link children in remote areas to secondary
schools.

237
7.3 Concluding Remarks
Although boarding schools at secondary level are relatively fewer, being educated in
a boarding facility is very highly regarded largely because of good performance in these
schools than in the day schools. In the same logic, if access to secondary education is to be
tackled from the perspective of meaningful learning as defined by Lewin & Little (2011)
and not “mere physical access”, then most children who do not access especially boarding
secondary facilities in Uganda, are denied access to meaningful secondary education.
This is more compounded by the fact that despite Universal Secondary education,
boarding schools that would provide hope to poor parents by educationally emancipating
their children are both very selective at entry and quite expensive since by policy their
expenses are met by parents or benefactors. As seen, the paradox is that most of these good
boarding so called government schools that partly receive funding from government (tax
payers’ money) cannot be accessed by the poor and leads to questioning the social justice
and equity considerations inherent in universalizing secondary education.
Boarding schools provide superior education because they have better infrastructure
since they enjoy support from government, the founding churches and strong bodies of
influential alumni. Besides, they are very selective of the children they recruit, can afford to
top up teachers’ salaries and provide other incentives, are able to control discipline in
schools and their children have ample time to concentrate, all of which have a strong bearing
on performance.
As has been seen with regard to all the other educational outcomes, household
income is one biggest factor that explains differentials in accessing boarding facilities by
boys and girls before and after the USE Policy of 2007. Not only it is costly for most parents
to raise the fees and other requirements demanded by boarding schools, the competitive cut
off points by these schools imply that most children that enter them have attended good
private and or boarding primary schools whose charges are as high as (if not higher) the

238
ones in most secondary schools. As expected (because the costs of boarding are borne by
parents), the USE Policy did not have any impact on alleviating inequalities in accessing a
secondary boarding facility as children in the lowest wealth quintile were largely as equally
likely to miss out on being borders before the USE Policy as they were after.
While the Central region was found to be more educationally privileged than all
other regions with regard to accessing secondary education, boarding schooling was more
associated with children surveyed in other regions and this could be related to inadequacy in
supply of secondary schools and spatial inequities in distribution of the schools. Able
parents have the option to place their children in boarding schools and for the majority that
cannot the implications may range from placing them in easily accessible day schools, to
removing them from school altogether, even at the lower levels. Spatial inequities with
regard to supply of especially more affordable day secondary schools before the 2007 Policy
have largely remained making access to especially boarding secondary schooling an almost
exclusive prerogative of the rich few in especially the traditionally deprived regions like the
north.
On examining the probability of accessing boarding schools by relationship to the
household head, it is unambiguously certain that children not related to the household head
were less likely to benefit from the quality schooling dispensed by boarding schools. This
may be explained by the fact that biological parents make “rational decisions” in times of
scarcity of resources and or higher financial demands but also that a good number of
households place their children in other households closer to education facilities, as has been
seen elsewhere, for them to access especially day secondary schooling.
While it had been concluded that single heads i.e. elder brothers or sisters play a big
role in educating their younger siblings, it is evident in this chapter and following field
findings that indeed most of these single heads enroll these siblings in cheaper day schools
to be able to pay for as many dependants as they could but also benefit from the labor and or
company of these dependants.
In the final analysis, the Universal Secondary Education policy of 2007, has failed to
eclipse inequalities in accessing boarding schools as the categories of children that were
excluded from boarding i.e. the poor, the ones unrelated to the household head and the ones
under single heads were consistently less likely to be boarders before and after the Policy.

239
Besides, that most parents in especially the predominantly poor north continue to place their
children in boarding facilities, more so after 2007, is reminiscent of government failure to
equitably supply day secondary schools in the previously underserved areas. While the
dilemma with boarding schools would be with regard to the prior policy (Education White
Paper of 1992) about boarding schools, one questions the rationale of an equity-driven
Public Policy that does not address what seems to be an inescapable cycle of social
reproduction by availing equality of opportunity (especially to accessing good education) to
all.

240
GENERAL CONCLUSION
The study of evolution of inequalities in accessing secondary schooling was largely
inspired by a myriad of advantages that are associated with sustained meaningful education
and by the fact that these advantages are largely beneficial to all and not only a few
individuals. Indeed, development is not only inextricably linked to equity (or equality) but
any definition of development, especially sustainable development must exhibit equity
dimensions.
In the spirit of the EFA and MDG goals, the Ugandan government was among the
first governments in Sub-Saharan Africa to universalise primary education in 1997 and
secondary education in 2007. This was indeed great commitment by Policy to spread
advantages of education and engender enjoyment of the right to education by all.
Universalization of primary education in the context of high population growth rates
and by implication large cohorts of school age children, led to a surge in enrolments more so
for the formerly excluded groups of children like girls, orphans, the poor, and children from
remote areas, who were generally older for entry into school due to prior exclusion. A surge
in enrolments, in a context of a limited budget from government and an overburdened and
less motivated (had lost PTA allowances) teaching staff led to enrolment shocks that
manifested in form of, inter alia, high pupil teacher and classroom ratios, inadequacy of
textbooks and building infrastructure as well as shortage of water supply and sanitation
facilities all of which have led to decline in quality. The decline in quality is clearly
manifested in an increased proportion of children that fail to master basic competencies in
literacy and numeracy by grade six, over the years.
In response to declined quality in public schools and increased demand for
education, private providers came in to quench the demand of especially the middle class
that could not stand the decline in standards in the public schools. Indeed, the proportion of
schools that are privately owned has greatly increased over the past decade and quality
education, especially at the primary level is increasingly being associated with private
education.
Whereas it is generally agreed that the private sector may help free space in public
schools and or enable government concentrate on concerns of children in public schools,
241
increased privatization of education in an economy characterized by corruption and little
efforts to redistribute wealth through, inter alia, progressive taxation, may have negative
implications for equity. Privatization of education has resulted into denying the poor access
to quality education in the private schools, declined quality of education in public schools as
good teachers and or administrators are taken over by the private sector, less involvement of
“quality” parents in management of public schools and hence reduced chances of benefitting
from their economic, social and cultural capital and reduced chances that the rich may help
their poorer relatives as they are also constrained with high fees in private schools, all of
which may engender, nourish and perpetuate social class cleavages whose implications for
all tend to be negative.
As expected and seen elsewhere, while enrolment in school was generally
universalized and remains to be so, progression in school has remained largely selective and
eliminative to the extent that close to 70% of children who enroll in grade one of primary
have continued to drop out before completion of primary seven in the past decade. Besides,
whereas the proportion of children that would make a transition after grade seven (P7) has
slightly improved, this has neither eclipsed inequalities that existed before in this regard nor
increased transition in real terms as the rate at which the population is increasing surpasses,
by far, the percentage increase in transition.
Indeed, completion of primary and transition to secondary remain a prerogative of
largely children from better socio-economic backgrounds, urban areas and the central region
even after the Universal secondary education Policy. Children in households below the 25th
top percentile of household income, those in the rural, the ones in the East, West and North,
and those under households whose heads had less than secondary education remain largely
excluded from secondary schooling despite universal secondary education. In fact in the
latter case, children with less educated heads were more likely to be excluded in 2010 than
five years earlier leading to questioning the social justice dimensions of the policy if it does
not show signs of arresting what seems to be an inescapable cycle of social reproduction.
This study endeavored to distinguish between factors influencing general access
from those predicting transition as this was critical because of high levels of attrition at the
primary level. Indeed, most children are excluded from secondary schooling because they
have not completed primary and less because they have failed to make a transition.

242
Efforts to bolster secondary schooling should therefore be more preoccupied with
combating dropouts at primary than improving transition. Since household socio-economic
status (largely income and education of head) stands out as a major factor impeding
completion of primary, that in turn negatively affects access to secondary, it is important
that mechanisms through which this operates be clearly understood as they are both complex
and sometimes exhibit temporal dimensions that affect not only learning outcomes but also
schooling outcomes like retention and progression in school. Household socio-economic
status impacts retention and by implication progression in school through dictating, inter
alia, age at first enrolment, the possibility of attending preschool, type of school attended,
parental involvement in children’s work, regularity of attendance, children’s feeding habits
and health status, children’s access to the required scholastics, distance covered to access
school and the amount of work a child is exposed to, all of which impact learning and
schooling outcomes.
The socio-economic status of households is so critical a factor that it largely explains
rural-urban and regional differentials in accessing secondary schooling. Besides, inequities
in supply of education by place of residence and region, in the wake of increased
involvement of private providers in education provision, equally explain spatial differentials
in demand for secondary schooling. Given that the role of government in establishing its
own schools remains very limited, one wonders how it shall redress rural-urban inequities in
demand for secondary schooling. This is more important given the demographic
preponderance of rural children and the extent of their vulnerability lest Uganda misses out
on the numerous advantages of education and the possibility of benefitting from the
demographic transition.
While children in the Central region were most likely to have completed primary and
accessed secondary, the North and especially for girls, remains the most disadvantaged
region due factors related to generalized poverty, culture, inadequacy of schools and the
effect of the 20 year LRA war whose impact still lingers on to date.
Whereas the numbers making a transition were seen to have increased over the five
year period, this has failed to stop an increase in the number of children out of secondary
school and dampen inequalities in making a transition. On the contrary, inequalities in
making a transition by household income and education level of heads seem to have
worsened over the five year period. Results show that making a transition remains an almost
243
exclusive privilege for children in the top 25th percentile of household income and whose
parents had a minimum of secondary education, implying a clear scenario of social
reproduction despite universalized education. Transition may have become more difficult
because of increasing income inequalities, increased privatization of secondary education,
higher costs of boarding schools whose burden in on parents, increased selectivity into the
quality boarding schools in disfavor of children who have attended public primary schools,
reduced number of available secondary school places given increased demand, absence of
secondary schools in some places and an increased financial burden to parents even in the
so called “USE” Schools.
While the rural urban gap in transition seems to have disappeared implying that rural
children are largely affected by dropouts at primary, it was largely boys in the West that had
least chances of making a transition. Besides, the role of elder siblings in educating younger
ones especially in day secondary schools as well as the negative role of divorce and or
polygamy on making a transition stand out as other factors influencing transition.
It is one thing to access secondary school and yet another to access good secondary
education that is increasingly associated with boarding schools especially at secondary.
Whereas these schools are not as numerous as day schools and are attended by fewer
children, they are generally the best schools in terms of performance in the country. The
paradox about these schools is that while some are government schools, government policy
is that the costs of boarding (that happen to be high) are supposed to be met by parents.
Whereas most of these are quality schools that would be ideal for children of the poor to
jump start the process of social mobility, they are inaccessible to the poor. They are largely
inaccessible because of (i) the competitive grades required at intake that presuppose prior
good education in a private primary school, (ii) high charges in terms of school dues and
other requirements and (iii) the fact that parents of the poor children lack the socio and
cultural capital to get a place at these schools. Spatial inequities in supply for secondary
education in especially the North and North-East explain both a disproportionately bigger
supply of boarding schools in the area and lowered demand for secondary schooling.
It looks that challenges of access are exacerbated by the fact that government is
playing a subsidiary role in matters of education supply, access and equity while unregulated
private providers are increasingly getting involved in the provision of this otherwise basic
service with far reaching implications for sustainable development. The subsidiary stance by
244
government may be a corollary of its capacity to finance education in terms of the
percentage of GDP it will commit to education. This is influenced by the strength of the
entire economy that in turn has a bearing on the amount that will be spent per child, in the
context of large schooling cohorts, low levels of government revenue and widespread
corruption. This whole scenario should be understood against the backdrop of increasingly
less foreign aid to the country in general and the education sector in particular.
The main contribution of this study is that it pioneered into investigating the
evolution of inequalities in accessing secondary schooling in Uganda while considering the
pre and post USE period. Besides, this study endeavored not only to distinguish between
factors associated with overall access from those related to transition but also mapped
pathways through which these factors operate to impact access to secondary schooling. Last
but not least, this study is among the pioneer studies into investigating inequalities in
accessing boarding facilities (some of which are government schools) that tend to offer
better quality education in Uganda and whose costs are by policy met by parents. It clearly
shows how the phenomenon of boarding schools contributes to increasing inequalities.
Challenges in this study included, the fact that a bigger age group of 13-24 was used
to measure past and present access to secondary schooling instead of the cohort 13-18, the
official age of secondary schooling, to measure current access. This may have introduced
some bias in the results. Besides, the time for measuring inequalities after the USE policy of
2007 was rather short (about 2 years) to enable one talk of evolution of inequalities in the
etymological sense of the word. In addition, the measurement of transition was an
approximation due to lack of data on the children that had sat primary seven and transited or
failed to transit in the subsequent year in the two datasets. The dataset for 2010 was found to
have missing data on some critical variables that could have compromised the overall
quality of the results. Besides, because this study was largely based on cross-sectional data,
some other information could not be easily established. A case in point is that it was not
possible to understand if some children in a household were being paid for by other people
outside the household. EMIS data that is often collected at school level has been found to
have some inadequacies as evidenced by variations in some of its statistics when compared
to other data sources. Triangulation of this data made it possible to surmount some of the
weaknesses of any of the data sources used.

245
Future research on this topic using Census data would endeavor to measure
correlates of initial access, retention, transition and access to boarding by region for the
relevant age groups. In addition, a study on interregional migration for schooling purposes
would provide interesting insights into regional inequities in especially accessing quality
schooling.
Other areas of interesting research include investigating the evolution of inequalities
over a longer period, investigating correlates of transition while considering children that sat
for the Primary Leaving Examination, conducting a study on the long term impact of the war
in the north on learning and schooling outcomes and a retrospective study endeavoring to
understand education trajectories of individuals and or the role of relatives /brothers/sisters
in educating their younger siblings.

246
BIBLIOGRAPHY
Acham, H., Kikafunda, J. K., Malde, M. K., Oldewage-Theron, W. H., & Egal, A. A. (2012). Breakfast, midday meals and academic achievement in rural primary schools in Uganda: implications for education and school health policy. Food & Nutrition Research, 56, 1–12.
Adelman, S., Alderman, H., Gilligan, D. O., & Lehrer, K. (2008). The impact of alternative food for education programs on learning achievement and cognitive development in Northern Uganda. Unpublished Manuscript, University of Maryland, World Bank, International Food Policy Research Institute, and University of British Columbia.
Ahmadi, A., Hussain, M., & Bose, M. L. (2005). Inequality in access to secondary education and rural poverty in Bangladesh: An analysis of household and School level data. Presented at the Workshop on Equity and Development in South Asia, India.
Ainsworth, M., Beegle, K., & Koda, G. (2005). The Impact of Adult Mortality and Parental Deaths on Primary Schooling in North-Western Tanzania. Journal of Development Studies, 41(3), 412–439.
Akyeampong, K. (2009). Revisiting Free Compulsory Universal Basic Education (FCUBE) in Ghana. Comparative Education, 45(2), 175–195. doi:10.1080/03050060902920534
Antoine, P., & Golaz, V. (2010). Vieillir au Sud : une grande variété de situations. Autrepart, 53, 3–15. doi:10.3917/autr.053.0003.
Antoine, P., Golaz, V., & Sajoux, M. (2009). Vieillir dans les pays du Sud : mieux connaître les solidarités privées et publiques autour de la vieillesse en Afrique. Retraite et Société, 58, 184–188.
Anugula, R. (2010). School Dropouts or Pushout? Overcoming barriers for the Right to Education (Research Monograph No. 40). Centre for International Education , Brighton , UK: University of Sussex.
Appleton, S. (2001). What can we expect from UPE? In Uganda’s Recovery ,The Role of farms , firms and Government (Ritva Reinikka and Paul Collier.). Washington: World Bank.
Bajracharya, A. (2010). The Nature of mothers work and children schooling in Nepal:The Influence of Income and Time effects. The Population Council , Inc.
Balihuta, A. . ., & Semogerere, J. (1995). A Report on Education and Poverty in Uganda. Kampala, Makerere University Department of Economics.
Bangay, C., & Latham, M. (2013). Are we asking the right questions? Moving beyond the state vs non-state providers debate: Reflections and a Case Study from India. International Journal of Educational Development, 33(3), 244–252. doi:10.1016/j.ijedudev.2012.09.004
Bass, L. R. (2013). Boarding Schools and Capital Benefits: Implications for Urban School Reform. The Journal of Educational Research, 107(1), 16–35. doi:10.1080/00220671.2012.753855
Baux, S. (2010). Le « droit à l’école » face aux inégalités scolaires et sociales : Analyse comparative entre milieux urbains et ruraux au Burkina Faso. In M. Pilon, J.-Y. Martin, & A. Carry

247
(Eds.), Le droit à l’éducation, Quelle Universalité? (pp. 217–232). Paris: Editions des archives Contemporaines.
Becker, G. S., & Lewis, H. G. (1973). On the Interaction between the Quantity and Quality of Children. Journal of Political Economy, 81(2), S279. doi:Article
Becker, G. S., & Tomes, N. (1976). Child Endowments and the Quantity and Quality of Children. Journal of Political Economy, 84(4), 143. doi:Article
Bennell, P. (2002). Hitting the Target: Doubling Primary School Enrollments in Sub-Saharan Africa by 2015. World Development, 30(7), 1179–1194. doi:10.1016/S0305-750X(02)00027-X
Berlinski, S., Galiani, S., & Gertler, P. (2009). The effect of pre-primary education on primary school performance. Journal of Public Economics, 93(1–2), 219–234. doi:10.1016/j.jpubeco.2008.09.002
Bernard, J. M. (2010). Scolarisation Primaire Universelle et Pilotage par les résultats dans le contexte africain : Quels Indicateurs. In M. Pilon, J.-Y. Martin, & A. Carry (Eds.), Le droit a l’éducation, quelle universalité ? (pp. 251–265). Paris: Editions des archives Contemporaines.
Blake, J. (1981). Family size and the quality of children. Demography, 18(4), 421–442. doi:10.2307/2060941
Bonini, N. (2011). Le développement de l’enseignement secondaire en Tanzanie et la scolarisation des Maasai. Autrepart, 59, 57–74.
Booth, A. L., & Hiau Joo Kee. (2009). Birth order matters: the effect of family size and birth order on educational attainment. Journal of Population Economics, 22(2), 367–397.
Bourdon, J. (2006). Coût et financement de l’éducation en Afrique Subsaharienne. In M. Pilon (Ed.), Défis du développement en Afrique subsaharienne, l’éducation en jeu (pp. 123–145). Paris: CEPED.
Boyle, S., Brock, A., Mace, J., & Sibbons, M. (2002). Reaching the Poor: The “Costs” of Sending Children to School: A Six Country Comparative Study, Synthesis Report. Department for International Development (DFID)(UK).
Bressoux, P. (2010). Modélisation statistique appliquée aux sciences sociales. Bruxelles: Groupe de Boeck s.a.
Bruyninckx, M., & Pilon, M. (2010). Entraves au développement et à l’éducation de l’enfant à Haïti. In M. Pilon, J.-Y. Martin, & A. Carry (Eds.), Le droit à l’éducation, Quelle Universalité? (pp. 233–247). Paris: Editions des archives Contemporaines.
Buchmann, C. (2000). Family Structure, Parental Perceptions, and Child Labor in Kenya: What Factors Determine Who Is Enrolled in School?. Social Forces, 78(4), 1349–1378.
Byamugisha, A., & Ssenabulya, F. (2005). The SACMEQ II Project in Uganda: A Study of the Conditions of Schooling and the Quality of Education. Harare: SACMEQ.
Camarena Cordova, R. M. (2003). Family and education in Mexico. In M. Cosio, R. Marcoux, M. Pilon, & A. Quesnel (Eds.), Education, Family and Population dynamics (pp. 247–279). Paris: CICRED.

248
CEPED, UEPA, & UNESCO. (1999). Guide d’exploitation et d’analyse des données de recensement et d’enquêtes en matière de scolarisation (Documents et Manuels du CEPED No. 9). Paris.
Chapman, D. W., Burton, L., & Werner, J. (2010). Universal secondary education in Uganda: The head teachers’ dilemma. International Journal of Educational Development, 30(1), 77–82. doi:10.1016/j.ijedudev.2009.08.002
Charbit, Y., & Kébé, M. (2006). Education et changements démographiques. In M. Pilon (Ed.), Défis du développement en Afrique subsaharienne, l’éducation en jeu (pp. 25–36). Paris.
Charbit, Y., & Kébé, M. (2010). Croissance démographique, fécondité et éducation en Afrique subsaharienne. In F. Nohra (Ed.), Politiques éducatives, émancipation humaine et inégalités sociales dans les pays de développement. Paris: L’Harmattan.
Chernichovsky, D. (1985). Socioeconomic and Demographic Aspects of School Enrollment and Attendance in Rural Botswana. Economic Development & Cultural Change, 33(2), 319–332.
Chimombo, J. (2009). Changing patterns of access to basic education in Malawi: a story of a mixed bag? Comparative Education, 45(2), 297–312. doi:10.1080/03050060902921003
Colclough, C. (2012). Education, poverty and development – mapping their interconnections. Comparative Education, 48(2), 135–148. doi:10.1080/03050068.2011.608891
Colclough, C., Rose, P., & Tembon, M. (2000). Gender inequalities in primary schooling: The roles of poverty and adverse cultural practice. International Journal of Educational Development, 20(1), 5–27. doi:10.1016/S0738-0593(99)00046-2
Cookson, P. W., Jr., & Persell, C. H. (1985). English and American Residential Secondary Schools: A Comparative Study of the Reproduction of Social Elites. Comparative Education Review, 29(3), 283–298. doi:10.2307/1188490
Cremin, P., & Nakabugo, M. G. (2012). Education, development and poverty reduction: A literature critique. International Journal of Educational Development, 32(4), 499–506. doi:10.1016/j.ijedudev.2012.02.015
Daily Monitor. (2013, October 15). Domestic Workers Most Vulnerable. Daily Monitor. Kampala, Uganda. Retrieved from http://www.monitor.co.ug/News/National/Domestic-workers-most-vulnerable---activists/-/688334/2032240/-/kcmjej/-/index.html
Deininger, K. (2003). Does cost of schooling affect enrollment by the poor? Universal primary education in Uganda. Economics of Education Review, 22(3), 291–305. doi:10.1016/S0272-7757(02)00053-5
De Kemp, A., & Eilor, J. (2008). Primary Education in Uganda (IOB Impact Evaluation No. 311). The Hague: Netherlands Ministry of Foreign Affairs.
Deleigne, M.-C., & Kail, B. (2010). Obligation scolaire et gratuité de l’école : Le droit à l’éducation et ses ambigüités dans les écoles rurales à Madagascar. In M. Pilon, J.-Y. Martin, & A. Carry (Eds.), Le droit à l’éducation, Quelle Universalité? (pp. 203–215). Paris: Editions des archives Contemporaines.
Dubow, E. F., Boxer, P., & Huesmann, L. R. (2009). Long-term effects of parents’ education on children’s educational and occupational success: Mediation by family interactions, child

249
aggression, and teenage aspirations. Merrill-Palmer Quarterly (Wayne State University. Press), 55(3), 224.
Easterly, W. (2009). How the Millennium Development Goals are Unfair to Africa. World Development, 37(1), 26–35. doi:10.1016/j.worlddev.2008.02.009
Eloundou-Enyegue, P., & Davanzo, J. (2003). Economic downturns and schooling inequality, Cameroon, 1987-95. Population Studies, 57(2), 183–197. doi:10.1080/0032472032000097092
Eloundou, P., & Williams, L. (2006). Family size and schooling in Sub-Saharan Africa Settings: a re-examination. Demography, 43(1), 25–52. doi:10.1353/dem.2006.0002
Fan, X., & Chen, M. (2001). Parental Involvement and Students’ Academic Achievement: A Meta-Analysis. Educational Psychology Review, 13(1), 1–22. doi:10.1023/A:1009048817385
Fentiman, A., Hall, A., & Bundy, D. (1999). School Enrolment Patterns in Rural Ghana: A comparative Study of the impact of Location, Gender, Age and Health of children’s access to basic schooling. Comparative Education, 35(3), 331–349.
Filmer, D., & Pritchett, L. H. (2001). Estimating Wealth Effects Without Expenditure Data—Or Tears: An Application To Educational Enrollments In States Of India*. Demography, 38(1), 115–132. doi:10.1353/dem.2001.0003
Gaskins, C. D., & Mastropieri, M. A. (2010). Academic and Behavioral Characteristics of Students at a Secondary Residential School. Child Welfare, 89(2), 189–208.
Gérald, E., & Pilon, M. (2005). Le niveau de scolarisation au primaire, entre mesures, usages et enjeux, Exemple tirés de l’Afrique. Cahiers de la recherche sur l’éducation et les savoirs, 1, 201–222.
Ginoglu, M. (2012). Evaluation of Boarding Schools in Turkey (Case Study). The Online Journal of Counseling and Education, 1(2), 27–38.
Glick, P., & Sahn, D. E. (2000). Schooling of girls and boys in a West African country: the effects of parental education, income, and household structure. Economics of Education Review, 19(1), 63–87. doi:10.1016/S0272-7757(99)00029-1
Gomes Melba. (1984). Family Size and Educational Attainment in Kenya. Population and Development Review, 10(4), 647–660.
Government of Uganda. (1995). The Constitution of the Republic of Uganda. Kampala, Uganda.
Government of Uganda. (2008). The Education Act , 2008. UPPC, Entebbe.
Govinda, R., & Bandyopadhyay, M. (2010). Social exclusion and school participation in India: Expanding access with equity. PROSPECTS, 40(3), 337–354. doi:10.1007/s11125-010-9160-8
Grogan, L. (2009). Universal Primary education and school entry in Uganda. Journal of African Economies, 18(2), 183–211.
Hedger, E., Williamson, T., Muzoora, T., & Stroh, J. (2010). Sector Budget Support in Practice , Case Study; Education Sector in Uganda. London: Overseas Development Institute.

250
Retrieved from http://www.odi.org.uk/sites/odi.org.uk/files/odi-assets/publications-opinion-files/6077.pdf
Henaff, N. (2006). Education et développement : Regard critique sur l’apport de la recherche en économie. In M. Pilon (Ed.), Défis du développement en Afrique subsaharienne, l’éducation en jeu (pp. 67–93). Paris: CEPED.
Henaff, N., & Lange, M.-F. (2011). Inégalités scolaires au Sud : transformation et reproduction. Autrepart, 59, 3–18. doi:10.3917/autr.059.0003.
Henaff, N., Lange, M.-F., & Martin, J.-Y. (2009). Revisiter les relations entre pauvreté et éducation. Revue Française de Socio-Économie, (3), 187–194. doi:10.3917/rfse.003.0187.
Hossain, A., & Zeitlyn, B. (2010). Poverty , Equity and Access to Education in Bangladesh (Research Monograph No. 51). Centre for International Education , Brighton , UK: University of Sussex.
Hunt, F. (2008). Dropping Out from School: A Cross Country Review of Literature (Research Monograph No. 16). Centre for International Education , Brighton , UK: University of Sussex.
Ilon, L., & Moock, P. (1991). School attributes, household characteristics and demand for schooling: a case study of rural Peru. International Review of Education, 37(4), 429–451.
Kabore, I., Lairez, T., & Pilon, M. (2003). Genre et Scolarisation au Burkina Faso : Enseignement d’une approche Statistique. In M. Cosio, R. Marcoux, M. Pilon, & A. Quesnel (Eds.), Education, Family and Population dynamics (pp. 221–246). Paris: CICRED.
Kabubo-mariara, J., & Mwabu, D. K. (2007). Determinants of school enrolment and educational attainment: Empirical evidence from Kenya. South African Journal of Economics, 75(3), 572–593. doi:10.1111/j.1813-6982.2007.00138.x
Kadzamira, E., & Rose, P. (2003). Can free primary education meet the needs of the poor?: evidence from Malawi. International Journal of Educational Development, 23(5), 501–516. doi:10.1016/S0738-0593(03)00026-9
Kakuba, C. J. (2006). Influence of the number of children ever born on children’s education in Uganda, a case study of the Western Region.
Kakuba, C. J. (2012). Children and the Youth in Uganda: Who accesses Secondary Education. Presented at the Child Victims , Vulnerable Children and “Violent” Youth in East Africa, Kampala, Uganda.
Kakuba, C. J., & Kahunga, B. (2008). KORO-BOBI Area Development Program Baseline Survey Report (Baseline Survey). Kampala, Uganda: World Vision.
Kakuba, C. J., Katsirabo, N., & Katunguka, G. (2011). Civil Society Empowerment Pilot Project Midterm Evaluation Report (Midterm Evaluation). Kampala, Uganda: World Vision.
Kalule, L. (2000). Disaffection with schooling? In Catholic Schools 2000; Issues and Challenges (pp. 224–230). Marianum Publishing Company Limited.
Kamuli, E., Younger, M., & Warrington, M. (2012). Gender in East Africa: What Keeps Girls in Primary School in Uganda ? An exploration of the factors that enable girls’ retention in Bududa and Nakapiripirit (CCE Report No. 12). The Centre for Commonwealth Education.

251
Karugaba, M. (2013, October 5). Government UPE Funds not yielding good fruits. The New Vision. Kampala, Uganda. Retrieved from http://www.newvision.co.ug/news/647988-govt-upe-funds-not-yielding-good-fruits.html
Kasirye, I. (2009). Determinants of learning achievement in Uganda. Presented at the Economic Development in Africa, Oxford.
Katrina, M. (1997). The Emotional Transition of Twelve Year Olds from Home to a Boarding Situation (Research report). Australia.
Knodel, J., & Wongsith, M. (1991). Family size and children’s education in Thailand: evidence from a national sample. Demography, 28(1), 119–131.
Kobiané, J.-F. (2003). Pauvreté, structures familiales et stratégies éducatives à Ouagadougou. In M. Cosio, R. Marcoux, M. Pilon, & A. Quesnel (Eds.), Education, Family and Population dynamics (pp. 153–182). Paris: CICRED.
Kobiané, J.-F. (2004). Habitat et biens d’équipement comme indicateurs de niveau de vie des ménages : bilan méthodologique et application à l’analyse de la relation pauvreté-scolarisation. African Population Studies, Supplement A to Vol 19, 265–283.
Kobiané, J.-F. (2006). Ménage et scolarisation des enfants au Burkina Faso. A la recherche des déterminants de la demande scolaire. Louvain-la-Neuve: BRUYLANT-ACADEMIA.
Kobiané, J.-F., Calvès, A.-E., & Marcoux, R. (2005). Parental Death and Children’s Schooling in Burkina Faso. Comparative Education Review, 49(4), 468–489.
Kravdal, Ø., Kodzi, I., & Sigle-Rushton, W. (2013). Effects of the Number and Age of Siblings on Educational Transitions in Sub-Saharan Africa. Studies in Family Planning, 44(3), 275–297. doi:10.1111/j.1728-4465.2013.00358.x
Kyeyune, R. (2012). Education in the Urban Context in Uganda. In M. Oketch & M. Ngware (Eds.), Urbanisation & Education in East Africa. Nairobi , Kenya: African Population and Health Research Center.
Lam, D., & Marteleto, L. (2008). Stages of the Demographic Transition from a Child’s Perspective: Family Size, Cohort Size, and Children’s Resources. Population and Development Review, 34(2), 225–252. doi:10.1111/j.1728-4457.2008.00218.x
Lange, M.-F., & Pilon, M. (2009). L’inégale soumission des familles aux impératifs scolaires. Cahiers de La Recherche Sur L’éducation et Les Savoirs, 8, 7–16.
Lewin, K. (2006). Financing Universal Post Primary Education and Training in Uganda. MoES and World Bank.
Lewin, K. (2007a). EFA Goals and Expanded Secondary Schooling – Taking stock and seeking solutions. Presented at the Common Wealth People’s Forum, Kampala, Uganda.
Lewin, K. (2007b). Expanded access to secondary schooling in Sub-Saharan Africa: Key Planning and Finance issues (Research Monograph No. 8). Centre for International Education , Brighton , UK: University of Sussex.
Lewin, K. (2007c). Improving access , Equity and Transitions in Education: Creating a Research Agenda (Research Monograph No. 1). Centre for International Education , Brighton , UK.

252
Lewin, K. (2011a). Expanding access to secondary education, Can India catch up ? International Journal of Educational Development, 31(4), 382–393.
Lewin, K. (2011b). Making rights realities, researching educational access, transitions and equity. United Kingdom: University of Sussex. Retrieved from http://www.create-rpc.org
Lewin, K. (2011c). Taking Targets to task revisited: How Indicators of Progress on access to education can mislead (Research Monograph No. 54). United Kingdom: University of Sussex.
Lewin, K., & Akyeampong, K. (2009). Education in sub‐Saharan Africa: researching access, transitions and equity. Comparative Education, 45(2), 143–150. doi:10.1080/03050060902920492
Lewin, K., & Little, A. W. (2011). Access to education revisited: Equity, drop out and transitions to secondary school in South Asia and Sub-Saharan Africa. International Journal of Educational Development, 31(4), 333–337. doi:10.1016/j.ijedudev.2011.01.011
Lewin, K., & Lu, W. (2011). Education and Change in Rich, Poor and National Minority Areas in China: Two Decades of Transition. CREATE Pathways to Access. Research Monograph No. 61. ERIC.
Lewin, K. M. (2009). Access to education in Sub‐Saharan Africa: patterns, problems and possibilities. Comparative Education, 45(2), 151–174. doi:10.1080/03050060902920518
Lewin, K., & Sabates, R. (2011). Changing patterns of access to education in Anglophone and Francophone countries in Sub-Saharan Africa: Is Education pro-poor? (Research Monograph No. 52). United Kingdom: University of Sussex.
Lewin, K., & Sabates, R. (2012). Who gets what? Is improved access to basic education pro-poor in Sub-Saharan Africa? International Journal of Educational Development, 32(4), 517–528. doi:10.1016/j.ijedudev.2012.02.013
Lewin, K., Wasanga, P., Wanderi, E., & Somerset, A. (2011). Participation and Performance in Education in Sub-Saharan Africa with special reference to Kenya: Improving Policy and Practice (Research Monograph No. 74). Centre for International Education , Brighton , UK: University of Sussex. Retrieved from http://www.create-rpc.org/pdf_documents/PTA74.pdf
Lincove, J. A. (2009). Determinants of schooling for boys and girls in Nigeria under a policy of free primary education. Economics of Education Review, 28(4), 474–484. doi:10.1016/j.econedurev.2008.10.001
Lloyd, C. B., & Blanc, A. K. (1996). Children’s Schooling in sub-Saharan Africa: The Role of Fathers, Mothers, and Others. Population and Development Review, 22(2), 265–298.
Lloyd, C. B., & Gage-Brandon, A. (1994). High Fertility and Children’s Schooling in Ghana - Sex Differences in Parental Contributions and Educational Outcomes. Population Studies, 48(2), 293–306.
Luo, R., Shi, Y., Zhang, L., Liu, C., Rozelle, S., & Sharbono, B. (2009). Malnutrition in China’s rural boarding schools: the case of primary schools in Shaanxi Province. Asia Pacific Journal of Education, 29(4), 481–501. doi:10.1080/02188790903312680
253
Mabika Mabika, C., & Shapiro, D. (2012). School enrolment in the Democratic Republic of Congo:family economic-well-being, gender and place of residence. African Population Studies, 26(2), 197–220.
Maitra, P. (2003). Schooling and Educational Attainment: Evidence from Bangladesh. Education Economics, 11(2), 129–153.
Majgaard, K., & Mingat, A. (2012). Education in Sub-Saharan Africa : A Comparative Analysis. Washington DC: The World Bank.
Maralani, V. (2008). The changing relationship between family size and educational attainment over the course of socioeconomic development: evidence from Indonesia. Demography, 45(3), 693–717. doi:10.1353/dem.0.0013
Marcoux, R., & Pilon, M. (2003). Evaluation and prospects of methodological approaches concerning primary education in countries of the South: The Point of view of Demographers. In M. Cosio, R. Marcoux, M. Pilon, & A. Quesnel (Eds.), Education, Family and Population dynamics (pp. 77–100). Paris: CICRED.
Mare, R. (1980). Social Background and School continuation decisions. The Journal of American Statistical Association, 75(370), 295–305.
Mestry, R., Moloi, K. C., & Mahomed, A. . (2007). Perspectives on a zero-tolerance approach to discipline: towards maintaining a nurturing and secure school environment. Africa Education Review, 4(2), 94–113. doi:10.1080/18146620701652721
Ministry of Education and Sports. (2004). Education Sector Strategic Plan 2004-2015.
Ministry of Education and Sports. (2011). The Education and Sports Sector Annual Performance Report. Kampala.
Ministry of Education and Sports. (2012). The Education and Sports Sector Annual Performance Report. Kampala.
Ministry of Finance Planning and Economic Development. (2011). The State of Uganda Population Report 2011. Kampala, Uganda.
MoES. (1989). Report of the Education Policy Review Commission. Kampala, Uganda: Ministry of Education and Sports.
MoES. (1992). The Government White Paper. Kampala, Uganda: Ministry of Education and Sports.
MoES. (1998). Education Sector Investment Plan 1998-2003. Ministry of Education and Sports.
MoES. (2001). The Development of Education in Uganda in the last 10 Years. Geneva: Ministry of Education and Sports.
MoES. (2004). Education Sector Strategic Plan 2004-2015. Ministry of Education and Sports.
MoES. (2010). Uganda Education Statistical abstract 2010. Kampala: Ministry of Education and Sports.
MoES. (2011a). Uganda Education Statistical Abstract 2011. Kampala, Uganda: Ministry of Education and Sports.
254
MoES. (2011b). USE/UPPET National Headcount 2011Report. Uganda Bureau of Statistics.
MoES. (2012a). Comprehensive Report on the Universal Secondary Education(USE/UPPET)& Universal Post O’ Level Education & Training (UPOLET) (National Headcount Exercise 2012). Kampala, Uganda: Ministry of Education and Sports.
MoES. (2012b). The Education and Sports Sector Annual Performance Report. Kampala, Uganda: Ministry of Education and Sports.
MoES. (2013). The Education and Sports Sector Annual Performance Report FY 2012/13. Kampala, Uganda: Ministry of Education and Sports. Retrieved from http://www.education.go.ug/files/downloads/ESSAPR%20%20FY2012_13.pdf
MOFPED. (2012). The Background to the Budget 2012/13 Fiscal Year. Kampala: Ministry of Finance Planning and Economic Development.
Moguérou, L. (2011). La démocratisation de l’école à Dakar, les enseignements d’une enquête biographique. Autrepart, 59, 91–108. doi:10.3917/autr.059.0091
Mugisha, F. (2006). School enrollment among urban non-slum, slum and rural children in Kenya: Is the urban advantage eroding? International Journal of Educational Development, 26(5), 471–482. doi:10.1016/j.ijedudev.2005.09.012
Mulindwa Najjumba, I., Lwanga Bunjo, C., Kyaddondo, D., & Misinde, C. (2013). Improving learning in Uganda Community-led school feeding practices (No. Vol. 1). Washington DC: The World Bank.
Nakabugo, M. G., Byamugisha, A., & Bithaghalire, J. (2008). Future Schooling in Uganda. Journal of International Cooperation in Education, 11(1), 55–69.
Nassali, R. (1998). Working toward gender parity in education in developing countries: Issues and Challenges.
New Vision. (2011, January 19). Dropouts in primary schools in Uganda.
New Vision. (2014, February 4). Ranking of PLE Schools per district. Kampala. Retrieved from http://www.newvision.co.ug/news/652109-ranking-of-ple-schools-per-district.html
Ngware, M. W., Onsomu, E. N., Muthaka, D. I., & Manda, D. K. (2006). Improving access to secondary education in Kenya: what can be done? Equal Opportunities International, 25(7), 523–543.
Nishimura, M., Yamano, T., & Sasaoka, Y. (2008). Impacts of the universal primary education policy on educational attainment and private costs in rural Uganda. International Journal of Educational Development, 28(2), 161–175. doi:10.1016/j.ijedudev.2006.09.017
Nkata James. (1999). Basic education renewal. The Ugandan experience.
Ntozi, J. P. (1997). Effect of AIDS on children: the problem of orphans in Uganda. Health Transition Review, Supplement to Volume 7, 23–40.
Ohba, A. (2009). Does free secondary education enable the poor to again access? A study from rural Kenya (Research Monograph No. 21). Centre for International Education , Brighton , UK: University of Sussex.
255
Ohba, A. (2011). The abolition of secondary school fees in Kenya: Responses by the poor. International Journal of Educational Development, 31(4), 402–408. doi:10.1016/j.ijedudev.2011.01.009
Ohba, A. (2012). Widening access to secondary education in Africa: What lessons could Africa learn from East and Southeast Asian Countries? Asia Pacific Journal of Educators and Education, 27, 1–21.
Oketch, M., & Rolleston, C. (2007). Policies on free Primary and secondary Education in East Africa, Retrospect and prospect. Review of Research in Education, 31, 131–158.
Oketch, M., & Somerset, A. (2010). Free Primary Education and After in Kenya: Enrolment impact, quality effects, and the transition to secondary school (Research Monograph No. 37). Centre for International Education , Brighton , UK: University of Sussex. Retrieved from http://www.create-rpc.org/pdf_documents/PTA37.pdf
Olaniyan, D., & Okemakinde, T. (2008). Human Capital theory : Implications for Educational Development. European Journal of Scientific Research, 24(2), 157–162.
Otieno, W., & K’Oliech, D. (2007). Factors Affecting transition to secondary education in Africa.
Pilon, M. (1995). Les déterminants de la scolarisation des enfants de 6-14ans au Togo en 1981 : apports et limites des données censitaires. Cahiers Sciences Humaines, 31(3), 697–718.
Pilon, M. (1996). Genre et scolarisation des enfants en Afrique Subsaharienne. In T. Locoh, A. Labourie-Racapé, & C. Tichit (Eds.), Genre et Développement : Des pistes à Suivre (pp. 25–34). Paris: CEPED.
Pilon, M. (2002a). Disparités intra-urbaines en matière de scolarisation ; Le cas de Ouagadougou. In Atelier de Recherche sur L’éducation au Burkina Faso. Ouagadougou.
Pilon, M. (2002b). Scolarisation et travail des enfants en Afrique : apports et limites des sources de données démographiques. Presented at the Enfants d’aujourd’hui, diversité des contextes, pluralité des parcours, Dakar.
Pilon, M. (2004). L’évolution du champ scolaire au Burkina Faso : entre diversification et privatisation. Cahiers de la recherche sur l’éducation et les savoirs, 3, 143–165.
Pilon, M. (2005). Confiage et scolarisation en Afrique de l’Ouest, éclairage a partir des sources de données démographiques. In Scolarisation et changements démographiques.
Pilon, M. (2006). Introduction. In M. Pilon (Ed.), Défis du développement en Afrique subsaharienne, l’éducation en jeu (pp. 9–23). Paris: CEPED.
Pilon, M. (2010). Introduction. In M. Pilon, J.-Y. Martin, & A. Carry (Eds.), Le droit à l’éducation, Quelle Universalité? (pp. 7–16). Paris: Editions des archives Contemporaines.
Pilon, M., & Wayack-Pambè, M. (2002). Evolution de l’enseignement secondaire au Burkina Faso de 1960 à 1999 (Etudes et Documents No. 8). Ouagadougou: UERD.
Poirier, T. (2012). The effects of armed conflict on schooling in Sub-Saharan Africa. International Journal of Educational Development, 32(2), 341–351. doi:10.1016/j.ijedudev.2011.06.001
256
Pridmore, P. (2007). Impact of health on education access and Achievement: A cross-national Review of the Research Evidence (Research Monograph No. 2). Centre for International Education, Brighton, UK: University of Sussex.
Roach, T. (2009). The Effect of fertility levels on the educational attainment of children in Uganda.
Rolleston, C. (2009). The determination of exclusion: evidence from the Ghana Living Standards Surveys 1991–2006. Comparative Education, 45(2), 197–218. doi:10.1080/03050060902920617
Rollins, M. R., & Cross, T. L. (2014). A Deeper Investigation Into the Psychological Changes of Intellectually Gifted Students Attending a Residential Academy. Roeper Review, 36(1), 18–29. doi:10.1080/02783193.2014.856372
Sabates, R., Hossain, A., & Lewin, K. (2013). School dropout in Bangladesh: Insights using panel data. International Journal of Educational Development, 33(3), 225–232. doi:10.1016/j.ijedudev.2012.09.007
Saito, I., Ssenabulya, F., & Lubega, I. (2011). Progress in gender equality in education in Uganda (SACMEQ). Harare.
Shapiro, D. (2003). Family influences on women’s education in Kinshasa. In M. Cosio, R. Marcoux, M. Pilon, & A. Quesnel (Eds.), Education, Family and Population dynamics (pp. 281–304). Paris: CICRED.
Shapiro, D., & Oleko Tambashe, B. (2001). Gender, poverty, family structure, and investments in children’s education in Kinshasa, Congo. Economics of Education Review, 20(4), 359–375. doi:10.1016/S0272-7757(00)00059-5
Siddhu, G. (2011). Who makes it to secondary school? Determinants of transition to secondary schools in Rural India. International Journal of Educational Development, 31(4), 394–401.
Smith, A. (2009). Indigenous peoples and boarding schools: A comparative study. In Paper Secretariat of the United Nations Permanent Forum on Indigenous Issues. New York (pp. 18–29). New York.
Somerset, A. (2011). Access, cost and quality: tensions in the development of primary education in Kenya. Journal of Education Policy, 26(4), 483–497. doi:10.1080/02680939.2011.554998
Sommers, C. (2013). Primary Education in Rural Bangladesh : Degrees of access , Choice and participation of the poorest (Research Monograph No. 75). Centre for International Education , Brighton , UK: University of Sussex.
Sommers, M. (2005). Islands of Education: Schooling, Civil war and the Southern Sudanese (1983-2004). Paris: International Institute for Educational Planning.
Ssekamwa, J. . (1997). History and Development of Education in Uganda. Kampala: Fountain Publishers.
Ssewamala, F. M., Wang, J. S.-H., Karimli, L., & Nabunya, P. (2011). Strengthening Universal Primary Education in Uganda: The potential role of an asset-based development policy. International Journal of Educational Development, 31(5), 472–477. doi:10.1016/j.ijedudev.2010.11.001
257
Ssewanyana, S., & Kasirye, I. (2012). Poverty and Inequality Dynamics in Uganda: Insights from the Uganda National Panel Surveys 2005/6 and 2009/10 (Research series No. 94). Kampala, Uganda: Economic Policy Research Centre.
Ssewanyana, S., Okoboi, G., & Kasirye, I. (2011). Cost Benefit Analysis of Uganda Post Primary Education and Training Expansion and Improvement Project (Research Paper No. 86) (pp. 1–12). Kampala: Economic Policy Research Centre.
Stickney, B. D. (1977). Boarding Schools: An Alternative Educational Experience for Disadvantaged Children. Retrieved from https://frodon.univ-paris5.fr/url?http://search.ebscohost.com/login.aspx?direct=true&db=eric&AN=ED160673&lang=fr&site=ehost-live
Syngellakis, K., & Arudo, E. (2006). Education Sector Policy Overview. United Kingdom.
Takahashi, K. (2011). Determinants of Indonesian rural secondary school enrolment: gender, neighbourhood and school characteristics. Bulletin of Indonesian Economic Studies, 47(3), 395–413.
Talemwa, M. (2012, February 14). Special Analysis:Catholic, boarding schools the best. The Observer. Kampala.
The Republic of Uganda. (2013). The State of Uganda Population Report 2013. Kampala: Ministry of Finance Planning and Economic Development.
The World Bank. (2013). Education and Health services in Uganda: Data for Results and Accountability (Service Delivery Indicators). Washington DC.
Tiberondwa, A. (1999). Basic education provision and the politics of Uganda. Presented at the Conference on Basic Education Renewal Research Initiative for Poverty Alleviation, Arusha.
Tsujita, Y. (2013). Factors that prevent children from gaining access to schooling: A study of Delhi slum households. International Journal of Educational Development, 33(4), 348–357. doi:10.1016/j.ijedudev.2012.08.001
Tumushabe, J., Barasa, C., Muhanguzi, F., & Otim-Nape, J. (1999). Gender and Primary Schooling in Uganda. FAWE.
UBOS. (2002). 2002 Uganda Population and Housing Census. Kampala, Uganda: Uganda Bureau of Statistics.
UBOS. (2006). Uganda National Household Survey 2005/2006 ; Socio-Economic Module. Kampala: Uganda Bureau of Statistics.
UBOS. (2009). Uganda National Household Survey 2009/2010, Manual of Instructions.
UBOS. (2010b). Uganda National Household Survey 2009/2010, Socio-Economic Module. Kampala: Uganda Bureau of Statistics.
UBOS. (2010c). UNHS 2009/10 Qualitative Module. Kampala, Uganda: Uganda Bureau of Statistics.
UBOS. (2011). Uganda National Panel Survey 2009/2010 (WAVE 1). Kampala, Uganda: Uganda Bureau of Statistics.

258
UBOS and ICF International Inc. (2012). Uganda Demographic and Health Survey 2011. Calverton, Maryland, USA.
UBOS and Macro International Inc. (2007). Uganda Demographic and Health Survey 2006. Calverton, Maryland, USA.
Uganda Bureau of Statistics. (2010). Uganda Education Statistics Abstract 2010.
Uganda Bureau of Statistics and ORC Macro. (2001). Uganda DHS EdData survey, 2001: Education data for decision-making. Calverton, Maryland, USA: Uganda Bureau of Statistics.
UIS. (2011). Global education digest 2011. Focus on secondary education : the next great challenge. Montréal: UNESCO.
UIS, UAPS, UNICEF, Ed Data, & USAID. (2004). Guide to the Analysis and use of Household Survey and Census Education Data. UNESCO Institute of Statistics.
Uitto, J. I. (1989). The Kenyan Conundrum: A regional Analysis of Population growth and Primary education in Kenya. Sweden: Lund University Press.
UNDP. (2013). Human Development Report 2013,The rise of the South: Human Progress in a diverse World. New York: United Nations Development Program.
UNEB. (2010a). The Achievement of Primary School Pupils in Uganda in Numeracy, Literacy in English and local languages. Kampala, Uganda: Uganda National Examinations Board.
UNEB. (2010b). The Achievement of Senior Two Students in Mathematics , English Language and Biology. Kampala, Uganda: Uganda National Examinations Board.
UNEB. (2012). The Achievement of Primary School Pupils in Uganda in Numeracy and Literacy in English. Kampala, Uganda: Uganda National Examinations Board.
UNESCO. (2007). EFA Global Monitoring Report, 2008: Education for All by 2015, Will We Make it?. Paris.
UNESCO. (2011). Education for All Global Monitoring Report 2011 : Regional Overview Sub-Saharan Africa. Retrieved from http://unesdoc.unesco.org/images/0019/001913/191393e.pdf
UNICEF. (2005). The report on the situation of children and women in the Republic of Uganda.
United Nations. (2013). World Population Prospects, the 2012 Revision, CD-ROM Edition. United Nations , Department of Economic and Social Affairs , Population Division.
UWEZO-Uganda. (2010). Are our children learning? Annual Learning Assessment Report 2010. Kampala.
UWEZO-Uganda. (2011). Are our children learning? Annual Learning Assessment Report 2011. Kampala.
UWEZO-Uganda. (2012). Are Our Children Learrning? Annual Learning Assessment Report 2012.
Wakam, J. (2003). Structure démographique des ménages et scolarisation au Cameroun. In M. Cosio, R. Marcoux, M. Pilon, & A. Quesnel (Eds.), Education, Family and Population dynamics (pp. 183–210). Paris: CICRED.
259
Walubiri, M. (2012, May 18). 200,000 may drop out of USE. New Vision.
Wamala, R., Omala, S. K., & Jjemba, E. (2013). Academic achievement of Ugandan Sixth grade students: Influence of Parents’ Education. Contemporary Issues in Education Review, 6(1), 133–141.
Wayack-Pambè, M. (2012). Genre, Sexe du chef du ménage et Scolarisation des enfants à Ouagadougou. Université de Paris Ouest- Nanterre La Défense, Paris.
Wayack-Pambè, M., & Pilon, M. (2011). Sexe du chef de ménage et Inégalités scolaires à Ouagadougou (Burkina Faso). Autrepart, 59, 125–144. doi:10.3917/autr.059.0125
Wells, R. (2009). Gender and age-appropriate enrolment in Uganda. International Journal of Educational Research, 48(1), 40–50. doi:10.1016/j.ijer.2009.03.002
Wilkinson, R., & Pickett, K. (2009). The Spirit Level: Why Greater Equality makes Societies stronger. New York: Bloomsbury Press.
Woodhead, M., Frost, M., & James, Z. (2013). Does growth in private schooling contribute to Education for All? Evidence from a longitudinal, two cohort study in Andhra Pradesh, India. International Journal of Educational Development, 33(1), 65–73. doi:10.1016/j.ijedudev.2012.02.005
World Bank. (2011). Demography and Economic Growth in Uganda (No. 63165-UG). Washington: World Bank.
World Bank. (2012a). Improving Learning , A shared Responsibility.
World Bank. (2012b). Uganda; Promoting Inclusive Growth (No. 67377-UG). Washington: World Bank.
Zuze, T. L., & Leibbrandt, M. (2011). Free education and social inequality in Ugandan primary schools: A step backward or a step in the right direction? International Journal of Educational Development, 31(2), 169–178. doi:10.1016/j.ijedudev.2010.06.013

260
Annex 1: Univariate Analysis for General Model 2006 2010
Frequency % Frequency %
Residence Rural 6,225 81 Rural 6,562 82
Urban 1,430 19 Urban 1,461 18
Total 7,655 100 8,023 100
Wealth status Poor 3,431 45 Poor 3,392 42 Middle 1,856 24 Middle 2,091 26
Rich 2,368 31 Rich 2,540 32
Total 7,655 100 8,023 100
Region Central 2,398 31 Central 2,309 29
Eastern 1,790 23 Eastern 2,212 28
Northern 1,340 18 Northern 1,533 19
Western 2,127 28 Western 1,967 24
Total 7,655 100 8,021 100
Sex of child Male 3,696 48 Male 3,763 47
Female 3,959 52 Female 4,260 53
Total 7,655 100 8,023 100
Relation to hh head Own Child 4,083 53 Own Child 4,422 55
Other Relative 3,329 44 Other Relative 3,385 42
Non Relative 244 3 Non Relative 217 3
Total 7,656 100 8,023 100
Education of hh head
None 973 13 None 982 12
Primary 4,710 63 Primary 4,817 61
Secondary & Above 1,794 24 Secondary & Above 2,128 27
Total 7,603 100 7,927 100
Sex of hh head Male 5,635 74 Male 5,624 70
Female 2,020 26 Female 2,399 30
Total 7,655 100 8,023 100
Marital Status of head
Married monogamously
4,360 57 Married monogamously
4,653 60
Married polygamously
1,531 20 Married polygamously 1,434 17
Divorced/separated 400 5 Divorced/separated 488 6
Widow/widower 1,002 13 Widow/widower 1,096 13
Never married 362 5 Never married 352 4
Total 7,655 100 8,023 100
Age of household head
Less than 31
1,629
21
Less than 31
1,999
25
31-59 4,690 61 31-59 4,837 60

261
60+ 1,336 18 60+ 1,186 15
Total 7,655 100 8,023 100
Age of child 13-18 4,541 59 13-18 4,747 59
19-24 3,114 41 19-24 3,276 41
Total 7,655 100 8,023 100
Household size 1--4 2,042 26 1--4 2,308 29
5--9 4,120 54 5--9 4,395 55
10+ 1,493 20 10+ 1,318 16
Total 7,655 100 8,023 100
If natural Father in hh
Yes 1,584 41 Yes 2,436 58
No, Alive 1,013 27 No, Alive 1,168 28
No , Dead 1,231 32 No , Dead 613 14
Total 3,828 100 4,217 100
If natural Mother in hh
Yes 1,940 51 Yes 3,059 73
No, Alive 1,088 28 No, Alive 863 20
No, Dead 796 21 No, Dead 295 7
Total 3,824 100 4,217 100
Main Occupation of hh
Subsistence farming 4,017 54 Subsistence farming 3,650 46
Commercial farming 298 4 Commercial farming 385 5
Wage employment 1,220 17 Wage employment 1,653 21
Nonagricultural enterprises
1,330 18 Nonagricultural enterprises
1,639 21
Property Income ,remittances &transfers
350 5 Property Income ,remittances &transfers
620 6
Org. support &others 148 2 Org. support &others 63 1
Total 7,363 100 8,010 100
Children < 5 0-1 5,416 71 0-1 5,694 71
2 1,595 21 2 1,741 22
3+ 642 8 3+ 588 7
Total 7,655 100 8,023 100
Adults None 5,069 66 None 5,297 66
One 1,640 22 One 1,817 23
2+ 948 12 2+ 908 11
Total 7,655 100 8,023 100

262
Annex 2: List of top 200 Secondary Schools at Ordinary Level in 2012
No. SCHOOL Div 1 TOTAL % Div 1 STATUS FOUNDER BODY SEX
1. MT. ST. MARYS NAMAGUNGA 134 134 100.0 Boarding Catholic Single Sex
2. ST. MARY'S COL. KISUBI 189 191 99.0 Boarding Catholic Single Sex
3. ST. MARY'S SS, KITENDE 399 410 97.3 Boarding Private Mixed
4. UGANDA MARTYRS NAMUGONGO 252 260 96.9 Boarding Catholic Mixed
5. NTARE SCHOOL 245 253 96.8 Boarding Government Single Sex
6. ST. HENRY'S COL. KITOVU 112 117 95.7 Boarding Catholic Single Sex
7. NAMILYANGO COL. 171 181 94.5 Boarding Catholic Single Sex
8. LONDON COL – ST LAWRENCE 48 51 94.1 Boarding Private Mixed
9. KISUBI SEMINARY 44 47 93.6 Boarding Catholic Single Sex
10. NADIKET SEMINARY MOROTO 14 15 93.3 Boarding Catholic Single Sex
11. SEETA HIGH 171 187 91.4 Boarding Private Mixed
12. NDEJJE SSS 179 202 88.6 Boarding Anglican Mixed
13. IMMACULATE HEARTS G/S 172 198 86.9 Boarding Catholic Single Sex
14. ST. JOSEPH'S SS, NAGGALAMA 137 158 86.7 Boarding Catholic Mixed
15. GAYAZA HIGH SCH 162 187 86.6 Boarding Anglican Single Sex
16. NABISUNSA GIRLS' SCH 201 233 86.3 Boarding Muslim Single Sex
17. NAALYA SS NAMUGONGO 137 161 85.1 Boarding Private Mixed
18. TURKISH LIGHT ACADEMY K'LA 57 67 85.1 Boarding Private Mixed
19. ST.JOSEPH'S VOC SCH-MBARARA 102 121 84.3 Boarding Catholic Single Sex
20. NOTRE DAME ACADEMY BUSEESA 32 38 84.2 Boarding Private Mixed
21. TRINITY COL. NABBINGO 143 170 84.1 Boarding Catholic Single Sex
22. ST. JOSEPH'S GIRLS' NSAMBYA 186 224 83.0 Boarding Catholic Single Sex
23. MARYHILL H/S 181 218 83.0 Boarding Catholic Single Sex
24. OUR LADY OF AFRICA, SEETA 83 100 83.0 Boarding Catholic Mixed
25. MERRYLAND H/S ENTEBBE 81 98 82.7 Boarding Private Mixed
26. KING'S COL. BUDO 182 224 81.3 Boarding Anglican Mixed
27. ST.JULIAN H/S K'LA 21 26 80.8 Boarding Private Mixed
28. MBARARA HIGH SCH 157 198 79.3 Boarding Anglican Single Sex
29. TORORO GIRLS' SCH 137 186 73.7 Boarding Government Single Sex
30. KAWEMPE MUSLIM SS 161 220 73.2 Boarding Muslim Mixed
31. KIIRA COL. BUTIKI 102 144 70.8 Boarding Government Single Sex
32. ST KIZITO SS KABOWA 19 27 70.4 Boarding Catholic Mixed
33. SEETA H/S MUKONO 147 213 69.0 Boarding Private Mixed
34. IGANGA SEC. SCH 160 236 67.8 Boarding Government Single Sex
35. MAKERERE COL. SCH 163 242 67.4 Day/Boarding Anglican Mixed
36. KIBULI SEC. SCH 185 277 66.8 Boarding Muslim Mixed
37. BWERANYANGI GIRLS' SCH 140 216 64.8 Boarding Anglican Single Sex
38. BUKINDA SEMINARY KABALE 14 22 63.6 Boarding Catholic Single Sex
39. KITABI SEMINARY 47 76 61.8 Boarding Catholic Single Sex

263
40. GOMBE SSS 163 270 60.4 Boarding Muslim Mixed
41. SOS H. GMEINER SS KAMPALA 18 30 60.0 Boarding Private Mixed
42. ST. ANDREA KAHWA COL. HOIMA 111 187 59.4 Boarding Private mixed
43. ST. PAUL'S SEMINARY KABALE 29 49 59.2 Boarding Catholic Single Sex
44. JINJA COL. 90 155 58.1 Boarding Government Single Sex
45. BP. CYPRIANO KIHANGIRE 140 243 57.6 Day/Boarding Catholic Mixed
46. NAGONGERA SEMINARY 19 34 55.9 Boarding Catholic Single Sex
47. BUDO SS K'LA 129 232 55.6 Boarding Private single Sex
48. NAMIREMBE HILLSIDE 37 67 55.2 Boarding Private Mixed
49. ST. KAGGWA BUSHENYI H/S 29 53 54.7 Boarding Catholic Single Sex
50. ST.JOSEPH OF NAZARETH K'LA 27 50 54.0 boarding Private Single Sex
51. ARCH. BP FLYNN SS-PADER 14 26 53.8 Day/Boarding Catholic mixed
52. DR. OBOTE COL. BOROBORO 67 127 52.8 Boarding Government Single Sex
53. ST. MARY'S COL. ABOKE 25 49 51.0 Boarding Catholic Single Sex
54. CENTRAL COL MITYANA 56 110 50.9 Day/Boarding Private Mixed
55. BISHOP CYPRIAN H/S-NAGGALAMA 41 81 50.6 Boarding Catholic Mixed
56. ST. LAWRENCE HORIZON-KAMPALA 25 50 50.0 Boarding Private Mixed
57. ST.CHARLES LWANGA SEM RUKUNGIRI 15 30 50.0 Boarding Catholic Single Sex
58. NAALYA SS BWEYOGERERE 68 140 48.6 Boarding Private Mixed
59. SACRED HEART SS MBARARA 70 145 48.3 Boarding Catholic Single Sex
60. ST. THEREZA GIRL'S BWANDA 64 133 48.1 Boarding Catholic Single Sex
61. MULLUSA ACADEMY WOBULENZI 29 61 47.5 Boarding Private Mixed
62. KATIKAMU SEC. SCH 104 220 47.3 Boarding Private Mixed
63. HILTON H/S MUKONO 64 139 46.0 Boarding Private Mixed
64. BUSOGA COL. MWIRI 55 125 44.0 Boarding Anglican Single Sex
65. BAPTIST HIGH SCH-KITEBI 42 96 43.8 Day/Boarding Private Mixed
66. ST ADRIAN SEM KABALE 17 39 43.6 Boarding Catholic Single Sex
67. OUR LADY O.G.C. GAYAZA 93 222 41.9 Boarding Catholic Mixed
68. ST. PAUL'S COL. MBALE 30 72 41.7 Boarding Catholic Mixed
69. GAYAZA ROAD SS KAMPALA 27 65 41.5 Day/Boarding Private Mixed
70. BLESSED SACRAMENT KIMAANYA 63 154 40.9 Day/Boarding Catholic Mixed
71. ST. EDWARD'S SCH. BUKUUMI 22 54 40.7 Boarding Catholic Mixed
72. MENGO SEC. SCH 200 492 40.7 Day Anglican Mixed
73. ST. LAWRENCE SS-KAMPALA 31 78 39.7 Day/Boarding Private Mixed
74. ST AUGUSTINE COL WAKISO 57 145 39.3 Day/Boarding Catholic Mixed
75. ST. MARIA GORETTI KATENDE 68 173 39.3 Boarding Catholic Single Sex
76. KYEIZOOBA GIRLS' SEC SCH 93 240 38.8 Boarding Government Single Sex
77. BUKALASA MINOR SEMINARY 11 29 37.9 Boarding Catholic Single Sex
78. LUBIRI SEC. SCH 116 309 37.5 Day Government Mixed
79. RUBAGA GIRLS SEC. SCH 34 91 37.4 Boarding Catholic Single Sex
80. MBOGO HGH SCH 70 188 37.2 Boarding Private Single Sex
81. ST. JOSEPH'S COL. , LAYIBI 54 149 36.2 Boarding Catholic Single Sex
82. CHRIST THE KING SS KALISIZO 47 130 36.2 Boarding Catholic Single Sex
83. ST. JOSEPH'S SEMINARY ABOKE 9 25 36.0 Boarding Catholic Single Sex
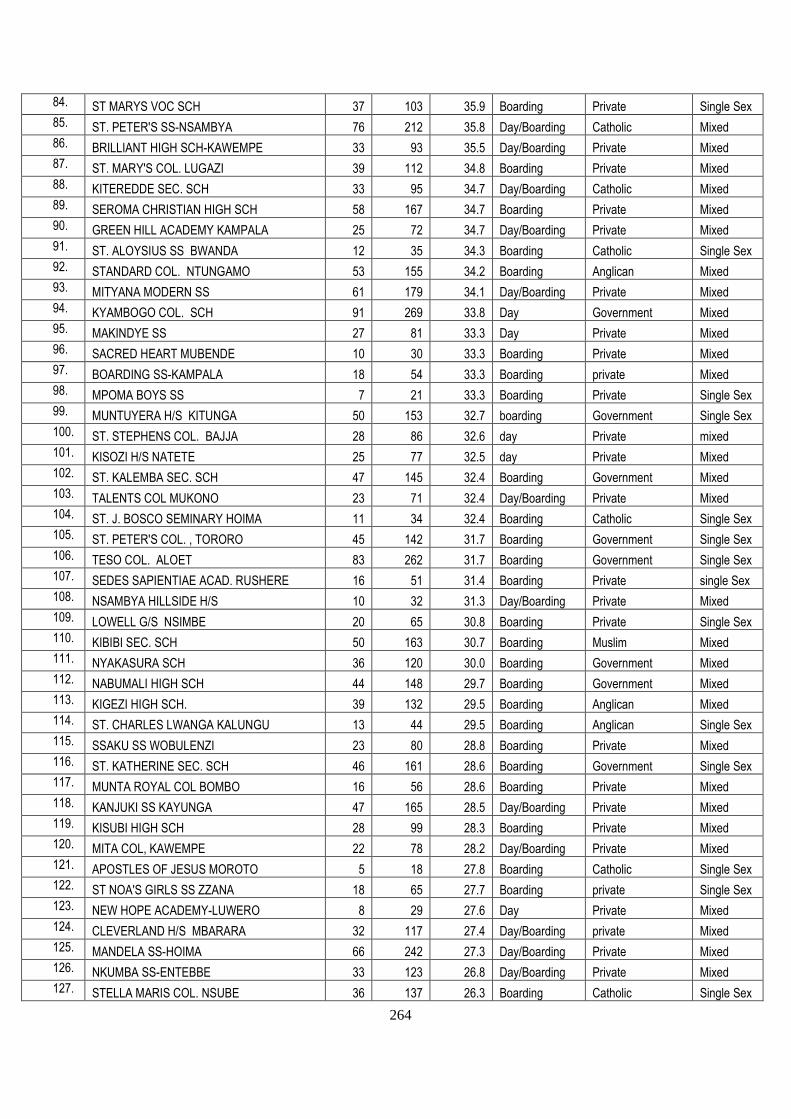
264
84. ST MARYS VOC SCH 37 103 35.9 Boarding Private Single Sex
85. ST. PETER'S SS-NSAMBYA 76 212 35.8 Day/Boarding Catholic Mixed
86. BRILLIANT HIGH SCH-KAWEMPE 33 93 35.5 Day/Boarding Private Mixed
87. ST. MARY'S COL. LUGAZI 39 112 34.8 Boarding Private Mixed
88. KITEREDDE SEC. SCH 33 95 34.7 Day/Boarding Catholic Mixed
89. SEROMA CHRISTIAN HIGH SCH 58 167 34.7 Boarding Private Mixed
90. GREEN HILL ACADEMY KAMPALA 25 72 34.7 Day/Boarding Private Mixed
91. ST. ALOYSIUS SS BWANDA 12 35 34.3 Boarding Catholic Single Sex
92. STANDARD COL. NTUNGAMO 53 155 34.2 Boarding Anglican Mixed
93. MITYANA MODERN SS 61 179 34.1 Day/Boarding Private Mixed
94. KYAMBOGO COL. SCH 91 269 33.8 Day Government Mixed
95. MAKINDYE SS 27 81 33.3 Day Private Mixed
96. SACRED HEART MUBENDE 10 30 33.3 Boarding Private Mixed
97. BOARDING SS-KAMPALA 18 54 33.3 Boarding private Mixed
98. MPOMA BOYS SS 7 21 33.3 Boarding Private Single Sex
99. MUNTUYERA H/S KITUNGA 50 153 32.7 boarding Government Single Sex
100. ST. STEPHENS COL. BAJJA 28 86 32.6 day Private mixed
101. KISOZI H/S NATETE 25 77 32.5 day Private Mixed
102. ST. KALEMBA SEC. SCH 47 145 32.4 Boarding Government Mixed
103. TALENTS COL MUKONO 23 71 32.4 Day/Boarding Private Mixed
104. ST. J. BOSCO SEMINARY HOIMA 11 34 32.4 Boarding Catholic Single Sex
105. ST. PETER'S COL. , TORORO 45 142 31.7 Boarding Government Single Sex
106. TESO COL. ALOET 83 262 31.7 Boarding Government Single Sex
107. SEDES SAPIENTIAE ACAD. RUSHERE 16 51 31.4 Boarding Private single Sex
108. NSAMBYA HILLSIDE H/S 10 32 31.3 Day/Boarding Private Mixed
109. LOWELL G/S NSIMBE 20 65 30.8 Boarding Private Single Sex
110. KIBIBI SEC. SCH 50 163 30.7 Boarding Muslim Mixed
111. NYAKASURA SCH 36 120 30.0 Boarding Government Mixed
112. NABUMALI HIGH SCH 44 148 29.7 Boarding Government Mixed
113. KIGEZI HIGH SCH. 39 132 29.5 Boarding Anglican Mixed
114. ST. CHARLES LWANGA KALUNGU 13 44 29.5 Boarding Anglican Single Sex
115. SSAKU SS WOBULENZI 23 80 28.8 Boarding Private Mixed
116. ST. KATHERINE SEC. SCH 46 161 28.6 Boarding Government Single Sex
117. MUNTA ROYAL COL BOMBO 16 56 28.6 Boarding Private Mixed
118. KANJUKI SS KAYUNGA 47 165 28.5 Day/Boarding Private Mixed
119. KISUBI HIGH SCH 28 99 28.3 Boarding Private Mixed
120. MITA COL, KAWEMPE 22 78 28.2 Day/Boarding Private Mixed
121. APOSTLES OF JESUS MOROTO 5 18 27.8 Boarding Catholic Single Sex
122. ST NOA'S GIRLS SS ZZANA 18 65 27.7 Boarding private Single Sex
123. NEW HOPE ACADEMY-LUWERO 8 29 27.6 Day Private Mixed
124. CLEVERLAND H/S MBARARA 32 117 27.4 Day/Boarding private Mixed
125. MANDELA SS-HOIMA 66 242 27.3 Day/Boarding Private Mixed
126. NKUMBA SS-ENTEBBE 33 123 26.8 Day/Boarding Private Mixed
127. STELLA MARIS COL. NSUBE 36 137 26.3 Boarding Catholic Single Sex

265
128. ST MARK'S COL. NAMAGOMA 41 157 26.1 Boarding Private Mixed
129. ST. MARY'S COL. RUSHOROZA 45 173 26.0 Boarding Catholic Mixed
130. BISHOP'S SS MUKONO 72 277 26.0 Day/Boarding Anglican mixed
131. ST. JOSEPH SS NANDERE 9 35 25.7 Day/Boarding Government Mixed
132. SOROTI MUNICIPALITY SS 21 82 25.6 Day/Boarding Government Mixed
133. ST. CELICIA GIRLS-BUSHENYI 24 95 25.3 Day Community Single Sex
134. SEAT OF WISDOM SS KASAWO 29 115 25.2 Day Private Mixed
135. LAKESIDE COL. LUZIRA 57 229 24.9 Boarding Private Mixed
136. BUGEMA ADV. SEC. SCH 34 138 24.6 Day/Boarding SDA Mixed
137. HOPE SENIOR SCH , NAKIREBE 15 61 24.6 Day Community Mixed
138. GOODHEART SS-JINJA 28 114 24.6 Day Community Mixed
139. NTUNGAMO HIGH SCH 26 106 24.5 Day/Boarding Private Mixed
140. NGORA HIGH SCH 49 201 24.4 Boarding Government Mixed
141. KABALEGA SEC. SCH 27 112 24.1 Boarding Government Single Sex
142. BULOBA H/S 42 175 24.0 Boarding Private Mixed
143. BUDINI SEC SCH 58 243 23.9 Boarding Government Mixed
144. KAWANDA SS 30 128 23.4 Day/Boarding Private Mixed
145. ADUKU SEC. SCH 25 108 23.1 Day Government Mixed
146. SEETA H/S-GREEN CAMPUS 35 152 23.0 Boarding Private Mixed
147. BLESSED DAMIAN SS MASINDI 8 35 22.9 Day/Boarding private Mixed
148. MARGARET SS KIKAAYA 10 44 22.7 Boarding Private Mixed
149. WANYANGE GIRLS SCH 41 182 22.5 Boarding Anglican Single Sex
150. IBANDA SEC. SCH 31 138 22.5 Boarding Catholic Single Sex
151. LANGO COL. , LIRA 22 98 22.4 Boarding Government Single Sex
152. ST. KIZITO H/S BETHANY 21 94 22.3 Day/Boarding Government Mixed
153. KYEBAMBE GIRL'S SEC. SCH 41 184 22.3 Boarding Government Single Sex
154. ST BALIKUDEMBE KISOGA 22 99 22.2 Boarding Private Mixed
155. HOLY CROSS LAKE VIEW JINJA 23 105 21.9 Day/Boarding Catholic Mixed
156. ST MARY'S SS NAMALIGA 21 96 21.9 Boarding Catholic Single Sex
157. ST. JOSEPH'S COL. OMBACI 33 151 21.9 Boarding Catholic Single Sex
158. USHINDI SEC SCH 10 46 21.7 Day/Boarding Government Mixed
159. ST.JOSEPH 'S H/S NAKIREBE 10 46 21.7 Day/Boarding Private Mixed
160. KINAWA HGH SCH MUGONGO 37 172 21.5 Boarding Private Mixed
161. SENTAH COL-MBARARA 23 107 21.5 Day/Boarding Private Mixed
162. ADWARI SS LIRA 26 121 21.5 Day/Boarding Government Mixed
163. ST.GEORGE SS-MASAKA 15 70 21.4 Day/Boarding Mixed
164. KAJJANSI PROGRESSIVE SS 52 243 21.4 Boarding Private Mixed
165. HOMELAND COL KYOTERA 7 33 21.2 Day/Boarding Private Mixed
166. GOOD SAMARITAN H/S NANSANA 11 52 21.2 Day/Boarding Private Mixed
167. KITANTE HILL SEC. SCH 49 232 21.1 Day Government Mixed
168. KISORO VISION SCH 29 138 21.0 Day/Boarding Private Mixed
169. ST. PETER'S SS-NAALYA 27 129 20.9 Boarding Private Mixed
170. NYAKABANGA SS-BUSHENYI 23 110 20.9 Boarding Private Mixed
171. MEHTA SEC. SCH LUGAZI 19 91 20.9 Day/Boarding private Mixed

266
172. LUGAZI HOMESTONE SCH 39 187 20.9 Day/Boarding Private Mixed
173. ST. CHARLES LWANGA KASASA 10 48 20.8 Boarding Catholic Single Sex
174. ST. LEO'S COL. , KYEGOBE 26 125 20.8 Boarding Catholic Single Sex
175. NAMAGABI SS KAYUNGA 43 207 20.8 Boarding Muslim Mixed
176. MBALE SEC. SCH 78 380 20.5 Day Government Mixed
177. KICHWAMBA HIGH SCH 17 83 20.5 Day/Boarding Private Mixed
178. NAMIRYANGO SS-KAMPALA 22 108 20.4 day/Boarding Private Mixed
179. JERESSAR H/S SOROTI 59 293 20.1 day/Boarding Private Mixed
180. ST LUCIA HILL SCH NAMAGOMA 22 110 20.0 Day/Boarding Private Mixed
181. ST. STEVEN SS-KATAKWI 6 30 20.0 Day/Boarding Private Mixed
182. MBOGO COL-KAMPALA 23 115 20.0 Day/Boarding Private Mixed
183. PRINCESS DIANA SCH K'LA 6 30 20.0 Day/Boarding Private Mixed
184. ST.ANDREA KAAHWA SCH.KOOKI 16 80 20.0 Boarding Private Mixed
185. COMBONI COL. LIRA 18 91 19.8 Boarding Catholic Single Sex
186. MPIGI MIXED SS 15 76 19.7 Day/Boarding Government mixed
187. LUWERO SEC SCH 46 234 19.7 Day Government Mixed
188. CITIZEN'S HIGH SCH-MBARARA 10 51 19.6 Day/Boarding Private Mixed
189. ST. KIZITO HIGH, NAMUGONGO 19 97 19.6 Day/Boarding Private Mixed
190. BUKOYO SEC. SCH 40 205 19.5 Boarding Muslim Mixed
191. ST PAULS SS BUKINDA 17 88 19.3 Day/Boarding Government Mixed
192. ST HENRY'S COLL GANGU 24 125 19.2 Day/Boarding Private Mixed
193. KAKOOLA H/S WOBULENZI 9 47 19.1 Day/Boarding Private Mixed
194. KIBUBURA GIRLS' SS 26 136 19.1 Boarding Government Single Sex
195. ENTEBBE SEC. SCH 29 152 19.1 Day/Boarding Government Mixed
196. ST. CHARLES LWANGA-BUSHENYI 8 42 19.0 Day/Boarding Private Mixed
197. ST. KIZITO SS-KAMPALA 28 147 19.0 Day/Boarding Private Mixed
198. KABOWA H/S K'LA 27 143 18.9 Day/Boarding Private Mixed
199. SEETA HILL COL-MUKONO 10 53 18.9 Day/Boarding Private Mixed
200. MASAKA SEC. SCH 81 430 18.8 Day/Boarding Muslim Mixed
201. LUBIRI HIGH SCH 29 155 18.7 Day/Boarding Private Mixed
202. KASHAKA G/S MBARARA 27 145 18.6 Boarding Government Single Sex
Source the Weekly Observer Newspaper
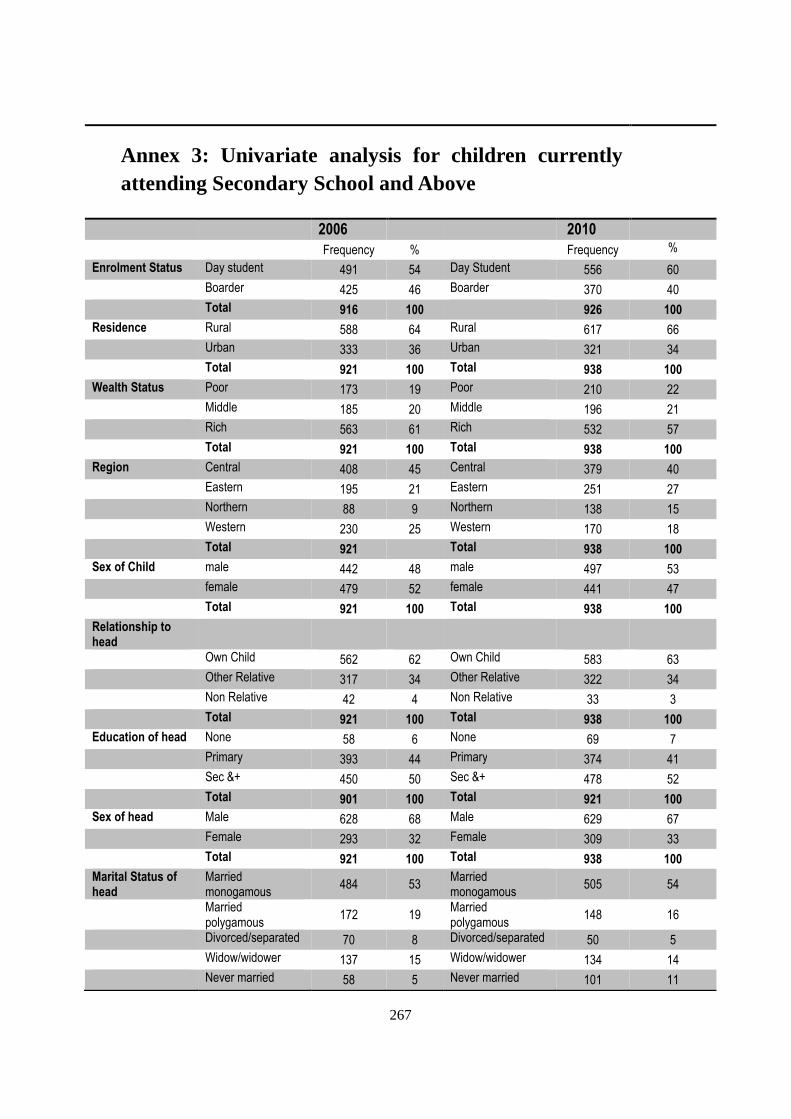
267
Annex 3: Univariate analysis for children currently attending Secondary School and Above
2006 2010
Frequency % Frequency %
Enrolment Status Day student 491 54 Day Student 556 60
Boarder 425 46 Boarder 370 40
Total 916 100 926 100
Residence Rural 588 64 Rural 617 66
Urban 333 36 Urban 321 34
Total 921 100 Total 938 100
Wealth Status Poor 173 19 Poor 210 22
Middle 185 20 Middle 196 21
Rich 563 61 Rich 532 57
Total 921 100 Total 938 100
Region Central 408 45 Central 379 40
Eastern 195 21 Eastern 251 27
Northern 88 9 Northern 138 15
Western 230 25 Western 170 18
Total 921
Total 938 100
Sex of Child male 442 48 male 497 53
female 479 52 female 441 47
Total 921 100 Total 938 100
Relationship to head
Own Child 562 62 Own Child 583 63
Other Relative 317 34 Other Relative 322 34
Non Relative 42 4 Non Relative 33 3
Total 921 100 Total 938 100
Education of head None 58 6 None 69 7
Primary 393 44 Primary 374 41
Sec &+ 450 50 Sec &+ 478 52
Total 901 100 Total 921 100
Sex of head Male 628 68 Male 629 67
Female 293 32 Female 309 33
Total 921 100 Total 938 100
Marital Status of head
Married monogamous
484 53 Married monogamous
505 54
Married polygamous
172 19 Married polygamous
148 16
Divorced/separated 70 8 Divorced/separated 50 5
Widow/widower 137 15 Widow/widower 134 14
Never married 58 5 Never married 101 11
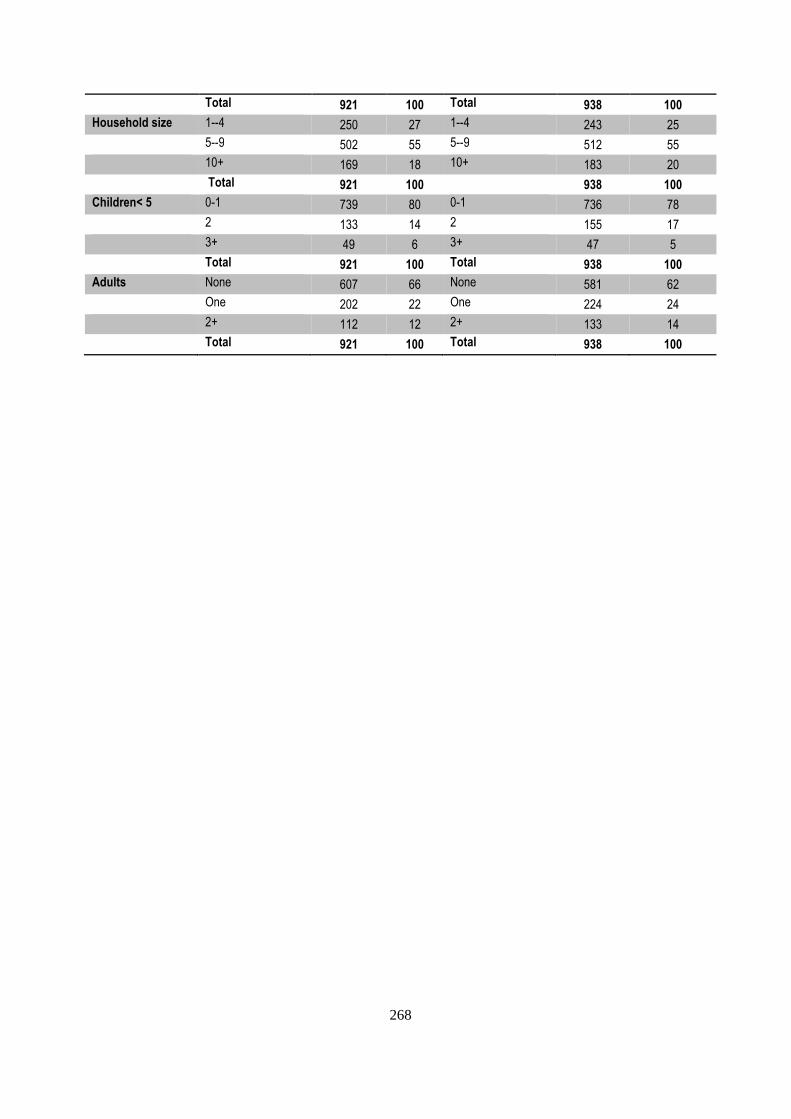
268
Total 921 100 Total 938 100
Household size 1--4 250 27 1--4 243 25
5--9 502 55 5--9 512 55
10+ 169 18 10+ 183 20
Total 921 100 938 100
Children< 5 0-1 739 80 0-1 736 78
2 133 14 2 155 17
3+ 49 6 3+ 47 5
Total 921 100 Total 938 100
Adults None 607 66 None 581 62
One 202 22 One 224 24
2+ 112 12 2+ 133 14
Total 921 100 Total 938 100
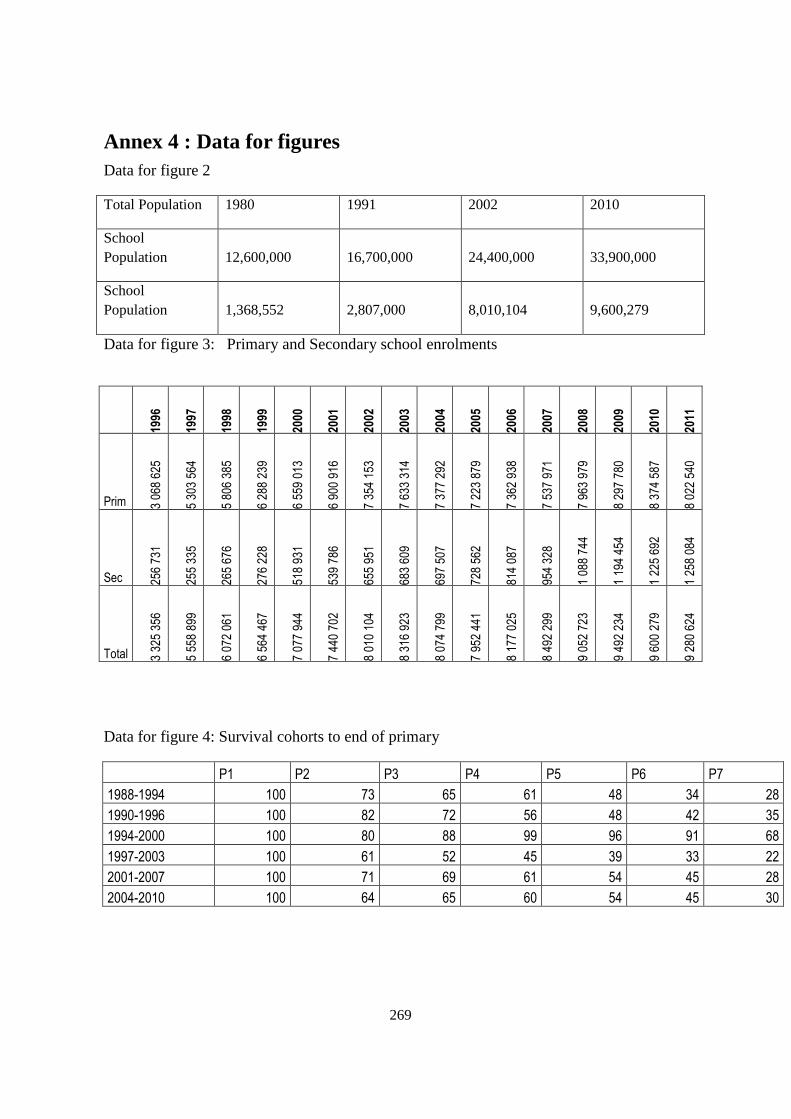
269
Annex 4 : Data for figures Data for figure 2
Total Population 1980 1991 2002 2010
School Population 12,600,000 16,700,000 24,400,000 33,900,000
School Population 1,368,552 2,807,000 8,010,104 9,600,279
Data for figure 3: Primary and Secondary school enrolments
Data for figure 4: Survival cohorts to end of primary
P1 P2 P3 P4 P5 P6 P7
1988-1994 100 73 65 61 48 34 28
1990-1996 100 82 72 56 48 42 35
1994-2000 100 80 88 99 96 91 68
1997-2003 100 61 52 45 39 33 22
2001-2007 100 71 69 61 54 45 28
2004-2010 100 64 65 60 54 45 30
1996
1997
1998
1999
2000
2001
2002
2003
2004
2005
2006
2007
2008
2009
2010
2011
Prim 3 06
8 62
5
5 30
3 56
4
5 80
6 38
5
6 28
8 23
9
6 55
9 01
3
6 90
0 91
6
7 35
4 15
3
7 63
3 31
4
7 37
7 29
2
7 22
3 87
9
7 36
2 93
8
7 53
7 97
1
7 96
3 97
9
8 29
7 78
0
8 37
4 58
7
8 02
2 54
0
Sec 256
731
255
335
265
676
276
228
518
931
539
786
655
951
683
609
697
507
728
562
814
087
954
328
1 08
8 74
4
1 19
4 45
4
1 22
5 69
2
1 25
8 08
4
Total 3 32
5 35
6
5 55
8 89
9
6 07
2 06
1
6 56
4 46
7
7 07
7 94
4
7 44
0 70
2
8 01
0 10
4
8 31
6 92
3
8 07
4 79
9
7 95
2 44
1
8 17
7 02
5
8 49
2 29
9
9 05
2 72
3
9 49
2 23
4
9 60
0 27
9
9 28
0 62
4
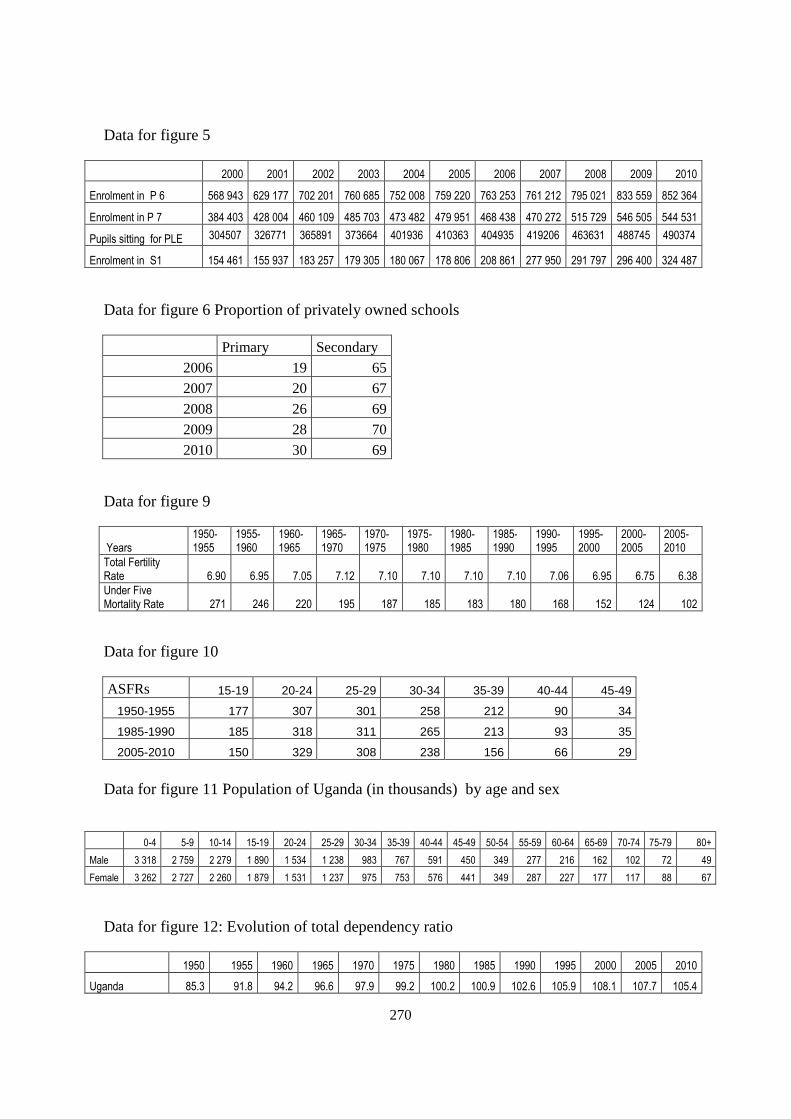
270
Data for figure 5
2000 2001 2002 2003 2004 2005 2006 2007 2008 2009 2010
Enrolment in P 6 568 943 629 177 702 201 760 685 752 008 759 220 763 253 761 212 795 021 833 559 852 364
Enrolment in P 7 384 403 428 004 460 109 485 703 473 482 479 951 468 438 470 272 515 729 546 505 544 531
Pupils sitting for PLE 304507 326771 365891 373664 401936 410363 404935 419206 463631 488745 490374
Enrolment in S1 154 461 155 937 183 257 179 305 180 067 178 806 208 861 277 950 291 797 296 400 324 487
Data for figure 6 Proportion of privately owned schools
Primary Secondary
2006 19 65
2007 20 67
2008 26 69
2009 28 70
2010 30 69
Data for figure 9
Years 1950-1955
1955-1960
1960-1965
1965-1970
1970-1975
1975-1980
1980-1985
1985-1990
1990-1995
1995-2000
2000-2005
2005-2010
Total Fertility Rate 6.90 6.95 7.05 7.12 7.10 7.10 7.10 7.10 7.06 6.95 6.75 6.38
Under Five Mortality Rate 271 246 220 195 187 185 183 180 168 152 124 102
Data for figure 10
ASFRs 15-19 20-24 25-29 30-34 35-39 40-44 45-49
1950-1955 177 307 301 258 212 90 34
1985-1990 185 318 311 265 213 93 35
2005-2010 150 329 308 238 156 66 29
Data for figure 11 Population of Uganda (in thousands) by age and sex
0-4 5-9 10-14 15-19 20-24 25-29 30-34 35-39 40-44 45-49 50-54 55-59 60-64 65-69 70-74 75-79 80+
Male 3 318 2 759 2 279 1 890 1 534 1 238 983 767 591 450 349 277 216 162 102 72 49
Female 3 262 2 727 2 260 1 879 1 531 1 237 975 753 576 441 349 287 227 177 117 88 67
Data for figure 12: Evolution of total dependency ratio
1950 1955 1960 1965 1970 1975 1980 1985 1990 1995 2000 2005 2010
Uganda 85.3 91.8 94.2 96.6 97.9 99.2 100.2 100.9 102.6 105.9 108.1 107.7 105.4

271
Eastern Africa 79.6 81.7 84.2 86.5 88.4 90.2 91.1 92.2 92.0 89.6 88.7 87.2 85.1
Data for figure 13 Evolution of Uganda’s GDP growth rate
1971 1972 1973 1974 1975 1976 1977 1978 1979 1980 1981 1982 1983 1984 1985 1986 1987 1988 1989 1990 1991
Eastern Africa 5,0 5,5 1,8 2,8 1,7 3,5 2,0 1,8 2,3 3,9 2,2 2,0 0,7 0,1 2,3 3,9 4,9 4,4 3,7 3,4 1,3
Uganda 2,7 0,0 0,0 0,0 -1,3 0,0 1,4 -4,0 -12,5 -2,5 1,9 7,8 6,3 -4,6 -0,3 1,5 6,4 7,8 6,9 6,2 5,5
1992 1993 1994 1995 1996 1997 1998 1999 2000 2001 2002 2003 2004 2005 2006 2007 2008 2009 2010 2011
-1,5 4,1 0,1 3,6 6,7 3,4 3,0 3,0 2,1 5,1 2,1 2,7 6,2 6,1 6,3 6,9 13,6 4,4 7,3 5,7
4,6 7,1 10,8 9,4 6,2 5,5 9,7 6,5 4,4 8,8 7,1 6,2 5,8 10,0 7,0 8,1 10,4 4,2 6,3 4,1
Data for figure 14: Evolution of Uganda’s GDP per capita
1970 1971 1972 1973 1974 1975 1976 1977 1978 1979 1980 1981 1982 1983 1984 1985 1986 1987 1988 1989 1990 1991
Eastern Africa 160 171 189 218 248 260 261 279 300 328 361 366 367 352 336 343 340 325 341 340 338 323
Uganda 139 150 158 180 212 232 238 249 248 228 235 254 282 303 290 288 317 342 377 321 220 172
1992 1993 1994 1995 1996 1997 1998 1999 2000 2001 2002 2003 2004 2005 2006 2007 2008 2009 2010 2011
289 255 262 284 308 322 304 287 281 276 272 291 313 348 387 444 550 534 552 600
179 179 272 309 304 317 296 273 252 254 259 265 307 353 375 447 523 511 531 558
Data for figure 15: Evolution of population below poverty line by region
2002/3 2005/6 2009/10
Uganda 39 31 25
Central 22 16 11
West 33 21 22
East 46 36 24
North 63 61 46
Data for figure 17: Evolution of Primary Schools and teachers
Year 1967 1968 1969 1970 1971 1972 1973 1974 1975 1976 1977 1978 1979 1980 1981 1982 1983 1984 1985 1986 1987 1988 1989 1990 1991
Schools 2 551 2 755 2 863 2 937 3 184 3 471 3 663 3 854 3 969 4 294 4 276 4 585 4 945 5 605 6425 7 025 7 351 7 627 7 905 7 684 7 667 8 046
Teachers 19 257 21 471 22 864 24 032 25 394 26 339 27 393 30 321 32 554 34 213 36 442 38 422 40 489 43 967 49 206 57 078 66 101 72 970 75 561 81 418 81 590 78 259
1992 1993 1994 1995 1996 1997 1998 1999 2000 2001 2002 2003 2004 2005 2006 2007 2008 2009 2010
8 325 7 535 8 411 8 531 8 531 8 600 9 916 10 597 11 578 12 280 13 332 13 353 13 371 13 576 14 385 14 728 15 962 17 127 17 865
86 821 91 905 84 043 76 111 81 564 89 247 99 237 109 733 110 366 127 038 139 484 145 587 147 242 143 247 150 135 152 086 159 516 168 376 172 403

272
Data for figure 18: Evolution of secondary schools and teachers.
1967 1968 1970 1971 1972 1973 1974 1975 1976 1977 1978 1979 1980 1981 1982 1983 1984 1985 1986 1987 1988 1989 1990 1991
Schools 71 73 73 73 73 73 74 102 102 103 118 120 178 261 285 417 500 508 515 515 510 508 512
Teachers 1 816 1 791 1 753 1 894 2 594 2 662 2 838 3 108 3 202 3 732 4 772 5 617 6 561 10 193 12 000 12 300 12 919 11 069 13 476
1992 1993 1994 1995 1996 1997 1998 1999 2000 2001 2002 2003 2004 2005 2006 2007 2008 2009 2010
515 508 557 619 619 621 837 1 633 1 892 1 850 2 198 2 055 1 969 1 961 2 286 2 644 2 908 3 149 3 234
14 660 14 620 16 245 14 447 15 783 15 995 16 206 23 295 30 384 30 425 37 227 38 549 37 313 37 607 42 673 50 767 57 158 65 045 62 921
Data for figure 24 : Evolution of enrolments and rates at Primary
1963 1964 1965 1966 1967 1968 1970 1971 1972 1973 1974 1975 1976 1977 1978 1979 1980 1981 1982 1983 1984 1985 1986 1987 1988 1989 1990
Primary Enrolment 507 735 525 867 578 459 633 546 652 027 641 639 729 522 793 530 783 276 #N/A 878 096 970 159 1 016 963 1 139 323 1 204 321 1 223 850 1 302 377 1 246 399 1 581 409 1 730 300 1 930 298 2 117 000 2 203 824 2 309 000 2 417 000 2 366 666 2 276 590
NER (%) 37 41 43 57
1991 1992 1993 1994 1995 1996 1997 1998 1999 2000 2001 2002 2003 2004 2005 2006 2007 2008 2009 2010 2011
2 576 000 2 403 745 2 177 169 2 305 258 2 636 409 3 068 625 5 303 564 5 806 385 6 288 239 6 559 013 6 900 916 7 354 153 7 633 314 7 377 292 7 223 879 7 362 938 7 537 971 7 963 979 8 297 780 8 374 587 8 022 540
86 87 85 87 90 93 92 93 95 91 96 97
Data for figure 25: Evolution of enrolments and rates at Secondary
1963 1964 1965 1966 1967 1968 1970 1971 1972 1973 1974 1975 1976 1977 1978 1979 1980 1981 1982 1983 1984 1985 1986 1987 1988 1989 1990
Sec enrolment 18282 20447 24345 28067 27019 33698 46626 43722 43558 160762 45476 45231 56884 57882 62790 66175 61869 82991 97752 117090 144526 160000 123479 223000 243000 235032 244778
NER (%) 4 4 4 4 5 5 5 5 5 5 8 7 8 9 10 11 12 11
1991 1992 1993 1994 1995 1996 1997 1998 1999 2000 2001 2002 2003 2004 2005 2006 2007 2008 2009 2010 2011
231000 230256 151029 183056 256259 256731 255335 265676 276228 518931 539786 655951 683609 697507 728562 814087 954328 1088744 1194454 1225692 1258084
10 10 10 10 10 10 15 15 17 17 17

273
Data for figure 26 : Proportion of females by level of education
1963 1964 1965 1966 1967 1968 1969 1970 1971 1972 1973 1974 1975 1976 1977 1978 1979 1980 1981 1982 1983 1984 1985 1986 1987 1988 1989 1990
Primary 35 36 37 37 37 38 39 39 40 41 42 42 41 42 42 43 48 41 43 44 44 45 45 44 45 44
O Level 24 35 23 22 23 24 26 28 30 28 29 30 31 34 34 33 33 35 33 33 34 38
A level 22 20 21 21 18 20 20 20 20 23 21 22 22 22 24 33 28 33 34 36 28
1991 1992 1993 1994 1995 1996 1997 1998 1999 2000 2001 2002 2003 2004 2005 2006 2007 2008 2009 2010
45 44 45 46 45 46 47 47 47 48 49 49 49 49 50 50 50 50 50 50
38 38 40 39 39 41 41 41 42 45 45 46 46 46 46 46 46 46 47 47
38 28 28 29 30 32 34 35 38 39 38 40 41 41 41 41 42 42 41 42
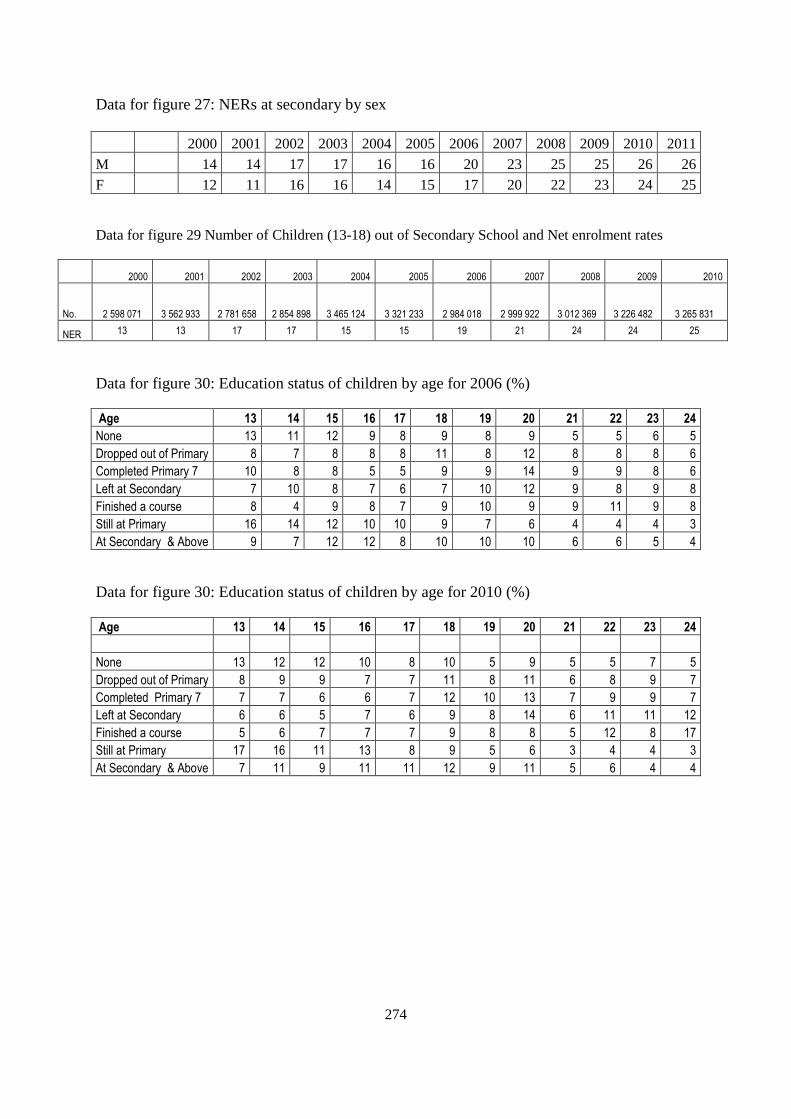
274
Data for figure 27: NERs at secondary by sex
Data for figure 29 Number of Children (13-18) out of Secondary School and Net enrolment rates
2000 2001 2002 2003 2004 2005 2006 2007 2008 2009 2010
No.
2 598 071
3 562 933
2 781 658
2 854 898
3 465 124
3 321 233
2 984 018
2 999 922
3 012 369
3 226 482
3 265 831
NER 13 13 17 17 15 15 19 21 24 24 25
Data for figure 30: Education status of children by age for 2006 (%)
Age 13 14 15 16 17 18 19 20 21 22 23 24
None 13 11 12 9 8 9 8 9 5 5 6 5
Dropped out of Primary 8 7 8 8 8 11 8 12 8 8 8 6
Completed Primary 7 10 8 8 5 5 9 9 14 9 9 8 6
Left at Secondary 7 10 8 7 6 7 10 12 9 8 9 8
Finished a course 8 4 9 8 7 9 10 9 9 11 9 8
Still at Primary 16 14 12 10 10 9 7 6 4 4 4 3
At Secondary & Above 9 7 12 12 8 10 10 10 6 6 5 4
Data for figure 30: Education status of children by age for 2010 (%)
Age 13 14 15 16 17 18 19 20 21 22 23 24
None 13 12 12 10 8 10 5 9 5 5 7 5
Dropped out of Primary 8 9 9 7 7 11 8 11 6 8 9 7
Completed Primary 7 7 7 6 6 7 12 10 13 7 9 9 7
Left at Secondary 6 6 5 7 6 9 8 14 6 11 11 12
Finished a course 5 6 7 7 7 9 8 8 5 12 8 17
Still at Primary 17 16 11 13 8 9 5 6 3 4 4 3
At Secondary & Above 7 11 9 11 11 12 9 11 5 6 4 4
2000 2001 2002 2003 2004 2005 2006 2007 2008 2009 2010 2011
M 14 14 17 17 16 16 20 23 25 25 26 26
F 12 11 16 16 14 15 17 20 22 23 24 25
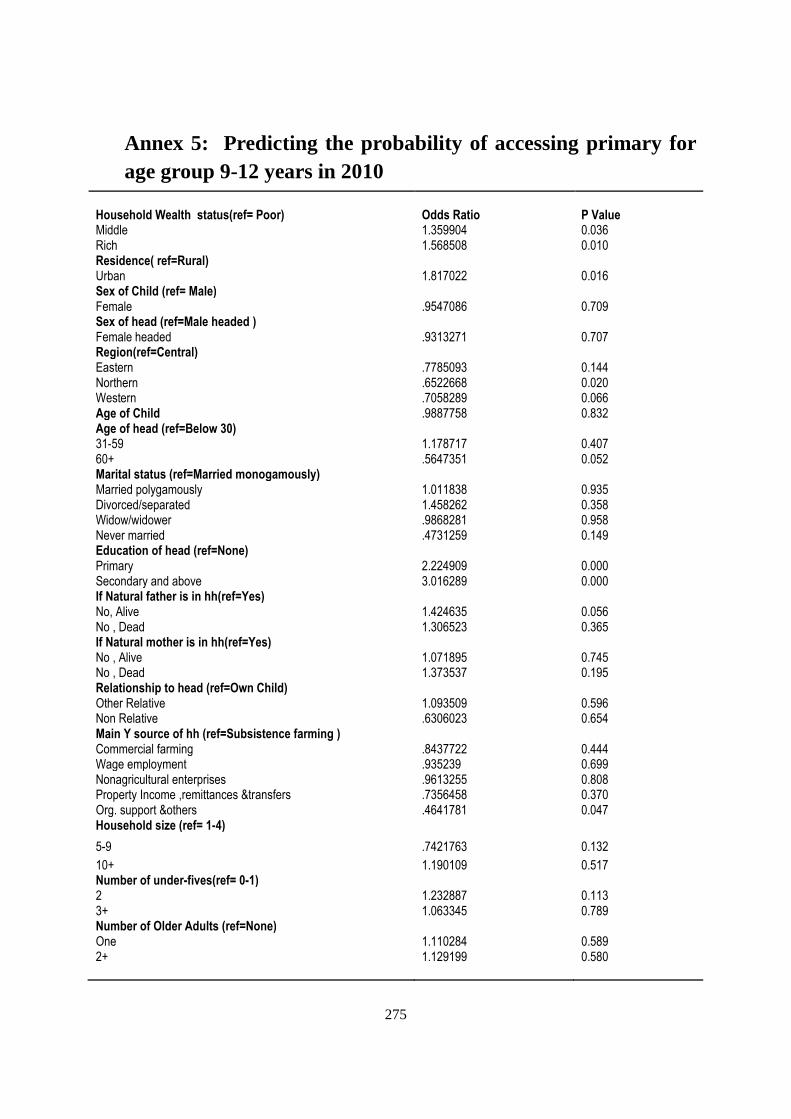
275
Annex 5: Predicting the probability of accessing primary for age group 9-12 years in 2010
Household Wealth status(ref= Poor) Odds Ratio P Value Middle 1.359904 0.036 Rich 1.568508 0.010 Residence( ref=Rural) Urban 1.817022 0.016 Sex of Child (ref= Male) Female .9547086 0.709 Sex of head (ref=Male headed ) Female headed .9313271 0.707 Region(ref=Central) Eastern .7785093 0.144 Northern .6522668 0.020 Western .7058289 0.066 Age of Child .9887758 0.832 Age of head (ref=Below 30) 31-59 1.178717 0.407 60+ .5647351 0.052 Marital status (ref=Married monogamously) Married polygamously 1.011838 0.935 Divorced/separated 1.458262 0.358 Widow/widower .9868281 0.958 Never married .4731259 0.149 Education of head (ref=None) Primary 2.224909 0.000 Secondary and above 3.016289 0.000 If Natural father is in hh(ref=Yes) No, Alive 1.424635 0.056 No , Dead 1.306523 0.365 If Natural mother is in hh(ref=Yes) No , Alive 1.071895 0.745 No , Dead 1.373537 0.195 Relationship to head (ref=Own Child) Other Relative 1.093509 0.596 Non Relative .6306023 0.654 Main Y source of hh (ref=Subsistence farming ) Commercial farming .8437722 0.444 Wage employment .935239 0.699 Nonagricultural enterprises .9613255 0.808 Property Income ,remittances &transfers .7356458 0.370 Org. support &others .4641781 0.047 Household size (ref= 1-4)
5-9 .7421763 0.132
10+ 1.190109 0.517 Number of under-fives(ref= 0-1) 2 1.232887 0.113 3+ 1.063345 0.789 Number of Older Adults (ref=None) One 1.110284 0.589 2+ 1.129199 0.580