central bank policies and the behavior of the money market
75
CENTRAL BANK POLICIES AND THE BEHAVIOR OF THE MONEY MARKET: THE CASE OF THE PHILIPPINES Josef T. Yap, Mario B. Lamberte, Teodoro S. Untalan and Ma. Socorro V. Zingapan WORKING PAPER SERIES NO. 90-24 November 1990 Philippine Institute for Development Studies
-
Upload
khangminh22 -
Category
Documents
-
view
0 -
download
0
Transcript of central bank policies and the behavior of the money market

CENTRAL BANK POLICIES AND THE BEHAVIOR OF THE MONEY MARKET:
THE CASE OF THE PHILIPPINES
Josef T. Yap, Mario B. Lamberte, Teodoro S. Untalan and
Ma. Socorro V. Zingapan
WORKING PAPER SERIES NO. 90-24
November 1990
Philippine Institute for Development Studies

TABLE OF CONTENTS
I. Introduction and Overview 1
II. The Philippine Financial System 3 A. History and Current Developments 3 B. Policy Framework, 1956 - Present 8
1. Introduction 8 2. Period of Rigid Financial Repression: 1956- 1973 13 3. Period of Repression in the Money Markets: 1974 - 1980 15 4. Period of Liberalization: 1981 - Present 16
III. Money Market in the Philippines 17 A. The Philippine Money Market:Its Development 17 B. A Survey of the Philippine Money Market 18
1. Interbank Call Loans , 20 2. Deposit Substitutes 23 3. Deposit and Deposit Substitutes 26 4. Commercial Paper 26 5. Government Securities 34
C. The Foreign Exchange Market 35 D. Key Events 41
IV. Effect of Policy on Performance of the Money Market 43 A. Performance Measures 43 B. Data Analysis 44
1. The Effect of Policy 44 2. Analysis of Key Events 59
C. Some Broad Conclusions 62
Bibliography 63 Appendix 1 65
2 66 3 67

LIST OF TABLES
1. Assets of the Financial System 5 2. Distribution of Assets of the Financial System 6 3. Assets of the Commercial Banking System 7 4. Share of Top Three Conglomerations in Total Money Market
Balances of Banks and NBQBs as of Year-end 1988 9 5. Financial Development Indicators (1956-'88) 11 6. M2/GNP in Selected Asian Countries 12 7. Volume of Money Market Transactions, 1975-1988 19 8. Volume of Interbank Call Loan Transactions by Type of Borrrower 21 9. Volume of Interbank Call Loan Transactions by Type of Investor 21 10. Volume of Money Market Transactions by Type of Instruments 22 11. Volume of Deposit Substitute Transactions by Type of Borrower 24 12. Volume of Deposit Substitute Transcations by Type of Investor 25 13. Level of Outstanding Deposits and Deposit Substitutes of
Commercial Banks and Quasi-Banks 27 14. Volume of Commercial Paper Transactions by Type of Borrower 29 15. Volume of Commercial Paper Transactions by Type of Investors 29 16. Volunie of Money Market Transactions by Instrument 30 17. Total Commercial Paper Issuances by Registered Issuers 32 18. Volume of Money Market Transactions by Instrument 33 19. Volume of Government Security Transactions by Type of Investor 36 20. Volume of Government Security Transactions by Type of Borrower 37 21. Volume of Treasury Bill Transactions by Type of Investor 37 22. Volume of DBP Bonds and other Government
Security Transactions by Type of Investor 38 23. Volume of CBCI Transactions by Type of Investor 39 24. Outstanding Volume of Forward Exchange Contracts
by Commercial Banks 42 25. Spread and Range Average Before 1981 45
LIST OF FIGURES
1. The Philippine Financial System 4 2. 91-Day T-Bill Rate Range Average 46 3. Range Average, 1982 - '88 47 4. Spread Average, 1982 - '88 52
CENTRAL BANK POLICIES AND THE BEHAVIOR OF THE MONEY MARKET:
THE CASE OF THE PHILIPPINES*
Josef T. Yap, Mario B. Lamberte, Teodoro S. Untalan and Ma. Socorro V. Zingapan**
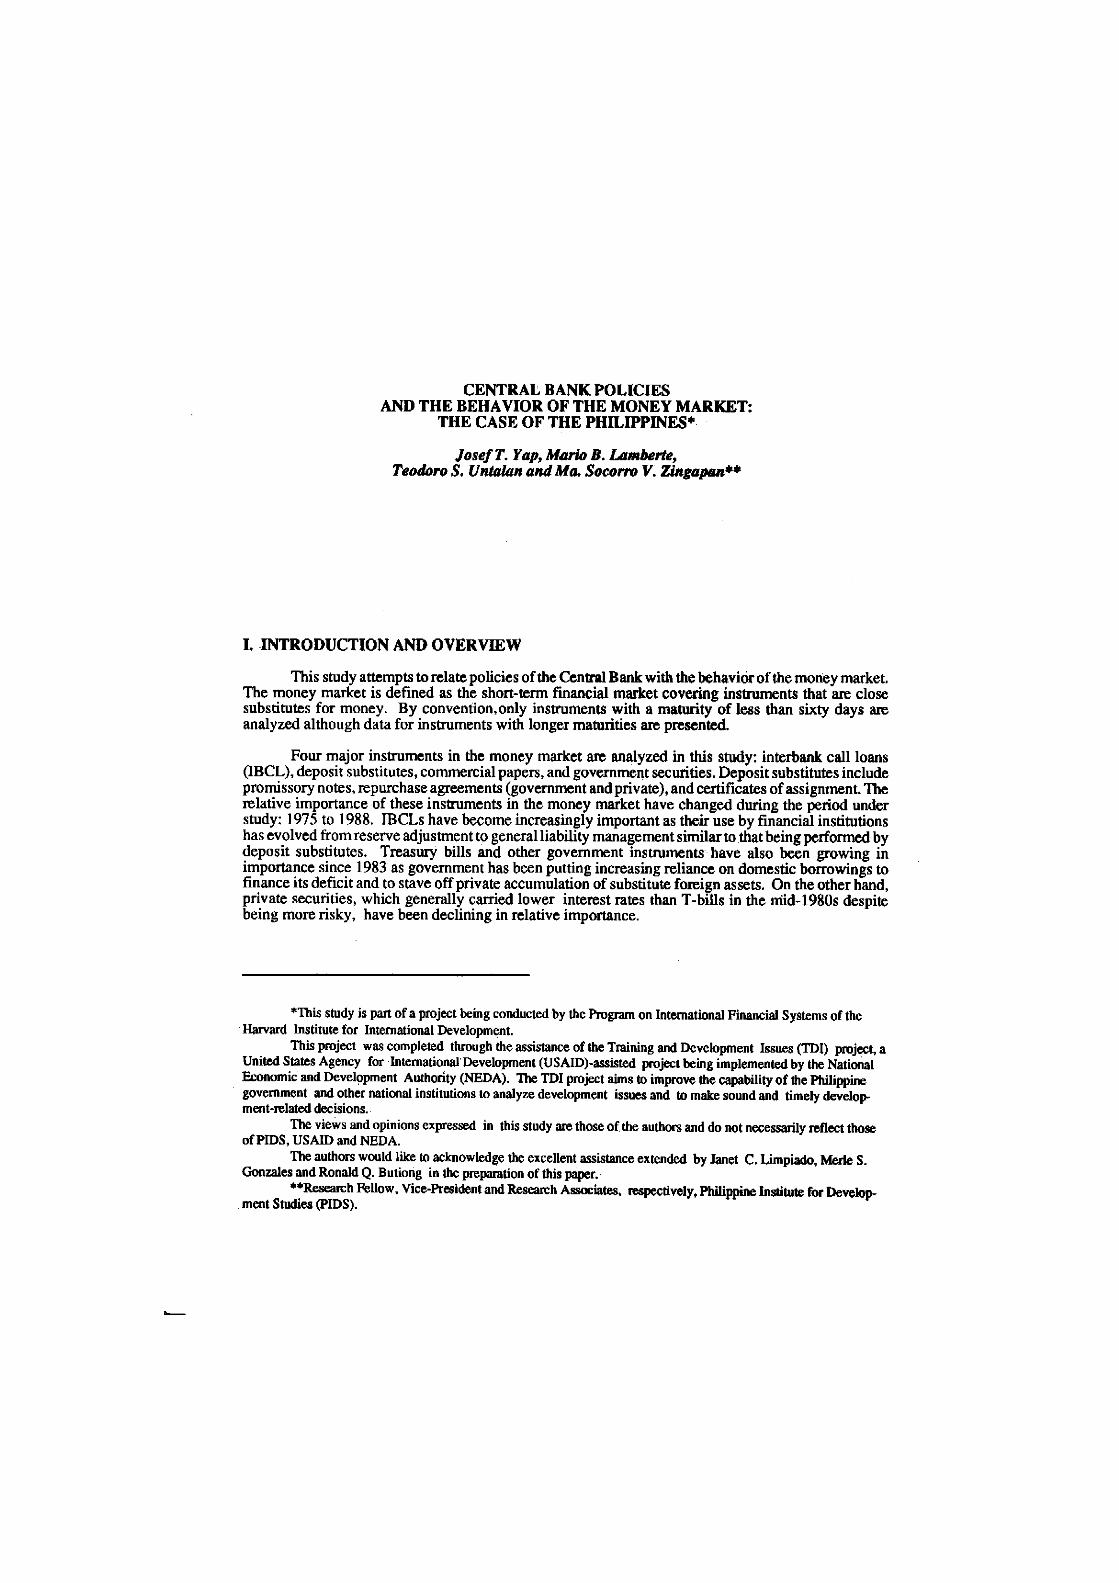
L INTRODUCTION AND OVERVIEW
This study attempts to relate policies of the Central Bank with the behavior of the money market. The money market is defined as the short-term financial market covering instruments that are close substitutes for money. By convention, only instruments with a maturity of less than sixty days are analyzed although data for instruments with longer maturities are presented.
Four major instruments in the money market are analyzed in this study: interbank call loans (IBCL), deposit substitutes, commercial papers, and government securities. Deposit substitutes include promissory notes, repurchase agreements (government and private), and certificates of assignment. The relative importance of these instruments in the money market have changed during the period under study: 1975 to 1988. IBCLs have become increasingly important as their use by financial institutions has evolved from reserve adjustment to general liability management similar to that being performed by deposit substitutes. Treasury bills and other government instruments have also been growing in importance since 1983 as government has been putting increasing reliance on domestic borrowings to finance its deficit and to stave off private accumulation of substitute foreign assets. On the other hand, private securities, which generally carried lower interest rates than T-bills in the mid-1980s despite being more risky, have been declining in relative importance.
*This study is part of a project being conducted by the Program on International Financial Systems of the Harvard Institute for International Development.
This project was completed through the assistance of the Training and Development Issues (TDI) project, a United States Agency for International Development (USAID)-assisted project being implemented by the National Economic and Development Authority (NEDA). The TDI project aims to improve the capability of the Philippine government and other national institutions to analyze development issues and to make sound and timely develop-ment-related decisions.
The views and opinions expressed in this study are those of the authors and do not necessarily reflect those of PIDS, USAID and NEDA.
The authors would like to acknowledge the excellent assistance extended by Janet C. Limpiado, Merle S. Gonzales and Ronald Q. Butiong in the preparation of this paper.
••Research Fellow, Vice-President and Research Associates, respectively, Philippine Institute for Develop-ment Studies (PIDS).

2
The government is involved in the money market as a regulatory authority and, since 1983, as a major borrower. Government through the Central Bank started to heavily regulate the market in 1974. Regulation took several forms: putting a cap on interest rates of IBCLs and deposit substitutes, imposition of a transactions tax, prescription of minimum placement, and placing under its regulatory purview the non-bank investment institutions. By all these, the government aimed to instill discipline in the market, which was left unregulated since its inception in the mid-1960s, and to mitigate the flow of surplus funds in short-term assets which was considered detrimental to the performance of the real sector. The period of heavy regulation lasted up to 1981, at which time liberalization policies were introduced.
Liberalization, which continued up to now, features a mix of free market and administered market policies. Free market policies are being implemented by the lifting of all interest rate ceilings, the reduction in minimum placements, and the promotion of universal banking. Administered policies are demonstrated via the imposition of higher reserve requirements and other forms of taxation. Meanwhile, government's involvement as a major borrower in the market also started after 1981 due to the growing instability of its balance-of-payments position. Detailed discussions of these policies affecting the money market as well as the market's development are tackled in Chapter 3.
Chapter 4 analyzes the effect of the abovementioned policy changes on the performance of the money market, with focus on the efficiency and stability of the market. Initially, regression analysis of money market variables against the suggested typology of Central Bank policies was performed.1 But this yielded unsatisfactory results. Thus the paper resorted to the qualitative analysis of three measures of operating efficiency: (1) the spread between the price of the funds in the market under study and the reference rate, (2) the liquidity of the market or the range of prices in the market, and (3) concentration of financial institutions in the market. The last two are indirect measures of efficiency, while (2) was also used as an indicator of stability. The reference rate used for (1), the 91-day Treasury-bill rate was identified through the unit root test.2 This test, which was also applied to other alternative rates, was used to determine whether the behavior of a particular market follows a random walk.
Based on the observation of the abovementioned performance measures, it can be generally concluded that regulations prior to 1981 produced a less efficient but more stable market. During the liberalization period, the behavior of the money markets was significantly affected by the Dewey Dee crisis in 1981 and the balance-of-payments (BOP) crisis in 1983 which led to the 1984-1985 recession. Since data on the money market for 1981 were not provided by the Central Bank, the assessment of key events focuses only on the effect of the BOP crisis. The Central Bank's main policy instruments during the crisis were the controversial "Jobo" bills which carried artificially high interest rates to arrest capital outflows. Stability in the monetary system was achieved but at the expense of operating efficiency. Transactions in the money market instruments, excluding Treasury bills and interbank call loans, declined rapidly during the period 1983-'85 and have since not recovered. 'Hiis paper, thus, clearly points out the trade-off between operating efficiency, on one hand, and stability, on the other.
'Harvard Program on International Financial Systems, Methodology Paper for Re gonal Research Project: Guidelines for Study of Money Markets in Asia. Harvard Institute for International Development, May 1988.
2The unit root test followed Dickey and Fuller (1981).

3
II. THE PHILIPPINE FINANCIAL SYSTEM
A. History and Current Developments The Philippine financial system has grown rapidly in size and variety, albeit at uneven rates,
since the establishment of the Central Bank in 1949. Prior to 1949, the system consisted of only seven commercial banks, three savings banks, a government-owned agricultural bank, seven branches of foreign banks, and a small stock exchange. The banking sector has since then evolved into a sophisticated system while various non-bank financial institutions (NBFIs) such as financing companies and investment houses have appeared. (Figure 1 presents the existing structure of the financial system and the number of financial agencies as of 1988. Tables 1 and 2 show the total resources of the institutions and their relative importance from 1970 to 1988).
The banking sector consists of commercial banks (KBs), thrift banks, rural banks, and specialized government banks. Most of the banking offices are concentrated in the National Capital Region (Metro Manila) as bank density ratio in this area (9.9) is much higher than the next region of importance (2.3).3 As of yearend 1988, the sector had total assets of P360 billion representing a 63 percent real growth over its resources in 1970.
Commercial Banks (KBs) form the dominant group in the financial system consistently accounting for over 50 percent of its gross assets over the years. At present, the group is comprised of 29 banks of which nine have expanded commercial banking functions, including the government-owned Philippine National Bank (PNB).4 Four of these are branches of foreign banks (Citibank N.A., Bank of America, Hongkong and Shanghai Banking Corp., and Standard Chartered Bank). PNB is the biggest among the banks, with total assets of P38.8 billion as of 1988, or three times larger than the average-sized KB. It should be noted that PNB, along with the Development Bank of the Philippines, underwent massive rehabilitation in 1986. The program called for the transfer of PNB's liabilities amounting to P53 billion to the national government and its non-performing assets to the Assets Privatization Trust. The effect of this on the commercial banking structure was clearly seen starting 1986 when PNB's historical share in KB resources of over 25 percent dipped to only 14 percent in 1986 and 12 percent in 1988 (Table 3). Apart from PNB, the next five largest banks (Bank of the Philippine Islands, Far East Bank, Metrobank, Citibank, and Philippine Commercial and Industrial Bank) chalked up 40 percent of total assets of the KBs in 1988. Compared to commercial banks in other countries, however, Philippine banks are among the smallest. As of 1986, PNB merely ranked 82nd and BPI 99th among the largest KBs in Asia.5 Nevertheless, the stickiness of nominal interest rates for deposits, and the CB disincentive for entry into the sector since 1972 have led to speculations that the KB structure is essentially oligopolistic. Tan points out that indices of concentration for the commercial banks, excluding PNB, rose rather fast from 1982 to 1988.6 The Herfindahl or H index of .045 (which means 22.2 equally-sized banks comprising the industry) in 1982 increased by 64 percent to .074 in 1988.7
3Bank density ratio: ratio of banking offices to total cities and municipalities as of December 31,1988. 4Expanded commercial banks (also called "universal" banks) are allowed to offer a host of banking and non-
banking services (e.g., investment or merchant banking) and to own voting shares in allied and non-allied enterprises. Allied undertakings include other commercial banks (up to 30 percent of total voting shares) and investment institu-tions (up to 100 percent). Non-allied undertakings include insurance agencies (up to 35 percent).
'World Bank, Philippine Financial Sector Study, 1988. 6Edita A. Tan, "Bank Concentration and the Structure of Interest," Discussion Paper 89-15 . University of
the Philipines School of Economics, October 1989. 7HI is derived by squaring and summing the market shares of the banks in the KB sector.

4
CO bS 7, • < TO
H fa-o H in 1 ce _> CO
z o X H H H
2 C/l
- 5 5 % — « .5 o .2 S 3 -S S " ' a 1 : a eb g S.
* 0 ** tt 1 0 o z
3s
> 3 £ £ a H o u
S.S 03 04 > § 56
a -
9 S P •a e
3 -l g u .2 fl 4)
a g" .s a C a IX u
a d •o I £ a
o •s Z s £ £l O US u
s » S a -
_ m fio aj k a 3 a te CD '— '
e
i- -M to £ 01 "
_ Q rfn, H fl K oj >- • < S > M
X S ^ « w o ^ « (_), ,CQ
•s
V,*
a o -c £ s [ 9 5 S
£ s» „„ V ° V
• 9 8? as it 111" s -a 8 •5 & S a -
- IH
si o p, d
s g
I S " ' •i S „ h i
it C 5° «
a £ 3-S-S ^ 4) « « fl 5 ..
l l t l S J

5
Table A3.1 (continuation) ASSETS OF T h t FINANCIAL SYSTEM
AS OF DECEMBER 31,1970, 1975,1980-1988 (billion pesos)
1970 1975 1980 1981 1982 1983 1984 1985 1986 1987 1988
Central Bank 6.0 26,0 65.4 71.6 91.7 130.4 206.0 251.6 313.9 325.2 349.9
Banking System 18.8 69.9 193.3 226.6 276.9 330.8 408.1 394.3 289.0 313.2 360.1
Commercial banks 14.1 53.2 144.1 168.9 205.3 248.2 303.5 285.7 236.5 259.8 299.3 Private 8.3 35.1 84.0 100.5 118.0 134.7 167.2 165.7 164.4 179.4 224.6 Government 4.6 18.1 41.4 47.6 60.7 73.1 89.5 76.1 35.0 31.3 38.8 Foreign 1.2 - 18.7 20.8 26.6 40.4 46:8 43.9 37.1 49.1 35.9
Thrift banks 0.9 2.1 10.6 9.7 12.6 16.1 15.0 15.1 17.6 19.5 24.9 Savings and mortgage banks 0.7 1.4 7.4 5.0 5.9 7.4 7.6 6.8 8.1 10.6 14.2 Private development banks 0.2 0.4 1.6 2.6 3.7 4.6 4.6 5.1 5.6 5.4 6.7 Stocks savings and loan associations - 0.3 1.6 2.1 3.0 4.1 2.8 3.2 3.9 3.5 4.0
Rural banks 0.7 2.8 5.5 6.5 8.0 9.3 8.8 8.6 9.1 9.7 10.7 Specialized government banks 3.1 11.8 33.1 41.5 51.0 57.2 80.8 84.9 25.8 /b 24.2 /b 25.2
Nonbank financial intermediaries 6.1 26.8 60.3 62.0 73.6 91.3 97.7 105.6 111.8 119.2 132.8
Insurance companies 5.9 11.9 29.5 33.3 40.7 44.6 50.0 60.8 70.8 79.2 90.9 Government /a 4.0 7.7 19.5 22.0 27.0 30.9 35.9 42.7 50.5 S3.8 61.2 Private 1.9 4.2 10.0 11.3 13.7 13.7 14.1 18.1 20.3 25.4 29.7
Investment institutions 0.0 10.3 25.5 23.5 25.6 28.9 27.3 23.8 23.3 20.8 21.4 Financing companies 3.5 11.9 12.1 12.9 11.8 9.6 6.2 5.6 7.0 7.4 Investment companies 2.0 5.0 5.5 5.9 9.9 10.2 11.0 10.2 4.8 5.6 Investment houses 4.8 8.6 5.9 6.8 7.2 7.5 6.6 7.5 9.0 8.4
Trust operations (Fund managers) 2.6 1.7 0.8 1.1 1.5 1.9 1.6 1.3 1.6 1.8 Other financial intermediaries 0.2 2.0 3.6 4.4 6.2 16.3 18.5 19.4 16.4 17.6 18.7
Total 30.9 122.7 319.0 360.2 442.2 552.5 711.8 751.5 714.7 757.6 842.8 Percent of GNP 75.7 107.3 120.6 118.6 131.8 14S.9 135.0 125.7 116.3 107.7 102.4
Total w/o CB 24.9 96.7 253.6 288.6 350.5 422.1 505.8 499.9 400.8 432.4 492.9 Percent of GNP 61.0 84.5 95.9 95.1 104.5 111.5 95.9 83.6 65.2 63.0 60.8
Memo ilem: GNP 40.8 114.4 264.5 303.6 335.4 378.7 527.4 597.7 614.7 703.4 822.7
/a GSIS and SSS. /b After transfer of certain assets and liabilities to the government. Sources: World Bank Report (1988) for data on insurance companies from 1970-1986.
Philippine Financial Fact Book (1988). Insurance Commission (for data on insurance companies in 1987 and 1988. Government Corporate Monitoring and Coordinating Committee for assets of SSS and GSIS in 1988.

§
N JO £
m s LU O Ul o u-O « <
O m DC K CO Q
z a < £E H Z UJ o (3 Z _i o> O T o
00 p> 2 " LU m & W ® > ^ l/> o" S> _i a < 2 I o 8 <™ s. z II _
T- IS (O 0) ()) f> O) ^ CO ^ o> ^ 0( O P) W ^ N ^ <p 9 to 6 in s n inw^d oi to <o e w u i ^ ^ ' - ' - o n o S ID V W £
to ! co | 0> I
Si i <5 : CD
< 8
^ T- IO M ^ lf> in <M CO CM (D <D Pi 8 " ^ N Tt t\l »- O CVI ID
O OMO fi! o 1- f c 0> If) -<t
i o o •"T (\i ^
e CO CO ID Kcjiniri-^W'-O'
(M i -
o o CO to
IO IO AO IA M * S O) N CO ' g iti N m r d d oj • JS 8 S S 1
CM (O ^ C) ^ CM O <0 ID CM ._• • ^ <M **
tf) (D (0 lO A) U> (0 Q) tf) (D cj (0 ^ (•) N d "i rt CO ^ lA S T" CM oi ^ ri U) N •r— CM CM T-
o
8
o 8
<J> CM ^ CM CO o O <p h> O ^ CMlOtfJCOCMCMPOCOO) o CO m Ift CO W T-' o WK CMODCO CMOCO O s lorir i- CM 2
r*. o i-** co o m O) (£) s o c) o • 4 u ^ " -• T ' A " Mk Jh h.' Al IA Al A rrt J ril^O) co ^ o © to o> oiNeimT-Ni-on o to -- *- *- o
^ 00 0> CO <0 00 00 O CM tp tp <pcocvi«ooq«i>'*o> o (D 00 T N (J) f) r- r- f" CM CO o'r^towtvioi-^ow o Is 55 CO i- CM -e- O
o to r- co to <pKi-o) to <0 o o gcot-^r^ eo »- ei e\i j T-fscji^co'i-i-O'- g
m m<ooii-cMa>pnin ^ s r i t o ^ ' - N d ' -<M
u> to co to n t\i o o cm to to r s n o ^ N t i o r m rt i- — —
o
8
o o o
co OMI"- ' cm fl- to o>cm n o n N O - ^ q S ' ; cm iri to tri N^ 'oo csi f j r ojeb-^otocjiftiMOJ in n i- cm T~
oo o
o
8
•c ra 13 a E
"S 5 i 3
2 S * Q. «! E S i i E o o o O -
o <5
W £ e E & £ '3 5 - | £ '»
t s 5 £ £ S. « o 5 £ S
i m m s
m o
! I m o
5 £ £ s I
a w
</) O
1 i « £ w te 55 i CD < 5 €

7
S >
n CO
2 H A -iE « Sen H gS
o (0 in <
o J® « 3
fc o- •
i # i
| g j I jg ! i s
s i oi =
E E 53
i f s i !
aSISKJJSSSS r>rtcoc>ioic»<b<bio 8 $ 8 8 3 S
ggggaSjggR 3 283®!
5 ^
to c\» § $ <o $ o 10 fS eg <s}£xi<£q>a>c\)Qj^A
fesiassass!»s
ISfc8Si838£Ri33SSi33iSS
si si ct o s <b ^ ~ © g
38
So S S ,iO ^ <t> ^ g
1 ^ i l l i l i i i I s s s s s i g e a s e s s f i s s s g s m g
SJ <o « « «si « w p> OJ
S 8'
O 8 5 R R( s u) ^ 6 at r- o
to ® « < m u m 1 iiiiigglSiiiSHll III
S F: SSSSsSSISjSIRI 2 3 8 g^f^wnrinnw Jj
3 K KfcgSSSSsSS S 3
a
i l s s f ^ i ^ i i i - a
!iJ I 1*
i l l ! i i l l 1
l££<
I is s
i > I
II
o •— <>!•-•-•-«> d o — riN»Aiiti ^ M H t i o c ;
ggSSllg&sfcKsasRs s s a s s s s s
"a a
i i l i •s-s?" s i r 5 3 l 1

8
Even as the banking system dominated the financial system from the start, other non-bank financial intermediaries (NBFIs) have appeared. The largest of these are the insurance companies which are in turn dominated by the two government-owned insurance systems, the Social Security System (SSS) and the Government Service Insurance System (GSIS). The former is the largest financial institution in the country, with its assets accounting for about nine percent of the gross assets of the financial system as of 1988. However, the insurance sector has declined in importance in the past two decades. Its share in the total financial system's assets of 23.7 percent in 1970 dropped to 11.7 percent in 1980 and reached only 18.4 percent in 1988.
Investment institutions such as investment companies, investment houses, and financing companies as well as trust operations (fund managers) were formed in the mid-1960s through the 1970s. However, their importance in the 1980s declined as a result primarily of the Dewey Dee crisis in 1981 which triggered the loss of confidence in short-term funds markets and, in the process, precipitated the downfall of several finance companies and investment houses, including the two largest investment houses in the country (Atrium Capital Corporation and Bancom). The number of investment institutions licensed to engage in quasi-banking functions (i.e., issue deposit substitutes) were trimmed down from 26 in 1980 to 13 as of yearend 1989. As of 1988, investment institutions also accounted for merely 4.3 percent of the total assets of the financial system, as against their share of 10.7 percent in 1975. Similarly, smaller NBFIs such as pawnshops, lending investors, venture capital corporations, and non-bank thrift institutions did not sustain their phenomenal 1983 growth and now remain relatively unimportant.
An important characteristic of the Philippine financial system is the prevalence of interlocking directorates, i.e., the simultaneous holding of a position in the Board of Directors of several financial as well as non-financial institutions. This is a feature that is implicitly encouraged by the universal banking law (universal banks are permitted to make equity investments in allied and non-allied financial institutions; see footnote 4). The policy's purpose is ostensibly to reduce the fragmentation of financial intermediaries and to increase competitive conditions and economies of scale to produce greater efficiency within the financial system. In the money markets, however, such interlocking with investment institutions increases the relative importance of certain banks and consequentiy make these (money markets) less diversified. As of yearend 1988, for example, four commercial banks (Metrobank, Citytrust, Citibank, and BPI) directly accounted for only 13.32 percent of the total deposit substitutes of all financial institutions with quasi-banking licenses (Table 4). However, their affiliates' total share of 34.73 percent clearly underscore the effect of interlocking directorates on the concentration of these markets.
B. Policy Framework, 1956-Present
Introduction. Regulation of financial institutions (FIs), except insurance companies supervised by the Philippine Insurance Commission, is vested upon the Central Bank. While policies are set by the Monetary Board via circulars and memoranda, the Supervision and Examination Sector of the Central Bank acts as the operational arm for supervision purposes.
The Monetary Board is composed of the Central Bank Governor as chairman; five representa-tives of the national government (the Secretaries of the Departments of Finance, and Budget and Management; the chairman of the Board of Investments who is concurrently Secretary of the Department of Trade and Industry; and the Director-General of the National Economic and Develop-ment Authority), and two representatives of the private sector who are appointed by the President. The preponderance of national government representatives in the Board has been rationalized by the need

Table A3.2 (continuation) S H A R E O F T O P T H R E E C O N G L O M E R A T I O N S IN TOTAL M O N E Y M A R K E T
BALANCES O F BANKS AND NBQBs AS O F Y E A R - E N D 1988
% Share Conglomeration - - -
Deposit Trading Account Substitutes a/ Securities b/
1. Metrobankc/ 0.01 11.09 First Metro Investment Corp. d/ 29.29 3.83
Sub-Total 29.30 14.92
2. Citytrust c/ 0.03 1.68 Citibank 9.97 4 .62 Citytrust Investment Phil., Inc. d/ 0.36 0,05 Citytrust Finance Corp, e/ 0.58 0.00
Sub-Total 10,94 6.35
3. Bank of the Philippine Islands a/ 3.31 6.09 AEA Development Corp. d/ 1.04 0.34 BPI Credit Corp. e/ 2 .57 0 .17 BPI Family Savings f/ • 0.89
Sub-Total 6.92 7.49
a/ Deposit substitutes are borrowings from the money markets in the form of promissory notes, certificates of participation/ assignments, and repurchase agreements
b/ Trading account securities include government and private securities and commercial papers purchased for money market trading.
d Universal banks.
d/ Investment houses.
e/ Finance companies.
f/ Thrift bank.
Source of basic data: Published financial statements. Philippine Financial Fact Book (1988).

10
for effective coordination between the economic, financial, and fiscal policies of the government and the monetary, credit, and exchange policies of the Central Bank.8 Thus, all Central Bank policies are, in essence, formulated in consultation with the heads of economic agencies.
CB regulations of FIs include: (1) asset creation (e.g., single borrower's limit, lending for agricultural and agrarian reform, directors, officers and related interests accounts (DOSRI), etc.); (2) liability creation (e.g., type of deposits, borrowings from CB, etc.); and (3) equity (e.g., minimum equity).
The crises that struck the financial system, especially those that originated from the money markets in 1981, demonstrated the generally slow reaction of the CB to practices that tended to subvert its rules and regulations. Lamberte cites that CB's measures on money market transactions such as the prohibition against the attachment of postdated checks to "without recourse" transactions came in too late when the money market already collapsed.9
In addition to the CB, the Securities and Exchange Commission (SEC) acts as the principal supervisory body for the securities market. Its Money Market Operations Department oversees the registration of short- and long-term commercial papers, financing companies, and investment houses. Although SEC regulations are aimed at "investors protection," SEC does not pass judgment on the worthiness of the securities or the issuing companies. "Investors protection" are promoted mainly by requiring the issuers to submit a prescribed set of information to be disseminated to prospective investors.
Note that the Central Bank and the SEC coordinate with respect to both formulation and implementation of policies affecting commercial papers. For instance, the rules of registration on commercial papers were approved first by the Monetary Board chairman before they were promulgated by the SEC. Also, all applications for a certificate of authority to operate a branch, an extension office or agency with quasi-banking functions are filed with the SEC, which refer these to the CB's Department of Financial Intermediaries for comments and recommendation. CB's recommendations are generally based on the applicant's compliance with its laws, rules, and regulations such as capital adequacy and solvency, profitability and liquidity position.
Information on the credit worthiness of borrowers in the financial markets are provided by the Credit Information Bureau, Inc. (CIBI). CIBI was set up by the Central Bank after the 1981 crisis to coordinate information on all issuers of commercial papers. As of 1988, it has collected data, (such as outstanding loans) on some 25,000 companies and 6,000 individuals, most of which are used by commercial banks.
Despite the sophistication that characterizes the Philippine financial system, it remains as one of the least developed vis-a-vis its neighboring Asian economies. The highest ratio of M2to GDP of 27.5 percent recorded in 1967 has never been duplicated nor approached even during the advent of financial liberalization starting in 1981 (Table 5). The same ratio was merely 22 percent in 1987, in contrast with
8The Central Bank is also referred to as a "quasi-fiscal agent," i.e., it is primarily responsible for the market-ing and stabilization of government securities and acts as the financial advisor of the government. The government through the Secretary of Finance, must request for the Monetary Board's opinion before borrowing from domestic and international markets.
9Mario B. Lamberte, "Assessment of the Problems of the Financial System: The Philippine Case," PIDS Working Paper Series No. 89-J8, August 1989.

Table A3.2 (continuation) FINANCIAL DEVELOPMENT INDICATORS, 1956-1988
(%)
Nominal Interest Rates
M2 M3
GNP a/ GNP b/
Savings Deposits
Time Deposits
Secured Loans
(61-90 days)
91-day T-Bills
Deposit Substitutes
1. Period of managed interest rates of traditionalo assets with de facto * ' " ig in money markets: 1956-1973
1956 1957 1958 1959 1960 1961 1962 1963 1964 1965 1966 1967 1968 1969 1970 1971 1972 1973
Average
19.4 19.4 20.4 20.5 20.4 23.5 25.1 26.0 24.1 23.4 24.8 27.5 25.7 26 .2 23.0 21. 21. 19.4 22.8
.2
.2
1974 16.8 1975 16.8 1976 18.6 1977 21.2 1978 22.8 1979 20.8 1980 21.0
Average 19.7 3. Liberalization period
1981 1982 1983 1984 1985 1986 1987 1988
Average
21. 23.5 25.3 20.8 20 .8 22.2
22.1 23.0 22.4
19.4 2.0 2.5 12.0 19.4 3.0 3.5 12.0 20.4 3.0 3.5 12.0 20.5 3.0 3.5 12.0 20.4 3.0 4.0 12.0 23.5 3.0 4.0 12.0 25.1 3.0 4.0 12.0 26.0 3.5 4.5 12.0 24.1 4.0 5.0 12.0 23.4 5.8 6.5 12.0 24.8 5.8 6.5 12.0 6.5 c/ 27.5 5.8 6.0 12.0 6.4 c/ 25.7 5.8 6.0 12.0 6.7 c/ 26.2 6.0 7.0 12.0 8.1 d 23.0 6.0 7.0 12.0 13.1 21.2 6.0 7.0 12.0 11.9 13.30 21.2 6.0 7.0 12.0 11.9 13.90 25.0 6.0 7.0 12.0 9.4 9.40 23.2
9.40
iged interest rates in all markets 24.3 6.0 9.5 12.0 10.0 31.8 25.2 6.0 9.5 12.0 10.3 13.8 d/ 26.8 7.0 10.0 12.0 10.2 13.1 d/ 28.7 7.0 10.0 12.0 10.9 12.5 d/ 29.3 9.0 10.0 14.0 10.9 10.6 d/ 26.3 9.0 12.0 14.0 12.2 12.0 d/ 25.6 9.0 14.0 14.0 12.1 12.2 d/ 26.6
12.2 d/
27.0 9.8 14.6 16.0 12.6 15.9 d/ 28.4 9.8 14.5 17.1 13.8 15.0 d/ 29.8 9.7 13.4 18.4 14.1 16.6 d/ 23.0 9.9 20.1 29.2 30.5 23.8 61 22.0 10.8 18.8 27.5 26.8 21.0 d/ 23.0 8.0 11.0 17.5 14.4 13.6 d/ 22.6 4.5 7.4 1 3 4 11.4 9.7 d/ 24.1 4.1 13.0 16.2 12.1 25.0
12.1
nterest on promissory note t + D e p o s i t s ( d e m a n d . savings & time) c/ As of Oecc/ A s of December" W M3= M2 + Deposit substitutes. d/ Interest on promisid/ Sources: Lambert®, "Financial Liberalization and the Internal Structure of
Capital Markets," (PIDS), 1985. Tan, "Philippine Monetary Policy and Aspects of the Philippine Market: A Review of Literature," PIDS 1980 CB Statistical Yearbook

12
i <»
CP
OT eo o o
O T-« CO d d
CO LLI
O o z < w <
ffl H J3 O at LU t— _l LU
CO
g £
in ao a>
s O)
(T> CO <35
(M 00 O)
8
00 o>
in cn
8 o o
d o
csj 3 d o
o d
a> oo -r- in d O
3 o
CD CO d d
M eg d
cm <N o
SI
CM d
CM o
m CM
3
SI d
s
m oo
CO cc
r--co
n Tt O
3
00 d o s
•1- cm •>* CO d t
§ t o
I?
$
o d
o CD
U> ID
o in
cn to
w
CO o
CM O)
o> to o d 88
£ k.) d d
0) CO d d is
O) co d d o r-- in
CO d o CO
5- 3 n <§ o> CO o d CO d 3 o
t s Tl-CO o S £8 d d
2 2 I I £ 8. c 3? o. o ® = •O <e £ S 5 £
a. ® T3 DC
P c ra « -2 ® i flj 2. .2
5
J2
i t <
X "o > CO O)
3 2 > x s r "5 00
> 2 co "r 9 S < t-•S c S"8 s c " 3 8" o S •O •S -S » f -J s ® CO" Q CO "5 2 S t S i £ X >._• ® O * >
£ '5 Si + ii ® CM Jj
; 3 i3 co

13
the 31 percent of Indonesia (Table 6). Malaysia and Thailand have much higher intermediation levels. Almost all studies on this phenomenon agree that government's repression of asset prices in the intermediation markets, as well as the subsidized equity programs for selected institutions (rural banks and private development banks) prior to 1981 are to be blamed. After 1981, a host of new factors have contributed to the maintenance of the stickiness of savings deposit rates, among them, the oligopolistic character of the commercial banking system that is further nurtured by CB's aversion against the entry of new players in the sector.
The formal financial system has gone through three periods of policy environment promoted by government.10 The first period covered the years 1956-1973 in which government policies replaced market forces in the intermediation of surplus funds through the banking system while "allowing" free market forces to operate in new markets, i.e., money markets. During the second period, 1974-1981, coverage of CB's authority was broadened to include the pricing of assets and structure of all financial institutions involved in credit allocation such as the so-called non-bank financial intermediaries with authority to engage in quasi-banking functions (NBQBs). Money markets thus became heavily regulated. The intention was to close the gap between yields of short-term and long-term funds. The third period, which started in 1981 and continues up to the present, is the period of liberalization. A mix of free and administered market policies are being promoted, the former being demonstrated by the lifting of all interest rate ceilings while the latter were implemented through the imposition of record-high reserve requirements and taxes on deposit transactions.
Period of rigid financial repression: 1956-1973. The period 1956-73, which is considered as the period of rigid financial repression, featured a mix of Central Bank policies aimed at increasing the supply of credit at subsidized rates to broad-based, government-identified priority areas. Lending rates were governed by the Usury Act of 1916 which prescribed ceilings of 12 percent for secured loans and 15 percent for unsecured loans. Interest ceilings on deposits were imposed starting in 1956; these were adjusted upwards but at long-time intervals and in smaller steps. Deposits were further taxed by reserve requirements imposed on savings and time deposits of commercial banks which were gradually raised from 5 percent in 1959 to 20 percent in 1970. Preferential or concessional rediscount rates then extended to a broad range of activities such as rice production and small-scale industrial loans. The wide margins between the prescribed loan rates and the Central Bank rediscount rates plus the subsidized entry of rural banks and small private development banks, thus facilitated the rise of banking institutions that relied more on CB support rather than on funds intermediation. The development of other forms of financial intermediation was neglected. The market for government securities did not prosper due to their unattractive yields which were fixed in at par. The equity market likewise remained underdeveloped, primarily due to the low loan rates.
The repression of deposit and lending rates of the banking system paved the way for the emergence of new financial institutions that introduced new financial assets outside the purview of Central Bank regulations. Soon after, existing KBs also started issuing unregulated short-term instruments. Money market instruments began to be traded in the mid-1960s. An interbank call market, which operated on a limited scale and on a day-to-day basis, was augmented by the trading of short-dated debt instruments of banks and prime corporate names by few investment houses.11 Prices of these instruments inevitably drew resources away from traditional deposits. From 1965 to 1974, deposit substitute holdings of the private sector amounted to P7.5 billion, almost double the amount of demand
10See also Lamberte, "Financial Liberalization and the Internal Structure of Capital Markets." PIDS Staff Paper Series No. 85-07,1985.
"Victoria S. Licuanan, An Analysis of the Institutional Framework of the Philippine Short-Term Financial Markets, 1986.

14
deposits (P3.9 billion). Relatedly, average M3/GNP ratio during the entire period of financial repression was 23.2 percent. Tan explains the banking sector's increasing use of deposit substitutes, as partly a move "to price discriminately between small and large lenders. Instead of paying a uniform rate on all deposits, banks maximize profits by paying regulated rates to ordinary small depositors, borrowing from the CB part of its funds and offering deposit substitutes to large depositors."'2
While new financial institutions emerged to expand the domestic financial system, its integration into the international markets was not encouraged by the Central Bank. Whereas foreign investments in the short-term funds market have not been prohibited, residents were not allowed to purchase foreign securities nor maintain bank balances overseas, although they could deposit foreign currencies in authorized domestic banks. These policies prevail up to the present. (Even the purchase of Philippine debt papers in foreign currencies by local banks require Central Bank approval.) These policies were not intentionally designed to protect the domestic financial system from competition but functioned as exchange controls, the latter were imposed in view of the limited (rather than full) flexibility of the exchange rate system which started in 1970.13 Limited flexibility, which functions through the purchase and sale of foreign exchange by the Central Bank and other exchange controls,14 is a consequence of the Central Bank's mandate "to maintain the stability of the exchange rate" despite the official policy that "all exchange transactions take place in a free market."15 Prohibiting investments in foreign assets abroad is thus seen as an important complementary strategy. Nevertheless, recent evidence shows how some practices of local residents (some of whom were government officials) rendered the policy de facto inoperative. The more infamous transgressors of the policy, the family of then President Mardos, have been reported to maintain multi-million dollar deposits in Swiss banks. Boyce and Zarsky16 provide a list of the mechanics used by residents in the illegal export of capital (or capital flight) as follows: (1) cash transfers via personal smuggling, the use of hired couriers, the mails, and wire transmission services; 17(2) false invoicing of exports and imports;18 (3) kickbacks on import contracts; 19and (4) interbank transfers. The total capital flight from the Philippines from 1962 to 1986 has been estimated to reach US$10.3 billion which is one-third of the total increase in external debt outstanding of US$27.9 billion during the same period.20
Instead of liberalizing the interest rates of traditional assets, (deposits), the authorities responded to the rise in money market assets and intermediaries by (1) placing the non-bank FIs engaged in short-
12Edita A. Tan, "Philippine Monetary Policy and Aspects of the Financial Market: A Review of Literature." Survey of Philippine Development Research I . Makati: Philippine Institute for Development Studies, 1980.
13Prior to 1970, a fixed exchange rate system was in force. 14Other exchange controls include quantitative limitations on invisible payments such as those for travel
abroad, educational expenses of students abroad, and maintenance of dependents. lsCential Bank of the Philippines, "Trade and Payments Systems of the Philippines," Mimeographed.
June 30,1980. 16J.K. Boyce and L. Zarsky, "Capital Flight from the Philippines, 1962-1986. Journal of Philippine
Development, 1988. 17Wire transmission services were practiced by black marketeers in Manila's Binondo district (also known as
the Binondo Central Bank). Binondo bankers bought dollars in the Philippine black market and smuggled them abroad for deposit in major banks. Philippine residents bought these deposits by giving pesos to an intermediary in exchange for the latter's instruction to the major bank to wire dollars to the Philippine resident's overseas account.
18Exporters are required to surrender their foreign currency receipts to the Central Bank's authorized agent banks for conversion into pesos. They can understate their invoice value and deposit the difference abroad.
1'Kickbacks for the contract go-between are paid abroad but are eventually paid out of dollars from the Philippines obtained via higher prices of the goods.
20Boyce and Zarsky (1988).

15
term lending under its authority; (2) enforcing specialization among various types of financial entities; and (3) imposing interest rate ceilings and taxes on money market transactions. These policies came along with reforms introduced during 1972-1973 via amendments in the General Banking Act and the Central Bank Act. Other major reforms aside from those previously mentioned are —
(1) The reduction of bank classifications into three categories, i.e., commercial, thrift, and rural banks;
(2) Adoption of policies to improve the efficiency of existing banks. Entry into the commercial banking system was to be halted by preferring branch over unit banking while consolida tions, mergers, and foreign equity participation in domestic banks were promoted. Mini mum paid-in capital was also increased to PI 00 million;
(3) Redefinition of CB's mission to exclude promotion of economic growth, which was to be the domain of the government planning agencies. Thus, Central Bank was given more flexibility in exercising powers consistent with the maintenance of monetary stability;
(4) Financial institutions ("banks," "banking institutions," and "non-bank financial institu-tions") were redefined to indicate the extent to which each type was subject to CB
regulations; and
(5) In 1973 Monetary Board was given the authority to prescribe maximum lending rates which virtually repealed the Usury Act of 1916.
Period of repression in the money markets: 1974-1980. Within the framework of the above reforms, the period 1974-1980 featured interest rate reforms that were intended to reverse the flow of funds from short-term instruments (essentially money market instruments) to long-term financial assets. At the outset, however, these were undermined by the segmentation of the financial system that was aggravated by the enforced specialization among the FIs,( e.g., investment banking activities were assigned solely to investment houses and were set apart from regular banking activities).
While rates on long-term deposits were deregulated, ceilings of shorter-term instruments remained although these were changed from time to time. For instance, ceilings on short-term time deposits were increased from 6.5-8.0 percent to 8-11 percent in 1974; ceilings on savings deposits rose from 6 to 7 percent in 1976. Intermediation in the money markets were penalized in terms of: (1) a 17 percent interest ceiling on short-term deposit substitutes; (2) increase in minimum placement on deposit substitutes to P200,000 for maturities of730 days or less, and P100,000 for maturities of more than 730 days; (3) a reserve requirement of 20 percent on deposit substitutes of commercial banks and nort-bank financial institutions; and (4) a 35 percent transactions tax on all primary borrowings in the money market.
Despite these regulations, the M3/GNP ratio during this period rose to average of 26.6 percent, in contrast with the 23.2 percent during the period of repression. The attractiveness of deposit substitutes was heightened by the fact that M^GNP ratio declined from 22.8 percent to 19.7 percent. Tan explains the seemingly minimal effect of the regulations to the ability of the issuers to arrange their portfolio "so that those of relatively low risk and transactions cost are issued in known money market papers with rates at or below the ceiling, while those with market rates above the ceiling are issued as new papers and therefore not covered by regulations."21 NBQBs also evaded CB regulations by engaging in transactions
21Edita A. Tan, "The Structure and Growth of the Philippine Financial Market and the Behavior of its Major Components," PIDS Working Paper Series No. 81-06, June 1981.

16
falling outside of the latter's terms of reference. Specifically, they engaged in "without recourse" transactions in which they attached their own postdated checks under a paying-agency agreement and reinforced it with verbal commitments to buy back the paper.22
Period of liberalization: 1981-present.The financial liberalization program initiated in 1981 included reforms on pricing policies for the various financial assets as well as on the structure of the financial system; the reforms aimed at fostering competitive conditions and improving the availability of medium- and long-term funds to deficit units. First, interest rate ceilings on all types of deposits and loans were lifted, while the rediscounting privileges were scaled down. Minimum placements on deposit substitutes were also reduced to P50,000, irrespective of their maturity. Second, the differentiation between banks and non-banks performing quasi-banking functions decreased with the introduction of the universal banking. Under the universal banking, commercial banks whose capitalization reached P500 million were allowed to perform a broad range of activities including underwriting, securities dealing, and equity investments in both allied and non-allied undertakings. Clearly, the focus was on bigness which was thought to help ensure the banking system's stability.
However, regulation on other aspects of intermediation were made more stringent. Reserve requirement ratios for deposits and deposit substitutes of KBs, which were supposed to be scaled down to reduce the cost of intermediation, were instead jacked up to 24 percent in 1984, the highest ever since the establishment of the CB. (These were later brought down to 21 percent in 1986.) Two taxes were also imposed for revenue generation purposes: a five percent tax on gross receipts of banks and a 20 percent tax on deposit and money market earnings of depositors/investors. One estimate showed that both taxes comprised 25-39 percent of the average intermediation cost of banks (defined as the difference between the average cost of funds and the average interest rate on loans and investments other than reserve requirements) in 1983-1986.23
Despite the freeing of all interest rates, MVGNP ratios were generally lower than those during the earlier periods of repression, although M/GNP ratios were slightly higher. Aside from the abovementioned policies, there were other factors that brought about these dismal records. First, the continuing high deficit spending of the government fueled double-digit inflation rates for most years, especially during the 1984-1985 recession, resulting in negative real returns on deposits which remained sticky. Second, savings deposit rates were extremely low since 1985, even lower than those set by authorities during the regulated regimes. The latter factor, together with abnormal bank margins among commercial banks of 5.8 percent (versus 4.4 percent average of other countries), seem to indicate a monopolistic banking structure.24 Third, trust accounts, which are off-balance sheet borrowings of banks, have been absorbing an increasing portion of funds from large depositors. During 1984-1988, such funds reached P181 billion of which only around 10 percent was held as cash and deposits in banks. Most of these funds are lent and invested in money market instruments, especially high-yielding government securities. Lastly, it is felt that the Dewey Dee crisis in 1981 had a lasting impact on confidence, causing large depositors to invest their funds in more stable assets, e.g., trust accounts.
22Lamberte (1989). 23World Bank, p. 67. 24Tan (1989).

17
HI. MONEY MARKET IN THE PHILIPPINES
A. The Philippine Money Market: Its Development
The evolving needs of an expanding economy set the stage for the development of the Philippine money market. Faced by the changing structure of a developing economy in the 1960s, from predominantly extractive industries into a diversifying economy where manufacturing concerns played an increasing role, the financial system had to respond by developing in a similar fashion.
New ways had to be found to mobilize untapped financial resources, especially at a time when rates on traditional instruments were administratively set at lower levels. This became a take-off point for emerging financial concerns with the objective of meeting the financial requirements of new industrial ventures by raising funds through the trading of short-term debt papers bearing rates not regulated by the authorities. In 1963, the Private Development Corporation of the Philippines, an investment company, was set up offering financial services through underwriting and loan syndication. In 1964, BANCOM, the first investment house was also established. This new form of financial intermediation attracted others especially among the established commercial banks. Since then, the money market set its mark in Philippine finance.
There were no official figures about the value of transactions from money market activities during the early period. An unofficial estimate placed it at around P32 million at the end of 1966.25
Prior to the 1972 banking reforms, the Philippine money market was left unregulated. Because of its novelty and the relatively high returns compared to ordinary deposits, many investors were attracted to it. This contributed to its exceptional growth. Consistent with the CB task of supervising and regulating the financial system, operations of non-bank financial institutions became supervised in 1972. The need to rein this new form of financial intermediation, i.e., the marketing of short-term debts, became a necessity as this challenged the effectiveness of the CB to direct the allocation of financial resources and to price financial instruments.
In 1973, the investment house law was promulgated; this became the basis for the establishment, operation, and regulation of investment houses. The CB also regulated the borrowings of investment houses and other non-bank financial institutions from 20 or more lenders at any one time for the purpose ofrelendingorthe purchasing of receivables and other obligations. The borrowing instruments allowed by the Central Bank were those introduced under Central Bank Circular 438 in 1974 and are collectively called deposit substitutes. They consisted of repurchase agreements, certificates of assignment, certificates of participation, and dealer promissory notes (these are further discussed in Chapter III, B.).
25Licuanan (1986).

18
In 1975, the Securities Act was amended to place all debt instruments under the supervision of the Securities and Exchange Commission (SEC). All commercial papers had to be registered and had to comply with the minimum requirements for SEC issuance. In the late 1970s, various regulations were passed to monitor the money market such as requiring firms to present authority to issue debt instruments, prescribing qualifications of officers by quasi-banks, imposing a transaction tax on all money market borrowings, and prescribing reserve requirements on interbank loans and deposit substitutes, among others.
Between 1973 and 1979, the money market became highly regulated as with the rest of the financial system. Nonetheless, the volume of money market transactions, i.e., the sales and purchases of money market instruments, increased from official figures of P142 billion in 1975 to P304 billion in 1980 (Table 7).
A second set of bank reforms was introduced in 1980 which liberalized the financial system and introduced the concept of universal banking. Commercial banks could now engage in investment banking and own allied and non-allied enterprises. Functions of investment banks were also expanded to include foreign exchange operations and trust functions. Underlying these reforms was the need to strengthen the condition of financial intermediaries to meet the growing need for financial services. As a requisite for expanded banking, banks were required to increase their capitalization or encouraged to merge with other allied financial institutions. The improvement in the financial standing of these banks permitted them to assume broader operations particularly in packaging financial services. The mergers provided incentives for these banks to mobilize more funds for bigger operations. The benefits were translated into increased flow of savings into the system for the requirements of medium and long-term borrowers made possible through term-transformation.
Since lending long and borrowing short could give rise to liquidity problems, the CB instituted safeguards; a m o n g t h e s e was its lender-of-last-resort facility. However, the money market not only functioned as an important source of funds for financial intermediaries but an essential counter-weight for illiquidity as this provided a ready mechanism for intermediaries to raise funds in short duration.
From that time on, the volume of money market transactions grew, surviving the liquidity crisis in 1981, then reaching a peak at the onset of the 1983 economic crisis. (These crises are discussed in the subsequent chapter of this paper.) Since then, money market transactions ballooned to a volume of P780 billion in nominal terms by the end of 1988. The money market has since become an important form of financial intermediation.
B. Survey of the Philippine Money Market
The Philippine money market can be classified into four main types: the interbank loans also known as the interbank call loans market, the deposit substitute, the commercial paper, and the government security markets. These markets are functionally classified according to the major players, usually the borrowers, in each market.

fable 7 VOLUME OF MONEY MARKET TRANSACTIONS, 1975-1988 a/
(in million pesos)
Year Nominal Real As percentage
1975* 142263.76 84887.47 5.50 1976 190449.00 104072.77 5.95 1977 210520.97 107122.27 5 32 1978 238094.40 110933.01 5.07 1979 295488.10 119476.02 5.55 1980 303739.92 106246.61 5.08 1981 329558.00 103896.62 4.37 1982 462822.23 134581.25 5.28 1983 600561.87 156377.59 5.97 1984 505810.94 87900.01 4.48 1985 505742.25 74343.03 4.14 1986 523417.46 76212.38 4.03 1987 460855.74 62112.87 3.26 1988 780052.00 95794.52 4.59
a/ Sum of monthly trading, b/ First quarter data not available.
Source of basic data: Central Bank of the Philippines.

20
Interbank loans and deposit substitutes are the markets for funds by financial intermediaries. The market for debt instruments by private corporations and other financial institutions without quasi-banking functions are classified under the commercial paper market. Lasdy, the market for government securities includes the issues by the Central Bank, the national government, various government corporations, and government financial institutions.
Interbank call loans. These are very short-term, normally not exceeding twenty-four hours, bank-to-bank accommodations to cover reserve deficiencies by banks and non-bank quasi-banks. Operationally, interbank loans are accomplished through fund transfers among lending and borrowing financial intermediaries carried each day in the books of the Central Bank when the clearing results are known.
Since interbank call loans are bank-to-bank accommodations for funds, players in this market are exclusively banks as well as non-banks granted quasi-banking licenses, i.e., investment houses and finance companies. The biggest borrowers in the market are largely commercial banks. Between 1983 to 1987, commercial banks were consistently the sole users of funds for this market (Table 8) mainly to cover reserve deficiencies for their deposit and deposits substitutes.
The lending side of this market, however, has a more diverse composition. Although commercial banks were also the biggest lenders having an average share of 85 percent between 1983-1988 (Table 9), other major lenders in the market were the government financial institutions (10%), e.g., Development Bank of the Philippines and the Land Bank, the investment houses (0.4%), and the finance companies (0.2%). The interbank market is also a ready market forinvestible funds among rural and thrift banks (3.7%).
In the 1970s, interbank call loans comprised less than 10 percent of the total volume of money market transactions (Table 10). A rapid expansion of this type of market in the 1980s wherein the volume of transactions by 1988 accounted for almost 40 percent of total money market transactions.
Between 1975 to 1979, the interbank market had an average share of nine percent of the total money market transactions compared to its average share of 33 percent in the 1980s (Table 10).
Pieces of evidence even as early as 1979 show that banks used the funds in this market not only to cover reserve deficiencies but also for their regular operations. In 1979, despite a newly imposed reserve requirement of five percent for interbank borrowings the previous year,the volume of interbank loan transactions almost doubled. This may be traced to the pervasive demand for short-term funds by enterprises hit by the oil price shock in that year.
Given the favorable business climate in the banking sector, with a liberalized system starting with the lifting of interest restrictions on long-term loans in 1981 and eventually short-term loans in 1982, the need for more funds for expanded banking, notably among commercial banks, necessitated the increase in the volume of funds sourced via this market. Funds sourced through this market were likewise relatively more attractive than deposit substitutes which carry higher reserve requirements. Required reserves for interbank funds were lowered from five percent to one percent in 1980.
Partly, the growth of this market in the 1980s could also be traced to the demand for reserves especially among banks due to the increase in their deposit liabilities resulting from the newly liberalized depositrates. Interbank borrowings were resorted to by banks to cover up reserve deficiencies whenever these banks felt the pinch of high reserve requirements on deposit liabilities which reached as high as 24 percent in 1984. The rash offailures among banks and quasi-banks in the early 1980s, which dictated the need for these financial intermediaries to remain liquid always, may have also been a contributing factor to the emerging importance of this market as a ready and immediate source of funds among banks.

CO z O l-o < m z < £ 2 < o
CO - i
J * t- z EC LU
rr "ST y 8 S a O
S I U- £
z a.
lu £ E ^
O >
98 ® ® E
O >
co a> 2 e .2 o >
in oo ® O) £
oo a> 2 E
£
OJ N N Lf) N lO N ^ cJ r ^ oo OJ o n n co O) n CM CO O t-C0 t-IN
8 in 3 on
0 0 0 T— 10 (D -ti CO r fv 00 10 N. CM CM •— T—
o cm co r--
« S c — * I 1 " <5
f l ^ I m p m m F £ Q O)™ E ai c c t E ; « > | o > S € O u. w O
CM pj ^ ui
§
o il a> § o
^ CO T- i— in o> o
§ a> ffi E
£8 §? 8 o , r oj oj iri 00* in c CM C\J CO T- f c ® co . ^ iruj N CM CO CM W CO CM
oo ® O) E o
CO O H O <
H" CD Z ' "fA* < ™ o 3 S |
l ^ g J
< g -CD -DC LL.
S t
Z)
i s E •
5
<q oo in co co C <g CM CM O °
ffl^pooo O N Q U) (I tz co co cm co' r-cn Q o o oo to CO CO CO O 0) O O) ^ M- CM
w w q o o c (fl r- ri t\i ri ®
S ^ o n o i o O) 00 o O) o n c\i to co' o' o co iS cm co co co it
O N i - M O O W CM O CM e> 2 l*» CM
S O, a> e
o ! a
s 25 § S 8 o ' 00' 00' O 8 3 n u5
m in o i o S £ ^ CM Ol T— CO in
3 ® ro E 5
CO NlA 0) (O O
£ 3 5f s g S2 gi -N P) O O CM CO 1- 00 CD
CO CO CD CM O K O O ^ O °
i S J 2 ® o n in (O O) co t a)
ti-ll) € B i;
c 9) o 3 -g o '8 J3
5
V) c .0 5 VI a> ra <n -f= to J2 » ® .. ._ „ c c O i c o
m oj O to 8. — E X CO E m Jt — ±i 5
§ £ s g s O O -E EE [I
21
a c CL a. a. a •S "5 jt c (0 m
c a> O is a •o 0 (0 1 o
o CO

22
O In LU g O >- .o - m l ®<fl E
T CO
<
o m
at —
s i
<=1 o) -2
o5 = o >
o> 5 o
dexji^^ddt^tb^dddd" cm r- io
ggSSSSSiSSigiiSSi s g s s a
^ <o
OS 0 ^ Nr
^^ifddopjNddood®
8S8R88S88SI28Se K cn fg Q iANOia)0NON«
NKsoibbAAb^ddd;
s e a s s s s s e s s s s s h-aicncnscvsm intt ^A
A D S r^r-. c\J a
ttigjgaidd^tcrleiT-di-d"
SSSSSSSSRISS^SS
t i f l M D ' - O f l ' - n ^ O N ' - Q oit'M^ddihiAddddoS tt <0 CM
88888288S85SS38 SS3 S f- m r ^ S)
j ^ c o o c D i - a ^ m ^ — CH — Q ^ ( j j ^ b d m . f l O r O - o S
•-SSS ^ " »
A 5 EE » g s . i t l s | i J I J i < * h 1 1 r J i S l l , | | i 'S.Sf.S-Blllil-i £QQ.[TUUC V i j s s i i Z LL 0 Q U I—
H
i »> i I I
i i
35 2 o >
o> en m u> o NWOON O) © <\i cm a wj r- °
s s s s s S« to r* eo cv H**£
I f l l CD O ^ O O O P J N O Q O j j j g o d o ^ d g j B . O j j O
s s l s s a l m i s as f\J S « CD CO 4 f; <£ Q
i f ) « P ) P ) O N O O O N O O « Q (tbbbodnndNNbbz n ^ n ^
n « <o « r-i <£> <' Cv» <D &> tft * l "t h (D O O < s e a s KJ <M ~
itiAomo QO>OOI-DNQ ^ rt rt
8SS8E3KS8 ® r— 0) r-<2 « Ifl « (AN re 4 in cv T- a <\j co ( S! r» r>
k r i ^ t f j ^ d d ^ C N i w o i i ^ d ^ S rt ifl «
2 8!gS§8iS!
(*) <D it
82S3S3 SS
IQUOIQ
-^isitjissiffisfs Olg iOwOOOVI
^pNnansioaisioiAN
i ! s = =
' " I * m
S %
n £-8 s i | 1 i i o j S i S S | | | ° |J? | g = £ | Joo .EuOOzu.OqOi-
.'i i "-B o j n c i
I e o) iZ
"9 •e <5

23
Deposit substitutes. As the term implies, deposit substitutes are alternative means by which financial intermediaries, specifically banks and non-banks with quasi-banking licenses (NBQBs) raise funds other than traditional deposits.26 Transactions in deposit substitutes may either be through the issuance of a debt paper by the bank or quasi-bank or through the sale or transfer to a third party of existing instruments in their portfolio for purposes of raising funds. Debt papers are primary issues that are heretofore referred as dealer promissory notes because it is the intermediary itself which issues the debt instrument. Existing instruments, however, may not be considered secondary instruments since the sale or transfer are done with recourse to the original subscribers. The banks or NBQBs are obligated to redeem such issues at some specified date in the future. Strictly speaking, there is no secondary market for their debt instruments.
The following instruments comprise the deposit substitutes market:
1. Repurchase Agreements — These are existing instruments in a financial intermediary's portfolio sold in the money market with recourse, meaning the bank or quasi- bank by mutual agreement with the buyer will buy back the instrument sometime in the future. The underlying instruments are both private and government issues.
2. Certificate of Assignment — These are instruments the right of which are transferred from the financial intermediary to the assignee; in this case, the latter can claim credit to or interest on the instrument at some agreed time in the future. The underlying instruments are also both private or government securities.
3. Certificate of Participation—These are instruments evidencing the share of a holder, on the interest which is payable at some future time, depending upon the extent of his investment or participation in the instrument. The financial intermediary is then able to retail debt instruments denominated in large amounts. These can either be private or government securities.
4. Dealer Promissory Notes — These are debt instruments issued by banks and quasi-banks to investors, payable at some agreed time in the future.
The relative size of the deposit substitute market to the total volume of money market transactions deserves attention. Between 1975 to 1984, deposit substitutes accounted for more than 50 percent (Table 10) of total money market transactions, even averaging 75 percent during this period. This reflects the importance of this market as a secondary source of funds relative to deposits for financial intermediaries with quasi-banking functions.
The deposit substitute market has been dominated by commercial banks, the largest borrowers which are also the largest investors (Tables 11 and 12). As borrowers, they accounted for an average share of 55 percent of total deposit substitute borrowings between 1983 to 1988, although this share has been declining lately. As lenders, they accounted for an average share of 46 percent of this market during the same period.
Investment houses, as the second largest group of borrowers, recently increased their borrowings through this market from 13.6percentin 1983 to 39percentin 1988 (Table 11). Thesamecan be said
finance companies which have increased their share from 9.9 percent in 1983 to 21 percent in 1988. Together these institutions account for a share deposit substitutes between 1983 to 1988. of about 39 percent of total borrowings through
26This class of instruments was created under Central Bank Circular No. 438 dated November 1974 Only these instruments, classified under deposit substitutes, are allowed in quasi-banking.

I
I
I
H
O * 0 O d> 0> © o 2 9i« CM ^
w ^ S 6 t^
f l P l
w o f n o oS K oi u> o" £ CM » CM
ai^Ni-ins i i s s ' i niofl n
o © o r- o IggJ-rfttjO
S $ N S S F > N a o n n
a n u v n o j ji o o o °
i p f t l S O P ) '
f ffi ® it CM n t- o n N ^ a
<j> cm o « a> oi ®
N in a>Nn in ir» ir> r © r-<o v «' i/i « CM rt <vi o to co ^ B (M JO
q (0 0 r to o P « a> oi W O
R O S S I S inOxpMAff
P 1 ^ I H M
s
| OJ O ^ Ifl

•a 59 « .2 rD LU =
a?
| |
8 j? O >
§ | 5
T CO a 2 E
5
g gj c\i pi ri t-' o o o
NQVON'-gVVAID AO In w ffl rt ® * N N ^ rt t-' N P) * IO PjV'fti N a i A M n d a N N ^ n k
o o o" o
8 S *— o in
p e
S 3
lO^OICCOIHIDMIDOf (DO (OQUjoui^QUlVlflSlocJ) r-incM^eoeo-^i^^-oici)*-S-- m -- ^ N N in
CM CM CM
8
S S S g S a S S S S S M a S S S t CO o
i - O o « « S in S W ^ Pi
(OT-ifluioinNn^coO 01 00 s o i -NBndi ionNBNqi fNqn to oj n <c is rt CM CM i—
s
CO 0> 8 CO
2 8
CO CM
- 3
rt to ao (D <0 cm"cm ^ d o o o o d 8
in
s s ^ s i s s s s a s 2 MD IS N (D ^ t- T- 00 ^ CM ^ i— i—
pTfnTfMoqcqionNqNuq N d i l V f f i n f l n i n d d o o d o co •— 8
25
CO co <b 2 i 3
I
r - v-a CM (0 o O) in « 8 in A r- 8 8 CM tn n
CM CO fM 5 8 CM tn CO
S' c r i ^ r t Q N l O V f l i d
H I <A m
cm co m <o
£L <D £ 0 s m •ffl c 8 1 w •o o a o 3

26
Aside from commercial banks, individuals and private corporations are two of the largest lenders in this market accounting for an average market share of 15 percent and 12 percent, respectively, between 1983 to 1988 (Table 12). Investment houses and finance companies account for only 6.5 percent and two percent, respectively, of total investments in deposit substitutes between 1983 to 1988.
Dealer promissory notes are the most popular debt instruments among all deposit substitutes, accounting for an average of 77 percent of the total volume traded for all deposit substitutes between 1975 to 1988. Repurchase agreements are the second most popular, averaging 23 percent Financial intermediaries seem to prefer borrowing directly through the issuance of their own instruments rather than raise funds using other securities as underlying instruments.
Starting in 1975 when deposit substitutes were already formally introduced through quasi-banking, the deposit substitute market averaged 62 percent of the total volume of money market transactions. Despite this share, however, the share of this market to total volume of money market transactions started to decline from 82 percent in 1979 to only 14 percent in 1988 (Table 10).
Deposits and deposit substitutes. In the mid-1980s, the banks' preference in sourcing funds shifted. The liberal deposit rates which came during the 1980 financial reforms saw the expansion of funds coming from traditional deposits. From a peak in 1981, total outstanding deposit substitutes among commercial banks were declining, showing negative growth rates from 1984 onwards while outstanding deposits have increasingly grown with an average growth rate of 43 percent for the same period (Table 13). Banks found it convenient to obtain funds through deposits rather than go through the requirements of issuing their own promissory notes, given the stringent rules instituted with the collapse of a few investment and finance companies at the start of the 1980s. Thus, the volume of deposit substitutes by way of repurchase agreements also decreased due to the decline in the use of private commercial papers as underlying instruments (Table 10). The next chapter will show that banks preferred to sell commercial papers directly, on a without recourse basis after the Dewey Dee Crisis in 1981; this undermined the popularity of these papers.
The preference for other sources of funds other than deposit substitutes can also be explained by the increasing reserve requirements imposed on this group of instruments from 20 percent in 1980 to as high as 24 percent during the 1984 financial crisis. Despite the same reserve requirements imposed on deposits, sourcing funds through deposit substitutes involved more paper work, since One had to comply with the minimum legal requirements of issuing debt instruments in the money market. The growth of bank funds sourced through traditional deposits and through interbank loans may, therefore, be said to have come at the expense of deposit substitutes.
Commercial Paper. The commercial paper market will be defined here as the market for debt instruments issued by private corporations (non-financial) and financial corporations without quasi-banking licenses. This market consists of debt instruments that are issued and sold outrightin the market through financial intermediaries for the account of an investor.27
Intermediation in the commercial paper market takes three forms. First is when these commercial papers are traded as underlying instruments in deposit substitutes. This form of activity, as
27This does not include commercial papers used as underlying instruments in deposit substitutes either in repurchase agreements , by certificates of participation or assignment. This type was already discussed under the deposit substitute market.
For functional segregation, all commercial paper issues by financial institutions with or without quasi-banking license, e.g., banks and non-bank quasi-banks for the purposes of raising funds for their end-use are classified under deposit substitutes. These were also properly dealt with in the earlier section and were referred to as dealer promissory notes or simply promissory notes.

27
Table 13 LEVEL OF OUTSTANDING DEPOSITS AND DEPOSIT SUBSTITUTES
OF COMMERCIAL BANKS AND QUASl-BANKS
Deposit Subs. Deposit Deposit Subs.
1978 11,493 43,625 6,731 1979 11,950 55,997 8,907 1980 12,371 72,630 11,327 1981 16,452 29,261 8,598 1982 16,565 93,230 9,590 1983 17,106 116,227 8,438 1984 11,275 134,552 6,401 1985 8,608 143,017 5,434 1986 4,874 138,026 6,086 1987 3,605 151,794 7,885 1988 2,543 192,125 7,131
Source: Central Bank of the Philippines.

28
defined in quasi-banking, occurs when financial intermediaries buy these debt instruments, keep these in their loan portfolio and later use these as underlying instruments. Another form of trading the instrument is when the original transaction involves the commercial paper as a primary issue which the financial intermediary buys and later sells outright and without recourse as in dealership. Lastly, there is a matching between the borrowers and the investor, in which case intermediation takes the form of brokerage.
The non-financial corporate sector has used this market more often than the financial institutions (without quasi-banking license) in obtaining funds through the issuances of commercial papers. Available data between 1983 to 1988 show non-financial corporations accounting for an average share of 82 percent against 18 percent for financial corporations of the total volume of trading for outright sale ofcommercialpapersinthe money market (Table 14). Between 1985 to 1988, non-financial corporate borrowers had almost a 100 percent share in the market with financial corporate borrowers having a neglible share. The major investors were individuals accounting for 54 percent average share of investment in commercial paper sold without recourse, followed by private corporations, 29 percent. Investments through trust and pension funds accounted for 11 percent of the total investment in these instruments (Table 15).
The commercial paper's popularity as an investment alternative for those with surplus funds enabled it to stand out from the rest of the money market. In fact, Philippine money market almost became synonymous with the commercial paper market. Yet, the volume of transactions involving commercial paper issues sold outright averaged only 4.2 percent of the total volume of money market transactions from 1975 to 1988 (Table 16).
The high profile of the commercial paper market from the inception of the entire money market to the time it was regulated in 1972 deserves a closer look. Also through the years, the commercial paper market has been the focus of some important banking regulations.
In the 1970s, most private corporations turned their efforts toward sourcing their fund requirements via the money market. Their growing number prompted the need to regulate the issuance of commercial papers as a form of control to protect investors and as a matter of achieving monetary targets. In 1975, the SEC required all corporate issuers to seek the initial approval of the Commission before issuing commercial papers. In November of the same year, the Central Bank required all banks and non-banks quasi-banks to observe the SEC rules of registration on commercial papers. At the start of 1976, the CB issued a circular for all banks and quasi-banks to present evidence of authority when issuing instruments and/or to require from corporate issuers this authority before selling or buying their commercial papers.
Despite the regulations introduced in 1975 to 1976, the volume of transactions involving issues of commercial papers sold without recourse increased by 12 percent. Somehow the high-yielding debt instruments were a lure to investors.
Despite the regulations on the money market introduced by the 1972 banking reforms, the Central Bank's influence to allocate financial resources through credit was severely challenged. For one, commercial papers sold outright or without recourse were outside the scope of quasi-banking and remained unregulated by the Central Bank. The authority of the Central Bank over the origin or issuer of the commercial paper was also limited to financial intermediaries, e.g., banks and non-bank quasi-banks and not to private corporations.28
og The Securites and Exchange Commission as the registrar of all corporations, public or private, financial (with or
without quasi-banking license), or non-financial, exercises supervision on the activities of all corporations. The Central Bank's role is limited to supervising the operations of financial institutions in relation to monetary goals; but it does not act as a corporate watchdog.

i
9 « E <30 .2 oi
C/5 Z 0
1
®
So §
00 CO 0> I co 00 o>
< oc w 5 > S cc g S.
l~ o CO = ° U- .£ ^ uj LU Q_
—I V 0 £
to g ® = CD q ^ >
a w | CO 3 <J> o ^ >
5S
®
* I oo o>
M S O oi o 2 o> ^
00 00 U) eg o> c\J co to o CO i- W ffl I- oi <£> tC
m m o oi o 2 o>
LO CM 00 co rs o' uj iri <j> ~ 00
o o o o o ° T- W T*
O) ^ 0) co t r» d d o m in to w 18
00 CM O 00 ^ © O) ^
CO 00 CD O CJ ^ i t
O) o T- CM
a> o ui -rf 2 in v ^
r» H3 ,— CM ft 00 10 to o s
o CO
o> CO
CO o CO *—' CM
s i
a> i I I | i "S <8 i
< S
p (0 i f Z IT
CM
n n o r c\i 2 CO to
IN CO TO 1-IO® o oi a> o> "t co t- CM
i 5 ! S
o c
3
o E "B E co "S
29
! l
CO 00 0>
0 "i Q. w ® 1
s UI «
<D c
a. a>
I t O,' c (0 m
« o id 75
• a .y £ -O •s 8 Z3 O CO
' I
n d o io o o 6 o r ?!
f Q W < 8 2 8 CO u>
o o $ <0
N M r o d ^ d o b o r i o d' IS) C)
SMfiD^ OtlNdlAAflQ _ n^n^tovQooiiAO COCXIIA t- «"> csi u> c«> ^ W op cvi o> o ob
f) o O t O N * CM
POO) S v o l U> -
CM CM U) O 1-; IS CO o N d o o e\j ui
q p> to i o « » o »' N > ^
I S © O O
H
£
^
dirtW 6 d s i" o d o o to ^
co c*> 5 * <6 § Si SI 3 3
3 § 31 ° ? 8 K Si S 6 8 bS « "
«3C\Jcr>OOCT)C\J»-h-OCvJ Is o o ® S l e s ^ d d t ' o V odd %D CM O o

Table 16 VOLUME OF MONEY MARKET TRANSACTIONS
BY INSTRUMENT, 1975-1988 (in million pesos)
1975-1988 a/ Instrument
Volume % (in million pesos)
1. Interbank Call Loans 1638001.55 29.52
2. Deposit Substitutes 1. Promissory Notes 2. Repurchase Agreement 3. Certificates of Assignment 4. Cert, of Participation
2943986.921 2203557.97 732481.284
4005.66' 3942.003
53.05 39.71 13.20 0.07 0.07
3. Commercial Papers 1. Non-financial 2. Financial
233052.236 185413.86 47638.38
4.20 3.34 0.86
4. Government Securities 1. DBP bonds and other securities 2. CBCI's 3. Treasury Bills
734335.943 198849.018
19658.08 '515828.84
13.23 3.58 0.35 9.30
Total 5549376.65 100
a/ First quarter data for year 1975 not available.
Source of basic data: Central Bank of the Philippines.

31
The popularity of commercial papers which promised fast and high returns also came at a time of a repressed financial system. Savers, particularly investors, had more reason to shift their savings preference from deposits, which carried negative real rates, to such investment alternative as the attractive commercial papers.
Realizing this disparity of yields between ordinary deposits and commercial papers, the authorities imposed a 35 percent transaction tax on all primary borrowings in 1977. In the same year, the volume of transactions involving commercial paper sold outright dropped by 18.4 percent.
The money market continued to be very active in the second half of the 1970s, with the emergence of some aspiring corporate giants associated with the Marcos government. These firms extensively used the money market for their funding requirements. Most of these corporations turned to the money market because they could no longer avail of credit from the banking system either because these firms had overborrowed or there was a shortfall of investment funds for lending by the financial system given the repressed regime.29 Some of these expanding corporations even acquired their own investment houses and finance companies in order to tap funds through this market.
The investment houses and finance companies affiliated with these corporate giants became virtual "milking cows" through extensive loans accorded their mother companies; or they were used as conduits for investors' funds. Following the 1977 collapse of a commercial bank which had extensive exposure to its sister investment company, the Central Bank acted to avert parallel cases in the future and to restore the public confidence in financial intermediaries.
In 1977, the CB issued a circular limiting credit accommodations by non-banks to its directors, officers, stockholders, subsidiaries, and affiliates. This was followed in 1978 by another regulation on interlocking directorates and officerships in banks and non-bank quasi- banks.
Despite these regulations, the commercial paper market maintained an almost invariable trading volume between 1978 to 1980. In fact, its share to the total volume of transactions on the entire money market was fairly constant (Table 10).
During the first quarter of 1981, just when investor confidence was about to be restored, a businessman with hundreds of millions of debt owed by his firms through the money market fled the country; this directly affected 13 commercial banks and 11 investment houses and finance companies A massive pre-termination ensued hurting heavily the non-bank quasi-banks which were highly dependent on the money market for funds. Among the first to fold up were the so called financing arms of the corporate giants.
In 1981, the volume of new issuances of commercial paper by corporations declined starting trom its level in the first quarter (Table 17). During 1981 and 1982, and in an obvious maneuver to extricate themselves out of the mess, intermediaries, notably commercial banks, sold commercial papers in die market on a without recourse basis instead of using these as underlying instruments in deposit substitutes. The volume of transactions involving outright sale of commercial papers rose relative to the volume of repurchase agreements involving private instruments (Table 10). Table 18 shows that the volume of deposit substitute transactions involving private securities in repurchase agreements drastically dropped by 31 percent in 1981 from its level in 1980. A further decrease in this volume occunred in 1982. On this basis, the volume of commercial papers sold outright without recourse remained high in 1981 and 1982.
29Lamberie (1989), pp. 38-39.

32
Table 17 TOTAL COMMERCIAL PAPER ISSUANCES
BY REGISTERED ISSUERS, 1979-1982 (in million pesos)
1979 1980 1981 1982
January 2,874 3,036 3,945 2,663 February 2,369 3,475 3,609 2,259 March 2,591 3,374 4,295 2,404 April 2,652 3,711 3,699 2,023 May 2,844 4,227 3,160 2,182 June 2,840 3,430 3,226 1,979 July 3,033 3,311 3,467 1,781 August 3,483 3,579 2,709 1,420 September 3,259 4,493 2,821 1,477 October 3,252 3,355 2,791 961 November 3,189 3,661 2,360 940 December 3,002 3,673 2,148 663
Total 35,388 43,325 38,230 20,752
Source: Licuanan, 1986.

w
I - M
S i co S. 5 c
CO * ~ cvi CO o>
£ CC JD ^ w >• v t- m ^ §00
O Lit U1 |
= i
• w
! 50 ! 0»
8
! 8 CD
<D E O >
yO o -
© E o >
a) E
5
® E 3
V,
o> CO CM
CD IO CO a> i n c o c o
co o CM
o CO a> CD o>
s
CO CO
CO oi o s in
(0 c CO o
a> E
O> 1 0 O CO 1— 1— t ^ T ^ O N O O CO U)
m o o c o c o c o t O U l N W ® O CO O OJ 03 O © O 3 N N ^ C\1 CO 00 i n CO OJ CO 00 CO CO CO CO •»— CO Si eg
OJ i n c o c o . -c \ i s < d c d 6 6 r- 10
0 0 0 0 0 0 co co R-- c o OJ O) I D r O t d l r i n n o n o) SIOOOlWi-S p l g N
CM
H- CO OI CO ** CO o i N o i W d o Is* ^ T-
1- (O O) 1- o ^ r-- T - co co o j <0 riooioioui 00 CO CO TO CO O)
S S S S i S ® ^ CO CO CM
- I O
© ® E E « c ® 0 c o
<g S £ £ s
I z < <
« © ® « t : 2 <2 w « w _
E u a
Q ^
Q. Q.C t; aT ® a> a> DC (TOO c\i c o iri
i n a> <0 Tf o i
CO c o o> co r^ i n i n c o i n c o o ) <D N ®
CM 1-CO OJ
CO OJ o
CM "f 00 CM co i n o> "I- 5
i n 1— t t 05 0)0 i n i n o ( O N ® 38®
A S CR 2 JG W W — E
w - s s a a o - s a i f o
®
_ S CO CO
8 Eu .6 -7 ll
t- CM CO CM
OJ 00 o i §
CO o
0 <0 01 CD CO
00 CO OJ CO CM O O
i n o> o CO CO
w .S
CO Tz I §
O
$3 § CO OJ <9
o o
CO m i n en CM CO
o o
CM o» oi CO § CO
3 I 1
E o E o
E 3 CO
• a

34
Before the year ended with a looming liquidity crisis threatening to affect the entire system, the CB issued various circulars to enhance the stability of the market in general and to provide protection to investors in particular. Among these were —
1. The need for full disclosure of the financial standing and performance of a corporate issuer before receiving the authority to issue commercial papers;
2. Limiting the outstanding liabilities of a corporate issuer to at most 300 percent of its networth;
3. Requiring corporate issuers to secure at least a 20 percent credit line from authorized banks before they can issue commercial papers; and
4. Providing incentives to commercial banks that issue a credit line to prospective commercial paper issuers through special credit accommodations by the Central Bank.
Also, in 1981, the CB extended a massive bail-out to some of these banks and non-bank quasi-banks in order to prop up the market. To discourage preterminations, the pre-termination clause as an option of the lender was removed from the commercial paper. In 1982, the CB also helped setup a credit rating agency to furnish information on the credit worthiness of corporations.
The drastic drop in the volume of transactions which occurred in 1983 was expected. The 15-month transition period granted by the Central Bank to some corporations, during which they could issue commercial papers without the necessary credit line, already expired. With the credit line requirement applied to all corporate issuers in 1983, the number of firms intending to issue commercial papers suddenly declined. A political crisis also began to grip the economy at that time.
From 1983 to 1988, the share in the volume of money market transactions of commercial papers sold outright averaged only 3.6 percent, compared with 4.5 percent in the second half of the 1970s. Total peso volume also showed a constant decline.
Government Securities. Instruments in this market consist of issues by the Central Bank, e.g., Central Bank Certificate of Indebtedness (CBCIs) and CB bills; the national government, e.g., treasury bills; and debt instruments of government corporations and financial institutions, e.g.,DBP bonds. The scope of the government securities market as discussed here includes only the marketable type traded in the market and does not cover some special CB issues, such as those used by banks and non-bank quasi-banks for branching requirements. Normally, government securities are relegated to their institutional roles as a tool for monetary and fiscal policies such as in the control of money, allocation of credit, and as instruments for public sector debt. Nevertheless, the government securities market has grown in importance relative to the entire money market, especially in the 1980s, owing to the increasing acceptance of these instruments as a form of alternative investment.
In the 1970s, the primary government securities sold without recourse to investors were the CBCIs and the treasury bills. Owing to their unattractive yield relative to other money market instruments such as commercial papers, the combined market share of all government securities in the total volume of money market transactions averaged only one percent. Likewise, the growth rates of this type of market were negligible.
In most cases, issues of government securities notably CBCIs ended up in the balance sheets of financial intermediaries either as required investments in the credit policies of the government such as the agricultural and agrarian credit programs. In 1975, repurchase agreements with the CB on the holdings of CBCIs and other government securities by banks and non-bank quasi-banks were allowed mainly as a means to control credit. Most of these instruments were also used as collaterals by financial intermediaries with CB's rediscount window.

35
With the banking reforms in the 1980s, a rationalization program for government securities was instituted by monetary authorities to make these competitive in the market. First, CBCIs were slowly phased out starting in 1981, although there were re-issues in 1983 and 1984 in favor of treasury bills making the latter the instrument of public debt and at the same time, a primary open-market tool by theCB. Second, a securities dealership network was instituted which included nine commercial banks and six non-bank quasi-banks.
The share of this market in the total volume of money market transactions markedly increased in 1982 with the operation of the dealership network of these 15 financial intermediaries. In the same year, new treasury bills at competitive market rates were issued to replace maturing CBCIs. Between 1982 to 1988, the share of this market averaged 17 percent (Table 10). During the 1984 financial crisis, the total volume of transactions involving government securities more than doubled from the previous year's level, owing to the attractively higher yields of these instruments which were intended to moderate the liquidity expansion at that time. From 1983 to the 3rd quarter of 1986, the Central Bank both auctioned and negotiated the sale of primary government securities such as the CBCIs and treasury bills. In the 1980s, the dominant share of this market, particularly for treasury bills, provided monetary authorities a medium to influence the rates of other instruments in the market.
Based on their average share between 1983-1988, the biggest investors for government securities, are private corporations (29%); commercial banks (17%), and individuals (13%)( Table 19). For treasury bills the top three investors are private corporations, commercial banks, and individuals ( Table 21). For DBP bonds and other government securities, the top investors are private corporations, other banking institutions, and commercial banks (Table 22). The phased-out CBCIs have attracted investments from trust pension funds, government corporations, commercial banks, private corporations and private insurance companies ( Table 23).
C. The Foreign Exchange Market
A total of 20 currencies comprise the basket of foreign currencies traded at official rates in the foreign exchange (FOREX) market. Of the 20,12 form part of the official reserves of the Philippines led by the US dollar.30 The US dollar is considered the major currency mainly because of the traditional ties of the peso to the dollar. After the shift from a fixed foreign exchange rate regime to a "managed" floating rate in February 1970, the US dollar became the major currency for intervention by monetary authorities in the foreign exchange market.
Trading in the foreign exchange market involves both forward and spot transactions. The peso-dollar exchange rate is based on the results of the previous day's trading participated in by banks at the FOREX Trading Center.31 The rates of the peso against other currencies are based on the rates in New York as well as the existing peso-dollar exchange rate. Beginning in the 1970s, the Central Bank exercised direct control over the movement of the peso against the US dollar through intervention at the trading floor. Starting in 1972, there was a marked increase in CB intervention. Pante points out that as a percentage of foreign exchange transactions among commercial banks, CB purchases and sales of dollar increased from 9.4 percent in 1970 to 60 percent in 1972.32
30 Currencies as official reserves: US Dollar, Japanese Yen, Pound Sterling, Canadian Dollar, Swiss Franc, Deutsche
Mark, French Franc/Dutch Guilder, Austrian Schilling, Hongkong Dollar, Singapore Dollar and Belgian Frank. 31The CB allows all authorized foreign exchange dealers to quote spot buying and selling rates by a certain percentage
below and above the guiding rate. The guiding rate is the weighted average Oi" the rates for all sales made off-floor at the trading center and is posted daily at the beginning of each day.
32Filologo Pante, Jr. "Exchange Rate Flexibility and Intervention Policy in the Philippines, 1973-1981," PIDS Staff Paper 83-01 ( February 1983): Philippine Institute for Development Studies.

36
c o o i o i N C T o r ^ c o o i - o o o o 3?
(M T- O O O CM i- CO co «o o> Sr-. (O a>
E D £
SK ^ W O ) o n oo n 1- O CO oq rv. eg gicb^cMgitbobiriinin 1 1 5! 5 9 ? 1 ® o n o c o o t b o o T f i n N N O O l N W S N R I V n 00 CO t— NCMi-r-
3 <0 £ S fsgp CO CO Tl" o>
•*»• O i -W O N S I O S oo h-<N
In co
I < q i o a o q ( O N q n * o ( ® » t - i - C M .o ! o> o g> cMdcncococMcucMcgdod B®- ! t- i- m
N to <J> a> E J3
5
a>
co z o o
z £
t* b ffi = oo Cl a> 13 Geo UU 00 W 0>
3? co oo o>
® E o >
a? m co o>
"5 L_ O) co a. Z CO CC HI
si. Sfe
© E 3 £
3S
® E 3
n oo o> a> E 3 £
CM 00 r - s
s co i n
CO CO
CO j— CD CD CM s? CO
w s w i t o N i n i o n n s f J I P S N N ^ i - N t - b w C M i n m c d i v ^ d d d ^ i n n u j f f l ( O o o o o < D O ) i M O C O O O I V N O N S y- tT> co co co co co co
t O O N N O r M N O r d T - ' c i d c i CM CO
CM cb oo op CM CM ^ o in r in OONCD CM CO (J) ^ CO o
CO 00 Tj- CO CO o> CM CM (D O r O) S f OIC e o n t D a m o i a i O M
co co co a> -r-CM CM 1- in
s o i N ^ s s n o i N r ^ i n q q o b^riflovicDMd^Nodd CO
s T t c 0 T r c p i o i r ) i - c \ i c 0
' O in co cd <d o W N W (\l t r- T™ (O (X)
O 0)0(0 r W T» N N Oi ®S883S« co r- m (o cm T- W T"
S8 CM
in
q<p«5voqiqccinw(MNOOO ^ c o i n a o c M c b d i n o d c M o d d i - r ( \ l r i-
TjOincpr^-gjmincD'i-coT-cooi ® ^ O O) W r SgSK00®^ CM CM in
1- ^ o
i n ^ c o c q c ^ i - i - m c M i o a ) o o o b o o i n ^ d ^ ^ o o c o «- CM " i-
CO CM <D CM in •» t- w o) r CM co oo i-CM CO
$ SffSfc »— <o
CM
EM CM
o> ®
s o
o ! ° i I I I I o ; i in i 3 ! ^ >
o o
CO oo
s i n CM ai
8
S K oo ff
o o
00 CO o
5 o o
2 o> in 5
I T- CM
s| |5
J § 8
— - M i h . h
gllaJJIIJIail o r-' ^ (D if U) (O N flD Oy T* i" ^ T- — ^
So <n
o
s I
1 s A o
1 E •s
"E <3

<o z o & < co z < tr
"a
£35 I— £E o
o UJ <M CO
ID £ £E O LU 111 > CL o f-& O <9 UJ 2 Z> _i s
mi s > a S a. g s cc = ~ E 8
CO 00 a 0) £ O >
8 | "5 >
$ ™ ® £ £ _3 5
5
I 2 E 3
I
S d> 2 E _3
5
it-CO lO CD
IS CM
I = m m CD O
3
O C B O o ui ®
o w n CO CO 00
18
o cm o ©
o 18
o co <M O 3 L0 10
00
U)
s? 3 8
q
s
8 if CM c\i N o ui <p CM Tf CM CO co co
oo o
CO CM
OONO d d ^ o
CO O I 1- CM ' ID Si CO
8,*
© CO 00 00 oo r-» a> co m o o d O l O N i -ID CO ^ T-
O 00 CO Q s N O N CM f C» O (0 T-to o> " id
<o co oo ui ai r-. CO U) to CM co o>
co oo a> o • ^ 0 0 ° U) ^
s o> ! 2 ' .2 Q.
I t J3 O m | ^ • <0 (0 i o s ctt a>
s^ \ S P fi c ,o
I ? ? ! '•w o £ Q_ ®
(0 ^ s
(3
- m o m H t - O y,Q
f » C rtj ! | o ra E E
co i I I3 2i
w z ^
p OT O i s H ® IS"
^ a f i CM m o a. ® > I— c s £ w 5 E
f o LU
UJ ( -
D £ g
a. a.
a a> o J£
a O
•S o 8 -O
3 O co
U l O U l O f f l N O i - ^ N W I O N ^ O
CM i- CO . O
I ^ a a E
W ^ o ^ w i n t q o j N i n o o i N q w o N CM ui co r r* <0 cj ir op ^ ^ i/i ui ui <p
I ( o i o i S d i B r o t H
s i 3
5
a>
d - r ^ ^ c M d ^ c o c M C M c o c o ' c o d d o
•OOCO(OCOOOi~U)'<CMr<>U)CMCM'4'
SJ^cm^^COSCSSCTCO ^ P) ^
CM o
• s
o s s o m a i s N o ^ a i i i i i o o a i i n S' N N t f i d f f l N ^ N a d N N O O I > ) N 9 S i - N C O M C O O
I i s s l 5
gw^wob
i I-• 5
O L ^ R J ^ N R I P F L T J P J ^ T O i - C O C O O O U ) M r O O r ^ ^ O ^ • f—
t s S S S i s S S K S ™ 0 5 ^ ^ g C? ^ w ? !gr" - §
i co K CO U) O IS O x I gjis S ^ ° ^ ^
s I 5
3 a o> E 1 3
5
^ o; <0. K o I j CO a CM
CM o <0 0) o) co 00 W O O r U) O
CM O 10 o d 00
(D P r d d ui lo o
§
SCO o o V- T- ^ O ^ LO
CM
O 8
U) & CO
o s CM ui CO <0 CM
s q ^ i p a n i a v o i n a ) ^ O » N I o rt t- s .&! 5 s ^ d s ffi
U) CM CM 9
i s i k f 0 ^ S > O = CL O -E
c ? - - o e C m ^ S ^ i > s | g ® c Q (3 I
I ro >• ra <3 j- .r l. C
37
1 s •c a s €0 ®
! «
® c •5. a.
fl "5
o c a c is
« o

38
co z 0
1 CO
cc =5 O LU CO
LU " f t
EC UJ • > § IT LLI
CM X
5 O O S < W O z ° i tn I 0- ' M I O LL o M 5
g
i O)
£ £ O ® fee UJ o > j= S E u. c O •=• HI A.
S • 8 E I
' E 1 3
5
ss
i !
5
M Si 8 i 8 E I .2 ! 5
as
8 E 5
S ® O> |
§ 9>
o i f l ^ r i t B ^ n i d d ^ o d d d © T- ui o
N n M V ) < o n u t t o | N a o K O gjOW^ioKS^iniiSNn S s ^
<O CM <O. I ^ ^ N Q Q O R A W I - I - M O m N g C M O u j o i ^ r ^ o W d o d g
N o i o N d o x p N n c t i ^ n q o e i u i i s i i i i i u s s * N S I O R CM
CM
o j N r ^ q ^ n i q i D M i p i D N O i -t - V f -
N^^T^Noioja jeov^aj ip ioN OfflWfi W 00 T- N 00 ID O)
t K i N O N U l ^ r ^ q T ; CM CO
^O^ISIAIfiOIOOOlAOOO jj tt y? w CM i CO
R>- CM CM IN OOr-NNS to co -<r
i D r i o ^ u i g j o d d d s o
(Ocqcqi-M'4-m(oo>cMO>(3>n I 2 r n ® I T 00 T- ^ in
CM
15
o
§
co O
O 8
CM 8 CM
w co eg o ro R^ ri o' o' CM
IS CM CO CM CM 1 - CO N
Mi o
Is CM
ID ®
£ "C Q.
i $ .1 4 s f S I
1 1
I
O E
<3
3 E A O
is
•a <8

I l l l l l t l l l t l l i l l
TO § s
f a ? 8 « P o CM _ C- C E O W O
u. £ c O I L ® QJ O Sui 3 0. p f
! I •
5
3
£ •
: i I
5
I I • , 2
5
l < l l t l l l l l l * l t * | |
1- 0» 3 *
r--cn
o
i i i i
IA d
s CM <4
8
u> 3
i i • i i
CO 00 O)
oiiti/i
O CO. o r-! <o • i i
CM
<O •»» CL I/) CM N R. o ^ g o ^ oo t- rr
i i I I
s
«
s <D H- M O P) LO O CM
SE55W S 9 ^ a T- CM
N. P » Q S ID O CMooddW^dcM
•v m © co
o
S (0
«o 10
o s
s 1 I s l H £ £ i i i i P i i c ! { c q O >
. o T- CM n ^ in to

40
For the rest of the 1970s, monetary authorities adopted the official policy of defending the peso against the dollar, a task quite formidable given the persistent current account deficit experienced by the economy during the period.33 Devaluation ofthe peso was allowed during the period 1973 to 1981 but at a minimal rate. Between 1973 to 1981, the peso depreciated by only 20.1 percent compared with 64 percent between 1970 to 1973. Much of the effort to prop up the peso during the period, characterized by a balance of payment difficulty due to the 1973- 74 oil crisis, was focused on the massive foreign borrowings by monetary authorities. These were intended mainly to build up international reserves in order to shield the peso against undue speculation, given a worsening current account balance. Bautista explains that authorities adopted this policy because of the scare brought about by the unexpected current account deficit in 1974 and the perceived instability in the world market at that time.34
This resulted in an overvalued peso which penalized exports but rewarded imports, thus further aggravating an existing current account deficit. A drastic devaluation was inevitable when the country experienced a severe balance of payments crisis in 1983. Between 1983 to 1984, the peso was devalued twice mainly to discourage imports. Likewise, several exchange rate control measures were imple-mented. Among these were —
1. Requiring all non-bank, authorized foreign exchange dealers to sell to the CB US$100,000 a month;
2. Instituting a dollar pooling scheme for priority uses by requiring all banks to sell all dollar receipts to the CB;
3. Imposing a 10 percent excise tax on all foreign exchange sold by the CB or any of its authorized foreign exchange dealers; and
4. Giving banks access to the CB's special credit facility for sales to CB of any of the acceptable foreign currencies and/or deposits of US dollar notes.
The CB also imposed stricter standards in approving all foreign borrowings and guarantees limiting these to high priority projects, refinancing of maturing obligations and working capital only for overseas projects. Allowable foreign exchange given to Phifipine overseas companies were reduced and debt obligations by the private sector was monitored by requiring the companies to submit monthly reports on all foreign obligations.
The 1983- 84 BOP crisis unmasked the inherent weakness of the peso vis-a-vis the dollar. The Philippines was no stranger to unfavorable trade developments in the 1980s since the country also experienced balance of payment difficulties in the 1970s. The only difference is that in earlier periods the peso was artificially strengthened by a strong capital account.
Not until the 1980s did speculations on the peso-dollar rate became more evident given the pattern of continuous deterioration the exchange rate underwent. Starting in 1980, the strong dollar, the recession in most industrial economies, and the country's debt service began to exact a toll on the country's reserves. Monetary authorities tried to stave off speculations by steadily but gradually
33CB Annual Report (Manila: Central Bank, 1971). "Generally, the Central Bank (or an agent acting on its behalf)
stands ready to provide foreign exchange at the current rate to maintain the stability of the exchange rate." 34R.M. Bautista, "The Balance of Payments Adjustment Process in the Philippines."(Paper presented at the UNCTAD/
UNDP Round Expert Group Meeting on the Balance of Payments Adjustment in Developing Countries, 1978).

41
allowing the peso to depreciate. Debtors and traders sought forward exchange cover through swaps. Financial intermediaries notably commercial banks, also participated actively in the market. Table 24 shows that the total amount of dollars bought from the CB exceeded dollars sold in the future exchange market indicating that banks were profiting from the dollar trade. In effect, the CB was providing dollar subsidies to these banks.
Realizing the futility of further defending the peso as well as the need to let the peso seek its real value, all exchange controls were lifted in 1984. The CB also finally stopped accommodating forward exchange covers due to heavy losses when a brief unrestricted trading sharply depreciated the peso from PI4.002 in October 1983 to PI 8.002 in June 1984.
Developments in the foreign exchange market also influenced measures in the money market. The intensified marketing of CBCIs and lately T-bills, a strategy used in 1983-'84 to mop up excess liquidity, was adopted partly to minimize speculations on the dollar. At present, however, the CB still exercises the option to intervene in FOREX trading as a measure to maintain the existing rate and/or prevent severe fluctuations in pursuit of monetary and economic targets.
D. Key Events
In the early part of 1981, the Philippine economy experienced a major financial crisis wnen Dewey Dee, a prominent Filipino-Chinese busines sman, suddenly fled the country leaving behind P635 million (or 2.7 percent of the country 's money supply) in unpaid debts. The sources of these debts were unsecured loans from several financial institutions, overborrowings from the money market, and loans from foreign banks with Central Bank approval. When this scandal surfaced, public reaction was instantaneous: money market placements were preterminated and deposits withdrawn to be placed in what were believed to be safer repositories such as local branches of foreign banks. In the wake of this crisis, several institutions that had actively participated in the money market went bankrupt. Subsequently, there was a decline in the commercial paper market and in the importance of investment houses and financial institutions as money market institutions. On the whole, however, the volume of money market transactions still grew by 8.5 percent in 1981 which was slightly lower than the 1976-80 average growth rate of 12 percent.
The most recent economic crisis occurred in 1983 when the Philippines experienced severe balance-of-payments difficulties. Although this particular BOP crisis had long historical roots, it was the Aquino assassination and the Central Bank disclosures on international reserves that precipitated the crisis. During this period, international lending institutions ceased further lending to the Philippines and called in their maturing loans in the second half of 1983.
The monetary sector's response to the crisis was generally restrictive and deflationary. Reserve requirements were increased, the Central Bank rediscounting window was practically closed, and the CB bills which carried relatively high interest rates were introduced to help mop up excess liquidity. Although the unprecedentedly high rates offered on these bills seemed to have arrested capital outflows that might have put further pressure on the peso, they induced high interest rates in the whole system, resulting in massive decline in trade and inventory financing.

I dc
8 LU <
1 0 CE
1 -t o CM I L .
• u.
I— Hi
§ O
<
m c
o = DC .E 111 — S 2 O o
V) I-D O
co 3
$
£ (D o>
£ O)
CO o>
s O)
CO o»
1
£ OS
CO &
IS! <0 L, CM
1 in
$3 2
o t-. r-. cm co 5 8I CM
fSJS m y-
a> o» 5 5 o ao r- -<t
m cm
i- « n a
3 CD 0> CVI O IO CM
CO
s a>
(O o £ en m n co eo
s so CO in
s i i
s 5 co
co <p _ 5 g JNJ
in oy at
I
i- CM
43
IV. EFFECT OF POLICY ON PERFORMANCE OF THE MONEY MARKET
In this section, specific policies implemented during the period 1975-88 are related to the behavior of the money market as reflected in the data. To facilitate the analysis, relevant figures were summarized into various performance measures which were based on those recommended in the terms of reference.35 How these performance measures were computed are discussed in the next subsection. These numbers were later subjected to statistical tests and qualitative analysis. Based on the results of these exercises some broad conclusions were made on the effect of policy on the efficiency and stability of the market.
A. Performance Measures
Money market behavior was analyzed along two dimensions: efficiency and stability. The former was evaluated in terms of whether the interest rate of the principal instruments in a given market moves in consonance with some reference interest rate, and whether the spread between the reference rate and the particular market rate was consistent with reasonable differences in risk or transactions cost.36 A more rigorous definition states that a market is considered efficient when prices and interest rates of money market instruments correctly reflect available information.
In order to identify a reference rate a unit root test is applied to the rates of various instruments. (The test and the results are presented in Appendix 3.) The first difference of those rates that were determined to have unit roots were then checked if they exhibited a pattern that closely followed the assumptions of independent and identically distributed error terms (i.i.d.). The objective of such a combination of tests is to determine whether the behavior of a particular market follows a random walk; if such is the case, then the market would be considered efficient since a random walk indicates that all information is being fully utilized by the agents involved, effectively discounting the possibility of arbitrage resulting in economic profits.
Many rates were considered as the possible reference rate, namely, the 91-day treasury bill rate, the interbank call loan rate, promissory notes (selected maturities), government repurchase agreements (selected maturities), and private repurchase agreements (selected maturities). While several rates qualified as the reference rate, we decided to adopt the 91 -day treasury bill rate for this purpose for the following reasons. First, it is the most widely quoted rate, with bankers using it as a basis for setting lending rates. Second, government-issued securities are mostly in the form of 91-day treasury bills. Lastly, in different econometric studies concerning the linkage between real and financial sectors, it is the 91-day treasury bill rate that has consistently turned out to be a significant transmission mechanism.
A direct measure of operating efficiency is the spread between the price of funds in the market under study and the reference rate. If r is the market rate, the spread is computed to be r - o where d is the reference rate. We computed the monthly spreads for a selected subset of instruments and then computed an annual average equal to [«(r - S)/12]. We termed this measure the average spread.
An indirect measure of operating efficiency is liquidity. A market for an intermediated instrument is considered liquid, or deep and broad if it has many suppliers and borrowers over a wide range of prices. We simplified our analysis by using as a measure of liquidity the monthly range of interest rates, averaged over a whole year. The range is defined to be the difference between the highest rate and lowest rate accepted by the seller of the instrument.37 We termed this measure the range average.
35 "See Program on International Financial Syslenis (PIFS), May 1988. Definition obtained f rom Cole, Slade e t a l . (1990). Most of the rales presented are those of primary issues. Thus high and low rales are bidders' of fers accepted by the sellers. Technically,
this would not reflect a high and a. low rale for a particular transaction but ralher for a particular period of l ime.

44
In the subsequent analysis, however, it was observed that this measure could also be an indicator of the stability of the market especially since the range, like the variance, is a measure of dispersion.
A second indirect measure of operating efficiency is the concentration of financial institutions in the market. A small number of financial institutions in the market would reduce efficiency by permitting collusion in the pricing of financial services. We counted the number of institutions that held approximately 55 percent of the market share and compared it across time.
Stability was relatively difficult to measure for this study. The use of variance in the price and volume was suggested as an indicator of stability, with a smaller variance indicative of greater stability in the money market. However, data on the variance of a particular instrument's rate over a monthly period was notreadily available. An alternative was to compute the variance across the 12-month period although such a figure is of limited usefulness compared to an average monthly variance.
B. Data Analysis
The effect of policy. At its inception, the money market was allowed to develop in a rela-tively unregulated atmosphere until its rapid expansion was deemed detrimental to the growth of the real sector. Beginning in 1973, the money market was subjected to various regulations and controls culminating in the CB policy of 1977 wherein the different instruments were slapped a 35 percent tax and ceilings were imposed on the interest rates of deposit substitutes. It has been hypothesized that controls on pricing within the money market will decrease the efficiency, but may increase the stability, of those markets.
This hypothesis cannot be effectively tested due to lack of data for the period 1975-'81 (in fact data for 1981 is missing for almost all instruments). However, data for the years when these were available are presented in Table 25. It should be noted that the range average declined markedly from 1975 to 1977 and again from 1977 to 1980. Granted that the range average is a measure of liquidity, the downward movement in the figures implied a narrower band within which interest rates fluctuated and hence a decline in efficiency. But this analysis is not supported by the direct indicator of operating efficiency which is the spread average.
Looking at Table 25, the figures for 1977 and 1980 are smaller in absolute value than those of 1975. Assuming that these years are representative of the general trend, it would seem that efficiency in the money market generally increased. But such a conclusion may be misleading since even the 91-day T-bill rate experienced a similar decrease in its range average(Figure 2.). One may surmise that the repression prevailing in the financial system at that time led to a general narrowing of the range within which interest rates could fluctuate, whether the latter were from an efficient market or not.
The range average could also be interpreted to mean that there was greater stability in the market. This is likely since this measure experienced a big jump in 1982 compared to the figures in 1980 as can be observed when comparing Table 25 and Figure 3. Right in the middle of these two years is the occurrence of the Dewey Dee crisis (as described in Chapter III, D). It is highly probable that the scandal induced greater instability in the market which is then reflected in the data.
However, slight complication is posed by the fact that it was during the same year of the financial crisis that the Central Bank began implementing its liberalization program. While this may have also contributed to the significant increase in the market's instability, theoretically efficiency should have also been enhanced. Following the definition of a liquid market and its relation to efficiency, the rise in the range average could also be attributed to the increase in efficiency. The latter

45
TABLE 25
SPREAD AND RANGE AVERAGE BEFORE 1981
A. Spread Average
Instrument 1975 1976 1977 1978 1979 1980
1. Interbank Call Loans 1.362 1.225 1.076 -0.397 1.319 -0.266 2. Promissory Notes (Demand) 4.306 - 1.690 - - 0.072 3. Promissory Notes (1-7 Day Maturity) 2.228 - 2.432 - - 0.621 4. Promissory Notes (8-15 Day Maturity) 3.060 - 1.358 - - 1.216 5. Promissory Notes (31-45 Day Maturity) 4.519 - 1.972 - - 2.726 6. Gov't. Repurchase Agreement (Demand) 4.870 - 2.177 - - 0.154 7. Gov't. Repurchase Agreement (1-7 Day Maturity) 2.294 - 2.610 - - -0.279 8. Gov't. Repurchase Agreement (8-15 Day Maturity) 2.431 - 1.969 - - 1.767 9. Gov't. Repurchase Agreement (16-30 Day Maturity) 3.657 - 1.167 - - 2.143 10. Priv. Repurchase Agreement (Demand) 6.009 - 2.793 - - -0.270 11. Priv. Repurchase Agreement (1-7 Day Maturity) 4.036 - 1.107 - - - -1.621 12. Priv. Repurchase Agreement (31-45 Day Maturity) 5.298 - 2.958 - - 3,193 13. Commercial Papers (Non-Financial) 5.441 3.904 2.668 0.537 2.084 3.923 14. Commercial Papers (Financial) 4.252 4.307 3.094 0.383 3.143 5.277
B. Range Average
Instrument 197S 1976 1977 1978 1979 1980
10.096 11.118
1.644 2.388 4.445 8.900 2.746 1.488 1.634 6.755 1.499 2.792 9.530
10.804
1. Interbank Call Loans 2. Promissory Notes (Demand) 3. Promissory Notes (1-7 Day Maturity) 4. Promissory Notes (8-15 Day Maturity) 5. Promissory Notes (31-45 Day Maturity) 6. Gov't. Repurchase Agreement (Demand) 7. Gov't. Repurchase Agreement (1-7 Day Maturity) 8. Gov't. Repurchase Agreement (8-15 Day Maturity) 9. Gov't. Repurchase Agreement (16-30 Day Maturity) 10. Priv. Repurchase Agreement (Demand) 11. Priv. Repurchase Agreement (1-7 Day Maturity)
' 12- Priv. Repurchase Agreement (31-45 Day Maturity; 13. Commercial Papers (Non-Financial) 14. Commercial Papers (Financial)
12.357 13.800 38.821 15.111 30.000 10.333 22.357 15.111 19.107 14.106 32.786 13.778 20.518 5.361 13.821 7.722 15.221 7.750 38.143 13.611 28.861 8.367 17.786 9.409 26.357 22.636 15.036 12.525
Source of basic data: Central Bank of the Philippines.

46
Figure 2 91-DAY T-BILL RATE RANGE AVERAGE, 1975-1988
:;: \:;i I! I i; Liliii 0 Li-iliiiiiJ;. iiiiiii ii\iiiiiA iliJi l; ; jiii-iii iiiii -iii jiiiiiifi iili iiiiil iliJlLLiil=J.: IV' ;!: •=• W v RANGE AVERAGE: 91-DAY TBILL RATE :v ;.-v ; • r r ' : ' :'
iilllhiiiHHlihiillljiiiii
l i i l l l l l l l l "i 1 1 i i 1 1 r T 1 ~~r 1976 im la/7 1970 1979 1960 1981 1982 I98J 19(14 1905 1963 1907 1900
wm:i::MMMmmmmm*mm MBzmmz mMmmmmmmmmmmmrn'm
H i ! i i H i e ^ ^ M i i i S i i i i i i i M i i i w
* 1984 data oased"on Jun-Ju l L9:J6 data basa l on Oct-Dec
Source of basic data: Central Bank or clic Phi l ippines

Figure 3 RANGE AVERAGE, 1982 - 1988 47
RANGE AVERAGE.INTERBANK CALL LOAN RATE
, r YEAR RATE
1982 19.8333 1983 26.7083 1984 50.6667 1985 35.4583 1986 20.0455 1987 18.3229 1388 23.6603
; I RANGE AVERAGE: PROMISSORY NOTES (Demand)
I'1--.- YEAR RATE
1882 24.5417 1983 28.9063 1984 52.8500 1985 37.2500 1986 22.0455 1987 17.8342 1988 21.9671
RANGE AVERAGEiPROMISSORY NOTES (1 - to 7 - day maturity)
• i •••• '
YEAR RATE
1982 14.8937 1983 16.6086 1384 28.5494 1985 25.0833 1986 16.8045 19S7 9.4747 1938 7.4896
u J.
m • l l l l f
•: RANGE AVERAGE:PROMISSORY NOTES (8- to 15-
' : \ /r A n nc.Tr •:•:!; ill wmm ^ky}
I f
YEAR RATE
1332 15.0125 1983 18.4093 1984 28.5271 1985 7.7569 1986 2.9722 1987 2.5000
1.4286 l iJU/
; 1988
I I I ! l l t t
iii&i i||||| 111!
i&K" •:•;:• 'Yj •" _
MY:-1 Y: ":•• •• v x-Y NW' YYH SY':. .= •• 'YYY .iivYYiYY-i ' i " i ' t ' I ' i ' [ ' i t i ' i l i ' i - - - - • • •• - - - - - y - . • . . . . . . . . . ., . . • . ; - ;- : • •• •-• • • • : • • • • . • •• . • •
Source of b a s i c d a t a : C e n t r a l Bank of t h e P h i l i p p i n e s .

48 W!
Figure 3 (continuation)
' ' [RANGE AVERAGE:PROMISSORY NOTES (31 - to 45- day maturity) i .
W
YEAR RATE
1982 14.5400 1983 16.1583 1984 27.0412 1985 14.1154 1986 9.8973 1987 6.2646 1988 4.3542
IMS tfiiili&iili ' j'.:.! i
Ill iiisijiH
mm m
SiiiiiiiSii! i i l i i jlli;:'-;";; jijijli-iiliili H iKiiii • l i i
u'Sli RANGE AVERAGE:GOVERNMENT REPURCHASE AGREEMENT (Demand)
' " y e a r r a t e " 1
I;.';',;. j:<S;S
•iiif | | |
I l l MM mm
I
1962 17.5000 1983 24.5833 1984 45.1667 1985 26.5000 1986 10.2917 1987 0.8929 !!!!$j 1988 0.9643
m m m m r n m r n m ^ m m i m m m m m m m m i m i & iij RANGE AVERAGE; GOVT. REPURCHASE AGREEMENT (1- to 7- day mat.
r |I|li{ IfInfTTnt=HSI M w M^ t ; " -!: ? n - >:; """IHTnU?! H li ri. i! H -"MIM"!-:tH f H! HKH - Kl ""M H; itl fif=f i iiM M—il Hi H Uil M Ht H iUt WH |
| Sii i
YEAR ;
RATE -
1982 8.4715 •: •. : •. :
1983 8.7509 1984 16.0490 1985 2.0000 [•If;-!;:-:
I:1:!:!:?!? 1986 0.1166 1987 1.0000 • . . .
1988 2.0000 . . . . .
YEAR RATE
1S82 5.8125 1983 8.4163 1984 17.8875 1985 11.0000 1986 0.6580 1987 0.1000 1988 0.0000
RANGE AVERAGE;GOV'T.REPURCHASE AGREEMENT (8- to 15- day .,,..,.,......... _ _ , ..,, •
111!!
111
..
111®!. m
| | l II:

Figure 3 (continuation) 49
• c d RANGE AVERAGE:GOVT.REPURCHASE AGREEMENT (16- to 30- day mat.)
• YEAR RATE
1982 6.6883
SHHi 1983 7.4817 1984 13.6892 1985 4.2292 1986 2.5375 1987 0.2813 1988 0.3571
.v . . ; .
RANGE AVERAGE.PRIVATE REPURCHASE AGREEMENT (Demand)
^ ' " y e a r
l l i
1982 1983 1984 1985 1986 1987 1988
RATE
15.0833 23.2396 29.7087 23.7500 13.9000
1.2500 4.5000
m M i Jill liliiilii lijiHiiiii:;! l i l '
ill
'll!!!!{! RANGE AVERAGE:PRIV.REPURCHASE AGREEMENT (1- to 7 - day mat.) imVww
i l l ! mi' mh
Itll
f f iWl /EAR'
1932 1983 1984 1885 1986 1987
R A T E
4.2309 5.2015 2.8250 9.5833 6.1429 0.0000
jpiilji
a ;a w IS: III® l i i
iiiii;!:;;;;;: Ipliii;
SSi i i lSWi i i l l lS I I . " ~ ~ ~ " " w x i u i m m m m m m m a a m m m m m m B m m M m m
l i t iiH!;ijiil{Hi' Hiiil i i lM
Sill

Figure 3 (continuation)
m m — n M M H M M M B B a M B AVERAOErCOMMERCIAL PAPER W/O RECOURSE
iiii;;;;:
YEAR RATE
1962 18.5952 1983 19.6250 1984 16.0833 1985 4.9167 1986 0,0000 1987 3.9840 1988 6.6580
l i B S I f S t i l l H I p B !
l l l l I-:-:-:;:.:;:
iNUfc. AVbRAGE:COMMERCIAL PAPER W/O RECOURSE (Non-Financial) : "" ••:•"• : 7 & • • • • • - ' - • •ah^.-WA:• : • . v ^ . v - Y "
i t ! YEAR RATE
1982 1983 1984 1985 1986 1987 1988
16.0173 12.6250 23.0833 25.3187
8.8125 8.0167 8.6231
iiijiiii®
liiiH
m
_ ii

51
could also be gleaned from the relatively low spread average for instruments with an on demand maturity.34
From this discussion, we conclude that the range average is both an indicator of stability and efficiency. As for the spread average in a regime of controlled interest rates, this measure ceases to be a reliable gauge of efficiency. One could also look at Figures 3 and 4 and observe data points during the crisis year 1984 for instruments with on demand maturities. There is a high correlation (albeit negative) between the spread average and the range average.
Thus, far adequate evidence has been presented to support the hypothesis that controls on pricing will lead to a decline in efficiency but an increase in stability. During the time that the money market was effectively regulated, the range average declined. After the liberalization program in 1981, the range average increased and this was accompanied by low values for the spread average.
Further support for this conjecture came from the cointegration tests using the reference rate and various market rates. If two or more variables are cointegrated in the sense of Engle and Granger, there would exist an equilibrium condition among them.39 Table 27 shows the result of the cointegration tests. For almost all rates, especially for those with on demand maturity, and when using all years with available data, market rates were found to cointegrate with the reference rate. If the sample period is divided into two subsets, one before 1981 when financial reforms were introduced, and the other after 1981, mixed results were obtained. The latter shows that a market rate may not have been cointegrated with the reference rate before 1981 and cointegrated after 1981, but not the other way around. This outcome lends support to the hypothesis that distortions were introduced by the imposition of interest rate ceilings and other forms of control. These, however, were reduced with the introduction of the liberalization program.
In 1980, the Central Bank fundamentally altered the structure of the financial system by introducing the concept of universal banking. By imposing a minimal capital requirement of P500 million to qualify as a universal bank, this reform effectively regulated the number of participants and granted a privilege to a select group of financial institutions. The original objectives behind this promulgation were to reduce specialization, eliminate market segmentation, increase allocative effi-ciency, and enhance the stability of the financial system. It is hypothesized, however, that operational efficiency will decrease with the potential oligopolistic structure. In this case, a more appropriate measure of efficiency is the concentration ratio defined earlier in this chapter.
Table 28 presents the list of specific financial institutions that comprised 55 percent of the market share in trading account securities.40 It can be seen that in 1979,14 institutions contributed to 55 percent of the market share. In 1985, the list was pruned.down to eight and the figure reached a low of five in 1987. What is more striking is that investment houses and financing companies were eased out completely from the picture from 1985 onward; during the recovery years of 1986-88 universal banks dominated the scene. Judging from this data,it can be concluded that to the extent greater concentration is a measure of less efficiency, there has been a decline in operating efficiency in the money market. The effects of such inefficiencies have also been alluded to in Chapter II.
We choose to emphasize the behavior of instruments with an on demand maturity since these accounted for more than 60 percent of the transactions (Table 26). One could also observe from the graphs in Figures 3 and 4 that during the period 1982-'88, these instruments generally behaved in the same manner.
39R.F. Engle and C.W.J. Granger, "Co-Integration and Error Correction Representation, Estimation anu Testing," Econometrica 55 (March 1987):2.
^Due to data limitations, the only figures presented are for the years 1979-'80 and 1985-'88. However, these may be assumed to be representative periods since during the 1981-'85 period the financial sector experienced a number of convulsions.

52 Figure 4
SPREAD AVERAGE, 1982 -1988
SPREAD AVERAGErlNTERBANK CALL LOAN RATE
ili--:;-:-:"
Hivijl'
I;!!;!!!!!! iilH!
SPREAD AVERAGEiPROMISSORY NOTES (Demand) :
jlliijlilljlj YEAR RATE
1982 0.S076 1983 3,8548 1984 -0.7331 1985 -8 .0725 1986 -4 .2906 1987 -2 .9047 1988 -1.2698
;!!!;!!!!!
. ,
Sii:;;::
MM
iilii: -i
SPREAD AVERAGE:PROMISSORY NOTES (1- to 7 - day maturity)
I I i i ! l YEAR RATE
1982 0.3593 1983 2 .9279 1984 -1 .2822 1985 -3 .0406 1986 -1 .1797 1987 0.1037 1988 -6 .1987 1111 . . . .
111!
1 1 1 §!!!!
Jiiiiiifj!!:;
l i l l
ill® mm 1 1 1 ilii fclK ® § i
mmtemimwm*
VjuS' SPREAD AVERAGE:PROMISSORY NOTES (8- to 15- day maturity) -Vv : "?:i:hi:MUL=iJi"i"I-I="=i;i:i!«*;• I'==":
YEAR RATE
1982 1.2645 1933 1.437ft 1984 -5.5721 1985 -7 ,0272 1986 -4.9031 1987 -2 .5684 1988 -2 .3189
SlElSiliiiS?
jjjll i l l I I I
ill i;i(|il|!ll« & .. :.:'
: :::
,...-•..•-.,. : —LJ. J " j l . . „ — . : ._l — — " ' • • ' l :—1—!—• • ource o f b a s i c d a t a : C e n t r a l Bank of the P h i l i p p i n e s .
I I
i i i

Figure 3 (continuation) 56
SPREAD AVERAGE: PR OMISSORY NOTES (31- to 45- day maturity)
YEAR RATE
1982 2.5438 1383 1.9020 1984 -3 .8853 1985 -3.3601 19S6 -2 .8575 1987 -1 .3620 1988 -0 .7385
iiiif®
III! v . : *
III! i r ^ iiiigiil
[SPREAD AVERAGE:GOV'T.REPURCHASE AGREEMENT (Demand) Jill iipiSi
•i::;:; liil; IIII
•!l!i!i!i!!!l!
YEAR RATE
1982 0.0088 1983 3.6687 1984 -0 .7162 1985 -8 .4082 1986 -0 .2060 1987 1.9571 1988 3.9087
IlijililM ill:"' "'
iliflfllll=Mf ==!=1«==i
iiiii!!!
,m • • • . ! , . . . • . . .
: •: : SPREAD AVERAGE:GOV*T.REPURCHASE AGREEMENT (1- to 7 - day mat.) j :
y e a r r a t e l i l i ! ! !
$ ! ! ! .MHHijj
111! Jiiiiii
1982 0.4220 1983 2.1961 1984 1.5833 1985 -3 .1850 1986 -2 .0476 1987 1.0127 1988 5.1500
BM i i i i i
111 tfittii:-::-: li^sM :=!=!: j'S'lilii !l!!!!!!!i!|!il m
•••'.: '.. v.-: « SPREAD A VERAGErGOVT.REPURCHASE AGREEMENT (8- to 15- day mat.)
. i - l . ! - ; . . ! . B f . . •• ^ n • .T. , . i i . .
YEAR RATE
1982 0.6170 1983 0.8506 1984 8.1964 1985 6.2190 1986 -0 .7580
\ 1987 1.3022 1988 2.4250

Figure 3 (continuation) 57
: [SPREAD AVERAGE:OOV'T.REPURCHASE AGREEMENT (16- to 30- day mat.)
TC iUliiiiilli!;!
iliii
; .•:: •} J:!1 -'
YEAR RATE
1982 1.1565 1983 0.1797 1984 -4.3353 1985 -3.4398 1986 -1.2024 1987 -3.5531 1988 1.0627
l l l l j ! i n
111
•Bi
H I IMP •Siii'Hi'lHi!
••::•• iU;l 1988 1.0627
.;!;] SPREAD AVERAGE:PRIVATE REPURCHASE AGREEMENT (Demand) j
YEAR RATE
1982 -1.7614 1983 1984 1985
2.4413 0.4466
-7.8724 1986 -4.0851 1987 0.7895 1988
SjjiHiiHS'Hliiilji' - -3.9437
S i SPREAD AVERAGE:PRIV. REPURCHASE AGREEMENT (1- to 7- day mat.) I(« i j i ' . i.i«... I ' i i>\ ,n n i.i f . . . . . . . j . i . . . . . . . . . . . . . . . . . . . . . . . . . . . . . . . . . . . ' i . " . . . . . ' ! ' ' ^ ! ^
m YEAR RATE
i l l
1982 -1.6117 1983 3.2262 1984 3.5994 1985 -6.8352 1986 1.0217 1987 4.5875
;t ;T i' T
IIS! l l l l liSiiiijiHIl: lillili liiiliiiii
-l. •••.• y:-:"'':™1?'* ST.?
. .. . 1''•'••"••'>:;• • • > : • ' ^ • fo•Xlsfeir^-U'j• ? C f r . ?jg/i& I:& i [SPREAD AVERAGE: PRIV. REPURCHASE AGREEMENT (31-to 4S- day mat.) | ii
IS.vEi::;-;;;;:;; ::;: i ^ i ' ;;:• 'liif;;:: III
l l l l ; VliniMN!
is
YEAR RATE
1982 2.0440 1983 1.8730 1984 -5.7500 1985 -9.4260 1986 -10.2140
H I
jjijliijiilij ililiSiiSliji
Siiiliik
Sii-iilii!!:
l i l l iiSiii;, {j.|{|!j!;|ifj
jsjli&ii

55
Figure 4 (continuation)

56
Table A3.1 (continuation) MONEY MARKET TRANSACTIONS BY MATURITY OF PAPER
VOLUME AND SHARE, 1975-1988 a/
All Years Maturity
Volume %
1. Demand (IBCL) 1573651.1 34.35 2. Demand 1311159.3 28.62 3. 1-7 Day Maturity 204195.2 4.46 4. 8-15 Day Maturity 175859.3 3.84 5. 16-30 Day Maturity 431397.2 9.42 6. 31-45 Day Maturity 440328 9.61 7. 46-60 Day Maturity 184480.7 4.03 8. 61-90 Day Maturity 164456.2 3.59 9. 91-120 Day Maturity 38562.8 0.84 10.121 -180 Day Maturity 21545.6 0.47 11. 181-730 Day Maturity 22782.6 0.50 12. OVER 730 Day Maturity 12441.7 0.27
Total 4580859.7 100.00
/a First quarter data for year 1975 not available.
Source: Central Bank of the Philippines.

57
Table 27 TESTING FOR CO-INTEGRATION
WITH 91-DAY TREASURY BILL RATE
Instrument All Years Before 1981 After 1981
Interbank Call Loan Coint NA Coint
Promissory Notes (Demand) Coint Not Coint Coint
Promissory Notes (1-7 Day) Coint Not Coint Coint
Promissory Notes (8-15 Day) Not Coint Not Coint Not Coint
Government Repurchase Agreement (Demand) Coint Not Coint Coint
Government Repurchase Agreement (1-7 Day) Coint Coint Coint
Government Repurchase Agreement (8-15 Day) Not Coint Not Coint Not Coint
Government Repurchase Agreement (16-30 Day) Coint Not Coint Coint
Private Repurchase Agreement (Demand) Coint Not Coint Coint
Private Repurchase Agreement (1- 7 Day) Coint Not Coint Not Coint
Private Repurchase Agreement (8-15 Day) Not Coint Not Coint Not Coint
Private Repurchase Agreement (31-45 Day) Not Coint Not Coint Not Coint

CO UJ DC <
• UJ
5 EC LU
< o < z LL
5 CO < cc m < Z £
w * s a> O l= 5 Z O < LU I- ^ _l
z UJ m LL O CO LU
tr o LU CO
o o s o z Q < DC
I m ^ co a)
o >
c o
to c
o CO 0> 2 E
o >
<n ' ® E
o >
o 'a 3 w CO C
CMNN0lfi08)(D T-n^oowosio in loobr-^tbiri**^-'^-
m n w r O N S N CM r- T- t-
b 2 * 3L» C * * ? (D I I U J O O & O 0) <mLL.Q_COO=3CO
o 01 T— at co in co r- CM T— CO co o CO in tt co o o 00 oo in 00 CO cd cb co CO CO CO CM CM CM
o o o i o m S B N T - o o c o m ^ i -c>r-»r»r--inmTi-i!i-cococococo
"D JL > 5 £ .tO d) c to
.3 £ m 75 ^ o c < < a. < co => O
o •E '8 CL « h i_ —
O « _ . co o —-SQ.O Q. CD CL i i
CM CM o co CM <3 co o o CO r-. O) CM co i— o r- co CO in CM CD r- CO in CO in in CO CO CO CO CO CM csi CM cvi
CM CO r-- in o co CM m in f- o oo m co CO co in co ai 01 ® r- CM ai oo CO in in CO CO CO co co co CM CM CM
= O 5, ® S Z S = > ( L S S a l r < c < 5 o o a i i J . £ f f l D . ( 0 0 . D .
(U "D c 3
oo co a> £ E
O >
e o
o a> cn co o co o co o o CO c> co cb cb in CM
m o r» ai o CO co CM co CM ao T— in in CO in CM C\J T— j— t—
3 •H CO
* JXL C re 00 o * m e QQ H m z 0) O CL UJ 0- 5 0. CD LL
CM r- to _ M; cn <3 Ol h-CO cb o cb cb T— 1—
CO in o <3 co O in T- co CM 01 CM i— CO CM T— i—
ra -e
c o
M c
c o 3
4 c , re
b m«
Z u i O ®o Q_ LL LL 2 =3 to CM CM <3 r- Ol r-CO CO ai <b cb <b
T— o CM CM o co CM in in m o T r- CM j— T— CM CM T* r- i—
c p
(C t- 'p C CD CO t jg 3 r> d U. S cd i- — >;_ E UJ Q- S - ° U_ CD 2E O CD CO

59
Analysis of key events. The effect of government policy on the behavior of the money market can also be observed by analyzing specific key events, the response of the government to any instabil-ity spawned by the occurrence of these events, and the resulting reaction of the money market. The events to be analyzed have been described in an earlier part of this paper.
The Dewey Dee scandal in 1981 was the first key event. However, a rigorous analysis of this crisis was not possible for two reasons: 1981 data on the money market was not provided by the Central Bank and post-1981 data were also influenced by major policies instituted in 1980 and 1981.
Attention was focused on the balance-of-payments crisis in 1983, triggered off by the assassination of a key political figure. Looking at Figure 3, it can be observed that the range average for almost all instruments peaked in 1984 (this is true for all instruments with on demand maturity). Si-multaneously, the spread average declined to negligible levels (again, true for all instruments with on demand maturity). However, the spread average bottomed out in 1985 and, in most cases, the absolute value was highest during the period 1982-'88.
The substance of these figures can be gleaned from the sequence of policies that materialized. Because of increased market instability, the government sought to control the transactions involved. While these efforts met with some success, it was only at the cost of reduced efficiency. Left unanswered was the nature of the policy response.
During the last quarter of 1984, the Central Bank began to earnestly sell the much celebrated "Jobo" bills which carried a much higher rate than other instruments."41 The main objective for floating these attractive bonds was to arrest capital outflows. The high interest rates also reduced domestic absorption thus freeing resources that were used to meet external debt obligations. Also this time, the government required that all public offices invest all their surplus funds in CB bills or treasury bills.
Other policy responses of the government to the crisis included three major currency devalu-ations which were accompanied by severe foreign exchange restrictions and wide ranging import controls which included the creation of a foreign exchange pool for priority import payments by requiring banks to sell 100 percent of their foreign exchange receipts to the Central Bank and the setting up of priorities in the allocation of foreign exchange. Tighter money supply was also instituted by raising reserve requirements.42
Sufficient data support the hypothesis that the portfolio restriction contributed to the decline in operating efficiency. However, one critical factor that gave rise to the larger spread between the reference rate and yields of other instruments is the fact the former was held at an artificially high level. The Central Bank achieved its objective of mitigating speculative activity and financial instability by effectively choking off expenditure demand and suppressing the other sectors of the money market. Transactions in money market instruments excluding treasury bills and interbank call loans declined rapidly during the period 1983-85 and have since not recovered (Table 10).
Government financial and fiscal policy following the 1983 BOP crisis did not fundamentally change: the former, because of lack of any other suitable term can be described as elitist. A basic
'The Central Bank introduced the CB bills (or "Jobo" bills) under MB Resolution No. 416 dated 16 March 1984 but began stepping up sales of these instruments only in September. Thus, the main effects were not felt until 1985. During this period, transactions in treasury bills on an auction basis were suspended and instead rates were determined on a negotiated basis. Hence, while the 91-day treasury bill rate remained as the reference rate for the period September 1984-October 1986, its value generally followed the trend of CB bills.
For a more detailed and exhaustive discussion of the government response to the balance-of-payments crises see Lamberte et al (1985).

60
macroeconomic identity as modified by Cohen (1987) can be used as a reference point to describe the general thrust of government policy.
Assuming no capital accumulation and that all external debt is government debt (which closely approximates reality in the Philippines), the following identity can be derived:
TB = (T - G) + D - (1+T)D ,
The trade balance, TB, is the sum of the government's primary surplus (taxes or T, less government spending termed G which includes repayments on the external debt) and of the net new savings (D) which are drained from the domestic financial markets, t is the domestic interest rate.
The government's primary surplus, in turn, could be decomposed into resources from money creation or the seigniorage tax, S, and the primary surplus due to an excess of tax revenue, Z. The revised identity thus reads as:
TB = S + Z + D - (l+r)D ,
The increase in money supply was generally maintained at controllable levels. Inflation since 1985 reached a maximum of 14 percent. It can be assumed that the inflation tax was used to the limit allowed by the conditionalities of the International Monetary Fund (IMF). The tax system was described as regressive with the government relying heavily on indirect taxes to generate additional revenues. Estimates also showed the tax system to be inelastic.
Putting aside the option of a currency devaluation in order to restrain the current account deficit (caused primarily by a currency estimated to be 22 - 25 percent overvalued), the government has to resort to domestic savings. The government did this by making government financial instruments more attractive than other money market instruments. This in turn has led to a significant degree of crowding-out that has maintained real interest rates at a very high level, which are in fact the highest in Asia. As can be observed from Table 29, real interest rates have been at their highest level over the past five years. The rise in the variable G due to the external debt overhang only exacerbates the situation.
This process, of course, cannot be pursued indefinitely. But the government, is generally unvarying with its conduct of policy. It avoids implementing stronger measures that would increase direct taxes while, at the same time, it intervenes in the exchange rate market to prevent a drastic drop in the value of the peso. The main beneficiaries of an overvalued currency are the import substituting industries which are themselves heavily import-dependent. These sectors have been favored with protectionist measures. In the same vein, the bulk of additional direct taxes would come from the upper income brackets. A high interest rate policy, on the other hand, would benefit large savers and, of course, the large commercial banks. Small savers are constrained to savings deposits which bear ridiculously low yields. Smaller banks, which on a relative basis are more dependent on income from loans, are faced with lower demand for credit. It goes without saying that high real interest rates slow down economic growth by dampening real consumption and investment expenditures.
The net result of this combination of macroeconomic policies would be a more skewed income distribution which forms a symbiotic relationship with the oligopolistic structure of the banking system. For example, smaller banks hard pressed to generate income from loans, would be hesitant to compete with larger banks by offering a higher savings deposit rate. The larger banks would simply match the smaller banks' rates, thus negating any possible increase in the flow of savings deposits to the smaller banks. In the end, the latter have at most the same volume of deposits but at a lower spread,,a condition that may prove disastrous. The smaller bank would simply be content to follow the actions of their bigger counterparts.

61
Table 29 REAL INTEREST RATE
1970 -1989 (in percent)
91-day Inflation Real Year T-bill Rate Rate Interest Rate
1970 13.14 14.85 -1.71 1971 11.95 21.90 -9.95 1972 11.92 8.23 3.69 1973 9.43 16.50 -7.08 1974 10.05 34.16 -24.12 1975 10.34 6.78 3.56 1976 10.19 9.23 0.96 1977 10.90 9.93 0.97 1978 10.89 7.29 3.60 1979 12.25 16.51 -4.26 1980 12.14 17.60 -5.46 1981 12.61 12.39 0.22 1982 13.81 10.21 3.60 1983 14.17 10.17 4.01 1984 30.53 50.35 -19.81 1985 26.81 23.10 3.71 1986 14.43 0.75 13.68 1987 11.39 3.79 7.60 1988 14.67 8.76 5.91 1989 19.33 10.60 8.73 1990* 26.00 13.00 13.00
* January to May 1990
Source: Central Bank, Department of Economic Research.

62
It could be concluded from this briet analysis that the macroeconomic policy stance of the government has spawned the inefficiencies in the financial system, in general, and the money market, in particular.
C. Some Broad Conclusions
Apart from the hypotheses that were proven, one clear point stands out in the analysis: there is a trade-off between operating efficiency, on one hand, and stability, on the other. Policies designed to induce stability in the financial system met with success only at the expense of a reduction in operating efficiency, and vice-versa.
Based on the analysis in Chapter IV,B, it would seem that the Central Bank has placed greater weight on the role of stability, and this attitude engendered an oligopolistic structure in the financial system that could have led to rent-seeking activity. As a result not only has development in the money market stagnated but spawned the overall financial deepening of the economy as well. There could have also been adverse effects on the income distribution but empirical studies have to be conducted to justify this point.
It is now left to policymakers to design reforms that would assure a more efficient structure but not at the sacrifice of a financial crash.

63
BIBLIOGRAPHY
Bautista, R. M. "Balance of Pay ments Adjustment Process in the Philippines." Paper presented at UNCT AD/UNDP Round Expert Group Meeting on the BOP Adjustment in Developing Countries, 1978.
Boyce, J. K. and L. Zarsky. "Capital Flight from the Philippines, 1962-1986." Journal of Philippine Development XV (Second Semester 1988): 191-210.
Cohen, D. "External and Domestic Debt Constraints of LDCs: A Theory with a Numerical Application to Brazil and Mexico," In Global Macroeconomics, R. C. Bryant and R. Poites. eds. New York: Macmillan, 1987.
Cole, D.C., B.F. Slade, et al. "Development of Money Markets in Indonesia." (January 1990) photocopy.
Engle, R. F. and C. W. J. Granger. "Co-Integration and Error Correction Representation, Estimation and Testing." Econometrica 55 ,2 (March 1987).
Lamberte, M. B. "Assessment of the Problems of the Financial System: The Philippine Case." Working Paper Series No. 89-18: Makati: Philippine Institute for Development Studies, 1989.
"Comparative Bank Study: A Background Paper." Working Paper Series87-04 . Makati: Philippine Institute for Development Studies, 1987.
. "Financial Liberalization and the Internal Structure of Capital Markets." Staff Paper Series 85-07. Makati: Philippine Institute for Development Studies, 1985.
et al. "A Review and Appraisal of the Government Response to the 1983-84 Balance-of-Payments Crisis." PIDS Monograph Series No. 8. Makati: Philippine Institute for Development Studies, October 1985.
Licuanan, V.S. An Analysis of the Institutional Framework of the Philippine Short-term Financial Markets. Makati: Philippine Institute for Development Studies, 1986.
Pante, Filologo, Jr. "Exchange Rate Flexibility and Intervention Policy in the Philippines, 1973-1981." Working Paper Series No. 83-01. Makati: Philippine Institute for Development Studies, 1983.
Program on International Financial Systems (PIFS), Harvard Institute for International Development (HIID). Method-ology Papa for Regional Research Project: Guidelines for Study of Money Markets in Asia (May 1988). photocopied.
Tan, E. A. "Bank Concentration and the S trocture of Interest. University of the Philippines School of Economics Discussion Paper No. 89-15, October 1989.
. "The Structure and Growth of the Philippine Financial Market and the Behavior of its Major Components.'' Working Paper Series No. 81-06. Makati: Philippine Institute for Development Studies, 1981.
„ . "Philippine Monetary Policy and Aspects of the Financial Market: A Review of the Literature." Survey of Philippine Development Research I. Makati: Philippine Institute for Development Studies, 1980.
World Bank. World Development Report 1989. World Bank, 1990.
. Philippine Financial Sector Study. Report No. 7177-PH. (August 1988).

APPENDIX 1
LIST OF MAJOR BANKS AND NON-BANKS WITH QUASI-BANKING FUNCTIONS
A. Commercial Banks (KBs)
1. Expanded KBs (EKBs) Philippine National Bank (Government) Allied Banking Corporation Bank of the Philippine Islands Citytrust Banking Corporation Equitable Banking Corporation Far East Bank and Trust Company Metropolitan Bank and Trust Company Philippine Commercial International Bank United Coconut Planters Bank
PNB Allied BPI Citytrust Equitable FEBTC Metrobank PCIB UCPB
2. Non-EKBs Associated Bank Boston Bank China Banking Corporation International Corporate Bank Philippine Bank of Communications Philippine Banking Corporation Philippine Trust Company Pilipinas Bank Producers Bank of the Philippines Prudential Bank and Trust Company Republic Planters Bank Rizal Commercial Banking Corporation Security Bank Consolidated Bank and Trust Company Traders Royal Bank Union Bank of the Philippines Family Bank
3. Foreign Banks Bank of America Standard Chartered CitibanK Hongkong and Shanghai Banking Corporation
B. Thrift Banks Asiatrust Development Bank Banco de Oro and Mortgage Bank Bank of the Philippine Islands Family Bank
C. Special Government Banks Land Bank of the Philippines Development Bank of the Philippines
Associated Boston (formerly Com bank) China Bank Interbank PBCom Philbanking Philtrust Pilipinas Producers PBTC Republic RCBC Security Solidbank Traders UBP Family
BA Chartered Citibank Hongkong-Shanghai
Asiatrust Banco de Oro BPI Family Bank
LBP DBP
D. Non-Banks with Quasi-Banking Licenses (NBQBs)
1. Investment Houses AEA Development Corporation AEA Anscor Capital and Investment Corporation As cor Citytrust Investment Philippines Citicorp First Metro Investment Corporation First Metro Multinational Investment Bancorporation Multinational Private Development Corporation of the Philippines PDCP State Investment House Incorporated State IHI Philippine Pacific Capital Corporation PPCC
2. Finance Companies Bank of America Finance Corporation BA Finance BPI Credit BPIC Cebu International Finance Corporation CIFC Citytrust Finance Corporation Citytrust Finance General Credit Corporation GCC First Malayan Leasing and Finance Coporatkm Malayan Paramount Finance Corporation Paramount

66
LLI
cc en
O O z °
Q- 3 < DC
111 Q. tn o CO UJ Q.
f UJ <2 o> < & £
o Ml
g s o> >-
s 2
111 s tr HI 5
o « Q
CL ® w
O) 5
s
w s
0.
o t t n s i / i n i s r n r j n o i o o i S J 1 8 8 ft n 8 9 S S £ S 5S 3 8 S S S S N N ^ c d ^ l f l o d o o V ^ — — CM CM CM CM
r ^ r ^ r ^ d d ^ a i a o d d j - c v j
i e N p i Q a N o i ( M O o e o o i - i - i o a ) N a ( S N c g o h o i f l n n < - N ( D r^r^r^r^r^r^co'cd^dcdddir^cM i- i- CM CM CM CM
t- (o c\j o o) o) ' Sco oi ai © to •
C M o o i o r - ® C - _ ^ K i ' t n w n w o s N ' - N ^ s n o i s s n n s s oo co ri oi co'd o t— T- CM CM CM CM
CO CM O) CM CM CO
NIAIOIS o> O 00 O) I - O ^ O N N O O U O N 0>P>CO»-CMCMCMOO»-CMW_. _ _. o w o i u s o o i n o o ' - o o ^ n ia n n n in at <p o o o u to i\i oi i- CM CM CM CM
c s N O N M M t o n i D O M e N i - o i n ^ n n n u i n i f l o q i p ^ ^ q a
CO CO O O r' t-r- i- CM CM CM CM
0> a) T- 0> CO CM CO h-o o CM 8 0> CO O O W O J S r CM *- 8 * * T-
CM o> CO N ^ ^ CO o O 00 W CM CO CM CO co co iA cn - t o O in o 00 N S ^ N ai r CO 00 o d T- T-
CM CM CM CM
O i - M d O O O X O 8 S 8 K - & 8 " ^ n n n i f l o i r— i— i— i—
a ^ a i o n i a j r i o o o N N Q s o f n a o i o c D i - C M o o n ^ .. r n o i O N o i o i - n o c o o M o i o s s ^ ^ ^ r s l t s l d d ' t o d c i o ' o V ^ y- CM CM CM CM
£1
0> 00 CO ^ ^ CM s i ? § $ ? I S
in co co co 3 3 3 8 2 t in in o ^ o ^ ^ t c o r t ^ S r t f l o o
S 3 $ 3 ft 3 S S & 3 £ ? 3 ft S 3 S S S K co p»
O N ffl N O - - • - © , (
CO o> co 0) -O E s <3 D> c c CO CD 3
2 9
SN CT O CO vr cb a o T- f-
r - y - C i CM CM CM
C M « C M » 0 f - 0 > < 0 i - _ . _ -
cDir)i>T-cocDc\iTrcpcNj^^cNcpc\j o Q] o ^ oo co ^ ^ n c o ^ i c c M N o a o ^ o o n
rv . ' r^r^Nr^i^ i^cdd^edo iddr^ i- i- i- CM CM CM
Q. CL
CL O
J£ § m
<8

67
APPENDIX 3
A requirement of the study was to identify a reference rate which would be the price of a short-term, low-risk instrument in a free, liquid market. Since this reference rate would be used as a basis to measure efficiency in other markets, the process was simplified by determining which particular interest rate followed a random walk. This was done by applying the unit root test developed by Dickey and Fuller (1981) and later determining whether the first difference of the rate or rates with unit roots exhibited a pattern similar to error terms that are independent and identically distributed (i.i.d.). As mentioned in the text, a random walk implies that all information pertinent in the market is being fully utilized, effectively discounting the possibility of arbitrage resulting in economic profit.
The unit root test for a particular interest rate r is based on the following model:
r = 8r, + u,
where u is a stochastic disturbance term representing white noise. The null hypothesis is that 5 = 1 with the alternative hypothesis that the series is stationary (for the case that IS! < 1) or explosive (for the case that IS! > 1).
Using the augmented Dickey-Fuller test to guard against error terms (u in the above model) that are not i.i.d., the actual model estimated using ordinary least squares is
&r = A.+ Br , + r ,&r , + T 2 t . r 2 + ... + T / r p + u.
This is done in order to generate consistent estimates. If B is insignificant, then the null hypothesis would not be rejected to conclude that the series has a unit root. On the other hand if 6 is negative and significant, the null hypothesis would be rejected in favor of the alternative that the series is stationary. A positive and significant coefficient for B is indicative of an explosive series.
The model was run for p = 2 and p = 4 with the choice of the regression equation being based on a higher adjusted coefficient of determination.
The results for the various interest rates are presented in Table A3.1 and Table A3.2. To show that an interest rate r has a unit root, it must not be integrated of order zero and its first difference must be integrated of order 0 [i.e. r must be 1(1)]. The critical region for the test of significance was obtained from the tables generated by Dickey and Fuller.
Based on the results, it can be concluded that almost all interest rates have unit roots. The behavior of the first difference of the 91 -day treasury bill rate was plotted against time and its behavior reasonably approximated white noise. (Figure A3.1) Because of this result and also due to reasons cited in the text, the 91-day treasury bill rate was used as the reference rate.
A cointegration test was also conducted between a particular market rate and the reference rate S. Following the Granger two step procedure [Hall and Henry (1988)], r is first regressed against^. If the resulting residual terms would be stationary or 1(0) [determined by using an augmented Dickey-Fuller test], it can be concluded that the two variables are cointegrated.
References
Dickey, D. A. and W. A. Fuller, "Likelihood Ratio Statistics for Autoregressive Time Series with a Unit Root." Econometrica 49 (July 1981).
Hall, S. G. and S. G. B. Henry. Macroeconometric Modelling. Amsterdam: Elsevier Science Publishers B. V., 1988.

68
Table A3.1 DETERMINATION OF ORDER OF INTEGRATION
[TEST FOR 1(0)]
Dependent Variable X
Explanatory Variables
t-1 t-1 t-2 t-3 t-4 Interbank Call Loan
2.420 (1.83)
Promissory Notes (Demand) 1.814 (1.58)
Promissory Notes (1-7 Day) 1.723 (1.45)
Promissory Notes (8-15 Day) 2.067 (1-74)
-.149 -.168 -.157 -.249 -0.23 (1.94) (1.44) (1.42) (2.32) (0.22)
-.121 -.214 -.269 -.248 -.194 (1.72) (2.02) (2.63) (2.49) (2.0)
-1.08 -.470 -.370 -.424 -.035 (1.53) (4.23) (3.43) (4.12) (0.37)
-.133 -.523 -.166 -.130 -.013 (1.81) (4.47) (1.29) (1.03) (0.11)
Government Repurchase Agreement (Demand) 3.534 -.198 -.111 -.195 -.172 -0.75 (2.17) (2.15) (0.90) (1.65) (1.53) (0.68)
Government Repurchase Agreement (1- 7 Day) 1.598 -.090 -.423 -.023 -.222 -.314 (1.21) (1.16) (4.01) (0.21) (1.98) (3.81)
Government Repurchase Agreement (8-15 Day) 2.63 -.141 .102 .112 (1.94) (2.20) (0.79) (0.87)
Government Repurchase Agreement (16-30 Day) 1.459 -.088 .151 -.004 -.359 .187 (1.76) (1.82) (1.38) (0.04) (3.67) (1.28)

69
Table A3.1 (continuation)
Dependent Variable Explanatory Variables x X X X X X t t-1 t-1 t-2 t-3 t-4
Private Repurchase Agreement (Demand) 3.824 -.223 -.192 -.248 -.248 -.023 (1.97) (2.05) (1.40) (1.92) (2.07) (0 .20)
Private Repurchase Agreement (1- 7 Day) 4.751 -.319 -.127 -.096 (2.36) (2.58) (0.76) (0.75)
Private Repurchase Agreement (8-15 Day) 16-51 -1.148 1.041 0.874 .736 .742 (4.64) (4-57)* (3.81) (3.16) (3.08) (3 .72)
Private Repurchase Agreement (31-45 Day) 2.386 -.144 -.282 .054 .139 .293 (1-84) (1-94) (2.18) (0.41) (1.07) (2.46)
91-day Treasury Bill Rate .712 -.047 .373 -.039 (2.22) (2.35) (4.81) (0.50)
* significant at the 5 percent level.

70
Table A3.1 (continuation) DETERMINATION OF ORDER OF INTEGRATION
[TEST FOR 1/(1)]
Interest Rate: X ; Z = X t t t
Dependent Variable Explanatory Variables 2 2 2 Z Z Z t t-1 t-1 t-2 t-3 t-4
Interbank Call Loan .029 -1.778 .523 .298 (0.06) (8.73)* (3.36) (2.97)
Promissory Notes (Demand) -.041 -1.994 .711 .395 .123 .082 (0.10) (6.07)* (2.57) (1.79) (0.77) (0.83)
Promissory Notes (1-7 Day) .021 -2.377 .848 .438 (0.05) (12.06)* (5.73) (5.16)
Promissory Notes (8-15 Day) .018 -1.728 .108 -.112 (0.05) (6.44)* (0.54) (1.07)
Government Repurchase Agreement (Demand) .175 -1.721 .498 .225 (0.36) (8.03)* (3.10) (2.12)
Government Repurchase Agreement (1- 7 Day) -.379 -2.118 .541 .276 (0.70) (7.84)* (2.77) (2.79)
Government Repurchase Agreement (8-15 Day) -.023 -1.035 .074 .120 (0.03) (4.75)* (0.41) (0.92)
Government Repurchase Agreement (16-30 Day) .031 -1.435 .459 .395 (0.11) (8.72)* (3.49) (4.10)

Table A3.2 (continuation)
Interest Rate: X ; Z = X t t t
Dependent Variable Explanatory Variables Z Z Z Z Z Z t t-1 t-1 t-2 t-3 t-4
Private Repurchase Agreement (Demand) .110 -1.996 (0.15) (8,90)*
.662 (3.97)
.314 (2.93)
Private Repurchase Agreement ( 1 - 7 Day) -.053 -1.764 (0.08) (5.32)*
.329 (1.37)
.087 (0.71)
Private Repurchase Agreement (8-15 Day) .196 -1,386 (0.49) (3.50)*
.494 (1.13)
.486 (1.21)
.323 (1.07)
.618 (3.0)
Private Repurchase Agreement (31-45 Day) -.05 -1.44 (0.21) (5,48)*
.049 (0.24)
.023 (0.19)
91-day Treasury Bill Rate .029 -.746 (0.22) (6.98)*
.103 (1.11)
.047 (0.59)
* Significant at the 5 percent level.

72
oi
J 1 5 £ %£ to u
H
Q
L.
O
CJ1 . c +J tn
£
I r <
T T T T T T T T T T
o CO
O 1- in
I /'H l'
o I-
o E- CM
I i r 1 — I — T ~ T
o E- o
E. o co Oi 03
OI
= O T - „ n oi
o
L o - CD
L O in
L o c
E z. o r «
L O e cm
5. O
E
f O r N n + i n ( D S o a o i o I I I I I I I
d D U d j a ^ i Q i & i y

This is a download from the BLDS Digital Library on OpenDocs
http://opendocs.ids.ac.uk/opendocs/
This work is licensed under a Creative Commons Attribution – NonCommercial - NoDerivs 3.0 License. To view a copy of the license please see: http://creativecommons.org/licenses/by-nc-nd/3.0/