Cell Reports Article Identification of Lgr5-Independent Spheroid-Generating Progenitors of the Mouse...
24
Cell Reports Article Identification of Lgr5 -Independent Spheroid-Generating Progenitors of the Mouse Fetal Intestinal Epithelium Roxana C. Mustata, 1,5 Gabriela Vasile, 1,4 Valeria Fernandez-Vallone, 1,4 Sandra Strollo, 1 Anne Lefort, 1 Fre ´ de ´ rick Libert, 1 Daniel Monteyne, 2 David Pe ´ rez-Morga, 2,3 Gilbert Vassart, 1, * and Marie-Isabelle Garcia 1, * 1 Institut de Recherche Interdisciplinaire en Biologie Humaine et Mole ´ culaire (IRIBHM), Faculty of Medicine, Universite ´ Libre de Bruxelles ULB, Route de Lennik 808, 1070 Brussels, Belgium 2 Laboratory of Molecular Parasitology, IBMM, Universite ´ Libre de Bruxelles, 12 rue des Professeurs Jeener et Brachet, 6041 Gosselies, Belgium 3 Center for Microscopy and Molecular Imaging (CMMI), Universite ´ Libre de Bruxelles, 8 rue Adrienne Bolland, B-6041 Gosselies, Belgium 4 These authors contributed equally to this work 5 Present address: Wellcome Trust and Medical Research Council, Cambridge Stem Cell Institute, Tennis Court Road, Cambridge, CB2 1QR, UK *Correspondence: [email protected] (G.V.), [email protected] (M.-I.G.) http://dx.doi.org/10.1016/j.celrep.2013.09.005 This is an open-access article distributed under the terms of the Creative Commons Attribution-NonCommercial-No Derivative Works License, which permits non-commercial use, distribution, and reproduction in any medium, provided the original author and source are credited. SUMMARY Immortal spheroids were generated from fetal mouse intestine using the culture system initially developed to culture organoids from adult intestinal epithelium. Spheroid proportion progressively de- creases from fetal to postnatal period, with a corre- sponding increase in production of organoids. Like organoids, spheroids show Wnt-dependent indefi- nite self-renewing properties but display a poorly differentiated phenotype reminiscent of incom- pletely caudalized progenitors. The spheroid tran- scriptome is strikingly different from that of adult intestinal stem cells, with minimal overlap of Wnt target gene expression. The receptor LGR4, but not LGR5, is essential for their growth. Trop2/ Tacstd2 and Cnx43/Gja1, two markers highly en- riched in spheroids, are expressed throughout the embryonic-day-14 intestinal epithelium. Comparison of in utero and neonatal lineage tracing using Cnx43- CreER and Lgr5-CreERT2 mice identified spheroid- generating cells as developmental progenitors involved in generation of the prenatal intestinal epithelium. Ex vivo, spheroid cells have the potential to differentiate into organoids, qualifying as a fetal type of intestinal stem cell. INTRODUCTION The adult intestinal epithelium is one of the most rapidly self-re- newing tissues in adult mammals. The steady-state maintenance and self-repairing ability of this tissue are ensured by a hierarchy of stem cells present in the crypts of Lieberkhun (Barker et al., 2012). Crypt base columnar cells (CBCs) are rapidly dividing stem cells, expressing the specific marker Lgr5, responsible for the constant production of transit-amplifying (TA) cells, while simultaneously maintaining their own population in steady state (Barker et al., 2007). Upon leaving the crypts, TA cells differen- tiate into postmitotic enterocytes, Goblet cells, enteroendocrine cells, and Tuft cells, which populate the intestinal villi before being shed at their tip. Other rarely dividing adult intestinal stem cells have been described, located just above the Paneth cells in the ‘‘+4 position.’’ These ‘‘label-retaining cells’’ are char- acterized by the expression of several marker genes, including Bmi1, Hopx, Tert, and Lrig1 (Sangiorgi and Capecchi, 2008; Yan et al., 2012; Takeda et al., 2011; Montgomery et al., 2011; Wong et al., 2012). The possibility of interconversion between slow and rapidly cycling LGR5 + intestinal stem cells has recently been demonstrated in healing processes after tissue injury or in ex vivo intestinal organoids (Tian et al., 2011; Takeda et al., 2011; Roth et al., 2012, Buczacki et al., 2013). Embryonic development of the murine intestine has been well characterized morphologically, and recent studies have pro- vided important information regarding the inductive cues and transcription factors implicated in the differentiation of the gut (Walton et al., 2012; Kim et al., 2007; Verzi et al., 2011; Noah and Shroyer, 2013; Spence et al., 2011). Despite these pro- gresses, there is still limited understanding about the origin of the complex adult stem cell pool during development. Fetal pro- genitors are believed to originate from the region between the newly formed villi, around embryonic day 15–16 (E15–E16). We previously showed that Lgr5-expressing cells are detected in the ileal epithelium of E15 embryos and then become exclusively localized to the intervillus region in the late fetal intestine, before being restricted to CBCs in the crypts (Garcia et al., 2009). Earlier studies with chimeric mice have suggested the existence of mul- tiple progenitors in intervillus regions preceding crypt formation Cell Reports 5, 1–12, October 31, 2013 ª2013 The Authors 1 Please cite this article in press as: Mustata et al., Identification of Lgr5-Independent Spheroid-Generating Progenitors of the Mouse Fetal Intestinal Epithelium, Cell Reports (2013), http://dx.doi.org/10.1016/j.celrep.2013.09.005
Transcript of Cell Reports Article Identification of Lgr5-Independent Spheroid-Generating Progenitors of the Mouse...
Please cite this article in press as: Mustata et al., Identification of Lgr5-Independent Spheroid-Generating Progenitors of the Mouse Fetal IntestinalEpithelium, Cell Reports (2013), http://dx.doi.org/10.1016/j.celrep.2013.09.005
Cell Reports
Article
Identification of Lgr5-IndependentSpheroid-Generating Progenitorsof the Mouse Fetal Intestinal EpitheliumRoxana C. Mustata,1,5 Gabriela Vasile,1,4 Valeria Fernandez-Vallone,1,4 Sandra Strollo,1 Anne Lefort,1 Frederick Libert,1
Daniel Monteyne,2 David Perez-Morga,2,3 Gilbert Vassart,1,* and Marie-Isabelle Garcia1,*1Institut de Recherche Interdisciplinaire en Biologie Humaine etMoleculaire (IRIBHM), Faculty of Medicine, Universite Libre de Bruxelles ULB,
Route de Lennik 808, 1070 Brussels, Belgium2Laboratory of Molecular Parasitology, IBMM, Universite Libre de Bruxelles, 12 rue des Professeurs Jeener et Brachet, 6041 Gosselies,
Belgium3Center for Microscopy and Molecular Imaging (CMMI), Universite Libre de Bruxelles, 8 rue Adrienne Bolland, B-6041 Gosselies, Belgium4These authors contributed equally to this work5Present address: Wellcome Trust and Medical Research Council, Cambridge Stem Cell Institute, Tennis Court Road, Cambridge,CB2 1QR, UK
*Correspondence: [email protected] (G.V.), [email protected] (M.-I.G.)
http://dx.doi.org/10.1016/j.celrep.2013.09.005
This is an open-access article distributed under the terms of the Creative Commons Attribution-NonCommercial-No Derivative WorksLicense, which permits non-commercial use, distribution, and reproduction in any medium, provided the original author and source are
credited.
SUMMARY
Immortal spheroids were generated from fetalmouse intestine using the culture system initiallydeveloped to culture organoids from adult intestinalepithelium. Spheroid proportion progressively de-creases from fetal to postnatal period, with a corre-sponding increase in production of organoids. Likeorganoids, spheroids show Wnt-dependent indefi-nite self-renewing properties but display a poorlydifferentiated phenotype reminiscent of incom-pletely caudalized progenitors. The spheroid tran-scriptome is strikingly different from that of adultintestinal stem cells, with minimal overlap of Wnttarget gene expression. The receptor LGR4, butnot LGR5, is essential for their growth. Trop2/Tacstd2 and Cnx43/Gja1, two markers highly en-riched in spheroids, are expressed throughout theembryonic-day-14 intestinal epithelium. Comparisonof in utero and neonatal lineage tracing using Cnx43-CreER and Lgr5-CreERT2 mice identified spheroid-generating cells as developmental progenitorsinvolved in generation of the prenatal intestinalepithelium. Ex vivo, spheroid cells have the potentialto differentiate into organoids, qualifying as a fetaltype of intestinal stem cell.
INTRODUCTION
The adult intestinal epithelium is one of the most rapidly self-re-
newing tissues in adult mammals. The steady-statemaintenance
and self-repairing ability of this tissue are ensured by a hierarchy
of stem cells present in the crypts of Lieberkhun (Barker et al.,
2012). Crypt base columnar cells (CBCs) are rapidly dividing
stem cells, expressing the specific marker Lgr5, responsible
for the constant production of transit-amplifying (TA) cells, while
simultaneously maintaining their own population in steady state
(Barker et al., 2007). Upon leaving the crypts, TA cells differen-
tiate into postmitotic enterocytes, Goblet cells, enteroendocrine
cells, and Tuft cells, which populate the intestinal villi before
being shed at their tip. Other rarely dividing adult intestinal
stem cells have been described, located just above the Paneth
cells in the ‘‘+4 position.’’ These ‘‘label-retaining cells’’ are char-
acterized by the expression of several marker genes, including
Bmi1, Hopx, Tert, and Lrig1 (Sangiorgi and Capecchi, 2008;
Yan et al., 2012; Takeda et al., 2011; Montgomery et al., 2011;
Wong et al., 2012). The possibility of interconversion between
slow and rapidly cycling LGR5+ intestinal stem cells has recently
been demonstrated in healing processes after tissue injury or in
ex vivo intestinal organoids (Tian et al., 2011; Takeda et al., 2011;
Roth et al., 2012, Buczacki et al., 2013).
Embryonic development of the murine intestine has been well
characterized morphologically, and recent studies have pro-
vided important information regarding the inductive cues and
transcription factors implicated in the differentiation of the gut
(Walton et al., 2012; Kim et al., 2007; Verzi et al., 2011; Noah
and Shroyer, 2013; Spence et al., 2011). Despite these pro-
gresses, there is still limited understanding about the origin of
the complex adult stem cell pool during development. Fetal pro-
genitors are believed to originate from the region between the
newly formed villi, around embryonic day 15–16 (E15–E16). We
previously showed that Lgr5-expressing cells are detected in
the ileal epithelium of E15 embryos and then become exclusively
localized to the intervillus region in the late fetal intestine, before
being restricted to CBCs in the crypts (Garcia et al., 2009). Earlier
studies with chimeric mice have suggested the existence of mul-
tiple progenitors in intervillus regions preceding crypt formation
Cell Reports 5, 1–12, October 31, 2013 ª2013 The Authors 1
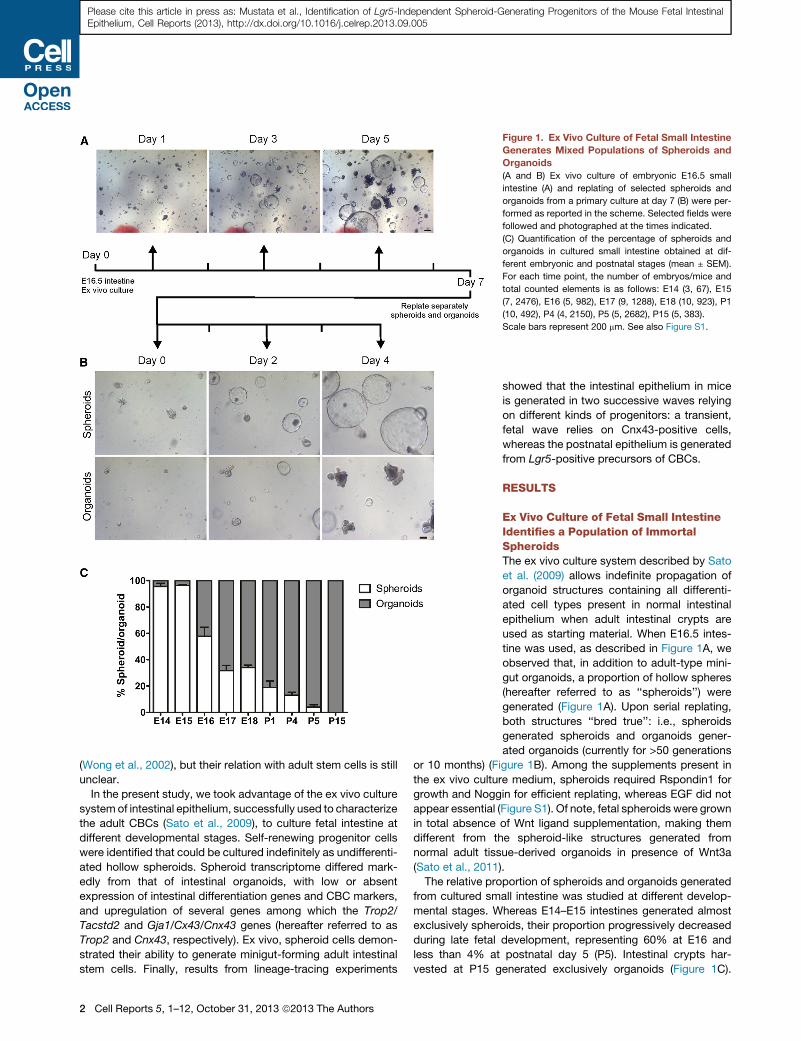
Figure 1. Ex Vivo Culture of Fetal Small Intestine
Generates Mixed Populations of Spheroids and
Organoids
(A and B) Ex vivo culture of embryonic E16.5 small
intestine (A) and replating of selected spheroids and
organoids from a primary culture at day 7 (B) were per-
formed as reported in the scheme. Selected fields were
followed and photographed at the times indicated.
(C) Quantification of the percentage of spheroids and
organoids in cultured small intestine obtained at dif-
ferent embryonic and postnatal stages (mean ± SEM).
For each time point, the number of embryos/mice and
total counted elements is as follows: E14 (3, 67), E15
(7, 2476), E16 (5, 982), E17 (9, 1288), E18 (10, 923), P1
(10, 492), P4 (4, 2150), P5 (5, 2682), P15 (5, 383).
Scale bars represent 200 mm. See also Figure S1.
Please cite this article in press as: Mustata et al., Identification of Lgr5-Independent Spheroid-Generating Progenitors of the Mouse Fetal IntestinalEpithelium, Cell Reports (2013), http://dx.doi.org/10.1016/j.celrep.2013.09.005
(Wong et al., 2002), but their relation with adult stem cells is still
unclear.
In the present study, we took advantage of the ex vivo culture
system of intestinal epithelium, successfully used to characterize
the adult CBCs (Sato et al., 2009), to culture fetal intestine at
different developmental stages. Self-renewing progenitor cells
were identified that could be cultured indefinitely as undifferenti-
ated hollow spheroids. Spheroid transcriptome differed mark-
edly from that of intestinal organoids, with low or absent
expression of intestinal differentiation genes and CBC markers,
and upregulation of several genes among which the Trop2/
Tacstd2 and Gja1/Cx43/Cnx43 genes (hereafter referred to as
Trop2 and Cnx43, respectively). Ex vivo, spheroid cells demon-
strated their ability to generate minigut-forming adult intestinal
stem cells. Finally, results from lineage-tracing experiments
2 Cell Reports 5, 1–12, October 31, 2013 ª2013 The Authors
showed that the intestinal epithelium in mice
is generated in two successive waves relying
on different kinds of progenitors: a transient,
fetal wave relies on Cnx43-positive cells,
whereas the postnatal epithelium is generated
from Lgr5-positive precursors of CBCs.
RESULTS
Ex Vivo Culture of Fetal Small IntestineIdentifies a Population of ImmortalSpheroidsThe ex vivo culture system described by Sato
et al. (2009) allows indefinite propagation of
organoid structures containing all differenti-
ated cell types present in normal intestinal
epithelium when adult intestinal crypts are
used as starting material. When E16.5 intes-
tine was used, as described in Figure 1A, we
observed that, in addition to adult-type mini-
gut organoids, a proportion of hollow spheres
(hereafter referred to as ‘‘spheroids’’) were
generated (Figure 1A). Upon serial replating,
both structures ‘‘bred true’’: i.e., spheroids
generated spheroids and organoids gener-
ated organoids (currently for >50 generations
or 10 months) (Figure 1B). Among the supplements present in
the ex vivo culture medium, spheroids required Rspondin1 for
growth and Noggin for efficient replating, whereas EGF did not
appear essential (Figure S1). Of note, fetal spheroids were grown
in total absence of Wnt ligand supplementation, making them
different from the spheroid-like structures generated from
normal adult tissue-derived organoids in presence of Wnt3a
(Sato et al., 2011).
The relative proportion of spheroids and organoids generated
from cultured small intestine was studied at different develop-
mental stages. Whereas E14–E15 intestines generated almost
exclusively spheroids, their proportion progressively decreased
during late fetal development, representing 60% at E16 and
less than 4% at postnatal day 5 (P5). Intestinal crypts har-
vested at P15 generated exclusively organoids (Figure 1C).
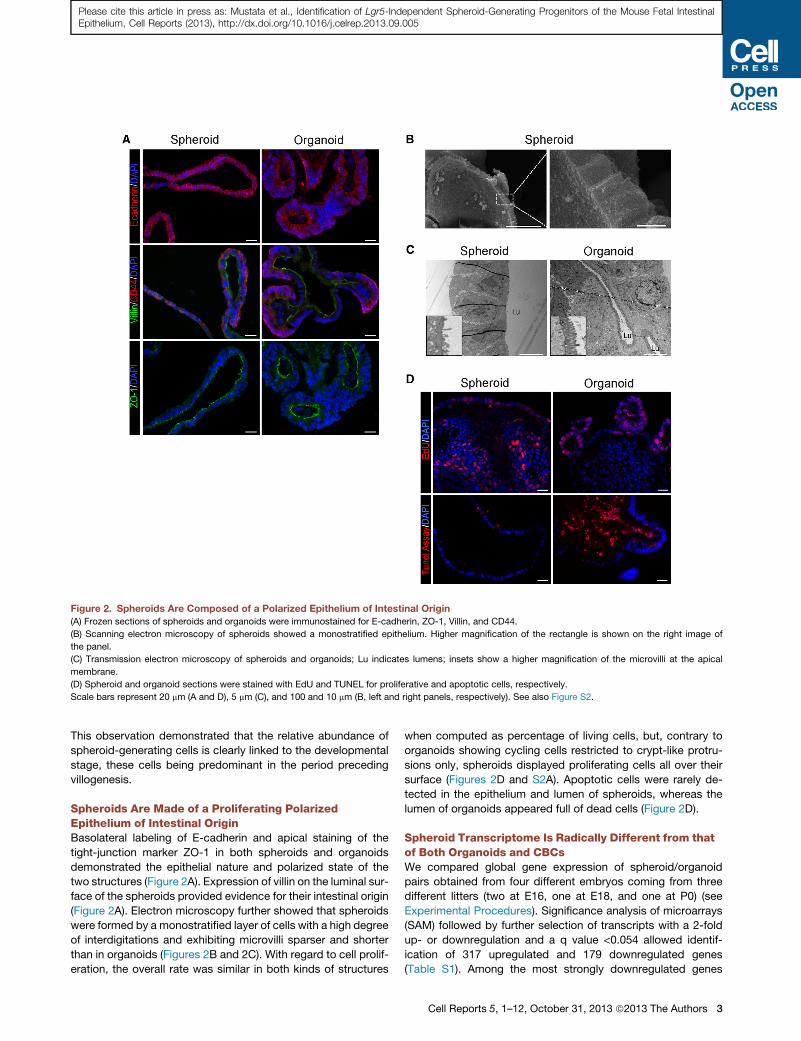
Figure 2. Spheroids Are Composed of a Polarized Epithelium of Intestinal Origin
(A) Frozen sections of spheroids and organoids were immunostained for E-cadherin, ZO-1, Villin, and CD44.
(B) Scanning electron microscopy of spheroids showed a monostratified epithelium. Higher magnification of the rectangle is shown on the right image of
the panel.
(C) Transmission electron microscopy of spheroids and organoids; Lu indicates lumens; insets show a higher magnification of the microvilli at the apical
membrane.
(D) Spheroid and organoid sections were stained with EdU and TUNEL for proliferative and apoptotic cells, respectively.
Scale bars represent 20 mm (A and D), 5 mm (C), and 100 and 10 mm (B, left and right panels, respectively). See also Figure S2.
Please cite this article in press as: Mustata et al., Identification of Lgr5-Independent Spheroid-Generating Progenitors of the Mouse Fetal IntestinalEpithelium, Cell Reports (2013), http://dx.doi.org/10.1016/j.celrep.2013.09.005
This observation demonstrated that the relative abundance of
spheroid-generating cells is clearly linked to the developmental
stage, these cells being predominant in the period preceding
villogenesis.
Spheroids Are Made of a Proliferating PolarizedEpithelium of Intestinal OriginBasolateral labeling of E-cadherin and apical staining of the
tight-junction marker ZO-1 in both spheroids and organoids
demonstrated the epithelial nature and polarized state of the
two structures (Figure 2A). Expression of villin on the luminal sur-
face of the spheroids provided evidence for their intestinal origin
(Figure 2A). Electron microscopy further showed that spheroids
were formed by a monostratified layer of cells with a high degree
of interdigitations and exhibiting microvilli sparser and shorter
than in organoids (Figures 2B and 2C). With regard to cell prolif-
eration, the overall rate was similar in both kinds of structures
when computed as percentage of living cells, but, contrary to
organoids showing cycling cells restricted to crypt-like protru-
sions only, spheroids displayed proliferating cells all over their
surface (Figures 2D and S2A). Apoptotic cells were rarely de-
tected in the epithelium and lumen of spheroids, whereas the
lumen of organoids appeared full of dead cells (Figure 2D).
Spheroid Transcriptome Is Radically Different from thatof Both Organoids and CBCsWe compared global gene expression of spheroid/organoid
pairs obtained from four different embryos coming from three
different litters (two at E16, one at E18, and one at P0) (see
Experimental Procedures). Significance analysis of microarrays
(SAM) followed by further selection of transcripts with a 2-fold
up- or downregulation and a q value <0.054 allowed identif-
ication of 317 upregulated and 179 downregulated genes
(Table S1). Among the most strongly downregulated genes
Cell Reports 5, 1–12, October 31, 2013 ª2013 The Authors 3

Figure 3. Spheroid and Organoid Transcriptomes Are Different
(A) List of the 33 genes most up- or downregulated in spheroids versus organoids. Data were generated from four independent pairs of spheroid/organoids
samples.
(B) qRT-PCR analysis of transcripts from spheroids and organoids. Six pairs of spheroids/organoids were used. Bars represent mean ± SEM.
(C) GSEA analysis of microarray data versus CBC signature of Munoz et al. (2012).
(D) GSEA analysis of microarray data versus Cdx1KO/Cdx2KO list of upregulated genes (left panel) or downregulated genes (right panel). NES, normalized
enrichment score.
See also Figures S3 and S4 and Tables S1, S2, and S3.
Please cite this article in press as: Mustata et al., Identification of Lgr5-Independent Spheroid-Generating Progenitors of the Mouse Fetal IntestinalEpithelium, Cell Reports (2013), http://dx.doi.org/10.1016/j.celrep.2013.09.005
were differentiation markers corresponding to the four main in-
testinal cell types (Figure 3A and Table S1). Loss of differentiation
markers was confirmed by quantitative RT-PCR (qRT-PCR) and
immunofluorescence (Figures 3B and 4A).
Interestingly, compared to organoids, spheroids also showed
low expression levels of several adult intestinal stem cell markers
(Lgr5/Gpr49, Smoc2, Axin2, Cdx1) (Figure 3B and Table S1).
Gene set enrichment analyses (GSEA) comparing our microarray
results with the set of CBC-enriched genes (Munoz et al., 2012)
4 Cell Reports 5, 1–12, October 31, 2013 ª2013 The Authors
confirmed the downregulation of the CBC signature in spher-
oids (Figure 3C). These data were validated by qRT-PCR and
extended to additional adult stem cell markers: whereas expres-
sion of Tert and Olfm4 were also downregulated in spheroids,
Bmi1 and Ascl2 were expressed at similar levels in spheroids
and organoids (Figure 3B). The uncoupling between Lgr5 and
Ascl2 gene expression was unexpected as both genes are
markers for adult CBCs (van der Flier et al., 2009). In accordance
with qRT-PCR data, expression of Lgr5 and the Wnt reporter
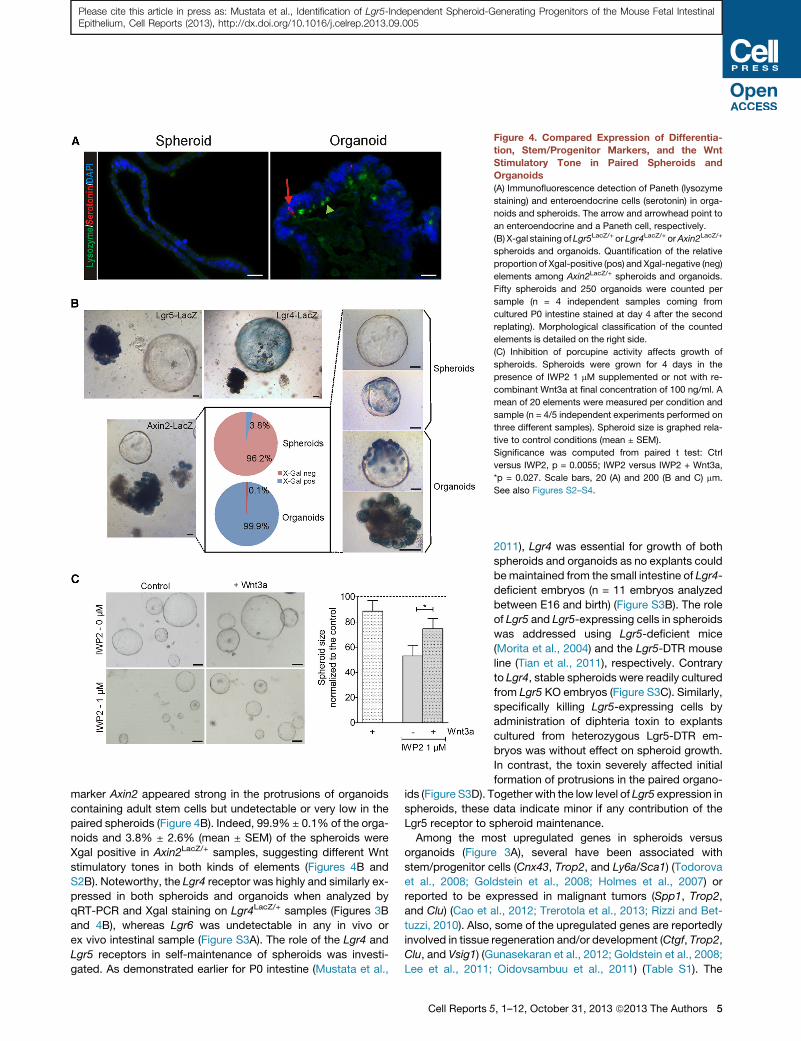
Figure 4. Compared Expression of Differentia-
tion, Stem/Progenitor Markers, and the Wnt
Stimulatory Tone in Paired Spheroids and
Organoids
(A) Immunofluorescence detection of Paneth (lysozyme
staining) and enteroendocrine cells (serotonin) in orga-
noids and spheroids. The arrow and arrowhead point to
an enteroendocrine and a Paneth cell, respectively.
(B) X-gal staining ofLgr5LacZ/+ or Lgr4LacZ/+ orAxin2LacZ/+
spheroids and organoids. Quantification of the relative
proportion of Xgal-positive (pos) and Xgal-negative (neg)
elements among Axin2LacZ/+ spheroids and organoids.
Fifty spheroids and 250 organoids were counted per
sample (n = 4 independent samples coming from
cultured P0 intestine stained at day 4 after the second
replating). Morphological classification of the counted
elements is detailed on the right side.
(C) Inhibition of porcupine activity affects growth of
spheroids. Spheroids were grown for 4 days in the
presence of IWP2 1 mM supplemented or not with re-
combinant Wnt3a at final concentration of 100 ng/ml. A
mean of 20 elements were measured per condition and
sample (n = 4/5 independent experiments performed on
three different samples). Spheroid size is graphed rela-
tive to control conditions (mean ± SEM).
Significance was computed from paired t test: Ctrl
versus IWP2, p = 0.0055; IWP2 versus IWP2 + Wnt3a,
*p = 0.027. Scale bars, 20 (A) and 200 (B and C) mm.
See also Figures S2–S4.
Please cite this article in press as: Mustata et al., Identification of Lgr5-Independent Spheroid-Generating Progenitors of the Mouse Fetal IntestinalEpithelium, Cell Reports (2013), http://dx.doi.org/10.1016/j.celrep.2013.09.005
marker Axin2 appeared strong in the protrusions of organoids
containing adult stem cells but undetectable or very low in the
paired spheroids (Figure 4B). Indeed, 99.9% ± 0.1% of the orga-
noids and 3.8% ± 2.6% (mean ± SEM) of the spheroids were
Xgal positive in Axin2LacZ/+ samples, suggesting different Wnt
stimulatory tones in both kinds of elements (Figures 4B and
S2B). Noteworthy, the Lgr4 receptor was highly and similarly ex-
pressed in both spheroids and organoids when analyzed by
qRT-PCR and Xgal staining on Lgr4LacZ/+ samples (Figures 3B
and 4B), whereas Lgr6 was undetectable in any in vivo or
ex vivo intestinal sample (Figure S3A). The role of the Lgr4 and
Lgr5 receptors in self-maintenance of spheroids was investi-
gated. As demonstrated earlier for P0 intestine (Mustata et al.,
Cell Reports 5
2011), Lgr4 was essential for growth of both
spheroids and organoids as no explants could
be maintained from the small intestine of Lgr4-
deficient embryos (n = 11 embryos analyzed
between E16 and birth) (Figure S3B). The role
of Lgr5 and Lgr5-expressing cells in spheroids
was addressed using Lgr5-deficient mice
(Morita et al., 2004) and the Lgr5-DTR mouse
line (Tian et al., 2011), respectively. Contrary
to Lgr4, stable spheroids were readily cultured
from Lgr5 KO embryos (Figure S3C). Similarly,
specifically killing Lgr5-expressing cells by
administration of diphteria toxin to explants
cultured from heterozygous Lgr5-DTR em-
bryos was without effect on spheroid growth.
In contrast, the toxin severely affected initial
formation of protrusions in the paired organo-
ids (Figure S3D). Together with the low level of Lgr5 expression in
spheroids, these data indicate minor if any contribution of the
Lgr5 receptor to spheroid maintenance.
Among the most upregulated genes in spheroids versus
organoids (Figure 3A), several have been associated with
stem/progenitor cells (Cnx43, Trop2, and Ly6a/Sca1) (Todorova
et al., 2008; Goldstein et al., 2008; Holmes et al., 2007) or
reported to be expressed in malignant tumors (Spp1, Trop2,
and Clu) (Cao et al., 2012; Trerotola et al., 2013; Rizzi and Bet-
tuzzi, 2010). Also, some of the upregulated genes are reportedly
involved in tissue regeneration and/or development (Ctgf, Trop2,
Clu, and Vsig1) (Gunasekaran et al., 2012; Goldstein et al., 2008;
Lee et al., 2011; Oidovsambuu et al., 2011) (Table S1). The
, 1–12, October 31, 2013 ª2013 The Authors 5

Figure 5. Tissue Expression of Spheroid
Markers Ex Vivo and during Fetal Intestinal
Development
(A) Immunofluorescence images of Cnx43 and Trop2
coexpression in spheroids and organoids. Individual
channels for visualizing Cnx43 and Trop2 expression
in spheroids are depicted below the corresponding
merged image.
(B) Immunohistochemical detection of Cnx43 and
Trop2 in duodenal sections at E14, E16.5, and P0.
Arrow shows cells expressing high Trop2 at E16.5,
empty arrowheads evidence epithelial-expressing
Cnx43 at E16.5 and arrowheads points to mesen-
chymal expression of Cnx43.
Scale bars represent 20 mm (A and B). See also
Figure S5.
Please cite this article in press as: Mustata et al., Identification of Lgr5-Independent Spheroid-Generating Progenitors of the Mouse Fetal IntestinalEpithelium, Cell Reports (2013), http://dx.doi.org/10.1016/j.celrep.2013.09.005
preferential expression of Cnx43 and Trop2 in spheroids was
confirmed by qRT-PCR and immunofluorescence on matched
pairs of spheroids/organoids (Figures 3B and 5A).
Before reaching a mature state with multiple crypt-like protru-
sions, organoids display a transient spheroid-like appearance
(Sato et al., 2009) (Figure S4A). The possibility that organoids
would pass through a less differentiated state similar to that of
the spheroids described here was ruled out by qRT-PCR anal-
ysis. Indeed, at their spheroid-like stage, organoids already ex-
hibited low Trop2, Cnx43, and Ccnd1 transcript levels, with
high expression of the differentiation markers (Crypt4, Muc2,
Chga, and Si) (Figure S4A). Of note, the gene expression profiles
of spheroids and organoids were stable, with no substantial
changes of their ratio after ten replatings (Figure S4B).
Given the striking morphological similarity of fetal spheroids
with those reported from cultured adult Apcmin adenomas, we
comparedourmicroarraydata to the short list of 38genesupregu-
lated in adenomas and their related organotypic cultures (Farrall
et al., 2012). Twelve genes appeared commonly upregulated in
both kinds of spheroid cultures, with the Trop2marker ranking in
6 Cell Reports 5, 1–12, October 31, 2013 ª2013 The Authors
the top list, pointing to b-catenin-dependent
activation of partially overlappinggenetic pro-
grams in the two cases (Table S2). Coherent
with this view, spheroid growth was inhibited
in a dose-dependent manner by the porcu-
pine inhibitor IWP2 and partially restored by
Wnt3a addition to the culture medium (Fig-
ures 4CandS4C). This suggests dependence
of spheroids on autocrine production of Wnt
ligand for their survival. Unexpectedly, only
two genes (Trex2 and Foxq1) out of the 80
making the intestinal Wnt/TCF signature
reported by Van der Flier et al. (2007) were
found to be upregulated in fetal spheroids.
Togetherwith the lowexpressionof additional
Wnt target genes in fetal spheroids (Lgr5
and Axin2), this suggests that Wnt would act
differently, depending on the epigenetic
status of the Apcmin and fetal spheroids.
From these observations, we concluded
that spheroids are made of poorly differenti-
ated intestinal cells with progenitor/stem cell characteristics
different from those of adult CBCs.
Spheroids Cells Correspond to Incompletely CaudalizedProgenitorsFurther inspection of the list of genes upregulated in spheroids
pointed to gastric and esophageal genes such asGkn1,2,3, Invo-
lucrin, Vsig1, and Krt4 (Figure 3A and Table S1). Together with
the strong downregulation of the caudal type homeobox 1
gene Cdx1 observed in spheroids (Figure 3B), this prompted
us to compare byGSEA ourmicroarray results to the list of genes
up- and downregulated in the intestine of Cdx1/Cdx2 double
knockouts, which are known to lose intestinal differentiation
and acquire expression of gastric markers (Verzi et al., 2011). A
clear positive relation was observed between the spheroid
versus organoids and the Cdx1/Cdx2 knockout intestine data
sets (Figure 3D), suggesting a lack of caudal differentiation in
spheroid cells. Surprisingly, this phenotype is observed despite
low but detectable expression of Cdx2 in spheroids (Figure 3B),
suggesting that the reported redundancy of Cdx genes in the

Please cite this article in press as: Mustata et al., Identification of Lgr5-Independent Spheroid-Generating Progenitors of the Mouse Fetal IntestinalEpithelium, Cell Reports (2013), http://dx.doi.org/10.1016/j.celrep.2013.09.005
intestine (Beck and Stringer, 2010) is not effective in the context
of spheroids.
Trop2 and Cnx43 Are Expressed in the Fetal Epitheliumof the Mouse IntestineThe Trop2 molecule is highly expressed in several types of
tumors, including colorectal cancer, but its expression pattern
in the developing intestine has not yet been studied (Ohmachi
et al., 2006). As reported in Figures 5B and S5A, Trop2 was ex-
pressed at high levels in all epithelial proliferating progenitors of
the E14 duodenum. At E15.5, strong membrane staining was
observed in cells present at the tip of the newly formed villi
with lower but still detectable signal, in the intervillus zone (Fig-
ure S5A). Between E16.5 and birth, these strongly labeled cells
progressively disappeared, having likely been shed from the villi
(Figure 5B). Similar staining was observed in the ileum (Fig-
ure S5B). When sorted from fetal intestine and cultured
ex vivo, the epithelial Trop2+ cells generated spheroids, demon-
strating a direct filiation between in vivo Trop2+ cells and ex vivo
spheroids (Figure S5C). Of note, several transcripts found to
be enriched in spheroids displayed lower or absent expression
in Trop2+ cells sorted from the E15 intestine, indicating an
effect of the ex vivo culture conditions on spheroid phenotype
(Table S3).
Intestinal expression was also studied for the gap junction pro-
tein Cnx43 (second position in themicroarray list). At E14, Cnx43
was expressed in the lateral intercellular epithelial membranes
and at the basal pole of epithelial cells at the mesenchymal inter-
face (Figure 5B). At E16.5, Cnx43 was found in a more restricted
pattern in the epithelium, being almost exclusively detected in
cells of the intervillus region and showing a characteristic punc-
tuate staining (Figures 5B and S5D). In addition, Cnx43 was also
detected in rare mesenchymal cells, many of them located un-
derneath the epithelium of the intervillus region and within the
mesenchymal bud of nascent villi. At P0, Cnx43 was almost
exclusively expressed in mesenchymal cells surrounding the
epithelium, often organized into clusters (Figures 5B and S5D).
Cnx43-Expressing Cells Contribute to Prenatal VillusFormationWe used lineage tracing to explore the respective contribution of
Cnx43+ and Lgr5+ cells to generation of the fetal and postnatal
intestine. Cnx43-Cre/Rosa26R and Lgr5-Cre/Rosa26R embryos
were pulsedwith tamoxifen at the onset of villogenesis (E15), and
the labeling patterns were assessed at several time points pre-
and postnatally. One day post pulse (dpp), Cnx43-Cre/Rosa26R
embryos displayed numerous labeled cells in newly formed villi
and intervillus regions, mainly as single cells but also sometimes
as small groups of two to three cells, whereas 3 dpp the number
of labeled cells had decreased (Figure 6A). At a later time, most
epithelial positive cells disappeared from the intestine, with
labeling confined to villus extremities and only sparse intervillus
regions around birth (6 dpp, Figure S6A) and very rare ribbons of
crypt/villus units later (2 weeks pp, Figure 6A). In contrast, in E15-
pulsed Lgr5-Cre/Rosa26R embryos, only very rare labeled cells
were observed after 1 and 3 dpp, which persisted postnatally
(2 weeks pp), suggesting a minor contribution of Lgr5+ cells to
prenatal villus formation (Figure 6A). Low lineage tracing due to
potential variegation of the Lgr5-Cre knockin allele was unlikely
considering the number of embryos analyzed giving similar re-
sults (see Experimental Procedures). When a long pulse was per-
formed during the neonatal period via the lactating female (from
P5 to P8), Cnx43-dependent recombination yielded only mesen-
chymal labeling and virtually no epithelial labeling, in agreement
with the observed loss of Cnx43 epithelial expression around
birth (Figure 6B). In contrast, Lgr5-Cre/Rosa26R intestine dis-
played abundant labeling of crypt/villus units, compatible with
the tracing of immediate CBC precursors (Figures 6B and
S6B). Quantification of lineage tracing confirmed these observa-
tions (Figure 6C). Together, these results suggest that Cnx43+
cells function as progenitors of prenatal villi, their offspring being
lost by shedding in the lumen as Trop2+ cells (Figure S5B). Only a
small proportion of them, likely those gaining expression of Lgr5
in the forming intervillus region, may function as progenitors of
adult crypt-villus units. In agreement with this view, the rare post-
natal ribbons of cells generated from E15 Cnx43-positive pro-
genitors express Lgr5 in the crypts (Figure S6C).
Fetal Spheroids Can Differentiate into OrganoidsThe ability of spheroid Cnx43+ cells to potentially convert into
adult Lgr5+ CBCs was investigated in the ex vivo culture system.
After 7–8 days of culture, despite the stability of the phenotype, a
small proportion of the grown elements generated dark spheres,
with intraluminal accumulation of dead cells, and some of these
emitted protrusions similar to the crypt-like domains of organo-
ids (�1.4%) (Figures 7A and 7D). As expected for miniguts, the
newly formed organoids demonstrated strong expression of
Lgr5 restricted to the protrusions and exhibited expression of dif-
ferentiation markers from the absorptive and secretory lineages
(Figure 7C). Interestingly, the proportion of spheroids displaying
morphological differentiation toward an organoid-like phenotype
increased to 11.5% when spheroids were grown in a medium
containing the gamma secretase inhibitor DAPT (1 mM) (Figures
7B and 7D). As observed in the case of spontaneous differentia-
tion, after replating in normal medium, the organoid-like ele-
ments generated in the presence of DAPT gave rise to stable
organoids. These results indicate that fetal spheroids have the
potential to generate adult-type CBCs.
DISCUSSION
Using the minigut culture system, we have isolated from fetal in-
testine self-renewing cells that generate immortal epithelial
‘‘spheroids.’’ Spheroids display genetic commitment to intesti-
nal differentiation but express low levels of intestinal markers in
comparison to organoids and their gene expression profile dif-
fers radically from that of adult CBC stem cells. Several lines of
evidences suggest that spheroid cells represent a ‘‘frozen state’’
of progenitors found in the epithelium before the onset of villo-
genesis in vivo (i.e., around E14). A first strong argument in favor
of this hypothesis is given by the inverse relation between the
proportion of spheroids obtained from fetal tissue explants and
the developmental stage: whereas E14–E15 tissue generates
close to 100% spheroids, the ratio progressively decreases dur-
ing late fetal development, approaching zerowhen crypts start to
form (P5 onward). Second, we have shown that all epithelial cells
Cell Reports 5, 1–12, October 31, 2013 ª2013 The Authors 7
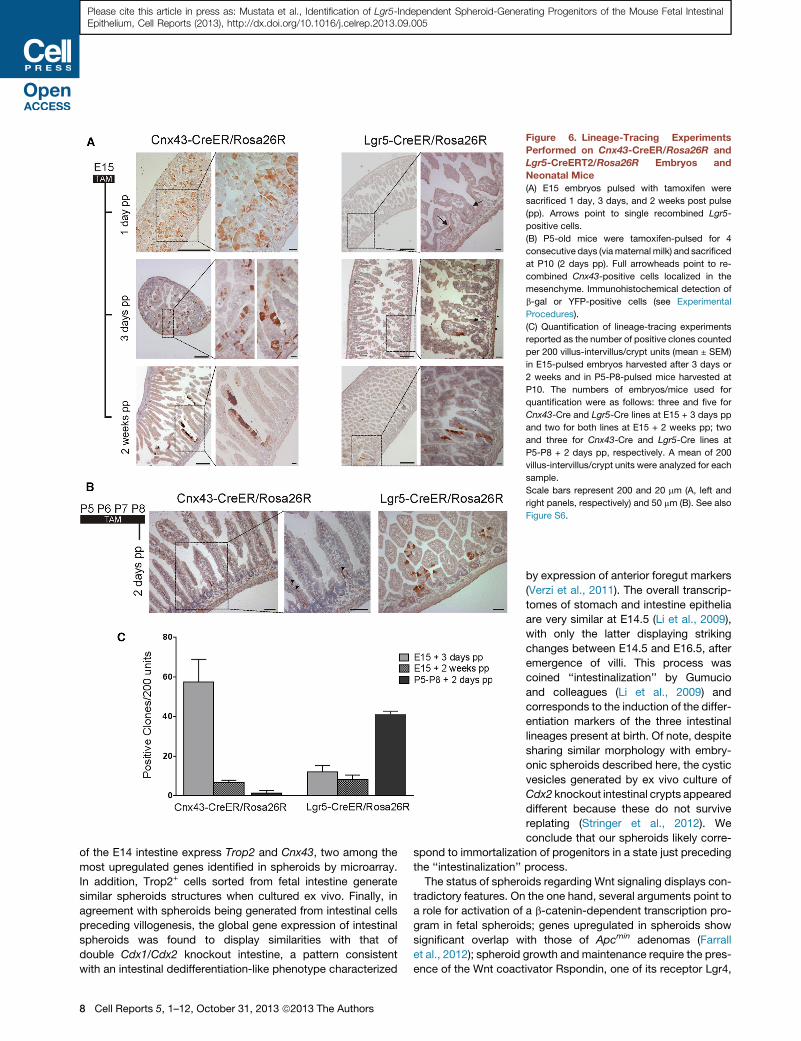
Figure 6. Lineage-Tracing Experiments
Performed on Cnx43-CreER/Rosa26R and
Lgr5-CreERT2/Rosa26R Embryos and
Neonatal Mice
(A) E15 embryos pulsed with tamoxifen were
sacrificed 1 day, 3 days, and 2 weeks post pulse
(pp). Arrows point to single recombined Lgr5-
positive cells.
(B) P5-old mice were tamoxifen-pulsed for 4
consecutive days (viamaternal milk) and sacrificed
at P10 (2 days pp). Full arrowheads point to re-
combined Cnx43-positive cells localized in the
mesenchyme. Immunohistochemical detection of
b-gal or YFP-positive cells (see Experimental
Procedures).
(C) Quantification of lineage-tracing experiments
reported as the number of positive clones counted
per 200 villus-intervillus/crypt units (mean ± SEM)
in E15-pulsed embryos harvested after 3 days or
2 weeks and in P5-P8-pulsed mice harvested at
P10. The numbers of embryos/mice used for
quantification were as follows: three and five for
Cnx43-Cre and Lgr5-Cre lines at E15 + 3 days pp
and two for both lines at E15 + 2 weeks pp; two
and three for Cnx43-Cre and Lgr5-Cre lines at
P5-P8 + 2 days pp, respectively. A mean of 200
villus-intervillus/crypt units were analyzed for each
sample.
Scale bars represent 200 and 20 mm (A, left and
right panels, respectively) and 50 mm (B). See also
Figure S6.
Please cite this article in press as: Mustata et al., Identification of Lgr5-Independent Spheroid-Generating Progenitors of the Mouse Fetal IntestinalEpithelium, Cell Reports (2013), http://dx.doi.org/10.1016/j.celrep.2013.09.005
of the E14 intestine express Trop2 and Cnx43, two among the
most upregulated genes identified in spheroids by microarray.
In addition, Trop2+ cells sorted from fetal intestine generate
similar spheroids structures when cultured ex vivo. Finally, in
agreement with spheroids being generated from intestinal cells
preceding villogenesis, the global gene expression of intestinal
spheroids was found to display similarities with that of
double Cdx1/Cdx2 knockout intestine, a pattern consistent
with an intestinal dedifferentiation-like phenotype characterized
8 Cell Reports 5, 1–12, October 31, 2013 ª2013 The Authors
by expression of anterior foregut markers
(Verzi et al., 2011). The overall transcrip-
tomes of stomach and intestine epithelia
are very similar at E14.5 (Li et al., 2009),
with only the latter displaying striking
changes between E14.5 and E16.5, after
emergence of villi. This process was
coined ‘‘intestinalization’’ by Gumucio
and colleagues (Li et al., 2009) and
corresponds to the induction of the differ-
entiation markers of the three intestinal
lineages present at birth. Of note, despite
sharing similar morphology with embry-
onic spheroids described here, the cystic
vesicles generated by ex vivo culture of
Cdx2 knockout intestinal crypts appeared
different because these do not survive
replating (Stringer et al., 2012). We
conclude that our spheroids likely corre-
spond to immortalization of progenitors in a state just preceding
the ‘‘intestinalization’’ process.
The status of spheroids regarding Wnt signaling displays con-
tradictory features. On the one hand, several arguments point to
a role for activation of a b-catenin-dependent transcription pro-
gram in fetal spheroids; genes upregulated in spheroids show
significant overlap with those of Apcmin adenomas (Farrall
et al., 2012); spheroid growth and maintenance require the pres-
ence of the Wnt coactivator Rspondin, one of its receptor Lgr4,
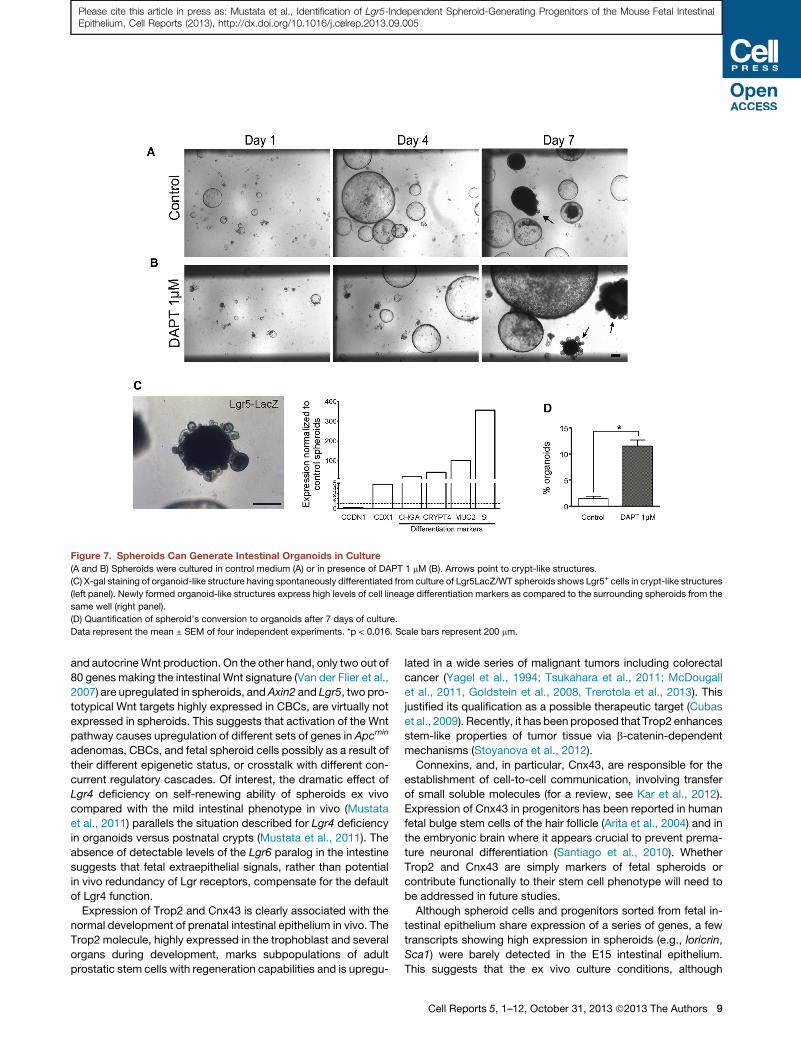
Figure 7. Spheroids Can Generate Intestinal Organoids in Culture
(A and B) Spheroids were cultured in control medium (A) or in presence of DAPT 1 mM (B). Arrows point to crypt-like structures.
(C) X-gal staining of organoid-like structure having spontaneously differentiated from culture of Lgr5LacZ/WT spheroids shows Lgr5+ cells in crypt-like structures
(left panel). Newly formed organoid-like structures express high levels of cell lineage differentiation markers as compared to the surrounding spheroids from the
same well (right panel).
(D) Quantification of spheroid’s conversion to organoids after 7 days of culture.
Data represent the mean ± SEM of four independent experiments. *p < 0.016. Scale bars represent 200 mm.
Please cite this article in press as: Mustata et al., Identification of Lgr5-Independent Spheroid-Generating Progenitors of the Mouse Fetal IntestinalEpithelium, Cell Reports (2013), http://dx.doi.org/10.1016/j.celrep.2013.09.005
and autocrineWnt production. On the other hand, only two out of
80 genes making the intestinal Wnt signature (Van der Flier et al.,
2007) are upregulated in spheroids, andAxin2 and Lgr5, two pro-
totypical Wnt targets highly expressed in CBCs, are virtually not
expressed in spheroids. This suggests that activation of the Wnt
pathway causes upregulation of different sets of genes in Apcmin
adenomas, CBCs, and fetal spheroid cells possibly as a result of
their different epigenetic status, or crosstalk with different con-
current regulatory cascades. Of interest, the dramatic effect of
Lgr4 deficiency on self-renewing ability of spheroids ex vivo
compared with the mild intestinal phenotype in vivo (Mustata
et al., 2011) parallels the situation described for Lgr4 deficiency
in organoids versus postnatal crypts (Mustata et al., 2011). The
absence of detectable levels of the Lgr6 paralog in the intestine
suggests that fetal extraepithelial signals, rather than potential
in vivo redundancy of Lgr receptors, compensate for the default
of Lgr4 function.
Expression of Trop2 and Cnx43 is clearly associated with the
normal development of prenatal intestinal epithelium in vivo. The
Trop2 molecule, highly expressed in the trophoblast and several
organs during development, marks subpopulations of adult
prostatic stem cells with regeneration capabilities and is upregu-
lated in a wide series of malignant tumors including colorectal
cancer (Yagel et al., 1994; Tsukahara et al., 2011; McDougall
et al., 2011, Goldstein et al., 2008, Trerotola et al., 2013). This
justified its qualification as a possible therapeutic target (Cubas
et al., 2009). Recently, it has been proposed that Trop2 enhances
stem-like properties of tumor tissue via b-catenin-dependent
mechanisms (Stoyanova et al., 2012).
Connexins, and, in particular, Cnx43, are responsible for the
establishment of cell-to-cell communication, involving transfer
of small soluble molecules (for a review, see Kar et al., 2012).
Expression of Cnx43 in progenitors has been reported in human
fetal bulge stem cells of the hair follicle (Arita et al., 2004) and in
the embryonic brain where it appears crucial to prevent prema-
ture neuronal differentiation (Santiago et al., 2010). Whether
Trop2 and Cnx43 are simply markers of fetal spheroids or
contribute functionally to their stem cell phenotype will need to
be addressed in future studies.
Although spheroid cells and progenitors sorted from fetal in-
testinal epithelium share expression of a series of genes, a few
transcripts showing high expression in spheroids (e.g., loricrin,
Sca1) were barely detected in the E15 intestinal epithelium.
This suggests that the ex vivo culture conditions, although
Cell Reports 5, 1–12, October 31, 2013 ª2013 The Authors 9

Please cite this article in press as: Mustata et al., Identification of Lgr5-Independent Spheroid-Generating Progenitors of the Mouse Fetal IntestinalEpithelium, Cell Reports (2013), http://dx.doi.org/10.1016/j.celrep.2013.09.005
allowing survival of progenitors as spheroids, cause some distor-
tion of gene expression profile. A similar observation has been
reported when culturing adult normal and Apcmin adenoma tis-
sues (Farrall et al., 2012). Nonetheless, the strikingly different
gene expression profiles displayed by fetal spheroids and orga-
noids generated from the same intestine, when exposed to the
same culture conditions, highlight the different nature of the
self-renewing cells from which they originate. The fundamental
difference between CBCs and spheroid-generating cells is
further attested by their different Lgr5 status. Whereas CBCs
are currently defined as Lgr5-positive cells, fetal spheroids ex-
press low level of this gene and experiments with Lgr5-DTR
embryos demonstrate that spheroids do thrive in the absence
of Lgr5-expressing cells.
The progressive decrease in the number of Cnx43+ cells in
fetal intestinal epithelium during the E14–E18 period parallels
the spheroid-generating ability of intestinal explants and fits
with the lineage-tracing experiments of Cnx43+ cells performed
in utero and during the neonatal period. Together, these obser-
vations suggest that Trop2/Cnx43+ cells act as transient stem
cells responsible for the generation of fetal intestine in an envi-
ronment characterized by low Wnt and high Bmp stimulatory
tones prevailing at this period of intestinal development (Karls-
son et al., 2000; Li et al., 2009; Kim et al., 2007; Korinek et al.,
1998). In contrast, the majority of Lgr5+ cells are generated later
as precursors of adult CBCs. Ex vivo experiments showing the
capacity of Cnx43+ cells to convert to organoids suggest that a
fraction of these cells would be the precursors of Lgr5+ cells pre-
sent in the intervillus region during late gestation (Garcia et al.,
2009), whereas the vast majority of them are lost at the tip of
prenatal villi. Only very rare E15 Cnx43+ cells contribute directly
to the postnatal epithelium, being likely those that already ex-
pressed, or gained expression, of Lgr5 in a higher Wnt environ-
ment (Li et al., 2009). The boosting effect on spontaneous
conversion of spheroids to organoids observed ex vivo in the
presence of DAPT suggests that Notch pathway contributes to
maintenance of spheroid progenitor cells in an undifferentiated
state, as it contributes to proliferation of adult intestinal stem
cells (Noah and Shroyer, 2013).
Reminiscent of a switch from Cnx43+ progenitors of the early
intestinal epithelium to Lgr5+ stem cells, establishment of the
definitive intestinal epithelium adapted to digestion of adult
food type is known to be a two-step process in batrachians
(for a review, see Ishizuya-Oka and Hasebe, 2013). During meta-
morphosis of Xenopus laevis, the intestinal epithelium of the
tadpole is totally replaced by a novel, definitive epithelium gener-
ated from rare Lgr5+ cells. Similarly, our results suggest that the
intestinal epithelium in mammals is generated in two waves
relying on different kinds of stem cells: a transient, fetal wave
relies on Cnx43-positive progenitors, whereas the postnatal
epithelium is generated from Lgr5-positive precursors of CBCs.
Altogether, our data establish a relationship between transient
progenitors responsible for generation of fetal intestinal epithe-
lium and immortal spheroid-generating cells having the capa-
bility to ‘‘differentiate’’ into CBCs. This is of particular interest
in the recently documented context of interconversion of the
various adult intestinal stem cell types, in situations of epithelial
regeneration (Takeda et al., 2011; Tian et al., 2011; Parry et al.,
10 Cell Reports 5, 1–12, October 31, 2013 ª2013 The Authors
2013; Yan et al., 2012; Roth et al., 2012; Munoz et al., 2012;
Montgomery et al., 2011). Considering that most spheroid cells
are mitotically active and display an early, poorly differentiated
intestinal phenotype, grafting of spheroids cells could be partic-
ularly efficient in regeneration of injured gut epithelium.
EXPERIMENTAL PROCEDURES
Animal Experiments and Tissue Processing
Animal procedures complied with the guidelines of the EU and were approved
by the Local Ethical Committee. Mice strains were CD1 (Charles River Labora-
tories), Lgr5/LacZ-NeoR knockin (Morita et al., 2004), Lgr5-DTR knockin (Tian
et al., 2011), Lgr4/Gpr48^Gt (Leighton et al., 2001), Cnx43-KI-Cre-ER(T)
(EMMA), Rosa26R-LacZ, Rosa26R-YFP, Lgr5-Cre-ERT2, and Axin2-lacZ
(Jax mice). The day the vaginal plug was observed was considered as E0.5.
For lineage-tracing experiments, tamoxifen (Sigma-Aldrich) was dissolved
in a sunflower oil (Sigma-Aldrich)/ethanol mixture (9:1) at 10 mg/ml and used
in all experiments at a dose of 0.1 mg/g of body weight. For in utero induction,
pregnant mothers were injected intraperitoneally at E15. When required,
cesarean sections were performed for delivery, and newborn mice were
nursed by adoptive lactating females. For neonatal induction, lactating
mothers were injected intraperitoneally once a day for 4 consecutive days
(from P5 to P8). TheRosa26R-LacZ background was used in all Lgr5-CreERT2
experiments. For the experiments using Cnx43-CreERT, the Rosa26R-LacZ
background was used for in utero pulse + 1 and 6 dpp, and the Rosa26R-
YFP context was used in the embryonic pulse + 3 dpp and + 2 weeks pp as
well as in neonatal pulse + 2 dpp. The number of embryos analyzed for each
time point were as follows: lineage tracing with Cnx43-Cre (n = 4, 4, 3, 2,
and 2, for E15 + 1 dpp, 3 dpp, 6 dpp, 2 weeks pp and postnatal pulse, respec-
tively); lineage tracing with Lgr5-Cre (n = 10, 7, 2, and 3, for E15 + 1 dpp, 3 dpp,
2 weeks pp and postnatal pulse, respectively).
Tissue processing, histological protocols, and immunofluorescence/histo-
chemistry experiments were carried out as previously described (Garcia
et al., 2009). The primary antibodies used for staining were mouse anti-E-
cadherin, rat anti-CD44, mouse antibromodeoxyuridine, all from BD Biosci-
ences, goat anti-Villin (Santa Cruz Biotechnology), mouse antiserotonin and
rabbit antilysozyme from Dako, goat anti-Trop2 (R&D Systems), rabbit anti-
Cnx43 (Cell Signaling), rabbit anti-ZO-1 (Invitrogen), and chicken anti-b-gal
and anti-YFP (Abcam). EdU staining (Invitrogen) and TUNEL assays (Roche)
were performed according to the manufacturer’s instructions. Samples were
visualized with Zeiss Axioplan2 (immunohistochemistry) or Zeiss Observer
Z1 microscope (immunofluorescence).
Ex Vivo Culture
Small intestinal tissue was dissociated, and epithelial samples were cultured
as previously described (Mustata et al., 2011). Specifically, the culture medium
was composed of Advanced-DMEM/F12 medium supplemented with 2 mM
L-glutamine, gentamycin, penicillin-streptomycin cocktail, and 2% fetal
bovine serum (Gibco). The only growth factors added to the culture medium
were at a final concentration of 50 ng/ml EGF (PeproTech), 100 ng/ml Noggin
(PeproTech), and 500 ng/ml R-spondin1 (R&D Systems). Culture medium was
changed every other day, and, after 5–7 days in culture, spheroids and organo-
ids pairs were harvested, mechanically dissociated, and replated in fresh
Matrigel.
Diphteria toxin, IWP2, or DAPT compounds (all from Sigma-Aldrich) were
added together with fresh medium. In experiments with Trop2+-sorted cells,
1 mM JAG-1 (Anaspec) was added to the Matrigel, and the culture medium
was supplemented with 10 mM Y-27632 (Sigma). For Xgal staining experi-
ments, ex vivo cultures were prefixed for 15 min at room temperature before
proceeding to staining as described (Garcia et al., 2009). Pictures were
acquired with a Moticam Pro camera connected to Motic AE31 microscope
or with a Leica DFC 420C camera using the Leica Application Suite V3.8 soft-
ware. For electron microscopy studies, spheroids and organoids cultured in
Matrigel were layered onto a nitrocellulose filter, and samples were processed
as described in Supplemental Experimental Procedures. Fluorescence-acti-
vated cell sorting (FACS) is detailed in Supplemental Experimental Procedures.

Please cite this article in press as: Mustata et al., Identification of Lgr5-Independent Spheroid-Generating Progenitors of the Mouse Fetal IntestinalEpithelium, Cell Reports (2013), http://dx.doi.org/10.1016/j.celrep.2013.09.005
Microarray Experiments
Two-channel microarray experiments were performed from spheroid/orga-
noid pairs isolated each from a given embryo. Specifically, spheroid/organoid
pairs were obtained as reported in Figure 1A. Following initial seeding of small
intestine from a given embryo/mouse (at E16, E18, or P0), spheroids and orga-
noids were selectively picked up for each animal and replated for three pas-
sages to reach sample homogeneity. Hybridization was performed on the
four independent pairs with dye-swap, on Mouse ReadyArray MM1100 slides
(38,467 70-mer probes; MI-Microarrays), as described (Garcia et al., 2009).
SAM analysis was performed using default parameters. A list of 1,982
upregulated and 1,276 downregulated genes was obtained. Unknown and
duplicate genes were removed and genes modulated more than 2-fold with
q value <0.054 were kept. The resulting short list of 317 upregulated and
179 downregulated genes is provided in Table S1.
Quantitative Real-Time PCR
Quantitative real-time PCR was performed on total RNA as reported (Garcia
et al., 2009). Expression levels were normalized to that of the house keeping
genes (HPRT, RPL13, and TBP). Each sample was run in duplicate. Primer
sequences were previously reported (Mustata et al., 2011) or are listed in
Supplemental Experimental Procedures.
Statistical Evaluation
Statistical analyses were performed with GraphPad Prism. All experimental
data are expressed as mean ± SEM. The significance of differences between
groups was determined by unpaired nonparametric (Mann-Whitney) test or
paired t test analysis.
ACCESSION NUMBERS
Microarray data sets were deposited in the Gene Expression Omnibus under
accession number GSE49803.
SUPPLEMENTAL INFORMATION
Supplemental Information includes Supplemental Experimental Procedures,
six figures, and three tables and can be found with this article online at
http://dx.doi.org/10.1016/j.celrep.2013.09.005.
AUTHOR CONTRIBUTIONS
R.C.M., G. Vasile, V.F.-V., S.S., and M.-I.G. performed the majority of the ex-
periments. A.F. and F.L. performed the microarray experiments and made the
related statistical analyses. D.M. and D.P.-M. performed and analyzed the
electron microscopy experiments. R.C.M., G.Vassart, V.F.-V., G. Vasile, and
M.-I.G. conceived the experiments and analyzed the results. R.C.M., G. Vas-
sart, and M.-I.G. wrote the paper.
ACKNOWLEDGMENTS
We are grateful to William C. Skarnes, Genentech, and Hans Clevers for
providing us with Lgr4/Gpr48^Gt, Lgr5-DTR, and Lgr5-LacZ-NeoR knockin
mice, respectively. We thank Christine Dubois for assistance in cell sorting ex-
periments and Cedric Blanpain, David Communi, and Pierre Vanderhaeghen
for critical reading of the manuscript. This work was supported by the Interuni-
versity Attraction Poles Programme-Belgian State-Belgian Science Policy
(6/14), the Fonds de la Recherche Scientifique Medicale of Belgium, the
Walloon Region (program ‘‘Cibles’’), and the not-for-profit Association
Recherche Biomedicale et Diagnostic. The CMMI is supported by the Euro-
pean Regional Development Fund and the Walloon Region.
Received: May 22, 2013
Revised: July 16, 2013
Accepted: September 4, 2013
Published: October 17, 2013
REFERENCES
Arita, K., Akiyama, M., Tsuji, Y., McMillan, J.R., Eady, R.A., and Shimizu, H.
(2004). Gap junction development in the human fetal hair follicle and bulge
region. Br. J. Dermatol. 150, 429–434.
Barker, N., van Es, J.H., Kuipers, J., Kujala, P., van den Born, M., Cozijnsen,
M., Haegebarth, A., Korving, J., Begthel, H., Peters, P.J., and Clevers, H.
(2007). Identification of stem cells in small intestine and colon by marker
gene Lgr5. Nature 449, 1003–1007.
Barker, N., van Oudenaarden, A., and Clevers, H. (2012). Identifying the stem
cell of the intestinal crypt: strategies and pitfalls. Cell Stem Cell 11, 452–460.
Beck, F., and Stringer, E.J. (2010). The role of Cdx genes in the gut and in axial
development. Biochem. Soc. Trans. 38, 353–357.
Buczacki, S.J., Zecchini, H.I., Nicholson, A.M., Russell, R., Vermeulen, L.,
Kemp, R., and Winton, D.J. (2013). Intestinal label-retaining cells are secretory
precursors expressing Lgr5. Nature 495, 65–69.
Cao, D.X., Li, Z.J., Jiang, X.O., Lum, Y.L., Khin, E., Lee, N.P., Wu, G.H., and
Luk, J.M. (2012). Osteopontin as potential biomarker and therapeutic target
in gastric and liver cancers. World J. Gastroenterol. 18, 3923–3930.
Cubas, R., Li, M., Chen, C., and Yao, Q. (2009). Trop2: a possible therapeutic
target for late stage epithelial carcinomas. Biochim. Biophys. Acta 1796,
309–314.
Farrall, A.L., Riemer, P., Leushacke, M., Sreekumar, A., Grimm, C., Herrmann,
B.G., and Morkel, M. (2012). Wnt and BMP signals control intestinal adenoma
cell fates. Int. J. Cancer 131, 2242–2252.
Garcia, M.I., Ghiani, M., Lefort, A., Libert, F., Strollo, S., and Vassart, G. (2009).
LGR5 deficiency deregulates Wnt signaling and leads to precocious Paneth
cell differentiation in the fetal intestine. Dev. Biol. 331, 58–67.
Goldstein, A.S., Lawson, D.A., Cheng, D., Sun, W., Garraway, I.P., and Witte,
O.N. (2008). Trop2 identifies a subpopulation of murine and human prostate
basal cells with stem cell characteristics. Proc. Natl. Acad. Sci. USA 105,
20882–20887.
Gunasekaran, U., Hudgens, C.W., Wright, B.T., Maulis, M.F., and Gannon, M.
(2012). Differential regulation of embryonic and adult b cell replication. Cell
Cycle 11, 2431–2442.
Holmes, C., Khan, T.S., Owen, C., Ciliberti, N., Grynpas, M.D., and Stanford,
W.L. (2007). Longitudinal analysis of mesenchymal progenitors and bone qual-
ity in the stem cell antigen-1-null osteoporotic mouse. J. Bone Miner. Res. 22,
1373–1386.
Ishizuya-Oka, A., and Hasebe, T. (2013). Establishment of intestinal stem cell
niche during amphibian metamorphosis. Curr. Top. Dev. Biol. 103, 305–327.
Kar, R., Batra, N., Riquelme, M.A., and Jiang, J.X. (2012). Biological role of
connexin intercellular channels and hemichannels. Arch. Biochem. Biophys.
524, 2–15.
Karlsson, L., Lindahl, P., Heath, J.K., and Betsholtz, C. (2000). Abnormal
gastrointestinal development in PDGF-A and PDGFR-(alpha) deficient mice
implicates a novel mesenchymal structure with putative instructive properties
in villus morphogenesis. Development 127, 3457–3466.
Kim, B.M., Mao, J., Taketo, M.M., and Shivdasani, R.A. (2007). Phases of
canonical Wnt signaling during the development of mouse intestinal epithe-
lium. Gastroenterology 133, 529–538.
Korinek, V., Barker, N., Moerer, P., van Donselaar, E., Huls, G., Peters, P.J.,
and Clevers, H. (1998). Depletion of epithelial stem-cell compartments in the
small intestine of mice lacking Tcf-4. Nat. Genet. 19, 379–383.
Lee, S., Hong, S.W., Min, B.H., Shim, Y.J., Lee, K.U., Lee, I.K., Bendayan, M.,
Aronow, B.J., and Park, I.S. (2011). Essential role of clusterin in pancreas
regeneration. Dev. Dyn. 240, 605–615.
Leighton, P.A., Mitchell, K.J., Goodrich, L.V., Lu, X., Pinson, K., Scherz, P.,
Skarnes, W.C., and Tessier-Lavigne, M. (2001). Defining brain wiring patterns
and mechanisms through gene trapping in mice. Nature 410, 174–179.
Li, X., Udager, A.M., Hu, C., Qiao, X.T., Richards, N., andGumucio, D.L. (2009).
Dynamic patterning at the pylorus: formation of an epithelial intestine-stomach
boundary in late fetal life. Dev. Dyn. 238, 3205–3217.
Cell Reports 5, 1–12, October 31, 2013 ª2013 The Authors 11

Please cite this article in press as: Mustata et al., Identification of Lgr5-Independent Spheroid-Generating Progenitors of the Mouse Fetal IntestinalEpithelium, Cell Reports (2013), http://dx.doi.org/10.1016/j.celrep.2013.09.005
McDougall, A.R., Hooper, S.B., Zahra, V.A., Sozo, F., Lo, C.Y., Cole, T.J.,
Doran, T., and Wallace, M.J. (2011). The oncogene Trop2 regulates fetal
lung cell proliferation. Am. J. Physiol. Lung Cell. Mol. Physiol. 301, L478–L489.
Montgomery, R.K., Carlone, D.L., Richmond, C.A., Farilla, L., Kranendonk,
M.E., Henderson, D.E., Baffour-Awuah, N.Y., Ambruzs, D.M., Fogli, L.K.,
Algra, S., and Breault, D.T. (2011). Mouse telomerase reverse transcriptase
(mTert) expression marks slowly cycling intestinal stem cells. Proc. Natl.
Acad. Sci. USA 108, 179–184.
Morita, H., Mazerbourg, S., Bouley, D.M., Luo, C.W., Kawamura, K., Kuwa-
bara, Y., Baribault, H., Tian, H., and Hsueh, A.J. (2004). Neonatal lethality of
LGR5 null mice is associated with ankyloglossia and gastrointestinal disten-
sion. Mol. Cell. Biol. 24, 9736–9743.
Munoz, J., Stange, D.E., Schepers, A.G., van de Wetering, M., Koo, B.K.,
Itzkovitz, S., Volckmann, R., Kung, K.S., Koster, J., Radulescu, S., et al.
(2012). The Lgr5 intestinal stem cell signature: robust expression of proposed
quiescent ‘‘+4’’ cell markers. EMBO J. 31, 3079–3091.
Mustata, R.C., Van Loy, T., Lefort, A., Libert, F., Strollo, S., Vassart, G., and
Garcia, M.I. (2011). Lgr4 is required for Paneth cell differentiation and mainte-
nance of intestinal stem cells ex vivo. EMBO Rep. 12, 558–564.
Noah, T.K., and Shroyer, N.F. (2013). Notch in the intestine: regulation of
homeostasis and pathogenesis. Annu. Rev. Physiol. 75, 263–288.
Ohmachi, T., Tanaka, F., Mimori, K., Inoue, H., Yanaga, K., andMori, M. (2006).
Clinical significance of TROP2 expression in colorectal cancer. Clin. Cancer
Res. 12, 3057–3063.
Oidovsambuu, O., Nyamsuren, G., Liu, S., Goring, W., Engel, W., and Adham,
I.M. (2011). Adhesion protein VSIG1 is required for the proper differentiation of
glandular gastric epithelia. PLoS ONE 6, e25908.
Parry, L., Young, M., El Marjou, F., and Clarke, A.R. (2013). Evidence for a
crucial role of paneth cells in mediating the intestinal response to injury.
Stem Cells 31, 776–785.
Rizzi, F., and Bettuzzi, S. (2010). The clusterin paradigm in prostate and breast
carcinogenesis. Endocr. Relat. Cancer 17, R1–R17.
Roth, S., Franken, P., Sacchetti, A., Kremer, A., Anderson, K., Sansom, O., and
Fodde, R. (2012). Paneth cells in intestinal homeostasis and tissue injury. PLoS
One 7, e38965.
Sangiorgi, E., andCapecchi, M.R. (2008). Bmi1 is expressed in vivo in intestinal
stem cells. Nat. Genet. 40, 915–920.
Santiago, M.F., Alcami, P., Striedinger, K.M., Spray, D.C., and Scemes, E.
(2010). The carboxyl-terminal domain of connexin43 is a negative modulator
of neuronal differentiation. J. Biol. Chem. 285, 11836–11845.
Sato, T., Vries, R.G., Snippert, H.J., van de Wetering, M., Barker, N., Stange,
D.E., van Es, J.H., Abo, A., Kujala, P., Peters, P.J., and Clevers, H. (2009).
Single Lgr5 stem cells build crypt-villus structures in vitro without a mesen-
chymal niche. Nature 459, 262–265.
Sato, T., van Es, J.H., Snippert, H.J., Stange, D.E., Vries, R.G., van den Born,
M., Barker, N., Shroyer, N.F., van de Wetering, M., and Clevers, H. (2011).
Paneth cells constitute the niche for Lgr5 stem cells in intestinal crypts. Nature
469, 415–418.
Spence, J.R., Lauf, R., and Shroyer, N.F. (2011). Vertebrate intestinal endo-
derm development. Dev. Dyn. 240, 501–520.
12 Cell Reports 5, 1–12, October 31, 2013 ª2013 The Authors
Stoyanova, T., Goldstein, A.S., Cai, H., Drake, J.M., Huang, J., andWitte, O.N.
(2012). Regulated proteolysis of Trop2 drives epithelial hyperplasia and stem
cell self-renewal via b-catenin signaling. Genes Dev. 26, 2271–2285.
Stringer, E.J., Duluc, I., Saandi, T., Davidson, I., Bialecka, M., Sato, T., Barker,
N., Clevers, H., Pritchard, C.A., Winton, D.J., et al. (2012). Cdx2 determines the
fate of postnatal intestinal endoderm. Development 139, 465–474.
Takeda, N., Jain, R., LeBoeuf, M.R., Wang, Q., Lu, M.M., and Epstein, J.A.
(2011). Interconversion between intestinal stem cell populations in distinct
niches. Science 334, 1420–1424.
Tian, H., Biehs, B., Warming, S., Leong, K.G., Rangell, L., Klein, O.D., and de
Sauvage, F.J. (2011). A reserve stem cell population in small intestine renders
Lgr5-positive cells dispensable. Nature 478, 255–259.
Todorova, M.G., Soria, B., and Quesada, I. (2008). Gap junctional intercellular
communication is required to maintain embryonic stem cells in a non-differen-
tiated and proliferative state. J. Cell. Physiol. 214, 354–362.
Trerotola, M., Cantanelli, P., Guerra, E., Tripaldi, R., Aloisi, A.L., Bonasera, V.,
Lattanzio, R., de Lange, R., Weidle, U.H., Piantelli, M., and Alberti, S. (2013).
Upregulation of Trop-2 quantitatively stimulates human cancer growth.
Oncogene 32, 222–233.
Tsukahara, Y., Tanaka, M., and Miyajima, A. (2011). TROP2 expressed in the
trunk of the ureteric duct regulates branching morphogenesis during kidney
development. PLoS ONE 6, e28607.
Van der Flier, L.G., Sabates-Bellver, J., Oving, I., Haegebarth, A., De Palo, M.,
Anti, M., Van Gijn, M.E., Suijkerbuijk, S., Van de Wetering, M., Marra, G., and
Clevers, H. (2007). The Intestinal Wnt/TCF Signature. Gastroenterology 132,
628–632.
van der Flier, L.G., van Gijn, M.E., Hatzis, P., Kujala, P., Haegebarth, A.,
Stange, D.E., Begthel, H., van den Born, M., Guryev, V., Oving, I., et al.
(2009). Transcription factor achaete scute-like 2 controls intestinal stem cell
fate. Cell 136, 903–912.
Verzi, M.P., Shin, H., Ho, L.L., Liu, X.S., and Shivdasani, R.A. (2011). Essential
and redundant functions of caudal family proteins in activating adult intestinal
genes. Mol. Cell. Biol. 31, 2026–2039.
Walton, K.D., Kolterud, A., Czerwinski, M.J., Bell, M.J., Prakash, A.,
Kushwaha, J., Grosse, A.S., Schnell, S., and Gumucio, D.L. (2012).
Hedgehog-responsive mesenchymal clusters direct patterning and emer-
gence of intestinal villi. Proc. Natl. Acad. Sci. USA 109, 15817–15822.
Wong,M.H., Huelsken, J., Birchmeier, W., andGordon, J.I. (2002). Selection of
multipotent stem cells during morphogenesis of small intestinal crypts of
Lieberkuhn is perturbed by stimulation of Lef-1/beta-catenin signaling.
J. Biol. Chem. 277, 15843–15850.
Wong, V.W., Stange, D.E., Page, M.E., Buczacki, S., Wabik, A., Itami, S., van
de Wetering, M., Poulsom, R., Wright, N.A., Trotter, M.W., et al. (2012). Lrig1
controls intestinal stem-cell homeostasis by negative regulation of ErbB sig-
nalling. Nat. Cell Biol. 14, 401–408.
Yagel, S., Shpan, P., Dushnik, M., Livni, N., and Shimonovitz, S. (1994).
Trophoblasts circulating in maternal blood as candidates for prenatal genetic
evaluation. Hum. Reprod. 9, 1184–1189.
Yan, K.S., Chia, L.A., Li, X., Ootani, A., Su, J., Lee, J.Y., Su, N., Luo, Y., Heils-
horn, S.C., Amieva, M.R., et al. (2012). The intestinal stem cell markers Bmi1
and Lgr5 identify two functionally distinct populations. Proc. Natl. Acad. Sci.
USA 109, 466–471.
Supplemental Experimental Procedures
Electron microscopy protocol: Samples were washed with PBS and fixed with ice-cold glutaraldehyde
2% (Sigma). For TEM, samples were post-fixed in OsO4 (2%) in 0.1M cacodylate buffer (pH 7.2),
serially dehydrated in increasing ethanol concentrations, embedded in Agar 100 resin (Agar Scientific
Ltd, UK) and left to polymerize at 60°C for 2 days. Ultrathin sections (50-70 nm thick) were produced
with a Leica EM UC6 ultra-microtome, collected on formvar-carbon-coated copper grids and stained with
uranyl acetate and lead citrate by standard procedures. Observations were made on a Tecnai 10 TEM
(FEI) and images were captured with a Veleta CCD camera and processed with SIS iTEM (Olympus).
For SEM, samples were fixed over night at 4°C in glutaraldehyde 2.5%, 0.1M cacodylate buffer (pH 7.2),
and post-fixed in OsO4 (2%) in the same buffer. After serial dehydration, samples were dried at critical
point and coated with platinum by standard procedures. Observations were made in a Tecnai FEG ESEM
QUANTA 200 (FEI) and images processed by SIS iTEM (Olympus) software.
Flow cytometric analysis and cell sorting (FACS)
Small intestine of E15 embryos (pool of 12 embryos from a given litter per experiment, n=2 independent
experiments), or spheroids cultured ex vivo for 14 passages collected from Matrigel, were completely
dissociated with the Stem Pro accutase cell dissociation reagent (Thermo electron) and passed through a
40-μm nylon cell strainer (Greiner). Cells were Fc-blocked for 15 min on ice with anti-CD16/CD32 (BD
Biosciences) before incubation with fluorochrome-conjugated anti-Trop2-APC antibody, or the relevant
isotype control (R&D systems) in PBS-1% BSA for 30 min on ice. Live/Dead reagent (Invitrogen) was
used to exclude dead cells from the analysis. Cell sorting was done by using the Facs Aria I (BD
Biosciences). Sorted cells were either cultured ex vivo for cell plating efficiency measurements or
collected for RNA analysis.
List of primers used in RT-PCR and qRT-PCR.
Hprt fw: 5’-GCTACTGTAATGATCAGTCAACGGG, Hprt Rev: 5’-AAGCTTGCAACCTTAACCATTTTG; rlp13 Fw: 5’- CCCGTGGCGATTGTGAA, rlp13 Rev: 5’-TCATTGTCCTTCTGTGCAGGTT; tbp Fw:5’-TGTACCGCAGCTTCAAAATATTGTAT, tbp Rev: 5’-AAATCAACGCAGTTGTCCGTG; cdx1 Fw: 5’-GCGGTGGCAGCGGTAAGACC, cdx1 Rev: 5’-AGCTCGGACTTGCGCCGGAT; cdx2 Fw: 5’-CTGCTCTGGGTCCCTCGCCA, cdx2 Rev: 5’-CTGCGGAGCCAGGTTCAGGC; cnx43 Fw: 5’-TGGGGGAAAGGCGTGAGGGA, cnx43 Rev: 5’-ACCCATGTCTGGGCACCTCTCTT; ctgf Fw: 5’-TGACCCCTGCGACCCACACA, ctgf Rev: 5’-CAGGGTGCACCATCTTTGGCAGT; lgr6 Fw: 5’-CTACGCTGCAGCCGGTGAGCTG, lgr6 Rev: 5’-CAAAGTGGCTCCCTCTGCCTTCAGC; lor Fw: 5’-TCCCTGGTGCTTCAGGGTAAC, lor Rev: 5’-CTTTCCACAACCCACAGGAGG; olfm4 Fw: 5’-CAGCTGCCTGGTTGCCTCCG, olfm4 Rev: 5’-

GGCAGGTCCCATGGCTGTCC; sca1 Fw: 5’-GAAAGAGCTCAGGGACTGGAGTGTT, Sca1 Rev: 5’-TTAGGAGGGCAGATGGGTAAGCAA; smoc2 Fw:5’-GTTCGCACACCGGATCTTC, smoc2 Rev: 5’-TTGATCGACTCTCAAGAACGTG; spp1 Fw: 5’-TCGGAGGAAACCAGCCAAGGACT, spp1 Rev: 5’-AAGCTTCTTCTCCTCTGAGCTGCCA; tert Fw: 5’-TGAGAGCAGCAGCAGCCTGT, tert Rev: 5’-TAGGCTGGAGCCCTGGGGGA; trop2 Fw: 5’-GAACGCGTCGCAGAAGGGC, trop2 Rev: 5’-CGGCGGCCCATGAACAGTGA

Figure S1. Growth requirements for ex vivo cultures of paired spheroids and organoids, related to Figure
1. Upon replating, spheroids and organoids were cultured either in complete medium supplemented with
Rspondin1, Noggin and EGF or in absence of one of these growth factors. Selected fields were followed
over the culture period for each culture condition. Scale bar 200µm.
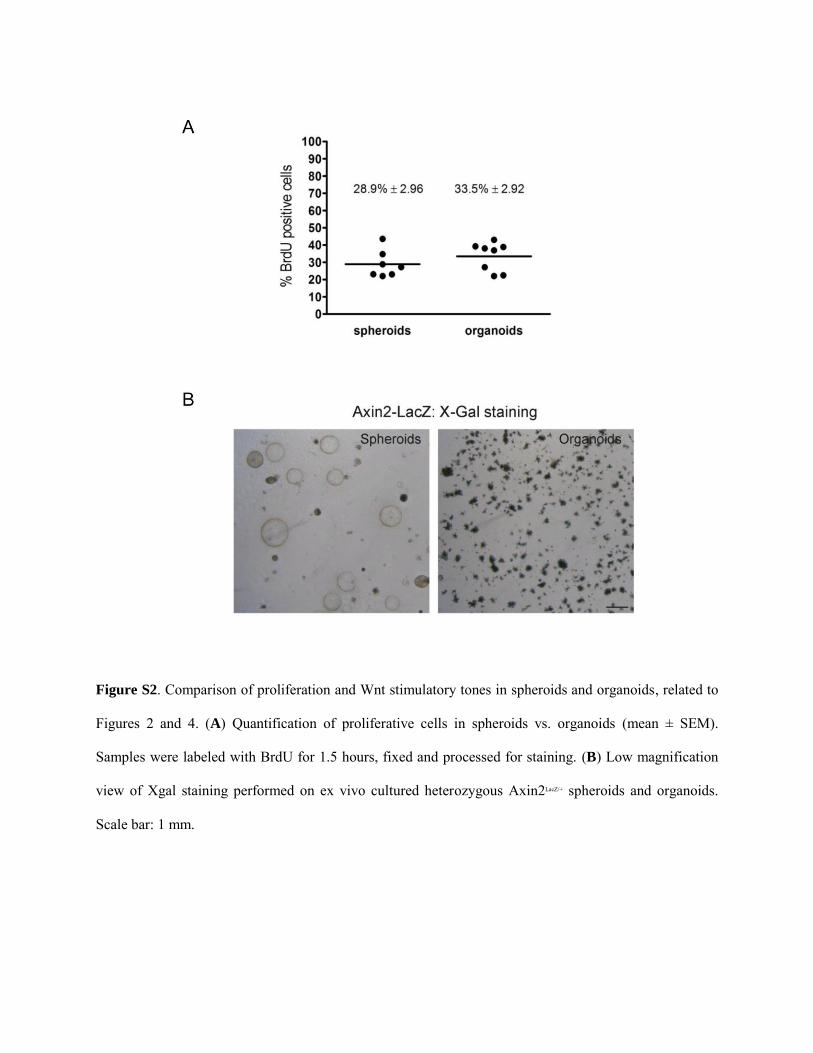
Figure S2. Comparison of proliferation and Wnt stimulatory tones in spheroids and organoids, related to
Figures 2 and 4. (A) Quantification of proliferative cells in spheroids vs. organoids (mean ± SEM).
Samples were labeled with BrdU for 1.5 hours, fixed and processed for staining. (B) Low magnification
view of Xgal staining performed on ex vivo cultured heterozygous Axin2LacZ/+ spheroids and organoids.
Scale bar: 1 mm.

Figure S3. Role of Lgr receptors in the growth of intestinal spheroids, related to Figures 3 and 4. (A)
Lgr6 is not expressed at detectable levels in intestinal samples. RT-PCR performed on spheroid (S) or
organoid (O) RNA samples and E15, E17 or adult small intestine RNA, using primers specific for Lgr4,
Lgr6 and HPRT. A E18 skin RNA sample was used as positive control for Lgr6 expression. RT (-)
corresponds to PCR of the E17 sample processed without reverse transcription. (B) Intestinal extracts
from E17 Lgr4 wild-type (WT, n=10) and Lgr4 knockout (KO, n=11) embryos were seeded and cell
growth was followed over the time. None of the cultured Lgr4KO samples generated productive spheroid
or organoid structures. (C) Intestinal extracts from E18 Lgr5 WT (n=3) and Lgr5 KO (n=3) embryos were
seeded and growth was followed over the time. The elements grown from the first seeding could be
efficiently replated (#3=passage 3). (D) Spheroid and organoid pairs from E15 or E17 WT (n=4) or
heterozygous (HE, n=4) Lgr5-DTR embryos were cultured in absence or presence of diphteria toxin (DT,
20 ng/ml final concentration). Medium was replenished every other day. DT treatment did not affect HE
spheroids but interfered with protrusion emergence in organoids (see inset). Scale bars 200 µm.

Figure S4. Gene expression and Wnt signaling of fetal spheroids differs from that of early spheroid-like
stage of organoids, related to Figures 3 and 4. (A) qPCR analysis of spheroids and organoids at day 2 and
day 5 of culture. * represent values ≤ 0.03. Images represent typical cultures of spheroids and organoids at
day 2. (B) qPCR analysis of spheroids and organoids at passage 5 and 15. * represent values ≤ 0.01. (C)
Porcupine inhibition with the IWP2 compound affects fetal spheroid growth in a dose-dependent way.
Spheroids were grown for 4 days in presence of IWP2 at the indicated concentrations. A mean of 20
elements were measured per condition and sample (n=2/4 independent experiments performed on 3
different samples). Spheroid size is graphed relative to control conditions (mean ± SEM). Significance
was computed from paired t-test: *p <0,035. Scale bars: 200 µm.
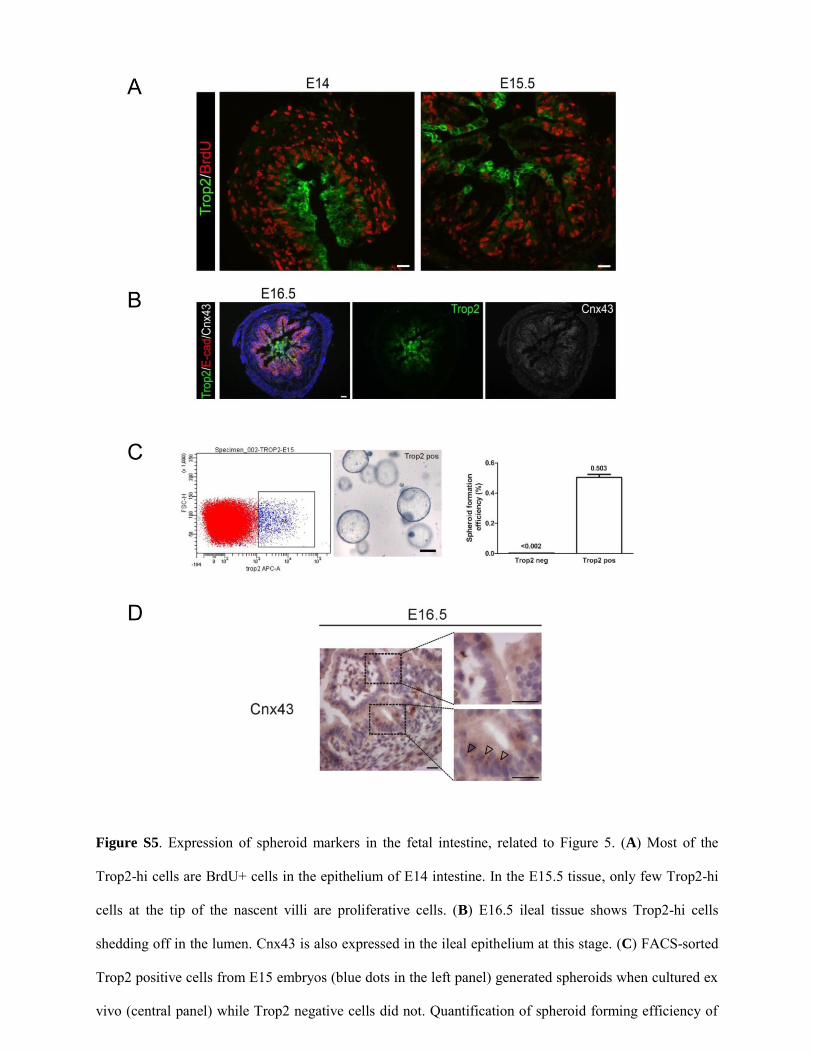
Figure S5. Expression of spheroid markers in the fetal intestine, related to Figure 5. (A) Most of the
Trop2-hi cells are BrdU+ cells in the epithelium of E14 intestine. In the E15.5 tissue, only few Trop2-hi
cells at the tip of the nascent villi are proliferative cells. (B) E16.5 ileal tissue shows Trop2-hi cells
shedding off in the lumen. Cnx43 is also expressed in the ileal epithelium at this stage. (C) FACS-sorted
Trop2 positive cells from E15 embryos (blue dots in the left panel) generated spheroids when cultured ex
vivo (central panel) while Trop2 negative cells did not. Quantification of spheroid forming efficiency of

both populations is shown on the right panel (mean ± SEM of 2 independent experiments.). (D) Higher
magnifications for immunohistochemical detection of Cnx43 in duodenal sections at E16.5. Empty arrow-
heads show punctuated staining observed in epithelial cells localized in the intervillus region. Scale bars
20 µm (A, B, D) and 200 µm (C).

Figure S6. Lineage tracing experiment performed on Cnx43-CreER and Lgr5-CreERT2/Rosa26R
embryos, related to Figure 6. (A) Cnx43-CreER/Rosa26-LacZ embryos pulsed with tamoxifen at E15
were sacrificed 6 days post-pulse. Tissues were immunostained with anti-βgal antibody to detect
recombined Cnx43 positive cells. (B) Lgr5-CreERT2/Rosa26LacZ P5-old mice were tamoxifen-pulsed
for 4 consecutive days (via maternal milk) and sacrificed at P10 (2 days pp). Low, medium and high
magnification images of a representative field are shown. Positive clones are evidenced by circles. (C)
Cnx43-CreER/Rosa26-YFP/Lgr5-LacZ embryo pulsed at E15 and sacrificed 2 weeks post-pulse. Serial
sections of 5 µm show that crypt-villus units generated from Cnx43 positive cells contain Lgr5 expressing
cells in the bottom of the crypt. Tissues were immunostained with anti-GFP and anti-βgal antibodies to
detect recombined Cnx43 positive and Lgr5 expressing cells, respectively. Scale bars 20 µm (A, B right
panel, C) and 200 µm (B left and central panels).
Table S1. Short List of 317 Upregulated and 179 Downregulated Genes in Spheroids versus Organoids,
Related to Figure 3 and Experimental Procedures
Provided as a separate Excel file.

Table S2. Comparison of the Fetal Spheroid versus Organoids Microarray List with Genes Upregulated
in Apcmin Adenomas and the Corresponding Organotypic Cultures, Related to Figure 3
Up > 2fold in Apc
min adenoma vs normal tissue
Genes in column 1 and up > 2 fold in adenoma spheroids vs organoids
Genes in column 1 and up > 2 fold in fetal spheroids vs organoids (present study)
1 Cfi Cfi
2 Lcn2 Lcn2
3 Krt23 Krt23 Krt23
4 Ctse Ctse
5 Foxq1 Foxq1 Foxq1
6 Scara3 Scara3
7 Tnfrsf11b Tnfrsf11b
8 S100a9 S100a9
9 Avil Avil
10 Stra6 Stra6
11 Onecut2 Onecut2
12 Cxcl1 Cxcl1
13 Tacstd2 Tacstd2 Tacstd2=Trop2
14 Prr18 Prr18
15 Rbp1 Rbp1
6 Phlda1 Phlda1
17 Tnfrsf12a Tnfrsf12a
18 Rgs17 Rgs17 Rgs17
19 Mmp14 Mmp14
20 Akr1b8 Akr1b8 Akr1b8
21 Il33 Il33 Il33
22 Tns4 Tns4 Tns4
23 Tnfrsf19 Tnfrsf19
24 Slc2a1 Slc2a1
25 Egln3 Egln3
26 Anxa3 Anxa3 Anxa3
27 Bmp4 Bmp4
28 Rbms3 Rbms3
29 H6pd H6pd
30 Cgnl1 Cgnl1 Cgnl1
31 Pls3 Pls3
32 Rbms1 Rbms1 Rbms1
33 Krt7 Krt7 Krt7
34 Bace1 Bace1
35 Pdlim4 Pdlim4 Pdlim4
36 Tspan12 Tspan12
37 Ptprb Ptprb
38 Cldn2 Cldn2
39 1190003m12rik
40 Wif1
41 S100a8
42 Otop2
43 Etv5
44 Cyp2c55
45 Fxyd3 Fxyd3
46 Cdkn1c
47 Asah3l
48 Ccdc3
49 Igfbp4
50 Mt2
51 Loc100047651
52 Rnf43
53 Sox4
54 Htra1
55 Sidt1
56 Gstm5
57 Paip1
58 2210407c18rik
59 Smoc1
60 Mt1
61 Fndc3b
62 Mafg
63 1110012d08rik
64 Nedd9
65 Mir16
66 Fgl1
67 Tmc7
68 Prkcbp1
69 Loc100043257
70 Nfib
71 Fvt1
72 Mycl1
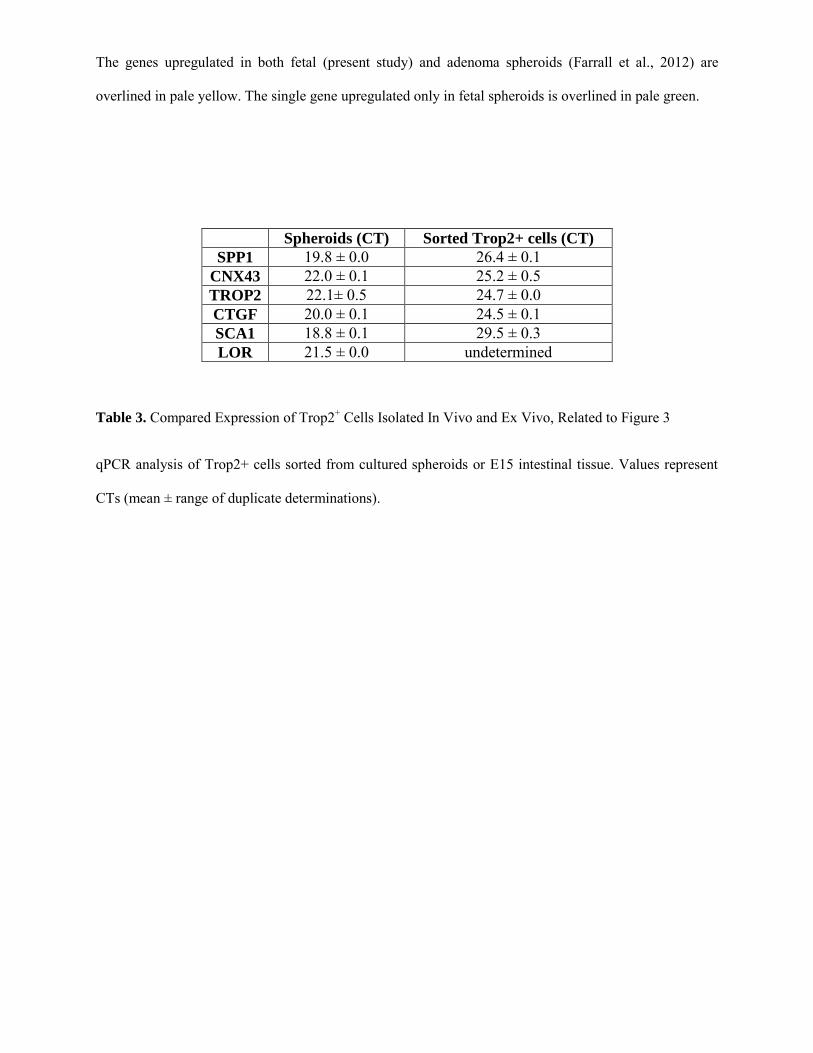
The genes upregulated in both fetal (present study) and adenoma spheroids (Farrall et al., 2012) are
overlined in pale yellow. The single gene upregulated only in fetal spheroids is overlined in pale green.
Spheroids (CT) Sorted Trop2+ cells (CT)
SPP1 19.8 ± 0.0 26.4 ± 0.1 CNX43 22.0 ± 0.1 25.2 ± 0.5 TROP2 22.1± 0.5 24.7 ± 0.0 CTGF 20.0 ± 0.1 24.5 ± 0.1 SCA1 18.8 ± 0.1 29.5 ± 0.3 LOR 21.5 ± 0.0 undetermined
Table 3. Compared Expression of Trop2+ Cells Isolated In Vivo and Ex Vivo, Related to Figure 3
qPCR analysis of Trop2+ cells sorted from cultured spheroids or E15 intestinal tissue. Values represent
CTs (mean ± range of duplicate determinations).