Spheroid-based drug screen: considerations and practical approach
16
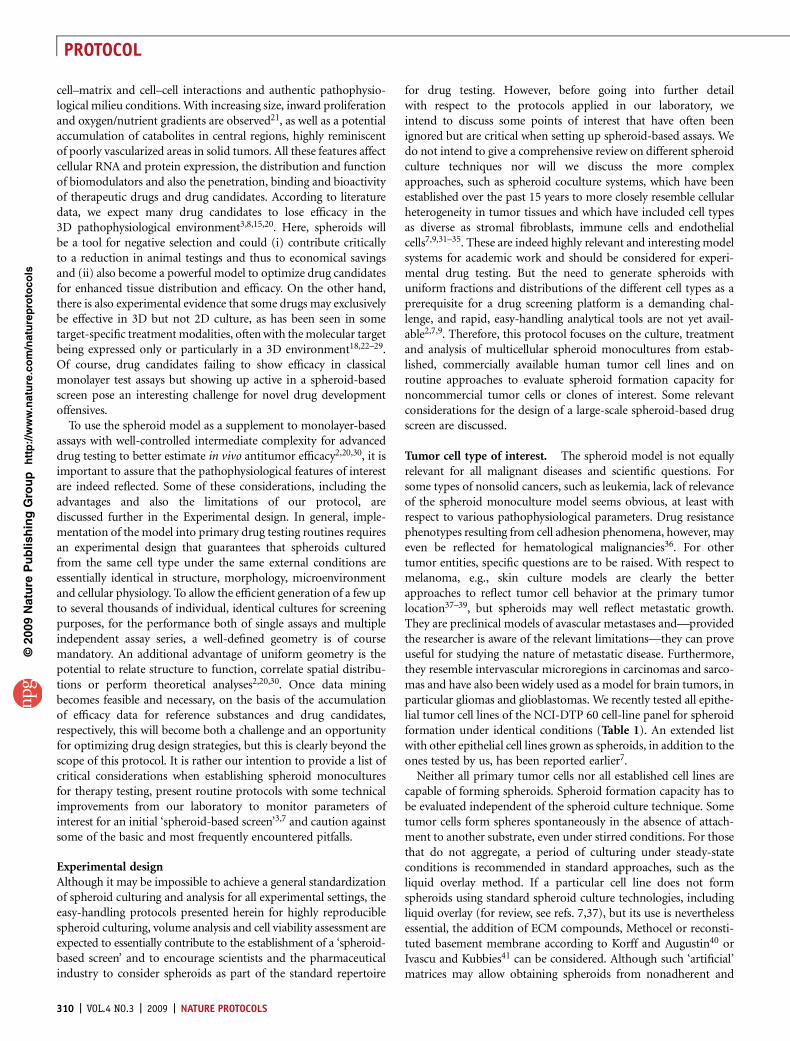
Spheroid-based drug screen: considerations and practical approach Juergen Friedrich 1,2 , Claudia Seidel 1 , Reinhard Ebner 3 & Leoni A Kunz-Schughart 1 1 OncoRay-Center for Radiation Research in Oncology, Tumor Pathophysiology, Faculty of Medicine Carl Gustav Carus, Dresden University of Technology, 01307 Dresden, Germany. 2 Institute of Pathology, University of Regensburg, Franz-Josef-Strauss-Allee 11, 93053 Regensburg, Germany. 3 Avalon Pharmaceuticals Inc., 20358 Seneca Meadows Parkway, Germantown, Maryland 20876, USA. Correspondence should be addressed to L.A.K-S. ([email protected]). Published online 12 February 2009; doi:10.1038/nprot.2008.226 Although used in academic research for several decades, 3D culture models have long been regarded expensive, cumbersome and unnecessary in drug development processes. Technical advances, coupled with recent observations showing that gene expression in 3D is much closer to clinical expression profiles than those seen in 2D, have renewed attention and generated hope in the feasibility of maturing organotypic 3D systems to therapy test platforms with greater power to predict clinical efficacies. Here we describe a standardized setup for reproducible, easy-handling culture, treatment and routine analysis of multicellular spheroids, the classical 3D culture system resembling many aspects of the pathophysiological situation in human tumor tissue. We discuss essential conceptual and practical considerations for an adequate establishment and use of spheroid-based drug screening platforms and also provide a list of human carcinoma cell lines, partly on the basis of the NCI-DTP 60-cell line screen, that produce treatable spheroids under identical culture conditions. In contrast to many other settings with which to achieve similar results, the protocol is particularly useful to be integrated into standardized large-scale drug test routines as it requires a minimum number of defined spheroids and a limited amount of drug. The estimated time to run the complete screening protocol described herein—including spheroid initiation, drug treatment and determination of the analytical end points (spheroid integrity, and cell survival through the acid phosphatase assay)—is about 170 h. Monitoring of spheroid growth kinetics to determine growth delay and regrowth, respectively, after drug treatment requires long-term culturing (Z14 d). INTRODUCTION Over the past several years, various types of 3D culture systems have garnered much attention and gained increased recognition as important research tools. This trend has been illustrated, among others, in Alison Abbott’s 2003 Nature report entitled ‘Cell culture: biology’s new dimension’, which particularly emphasized the basic necessity for such systems before turning to whole-animal studies, for both basic research and therapeutic development 1 . Examples of 3D culture systems in use that show intermediate complexity reflecting particular aspects of tumor tissues include multilayer cell systems. These have been applied, for example, to study phenomena, such as drug transport and binding, therapy resistance and cell invasion. Matrix-embedded 3D cultures are increasingly applied to investigate differentiation, migration and invasion processes of tumor cells triggered by extracellular matrix com- pounds. Hollow-fiber-based approaches and ex vivo cultures of pieces or slices from tumors are also to be mentioned as advanced 3D culture systems but are not yet sufficiently well standardized and/or depend on the supply of primary tumor tissue, which can be challenging to obtain and limits routine application 2,3 . Continuing progress in testing natural and artificial matrices as well as 3D scaffolds, e.g., for tissue engineering purposes, has resulted in a number of critical improvements in reproducibility, ease of use and reliability of 3D model systems, with many obvious applications especially in cancer research. Some approaches have been discussed earlier with particular focus on the multicellular spheroid system as one of the models that has been characterized sufficiently well to say with confidence that it simulates the pathophysiological milieu in a patient tumor showing similar therapy responses 4–7 . Multicellular spheroids are probably the most classical approach for 3D culturing, and multiple review articles throughout the past three decades have highlighted the potential of this model system in cancer research and treatment 2,7–10 . Early investigations in the 1970s not only triggered the study of basic biological mechanisms in multicellular tumor spheroids (MCTSs), such as the regulation of tumor cell proliferation, differentiation and cell death processes, but also initiated the progressive entry of the MCTS model into various new fields of therapeutic interest. Today, there is an enormous body of literature on multicellular spheroids used in therapy-oriented studies, far too numerous to be discussed at length herein. However, it is worth noting that many of these studies have demonstrated the particular power of MCTSs to gain insight into therapeutic problems associated with metabolic and proliferative gradients, such as the altered responsiveness and effects of chronically hypoxic tumor cells, and the importance of 3D cell–cell and cell–matrix interactions, e.g., in radio- and chemoresistance 10,11–15 . In fact, tumor cells grown as 3D structures can acquire some type of clinically relevant multicellular resis- tance to apoptosis-inducing drugs that may mimic the chemoresis- tance found in solid tumors 16–19 . Accordingly, experts in the field have proposed to include MCTSs as mandatory models in major programs for drug screening and development and fre- quently alluded to the rationale for using MCTSs in antitumor drug testing 2,7,20 . In brief, MCTSs resemble avascular tumor nodules/micrometas- tases or intervascular regions of large solid tumors with respect to micromilieu, volume growth kinetics and some histomorphologi- cal features. They reestablish morphological, functional and mass transport properties of the corresponding tissue in vivo, with tumor cells restoring an in vivo-like differentiation pattern due to the appropriate 3D extracellular matrix (ECM) assembly, complex p u o r G g n i h s i l b u P e r u t a N 9 0 0 2 © natureprotocols / m o c . e r u t a n . w w w / / : p t t h NATURE PROTOCOLS | VOL.4 NO.3 | 2009 | 309 PROTOCOL
Transcript of Spheroid-based drug screen: considerations and practical approach
Spheroid-based drug screen: considerations andpractical approachJuergen Friedrich1,2, Claudia Seidel1, Reinhard Ebner3 & Leoni A Kunz-Schughart1
1OncoRay-Center for Radiation Research in Oncology, Tumor Pathophysiology, Faculty of Medicine Carl Gustav Carus, Dresden University of Technology, 01307Dresden, Germany. 2Institute of Pathology, University of Regensburg, Franz-Josef-Strauss-Allee 11, 93053 Regensburg, Germany. 3Avalon Pharmaceuticals Inc., 20358Seneca Meadows Parkway, Germantown, Maryland 20876, USA. Correspondence should be addressed to L.A.K-S. ([email protected]).
Published online 12 February 2009; doi:10.1038/nprot.2008.226
Although used in academic research for several decades, 3D culture models have long been regarded expensive, cumbersome and
unnecessary in drug development processes. Technical advances, coupled with recent observations showing that gene expression in
3D is much closer to clinical expression profiles than those seen in 2D, have renewed attention and generated hope in the feasibility
of maturing organotypic 3D systems to therapy test platforms with greater power to predict clinical efficacies. Here we describe a
standardized setup for reproducible, easy-handling culture, treatment and routine analysis of multicellular spheroids, the classical
3D culture system resembling many aspects of the pathophysiological situation in human tumor tissue. We discuss essential
conceptual and practical considerations for an adequate establishment and use of spheroid-based drug screening platforms and also
provide a list of human carcinoma cell lines, partly on the basis of the NCI-DTP 60-cell line screen, that produce treatable spheroids
under identical culture conditions. In contrast to many other settings with which to achieve similar results, the protocol is
particularly useful to be integrated into standardized large-scale drug test routines as it requires a minimum number of defined
spheroids and a limited amount of drug. The estimated time to run the complete screening protocol described herein—including
spheroid initiation, drug treatment and determination of the analytical end points (spheroid integrity, and cell survival through the
acid phosphatase assay)—is about 170 h. Monitoring of spheroid growth kinetics to determine growth delay and regrowth,
respectively, after drug treatment requires long-term culturing (Z14 d).
INTRODUCTIONOver the past several years, various types of 3D culture systems havegarnered much attention and gained increased recognition asimportant research tools. This trend has been illustrated, amongothers, in Alison Abbott’s 2003 Nature report entitled ‘Cell culture:biology’s new dimension’, which particularly emphasized the basicnecessity for such systems before turning to whole-animal studies,for both basic research and therapeutic development1. Examples of3D culture systems in use that show intermediate complexityreflecting particular aspects of tumor tissues include multilayercell systems. These have been applied, for example, to studyphenomena, such as drug transport and binding, therapy resistanceand cell invasion. Matrix-embedded 3D cultures are increasinglyapplied to investigate differentiation, migration and invasionprocesses of tumor cells triggered by extracellular matrix com-pounds. Hollow-fiber-based approaches and ex vivo cultures ofpieces or slices from tumors are also to be mentioned as advanced3D culture systems but are not yet sufficiently well standardizedand/or depend on the supply of primary tumor tissue, which can bechallenging to obtain and limits routine application2,3. Continuingprogress in testing natural and artificial matrices as well as 3Dscaffolds, e.g., for tissue engineering purposes, has resulted in anumber of critical improvements in reproducibility, ease of use andreliability of 3D model systems, with many obvious applicationsespecially in cancer research. Some approaches have been discussedearlier with particular focus on the multicellular spheroid system asone of the models that has been characterized sufficiently well to saywith confidence that it simulates the pathophysiological milieu in apatient tumor showing similar therapy responses4–7.
Multicellular spheroids are probably the most classical approachfor 3D culturing, and multiple review articles throughout the past
three decades have highlighted the potential of this model system incancer research and treatment2,7–10. Early investigations in the1970s not only triggered the study of basic biological mechanismsin multicellular tumor spheroids (MCTSs), such as the regulationof tumor cell proliferation, differentiation and cell death processes,but also initiated the progressive entry of the MCTS model intovarious new fields of therapeutic interest. Today, there is anenormous body of literature on multicellular spheroids used intherapy-oriented studies, far too numerous to be discussed atlength herein. However, it is worth noting that many of thesestudies have demonstrated the particular power of MCTSs to gaininsight into therapeutic problems associated with metabolic andproliferative gradients, such as the altered responsiveness andeffects of chronically hypoxic tumor cells, and the importance of3D cell–cell and cell–matrix interactions, e.g., in radio- andchemoresistance10,11–15. In fact, tumor cells grown as 3D structurescan acquire some type of clinically relevant multicellular resis-tance to apoptosis-inducing drugs that may mimic the chemoresis-tance found in solid tumors16–19. Accordingly, experts in thefield have proposed to include MCTSs as mandatory models inmajor programs for drug screening and development and fre-quently alluded to the rationale for using MCTSs in antitumordrug testing2,7,20.
In brief, MCTSs resemble avascular tumor nodules/micrometas-tases or intervascular regions of large solid tumors with respect tomicromilieu, volume growth kinetics and some histomorphologi-cal features. They reestablish morphological, functional and masstransport properties of the corresponding tissue in vivo, with tumorcells restoring an in vivo-like differentiation pattern due to theappropriate 3D extracellular matrix (ECM) assembly, complex
p
uor
G g
n ih si l
bu
P eru ta
N 900 2©
nat
ure
pro
toco
ls/
moc.er
ut an.
ww
w//:ptt
h
NATURE PROTOCOLS | VOL.4 NO.3 | 2009 | 309
PROTOCOL
cell–matrix and cell–cell interactions and authentic pathophysio-logical milieu conditions. With increasing size, inward proliferationand oxygen/nutrient gradients are observed21, as well as a potentialaccumulation of catabolites in central regions, highly reminiscentof poorly vascularized areas in solid tumors. All these features affectcellular RNA and protein expression, the distribution and functionof biomodulators and also the penetration, binding and bioactivityof therapeutic drugs and drug candidates. According to literaturedata, we expect many drug candidates to lose efficacy in the3D pathophysiological environment3,8,15,20. Here, spheroids willbe a tool for negative selection and could (i) contribute criticallyto a reduction in animal testings and thus to economical savingsand (ii) also become a powerful model to optimize drug candidatesfor enhanced tissue distribution and efficacy. On the other hand,there is also experimental evidence that some drugs may exclusivelybe effective in 3D but not 2D culture, as has been seen in sometarget-specific treatment modalities, often with the molecular targetbeing expressed only or particularly in a 3D environment18,22–29.Of course, drug candidates failing to show efficacy in classicalmonolayer test assays but showing up active in a spheroid-basedscreen pose an interesting challenge for novel drug developmentoffensives.
To use the spheroid model as a supplement to monolayer-basedassays with well-controlled intermediate complexity for advanceddrug testing to better estimate in vivo antitumor efficacy2,20,30, it isimportant to assure that the pathophysiological features of interestare indeed reflected. Some of these considerations, including theadvantages and also the limitations of our protocol, arediscussed further in the Experimental design. In general, imple-mentation of the model into primary drug testing routines requiresan experimental design that guarantees that spheroids culturedfrom the same cell type under the same external conditions areessentially identical in structure, morphology, microenvironmentand cellular physiology. To allow the efficient generation of a few upto several thousands of individual, identical cultures for screeningpurposes, for the performance both of single assays and multipleindependent assay series, a well-defined geometry is of coursemandatory. An additional advantage of uniform geometry is thepotential to relate structure to function, correlate spatial distribu-tions or perform theoretical analyses2,20,30. Once data miningbecomes feasible and necessary, on the basis of the accumulationof efficacy data for reference substances and drug candidates,respectively, this will become both a challenge and an opportunityfor optimizing drug design strategies, but this is clearly beyond thescope of this protocol. It is rather our intention to provide a list ofcritical considerations when establishing spheroid monoculturesfor therapy testing, present routine protocols with some technicalimprovements from our laboratory to monitor parameters ofinterest for an initial ‘spheroid-based screen’3,7 and caution againstsome of the basic and most frequently encountered pitfalls.
Experimental designAlthough it may be impossible to achieve a general standardizationof spheroid culturing and analysis for all experimental settings, theeasy-handling protocols presented herein for highly reproduciblespheroid culturing, volume analysis and cell viability assessment areexpected to essentially contribute to the establishment of a ‘spheroid-based screen’ and to encourage scientists and the pharmaceuticalindustry to consider spheroids as part of the standard repertoire
for drug testing. However, before going into further detailwith respect to the protocols applied in our laboratory, weintend to discuss some points of interest that have often beenignored but are critical when setting up spheroid-based assays. Wedo not intend to give a comprehensive review on different spheroidculture techniques nor will we discuss the more complexapproaches, such as spheroid coculture systems, which have beenestablished over the past 15 years to more closely resemble cellularheterogeneity in tumor tissues and which have included cell typesas diverse as stromal fibroblasts, immune cells and endothelialcells7,9,31–35. These are indeed highly relevant and interesting modelsystems for academic work and should be considered for experi-mental drug testing. But the need to generate spheroids withuniform fractions and distributions of the different cell types as aprerequisite for a drug screening platform is a demanding chal-lenge, and rapid, easy-handling analytical tools are not yet avail-able2,7,9. Therefore, this protocol focuses on the culture, treatmentand analysis of multicellular spheroid monocultures from estab-lished, commercially available human tumor cell lines and onroutine approaches to evaluate spheroid formation capacity fornoncommercial tumor cells or clones of interest. Some relevantconsiderations for the design of a large-scale spheroid-based drugscreen are discussed.
Tumor cell type of interest. The spheroid model is not equallyrelevant for all malignant diseases and scientific questions. Forsome types of nonsolid cancers, such as leukemia, lack of relevanceof the spheroid monoculture model seems obvious, at least withrespect to various pathophysiological parameters. Drug resistancephenotypes resulting from cell adhesion phenomena, however, mayeven be reflected for hematological malignancies36. For othertumor entities, specific questions are to be raised. With respect tomelanoma, e.g., skin culture models are clearly the betterapproaches to reflect tumor cell behavior at the primary tumorlocation37–39, but spheroids may well reflect metastatic growth.They are preclinical models of avascular metastases and—providedthe researcher is aware of the relevant limitations—they can proveuseful for studying the nature of metastatic disease. Furthermore,they resemble intervascular microregions in carcinomas and sarco-mas and have also been widely used as a model for brain tumors, inparticular gliomas and glioblastomas. We recently tested all epithe-lial tumor cell lines of the NCI-DTP 60 cell-line panel for spheroidformation under identical conditions (Table 1). An extended listwith other epithelial cell lines grown as spheroids, in addition to theones tested by us, has been reported earlier7.
Neither all primary tumor cells nor all established cell lines arecapable of forming spheroids. Spheroid formation capacity has tobe evaluated independent of the spheroid culture technique. Sometumor cells form spheres spontaneously in the absence of attach-ment to another substrate, even under stirred conditions. For thosethat do not aggregate, a period of culturing under steady-stateconditions is recommended in standard approaches, such as theliquid overlay method. If a particular cell line does not formspheroids using standard spheroid culture technologies, includingliquid overlay (for review, see refs. 7,37), but its use is neverthelessessential, the addition of ECM compounds, Methocel or reconsti-tuted basement membrane according to Korff and Augustin40 orIvascu and Kubbies41 can be considered. Although such ‘artificial’matrices may allow obtaining spheroids from nonadherent and
p
uor
G g
n ih si l
bu
P eru ta
N 900 2©
nat
ure
pro
toco
ls/
moc.er
ut an.
ww
w//:ptt
h
310 | VOL.4 NO.3 | 2009 | NATURE PROTOCOLS
PROTOCOL
eventually highly metastatic tumor cells, the occurrence of matrix-driven alterations in growth, expression profile and behavior of thecells, including drug response, must be taken into consideration.However, such effects have not been systematically studied, andtheir in vivo relevance requires further examination. We highlyrecommend that all spheroid types in a screen should be grownunder identical conditions. The primary ‘spheroid-based screen’described herein was designed to not include any artificial supple-ments except for standard conditioned media and the coating toprovide a nonadherent surface for liquid overlay.
Similar to the case with monolayer cultures, many spheroid typesare kept typically in different cell type–specific media to assurereasonable spheroid growth and maintain viability. This is, ofcourse, undesirable for high-throughput screening purposes andalso with respect to some pathophysiological features that shouldcontinue to be reflected properly in the model. Just as an example,differences in glucose supplementation may alter survival and/or
drug sensitivity of cells under hypoxic conditions. Thus, werecommend the physiological range of 1 g liter�1 (5 mM) glucose.It is also clear that some conditions cannot be mimicked wellin vitro. However, within and between screens, the conditionsshould not vary for the cell lines used, as this would clearlycomplicate data analysis and interpretation. In our experimentalsetting, we have adapted all cell lines of interest to growth inDulbecco’s modified Eagle medium (DMEM) supplemented with10% (vol/vol) fetal calf serum (FCS).
Spheroid size and culture time. The physiological state ofspheroids clearly depends on the spheroid size, the individualand cell type–specific behavior of the tumor cells, the cell densitywithin the spheroid and also directly or indirectly on the culturetime. We intended to establish a spheroid-based screen with clearpathophysiological gradients but without central necroses at theonset of treatment. Owing to literature data and our own experi-ence, a 4-d initiation interval for spheroid formation seemedreasonable and was found to reproducibly create spheroids ofdifferent cell types under identical culture conditions, reaching astandard size of 370–400 mm after 96 h of incubation at the onset oftreatment. The culture of small spheroids with a size of up to200 mm is frequently carried out for drug testing42–45 and mayindeed be sufficient to reflect 3D cell–cell and cell–matrix interac-tions but is clearly inappropriate when attempting to resemblepathophysiological conditions with hypoxic areas in the spheroidcenter or to develop proliferation gradients8,30,46,47. Hypoxia is notonly a well-established direct radio- and drug- resistance factor, butit also leads to numerous indirect effects in tumor cells bymodulating expression patterns, e.g., of HIF-1(a)-regulatedgenes. For example, it has been shown that growth of humanbreast cancer, human melanoma and murine breast cancer cell linesas multicellular spheroids lead to a reproducible downregulation ofvarious DNA mismatch-repair genes48,49, an effect that may also bedirectly triggered by hypoxic conditions50. In spite of using spher-oids with a size that is sufficient to develop hypoxia in the center,approaches using small spheroids cultured under hypoxic condi-tions may thus be considered, keeping in mind of course thatoxygen deficiency is only one of a number of pathophysiologicalparameters with therapeutic relevance. Large spheroids with adiameter between 500 and 600 mm develop central secondarynecroses, which may be desired for some drug testing approachesbut can be problematic in others. How relevant secondary necrosisis has to be determined for the intended application and for theparticular tumor entities in vivo—see, e.g., the development of theso-called Comedo necroses in breast tumors. The possibility thatsuch secondary necroses—both in vitro and in vivo—may developthrough apoptosis has to be kept in mind as well20,22,51.
Short-term cultures may not be as densely packed as those thatformed over a longer period, they may not have endured lag phaseafter dissociation and seeding or may not yet express the entireauthentic 3D pattern, e.g., with respect to extracellular matrixdistribution and cell–cell/cell–matrix interactions52. Also, theymay not show the same degree of chronic nutrient-deficiencycharacteristics. Molecules of interest should thus be carefullychecked when short-term cultures of o48 h are used for testing.
Culture technology and treatment modalities. Easy and rapidhandling of both spheroid culturing and analysis are a condition for
p
uor
G g
n ih si l
bu
P eru ta
N 900 2©
nat
ure
pro
toco
ls/
moc.er
ut an.
ww
w//:ptt
h
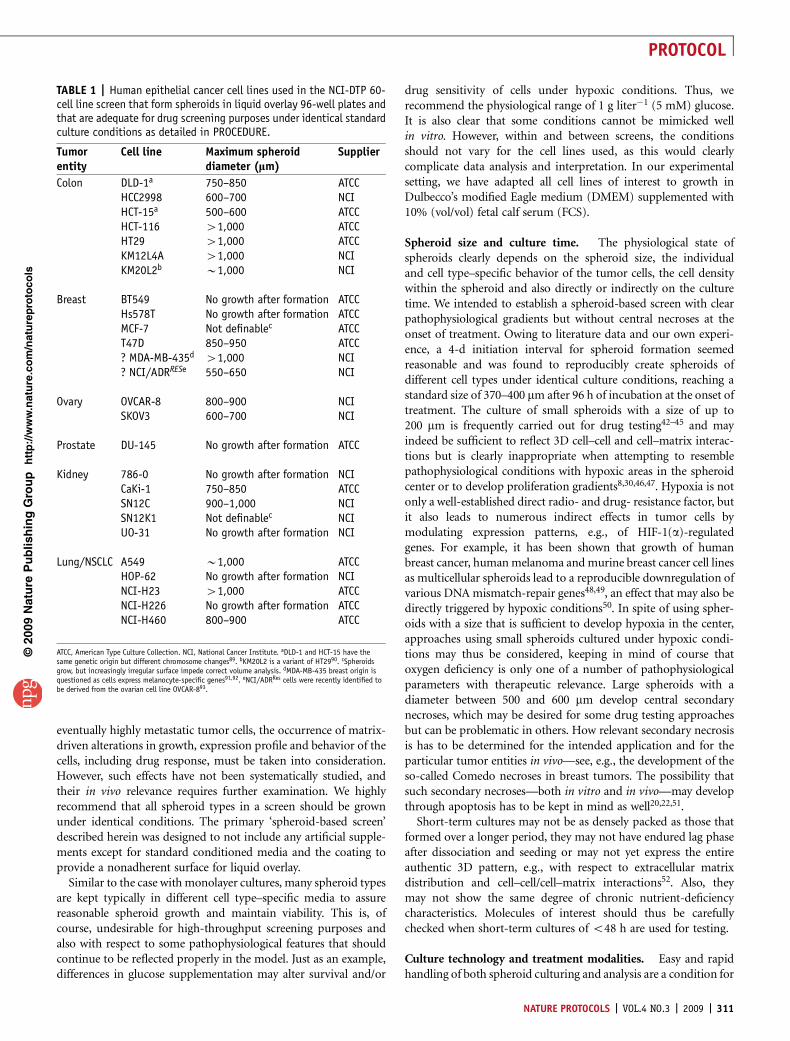
TABLE 1 | Human epithelial cancer cell lines used in the NCI-DTP 60-cell line screen that form spheroids in liquid overlay 96-well plates andthat are adequate for drug screening purposes under identical standardculture conditions as detailed in PROCEDURE.
Tumorentity
Cell line Maximum spheroiddiameter (lm)
Supplier
Colon DLD-1a 750–850 ATCCHCC2998 600–700 NCIHCT-15a 500–600 ATCCHCT-116 41,000 ATCCHT29 41,000 ATCCKM12L4A 41,000 NCIKM20L2b B1,000 NCI
Breast BT549 No growth after formation ATCCHs578T No growth after formation ATCCMCF-7 Not definablec ATCCT47D 850–950 ATCC? MDA-MB-435d 41,000 NCI? NCI/ADRRESe 550–650 NCI
Ovary OVCAR-8 800–900 NCISKOV3 600–700 NCI
Prostate DU-145 No growth after formation ATCC
Kidney 786-0 No growth after formation NCICaKi-1 750–850 ATCCSN12C 900–1,000 NCISN12K1 Not definablec NCIUO-31 No growth after formation NCI
Lung/NSCLC A549 B1,000 ATCCHOP-62 No growth after formation NCINCI-H23 41,000 ATCCNCI-H226 No growth after formation ATCCNCI-H460 800–900 ATCC
ATCC, American Type Culture Collection. NCI, National Cancer Institute. aDLD-1 and HCT-15 have thesame genetic origin but different chromosome changes89. bKM20L2 is a variant of HT2990. cSpheroidsgrow, but increasingly irregular surface impede correct volume analysis. dMDA-MB-435 breast origin isquestioned as cells express melanocyte-specific genes91,92. eNCI/ADRRes cells were recently identified tobe derived from the ovarian cell line OVCAR-893.
NATURE PROTOCOLS | VOL.4 NO.3 | 2009 | 311
PROTOCOL
integration of this model system into routine drug testing. Thevarious techniques for spheroid culturing have been describedearlier, emphasizing their individual advantages and disadvan-tages7,8,10,37. It is noted that the spinner flask technique remainsthe most appropriate for large-scale culturing and for maintainingspheroids under optimal supply conditions over a long period oftime. One has to acknowledge, however, that rotating culturesystems require relatively high quantities of media, conflictingwith the usual demand for minimum amounts of new drugcandidates to be applied in a drug test system. It may thus benecessary to transfer the spheroids to stationary spheroid culturesystems, not only during drug exposure, but also for determiningsome of the analytical parameters, such as spheroid volume growth.Such transfer would not only disturb the cultures following treat-ment but also renders individual spheroid monitoring impossible.
Stationary culturing technologies include the growth of spheroidcultures in nonadherent dishes, 96-well plates or as hanging drops.Whereas the first approach results in the formation of multiplespheroids with a broad size range requiring further sorting and isthus not recommended for screening, the 96-well approach allowsmonitoring and manipulation of single and uniform spheroids.The hanging drop method is comparably sufficient, but here drugtreatment would require spheroid transfer that is counterproduc-tive to large-scale screening. Problems with stationary culturing areprimarily due to the more diffusion-limited conditions comparedwith rotary systems that affect the supply of nutrients and thepathophysiological situation in the spheroids throughout growthbut may also alter drug distribution. The implementation ofrotating platforms for 96-well plates might be useful to reducethis problem. Other critical points specifically relevant for drugtesting in stationary cultures that may complicate interpretation ofdrug treatment studies have been discussed earlier7. Not surpris-ingly, drug treatment itself can affect the pathophysiological beha-vior, e.g., metabolic activity, of the cells, leading to secondary effectsdue to internally induced alterations in the nutrient environment.Such effects may be more pronounced in stationary than in stirredconditions. However, it has been speculated that similar alterationsdo occur in solid carcinomas due to their leaky, irregular andtortuous vascular system. In high-throughput test settings, some ofthe limitations of stationary culturing may be inevitable to mini-mize the amount of drug required. Owing to the need for analyzingand monitoring individual spheroids before and after treatmentand to be able to apply small amounts of drugs, we chose the well-established liquid-overlay 96-well plate approach7,37,53 to set up thespheroid-based screen protocol.
At present, none of the commercially available 96-well platesguarantees entirely reproducible spheroid culture for routineapplications. We are continuously testing new plates from variousdistributors and manufacturers; any test plates are welcome in ourlaboratory. However, for now, plates with nonadherent surfaces areprepared routinely before spheroid culturing. Different coatingstrategies are described, such as the treatment of round-bottomedwells with 0.5% (wt/vol) poly-hydroxyethyl methacrylate (poly-HEMA) in 95% ethanol41,54,55. Here, a centrifugation step to centerthe cells following inoculation may be advantageous for adequatespheroid formation. In our laboratory, the quality and reproduci-bility of spheroid formation and growth was still superior whenusing Agarose-coated flat-bottomed wells. This may be due toindividual handling, the poly-HEMA batches available or other
variables. Individual, small-scale testing of poly-HEMA versusagarose coating might, however, be useful for special applicationsor if problems with certain cell lines or systems occur. Agarosediluted in medium forms a semisolid, nonadherent, concave sur-face that has proven to be appropriate for liquid overlay spheroidculturing more than 20 years ago53. It is hypothesized that thesemisolid agar surface provides slightly better supply conditionsthan the bottom of a (coated) round-well plate, but this is stillawaiting clear experimental evidence. Note: do-it-yourself coatingof plates is obligatory for spheroid culturing, and coated platesshould/can only be stored for a limited time (see also instructionsbelow).
Analytical end points. Many basic and complex methods havebeen used for the analysis of MCTSs, be they viable, fixed ordissociated2,7,9. Today, all modern analytical tools, including mole-cular analyses, can be adapted to spheroid culture and may beconsidered if the analytical end point in a comparable monolayersystem—such as a critical up- or downregulation of a particulargene, set of genes or protein—is well established. Colony formationassays to verify clonogenic survival are an established end point toverify drug efficacy and radioresistance in monolayer cells andcultures, respectively. It has, however, become evident that the cellpreparation protocol is a critical determinant for the analyticalpower of this end point. Accordingly, clonogenic survival assayshave also been performed with single cells isolated from spheroids,e.g., following selective dissociation56–61, but such experimentalsetups are time intensive, require large amounts of spheroids andare thus not suitable for an initial spheroid-based screen. Inaddition, artificial cell loss due to the more difficult dissociationprocedure for 3D cultures, in particular after drug exposure, maybecome a major problem. Thus, the first spheroid-based screen toevaluate drug efficacy on a routine basis in our laboratory has beendesigned to cover the analytical end points: spheroid integrity, cellintegrity and regrowth following treatment.
Spheroid integrity can easily be visualized by (rapid) phase-contrast imaging, which is also the basis for recording spheroidvolume growth kinetics. We have semiautomated this setting forsingle spheroid monitoring according to a protocol given below. Asspheroid cell detachment directly after treatment may not necessa-rily result from (total) cell destruction and vice versa, microscopi-cally intact spheroids may as well contain membrane-defect cells;there is no strong argument against the analysis of spheroid volumegrowth as a function of time. Indeed, spheroid growth delay is oneof the supposed end points of interest that can most easily bedetermined.
Various protocols have been used in the literature to calculatespheroid growth delay. Approaches range from linear andnonlinear correlation analyses of the spheroid volume kineticsconsidering defined spheroid volume end points to the purerecording of time delay for spheroid regrowth after treatment62,63.The variable, nonuniform analysis in past reports has resulted in adispute over the term ‘growth delay.’ On the basis of the spheroiddiameter of 370–400 mm at the onset of drug treatment (averagestarting volume Vd4: (2.7–3.4) � 107 mm3), our setting includes thedocumentation of the time required to reach five times Vd4, withthe growth delay being calculated as the average time differencebetween treated and nontreated control spheroids. As spheroidsafter treatment may not show ‘normal’ tumor growth kinetics, e.g.,
p
uor
G g
n ih si l
bu
P eru ta
N 900 2©
nat
ure
pro
toco
ls/
moc.er
ut an.
ww
w//:ptt
h
312 | VOL.4 NO.3 | 2009 | NATURE PROTOCOLS
PROTOCOL
according to a Gompertzian or equivalent function64–66, we do notroutinely perform complex correlation analyses but record the firstday of the cultures to have a mean spheroid volume of Z5 � Vd4 asrapid estimate. This is useful if, as in the case of new drugcandidates, pronounced but not minor effects are to be assessed.In addition, the individual spheroid regrowth is recorded, and theproportion of spheroids to reach 5�Vd4 is monitored as a functionof time. This approach allows estimation of a 50% spheroid controlconcentration or dose according to the tumor control dose(TCD50) known from irradiation experiments.
Spheroid volume (re)growth is a primary analytical end point.However, it requires long-term culturing, and it is desirable also tohave a more immediate measure for cell survival directly aftertreatment. We have recently established an easy-handling protocolto use the acid phosphatase assay (APH) for cell integrity andviability assessment in single spheroids3. The assay is simple, rapidand high-throughput compatible, as it does not require spheroiddissociation. It has been described to be linear and highly sensitiveover a large cell concentration range for two well-establishedcolorectal cancer spheroid types, and the results can directly becompared with respective data from monolayer cultures using thesame assay. Similar systematic experiments for other simple assaysare not documented in the literature, although various groups haveapplied cell viability or cytotoxicity assays in spheroids42,67,68. As wefound several of the classical cell viability and cytotoxicity assaysnot to be applicable to spheroid cultures with varying sizes, wehighly recommend to not blindly apply any monolayer assay systembut to check the validity of the assay of choice or to use the APHapproach described herein. Thymidine incorporation assays mayalso be useful, as they primarily reflect proliferative activity, butwere not considered due to the more complex handling of radio-active material. In our laboratory, IC50 values estimated from dose-response curves determined through APH cell viability assessmentare used as one analytical end point for drug testing.
The capacity for spheroid outgrowth in 3D matrices or onadherent, ECM coated or noncoated surfaces, has been describedpreviously as an interesting parameter to describe the migratorybehavior of spheroid cells69,70. However, this is valid only if shortincubation intervals of less than one cell cycle are considered or ifcell cycle progression is chemically inhibited. Unfortunately, thelatter may interfere with drug efficacy and should be avoided.Therefore, the approach is particularly useful only for rapidlymigrating cells, e.g., in glioma or glioblastoma spheroids70. Wehave established a high-throughput compatible process to transferand center single spheroids from agarose-coated into ECM-coated96-well plates and to semiautomatically analyze spheroid out-growth. However, for many but not all colorectal cancer spheroidtypes, outgrowth is seen exclusively over a longer period of time (3–5 d), which does not allow clear discrimination of the effects of adrug on cell adherence, migration or proliferation. The test para-meter ‘outgrowth’ is thus not considered as a primary analyticalend point for routine monitoring in the spheroid-based screen andwill not be discussed further in this protocol.
Additional methodological considerations. Three types ofcontrols should be considered for a spheroid-based drug testsystem: (i) spheroid, (ii) treatment and (iii) analytical controls.Spheroid control means that a well-established and characterizedspheroid type is routinely included in the experimental setup. Weuse HT29 spheroids as a standard. Drugs that are already in clinicaluse either for a specific tumor entity or with broader efficacy canserve as treatment controls. Such drugs may be 5-fluorouracil oririnotecan, e.g., for colorectal cancers, and also paclitaxel, cisplatinor even doxorubicin (adriamycin), which has the advantage ofbeing fluorescent and thus can be useful as a control for drugpenetration studies56,71,72. Analytical controls, e.g., cell-free med-ium, dead cell and drug solvent controls and others, are depictedfor our specific procedure in the respective paragraphs.
MATERIALSREAGENTSm CRITICALThe lists provided in this section are based on thematerials usedin our laboratory. Chemicals and cell culture materials may, of course, alsobe purchased from other distributors and/or manufacturers..Acetic acid 96% (Merck KGaA, cat. no. 1000621000) ! CAUTION Flammable,
toxic..Agarose (Sigma-Aldrich Chemie GmbH, cat. no. A9539-100G) m CRITICAL
Use of other agaroses may cause problems..Dimethyl sulfoxide (DMSO; Merck KGaA, cat. no. 317275-100ML)! CAUTION Hazardous; avoid contact with skin and eyes.
.DMEM (PAN Biotech GmbH, cat. no. P04-01550)
.Electrolyte solution (Casyton, Scharfe System GmbH, cat. no. 43001)
.FCS (PAN Biotech GmbH, cat. no. 3302-P250922) m CRITICAL Serumquality affects spheroid formation and growth and should be routinelytested! Serum may interfere with the APH signal (n Z 20% serum).
.ImmunoPure p-nitrophenyl phosphate, disodium salt (Pierce, cat. no. 34045)
.Sodium hydroxide (Merck KGaA, cat. no 567530-250GM) ! CAUTIONCorrosive, wear suitable gloves and eye/face protection.
.Sodium acetate 3 M, pH 5.2 (Quality Biological Inc., cat. no. 351-035-061)
.Penicillin/streptomycin 1,000 U pen./10 mg strep. per ml (PAN BiotechGmbH, cat. no. P06-07100)
.Phosphate-buffered saline without Ca2+, Mg2+ (PBS; PAN Biotech GmbH,cat. no. P04-36500) m CRITICAL For some steps, Ca2+/Mg2+-free conditionsare required, e.g., to avoid cell clumping.
.Triton X-100 (Sigma-Aldrich Chemie GmbH, cat. no. X100-100ML)! CAUTION Harmful/dangerous for the environment; wear suitable gloves
and eye/face protection. m CRITICAL Triton X-100 of different manufacturersmay vary with respect to cell kill.
.0.5% (wt/vol) trypsin/0.2% (wt/vol) ethylenediaminetetraacetic acid (EDTA)solution (PAN Biotech GmbH, cat. no. P10-024020)
EQUIPMENTm CRITICAL It is noted that there is a clear difference in the configurationrequired for laboratories using spheroids for primary but large-scaledrug testing, as is the focus herein, versus those most suitable for addressingbasic research-driven questions. Automated phase-contrast imaging,e.g., is not required for spheroid work per se but should be availablefor a spheroid-based drug screening platform. Some equipment can besubstituted by other systems, e.g., pipetting and microscope apparatusesas well as application software. We have added information on theparticular use of the specific equipment for our protocol to allowpotential and sufficient substitution in the reader’s laboratories..Autoclave: tabletop autoclave Model DC2002 (Biocare Medical)
(see EQUIPMENT SETUP).Beaker system from either one-way material or reusable glassware
(e.g., Schott; see EQUIPMENT SETUP; Fig. 1).Cell analyzer: cell counter Casy 1 Model 1 TTC (Scharfe System GmbH).Cell culture flasks T75 and T175 (Greiner Bio-One GmbH, cat. nos. 658175
and 660175).Cell culture plates Microtest, 96-well, flat bottomed (Becton Dickinson
GmbH, cat. no. 353075; see EQUIPMENT SETUP).Centrifuge Megafuge Model 1.0 or Multifuge 1S-R (Heraeus Sepatech
GmbH)
p
uor
G g
n ih si l
bu
P eru ta
N 900 2©
nat
ure
pro
toco
ls/
moc.er
ut an.
ww
w//:ptt
h
NATURE PROTOCOLS | VOL.4 NO.3 | 2009 | 313
PROTOCOL
.Centrifuge Varifuge Model 3.2RS or Biofuge stratos (Heraeus SepatechGmbH; see Step 9B(ii))
.CO2 incubators, such as Heraeus Model T 6120 and Hera cell 150 (HeraeusGmbH)
.Clean benches, such as Laminair 2472S/HBB 2448 and Hera safe KS18(Heraeus GmbH) or Holten 2010 1.2 (Holten) m CRITICAL Required forsterile cell culture handling.
.Microplate Readers, e.g., the Emax Precision Microplate Reader (MolecularDevices Corporation) or Fusion Universal Microplate Analyzer (Packard; seeSteps 9A(vi) and 9B(viii))
.Microscopes: Axiovert 200 microscope equipped with an AxioCam MRccamera (Zeiss AG, cat. no. 426508-9901-000) and an Axiovert 200 Mmicroscope equipped with an AxioCam MRm camera (Zeiss AG, cat. no.426509-9901-000; Fig. 2)
.Nitrogen tanks, such as the Model GT 75 l (Air Liquide GmbH) or theApollo Cryosystem (KGW Isotherm)
.Pipettor, AccuJet (Brand GmbH + Co KG, cat. no. 26300)
.5-, 10- and 25-ml polypropylene (PP) pipettes (BD Falcon, cat. nos. 357543,357551 and 357525)
.Pipettor, 8-channel (Brand GmbH + Co KG, cat. no. 703608)
.100-ml Ultratips (Greiner Bio-One GmbH, cat. no. 739296)
.300-ml Plastibrand tips (Brand GmbH + Co KG, cat. no. D-286-3)
.Pipettor, electronic multichannel Finn Pipettus Biocontrol (50–1300 ml)
.Extra volume tips (100–1,300 ml; StarLab, cat. no. I1012-2000)
.Pipettor, Multipette plus or multipette x-stream with 5-ml combi tips(Eppendorf GmbH, cat. no. 0030069.455; see EQUIPMENT SETUP; Fig. 1)
.SerialMate automated multichannel pipetting system (Thermo FisherScientific Inc.; see Step 4; Fig. 2)
.Tubes: 15- or 50-ml PP tubes (Greiner Bio-One GmbH, cat. nos. 188271and 210261)
.Cryo tubes (Cryo.S, PP, sterile; Greiner Bio-One GmbH, cat. no 122261)
REAGENT SETUPStandard medium Dulbecco’s modified Eagle’s medium with phenol redcontaining 1 g liter�1 glucose, 1% (wt/vol) sodium pyruvate, 1% (wt/vol)L-glutamine and 3.7% (wt/vol) NaHCO3, supplemented with 100 U ml�1
penicillin, 100 mg ml�1 streptomycin and 10% FCS is used as standard mediumfor routine cell and spheroid culturing. Standard medium can be stored at4 1C for up to 2 weeks.Trypsin/EDTA working solution Phosphate-buffered saline is applied todilute the trypsin/EDTA stock solution to a final concentration of 0.05%(wt/vol) trypsin and 0.02% (wt/vol) EDTA. The working solution can be storedat �20 1C for up to 1 year.Drugs and drug candidates Prepare appropriate stock solutions of drugs anddrug candidates, respectively, and store at conditions required to keep optimumdrug activity. In our first standard spheroid-based screen, final drug concentrationranged from 0.01 to 200 mM, but some drug candidates are efficient at much lowerconcentrations. For most but not all drugs in our laboratory, 100 mM stocksolutions in DMSO and storage at �20 1C for up to 2 weeks are suitable.APH assay buffer The assay buffer to assess APH activity contains 0.1 Msodium acetate (3 M stock solution, pH 5.2) and 0.1% (vol/vol) Triton X-100 indeionized/destilled H2O and can be stored at 4 1C for up to 4 weeks. Thesubstrate solution is prepared by supplementing the assay buffer with 2 mg ml�1
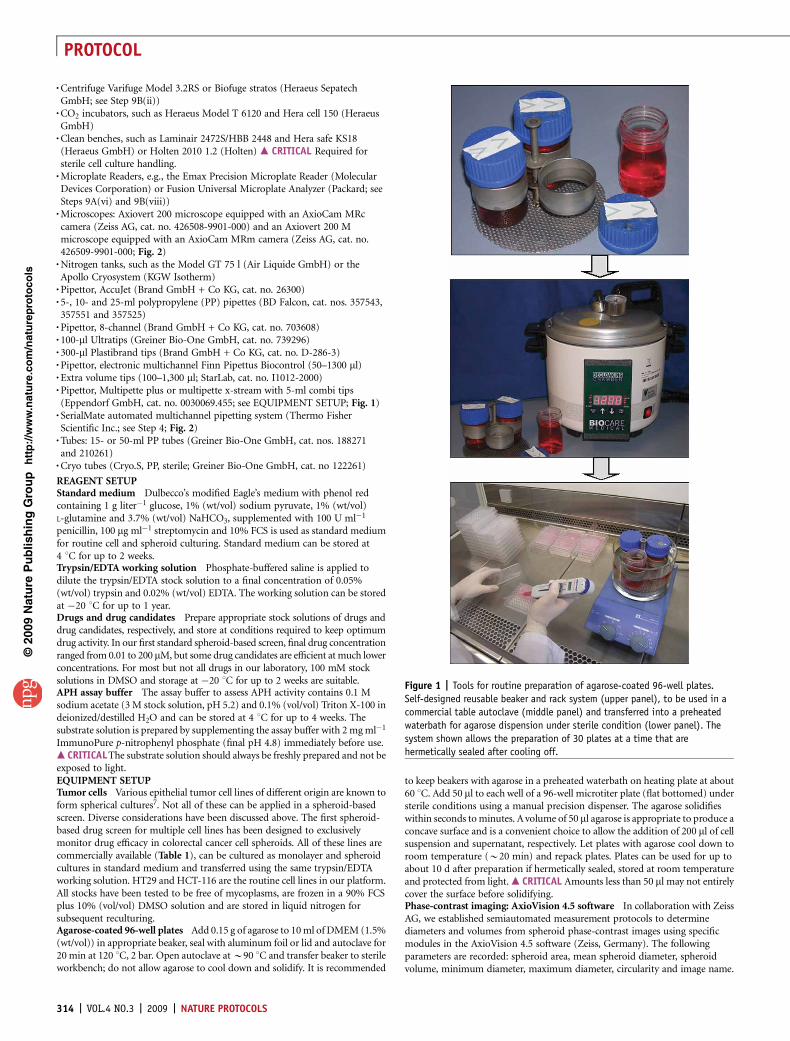
ImmunoPure p-nitrophenyl phosphate (final pH 4.8) immediately before use.m CRITICALThe substrate solution should always be freshly prepared and not beexposed to light.EQUIPMENT SETUPTumor cells Various epithelial tumor cell lines of different origin are known toform spherical cultures7. Not all of these can be applied in a spheroid-basedscreen. Diverse considerations have been discussed above. The first spheroid-based drug screen for multiple cell lines has been designed to exclusivelymonitor drug efficacy in colorectal cancer cell spheroids. All of these lines arecommercially available (Table 1), can be cultured as monolayer and spheroidcultures in standard medium and transferred using the same trypsin/EDTAworking solution. HT29 and HCT-116 are the routine cell lines in our platform.All stocks have been tested to be free of mycoplasms, are frozen in a 90% FCSplus 10% (vol/vol) DMSO solution and are stored in liquid nitrogen forsubsequent reculturing.Agarose-coated 96-well plates Add 0.15 g of agarose to 10 ml of DMEM (1.5%(wt/vol)) in appropriate beaker, seal with aluminum foil or lid and autoclave for20 min at 120 1C, 2 bar. Open autoclave at B90 1C and transfer beaker to sterileworkbench; do not allow agarose to cool down and solidify. It is recommended
to keep beakers with agarose in a preheated waterbath on heating plate at about60 1C. Add 50 ml to each well of a 96-well microtiter plate (flat bottomed) understerile conditions using a manual precision dispenser. The agarose solidifieswithin seconds to minutes. A volume of 50 ml agarose is appropriate to produce aconcave surface and is a convenient choice to allow the addition of 200 ml of cellsuspension and supernatant, respectively. Let plates with agarose cool down toroom temperature (B20 min) and repack plates. Plates can be used for up toabout 10 d after preparation if hermetically sealed, stored at room temperatureand protected from light. m CRITICAL Amounts less than 50 ml may not entirelycover the surface before solidifying.Phase-contrast imaging: AxioVision 4.5 software In collaboration with ZeissAG, we established semiautomated measurement protocols to determinediameters and volumes from spheroid phase-contrast images using specificmodules in the AxioVision 4.5 software (Zeiss, Germany). The followingparameters are recorded: spheroid area, mean spheroid diameter, spheroidvolume, minimum diameter, maximum diameter, circularity and image name.
p
uor
G g
n ih si l
bu
P eru ta
N 900 2©
nat
ure
pro
toco
ls/
moc.er
ut an.
ww
w//:ptt
h
Figure 1 | Tools for routine preparation of agarose-coated 96-well plates.
Self-designed reusable beaker and rack system (upper panel), to be used in a
commercial table autoclave (middle panel) and transferred into a preheated
waterbath for agarose dispension under sterile condition (lower panel). The
system shown allows the preparation of 30 plates at a time that are
hermetically sealed after cooling off.
314 | VOL.4 NO.3 | 2009 | NATURE PROTOCOLS
PROTOCOL
PROCEDURESpheroid initiation � TIMING Working time 1–2 h,incubation time 96 h1| Thaw tumor cells routinely from frozen stocks andsubculture for 41 and o20 passages (before spheroidinitiation). Use ‘standard medium’ for routine culturing3. Keepcultures in humidified atmosphere with 5% CO2 in air at 37 1C.
2| Prepare single-cell suspensions by mild enzymaticdissociation using a trypsin/EDTA solution9. Transfer stockcultures every 3–4 d by seeding appropriate numbers of cellsof (0.5–1) � 106 (depending on cell type and doubling time)into T75 culture flasks. Avoid repeated dissociation ofmonolayers within less than 2 d.
3| To generate spheroids of 400-mm diameter at day 4 afterinoculation in liquid overlay culture37,53, dilute dissociatedcells from stock cultures to appropriate concentrations in stan-dard medium, e.g., 7,500 cells ml�1 for HT29 and 3,750 cellsml�1 for HCT-116 human colon carcinoma cells.m CRITICAL STEP For each tumor cell line, the cell numberneeded to create spheroids of 370–400 mm in diameter at day 4after initiation (see Step 6) has to be determined in preliminarytests using appropriate dissociation means to produce single cellsuspensions. In our setup, spheroid formation is routinely checked by phase-contrast microscopy for cell concentrations rangingfrom 2.5� 103 to 6� 104 cells ml�1 (as described in Step 6 ). A representative example of one cell type from the NCI-DTP 60 cell linepanel tested is shown in Figure 3. Reproducibility is then checked twice, 3D sphericity is evaluated, and spheroid characteristics ofinterest, e.g., the number of cells per spheroid, at the respective diameter are documented.
4| Use a manual eight-channel pipettor or an automated multichannel pipetting system, such as the SerialMate to transfer200 ml of the cell suspension into each well of an agarose-coated microtiter plate (1,500 HT29 and 750 HCT-116 cells perwell, respectively). Application of an automated multichannel pipetting system (Fig. 2) may optimize spheroid formation byreducing variability due to individual handling during seeding. The standard deviation (s.d.) of HT 29 spheroid diameters at day4 after seeding is reproducibly below 5% in one 96-well plate and one experimental 96-well plate series, respectively, and lessthan 10% between different experiments.? TROUBLESHOOTING
5| Incubate plates for 96 h in a humidified atmosphere with 5% CO2 in air at 37 1C.m CRITICAL STEP Avoid agitation during initiation interval.? TROUBLESHOOTING
6| After 96 h of incubation (day 4 after intiation of spheroids), image each well of the 96-well plate with a phase-contrastmicroscope using a �10 or �5 objective to monitor and analyze spheroid integrity, diameter and volume. An automated ZeissAxiovert200/M-based system is used for this purpose in our laboratory. Spheroid analysis is performed through image processingalgorithms implemented in the AxioVision 4.5 Software (Zeiss), which allows reliable and reproducible area selection todetermine spheroid diameter and volume (Fig. 2). Routinely generated data tables contain the following morphometric
p
uor
G g
n ih si l
bu
P eru ta
N 900 2©
nat
ure
pro
toco
ls/
moc.er
ut an.
ww
w//:ptt
h
Semiautomatedseeding and feedingof MCTS in liquid-overlay culture understerile conditions
a
bc d
e
f g h
i
800 µm
Automated microscopesystem for phase-contrastImaging and analysis
Imaging Analysis Storage100 µm
Spheroid integritySpheroid diameterSpheroid volume
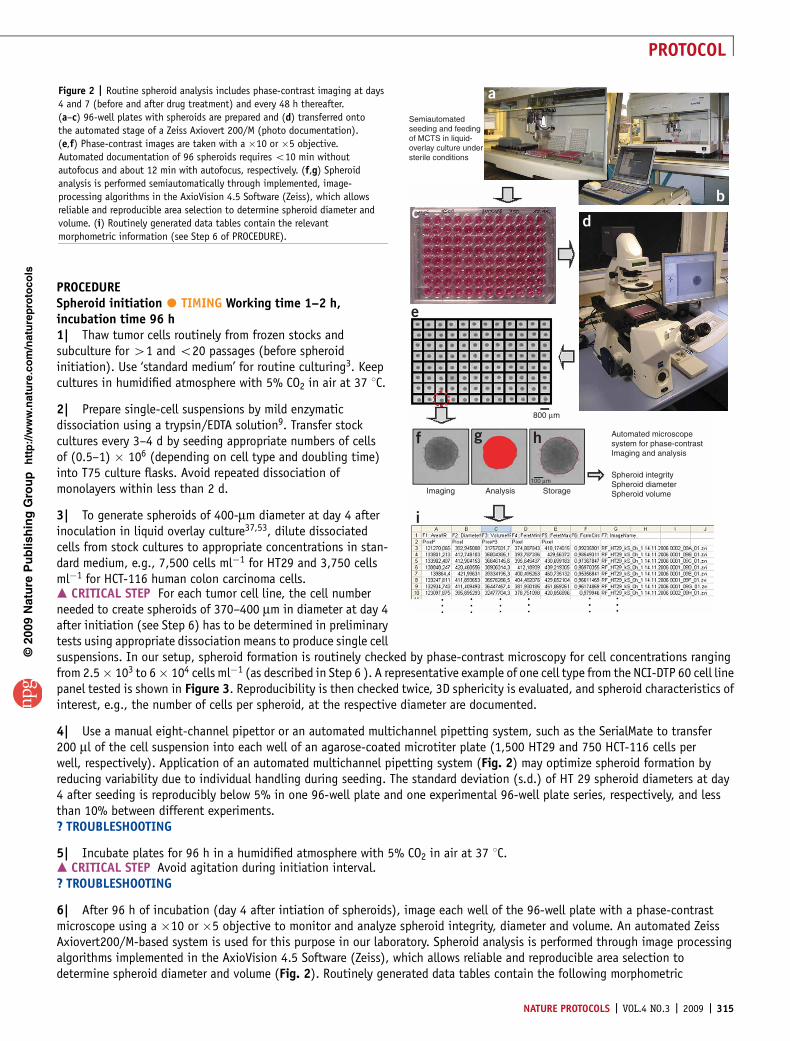
Figure 2 | Routine spheroid analysis includes phase-contrast imaging at days
4 and 7 (before and after drug treatment) and every 48 h thereafter.
(a–c) 96-well plates with spheroids are prepared and (d) transferred onto
the automated stage of a Zeiss Axiovert 200/M (photo documentation).
(e,f) Phase-contrast images are taken with a �10 or �5 objective.
Automated documentation of 96 spheroids requires o10 min without
autofocus and about 12 min with autofocus, respectively. (f,g) Spheroid
analysis is performed semiautomatically through implemented, image-
processing algorithms in the AxioVision 4.5 Software (Zeiss), which allows
reliable and reproducible area selection to determine spheroid diameter and
volume. (i) Routinely generated data tables contain the relevant
morphometric information (see Step 6 of PROCEDURE).
NATURE PROTOCOLS | VOL.4 NO.3 | 2009 | 315
PROTOCOL
information: spheroid area (area), mean spheroid diameter(diameter), spheroid volume (volume), minimum diameter(FeretMin), maximum diameter (FeretMax), circularity (For-mCirc) and image name of the stored image of an evaluatedarea selection. The image name is based on cell line, date andtime of measurement, location on plate and plate number.
Drug treatment � TIMING Working time 1 h; incubationtime 72 h7| For spheroid and monolayer treatment, respectively, dilute drugs or drug stock solutions in standard medium at 2� finalconcentration immediately before usage. As reference for nontreated control cells and spheroids, standard medium containingthe respective solvent, e.g., DMSO, according to the concentration present in the lowest drug dilution (2 � 200 mM) isprepared.m CRITICAL STEP Note that DMSO concentrations of o0.5% are not expected to affect spheroid growth. Slight effects mayalready be seen at a concentration of 0.5–1%, depending on the cell type and culture condition. A proportion of 41% DMSO inthe drug dilution for treatment should be avoided. Other solvents are to be verified. Individual solvent controls for each drugconcentrations may be considered.
8| Treat spheroid cultures by replacing 50% (¼100 ml) of supernatant with drug-supplemented standard medium using amanual 8-channel pipettor or the SerialMate automated multichannel pipetting system. In parallel, replace medium ofuntreated reference cells and spheroids with solvent-containing or solvent-free standard medium. In our setup, 8–16 spheroidsare treated and analyzed per condition and drug concentration, respectively.m CRITICAL STEP Spheroid symmetry (sphericity) should be checked in control untreated spheroids before using a new spheroidtype for routine drug testing. In some instances, it may be recommended to also monitor 3D spherical structure following treatment,e.g., if spheroids grow much larger than expected and/or become transparent.? TROUBLESHOOTING
9| Incubate cultures for a defined treatment interval (in our case for 72 h) in a humidified atmosphere with 5% CO2 in airat 37 1C.
Determination of cell viability using the acid phosphotase assay � TIMING 2–3 h10| The APH assay proved useful to determine cell viability in monolayer and spheroid cultures3. As we routinely determinedrug effects in monolayer cultures in parallel to spheroid cultures, the APH assay procedure for monolayer cells shall also bedescribed herein. The assay procedure differs for monolayer cultures (option A) and MCTSs (option B).(A) APH assay on monolayer cultures
(i) Prepare monolayer cells for every test as follows: plate 600 exponentially growing monolayer cells in 200 ml of standardmedium per well of a 96-well microtiter plate (flat bottomed) and incubate for 4 d in humidified atmosphere with 5% CO2
in air at 37 1C. Treat monolayer cells according to the instructions for spheroid cultures described in the previous section(Steps 6–8).
(ii) After treatment, wash monolayer cultures by carefully replacing the 200 ml of supernatant with PBS.(iii) Repeat wash step and add 100 ml of PBS per well.(iv) Add 100 ml of APH assay buffer to each well and incubate for 90 min at 37 1C in an incubator.
? TROUBLESHOOTING(v) Following incubation, add 10 ml of 1 N NaOH to each well.(vi) Measure absorption at 405 nm within 10 min on a microplate reader.
? TROUBLESHOOTING
p
uor
G g
n ih si l
bu
P eru ta
N 900 2©
nat
ure
pro
toco
ls/
moc.er
ut an.
ww
w//:ptt
h
2
A
B
C
D
E
F
G
H
500
1,00
01,
500
2,00
03,
000
1,600 µm
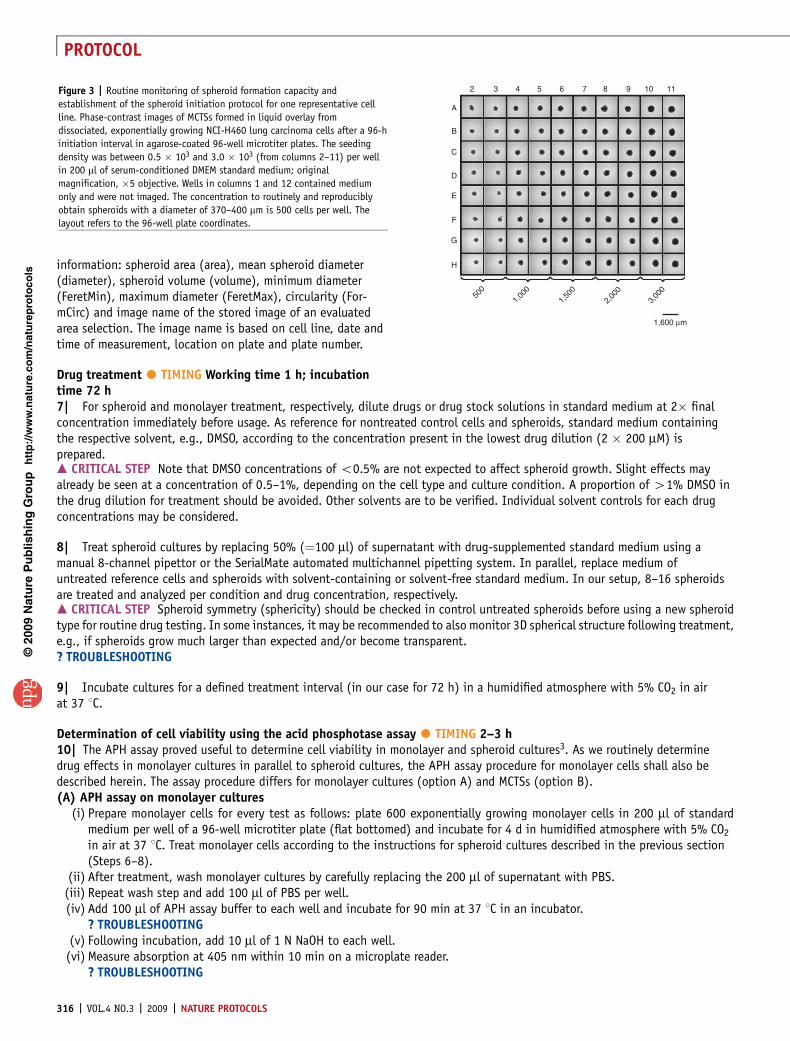
3 4 5 6 7 8 9 10 11Figure 3 | Routine monitoring of spheroid formation capacity and
establishment of the spheroid initiation protocol for one representative cell
line. Phase-contrast images of MCTSs formed in liquid overlay from
dissociated, exponentially growing NCI-H460 lung carcinoma cells after a 96-h
initiation interval in agarose-coated 96-well microtiter plates. The seeding
density was between 0.5 � 103 and 3.0 � 103 (from columns 2–11) per well
in 200 ml of serum-conditioned DMEM standard medium; original
magnification, �5 objective. Wells in columns 1 and 12 contained medium
only and were not imaged. The concentration to routinely and reproducibly
obtain spheroids with a diameter of 370–400 mm is 500 cells per well. The
layout refers to the 96-well plate coordinates.
316 | VOL.4 NO.3 | 2009 | NATURE PROTOCOLS
PROTOCOL
(B) APH assay on MCTSs(i) Analyze sphericity, spheroid integrity and diameter of MCTSs grown in liquid overlay for 7 d (initiation period of 4 d plus
treatment interval of 72 h), i.e., from Step 10, through phase-contrast imaging before APH assaying.m CRITICAL STEP 10% Triton X-100 in standard medium can be used as ultimate (positive) control to induce completeloss of cell membrane integrity of all cells in structurally intact spheroids with an incubation interval of 2 h before APHassaying.
(ii) Carefully transfer MCTSs and entire supernatant with cells into standard flat-bottomed 96-well microplates with a manualeight-channel pipettor.m CRITICAL STEP Note that APH assays are routinely performed with 8–16 spheroids per condition and treatment modal-ity. Most experiments are repeated twice, except for rapid, preliminary concentration screening. Application of an auto-mated pipettor is envisioned upon assay scale-up.
(iii) Centrifuge for 10 min at RT at B400g to spin down spheroids, clusters and single cells.(iv) Wash spheroid/cell pellet by carefully replacing 160 ml of the supernatant with PBS.
m CRITICAL STEP Be sure not to lose any cell material.(v) Repeat centrifugation and discard supernatant to a final volume of 100 ml.(vi) Add 100 ml of APH assay buffer to each well and incubate for 90 min at 37 1C in an incubator.
? TROUBLESHOOTING(vii) Following incubation, supplement each well with 10 ml of 1 N NaOH.(viii) Measure absorption at 405 nm within 10 min on a microplate reader.
? TROUBLESHOOTING
Determination of spheroid integrity and volume growth kinetics� TIMING Working time 1 h per drug every 2 d over a periodof Z14 d11| Culture spheroids in liquid overlay and treat as detailed earlier (Steps 1–9). For studies on spheroid growth delay/regrowth,replace 50% of the supernatant by fresh, standard medium after the treatment interval and every 48 h thereafter.m CRITICAL STEP To avoid spheroid cell loss or disruption, supernatant cannot be removed completely even after treatment. Inmost applications, we accept replacement of 50% of the supernatant leading to a 1:2 dilution of the remaining drug and residualdrug activity, respectively, which is then consecutively diluted throughout further culturing, i.e., with every medium refreshment.The incubation period is thus not as clearly defined as for the APH assay setting at least for those drugs that are still highly activeafter 72 h at 37 1C. Approaches to adapt and eventually optimize this setting for semiautomated test routines are discussed, andsome basic tests are underway. Sequential treatment is, of course, also feasible but unlikely in a primary screen/test system.
12| Collect phase-contrast images of all individual spheroids before drug treatment (day 4 in culture), after 72 h of treatment(day 7 in culture) and at least every 48 h thereafter either manually or automated, e.g., on a Zeiss Axiovert 200 or automatedZeiss Axiovert 200 M equipped with camera systems and workstations.
13| Monitor and analyze spheroid integrity, diameter and volume semiautomatically at any given time from images taken with�5 or �10 objective, respectively, using appropriate software modules, e.g., in the AxioVision 4.5 software (Fig. 2).
14| Routinely transfer list of data into worksheet (e.g., in Excel) or specific databank (not yet commercially or freely available)for subsequent spheroid data analysis, and plot mean spheroid volume as a function of time on a semilogarithmic scale to visua-lize spheroid volume growth kinetics and to evaluate spheroid growth delay after treatment.? TROUBLESHOOTING
15| As potential analytical end point, determine the time delay and the proportion of treated spheroids versus nontreatedspheroids to reach the spheroid volume five times higher than the starting volume at day 4 after initiation (5 � Vd4), i.e., spher-oid volume at the onset of treatment, and also record the first day of spheroid regrowth following treatment if possible (seealso Experimental design)m CRITICAL STEP The spheroid volume 5 � Vd4 is valid for all spheroid types reaching diameters of Z700 mm under standardconditions. For some practical reasons not discussed herein, the maximum spheroid volume is a poor analytical end point in liquidoverlay culture.? TROUBLESHOOTING
� TIMINGA time table with day 0 defined as the day of cell seeding for spheroid initiation is given in Figure 4.
? TROUBLESHOOTINGTroubleshooting advice can be found in Table 2.
p
uor
G g
n ih si l
bu
P eru ta
N 900 2©
nat
ure
pro
toco
ls/
moc.er
ut an.
ww
w//:ptt
h
NATURE PROTOCOLS | VOL.4 NO.3 | 2009 | 317
PROTOCOL
p
uor
G g
n ih si l
bu
P eru ta
N 900 2©
nat
ure
pro
toco
ls/
moc.er
ut an.
ww
w//:ptt
h
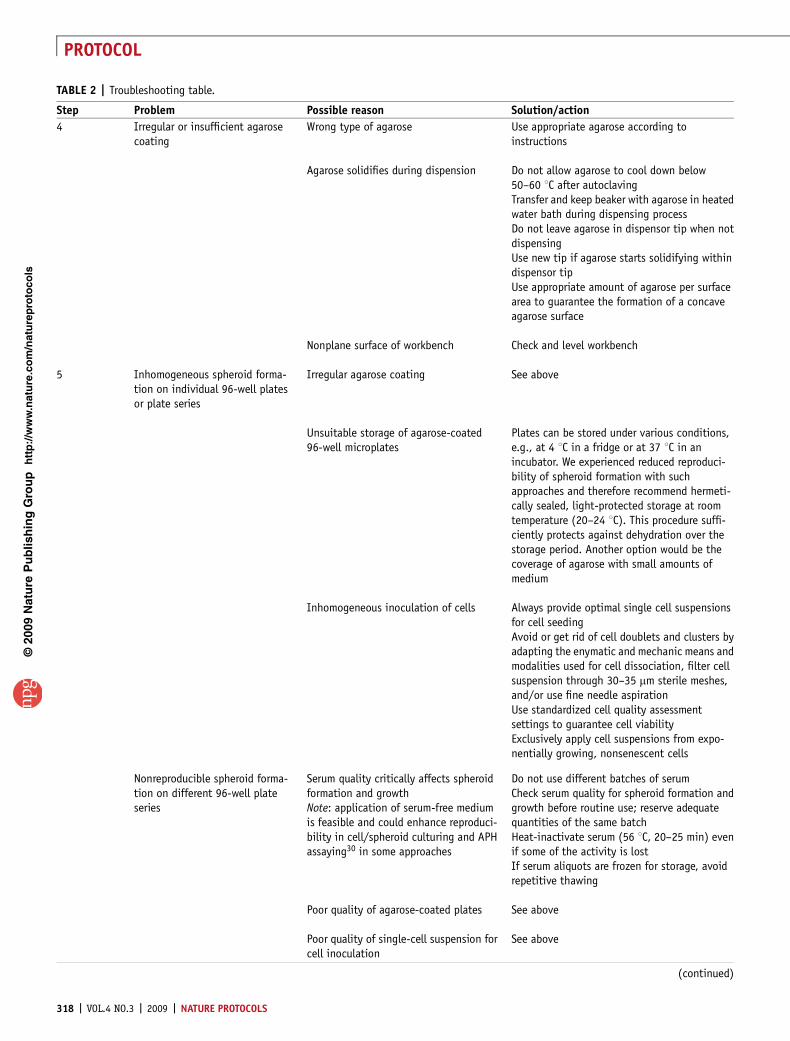
TABLE 2 | Troubleshooting table.
Step Problem Possible reason Solution/action
4 Irregular or insufficient agarosecoating
Wrong type of agarose Use appropriate agarose according toinstructions
Agarose solidifies during dispension Do not allow agarose to cool down below50–60 1C after autoclavingTransfer and keep beaker with agarose in heatedwater bath during dispensing processDo not leave agarose in dispensor tip when notdispensingUse new tip if agarose starts solidifying withindispensor tipUse appropriate amount of agarose per surfacearea to guarantee the formation of a concaveagarose surface
Nonplane surface of workbench Check and level workbench
5 Inhomogeneous spheroid forma-tion on individual 96-well platesor plate series
Irregular agarose coating See above
Unsuitable storage of agarose-coated96-well microplates
Plates can be stored under various conditions,e.g., at 4 1C in a fridge or at 37 1C in anincubator. We experienced reduced reproduci-bility of spheroid formation with suchapproaches and therefore recommend hermeti-cally sealed, light-protected storage at roomtemperature (20–24 1C). This procedure suffi-ciently protects against dehydration over thestorage period. Another option would be thecoverage of agarose with small amounts ofmedium
Inhomogeneous inoculation of cells Always provide optimal single cell suspensionsfor cell seedingAvoid or get rid of cell doublets and clusters byadapting the enymatic and mechanic means andmodalities used for cell dissociation, filter cellsuspension through 30–35 mm sterile meshes,and/or use fine needle aspirationUse standardized cell quality assessmentsettings to guarantee cell viabilityExclusively apply cell suspensions from expo-nentially growing, nonsenescent cells
Nonreproducible spheroid forma-tion on different 96-well plateseries
Serum quality critically affects spheroidformation and growthNote: application of serum-free mediumis feasible and could enhance reproduci-bility in cell/spheroid culturing and APHassaying30 in some approaches
Do not use different batches of serumCheck serum quality for spheroid formation andgrowth before routine use; reserve adequatequantities of the same batchHeat-inactivate serum (56 1C, 20–25 min) evenif some of the activity is lostIf serum aliquots are frozen for storage, avoidrepetitive thawing
Poor quality of agarose-coated plates See above
Poor quality of single-cell suspension forcell inoculation
See above
(continued)
318 | VOL.4 NO.3 | 2009 | NATURE PROTOCOLS
PROTOCOL
p
uor
G g
n ih si l
bu
P eru ta
N 900 2©
nat
ure
pro
toco
ls/
moc.er
ut an.
ww
w//:ptt
h
TABLE 2 | Troubleshooting table (continued).
Step Problem Possible reason Solution/action
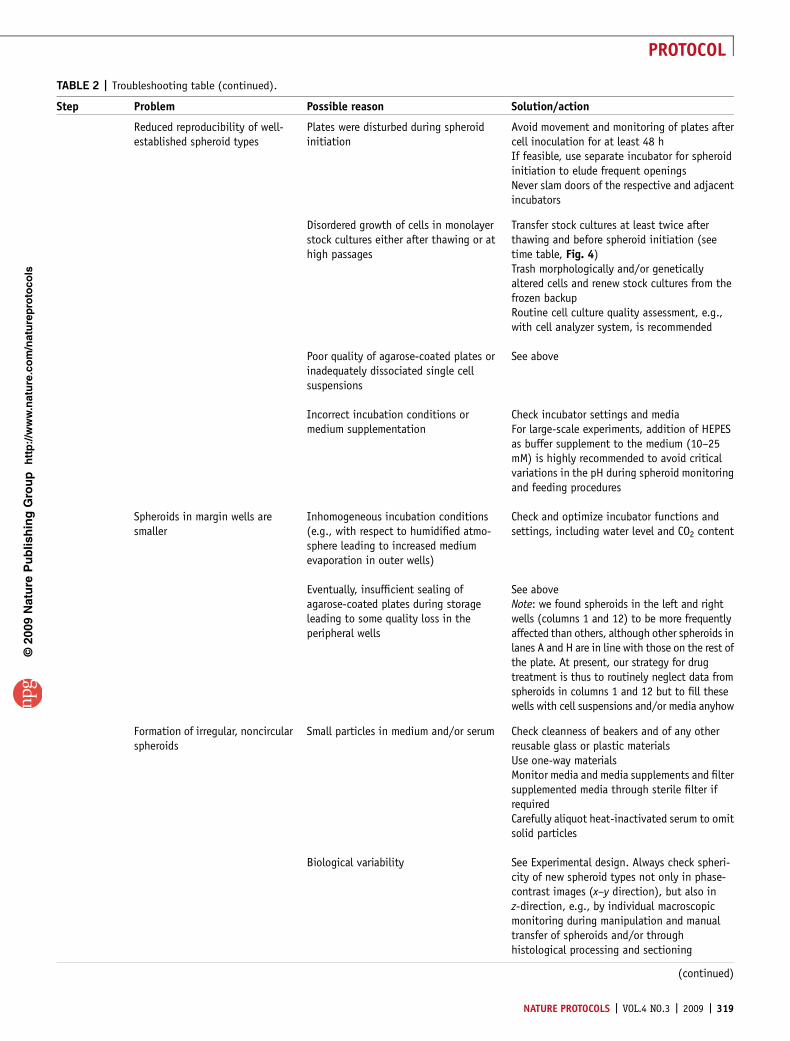
Reduced reproducibility of well-established spheroid types
Plates were disturbed during spheroidinitiation
Avoid movement and monitoring of plates aftercell inoculation for at least 48 hIf feasible, use separate incubator for spheroidinitiation to elude frequent openingsNever slam doors of the respective and adjacentincubators
Disordered growth of cells in monolayerstock cultures either after thawing or athigh passages
Transfer stock cultures at least twice afterthawing and before spheroid initiation (seetime table, Fig. 4)Trash morphologically and/or geneticallyaltered cells and renew stock cultures from thefrozen backupRoutine cell culture quality assessment, e.g.,with cell analyzer system, is recommended
Poor quality of agarose-coated plates orinadequately dissociated single cellsuspensions
See above
Incorrect incubation conditions ormedium supplementation
Check incubator settings and mediaFor large-scale experiments, addition of HEPESas buffer supplement to the medium (10–25mM) is highly recommended to avoid criticalvariations in the pH during spheroid monitoringand feeding procedures
Spheroids in margin wells aresmaller
Inhomogeneous incubation conditions(e.g., with respect to humidified atmo-sphere leading to increased mediumevaporation in outer wells)
Check and optimize incubator functions andsettings, including water level and CO2 content
Eventually, insufficient sealing ofagarose-coated plates during storageleading to some quality loss in theperipheral wells
See aboveNote: we found spheroids in the left and rightwells (columns 1 and 12) to be more frequentlyaffected than others, although other spheroids inlanes A and H are in line with those on the rest ofthe plate. At present, our strategy for drugtreatment is thus to routinely neglect data fromspheroids in columns 1 and 12 but to fill thesewells with cell suspensions and/or media anyhow
Formation of irregular, noncircularspheroids
Small particles in medium and/or serum Check cleanness of beakers and of any otherreusable glass or plastic materialsUse one-way materialsMonitor media and media supplements and filtersupplemented media through sterile filter ifrequiredCarefully aliquot heat-inactivated serum to omitsolid particles
Biological variability See Experimental design. Always check spheri-city of new spheroid types not only in phase-contrast images (x–y direction), but also inz-direction, e.g., by individual macroscopicmonitoring during manipulation and manualtransfer of spheroids and/or throughhistological processing and sectioning
(continued)
NATURE PROTOCOLS | VOL.4 NO.3 | 2009 | 319
PROTOCOL
p
uor
G g
n ih si l
bu
P eru ta
N 900 2©
nat
ure
pro
toco
ls/
moc.er
ut an.
ww
w//:ptt
h
TABLE 2 | Troubleshooting table (continued).
Step Problem Possible reason Solution/action
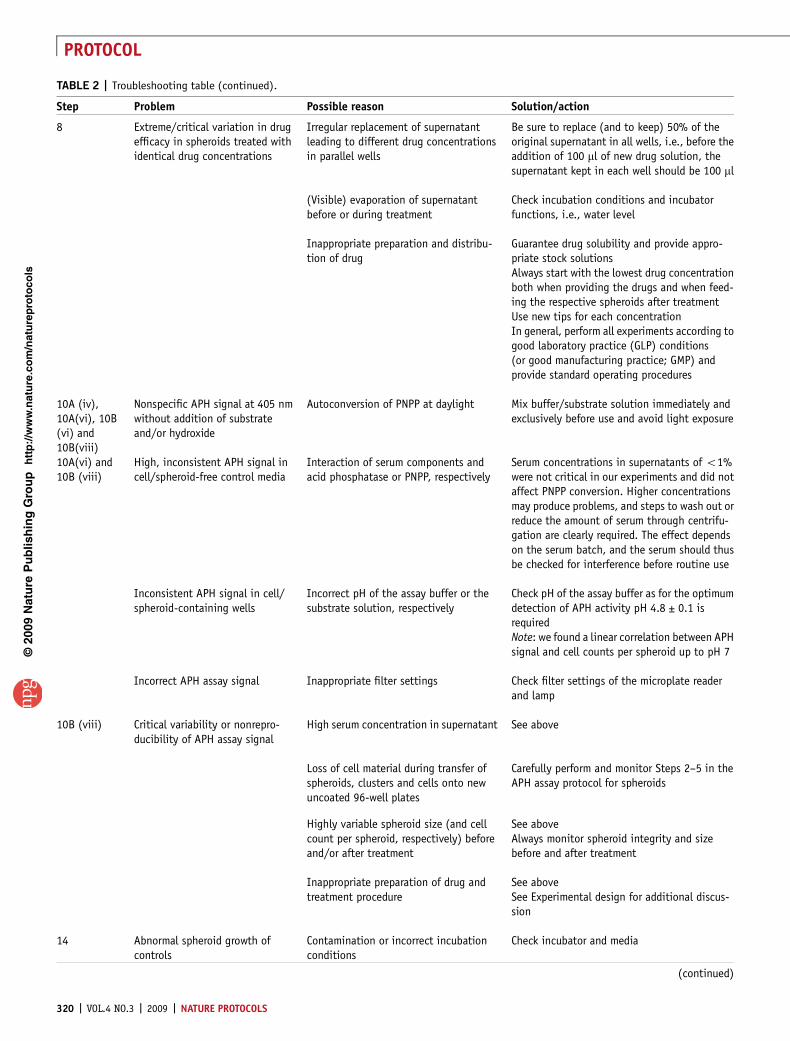
8 Extreme/critical variation in drugefficacy in spheroids treated withidentical drug concentrations
Irregular replacement of supernatantleading to different drug concentrationsin parallel wells
Be sure to replace (and to keep) 50% of theoriginal supernatant in all wells, i.e., before theaddition of 100 ml of new drug solution, thesupernatant kept in each well should be 100 ml
(Visible) evaporation of supernatantbefore or during treatment
Check incubation conditions and incubatorfunctions, i.e., water level
Inappropriate preparation and distribu-tion of drug
Guarantee drug solubility and provide appro-priate stock solutionsAlways start with the lowest drug concentrationboth when providing the drugs and when feed-ing the respective spheroids after treatmentUse new tips for each concentrationIn general, perform all experiments according togood laboratory practice (GLP) conditions(or good manufacturing practice; GMP) andprovide standard operating procedures
10A (iv),10A(vi), 10B(vi) and10B(viii)
Nonspecific APH signal at 405 nmwithout addition of substrateand/or hydroxide
Autoconversion of PNPP at daylight Mix buffer/substrate solution immediately andexclusively before use and avoid light exposure
10A(vi) and10B (viii)
High, inconsistent APH signal incell/spheroid-free control media
Interaction of serum components andacid phosphatase or PNPP, respectively
Serum concentrations in supernatants of o1%were not critical in our experiments and did notaffect PNPP conversion. Higher concentrationsmay produce problems, and steps to wash out orreduce the amount of serum through centrifu-gation are clearly required. The effect dependson the serum batch, and the serum should thusbe checked for interference before routine use
Inconsistent APH signal in cell/spheroid-containing wells
Incorrect pH of the assay buffer or thesubstrate solution, respectively
Check pH of the assay buffer as for the optimumdetection of APH activity pH 4.8 ± 0.1 isrequiredNote: we found a linear correlation between APHsignal and cell counts per spheroid up to pH 7
Incorrect APH assay signal Inappropriate filter settings Check filter settings of the microplate readerand lamp
10B (viii) Critical variability or nonrepro-ducibility of APH assay signal
High serum concentration in supernatant See above
Loss of cell material during transfer ofspheroids, clusters and cells onto newuncoated 96-well plates
Carefully perform and monitor Steps 2–5 in theAPH assay protocol for spheroids
Highly variable spheroid size (and cellcount per spheroid, respectively) beforeand/or after treatment
See aboveAlways monitor spheroid integrity and sizebefore and after treatment
Inappropriate preparation of drug andtreatment procedure
See aboveSee Experimental design for additional discus-sion
14 Abnormal spheroid growth ofcontrols
Contamination or incorrect incubationconditions
Check incubator and media
(continued)
320 | VOL.4 NO.3 | 2009 | NATURE PROTOCOLS
PROTOCOL
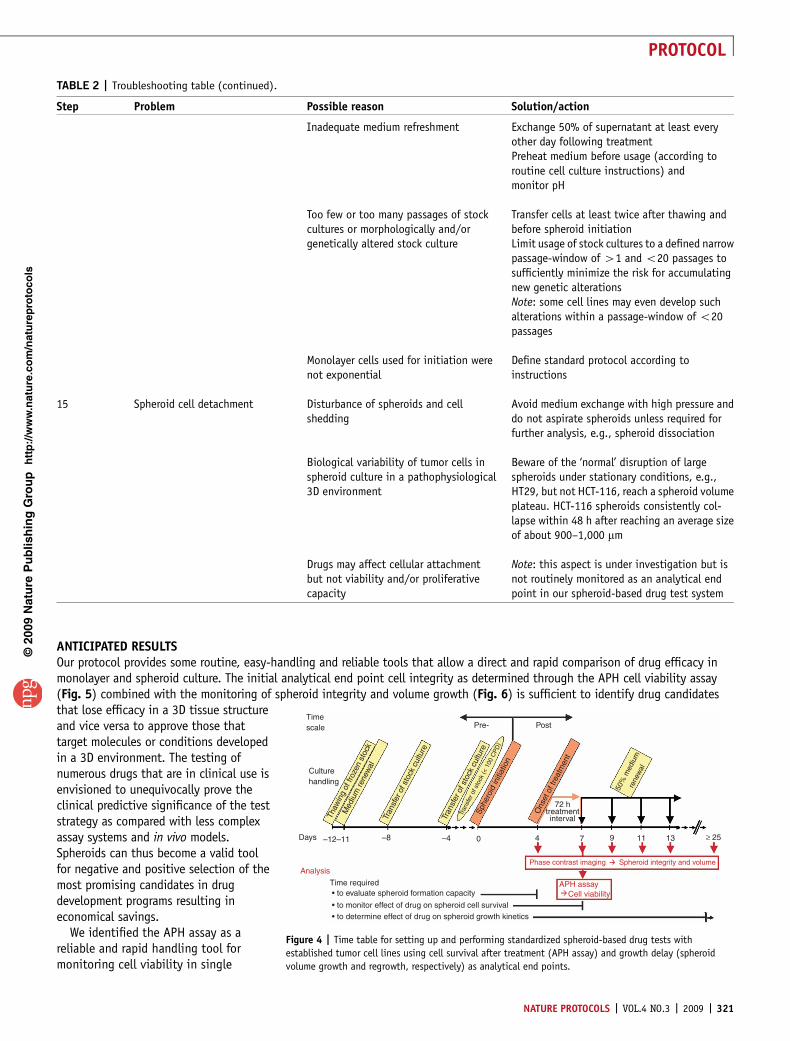
ANTICIPATED RESULTSOur protocol provides some routine, easy-handling and reliable tools that allow a direct and rapid comparison of drug efficacy inmonolayer and spheroid culture. The initial analytical end point cell integrity as determined through the APH cell viability assay(Fig. 5) combined with the monitoring of spheroid integrity and volume growth (Fig. 6) is sufficient to identify drug candidatesthat lose efficacy in a 3D tissue structureand vice versa to approve those thattarget molecules or conditions developedin a 3D environment. The testing ofnumerous drugs that are in clinical use isenvisioned to unequivocally prove theclinical predictive significance of the teststrategy as compared with less complexassay systems and in vivo models.Spheroids can thus become a valid toolfor negative and positive selection of themost promising candidates in drugdevelopment programs resulting ineconomical savings.
We identified the APH assay as areliable and rapid handling tool formonitoring cell viability in single
p
uor
G g
n ih si l
bu
P eru ta
N 900 2©
nat
ure
pro
toco
ls/
moc.er
ut an.
ww
w//:ptt
h
TABLE 2 | Troubleshooting table (continued).
Step Problem Possible reason Solution/action
Inadequate medium refreshment Exchange 50% of supernatant at least everyother day following treatmentPreheat medium before usage (according toroutine cell culture instructions) andmonitor pH
Too few or too many passages of stockcultures or morphologically and/orgenetically altered stock culture
Transfer cells at least twice after thawing andbefore spheroid initiationLimit usage of stock cultures to a defined narrowpassage-window of 41 and o20 passages tosufficiently minimize the risk for accumulatingnew genetic alterationsNote: some cell lines may even develop suchalterations within a passage-window of o20passages
Monolayer cells used for initiation werenot exponential
Define standard protocol according toinstructions
15 Spheroid cell detachment Disturbance of spheroids and cellshedding
Avoid medium exchange with high pressure anddo not aspirate spheroids unless required forfurther analysis, e.g., spheroid dissociation
Biological variability of tumor cells inspheroid culture in a pathophysiological3D environment
Beware of the ‘normal’ disruption of largespheroids under stationary conditions, e.g.,HT29, but not HCT-116, reach a spheroid volumeplateau. HCT-116 spheroids consistently col-lapse within 48 h after reaching an average sizeof about 900–1,000 mm
Drugs may affect cellular attachmentbut not viability and/or proliferativecapacity
Note: this aspect is under investigation but isnot routinely monitored as an analytical endpoint in our spheroid-based drug test system
Timescale Pre- Post
Culturehandling
Days –12–11 –8
Time required• to evaluate spheroid formation capacity
• to monitor effect of drug on spheroid cell survival• to determine effect of drug on spheroid growth kinetics
–4
Analysis
0 4
Phase contrast imaging Spheroid integrity and volume
APH assayCell viability
7 9 11 13 ≥ 25
Thaw
ing
of fr
ozen
sto
ck
Med
ium
rene
wal
Tran
sfer
of s
tock
cul
ture
Tran
sfer
of s
tock
cul
ture
Sph
eroi
d in
itiat
ion
Ons
et o
f tre
atm
ent
50%
med
ium
rene
wal
Tran
sfer
of s
tock
(< 1
00 C
PD
)
72 htreatmentinterval
Figure 4 | Time table for setting up and performing standardized spheroid-based drug tests with
established tumor cell lines using cell survival after treatment (APH assay) and growth delay (spheroid
volume growth and regrowth, respectively) as analytical end points.
NATURE PROTOCOLS | VOL.4 NO.3 | 2009 | 321
PROTOCOL
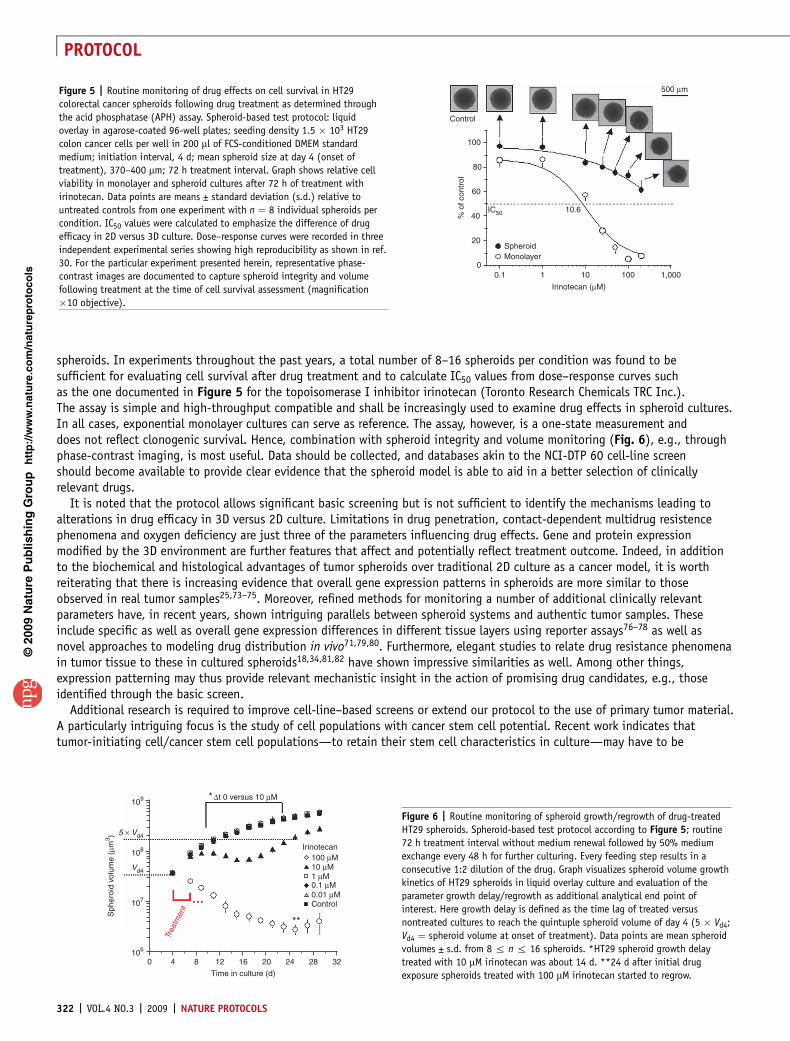
spheroids. In experiments throughout the past years, a total number of 8–16 spheroids per condition was found to besufficient for evaluating cell survival after drug treatment and to calculate IC50 values from dose–response curves suchas the one documented in Figure 5 for the topoisomerase I inhibitor irinotecan (Toronto Research Chemicals TRC Inc.).The assay is simple and high-throughput compatible and shall be increasingly used to examine drug effects in spheroid cultures.In all cases, exponential monolayer cultures can serve as reference. The assay, however, is a one-state measurement anddoes not reflect clonogenic survival. Hence, combination with spheroid integrity and volume monitoring (Fig. 6), e.g., throughphase-contrast imaging, is most useful. Data should be collected, and databases akin to the NCI-DTP 60 cell-line screenshould become available to provide clear evidence that the spheroid model is able to aid in a better selection of clinicallyrelevant drugs.
It is noted that the protocol allows significant basic screening but is not sufficient to identify the mechanisms leading toalterations in drug efficacy in 3D versus 2D culture. Limitations in drug penetration, contact-dependent multidrug resistencephenomena and oxygen deficiency are just three of the parameters influencing drug effects. Gene and protein expressionmodified by the 3D environment are further features that affect and potentially reflect treatment outcome. Indeed, in additionto the biochemical and histological advantages of tumor spheroids over traditional 2D culture as a cancer model, it is worthreiterating that there is increasing evidence that overall gene expression patterns in spheroids are more similar to thoseobserved in real tumor samples25,73–75. Moreover, refined methods for monitoring a number of additional clinically relevantparameters have, in recent years, shown intriguing parallels between spheroid systems and authentic tumor samples. Theseinclude specific as well as overall gene expression differences in different tissue layers using reporter assays76–78 as well asnovel approaches to modeling drug distribution in vivo71,79,80. Furthermore, elegant studies to relate drug resistance phenomenain tumor tissue to these in cultured spheroids18,34,81,82 have shown impressive similarities as well. Among other things,expression patterning may thus provide relevant mechanistic insight in the action of promising drug candidates, e.g., thoseidentified through the basic screen.
Additional research is required to improve cell-line–based screens or extend our protocol to the use of primary tumor material.A particularly intriguing focus is the study of cell populations with cancer stem cell potential. Recent work indicates thattumor-initiating cell/cancer stem cell populations—to retain their stem cell characteristics in culture—may have to be
p
uor
G g
n ih si l
bu
P eru ta
N 900 2©
nat
ure
pro
toco
ls/
moc.er
ut an.
ww
w//:ptt
h
100
Control
500 µm
80
% o
f con
trol
60
40IC50
SpheroidMonolayer
10.6
20
00.1 1 10
Irinotecan (µM)
100 1,000
Figure 5 | Routine monitoring of drug effects on cell survival in HT29
colorectal cancer spheroids following drug treatment as determined through
the acid phosphatase (APH) assay. Spheroid-based test protocol: liquid
overlay in agarose-coated 96-well plates; seeding density 1.5 � 103 HT29
colon cancer cells per well in 200 ml of FCS-conditioned DMEM standard
medium; initiation interval, 4 d; mean spheroid size at day 4 (onset of
treatment), 370–400 mm; 72 h treatment interval. Graph shows relative cell
viability in monolayer and spheroid cultures after 72 h of treatment with
irinotecan. Data points are means ± standard deviation (s.d.) relative to
untreated controls from one experiment with n ¼ 8 individual spheroids per
condition. IC50 values were calculated to emphasize the difference of drug
efficacy in 2D versus 3D culture. Dose–response curves were recorded in three
independent experimental series showing high reproducibility as shown in ref.
30. For the particular experiment presented herein, representative phase-
contrast images are documented to capture spheroid integrity and volume
following treatment at the time of cell survival assessment (magnification
�10 objective).
109 *
**
108 Irinotecan100 µM10 µM1 µM0.1 µM0.01 µMControl107
106
Trea
tmen
t
0 4 8 12 16 20 24 28 32
Time in culture (d)
Sph
eroi
d vo
lum
e (µ
m3 ) 5 × Vd4
Vd4
∆t 0 versus 10 µM
Figure 6 | Routine monitoring of spheroid growth/regrowth of drug-treated
HT29 spheroids. Spheroid-based test protocol according to Figure 5; routine
72 h treatment interval without medium renewal followed by 50% medium
exchange every 48 h for further culturing. Every feeding step results in a
consecutive 1:2 dilution of the drug. Graph visualizes spheroid volume growth
kinetics of HT29 spheroids in liquid overlay culture and evaluation of the
parameter growth delay/regrowth as additional analytical end point of
interest. Here growth delay is defined as the time lag of treated versus
nontreated cultures to reach the quintuple spheroid volume of day 4 (5 � Vd4;
Vd4 ¼ spheroid volume at onset of treatment). Data points are mean spheroid
volumes ± s.d. from 8 r n r 16 spheroids. *HT29 spheroid growth delay
treated with 10 mM irinotecan was about 14 d. **24 d after initial drug
exposure spheroids treated with 100 mM irinotecan started to regrow.
322 | VOL.4 NO.3 | 2009 | NATURE PROTOCOLS
PROTOCOL
propagated as spheroids (or spheres). Examples from the literature providing evidence for the existence of tumor-initiatingcell/cancer stem cell populations in solid tumors include entities as diverse as glioblastomas, breast, renal, ovarian, pancreatic,gastric and colorectal cancers83–88. If the cancer stem cell hypothesis proves true, including the assumption that this subpopula-tion of cells shows higher treatment resistance or survival capacity in particular pathophysiological niches, this observation willhave a clear and important impact on future experimental work, including the development of new, target-specific drugs.
ACKNOWLEDGMENTS We gratefully acknowledge the technical assistance of MaritWondrak, Juana M Castaneda and Tammy Lawrence as well as Frank van Rey andRupert Feldmeier. The experimental protocols and work documented herein weresupported by the Society for Biomolecular Sciences (SBS) and by the GermanFederal Ministry of Education and Research (BMBF) through grants 0313143 and01ZZ0502 to L.A.K.-S.
COMPETING INTERESTS STATEMENT The authors declare competing financialinterests (see the HTML version of this article for details).
Published online at http://www.natureprotocols.com/Reprints and permissions information is available online at http://npg.nature.com/reprintsandpermissions/
1. Abbott, A. Cell culture: biology’s new dimension. Nature 424, 870–872 (2003).2. Kunz-Schughart, L.A., Freyer, J.P., Hofstaedter, F. & Ebner, R. The use of 3-D
cultures for high-throughput screening: the multicellular spheroid model.J. Biomol. Screen 9, 273–285 (2004).
3. Friedrich, J. et al. A reliable tool to determine cell viability in complex 3-dculture: the Acid phosphatase assay. J. Biomol. Screen. 12, 925–937(2007).
4. Gudjonsson, T., Ronnov-Jessen, L., Villadsen, R., Bissell, M.J. & Petersen, O.W. Tocreate the correct microenvironment: three-dimensional heterotypic collagenassays for human breast epithelial morphogenesis and neoplasia. Methods 30,247–255 (2003).
5. Nelson, C.M. & Bissell, M.J. Modeling dynamic reciprocity: engineering three-dimensional culture models of breast architecture, function, and neoplastictransformation. Semin. Cancer Biol. 15, 342–352 (2005).
6. Lee, G.Y., Kenny, P.A., Lee, E.H. & Bissell, M.J. Three-dimensional culturemodels of normal and malignant breast epithelial cells. Nat. Methods 4, 359–365(2007).
7. Friedrich, J., Ebner, R. & Kunz-Schughart, L.A. Experimental anti-tumor therapy in3-D: spheroids—old hat or new challenge? Int. J. Radiat. Biol. 83, 849–871(2007).
8. Mueller-Klieser, W. Multicellular spheroids. A review on cellular aggregates incancer research. J. Cancer Res. Clin. Oncol. 113, 101–122 (1987).
9. Kunz-Schughart, L.A., Kreutz, M. & Knuechel, R. Multicellular spheroids: a three-dimensional in vitro culture system to study tumour biology. Int. J. Exp. Pathol.79, 1–23 (1998).
10. Santini, M.T. & Rainaldi, G. Three-dimensional spheroid model in tumor biology.Pathobiology 67, 148–157 (1999).
11. Khaitan, D., Chandna, S., Arya, M.B. & Dwarakanath, B.S. Establishment andcharacterization of multicellular spheroids from a human glioma cell line:implications for tumor therapy. J. Transl. Med. 4, 12 (2006).
12. Dubessy, C., Merlin, J.M., Marchal, C. & Guillemin, F. Spheroids in radiobiologyand photodynamic therapy. Crit. Rev. Oncol. Hematol. 36, 179–192 (2000).
13. Ballangrud, A.M. et al. Response of LNCaP spheroids after treatment with analpha-particle emitter (213Bi)-labeled anti-prostate-specific membrane antigenantibody (J591). Cancer Res. 61, 2008–2014 (2001).
14. Durand, R.E. & Olive, P.L. Resistance of tumor cells to chemo- and radiotherapymodulated by the three-dimensional architecture of solid tumors and spheroids.Methods Cell Biol. 64, 211–233 (2001).
15. Mueller-Klieser, W. Three-dimensional cell cultures: from molecular mechanismsto clinical applications. Am. J. Physiol. 273, C1109–C1123 (1997).
16. Al-Hajj, M., Becker, M.W., Wicha, M., Weissman, I. & Clarke, M.F. Therapeuticimplications of cancer stem cells. Curr. Opin. Genet. Dev. 14, 43–7 (2004).
17. Vermeulen, L. et al. Single-cell cloning of colon cancer stem cells reveals a multi-lineage differentiation capacity. Proc. Natl. Acad. Sci. USA 105, 13427–13432(2008).
18. Barbone, D., Yang, T.M., Morgan, J.R., Gaudino, G. & Broaddus, V.C. Mammaliantarget of rapamycin contributes to the acquired apoptotic resistance ofhuman mesothelioma multicellular spheroids. J. Biol. Chem. 283, 13021–13030(2008).
19. Desoize, B. & Jardillier, J. Multicellular resistance: a paradigm for clinicalresistance? Crit. Rev. Oncol. Hematol. 36, 193–207 (2000).
20. Mueller-Klieser, W. Tumor biology and experimental therapeutics. Crit. Rev. Oncol./Hematol. 36, 123–139 (2000).
21. Carlsson, J. & Acker, H. Relations between pH, oxygen partial pressure and growthin cultured cell spheroids. Int. J. Cancer 42, 715–720 (1988).
22. Poland, J. et al. Comparison of protein expression profiles between monolayer andspheroid cell culture of HT-29 cells revealed fragmentation of CK18 in three-dimensional cell culture. Electrophoresis 23, 1174–1184 (2002).
23. Frankel, A., Man, S., Elliott, P., Adams, J. & Kerbel, R.S. Lack of multicellulardrug resistance observed in human ovarian and prostate carcinomatreated with the proteasome inhibitor PS-341. Clin. Cancer Res. 6, 3719–3728(2000).
24. Eshleman, J.S. et al. Inhibition of the mammalian target of rapamycin sensitizesU87 xenografts to fractionated radiation therapy. Cancer Res. 62, 7291–7297(2002).
25. Oloumi, A., Lam, W., Banath, J.P. & Olive, P.L. Identification of genesdifferentially expressed in V79 cells grown as multicell spheroids. Int. J. Radiat.Biol. 78, 483–492 (2002).
26. Jelic, S. Molecular basis of future patients-tailored treatment. Arch. Oncol. 13,56–58 (2005).
27. Liu, M. et al. Antitumor activity of rapamycin in a transgenic mouse model ofErbB2-dependent human breast cancer. Cancer Res. 65, 5325–5336 (2005).
28. Dardousis, K. et al. Identification of differentially expressed genes involved in theformation of multicellular tumor spheroids by HT-29 colon carcinoma cells. Mol.Ther. 15, 94–102 (2007).
29. Howes, A.L. et al. The phosphatidylinositol 3-kinase inhibitor, PX-866, is a potentinhibitor of cancer cell motility and growth in three-dimensional cultures. Mol.Cancer Ther. 6, 2505–2514 (2007).
30. Kunz-Schughart, L.A. Multicellular tumor spheroids: intermediates betweenmonolayer culture and in vivo tumor. Cell Biol. Int. 23, 157–161 (1999).
31. Furbert-Harris, P.M. et al. Eosinophils in a tri-cell multicellular tumor spheroid(MTS)/endothelium complex. Cell Mol. Biol. 49, 1081–1088 (2003).
32. Gottfried, E., Kunz-Schughart, L.A., Andreesen, R. & Kreutz, M. Brave little world:spheroids as an in vitro model to study tumor-immune-cell interactions. Cell Cycle5, 691–695 (2006).
33. Spoettl, T. et al. Monocyte chemoattractant protein-1 (MCP-1) inhibits theintestinal-like differentiation of monocytes. Clin. Exp. Immunol. 145, 190–199(2006).
34. Wartenberg, M., Finkensieper, A., Hescheler, J. & Sauer, H. Confrontation culturesof embryonic stem cells with multicellular tumor spheroids to study tumor-induced angiogenesis. Methods Mol. Biol. 331, 313–328 (2006).
35. Gunther, S. et al. Polyphenols prevent cell shedding from mouse mammary cancerspheroids and inhibit cancer cell invasion in confrontation cultures derived fromembryonic stem cells. Cancer Lett. 250, 25–35 (2007).
36. Li, Z.W. & Dalton, W.S. Tumor microenvironment and drug resistance inhematologic malignancies. Blood Rev. 20, 333–342 (2006).
37. Kunz-Schughart, L.A. & Mueller-Klieser, W. Three-dimensional culture. In AnimalCell Culture Vol. 3 (Ed. Masters, J.R.W.) 123–148 (Oxford University Press, Oxford,2000).
38. Stark, H.J., Baur, M., Breitkreutz, D., Mirancea, N. & Fusenig, N.E. Organotypickeratinocyte cocultures in defined medium with regular epidermal morphogenesisand differentiation. J. Invest. Dermatol. 112, 681–691 (1999).
39. Stark, H.J. et al. Epidermal homeostasis in long-term scaffold-enforced skinequivalents. J. Investig. Dermatol. Symp. Proc. 11, 93–105 (2006).
40. Korff, T. & Augustin, H.G. Integration of endothelial cells in multicellularspheroids prevents apoptosis and induces differentiation. J. Cell Biol. 143,1341–1352 (1998).
41. Ivascu, A. & Kubbies, M. Rapid generation of single-tumor spheroids for high-throughput cell function and toxicity analysis. J. Biomol. Screen 11, 922–932(2006).
42. Kosaka, T. et al. Comparison of various methods of assaying the cytotoxic effectsof ethanol on human hepatoblastoma cells (HUH-6 line). Acta. Med. Okayama 50,151–156 (1996).
43. Enmon, R. et al. Combination treatment with 17-N-allylamino-17-demethoxygeldanamycin and acute irradiation produces supra-additive growth suppressionin human prostate carcinoma spheroids. Cancer Res. 63, 8393–8399 (2003).
p
uor
G g
n ih si l
bu
P eru ta
N 900 2©
nat
ure
pro
toco
ls/
moc.er
ut an.
ww
w//:ptt
h
NATURE PROTOCOLS | VOL.4 NO.3 | 2009 | 323
PROTOCOL
44. Fehlauer, F. et al. Effects of irradiation and cisplatin on human glioma spheroids:inhibition of cell proliferation and cell migration. J. Cancer Res. Clin. Oncol. 131,723–732 (2005).
45. Lambert, B. et al. Screening for supra-additive effects of cytotoxic drugs andgamma irradiation in an in vitro model for hepatocellular carcinoma. Can. J.Physiol. Pharmacol. 82, 146–152 (2004).
46. Sutherland, R.M. Cell and environment interactions in tumor microregions: themulticell spheroid model. Science 240, 177–184 (1988).
47. LaRue, K.E., Khalil, M. & Freyer, J.P. Microenvironmental regulation ofproliferation in multicellular spheroids is mediated through differentialexpression of cyclin-dependent kinase inhibitors. Cancer Res. 64, 1621–1631(2004).
48. Francia, G., Man, S., Teicher, B., Grasso, L. & Kerbel, R.S. Gene expression analysisof tumor spheroids reveals a role for suppressed DNA mismatch repair inmulticellular resistance to alkylating agents. Mol. Cell. Biol. 24, 6837–6849(2004).
49. Francia, G. et al. Down-regulation of DNA mismatch repair proteins in human andmurine tumor spheroids: implications for multicellular resistance to alkylatingagents. Mol. Cancer Ther. 4, 1484–1494 (2005).
50. Bindra, R.S., Crosby, M.E. & Glazer, P.M. Regulation of DNA repair in hypoxiccancer cells. Cancer Metastasis Rev 26, 249–260 (2007).
51. Romero, F.J., Zukowski, D. & Mueller-Klieser, W. Glutathione content of V79 cellsin two- or three-dimensional culture. Am. J. Physiol. 272, C1507–C1512 (1997).
52. Winters, B.S., Raj, B.K., Robinson, E.E., Foty, R.A. & Corbett, S.A. Three-dimensional culture regulates Raf-1 expression to modulate fibronectin matrixassembly. Mol. Biol. Cell 17, 3386–3396 (2006).
53. Carlsson, J. & Yuhas, J.M. Liquid-overlay culture of cellular spheroids. RecentResults Cancer Res. 95, 1–23 (1984).
54. Tong, J.Z. et al. Long-term culture of adult rat hepatocyte spheroids. Exp. Cell Res.200, 326–332 (1992).
55. Hoevel, T., Macek, R., Swisshelm, K. & Kubbies, M. Reexpression of the TJ proteinCLDN1 induces apoptosis in breast tumor spheroids. Int. J. Cancer 108, 374–383(2004).
56. Wartenberg, M. et al. Development of an intrinsic P-glycoprotein-mediateddoxorubicin resistance in quiescent cell layers of large, multicellular prostatetumor spheroids. Int. J. Cancer 75, 855–863 (1998).
57. Kunz-Schughart, L.A. & Freyer, J.P. Adaptation of an automated selectivedissociation procedure to two novel spheroid types. In Vitro Cell. Dev. Biol. Anim.33, 73–76 (1997).
58. Kerr, D.J., Wheldon, T.E., Kerr, A.M. & Kaye, S.B. In vitro chemosensitivity testingusing the multicellular tumor spheroid model. Cancer Drug Deliv. 4, 63–74 (1987).
59. Durand, R.E. Slow penetration of anthracyclines into spheroids and tumors: atherapeutic advantage? Cancer Chemother. Pharmacol. 26, 198–204 (1990).
60. Freyer, J.P. & Schor, P.L. Automated selective dissociation of cells from differentregions of multicellular spheroids. In Vitro Cell Dev. Biol. 25, 9–19 (1989).
61. Watanabe, N., Hirayama, R. & Kubota, N. The chemopreventive flavonoid apigeninconfers radiosensitizing effect in human tumor cells grown as monolayers andspheroids. J. Radiat. Res. (Tokyo) 48, 45–50 (2007).
62. Essand, M., Nilsson, S. & Carlsson, J. Growth of prostatic cancer cells, DU145, as multicellular spheroids and effects of estramustine. Anticancer Res. 13,1261–1268 (1993).
63. Russell, J., Wheldon, T.E. & Stanton, P. A radioresistant variant derived from ahuman neuroblastoma cell line is less prone to radiation-induced apoptosis.Cancer Res. 55, 4915–4921 (1995).
64. Marusic, M., Bajzer, Z., Vuk-Pavlovic, S. & Freyer, J.P. Tumor growth in vivo and asmulticellular spheroids compared by mathematical models. Bull. Math. Biol. 56,617–631 (1994).
65. Kunz-Schughart, L.A., Groebe, K. & Mueller-Klieser, W. Three-dimensional cellculture induces novel proliferative and metabolic alterations associated withoncogenic transformation. Int. J. Cancer 66, 578–586 (1996).
66. Tabatabai, M., Williams, D.K. & Bursac, Z. Hyperbolastic growth models: theoryand application. Theor. Biol. Med. Model. 2, 14–15 (2005).
67. Mellor, H.R., Ferguson, D.J. & Callaghan, R. A model of quiescent tumourmicroregions for evaluating multicellular resistance to chemotherapeutic drugs.Br. J. Cancer 93, 302–309 (2005).
68. Orlandi, P. et al. Idarubicin and idarubicinol effects on breast cancer multicellularspheroids. J. Chemother. 17, 663–667 (2005).
69. Lambert, B. et al. Assessment of supra-additive effects of cytotoxic drugs and lowdose rate irradiation in an in vitro model for hepatocellular carcinoma. Can. J.Physiol. Pharmacol. 84, 1021–1028 (2006).
70. Hirschberg, H., Sun, C.H., Krasieva, T. & Madsen, S.J. Effects of ALA-mediatedphotodynamic therapy on the invasiveness of human glioma cells. Lasers Surg.Med. 38, 939–945 (2006).
71. Minchinton, A.I. & Tannock, I.F. Drug penetration in solid tumours. Nat. Rev.Cancer 6, 583–592 (2006).
72. Xiao, Z., Hansen, C.B., Allen, T.M., Miller, G.G. & Moore, R.B. Distribution ofphotosensitizers in bladder cancer spheroids: implications for intravesicalinstillation of photosensitizers for photodynamic therapy of bladder cancer.J. Pharm. Pharm. Sci. 8, 536–543 (2005).
73. L’Esperance, S., Bachvarova, M., Tetu, B., Mes-Masson, A.M. & Bachvarov, D.Global gene expression analysis of early response to chemotherapy treatment inovarian cancer spheroids. BMC Genomics 9, 99 (2008).
74. Shiras, A., Bhosale, A., Patekar, A., Shepal, V. & Shastry, P. Differential expressionof CD44(S) and variant isoforms v3, v10 in three-dimensional cultures of mousemelanoma cell lines. Clin. Exp. Metastasis 19, 445–455 (2002).
75. Zietarska, M. et al. Molecular description of a 3D in vitro model for the study ofepithelial ovarian cancer (EOC). Mol. Carcinog. 46, 872–885 (2007).
76. Berchner-Pfannschmidt, U. et al. Nuclear oxygen sensing: induction ofendogenous prolyl-hydroxylase 2 activity by hypoxia and nitric oxide. J. Biol.Chem. 83, 31745–31753 (2008).
77. Leroux, F. et al. Experimental approaches to kinetics of gas diffusion inhydrogenase. Proc. Natl. Acad. Sci. USA 105, 11188–11193 (2008).
78. Nowicki, M.O. et al. Lithium inhibits invasion of glioma cells; possibleinvolvement of glycogen synthase kinase-3. Neuro Oncol. 10, 690–699 (2008).
79. Wartenberg, M., Hescheler, J. & Sauer, H. Electrical fields enhance growth ofcancer spheroids by reactive oxygen species and intracellular Ca2+. Am. J.Physiol. 272, R1677–R1683 (1997).
80. Gali-Muhtasib, H. et al. Thymoquinone triggers inactivation of the stress responsepathway sensor CHEK1 and contributes to apoptosis in colorectal cancer cells.Cancer Res. 68, 5609–5618 (2008).
81. Wartenberg, M. et al. Reactive oxygen species-linked regulation of the multidrugresistance transporter P-glycoprotein in Nox-1 overexpressing prostate tumorspheroids. FEBS Lett. 579, 4541–4549 (2005).
82. Salmaggi, A. et al. Glioblastoma-derived tumorospheres identify a population oftumor stem-like cells with angiogenic potential and enhanced multidrugresistance phenotype. Glia 54, 850–860 (2006).
83. Singh, S.K. et al. Identification of human brain tumour initiating cells. Nature432, 396–401 (2004).
84. Hermann, P.C. et al. Distinct populations of cancer stem cells determinetumor growth and metastatic activity in human pancreatic cancer. Cell Stem Cell1, 313–323 (2007).
85. O’Brien, C.A., Pollett, A., Gallinger, S. & Dick, J.E. A human colon cancer cellcapable of initiating tumour growth in immunodeficient mice. Nature 445,106–110 (2007).
86. Ricci-Vitiani, L. et al. Identification and expansion of human colon-cancer-initiating cells. Nature 445, 111–115 (2007).
87. Mizrak, D., Brittan, M. & Alison, M.R. CD133: molecule of the moment. J. Pathol.214, 3–9 (2008).
88. Takaishi, S., Okumura, T. & Wang, T.C. Gastric cancer stem cells. J. Clin. Oncol. 26,2876–2882 (2008).
89. Chen, T.R., Dorotinsky, C.S., McGuire, L.J., Macy, M.L. & Hay, R.J. DLD-1 and HCT-15 cell lines derived separately from colorectal carcinomas have totally differentchromosome changes but the same genetic origin. Cancer Genet. Cytogenet. 81,103–108 (1995).
90. Roschke, A.V. et al. Karyotypic ‘state’ as a potential determinant for anticancerdrug discovery. Proc. Natl. Acad. Sci. USA 102, 2964–2969 (2005).
91. Ellison, G. et al. Further evidence to support the melanocytic origin of MDA-MB-435. Mol. Pathol. 55, 294–299 (2002).
92. Rae, J.M. et al. Common origins of MDA-MB-435 cells from various sources withthose shown to have melanoma properties. Clin. Exp. Metastasis 21, 543–552(2004).
93. Garraway, L.A. et al. Integrative genomic analyses identify MITF as a lineagesurvival oncogene amplified in malignant melanoma. Nature 436, 117–122(2005).
p
uor
G g
n ih si l
bu
P eru ta
N 900 2©
nat
ure
pro
toco
ls/
moc.er
ut an.
ww
w//:ptt
h
324 | VOL.4 NO.3 | 2009 | NATURE PROTOCOLS
PROTOCOL