
CBRE GROUP, INC.
172
Table of Contents UNITED STATES SECURITIES AND EXCHANGE COMMISSION Washington, D.C. 20549 FORM 10-K ANNUAL REPORT PURSUANT TO SECTION 13 OR 15(d) OF THE SECURITIES EXCHANGE ACT OF 1934 For the fiscal year ended December 31, 2014 Commission File Number 001 - 32205 CBRE GROUP, INC. (Exact name of registrant as specified in its charter) (213) 613-3333 (Registrant’s telephone number, including area code) Securities registered pursuant to Section 12(b) of the Act: Securities registered pursuant to Section 12(g) of the Act: N.A. Indicate by check mark if the registrant is a well-known seasoned issuer, as defined in Rule 405 of the Securities Act. Yes No Indicate by check mark if the registrant is not required to file reports pursuant to Section 13 or Section 15(d) of the Act. Yes No Indicate by check mark whether the registrant (1) has filed all reports required to be filed by Section 13 or 15(d) of the Securities Exchange Act of 1934 during the preceding 12 months (or for such shorter period that the registrant was required to file such reports), and (2) has been subject to such filing requirements for the past 90 days. Yes No Indicate by check mark whether the registrant has submitted electronically and posted on its corporate Web site, if any, every Interactive Data File required to be submitted and posted pursuant to Rule 405 of Regulation S-T (§232.405 of this chapter) during the preceding 12 months (or for such shorter period that the registrant was required to submit and post such files). Yes No . Indicate by check mark if disclosure of delinquent filers pursuant to Item 405 of Regulation S-K (§229.405 of this chapter) is not contained herein, and will not be contained, to the best of registrant’s knowledge, in definitive proxy or information statements incorporated by reference in Part III of this Form 10-K or any amendment to the Form 10-K. Indicate by check mark whether the registrant is a large accelerated filer, an accelerated filer, a non-accelerated filer, or a smaller reporting company. See the definitions of “large accelerated filer,” “accelerated filer” and “smaller reporting company” in Rule 12b-2 of the Exchange Act. Large accelerated filer Accelerated filer Non-accelerated filer Smaller reporting company Indicate by check mark whether the registrant is a shell company (as defined in Rule 12b-2 of the Exchange Act). Yes No As of June 30, 2014, the aggregate market value of Class A Common Stock held by non-affiliates of the registrant was $10.6 billion based upon the last sales price on June 30, 2014 on the New York Stock Exchange of $32.04 for the registrant’s Class A Common Stock. As of February 13, 2015, the number of shares of Class A Common Stock outstanding was 333,024,341. DOCUMENTS INCORPORATED BY REFERENCE Portions of the proxy statement for the registrant’s 2015 Annual Meeting of Stockholders to be held May 15, 2015 are incorporated by reference in Part III of this Annual Report on Form 10-K. Delaware 94-3391143 (State or other jurisdiction of incorporation or organization) (I.R.S. Employer Identification Number) 400 South Hope Street, 25 Floor Los Angeles, California 90071 (Address of principal executive offices) (Zip Code) Title of Each Class Name of Each Exchange on Which Registered Class A Common Stock, $0.01 par value New York Stock Exchange th
-
Upload
khangminh22 -
Category
Documents
-
view
0 -
download
0
Transcript of CBRE GROUP, INC.
Table of Contents
UNITED STATES
SECURITIES AND EXCHANGE COMMISSION
Washington, D.C. 20549
FORM 10-K
ANNUAL REPORT PURSUANT TO SECTION 13 OR 15(d) OF THE SECURITIES EXCHANGE ACT OF 1934
For the fiscal year ended December 31, 2014 Commission File Number 001 - 32205
CBRE GROUP, INC. (Exact name of registrant as specified in its charter)
(213) 613-3333 (Registrant’s telephone number, including area code)
Securities registered pursuant to Section 12(b) of the Act:
Securities registered pursuant to Section 12(g) of the Act: N.A.
Indicate by check mark if the registrant is a well-known seasoned issuer, as defined in Rule 405 of the Securities Act. Yes No � Indicate by check mark if the registrant is not required to file reports pursuant to Section 13 or Section 15(d) of the Act. Yes � No
Indicate by check mark whether the registrant (1) has filed all reports required to be filed by Section 13 or 15(d) of the Securities Exchange
Act of 1934 during the preceding 12 months (or for such shorter period that the registrant was required to file such reports), and (2) has been subject to such filing requirements for the past 90 days. Yes No �
Indicate by check mark whether the registrant has submitted electronically and posted on its corporate Web site, if any, every Interactive Data File required to be submitted and posted pursuant to Rule 405 of Regulation S-T (§232.405 of this chapter) during the preceding 12 months (or for such shorter period that the registrant was required to submit and post such files). Yes No � .
Indicate by check mark if disclosure of delinquent filers pursuant to Item 405 of Regulation S-K (§229.405 of this chapter) is not contained herein, and will not be contained, to the best of registrant’s knowledge, in definitive proxy or information statements incorporated by reference in Part III of this Form 10-K or any amendment to the Form 10-K.
Indicate by check mark whether the registrant is a large accelerated filer, an accelerated filer, a non-accelerated filer, or a smaller reporting company. See the definitions of “large accelerated filer,” “accelerated filer” and “smaller reporting company” in Rule 12b-2 of the Exchange Act.
Large accelerated filer Accelerated filer � Non-accelerated filer � Smaller reporting company � Indicate by check mark whether the registrant is a shell company (as defined in Rule 12b-2 of the Exchange Act). Yes � No As of June 30, 2014, the aggregate market value of Class A Common Stock held by non-affiliates of the registrant was $10.6 billion based
upon the last sales price on June 30, 2014 on the New York Stock Exchange of $32.04 for the registrant’s Class A Common Stock. As of February 13, 2015, the number of shares of Class A Common Stock outstanding was 333,024,341.
DOCUMENTS INCORPORATED BY REFERENCE Portions of the proxy statement for the registrant’s 2015 Annual Meeting of Stockholders to be held May 15, 2015 are incorporated by
reference in Part III of this Annual Report on Form 10-K.
Delaware 94-3391143
(State or other jurisdiction of incorporation or organization)
(I.R.S. Employer Identification Number)
400 South Hope Street, 25 Floor Los Angeles, California 90071
(Address of principal executive offices) (Zip Code)
Title of Each Class Name of Each Exchange on Which Registered
Class A Common Stock, $0.01 par value New York Stock Exchange
th
Table of Contents
CBRE GROUP, INC.
ANNUAL REPORT ON FORM 10-K
TABLE OF CONTENTS
2
Page PART I
Item 1. Business 3 Item 1A. Risk Factors 11 Item 1B. Unresolved Staff Comments 28 Item 2. Properties 28 Item 3. Legal Proceedings 28 Item 4. Mine Safety Disclosures 28
PART II
Item 5. Market for the Registrant’s Common Equity, Related Stockholder Matters and Issuer Purchases of Equity Securities 29 Item 6. Selected Financial Data 31 Item 7. Management’s Discussion and Analysis of Financial Condition and Results of Operations 34 Item 7A. Quantitative and Qualitative Disclosures About Market Risk 67 Item 8. Financial Statements and Supplementary Data 70 Item 9. Changes in and Disagreements With Accountants on Accounting and Financial Disclosure 150 Item 9A. Controls and Procedures 150 Item 9B. Other Information 151
PART III
Item 10. Directors, Executive Officers and Corporate Governance 151 Item 11. Executive Compensation 151 Item 12. Security Ownership of Certain Beneficial Owners and Management and Related Stockholder Matters 151 Item 13. Certain Relationships and Related Transactions, and Director Independence 152 Item 14. Principal Accountant Fees and Services 152
PART IV
Item 15. Exhibits and Financial Statement Schedules 152 Schedule II—Valuation and Qualifying Accounts 153 Schedule III—Real Estate Investments and Accumulated Depreciation 154 SIGNATURES 157
Table of Contents
PART I Item 1. Business Company Overview
CBRE Group, Inc., a Delaware corporation, (which may be referred to in this Form 10-K as the “company” , “we”, “us” and “our” ), is the world’s largest commercial real estate services and investment firm, based on 2014 revenue, with leading full-service operations in major metropolitan areas throughout the world. We offer a full range of services to occupiers, owners, lenders and investors in office, retail, industrial, multifamily and other types of commercial real estate. As of December 31, 2014, excluding independent affiliates, we operated in over 370 offices worldwide, with more than 52,000 employees providing commercial real estate services under the “CBRE” brand name, investment management services under the “CBRE Global Investors” brand name and development services under the “Trammell Crow” brand name.
Our business is focused on several competencies, including commercial property and corporate facilities management, tenant/occupier and property/agency leasing, capital markets solutions (property sales, commercial mortgage origination and servicing, and debt/structured finance), real estate investment management, valuation, development services and proprietary research. We generate revenues from management fees on a contractual and per-project basis, and from commissions on transactions. Our contractual, fee-for-services businesses, which generally involve property and facilities management, mortgage loan servicing and investment management, represented approximately 46% of our 2014 revenue. In addition, our appraisal/valuation and leasing services have contractual elements and work for clients in these service lines is often recurring in nature. Our revenue mix has shifted in recent years toward more contractual revenue as property occupiers and investors increasingly prefer to purchase integrated, account-based services from firms that have the capabilities to meet their needs across diverse disciplines and in local markets nationally and globally. We believe we are well-positioned to capture a growing share of the business being awarded as a result of this trend.
In 2014, we generated revenue from a well-balanced, highly diversified base of clients, including approximately 85 of the Fortune 100 companies. In 2014, we were the highest ranked commercial real estate services company among the Fortune Most Admired Companies, and we ranked seventh among all companies on the Barron’s 500, which evaluates companies on growth and financial performance. We have been the only commercial real estate services and investment firm included in the S&P 500 since 2006, and in the Fortune 500 since 2008. Additionally, the International Association of Outsourcing Professionals (IAOP) has included us among the top 100 global outsourcing companies across all industries for nine consecutive years. In 2014, the IAOP ranked us as a top three service provider among all outsourcing companies globally and as the highest ranked commercial real estate services company for the fifth year in a row. CBRE History
CBRE marked its 108 year of continuous operations in 2014, tracing our origins to a company founded in San Francisco in the aftermath of the 1906 earthquake. Since then, we have grown into the largest global commercial real estate services and investment firm (in terms of 2014 revenue) through organic growth and a series of strategic acquisitions, including the December 2006 purchase of Trammell Crow Company and the 2011 acquisition of substantially all of ING Group N.V.’s Real Estate Investment Management (REIM) operations in Europe and Asia and its U.S.-based global real estate listed securities business (collectively referred to as the REIM Acquisitions). In 2013, we fortified our real estate outsourcing platform in Europe with the acquisition of London-based Norland Managed Services Ltd (Norland). Norland is a premier provider of building technical engineering services that enables us to self-perform these services in Europe and adds to our expertise in the highly specialized critical environments market.
We have also historically enhanced and complemented our global capabilities through the acquisition of regional and specialty firms that are leaders in their areas of focus and/or geographies, including regional firms
3
th
Table of Contents
with which we had previous affiliate relationships. These “in-fill” acquisitions are an integral part of our growth strategy and we completed 11 such acquisitions during 2014. Our Regions of Operation and Principal Services
CBRE Group, Inc. is a holding company that conducts all of its operations through its indirect subsidiaries. CBRE Services, Inc., our direct wholly-owned subsidiary, is also generally a holding company and is the primary obligor or issuer with respect to most of our long-term indebtedness.
We report our operations through the following segments: (1) Americas, (2) Europe, Middle East and Africa, or EMEA, (3) Asia Pacific, (4) Global Investment Management and (5) Development Services.
Information regarding revenue and operating income or loss, attributable to each of our segments, is included in “Segment Operations” within the “Management’s Discussion and Analysis of Financial Condition and Results of Operations” section and within Note 20 of our Notes to Consolidated Financial Statements, which are incorporated herein by reference. Information concerning the identifiable assets of each of our business segments is also set forth in Note 20 of our Notes to Consolidated Financial Statements, which is incorporated herein by reference.
The Americas
The Americas is our largest reporting segment, comprised of operations throughout the United States and Canada as well as key markets in Latin America. Our operations are largely wholly-owned, but also include independent affiliates to whom we license the “CBRE” and “CB Richard Ellis” names in their local markets in return for payments of annual or quarterly royalty fees to us and an agreement to cross-refer business between us and the affiliate.
Most of our operations are conducted through our indirect wholly-owned subsidiary CBRE, Inc. Our mortgage loan origination, sales and servicing operations are conducted exclusively through our indirect wholly-owned subsidiary operating under the name CBRE Capital Markets, Inc., or Capital Markets, and its subsidiaries. Our operations in Canada are conducted through our indirect wholly-owned subsidiary CBRE Limited. Both CBRE Capital Markets and CBRE Limited are subsidiaries of CBRE, Inc.
Our Americas segment accounted for 57.5% of our 2014 revenue, 62.7% of our 2013 revenue and 63.0% of our 2012 revenue. Within our Americas segment, we organize our services into the following business lines:
Advisory Services
Our advisory services businesses offer occupier/tenant and investor/owner services that meet the full spectrum of marketplace needs, including (1) real estate services, (2) capital markets and (3) valuation. Our advisory services business line accounted for 32.5% of our 2014 consolidated worldwide revenue, 34.8% of our 2013 consolidated worldwide revenue and 35.0% of our 2012 consolidated worldwide revenue.
Within advisory services, our major service lines are the following:
4
• Real Estate Services. We provide strategic advice and execution to owners, investors and occupiers of real estate in connection with leasing, disposition and acquisition of property. Our many years of strong local market presence have allowed us to develop significant repeat business from existing clients, including approximately 67% of our revenues from existing U.S. real estate sales and leasing clients in 2014. This includes referrals from other parts of our business. Our real estate services professionals are particularly adept at aligning real estate strategies with client business objectives, serving as advisors as well as transaction executors. We believe we are a market leader for the provision of sales and leasing
Table of Contents
real estate services in most top U.S. metropolitan statistical areas (as defined by the U.S. Census Bureau), including Atlanta, Chicago, Denver, Houston, Los Angeles, Miami, New York, Philadelphia, Phoenix and San Francisco. Our real estate services professionals are compensated primarily through commission-based programs, which are payable upon completion of an assignment. Therefore, as compensation is our largest expense, this cost structure gives us flexibility to mitigate the negative effect on our operating margins during difficult market conditions. Due to the low barriers to entry and significant competition for quality employees, we strive to retain top professionals through an attractive compensation program tied to productivity. We believe we invest in greater support resources than most other firms, including professional development and training, market research and information, technology, branding and marketing. We also foster an entrepreneurial culture that emphasizes client service and rewards performance.
We further strengthen our relationships with our real estate services clients by offering proprietary research to them through CBRE Research and CBRE Econometric Advisors, or CBRE-EA, our commercial real estate market information and forecasting groups.
• Capital Markets. We offer clients fully integrated investment sales and debt/structured financing services under the CBRE Capital Markets brand. The tight integration of these services fosters collaboration between our investment sales and debt/structured financing professionals, helping to meet the marketplace demand for comprehensive capital markets solutions. During 2014, we concluded approximately $105.5 billion of capital markets transactions in the Americas, including $72.1 billion of investment sales transactions and $33.4 billion of mortgage loan originations and sales. We believe our Investment Properties business, which includes office, industrial, retail, multifamily and hotel properties, is the leading investment sales property advisor in the United States, with a market share of approximately 16% in 2014. Our mortgage brokerage business originates, sells and services commercial mortgage loans primarily through relationships established with investment banking firms, national banks, credit companies, insurance companies, pension funds and government agencies. In the United States, our mortgage loan origination volume in 2014 was $26.7 billion, representing an increase of approximately 15% from 2013. Approximately $8.7 billion of loans in 2014 were originated for U.S. federal government-sponsored entities, most of which were financed through our revolving credit lines dedicated exclusively for this purpose. We substantially mitigate the principal risk associated with loans financed through these credit lines prior to closing by either obtaining a contractual purchase commitment from the government-sponsored entity or confirming a forward-trade commitment for the issuance and purchase of a mortgage-backed security that will be secured by the loan. We advised on the sale of approximately $5.8 billion of mortgages on behalf of financial institutions in 2014, compared with $2.5 billion in 2013. In 2014, GEMSA Loan Services, a joint venture between CBRE Capital Markets and GE Capital Real Estate, serviced approximately $118.1 billion of mortgage loans, $85.2 billion of which related to the servicing rights of CBRE Capital Markets.
Outsourcing Services
• Valuation . We provide valuation services that include market value appraisals, litigation support, discounted cash flow analyses, feasibility and fairness opinions and property condition and environmental consulting. Our valuation business has developed proprietary systems for data management, analysis and valuation report preparation, which we believe provides us with an advantage over our competitors. We believe that our valuation business is one of the largest in the industry. During 2014, we completed over 48,000 valuation, appraisal and advisory assignments in the Americas.
Outsourcing commercial real estate services is expected to be a long-term trend in our industry, with property owners, corporations, institutions, public sector entities, health care providers and others seeking to achieve improved efficiency, better execution and lower costs by relying on the expertise of third-party real
5
Table of Contents
estate specialists. Two of our service offerings seek to capitalize on the outsourcing trend: (1) occupier outsourcing, which we provide through our Global Corporate Services business line, and (2) property management, which we provide through our Asset Services business line. Agreements with our outsourcing clients that are occupiers of space are typically long-term arrangements with penalties for early termination. Our management agreements with our property management clients, which are owners/investors in real estate, may be terminated by either party with notice generally ranging between 30 to 90 days; however, we have developed long-term relationships with many of these clients and we work closely with them to implement their specific goals and objectives and to preserve and expand upon these relationships. As of December 31, 2014, we managed approximately 1.8 billion square feet of commercial space for property owners and occupiers in the Americas, which we believe represents one of the largest portfolios in the region. Our outsourcing services business line accounted for 25.0% of our 2014 consolidated worldwide revenue, 27.9% of our 2013 consolidated worldwide revenue and 28.0% of our 2012 consolidated worldwide revenue.
• Occupier Outsourcing . Through our Global Corporate Services business line, we provide a comprehensive suite of services to occupiers of real estate, including portfolio and transaction management, project management, facilities management and strategic consulting. We are capitalizing significantly from the increasing preference of occupiers to purchase these services on an integrated, bundled basis, relying on one firm to meet their needs across geographic markets and service disciplines. We enter into multi-year, multi-service outsourcing contracts with our clients, but also provide services on a one-off assignment or a short-term contract basis. The long-term, contractual nature of these relationships enables us to devise and execute real estate strategies that support our clients’ overall business strategies. Our clients include leading global corporations, health care providers and public sector entities with large, geographically-diverse real estate portfolios. Facilities management involves the day-to-day management of client-occupied space and includes headquarter buildings, regional offices, administrative offices, data centers and other critical facilities, and manufacturing and distribution facilities. We identify best practices, implement technology solutions and leverage our resources to control clients’ facilities costs and enhance the workplace environment. Contracts for facilities management services are typically structured so we receive reimbursement of client-dedicated personnel costs and associated overhead expenses plus a monthly fee, and in some cases, annual incentives if agreed-upon performance targets are satisfied. Project management services are typically provided on a portfolio-wide or programmatic basis. Revenues for project management generally include fixed management fees, variable fees, and incentive fees if certain agreed-upon performance targets are met. Revenues for project management may also include reimbursement of payroll and related costs for personnel providing the services. In general, portfolio and transaction services contribute revenue on a transaction basis; project management and facilities management contribute contractual, or per-project, revenue and strategic consulting services contribute both transaction and contractual revenue.
6
• Property Management . Through our Asset Services business line, we provide property management services on a contractual basis for owners/investors in office, industrial and retail properties. These services include construction management, marketing, leasing, building engineering, accounting and financial services. We provide these services through an extensive network of real estate experts in major markets throughout the United States. These local specialists are supported by a strategic accounts team whose function is to help ensure quality service and to maintain and expand relationships with large institutional clients, including buyers, sellers and landlords who need to lease, buy, sell and/or finance space. We believe our contractual relationships with these clients put us in an advantageous position to provide other services to them, including refinancing, disposition and appraisal. We typically receive monthly management fees for the asset services we provide based upon a specified percentage of the monthly rental income or rental receipts generated from the property under management, or in certain cases, the greater of such percentage fee or a minimum agreed-upon fee. We are also normally reimbursed for our administrative and payroll costs, as well as certain out-of-pocket expenses, directly attributable to the properties under management.
Table of Contents
Europe, Middle East and Africa (EMEA)
Our Europe, Middle East and Africa, or EMEA, reporting segment operates in 41 countries with services primarily furnished through a number of indirect wholly-owned subsidiaries. The largest operations are located in France, Germany, Italy, The Netherlands, Spain and the United Kingdom. Our operations in these countries generally provide a full range of services to the commercial property sector. Additionally, we provide some residential property services, focused on the prime and super-prime segments of the market, primarily in the United Kingdom. Within EMEA, our services are organized along similar lines as in the Americas, including leasing brokerage, property sales, valuation services, asset management services and facilities management, among others. In addition, the acquisition of Norland in December 2013 enables us to self-perform building technical engineering services in Europe. Our EMEA segment accounted for 25.9% of our 2014 revenue, 16.9% of our 2013 revenue and 15.8% of our 2012 revenue.
In France, we believe we are a market leader in Paris and also have operations in Aix en Provence, Bagnolet, Bordeaux, Lille, Lyon, Marseille, Montreuil, Montrouge, Saint Denis and Toulouse. Our German operations are located in Berlin, Cologne, Düsseldorf, Frankfurt, Hamburg, Munich, Nuremberg and Stuttgart. Our presence in Italy includes operations in Milan, Modena, Rome and Turin. Our operations in The Netherlands are located in Amsterdam, the Hague, Rotterdam and Utrecht. In Spain, we provide full-service coverage through our offices in Barcelona, Madrid, Marbella, Palma de Mallorca, Valencia and Zaragoza. We are one of the leading commercial real estate services companies in the United Kingdom. We have held the leading market position in investment sales in the United Kingdom in each of the past seven years. In London, we provide a broad range of commercial property real estate services to investment and occupier clients, and held the leading market position for space acquisition in 2014 for the fifth year in a row. We also have regional offices in Birmingham, Bristol, Jersey, Leeds, Liverpool, Manchester, Sheffield and Southampton as well as offices in Aberdeen, Belfast, Dublin, Edinburgh and Glasgow managed by our U.K. team. In addition, our building technical engineering services operate in several other cities throughout the United Kingdom.
In several countries in EMEA, we operate through independent affiliates that provide commercial real estate services under our brand name. Our agreements with these independent affiliates include licenses by us to them to use the “CBRE” and “CB Richard Ellis” names in the relevant territory in return for payments of annual or quarterly royalty fees to us. In addition, these agreements may include business cross-referral arrangements between us and our affiliates.
Asia Pacific
Our Asia Pacific reporting segment operates in 13 countries with services primarily furnished through a number of indirect wholly-owned subsidiaries. We believe that we are one of only a few companies that can provide a full range of real estate services to large occupiers and investors throughout the region, similar to the broad range of services provided by our Americas and EMEA segments. Our principal operations in Asia are located in Greater China, India, Japan, Singapore, South Korea, Thailand and Vietnam. In addition, we have agreements with independent affiliates in Cambodia and the Philippines that generate royalty fees and support cross-referral arrangements similar to our EMEA segment. The Pacific region includes Australia and New Zealand, with principal offices located in Adelaide, Brisbane, Canberra, Melbourne, Perth, Sydney, Auckland, Christchurch and Wellington. Our Asia Pacific segment accounted for 10.7% of our 2014 revenue, 12.2% of our 2013 revenue and 12.6% of our 2012 revenue.
Global Investment Management
Operations in our Global Investment Management reporting segment are conducted through our indirect wholly-owned subsidiary CBRE Global Investors, LLC and its global affiliates, which we also refer to as CBRE Global Investors. CBRE Global Investors provides investment management services to pension funds, insurance companies, sovereign wealth funds, foundations, endowments and other institutional investors seeking to
7
Table of Contents
generate returns and diversification through investment in real estate. It sponsors investment programs that span the risk/return spectrum across three continents: North America, Europe and Asia. In some strategies, CBRE Global Investors and its investment teams co-invest with its limited partners. Our Global Investment Management segment accounted for 5.2% of our 2014 revenue, 7.5% of our 2013 revenue and 7.4% of our 2012 revenue.
CBRE Global Investors’ offerings are organized into four primary categories, which include direct real estate investments through separate accounts and sponsored funds as well as indirect real estate investments through listed securities and multi manager investment programs. These offerings cover the full range of risk strategies from core/core+ to opportunistic. Operationally, dedicated investment teams execute each investment program within these categories, with the team’s compensation being driven largely by the investment performance of its particular strategy/fund. This organizational structure is designed to align the interests of team members with those of the firm and its investor clients/partners and to enhance accountability and performance. Dedicated teams are supported by shared resources such as accounting, finance, legal, information technology, investor services and research. CBRE Global Investors has an in-house team of research professionals who focus on investment strategy, underwriting and forecasting, based in part on market data from our advisory services group.
CBRE Global Investors closed approximately $6.8 billion and $4.2 billion of new acquisitions in 2014 and 2013, respectively. It liquidated $6.7 billion and $8.9 billion of investments in 2014 and 2013, respectively. Assets under management have increased from $15.1 billion at December 31, 2004 to $90.6 billion at December 31, 2014, representing an approximately 20% compound annual growth rate. This includes growth as a result of the REIM Acquisitions.
Previously, CBRE Global Investors has had a portfolio of consolidated real estate held for investment consisting of multifamily/residential properties located in the United States. Included in the accompanying consolidated statements of operations were rental revenues (which are included in revenue) and expenses (which are included in operating, administrative and other expenses) relating to operational real estate properties, excluding those reported as discontinued operations in 2013 and 2012, of $3.6 million and $2.6 million, respectively, for the year ended December 31, 2014, $9.8 million and $5.3 million, respectively, for the year ended December 31, 2013 and $20.2 million and $18.4 million, respectively, for the year ended December 31, 2012.
Development Services
Operations in our Development Services reporting segment are conducted through our indirect wholly-owned subsidiary Trammell Crow Company, LLC and certain of its subsidiaries, providing development services primarily in the United States to users of and investors in commercial real estate, as well as for its own account. Trammell Crow Company pursues opportunistic, risk-mitigated development and investment in commercial real estate across a wide spectrum of property types, including: industrial, office and retail properties; healthcare facilities of all types (medical office buildings, hospitals and ambulatory surgery centers); and residential/mixed-use projects. Our Development Services segment accounted for 0.7% of our 2014 revenue, 0.7% of our 2013 revenue and 1.2% of our 2012 revenue.
Trammell Crow Company acts as the manager of development projects, providing services that are vital in all stages of the process, including: (i) site identification, due diligence and acquisition; (ii) evaluating project feasibility, budgeting, scheduling and cash flow analysis; (iii) procurement of approvals and permits, including zoning and other entitlements; (iv) project finance advisory services; (v) coordination of project design and engineering; (vi) construction bidding and management as well as tenant finish coordination; and (vii) project close-out and tenant move coordination.
Trammell Crow Company pursues development and investment activity on behalf of its user and investor clients (with no ownership), in partnership with its clients (through co-investment – either on an individual project basis or through programs with certain strategic capital partners) or for its own account (100%
8
Table of Contents
ownership). Development activity in which Trammell Crow Company has an ownership interest is conducted through subsidiaries that are consolidated or unconsolidated for financial reporting purposes, depending primarily on the extent and nature of our ownership interest.
As of December 31, 2014, our portfolio of consolidated real estate consisted of land, industrial and office properties that are geographically dispersed throughout the United States. Included in the accompanying consolidated statements of operations were rental revenues (which are included in revenue) and expenses (which are included in operating, administrative and other expenses) relating to these operational real estate properties, excluding those reported as discontinued operations in 2013 and 2012, of $10.7 million and $4.2 million, respectively, for the year ended December 31, 2014, $14.5 million and $6.4 million, respectively, for the year ended December 31, 2013 and $35.4 million and $17.1 million, respectively, for the year ended December 31, 2012.
At December 31, 2014, Trammell Crow Company had $5.4 billion of development projects in process. Additionally, the inventory of pipeline deals (prospective projects we believe have a greater than 50% chance of closing or where land has been acquired and the projected construction start date is more than twelve months out) was $4.0 billion at December 31, 2014. Competition
We compete across a variety of business disciplines within the commercial real estate industry, including commercial property and corporate facilities management, occupier and property/agency leasing, property sales, valuation, real estate investment management, commercial mortgage origination and servicing, capital markets (structured finance and debt) solutions, development services and proprietary research. Each business discipline is highly competitive on an international, national, regional and local level. Although we are the largest commercial real estate services firm in the world in terms of 2014 revenue, our relative competitive position varies significantly across geographic markets, property types and services. Depending on the geography, property type or service, we face competition from other commercial real estate service providers that compete with us on a global, national, regional or local basis or within a market segment; outsourcing companies that traditionally competed in limited portions of our facilities management business and have recently expanded their offerings; in-house corporate real estate departments and property owners/developers that self-perform real estate services; investment banking firms, investment managers and developers that compete with us to raise and place investment capital; and accounting/consulting firms that advise on real estate strategies. Some of these firms may have greater financial resources than we do. Despite recent consolidation, the commercial real estate services industry remains highly fragmented and competitive. Although many of our competitors are substantially smaller than us, some of them are larger on a local or regional basis or have a stronger position in a market segment or service offering. In addition, it is also possible that two or more of our competitors could combine to create a much larger and more formidable global competitor. Among our primary competitors are other large national and global firms, such as Cushman & Wakefield, JLL (also known as Jones Lang LaSalle), FirstService Corporation (the publicly traded parent of Colliers International), Savills (which acquired U.S.-based service provider Studley, Inc. in 2014) and DTZ (which was acquired in 2014 by an investment consortium led by TPG Capital and merged with Cassidy Turley, a U.S.-based real-estate services firm, forming a new competitor entity), and Newmark Grubb Knight Frank; market-segment specialists, such as HFF and Eastdil Secured; and large global firms with business lines that compete with our outsourcing business. Seasonality
A significant portion of our revenue is seasonal, which an investor should keep in mind when comparing our financial condition and results of operations on a quarter-by-quarter basis. Historically, our revenue, operating income, net income and cash flow from operating activities tend to be lowest in the first quarter, and highest in the fourth quarter of each year. Earnings and cash flow have generally been concentrated in the fourth quarter due to the focus on completing sales, financing and leasing transactions prior to calendar year-end.
9
Table of Contents
Employees
At December 31, 2014, excluding our independent affiliates, we had more than 52,000 employees worldwide, approximately 43% of which represent costs that are fully reimbursed by clients and are mostly in our outsourcing services lines of business. At December 31, 2014, 1,222 of our employees were subject to collective bargaining agreements, most of whom are on-site employees in our asset services business in California, Illinois, New Jersey and New York. Intellectual Property
We hold various trademarks and trade names worldwide, which include the “CBRE” name as well as our prior “CB Richard Ellis” name. Although we believe our intellectual property plays a role in maintaining our competitive position in a number of the markets that we serve, we do not believe we would be materially, adversely affected by expiration or termination of our trademarks or trade names or the loss of any of our other intellectual property rights other than the “CBRE,” “CB Richard Ellis” and “Trammell Crow” names. With respect to the CBRE and CB Richard Ellis names, we maintain trademark registrations for these service marks in jurisdictions where we conduct significant business.
We hold a license to use the “Trammell Crow” trade name pursuant to a license agreement with CF98, L.P., an affiliate of Crow Realty Investors, L.P., d/b/a Crow Holdings, which may be revoked if we fail to satisfy usage and quality control covenants under the license agreement.
In addition to trade names, we have developed proprietary technologies for the provision of complex services and analysis through our global outsourcing business and for preparing and developing valuation reports for our clients through our valuation business. We also offer proprietary research to clients through our CBRE-EA research unit and we offer proprietary investment analysis and structures through CBRE Global Investors. We have not generally registered these items of intellectual property in any jurisdiction. While we may seek to secure our rights under applicable intellectual property protection laws in these and any other proprietary assets that we use in our business, we do not believe any of these other items of intellectual property are material to our business in the aggregate. Environmental Matters
Federal, state and local laws and regulations in the countries in which we do business impose environmental liabilities, controls, disclosure rules and zoning restrictions that affect the ownership, management, development, use or sale of commercial real estate. Certain of these laws and regulations may impose liability on current or previous real property owners or operators for the cost of investigating, cleaning up or removing contamination caused by hazardous or toxic substances at a property, including contamination resulting from above-ground or underground storage tanks or the presence of asbestos or lead at a property. If contamination occurs or is present during our role as a property or facility manager or developer, we could be held liable for such costs as a current “operator” of a property, regardless of the legality of the acts or omissions that caused the contamination and without regard to whether we knew of, or were responsible for, the presence of such hazardous or toxic substances. The operator of a site also may be liable under common law to third parties for damages and injuries resulting from exposure to hazardous substances or environmental contamination at a site, including liabilities arising from exposure to asbestos-containing materials. Under certain laws and common law principles, any failure by us to disclose environmental contamination at a property could subject us to liability to a buyer or lessee of the property. Further, federal, state and local governments in the countries in which we do business have enacted various laws, regulations, and treaties governing environmental and climate change, particularly for “greenhouse gases,” which seek to tax, penalize or limit their release. Such regulations could lead to increased operational or compliance costs over time.
10

Table of Contents
While we are aware of the presence or the potential presence of regulated substances in the soil or groundwater at or near several properties owned, operated or managed by us that may have resulted from historical or ongoing activities on those properties, we are not aware of any material noncompliance with the environmental laws or regulations currently applicable to us, and we are not the subject of any material claim for liability with respect to contamination at any location. However, these laws and regulations may discourage sales and leasing activities and mortgage lending with respect to some properties, which may adversely affect both the commercial real estate services industry and us in general. Environmental contamination or other environmental liabilities may also negatively affect the value of commercial real estate assets held by entities that are managed by our investment management and development services businesses, which could adversely affect the results of operations of these business lines. Available Information
Our internet address is www.cbre.com . We use our website as a channel of distribution for Company information, and financial and other material information regarding us is routinely posted and accessible on our website.
On the Investor Relations page on our website, we post the following filings as soon as reasonably practicable after they are electronically filed with or furnished to the Securities and Exchange Commission, or SEC: our Annual Report on Form 10-K, our Proxy Statement on Schedule 14A, our Quarterly Reports on Form 10-Q, our Current Reports on Form 8-K, and any amendments to those reports filed or furnished pursuant to Section 13(a) or 15(d) of the Securities Exchange Act of 1934, or the Exchange Act. We also make available through our website other reports filed with or furnished to the SEC under the Exchange Act, including reports filed by our officers and directors under Section 16(a) of the Exchange Act.
All of the information on our Investor Relations web page is available to be viewed free of charge. Information contained on our website is not part of this Annual Report on Form 10-K or our other filings with the SEC. We assume no obligation to update or revise any forward-looking statements in the Annual Report on Form 10-K, whether as a result of new information, future events or otherwise, unless we are required to do so by law.
A copy of this Annual Report on Form 10-K is available without charge upon written request to: Investor Relations, CBRE Group, Inc., 200 Park Avenue, New York, New York 10166. The SEC also maintains an Internet site ( www.sec.gov ) that contains reports, proxy and information statements and other information regarding issuers that file electronically with the SEC. Item 1A. Risk Factors
Set forth below and elsewhere in this report and in other documents we file with the SEC are risks and uncertainties that could cause our actual results to differ materially from the results contemplated by the forward-looking statements contained in this report and other public statements we make. Based on the information currently known to us, we believe that the matters discussed below identify the material risk factors affecting our business. However, the risks and uncertainties we face are not limited to those described below. Additional risks and uncertainties not presently known to us or that we currently believe to be immaterial (but that later become material) may also adversely affect our business.
The success of our business is significantly related to general economic conditions and, accordingly, our business, operations and financial condition could be adversely affected by economic slowdowns, liquidity crises, fiscal uncertainty and possible subsequent downturns in commercial real estate asset values, property sales and leasing activities in one or more of the geographies or industry sectors that we or our clients serve.
Some of the world’s large economies and financial institutions continue to be affected by ongoing global economic and financial issues, with some continuing to face financial difficulty, fiscal uncertainty, pressure on
11
Table of Contents
asset prices, liquidity problems and limited availability of credit, made worse in certain areas by increased unemployment or limited economic growth. It is uncertain how long these effects will last, or whether economic and financial trends in those areas, particularly in Europe, will worsen or improve. The current economic situation may be exacerbated if additional negative geo-political or economic developments, natural disasters or other disruptions were to arise.
Periods of economic weakness or recession, significantly rising interest rates, fiscal uncertainty, declining employment levels, declining demand for commercial real estate, falling real estate values, disruption to the global capital or credit markets or the public perception that any of these events may occur, may negatively affect the performance of some or all of our business lines.
Our business is significantly affected by generally prevailing economic conditions in the principal markets where we operate, which can result in a general decline in real estate acquisition, disposition and leasing activity, as well as a general decline in the value of commercial real estate and in rents, which in turn reduces revenue from property management fees and commissions derived from property sales, leasing, valuation and financing, as well as revenues associated with development or investment management activities. Our Capital Markets business could also suffer from any political or economic disruption that affects interest rates or liquidity. In addition, we could experience a reduction in the amount of fees we earn in our Global Investment Management business if our assets under management decrease or those assets fail to perform as anticipated. These economic conditions could also lead to a decline in property sales prices as well as a decline in funds invested in existing commercial real estate assets and properties planned for development.
Our development and investment strategy often entails making relatively modest co-investments alongside our investor clients. Our ability to conduct these activities depends in part on the supply of investment capital for commercial real estate and related assets. During an economic downturn, investment capital is usually constrained and it may take longer for us to dispose of real estate investments or selling prices may be lower than originally anticipated. As a result, the value of our commercial real estate investments may be reduced, and we could realize losses or diminished profitability. In addition, economic downturns may reduce the amount of loan originations and related servicing by our commercial mortgage brokerage business.
Performance of our asset services line of business partially depends upon the performance of the properties we manage because our fees are generally based on a percentage of aggregate rent collections from these properties. The performance of these properties may be affected by many factors which are partially or completely outside of our control, including: (i) real estate and financial market conditions prevailing generally and locally; (ii) our ability to attract and retain creditworthy tenants, particularly during economic downturns; and (iii) the magnitude of defaults by tenants under their respective leases, which may increase during distressed conditions.
For example, during 2008 and 2009, credit became severely constrained and prohibitively expensive, and real estate market activity contracted sharply in most markets around the world as a result of the global financial crisis and the deep economic recession. These adverse macro conditions affected commercial real estate services companies like ours by significantly hampering transaction activity and lowering real estate valuations. Similar to other commercial real estate services firms, our transaction volumes fell during 2008 and most of 2009, and as a result, our stock price declined significantly. If the economic and market conditions that prevailed in 2008 and 2009 were to return, our business performance and profitability could again deteriorate.
Certain geographies within the Americas, as well as certain sectors of the constituency that we serve, have been negatively affected by the recent weakened performance of the U.S. oil and gas industry, which may in turn diminish the performance of our various development, investment, leasing and other businesses in those geographies as well as reduce the demand for our services by our clients in such areas or who are affected by that industry. In addition, the economic situation in Europe remains unstable, arising from the various austerity policies and continuing credit restrictions. If the nascent recovery in certain European economies does not gain traction, or if conditions remain unstable or worsen, our revenues may be adversely affected.
12
Table of Contents
Economic uncertainty as well as significant changes and volatility in the financial markets and business environment, and in the global political, security and competitive landscape, make it increasingly difficult for us to predict our revenue and earnings into the future. As a result, any revenue or earnings guidance or outlook, which we have given or might give, may be overtaken by events, or may otherwise turn out to be inaccurate. Though we endeavor to give reasonable estimates of future revenue and earnings at the time we give such guidance based on then-current conditions, there is a significant risk that such guidance or outlook will turn out to be, or to have been, incorrect.
Adverse developments in the credit markets may harm our business, results of operations and financial condition.
Our Global Investment Management, Development Services and Capital Markets (including investment property sales and debt and structured financing services) businesses are sensitive to credit cost and availability as well as marketplace liquidity. Additionally, the revenues in all of our businesses are dependent to some extent on the overall volume of activity (and pricing) in the commercial real estate market.
Disruptions in the credit markets may adversely affect our business of providing advisory services to owners, investors and occupiers of real estate in connection with the leasing, disposition and acquisition of property. If our clients are unable to procure credit on favorable terms, there may be fewer completed leasing transactions, dispositions and acquisitions of property. In addition, if purchasers of commercial real estate are not able to procure favorable financing resulting in the lack of disposition opportunities for our funds and projects, our Global Investment Management and Development Services businesses will be unable to generate incentive fees, and we may also experience losses of co-invested equity capital if the disruption causes a permanent decline in the value of investments made.
Our international operations subject us to social, political and economic risks of doing business in foreign countries.
We conduct a significant portion of our business and employ a substantial number of people outside of the United States and as a result, we are subject to risks associated with doing business globally. During 2014, we generated approximately 44% of our revenue from operations outside the United States. With the REIM Acquisitions, the footprint of our Global Investment Management business significantly expanded, particularly in Europe and Asia, and with the acquisition of Norland, our Global Corporate Services business has expanded significantly in Europe. Additional circumstances and developments related to international operations that could negatively affect our business, financial condition or results of operations include, but are not limited to, the following factors:
• difficulties and costs of staffing and managing international operations among diverse geographies, languages and cultures;
• currency restrictions, transfer pricing regulations and adverse tax consequences, which may affect our ability to transfer capital and
profits to the United States;
• adverse changes in regulatory or tax requirements and regimes;
• the responsibility of complying with numerous, potentially conflicting and frequently complex and changing laws in multiple
jurisdictions, e.g. , with respect to corrupt practices, embargoes, trade sanctions, employment and licensing;
• the impact of regional or country-specific business cycles and economic instability, particularly in Europe, which is undergoing
economic stagnation following its sovereign debt crisis;
13
• greater difficulty in collecting accounts receivable in some geographic regions such as Asia, where many countries have
underdeveloped insolvency laws;
Table of Contents
• a tendency for clients to delay payments in some European and Asian countries;
• political and economic instability in certain countries; and
We maintain anti-corruption and anti-money laundering compliance programs and programs designed to enable us to comply with
applicable government economic sanctions, embargoes and other import/export controls throughout the company. But, coordinating our activities to deal with the broad range of complex legal and regulatory environments in which we operate presents significant challenges. We may not be successful in complying with regulations in all situations and violations may result in criminal or civil sanctions, including material monetary fines, penalties, equitable remedies (including disgorgement), and other costs against us or our employees, and may have a material adverse effect on our reputation and business.
We have committed additional resources to expand our worldwide sales and marketing activities, to globalize our service offerings and products in selected markets and to develop local sales and support channels. If we are unable to successfully implement these plans, maintain adequate long-term strategies that successfully manage the risks associated with our global business or adequately manage operational fluctuations, our business, financial condition or results of operations could be harmed. In addition, we have penetrated, and seek to continue to enter into, emerging markets to further expand our global platform. However, we may not be successful in effectively evaluating and monitoring the key business, operational, legal and compliance risks specific to those markets. The political and cultural risks present in emerging countries could also harm our ability to successfully execute our operations or manage our businesses there.
Our revenue and earnings may be adversely affected by foreign currency fluctuations.
Our revenue from non-U.S. operations is denominated primarily in the local currency where the associated revenue was earned. During 2014, approximately 44% of our revenue was transacted in foreign currencies, the majority of which included the Australian dollar, Brazilian real, British pound sterling, Canadian dollar, Chinese yuan, Euro, Indian rupee, Japanese yen and Singapore dollar. Our Global Investment Management business has a significant amount of Euro-denominated assets under management as well as associated revenue and earnings in Europe, which continues to experience economic stagnation that may result in further deterioration in the value of the Euro against the U.S. dollar. Fluctuations in foreign currency exchange rates may result in corresponding fluctuations in our assets under management, revenue and earnings.
Over time, fluctuations in the value of the U.S. dollar relative to the other currencies in which we may generate earnings could adversely affect our business, financial condition and operating results. Due to the constantly changing currency exposures to which we are subject and the volatility of currency exchange rates, we cannot predict the effect of exchange rate fluctuations upon future operating results. In addition, fluctuations in currencies relative to the U.S. dollar may make it more difficult to perform period-to-period comparisons of our reported results of operations.
Selectively, our management uses currency hedging instruments, including foreign currency forward and option contracts. There can be no assurance that these hedging instruments will be available when needed. Additionally, economic risks associated with these hedging instruments include unexpected fluctuations in inflation rates, which affect cash flow, unexpected changes in the underlying net asset position, and hedge counterparty credit risk.
Our growth has benefited significantly from acquisitions, which may not perform as expected and similar opportunities may not be available in the future.
A significant component of our growth has occurred through acquisitions, including our acquisition of Norland in 2013. Any future growth through acquisitions will be dependent in part upon the continued
14
• foreign ownership restrictions with respect to operations in countries such as China and Thailand.
Table of Contents
availability of suitable acquisition candidates at favorable prices and upon advantageous terms and conditions, which may not be available to us, as well as sufficient liquidity and credit to fund these acquisitions. We may incur significant additional debt from time to time to finance any such acquisitions, subject to the restrictions contained in the documents governing our then-existing indebtedness. If we incur additional debt, the risks associated with our leverage, including our ability to service our then-existing debt, would increase. Acquisitions involve risks that business judgments concerning the value, strengths and weaknesses of businesses acquired may prove incorrect. Future acquisitions and any necessary related financings also may involve significant transaction-related expenses, which include severance, lease termination, transaction and deferred financing costs, among others.
We have had, and may continue to experience, challenges in integrating operations and information technology systems acquired from other companies. This could result in the diversion of management’s attention from other business concerns and the potential loss of our key employees or clients or those of the acquired operations. The integration process itself may be disruptive to our business and the acquired company’s businesses as it requires coordination of geographically diverse organizations and implementation of new accounting and information technology systems. We believe that most acquisitions will initially have an adverse impact on operating and net income. Acquisitions also frequently involve significant costs related to integrating information technology, accounting and management services and rationalizing personnel levels.
The anticipated benefits of the Norland acquisition and other acquisitions we make may not be realized as we contemplated.
We completed the Norland acquisition as well as other acquisitions with the expectation that such acquisitions would result in various benefits, including, among others, enhanced revenues, a strengthened market position, cross-selling opportunities and operating efficiencies. We are also likely to have similar expectations for future acquisitions. Achieving the anticipated benefits of the Norland acquisition and other acquisitions will be subject to a number of uncertainties, including the realization of accretive benefits in the timeframe anticipated. Failure to achieve these anticipated benefits could result in increased costs, decreases in the amount of expected revenues and diversion of management’s time and energy, which could adversely affect our financial condition and operating results.
Our success depends upon the retention of our senior management, as well as our ability to attract and retain qualified and experienced employees (including those acquired through acquisitions).
Our continued success is highly dependent upon the efforts of our executive officers and other key employees, including Robert E. Sulentic, our President and Chief Executive Officer. Mr. Sulentic and certain other key employees are not parties to employment agreements with us. We also are highly dependent upon the retention of our property sales and leasing professionals, who generate a significant amount of our revenues, as well as other revenue producing professionals. The departure of any of our key employees (including those acquired through acquisitions), or the loss of a significant number of key revenue producers, if we are unable to quickly hire and integrate qualified replacements, could cause our business, financial condition and results of operations to suffer. Competition for these personnel is significant and we may not be able to successfully recruit, integrate or retain sufficiently qualified personnel. In addition, the growth of our business is largely dependent upon our ability to attract and retain qualified support personnel in all areas of our business. We use equity incentives to help retain and incentivize many of our key personnel. Any significant decline in, or failure to grow, our stock price may result in an increased risk of loss of these key personnel. If we are unable to attract and retain these qualified personnel, our growth may be limited and our business and operating results could suffer.
Our joint venture activities and affiliate program involve unique risks that are often outside of our control and that, if realized, could harm our business.
We have utilized joint ventures for commercial investment, select local brokerage and other affiliations both in the United States and internationally, and we may acquire interests in other joint ventures in the future. Under
15
Table of Contents
our affiliate program, we enter into contractual relationships with local brokerage, property management or other operations pursuant to which we license to that operation our name and make available certain of our resources, in exchange for a royalty or economic participation in that operation’s revenue, profits or transactional activity. In many of these joint ventures and affiliations, we may not have the right or power to direct the management and policies of the joint ventures or affiliates, and other participants or operators of affiliates may take action contrary to our instructions or requests and against our policies and objectives. In addition, the other participants and operators may become bankrupt or have economic or other business interests or goals that are inconsistent with ours. If a joint venture participant or affiliate acts contrary to our interest, it could harm our brand, business, results of operations and financial condition.
Our revenue, net income and cash flow generated by our Global Investment Management business can vary significantly as a result of market developments.
The revenue, net income and cash flow generated by our Global Investment Management business can be variable, primarily due to the fact that management, transaction and incentive fees can vary as a result of market movements from one period to another.
The pace at which the real estate markets worldwide turned from positive to negative starting in 2007 and continuing into 2009 is an example of the market volatility to which we are subject and over which we have no control. The underlying market conditions, decisions regarding the acquisition and disposition of fund and separate account assets, and the specifics of client mandates will cause the amount of asset management, transaction and incentive fees to vary from one product to another.
A substantial part of our fees are based upon the value of the assets we manage, and if asset values deteriorate, our asset management fees will decline as a result. Our acquisition and disposition fees can decline as a result of delays in the deployment of capital or limited market liquidity. We also earn incentive fees tied to portfolio performance, which fees may decline if there is a downturn in real estate markets and we fail to meet benchmarks or return hurdles. Finally, during periods of economic weakness, recession or stagnation, existing and prospective clients in our Global Investment Management business may be less able or willing to commit new funds to real estate investments, which are inherently less liquid than many competing investment classes, thereby inhibiting the ability of our Global Investment Management business to raise new funds. Additionally, investors with open commitments to provide additional investment capital could become less able or willing to honor their financial commitments and/or seek to renegotiate the terms of their commitments or the fees that they are obligated to pay. To the extent that clients in our Global Investment Management business seek to avoid paying fees they are obligated to pay, or seek to avoid deploying capital that has been committed, we could experience a decrease in collection of fees and interruptions to our client relationships and business.
Our real estate investment and co-investment activities in our Global Investment Management as well as Development Services businesses subject us to real estate investment risks which could cause fluctuations in earnings and cash flow.
An important part of the strategy for our Global Investment Management business involves co-investing our capital in certain real estate investments with our clients, and there is an inherent risk of loss of our investments. As of December 31, 2014, we had committed $19.0 million to fund future co-investments in our Global Investment Management business, $12.7 million of which is expected to be funded during 2015. In addition to required future capital contributions, some of the co-investment entities may request additional capital from us and our subsidiaries holding investments in those assets. The failure to provide these contributions could have adverse consequences to our interests in these investments, including damage to our reputation with our co-investment partners and clients, as well as the necessity of obtaining alternative funding from other sources that may be on disadvantageous terms for us and the other co-investors. Participating as a co-investor is an important part of our Global Investment Management business, which might suffer if we were unable to make these investments. Although our debt instruments contain restrictions that limit our ability to provide capital to the
16
Table of Contents
entities holding direct or indirect interests in co-investments, we may provide this capital in many instances in further support of the co-investment.
Selective investment in real estate projects is an important part of our Development Services business strategy, and there is an inherent risk of loss of our investments. As of December 31, 2014, we had 16 consolidated real estate projects with invested equity of $8.3 million. In addition, at December 31, 2014, we were involved as a principal (in most cases, co-investing with our clients) in approximately 60 unconsolidated real estate subsidiaries with invested equity of $110.5 million and had committed additional capital to these unconsolidated subsidiaries of $25.5 million. We also guaranteed outstanding notes payable of these unconsolidated subsidiaries of $10.1 million.
During the ordinary course of our Development Services business, we provide numerous completion and budget guarantees requiring us to complete the relevant project within a specified timeframe and/or within a specified budget, with us potentially being liable for costs to complete in excess of such timeframe or budget. While we generally have “guaranteed maximum price” contracts with reputable general contractors with respect to projects for which we provide these guarantees (which are intended to pass most of the risk to such contractors), there can be no assurance that we will not have to perform under any such guarantees. If we are required to perform under a significant number of such guarantees, it could harm our business, results of operations and financial condition.
Because the disposition of a single significant investment can affect our financial performance in any period, our real estate investment activities could increase fluctuations in our net earnings and cash flow. In many cases, we have limited control over the timing of the disposition of these investments and the recognition of any related gain or loss, or incentive participation fee.
Poor performance of the investment programs that our Global Investment Management business manages would cause a decline in our revenue, net income and cash flow and could adversely affect our ability to raise capital for future programs.
In the event that any of the investment programs that our Global Investment Management business manages were to perform poorly, our revenue, net income and cash flow could decline because the value of the assets we manage would decrease, which would result in a reduction in some of our management fees, and our investment returns would decrease, resulting in a reduction in the incentive compensation we earn. Moreover, we could experience losses on co-investments of our own capital in such programs as a result of poor performance. Investors and potential investors in our programs continually assess our performance, and our ability to raise capital for existing and future programs and maintaining our current fee structure will depend on our continued satisfactory performance.
Our leverage and debt service obligations could harm our ability to operate our business, remain in compliance with debt covenants and make payments on our debt.
We are leveraged and have debt service obligations. As of December 31, 2014, our total debt, excluding notes payable on real estate (which are generally nonrecourse to us) and warehouse lines of credit (which are recourse only to our wholly-owned subsidiary, CBRE Capital Markets, and are secured by our related warehouse receivables), was approximately $1.9 billion. For the year ended December 31, 2014, our interest expense was approximately $112.0 million. On January 9, 2015, we entered into an amended and restated credit agreement, which replaced our prior credit agreement. The amended and restated credit agreement provides for a $2.6 billion revolving credit facility and a $500.0 million tranche A term loan facility, with the term facility fully drawn on the closing date of the new facility.
Our level of indebtedness increases the possibility that we may be unable to generate cash sufficient to pay when due the principal of, or other amounts due in respect of, our indebtedness. In addition, we may incur
17
Table of Contents
additional debt from time to time to finance strategic acquisitions, investments, joint ventures or for other purposes, subject to the restrictions contained in the documents governing our indebtedness. If we incur additional debt, the risks associated with our leverage, including our ability to service our debt, would increase. If we are required to seek an amendment to our credit agreement to accomondate further leverage, our debt service obligations may be substantially increased.
Our debt could have other important consequences, which include, but are not limited to, the following:
• a substantial portion of our cash flow from operations is used to pay principal and interest on our debt;
• our interest expense could increase if interest rates increase because the loans under our credit agreement generally bear interest at
floating rates;
• our leverage could increase our vulnerability to general economic downturns and adverse competitive and industry conditions, placing
us at a disadvantage compared to those of our competitors that are less leveraged;
• our debt service obligations could limit our flexibility in planning for, or reacting to, changes in our business and in the commercial real
estate services industry;
• our failure to comply with the financial and other restrictive covenants in the documents governing our indebtedness could result in an
event of default that, if not cured or waived, results in foreclosure on substantially all of our assets; and
From time to time, Moody’s Investors Service, Inc. and Standard & Poor’s Ratings Services, a division of The McGraw-Hill Companies,
Inc., rate our significant outstanding debt. These ratings and any downgrades thereof may affect our ability to borrow under any new agreements in the future, as well as the interest rates and other terms of any future borrowings, and could also cause a decline in the market price of our Class A common stock in addition to our outstanding debt instruments.
We cannot be certain that our earnings will be sufficient to allow us to pay principal and interest on our debt and meet our other obligations. If we do not have sufficient earnings, we may be required to seek to refinance all or part of our existing debt, sell assets, borrow more money or sell more securities, none of which we can guarantee that we will be able to do and which, if accomplished, may adversely affect our stock price.
Our debt instruments impose operating and financial restrictions on us, and in the event of a default, all of our borrowings would become immediately due and payable.
Our debt instruments, including our credit agreement, impose, and the terms of any future debt may impose, operating and other restrictions on us and many of our subsidiaries. These restrictions affect, and in many respects limit or prohibit, our ability to:
• our level of debt may restrict us from raising additional financing on satisfactory terms to fund strategic acquisitions, investments, joint
ventures and other general corporate requirements.
• plan for or react to market conditions;
• meet capital needs or otherwise restrict our activities or business plans; and
• finance ongoing operations, strategic acquisitions, investments or other capital needs or to engage in other business activities that would
be in our interest, including:
• incurring or guaranteeing additional indebtedness;
• paying dividends or making distributions on or repurchases of capital stock;
18
• repurchasing equity interests or debt;
Table of Contents
• the payment of dividends or other amounts to us;
• making investments;
• transferring or selling assets, including the stock of subsidiaries;
• engaging in transactions with affiliates;
• issuing subsidiary equity or entering into consolidations and mergers;
• creating liens; and
Our credit agreement currently requires us to maintain a minimum coverage ratio of EBITDA (as defined in the credit agreement) to total
interest expense of 2.00x and a maximum leverage ratio of total debt less available cash to EBITDA (as defined in the credit agreement) of 4.25x as of the end of each fiscal quarter. Our ability to meet these financial ratios can be affected by events beyond our control, and we cannot give assurance that we will be able to meet those ratios when required. For example, we experienced a decline in EBITDA during the economic downturn in 2008 to 2009, which negatively affected our minimum coverage ratio and maximum leverage ratio. Our coverage ratio of EBITDA to total interest expense was 12.34x for the year ended December 31, 2014 and our leverage ratio of total debt less available cash to EBITDA was 1.02x as of December 31, 2014. We continue to monitor our projected compliance with these financial ratios and other terms of our credit agreement.
A breach of any of these restrictive covenants or the inability to comply with the required financial ratios could result in a default under our debt instruments. If any such default occurs, the lenders under our credit agreement may elect to declare all outstanding borrowings, together with accrued interest and other fees, to be immediately due and payable. The lenders under our credit agreement also have the right in these circumstances to terminate any commitments they have to provide further borrowings. If we are unable to repay outstanding borrowings when due, the lenders under our credit agreement will have the right to proceed against the collateral granted to them to secure the debt, which collateral is described in the immediately following risk factor. If the debt under our credit agreement were to be accelerated, we cannot give assurance that this collateral would be sufficient to repay our debt. In addition, such a breach under our credit agreement could trigger a cross default or cross acceleration under our other debt instruments, including the notes under our indentures.
If we fail to meet our payment or other obligations under our credit agreement, the lenders under such credit agreement could foreclose on, and acquire control of, substantially all of our assets.
Our credit agreement is jointly and severally guaranteed by us and substantially all of our material domestic subsidiaries. Borrowings under our credit agreement are secured by a pledge of substantially all of the capital stock of the U.S. subsidiaries and 65% of the capital stock of certain non-U.S. subsidiaries, in each case, held by CBRE Services, Inc. and the U.S. guarantor subsidiaries. In addition, in connection with any amendment to our credit agreement, we may need to grant additional collateral to the lenders. If we are unable to repay outstanding borrowings when due, the lenders under our credit agreement will have the right to proceed against this pledged capital stock and take control of substantially all of our assets.
We have limited restrictions on the amount of additional recourse debt we are able to incur, which may intensify the risks associated with our leverage, including our ability to service our indebtedness.
Subject to the maximum amounts of indebtedness permitted by our credit agreement covenants, we are not restricted in the amount of additional recourse debt we are able to incur in connection with the financing of our development activities, and we may in the future incur such indebtedness in order to decrease the amount of equity we invest in these activities. Subject to certain covenants in our various bank credit agreements, we are also not restricted in the amount of additional recourse debt CBRE Capital Markets may incur in connection with
19
• entering into sale/leaseback transactions.
Table of Contents
funding loan originations for multifamily properties having prior purchase commitments by a government sponsored entity.
If we experience defaults by multiple clients or counterparties, it could adversely affect our business.
We could be adversely affected by the actions, deteriorating financial condition and results of operations of certain of our clients or counterparties if that led to losses or defaults by one or more of them, which in turn, could have a material adverse effect on our results of operations and financial condition.
Any of our clients may experience a downturn in their business that may weaken their results of operations and financial condition. As a result, a client may fail to make payments when due, become insolvent or declare bankruptcy. Any client bankruptcy or insolvency, or the failure of any client to make payments when due, could result in losses to our company. A client bankruptcy would delay or preclude full collection of amounts owed to us. Additionally, certain occupier outsourcing and property management client agreements require that we advance payroll and other vendor costs on behalf of clients. If such a client were to file bankruptcy or otherwise fail, we may not be able to obtain reimbursement for those costs or for the severance obligations we would incur as a result of the loss of the client.
The bankruptcy or insolvency of a significant counterparty (which may include co-brokers, lenders, insurance companies, hedging counterparties, service providers or other organizations with which we do business), or the failure of any significant counterparty to perform its contractual commitments, may result in disruption to our business or material losses to our company.
If the assets in our defined benefit pension plans are not sufficient to meet the plans’ obligations, we may be required to make cash contributions to it and our liquidity may be adversely affected.
Our subsidiaries based in the United Kingdom maintain two contributory defined benefit pension plans to provide retirement benefits to existing and former employees participating in the plans. With respect to these plans, our historical policy has been to contribute annually, an amount to fund pension cost as actuarially determined and as required by applicable laws and regulations. Our contributions to these plans are invested and, if these investments do not perform in the future as well as we expect, we will be required to provide additional funding to cover any shortfall. The underfunded status of our defined benefit pension plans included in pension liability in the accompanying consolidated balance sheets, which are incorporated herein by reference, was $92.9 million and $68.0 million at December 31, 2014 and 2013, respectively. If the assets in our defined benefit pension plans continue to be insufficient to meet the plans’ obligations, we may be required to make substantial cash contributions preventing the use of such cash for other purposes and adversely affecting our liquidity.
Failure to maintain and execute information technology strategies and ensure that our employees adapt to changes in technology could materially and adversely affect our ability to remain competitive in the market.
Our business relies heavily on information technology to deliver services that meet the needs of our clients. If we are unable to effectively execute our information technology strategies or adopt new technologies and processes relevant to our service platform, our ability to deliver high-quality services may be materially impaired. In addition, we make significant investments in new systems and tools to achieve competitive advantages and efficiencies. Implementation of such investments in information technology could exceed estimated budgets and we may experience challenges that prevent new strategies or technologies from being realized according to anticipated schedules. If we are unable to maintain current information technology and processes or encounter delays, or fail to exploit new technologies, then the execution of our business plans may be disrupted. Similarly, our employees require effective tools and techniques to perform functions integral to our business. Failure to successfully provide such tools and systems, or ensure that employees have properly adopted them, could materially and adversely impact our ability to achieve positive business outcomes.
20
Table of Contents
Failure to maintain the security of our information and technology networks, including personally identifiable and client information, intellectual property and proprietary business information could significantly adversely affect us.
Security breaches and other disruptions of our information and technology networks could compromise our information and intellectual property and expose us to liability, reputational harm and significant remediation costs, which could cause material harm to our business and financial results. In the ordinary course of our business, we collect and store sensitive data, including our proprietary business information and intellectual property, and that of our clients and personally identifiable information of our employees and contractors, in our data centers and on our networks. The secure processing, maintenance and transmission of this information are critical to our operations. Despite our security measures, our information technology and infrastructure may be vulnerable to attacks by third parties or breached due to employee error, malfeasance or other disruptions. A significant actual or potential theft, loss, corruption, exposure, fraudulent use or misuse of client, employee or other personally identifiable or proprietary business data, whether by third parties or as a result of employee malfeasance or otherwise, non-compliance with our contractual or other legal obligations regarding such data or intellectual property or a violation of our privacy and security policies with respect to such data could result in significant remediation and other costs, fines, litigation or regulatory actions against us. Such an event could additionally disrupt our operations and the services we provide to clients, damage our reputation, result in the loss of a competitive advantage, impact our ability to provide timely and accurate financial data and cause a loss of confidence in our services and financial reporting, which could adversely affect our business, revenues, competitive position and investor confidence. Additionally, we increasingly rely on third-party data storage providers, including cloud storage solution providers, resulting in less direct control over our data. Such third parties are also vulnerable to security breaches and compromised security systems, for which we may not be indemnified and which could materially adversely affect us and our reputation.
Interruption or failure of our information technology, communications systems or data services could impair our ability to provide our services effectively, which could damage our reputation and materially harm our operating results.
Our business requires the continued operation of information technology and communication systems and network infrastructure. Our ability to conduct our global business may be materially adversely affected by disruptions to these systems or infrastructure. Our information technology and communications systems are vulnerable to damage or disruption from fire, power loss, telecommunications failure, system malfunctions, computer viruses, cyber-attacks, natural disasters such as hurricanes, earthquakes and floods, acts of war or terrorism, employee errors or malfeasance, or other events which are beyond our control. In addition, the operation and maintenance of these systems and networks is in some cases dependent on third-party technologies, systems and service providers for which there is no certainty of uninterrupted availability. Any of these events could cause system interruption, delays and loss, corruption or exposure of critical data or intellectual property and may also disrupt our ability to provide services to or interact with our clients, and we may not be able to successfully implement contingency plans that depend on communication or travel. Furthermore, any such event could result in substantial recovery and remediation costs and liability to customers, business partners and other third parties. We have disaster recovery plans and backup systems to reduce the potentially adverse effect of such events, but our disaster recovery planning may not be sufficient and cannot account for all eventualities, and a catastrophic event that results in the destruction or disruption of any of our data centers or our critical business or information technology systems could severely affect our ability to conduct normal business operations, and as a result, our future operating results could be materially adversely affected.
The infrastructure disruptions we describe above may also disrupt our ability to manage real estate for clients or may adversely affect the value of real estate investments we make on behalf of clients. The buildings we manage for clients, which include some of the world’s largest office properties and retail centers, are used by numerous people daily. As a result, fires, earthquakes, floods, other natural disasters, defects and terrorist attacks can result in significant loss of life, and, to the extent we are held to have been negligent in connection with our management of the affected properties, we could incur significant financial liabilities and reputational harm.
21
Table of Contents
Our business relies heavily on the use of commercial real estate data. A portion of this data is purchased or licensed from third-party providers for which there is no certainty of uninterrupted availability. A disruption of our ability to provide data to our professionals and/or our clients or an inadvertent exposure of proprietary data could damage our reputation and competitive position, and our operating results could be adversely affected.
A significant portion of our operations are concentrated in California and our business could be harmed if there was an economic downturn in the California real estate markets.
During 2014, approximately 10% of our revenue was generated from transactions originating in California. As a result of the geographic concentration in California, economic downturns in the California commercial real estate market, particularly in the local economies in Los Angeles, Orange and San Diego counties, could harm our results of operations and disproportionately affect our business as compared to competitors who have less or different geographic concentrations.
We have numerous local and global competitors across all of our business lines and the geographies that we serve, and further industry consolidation could lead to significant future competition.
We compete across a variety of business disciplines within the commercial real estate services and investment industry, including commercial property and corporate facilities management, occupier and property/agency leasing, property sales, valuation, real estate investment management, commercial mortgage origination and servicing, capital markets (structured finance and debt) solutions, development services and proprietary research. Although we are the largest commercial real estate services firm in the world in terms of 2014 revenue, our relative competitive position varies significantly across geographies, property types and services and business lines. Depending on the geography, property type or service or business line, we face competition from other commercial real estate service providers and investment firms, including outsourcing companies that traditionally competed in limited portions of our facilities management business and have expanded their offerings, in-house corporate real estate departments, developers, institutional lenders, insurance companies, investment banking firms, investment managers and accounting and consulting firms. Some of these firms may have greater financial resources allocated to a particular geography, property type or service or business line than we have allocated that geography, property type, service or business line. In addition, future changes in laws could lead to the entry of other new competitors, such as financial institutions. Although many of our existing competitors are local or regional firms that are smaller than we are, some of these competitors are larger on a local or regional basis. We are further subject to competition from large national and multi-national firms that have similar service and investment competencies to ours, and it is possible that further industry consolidation could lead to much larger and more formidable competitors globally or in the particular geographies, property types, service or business lines that we serve. There is no assurance that we will be able to compete effectively, to maintain current fee levels or margins, or maintain or increase our market share.
Our goodwill and other intangible assets could become further impaired, which may require us to take significant non-cash charges against earnings.
Under current accounting guidelines, we must assess, at least annually and potentially more frequently, whether the value of our goodwill and other intangible assets has been impaired. Any impairment of goodwill or other intangible assets as a result of such analysis would result in a non-cash charge against earnings, and such charge could materially adversely affect our reported results of operations, stockholders’ equity and our stock price. For example, during the year ended December 31, 2013, we recorded a non-amortizable intangible asset impairment of $98.1 million in our Global Investment Management segment. This non-cash write-off was related to a decrease in value of our open-end funds, primarily in Europe. A significant and sustained decline in our future cash flows, a significant adverse change in the economic environment, slower growth rates or if our stock price falls below our net book value per share for a sustained period, could result in the need to perform additional impairment analysis in future periods. If we were to conclude that a future write-down of goodwill or other intangible assets is necessary, then we would record such additional charges, which could materially adversely affect our results of operations.
22
Table of Contents
We operate in many jurisdictions with complex and varied tax regimes. Changes in tax rules or the outcome of tax assessments and audits could adversely affect our results.
We operate in many jurisdictions with complex and varied tax regimes, and are subject to different forms of taxation resulting in a variable effective tax rate. In addition, from time to time we engage in transactions across different tax jurisdictions. Due to the different tax laws in the many jurisdictions where we operate, we are often required to make subjective determinations. The tax authorities in the various jurisdictions where we carry on business may not agree with the determinations that are made by us with respect to the application of tax law. Such disagreements could result in disputes and, ultimately, in the payment of additional funds to the government authorities in the jurisdictions where we carry on business, which could have an adverse effect on our results of operations. In addition, changes in tax rules or the outcome of tax assessments and audits could have an adverse effect on our results in any particular quarter.
Our estimate of tax related assets, liabilities, recoveries and expenses incorporates assumptions. These assumptions include, but are not limited to, the tax laws in various jurisdictions, the effect of tax treaties between jurisdictions, taxable income projections, and the benefits of various restructuring plans. To the extent that such assumptions differ from actual results, we may have to record additional income tax expenses and liabilities.
We are subject to the possibility of loss contingencies arising out of tax claims, assessments related to uncertain tax positions and provisions for specifically identified income tax exposures. There are currently tax audits ongoing in certain of the jurisdictions in which we operate. There can be no assurance that we will be successful in resolving potential tax claims that arise from these audits. Although we have recorded provisions on the basis of the best current understanding, we could be required to book additional provisions in future periods for amounts that cannot be assessed at this stage. Our failure to do so and/or the need to increase our provisions for such claims could have an adverse effect on our financial position.
We are subject to substantial litigation risks and may face significant liabilities and/or damage to our professional reputation as a result of litigation allegations and negative publicity.
As a licensed real estate broker, our licensed employees and we are subject to regulatory due diligence, disclosure and standard-of-care obligations. Failure to fulfill these obligations could subject us or our employees to litigation from parties who purchased, sold or leased properties that we or they brokered or managed. We could become subject to claims by participants in real estate sales, as well as building owners and companies for whom we provide management services, alleging that we did not fulfill our regulatory and fiduciary obligations.
In addition, in our property management business, we hire and supervise third-party contractors to provide construction services for our managed properties. While our role is limited to that of an agent for the owner, we may be subject to claims for construction defects or other similar actions.
The advice and services we render in our financial and valuation advisory businesses, the investment decisions we make in our Global Investment Management business and the activities of our investment banking and investment management professionals for or on behalf of our clients may subject them and us to the risk of third-party litigation. Such litigation may arise from client or investor dissatisfaction with the performance of our programs, differences between actual values and appraised values, and a variety of other litigation claims, including allegations that we improperly exercised judgment, discretion, control or influence over client investments or that we breached fiduciary duties to clients. For example, in our valuation and appraisal business, if market dynamics lead to a reduction in the market value of properties we have previously appraised, we may be subject to a higher risk of claims, including conflicts of interest claims, based on the circumstances of valuations previously issued. Our valuation and appraisal services involve transactions where the value of the transaction is much greater than the fees we generate. As a result, the consequences of errors that lead to damages might be disproportionately large in relation to the fees generated in the event our contractual protections or our insurance coverage are inadequate to protect us fully.
23
Table of Contents
To the extent investors in our programs suffer losses resulting from fraud, gross negligence, willful misconduct or other similar misconduct, investors may have remedies against us, our investment programs or funds or our employees under federal securities laws and applicable state laws. Moreover, we are exposed to risks of litigation or investigation by investors and regulators relating to allegations of our having engaged in transactions involving conflicts of interest that were not properly addressed.
We maintain commercial insurance in amounts we believe are appropriate to mitigate litigation risk. But, in the event of a substantial loss, our commercial insurance coverage and/or self-insurance reserve levels might not be sufficient to pay the full damages, the scope of available coverage may not cover certain types of claims, or such insurance may not continue to be available to us on acceptable terms. Further, the value of otherwise valid claims we hold under insurance policies could become uncollectible in the event of the covering insurance companies’ insolvency. Any of these events could negatively affect our business, financial condition or results of operations.
We depend on our business relationships and our reputation for integrity and high-caliber professional services to attract and retain clients across our overall business, as well as investors for our Global Investment Management business. As a result, allegations by private litigants or regulators of conflicts of interest or improper conduct by us, whether the ultimate outcome is favorable or unfavorable to us, as well as negative publicity and press speculation about us or our investment activities, whether or not valid, may harm our reputation and damage our business prospects both in our Global Investment Management business and our other businesses. In addition, if any lawsuits were brought against us and resulted in a finding of substantial legal liability, it could materially, adversely affect our business, financial condition or results of operations or cause significant reputational harm to us, which could materially impact our business.
A failure to appropriately deal with actual or perceived conflicts of interest could adversely affect our businesses.
Our company has a global platform with different business lines and a broad client base and is therefore subject to numerous potential, actual or perceived conflicts of interests in the provision of services to our existing and potential clients. For example, conflicts may arise from our position as broker to both owners and tenants in commercial real estate lease transactions. We have adopted various policies, controls and procedures to address or limit actual or perceived conflicts, but these policies and procedures may not be adequate and may not be adhered to by our employees. Appropriately dealing with conflicts of interest is complex and difficult and our reputation could be damaged and cause us to lose existing clients or fail to gain new clients if we fail, or appear to fail, to identify, disclose and manage potential conflicts of interest, which could have an adverse effect on our business, financial condition and results of operations. In addition, it is possible that in some jurisdictions regulations could be changed to limit our ability to act for parties where conflicts exist even with informed consent, which could limit our market share in those markets. There can be no assurance that conflicts of interest will not arise in the future that could cause material harm to us.
If we fail to maintain and protect our intellectual property, or infringe the intellectual property rights of third parties, our business could be harmed and we could incur financial penalties.
Our business depends, in part, on our ability to identify and protect proprietary information and other intellectual property (such as our service marks, client lists and information, business methods and research). Existing laws, or the application of those laws, of some countries in which we operate may offer only limited protections for our intellectual property rights. We rely on a combination of trade secrets, confidentiality policies, non-disclosure and other contractual arrangements, and on copyright, trademark and other intellectual property laws to protect our intellectual property rights. Our inability to detect unauthorized use or take appropriate or timely steps to enforce our rights may have an adverse effect on our business.
24
Table of Contents
We cannot be sure that the intellectual property that we may use in the course of operating our business or the services we offer to clients does not infringe on the rights of third parties, and we may have infringement claims asserted against us or against our clients. These claims may harm our reputation, cost us money and prevent us from offering some services.
Confidential intellectual property is increasingly stored or carried on mobile devices, such as laptop computers, which makes inadvertent disclosure more of a risk in the event the mobile devices are lost or stolen and the information has not been adequately safeguarded or encrypted.
Our businesses, financial condition, results of operations and prospects could be adversely affected by new laws or regulations or by changes in existing laws or regulations or the application thereof. If we fail to comply with laws and regulations applicable to us, including in our role as a real estate broker, registered investment advisor, mortgage broker, property/facility manager or developer, we may incur significant financial penalties.
We are subject to numerous federal, state, local and non-U.S. laws and regulations specific to the services we perform in our business. Brokerage of real estate sales and leasing transactions and the provision of property management and valuation services require us and our employees to maintain applicable licenses in each U.S. state and certain non-U.S. jurisdictions in which we perform these services. If we and our employees fail to maintain our licenses or conduct these activities without a license, or violate any of the regulations covering our licenses, we may be required to pay fines (including treble damages in certain states) or return commissions received or have our licenses suspended or revoked. A number of our services, including the services provided by our indirect wholly-owned subsidiaries, CBRE Capital Markets and CBRE Global Investors, are subject to regulation by the SEC, FINRA or other self-regulatory organizations and state securities regulators and compliance failures or regulatory action could adversely affect our business. We could be subject to disciplinary or other actions in the future due to claimed noncompliance with these regulations, which could have a material adverse effect on our operations and profitability.
We are also subject to laws of broader applicability, such as tax, securities, environmental and employment laws, including the Fair Labor Standards Act, occupational health and safety regulations and state wage-and-hour laws. Failure to comply with these requirements could result in the imposition of significant fines by governmental authorities, awards of damages to private litigants and significant amounts paid in legal fees or settlements of these matters.
As the size and scope of our business has increased significantly during the past several years, both the difficulty of ensuring compliance with numerous licensing and other regulatory requirements and the possible loss resulting from non-compliance have increased. The global economic crisis has resulted in increased government and legislative activities, including the introduction of new legislation and changes to rules and regulations, which we expect will continue into the future. New or revised legislation or regulations applicable to our business, both within and outside of the United States, as well as changes in administrations or enforcement priorities may have an adverse effect on our business, including increasing the costs of regulatory compliance or preventing us from providing certain types of services in certain jurisdictions or in connection with certain transactions or clients. We are unable to predict how any of these new laws, rules, regulations and proposals will be implemented or in what form, or whether any additional or similar changes to laws or regulations, including the interpretation or implementation thereof, will occur in the future. Any such action could affect us in substantial and unpredictable ways and could have an adverse effect on our businesses, financial condition, results of operations and prospects.
We may be subject to environmental liability as a result of our role as a property or facility manager or developer of real estate.
Various laws and regulations impose liability on real property owners or operators for the cost of investigating, cleaning up or removing contamination caused by hazardous or toxic substances at a property. In
25
Table of Contents
our role as a property or facility manager or developer, we could be held liable as an operator for such costs. This liability may be imposed without regard to the legality of the original actions and without regard to whether we knew of, or were responsible for, the presence of the hazardous or toxic substances. If we fail to disclose environmental issues, we could also be liable to a buyer or lessee of a property. If we incur any such liability, our business could suffer significantly as it could be difficult for us to develop or sell such properties, or borrow funds using such properties as collateral. In the event of a substantial liability, our insurance coverage might be insufficient to pay the full damages, or the scope of available coverage may not cover certain of these liabilities. Additionally, liabilities incurred to comply with more stringent future environmental requirements could adversely affect any or all of our lines of business. Cautionary Note on Forward-Looking Statements
This Annual Report on Form 10-K includes forward-looking statements within the meaning of Section 27A of the Securities Act of 1933, as amended, and Section 21E of the Securities Exchange Act of 1934, as amended. The words “anticipate,” “believe,” “could,” “should,” “propose,” “continue,” “estimate,” “expect,” “intend,” “may,” “plan,” “predict,” “project,” “will” and similar terms and phrases are used in this Annual Report on Form 10-K to identify forward-looking statements. Except for historical information contained herein, the matters addressed in this Annual Report on Form 10-K are forward-looking statements. These statements relate to analyses and other information based on forecasts of future results and estimates of amounts not yet determinable. These statements also relate to our future prospects, developments and business strategies.
These forward-looking statements are made based on our management’s expectations and beliefs concerning future events affecting us and are subject to uncertainties and factors relating to our operations and business environment, all of which are difficult to predict and many of which are beyond our control. These uncertainties and factors could cause our actual results to differ materially from those matters expressed in or implied by these forward-looking statements.
The following factors are among those, but are not only those, that may cause actual results to differ materially from the forward-looking statements:
• disruptions in general economic and business conditions, particularly in geographies where our business may be concentrated;
• volatility and disruption of the securities, capital and credit markets, interest rate increases, the cost and availability of capital for
investment in real estate, clients’ willingness to make real estate or long-term contractual commitments and other factors affecting the value of real estate assets, inside and outside the United States;
• increases in unemployment and general slowdowns in commercial activity;
• trends in pricing and risk assumption for commercial real estate services;
• the effect of significant movements in average cap rates across different property types;
• a reduction by companies in their reliance on outsourcing for their commercial real estate needs, which would affect our revenues and
operating performance;
• client actions to restrain project spending and reduce outsourced staffing levels;
• declines in lending activity of Government Sponsored Enterprises, regulatory oversight of such activity and our mortgage servicing
revenue from the U.S. commercial real estate mortgage market;
• our ability to diversify our revenue model to offset cyclical economic trends in the commercial real estate industry;
• our ability to attract new user and investor clients;
26
• our ability to retain major clients and renew related contracts;
Table of Contents
• our ability to leverage our global services platform to maximize and sustain long-term cash flow;
• our ability to maintain EBITDA margins that enable us to continue investing in our platform and client service offerings;
• our ability to control costs relative to revenue growth;
• variations in historically customary seasonal patterns that cause our business not to perform as expected;
• changes in domestic and international law and regulatory environments (including relating to anti-corruption, anti-money laundering,
trade sanctions, currency controls and other trade control laws), particularly in Russia, Eastern Europe and the Middle East, due to the rising level of political instability in those regions;
• foreign currency fluctuations;
• our ability to identify, acquire and integrate synergistic and accretive businesses;
• costs and potential future capital requirements relating to businesses we may acquire;
• integration challenges arising out of companies we may acquire;
• our ability to retain and incentivize producers;
• our and our employees’ ability to execute on, and adapt to, information technology strategies and trends;
• the ability of our Global Investment Management business to maintain and grow assets under management and achieve desired
investment returns for our investors, and any potential related litigation, liabilities or reputational harm possible if we fail to do so;
• our ability to manage fluctuations in net earnings and cash flow, which could result from poor performance in our investment programs,
including our participation as a principal in real estate investments;
• our leverage and our ability to perform under our credit facilities;
• our exposure to liabilities in connection with real estate advisory and property management activities and our ability to procure
sufficient insurance coverage on acceptable terms;
• liabilities under guarantees, or for construction defects, that we incur in our Development Services business;
• the ability of CBRE Capital Markets to periodically amend, or replace, on satisfactory terms, the agreements for its warehouse lines of
credit;
• our ability to compete globally, or in specific geographic markets or business segments that are material to us;
• changes in tax laws in the United States or in other jurisdictions in which our business may be concentrated that reduce or eliminate
deductions or other tax benefits we receive;
• our ability to maintain our effective tax rate at or below current levels;
• our ability to comply with laws and regulations related to our global operations, including real estate licensure, labor and employment
laws and regulations, as well as the anti-corruption laws and trade sanctions of the U.S. and other countries;
• the effect of implementation of new accounting rules and standards; and
27
• the other factors described elsewhere in this Annual Report on Form 10-K, included under the headings “Risk Factors” , “Management’s Discussion and Analysis of Financial Condition and Results of Operations – Critical Accounting Policies” and “Quantitative and Qualitative Disclosures About Market Risk” or as described in the other documents and reports we file with the Securities and Exchange Commission.
Table of Contents
Forward-looking statements speak only as of the date the statements are made. You should not put undue reliance on any forward-looking statements. We assume no obligation to update forward-looking statements to reflect actual results, changes in assumptions or changes in other factors affecting forward-looking information, except to the extent required by applicable securities laws. If we do update one or more forward-looking statements, no inference should be drawn that we will make additional updates with respect to those or other forward-looking statements. Additional information concerning these and other risks and uncertainties is contained in our other periodic filings with the Securities and Exchange Commission. Item 1B. Unresolved Staff Comments
Not applicable. Item 2. Properties
We occupied the following offices, excluding affiliates, as of December 31, 2014:
Some of our offices that contain employees of our Global Investment Management or our Development Services segments also contain
employees of our other business segments. Often, the employees of these segments occupy separate suites in the same building in order to operate the businesses independently with standalone offices. We have provided above office totals by geographic region and not listed all of our Global Investment Management and Development Services offices to avoid double counting.
In general, these leased offices are fully utilized. The most significant terms of the leasing arrangements for our offices are the length of the lease and the rent. Our leases have terms varying in duration. The rent payable under our office leases varies significantly from location to location as a result of differences in prevailing commercial real estate rates in different geographic locations. Our management believes that no single office lease is material to our business, results of operations or financial condition. In addition, we believe there is adequate alternative office space available at acceptable rental rates to meet our needs, although adverse movements in rental rates in some markets may negatively affect our profits in those markets when we enter into new leases.
We do not own any of these offices, which is consistent with our strategy to lease instead of own. Item 3. Legal Proceedings
Location Sales Offices Corporate Offices Total Americas 167 2 169 Europe, Middle East and Africa (EMEA) 122 1 123 Asia Pacific 79 1 80
Total 368 4 372
We are a party to a number of pending or threatened lawsuits arising out of, or incident to, our ordinary course of business. Our management believes that any losses in excess of the amounts accrued arising from such lawsuits are unlikely to be significant, but that litigation is inherently uncertain and there is the potential for a material adverse effect on our financial statements if one or more matters are resolved in a particular period in an amount materially in excess of that anticipated by management. Item 4. Mine Safety Disclosures
Not applicable.
28
Table of Contents
PART II Item 5. Market for Registrant’s Common Equity, Related Stockholder Matters and Issuer Purchases of Equity Securities Stock Price Information
Our Class A common stock has traded on the New York Stock Exchange under the symbol “CBG” since June 10, 2004. The applicable high and low prices of our Class A common stock for the last two fiscal years, as reported by the New York Stock Exchange, are set forth below for the periods indicated.
The closing share price for our Class A common stock on December 31, 2014, as reported by the New York Stock Exchange, was $34.25.
As of February 13, 2015, there were 258 stockholders of record of our Class A common stock. Dividend Policy
Price Range Fiscal Year 2014 High Low Quarter ending March 31, 2014 $ 28.44 $ 25.47 Quarter ending June 30, 2014 $ 32.06 $ 25.84 Quarter ending September 30, 2014 $ 33.77 $ 29.51 Quarter ending December 31, 2014 $ 35.37 $ 27.49
Fiscal Year 2013 Quarter ending March 31, 2013 $ 25.45 $ 19.78 Quarter ending June 30, 2013 $ 25.69 $ 20.59 Quarter ending September 30, 2013 $ 24.50 $ 21.24 Quarter ending December 31, 2013 $ 26.58 $ 21.86
We have not declared or paid any cash dividends on any class of our common stock since our inception on February 20, 2001, and we do not anticipate declaring or paying any cash dividends on our common stock for the foreseeable future. We currently intend to retain any future earnings to finance future growth and possibly reduce debt. Any future determination to pay cash dividends will be at the discretion of our board of directors and will depend on our financial condition, results of operations, capital requirements and other factors that the board of directors deems relevant. In addition, our ability to declare and pay cash dividends is restricted by the credit agreement governing our revolving credit facility and senior secured term loan facilities. Recent Sales of Unregistered Securities
None. Issuer Purchases of Equity Securities
We may repurchase shares awarded to grant recipients under our various equity compensation plans to satisfy minimum statutory federal, state and local tax withholding obligations arising from the vesting of their equity awards. The following table presents information with respect to the repurchased shares relating thereto during each calendar month within the fiscal quarter ended December 31, 2014:
29
Period
Total Number of Shares Purchased
Average Price Paid per Share
October 1, 2014 – October 31, 2014 993 $ 29.18 November 1, 2014 – November 30, 2014 December 1, 2014 – December 31, 2014
— —
$ $
— —
Total 993 $ 29.18
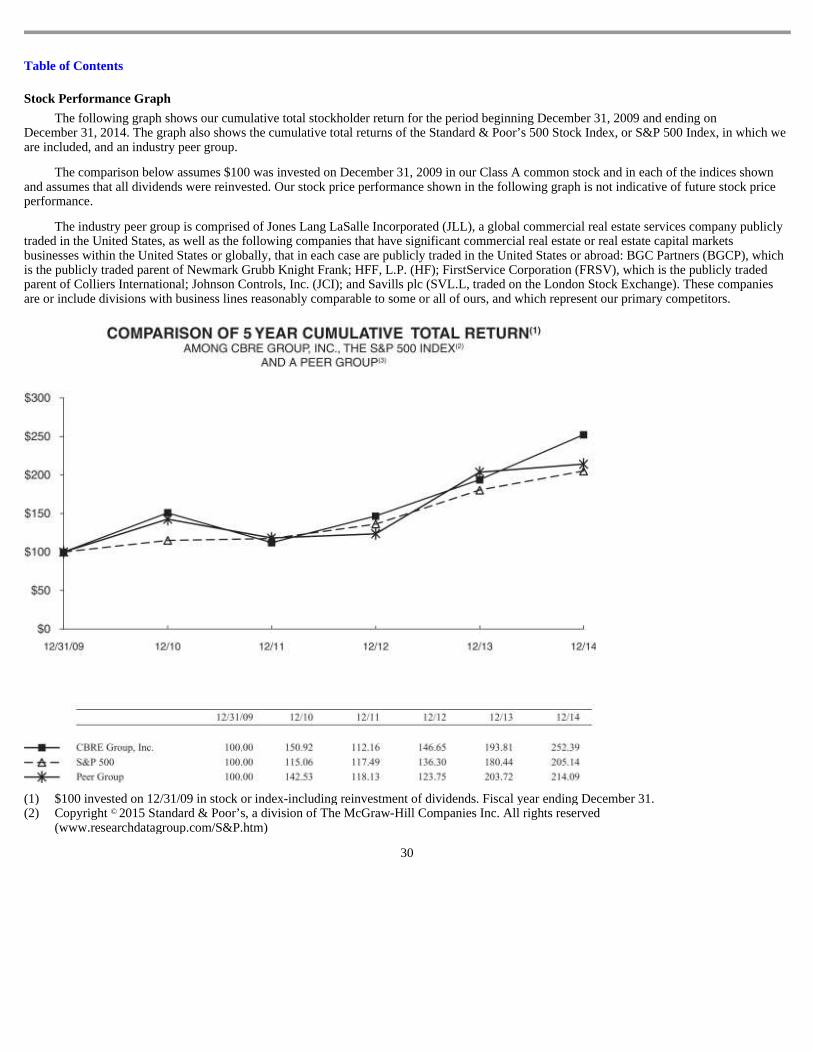
Table of Contents
Stock Performance Graph
The following graph shows our cumulative total stockholder return for the period beginning December 31, 2009 and ending on December 31, 2014. The graph also shows the cumulative total returns of the Standard & Poor’s 500 Stock Index, or S&P 500 Index, in which we are included, and an industry peer group.
The comparison below assumes $100 was invested on December 31, 2009 in our Class A common stock and in each of the indices shown and assumes that all dividends were reinvested. Our stock price performance shown in the following graph is not indicative of future stock price performance.
The industry peer group is comprised of Jones Lang LaSalle Incorporated (JLL), a global commercial real estate services company publicly traded in the United States, as well as the following companies that have significant commercial real estate or real estate capital markets businesses within the United States or globally, that in each case are publicly traded in the United States or abroad: BGC Partners (BGCP), which is the publicly traded parent of Newmark Grubb Knight Frank; HFF, L.P. (HF); FirstService Corporation (FRSV), which is the publicly traded parent of Colliers International; Johnson Controls, Inc. (JCI); and Savills plc (SVL.L, traded on the London Stock Exchange). These companies are or include divisions with business lines reasonably comparable to some or all of ours, and which represent our primary competitors.
30
(1) $100 invested on 12/31/09 in stock or index-including reinvestment of dividends. Fiscal year ending December 31. (2) Copyright 2015 Standard & Poor’s, a division of The McGraw-Hill Companies Inc. All rights reserved
(www.researchdatagroup.com/S&P.htm) ©
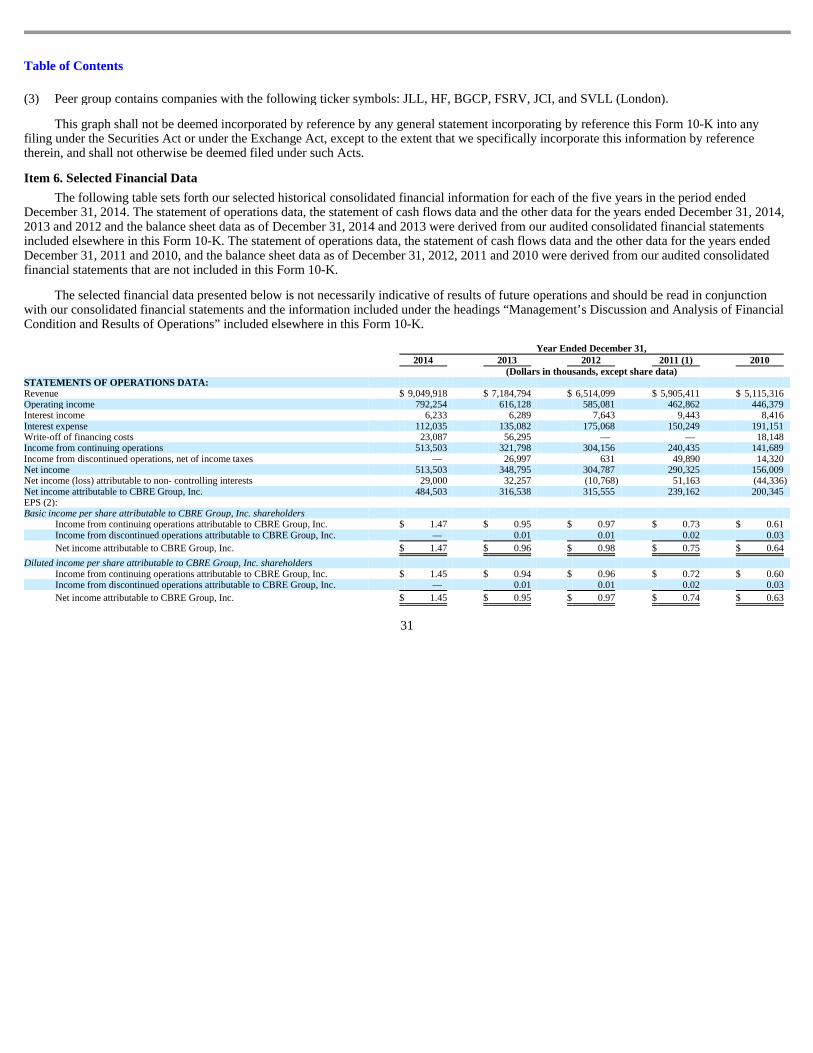
Table of Contents
This graph shall not be deemed incorporated by reference by any general statement incorporating by reference this Form 10-K into any
filing under the Securities Act or under the Exchange Act, except to the extent that we specifically incorporate this information by reference therein, and shall not otherwise be deemed filed under such Acts. Item 6. Selected Financial Data
(3) Peer group contains companies with the following ticker symbols: JLL, HF, BGCP, FSRV, JCI, and SVLL (London).
The following table sets forth our selected historical consolidated financial information for each of the five years in the period ended December 31, 2014. The statement of operations data, the statement of cash flows data and the other data for the years ended December 31, 2014, 2013 and 2012 and the balance sheet data as of December 31, 2014 and 2013 were derived from our audited consolidated financial statements included elsewhere in this Form 10-K. The statement of operations data, the statement of cash flows data and the other data for the years ended December 31, 2011 and 2010, and the balance sheet data as of December 31, 2012, 2011 and 2010 were derived from our audited consolidated financial statements that are not included in this Form 10-K.
The selected financial data presented below is not necessarily indicative of results of future operations and should be read in conjunction with our consolidated financial statements and the information included under the headings “Management’s Discussion and Analysis of Financial Condition and Results of Operations” included elsewhere in this Form 10-K.
31
Year Ended December 31, 2014 2013 2012 2011 (1) 2010 (Dollars in thousands, except share data) STATEMENTS OF OPERATIONS DATA: Revenue $ 9,049,918 $ 7,184,794 $ 6,514,099 $ 5,905,411 $ 5,115,316 Operating income 792,254 616,128 585,081 462,862 446,379 Interest income 6,233 6,289 7,643 9,443 8,416 Interest expense 112,035 135,082 175,068 150,249 191,151 Write-off of financing costs 23,087 56,295 — — 18,148 Income from continuing operations 513,503 321,798 304,156 240,435 141,689 Income from discontinued operations, net of income taxes — 26,997 631 49,890 14,320 Net income 513,503 348,795 304,787 290,325 156,009 Net income (loss) attributable to non- controlling interests 29,000 32,257 (10,768 ) 51,163 (44,336 ) Net income attributable to CBRE Group, Inc. 484,503 316,538 315,555 239,162 200,345 EPS (2): Basic income per share attributable to CBRE Group, Inc. shareholders
Income from continuing operations attributable to CBRE Group, Inc. $ 1.47 $ 0.95 $ 0.97 $ 0.73 $ 0.61 Income from discontinued operations attributable to CBRE Group, Inc. — 0.01 0.01 0.02 0.03
Net income attributable to CBRE Group, Inc. $ 1.47 $ 0.96 $ 0.98 $ 0.75 $ 0.64
Diluted income per share attributable to CBRE Group, Inc. shareholders Income from continuing operations attributable to CBRE Group, Inc. $ 1.45 $ 0.94 $ 0.96 $ 0.72 $ 0.60 Income from discontinued operations attributable to CBRE Group, Inc. — 0.01 0.01 0.02 0.03
Net income attributable to CBRE Group, Inc. $ 1.45 $ 0.95 $ 0.97 $ 0.74 $ 0.63
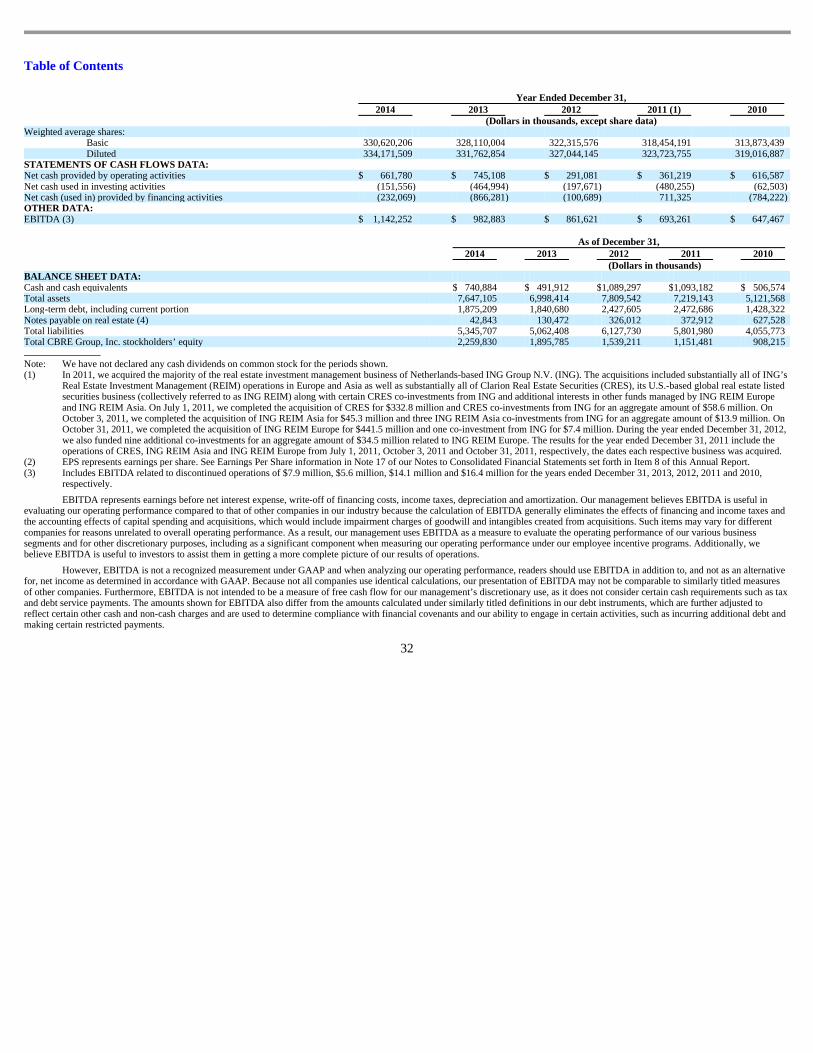
Table of Contents
Year Ended December 31, 2014 2013 2012 2011 (1) 2010 (Dollars in thousands, except share data) Weighted average shares:
Basic 330,620,206 328,110,004 322,315,576 318,454,191 313,873,439 Diluted 334,171,509 331,762,854 327,044,145 323,723,755 319,016,887
STATEMENTS OF CASH FLOWS DATA: Net cash provided by operating activities $ 661,780 $ 745,108 $ 291,081 $ 361,219 $ 616,587 Net cash used in investing activities (151,556 ) (464,994 ) (197,671 ) (480,255 ) (62,503 ) Net cash (used in) provided by financing activities (232,069 ) (866,281 ) (100,689 ) 711,325 (784,222 ) OTHER DATA: EBITDA (3) $ 1,142,252 $ 982,883 $ 861,621 $ 693,261 $ 647,467
As of December 31, 2014 2013 2012 2011 2010 (Dollars in thousands) BALANCE SHEET DATA: Cash and cash equivalents $ 740,884 $ 491,912 $ 1,089,297 $ 1,093,182 $ 506,574 Total assets 7,647,105 6,998,414 7,809,542 7,219,143 5,121,568 Long-term debt, including current portion 1,875,209 1,840,680 2,427,605 2,472,686 1,428,322 Notes payable on real estate (4) 42,843 130,472 326,012 372,912 627,528 Total liabilities 5,345,707 5,062,408 6,127,730 5,801,980 4,055,773 Total CBRE Group, Inc. stockholders’ equity 2,259,830 1,895,785 1,539,211 1,151,481 908,215 Note: We have not declared any cash dividends on common stock for the periods shown. (1) In 2011, we acquired the majority of the real estate investment management business of Netherlands-based ING Group N.V. (ING). The acquisitions included substantially all of ING’s
Real Estate Investment Management (REIM) operations in Europe and Asia as well as substantially all of Clarion Real Estate Securities (CRES), its U.S.-based global real estate listed securities business (collectively referred to as ING REIM) along with certain CRES co-investments from ING and additional interests in other funds managed by ING REIM Europe and ING REIM Asia. On July 1, 2011, we completed the acquisition of CRES for $332.8 million and CRES co-investments from ING for an aggregate amount of $58.6 million. On October 3, 2011, we completed the acquisition of ING REIM Asia for $45.3 million and three ING REIM Asia co-investments from ING for an aggregate amount of $13.9 million. On October 31, 2011, we completed the acquisition of ING REIM Europe for $441.5 million and one co-investment from ING for $7.4 million. During the year ended December 31, 2012, we also funded nine additional co-investments for an aggregate amount of $34.5 million related to ING REIM Europe. The results for the year ended December 31, 2011 include the operations of CRES, ING REIM Asia and ING REIM Europe from July 1, 2011, October 3, 2011 and October 31, 2011, respectively, the dates each respective business was acquired.
(2) EPS represents earnings per share. See Earnings Per Share information in Note 17 of our Notes to Consolidated Financial Statements set forth in Item 8 of this Annual Report. (3) Includes EBITDA related to discontinued operations of $7.9 million, $5.6 million, $14.1 million and $16.4 million for the years ended December 31, 2013, 2012, 2011 and 2010,
respectively.
EBITDA represents earnings before net interest expense, write-off of financing costs, income taxes, depreciation and amortization. Our management believes EBITDA is useful in evaluating our operating performance compared to that of other companies in our industry because the calculation of EBITDA generally eliminates the effects of financing and income taxes and the accounting effects of capital spending and acquisitions, which would include impairment charges of goodwill and intangibles created from acquisitions. Such items may vary for different companies for reasons unrelated to overall operating performance. As a result, our management uses EBITDA as a measure to evaluate the operating performance of our various business segments and for other discretionary purposes, including as a significant component when measuring our operating performance under our employee incentive programs. Additionally, we believe EBITDA is useful to investors to assist them in getting a more complete picture of our results of operations. However, EBITDA is not a recognized measurement under GAAP and when analyzing our operating performance, readers should use EBITDA in addition to, and not as an alternative for, net income as determined in accordance with GAAP. Because not all companies use identical calculations, our presentation of EBITDA may not be comparable to similarly titled measures of other companies. Furthermore, EBITDA is not intended to be a measure of free cash flow for our management’s discretionary use, as it does not consider certain cash requirements such as tax and debt service payments. The amounts shown for EBITDA also differ from the amounts calculated under similarly titled definitions in our debt instruments, which are further adjusted to reflect certain other cash and non-cash charges and are used to determine compliance with financial covenants and our ability to engage in certain activities, such as incurring additional debt and making certain restricted payments.
32
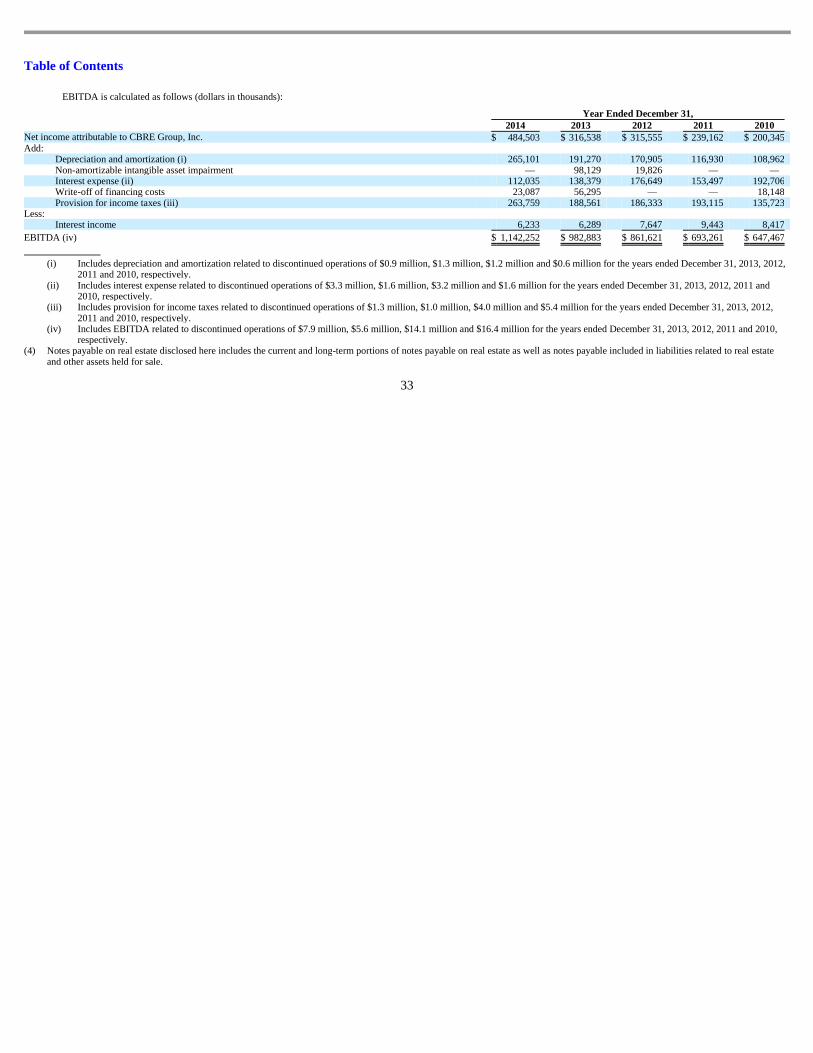
Table of Contents
EBITDA is calculated as follows (dollars in thousands):
33
Year Ended December 31, 2014 2013 2012 2011 2010 Net income attributable to CBRE Group, Inc. $ 484,503 $ 316,538 $ 315,555 $ 239,162 $ 200,345 Add:
Depreciation and amortization (i) 265,101 191,270 170,905 116,930 108,962 Non-amortizable intangible asset impairment — 98,129 19,826 — — Interest expense (ii) 112,035 138,379 176,649 153,497 192,706 Write-off of financing costs 23,087 56,295 — — 18,148 Provision for income taxes (iii) 263,759 188,561 186,333 193,115 135,723
Less: Interest income 6,233 6,289 7,647 9,443 8,417
EBITDA (iv) $ 1,142,252 $ 982,883 $ 861,621 $ 693,261 $ 647,467
(i) Includes depreciation and amortization related to discontinued operations of $0.9 million, $1.3 million, $1.2 million and $0.6 million for the years ended December 31, 2013, 2012,
2011 and 2010, respectively.
(ii) Includes interest expense related to discontinued operations of $3.3 million, $1.6 million, $3.2 million and $1.6 million for the years ended December 31, 2013, 2012, 2011 and 2010, respectively.
(iii) Includes provision for income taxes related to discontinued operations of $1.3 million, $1.0 million, $4.0 million and $5.4 million for the years ended December 31, 2013, 2012, 2011 and 2010, respectively.
(iv) Includes EBITDA related to discontinued operations of $7.9 million, $5.6 million, $14.1 million and $16.4 million for the years ended December 31, 2013, 2012, 2011 and 2010, respectively.
(4) Notes payable on real estate disclosed here includes the current and long-term portions of notes payable on real estate as well as notes payable included in liabilities related to real estate and other assets held for sale.
Table of Contents
Item 7. Management’s Discussion and Analysis of Financial Condition and Results of Operations Overview
We are the world’s largest commercial real estate services and investment firm, based on 2014 revenue, with leading full-service operations in major metropolitan areas throughout the world. We offer a full range of services to occupiers, owners, lenders and investors in office, retail, industrial, multifamily and other types of commercial real estate. As of December 31, 2014, excluding independent affiliates, we operated in over 370 offices worldwide, with more than 52,000 employees providing commercial real estate services under the “CBRE” brand name, investment management services under the “CBRE Global Investors” brand name and development services under the “Trammell Crow” brand name. Our business is focused on several competencies, including commercial property and corporate facilities management, tenant/occupier and property/agency leasing, capital markets solutions (property sales, commercial mortgage origination and servicing, and debt/structured finance) real estate investment management, valuation, development services and proprietary research. We generate revenue from management fees on a contractual and per-project basis, and from commissions on transactions. In 2014, we were the highest ranked commercial real estate services company among the Fortune Most Admired Companies, and we ranked seventh among all companies on the Barron’s 500, which evaluates companies on growth and financial performance. We have been the only commercial real estate services and investment firm included in the S&P 500 since 2006, and in the Fortune 500 since 2008. Additionally, the International Association of Outsourcing Professionals (IAOP) has included us among the top 100 global outsourcing companies across all industries for nine consecutive years. In 2014, the IAOP ranked us as a top three service provider among all outsourcing companies globally and as the highest ranked commercial real estate services company for the fifth consecutive year.
When you read our financial statements and the information included in this section, you should consider that we have experienced, and continue to experience, several material trends and uncertainties that have affected our financial condition and results of operations that make it challenging to predict our future performance based on our historical results. We believe that the following material trends and uncertainties are crucial to an understanding of the variability in our historical earnings and cash flows and the potential for continued variability in the future:
Macroeconomic Conditions
Economic trends and government policies affect global and regional commercial real estate markets as well as our operations directly. These include: overall economic activity and employment growth, interest rate levels, the cost and availability of credit and the impact of tax and regulatory policies. Periods of economic weakness or recession, significantly rising interest rates, fiscal uncertainty, declining employment levels, decreasing demand for commercial real estate, falling real estate values, disruption to the global capital or credit markets, or the public perception that any of these events may occur, will negatively affect the performance of some of our business lines.
Compensation is our largest expense and the sales and leasing professionals in our advisory services business generally are paid on a commission and bonus basis that correlates with their revenue production. As a result, the negative effect of difficult market conditions on our operating margins is partially mitigated by the inherent variability of our compensation cost structure. In addition, when negative economic conditions are particularly severe, we have moved decisively to lower operating expenses to improve financial performance, and then have restored certain expenses as economic conditions improved. Nevertheless, adverse global and regional economic trends could be significant risks to the performance of our operations and our financial condition.
Commercial real estate markets have recovered over the past five years in step with the steady improvement in global economic activity, most particularly in the United States. Since 2010, increased U.S. property sales activity has been sustained by gradually improving occupancy market conditions, including lower vacancy rates
34
Table of Contents
and higher rents, as well as the availability of low-cost credit and increased capital flows into commercial real estate. U.S. leasing markets have also recovered, with falling vacancies, higher rents and increased transaction activity.
European economies began to emerge from recession in 2013, with most countries there returning to positive, albeit very modest, economic growth. Reflecting the macro environment, property sales have increased significantly over the past two years, with higher volumes occurring across much of Europe in 2014. Leasing markets outside of the United Kingdom have been slower to recover, but did show some improvement in 2014.
In Asia Pacific, leasing activity picked up in 2014, but strong construction activity limits future rent growth. Investment markets have generally been stronger than leasing markets, and while investment levels have varied across the region, some countries like Australia and Japan have been notably strong.
Real estate investment management and property development activity has generally improved since 2010 as the real estate credit markets recovered and capital flows into commercial real estate have been strong.
The performance of our global sales, leasing, investment management and development services operations depends on sustained economic growth, strong job creation, stable, healthy global credit markets and continued improved business and investor sentiment.
Effects of Acquisitions
Our management historically has made significant use of strategic acquisitions to add new service competencies, to increase our scale within existing competencies and to expand our presence in various geographic regions around the world. In 2013, we fortified our real estate outsourcing platform in Europe within our EMEA segment with the acquisition of London-based Norland Managed Services Ltd (Norland) for approximately $474 million, which figure includes approximately $40 million deferred purchase price paid in 2014 (the Norland Acquisition). Norland is a premier provider of building technical engineering services that enables us to self-perform these services in Europe and adds to our expertise in the highly specialized critical environments market.
Strategic in-fill acquisitions have also played a key role in expanding our geographic coverage and broadening and strengthening our service offerings. The companies we acquired have generally been quality regional or specialty firms that complement our existing platform within a region, or affiliates in which, in some cases, we held a small equity interest. During 2014, we completed 11 in-fill acquisitions, including our former affiliate companies in Thailand, Greenville, South Carolina, Louisville, Kentucky and Oklahoma City and Tulsa, Oklahoma, a commercial real estate service provider in Chicago, a New York-based valuation and advisory business, a technical real estate consulting firm based in Germany, a consulting and advisory firm in the U.S. hotels sector, a shopping center management, leasing and consulting company in Switzerland and project management companies in Germany and Australia. During 2013, we completed ten in-fill acquisitions, including a firm serving the London prime residential real estate market, a regional commercial real estate services firm based in San Francisco, a retail real estate services firm in the U.S. Mid-Atlantic region, a facility consulting and project advisory firm based in Virginia serving the healthcare industry, and two property management specialist firms, one in the Czech Republic and Slovakia and one in Belgium. In January 2015, we acquired a Texas-based commercial real estate firm specializing in retail services.
Although our management believes that strategic acquisitions can significantly decrease the cost, time and commitment of management resources necessary to attain a meaningful competitive position within targeted markets or to expand our presence within our current markets, in general, most acquisitions will initially have an adverse impact on our operating and net income, both as a result of transaction-related expenditures, which include severance, lease termination, transaction and deferred financing costs, among others, and the charges and costs of integrating the acquired business and its financial and accounting systems into our own. In addition, our
35
Table of Contents
acquisition structures often include deferred and/or contingent purchase price payments in future periods that are subject to the passage of time or achievement of certain performance metrics and other conditions. As of December 31, 2014, we have accrued for deferred consideration totaling $125.2 million, which was included in accounts payable and accrued expenses and in other long-term liabilities in the accompanying consolidated balance sheets set forth in Item 8 of this Annual Report.
International Operations
As we increase our international operations through either acquisitions or organic growth, fluctuations in the value of the U.S. dollar relative to the other currencies in which we may generate earnings could adversely affect our business, financial condition and operating results. Our Global Investment Management business has a significant amount of Euro-denominated assets under management, or AUM, as well as associated revenue and earnings in Europe, which has recently seen more pronounced (and adverse) movement in the value of the Euro against the U.S. dollar. Fluctuations in foreign currency exchange rates have resulted and may continue to result in corresponding fluctuations in our AUM, revenue and earnings.
Our management team generally seeks to mitigate our exposure by balancing assets and liabilities that are denominated in the same currency. Fluctuations in foreign currency exchange rates affect reported amounts of our total assets and liabilities, which are reflected in our financial statements as translated into U.S. dollars for each financial reporting period at the exchange rate in effect on the respective balance sheet dates, and our total revenue and expenses, which are reflected in our financial statements as translated into U.S. dollars for each financial reporting period at the monthly average exchange rate. During the year ended December 31, 2014, foreign currency translation had a $53.5 million negative impact on our total revenue and a $49.5 million positive impact on our total cost of services and operating, administrative and other expenses. In addition, from time to time we enter into foreign currency exchange contracts to attempt to mitigate some of our exposure to exchange rate changes related to particular transactions and to hedge risks associated with the translation of certain foreign currencies into U.S. dollars.
During the year ended December 31, 2014, approximately 44% of our business was transacted in local currencies of foreign countries, the majority of which includes the Australian dollar, Brazilian real, British pound sterling, Canadian dollar, Chinese yuan, Euro, Indian rupee, Japanese yen and Singapore dollar. Although we operate globally, we report our results in U.S. dollars. As a result, the strengthening or weakening of the U.S. dollar may positively or negatively impact our reported results. The following table sets forth our revenue derived from our most significant currencies (dollars in thousands):
36
Year Ended December 31,
2014 2013 2012 United States dollar $ 5,027,479 55.6 % $ 4,359,277 60.7 % $ 3,932,204 60.4 % British pound sterling 1,632,127 18.0 % 634,375 8.8 % 547,339 8.4 % Euro 773,753 8.5 % 677,258 9.4 % 598,621 9.2 % Australian dollar 359,660 4.0 % 322,792 4.5 % 302,463 4.6 % Canadian dollar 319,670 3.5 % 324,900 4.5 % 324,304 5.0 % Japanese yen 168,574 1.9 % 151,050 2.1 % 157,007 2.4 % Indian rupee 135,139 1.5 % 118,944 1.7 % 119,327 1.8 % Chinese yuan 101,790 1.1 % 102,643 1.4 % 92,215 1.4 % Singapore dollar 89,343 1.0 % 89,509 1.3 % 82,069 1.3 % Brazilian real 77,305 0.9 % 91,895 1.3 % 88,149 1.4 % Other currencies 365,078 4.0 % 312,151 4.3 % 270,401 4.1 %
Total revenue $ 9,049,918 100.0 % $ 7,184,794 100.0 % $ 6,514,099 100.0 %
Table of Contents
We estimate that had the British pound sterling-to-U.S. dollar exchange rates been 10% higher during the year ended December 31, 2014, the net impact would have been an increase in pre-tax income of $9.3 million. This hypothetical calculation estimates the impact of translating results into U.S. dollars and does not include an estimate of the impact a 10% change in the U.S. dollar against other currencies would have had on our foreign operations.
Due to the constantly changing currency exposures to which we are subject and the volatility of currency exchange rates, we cannot predict the effect of exchange rate fluctuations upon future operating results. In addition, fluctuations in currencies relative to the U.S. dollar may make it more difficult to perform period-to-period comparisons of our reported results of operations. Our international operations also are subject to, among other things, political instability and changing regulatory environments, which may adversely affect our future financial condition and results of operations. Our management routinely monitors these risks and related costs and evaluates the appropriate amount of resources to allocate towards business activities in foreign countries where such risks and costs are particularly significant.
Leverage
We are leveraged and have debt service obligations. As of December 31, 2014, our total debt – excluding our notes payable on real estate (which are generally nonrecourse to us) and warehouse lines of credit (which are recourse only to our wholly-owned subsidiary, CBRE Capital Markets, Inc., or CBRE Capital Markets, and are secured by our related warehouse receivables) – was approximately $1.9 billion.
Our level of indebtedness and the operating and financial restrictions in our debt agreements place some constraints on the operation of our business. Although our management believes that long-term indebtedness has been an important lever in the development of our business, including facilitating the acquisition of the majority of the real estate investment management business of Netherlands-based ING Group N.V. (the REIM Acquisitions) and the Norland Acquisition, the cash flow necessary to service this debt is not available for other general corporate purposes, which may limit our flexibility in planning for, or reacting to, changes in our business and in the commercial real estate services industry. Our management seeks to mitigate this exposure both through the refinancing of debt when available on attractive terms and through selective repayment and retirement of indebtedness.
For example, during 2014, we completed three financing transactions, and in January 2015 we entered into an amended and restated credit agreement. The 2014 transactions included the issuance in September 2014 and December 2014 of $300.0 million and $125.0 million, respectively, in aggregate principal amount of 5.25% senior notes due March 15, 2025 and the redemption in October 2014 of all of the then outstanding 6.625% senior notes (aggregate principal amount of $350.0 million). During the year ended December 31, 2014, in connection with these financing activities, we incurred approximately $4.7 million of financing costs. In addition, we expensed $5.7 million of previously-deferred financing costs as well as a $17.4 million early extinguishment premium. Critical Accounting Policies
Our consolidated financial statements have been prepared in accordance with accounting principles generally accepted in the United States, which require management to make estimates and assumptions that affect reported amounts. The estimates and assumptions are based on historical experience and on other factors that management believes to be reasonable. Actual results may differ from those estimates. We believe that the following critical accounting policies represent the areas where more significant judgments and estimates are used in the preparation of our consolidated financial statements:
Revenue Recognition
In order for us to recognize revenue, there are four basic criteria that must be met:
37
• existence of persuasive evidence that an arrangement exists;
Table of Contents
• delivery has occurred or services have been rendered;
• the seller’s price to the buyer is fixed and determinable; and
Our revenue recognition policies are consistent with these criteria. The judgments involved in revenue recognition include understanding the
complex terms of agreements and determining the appropriate time to recognize revenue for each transaction based on such terms. Each transaction is evaluated to determine: (i) at what point in time revenue is earned, (ii) whether contingencies exist that impact the timing of recognition of revenue and (iii) how and when such contingencies will be resolved. The timing of revenue recognition could vary if different judgments were made. Our revenues subject to the most judgment are brokerage commission revenue and incentive-based management and development fees.
We record commission revenue on real estate sales generally upon close of escrow or transfer of title, except when future contingencies exist. Real estate commissions on leases are generally recorded in revenue when all obligations under the commission agreement are satisfied. Terms and conditions of a commission agreement may include, but are not limited to, execution of a signed lease agreement and future contingencies including tenant occupancy, payment of a deposit or payment of a first month’s rent (or a combination thereof). As some of these conditions are outside of our control and are often not clearly defined, judgment must be exercised in determining when such required events have occurred in order to recognize revenue.
A typical commission agreement provides that we earn a portion of a lease commission upon the execution of the lease agreement by the tenant and landlord, with the remaining portion(s) of the lease commission earned at a later date, usually upon tenant occupancy or payment of rent. The existence of any significant future contingencies results in the delay of recognition of corresponding revenue until such contingencies are satisfied. For example, if we do not earn all or a portion of the lease commission until the tenant pays its first month’s rent, and the lease agreement provides the tenant with a free rent period, we delay revenue recognition until rent is paid by the tenant.
Property and facilities management revenues are generally based upon percentages of the revenue or base rent generated by the entities managed or the square footage managed. These fees are recognized when earned under the provisions of the related management agreements.
Investment management fees are based predominantly upon a percentage of the equity deployed on behalf of our limited partners. Fees related to our indirect investment management programs are based upon a percentage of the fair value of those investments. These fees are recognized when earned under the provisions of the related investment management agreements. Our Global Investment Management segment also earns performance-based incentive fees with regard to many of its investments. Such revenue is recognized at the end of the measurement periods when the conditions of the applicable incentive fee arrangements have been satisfied and following the expiration of any potential claw back provision. With many of these investments, our Global Investment Management professionals have participation interests in such incentive fees, which are commonly referred to as carried interest. This carried interest expense is generally accrued for based upon the probability of such performance-based incentive fees being earned over the related vesting period. In addition, our Global Investment Management segment also earns success-based transaction fees with regard to buying or selling properties on behalf of certain funds and separate accounts. Such revenue is recognized at the completion of a successful transaction and is not subject to any claw back provision.
We earn development and incentive development fees in our Development Services segment. Development fees are generally based on a percentage of a defined cost measure and are recognized at the lower of the amount billed or the amount determined on a straight-line basis over the development period. Incentive development fees are recognized when quantitative criteria have been met (such as specified leasing or budget targets) or, for those incentive fees based on qualitative criteria, upon approval of the fee by our clients. Certain incentive
38
• collectability is reasonably assured.
Table of Contents
development fees allow us to share in the fair value of the developed real estate asset above cost. This sharing creates additional revenue potential to us with no exposure to loss other than opportunity cost. Our incentive development fee revenue is recognized to the extent that future performance contingencies have been resolved. The unique nature and complexity of each incentive fee requires us to use varying levels of judgment in determining the timing of revenue recognition.
In establishing the appropriate provisions for trade receivables, we make assumptions with respect to future collectability. Our assumptions are based on an assessment of a customer’s credit quality as well as subjective factors and trends, including the aging of receivables balances. In addition to these assessments, in general, outstanding trade accounts receivable amounts that are more than 180 days overdue are evaluated for collectability and fully provided for if deemed uncollectible. Historically, our credit losses have generally been insignificant. However, estimating losses requires significant judgment, and conditions may change or new information may become known after any periodic evaluation. As a result, actual credit losses may differ from our estimates.
Principles of Consolidation
The accompanying consolidated financial statements include our accounts and those of our majority-owned subsidiaries, as well as variable interest entities, or VIEs, in which we are the primary beneficiary and other subsidiaries we control. The equity attributable to non-controlling interests in subsidiaries is shown separately in our consolidated balance sheets included elsewhere in this report. All significant intercompany accounts and transactions have been eliminated in consolidation.
Variable Interest Entities
As required by the “ Consolidations ” Topic of the Financial Accounting Standards Board, or FASB, Accounting Standards Codification, or ASC, or Topic 810, we consolidate all VIEs in which we are the entity’s primary beneficiary. A reporting entity is determined to be the primary beneficiary if it holds a controlling financial interest in the VIE. Determining which reporting entity, if any, has a controlling financial interest in a VIE is primarily a qualitative approach focused on identifying which reporting entity has both (1) the power to direct the activities of a VIE that most significantly impact such entity’s economic performance and (2) the obligation to absorb losses or the right to receive benefits from such entity that could potentially be significant to such entity. The entity which satisfies these criteria is deemed to be the primary beneficiary of the VIE.
We determine if an entity is a VIE based on several factors, including whether the entity’s total equity investment at risk upon inception is sufficient to finance the entity’s activities without additional subordinated financial support. We make judgments regarding the sufficiency of the equity at risk based first on a qualitative analysis, then a quantitative analysis, if necessary.
We analyze any investments in VIEs to determine if we are the primary beneficiary. We consider a variety of factors in identifying the entity that holds the power to direct matters that most significantly impact the VIE’s economic performance including, but not limited to, the ability to direct financing, leasing, construction and other operating decisions and activities. In addition, we consider the rights of other investors to participate in those decisions, to replace the manager and to sell or liquidate the entity.
We also have several co-investments in real estate investment funds which qualify for a deferral of the qualitative approach for analyzing potential VIEs. We continue to analyze these investments under the former quantitative method incorporating various estimates, including estimated future cash flows, asset hold periods and discount rates, as well as estimates of the probabilities of various scenarios occurring. If the entity is a VIE, we then determine whether we consolidate the entity as the primary beneficiary. This determination of whether we are the primary beneficiary includes any impact of an “upside economic interest” in the form of a “promote” that we may have. A promote is an interest built into the distribution structure of the entity based on the entity’s achievement of certain return hurdles.
39
Table of Contents
We consolidate any VIE of which we are the primary beneficiary (see Note 3 of the Notes to Consolidated Financial Statements set forth in Item 8 of this Annual Report) and disclose significant VIEs of which we are not the primary beneficiary, if any, as well as disclose our maximum exposure to loss related to VIEs that are not consolidated. We determine whether an entity is a VIE and, if so, whether it should be consolidated by utilizing judgments and estimates that are inherently subjective.
Limited Partnerships, Limited Liability Companies and Other Subsidiaries
If an entity is not a VIE, our determination of the appropriate accounting method with respect to our investments in limited partnerships, limited liability companies and other subsidiaries is based on voting control. For our general partner interests, we are presumed to control (and therefore consolidate) the entity, unless the other limited partners have substantive rights that overcome this presumption of control. These substantive rights allow the limited partners to remove the general partner with or without cause or to participate in significant decisions made in the ordinary course of the entity’s business. We account for our non-controlling general partner investments in these entities under the equity method. This treatment also applies to our managing member interests in limited liability companies.
Other Investments
Our investments in unconsolidated subsidiaries in which we have the ability to exercise significant influence over operating and financial policies, but do not control, or entities which are variable interest entities in which we are not the primary beneficiary are accounted for under the equity method. Accordingly, our share of the earnings from these equity-method basis companies is included in consolidated net income. All other investments held on a long-term basis are valued at cost less any impairment in value.
Our determination of the appropriate accounting treatment for an investment in a subsidiary requires judgment of several factors, including the size and nature of our ownership interest and the other owners’ substantive rights to make decisions for the entity. If we were to make different judgments or conclusions as to the level of our control or influence, it could result in a different accounting treatment. Accounting for an investment as either consolidated or using the equity method generally would have no impact on our net income or stockholders’ equity in any accounting period, but a different treatment would impact individual income statement and balance sheet items, as consolidation would effectively “gross up” our income statement and balance sheet. If our evaluation of an investment accounted for using the cost method was different, it could result in our being required to account for an investment by consolidation or by the equity method. Under the cost method, the investor only records its share of the underlying entity’s earnings to the extent that it receives dividends from the investee; when the dividends received by the investor exceed the investor’s share of the investee’s earnings subsequent to the date of the investor’s investment, the investor records a reduction in the basis of its investment. Under the cost method, the investor does not record its share of losses of the investee. Conversely, under either consolidation or equity method accounting, the investor effectively records its share of the underlying entity’s net income or loss, or its guarantees of the underlying entity’s debt.
Impairment Evaluation
Under either the equity or cost method, impairment losses are recognized upon evidence of other-than-temporary losses of value. When testing for impairment on investments that are not actively traded on a public market, we generally use a discounted cash flow approach to estimate the fair value of our investments and/or look to comparable activities in the marketplace. Management judgment is required in developing the assumptions for the discounted cash flow approach. These assumptions include net asset values, internal rates of return, discount and capitalization rates, interest rates and financing terms, rental rates, timing of leasing activity, estimates of lease terms and related concessions, etc. When determining if impairment is other-than-temporary, we also look to the length of time and the extent to which fair value has been less than cost as well as the financial condition and near-term prospects of each investment.
40
Table of Contents
Goodwill and Other Intangible Assets
Our acquisitions require the application of purchase accounting, which results in tangible and identifiable intangible assets and liabilities of the acquired entity being recorded at fair value. The difference between the purchase price and the fair value of net assets acquired is recorded as goodwill. In determining the fair values of assets and liabilities acquired in a business combination, we use a variety of valuation methods including present value, depreciated replacement cost, market values (where available) and selling prices less costs to dispose. We are responsible for determining the valuation of assets and liabilities and for the allocation of purchase price to assets acquired and liabilities assumed.
Assumptions must often be made in determining fair values, particularly where observable market values do not exist. Assumptions may include discount rates, growth rates, cost of capital, royalty rates, tax rates and remaining useful lives. These assumptions can have a significant impact on the value of identifiable assets and accordingly can impact the value of goodwill recorded. Different assumptions could result in different values being attributed to assets and liabilities. Since these values impact the amount of annual depreciation and amortization expense, different assumptions could also impact our statement of operations and could impact the results of future impairment reviews.
The majority of our goodwill balance has resulted from our acquisition of CBRE Services, Inc, or CBRE, in 2001 (the 2001 Acquisition), our acquisition of Insignia Financial Group, Inc., or Insignia, in 2003 (the Insignia Acquisition), the Trammell Crow Company Acquisition in 2006, the REIM Acquisitions in 2011 and the Norland Acquisition in 2013. Other intangible assets that have indefinite estimated useful lives and are not being amortized include certain management contracts identified in the REIM Acquisitions, a trademark, which was separately identified as a result of the 2001 Acquisition, and a trade name separately identified as a result of the REIM Acquisitions. The remaining other intangible assets primarily include customer relationships, management contracts and loan servicing rights, which are all being amortized over estimated useful lives ranging up to 20 years.
We are required to test goodwill and other intangible assets deemed to have indefinite useful lives for impairment annually or more often if circumstances or events indicate a change in the impairment status. The goodwill impairment analysis is a two-step process. The first step used to identify potential impairment involves comparing each reporting unit’s estimated fair value to its carrying value, including goodwill. We use a discounted cash flow approach to estimate the fair value of our reporting units. Management judgment is required in developing the assumptions for the discounted cash flow model. These assumptions include revenue growth rates, profit margin percentages, discount rates, etc. If the estimated fair value of a reporting unit exceeds its carrying value, goodwill is considered to not be impaired. If the carrying value exceeds estimated fair value, there is an indication of potential impairment and the second step is performed to measure the amount of impairment. The second step of the process involves the calculation of an implied fair value of goodwill for each reporting unit for which step one indicated impairment. The implied fair value of goodwill is determined similar to how goodwill is calculated in a business combination, by measuring the excess of the estimated fair value of the reporting unit as calculated in step one, over the estimated fair values of the individual assets, liabilities and identifiable intangibles as if the reporting unit was being acquired in a business combination. Due to the many variables inherent in the estimation of a business’s fair value and the relative size of our goodwill, if different assumptions and estimates were used, it could have an adverse effect on our impairment analysis.
Our annual assessment of goodwill and other intangible assets deemed to have indefinite lives has historically been completed as of the beginning of the fourth quarter of each year. When we performed our required annual goodwill impairment review as of October 1, 2014, 2013 and 2012, we determined that no impairment existed as the estimated fair value of our reporting units was in excess of their carrying value.
During the year ended December 31, 2013, we recorded a non-amortizable intangible asset impairment of $98.1 million in our Global Investment Management segment. This non-cash write-off was related to a decrease
41
Table of Contents
in value of our open-end funds, primarily in Europe. During the year ended December 31, 2012, we recorded a non-amortizable intangible asset impairment of $19.8 million in our EMEA segment related to the discontinuation of the use of a trade name in the United Kingdom. See Note 4 of the Notes to Consolidated Financial Statements set forth in Item 8 of this Annual Report.
Income Taxes
Income taxes are accounted for under the asset and liability method in accordance with the “ Accounting for Income Taxes ,” Topic of the FASB ASC, or Topic 740. Deferred tax assets and liabilities are determined based on temporary differences between the financial reporting and tax basis of assets and liabilities and operating loss and tax credit carry forwards. Deferred tax assets and liabilities are measured by applying enacted tax rates and laws and are released in the years in which the temporary differences are expected to be recovered or settled. The effect on deferred tax assets and liabilities of a change in tax rates is recognized in income in the period that includes the enactment date. Valuation allowances are provided against deferred tax assets when it is more likely than not that some portion or all of the deferred tax asset will not be realized.
Accounting for tax positions requires judgments, including estimating reserves for potential uncertainties. We also assess our ability to utilize tax attributes, including those in the form of carryforwards, for which the benefits have already been reflected in the financial statements. We do not record valuation allowances for deferred tax assets that we believe will be realized in future periods. While we believe the resulting tax balances as of December 31, 2014 and 2013 are appropriately accounted for in accordance with Topic 740, as applicable, the ultimate outcome of such matters could result in favorable or unfavorable adjustments to our consolidated financial statements and such adjustments could be material. See Note 15 of the Notes to Consolidated Financial Statements set forth in Item 8 of this Annual Report for further information regarding income taxes.
Our foreign subsidiaries have accumulated $1.3 billion of undistributed earnings for which we have not recorded a deferred tax liability. Although tax liabilities might result from dividends being paid out of these earnings, or as a result of a sale or liquidation of non-U.S. subsidiaries, these earnings are permanently reinvested outside of the United States and we do not have any plans to repatriate them or to sell or liquidate any of our non-U.S. subsidiaries. To the extent that we are able to repatriate earnings in a tax efficient manner, or in the event of a change in our capital situation or investment strategy in which such funds become needed for funding our U.S. operations, we would be required to accrue and pay U.S. taxes to repatriate these funds, net of foreign tax credits. Determining our tax liability upon repatriation is not practicable. Cash and cash equivalents owned by non-U.S. subsidiaries totaled $287.4 million at December 31, 2014. In 2012 and 2013, we repatriated $58.0 million and $196.2 million, respectively. In anticipation of these repatriations, tax benefits of $28.8 million were recorded in 2012. Additional tax benefits associated with the release of valuation allowances of $14.5 million and $4.9 million were recorded in 2013 and 2014, respectively.
42
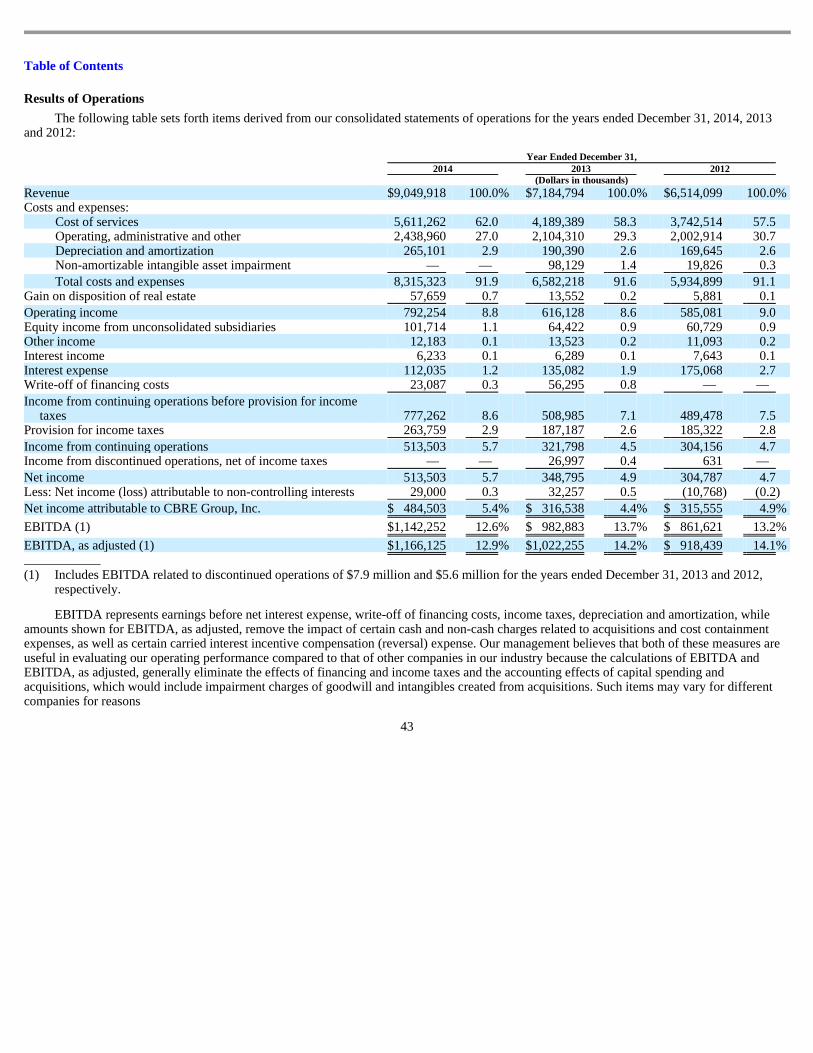
Table of Contents
Results of Operations
The following table sets forth items derived from our consolidated statements of operations for the years ended December 31, 2014, 2013 and 2012:
EBITDA represents earnings before net interest expense, write-off of financing costs, income taxes, depreciation and amortization, while
amounts shown for EBITDA, as adjusted, remove the impact of certain cash and non-cash charges related to acquisitions and cost containment expenses, as well as certain carried interest incentive compensation (reversal) expense. Our management believes that both of these measures are useful in evaluating our operating performance compared to that of other companies in our industry because the calculations of EBITDA and EBITDA, as adjusted, generally eliminate the effects of financing and income taxes and the accounting effects of capital spending and acquisitions, which would include impairment charges of goodwill and intangibles created from acquisitions. Such items may vary for different companies for reasons
43
Year Ended December 31, 2014 2013 2012 (Dollars in thousands) Revenue $ 9,049,918 100.0 % $ 7,184,794 100.0 % $ 6,514,099 100.0 % Costs and expenses:
Cost of services 5,611,262 62.0 4,189,389 58.3 3,742,514 57.5 Operating, administrative and other 2,438,960 27.0 2,104,310 29.3 2,002,914 30.7 Depreciation and amortization 265,101 2.9 190,390 2.6 169,645 2.6 Non-amortizable intangible asset impairment — — 98,129 1.4 19,826 0.3
Total costs and expenses 8,315,323 91.9 6,582,218 91.6 5,934,899 91.1 Gain on disposition of real estate 57,659 0.7 13,552 0.2 5,881 0.1
Operating income 792,254 8.8 616,128 8.6 585,081 9.0 Equity income from unconsolidated subsidiaries 101,714 1.1 64,422 0.9 60,729 0.9 Other income 12,183 0.1 13,523 0.2 11,093 0.2 Interest income 6,233 0.1 6,289 0.1 7,643 0.1 Interest expense 112,035 1.2 135,082 1.9 175,068 2.7 Write-off of financing costs 23,087 0.3 56,295 0.8 — —
Income from continuing operations before provision for income taxes 777,262 8.6 508,985 7.1 489,478 7.5
Provision for income taxes 263,759 2.9 187,187 2.6 185,322 2.8
Income from continuing operations 513,503 5.7 321,798 4.5 304,156 4.7 Income from discontinued operations, net of income taxes — — 26,997 0.4 631 —
Net income 513,503 5.7 348,795 4.9 304,787 4.7 Less: Net income (loss) attributable to non-controlling interests 29,000 0.3 32,257 0.5 (10,768 ) (0.2 )
Net income attributable to CBRE Group, Inc. $ 484,503 5.4 % $ 316,538 4.4 % $ 315,555 4.9 %
EBITDA (1) $ 1,142,252 12.6 % $ 982,883 13.7 % $ 861,621 13.2 %
EBITDA, as adjusted (1) $ 1,166,125 12.9 % $ 1,022,255 14.2 % $ 918,439 14.1 %
(1) Includes EBITDA related to discontinued operations of $7.9 million and $5.6 million for the years ended December 31, 2013 and 2012,
respectively.
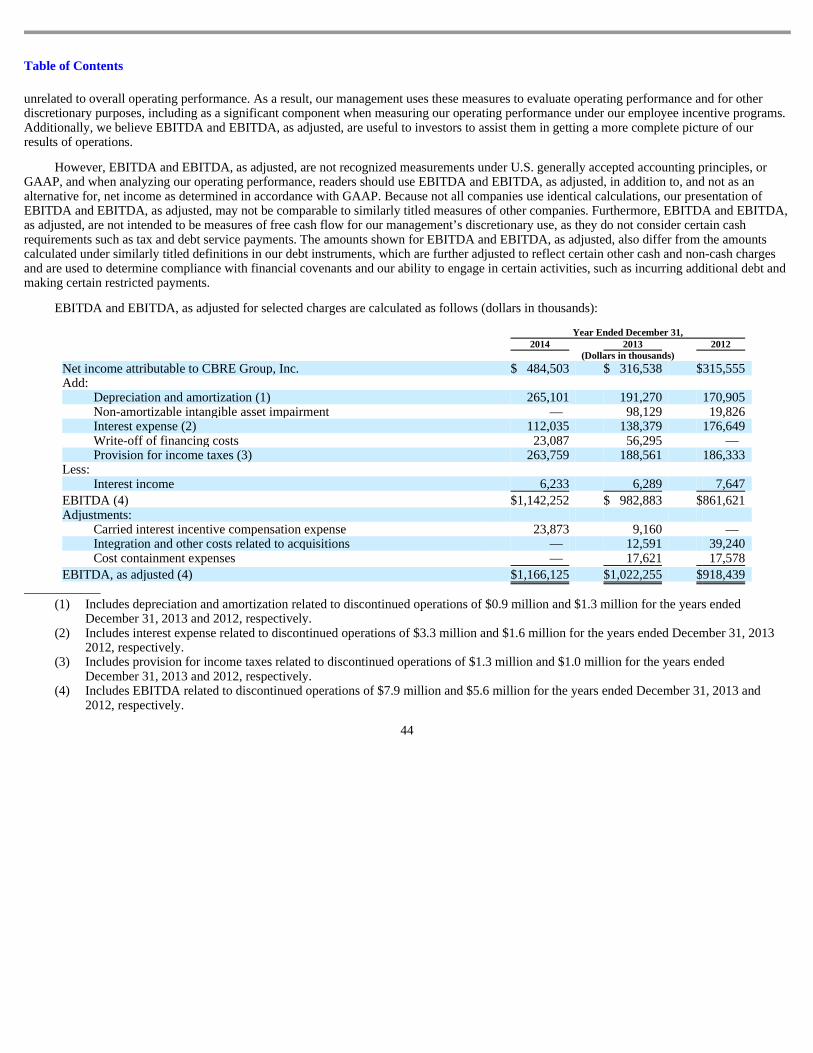
Table of Contents
unrelated to overall operating performance. As a result, our management uses these measures to evaluate operating performance and for other discretionary purposes, including as a significant component when measuring our operating performance under our employee incentive programs. Additionally, we believe EBITDA and EBITDA, as adjusted, are useful to investors to assist them in getting a more complete picture of our results of operations.
However, EBITDA and EBITDA, as adjusted, are not recognized measurements under U.S. generally accepted accounting principles, or GAAP, and when analyzing our operating performance, readers should use EBITDA and EBITDA, as adjusted, in addition to, and not as an alternative for, net income as determined in accordance with GAAP. Because not all companies use identical calculations, our presentation of EBITDA and EBITDA, as adjusted, may not be comparable to similarly titled measures of other companies. Furthermore, EBITDA and EBITDA, as adjusted, are not intended to be measures of free cash flow for our management’s discretionary use, as they do not consider certain cash requirements such as tax and debt service payments. The amounts shown for EBITDA and EBITDA, as adjusted, also differ from the amounts calculated under similarly titled definitions in our debt instruments, which are further adjusted to reflect certain other cash and non-cash charges and are used to determine compliance with financial covenants and our ability to engage in certain activities, such as incurring additional debt and making certain restricted payments.
EBITDA and EBITDA, as adjusted for selected charges are calculated as follows (dollars in thousands):
44
Year Ended December 31, 2014 2013 2012 (Dollars in thousands)
Net income attributable to CBRE Group, Inc. $ 484,503 $ 316,538 $ 315,555 Add:
Depreciation and amortization (1) 265,101 191,270 170,905 Non-amortizable intangible asset impairment — 98,129 19,826 Interest expense (2) 112,035 138,379 176,649 Write-off of financing costs 23,087 56,295 — Provision for income taxes (3) 263,759 188,561 186,333
Less: Interest income 6,233 6,289 7,647
EBITDA (4) $ 1,142,252 $ 982,883 $ 861,621 Adjustments:
Carried interest incentive compensation expense 23,873 9,160 — Integration and other costs related to acquisitions — 12,591 39,240 Cost containment expenses — 17,621 17,578
EBITDA, as adjusted (4) $ 1,166,125 $ 1,022,255 $ 918,439
(1) Includes depreciation and amortization related to discontinued operations of $0.9 million and $1.3 million for the years ended
December 31, 2013 and 2012, respectively.
(2) Includes interest expense related to discontinued operations of $3.3 million and $1.6 million for the years ended December 31, 2013
2012, respectively.
(3) Includes provision for income taxes related to discontinued operations of $1.3 million and $1.0 million for the years ended
December 31, 2013 and 2012, respectively.
(4) Includes EBITDA related to discontinued operations of $7.9 million and $5.6 million for the years ended December 31, 2013 and
2012, respectively.
Table of Contents
Year Ended December 31, 2014 Compared to Year Ended December 31, 2013
We reported consolidated net income of $484.5 million for the year ended December 31, 2014 on revenue of $9.0 billion as compared to consolidated net income of $316.5 million on revenue of $7.2 billion for the year ended December 31, 2013.
Our revenue on a consolidated basis for the year ended December 31, 2014 increased by $1.9 billion, or 26.0%, as compared to the year ended December 31, 2013. This increase was in part due to contributions from the Norland Acquisition. However, the revenue increase also reflects strong organic growth, fueled by higher worldwide property, facilities and project management fees (excluding the impact of the Norland Acquisition, up 15.8%), increased sales (up 19.7%) and leasing (up 16.2%) activity. Foreign currency translation had a $53.5 million negative impact on total revenue during the year ended December 31, 2014, primarily driven by weakness in the Australian dollar, Brazilian real, Canadian dollar, Indian rupee and Japanese yen, partially offset by strength in the British pound sterling, during the year ended December 31, 2014 versus the year ended December 31, 2013.
Our cost of services on a consolidated basis increased by $1.4 billion, or 33.9%, during the year ended December 31, 2014 as compared to the year ended December 31, 2013. This increase was primarily due to higher costs associated with our global property and facilities management businesses, particularly due to the Norland Acquisition. In addition, as previously mentioned, our sales professionals generally are paid on a commission basis, which substantially correlates with our transaction revenue performance. Accordingly, the increase in sales and lease transaction revenue led to a corresponding increase in commission accruals. Foreign currency translation had a $35.3 million positive impact on cost of services during the year ended December 31, 2014. Cost of services as a percentage of revenue increased from 58.3% for the year ended December 31, 2013 to 62.0% for the year ended December 31, 2014, largely due to the Norland Acquisition. Excluding activity associated with Norland, cost of services as a percentage of revenue was 59.4% for the year ended December 31, 2014, compared to 58.3% for the year ended December 31, 2013.
Our operating, administrative and other expenses on a consolidated basis increased by $334.7 million, or 15.9%, during the year ended December 31, 2014 as compared to the year ended December 31, 2013. The increase was partly driven by costs associated with the Norland Acquisition. Also contributing to the variance were higher worldwide payroll-related costs (including bonuses), increased consulting costs, and an asset impairment charge of $8.6 million incurred in our Americas segment during the year ended December 31, 2014. Foreign currency translation had a $14.2 million positive impact on total operating expenses during the year ended December 31, 2014. Operating expenses as a percentage of revenue decreased from 29.3% for the year ended December 31, 2013 to 27.0% for the year ended December 31, 2014, as a result of the Norland Acquisition. Excluding activity associated with Norland, operating expenses as a percentage of revenue were relatively consistent at 29.0% for the year ended December 31, 2014, compared to 29.2% for the year ended December 31, 2013.
Our depreciation and amortization expense on a consolidated basis increased by $74.7 million, or 39.2%, during the year ended December 31, 2014 as compared to the year ended December 31, 2013. This increase was primarily attributable to higher amortization expense relative to intangibles acquired in the Norland Acquisition and in-fill acquisitions completed in 2014. A rise in depreciation expense during the year ended December 31, 2014 driven by technology-related capital expenditures also contributed to the increase.
Our non-amortizable intangible asset impairment on a consolidated basis was $98.1 million for the year ended December 31, 2013, which represented non-cash write-offs related to a decrease in value of our open-end funds in our Global Investment Management segment, primarily in Europe.
Our gain on disposition of real estate on a consolidated basis was $57.7 million for the year ended December 31, 2014 as compared to $13.6 million for the year ended December 31, 2013. These gains resulted
45
Table of Contents
from activity within our Global Investment Management and Development Services segments. The increase over the prior-year period is largely due to our adoption of Accounting Standards Update, or ASU, 2014-08, “ Presentation of Financial Statements (Topic 205) and Property, Plant, and Equipment (Topic 360): Reporting Discontinued Operations and Disclosures of Disposals of Components of an Entity ” effective January 1, 2014 and as a result, no longer reporting discontinued operations in the ordinary course of our business. Prior to January 1, 2014, if in the ordinary course of business we disposed of real estate assets, or held real estate assets for sale, that were considered components of an entity in accordance with Topic 360, and if we did not have, or expect to have, significant continuing involvement with the operation of these real estate assets after disposition, we were required to recognize operating profits or losses and gains or losses on disposition of these assets as discontinued operations in our consolidated statements of operations in the periods in which they occurred.
Our equity income from unconsolidated subsidiaries on a consolidated basis increased by $37.3 million, or 57.9%, for the year ended December 31, 2014 as compared to the year ended December 31, 2013. This increase was primarily driven by higher equity earnings associated with gains on property sales within our Development Services segment and a gain on the sale of an equity investment in Canada within our Americas segment during the year ended December 31, 2014.
Our other income on a consolidated basis was relatively consistent at $12.2 million for the year ended December 31, 2014 as compared to $13.5 million for the year ended December 31, 2013.
Our consolidated interest income was $6.2 million for the year ended December 31, 2014 versus $6.3 million for the year ended December 31, 2013.
Our consolidated interest expense decreased by $23.0 million, or 17.1%, for the year ended December 31, 2014 as compared to the year ended December 31, 2013, due to the effects of our refinancing activities in the first half of 2013. During the latter part of 2014, we completed three financing transactions, including the issuance in September 2014 and December 2014 of $300.0 million and $125.0 million, respectively, in aggregate principal amount of 5.25% senior notes due March 15, 2025 and the redemption in October 2014 of all of the then outstanding 6.625% senior notes (aggregate principal amount of $350.0 million). Additionally, in January 2015 we entered into an amended and restated credit agreement with more favorable interest rate spreads than under our prior credit agreement.
Our write-off of financing costs on a consolidated basis was $23.1 million for the year ended December 31, 2014 as compared to $56.3 million for the year ended December 31, 2013. The write-off in 2014 related to costs associated with the redemption in full of our 6.625% senior notes, including a $17.4 million early extinguishment premium and the write-off of $5.7 million of previously deferred financing costs. The write-off in 2013 primarily related to costs associated with the redemption in full of our 11.625% senior subordinated notes, including a $26.2 million early extinguishment premium and the write-off of $16.1 million of unamortized original issue discount and previously deferred financing costs. In addition, during the year ended December 31, 2013, we wrote-off $10.4 million of unamortized deferred financing costs associated with a previous credit agreement and incurred fees of $3.6 million in connection with its replacement credit agreement and 5.00% senior notes.
Our provision for income taxes on a consolidated basis was $263.8 million for the year ended December 31, 2014 as compared to $187.2 million for the year ended December 31, 2013. This increase was driven by the significant growth in pre-tax income during the year ended December 31, 2014. Our effective tax rate from continuing operations, after adjusting pre-tax income to remove the portion attributable to non-controlling interests, decreased to 35.3% for the year ended December 31, 2014 as compared to 37.3% for the year ended December 31, 2013. This decrease was largely due to a favorable change in our mix, with 71% of our earnings, after removing the portion attributable to non-controlling interests, from the United States in 2013 as compared to 68% in 2014, partially due to the Norland Acquisition. Additionally, during the year ended December 31, 2014, we reversed accrued taxes, interest and penalties related to settled positions, which had a positive impact on the current year effective tax rate. These favorable items were partially offset by a reduction in foreign income tax credit benefits.
46
Table of Contents
Our consolidated income from discontinued operations, net of income taxes, was $27.0 million for the year ended December 31, 2013. This income was reported in our Development Services and Global Investment Management segments and mostly related to gains from property sales, which were largely attributable to non-controlling interests. As previously mentioned, on January 1, 2014, we adopted ASU 2014-08 and as a result, no longer anticipate reporting discontinued operations in the ordinary course of our business.
Our net income attributable to non-controlling interests on a consolidated basis was $29.0 million for the year ended December 31, 2014 as compared to $32.3 million for the year ended December 31, 2013. This activity primarily reflects our non-controlling interests’ share of income within our Global Investment Management and Development Services segments. Year Ended December 31, 2013 Compared to Year Ended December 31, 2012
We reported consolidated net income of $316.5 million for the year ended December 31, 2013 on revenue of $7.2 billion as compared to consolidated net income of $315.6 million on revenue of $6.5 billion for the year ended December 31, 2012.
Our revenue on a consolidated basis for the year ended December 31, 2013 increased by $670.7 million, or 10.3%, as compared to the year ended December 31, 2012. This increase was primarily driven by higher worldwide sales (up 23.9%), property, facilities and project management (up 11.3%) and leasing (up 8.6%) activity. Carried interest revenue earned in our Global Investment Management segment also contributed to the positive variance. These items were partially offset by foreign currency translation, which had a $73.4 million negative impact on total revenue during the year ended December 31, 2013. The negative impact of foreign currency was primarily driven by weakness in the Australian dollar, Brazilian real, British pound sterling, Canadian dollar, Indian rupee and Japanese yen, partially offset by strength in the Euro, during the year ended December 31, 2013 versus the year ended December 31, 2012.
Our cost of services on a consolidated basis increased by $446.9 million, or 11.9%, during the year ended December 31, 2013 as compared to the year ended December 31, 2012. Our sales professionals generally are paid on a commission basis, which substantially correlates with our transaction revenue performance. Accordingly, the increase in sales and lease transaction revenue led to a corresponding increase in commission accruals. The increase in cost of services was also due to higher salaries and related costs associated with our global property, facilities and project management contracts as well as higher bonuses in the United States and the United Kingdom due to increased headcount and improved operating performance. Foreign currency translation had a $41.9 million positive impact on cost of services during the year ended December 31, 2013. Cost of services as a percentage of revenue increased to 58.3% for the year ended December 31, 2013 from 57.5% for the year ended December 31, 2012, primarily attributable to a concentration of commissions among higher producing professionals in the United States and Asia Pacific. In addition, higher producer recruitment costs during the year ended December 31, 2013 increased this ratio.
Our operating, administrative and other expenses on a consolidated basis increased by $101.4 million, or 5.1%, during the year ended December 31, 2013 as compared to the year ended December 31, 2012. The increase was primarily driven by strategic investments made during the year ended December 31, 2013, including increased headcount, as well as higher insurance, legal, consulting, marketing and travel costs. These increases were partially offset by $32.3 million of impairment charges incurred during the year ended December 31, 2012 that did not recur during the year ended December 31, 2013 and $25.1 million of lower transaction and integration costs attributable to acquisitions. Foreign currency translation had an $18.4 million positive impact on total operating expenses during the year ended December 31, 2013. Operating expenses as a percentage of revenue decreased from 30.7% for the year ended December 31, 2012 to 29.3% for the year ended December 31, 2013, partially driven by the aforementioned lower costs associated with impairments and acquisitions during the year ended December 31, 2013. Excluding such costs, operating expenses were 29.1% of revenue for the year ended December 31, 2013 versus 29.6% for the year ended December 31, 2012. The decrease during the year
47

Table of Contents
ended December 31, 2013 was achieved despite incremental investments in our operating platform, and outside insurance costs, reflecting the operating leverage inherent in our business and proactive cost savings initiatives.
Our depreciation and amortization expense on a consolidated basis increased by $20.7 million, or 12.2%, during the year ended December 31, 2013 as compared to the year ended December 31, 2012. An increase in depreciation expense during the year ended December 31, 2013 driven by technology-related capital expenditures and an increase in amortization expense related to mortgage servicing rights during the year ended December 31, 2013, were partially mitigated by $9.6 million of intangible amortization expense related to ING REIM incentive fees in the year ended December 31, 2012, which did not recur during the year ended December 31, 2013.
Our non-amortizable intangible asset impairment on a consolidated basis was $98.1 million for the year ended December 31, 2013 as compared to $19.8 million for the year ended December 31, 2012. This activity represented non-cash write-offs related to a decrease in value of our open-end funds in our Global Investment Management segment, primarily in Europe, during the year ended December 31, 2013 and the discontinuation of the use of a trade name in the United Kingdom in our EMEA segment during the year ended December 31, 2012.
Our gain on disposition of real estate on a consolidated basis was $13.6 million for the year ended December 31, 2013 as compared to $5.9 million for the year ended December 31, 2012. These gains resulted from activity within our Development Services segment.
Our equity income from unconsolidated subsidiaries on a consolidated basis increased by $3.7 million, or 6.1%, for the year ended December 31, 2013 as compared to the year ended December 31, 2012. This increase was primarily attributable to higher equity earnings reported in our Global Investment Management and Americas business segments, partially offset by lower equity earnings reported in our Development Services segment.
Our other income on a consolidated basis increased by $2.4 million, or 21.9%, during the year ended December 31, 2013 as compared to the year ended December 31, 2012, primarily driven by increased net realized and unrealized gains related to co-investments in our real estate securities business within our Global Investment Management segment. This activity was partially offset by the impact of $4.3 million of income associated with the sale of a cost method investment in our EMEA segment, which did not recur during the year ended December 31, 2013.
Our consolidated interest income was $6.3 million for the year ended December 31, 2013 as compared to $7.6 million for the year ended December 31, 2012.
Our interest expense on a consolidated basis decreased by $40.0 million, or 22.8%, for the year ended December 31, 2013 as compared to the year ended December 31, 2012, reflecting the effects of our refinancing activities during the year ended December 31, 2013.
Our write-off of financing costs on a consolidated basis was $56.3 million for the year ended December 31, 2013, primarily related to costs associated with the early redemption of the 11.625% senior subordinated notes, including a $26.2 million early extinguishment premium and the write-off of $16.1 million of unamortized original issue discount and previously deferred financing costs. In addition, during the year ended December 31, 2013, we wrote-off $10.4 million of unamortized deferred financing costs associated with a previous credit agreement and incurred fees of $3.6 million in connection with its replacement credit agreement and 5.00% senior notes.
48

Table of Contents
Our provision for income taxes on a consolidated basis was $187.2 million for the year ended December 31, 2013 as compared to $185.3 million for the year ended December 31, 2012. Our effective tax rate from continuing operations, after adjusting pre-tax income to remove the portion attributable to non-controlling interests, was relatively consistent at 37.3% for the year ended December 31, 2013 versus 37.1% for the year ended December 31, 2012.
Our consolidated income from discontinued operations, net of income taxes, was $27.0 million for the year ended December 31, 2013 as compared to $0.6 million for the year ended December 31, 2012. This income was reported in our Development Services and Global Investment Management segments and mostly related to gains from property sales, which were largely attributable to non-controlling interests.
Our net income attributable to non-controlling interests on a consolidated basis was $32.3 million for the year ended December 31, 2013 as compared to a net loss attributable to non-controlling interests of $10.8 million for the year ended December 31, 2012. This activity primarily reflects our non-controlling interests’ share of income and losses within our Global Investment Management and Development Services segments.
49
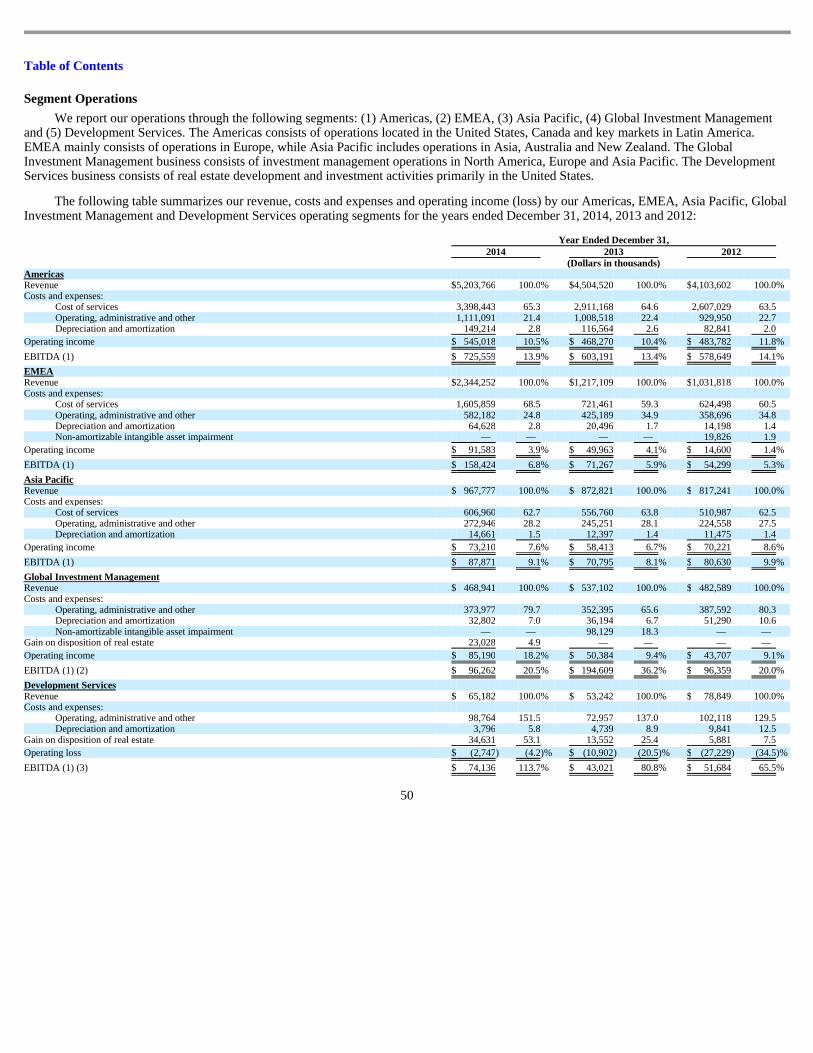
Table of Contents
Segment Operations
We report our operations through the following segments: (1) Americas, (2) EMEA, (3) Asia Pacific, (4) Global Investment Management and (5) Development Services. The Americas consists of operations located in the United States, Canada and key markets in Latin America. EMEA mainly consists of operations in Europe, while Asia Pacific includes operations in Asia, Australia and New Zealand. The Global Investment Management business consists of investment management operations in North America, Europe and Asia Pacific. The Development Services business consists of real estate development and investment activities primarily in the United States.
The following table summarizes our revenue, costs and expenses and operating income (loss) by our Americas, EMEA, Asia Pacific, Global Investment Management and Development Services operating segments for the years ended December 31, 2014, 2013 and 2012:
50
Year Ended December 31, 2014 2013 2012 (Dollars in thousands) Americas Revenue $ 5,203,766 100.0 % $ 4,504,520 100.0 % $ 4,103,602 100.0 % Costs and expenses:
Cost of services 3,398,443 65.3 2,911,168 64.6 2,607,029 63.5 Operating, administrative and other 1,111,091 21.4 1,008,518 22.4 929,950 22.7 Depreciation and amortization 149,214 2.8 116,564 2.6 82,841 2.0
Operating income $ 545,018 10.5 % $ 468,270 10.4 % $ 483,782 11.8 %
EBITDA (1) $ 725,559 13.9 % $ 603,191 13.4 % $ 578,649 14.1 %
EMEA Revenue $ 2,344,252 100.0 % $ 1,217,109 100.0 % $ 1,031,818 100.0 % Costs and expenses:
Cost of services 1,605,859 68.5 721,461 59.3 624,498 60.5 Operating, administrative and other 582,182 24.8 425,189 34.9 358,696 34.8 Depreciation and amortization 64,628 2.8 20,496 1.7 14,198 1.4 Non-amortizable intangible asset impairment — — — — 19,826 1.9
Operating income $ 91,583 3.9 % $ 49,963 4.1 % $ 14,600 1.4 %
EBITDA (1) $ 158,424 6.8 % $ 71,267 5.9 % $ 54,299 5.3 %
Asia Pacific Revenue $ 967,777 100.0 % $ 872,821 100.0 % $ 817,241 100.0 % Costs and expenses:
Cost of services 606,960 62.7 556,760 63.8 510,987 62.5 Operating, administrative and other 272,946 28.2 245,251 28.1 224,558 27.5 Depreciation and amortization 14,661 1.5 12,397 1.4 11,475 1.4
Operating income $ 73,210 7.6 % $ 58,413 6.7 % $ 70,221 8.6 %
EBITDA (1) $ 87,871 9.1 % $ 70,795 8.1 % $ 80,630 9.9 %
Global Investment Management Revenue $ 468,941 100.0 % $ 537,102 100.0 % $ 482,589 100.0 % Costs and expenses:
Operating, administrative and other 373,977 79.7 352,395 65.6 387,592 80.3 Depreciation and amortization 32,802 7.0 36,194 6.7 51,290 10.6 Non-amortizable intangible asset impairment — — 98,129 18.3 — —
Gain on disposition of real estate 23,028 4.9 — — — —
Operating income $ 85,190 18.2 % $ 50,384 9.4 % $ 43,707 9.1 %
EBITDA (1) (2) $ 96,262 20.5 % $ 194,609 36.2 % $ 96,359 20.0 %
Development Services Revenue $ 65,182 100.0 % $ 53,242 100.0 % $ 78,849 100.0 % Costs and expenses:
Operating, administrative and other 98,764 151.5 72,957 137.0 102,118 129.5 Depreciation and amortization 3,796 5.8 4,739 8.9 9,841 12.5
Gain on disposition of real estate 34,631 53.1 13,552 25.4 5,881 7.5
Operating loss $ (2,747 ) (4.2 )% $ (10,902 ) (20.5 )% $ (27,229 ) (34.5 )%
EBITDA (1) (3) $ 74,136 113.7 % $ 43,021 80.8 % $ 51,684 65.5 %
Table of Contents
Year Ended December 31, 2014 Compared to Year Ended December 31, 2013
(1) See Note 20 of the Notes to Consolidated Financial Statements set forth in Item 8 of this Annual Report for a reconciliation of segment EBITDA to the most comparable financial measure
calculated and presented in accordance with GAAP, which is segment net income (loss) attributable to CBRE Group, Inc. (2) Includes EBITDA related to discontinued operations of $1.4 million and $0.5 million for the years ended December 31, 2013 and 2012, respectively. (3) Includes EBITDA related to discontinued operations of $6.5 million and $5.1 million for the years ended December 31, 2013 and 2012, respectively.
Americas
Revenue increased by $699.2 million, or 15.5%, for the year ended December 31, 2014 as compared to the year ended December 31, 2013. This improvement was primarily driven by higher property, facilities and project management fees, as well as improved leasing, sales and commercial mortgage brokerage activity. Foreign currency translation had a $33.4 million negative impact on total revenue during the year ended December 31, 2014, primarily driven by weakness in the Brazilian real and Canadian dollar when converting to U.S. dollars during the year ended December 31, 2014 versus the year ended December 31, 2013.
Cost of services increased by $487.3 million, or 16.7%, for the year ended December 31, 2014 as compared to the year ended December 31, 2013, primarily due to increased commission expense resulting from higher sales and lease transaction revenue. Higher salaries and related costs associated with our property, facilities and project management contracts also contributed to an increase in cost of services during the year ended December 31, 2014. Foreign currency translation had a $20.9 million positive impact on cost of services during the year ended December 31, 2014. Cost of services as a percentage of revenue increased to 65.3% for the year ended December 31, 2014 from 64.6% for the year ended December 31, 2013, primarily attributable to a concentration of commissions among higher producing professionals.
Operating, administrative and other expenses increased by $102.6 million, or 10.2%, for the year ended December 31, 2014 as compared to the year ended December 31, 2013. The increase was primarily driven by higher payroll-related costs (including bonuses), which resulted from increased headcount, as well as higher consulting costs. Also contributing to the variance was the previously mentioned asset impairment charge during the year ended December 31, 2014 of $8.6 million. This non-cash write-off resulted from the decision (due to a change in strategy) to abandon a property database platform that was being developed in the U.S. Foreign currency translation had a $9.4 million positive impact on total operating expenses during the year ended December 31, 2014. EMEA
Revenue increased by $1.1 billion, or 92.6%, for the year ended December 31, 2014 as compared to the year ended December 31, 2013. The increase was in part due to contributions from the Norland Acquisition. Excluding Norland, revenue was up 21.2% and growth was strong in all major business lines. Foreign currency translation had a $19.1 million positive impact on total revenue during the year ended December 31, 2014, primarily driven by strength in the British pound sterling when converting to U.S. dollars during the year ended December 31, 2014 versus the year ended December 31, 2013.
Cost of services increased by $884.4 million, or 122.6%, for the year ended December 31, 2014 as compared to the year ended December 31, 2013, primarily due to higher costs associated with our global property and facilities management businesses, particularly due to the Norland Acquisition. Foreign currency translation had a $12.3 million negative impact on cost of services during the year ended December 31, 2014. Cost of services as a percentage of revenue increased to 68.5% for the year ended December 31, 2014 from 59.3% for the year ended December 31, 2013, mainly due to the Norland Acquisition. Excluding activity associated with Norland, cost of services as a percentage of revenue was 57.6% for the year ended December 31, 2014, an
51
Table of Contents
improvement over the 59.3% of revenue recorded in the prior year, primarily driven by higher transaction revenue during the year ended December 31, 2014 in certain countries that have a significant fixed cost compensation structure.
Operating, administrative and other expenses increased by $157.0 million, or 36.9%, for the year ended December 31, 2014 as compared to the year ended December 31, 2013. The increase was primarily driven by costs associated with the Norland Acquisition. Higher payroll-related costs (including bonuses), which resulted from improved operating performance, as well as increased consulting costs, also contributed to the increase for the year ended December, 31, 2014. Foreign currency translation had a $3.7 million negative impact on total operating expenses during the year ended December 31, 2014. Asia Pacific
Revenue increased by $95.0 million, or 10.9%, for the year ended December 31, 2014 as compared to the year ended December 31, 2013, reflecting improved overall performance in several countries, most notably in Australia, India and Japan, particularly in property, facilities and project management, sales and leasing activity. Contributions from the acquisition of our former affiliate company in Thailand in June 2014 also added to the increase during the year ended December 31, 2014. The increase was partially offset by foreign currency translation, which had a $43.7 million negative impact on total revenue during the year ended December 31, 2014, primarily driven by weakness in the Australian dollar, Japanese yen and Indian rupee when converting to U.S. dollars during the year ended December 31, 2014 versus the year ended December 31, 2013.
Cost of services increased by $50.2 million, or 9.0%, for the year ended December 31, 2014 as compared to the year ended December 31, 2013, driven by increased commission expense resulting from higher sales and lease transaction revenue as well as a concentration of commissions among higher producing professionals in Australia and Japan. Higher salaries and related costs associated with our property and facilities management contracts also contributed to an increase in cost of services during the year ended December 31, 2014. Foreign currency translation had a $26.7 million positive impact on cost of services during the year ended December 31, 2014. Cost of services as a percentage of revenue decreased to 62.7% for the year ended December 31, 2014 from 63.8% for the year ended December 31, 2013, primarily driven by higher transaction revenue during the year ended December 31, 2014 in certain countries that have a significant fixed cost compensation structure.
Operating, administrative and other expenses increased by $27.7 million, or 11.3%, for the year ended December 31, 2014 as compared to the year ended December 31, 2013. The increase was primarily driven by higher payroll-related (including bonuses), occupancy and consulting costs. Foreign currency translation had an $11.2 million positive impact on total operating expenses during the year ended December 31, 2014. Global Investment Management
Revenue decreased by $68.2 million, or 12.7%, for the year ended December 31, 2014 as compared to the year ended December 31, 2013, primarily driven by reduced carried interest revenue. Lower asset management fees, which reflect the sale of assets in 2013 to harvest gains for fund investors (which generated the carried interest in 2013), lower fees on some AUM in EMEA, and our exiting the management of a private REIT, also contributed to the decline during the year ended December 31, 2014. These reductions were partially offset by higher acquisitions fees during the year ended December 31, 2014 as well as foreign currency translation, which had a $4.5 million positive impact on total revenue during the year ended December 31, 2014.
Operating, administrative and other expenses increased by $21.6 million, or 6.1%, for the year ended December 31, 2014 as compared to the year ended December 31, 2013, primarily due to higher carried interest expense incurred in the current year. Foreign currency translation also had a $2.7 million negative impact on total operating expenses during the year ended December 31, 2014. These increases were partially offset by lower costs due to the sale of assets and internalization of the management of the private REIT discussed above.
52
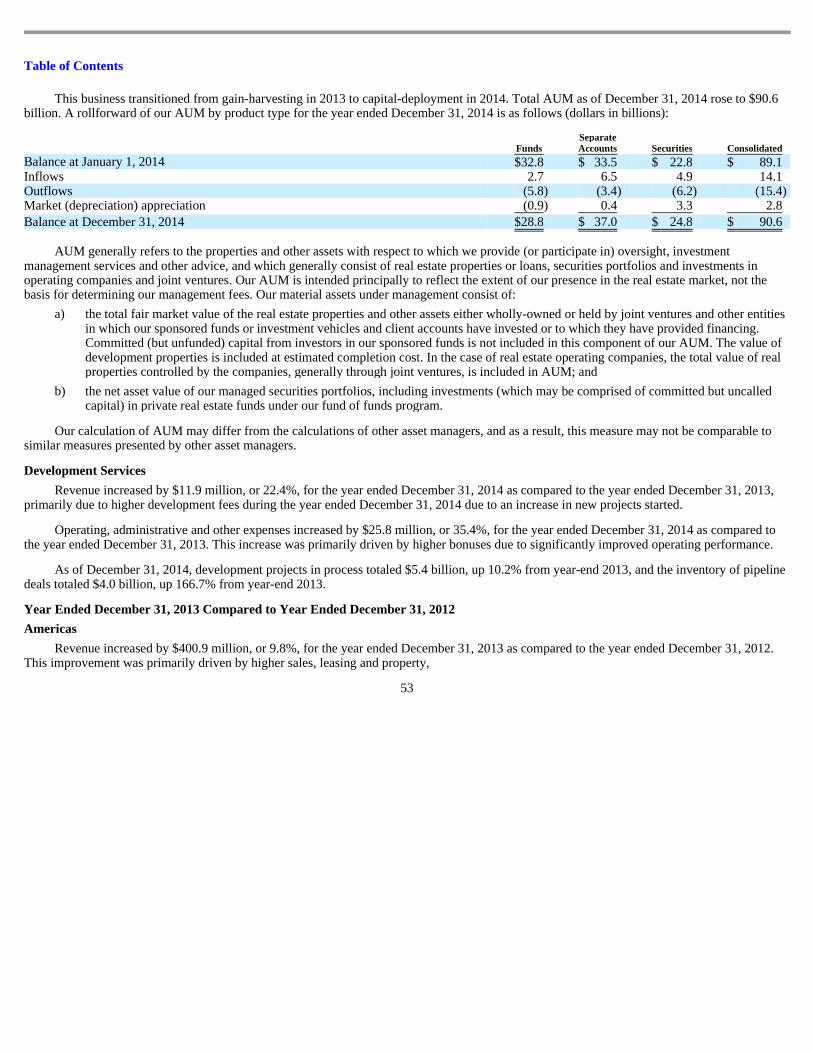
Table of Contents
This business transitioned from gain-harvesting in 2013 to capital-deployment in 2014. Total AUM as of December 31, 2014 rose to $90.6 billion. A rollforward of our AUM by product type for the year ended December 31, 2014 is as follows (dollars in billions):
AUM generally refers to the properties and other assets with respect to which we provide (or participate in) oversight, investment
management services and other advice, and which generally consist of real estate properties or loans, securities portfolios and investments in operating companies and joint ventures. Our AUM is intended principally to reflect the extent of our presence in the real estate market, not the basis for determining our management fees. Our material assets under management consist of:
Funds Separate Accounts Securities Consolidated
Balance at January 1, 2014 $ 32.8 $ 33.5 $ 22.8 $ 89.1 Inflows 2.7 6.5 4.9 14.1 Outflows (5.8 ) (3.4 ) (6.2 ) (15.4 ) Market (depreciation) appreciation (0.9 ) 0.4 3.3 2.8
Balance at December 31, 2014 $ 28.8 $ 37.0 $ 24.8 $ 90.6
a) the total fair market value of the real estate properties and other assets either wholly-owned or held by joint ventures and other entities in which our sponsored funds or investment vehicles and client accounts have invested or to which they have provided financing. Committed (but unfunded) capital from investors in our sponsored funds is not included in this component of our AUM. The value of development properties is included at estimated completion cost. In the case of real estate operating companies, the total value of real properties controlled by the companies, generally through joint ventures, is included in AUM; and
Our calculation of AUM may differ from the calculations of other asset managers, and as a result, this measure may not be comparable to
similar measures presented by other asset managers. Development Services
b) the net asset value of our managed securities portfolios, including investments (which may be comprised of committed but uncalled
capital) in private real estate funds under our fund of funds program.
Revenue increased by $11.9 million, or 22.4%, for the year ended December 31, 2014 as compared to the year ended December 31, 2013, primarily due to higher development fees during the year ended December 31, 2014 due to an increase in new projects started.
Operating, administrative and other expenses increased by $25.8 million, or 35.4%, for the year ended December 31, 2014 as compared to the year ended December 31, 2013. This increase was primarily driven by higher bonuses due to significantly improved operating performance.
As of December 31, 2014, development projects in process totaled $5.4 billion, up 10.2% from year-end 2013, and the inventory of pipeline deals totaled $4.0 billion, up 166.7% from year-end 2013. Year Ended December 31, 2013 Compared to Year Ended December 31, 2012 Americas
Revenue increased by $400.9 million, or 9.8%, for the year ended December 31, 2013 as compared to the year ended December 31, 2012. This improvement was primarily driven by higher sales, leasing and property,
53
Table of Contents
facilities and project management activity. The pullback in multi-housing lending from Government-Sponsored Entities, or GSEs, had an adverse impact on our performance, particularly in the second half of 2013. Foreign currency translation had a $20.7 million negative impact on total revenue during the year ended December 31, 2013, primarily driven by weakness in the Brazilian real and Canadian dollar when converting to U.S. dollars during the year ended December 31, 2013 versus the year ended December 31, 2012.
Cost of services increased by $304.1 million, or 11.7%, for the year ended December 31, 2013 as compared to the year ended December 31, 2012, primarily due to increased commission expense resulting from higher sales and lease transaction revenue. Also contributing to the variance was higher salaries and related costs associated with our property, facilities and project management contracts and higher bonuses due to increased headcount and improved operating performance. Foreign currency translation had a $10.6 million positive impact on cost of services during the year ended December 31, 2013. Cost of services as a percentage of revenue increased to 64.6% for the year ended December 31, 2013 from 63.5% for the year ended December 31, 2012, primarily attributable to a concentration of commissions among higher producing professionals as well as higher recruitment costs during the year ended December 31, 2013.
Operating, administrative and other expenses increased by $78.6 million, or 8.4%, for the year ended December 31, 2013 as compared to the year ended December 31, 2012. The increase was primarily driven by strategic investments made during the year ended December 31, 2013, including increased headcount, as well as higher insurance, legal, consulting, marketing and travel costs. Foreign currency translation had a $6.0 million positive impact on total operating expenses during the year ended December 31, 2013. EMEA
Revenue increased by $185.3 million, or 18.0%, for the year ended December 31, 2013 as compared to the year ended December 31, 2012. The increase was broad based, as every major business line showed growth, led by property sales and property, facilities and project management. Notable strength was evident in France, Spain and the United Kingdom. Foreign currency translation had a $9.5 million positive impact on total revenue during the year ended December 31, 2013 primarily driven by strength in the Euro, partially offset by weakness in the British pound sterling, when converting to U.S. dollars during the year ended December 31, 2013 versus the year ended December 31, 2012.
Cost of services increased by $97.0 million, or 15.5%, for the year ended December 31, 2013 as compared to the year ended December 31, 2012 primarily due to an increase in bonuses in the United Kingdom due to improved operating performance. Higher salaries and related costs associated with our property, facilities and project management contracts and higher payroll-related costs due to increased headcount also contributed to the variance. Foreign currency translation had a $6.2 million negative impact on cost of services during the year ended December 31, 2013. Cost of services as a percentage of revenue decreased to 59.3% for the year ended December 31, 2013 from 60.5% for the year ended December 31, 2012 primarily driven by an increase in transaction revenue in certain countries that have a significant fixed compensation structure.
Operating, administrative and other expenses increased by $66.5 million, or 18.5%, for the year ended December 31, 2013 as compared to the year ended December 31, 2012. The increase was primarily driven by higher payroll-related costs, which resulted from increased headcount and improved operating performance, as well as an increase in insurance, marketing and travel costs. Also contributing to the increase were higher transaction and integration costs related to acquisitions, primarily associated with the acquisition of Norland. Foreign currency translation had a $2.8 million negative impact on total operating expenses during the year ended December 31, 2013. Asia Pacific
Revenue increased by $55.6 million, or 6.8%, for the year ended December 31, 2013 as compared to the year ended December 31, 2012. Improved overall performance in all countries within the region, most notably
54
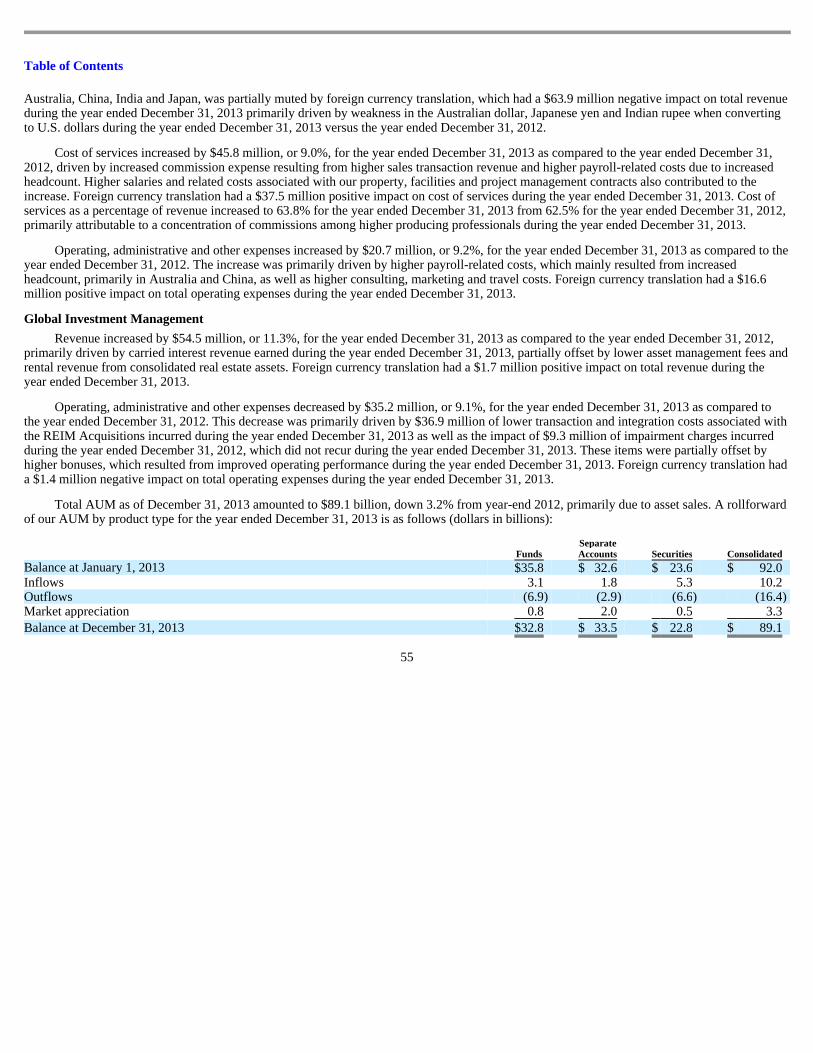
Table of Contents
Australia, China, India and Japan, was partially muted by foreign currency translation, which had a $63.9 million negative impact on total revenue during the year ended December 31, 2013 primarily driven by weakness in the Australian dollar, Japanese yen and Indian rupee when converting to U.S. dollars during the year ended December 31, 2013 versus the year ended December 31, 2012.
Cost of services increased by $45.8 million, or 9.0%, for the year ended December 31, 2013 as compared to the year ended December 31, 2012, driven by increased commission expense resulting from higher sales transaction revenue and higher payroll-related costs due to increased headcount. Higher salaries and related costs associated with our property, facilities and project management contracts also contributed to the increase. Foreign currency translation had a $37.5 million positive impact on cost of services during the year ended December 31, 2013. Cost of services as a percentage of revenue increased to 63.8% for the year ended December 31, 2013 from 62.5% for the year ended December 31, 2012, primarily attributable to a concentration of commissions among higher producing professionals during the year ended December 31, 2013.
Operating, administrative and other expenses increased by $20.7 million, or 9.2%, for the year ended December 31, 2013 as compared to the year ended December 31, 2012. The increase was primarily driven by higher payroll-related costs, which mainly resulted from increased headcount, primarily in Australia and China, as well as higher consulting, marketing and travel costs. Foreign currency translation had a $16.6 million positive impact on total operating expenses during the year ended December 31, 2013. Global Investment Management
Revenue increased by $54.5 million, or 11.3%, for the year ended December 31, 2013 as compared to the year ended December 31, 2012, primarily driven by carried interest revenue earned during the year ended December 31, 2013, partially offset by lower asset management fees and rental revenue from consolidated real estate assets. Foreign currency translation had a $1.7 million positive impact on total revenue during the year ended December 31, 2013.
Operating, administrative and other expenses decreased by $35.2 million, or 9.1%, for the year ended December 31, 2013 as compared to the year ended December 31, 2012. This decrease was primarily driven by $36.9 million of lower transaction and integration costs associated with the REIM Acquisitions incurred during the year ended December 31, 2013 as well as the impact of $9.3 million of impairment charges incurred during the year ended December 31, 2012, which did not recur during the year ended December 31, 2013. These items were partially offset by higher bonuses, which resulted from improved operating performance during the year ended December 31, 2013. Foreign currency translation had a $1.4 million negative impact on total operating expenses during the year ended December 31, 2013.
Total AUM as of December 31, 2013 amounted to $89.1 billion, down 3.2% from year-end 2012, primarily due to asset sales. A rollforward of our AUM by product type for the year ended December 31, 2013 is as follows (dollars in billions):
55
Funds Separate Accounts Securities Consolidated
Balance at January 1, 2013 $ 35.8 $ 32.6 $ 23.6 $ 92.0 Inflows 3.1 1.8 5.3 10.2 Outflows (6.9 ) (2.9 ) (6.6 ) (16.4 ) Market appreciation 0.8 2.0 0.5 3.3
Balance at December 31, 2013 $ 32.8 $ 33.5 $ 22.8 $ 89.1
Table of Contents
Development Services
Revenue decreased by $25.6 million, or 32.5%, for the year ended December 31, 2013 as compared to the year ended December 31, 2012, primarily attributable to lower rental revenue as a result of property dispositions.
Operating, administrative and other expenses decreased by $29.2 million, or 28.6%, for the year ended December 31, 2013 as compared to the year ended December 31, 2012. This decrease was primarily driven by the impact of a $17.2 million impairment charge related to real estate assets incurred during the year ended December 31, 2012, which did not recur during the year ended December 31, 2013, as well as lower property operating expenses as a result of the property dispositions noted above in this segment’s revenue discussion.
As of December 31, 2013, development projects in process totaled $4.9 billion, up 16.7% from year-end 2012. The inventory of pipeline deals totaled $1.5 billion, down 28.6% from year-end 2012. Liquidity and Capital Resources
We believe that we can satisfy our working capital requirements and funding of investments with internally generated cash flow and, as necessary, borrowings under our revolving credit facility. Our expected capital requirements for 2015 include up to approximately $180 million of anticipated net capital expenditures. As of December 31, 2014, we had committed to fund $25.5 million of additional capital to unconsolidated subsidiaries within our Development Services business, which we may be required to fund at any time. Additionally, as of December 31, 2014, we had aggregate commitments of $19.0 million to fund future co-investments in our Global Investment Management business, $12.7 million of which is expected to be funded in 2015.
In December 2013, we fortified our real estate outsourcing platform in Europe with the acquisition of Norland for approximately $474 million, which was financed with cash on hand and borrowings under our revolving credit facility. We also completed three financing transactions in recent years. These occurred in March 2013, September 2014 and December 2014, respectively, where we took advantage of market conditions to refinance our debt. In addition, in January 2015, we entered into an amended and restated credit agreement providing for a $500 million tranche A term loan facility (in addition to a $2.6 billion revolving credit facility). We historically have not sought external sources of financing and have relied on our internally generated cash flow and our revolving credit facility to fund our working capital, capital expenditure and investment requirements. In the absence of extraordinary events, we anticipate that our cash flow from operations and our revolving credit facility would be sufficient to meet our anticipated cash requirements for the foreseeable future, but at a minimum for the next 12 months. From time to time, we may again seek to take advantage of market opportunities to refinance existing debt securities with new debt securities at interest rates, maturities and terms we would deem attractive.
As evidenced above, from time to time, we consider potential strategic acquisitions. We believe that any future significant acquisitions that we may make could require us to obtain additional debt or equity financing. In the past, we have been able to obtain such financing for material transactions on terms that we believed to be reasonable. However, it is possible that we may not be able to find acquisition financing on favorable terms, or at all, in the future if we decide to make any further material acquisitions.
Our long-term liquidity needs, other than those related to ordinary course obligations and commitments such as operating leases, generally are comprised of three elements. The first is the repayment of the outstanding and anticipated principal amounts of our long-term indebtedness. We are unable to project with certainty whether our long-term cash flow from operations will be sufficient to repay our long-term debt when it comes due. If our cash flow is insufficient, then we expect that we would need to refinance such indebtedness or otherwise amend its terms to extend the maturity dates. We cannot make any assurances that such refinancing or amendments would be available on attractive terms, if at all.
56
Table of Contents
The second long-term liquidity need is the repayment of obligations under our pension plans in the United Kingdom. Our subsidiaries based in the United Kingdom maintain two contributory defined benefit pension plans to provide retirement benefits to existing and former employees participating in the plans. With respect to these plans, our historical policy has been to contribute annually, an amount to fund pension cost as actuarially determined and as required by applicable laws and regulations. Our contributions to these plans are invested and, if these investments do not perform in the future as well as we expect, we will be required to provide additional funding to cover any shortfall. During 2007, we reached agreements with the active members of these plans to freeze future pension plan benefits. In return, the active members became eligible to enroll in the CBRE Group Personal Pension plan, a defined contribution plan in the United Kingdom. The underfunded status of our defined benefit pension plans included in pension liability in the accompanying consolidated balance sheets set forth in Item 8 of this Annual Report was $92.9 million and $68.0 million at December 31, 2014 and 2013, respectively. We expect to contribute a total of $6.1 million to fund our pension plans for the year ending December 31, 2015.
The third long-term liquidity need is the payment of obligations related to acquisitions. Our acquisition structures often include deferred and/or contingent purchase price payments in future periods that are subject to the passage of time or achievement of certain performance metrics and other conditions. As of December 31, 2014 and 2013, we had accrued for $125.2 million and $86.9 million, respectively, of deferred purchase consideration, which was included in accounts payable and accrued expenses and in other long-term liabilities in the accompanying consolidated balance sheets set forth in Item 8 of this Annual Report.
Historical Cash Flows
Operating Activities
Net cash provided by operating activities totaled $661.8 million for the year ended December 31, 2014, a decrease of $83.3 million as compared to the year ended December 31, 2013. This variance was primarily due to an increase in receivables during the year ended December 31, 2014 and greater sales of real estate held for sale and under development during the year ended December 31, 2013. In addition, higher bonuses, income taxes and commissions paid during the year ended December 31, 2014 also contributed to the decrease. These items were partially offset by an increase in bonus accruals and improved operating performance during the year ended December 31, 2014.
Net cash provided by operating activities totaled $745.1 million for the year ended December 31, 2013, an increase of $454.0 million as compared to the year ended December 31, 2012. This variance was primarily due to a decrease in real estate held for sale and under development and higher bonus accruals during the year ended December 31, 2013. In addition, improved operating performance and greater collections on receivables during the year ended December 31, 2013 contributed to the variance. These items were partially offset by higher bonus payments made during the year ended December 31, 2013.
Investing Activities
Net cash used in investing activities totaled $151.6 million for the year ended December 31, 2014, a decrease of $313.4 million as compared to the year ended December 31, 2013. This decrease was primarily driven by greater amounts paid for acquisitions during the year ended December 31, 2013 (including the Norland Acquisition) and lower proceeds received from the sale of real estate held for investment during the year ended December 31, 2014.
Net cash used in investing activities totaled $465.0 million for the year ended December 31, 2013, an increase of $267.3 million as compared to the year ended December 31, 2012. This variance was primarily driven by greater amounts paid for acquisitions during the year ended December 31, 2013. This was partially offset by higher proceeds received from the sale of real estate held for investment during the year ended December 31, 2013 and a decrease in cash during the year ended December 31, 2012 as a result of the deconsolidation of CBRE
57
Table of Contents
Clarion U.S., L.P. in 2012. Higher contributions to unconsolidated subsidiaries in 2012, greater distributions from unconsolidated subsidiaries during the year ended December 31, 2013 and a decrease in restricted cash during the year ended December 31, 2013 versus an increase in restricted cash during the year ended December 31, 2012 also mitigated the increase in cash used in investing activities.
Financing Activities
Net cash used in financing activities totaled $232.1 million for the year ended December 31, 2014, a decrease of $634.2 million as compared to the year ended December 31, 2013. This variance was primarily due to our refinancing efforts during the year ended December 31, 2013, including the net repayment of $924.0 million of senior secured term loans and the redemption of $450.0 million in aggregate principal amount of 11.625% senior subordinated notes, partially offset by the issuance of $800.0 million of 5.00% senior notes. Proceeds from the issuance of the 5.25% senior notes due in 2025 during the year ended December 31, 2014 and higher net repayments of notes payable on real estate within our Development Services segment and higher distributions to non-controlling interests during the year ended December 31, 2013 also contributed to the variance. These items were partially offset by the redemption of $350.0 million in aggregate principal amount of 6.625% senior notes in 2014.
Net cash used in financing activities totaled $866.3 million for the year ended December 31, 2013, an increase of $765.6 million as compared to the year ended December 31, 2012. The increase in cash used in financing activities was primarily due to our refinancing efforts during the year ended December 31, 2013, including the net repayment of $924.0 million of senior secured term loans and the redemption of $450.0 million of 11.625% senior subordinated notes, partially offset by the issuance of $800.0 million of 5.00% senior notes. In addition, higher net repayments of notes payable on real estate within our Development Services segment and higher distributions to non-controlling interests during the year ended December 31, 2013 also contributed to the increase.
Summary of Contractual Obligations and Other Commitments
The following is a summary of our various contractual obligations and other commitments as of December 31, 2014:
58
Payments Due by Period
Contractual Obligations Total Less than
1 year 1 – 3 years 3 – 5 years More than
5 years (Dollars in thousands) Total debt (1) (2) $ 2,381,259 $ 548,457 $ 323,076 $ 82,425 $ 1,427,301 Operating leases (3) 1,207,086 203,974 344,574 243,327 415,211 Pension liability (4) (5) 92,923 — — — 92,923 Notes payable on real estate (non recourse) (6) 42,843 23,229 3,454 7,027 9,133 Deferred purchase consideration (7) 125,153 65,924 23,223 36,006 —
Total Contractual Obligations $ 3,849,264 $ 841,584 $ 694,327 $ 368,785 $ 1,944,568
Amount of Other Commitments Expiration
Other Commitments Total Less than
1 year 1 – 3 years 3 – 5 years More than
5 years (Dollars in thousands) Letters of credit (3) $ 40,869 $ 40,869 $ — $ — $ — Guarantees (3) (8) 13,800 13,800 — — — Co-investments (3) (9) 44,473 38,214 5,127 243 889 Tax liabilities (10) 40,667 28,818 11,849 — — Other (11) 73,184 73,184 — — —
Total Other Commitments $ 212,993 $ 194,885 $ 16,976 $ 243 $ 889
Table of Contents
Indebtedness
(1) See Note 12 of our Notes to the Consolidated Financial Statements set forth in Item 8 of this Annual Report. Figures do not include
scheduled interest payments. (2) On January 9, 2015, we entered into an amended and restated credit agreement, which resulted in the pay off of the prior tranche A and
tranche B term loans (balances were $434.4 million and $211.2 million, respectively, at December 31, 2014) and the previously outstanding balance on our prior revolving credit facility ($4.8 million at December 31, 2014). The amended and restated credit agreement includes a $2.6 billion revolving credit facility and a $500.0 million tranche A term loan facility. Assuming each debt obligation is held until maturity (taking into consideration the above mentioned changes to our credit agreement in January 2015), we estimate that we will make the following interest payments (dollars in thousands): 2015 – $70,785; 2016 to 2017 – $140,614; 2018 to 2019 – $138,843 and thereafter – $249,922. The interest payments on the new tranche A term loan facility have been calculated based on the interest rate as of January 9, 2015.
(3) See Note 13 of our Notes to the Consolidated Financial Statements set forth in Item 8 of this Annual Report. (4) See Note 14 of our Notes to the Consolidated Financial Statements set forth in Item 8 of this Annual Report. (5) Because these obligations are related, either wholly or partially, to the future retirement of our employees and such retirement dates are not
predictable, an undeterminable portion of this amount will be paid in years one through five. (6) See Note 11 of our Notes to the Consolidated Financial Statements set forth in Item 8 of this Annual Report. Figures do not include
scheduled interest payments. The notes (primarily construction loans) have either fixed or variable interest rates, ranging from 2.41% to 10.0% at December 31, 2014. In general, interest is drawn on the underlying loan and subsequently paid with proceeds received upon the sale of the real estate project.
(7) Represents deferred obligations related to previous acquisitions, which are included in accounts payable and accrued expenses and other long-term liabilities in the consolidated balance sheets at December 31, 2014 set forth in Item 8 of this Annual Report.
(8) Due to the nature of guarantees, payments could be due at any time upon the occurrence of certain triggering events including default. Accordingly, all guarantees are reflected as expiring in less than one year.
(9) Includes $19.0 million related to our Global Investment Management segment, $12.7 million of which is expected to be funded in 2015 and $25.5 million related to our Development Services segment (callable at any time).
(10) As of December 31, 2014, our current and non-current tax liabilities, including interest and penalties, totaled $74.8 million. Of this amount, we can reasonably estimate that $28.8 million will require cash settlement in less than one year and $11.8 million will require cash settlement in one to three years. We are unable to reasonably estimate the timing of the effective settlement of tax positions for the remaining $34.2 million.
(11) Represents outstanding reserves for claims under certain insurance programs, which are included in other current and other long-term liabilities in the consolidated balance sheets at December 31, 2014 set forth in Item 8 of this Annual Report. Due to the nature of this item, payments could be due at any time upon the occurrence of certain events. Accordingly, the entire balance has been reflected as expiring in less than one year.
Our level of indebtedness increases the possibility that we may be unable to pay the principal amount of our indebtedness and other obligations when due. In addition, we may incur additional debt from time to time to finance strategic acquisitions, investments, joint ventures or for other purposes, subject to the restrictions contained in the documents governing our indebtedness. If we incur additional debt, the risks associated with our leverage, including our ability to service our debt, would increase.
Since 2001, we have maintained credit facilities to fund strategic acquisitions and to provide for our working capital needs. On March 28, 2013, we entered into a credit agreement (the 2013 Credit Agreement) with a syndicate of banks led by Credit Suisse Group AG, or CS, as administrative and collateral agent, to completely refinance a previous credit agreement, pursuant to which we completed a series of financing transactions, which
59
Table of Contents
included the repayment of $1.6 billion of our senior secured term loans under the previous credit agreement. On January 9, 2015, we entered into an amended and restated credit agreement (the 2015 Credit Agreement) with a syndicate of banks jointly led by Merrill Lynch, Pierce, Fenner & Smith Incorporated, J.P Morgan Securities LLC and CS.
Our 2015 Credit Agreement currently provides for the following: (1) a $2.6 billion revolving credit facility, including revolving credit loans, letters of credit and a swingline loan facility, maturing on January 9, 2020; and (2) a $500.0 million tranche A term loan facility requiring quarterly principal payments, which begin on June 30, 2015 and continue through maturity on January 9, 2020.
The new revolving credit facility allows for borrowings outside of the United States, with a $75.0 million sub-facility available to one of our Canadian subsidiaries, a $100.0 million sub-facility available to one of our Australian subsidiaries and one of our New Zealand subsidiaries and a $300.0 million sub-facility available to one of our U.K. subsidiaries. Additionally, outstanding borrowings under these sub-facilities may be up to 5.0% higher as allowed under the currency fluctuation provision in the 2015 Credit Agreement. Borrowings under the new revolving credit facility bear interest at varying rates, based at our option, on either the applicable fixed rate plus 1.175% to 1.50% or the daily rate plus 0.175% to 0.50% as determined by reference to our ratio of total debt less available cash to EBITDA (as defined in the 2015 Credit Agreement). Borrowings under the new tranche A term loan facility bear interest, based on our option, on either the applicable fixed rate plus 1.375% to 1.85% or the daily rate plus 0.375% to 0.85%, as determined by reference to our ratio of total debt less available cash to EBITDA (as defined in the 2015 Credit Agreement).
The 2015 Credit Agreement is jointly and severally guaranteed by us and substantially all of our material domestic subsidiaries. Borrowings under the 2015 Credit Agreement are secured by a pledge of substantially all of the capital stock of our U.S. subsidiaries and 65.0% of the capital stock of certain non-U.S. subsidiaries, in each case, held by CBRE and the U.S. guarantor subsidiaries. Also, the 2015 Credit Agreement requires us to pay a fee based on the total amount of the unused revolving credit facility commitment.
In January 2015, proceeds from the new tranche A term loan facility and from the $125.0 million of 5.25% senior notes due 2025 issued in December 2014, along with cash on hand, were used to pay off the prior tranche A and tranche B term loans and the previously outstanding balance on our prior revolving credit facility.
As of December 31, 2014, our 2013 Credit Agreement provided for the following: (1) a $1.2 billion revolving credit facility, which included revolving credit loans, letters of credit and a swingline loan facility, and would have matured on March 28, 2018; (2) a $500.0 million tranche A term loan facility (of which $300.0 million was on an optional delayed-draw basis for up to 120 days from March 28, 2013, which we drew down in June 2013 to partially fund the redemption of our 11.625% senior subordinated notes), which required quarterly principal payments, which began on June 30, 2013 and would have continued through maturity on March 28, 2018; and (3) a $215.0 million tranche B term loan facility requiring quarterly principal payments, which began on June 30, 2013 and would have continued through December 31, 2020, with the balance payable at maturity on March 28, 2021.
The revolving credit facility under the 2013 Credit Agreement allowed for borrowings outside of the United States, with a $10.0 million sub-facility available to one of our Canadian subsidiaries, a $35.0 million sub-facility available to one of our Australian subsidiaries and one of our New Zealand subsidiaries and a $150.0 million sub-facility available to one of our U.K. subsidiaries. Additionally, outstanding borrowings under these sub-facilities could have been up to 5.0% higher as allowed under the currency fluctuation provision in the 2013 Credit Agreement. Borrowings under the prior revolving credit facility bore interest at varying rates, based at our option, on either the applicable fixed rate plus 1.15% to 2.25% or the daily rate plus 0.125% to 1.25% as determined by reference to our ratio of total debt less available cash to EBITDA (as defined in the 2013 Credit Agreement). As of December 31, 2014 and 2013, we had $4.8 million and $142.5 million, respectively, of revolving credit facility principal outstanding with related weighted average interest rates of 1.4% and 2.2%,
60
Table of Contents
respectively, which were included in short-term borrowings in the accompanying consolidated balance sheets set forth in Item 8 of this Annual Report. As of December 31, 2014, letters of credit totaling $7.4 million were outstanding under the revolving credit facility. These letters of credit, which reduce the amount we may borrow under the revolving credit facility, were primarily issued in the normal course of business as well as in connection with certain insurance programs.
Borrowings under the term loan facilities (under the 2013 Credit Agreement) as of December 31, 2014 bore interest, based at our option, on the following: for the tranche A term loan facility, on either the applicable fixed rate plus 1.50% to 2.75% or the daily rate plus 0.50% to 1.75%, as determined by reference to our ratio of total debt less available cash to EBITDA (as defined in the 2013 Credit Agreement) and for the tranche B term loan facility, on either the applicable fixed rate plus 2.75% or the daily rate plus 1.75%. As of December 31, 2014, we had $645.6 million of term loan facilities principal outstanding (including $434.4 million of tranche A term loan facility and $211.2 million of tranche B term loan facility) under the 2013 Credit Agreement, which were included in the accompanying consolidated balance sheets set forth in Item 8 of this Annual Report. As of December 31, 2013, we had $685.3 million of term loan facilities principal outstanding (including $471.9 million of tranche A term loan facility and $213.4 million of tranche B term loan facility) under the 2013 Credit Agreement, which were also included in the accompanying consolidated balance sheets set forth in Item 8 of this Annual Report.
The 2013 Credit Agreement was jointly and severally guaranteed by us and substantially all of our material domestic subsidiaries. Borrowings under the 2013 Credit Agreement were secured by a pledge of substantially all of the capital stock of our U.S. subsidiaries and 65.0% of the capital stock of certain non-U.S. subsidiaries, in each case, held by CBRE and the U.S. guarantor subsidiaries. Also, the 2013 Credit Agreement required us to pay a fee based on the total amount of the unused revolving credit facility commitment.
In March 2011, we entered into five interest rate swap agreements, all with effective dates in October 2011, and immediately designated them as cash flow hedges in accordance with Financial Accounting Standards Board, or FASB, Accounting Standards Codification, or ASC, Topic 815, “ Derivatives and Hedging .” The purpose of these interest rate swap agreements is to attempt to hedge potential changes to our cash flows due to the variable interest nature of our senior secured term loan facilities. The total notional amount of these interest rate swap agreements is $400.0 million, with $200.0 million expiring in October 2017 and $200.0 million expiring in September 2019. There was no significant hedge ineffectiveness for the years ended December 31, 2014, 2013 and 2012. As of December 31, 2014 and 2013, the fair values of such interest rate swap agreements were reflected as a $26.9 million liability and a $29.0 million liability, respectively, and were included in other long-term liabilities in the accompanying consolidated balance sheets set forth in Item 8 of this Annual Report.
On September 26, 2014, CBRE, our wholly-owned subsidiary, issued $300.0 million in aggregate principal amount of 5.25% senior notes due March 15, 2025. On December 12, 2014, CBRE issued an additional $125.0 million in aggregate principal amount of 5.25% senior notes due March 15, 2025 at a price equal to 101.5% of their face value, plus interest deemed to have accrued from September 26, 2014. The 5.25% senior notes are unsecured obligations of CBRE, senior to all of its current and future subordinated indebtedness, but effectively subordinated to all of its current and future secured indebtedness. The 5.25% senior notes are jointly and severally guaranteed on a senior basis by us and each domestic subsidiary of CBRE that guarantees our 2015 Credit Agreement. Interest accrues at a rate of 5.25% per year and is payable semi-annually in arrears on March 15 and September 15, beginning on March 15, 2015. The 5.25% senior notes are redeemable at our option, in whole or in part, prior to December 15, 2024 at a redemption price equal to the greater of (1) 100% of the principal amount of the 5.25% senior notes to be redeemed and (2) the sum of the present values of the remaining scheduled payments of principal and interest thereon to December 15, 2024 (not including any portions of payments of interest accrued as of the date of redemption) discounted to the date of redemption on a semi-annual basis at the Adjusted Treasury Rate (as defined in the indentures governing these notes). In addition, at any time on or after December 15, 2024, the 5.25% senior notes may be redeemed by us, in whole or in part, at a redemption price equal to 100.0% of the principal amount, plus accrued and unpaid interest, if any, to (but
61
Table of Contents
excluding) the date of redemption. If a change of control triggering event (as defined in the indenture governing these notes) occurs, we are obligated to make an offer to purchase the then outstanding 5.25% senior notes at a redemption price of 101.0% of the principal amount, plus accrued and unpaid interest, if any, to the date of purchase. The amount of the 5.25% senior notes included in the accompanying consolidated balance sheets set forth in Item 8 of this Annual Report was $426.8 million at December 31, 2014.
On March 14, 2013, CBRE issued $800.0 million in aggregate principal amount of 5.00% senior notes due March 15, 2023. The 5.00% senior notes are unsecured obligations of CBRE, senior to all of its current and future subordinated indebtedness, but effectively subordinated to all of its current and future secured indebtedness. The 5.00% senior notes are jointly and severally guaranteed on a senior basis by us and each domestic subsidiary of CBRE that guarantees our 2015 Credit Agreement. Interest accrues at a rate of 5.00% per year and is payable semi-annually in arrears on March 15 and September 15, beginning on September 15, 2013. The 5.00% senior notes are redeemable at our option, in whole or in part, on or after March 15, 2018 at a redemption price of 102.5% of the principal amount on that date and at declining prices thereafter. At any time prior to March 15, 2016, we may redeem up to 35.0% of the original principal amount of the 5.00% senior notes using the net cash proceeds from certain public offerings. In addition, at any time prior to March 15, 2018, the 5.00% senior notes may be redeemed by us, in whole or in part, at a redemption price equal to 100.0% of the principal amount, plus accrued and unpaid interest, if any, to the date of redemption, and an applicable premium (as defined in the indenture governing these notes), which is based on the excess of the present value of the March 15, 2018 redemption price plus all remaining interest payments through March 15, 2018, over the principal amount of the 5.00% senior notes on such redemption date. If a change of control triggering event (as defined in the indenture governing these notes) occurs, we are obligated to make an offer to purchase the then outstanding 5.00% senior notes at a redemption price of 101.0% of the principal amount, plus accrued and unpaid interest, if any. The amount of the 5.00% senior notes included in the accompanying consolidated balance sheets set forth in Item 8 of this Annual Report was $800.0 million at both December 31, 2014 and 2013.
On October 8, 2010, CBRE issued $350.0 million in aggregate principal amount of 6.625% senior notes due October 15, 2020. The 6.625% senior notes were unsecured obligations of CBRE, senior to all of its current and future subordinated indebtedness, but effectively subordinated to all of its current and future secured indebtedness. The 6.625% senior notes were jointly and severally guaranteed on a senior basis by us and each domestic subsidiary of CBRE that guarantees our 2015 Credit Agreement. Interest accrued at a rate of 6.625% per year and was payable semi-annually in arrears on April 15 and October 15, having commenced on April 15, 2011. The 6.625% senior notes were redeemable at our option, in whole or in part, on or after October 15, 2014 at a redemption price of 104.969% of the principal amount on that date and at declining prices thereafter. In addition, at any time prior to October 15, 2014, the 6.625% senior notes were redeemable by us, in whole or in part, at a redemption price equal to 100% of the principal amount, plus accrued and unpaid interest and an applicable premium (as defined in the indenture governing these notes), which was based on the greater of 1.00% of the principal amount of the 6.625% senior notes and the excess of the present value of the October 15, 2014 redemption price plus all remaining interest payments through October 15, 2014, over the principal amount of the 6.625% senior notes on such redemption date. We redeemed these notes in full on October 27, 2014 in accordance with the provisions of the notes and associated indenture. In connection with this early redemption, we incurred charges of $23.1 million, including a premium of $17.4 million and the write-off of $5.7 million of unamortized deferred financing costs. The amount of the 6.625% senior notes included in the accompanying consolidated balance sheets set forth in Item 8 of this Annual Report was $350.0 million at December 31, 2013.
Our 2015 Credit Agreement and the indentures governing our 5.00% senior notes and 5.25% senior notes contain numerous restrictive covenants that, among other things, limit our ability to incur additional indebtedness, pay dividends or make distributions to stockholders, repurchase capital stock or debt, make investments, sell assets or subsidiary stock, create or permit liens on assets, engage in transactions with affiliates, enter into sale/leaseback transactions, issue subsidiary equity and enter into consolidations or mergers. Our 2015 Credit Agreement also currently requires us to maintain a minimum coverage ratio of EBITDA (as defined in the 2015 Credit Agreement) to total interest expense of 2.00x and a maximum leverage ratio of total debt less
62
Table of Contents
available cash to EBITDA (as defined in the 2015 Credit Agreement) of 4.25x as of the end of each fiscal quarter. Our coverage ratio of EBITDA to total interest expense was 12.34x for the year ended December 31, 2014 and our leverage ratio of total debt less available cash to EBITDA was 1.02x as of December 31, 2014. We may from time to time, in our sole discretion, look for opportunities to refinance or reduce our outstanding debt under our 2015 Credit Agreement and under our 5.00% senior notes and 5.25% senior notes.
From time to time, our indebtedness is rated by certain nationally recognized statistical rating organizations. The interest rates under our 2015 Credit Agreement would be positively impacted if we had two issuer or long-term debt ratings of “investment grade” (as defined in the 2015 Credit Agreement). In addition, changes in these ratings could impact the terms and availability of any future indebtedness.
On June 18, 2009, CBRE issued $450.0 million in aggregate principal amount of 11.625% senior subordinated notes due June 15, 2017 for approximately $435.9 million, net of discount. The 11.625% senior subordinated notes were unsecured senior subordinated obligations of CBRE and were jointly and severally guaranteed on a senior subordinated basis by us and our domestic subsidiaries that guarantee our 2015 Credit Agreement. Interest accrued at a rate of 11.625% per year and was payable semi-annually in arrears on June 15 and December 15. As permitted by the indenture governing these notes, on June 15, 2013, we redeemed all of the 11.625% senior subordinated notes. In connection with this early redemption, we paid a premium of $26.2 million and wrote off $16.1 million of unamortized deferred financing costs and unamortized discount.
We had short-term borrowings of $506.1 million and $517.1 million as of December 31, 2014 and 2013, respectively, with related weighted average interest rates of 1.8% and 1.9%, respectively, which are included in the accompanying consolidated balance sheets set forth in Item 8 of this Annual Report.
On March 2, 2007, we entered into a $50.0 million credit note with Wells Fargo Bank for the purpose of purchasing eligible investments, which include cash equivalents, agency securities, A1/P1 commercial paper and eligible money market funds. The proceeds of this note are not made generally available to us, but instead are deposited in an investment account maintained by Wells Fargo Bank and used and applied solely to purchase eligible investment securities. This agreement has been amended several times and currently provides for a $5.0 million revolving credit note, bears interest at 0.25% and has a maturity date of May 31, 2015. As of December 31, 2014 and 2013, there were no amounts outstanding under this note.
On March 4, 2008, we entered into a $35.0 million credit and security agreement with Bank of America, or BofA, for the purpose of purchasing eligible financial instruments, which include A1/P1 commercial paper, U.S. Treasury securities, Government Sponsored Enterprise, or GSE, discount notes (as defined in the credit and security agreement) and money market funds. The proceeds of this loan are not made generally available to us, but instead are deposited in an investment account maintained by BofA and used and applied solely to purchase eligible financial instruments. This agreement has been amended several times and currently provides for a $5.0 million credit line, bears interest at 1% and has a maturity date of April 30, 2015. As of December 31, 2014 and 2013, there were no amounts outstanding under this agreement.
On August 19, 2008, we entered into a $15.0 million uncommitted facility with First Tennessee Bank for the purpose of purchasing investments, which included cash equivalents, agency securities, A1/P1 commercial paper and eligible money market funds. The proceeds of this facility were not made generally available to us, but instead were held in a collateral account maintained by First Tennessee Bank. This agreement provided for a $4.0 million credit line, bore interest at 0.25% and expired on August 31, 2014. As of both December 31, 2014 and 2013, there were no amounts outstanding under this agreement.
Our wholly-owned subsidiary, CBRE Capital Markets, has the following warehouse lines of credit: credit agreements with JP Morgan Chase Bank, N.A., or JP Morgan, BofA, TD Bank, N.A., or TD Bank, and Capital
63
Table of Contents
One, N.A., or Capital One, for the purpose of funding mortgage loans that will be resold, and a funding arrangement with Federal National Mortgage Association, or Fannie Mae, for the purpose of selling a percentage of certain closed multifamily loans.
On November 15, 2005, CBRE Capital Markets entered into a secured credit agreement with JP Morgan to establish a warehouse line of credit. This agreement has been amended several times and as of December 31, 2014, provided for a $275.0 million line of credit, $100.0 million of which matured on January 15, 2015. This agreement currently provides for a $175.0 million line of credit, bears interest at the daily one-month LIBOR plus 1.90% and has a maturity date of October 26, 2015.
On April 16, 2008, CBRE Capital Markets entered into a secured credit agreement with BofA to establish a warehouse line of credit. This agreement has been amended several times and currently provides for a $400.0 million line of credit and bears interest at the daily one-month LIBOR plus 1.60%. A portion of the line of credit totaling $200.0 million matures on March 23, 2015. The remainder, or $200.0 million, has a maturity date of May 27, 2015.
In August 2009, CBRE Capital Markets entered into a funding arrangement with Fannie Mae under its Multifamily As Soon As Pooled Plus Agreement and its Multifamily As Soon As Pooled Sale Agreement, or ASAP Program. Under the ASAP Program, CBRE Capital Markets may elect, on a transaction by transaction basis, to sell a percentage of certain closed multifamily loans to Fannie Mae on an expedited basis. After all contingencies are satisfied, the ASAP Program requires that CBRE Capital Markets repurchase the interest in the multifamily loan previously sold to Fannie Mae followed by either a full delivery back to Fannie Mae via whole loan execution or a securitization into a mortgage backed security. Under this agreement, the maximum outstanding balance under the ASAP Program cannot exceed $200.0 million and, between the sale date to Fannie Mae and the repurchase date by CBRE Capital Markets, the outstanding balance bears interest and is payable to Fannie Mae at the daily one-month LIBOR plus 1.35% with a LIBOR floor of 0.35%. This arrangement remains in place but is cancelable at any time by Fannie Mae with notice.
On December 21, 2010, CBRE Capital Markets entered into a secured credit agreement with TD Bank to establish a warehouse line of credit. The secured revolving line of credit has been amended several times and currently provides for a $300.0 million line of credit, bears interest at the daily one-month LIBOR plus 1.50% and has a maturity date of June 30, 2015.
On July 30, 2012, CBRE Capital Markets entered into a secured credit agreement with Capital One to establish a warehouse line of credit. This agreement currently provides for a $200.0 million senior secured revolving line of credit, bears interest at the daily one-month LIBOR plus 1.55% and has a maturity date of July 29, 2015.
On September 21, 2012, CBRE Capital Markets entered into a repurchase facility with JP Morgan for additional warehouse capacity pursuant to a Master Repurchase Agreement. This agreement provided for a $200.0 million warehouse facility, bore interest at the daily one-month LIBOR plus 2.25% and expired on January 16, 2014.
On March 17, 2014, CBRE Capital Markets’ wholly-owned subsidiary, CBRE Business Lending, Inc., entered into a secured credit agreement with JP Morgan to establish a line of credit. This agreement currently provides for a $25.0 million secured revolving line of credit, bears interest at daily one-month LIBOR plus 2.75% and has a maturity date of March 16, 2015.
During the year ended December 31, 2014, we had a maximum of $1.1 billion of warehouse lines of credit principal outstanding. As of December 31, 2014 and 2013, we had $501.2 million and $374.6 million, respectively, of warehouse lines of credit principal outstanding, which were included in short-term borrowings in the accompanying consolidated balance sheets set forth in Item 8 of this Annual Report. Additionally, we had
64
Table of Contents
$506.3 million and $381.5 million of mortgage loans held for sale (warehouse receivables), as of December 31, 2014 and 2013, respectively, which substantially represented mortgage loans funded through the lines of credit that, while committed to be purchased, had not yet been purchased and which were also included in the accompanying consolidated balance sheets set forth in Item 8 of this Annual Report.
Pension Liability
Our subsidiaries based in the United Kingdom maintain two contributory defined benefit pension plans to provide retirement benefits to existing and former employees participating in the plans. The underfunded status of our defined benefit pension plans included in pension liability in the accompanying consolidated balance sheets set forth in Item 8 of this Annual Report was $92.9 million and $68.0 million at December 31, 2014 and 2013, respectively. We expect to contribute a total of $6.1 million to fund our pension plans for the year ending December 31, 2015.
Off-Balance Sheet Arrangements
In January 2008, CBRE Multifamily Capital, Inc., or CBRE MCI, a wholly-owned subsidiary of CBRE Capital Markets, entered into an agreement with Fannie Mae, under Fannie Mae’s Delegated Underwriting and Servicing Lender Program, or DUS Program, to provide financing for multifamily housing with five or more units. Under the DUS Program, CBRE MCI originates, underwrites, closes and services loans without prior approval by Fannie Mae, and in selected cases, is subject to sharing up to one-third of any losses on loans originated under the DUS Program. CBRE MCI has funded loans subject to such loss sharing arrangements with unpaid principal balances of $9.7 billion at December 31, 2014. Additionally, CBRE MCI has funded loans under the DUS Program that are not subject to loss sharing arrangements with unpaid principal balances of approximately $293.7 million at December 31, 2014. CBRE MCI, under its agreement with Fannie Mae, must post cash reserves or other acceptable collateral under formulas established by Fannie Mae to provide for sufficient capital in the event losses occur. As of December 31, 2014 and 2013, CBRE MCI had a $29.0 million letter of credit and $16.6 million of cash deposited, respectively, under this reserve arrangement, and had provided approximately $16.8 million and $13.8 million, respectively, of loan loss accruals. Fannie Mae’s recourse under the DUS Program is limited to the assets of CBRE MCI, which totaled approximately $310.2 million (including $165.9 million of warehouse receivables, a substantial majority of which are pledged against warehouse lines of credit and are therefore not available to Fannie Mae) at December 31, 2014.
We had outstanding letters of credit totaling $40.9 million as of December 31, 2014, excluding letters of credit for which we have outstanding liabilities already accrued on our consolidated balance sheet related to our subsidiaries’ outstanding reserves for claims under certain insurance programs as well as letters of credit related to operating leases. CBRE MCI’s letter of credit totaling $29.0 million referred to in the preceding paragraph represented the majority of the $40.9 million outstanding letters of credit. The remaining letters of credit are primarily executed by us in the ordinary course of business and expire at varying dates through December 2015.
We had guarantees totaling $13.8 million as of December 31, 2014, excluding guarantees related to pension liabilities, consolidated indebtedness and other obligations for which we have outstanding liabilities already accrued on our consolidated balance sheet, and operating leases. The $13.8 million mainly represents guarantees of obligations of unconsolidated subsidiaries, which expire at varying dates through December 2018, as well as various guarantees of management contracts in our operations overseas, which expire at the end of each of the respective agreements.
In addition, as of December 31, 2014, we had numerous completion and budget guarantees relating to development projects. These guarantees are made by us in the ordinary course of our Development Services business. Each of these guarantees requires us to complete construction of the relevant project within a specified timeframe and/or within a specified budget, with us potentially being liable for costs to complete in excess of such timeframe or budget. However, we generally have “guaranteed maximum price” contracts with reputable
65
Table of Contents
general contractors with respect to projects for which we provide these guarantees. These contracts are intended to pass the risk to such contractors. While there can be no assurance, we do not expect to incur any material losses under these guarantees.
An important part of the strategy for our Global Investment Management business involves investing our capital in certain real estate investments with our clients. These co-investments typically range from 2.0% to 5.0% of the equity in a particular fund. As of December 31, 2014, we had aggregate commitments of $19.0 million to fund future co-investments, $12.7 million of which is expected to be funded in 2015. In addition to required future capital contributions, some of the co-investment entities may request additional capital from us and our subsidiaries holding investments in those assets and the failure to provide these contributions could have adverse consequences to our interests in these investments.
Additionally, an important part of our Development Services business strategy is to invest in unconsolidated real estate subsidiaries as a principal (in most cases co-investing with our clients). As of December 31, 2014, we had committed to fund $25.5 million of additional capital to these unconsolidated subsidiaries, which we may be required to fund at any time. Seasonality
A significant portion of our revenue is seasonal, which an investor should keep in mind when comparing our financial condition and results of operations on a quarter-by-quarter basis. Historically, our revenue, operating income, net income and cash flow from operating activities tend to be lowest in the first quarter, and highest in the fourth quarter of each year. Earnings and cash flow have generally been concentrated in the fourth quarter due to the focus on completing sales, financing and leasing transactions prior to calendar year-end. Inflation
Our commissions and other variable costs related to revenue are primarily affected by real estate market supply and demand, which may be affected by general economic conditions including inflation. However, to date, we do not believe that general inflation has had a material impact upon our operations. New Accounting Pronouncements
In May 2014, the FASB issued ASU 2014-09, “ Revenue from Contracts with Customers (Topic 606). ” This ASU requires an entity to recognize the amount of revenue to which it expects to be entitled for the transfer of promised goods or services to customers. The ASU will replace most existing revenue recognition guidance under accounting principles generally accepted in the United States, or GAAP, when it becomes effective on January 1, 2017. This ASU permits the use of either the retrospective or cumulative effect transition method. Early adoption is not permitted. We are evaluating the effect that ASU 2014-09 will have on our consolidated financial statements and related disclosures. We have not yet selected a transition method nor have we determined the effect of this ASU on our ongoing financial reporting.
In February 2015, the FASB issued ASU 2015-02, “ Consolidation (Topic 810): Amendments to the Consolidation Analysis. ” This ASU provides consolidation guidance for legal entities such as limited partnerships, limited liability corporations and securitization structures. This ASU offers updated consolidation evaluation criteria and may require additional disclosure requirements. ASU 2015-02 is effective for fiscal years, and interim periods within those years, beginning after December 15, 2016. We do not believe the adoption of this update will have a material impact on our consolidated financial position, results of operations or disclosure requirements of our consolidated financial statements.
66
Table of Contents
Item 7A. Quantitative and Qualitative Disclosures About Market Risk
Our exposure to market risk primarily consists of foreign currency exchange rate fluctuations related to our international operations and changes in interest rates on debt obligations. We manage such risk primarily by managing the amount, sources, and duration of our debt funding and by using derivative financial instruments. We apply the “ Derivatives and Hedging ” Topic of the Financial Accounting Standards Board (FASB) Accounting Standards Codification (ASC) (Topic 815) when accounting for derivative financial instruments. In all cases, we view derivative financial instruments as a risk management tool and, accordingly, do not use derivatives for trading or speculative purposes.
Exchange Rates
Certain of our foreign operations expose us to fluctuations in foreign exchange rates. These fluctuations may impact the value of our cash receipts and payments in terms of our functional currency. During the year ended December 31, 2014, approximately 44% of our business was transacted in local currencies of foreign countries, the majority of which includes the Australian dollar, Brazilian real, British pound sterling, Canadian dollar, Chinese yuan, Euro, Indian rupee, Japanese yen and Singapore dollar. We enter into derivative financial instruments to attempt to protect the value or fix the amount of certain obligations in terms of our reporting currency, the U.S. dollar.
In March 2014, we began a foreign currency exchange forward hedging program by entering into 38 foreign currency exchange forward contracts, including agreements to buy U.S. dollars and sell Australian dollars, Canadian dollars, Japanese yen, Euros, and British pound sterling covering an initial notional amount of $209.7 million. The purpose of these forward contracts is to attempt to mitigate the risk of fluctuations in foreign currency exchange rates that would adversely impact some of our foreign currency denominated EBITDA. Hedge accounting was not elected for any of these contracts. As such, changes in the fair values of these contracts are recorded directly in earnings. Included in the consolidated statement of operations set forth in Item 8 of this Annual Report were net gains of $5.3 million for the year ended December 31, 2014 resulting from net gains on foreign currency exchange forward contracts. As of December 31, 2014, we had 52 foreign currency exchange forward contracts outstanding covering a notional amount of $302.0 million. As of December 31, 2014, the fair value of forward contracts with two counterparties aggregated to a $0.5 million asset position, which was included in other current assets in the accompanying consolidated balance sheets set forth in Item 8 of this Annual Report. As of December 31, 2014, the fair value of forward contracts with four counterparties aggregated to a $1.3 million liability position, which was included in other current liabilities in the accompanying consolidated balance sheets set forth in Item 8 of this Annual Report.
We also routinely monitor our exposure to currency exchange rate changes in connection with certain transactions and sometimes enter into foreign currency exchange option and forward contracts to limit our exposure to such transactions, as appropriate. In the normal course of business, we also sometimes utilize derivative financial instruments in the form of foreign currency exchange contracts to attempt to mitigate foreign currency exchange exposure resulting from intercompany loans. Included in the consolidated statements of operations set forth in Item 8 of this Annual Report were net gains of $4.3 million for the year ended December 31, 2014 and net losses of $1.8 million for the year ended December 31, 2013, resulting from net gains/losses on foreign currency exchange option and forward contracts. As of December 31, 2014, the fair value of such contracts with one counterparty aggregated to a $0.8 million asset position, which was included in other current assets in the accompanying consolidated balance sheets set forth in Item 8 of this Annual Report. As of December 31, 2014, the fair value of forward contracts with one counterparty aggregated to a $0.1 million liability position, which was included in other current liabilities in the accompanying consolidated balance sheets set forth in Item 8 of this Annual Report.
67
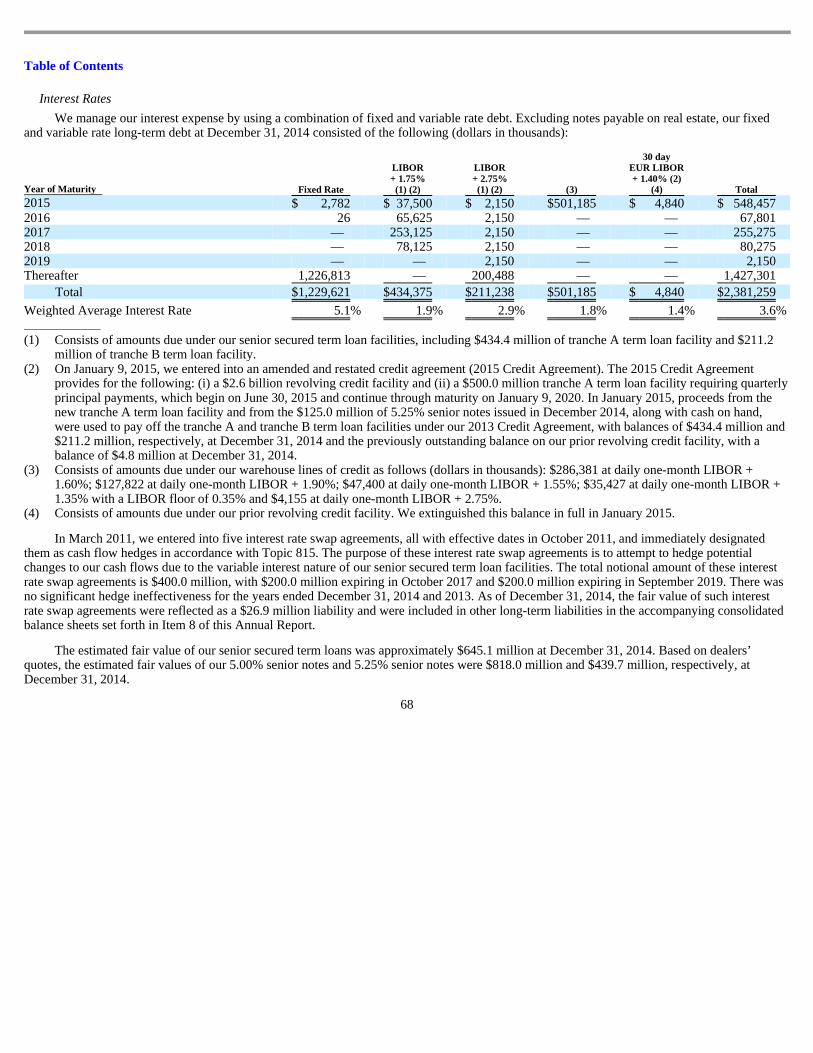
Table of Contents
Interest Rates
We manage our interest expense by using a combination of fixed and variable rate debt. Excluding notes payable on real estate, our fixed and variable rate long-term debt at December 31, 2014 consisted of the following (dollars in thousands):
In March 2011, we entered into five interest rate swap agreements, all with effective dates in October 2011, and immediately designated
them as cash flow hedges in accordance with Topic 815. The purpose of these interest rate swap agreements is to attempt to hedge potential changes to our cash flows due to the variable interest nature of our senior secured term loan facilities. The total notional amount of these interest rate swap agreements is $400.0 million, with $200.0 million expiring in October 2017 and $200.0 million expiring in September 2019. There was no significant hedge ineffectiveness for the years ended December 31, 2014 and 2013. As of December 31, 2014, the fair value of such interest rate swap agreements were reflected as a $26.9 million liability and were included in other long-term liabilities in the accompanying consolidated balance sheets set forth in Item 8 of this Annual Report.
The estimated fair value of our senior secured term loans was approximately $645.1 million at December 31, 2014. Based on dealers’ quotes, the estimated fair values of our 5.00% senior notes and 5.25% senior notes were $818.0 million and $439.7 million, respectively, at December 31, 2014.
68
Year of Maturity Fixed Rate
LIBOR + 1.75% (1) (2)
LIBOR + 2.75% (1) (2) (3)
30 day EUR LIBOR + 1.40% (2)
(4) Total 2015 $ 2,782 $ 37,500 $ 2,150 $ 501,185 $ 4,840 $ 548,457 2016 26 65,625 2,150 — — 67,801 2017 — 253,125 2,150 — — 255,275 2018 — 78,125 2,150 — — 80,275 2019 — — 2,150 — — 2,150 Thereafter 1,226,813 — 200,488 — — 1,427,301
Total $ 1,229,621 $ 434,375 $ 211,238 $ 501,185 $ 4,840 $ 2,381,259
Weighted Average Interest Rate 5.1 % 1.9 % 2.9 % 1.8 % 1.4 % 3.6 %
(1) Consists of amounts due under our senior secured term loan facilities, including $434.4 million of tranche A term loan facility and $211.2
million of tranche B term loan facility. (2) On January 9, 2015, we entered into an amended and restated credit agreement (2015 Credit Agreement). The 2015 Credit Agreement
provides for the following: (i) a $2.6 billion revolving credit facility and (ii) a $500.0 million tranche A term loan facility requiring quarterly principal payments, which begin on June 30, 2015 and continue through maturity on January 9, 2020. In January 2015, proceeds from the new tranche A term loan facility and from the $125.0 million of 5.25% senior notes issued in December 2014, along with cash on hand, were used to pay off the tranche A and tranche B term loan facilities under our 2013 Credit Agreement, with balances of $434.4 million and $211.2 million, respectively, at December 31, 2014 and the previously outstanding balance on our prior revolving credit facility, with a balance of $4.8 million at December 31, 2014.
(3) Consists of amounts due under our warehouse lines of credit as follows (dollars in thousands): $286,381 at daily one-month LIBOR + 1.60%; $127,822 at daily one-month LIBOR + 1.90%; $47,400 at daily one-month LIBOR + 1.55%; $35,427 at daily one-month LIBOR + 1.35% with a LIBOR floor of 0.35% and $4,155 at daily one-month LIBOR + 2.75%.
(4) Consists of amounts due under our prior revolving credit facility. We extinguished this balance in full in January 2015.

Table of Contents
We utilize sensitivity analyses to assess the potential effect of our variable rate debt. If interest rates were to increase by 10.0% on our outstanding variable rate debt, excluding notes payable on real estate, at December 31, 2014, the net impact of the additional interest cost would be a decrease of $2.4 million on pre-tax income and a decrease of $2.4 million on cash provided by operating activities for the year ended December 31, 2014.
We also have $42.8 million of notes payable on real estate as of December 31, 2014. These notes have interest rates ranging from 2.41% to 10.0% with maturity dates extending through 2023. Interest costs relating to notes payable on real estate include both interest that is expensed and interest that is capitalized as part of the cost of real estate. If interest rates were to increase by 10.0%, our total estimated interest cost related to notes payable would increase by approximately $0.2 million for the year ended December 31, 2014. From time to time, we enter into interest rate swap and cap agreements in order to limit our interest expense related to our notes payable on real estate. If any of these agreements are not designated as effective hedges, then they are marked to market each period with the change in fair value recognized in current period earnings. The net impact on our earnings resulting from gains and/or losses on interest rate swap and cap agreements associated with notes payable on real estate has not been significant.
We also enter into loan commitments that relate to the origination of commercial mortgage loans that will be held for resale. FASB ASC Topic 815 requires that these commitments be recorded at their fair values as derivatives. Included in the consolidated statements of operations set forth in Item 8 of this Annual Report were net gains of $2.4 million for the year ended December 31, 2014, resulting from gains on these loan commitments. As of December 31, 2014, the fair value of such contracts with three counterparties aggregated to a $2.4 million asset position, which was included in other current assets in the accompanying consolidated balance sheets set forth in Item 8 of this Annual Report. The net impact on our financial position and earnings resulting from loan commitments for years prior to 2014 was not significant.
69
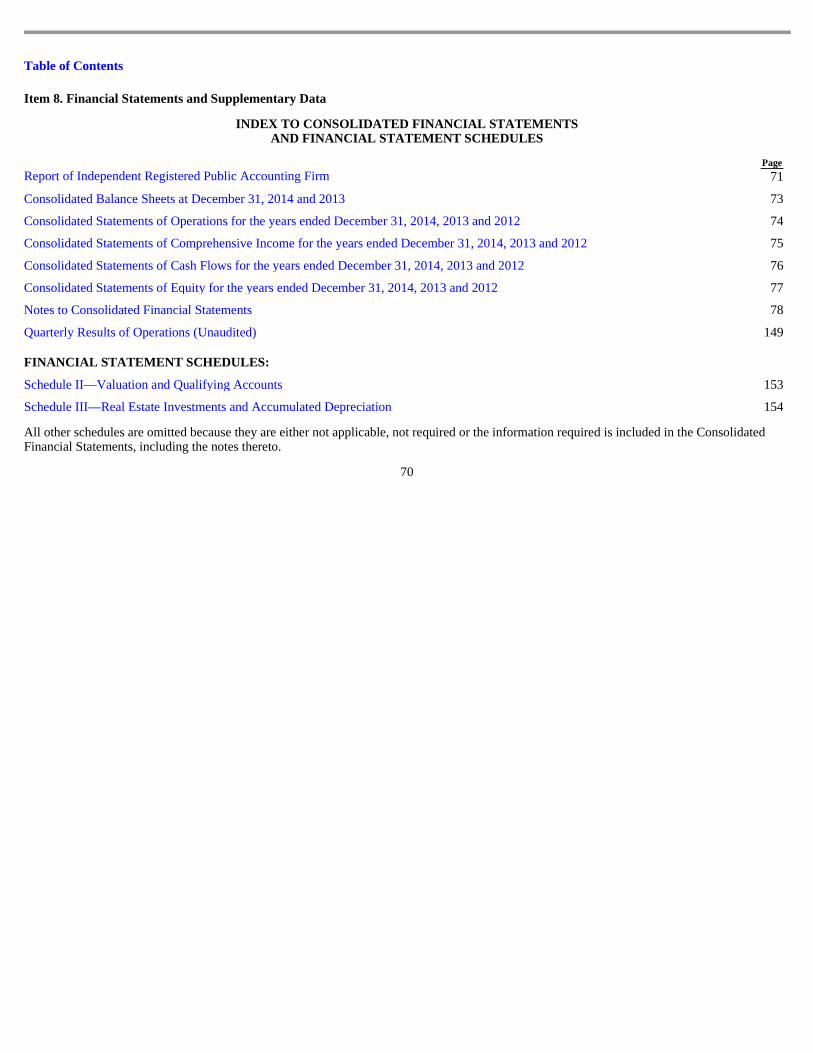
Table of Contents
Item 8. Financial Statements and Supplementary Data
INDEX TO CONSOLIDATED FINANCIAL STATEMENTS AND FINANCIAL STATEMENT SCHEDULES
All other schedules are omitted because they are either not applicable, not required or the information required is included in the Consolidated Financial Statements, including the notes thereto.
70
Page Report of Independent Registered Public Accounting Firm 71
Consolidated Balance Sheets at December 31, 2014 and 2013 73
Consolidated Statements of Operations for the years ended December 31, 2014, 2013 and 2012 74
Consolidated Statements of Comprehensive Income for the years ended December 31, 2014, 2013 and 2012 75
Consolidated Statements of Cash Flows for the years ended December 31, 2014, 2013 and 2012 76
Consolidated Statements of Equity for the years ended December 31, 2014, 2013 and 2012 77
Notes to Consolidated Financial Statements 78
Quarterly Results of Operations (Unaudited) 149
FINANCIAL STATEMENT SCHEDULES:
Schedule II—Valuation and Qualifying Accounts 153
Schedule III—Real Estate Investments and Accumulated Depreciation 154

Table of Contents
REPORT OF INDEPENDENT REGISTERED PUBLIC ACCOUNTING FIRM The Board of Directors and Stockholders CBRE Group, Inc.: We have audited the accompanying consolidated balance sheets of CBRE Group, Inc. (the Company) and subsidiaries as of December 31, 2014 and 2013, and the related consolidated statements of operations, comprehensive income, cash flows and equity for each of the years in the three-year period ended December 31, 2014. In connection with our audits of the consolidated financial statements, we also have audited the related financial statement schedules. We also have audited the Company’s internal control over financial reporting as of December 31, 2014, based on criteria established in Internal Control – Integrated Framework (2013) issued by the Committee of Sponsoring Organizations of the Treadway Commission (COSO). The Company’s management is responsible for these consolidated financial statements and financial statement schedules, for maintaining effective internal control over financial reporting, and for its assessment of the effectiveness of internal control over financial reporting, included in the accompanying Management’s Report on Internal Control Over Financial Reporting . Our responsibility is to express an opinion on these consolidated financial statements and financial statement schedules and an opinion on the Company’s internal control over financial reporting based on our audits. We conducted our audits in accordance with the standards of the Public Company Accounting Oversight Board (United States). Those standards require that we plan and perform the audits to obtain reasonable assurance about whether the financial statements are free of material misstatement and whether effective internal control over financial reporting was maintained in all material respects. Our audits of the consolidated financial statements included examining, on a test basis, evidence supporting the amounts and disclosures in the financial statements, assessing the accounting principles used and significant estimates made by management, and evaluating the overall financial statement presentation. Our audit of internal control over financial reporting included obtaining an understanding of internal control over financial reporting, assessing the risk that a material weakness exists, and testing and evaluating the design and operating effectiveness of internal control based on the assessed risk. Our audits also included performing such other procedures as we considered necessary in the circumstances. We believe that our audits provide a reasonable basis for our opinions. A company’s internal control over financial reporting is a process designed to provide reasonable assurance regarding the reliability of financial reporting and the preparation of financial statements for external purposes in accordance with generally accepted accounting principles. A company’s internal control over financial reporting includes those policies and procedures that (1) pertain to the maintenance of records that, in reasonable detail, accurately and fairly reflect the transactions and dispositions of the assets of the company; (2) provide reasonable assurance that transactions are recorded as necessary to permit preparation of financial statements in accordance with generally accepted accounting principles, and that receipts and expenditures of the company are being made only in accordance with authorizations of management and directors of the company; and (3) provide reasonable assurance regarding prevention or timely detection of unauthorized acquisition, use, or disposition of the company’s assets that could have a material effect on the financial statements. Because of its inherent limitations, internal control over financial reporting may not prevent or detect misstatements. Also, projections of any evaluation of effectiveness to future periods are subject to the risk that controls may become inadequate because of changes in conditions, or that the degree of compliance with the policies or procedures may deteriorate. In our opinion, the consolidated financial statements referred to above present fairly, in all material respects, the financial position of CBRE Group, Inc. and subsidiaries as of December 31, 2014 and 2013, and the results of their operations and their cash flows for each of the years in the three-year period ended December 31, 2014, in conformity with U.S. generally accepted accounting principles. Also in our opinion, the related financial statement schedules, when considered in relation to the basic consolidated financial statements taken as a whole,
71

Table of Contents
present fairly, in all material respects, the information set forth therein. Also in our opinion, CBRE Group, Inc. maintained, in all material respects, effective internal control over financial reporting as of December 31, 2014, based on criteria established in Internal Control – Integrated Framework (2013) issued by the Committee of Sponsoring Organizations of the Treadway Commission. As discussed in Note 2 to the financial statements, effective January 1, 2014, the Company adopted Financial Accounting Standards Board Accounting Standards Update No. 2014-08, Presentation of Financial Statements (Topic 205) and Property, Plant, and Equipment (Topic 360): Reporting Discontinued Operations and Disclosures of Disposals of Components of an Entity. /s/ KPMG LLP Los Angeles, California March 2, 2015
72
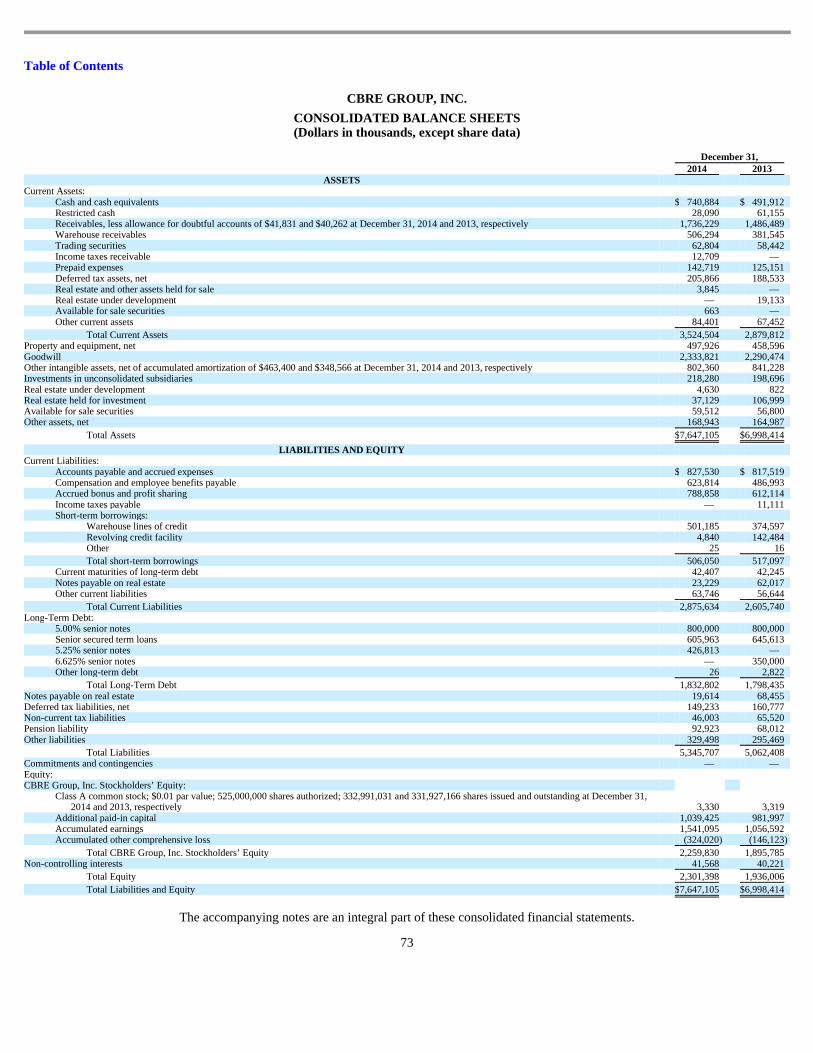
Table of Contents
CBRE GROUP, INC.
CONSOLIDATED BALANCE SHEETS (Dollars in thousands, except share data)
The accompanying notes are an integral part of these consolidated financial statements.
73
December 31, 2014 2013
ASSETS Current Assets:
Cash and cash equivalents $ 740,884 $ 491,912 Restricted cash 28,090 61,155 Receivables, less allowance for doubtful accounts of $41,831 and $40,262 at December 31, 2014 and 2013, respectively 1,736,229 1,486,489 Warehouse receivables 506,294 381,545 Trading securities 62,804 58,442 Income taxes receivable 12,709 — Prepaid expenses 142,719 125,151 Deferred tax assets, net 205,866 188,533 Real estate and other assets held for sale 3,845 — Real estate under development — 19,133 Available for sale securities 663 — Other current assets 84,401 67,452
Total Current Assets 3,524,504 2,879,812 Property and equipment, net 497,926 458,596 Goodwill 2,333,821 2,290,474 Other intangible assets, net of accumulated amortization of $463,400 and $348,566 at December 31, 2014 and 2013, respectively 802,360 841,228 Investments in unconsolidated subsidiaries 218,280 198,696 Real estate under development 4,630 822 Real estate held for investment 37,129 106,999 Available for sale securities 59,512 56,800 Other assets, net 168,943 164,987
Total Assets $ 7,647,105 $ 6,998,414
LIABILITIES AND EQUITY Current Liabilities:
Accounts payable and accrued expenses $ 827,530 $ 817,519 Compensation and employee benefits payable 623,814 486,993 Accrued bonus and profit sharing 788,858 612,114 Income taxes payable — 11,111 Short-term borrowings:
Warehouse lines of credit 501,185 374,597 Revolving credit facility 4,840 142,484 Other 25 16
Total short-term borrowings 506,050 517,097 Current maturities of long-term debt 42,407 42,245 Notes payable on real estate 23,229 62,017 Other current liabilities 63,746 56,644
Total Current Liabilities 2,875,634 2,605,740 Long-Term Debt:
5.00% senior notes 800,000 800,000 Senior secured term loans 605,963 645,613 5.25% senior notes 426,813 — 6.625% senior notes — 350,000 Other long-term debt 26 2,822
Total Long-Term Debt 1,832,802 1,798,435 Notes payable on real estate 19,614 68,455 Deferred tax liabilities, net 149,233 160,777 Non-current tax liabilities 46,003 65,520 Pension liability 92,923 68,012 Other liabilities 329,498 295,469
Total Liabilities 5,345,707 5,062,408 Commitments and contingencies — — Equity: CBRE Group, Inc. Stockholders’ Equity:
Class A common stock; $0.01 par value; 525,000,000 shares authorized; 332,991,031 and 331,927,166 shares issued and outstanding at December 31, 2014 and 2013, respectively 3,330 3,319
Additional paid-in capital 1,039,425 981,997 Accumulated earnings 1,541,095 1,056,592 Accumulated other comprehensive loss (324,020 ) (146,123 )
Total CBRE Group, Inc. Stockholders’ Equity 2,259,830 1,895,785 Non-controlling interests 41,568 40,221
Total Equity 2,301,398 1,936,006
Total Liabilities and Equity $ 7,647,105 $ 6,998,414
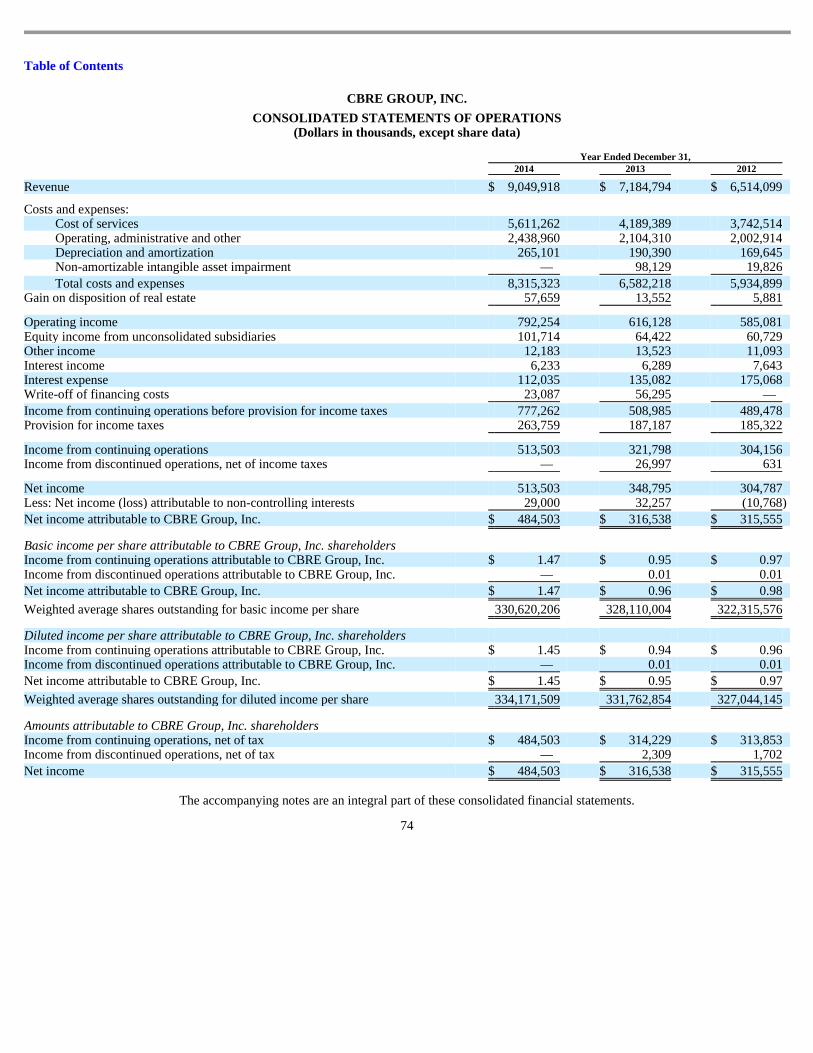
Table of Contents
CBRE GROUP, INC.
CONSOLIDATED STATEMENTS OF OPERATIONS (Dollars in thousands, except share data)
The accompanying notes are an integral part of these consolidated financial statements.
74
Year Ended December 31, 2014 2013 2012
Revenue $ 9,049,918 $ 7,184,794 $ 6,514,099
Costs and expenses: Cost of services 5,611,262 4,189,389 3,742,514 Operating, administrative and other 2,438,960 2,104,310 2,002,914 Depreciation and amortization 265,101 190,390 169,645 Non-amortizable intangible asset impairment — 98,129 19,826
Total costs and expenses 8,315,323 6,582,218 5,934,899 Gain on disposition of real estate 57,659 13,552 5,881
Operating income 792,254 616,128 585,081 Equity income from unconsolidated subsidiaries 101,714 64,422 60,729 Other income 12,183 13,523 11,093 Interest income 6,233 6,289 7,643 Interest expense 112,035 135,082 175,068 Write-off of financing costs 23,087 56,295 —
Income from continuing operations before provision for income taxes 777,262 508,985 489,478 Provision for income taxes 263,759 187,187 185,322
Income from continuing operations 513,503 321,798 304,156 Income from discontinued operations, net of income taxes — 26,997 631
Net income 513,503 348,795 304,787 Less: Net income (loss) attributable to non-controlling interests 29,000 32,257 (10,768 )
Net income attributable to CBRE Group, Inc. $ 484,503 $ 316,538 $ 315,555
Basic income per share attributable to CBRE Group, Inc. shareholders Income from continuing operations attributable to CBRE Group, Inc. $ 1.47 $ 0.95 $ 0.97 Income from discontinued operations attributable to CBRE Group, Inc. — 0.01 0.01
Net income attributable to CBRE Group, Inc. $ 1.47 $ 0.96 $ 0.98
Weighted average shares outstanding for basic income per share 330,620,206 328,110,004 322,315,576
Diluted income per share attributable to CBRE Group, Inc. shareholders
Income from continuing operations attributable to CBRE Group, Inc. $ 1.45 $ 0.94 $ 0.96 Income from discontinued operations attributable to CBRE Group, Inc. — 0.01 0.01
Net income attributable to CBRE Group, Inc. $ 1.45 $ 0.95 $ 0.97
Weighted average shares outstanding for diluted income per share 334,171,509 331,762,854 327,044,145
Amounts attributable to CBRE Group, Inc. shareholders Income from continuing operations, net of tax $ 484,503 $ 314,229 $ 313,853 Income from discontinued operations, net of tax — 2,309 1,702
Net income $ 484,503 $ 316,538 $ 315,555
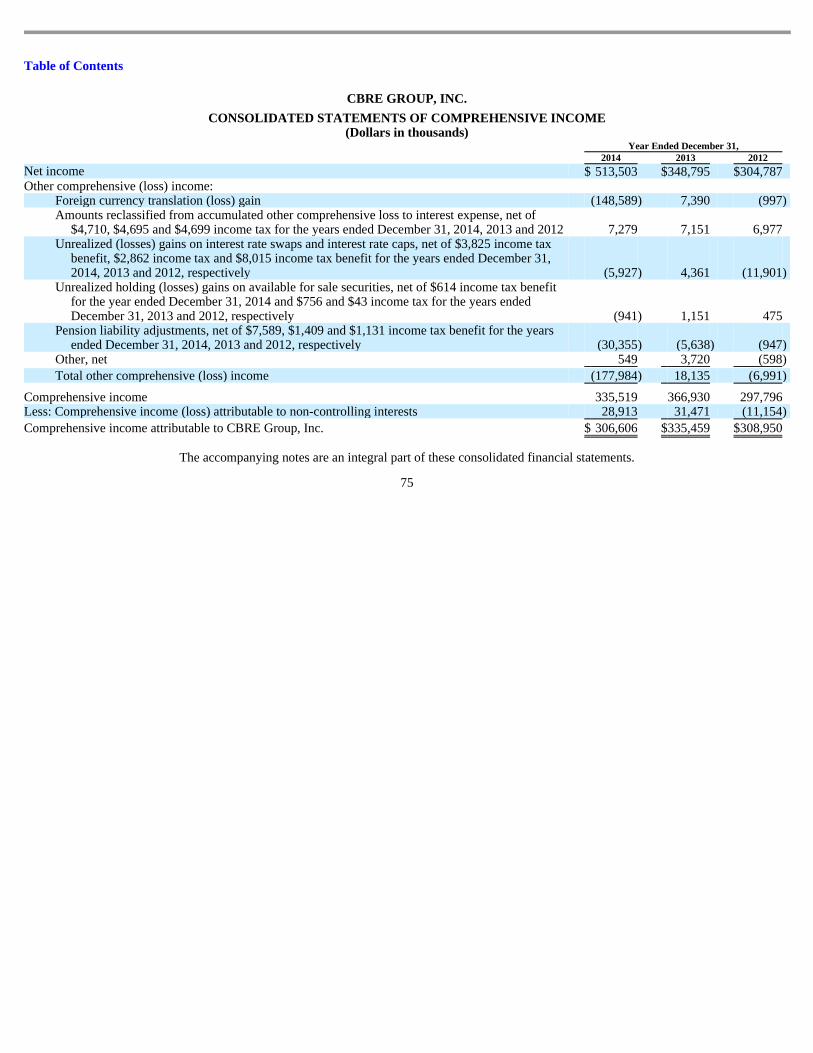
Table of Contents
CBRE GROUP, INC.
CONSOLIDATED STATEMENTS OF COMPREHENSIVE INCOME (Dollars in thousands)
The accompanying notes are an integral part of these consolidated financial statements.
75
Year Ended December 31, 2014 2013 2012 Net income $ 513,503 $ 348,795 $ 304,787 Other comprehensive (loss) income:
Foreign currency translation (loss) gain (148,589 ) 7,390 (997 ) Amounts reclassified from accumulated other comprehensive loss to interest expense, net of
$4,710, $4,695 and $4,699 income tax for the years ended December 31, 2014, 2013 and 2012 7,279 7,151 6,977 Unrealized (losses) gains on interest rate swaps and interest rate caps, net of $3,825 income tax
benefit, $2,862 income tax and $8,015 income tax benefit for the years ended December 31, 2014, 2013 and 2012, respectively (5,927 ) 4,361 (11,901 )
Unrealized holding (losses) gains on available for sale securities, net of $614 income tax benefit for the year ended December 31, 2014 and $756 and $43 income tax for the years ended December 31, 2013 and 2012, respectively (941 ) 1,151 475
Pension liability adjustments, net of $7,589, $1,409 and $1,131 income tax benefit for the years ended December 31, 2014, 2013 and 2012, respectively (30,355 ) (5,638 ) (947 )
Other, net 549 3,720 (598 )
Total other comprehensive (loss) income (177,984 ) 18,135 (6,991 )
Comprehensive income 335,519 366,930 297,796 Less: Comprehensive income (loss) attributable to non-controlling interests 28,913 31,471 (11,154 )
Comprehensive income attributable to CBRE Group, Inc. $ 306,606 $ 335,459 $ 308,950
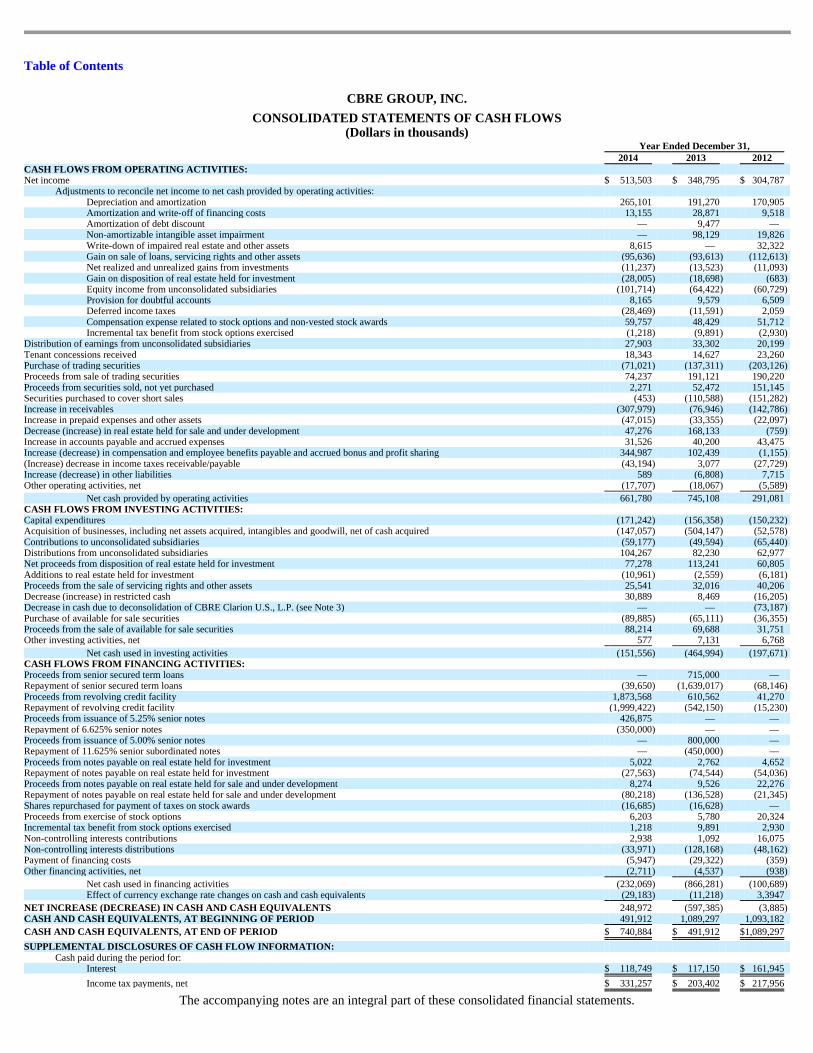
Table of Contents
CBRE GROUP, INC.
CONSOLIDATED STATEMENTS OF CASH FLOWS (Dollars in thousands)
The accompanying notes are an integral part of these consolidated financial statements.
Year Ended December 31, 2014 2013 2012 CASH FLOWS FROM OPERATING ACTIVITIES: Net income $ 513,503 $ 348,795 $ 304,787
Adjustments to reconcile net income to net cash provided by operating activities: Depreciation and amortization 265,101 191,270 170,905 Amortization and write-off of financing costs 13,155 28,871 9,518 Amortization of debt discount — 9,477 — Non-amortizable intangible asset impairment — 98,129 19,826 Write-down of impaired real estate and other assets 8,615 — 32,322 Gain on sale of loans, servicing rights and other assets (95,636 ) (93,613 ) (112,613 ) Net realized and unrealized gains from investments (11,237 ) (13,523 ) (11,093 ) Gain on disposition of real estate held for investment (28,005 ) (18,698 ) (683 ) Equity income from unconsolidated subsidiaries (101,714 ) (64,422 ) (60,729 ) Provision for doubtful accounts 8,165 9,579 6,509 Deferred income taxes (28,469 ) (11,591 ) 2,059 Compensation expense related to stock options and non-vested stock awards 59,757 48,429 51,712 Incremental tax benefit from stock options exercised (1,218 ) (9,891 ) (2,930 )
Distribution of earnings from unconsolidated subsidiaries 27,903 33,302 20,199 Tenant concessions received 18,343 14,627 23,260 Purchase of trading securities (71,021 ) (137,311 ) (203,126 ) Proceeds from sale of trading securities 74,237 191,121 190,220 Proceeds from securities sold, not yet purchased 2,271 52,472 151,145 Securities purchased to cover short sales (453 ) (110,588 ) (151,282 ) Increase in receivables (307,979 ) (76,946 ) (142,786 ) Increase in prepaid expenses and other assets (47,015 ) (33,355 ) (22,097 ) Decrease (increase) in real estate held for sale and under development 47,276 168,133 (759 ) Increase in accounts payable and accrued expenses 31,526 40,200 43,475 Increase (decrease) in compensation and employee benefits payable and accrued bonus and profit sharing 344,987 102,439 (1,155 ) (Increase) decrease in income taxes receivable/payable (43,194 ) 3,077 (27,729 ) Increase (decrease) in other liabilities 589 (6,808 ) 7,715 Other operating activities, net (17,707 ) (18,067 ) (5,589 )
Net cash provided by operating activities 661,780 745,108 291,081 CASH FLOWS FROM INVESTING ACTIVITIES: Capital expenditures (171,242 ) (156,358 ) (150,232 ) Acquisition of businesses, including net assets acquired, intangibles and goodwill, net of cash acquired (147,057 ) (504,147 ) (52,578 ) Contributions to unconsolidated subsidiaries (59,177 ) (49,594 ) (65,440 ) Distributions from unconsolidated subsidiaries 104,267 82,230 62,977 Net proceeds from disposition of real estate held for investment 77,278 113,241 60,805 Additions to real estate held for investment (10,961 ) (2,559 ) (6,181 ) Proceeds from the sale of servicing rights and other assets 25,541 32,016 40,206 Decrease (increase) in restricted cash 30,889 8,469 (16,205 ) Decrease in cash due to deconsolidation of CBRE Clarion U.S., L.P. (see Note 3) — — (73,187 ) Purchase of available for sale securities (89,885 ) (65,111 ) (36,355 ) Proceeds from the sale of available for sale securities 88,214 69,688 31,751 Other investing activities, net 577 7,131 6,768
Net cash used in investing activities (151,556 ) (464,994 ) (197,671 ) CASH FLOWS FROM FINANCING ACTIVITIES: Proceeds from senior secured term loans — 715,000 — Repayment of senior secured term loans (39,650 ) (1,639,017 ) (68,146 ) Proceeds from revolving credit facility 1,873,568 610,562 41,270 Repayment of revolving credit facility (1,999,422 ) (542,150 ) (15,230 ) Proceeds from issuance of 5.25% senior notes 426,875 — — Repayment of 6.625% senior notes (350,000 ) — — Proceeds from issuance of 5.00% senior notes — 800,000 — Repayment of 11.625% senior subordinated notes — (450,000 ) — Proceeds from notes payable on real estate held for investment 5,022 2,762 4,652 Repayment of notes payable on real estate held for investment (27,563 ) (74,544 ) (54,036 ) Proceeds from notes payable on real estate held for sale and under development 8,274 9,526 22,276 Repayment of notes payable on real estate held for sale and under development (80,218 ) (136,528 ) (21,345 ) Shares repurchased for payment of taxes on stock awards (16,685 ) (16,628 ) — Proceeds from exercise of stock options 6,203 5,780 20,324 Incremental tax benefit from stock options exercised 1,218 9,891 2,930 Non-controlling interests contributions 2,938 1,092 16,075 Non-controlling interests distributions (33,971 ) (128,168 ) (48,162 ) Payment of financing costs (5,947 ) (29,322 ) (359 ) Other financing activities, net (2,711 ) (4,537 ) (938 )
Net cash used in financing activities (232,069 ) (866,281 ) (100,689 ) Effect of currency exchange rate changes on cash and cash equivalents (29,183 ) (11,218 ) 3,3947
NET INCREASE (DECREASE) IN CASH AND CASH EQUIVALENT S 248,972 (597,385 ) (3,885 ) CASH AND CASH EQUIVALENTS, AT BEGINNING OF PERIOD 491,912 1,089,297 1,093,182
CASH AND CASH EQUIVALENTS, AT END OF PERIOD $ 740,884 $ 491,912 $ 1,089,297
SUPPLEMENTAL DISCLOSURES OF CASH FLOW INFORMATION: Cash paid during the period for:
Interest $ 118,749 $ 117,150 $ 161,945
Income tax payments, net $ 331,257 $ 203,402 $ 217,956

76
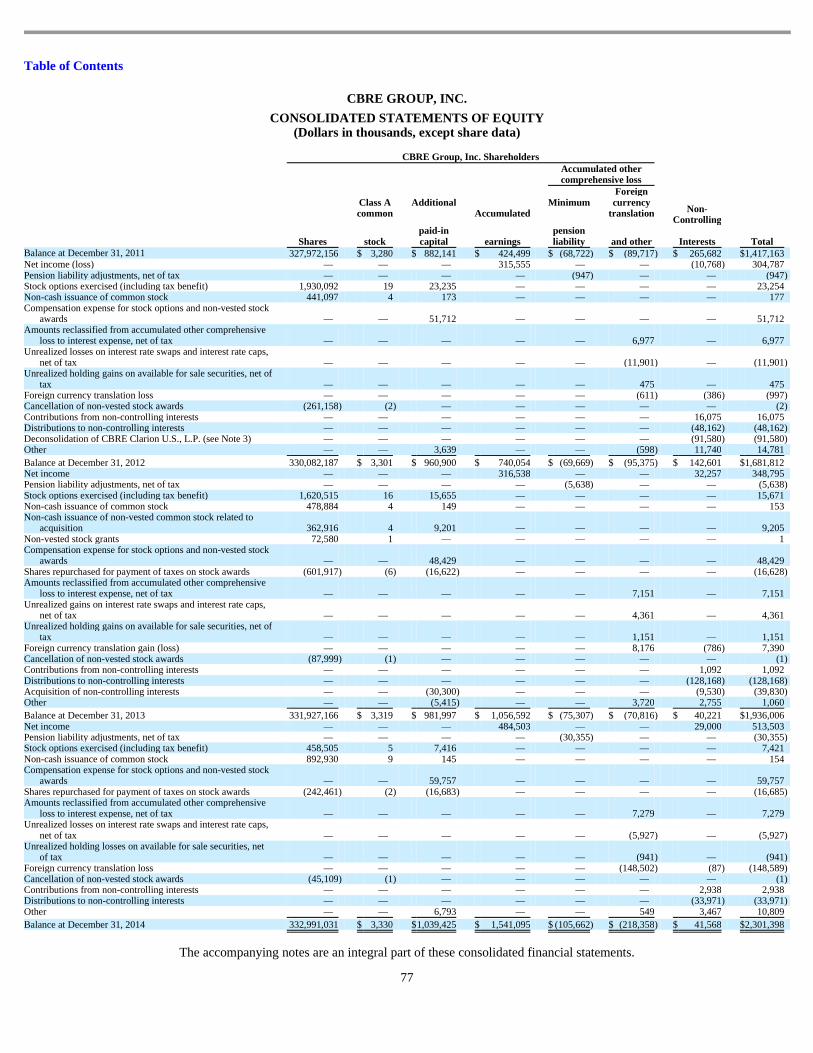
Table of Contents
CBRE GROUP, INC.
CONSOLIDATED STATEMENTS OF EQUITY (Dollars in thousands, except share data)
The accompanying notes are an integral part of these consolidated financial statements.
77
CBRE Group, Inc. Shareholders
Accumulated other comprehensive loss
Shares
Class A common
stock
Additional
paid-in capital
Accumulated
earnings
Minimum
pension liability
Foreign currency
translation
and other
Non- Controlling
Interests Total
Balance at December 31, 2011 327,972,156 $ 3,280 $ 882,141 $ 424,499 $ (68,722 ) $ (89,717 ) $ 265,682 $ 1,417,163 Net income (loss) — — — 315,555 — — (10,768 ) 304,787 Pension liability adjustments, net of tax — — — — (947 ) — — (947 ) Stock options exercised (including tax benefit) 1,930,092 19 23,235 — — — — 23,254 Non-cash issuance of common stock 441,097 4 173 — — — — 177 Compensation expense for stock options and non-vested stock
awards — — 51,712 — — — — 51,712 Amounts reclassified from accumulated other comprehensive
loss to interest expense, net of tax — — — — — 6,977 — 6,977 Unrealized losses on interest rate swaps and interest rate caps,
net of tax — — — — — (11,901 ) — (11,901 ) Unrealized holding gains on available for sale securities, net of
tax — — — — — 475 — 475 Foreign currency translation loss — — — — — (611 ) (386 ) (997 ) Cancellation of non-vested stock awards (261,158 ) (2 ) — — — — — (2 ) Contributions from non-controlling interests — — — — — — 16,075 16,075 Distributions to non-controlling interests — — — — — — (48,162 ) (48,162 ) Deconsolidation of CBRE Clarion U.S., L.P. (see Note 3) — — — — — — (91,580 ) (91,580 ) Other — — 3,639 — — (598 ) 11,740 14,781
Balance at December 31, 2012 330,082,187 $ 3,301 $ 960,900 $ 740,054 $ (69,669 ) $ (95,375 ) $ 142,601 $ 1,681,812 Net income — — — 316,538 — — 32,257 348,795 Pension liability adjustments, net of tax — — — — (5,638 ) — — (5,638 ) Stock options exercised (including tax benefit) 1,620,515 16 15,655 — — — — 15,671 Non-cash issuance of common stock 478,884 4 149 — — — — 153 Non-cash issuance of non-vested common stock related to
acquisition 362,916 4 9,201 — — — — 9,205 Non-vested stock grants 72,580 1 — — — — — 1 Compensation expense for stock options and non-vested stock
awards — — 48,429 — — — — 48,429 Shares repurchased for payment of taxes on stock awards (601,917 ) (6 ) (16,622 ) — — — — (16,628 ) Amounts reclassified from accumulated other comprehensive
loss to interest expense, net of tax — — — — — 7,151 — 7,151 Unrealized gains on interest rate swaps and interest rate caps,
net of tax — — — — — 4,361 — 4,361 Unrealized holding gains on available for sale securities, net of
tax — — — — — 1,151 — 1,151 Foreign currency translation gain (loss) — — — — — 8,176 (786 ) 7,390 Cancellation of non-vested stock awards (87,999 ) (1 ) — — — — — (1 ) Contributions from non-controlling interests — — — — — — 1,092 1,092 Distributions to non-controlling interests — — — — — — (128,168 ) (128,168 ) Acquisition of non-controlling interests — — (30,300 ) — — — (9,530 ) (39,830 ) Other — — (5,415 ) — — 3,720 2,755 1,060
Balance at December 31, 2013 331,927,166 $ 3,319 $ 981,997 $ 1,056,592 $ (75,307 ) $ (70,816 ) $ 40,221 $ 1,936,006 Net income — — — 484,503 — — 29,000 513,503 Pension liability adjustments, net of tax — — — — (30,355 ) — — (30,355 ) Stock options exercised (including tax benefit) 458,505 5 7,416 — — — — 7,421 Non-cash issuance of common stock 892,930 9 145 — — — — 154 Compensation expense for stock options and non-vested stock
awards — — 59,757 — — — — 59,757 Shares repurchased for payment of taxes on stock awards (242,461 ) (2 ) (16,683 ) — — — — (16,685 ) Amounts reclassified from accumulated other comprehensive
loss to interest expense, net of tax — — — — — 7,279 — 7,279 Unrealized losses on interest rate swaps and interest rate caps,
net of tax — — — — — (5,927 ) — (5,927 ) Unrealized holding losses on available for sale securities, net
of tax — — — — — (941 ) — (941 ) Foreign currency translation loss — — — — — (148,502 ) (87 ) (148,589 ) Cancellation of non-vested stock awards (45,109 ) (1 ) — — — — — (1 ) Contributions from non-controlling interests — — — — — — 2,938 2,938 Distributions to non-controlling interests — — — — — — (33,971 ) (33,971 ) Other — — 6,793 — — 549 3,467 10,809
Balance at December 31, 2014 332,991,031 $ 3,330 $ 1,039,425 $ 1,541,095 $ (105,662 ) $ (218,358 ) $ 41,568 $ 2,301,398
Table of Contents
CBRE GROUP, INC.
NOTES TO CONSOLIDATED FINANCIAL STATEMENTS 1. Nature of Operations
CBRE Group, Inc., a Delaware corporation (which may be referred to in these financial statements as the “company” , “we”, “us” and “our”), was incorporated on February 20, 2001. We are the world’s largest commercial real estate services and investment firm, based on 2014 revenue, with leading full-service operations in major metropolitan areas throughout the world. We offer a full range of services to occupiers, owners, lenders and investors in office, retail, industrial, multifamily and other types of commercial real estate. As of December 31, 2014, excluding independent affiliates, we operated in over 370 offices worldwide, with more than 52,000 employees providing commercial real estate services under the “CBRE” brand name, investment management services under the “CBRE Global Investors” brand name and development services under the “Trammell Crow” brand name. Our business is focused on several competencies, including commercial property and corporate facilities management, tenant/occupier and property/agency leasing, capital markets solutions (property sales, commercial mortgage origination and servicing, and debt/structured finance), real estate investment management, valuation, development services and proprietary research. We generate revenue from management fees on a contractual and per-project basis, and from commissions on transactions. Our contractual, fee-for-services businesses, which generally involve property and facilities management, mortgage loan servicing and investment management, represented approximately 46% of our 2014 revenue. In addition, our appraisal/valuation and leasing services have contractual elements and work for clients in these service lines is often recurring in nature. 2. Significant Accounting Policies
Principles of Consolidation
The accompanying consolidated financial statements include our accounts and those of our majority-owned subsidiaries, as well as variable interest entities (VIEs) in which we are the primary beneficiary and other subsidiaries of which we have control. The equity attributable to non-controlling interests in subsidiaries is shown separately in the accompanying consolidated balance sheets. All significant intercompany accounts and transactions have been eliminated in consolidation.
Variable Interest Entities
As required by the “ Consolidations ” Topic of the Financial Accounting Standards Board (FASB) Accounting Standards Codification (ASC) (Topic 810), we consolidate all VIEs in which we are the entity’s primary beneficiary. A reporting entity is determined to be the primary beneficiary if it holds a controlling financial interest in the VIE. Determining which reporting entity, if any, has a controlling financial interest in a VIE is primarily a qualitative approach focused on identifying which reporting entity has both (1) the power to direct the activities of a VIE that most significantly impact such entity’s economic performance and (2) the obligation to absorb losses or the right to receive benefits from such entity that could potentially be significant to such entity. The entity which satisfies these criteria is deemed to be the primary beneficiary of the VIE.
We determine if an entity is a VIE based on several factors, including whether the entity’s total equity investment at risk upon inception is sufficient to finance the entity’s activities without additional subordinated financial support. We make judgments regarding the sufficiency of the equity at risk based first on a qualitative analysis, then a quantitative analysis, if necessary.
We analyze any investments in VIEs to determine if we are the primary beneficiary. We consider a variety of factors in identifying the entity that holds the power to direct matters that most significantly impact the VIE’s economic performance including, but not limited to, the ability to direct financing, leasing, construction and other operating decisions and activities. In addition, we consider the rights of other investors to participate in those decisions, to replace the manager and to sell or liquidate the entity.
78
Table of Contents
CBRE GROUP, INC.
NOTES TO CONSOLIDATED FINANCIAL STATEMENTS —(Continued)
We also have several co-investments in real estate investment funds which qualify for a deferral of the qualitative approach for analyzing potential VIEs. We continue to analyze these investments under the former quantitative method incorporating various estimates, including estimated future cash flows, asset hold periods and discount rates, as well as estimates of the probabilities of various scenarios occurring. If the entity is a VIE, we then determine whether we consolidate the entity as the primary beneficiary. This determination of whether we are the primary beneficiary includes any impact of an “upside economic interest” in the form of a “promote” that we may have. A promote is an interest built into the distribution structure of the entity based on the entity’s achievement of certain return hurdles.
We consolidate any VIE of which we are the primary beneficiary (see Note 3) and disclose significant VIEs of which we are not the primary beneficiary, if any, as well as disclose our maximum exposure to loss related to VIEs that are not consolidated. We determine whether an entity is a VIE and, if so, whether it should be consolidated by utilizing judgments and estimates that are inherently subjective.
Limited Partnerships, Limited Liability Companies and Other Subsidiaries
If an entity is not a VIE, our determination of the appropriate accounting method with respect to our investments in limited partnerships, limited liability companies and other subsidiaries is based on voting control. For our general partner interests, we are presumed to control (and therefore consolidate) the entity, unless the other limited partners have substantive rights that overcome this presumption of control. These substantive rights allow the limited partners to remove the general partner with or without cause or to participate in significant decisions made in the ordinary course of the entity’s business. We account for our non-controlling general partner investments in these entities under the equity method. This treatment also applies to our managing member interests in limited liability companies.
Other Investments
Our investments in unconsolidated subsidiaries in which we have the ability to exercise significant influence over operating and financial policies, but do not control, or entities which are variable interest entities in which we are not the primary beneficiary are accounted for under the equity method. Accordingly, our share of the earnings from these equity-method basis companies is included in consolidated net income. All other investments held on a long-term basis are valued at cost less any impairment in value.
Our determination of the appropriate accounting method for all other investments in subsidiaries is based on the amount of influence we have (including our ownership interest) in the underlying entity. Those other investments where we have the ability to exercise significant influence (but not control) over operating and financial policies of such subsidiaries (including certain subsidiaries where we have less than 20% ownership) are accounted for using the equity method. We eliminate transactions with such equity method subsidiaries to the extent of our ownership in such subsidiaries. Accordingly, our share of the earnings or losses of these equity method subsidiaries is included in consolidated net income. All of our remaining investments are carried at cost.
Impairment Evaluation
Under either the equity or cost method, impairment losses are recognized upon evidence of other-than-temporary losses of value. When testing for impairment on investments that are not actively traded on a public market, we generally use a discounted cash flow approach to estimate the fair value of our investments and/or look to comparable activities in the marketplace. Management judgment is required in developing the assumptions for the discounted cash flow approach. These assumptions include net asset values, internal rates of
79
Table of Contents
CBRE GROUP, INC.
NOTES TO CONSOLIDATED FINANCIAL STATEMENTS —(Continued) return, discount and capitalization rates, interest rates and financing terms, rental rates, timing of leasing activity, estimates of lease terms and related concessions, etc. When determining if impairment is other-than-temporary, we also look to the length of time and the extent to which fair value has been less than cost as well as the financial condition and near-term prospects of each investment.
Estimates, Risks and Uncertainties
Our consolidated financial statements have been prepared in accordance with accounting principles generally accepted in the United States (U.S.), or GAAP, which require management to make estimates and assumptions about future events. These estimates and assumptions affect the amounts of assets, liabilities, revenue and expenses we report. Such estimates include the value of goodwill, intangibles and other long-lived assets, accounts receivable, investments in unconsolidated subsidiaries and assumptions used in the calculation of income taxes, retirement and other post-employment benefits, among others. These estimates and assumptions are based on management’s best judgment, and are evaluated on an ongoing basis and adjusted, as needed, using historical experience and other factors, including consideration of the macroeconomic environment. As future events and their effects cannot be forecast with precision, actual results could differ significantly from these estimates. Changes in those estimates resulting from continuing changes in the economic environment will be reflected in the financial statements in future periods.
The fair value of our goodwill and non-amortizable intangible assets is impacted by economic and capital market conditions as well as our stock price. Property sales and leasing activity is affected by economic and employment growth, capital markets liquidity, credit availability and pricing, business and investor confidence, and inflation levels. Adverse trends involving any or all of these factors could reduce transaction-based revenue as well as property values and sales and leasing volume. Such adverse economic conditions could cause declines in the estimated future discounted cash flows expected for our reporting units. A major or sustained decline in our future cash flows and/or the current economic conditions could result in impairment charges.
The recoverability of our investments in unconsolidated subsidiaries is impacted by general conditions in the global economy and commercial real estate market. Transaction activity has improved, to varying degrees and at a different pace in various regions around the world, over the past five years. Property values also have broadly rebounded, as underlying market fundamentals have improved and capital flows into commercial real estate have improved. The assumptions utilized in our recoverability analysis reflect our belief that the recovery will continue, but that a return to capital markets turmoil and negative economic growth could result in impairment charges.
The recoverability of the carrying value of our investments in real estate is impacted by general conditions in the global economy and commercial real estate market. Market fundamentals in the primary property types that we develop or own have improved, to varying degrees and at a different pace in various regions globally, over the past five years. Property sales have increased significantly, buoyed by improved market fundamentals, low interest rates and increased capital flows into commercial real estate. However, if conditions in the broader economy, capital markets, local, regional or global commercial real estate markets decline sharply once again, we may be required to record impairment charges.
Cash and Cash Equivalents
Cash and cash equivalents generally consist of cash and highly liquid investments with an original maturity of less than three months. Included in the accompanying consolidated balance sheets as of December 31, 2014 and 2013 is cash and cash equivalents of $58.0 million and $32.4 million, respectively, from consolidated funds
80
Table of Contents
CBRE GROUP, INC.
NOTES TO CONSOLIDATED FINANCIAL STATEMENTS —(Continued) and other entities, which are not available for general corporate use. We also manage certain cash and cash equivalents as an agent for our investment and property and facilities management clients. These amounts are not included in the accompanying consolidated balance sheets (see Note 18).
Restricted Cash
Included in the accompanying consolidated balance sheets as of December 31, 2014 and 2013 is restricted cash of $28.1 million and $61.2 million, respectively. The balances primarily include restricted cash set aside to cover funding obligations as required by contracts executed by us in the normal course of business.
Concentration of Credit Risk
Financial instruments that potentially subject us to credit risk consist principally of trade receivables and interest-bearing investments. Users of real estate services account for a substantial portion of trade receivables and collateral is generally not required. The risk associated with this concentration is limited due to the large number of users and their geographic dispersion.
We place substantially all of our interest-bearing investments with major financial institutions and limit the amount of credit exposure with any one financial institution.
Property and Equipment
Property and equipment is stated at cost, net of accumulated depreciation. Depreciation and amortization of property and equipment is computed primarily using the straight-line method over estimated useful lives ranging up to 15 years. Leasehold improvements are amortized over the term of their associated leases, excluding options to renew, since such leases generally do not carry prohibitive penalties for non-renewal. We capitalize expenditures that significantly increase the life of our assets and expense the costs of maintenance and repairs.
We review property and equipment for impairment whenever events or changes in circumstances indicate that the carrying amount of an asset may not be recoverable. If this review indicates that such assets are considered to be impaired, the impairment is recognized in the period the changes occur and represents the amount by which the carrying value exceeds the fair value of the asset.
Certain costs related to the development or purchase of internal-use software are capitalized. Internal computer software costs that are incurred in the preliminary project stage are expensed as incurred. Direct consulting costs as well as payroll and related costs, which are incurred during the development stage of a project are generally capitalized and amortized over a three-year period (except for enterprise software development platforms, which range from five to ten years) when placed into production.
Goodwill and Other Intangible Assets
Our acquisitions require the application of purchase accounting, which results in tangible and identifiable intangible assets and liabilities of the acquired entity being recorded at fair value. The difference between the purchase price and the fair value of net assets acquired is recorded as goodwill. The majority of our goodwill balance has resulted from our acquisition of CBRE Services, Inc. (CBRE) in 2001 (the 2001 Acquisition), our acquisition of Insignia Financial Group, Inc. (Insignia) in 2003 (the Insignia Acquisition), our acquisition of the Trammell Crow Company in 2006 (the Trammell Crow Company Acquisition), our acquisition of substantially all of the ING Group N.V. (ING) Real Estate Investment Management (REIM) operations in Europe and Asia, as well as substantially all of Clarion Real Estate Securities (CRES) in 2011 (collectively referred to as the REIM
81
Table of Contents
CBRE GROUP, INC.
NOTES TO CONSOLIDATED FINANCIAL STATEMENTS —(Continued) Acquisitions) and our acquisition of Norland Managed Services Ltd (Norland) in 2013 (Norland Acquisition). Other intangible assets that have indefinite estimated useful lives and are not being amortized include certain management contracts identified in the REIM Acquisitions, a trademark, which was separately identified as a result of the 2001 Acquisition, as well as a trade name separately identified as a result of the REIM Acquisitions. The remaining other intangible assets primarily include customer relationships, loan servicing rights and management contracts, which are all being amortized over estimated useful lives ranging up to 20 years.
We are required to test goodwill and other intangible assets deemed to have indefinite useful lives for impairment annually or more often if circumstances or events indicate a change in the impairment status. The goodwill impairment analysis is a two-step process. The first step used to identify potential impairment involves comparing each reporting unit’s estimated fair value to its carrying value, including goodwill. We use a discounted cash flow approach to estimate the fair value of our reporting units. Management judgment is required in developing the assumptions for the discounted cash flow model. These assumptions include revenue growth rates, profit margin percentages, discount rates, etc. If the estimated fair value of a reporting unit exceeds its carrying value, goodwill is considered to not be impaired. If the carrying value exceeds estimated fair value, there is an indication of potential impairment and the second step is performed to measure the amount of impairment. The second step of the process involves the calculation of an implied fair value of goodwill for each reporting unit for which step one indicated impairment. The implied fair value of goodwill is determined similar to how goodwill is calculated in a business combination, by measuring the excess of the estimated fair value of the reporting unit as calculated in step one, over the estimated fair values of the individual assets, liabilities and identifiable intangibles as if the reporting unit was being acquired in a business combination. Due to the many variables inherent in the estimation of a business’s fair value and the relative size of our goodwill, if different assumptions and estimates were used, it could have an adverse effect on our impairment analysis.
Deferred Financing Costs
Costs incurred in connection with financing activities are generally deferred and amortized over the terms of the related debt agreements ranging up to ten years. Amortization of these costs is charged to interest expense in the accompanying consolidated statements of operations. Total deferred financing costs, net of accumulated amortization, included in other assets in the accompanying consolidated balance sheets were $35.0 million and $42.3 million as of December 31, 2014 and 2013, respectively.
During 2014, we completed three financing transactions, which included the issuance in September and December of $300.0 million and $125.0 million, respectively, in aggregate principal amount of 5.25% senior notes due March 15, 2025 and the redemption in October 2014 of all of the then outstanding 6.625% senior notes (aggregate principal amount of $350.0 million). During the year ended December 31, 2014, in connection with these financing activities, we incurred approximately $4.7 million of financing costs. In addition, we expensed $5.7 million of previously-deferred financing costs as well as a $17.4 million early extinguishment premium, all of which were included in the write-off of financing costs in the accompanying consolidated statements of operations.
During 2013, we completed a series of financing transactions, including the amendment and restatement of a prior credit agreement, the issuance of $800.0 million aggregate principal amount of 5.00% senior notes due March 15, 2023 and the redemption of all of the 11.625% senior subordinated notes totaling $450.0 million. During the year ended December 31, 2013, in connection with all of these financing activities, we incurred approximately $28.6 million of financing costs, of which $3.6 million was expensed. In addition, we expensed $17.8 million of previously-deferred financing costs as well as a $26.2 million early extinguishment premium and $8.7 million of unamortized original issue discount associated with the 11.625% senior subordinated notes. All of these write-offs were included in write-off of financing costs in the accompanying consolidated statements of operations.
82
Table of Contents
CBRE GROUP, INC.
NOTES TO CONSOLIDATED FINANCIAL STATEMENTS —(Continued)
See Note 12 for additional information on activities associated with our debt.
Revenue Recognition
We record commission revenue on real estate sales generally upon close of escrow or transfer of title, except when future contingencies exist. Real estate commissions on leases are generally recorded in revenue when all obligations under the commission agreement are satisfied. Terms and conditions of a commission agreement may include, but are not limited to, execution of a signed lease agreement and future contingencies including tenant occupancy, payment of a deposit or payment of a first month’s rent (or a combination thereof). As some of these conditions are outside of our control and are often not clearly defined, judgment must be exercised in determining when such required events have occurred in order to recognize revenue.
A typical commission agreement provides that we earn a portion of a lease commission upon the execution of the lease agreement by the tenant and landlord, with the remaining portion(s) of the lease commission earned at a later date, usually upon tenant occupancy or payment of rent. The existence of any significant future contingencies results in the delay of recognition of corresponding revenue until such contingencies are satisfied. For example, if we do not earn all or a portion of the lease commission until the tenant pays its first month’s rent, and the lease agreement provides the tenant with a free rent period, we delay revenue recognition until rent is paid by the tenant.
Property and facilities management revenues are generally based upon percentages of the revenue or base rent generated by the entities managed or the square footage managed. These fees are recognized when earned under the provisions of the related management agreements.
We account for certain reimbursements (primarily salaries and related charges) mainly related to our property and facilities management operations as revenue. Reimbursement revenue is recognized when the underlying reimbursable costs are incurred.
Investment management fees are based predominantly upon a percentage of the equity deployed on behalf of our limited partners. Fees related to our indirect investment management programs are based upon a percentage of the fair value of those investments. These fees are recognized when earned under the provisions of the related investment management agreements. Our Global Investment Management segment earns performance-based incentive fees with regard to many of its investments. Such revenue is recognized at the end of the measurement periods when the conditions of the applicable incentive fee arrangements have been satisfied and following the expiration of any potential claw back provision. With many of these investments, our Global Investment Management professionals have participation interests in such incentive fees, which are commonly referred to as carried interest. This carried interest expense is generally accrued for based upon the probability of such performance-based incentive fees being earned over the related vesting period. In addition, our Global Investment Management segment also earns success-based transaction fees with regard to buying or selling properties on behalf of certain funds and separate accounts. Such revenue is recognized at the completion of a successful transaction and is not subject to any claw back provision.
Appraisal fees are recorded after services have been rendered. Loan origination fees are recognized at the time a loan closes and we have no significant remaining obligations for performance in connection with the transaction, while loan servicing fees are recorded in revenue as monthly principal and interest payments are collected from mortgagors. Other commissions, consulting fees and referral fees are recorded as revenue at the time the related services have been performed, unless significant future contingencies exist.
83
Table of Contents
CBRE GROUP, INC.
NOTES TO CONSOLIDATED FINANCIAL STATEMENTS —(Continued)
Development services and project management services generate fees from development and construction management projects. Most development and construction management and project management assignments are subject to agreements that describe the calculation of fees and when we earn such fees. The earnings terms of these agreements dictate when we recognize the related revenue. Generally, development fees are recognized based on the lower of the amount billed or the amount determined on a straight-line basis over the development period. We may earn incentive fees for project management services based upon achievement of certain performance criteria as set forth in the project management services agreement. We may earn incentive development fees by reaching specified timetable, leasing, budget or value creation targets, as defined in the relevant development services agreement. Certain incentive development fees allow us to share in the fair value of the developed real estate asset above cost. This sharing creates additional revenue potential to us with no exposure to loss other than opportunity cost. We recognize such fees when the specified target is attained and fees are deemed collectible.
We record deferred income to the extent that cash payments have been received in accordance with the terms of underlying agreements, but such amounts have not yet met the criteria for revenue recognition in accordance with generally accepted accounting principles. We recognize such revenues when the appropriate criteria are met.
In establishing the appropriate provisions for trade receivables, we make assumptions with respect to future collectability. Our assumptions are based on an assessment of a customer’s credit quality as well as subjective factors and trends, including the aging of receivables balances. In addition to these assessments, in general, outstanding trade accounts receivable amounts that are more than 180 days overdue are evaluated for collectability and fully provided for if deemed uncollectible. Historically, our credit losses have generally been insignificant. However, estimating losses requires significant judgment, and conditions may change or new information may become known after any periodic evaluation. As a result, actual credit losses may differ from our estimates.
Real Estate
Classification and Impairment Evaluation
We classify real estate in accordance with the criteria of the “ Property, Plant and Equipment ” Topic of the FASB ASC (Topic 360) as follows: (i) real estate held for sale, which includes completed assets or land for sale in its present condition that meet all of Topic 360’s “held for sale” criteria, (ii) real estate under development (current), which includes real estate that we are in the process of developing that is expected to be completed and disposed of within one year of the balance sheet date; (iii) real estate under development (non-current), which includes real estate that we are in the process of developing that is expected to be completed and disposed of more than one year from the balance sheet date; or (iv) real estate held for investment, which consists of land on which development activities have not yet commenced and completed assets or land held for disposition that do not meet the “held for sale” criteria. Any asset reclassified from real estate held for sale to real estate under development (current or non-current) or real estate held for investment is recorded individually at the lower of its fair value at the date of the reclassification or its carrying amount before it was classified as “held for sale,” adjusted (in the case of real estate held for investment) for any depreciation that would have been recognized had the asset been continuously classified as real estate held for investment.
Real estate held for sale is recorded at the lower of cost or fair value less cost to sell. If an asset’s fair value less cost to sell, based on discounted future cash flows, management estimates or market comparisons, is less than its carrying amount, an allowance is recorded against the asset.
84
Table of Contents
CBRE GROUP, INC.
NOTES TO CONSOLIDATED FINANCIAL STATEMENTS —(Continued)
Real estate under development and real estate held for investment are carried at cost less depreciation, as applicable. Buildings and improvements included in real estate held for investment are depreciated using the straight-line method over estimated useful lives, generally up to 39 years. Tenant improvements included in real estate held for investment are amortized using the straight-line method over the shorter of their estimated useful lives or terms of the respective leases. Land improvements included in real estate held for investment are depreciated over their estimated useful lives, up to 15 years.
Real estate under development and real estate held for investment are evaluated for impairment and losses are recorded when undiscounted cash flows estimated to be generated by an asset are less than the asset’s carrying amount. The amount of the impairment loss, if any, is calculated as the excess of the asset’s carrying value over its fair value, which is determined using a discounted cash flow analysis, management estimates or market comparisons.
Cost Capitalization and Allocation
When acquiring, developing and constructing real estate assets, we capitalize recoverable costs. Capitalization begins when the activities related to development have begun and ceases when activities are substantially complete and the asset is available for occupancy. Recoverable costs capitalized include pursuit costs, or pre-acquisition/pre-construction costs, taxes and insurance, interest, development and construction costs and costs of incidental operations. We do not capitalize any internal costs when acquiring, developing and constructing real estate assets. We expense transaction costs for acquisitions that qualify as a business in accordance with the “ Business Combinations ” Topic of the FASB ASC (Topic 805). Pursuit costs capitalized in connection with a potential development project that we have determined not to pursue are written off in the period that determination is made.
At times, we purchase bulk land that we intend to sell or develop in phases. The land basis allocated to each phase is based on the relative estimated fair value of the phases before construction. We allocate construction costs incurred relating to more than one phase between the various phases; if the costs cannot be specifically attributed to a certain phase or the improvements benefit more than one phase, we allocate the costs between the phases based on their relative estimated sales values, where practicable, or other value methods as appropriate under the circumstances. Relative allocations of the costs are revised as the sales value estimates are revised.
When acquiring real estate with existing buildings, we allocate the purchase price between land, land improvements, building and intangibles related to in-place leases, if any, based on their relative fair values. The fair values of acquired land and buildings are determined based on an estimated discounted future cash flow model with lease-up assumptions as if the building was vacant upon acquisition. The fair value of in-place leases includes the value of lease intangibles for above or below-market rents and tenant origination costs, determined on a lease by lease basis. The capitalized values for both lease intangibles and tenant origination costs are amortized over the term of the underlying leases. Amortization related to lease intangibles is recorded as either an increase to or a reduction of rental income and amortization for tenant origination costs is recorded to amortization expense.
Disposition of Real Estate
Gains or losses on disposition of real estate are recognized upon sale of the underlying project. We evaluate each real estate sale transaction to determine if it qualifies for recognition under the full accrual method. If the transaction does not meet the criteria for the full accrual method of profit recognition based on our assessment, we account for a sale based on an appropriate deferral method determined by the nature and extent of the buyer’s investment and our continuing involvement.
85
Table of Contents
CBRE GROUP, INC.
NOTES TO CONSOLIDATED FINANCIAL STATEMENTS —(Continued)
Discontinued Operations
On January 1, 2014, we adopted Accounting Standards Update (ASU) 2014-08, “ Presentation of Financial Statements (Topic 205) and Property, Plant, and Equipment (Topic 360): Reporting Discontinued Operations and Disclosures of Disposals of Components of an Entity,” and as a result, no longer anticipate reporting discontinued operations in the ordinary course of our business. Prior to January 1, 2014, if in the ordinary course of business we disposed of real estate assets, or held real estate assets for sale, that were considered components of an entity in accordance with Topic 360, and if we did not have, or expect to have, significant continuing involvement with the operation of these real estate assets after disposition, we were required to recognize operating profits or losses and gains or losses on disposition of these assets as discontinued operations in our consolidated statements of operations in the periods in which they occurred.
Business Promotion and Advertising Costs
The costs of business promotion and advertising are expensed as incurred. Business promotion and advertising costs of $55.6 million, $49.4 million and $43.7 million were included in operating, administrative and other expenses for the years ended December 31, 2014, 2013 and 2012, respectively.
Foreign Currencies
The financial statements of subsidiaries located outside the U.S. are generally measured using the local currency as the functional currency. The assets and liabilities of these subsidiaries are translated at the rates of exchange at the balance sheet date, and income and expenses are translated at the average monthly rate. The resulting translation adjustments are included in the accumulated other comprehensive loss component of equity. Gains and losses resulting from foreign currency transactions are included in the results of operations. The aggregate transaction losses included in the accompanying consolidated statements of operations for the years ended December 31, 2014, 2013 and 2012 were $7.9 million, $12.6 million and $3.6 million, respectively.
Derivative Financial Instruments and Hedging Activities
As required by FASB ASC Topic 815 “ Derivatives and Hedging ,” we record all derivatives on the balance sheet at fair value. We do not net derivatives on our balance sheet. The accounting for changes in the fair value of derivatives depends on the intended use of the derivative, whether we have elected to designate a derivative in a hedging relationship and apply hedge accounting and whether the hedging relationship has satisfied the criteria necessary to apply hedge accounting. Derivatives designated and qualifying as a hedge of the exposure to changes in the fair value of an asset, liability, or firm commitment attributable to a particular risk, such as interest rate risk, are considered fair value hedges. Derivatives designated and qualifying as a hedge of the exposure to variability in expected future cash flows, or other types of forecasted transactions, are considered cash flow hedges. Derivatives may also be designated as hedges of the foreign currency exposure of a net investment in a foreign operation. Hedge accounting generally provides for the matching of the timing of gain or loss recognition on the hedging instrument with the recognition of the changes in the fair value of the hedged asset or liability that are attributable to the hedged risk in a fair value hedge or the earnings effect of the hedged forecasted transactions in a cash flow hedge. We may enter into derivative contracts that are intended to economically hedge certain of our risk, even though hedge accounting does not apply or we elect not to apply hedge accounting. In all cases, we view derivative financial instruments as a risk management tool and, accordingly, do not use derivatives for trading or speculative purposes.
86

Table of Contents
CBRE GROUP, INC.
NOTES TO CONSOLIDATED FINANCIAL STATEMENTS —(Continued)
Comprehensive Income
Comprehensive income consists of net income and other comprehensive (loss) income. In the accompanying consolidated balance sheets, accumulated other comprehensive loss consists of foreign currency translation adjustments, amounts reclassified from accumulated other comprehensive loss to interest expense, unrealized (losses) gains on interest rate swaps and interest rate caps, unrealized holding (losses) gains on available for sale securities and other pension liability adjustments. Foreign currency translation adjustments exclude any income tax effect given that earnings of non-U.S. subsidiaries are deemed to be reinvested for an indefinite period of time (see Note 15).
Marketable Securities
We account for investments in marketable debt and equity securities in accordance with the “ Investments – Debt and Equity Securities ” Topic of the FASB ASC (Topic 320). We determine the appropriate classification of debt and equity securities at the time of purchase and reevaluate such designation as of each balance sheet date. Marketable securities we acquire with the intent to generate a profit from short-term movements in market prices are classified as trading securities. Debt securities are classified as held to maturity when we have the positive intent and ability to hold the securities to maturity. Marketable equity and debt securities not classified as trading or held to maturity are classified as available for sale.
Trading securities are carried at their fair value with realized and unrealized gains and losses included in net income. Available for sale securities are carried at their fair value and any difference between cost and fair value is recorded as unrealized gain or loss, net of income taxes, and is reported as accumulated other comprehensive loss in the consolidated statement of equity. Premiums and discounts are recognized in interest using the effective interest method. Realized gains and losses and declines in value expected to be other-than-temporary on available for sale securities have not been significant. The cost of securities sold is based on the specific identification method. Interest and dividends on securities classified as available for sale are included in interest income.
Warehouse Receivables
Our wholly-owned subsidiary CBRE Capital Markets is a Federal Home Loan Mortgage Corporation (Freddie Mac) approved Multifamily Program Plus Seller/Servicer and an approved Federal National Mortgage Association (Fannie Mae) Aggregation and Negotiated Transaction Seller/Servicer. In addition, CBRE Capital Markets’ wholly-owned subsidiary Multifamily Capital is an approved Fannie Mae Delegated Underwriting and Servicing (DUS) Seller/Servicer and CBRE Capital Markets’ wholly-owned subsidiary CBRE HMF is a U.S. Department of Housing and Urban Development (HUD) approved Non-Supervised Federal Housing Authority (FHA) Title II Mortgagee, an approved Multifamily Accelerated Processing (MAP) lender and an approved Government National Mortgage Association (Ginnie Mae) issuer of mortgage-backed securities (MBS). Under these arrangements, before loans are originated through proceeds from warehouse lines of credit, we obtain either a contractual loan purchase commitment from either Freddie Mac or Fannie Mae or a confirmed forward trade commitment for the issuance and purchase of a Fannie Mae or Ginnie Mae MBS that will be secured by the loans. The warehouse lines of credit are generally repaid within a one-month period when Freddie Mac or Fannie Mae buys the loans or upon settlement of the Fannie Mae or Ginnie Mae MBS, while we retain the servicing rights. Loans are funded at the prevailing market rates. We elect the fair value option for all warehouse receivables. At December 31, 2014 and 2013, all of the warehouse receivables included in the accompanying consolidated balance sheets were either under commitment to be purchased by Freddie Mac or had confirmed forward trade commitments for the issuance and purchase of Fannie Mae or Ginnie Mae mortgage backed securities that will be secured by the underlying loans.
87
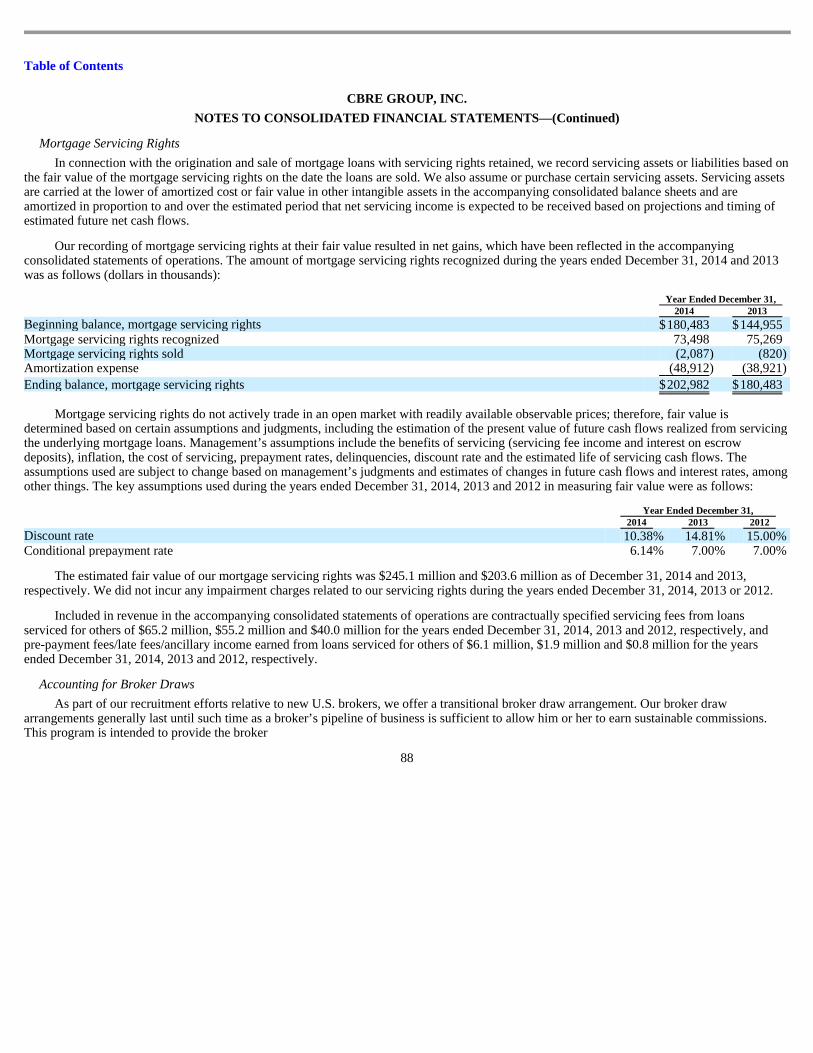
Table of Contents
CBRE GROUP, INC.
NOTES TO CONSOLIDATED FINANCIAL STATEMENTS —(Continued)
Mortgage Servicing Rights
In connection with the origination and sale of mortgage loans with servicing rights retained, we record servicing assets or liabilities based on the fair value of the mortgage servicing rights on the date the loans are sold. We also assume or purchase certain servicing assets. Servicing assets are carried at the lower of amortized cost or fair value in other intangible assets in the accompanying consolidated balance sheets and are amortized in proportion to and over the estimated period that net servicing income is expected to be received based on projections and timing of estimated future net cash flows.
Our recording of mortgage servicing rights at their fair value resulted in net gains, which have been reflected in the accompanying consolidated statements of operations. The amount of mortgage servicing rights recognized during the years ended December 31, 2014 and 2013 was as follows (dollars in thousands):
Mortgage servicing rights do not actively trade in an open market with readily available observable prices; therefore, fair value is
determined based on certain assumptions and judgments, including the estimation of the present value of future cash flows realized from servicing the underlying mortgage loans. Management’s assumptions include the benefits of servicing (servicing fee income and interest on escrow deposits), inflation, the cost of servicing, prepayment rates, delinquencies, discount rate and the estimated life of servicing cash flows. The assumptions used are subject to change based on management’s judgments and estimates of changes in future cash flows and interest rates, among other things. The key assumptions used during the years ended December 31, 2014, 2013 and 2012 in measuring fair value were as follows:
The estimated fair value of our mortgage servicing rights was $245.1 million and $203.6 million as of December 31, 2014 and 2013,
respectively. We did not incur any impairment charges related to our servicing rights during the years ended December 31, 2014, 2013 or 2012.
Included in revenue in the accompanying consolidated statements of operations are contractually specified servicing fees from loans serviced for others of $65.2 million, $55.2 million and $40.0 million for the years ended December 31, 2014, 2013 and 2012, respectively, and pre-payment fees/late fees/ancillary income earned from loans serviced for others of $6.1 million, $1.9 million and $0.8 million for the years ended December 31, 2014, 2013 and 2012, respectively.
Accounting for Broker Draws
Year Ended December 31, 2014 2013 Beginning balance, mortgage servicing rights $ 180,483 $ 144,955 Mortgage servicing rights recognized 73,498 75,269 Mortgage servicing rights sold (2,087 ) (820 ) Amortization expense (48,912 ) (38,921 )
Ending balance, mortgage servicing rights $ 202,982 $ 180,483
Year Ended December 31, 2014 2013 2012 Discount rate 10.38 % 14.81 % 15.00 % Conditional prepayment rate 6.14 % 7.00 % 7.00 %
As part of our recruitment efforts relative to new U.S. brokers, we offer a transitional broker draw arrangement. Our broker draw arrangements generally last until such time as a broker’s pipeline of business is sufficient to allow him or her to earn sustainable commissions. This program is intended to provide the broker
88
Table of Contents
CBRE GROUP, INC.
NOTES TO CONSOLIDATED FINANCIAL STATEMENTS —(Continued) with a minimal amount of cash flow to allow adequate time for his or her training as well as time for him or her to develop business relationships. Similar to traditional salaries, the broker draws are paid irrespective of the actual revenues generated by the broker. Often these broker draws represent the only form of compensation received by the broker. Furthermore, it is not our general policy to pursue collection of unearned broker draws paid under this arrangement. As a result, we have concluded that broker draws are economically equivalent to salaries paid and accordingly charge them to compensation as incurred. The broker is also entitled to earn a commission on completed revenue transactions. This amount is calculated as the commission that would have been payable under our full commission program, less any amounts previously paid to the broker in the form of a draw.
Stock-Based Compensation
We account for all employee awards under the fair value recognition provisions of the “ Compensation – Stock Compensation ” Topic of the FASB ASC (Topic 718). Topic 718 requires the measurement of compensation cost at the grant date, based upon the estimated fair value of the award, and requires amortization of the related expense over the employee’s requisite service period. See Note 14 for additional information on our stock-based compensation plans.
Income Per Share
Basic income per share attributable to CBRE Group, Inc. is computed by dividing net income attributable to CBRE Group, Inc. shareholders by the weighted average number of common shares outstanding during each period. The computation of diluted income per share attributable to CBRE Group, Inc. generally further assumes the dilutive effect of potential common shares, which include stock options and certain contingently issuable shares. Contingently issuable shares consist of non-vested stock awards.
Income Taxes
Income taxes are accounted for under the asset and liability method in accordance with the “ Accounting for Income Taxes ” Topic of the FASB ASC (Topic 740). Deferred tax assets and liabilities are determined based on temporary differences between the financial reporting and tax basis of assets and liabilities and operating loss and tax credit carry forwards. Deferred tax assets and liabilities are measured by applying enacted tax rates and laws and are released in the years in which the temporary differences are expected to be recovered or settled. The effect on deferred tax assets and liabilities of a change in tax rates is recognized in income in the period that includes the enactment date. Valuation allowances are provided against deferred tax assets when it is more likely than not that some portion or all of the deferred tax asset will not be realized.
Self-Insurance
Our wholly-owned captive insurance company, which is subject to applicable insurance rules and regulations, insures our exposure related to workers’ compensation insurance provided to employees and we purchase excess coverage from an unrelated insurance carrier. We purchase general liability and automotive insurance through an unrelated insurance carrier. The captive insurance company reinsures the related deductibles. The captive insurance company also insures deductibles relating to professional indemnity claims. Given the nature of these types of claims, it may take several years for resolution and determination of the cost of these claims. We are required to estimate the cost of these claims in our financial statements.
The estimates that we utilize to record our potential losses on claims are inherently subjective, and actual claims could differ from amounts recorded, which could result in increased or decreased expense in future periods. As of December 31, 2014 and 2013, our reserves for claims under these insurance programs were $73.2
89
Table of Contents
CBRE GROUP, INC.
NOTES TO CONSOLIDATED FINANCIAL STATEMENTS —(Continued) million and $65.7 million, respectively, which were included in other current and other long-term liabilities in the accompanying consolidated balance sheets. Of these amounts, $2.0 million and $2.2 million, respectively, represented our estimated current liabilities as of December 31, 2014 and 2013.
Non-Controlling Interests in Consolidated Limited Life Subsidiaries
As of December 31, 2014 and 2013, the estimated settlement value of non-controlling interests in our consolidated limited life subsidiaries was $0.8 million and $5.4 million, respectively, which approximated the carrying value, and which was included in non-controlling interests in the accompanying consolidated balance sheets.
New Accounting Pronouncements
In May 2014, the FASB issued ASU 2014-09, “ Revenue from Contracts with Customers (Topic 606). ” This ASU requires an entity to recognize the amount of revenue to which it expects to be entitled for the transfer of promised goods or services to customers. The ASU will replace most existing revenue recognition guidance under GAAP when it becomes effective on January 1, 2017. This ASU permits the use of either the retrospective or cumulative effect transition method. Early adoption is not permitted. We are evaluating the effect that ASU 2014-09 will have on our consolidated financial statements and related disclosures. We have not yet selected a transition method nor have we determined the effect of this ASU on our ongoing financial reporting.
In February 2015, the FASB issued ASU 2015-02, “ Consolidation (Topic 810): Amendments to the Consolidation Analysis. ” This ASU provides consolidation guidance for legal entities such as limited partnerships, limited liability corporations and securitization structures. This ASU offers updated consolidation evaluation criteria and may require additional disclosure requirements. ASU 2015-02 is effective for fiscal years, and interim periods within those years, beginning after December 15, 2016. We do not believe the adoption of this update will have a material impact on our consolidated financial position, results of operations or disclosure requirements of our consolidated financial statements.
Reclassifications
Certain reclassifications have been made to the 2013 and 2012 financial statements to conform with the 2014 presentation. 3. Variable Interest Entities (VIEs)
A consolidated subsidiary (the Venture) in our Global Investment Management segment sponsored investments by third-party investors in certain commercial properties through the formation of tenant-in-common limited liability companies and Delaware Statutory Trusts (collectively referred to as the Entities) that were owned by the third-party investors. The Venture also formed and was a member of a limited liability company for each property that served as master tenant (Master Tenant). Each Master Tenant leased the property from the Entities through a master lease agreement. Pursuant to the master lease agreements, the Master Tenant had the power to direct the day-to-day asset management activities that most significantly impacted the economic performance of the Entities. As a result, the Entities were deemed to be VIEs since the third-party investors holding the equity investment at risk in the Entities did not direct the day-to-day activities that most significantly impacted the economic performance of the properties held by the Entities. The Venture made voluntary contributions to each of these properties to support their operations beyond the cash flow generated by the properties themselves and such financial support was significant enough that the Venture was deemed to be the primary beneficiary of each Entity. As of December 31, 2011, we consolidated three such commercial properties.
90
Table of Contents
CBRE GROUP, INC.
NOTES TO CONSOLIDATED FINANCIAL STATEMENTS —(Continued) During the year ended December 31, 2012, an additional property was consolidated during the first quarter and subsequently sold in the fourth quarter. During the year ended December 31, 2013, one of the properties was sold, with the remaining two properties sold in the first half of 2014.
No financial support was provided by the Venture to the Entities during the years ended December 31, 2014 and 2013. During the year ended December 31, 2012, the Venture funded $0.2 million of financial support to the Entities. The assets of the Entities were the sole collateral for the mortgage notes payable and other liabilities of the Entities and, as such, the creditors and equity investors of these Entities had no recourse to our assets held outside of these Entities. Investments in real estate of $39.9 million and nonrecourse mortgage notes payable of $41.7 million ($0.9 million of which is current) attributable to the Entities were included in real estate assets held for sale or investment and notes payable on real estate, respectively, in the accompanying consolidated balance sheets as of December 31, 2013. In addition, a non-controlling deficit of $1.8 million in the accompanying consolidated balance sheets as of December 31, 2013 was attributable to the Entities.
Operating results relating to the Entities for the years ended December 31, 2014, 2013 and 2012 include the following (dollars in thousands):
In connection with our acquisition of CRES, we acquired CRES co-investments from ING in three funds (CRES Funds) for an aggregate
purchase price of $58.6 million. We determined that the CRES Funds were not VIEs and accordingly determined the method of accounting based upon voting control. The limited partners/members of the CRES Funds lack substantive rights that would overcome our presumption of control. Accordingly, we began consolidating the CRES Funds as of the acquisition date of July 1, 2011. In January 2012, one of the Clarion Real Estate Securities (CRES) Funds (CBRE Clarion U.S., L.P.), which we acquired in connection with our acquisition of CRES on July 1, 2011, was converted to a registered mutual fund, the CBRE Clarion Long/Short Fund (the Fund). As a result of this triggering event, we determined that the Fund became a VIE and that we were not the primary beneficiary. Accordingly, in the first quarter of 2012, the Fund was deconsolidated from our consolidated financial statements and we recorded an investment in available for sale securities of $14.3 million. No gain or loss was recognized in our consolidated statement of operations as a result of this deconsolidation. Subsequently, in June 2013, we redeemed our investment in the Fund and recorded a gain of $0.1 million.
We also hold variable interests in certain VIEs in our Global Investment Management and Development Services segments which are not consolidated as it was determined that we are not the primary beneficiary. Our involvement with these entities is in the form of equity co-investments and fee arrangements.
91
Year Ended December 31, 2014 2013 2012 Revenue $ 3,561 $ 8,222 $ 13,359 Operating, administrative and other expenses $ 2,588 $ 4,289 $ 7,961 Gain on disposition of real estate $ 23,028 $ — $ — Income (loss) from discontinued operations, net of income taxes $ — $ 15,236 $ (1,408 ) Net income (loss) attributable to non-controlling interests $ 21,724 $ 13,805 $ (5,227 )
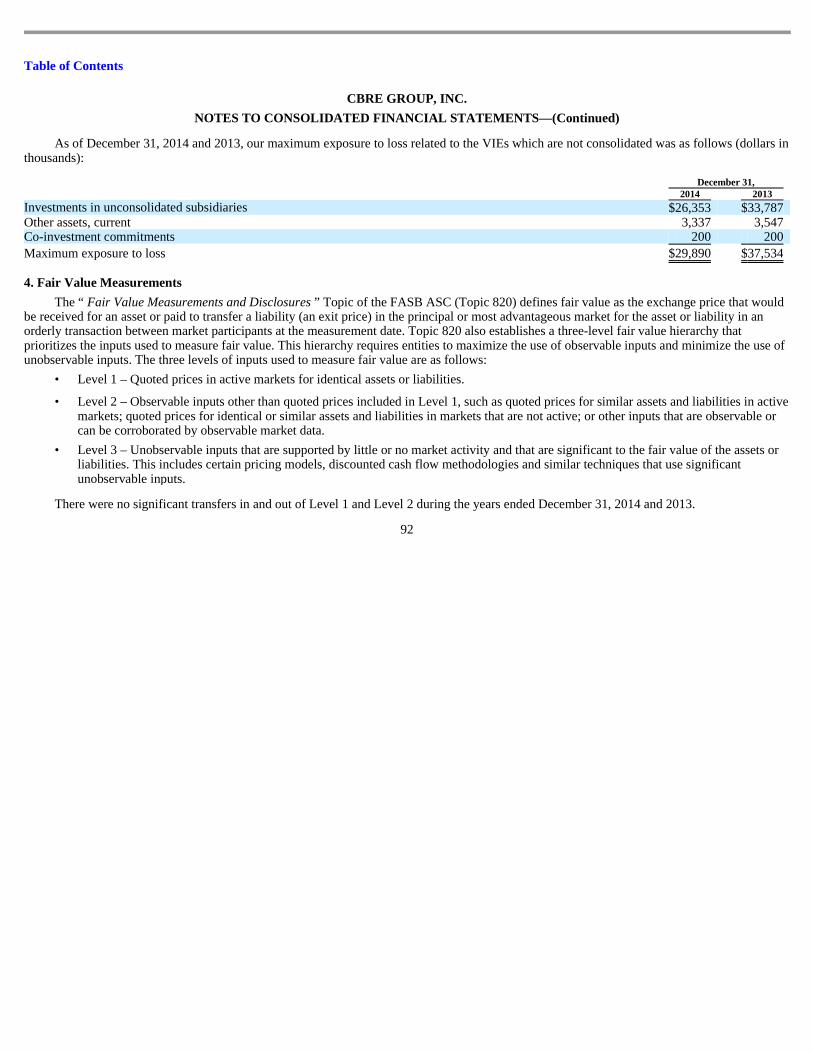
Table of Contents
CBRE GROUP, INC.
NOTES TO CONSOLIDATED FINANCIAL STATEMENTS —(Continued)
As of December 31, 2014 and 2013, our maximum exposure to loss related to the VIEs which are not consolidated was as follows (dollars in thousands):
4. Fair Value Measurements
December 31, 2014 2013 Investments in unconsolidated subsidiaries $ 26,353 $ 33,787 Other assets, current 3,337 3,547 Co-investment commitments 200 200
Maximum exposure to loss $ 29,890 $ 37,534
The “ Fair Value Measurements and Disclosures ” Topic of the FASB ASC (Topic 820) defines fair value as the exchange price that would be received for an asset or paid to transfer a liability (an exit price) in the principal or most advantageous market for the asset or liability in an orderly transaction between market participants at the measurement date. Topic 820 also establishes a three-level fair value hierarchy that prioritizes the inputs used to measure fair value. This hierarchy requires entities to maximize the use of observable inputs and minimize the use of unobservable inputs. The three levels of inputs used to measure fair value are as follows:
• Level 1 – Quoted prices in active markets for identical assets or liabilities.
• Level 2 – Observable inputs other than quoted prices included in Level 1, such as quoted prices for similar assets and liabilities in active
markets; quoted prices for identical or similar assets and liabilities in markets that are not active; or other inputs that are observable or can be corroborated by observable market data.
There were no significant transfers in and out of Level 1 and Level 2 during the years ended December 31, 2014 and 2013.
92
• Level 3 – Unobservable inputs that are supported by little or no market activity and that are significant to the fair value of the assets or
liabilities. This includes certain pricing models, discounted cash flow methodologies and similar techniques that use significant unobservable inputs.
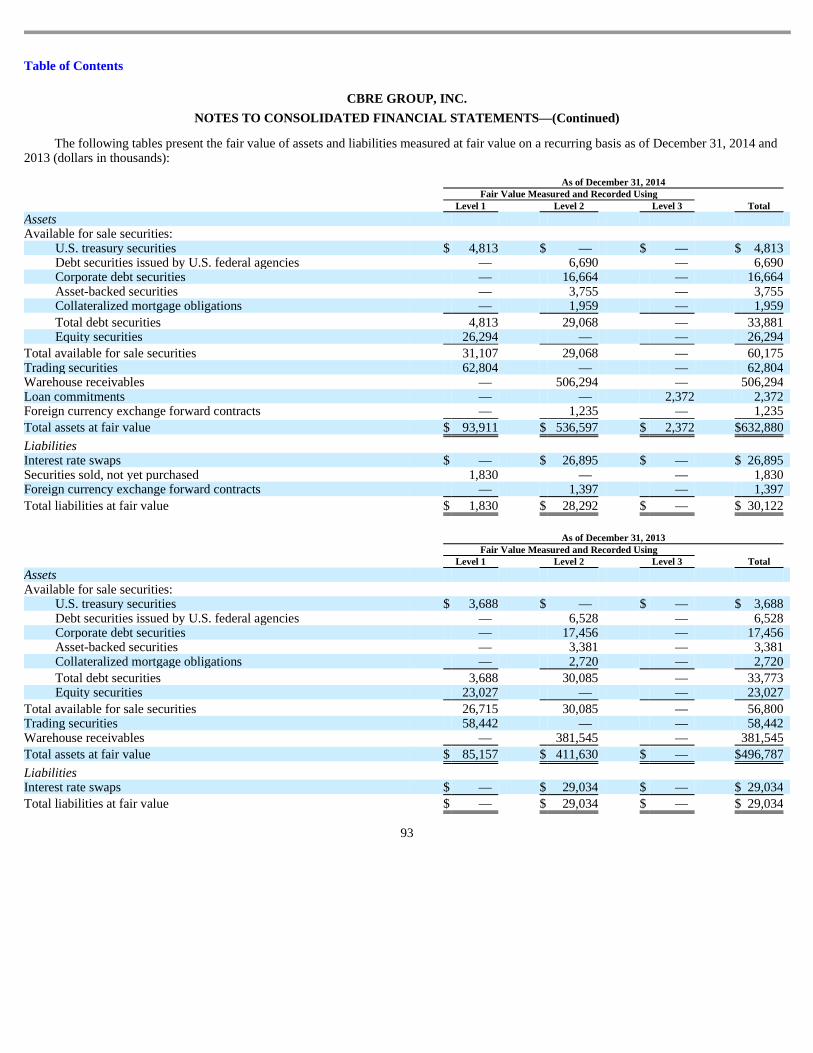
Table of Contents
CBRE GROUP, INC.
NOTES TO CONSOLIDATED FINANCIAL STATEMENTS —(Continued)
The following tables present the fair value of assets and liabilities measured at fair value on a recurring basis as of December 31, 2014 and 2013 (dollars in thousands):
93
As of December 31, 2014 Fair Value Measured and Recorded Using Level 1 Level 2 Level 3 Total Assets Available for sale securities:
U.S. treasury securities $ 4,813 $ — $ — $ 4,813 Debt securities issued by U.S. federal agencies — 6,690 — 6,690 Corporate debt securities — 16,664 — 16,664 Asset-backed securities — 3,755 — 3,755 Collateralized mortgage obligations — 1,959 — 1,959
Total debt securities 4,813 29,068 — 33,881 Equity securities 26,294 — — 26,294
Total available for sale securities 31,107 29,068 — 60,175 Trading securities 62,804 — — 62,804 Warehouse receivables — 506,294 — 506,294 Loan commitments — — 2,372 2,372 Foreign currency exchange forward contracts — 1,235 — 1,235
Total assets at fair value $ 93,911 $ 536,597 $ 2,372 $ 632,880
Liabilities Interest rate swaps $ — $ 26,895 $ — $ 26,895 Securities sold, not yet purchased 1,830 — — 1,830 Foreign currency exchange forward contracts — 1,397 — 1,397
Total liabilities at fair value $ 1,830 $ 28,292 $ — $ 30,122
As of December 31, 2013 Fair Value Measured and Recorded Using Level 1 Level 2 Level 3 Total Assets Available for sale securities:
U.S. treasury securities $ 3,688 $ — $ — $ 3,688 Debt securities issued by U.S. federal agencies — 6,528 — 6,528 Corporate debt securities — 17,456 — 17,456 Asset-backed securities — 3,381 — 3,381 Collateralized mortgage obligations — 2,720 — 2,720
Total debt securities 3,688 30,085 — 33,773 Equity securities 23,027 — — 23,027
Total available for sale securities 26,715 30,085 — 56,800 Trading securities 58,442 — — 58,442 Warehouse receivables — 381,545 — 381,545
Total assets at fair value $ 85,157 $ 411,630 $ — $ 496,787
Liabilities Interest rate swaps $ — $ 29,034 $ — $ 29,034
Total liabilities at fair value $ — $ 29,034 $ — $ 29,034
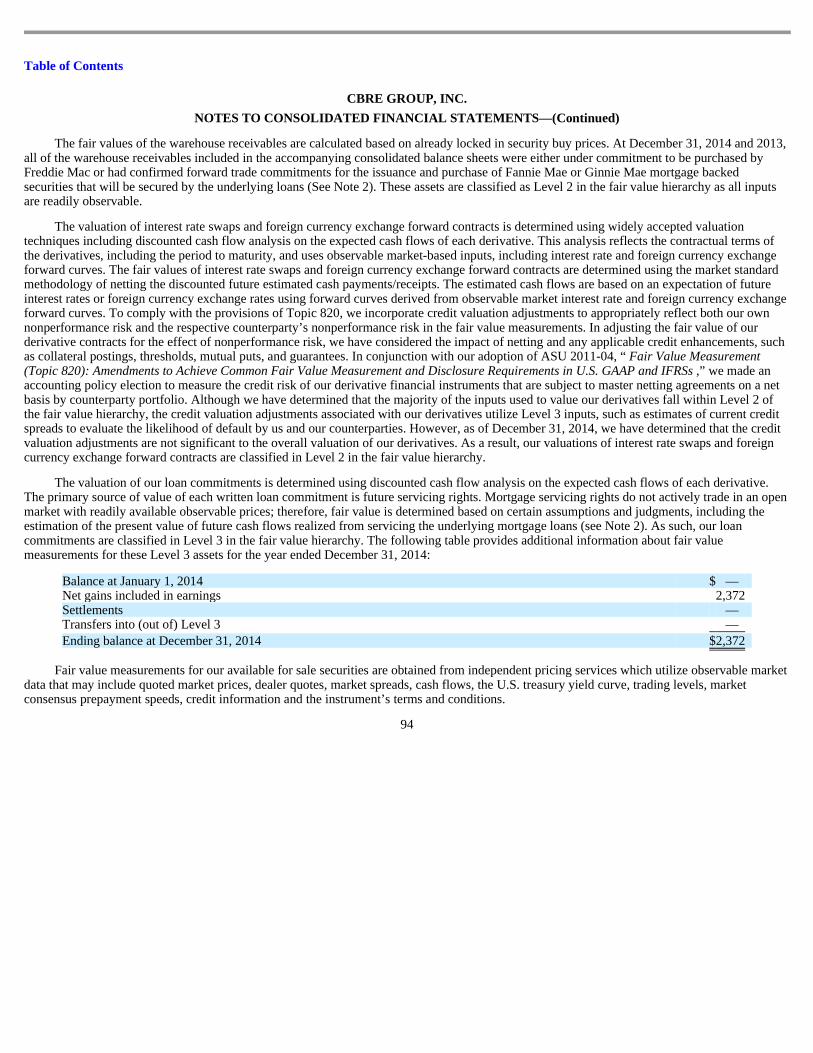
Table of Contents
CBRE GROUP, INC.
NOTES TO CONSOLIDATED FINANCIAL STATEMENTS —(Continued)
The fair values of the warehouse receivables are calculated based on already locked in security buy prices. At December 31, 2014 and 2013, all of the warehouse receivables included in the accompanying consolidated balance sheets were either under commitment to be purchased by Freddie Mac or had confirmed forward trade commitments for the issuance and purchase of Fannie Mae or Ginnie Mae mortgage backed securities that will be secured by the underlying loans (See Note 2). These assets are classified as Level 2 in the fair value hierarchy as all inputs are readily observable.
The valuation of interest rate swaps and foreign currency exchange forward contracts is determined using widely accepted valuation techniques including discounted cash flow analysis on the expected cash flows of each derivative. This analysis reflects the contractual terms of the derivatives, including the period to maturity, and uses observable market-based inputs, including interest rate and foreign currency exchange forward curves. The fair values of interest rate swaps and foreign currency exchange forward contracts are determined using the market standard methodology of netting the discounted future estimated cash payments/receipts. The estimated cash flows are based on an expectation of future interest rates or foreign currency exchange rates using forward curves derived from observable market interest rate and foreign currency exchange forward curves. To comply with the provisions of Topic 820, we incorporate credit valuation adjustments to appropriately reflect both our own nonperformance risk and the respective counterparty’s nonperformance risk in the fair value measurements. In adjusting the fair value of our derivative contracts for the effect of nonperformance risk, we have considered the impact of netting and any applicable credit enhancements, such as collateral postings, thresholds, mutual puts, and guarantees. In conjunction with our adoption of ASU 2011-04, “ Fair Value Measurement (Topic 820): Amendments to Achieve Common Fair Value Measurement and Disclosure Requirements in U.S. GAAP and IFRSs ,” we made an accounting policy election to measure the credit risk of our derivative financial instruments that are subject to master netting agreements on a net basis by counterparty portfolio. Although we have determined that the majority of the inputs used to value our derivatives fall within Level 2 of the fair value hierarchy, the credit valuation adjustments associated with our derivatives utilize Level 3 inputs, such as estimates of current credit spreads to evaluate the likelihood of default by us and our counterparties. However, as of December 31, 2014, we have determined that the credit valuation adjustments are not significant to the overall valuation of our derivatives. As a result, our valuations of interest rate swaps and foreign currency exchange forward contracts are classified in Level 2 in the fair value hierarchy.
The valuation of our loan commitments is determined using discounted cash flow analysis on the expected cash flows of each derivative. The primary source of value of each written loan commitment is future servicing rights. Mortgage servicing rights do not actively trade in an open market with readily available observable prices; therefore, fair value is determined based on certain assumptions and judgments, including the estimation of the present value of future cash flows realized from servicing the underlying mortgage loans (see Note 2). As such, our loan commitments are classified in Level 3 in the fair value hierarchy. The following table provides additional information about fair value measurements for these Level 3 assets for the year ended December 31, 2014:
Fair value measurements for our available for sale securities are obtained from independent pricing services which utilize observable market
data that may include quoted market prices, dealer quotes, market spreads, cash flows, the U.S. treasury yield curve, trading levels, market consensus prepayment speeds, credit information and the instrument’s terms and conditions.
94
Balance at January 1, 2014 $ — Net gains included in earnings 2,372 Settlements — Transfers into (out of) Level 3 —
Ending balance at December 31, 2014 $ 2,372
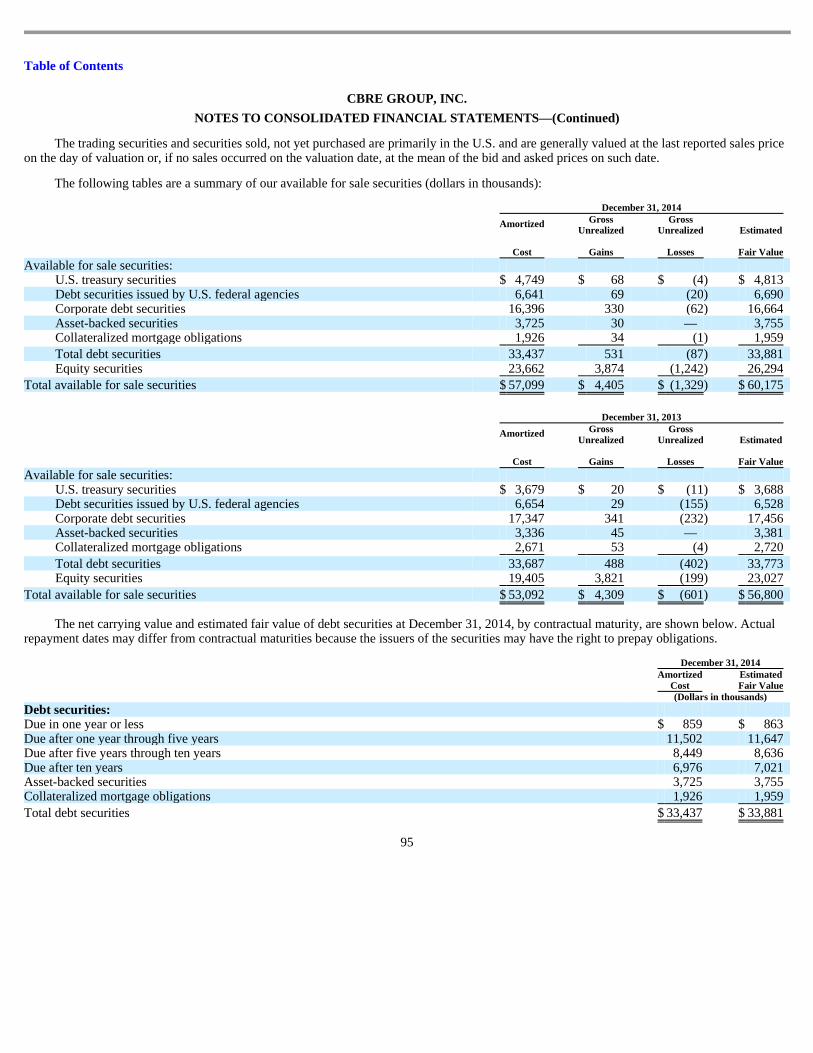
Table of Contents
CBRE GROUP, INC.
NOTES TO CONSOLIDATED FINANCIAL STATEMENTS —(Continued)
The trading securities and securities sold, not yet purchased are primarily in the U.S. and are generally valued at the last reported sales price on the day of valuation or, if no sales occurred on the valuation date, at the mean of the bid and asked prices on such date.
The following tables are a summary of our available for sale securities (dollars in thousands):
The net carrying value and estimated fair value of debt securities at December 31, 2014, by contractual maturity, are shown below. Actual
repayment dates may differ from contractual maturities because the issuers of the securities may have the right to prepay obligations.
95
December 31, 2014
Amortized
Cost
Gross Unrealized
Gains
Gross Unrealized
Losses
Estimated
Fair Value Available for sale securities:
U.S. treasury securities $ 4,749 $ 68 $ (4 ) $ 4,813 Debt securities issued by U.S. federal agencies 6,641 69 (20 ) 6,690 Corporate debt securities 16,396 330 (62 ) 16,664 Asset-backed securities 3,725 30 — 3,755 Collateralized mortgage obligations 1,926 34 (1 ) 1,959
Total debt securities 33,437 531 (87 ) 33,881 Equity securities 23,662 3,874 (1,242 ) 26,294
Total available for sale securities $ 57,099 $ 4,405 $ (1,329 ) $ 60,175
December 31, 2013
Amortized
Cost
Gross Unrealized
Gains
Gross Unrealized
Losses
Estimated
Fair Value Available for sale securities:
U.S. treasury securities $ 3,679 $ 20 $ (11 ) $ 3,688 Debt securities issued by U.S. federal agencies 6,654 29 (155 ) 6,528 Corporate debt securities 17,347 341 (232 ) 17,456 Asset-backed securities 3,336 45 — 3,381 Collateralized mortgage obligations 2,671 53 (4 ) 2,720
Total debt securities 33,687 488 (402 ) 33,773 Equity securities 19,405 3,821 (199 ) 23,027
Total available for sale securities $ 53,092 $ 4,309 $ (601 ) $ 56,800
December 31, 2014
Amortized
Cost Estimated Fair Value
(Dollars in thousands) Debt securities: Due in one year or less $ 859 $ 863 Due after one year through five years 11,502 11,647 Due after five years through ten years 8,449 8,636 Due after ten years 6,976 7,021 Asset-backed securities 3,725 3,755 Collateralized mortgage obligations 1,926 1,959
Total debt securities $ 33,437 $ 33,881
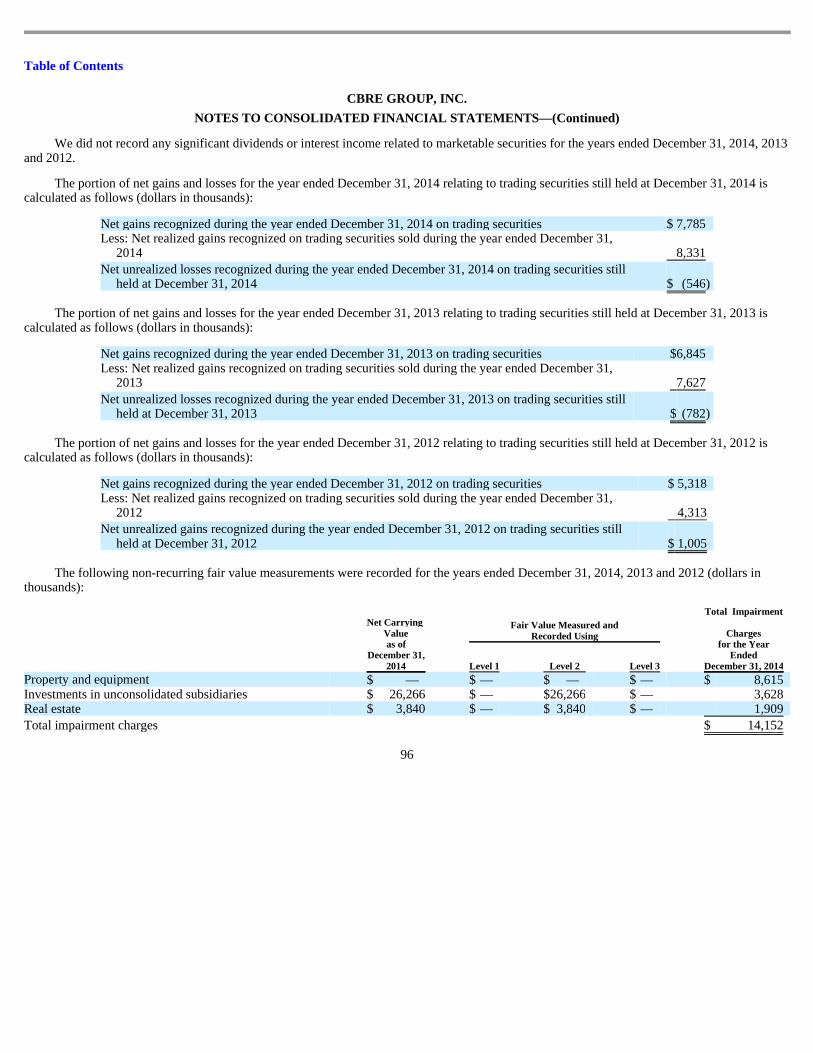
Table of Contents
CBRE GROUP, INC.
NOTES TO CONSOLIDATED FINANCIAL STATEMENTS —(Continued)
We did not record any significant dividends or interest income related to marketable securities for the years ended December 31, 2014, 2013 and 2012.
The portion of net gains and losses for the year ended December 31, 2014 relating to trading securities still held at December 31, 2014 is calculated as follows (dollars in thousands):
The portion of net gains and losses for the year ended December 31, 2013 relating to trading securities still held at December 31, 2013 is
calculated as follows (dollars in thousands):
The portion of net gains and losses for the year ended December 31, 2012 relating to trading securities still held at December 31, 2012 is
calculated as follows (dollars in thousands):
The following non-recurring fair value measurements were recorded for the years ended December 31, 2014, 2013 and 2012 (dollars in
thousands):
96
Net gains recognized during the year ended December 31, 2014 on trading securities $ 7,785 Less: Net realized gains recognized on trading securities sold during the year ended December 31,
2014 8,331
Net unrealized losses recognized during the year ended December 31, 2014 on trading securities still held at December 31, 2014 $ (546 )
Net gains recognized during the year ended December 31, 2013 on trading securities $ 6,845 Less: Net realized gains recognized on trading securities sold during the year ended December 31,
2013 7,627
Net unrealized losses recognized during the year ended December 31, 2013 on trading securities still held at December 31, 2013 $ (782 )
Net gains recognized during the year ended December 31, 2012 on trading securities $ 5,318 Less: Net realized gains recognized on trading securities sold during the year ended December 31,
2012 4,313
Net unrealized gains recognized during the year ended December 31, 2012 on trading securities still held at December 31, 2012 $ 1,005
Net Carrying Value as of
December 31, 2014
Fair Value Measured and
Recorded Using
Total Impairment
Charges
for the Year Ended
December 31, 2014
Level 1 Level 2 Level 3 Property and equipment $ — $ — $ — $ — $ 8,615 Investments in unconsolidated subsidiaries $ 26,266 $ — $ 26,266 $ — 3,628 Real estate $ 3,840 $ — $ 3,840 $ — 1,909
Total impairment charges $ 14,152
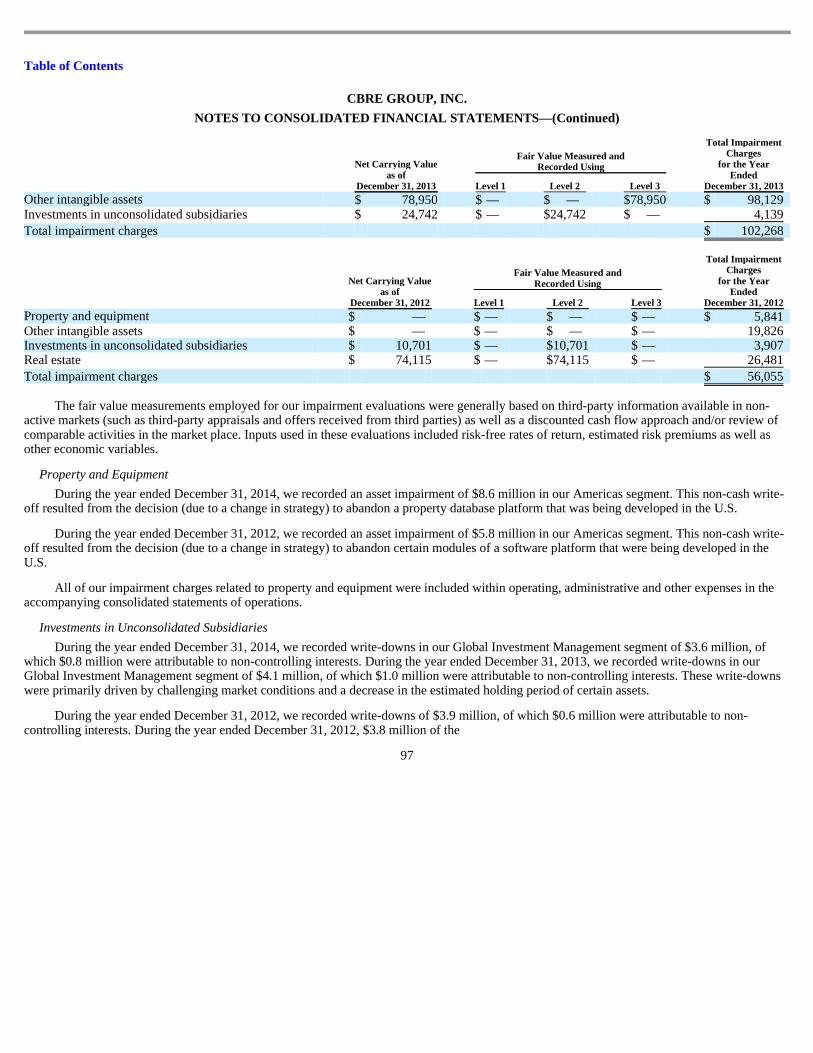
Table of Contents
CBRE GROUP, INC.
NOTES TO CONSOLIDATED FINANCIAL STATEMENTS —(Continued)
The fair value measurements employed for our impairment evaluations were generally based on third-party information available in non-
active markets (such as third-party appraisals and offers received from third parties) as well as a discounted cash flow approach and/or review of comparable activities in the market place. Inputs used in these evaluations included risk-free rates of return, estimated risk premiums as well as other economic variables.
Property and Equipment
Net Carrying Value as of
December 31, 2013
Fair Value Measured and
Recorded Using
Total Impairment
Charges for the Year
Ended December 31, 2013
Level 1 Level 2 Level 3 Other intangible assets $ 78,950 $ — $ — $ 78,950 $ 98,129 Investments in unconsolidated subsidiaries $ 24,742 $ — $ 24,742 $ — 4,139
Total impairment charges $ 102,268
Net Carrying Value as of
December 31, 2012
Fair Value Measured and
Recorded Using
Total Impairment
Charges for the Year
Ended December 31, 2012
Level 1 Level 2 Level 3 Property and equipment $ — $ — $ — $ — $ 5,841 Other intangible assets $ — $ — $ — $ — 19,826 Investments in unconsolidated subsidiaries $ 10,701 $ — $ 10,701 $ — 3,907 Real estate $ 74,115 $ — $ 74,115 $ — 26,481
Total impairment charges $ 56,055
During the year ended December 31, 2014, we recorded an asset impairment of $8.6 million in our Americas segment. This non-cash write-off resulted from the decision (due to a change in strategy) to abandon a property database platform that was being developed in the U.S.
During the year ended December 31, 2012, we recorded an asset impairment of $5.8 million in our Americas segment. This non-cash write-off resulted from the decision (due to a change in strategy) to abandon certain modules of a software platform that were being developed in the U.S.
All of our impairment charges related to property and equipment were included within operating, administrative and other expenses in the accompanying consolidated statements of operations.
Investments in Unconsolidated Subsidiaries
During the year ended December 31, 2014, we recorded write-downs in our Global Investment Management segment of $3.6 million, of which $0.8 million were attributable to non-controlling interests. During the year ended December 31, 2013, we recorded write-downs in our Global Investment Management segment of $4.1 million, of which $1.0 million were attributable to non-controlling interests. These write-downs were primarily driven by challenging market conditions and a decrease in the estimated holding period of certain assets.
During the year ended December 31, 2012, we recorded write-downs of $3.9 million, of which $0.6 million were attributable to non-controlling interests. During the year ended December 31, 2012, $3.8 million of the
97
Table of Contents
CBRE GROUP, INC.
NOTES TO CONSOLIDATED FINANCIAL STATEMENTS —(Continued) investment write-downs were reported in our Global Investment Management segment and $0.1 million were reported in our Development Services segment. These write-downs were primarily driven by a decrease in the estimated holding period of certain assets and challenging market conditions.
All of our impairment charges related to investments in unconsolidated subsidiaries were included in equity income from unconsolidated subsidiaries in the accompanying consolidated statements of operations.
Real Estate
During the year ended December 31, 2014, we recorded a provision for loss on real estate held for sale of $1.9 million, of which $1.8 million was attributable to non-controlling interests. This charge reduced the carrying value of certain assets to their fair value, less cost to sell, primarily due to reduced selling prices resulting from a decrease in the estimated holding period of certain assets.
During the year ended December 31, 2012, we recorded impairment charges of $26.5 million on real estate held for investment. Of this amount, $15.9 million was attributable to non-controlling interests. These impairment charges were driven by a decrease in the estimated holding period of certain assets and challenging market conditions.
All of the abovementioned charges were reported in our Development Services segment, with the exception of a $9.3 million impairment charge reported in our Global Investment Management segment during the year ended December 31, 2012. All of the abovementioned charges were included within operating, administrative and other expenses in the accompanying consolidated statements of operations.
Other Intangible Assets
During the year ended December 31, 2013, we recorded a non-amortizable intangible asset impairment of $98.1 million in our Global Investment Management segment. This non-cash write-off related to a decrease in value of our open-end funds, primarily in Europe. These funds experienced a decline in assets under management, as the business mix shifted toward separate accounts, consistent with market movements following the extended financial crisis in Europe, which resulted in project sales and planned liquidations of certain funds.
During the year ended December 31, 2012, we recorded a non-amortizable intangible asset impairment of $19.8 million in our EMEA segment. This non-cash write-off related to the discontinuation of the use of a trade name in the United Kingdom (U.K.).
All of our impairment charges related to non-amortizable intangible assets were included as a separate line item in the accompanying consolidated statements of operations.
FASB ASC Topic 825, “ Financial Instruments ” requires disclosure of fair value information about financial instruments, whether or not recognized in the accompanying consolidated balance sheets. Our financial instruments are as follows:
Cash and Cash Equivalents and Restricted Cash : These balances include cash and cash equivalents as well as restricted cash with maturities of less than three months. The carrying amount approximates fair value due to the short-term maturities of these instruments.
Receivables, less Allowance for Doubtful Accounts: Due to their short-term nature, fair value approximates carrying value.
98
Table of Contents
CBRE GROUP, INC.
NOTES TO CONSOLIDATED FINANCIAL STATEMENTS —(Continued)
Warehouse Receivables: These balances are carried at fair value based on market prices at the balance sheet date.
Trading and Available for Sale Securities: These investments are carried at their fair value.
Foreign Currency Exchange Forward Contracts and Loan Commitments: These assets and liabilities are carried at their fair value as calculated by using widely accepted valuation techniques including discounted cash flow analysis on the expected cash flows of each derivative (see Note 5).
Securities Sold, not yet Purchased: These liabilities are carried at their fair value.
Short-Term Borrowings : The majority of this balance represents outstanding amounts under our warehouse lines of credit for CBRE Capital Markets and revolving credit facility. Due to the short-term nature and variable interest rates of these instruments, fair value approximates carrying value (see Note 12).
Senior Secured Term Loans : Based upon information from third-party banks (which falls within Level 2 of the fair value hierarchy), the estimated fair value of our senior secured term loans was approximately $645.1 million and $687.6 million at December 31, 2014 and 2013, respectively. Their actual carrying value totaled $645.6 million and $685.3 million at December 31, 2014 and 2013, respectively (see Note 12).
Interest Rate Swaps : These liabilities are carried at their fair value as calculated by using widely accepted valuation techniques including discounted cash flow analysis on the expected cash flows of each derivative (see Note 5).
5.00% Senior Notes : Based on dealers’ quotes (which falls within Level 2 of the fair value hierarchy), the estimated fair value of our 5.00% senior notes was $818.0 million and $769.4 million at December 31, 2014 and 2013, respectively. Their actual carrying value totaled $800.0 million at both December 31, 2014 and 2013 (see Note 12).
5.25% Senior Notes : On September 26, 2014, CBRE issued $300.0 million in aggregate principal amount of 5.25% senior notes due March 15, 2025. On December 12, 2014, CBRE issued an additional $125.0 million in aggregate principal amount of 5.25% senior notes due March 15, 2025 at a price equal to 101.5% of their face value, plus interest deemed to have accrued from September 26, 2014. Based on dealers’ quotes (which falls within Level 2 of the fair value hierarchy), the estimated fair value of our 5.25% senior notes was $439.7 million at December 31, 2014. Their actual carrying value totaled $426.8 million at December 31, 2014 (see Note 12).
6.625% Senior Notes : Based on dealers’ quotes (which falls within Level 2 of the fair value hierarchy), the estimated fair value of our 6.625% senior notes was $372.8 million at December 31, 2013. Their actual carrying value totaled $350.0 million at December 31, 2013. We redeemed these notes in full on October 27, 2014 (see Note 12).
Notes Payable on Real Estate: As of December 31, 2014 and 2013, the carrying value of our notes payable on real estate was $42.8 million and $130.5 million, respectively (see Note 11). These borrowings generally have floating interest rates at spreads over a market rate index. It is likely that some portion of our notes payable on real estate have fair values lower than actual carrying values. Given the cost involved in estimating their fair value, we determined it was not practicable to do so. Additionally, only $4.0 million of these notes payable were recourse to us as of December 31, 2013 (none were recourse at December 31, 2014).
99
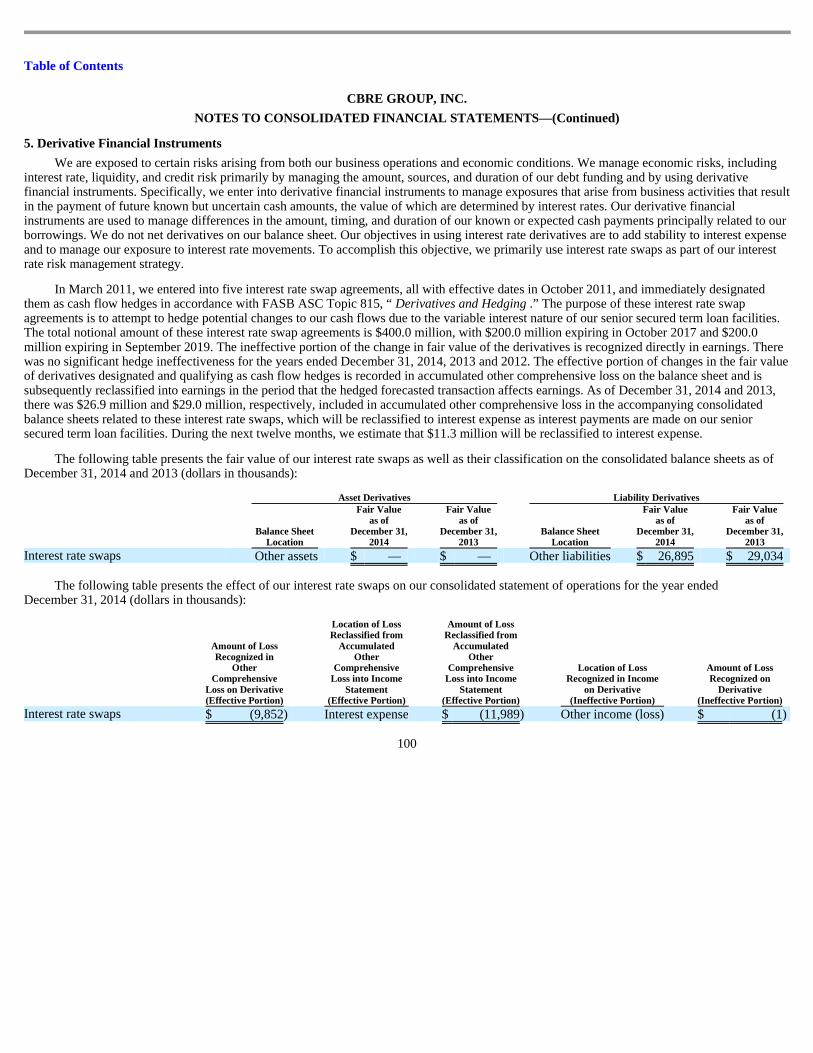
Table of Contents
CBRE GROUP, INC.
NOTES TO CONSOLIDATED FINANCIAL STATEMENTS —(Continued) 5. Derivative Financial Instruments
We are exposed to certain risks arising from both our business operations and economic conditions. We manage economic risks, including interest rate, liquidity, and credit risk primarily by managing the amount, sources, and duration of our debt funding and by using derivative financial instruments. Specifically, we enter into derivative financial instruments to manage exposures that arise from business activities that result in the payment of future known but uncertain cash amounts, the value of which are determined by interest rates. Our derivative financial instruments are used to manage differences in the amount, timing, and duration of our known or expected cash payments principally related to our borrowings. We do not net derivatives on our balance sheet. Our objectives in using interest rate derivatives are to add stability to interest expense and to manage our exposure to interest rate movements. To accomplish this objective, we primarily use interest rate swaps as part of our interest rate risk management strategy.
In March 2011, we entered into five interest rate swap agreements, all with effective dates in October 2011, and immediately designated them as cash flow hedges in accordance with FASB ASC Topic 815, “ Derivatives and Hedging .” The purpose of these interest rate swap agreements is to attempt to hedge potential changes to our cash flows due to the variable interest nature of our senior secured term loan facilities. The total notional amount of these interest rate swap agreements is $400.0 million, with $200.0 million expiring in October 2017 and $200.0 million expiring in September 2019. The ineffective portion of the change in fair value of the derivatives is recognized directly in earnings. There was no significant hedge ineffectiveness for the years ended December 31, 2014, 2013 and 2012. The effective portion of changes in the fair value of derivatives designated and qualifying as cash flow hedges is recorded in accumulated other comprehensive loss on the balance sheet and is subsequently reclassified into earnings in the period that the hedged forecasted transaction affects earnings. As of December 31, 2014 and 2013, there was $26.9 million and $29.0 million, respectively, included in accumulated other comprehensive loss in the accompanying consolidated balance sheets related to these interest rate swaps, which will be reclassified to interest expense as interest payments are made on our senior secured term loan facilities. During the next twelve months, we estimate that $11.3 million will be reclassified to interest expense.
The following table presents the fair value of our interest rate swaps as well as their classification on the consolidated balance sheets as of December 31, 2014 and 2013 (dollars in thousands):
The following table presents the effect of our interest rate swaps on our consolidated statement of operations for the year ended
December 31, 2014 (dollars in thousands):
100
Asset Derivatives Liability Derivatives
Balance Sheet
Location
Fair Value as of
December 31, 2014
Fair Value as of
December 31, 2013
Balance Sheet Location
Fair Value as of
December 31, 2014
Fair Value as of
December 31, 2013
Interest rate swaps Other assets $ — $ — Other liabilities $ 26,895 $ 29,034
Amount of Loss Recognized in
Other Comprehensive
Loss on Derivative (Effective Portion)
Location of Loss Reclassified from
Accumulated Other
Comprehensive Loss into Income
Statement (Effective Portion)
Amount of Loss Reclassified from
Accumulated Other
Comprehensive Loss into Income
Statement (Effective Portion)
Location of Loss Recognized in Income
on Derivative (Ineffective Portion)
Amount of Loss Recognized on
Derivative (Ineffective Portion)
Interest rate swaps $ (9,852 ) Interest expense $ (11,989 ) Other income (loss) $ (1 )
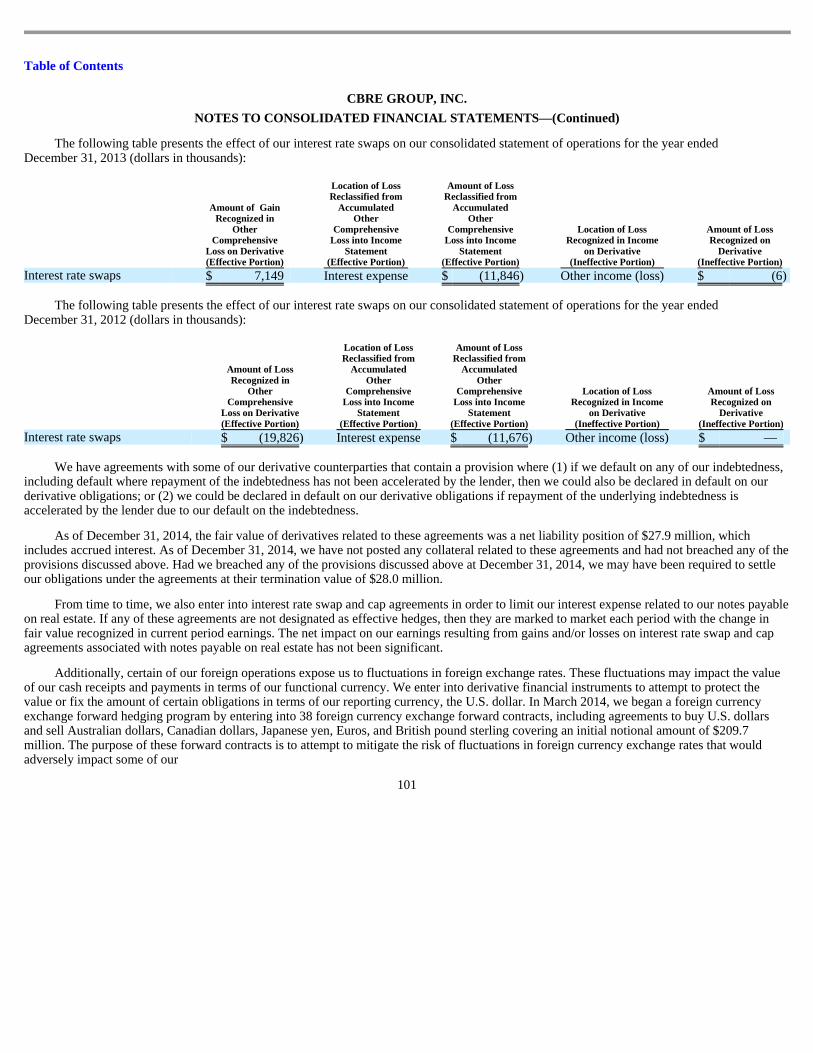
Table of Contents
CBRE GROUP, INC.
NOTES TO CONSOLIDATED FINANCIAL STATEMENTS —(Continued)
The following table presents the effect of our interest rate swaps on our consolidated statement of operations for the year ended December 31, 2013 (dollars in thousands):
The following table presents the effect of our interest rate swaps on our consolidated statement of operations for the year ended
December 31, 2012 (dollars in thousands):
We have agreements with some of our derivative counterparties that contain a provision where (1) if we default on any of our indebtedness,
including default where repayment of the indebtedness has not been accelerated by the lender, then we could also be declared in default on our derivative obligations; or (2) we could be declared in default on our derivative obligations if repayment of the underlying indebtedness is accelerated by the lender due to our default on the indebtedness.
As of December 31, 2014, the fair value of derivatives related to these agreements was a net liability position of $27.9 million, which includes accrued interest. As of December 31, 2014, we have not posted any collateral related to these agreements and had not breached any of the provisions discussed above. Had we breached any of the provisions discussed above at December 31, 2014, we may have been required to settle our obligations under the agreements at their termination value of $28.0 million.
From time to time, we also enter into interest rate swap and cap agreements in order to limit our interest expense related to our notes payable on real estate. If any of these agreements are not designated as effective hedges, then they are marked to market each period with the change in fair value recognized in current period earnings. The net impact on our earnings resulting from gains and/or losses on interest rate swap and cap agreements associated with notes payable on real estate has not been significant.
Additionally, certain of our foreign operations expose us to fluctuations in foreign exchange rates. These fluctuations may impact the value of our cash receipts and payments in terms of our functional currency. We enter into derivative financial instruments to attempt to protect the value or fix the amount of certain obligations in terms of our reporting currency, the U.S. dollar. In March 2014, we began a foreign currency exchange forward hedging program by entering into 38 foreign currency exchange forward contracts, including agreements to buy U.S. dollars and sell Australian dollars, Canadian dollars, Japanese yen, Euros, and British pound sterling covering an initial notional amount of $209.7 million. The purpose of these forward contracts is to attempt to mitigate the risk of fluctuations in foreign currency exchange rates that would adversely impact some of our
101
Amount of Gain Recognized in
Other Comprehensive
Loss on Derivative (Effective Portion)
Location of Loss Reclassified from
Accumulated Other
Comprehensive Loss into Income
Statement (Effective Portion)
Amount of Loss Reclassified from
Accumulated Other
Comprehensive Loss into Income
Statement (Effective Portion)
Location of Loss Recognized in Income
on Derivative (Ineffective Portion)
Amount of Loss Recognized on
Derivative (Ineffective Portion)
Interest rate swaps $ 7,149 Interest expense $ (11,846 ) Other income (loss) $ (6 )
Amount of Loss Recognized in
Other Comprehensive
Loss on Derivative (Effective Portion)
Location of Loss Reclassified from
Accumulated Other
Comprehensive Loss into Income
Statement (Effective Portion)
Amount of Loss Reclassified from
Accumulated Other
Comprehensive Loss into Income
Statement (Effective Portion)
Location of Loss Recognized in Income
on Derivative (Ineffective Portion)
Amount of Loss Recognized on
Derivative (Ineffective Portion)
Interest rate swaps $ (19,826 ) Interest expense $ (11,676 ) Other income (loss) $ —
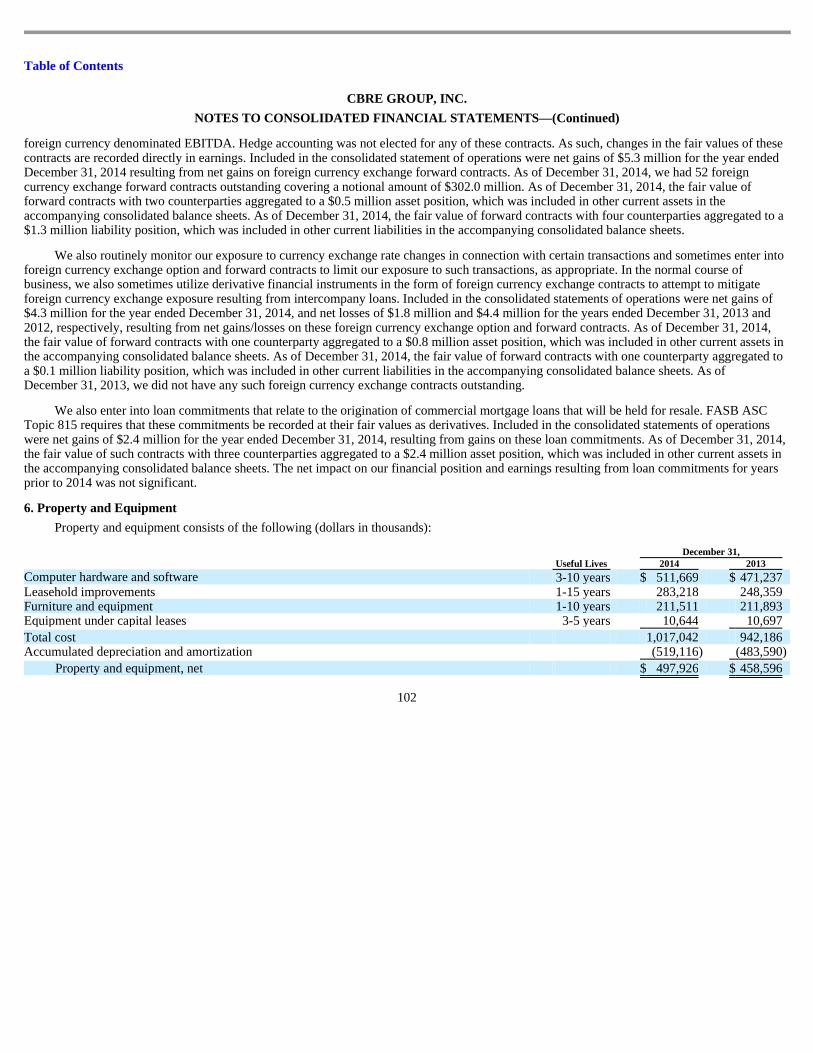
Table of Contents
CBRE GROUP, INC.
NOTES TO CONSOLIDATED FINANCIAL STATEMENTS —(Continued) foreign currency denominated EBITDA. Hedge accounting was not elected for any of these contracts. As such, changes in the fair values of these contracts are recorded directly in earnings. Included in the consolidated statement of operations were net gains of $5.3 million for the year ended December 31, 2014 resulting from net gains on foreign currency exchange forward contracts. As of December 31, 2014, we had 52 foreign currency exchange forward contracts outstanding covering a notional amount of $302.0 million. As of December 31, 2014, the fair value of forward contracts with two counterparties aggregated to a $0.5 million asset position, which was included in other current assets in the accompanying consolidated balance sheets. As of December 31, 2014, the fair value of forward contracts with four counterparties aggregated to a $1.3 million liability position, which was included in other current liabilities in the accompanying consolidated balance sheets.
We also routinely monitor our exposure to currency exchange rate changes in connection with certain transactions and sometimes enter into foreign currency exchange option and forward contracts to limit our exposure to such transactions, as appropriate. In the normal course of business, we also sometimes utilize derivative financial instruments in the form of foreign currency exchange contracts to attempt to mitigate foreign currency exchange exposure resulting from intercompany loans. Included in the consolidated statements of operations were net gains of $4.3 million for the year ended December 31, 2014, and net losses of $1.8 million and $4.4 million for the years ended December 31, 2013 and 2012, respectively, resulting from net gains/losses on these foreign currency exchange option and forward contracts. As of December 31, 2014, the fair value of forward contracts with one counterparty aggregated to a $0.8 million asset position, which was included in other current assets in the accompanying consolidated balance sheets. As of December 31, 2014, the fair value of forward contracts with one counterparty aggregated to a $0.1 million liability position, which was included in other current liabilities in the accompanying consolidated balance sheets. As of December 31, 2013, we did not have any such foreign currency exchange contracts outstanding.
We also enter into loan commitments that relate to the origination of commercial mortgage loans that will be held for resale. FASB ASC Topic 815 requires that these commitments be recorded at their fair values as derivatives. Included in the consolidated statements of operations were net gains of $2.4 million for the year ended December 31, 2014, resulting from gains on these loan commitments. As of December 31, 2014, the fair value of such contracts with three counterparties aggregated to a $2.4 million asset position, which was included in other current assets in the accompanying consolidated balance sheets. The net impact on our financial position and earnings resulting from loan commitments for years prior to 2014 was not significant. 6. Property and Equipment
Property and equipment consists of the following (dollars in thousands):
102
December 31, Useful Lives 2014 2013 Computer hardware and software 3-10 years $ 511,669 $ 471,237 Leasehold improvements 1-15 years 283,218 248,359 Furniture and equipment 1-10 years 211,511 211,893 Equipment under capital leases 3-5 years 10,644 10,697
Total cost 1,017,042 942,186 Accumulated depreciation and amortization (519,116 ) (483,590 )
Property and equipment, net $ 497,926 $ 458,596
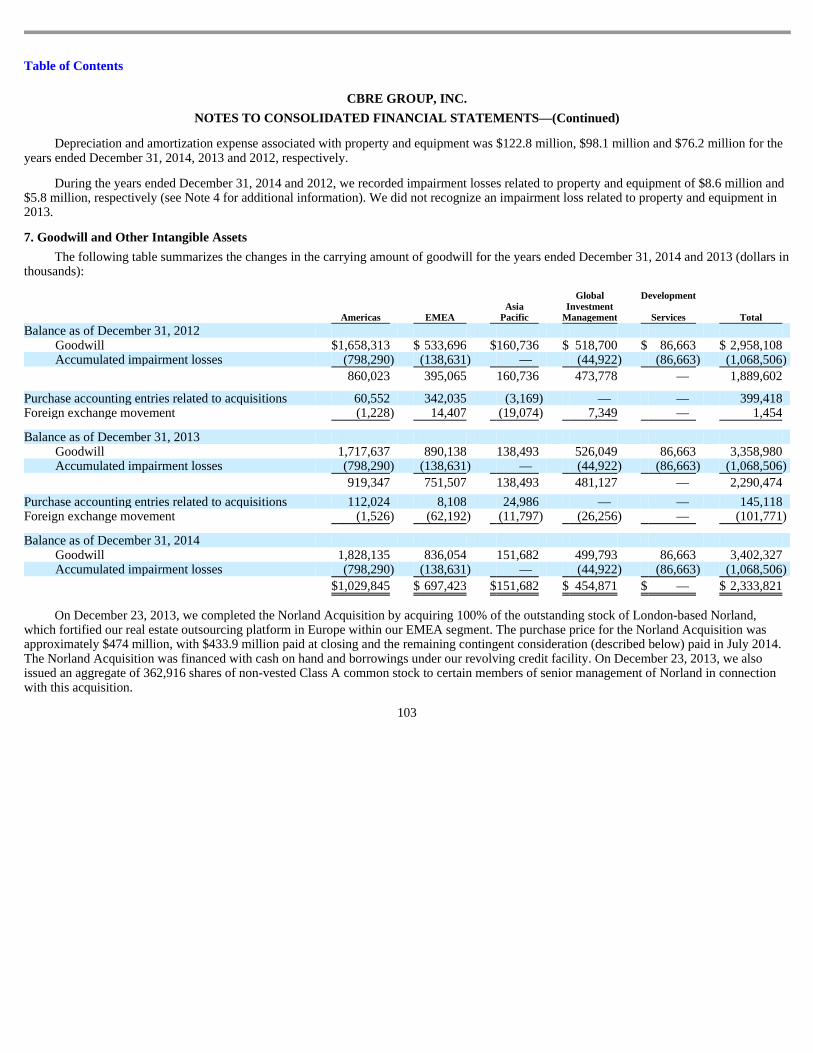
Table of Contents
CBRE GROUP, INC.
NOTES TO CONSOLIDATED FINANCIAL STATEMENTS —(Continued)
Depreciation and amortization expense associated with property and equipment was $122.8 million, $98.1 million and $76.2 million for the years ended December 31, 2014, 2013 and 2012, respectively.
During the years ended December 31, 2014 and 2012, we recorded impairment losses related to property and equipment of $8.6 million and $5.8 million, respectively (see Note 4 for additional information). We did not recognize an impairment loss related to property and equipment in 2013. 7. Goodwill and Other Intangible Assets
The following table summarizes the changes in the carrying amount of goodwill for the years ended December 31, 2014 and 2013 (dollars in thousands):
On December 23, 2013, we completed the Norland Acquisition by acquiring 100% of the outstanding stock of London-based Norland,
which fortified our real estate outsourcing platform in Europe within our EMEA segment. The purchase price for the Norland Acquisition was approximately $474 million, with $433.9 million paid at closing and the remaining contingent consideration (described below) paid in July 2014. The Norland Acquisition was financed with cash on hand and borrowings under our revolving credit facility. On December 23, 2013, we also issued an aggregate of 362,916 shares of non-vested Class A common stock to certain members of senior management of Norland in connection with this acquisition.
103
Americas EMEA Asia
Pacific
Global Investment
Management
Development
Services Total Balance as of December 31, 2012
Goodwill $ 1,658,313 $ 533,696 $ 160,736 $ 518,700 $ 86,663 $ 2,958,108 Accumulated impairment losses (798,290 ) (138,631 ) — (44,922 ) (86,663 ) (1,068,506 )
860,023 395,065 160,736 473,778 — 1,889,602
Purchase accounting entries related to acquisitions 60,552 342,035 (3,169 ) — — 399,418 Foreign exchange movement (1,228 ) 14,407 (19,074 ) 7,349 — 1,454
Balance as of December 31, 2013 Goodwill 1,717,637 890,138 138,493 526,049 86,663 3,358,980 Accumulated impairment losses (798,290 ) (138,631 ) — (44,922 ) (86,663 ) (1,068,506 )
919,347 751,507 138,493 481,127 — 2,290,474
Purchase accounting entries related to acquisitions 112,024 8,108 24,986 — — 145,118 Foreign exchange movement (1,526 ) (62,192 ) (11,797 ) (26,256 ) — (101,771 )
Balance as of December 31, 2014 Goodwill 1,828,135 836,054 151,682 499,793 86,663 3,402,327 Accumulated impairment losses (798,290 ) (138,631 ) — (44,922 ) (86,663 ) (1,068,506 )
$ 1,029,845 $ 697,423 $ 151,682 $ 454,871 $ — $ 2,333,821
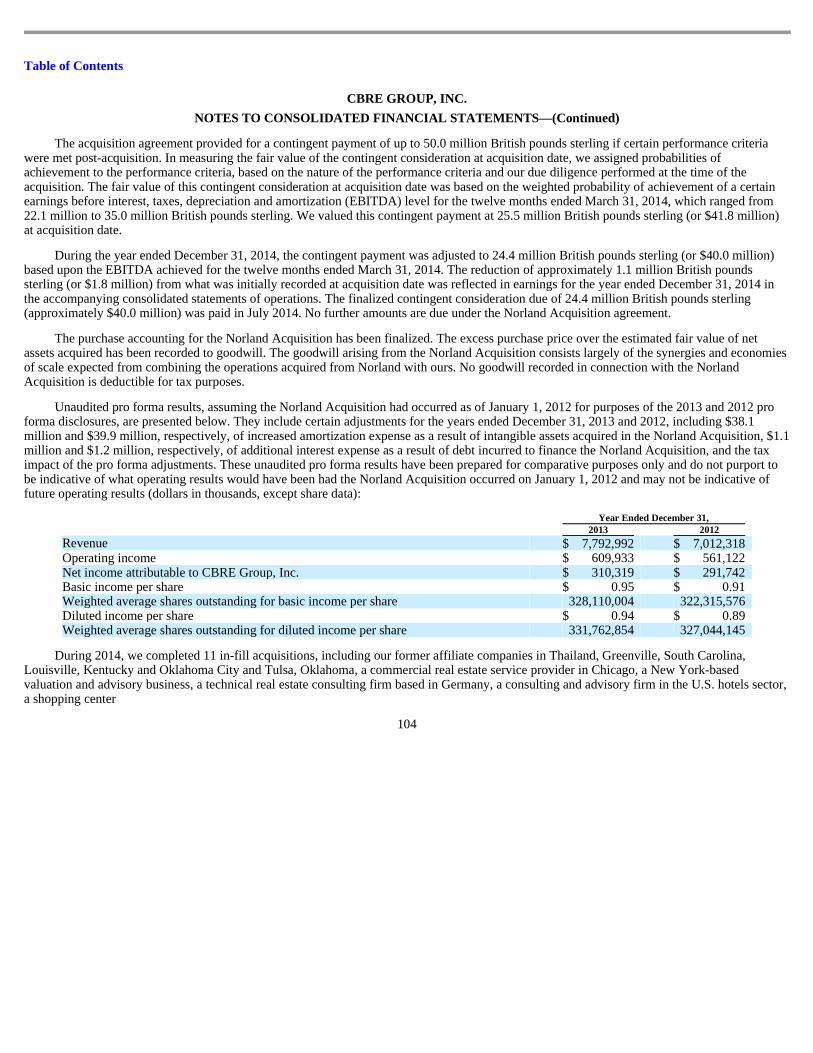
Table of Contents
CBRE GROUP, INC.
NOTES TO CONSOLIDATED FINANCIAL STATEMENTS —(Continued)
The acquisition agreement provided for a contingent payment of up to 50.0 million British pounds sterling if certain performance criteria were met post-acquisition. In measuring the fair value of the contingent consideration at acquisition date, we assigned probabilities of achievement to the performance criteria, based on the nature of the performance criteria and our due diligence performed at the time of the acquisition. The fair value of this contingent consideration at acquisition date was based on the weighted probability of achievement of a certain earnings before interest, taxes, depreciation and amortization (EBITDA) level for the twelve months ended March 31, 2014, which ranged from 22.1 million to 35.0 million British pounds sterling. We valued this contingent payment at 25.5 million British pounds sterling (or $41.8 million) at acquisition date.
During the year ended December 31, 2014, the contingent payment was adjusted to 24.4 million British pounds sterling (or $40.0 million) based upon the EBITDA achieved for the twelve months ended March 31, 2014. The reduction of approximately 1.1 million British pounds sterling (or $1.8 million) from what was initially recorded at acquisition date was reflected in earnings for the year ended December 31, 2014 in the accompanying consolidated statements of operations. The finalized contingent consideration due of 24.4 million British pounds sterling (approximately $40.0 million) was paid in July 2014. No further amounts are due under the Norland Acquisition agreement.
The purchase accounting for the Norland Acquisition has been finalized. The excess purchase price over the estimated fair value of net assets acquired has been recorded to goodwill. The goodwill arising from the Norland Acquisition consists largely of the synergies and economies of scale expected from combining the operations acquired from Norland with ours. No goodwill recorded in connection with the Norland Acquisition is deductible for tax purposes.
Unaudited pro forma results, assuming the Norland Acquisition had occurred as of January 1, 2012 for purposes of the 2013 and 2012 pro forma disclosures, are presented below. They include certain adjustments for the years ended December 31, 2013 and 2012, including $38.1 million and $39.9 million, respectively, of increased amortization expense as a result of intangible assets acquired in the Norland Acquisition, $1.1 million and $1.2 million, respectively, of additional interest expense as a result of debt incurred to finance the Norland Acquisition, and the tax impact of the pro forma adjustments. These unaudited pro forma results have been prepared for comparative purposes only and do not purport to be indicative of what operating results would have been had the Norland Acquisition occurred on January 1, 2012 and may not be indicative of future operating results (dollars in thousands, except share data):
During 2014, we completed 11 in-fill acquisitions, including our former affiliate companies in Thailand, Greenville, South Carolina,
Louisville, Kentucky and Oklahoma City and Tulsa, Oklahoma, a commercial real estate service provider in Chicago, a New York-based valuation and advisory business, a technical real estate consulting firm based in Germany, a consulting and advisory firm in the U.S. hotels sector, a shopping center
104
Year Ended December 31, 2013 2012 Revenue $ 7,792,992 $ 7,012,318 Operating income $ 609,933 $ 561,122 Net income attributable to CBRE Group, Inc. $ 310,319 $ 291,742 Basic income per share $ 0.95 $ 0.91 Weighted average shares outstanding for basic income per share 328,110,004 322,315,576 Diluted income per share $ 0.94 $ 0.89 Weighted average shares outstanding for diluted income per share 331,762,854 327,044,145
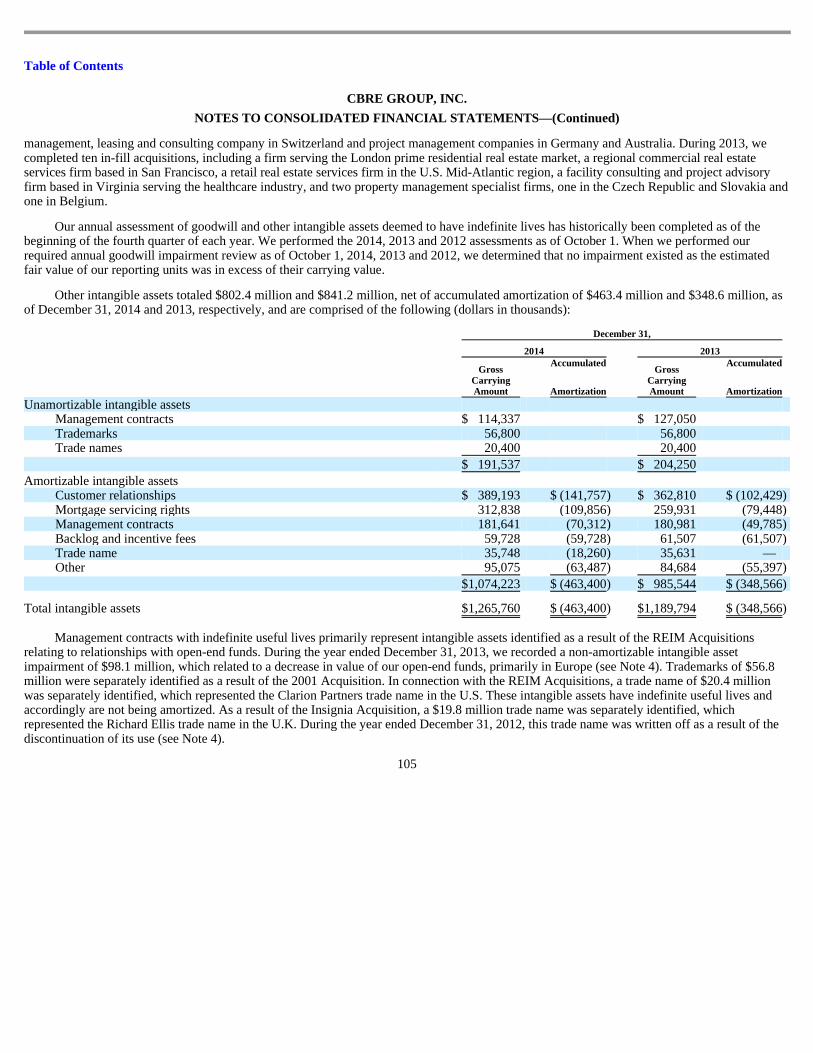
Table of Contents
CBRE GROUP, INC.
NOTES TO CONSOLIDATED FINANCIAL STATEMENTS —(Continued) management, leasing and consulting company in Switzerland and project management companies in Germany and Australia. During 2013, we completed ten in-fill acquisitions, including a firm serving the London prime residential real estate market, a regional commercial real estate services firm based in San Francisco, a retail real estate services firm in the U.S. Mid-Atlantic region, a facility consulting and project advisory firm based in Virginia serving the healthcare industry, and two property management specialist firms, one in the Czech Republic and Slovakia and one in Belgium.
Our annual assessment of goodwill and other intangible assets deemed to have indefinite lives has historically been completed as of the beginning of the fourth quarter of each year. We performed the 2014, 2013 and 2012 assessments as of October 1. When we performed our required annual goodwill impairment review as of October 1, 2014, 2013 and 2012, we determined that no impairment existed as the estimated fair value of our reporting units was in excess of their carrying value.
Other intangible assets totaled $802.4 million and $841.2 million, net of accumulated amortization of $463.4 million and $348.6 million, as of December 31, 2014 and 2013, respectively, and are comprised of the following (dollars in thousands):
Management contracts with indefinite useful lives primarily represent intangible assets identified as a result of the REIM Acquisitions
relating to relationships with open-end funds. During the year ended December 31, 2013, we recorded a non-amortizable intangible asset impairment of $98.1 million, which related to a decrease in value of our open-end funds, primarily in Europe (see Note 4). Trademarks of $56.8 million were separately identified as a result of the 2001 Acquisition. In connection with the REIM Acquisitions, a trade name of $20.4 million was separately identified, which represented the Clarion Partners trade name in the U.S. These intangible assets have indefinite useful lives and accordingly are not being amortized. As a result of the Insignia Acquisition, a $19.8 million trade name was separately identified, which represented the Richard Ellis trade name in the U.K. During the year ended December 31, 2012, this trade name was written off as a result of the discontinuation of its use (see Note 4).
105
December 31,
2014 2013
Gross Carrying Amount
Accumulated
Amortization
Gross Carrying Amount
Accumulated
Amortization
Unamortizable intangible assets Management contracts $ 114,337 $ 127,050 Trademarks 56,800 56,800 Trade names 20,400 20,400
$ 191,537 $ 204,250
Amortizable intangible assets Customer relationships $ 389,193 $ (141,757 ) $ 362,810 $ (102,429 ) Mortgage servicing rights 312,838 (109,856 ) 259,931 (79,448 ) Management contracts 181,641 (70,312 ) 180,981 (49,785 ) Backlog and incentive fees 59,728 (59,728 ) 61,507 (61,507 ) Trade name 35,748 (18,260 ) 35,631 — Other 95,075 (63,487 ) 84,684 (55,397 )
$ 1,074,223 $ (463,400 ) $ 985,544 $ (348,566 )
Total intangible assets $ 1,265,760 $ (463,400 ) $ 1,189,794 $ (348,566 )
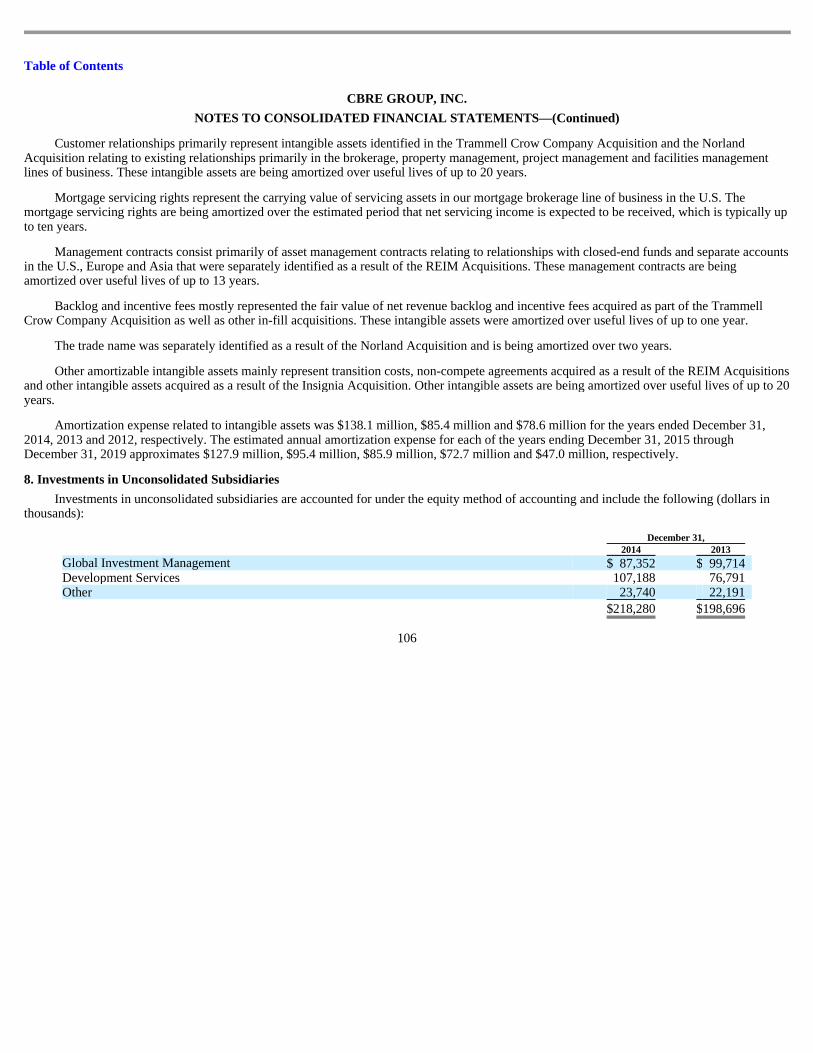
Table of Contents
CBRE GROUP, INC.
NOTES TO CONSOLIDATED FINANCIAL STATEMENTS —(Continued)
Customer relationships primarily represent intangible assets identified in the Trammell Crow Company Acquisition and the Norland Acquisition relating to existing relationships primarily in the brokerage, property management, project management and facilities management lines of business. These intangible assets are being amortized over useful lives of up to 20 years.
Mortgage servicing rights represent the carrying value of servicing assets in our mortgage brokerage line of business in the U.S. The mortgage servicing rights are being amortized over the estimated period that net servicing income is expected to be received, which is typically up to ten years.
Management contracts consist primarily of asset management contracts relating to relationships with closed-end funds and separate accounts in the U.S., Europe and Asia that were separately identified as a result of the REIM Acquisitions. These management contracts are being amortized over useful lives of up to 13 years.
Backlog and incentive fees mostly represented the fair value of net revenue backlog and incentive fees acquired as part of the Trammell Crow Company Acquisition as well as other in-fill acquisitions. These intangible assets were amortized over useful lives of up to one year.
The trade name was separately identified as a result of the Norland Acquisition and is being amortized over two years.
Other amortizable intangible assets mainly represent transition costs, non-compete agreements acquired as a result of the REIM Acquisitions and other intangible assets acquired as a result of the Insignia Acquisition. Other intangible assets are being amortized over useful lives of up to 20 years.
Amortization expense related to intangible assets was $138.1 million, $85.4 million and $78.6 million for the years ended December 31, 2014, 2013 and 2012, respectively. The estimated annual amortization expense for each of the years ending December 31, 2015 through December 31, 2019 approximates $127.9 million, $95.4 million, $85.9 million, $72.7 million and $47.0 million, respectively. 8. Investments in Unconsolidated Subsidiaries
Investments in unconsolidated subsidiaries are accounted for under the equity method of accounting and include the following (dollars in thousands):
106
December 31, 2014 2013 Global Investment Management $ 87,352 $ 99,714 Development Services 107,188 76,791 Other 23,740 22,191
$ 218,280 $ 198,696
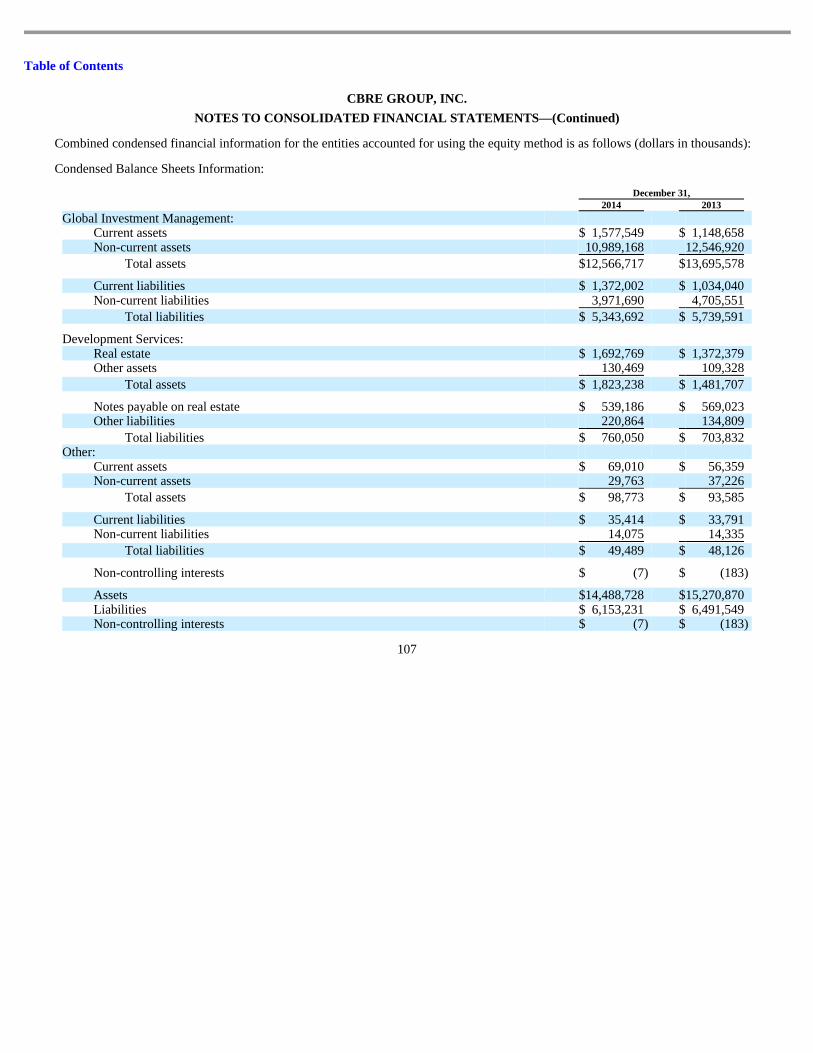
Table of Contents
CBRE GROUP, INC.
NOTES TO CONSOLIDATED FINANCIAL STATEMENTS —(Continued)
Combined condensed financial information for the entities accounted for using the equity method is as follows (dollars in thousands):
Condensed Balance Sheets Information:
107
December 31, 2014 2013 Global Investment Management:
Current assets $ 1,577,549 $ 1,148,658 Non-current assets 10,989,168 12,546,920
Total assets $ 12,566,717 $ 13,695,578
Current liabilities $ 1,372,002 $ 1,034,040 Non-current liabilities 3,971,690 4,705,551
Total liabilities $ 5,343,692 $ 5,739,591
Development Services: Real estate $ 1,692,769 $ 1,372,379 Other assets 130,469 109,328
Total assets $ 1,823,238 $ 1,481,707
Notes payable on real estate $ 539,186 $ 569,023 Other liabilities 220,864 134,809
Total liabilities $ 760,050 $ 703,832 Other:
Current assets $ 69,010 $ 56,359 Non-current assets 29,763 37,226
Total assets $ 98,773 $ 93,585
Current liabilities $ 35,414 $ 33,791 Non-current liabilities 14,075 14,335
Total liabilities $ 49,489 $ 48,126
Non-controlling interests $ (7 ) $ (183 )
Assets $ 14,488,728 $ 15,270,870 Liabilities $ 6,153,231 $ 6,491,549 Non-controlling interests $ (7 ) $ (183 )
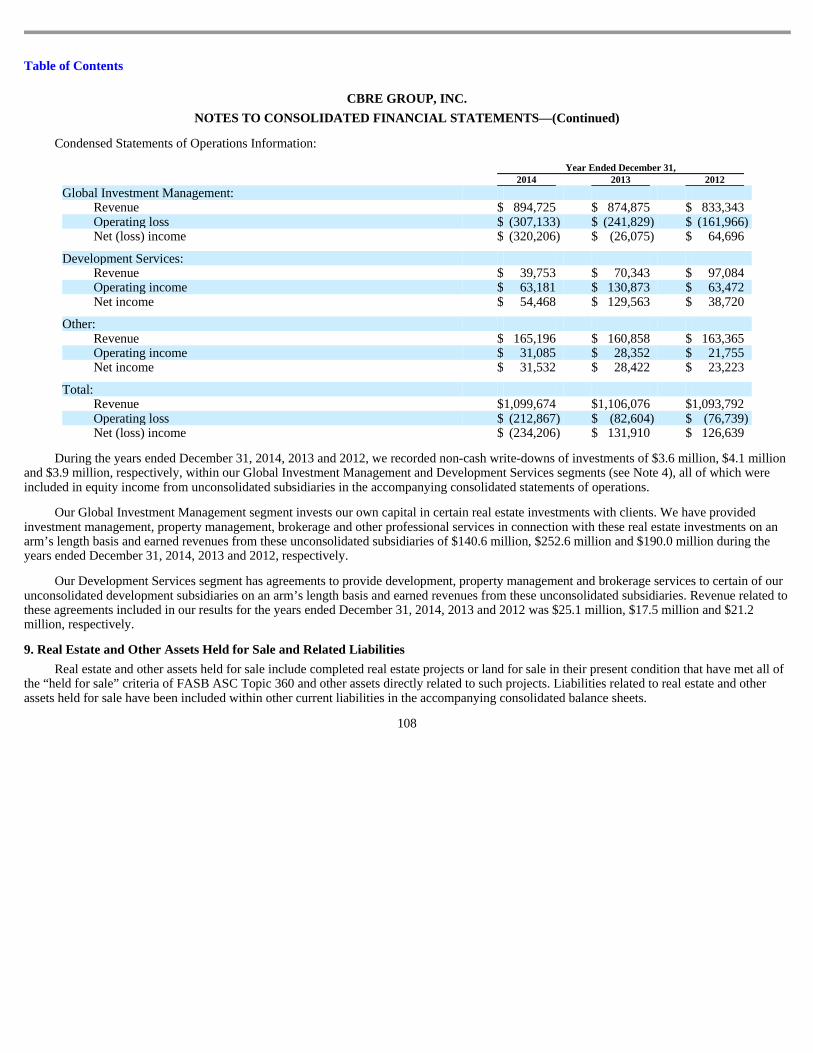
Table of Contents
CBRE GROUP, INC.
NOTES TO CONSOLIDATED FINANCIAL STATEMENTS —(Continued)
Condensed Statements of Operations Information:
During the years ended December 31, 2014, 2013 and 2012, we recorded non-cash write-downs of investments of $3.6 million, $4.1 million
and $3.9 million, respectively, within our Global Investment Management and Development Services segments (see Note 4), all of which were included in equity income from unconsolidated subsidiaries in the accompanying consolidated statements of operations.
Our Global Investment Management segment invests our own capital in certain real estate investments with clients. We have provided investment management, property management, brokerage and other professional services in connection with these real estate investments on an arm’s length basis and earned revenues from these unconsolidated subsidiaries of $140.6 million, $252.6 million and $190.0 million during the years ended December 31, 2014, 2013 and 2012, respectively.
Our Development Services segment has agreements to provide development, property management and brokerage services to certain of our unconsolidated development subsidiaries on an arm’s length basis and earned revenues from these unconsolidated subsidiaries. Revenue related to these agreements included in our results for the years ended December 31, 2014, 2013 and 2012 was $25.1 million, $17.5 million and $21.2 million, respectively. 9. Real Estate and Other Assets Held for Sale and Related Liabilities
Year Ended December 31, 2014 2013 2012 Global Investment Management:
Revenue $ 894,725 $ 874,875 $ 833,343 Operating loss $ (307,133 ) $ (241,829 ) $ (161,966 ) Net (loss) income $ (320,206 ) $ (26,075 ) $ 64,696
Development Services: Revenue $ 39,753 $ 70,343 $ 97,084 Operating income $ 63,181 $ 130,873 $ 63,472 Net income $ 54,468 $ 129,563 $ 38,720
Other: Revenue $ 165,196 $ 160,858 $ 163,365 Operating income $ 31,085 $ 28,352 $ 21,755 Net income $ 31,532 $ 28,422 $ 23,223
Total: Revenue $ 1,099,674 $ 1,106,076 $ 1,093,792 Operating loss $ (212,867 ) $ (82,604 ) $ (76,739 ) Net (loss) income $ (234,206 ) $ 131,910 $ 126,639
Real estate and other assets held for sale include completed real estate projects or land for sale in their present condition that have met all of the “held for sale” criteria of FASB ASC Topic 360 and other assets directly related to such projects. Liabilities related to real estate and other assets held for sale have been included within other current liabilities in the accompanying consolidated balance sheets.
108
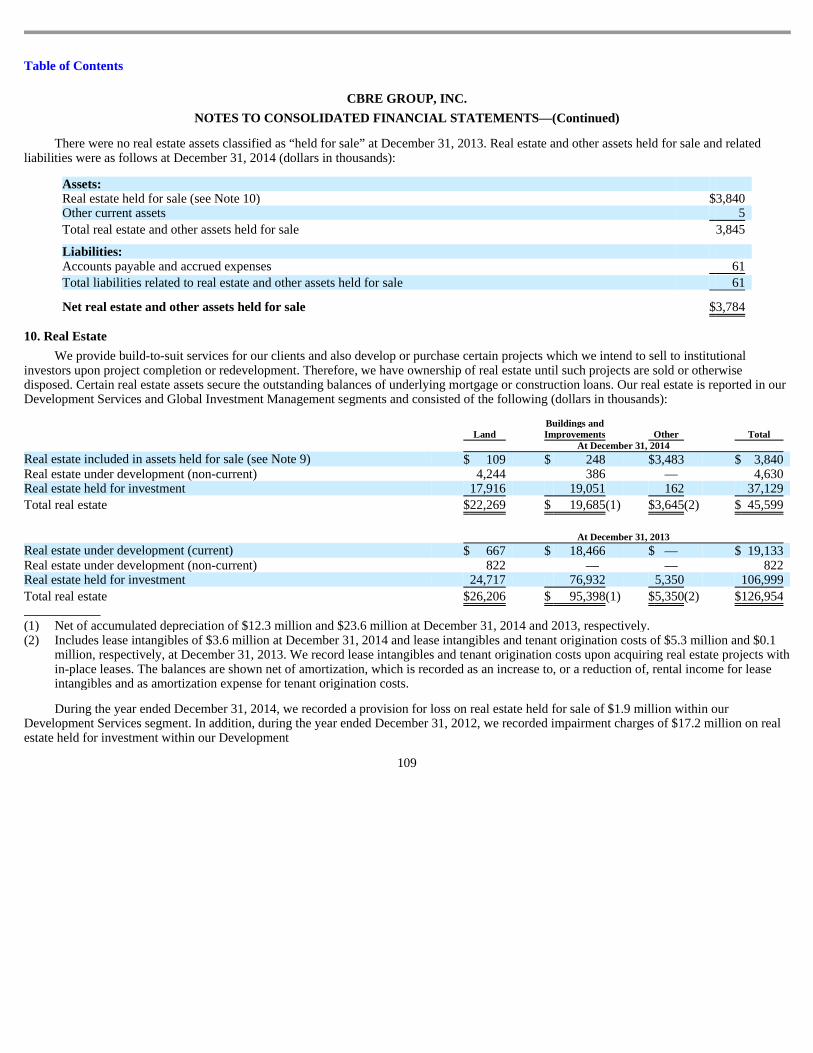
Table of Contents
CBRE GROUP, INC.
NOTES TO CONSOLIDATED FINANCIAL STATEMENTS —(Continued)
There were no real estate assets classified as “held for sale” at December 31, 2013. Real estate and other assets held for sale and related liabilities were as follows at December 31, 2014 (dollars in thousands):
10. Real Estate
Assets: Real estate held for sale (see Note 10) $ 3,840 Other current assets 5
Total real estate and other assets held for sale 3,845
Liabilities: Accounts payable and accrued expenses 61
Total liabilities related to real estate and other assets held for sale 61
Net real estate and other assets held for sale $ 3,784
We provide build-to-suit services for our clients and also develop or purchase certain projects which we intend to sell to institutional investors upon project completion or redevelopment. Therefore, we have ownership of real estate until such projects are sold or otherwise disposed. Certain real estate assets secure the outstanding balances of underlying mortgage or construction loans. Our real estate is reported in our Development Services and Global Investment Management segments and consisted of the following (dollars in thousands):
During the year ended December 31, 2014, we recorded a provision for loss on real estate held for sale of $1.9 million within our
Development Services segment. In addition, during the year ended December 31, 2012, we recorded impairment charges of $17.2 million on real estate held for investment within our Development
109
Land Buildings and Improvements Other Total
At December 31, 2014 Real estate included in assets held for sale (see Note 9) $ 109 $ 248 $ 3,483 $ 3,840 Real estate under development (non-current) 4,244 386 — 4,630 Real estate held for investment 17,916 19,051 162 37,129
Total real estate $ 22,269 $ 19,685 (1) $ 3,645 (2) $ 45,599
At December 31, 2013 Real estate under development (current) $ 667 $ 18,466 $ — $ 19,133 Real estate under development (non-current) 822 — — 822 Real estate held for investment 24,717 76,932 5,350 106,999
Total real estate $ 26,206 $ 95,398 (1) $ 5,350 (2) $ 126,954
(1) Net of accumulated depreciation of $12.3 million and $23.6 million at December 31, 2014 and 2013, respectively. (2) Includes lease intangibles of $3.6 million at December 31, 2014 and lease intangibles and tenant origination costs of $5.3 million and $0.1
million, respectively, at December 31, 2013. We record lease intangibles and tenant origination costs upon acquiring real estate projects with in-place leases. The balances are shown net of amortization, which is recorded as an increase to, or a reduction of, rental income for lease intangibles and as amortization expense for tenant origination costs.
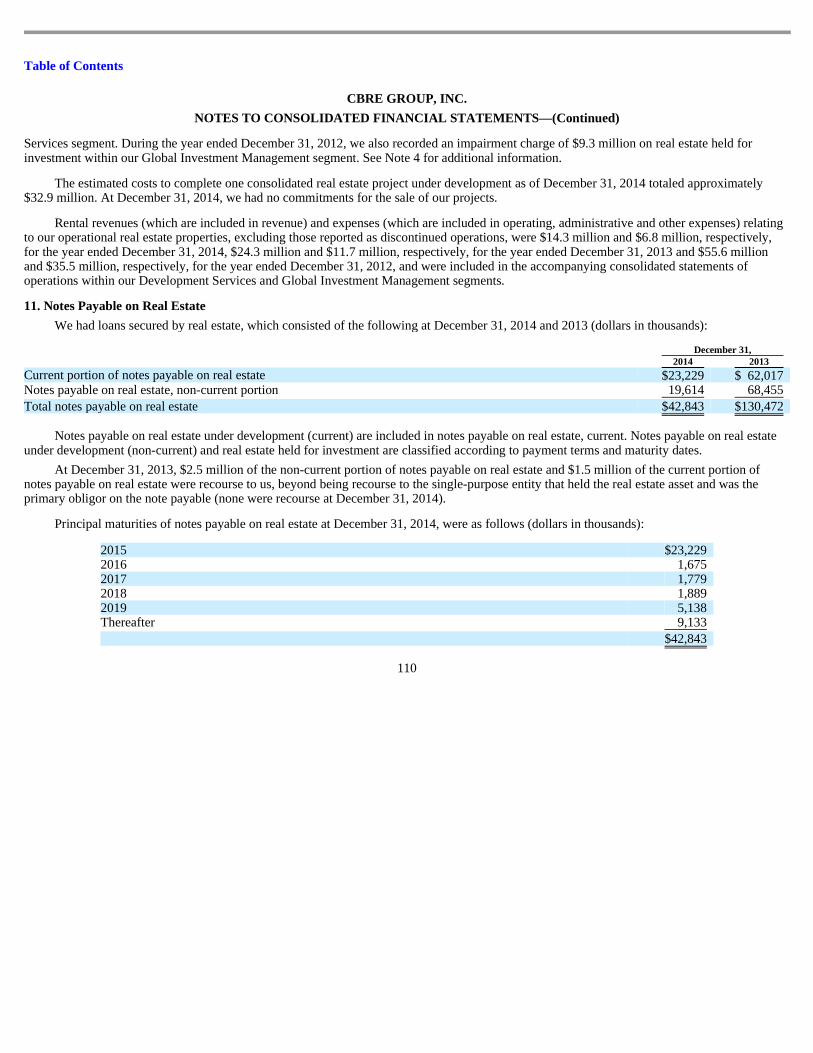
Table of Contents
CBRE GROUP, INC.
NOTES TO CONSOLIDATED FINANCIAL STATEMENTS —(Continued) Services segment. During the year ended December 31, 2012, we also recorded an impairment charge of $9.3 million on real estate held for investment within our Global Investment Management segment. See Note 4 for additional information.
The estimated costs to complete one consolidated real estate project under development as of December 31, 2014 totaled approximately $32.9 million. At December 31, 2014, we had no commitments for the sale of our projects.
Rental revenues (which are included in revenue) and expenses (which are included in operating, administrative and other expenses) relating to our operational real estate properties, excluding those reported as discontinued operations, were $14.3 million and $6.8 million, respectively, for the year ended December 31, 2014, $24.3 million and $11.7 million, respectively, for the year ended December 31, 2013 and $55.6 million and $35.5 million, respectively, for the year ended December 31, 2012, and were included in the accompanying consolidated statements of operations within our Development Services and Global Investment Management segments. 11. Notes Payable on Real Estate
We had loans secured by real estate, which consisted of the following at December 31, 2014 and 2013 (dollars in thousands):
Notes payable on real estate under development (current) are included in notes payable on real estate, current. Notes payable on real estate
under development (non-current) and real estate held for investment are classified according to payment terms and maturity dates.
December 31, 2014 2013
Current portion of notes payable on real estate $ 23,229 $ 62,017 Notes payable on real estate, non-current portion 19,614 68,455
Total notes payable on real estate $ 42,843 $ 130,472
At December 31, 2013, $2.5 million of the non-current portion of notes payable on real estate and $1.5 million of the current portion of notes payable on real estate were recourse to us, beyond being recourse to the single-purpose entity that held the real estate asset and was the primary obligor on the note payable (none were recourse at December 31, 2014).
Principal maturities of notes payable on real estate at December 31, 2014, were as follows (dollars in thousands):
110
2015 $ 23,229 2016 1,675 2017 1,779 2018 1,889 2019 5,138 Thereafter 9,133
$ 42,843
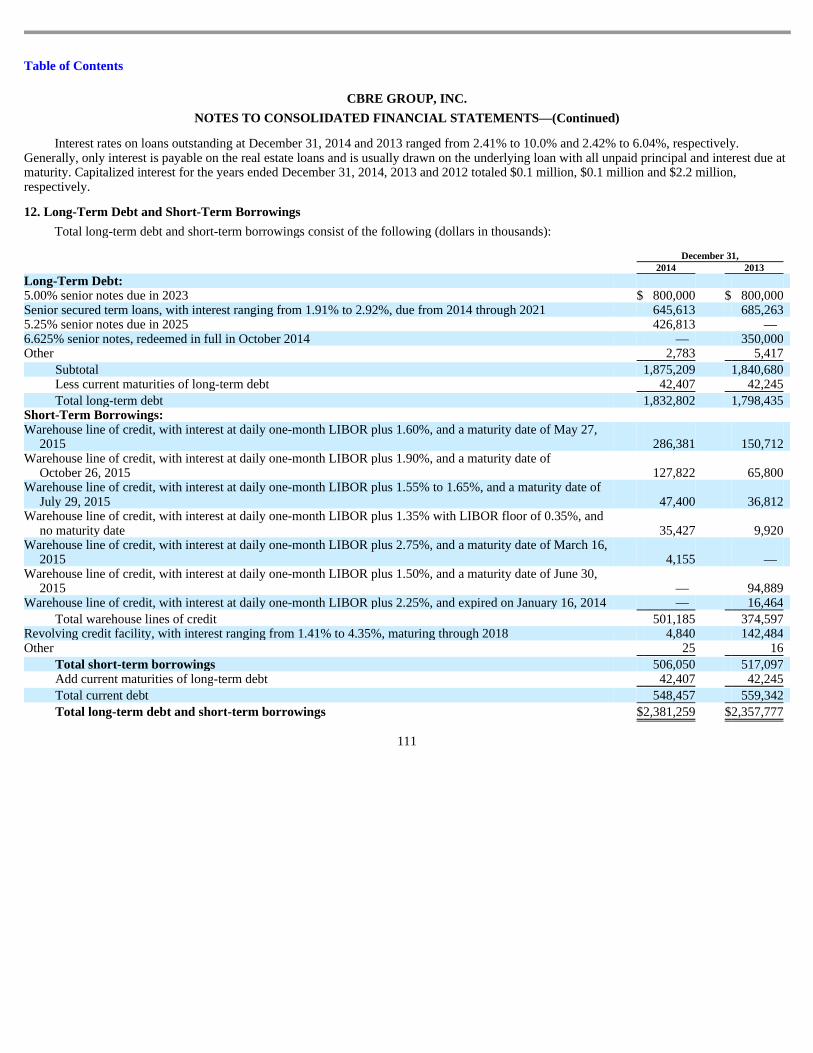
Table of Contents
CBRE GROUP, INC.
NOTES TO CONSOLIDATED FINANCIAL STATEMENTS —(Continued)
Interest rates on loans outstanding at December 31, 2014 and 2013 ranged from 2.41% to 10.0% and 2.42% to 6.04%, respectively. Generally, only interest is payable on the real estate loans and is usually drawn on the underlying loan with all unpaid principal and interest due at maturity. Capitalized interest for the years ended December 31, 2014, 2013 and 2012 totaled $0.1 million, $0.1 million and $2.2 million, respectively. 12. Long-Term Debt and Short-Term Borrowings
Total long-term debt and short-term borrowings consist of the following (dollars in thousands):
111
December 31, 2014 2013 Long-Term Debt: 5.00% senior notes due in 2023 $ 800,000 $ 800,000 Senior secured term loans, with interest ranging from 1.91% to 2.92%, due from 2014 through 2021 645,613 685,263 5.25% senior notes due in 2025 426,813 — 6.625% senior notes, redeemed in full in October 2014 — 350,000 Other 2,783 5,417
Subtotal 1,875,209 1,840,680 Less current maturities of long-term debt 42,407 42,245
Total long-term debt 1,832,802 1,798,435 Short-Term Borrowings: Warehouse line of credit, with interest at daily one-month LIBOR plus 1.60%, and a maturity date of May 27,
2015 286,381 150,712 Warehouse line of credit, with interest at daily one-month LIBOR plus 1.90%, and a maturity date of
October 26, 2015 127,822 65,800 Warehouse line of credit, with interest at daily one-month LIBOR plus 1.55% to 1.65%, and a maturity date of
July 29, 2015 47,400 36,812 Warehouse line of credit, with interest at daily one-month LIBOR plus 1.35% with LIBOR floor of 0.35%, and
no maturity date 35,427 9,920 Warehouse line of credit, with interest at daily one-month LIBOR plus 2.75%, and a maturity date of March 16,
2015 4,155 — Warehouse line of credit, with interest at daily one-month LIBOR plus 1.50%, and a maturity date of June 30,
2015 — 94,889 Warehouse line of credit, with interest at daily one-month LIBOR plus 2.25%, and expired on January 16, 2014 — 16,464
Total warehouse lines of credit 501,185 374,597 Revolving credit facility, with interest ranging from 1.41% to 4.35%, maturing through 2018 4,840 142,484 Other 25 16
Total short-term borrowings 506,050 517,097 Add current maturities of long-term debt 42,407 42,245
Total current debt 548,457 559,342
Total long-term debt and short-term borrowings $ 2,381,259 $ 2,357,777
Table of Contents
CBRE GROUP, INC.
NOTES TO CONSOLIDATED FINANCIAL STATEMENTS —(Continued)
Future annual aggregate maturities of total consolidated debt at December 31, 2014 are as follows (dollars in thousands): 2015—$548,457; 2016—$67,801; 2017—$255,275; 2018—$80,275; 2019—$2,150 and $1,427,301 thereafter.
Since 2001, we have maintained credit facilities to fund strategic acquisitions and to provide for our working capital needs. On March 28, 2013, we entered into a credit agreement (the 2013 Credit Agreement) with a syndicate of banks led by Credit Suisse Group AG (CS), as administrative and collateral agent, to completely refinance a previous credit agreement. During the year ended December 31, 2013, we completed a series of financing transactions, which included the repayment of $1.6 billion of our senior secured term loans under the previous credit agreement.
On January 9, 2015, we entered into an amended and restated credit agreement with a syndicate of banks jointly led by Merrill Lynch, Pierce, Fenner & Smith Incorporated, J.P Morgan Securities LLC and CS (see Note 23). As of December 31, 2014, our 2013 Credit Agreement provided for the following: (1) a $1.2 billion revolving credit facility, which included revolving credit loans, letters of credit and a swingline loan facility and would have matured on March 28, 2018; (2) a $500.0 million tranche A term loan facility (of which $300.0 million was on an optional delayed-draw basis for up to 120 days from March 28, 2013, which we drew down in June 2013 to partially fund the redemption of our 11.625% senior subordinated notes), which required quarterly principal payments that began on June 30, 2013 and would have continued through maturity on March 28, 2018; and (3) a $215.0 million tranche B term loan facility, which required quarterly principal payments that began on June 30, 2013 and would have continued through December 31, 2020, with the balance payable at maturity on March 28, 2021.
The revolving credit facility under the 2013 Credit Agreement allowed for borrowings outside of the U.S., with a $10.0 million sub-facility available to one of our Canadian subsidiaries, a $35.0 million sub-facility available to one of our Australian subsidiaries and one of our New Zealand subsidiaries and a $150.0 million sub-facility available to one of our U.K. subsidiaries. Additionally, outstanding borrowings under these sub-facilities could have been up to 5.0% higher as allowed under the currency fluctuation provision in the 2013 Credit Agreement. Borrowings under the revolving credit facility bore interest at varying rates, based at our option, on either the applicable fixed rate plus 1.15% to 2.25% or the daily rate plus 0.125% to 1.25% as determined by reference to our ratio of total debt less available cash to EBITDA (as defined in the 2013 Credit Agreement). As of December 31, 2014 and 2013, we had $4.8 million and $142.5 million, respectively, of revolving credit facility principal outstanding with related weighted average interest rates of 1.4% and 2.2%, respectively, which were included in short-term borrowings in the accompanying consolidated balance sheets. As of December 31, 2014, letters of credit totaling $7.4 million were outstanding under the revolving credit facility. These letters of credit, which reduced the amount we could borrow under the revolving credit facility, were primarily issued in the normal course of business as well as in connection with certain insurance programs.
Borrowings under the term loan facilities as of December 31, 2014 bore interest, based at our option, on the following: for the tranche A term loan facility, on either the applicable fixed rate plus 1.50% to 2.75% or the daily rate plus 0.50% to 1.75%, as determined by reference to our ratio of total debt less available cash to EBITDA (as defined in the 2013 Credit Agreement) and for the tranche B term loan facility, on either the applicable fixed rate plus 2.75% or the daily rate plus 1.75%. As of December 31, 2014, we had $645.6 million of term loan facilities principal outstanding (including $434.4 million of tranche A term loan facility and $211.2 million of tranche B term loan facility), which were included in the accompanying consolidated balance sheets. As of December 31, 2013, we had $685.3 million of term loan facilities principal outstanding (including $471.9 million of tranche A term loan facility and $213.4 million of tranche B term loan facility), which were also included in the accompanying consolidated balance sheets.
112
Table of Contents
CBRE GROUP, INC.
NOTES TO CONSOLIDATED FINANCIAL STATEMENTS —(Continued)
The 2013 Credit Agreement was jointly and severally guaranteed by us and substantially all of our material domestic subsidiaries. Borrowings under our 2013 Credit Agreement were secured by a pledge of substantially all of the capital stock of our U.S. subsidiaries and 65.0% of the capital stock of certain non-U.S. subsidiaries, in each case, held by CBRE and the U.S. guarantor subsidiaries. Also, the 2013 Credit Agreement required us to pay a fee based on the total amount of the unused revolving credit facility commitment.
On September 26, 2014, CBRE issued $300.0 million in aggregate principal amount of 5.25% senior notes due March 15, 2025. On December 12, 2014, CBRE issued an additional $125.0 million in aggregate principal amount of 5.25% senior notes due March 15, 2025 at a price equal to 101.5% of their face value, plus interest deemed to have accrued from September 26, 2014. The 5.25% senior notes are unsecured obligations of CBRE, senior to all of its current and future subordinated indebtedness, but effectively subordinated to all of its current and future secured indebtedness. The 5.25% senior notes are jointly and severally guaranteed on a senior basis by us and each domestic subsidiary of CBRE that guaranteed our 2013 Credit Agreement. Interest accrues at a rate of 5.25% per year and is payable semi-annually in arrears on March 15 and September 15, beginning on March 15, 2015. The 5.25% senior notes are redeemable at our option, in whole or in part, prior to December 15, 2024 at a redemption price equal to the greater of (1) 100% of the principal amount of the 5.25% senior notes to be redeemed and (2) the sum of the present values of the remaining scheduled payments of principal and interest thereon to December 15, 2024 (not including any portions of payments of interest accrued as of the date of redemption) discounted to the date of redemption on a semi-annual basis at the Adjusted Treasury Rate (as defined in the indentures governing these notes). In addition, at any time on or after December 15, 2024, the 5.25% senior notes may be redeemed by us, in whole or in part, at a redemption price equal to 100.0% of the principal amount, plus accrued and unpaid interest, if any, to (but excluding) the date of redemption. If a change of control triggering event (as defined in the indenture governing these notes) occurs, we are obligated to make an offer to purchase the then outstanding 5.25% senior notes at a redemption price of 101.0% of the principal amount, plus accrued and unpaid interest, if any, to the date of purchase. The amount of the 5.25% senior notes included in the accompanying consolidated balance sheets was $426.8 million at December 31, 2014.
On March 14, 2013, CBRE issued $800.0 million in aggregate principal amount of 5.00% senior notes due March 15, 2023. The 5.00% senior notes are unsecured obligations of CBRE, senior to all of its current and future subordinated indebtedness, but effectively subordinated to all of its current and future secured indebtedness. The 5.00% senior notes are jointly and severally guaranteed on a senior basis by us and each domestic subsidiary of CBRE that guaranteed our 2013 Credit Agreement. Interest accrues at a rate of 5.00% per year and is payable semi-annually in arrears on March 15 and September 15, beginning on September 15, 2013. The 5.00% senior notes are redeemable at our option, in whole or in part, on or after March 15, 2018 at a redemption price of 102.5% of the principal amount on that date and at declining prices thereafter. At any time prior to March 15, 2016, we may redeem up to 35.0% of the original principal amount of the 5.00% senior notes using the net cash proceeds from certain public offerings. In addition, at any time prior to March 15, 2018, the 5.00% senior notes may be redeemed by us, in whole or in part, at a redemption price equal to 100.0% of the principal amount, plus accrued and unpaid interest, if any, to the date of redemption, and an applicable premium (as defined in the indenture governing these notes), which is based on the excess of the present value of the March 15, 2018 redemption price plus all remaining interest payments through March 15, 2018, over the principal amount of the 5.00% senior notes on such redemption date. If a change of control triggering event (as defined in the indenture governing these notes) occurs, we are obligated to make an offer to purchase the then outstanding 5.00% senior notes at a redemption price of 101.0% of the principal amount, plus accrued and unpaid interest, if any. The amount of the 5.00% senior notes included in the accompanying consolidated balance sheets was $800.0 million at both December 31, 2014 and 2013.
113
Table of Contents
CBRE GROUP, INC.
NOTES TO CONSOLIDATED FINANCIAL STATEMENTS —(Continued)
On October 8, 2010, CBRE issued $350.0 million in aggregate principal amount of 6.625% senior notes due October 15, 2020. The 6.625% senior notes were unsecured obligations of CBRE, senior to all of its current and future subordinated indebtedness, but effectively subordinated to all of its current and future secured indebtedness. The 6.625% senior notes were jointly and severally guaranteed on a senior basis by us and each domestic subsidiary of CBRE that guaranteed our 2013 Credit Agreement. Interest accrued at a rate of 6.625% per year and was payable semi-annually in arrears on April 15 and October 15, having commenced on April 15, 2011. The 6.625% senior notes were redeemable at our option, in whole or in part, on or after October 15, 2014 at a redemption price of 104.969% of the principal amount on that date and at declining prices thereafter. In addition, at any time prior to October 15, 2014, the 6.625% senior notes were redeemable by us, in whole or in part, at a redemption price equal to 100% of the principal amount, plus accrued and unpaid interest and an applicable premium (as defined in the indenture governing these notes), which was based on the greater of 1.00% of the principal amount of the 6.625% senior notes and the excess of the present value of the October 15, 2014 redemption price plus all remaining interest payments through October 15, 2014, over the principal amount of the 6.625% senior notes on such redemption date. On September 26, 2014, we gave the 30-day notice required under the indenture of our intent to call all of the 6.625% senior notes. We redeemed these notes in full on October 27, 2014 in accordance with the provisions of the notes and associated indenture. In connection with this early redemption, we incurred charges of $23.1 million, including a premium of $17.4 million and the write-off of $5.7 million of unamortized deferred financing costs. The amount of the 6.625% senior notes included in the accompanying consolidated balance sheets was $350.0 million at December 31, 2013.
Our 2013 Credit Agreement contained, and the indentures governing our 5.00% senior notes and 5.25% senior notes contain, numerous restrictive covenants that, among other things, limit our ability to incur additional indebtedness, pay dividends or make distributions to stockholders, repurchase capital stock or debt, make investments, sell assets or subsidiary stock, create or permit liens on assets, engage in transactions with affiliates, enter into sale/leaseback transactions, issue subsidiary equity and enter into consolidations or mergers. As of December 31, 2014, our 2013 Credit Agreement also required us to maintain a minimum coverage ratio of EBITDA (as defined in the 2013 Credit Agreement) to total interest expense of 2.00x and a maximum leverage ratio of total debt less available cash to EBITDA (as defined in the 2013 Credit Agreement) of 4.25x as of the end of each fiscal quarter. Our coverage ratio of EBITDA to total interest expense was 12.34x for the year ended December 31, 2014 and our leverage ratio of total debt less available cash to EBITDA was 1.02x as of December 31, 2014.
On June 18, 2009, CBRE issued $450.0 million in aggregate principal amount of 11.625% senior subordinated notes due June 15, 2017 for approximately $435.9 million, net of discount. The 11.625% senior subordinated notes were unsecured senior subordinated obligations of CBRE and were jointly and severally guaranteed on a senior subordinated basis by us and our domestic subsidiaries that guaranteed our 2013 Credit Agreement. Interest accrued at a rate of 11.625% per year and was payable semi-annually in arrears on June 15 and December 15. As permitted by the indenture governing these notes, on June 15, 2013, we redeemed all of the 11.625% senior subordinated notes. In connection with this early redemption, we paid a premium of $26.2 million and wrote off $16.1 million of unamortized deferred financing costs and unamortized discount.
We had short-term borrowings of $506.1 million and $517.1 million as of December 31, 2014 and 2013, respectively, with related weighted average interest rates of 1.8% and 1.9%, respectively, which are included in the accompanying consolidated balance sheets.
On March 2, 2007, we entered into a $50.0 million credit note with Wells Fargo Bank for the purpose of purchasing eligible investments, which include cash equivalents, agency securities, A1/P1 commercial paper and eligible money market funds. The proceeds of this note are not made generally available to us, but instead are deposited in an investment account maintained by Wells Fargo Bank and used and applied solely to purchase
114

Table of Contents
CBRE GROUP, INC.
NOTES TO CONSOLIDATED FINANCIAL STATEMENTS —(Continued) eligible investment securities. This agreement has been amended several times and as of December 31, 2014 provides for a $5.0 million revolving credit note, bears interest at 0.25% and has a maturity date of May 31, 2015. As of December 31, 2014 and 2013, there were no amounts outstanding under this note.
On March 4, 2008, we entered into a $35.0 million credit and security agreement with Bank of America (BofA) for the purpose of purchasing eligible financial instruments, which include A1/P1 commercial paper, U.S. Treasury securities, Government Sponsored Enterprise, or GSE, discount notes (as defined in the credit and security agreement) and money market funds. The proceeds of this loan are not made generally available to us, but instead are deposited in an investment account maintained by BofA and used and applied solely to purchase eligible financial instruments. This agreement has been amended several times and as of December 31, 2014 provides for a $5.0 million credit line, bears interest at 1% and has a maturity date of April 30, 2015. As of December 31, 2014 and 2013, there were no amounts outstanding under this agreement.
On August 19, 2008, we entered into a $15.0 million uncommitted facility with First Tennessee Bank for the purpose of purchasing investments, which included cash equivalents, agency securities, A1/P1 commercial paper and eligible money market funds. The proceeds of this facility were not made generally available to us, but instead were held in a collateral account maintained by First Tennessee Bank. This agreement provided for a $4.0 million credit line, bore interest at 0.25% and expired on August 31, 2014. As of both December 31, 2014 and 2013, there were no amounts outstanding under this agreement.
Our wholly-owned subsidiary, CBRE Capital Markets, has the following warehouse lines of credit: credit agreements with JP Morgan Chase Bank, N.A. (JP Morgan), BofA, TD Bank, N.A. (TD Bank), and Capital One, N.A. (Capital One), for the purpose of funding mortgage loans that will be resold, and a funding arrangement with Fannie Mae for the purpose of selling a percentage of certain closed multifamily loans.
On November 15, 2005, CBRE Capital Markets entered into a secured credit agreement with JP Morgan to establish a warehouse line of credit. This agreement has been amended several times and as of December 31, 2014 provides for a $275.0 million line of credit and bears interest at the daily one-month LIBOR plus 1.90%. A portion of the line of credit totaling $100.0 million matured on January 15, 2015. The remainder, or $175.0 million, has a maturity date of October 26, 2015.
On April 16, 2008, CBRE Capital Markets entered into a secured credit agreement with BofA to establish a warehouse line of credit. This agreement has been amended several times and as of December 31, 2014, provides for a $400.0 million line of credit and bears interest at the daily one-month LIBOR plus 1.60%. A portion of the line of credit totaling $200.0 million matures on March 23, 2015. The remainder, or $200.0 million, has a maturity date of May 27, 2015.
In August 2009, CBRE Capital Markets entered into a funding arrangement with Fannie Mae under its Multifamily As Soon As Pooled Plus Agreement and its Multifamily As Soon As Pooled Sale Agreement (ASAP) Program. Under the ASAP Program, CBRE Capital Markets may elect, on a transaction by transaction basis, to sell a percentage of certain closed multifamily loans to Fannie Mae on an expedited basis. After all contingencies are satisfied, the ASAP Program requires that CBRE Capital Markets repurchase the interest in the multifamily loan previously sold to Fannie Mae followed by either a full delivery back to Fannie Mae via whole loan execution or a securitization into a mortgage backed security. Under this agreement, the maximum outstanding balance under the ASAP Program cannot exceed $200.0 million and, between the sale date to Fannie Mae and the repurchase date by CBRE Capital Markets, the outstanding balance bears interest and is payable to Fannie Mae at the daily one-month LIBOR plus 1.35% with a LIBOR floor of 0.35%. This arrangement remains in place but is cancelable at any time by Fannie Mae with notice.
115
Table of Contents
CBRE GROUP, INC.
NOTES TO CONSOLIDATED FINANCIAL STATEMENTS —(Continued)
On December 21, 2010, CBRE Capital Markets entered into a secured credit agreement with TD Bank to establish a warehouse line of credit. The secured revolving line of credit has been amended several times and as of December 31, 2014 provides for a $300.0 million line of credit, bears interest at the daily one-month LIBOR plus 1.50% and has a maturity date of June 30, 2015.
On July 30, 2012, CBRE Capital Markets entered into a secured credit agreement with Capital One to establish a warehouse line of credit. As of December 31, 2014, this agreement provides for a $200.0 million senior secured revolving line of credit, bears interest at the daily one-month LIBOR plus 1.55% and has a maturity date of July 29, 2015.
On September 21, 2012, CBRE Capital Markets entered into a repurchase facility with JP Morgan for additional warehouse capacity pursuant to a Master Repurchase Agreement. This agreement provided for a $200.0 million warehouse facility, bore interest at the daily one-month LIBOR plus 2.25% and expired on January 16, 2014.
On March 17, 2014, CBRE Capital Markets’ wholly-owned subsidiary, CBRE Business Lending, Inc., entered into a secured credit agreement with JP Morgan to establish a line of credit. As of December 31, 2014, this agreement provides for a $25.0 million secured revolving line of credit, bears interest at daily one-month LIBOR plus 2.75% and has a maturity date of March 16, 2015.
During the year ended December 31, 2014, we had a maximum of $1.1 billion of warehouse lines of credit principal outstanding. As of December 31, 2014 and 2013, we had $501.2 million and $374.6 million, respectively, of warehouse lines of credit principal outstanding, which were included in short-term borrowings in the accompanying consolidated balance sheets. Non-cash activity totaling $126.6 million increased the warehouse lines of credit, $651.8 million decreased the warehouse lines of credit and $313.0 million increased the warehouse lines of credit during the years ended December 31, 2014, 2013 and 2012, respectively. Additionally, we had $506.3 million and $381.5 million of mortgage loans held for sale (warehouse receivables), which substantially represented mortgage loans funded through the lines of credit that, while committed to be purchased, had not yet been purchased as of December 31, 2014 and 2013, respectively, and which were also included in the accompanying consolidated balance sheets. Non-cash activity totaling $128.7 million increased the warehouse receivables, $646.7 million decreased the warehouse receivables and $313.0 million increased the warehouse receivables during the years ended December 31, 2014, 2013 and 2012, respectively.
A significant number of our subsidiaries in Europe have had a Euro cash pool loan since 2001, which is used to fund their short-term liquidity needs. The Euro cash pool loan is an overdraft line for our European operations issued by HSBC Bank. The Euro cash pool loan has no stated maturity date and bears interest at varying rates based on LIBOR or EDF plus 2.0%. As of December 31, 2014 and 2013, there were no amounts outstanding under this facility. 13. Commitments and Contingencies
We are a party to a number of pending or threatened lawsuits arising out of, or incident to, our ordinary course of business. Our management believes that any losses in excess of the amounts accrued arising from such lawsuits are unlikely to be significant, but that litigation is inherently uncertain and there is the potential for a material adverse effect on our financial statements if one or more matters are resolved in a particular period in an amount materially in excess of that anticipated by management.
116
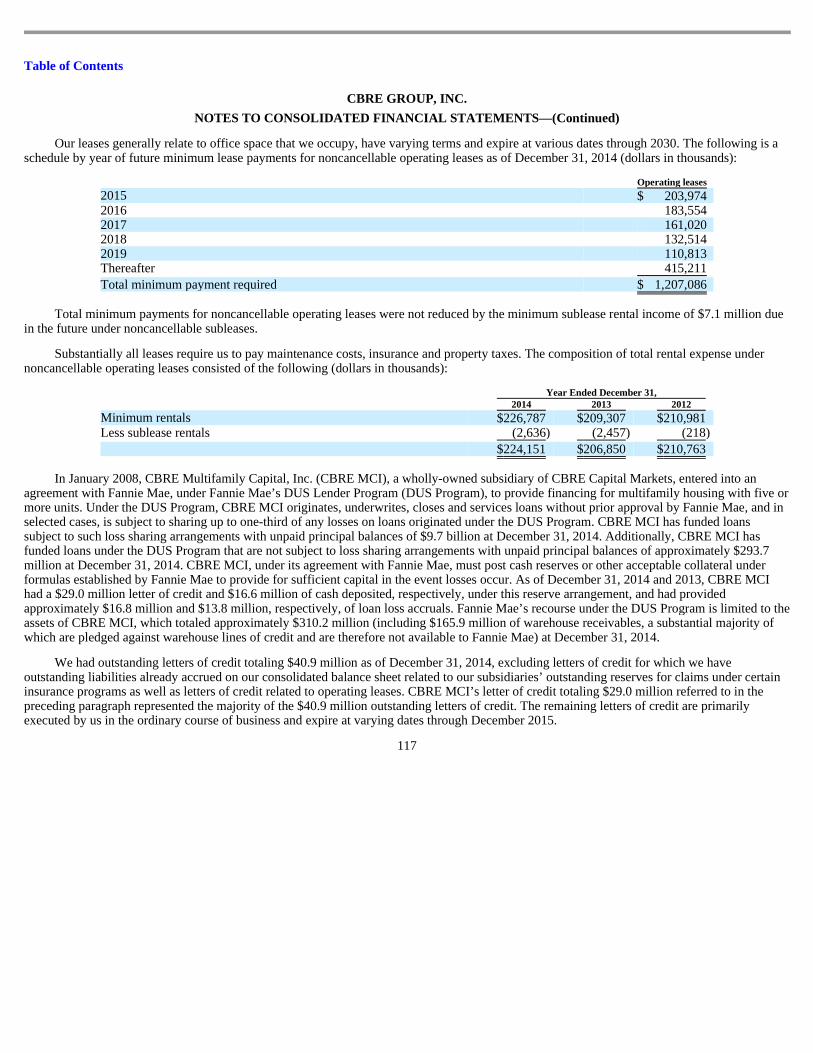
Table of Contents
CBRE GROUP, INC.
NOTES TO CONSOLIDATED FINANCIAL STATEMENTS —(Continued)
Our leases generally relate to office space that we occupy, have varying terms and expire at various dates through 2030. The following is a schedule by year of future minimum lease payments for noncancellable operating leases as of December 31, 2014 (dollars in thousands):
Total minimum payments for noncancellable operating leases were not reduced by the minimum sublease rental income of $7.1 million due
in the future under noncancellable subleases.
Substantially all leases require us to pay maintenance costs, insurance and property taxes. The composition of total rental expense under noncancellable operating leases consisted of the following (dollars in thousands):
In January 2008, CBRE Multifamily Capital, Inc. (CBRE MCI), a wholly-owned subsidiary of CBRE Capital Markets, entered into an
agreement with Fannie Mae, under Fannie Mae’s DUS Lender Program (DUS Program), to provide financing for multifamily housing with five or more units. Under the DUS Program, CBRE MCI originates, underwrites, closes and services loans without prior approval by Fannie Mae, and in selected cases, is subject to sharing up to one-third of any losses on loans originated under the DUS Program. CBRE MCI has funded loans subject to such loss sharing arrangements with unpaid principal balances of $9.7 billion at December 31, 2014. Additionally, CBRE MCI has funded loans under the DUS Program that are not subject to loss sharing arrangements with unpaid principal balances of approximately $293.7 million at December 31, 2014. CBRE MCI, under its agreement with Fannie Mae, must post cash reserves or other acceptable collateral under formulas established by Fannie Mae to provide for sufficient capital in the event losses occur. As of December 31, 2014 and 2013, CBRE MCI had a $29.0 million letter of credit and $16.6 million of cash deposited, respectively, under this reserve arrangement, and had provided approximately $16.8 million and $13.8 million, respectively, of loan loss accruals. Fannie Mae’s recourse under the DUS Program is limited to the assets of CBRE MCI, which totaled approximately $310.2 million (including $165.9 million of warehouse receivables, a substantial majority of which are pledged against warehouse lines of credit and are therefore not available to Fannie Mae) at December 31, 2014.
We had outstanding letters of credit totaling $40.9 million as of December 31, 2014, excluding letters of credit for which we have outstanding liabilities already accrued on our consolidated balance sheet related to our subsidiaries’ outstanding reserves for claims under certain insurance programs as well as letters of credit related to operating leases. CBRE MCI’s letter of credit totaling $29.0 million referred to in the preceding paragraph represented the majority of the $40.9 million outstanding letters of credit. The remaining letters of credit are primarily executed by us in the ordinary course of business and expire at varying dates through December 2015.
117
Operating leases 2015 $ 203,974 2016 183,554 2017 161,020 2018 132,514 2019 110,813 Thereafter 415,211
Total minimum payment required $ 1,207,086
Year Ended December 31, 2014 2013 2012 Minimum rentals $ 226,787 $ 209,307 $ 210,981 Less sublease rentals (2,636 ) (2,457 ) (218 )
$ 224,151 $ 206,850 $ 210,763
Table of Contents
CBRE GROUP, INC.
NOTES TO CONSOLIDATED FINANCIAL STATEMENTS —(Continued)
We had guarantees totaling $13.8 million as of December 31, 2014, excluding guarantees related to pension liabilities, consolidated indebtedness and other obligations for which we have outstanding liabilities already accrued on our consolidated balance sheet, and operating leases. The $13.8 million mainly represents guarantees of obligations of unconsolidated subsidiaries, which expire at varying dates through December 2018, as well as various guarantees of management contracts in our operations overseas, which expire at the end of each of the respective agreements.
In addition, as of December 31, 2014, we had numerous completion and budget guarantees relating to development projects. These guarantees are made by us in the ordinary course of our Development Services business. Each of these guarantees requires us to complete construction of the relevant project within a specified timeframe and/or within a specified budget, with us potentially being liable for costs to complete in excess of such timeframe or budget. However, we generally have “guaranteed maximum price” contracts with reputable general contractors with respect to projects for which we provide these guarantees. These contracts are intended to pass the risk to such contractors. While there can be no assurance, we do not expect to incur any material losses under these guarantees.
An important part of the strategy for our Global Investment Management business involves investing our capital in certain real estate investments with our clients. These co-investments typically range from 2.0% to 5.0% of the equity in a particular fund. As of December 31, 2014, we had aggregate commitments of $19.0 million to fund future co-investments.
Additionally, an important part of our Development Services business strategy is to invest in unconsolidated real estate subsidiaries as a principal (in most cases co-investing with our clients). As of December 31, 2014, we had committed to fund $25.5 million of additional capital to these unconsolidated subsidiaries. 14. Employee Benefit Plans
Stock Incentive Plans
Second Amended and Restated 2004 Stock Incentive Plan. Our 2004 stock incentive plan was adopted by our board of directors and approved by our stockholders on April 21, 2004, and was amended several times subsequently, including an amendment and restatement on June 2, 2008 and an amendment on December 3, 2008. However, our 2004 stock incentive plan was terminated in May 2012 in connection with the adoption of our 2012 equity incentive plan, which is described below. At termination, all unissued shares from the 2004 stock incentive plan were allocated to the 2012 equity incentive plan for potential future issuance. The 2004 stock incentive plan authorized the grant of stock-based awards to our employees, directors or independent contractors. A total of 20,785,218 shares of our Class A common stock initially were reserved for issuance under the 2004 stock incentive plan, which increased by 10,000,000 shares to a total of 30,785,218 shares in connection with the June 2, 2008 amendment and restatement. For awards granted prior to June 2, 2008 under this plan, this share reserve was reduced by one share upon grant of an option or stock appreciation right, and was reduced by 2.25 shares upon issuance of stock pursuant to other stock-based awards. For awards granted on or after June 2, 2008 under this plan, this share reserve was reduced by one share upon grant of all awards. In addition, full value awards, i.e., awards other than stock options and stock appreciation rights, were limited to no more than 75% of the total share reserve. No person was eligible to be granted awards in the aggregate covering more than 2,000,000 shares during any fiscal year. The number of shares issued or reserved pursuant to the 2004 stock incentive plan, or pursuant to outstanding awards, was subject to adjustment on account of mergers, consolidations, reorganizations, stock splits, stock dividends and other dilutive changes in our common stock. In addition, our board of directors could adjust outstanding awards to preserve the awards’ benefits or potential benefits. Since our 2004 stock incentive plan has been terminated, no new awards may be granted under it. However, as of December 31, 2014, outstanding stock options granted under the 2004 stock incentive plan to acquire 678,338 shares of our Class A common stock remain
118
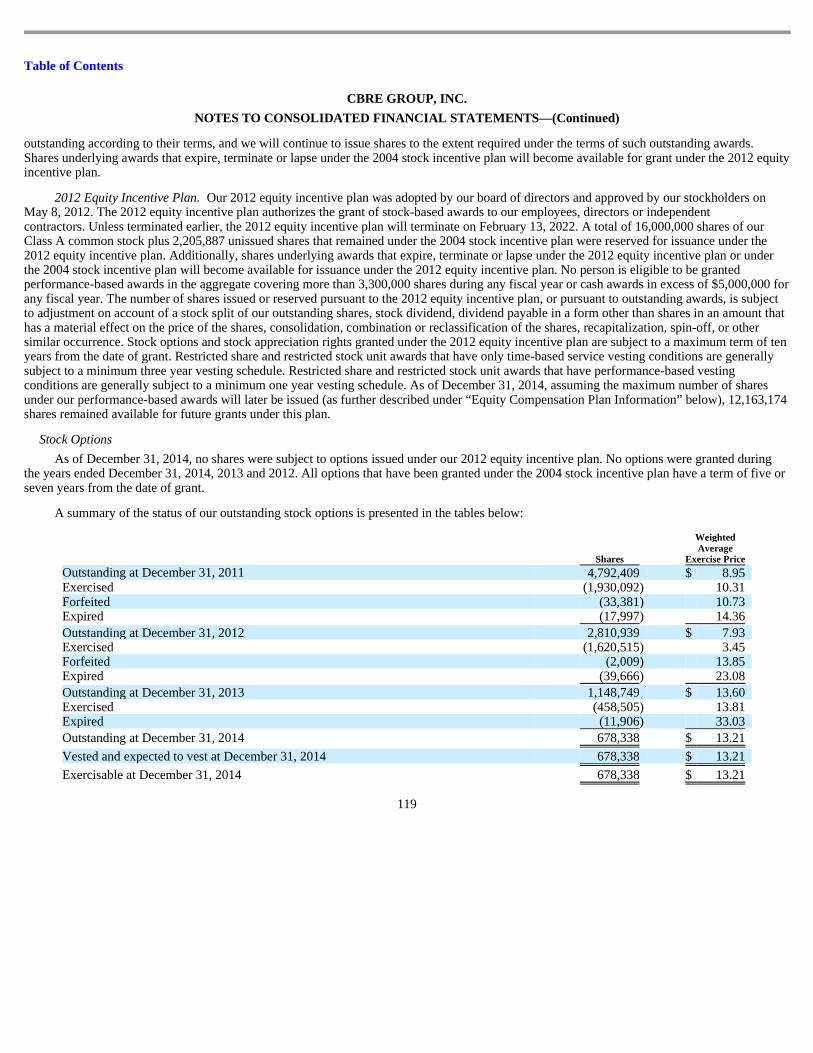
Table of Contents
CBRE GROUP, INC.
NOTES TO CONSOLIDATED FINANCIAL STATEMENTS —(Continued) outstanding according to their terms, and we will continue to issue shares to the extent required under the terms of such outstanding awards. Shares underlying awards that expire, terminate or lapse under the 2004 stock incentive plan will become available for grant under the 2012 equity incentive plan.
2012 Equity Incentive Plan. Our 2012 equity incentive plan was adopted by our board of directors and approved by our stockholders on May 8, 2012. The 2012 equity incentive plan authorizes the grant of stock-based awards to our employees, directors or independent contractors. Unless terminated earlier, the 2012 equity incentive plan will terminate on February 13, 2022. A total of 16,000,000 shares of our Class A common stock plus 2,205,887 unissued shares that remained under the 2004 stock incentive plan were reserved for issuance under the 2012 equity incentive plan. Additionally, shares underlying awards that expire, terminate or lapse under the 2012 equity incentive plan or under the 2004 stock incentive plan will become available for issuance under the 2012 equity incentive plan. No person is eligible to be granted performance-based awards in the aggregate covering more than 3,300,000 shares during any fiscal year or cash awards in excess of $5,000,000 for any fiscal year. The number of shares issued or reserved pursuant to the 2012 equity incentive plan, or pursuant to outstanding awards, is subject to adjustment on account of a stock split of our outstanding shares, stock dividend, dividend payable in a form other than shares in an amount that has a material effect on the price of the shares, consolidation, combination or reclassification of the shares, recapitalization, spin-off, or other similar occurrence. Stock options and stock appreciation rights granted under the 2012 equity incentive plan are subject to a maximum term of ten years from the date of grant. Restricted share and restricted stock unit awards that have only time-based service vesting conditions are generally subject to a minimum three year vesting schedule. Restricted share and restricted stock unit awards that have performance-based vesting conditions are generally subject to a minimum one year vesting schedule. As of December 31, 2014, assuming the maximum number of shares under our performance-based awards will later be issued (as further described under “Equity Compensation Plan Information” below), 12,163,174 shares remained available for future grants under this plan.
Stock Options
As of December 31, 2014, no shares were subject to options issued under our 2012 equity incentive plan. No options were granted during the years ended December 31, 2014, 2013 and 2012. All options that have been granted under the 2004 stock incentive plan have a term of five or seven years from the date of grant.
A summary of the status of our outstanding stock options is presented in the tables below:
119
Shares
Weighted Average
Exercise Price Outstanding at December 31, 2011 4,792,409 $ 8.95 Exercised (1,930,092 ) 10.31 Forfeited (33,381 ) 10.73 Expired (17,997 ) 14.36
Outstanding at December 31, 2012 2,810,939 $ 7.93 Exercised (1,620,515 ) 3.45 Forfeited (2,009 ) 13.85 Expired (39,666 ) 23.08
Outstanding at December 31, 2013 1,148,749 $ 13.60 Exercised (458,505 ) 13.81 Expired (11,906 ) 33.03
Outstanding at December 31, 2014 678,338 $ 13.21
Vested and expected to vest at December 31, 2014 678,338 $ 13.21
Exercisable at December 31, 2014 678,338 $ 13.21
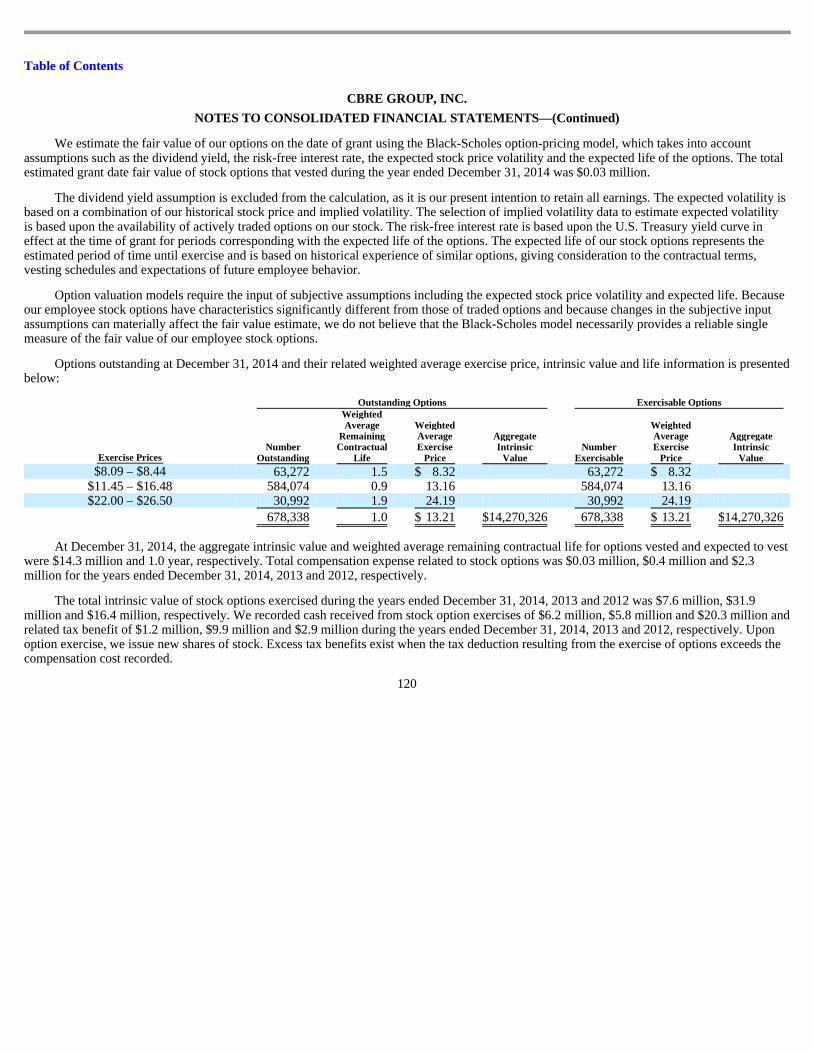
Table of Contents
CBRE GROUP, INC.
NOTES TO CONSOLIDATED FINANCIAL STATEMENTS —(Continued)
We estimate the fair value of our options on the date of grant using the Black-Scholes option-pricing model, which takes into account assumptions such as the dividend yield, the risk-free interest rate, the expected stock price volatility and the expected life of the options. The total estimated grant date fair value of stock options that vested during the year ended December 31, 2014 was $0.03 million.
The dividend yield assumption is excluded from the calculation, as it is our present intention to retain all earnings. The expected volatility is based on a combination of our historical stock price and implied volatility. The selection of implied volatility data to estimate expected volatility is based upon the availability of actively traded options on our stock. The risk-free interest rate is based upon the U.S. Treasury yield curve in effect at the time of grant for periods corresponding with the expected life of the options. The expected life of our stock options represents the estimated period of time until exercise and is based on historical experience of similar options, giving consideration to the contractual terms, vesting schedules and expectations of future employee behavior.
Option valuation models require the input of subjective assumptions including the expected stock price volatility and expected life. Because our employee stock options have characteristics significantly different from those of traded options and because changes in the subjective input assumptions can materially affect the fair value estimate, we do not believe that the Black-Scholes model necessarily provides a reliable single measure of the fair value of our employee stock options.
Options outstanding at December 31, 2014 and their related weighted average exercise price, intrinsic value and life information is presented below:
At December 31, 2014, the aggregate intrinsic value and weighted average remaining contractual life for options vested and expected to vest
were $14.3 million and 1.0 year, respectively. Total compensation expense related to stock options was $0.03 million, $0.4 million and $2.3 million for the years ended December 31, 2014, 2013 and 2012, respectively.
The total intrinsic value of stock options exercised during the years ended December 31, 2014, 2013 and 2012 was $7.6 million, $31.9 million and $16.4 million, respectively. We recorded cash received from stock option exercises of $6.2 million, $5.8 million and $20.3 million and related tax benefit of $1.2 million, $9.9 million and $2.9 million during the years ended December 31, 2014, 2013 and 2012, respectively. Upon option exercise, we issue new shares of stock. Excess tax benefits exist when the tax deduction resulting from the exercise of options exceeds the compensation cost recorded.
120
Outstanding Options Exercisable Options
Exercise Prices Number
Outstanding
Weighted Average
Remaining Contractual
Life
Weighted Average Exercise
Price
Aggregate Intrinsic
Value Number
Exercisable
Weighted Average Exercise
Price
Aggregate Intrinsic
Value $8.09 – $8.44 63,272 1.5 $ 8.32 63,272 $ 8.32
$11.45 – $16.48 584,074 0.9 13.16 584,074 13.16 $22.00 – $26.50 30,992 1.9 24.19 30,992 24.19
678,338 1.0 $ 13.21 $ 14,270,326 678,338 $ 13.21 $ 14,270,326
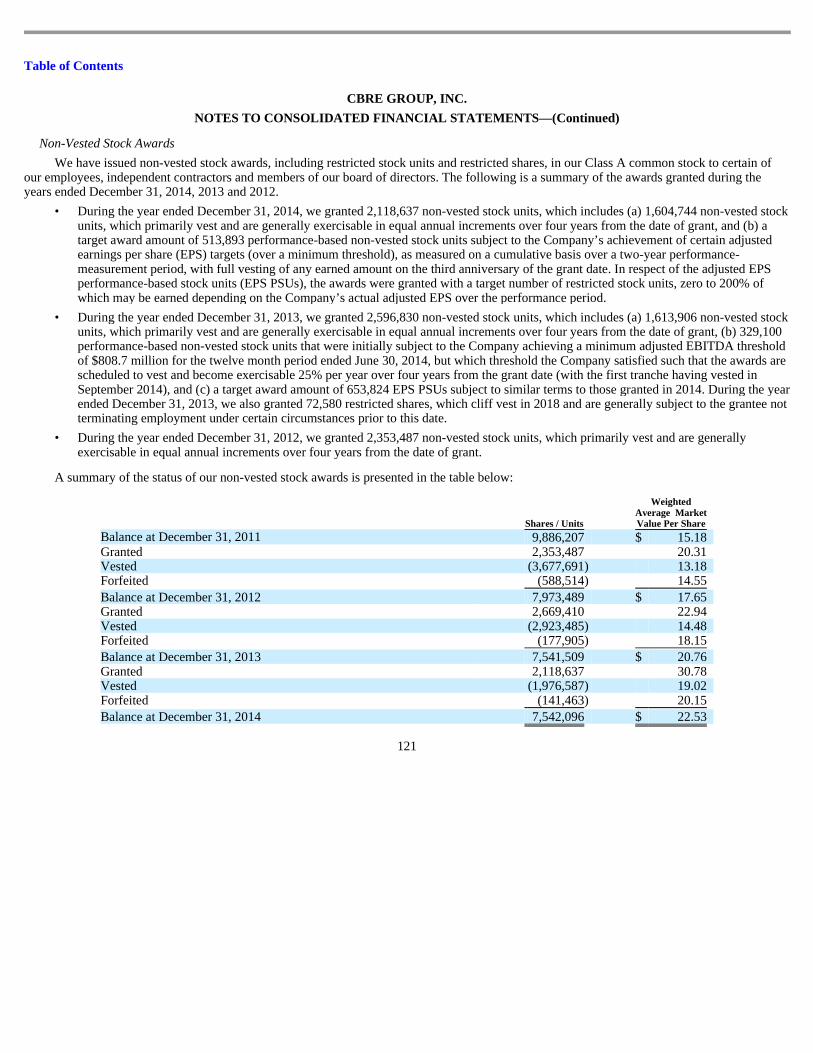
Table of Contents
CBRE GROUP, INC.
NOTES TO CONSOLIDATED FINANCIAL STATEMENTS —(Continued)
Non-Vested Stock Awards
We have issued non-vested stock awards, including restricted stock units and restricted shares, in our Class A common stock to certain of our employees, independent contractors and members of our board of directors. The following is a summary of the awards granted during the years ended December 31, 2014, 2013 and 2012.
• During the year ended December 31, 2014, we granted 2,118,637 non-vested stock units, which includes (a) 1,604,744 non-vested stock units, which primarily vest and are generally exercisable in equal annual increments over four years from the date of grant, and (b) a target award amount of 513,893 performance-based non-vested stock units subject to the Company’s achievement of certain adjusted earnings per share (EPS) targets (over a minimum threshold), as measured on a cumulative basis over a two-year performance-measurement period, with full vesting of any earned amount on the third anniversary of the grant date. In respect of the adjusted EPS performance-based stock units (EPS PSUs), the awards were granted with a target number of restricted stock units, zero to 200% of which may be earned depending on the Company’s actual adjusted EPS over the performance period.
• During the year ended December 31, 2013, we granted 2,596,830 non-vested stock units, which includes (a) 1,613,906 non-vested stock units, which primarily vest and are generally exercisable in equal annual increments over four years from the date of grant, (b) 329,100 performance-based non-vested stock units that were initially subject to the Company achieving a minimum adjusted EBITDA threshold of $808.7 million for the twelve month period ended June 30, 2014, but which threshold the Company satisfied such that the awards are scheduled to vest and become exercisable 25% per year over four years from the grant date (with the first tranche having vested in September 2014), and (c) a target award amount of 653,824 EPS PSUs subject to similar terms to those granted in 2014. During the year ended December 31, 2013, we also granted 72,580 restricted shares, which cliff vest in 2018 and are generally subject to the grantee not terminating employment under certain circumstances prior to this date.
A summary of the status of our non-vested stock awards is presented in the table below:
121
• During the year ended December 31, 2012, we granted 2,353,487 non-vested stock units, which primarily vest and are generally
exercisable in equal annual increments over four years from the date of grant.
Shares / Units
Weighted Average Market Value Per Share
Balance at December 31, 2011 9,886,207 $ 15.18 Granted 2,353,487 20.31 Vested (3,677,691 ) 13.18 Forfeited (588,514 ) 14.55
Balance at December 31, 2012 7,973,489 $ 17.65 Granted 2,669,410 22.94 Vested (2,923,485 ) 14.48 Forfeited (177,905 ) 18.15
Balance at December 31, 2013 7,541,509 $ 20.76 Granted 2,118,637 30.78 Vested (1,976,587 ) 19.02 Forfeited (141,463 ) 20.15
Balance at December 31, 2014 7,542,096 $ 22.53

Table of Contents
CBRE GROUP, INC.
NOTES TO CONSOLIDATED FINANCIAL STATEMENTS —(Continued)
Total compensation expense related to non-vested stock awards was $59.7 million, $48.0 million and $49.4 million for the years ended December 31, 2014, 2013 and 2012, respectively. At December 31, 2014, total unrecognized estimated compensation cost related to non-vested stock awards was approximately $114.5 million, which is expected to be recognized over a weighted average period of approximately 1.9 years.
Bonuses. We have bonus programs covering select employees, including senior management. Awards are based on the position and performance of the employee and the achievement of pre-established financial, operating and strategic objectives. The amounts charged to expense for bonuses were $206.3 million, $148.7 million and $134.5 million for the years ended December 31, 2014, 2013 and 2012, respectively.
401(k) Plan. Our CBRE 401(k) Plan (401(k) Plan) is a defined contribution savings plan that allows participant deferrals under Section 401(k) of the Internal Revenue Code. Most of our non-union U.S. employees, other than qualified real estate agents having the status of independent contractors under section 3508 of the Internal Revenue Code, are eligible to participate in the plan. The 401(k) Plan provides for participant contributions as well as a Company match. A participant is allowed to contribute to the 401(k) Plan from 1% to 75% of his or her compensation, subject to limits imposed by applicable law. Effective January 1, 2007, all participants hired post January 1, 2007 vest in company match contributions 20% per year for each plan year they work 1,000 hours. All participants hired before January 1, 2007 are immediately vested in company match contributions. For 2014, we contributed a 50% match on the first 4% of annual compensation (up to $150,000 of compensation) deferred by each participant. For 2013 and 2012, we contributed a 50% match on the first 3% of annual compensation (up to $150,000 of compensation) deferred by each participant. In connection with the 401(k) Plan, we charged to expense $21.3 million, $15.5 million and $12.9 million for the years ended December 31, 2014, 2013 and 2012, respectively.
Participants are entitled to invest up to 25% of their 401(k) account balance in shares of our common stock. As of December 31, 2014, approximately 1.3 million shares of our common stock were held as investments by participants in our 401(k) Plan.
Pension Plans. We have two contributory defined benefit pension plans in the U.K. The London-based firm of Hillier Parker May & Rowden, which we acquired in 1998, had a contributory defined benefit pension plan. A subsidiary of Insignia, which we acquired in connection with the Insignia Acquisition in 2003, also had a contributory defined benefit pension plan in the U.K. Our subsidiaries based in the U.K. maintain the plans to provide retirement benefits to existing and former employees participating in these plans. With respect to these plans, our historical policy has been to contribute annually an amount to fund pension cost as actuarially determined and as required by applicable laws and regulations. Effective July 1, 2007, we reached agreements with the active members of these plans to freeze future pension plan benefits. In return, the active members became eligible to enroll in a defined contribution plan.
122
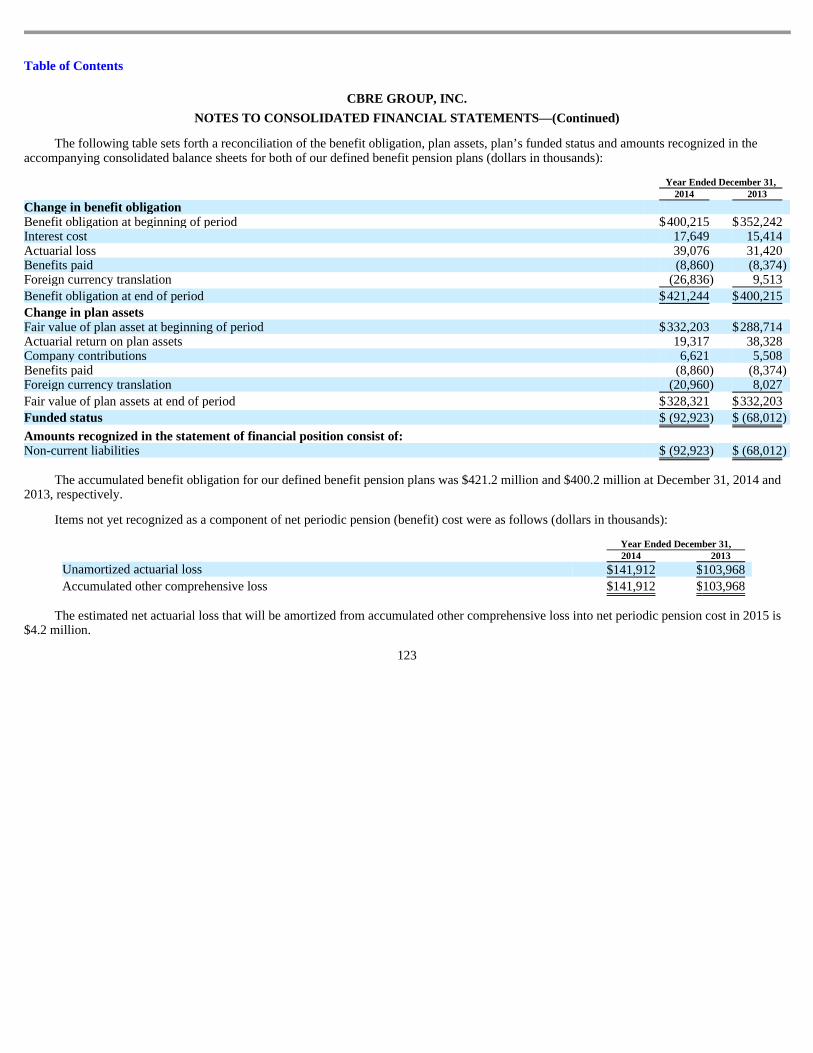
Table of Contents
CBRE GROUP, INC.
NOTES TO CONSOLIDATED FINANCIAL STATEMENTS —(Continued)
The following table sets forth a reconciliation of the benefit obligation, plan assets, plan’s funded status and amounts recognized in the accompanying consolidated balance sheets for both of our defined benefit pension plans (dollars in thousands):
The accumulated benefit obligation for our defined benefit pension plans was $421.2 million and $400.2 million at December 31, 2014 and
2013, respectively.
Items not yet recognized as a component of net periodic pension (benefit) cost were as follows (dollars in thousands):
The estimated net actuarial loss that will be amortized from accumulated other comprehensive loss into net periodic pension cost in 2015 is
$4.2 million.
123
Year Ended December 31, 2014 2013 Change in benefit obligation Benefit obligation at beginning of period $ 400,215 $ 352,242 Interest cost 17,649 15,414 Actuarial loss 39,076 31,420 Benefits paid (8,860 ) (8,374 ) Foreign currency translation (26,836 ) 9,513
Benefit obligation at end of period $ 421,244 $ 400,215
Change in plan assets
Fair value of plan asset at beginning of period $ 332,203 $ 288,714 Actuarial return on plan assets 19,317 38,328 Company contributions 6,621 5,508 Benefits paid (8,860 ) (8,374 ) Foreign currency translation (20,960 ) 8,027
Fair value of plan assets at end of period $ 328,321 $ 332,203
Funded status $ (92,923 ) $ (68,012 )
Amounts recognized in the statement of financial position consist of: Non-current liabilities $ (92,923 ) $ (68,012 )
Year Ended December 31, 2014 2013
Unamortized actuarial loss $ 141,912 $ 103,968
Accumulated other comprehensive loss $ 141,912 $ 103,968
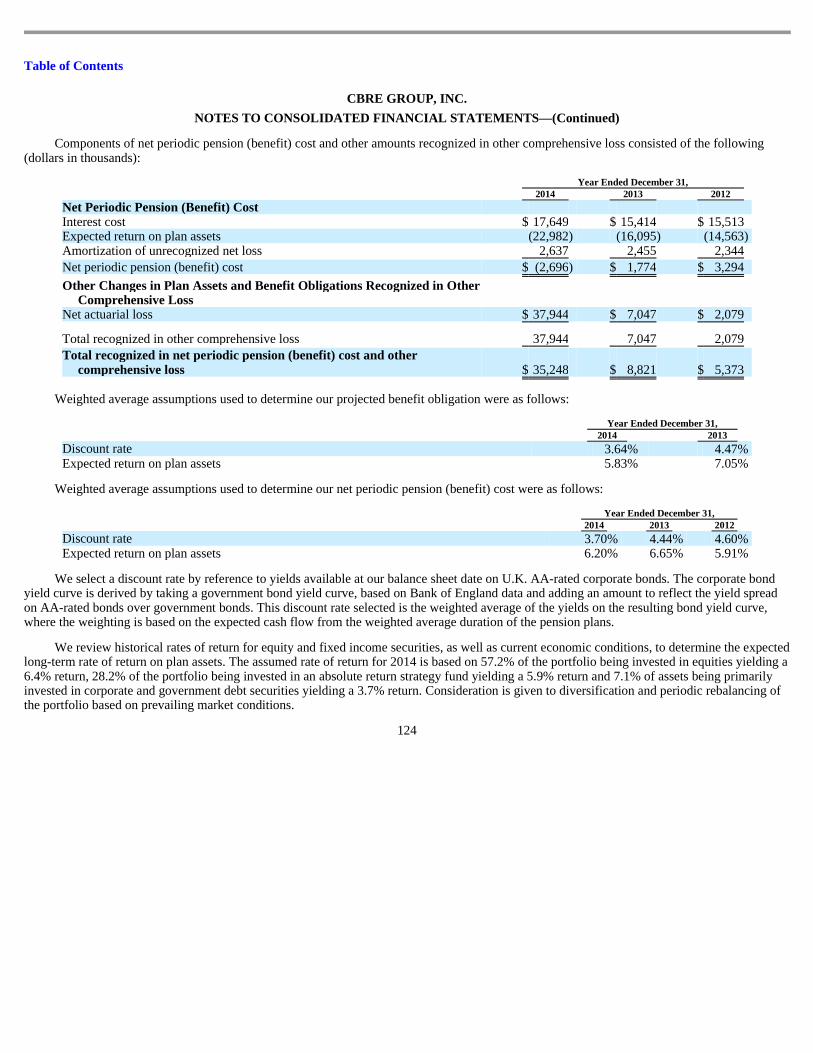
Table of Contents
CBRE GROUP, INC.
NOTES TO CONSOLIDATED FINANCIAL STATEMENTS —(Continued)
Components of net periodic pension (benefit) cost and other amounts recognized in other comprehensive loss consisted of the following (dollars in thousands):
Weighted average assumptions used to determine our projected benefit obligation were as follows:
Weighted average assumptions used to determine our net periodic pension (benefit) cost were as follows:
We select a discount rate by reference to yields available at our balance sheet date on U.K. AA-rated corporate bonds. The corporate bond
yield curve is derived by taking a government bond yield curve, based on Bank of England data and adding an amount to reflect the yield spread on AA-rated bonds over government bonds. This discount rate selected is the weighted average of the yields on the resulting bond yield curve, where the weighting is based on the expected cash flow from the weighted average duration of the pension plans.
We review historical rates of return for equity and fixed income securities, as well as current economic conditions, to determine the expected long-term rate of return on plan assets. The assumed rate of return for 2014 is based on 57.2% of the portfolio being invested in equities yielding a 6.4% return, 28.2% of the portfolio being invested in an absolute return strategy fund yielding a 5.9% return and 7.1% of assets being primarily invested in corporate and government debt securities yielding a 3.7% return. Consideration is given to diversification and periodic rebalancing of the portfolio based on prevailing market conditions.
124
Year Ended December 31, 2014 2013 2012 Net Periodic Pension (Benefit) Cost Interest cost $ 17,649 $ 15,414 $ 15,513 Expected return on plan assets (22,982 ) (16,095 ) (14,563 ) Amortization of unrecognized net loss 2,637 2,455 2,344
Net periodic pension (benefit) cost $ (2,696 ) $ 1,774 $ 3,294
Other Changes in Plan Assets and Benefit Obligations Recognized in Other Comprehensive Loss
Net actuarial loss $ 37,944 $ 7,047 $ 2,079
Total recognized in other comprehensive loss 37,944 7,047 2,079
Total recognized in net periodic pension (benefit) cost and other comprehensive loss $ 35,248 $ 8,821 $ 5,373
Year Ended December 31, 2014 2013 Discount rate 3.64 % 4.47 % Expected return on plan assets 5.83 % 7.05 %
Year Ended December 31, 2014 2013 2012 Discount rate 3.70 % 4.44 % 4.60 % Expected return on plan assets 6.20 % 6.65 % 5.91 %
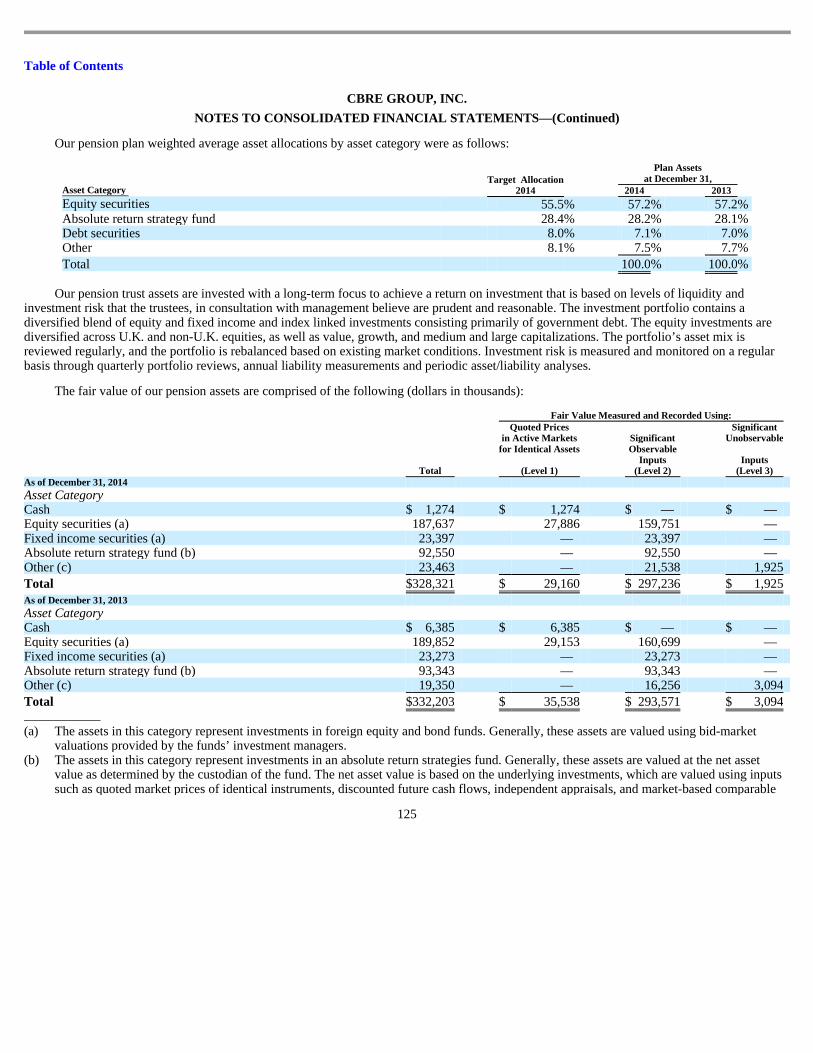
Table of Contents
CBRE GROUP, INC.
NOTES TO CONSOLIDATED FINANCIAL STATEMENTS —(Continued)
Our pension plan weighted average asset allocations by asset category were as follows:
Our pension trust assets are invested with a long-term focus to achieve a return on investment that is based on levels of liquidity and
investment risk that the trustees, in consultation with management believe are prudent and reasonable. The investment portfolio contains a diversified blend of equity and fixed income and index linked investments consisting primarily of government debt. The equity investments are diversified across U.K. and non-U.K. equities, as well as value, growth, and medium and large capitalizations. The portfolio’s asset mix is reviewed regularly, and the portfolio is rebalanced based on existing market conditions. Investment risk is measured and monitored on a regular basis through quarterly portfolio reviews, annual liability measurements and periodic asset/liability analyses.
The fair value of our pension assets are comprised of the following (dollars in thousands):
125
Target Allocation 2014
Plan Assets
at December 31, Asset Category 2014 2013 Equity securities 55.5 % 57.2 % 57.2 % Absolute return strategy fund 28.4 % 28.2 % 28.1 % Debt securities 8.0 % 7.1 % 7.0 % Other 8.1 % 7.5 % 7.7 %
Total 100.0 % 100.0 %
Fair Value Measured and Recorded Using:
Total
Quoted Prices in Active Markets for Identical Assets
(Level 1)
Significant Observable
Inputs (Level 2)
Significant Unobservable
Inputs
(Level 3) As of December 31, 2014 Asset Category Cash $ 1,274 $ 1,274 $ — $ — Equity securities (a) 187,637 27,886 159,751 — Fixed income securities (a) 23,397 — 23,397 — Absolute return strategy fund (b) 92,550 — 92,550 — Other (c) 23,463 — 21,538 1,925
Total $ 328,321 $ 29,160 $ 297,236 $ 1,925
As of December 31, 2013 Asset Category Cash $ 6,385 $ 6,385 $ — $ — Equity securities (a) 189,852 29,153 160,699 — Fixed income securities (a) 23,273 — 23,273 — Absolute return strategy fund (b) 93,343 — 93,343 — Other (c) 19,350 — 16,256 3,094
Total $ 332,203 $ 35,538 $ 293,571 $ 3,094
(a) The assets in this category represent investments in foreign equity and bond funds. Generally, these assets are valued using bid-market
valuations provided by the funds’ investment managers. (b) The assets in this category represent investments in an absolute return strategies fund. Generally, these assets are valued at the net asset
value as determined by the custodian of the fund. The net asset value is based on the underlying investments, which are valued using inputs such as quoted market prices of identical instruments, discounted future cash flows, independent appraisals, and market-based comparable
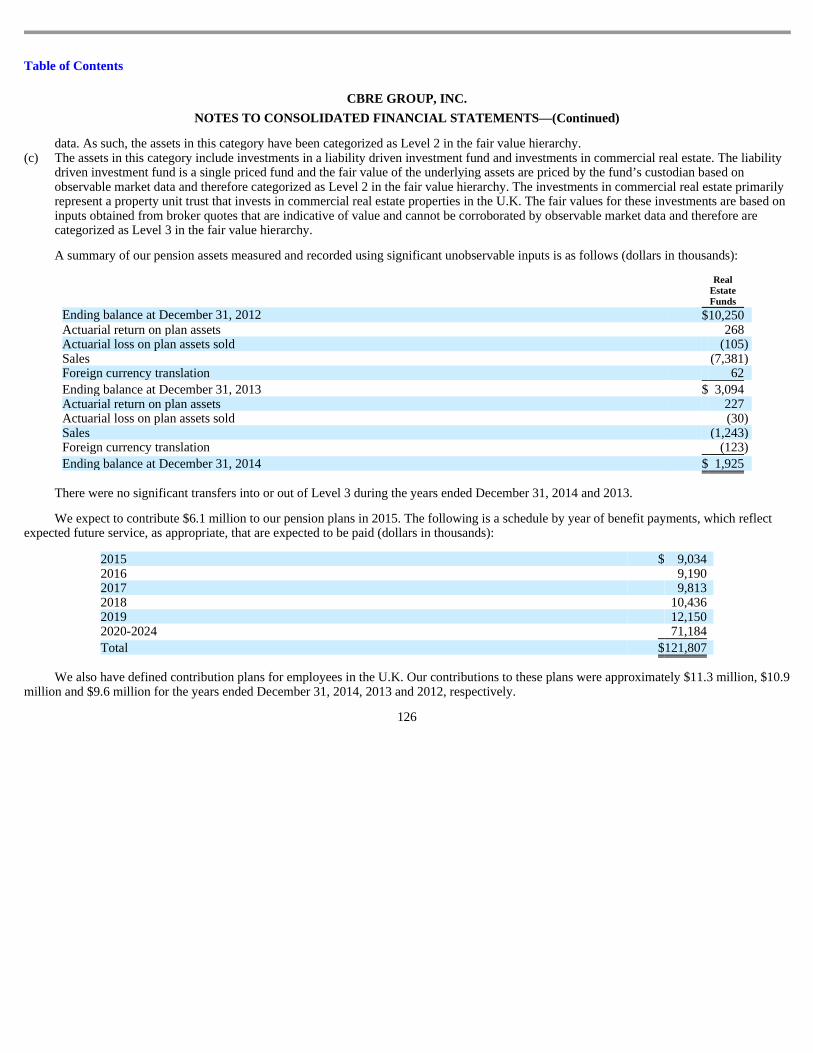
Table of Contents
CBRE GROUP, INC.
NOTES TO CONSOLIDATED FINANCIAL STATEMENTS —(Continued)
A summary of our pension assets measured and recorded using significant unobservable inputs is as follows (dollars in thousands):
There were no significant transfers into or out of Level 3 during the years ended December 31, 2014 and 2013.
We expect to contribute $6.1 million to our pension plans in 2015. The following is a schedule by year of benefit payments, which reflect
expected future service, as appropriate, that are expected to be paid (dollars in thousands):
We also have defined contribution plans for employees in the U.K. Our contributions to these plans were approximately $11.3 million, $10.9
million and $9.6 million for the years ended December 31, 2014, 2013 and 2012, respectively.
126
data. As such, the assets in this category have been categorized as Level 2 in the fair value hierarchy. (c) The assets in this category include investments in a liability driven investment fund and investments in commercial real estate. The liability
driven investment fund is a single priced fund and the fair value of the underlying assets are priced by the fund’s custodian based on observable market data and therefore categorized as Level 2 in the fair value hierarchy. The investments in commercial real estate primarily represent a property unit trust that invests in commercial real estate properties in the U.K. The fair values for these investments are based on inputs obtained from broker quotes that are indicative of value and cannot be corroborated by observable market data and therefore are categorized as Level 3 in the fair value hierarchy.
Real Estate Funds
Ending balance at December 31, 2012 $ 10,250 Actuarial return on plan assets 268 Actuarial loss on plan assets sold (105 ) Sales (7,381 ) Foreign currency translation 62
Ending balance at December 31, 2013 $ 3,094 Actuarial return on plan assets 227 Actuarial loss on plan assets sold (30 ) Sales (1,243 ) Foreign currency translation (123 )
Ending balance at December 31, 2014 $ 1,925
2015 $ 9,034 2016 9,190 2017 9,813 2018 10,436 2019 12,150 2020-2024 71,184
Total $ 121,807
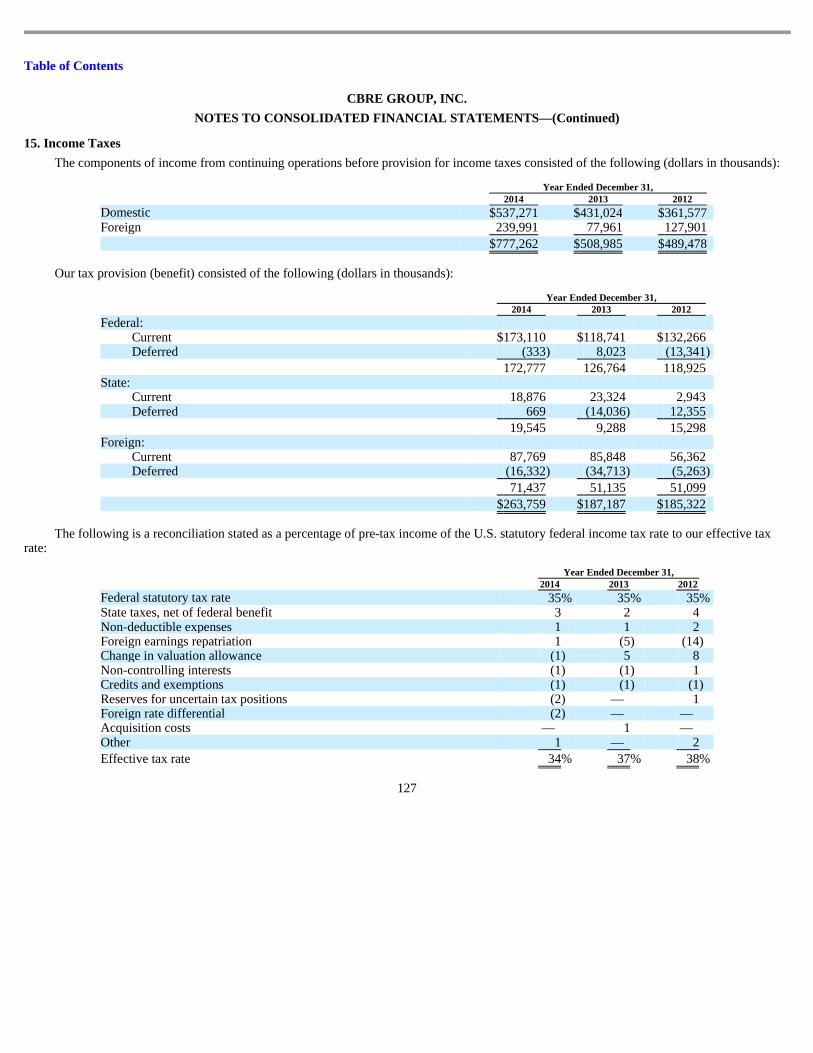
Table of Contents
CBRE GROUP, INC.
NOTES TO CONSOLIDATED FINANCIAL STATEMENTS —(Continued) 15. Income Taxes
The components of income from continuing operations before provision for income taxes consisted of the following (dollars in thousands):
Our tax provision (benefit) consisted of the following (dollars in thousands):
The following is a reconciliation stated as a percentage of pre-tax income of the U.S. statutory federal income tax rate to our effective tax
rate:
127
Year Ended December 31, 2014 2013 2012 Domestic $ 537,271 $ 431,024 $ 361,577 Foreign 239,991 77,961 127,901
$ 777,262 $ 508,985 $ 489,478
Year Ended December 31, 2014 2013 2012 Federal:
Current $ 173,110 $ 118,741 $ 132,266 Deferred (333 ) 8,023 (13,341 )
172,777 126,764 118,925 State:
Current 18,876 23,324 2,943 Deferred 669 (14,036 ) 12,355
19,545 9,288 15,298 Foreign:
Current 87,769 85,848 56,362 Deferred (16,332 ) (34,713 ) (5,263 )
71,437 51,135 51,099
$ 263,759 $ 187,187 $ 185,322
Year Ended December 31, 2014 2013 2012 Federal statutory tax rate 35 % 35 % 35 % State taxes, net of federal benefit 3 2 4 Non-deductible expenses 1 1 2 Foreign earnings repatriation 1 (5 ) (14 ) Change in valuation allowance (1 ) 5 8 Non-controlling interests (1 ) (1 ) 1 Credits and exemptions (1 ) (1 ) (1 ) Reserves for uncertain tax positions (2 ) — 1 Foreign rate differential (2 ) — — Acquisition costs — 1 — Other 1 — 2
Effective tax rate 34 % 37 % 38 %
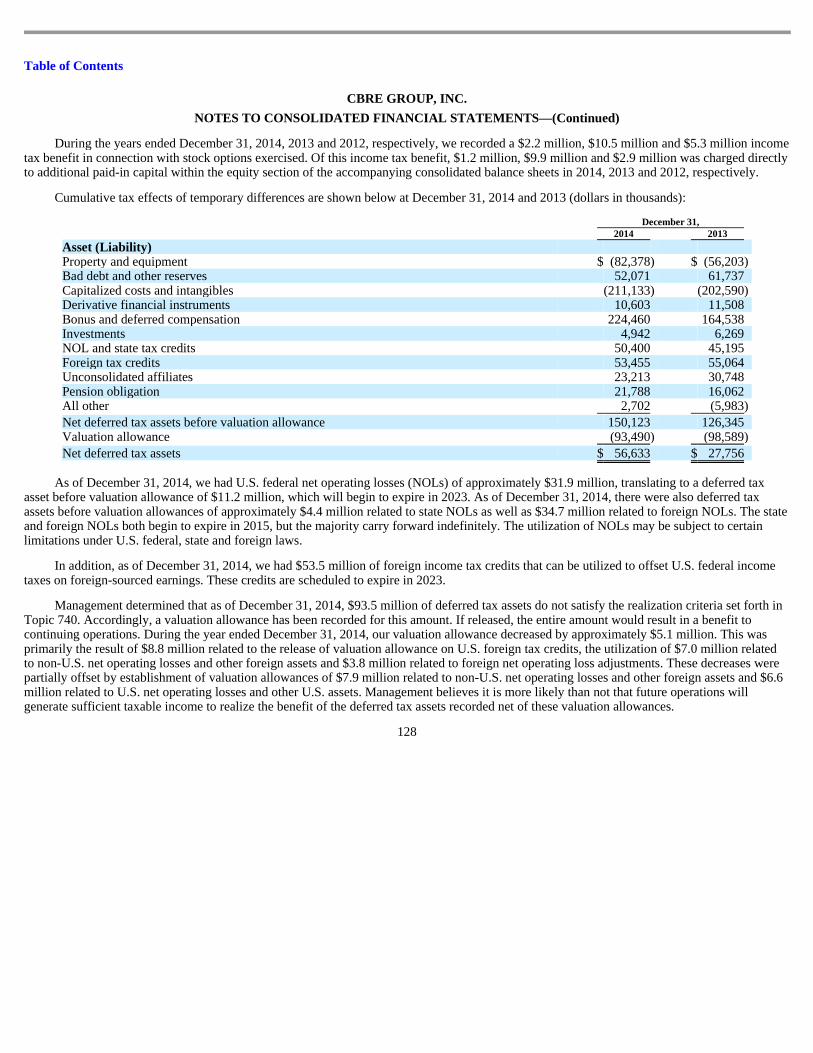
Table of Contents
CBRE GROUP, INC.
NOTES TO CONSOLIDATED FINANCIAL STATEMENTS —(Continued)
During the years ended December 31, 2014, 2013 and 2012, respectively, we recorded a $2.2 million, $10.5 million and $5.3 million income tax benefit in connection with stock options exercised. Of this income tax benefit, $1.2 million, $9.9 million and $2.9 million was charged directly to additional paid-in capital within the equity section of the accompanying consolidated balance sheets in 2014, 2013 and 2012, respectively.
Cumulative tax effects of temporary differences are shown below at December 31, 2014 and 2013 (dollars in thousands):
As of December 31, 2014, we had U.S. federal net operating losses (NOLs) of approximately $31.9 million, translating to a deferred tax
asset before valuation allowance of $11.2 million, which will begin to expire in 2023. As of December 31, 2014, there were also deferred tax assets before valuation allowances of approximately $4.4 million related to state NOLs as well as $34.7 million related to foreign NOLs. The state and foreign NOLs both begin to expire in 2015, but the majority carry forward indefinitely. The utilization of NOLs may be subject to certain limitations under U.S. federal, state and foreign laws.
In addition, as of December 31, 2014, we had $53.5 million of foreign income tax credits that can be utilized to offset U.S. federal income taxes on foreign-sourced earnings. These credits are scheduled to expire in 2023.
Management determined that as of December 31, 2014, $93.5 million of deferred tax assets do not satisfy the realization criteria set forth in Topic 740. Accordingly, a valuation allowance has been recorded for this amount. If released, the entire amount would result in a benefit to continuing operations. During the year ended December 31, 2014, our valuation allowance decreased by approximately $5.1 million. This was primarily the result of $8.8 million related to the release of valuation allowance on U.S. foreign tax credits, the utilization of $7.0 million related to non-U.S. net operating losses and other foreign assets and $3.8 million related to foreign net operating loss adjustments. These decreases were partially offset by establishment of valuation allowances of $7.9 million related to non-U.S. net operating losses and other foreign assets and $6.6 million related to U.S. net operating losses and other U.S. assets. Management believes it is more likely than not that future operations will generate sufficient taxable income to realize the benefit of the deferred tax assets recorded net of these valuation allowances.
128
December 31, 2014 2013
Asset (Liability) Property and equipment $ (82,378 ) $ (56,203 ) Bad debt and other reserves 52,071 61,737 Capitalized costs and intangibles (211,133 ) (202,590 ) Derivative financial instruments 10,603 11,508 Bonus and deferred compensation 224,460 164,538 Investments 4,942 6,269 NOL and state tax credits 50,400 45,195 Foreign tax credits 53,455 55,064 Unconsolidated affiliates 23,213 30,748 Pension obligation 21,788 16,062 All other 2,702 (5,983 )
Net deferred tax assets before valuation allowance 150,123 126,345 Valuation allowance (93,490 ) (98,589 )
Net deferred tax assets $ 56,633 $ 27,756
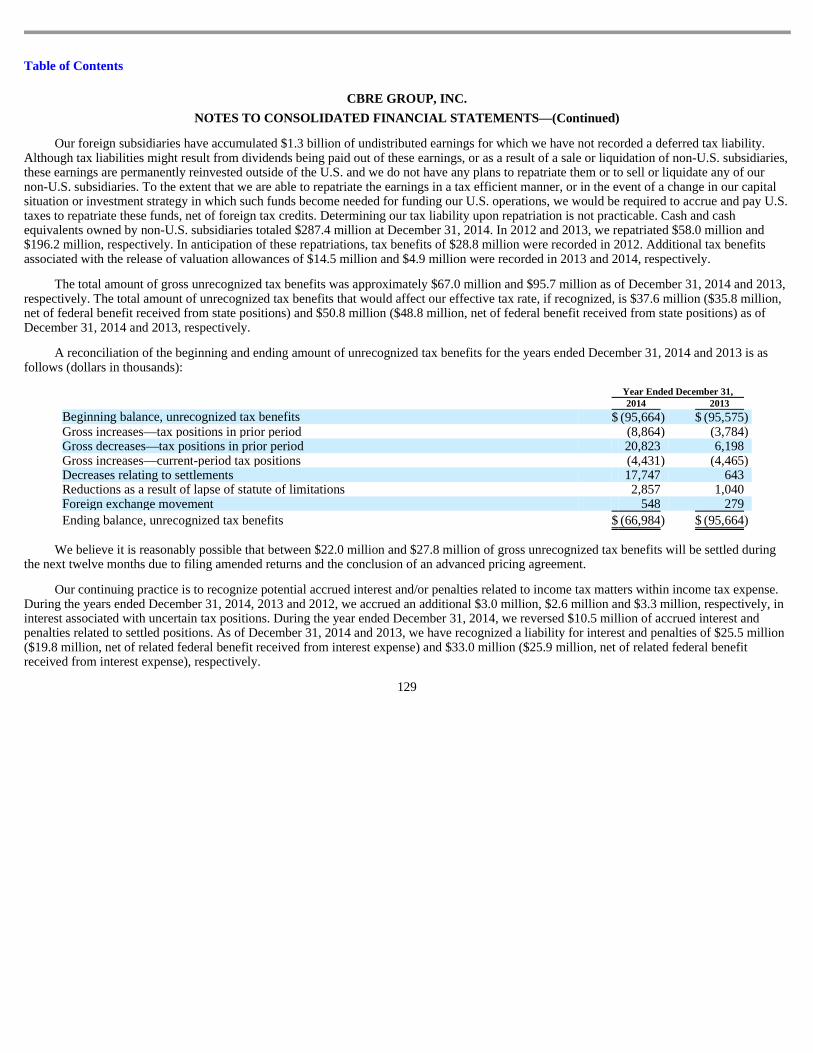
Table of Contents
CBRE GROUP, INC.
NOTES TO CONSOLIDATED FINANCIAL STATEMENTS —(Continued)
Our foreign subsidiaries have accumulated $1.3 billion of undistributed earnings for which we have not recorded a deferred tax liability. Although tax liabilities might result from dividends being paid out of these earnings, or as a result of a sale or liquidation of non-U.S. subsidiaries, these earnings are permanently reinvested outside of the U.S. and we do not have any plans to repatriate them or to sell or liquidate any of our non-U.S. subsidiaries. To the extent that we are able to repatriate the earnings in a tax efficient manner, or in the event of a change in our capital situation or investment strategy in which such funds become needed for funding our U.S. operations, we would be required to accrue and pay U.S. taxes to repatriate these funds, net of foreign tax credits. Determining our tax liability upon repatriation is not practicable. Cash and cash equivalents owned by non-U.S. subsidiaries totaled $287.4 million at December 31, 2014. In 2012 and 2013, we repatriated $58.0 million and $196.2 million, respectively. In anticipation of these repatriations, tax benefits of $28.8 million were recorded in 2012. Additional tax benefits associated with the release of valuation allowances of $14.5 million and $4.9 million were recorded in 2013 and 2014, respectively.
The total amount of gross unrecognized tax benefits was approximately $67.0 million and $95.7 million as of December 31, 2014 and 2013, respectively. The total amount of unrecognized tax benefits that would affect our effective tax rate, if recognized, is $37.6 million ($35.8 million, net of federal benefit received from state positions) and $50.8 million ($48.8 million, net of federal benefit received from state positions) as of December 31, 2014 and 2013, respectively.
A reconciliation of the beginning and ending amount of unrecognized tax benefits for the years ended December 31, 2014 and 2013 is as follows (dollars in thousands):
We believe it is reasonably possible that between $22.0 million and $27.8 million of gross unrecognized tax benefits will be settled during
the next twelve months due to filing amended returns and the conclusion of an advanced pricing agreement.
Our continuing practice is to recognize potential accrued interest and/or penalties related to income tax matters within income tax expense. During the years ended December 31, 2014, 2013 and 2012, we accrued an additional $3.0 million, $2.6 million and $3.3 million, respectively, in interest associated with uncertain tax positions. During the year ended December 31, 2014, we reversed $10.5 million of accrued interest and penalties related to settled positions. As of December 31, 2014 and 2013, we have recognized a liability for interest and penalties of $25.5 million ($19.8 million, net of related federal benefit received from interest expense) and $33.0 million ($25.9 million, net of related federal benefit received from interest expense), respectively.
129
Year Ended December 31, 2014 2013 Beginning balance, unrecognized tax benefits $ (95,664 ) $ (95,575 ) Gross increases—tax positions in prior period (8,864 ) (3,784 ) Gross decreases—tax positions in prior period 20,823 6,198 Gross increases—current-period tax positions (4,431 ) (4,465 ) Decreases relating to settlements 17,747 643 Reductions as a result of lapse of statute of limitations 2,857 1,040 Foreign exchange movement 548 279
Ending balance, unrecognized tax benefits $ (66,984 ) $ (95,664 )
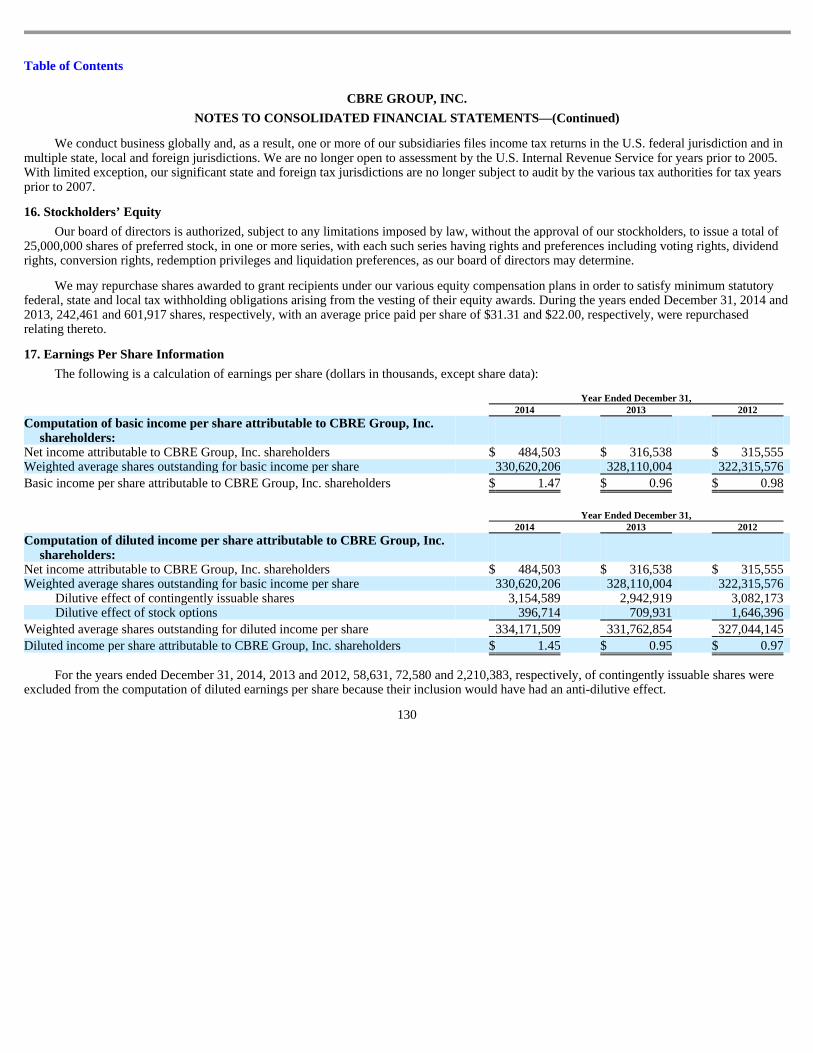
Table of Contents
CBRE GROUP, INC.
NOTES TO CONSOLIDATED FINANCIAL STATEMENTS —(Continued)
We conduct business globally and, as a result, one or more of our subsidiaries files income tax returns in the U.S. federal jurisdiction and in multiple state, local and foreign jurisdictions. We are no longer open to assessment by the U.S. Internal Revenue Service for years prior to 2005. With limited exception, our significant state and foreign tax jurisdictions are no longer subject to audit by the various tax authorities for tax years prior to 2007. 16. Stockholders’ Equity
Our board of directors is authorized, subject to any limitations imposed by law, without the approval of our stockholders, to issue a total of 25,000,000 shares of preferred stock, in one or more series, with each such series having rights and preferences including voting rights, dividend rights, conversion rights, redemption privileges and liquidation preferences, as our board of directors may determine.
We may repurchase shares awarded to grant recipients under our various equity compensation plans in order to satisfy minimum statutory federal, state and local tax withholding obligations arising from the vesting of their equity awards. During the years ended December 31, 2014 and 2013, 242,461 and 601,917 shares, respectively, with an average price paid per share of $31.31 and $22.00, respectively, were repurchased relating thereto. 17. Earnings Per Share Information
The following is a calculation of earnings per share (dollars in thousands, except share data):
For the years ended December 31, 2014, 2013 and 2012, 58,631, 72,580 and 2,210,383, respectively, of contingently issuable shares were
excluded from the computation of diluted earnings per share because their inclusion would have had an anti-dilutive effect.
130
Year Ended December 31, 2014 2013 2012 Computation of basic income per share attributable to CBRE Group, Inc.
shareholders: Net income attributable to CBRE Group, Inc. shareholders $ 484,503 $ 316,538 $ 315,555 Weighted average shares outstanding for basic income per share 330,620,206 328,110,004 322,315,576
Basic income per share attributable to CBRE Group, Inc. shareholders $ 1.47 $ 0.96 $ 0.98
Year Ended December 31, 2014 2013 2012 Computation of diluted income per share attributable to CBRE Group, Inc.
shareholders: Net income attributable to CBRE Group, Inc. shareholders $ 484,503 $ 316,538 $ 315,555 Weighted average shares outstanding for basic income per share 330,620,206 328,110,004 322,315,576
Dilutive effect of contingently issuable shares 3,154,589 2,942,919 3,082,173 Dilutive effect of stock options 396,714 709,931 1,646,396
Weighted average shares outstanding for diluted income per share 334,171,509 331,762,854 327,044,145
Diluted income per share attributable to CBRE Group, Inc. shareholders $ 1.45 $ 0.95 $ 0.97
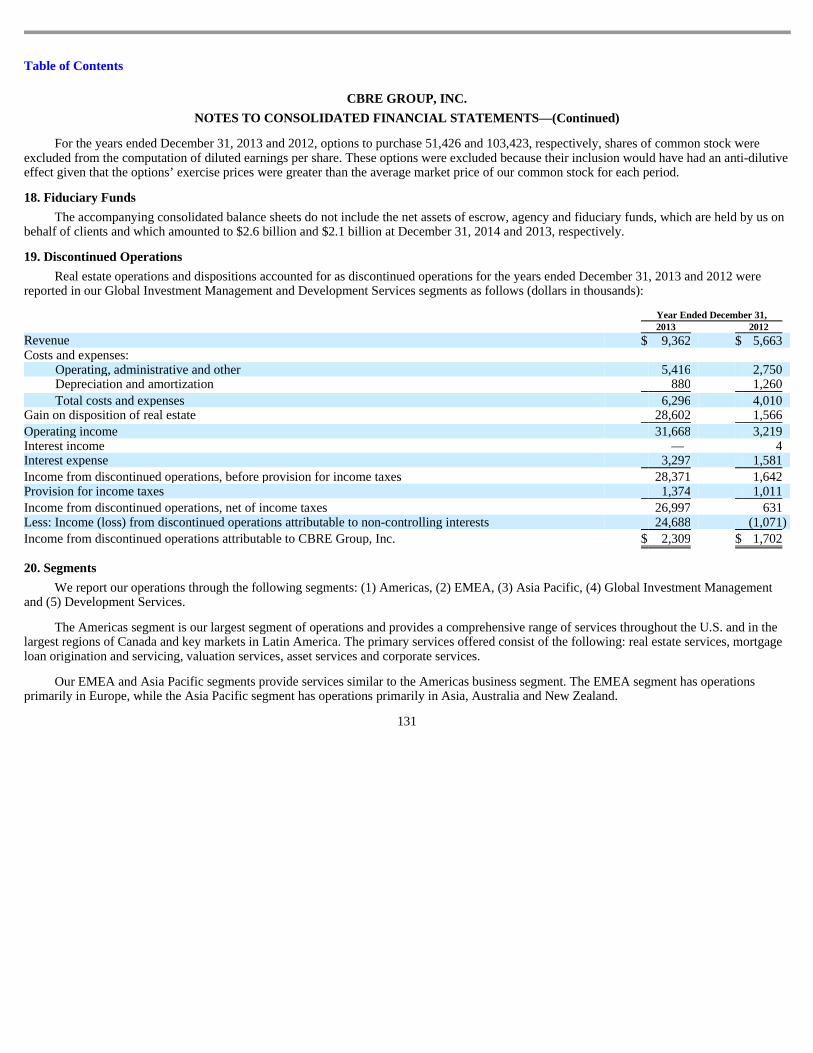
Table of Contents
CBRE GROUP, INC.
NOTES TO CONSOLIDATED FINANCIAL STATEMENTS —(Continued)
For the years ended December 31, 2013 and 2012, options to purchase 51,426 and 103,423, respectively, shares of common stock were excluded from the computation of diluted earnings per share. These options were excluded because their inclusion would have had an anti-dilutive effect given that the options’ exercise prices were greater than the average market price of our common stock for each period. 18. Fiduciary Funds
The accompanying consolidated balance sheets do not include the net assets of escrow, agency and fiduciary funds, which are held by us on behalf of clients and which amounted to $2.6 billion and $2.1 billion at December 31, 2014 and 2013, respectively. 19. Discontinued Operations
Real estate operations and dispositions accounted for as discontinued operations for the years ended December 31, 2013 and 2012 were reported in our Global Investment Management and Development Services segments as follows (dollars in thousands):
20. Segments
Year Ended December 31, 2013 2012 Revenue $ 9,362 $ 5,663 Costs and expenses:
Operating, administrative and other 5,416 2,750 Depreciation and amortization 880 1,260
Total costs and expenses 6,296 4,010 Gain on disposition of real estate 28,602 1,566
Operating income 31,668 3,219 Interest income — 4 Interest expense 3,297 1,581
Income from discontinued operations, before provision for income taxes 28,371 1,642 Provision for income taxes 1,374 1,011
Income from discontinued operations, net of income taxes 26,997 631 Less: Income (loss) from discontinued operations attributable to non-controlling interests 24,688 (1,071 )
Income from discontinued operations attributable to CBRE Group, Inc. $ 2,309 $ 1,702
We report our operations through the following segments: (1) Americas, (2) EMEA, (3) Asia Pacific, (4) Global Investment Management and (5) Development Services.
The Americas segment is our largest segment of operations and provides a comprehensive range of services throughout the U.S. and in the largest regions of Canada and key markets in Latin America. The primary services offered consist of the following: real estate services, mortgage loan origination and servicing, valuation services, asset services and corporate services.
Our EMEA and Asia Pacific segments provide services similar to the Americas business segment. The EMEA segment has operations primarily in Europe, while the Asia Pacific segment has operations primarily in Asia, Australia and New Zealand.
131
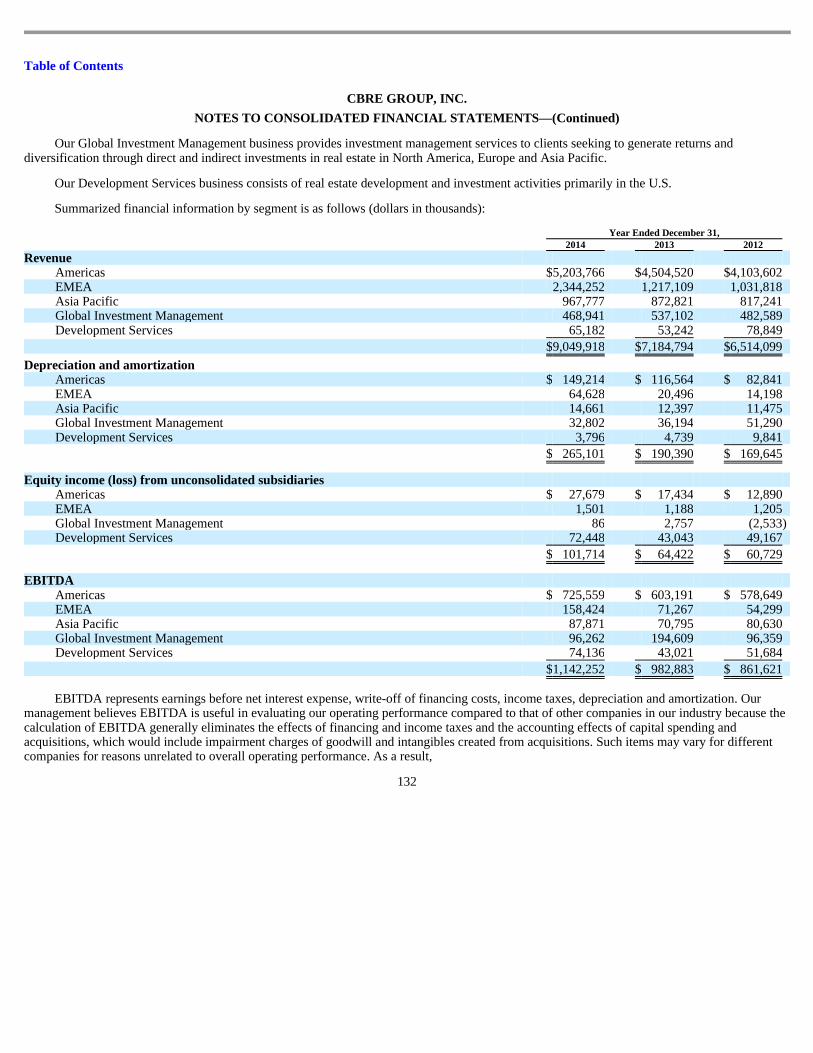
Table of Contents
CBRE GROUP, INC.
NOTES TO CONSOLIDATED FINANCIAL STATEMENTS —(Continued)
Our Global Investment Management business provides investment management services to clients seeking to generate returns and diversification through direct and indirect investments in real estate in North America, Europe and Asia Pacific.
Our Development Services business consists of real estate development and investment activities primarily in the U.S.
Summarized financial information by segment is as follows (dollars in thousands):
EBITDA represents earnings before net interest expense, write-off of financing costs, income taxes, depreciation and amortization. Our
management believes EBITDA is useful in evaluating our operating performance compared to that of other companies in our industry because the calculation of EBITDA generally eliminates the effects of financing and income taxes and the accounting effects of capital spending and acquisitions, which would include impairment charges of goodwill and intangibles created from acquisitions. Such items may vary for different companies for reasons unrelated to overall operating performance. As a result,
132
Year Ended December 31, 2014 2013 2012 Revenue
Americas $ 5,203,766 $ 4,504,520 $ 4,103,602 EMEA 2,344,252 1,217,109 1,031,818 Asia Pacific 967,777 872,821 817,241 Global Investment Management 468,941 537,102 482,589 Development Services 65,182 53,242 78,849
$ 9,049,918 $ 7,184,794 $ 6,514,099
Depreciation and amortization Americas $ 149,214 $ 116,564 $ 82,841 EMEA 64,628 20,496 14,198 Asia Pacific 14,661 12,397 11,475 Global Investment Management 32,802 36,194 51,290 Development Services 3,796 4,739 9,841
$ 265,101 $ 190,390 $ 169,645
Equity income (loss) from unconsolidated subsidiaries Americas $ 27,679 $ 17,434 $ 12,890 EMEA 1,501 1,188 1,205 Global Investment Management 86 2,757 (2,533 ) Development Services 72,448 43,043 49,167
$ 101,714 $ 64,422 $ 60,729
EBITDA Americas $ 725,559 $ 603,191 $ 578,649 EMEA 158,424 71,267 54,299 Asia Pacific 87,871 70,795 80,630 Global Investment Management 96,262 194,609 96,359 Development Services 74,136 43,021 51,684
$ 1,142,252 $ 982,883 $ 861,621
Table of Contents
CBRE GROUP, INC.
NOTES TO CONSOLIDATED FINANCIAL STATEMENTS —(Continued) our management uses EBITDA as a measure to evaluate the operating performance of our various business segments and for other discretionary purposes, including as a significant component when measuring our operating performance under our employee incentive programs. Additionally, we believe EBITDA is useful to investors to assist them in getting a more complete picture of our results of operations.
However, EBITDA is not a recognized measurement under GAAP and when analyzing our operating performance, readers should use EBITDA in addition to, and not as an alternative for, net income as determined in accordance with GAAP. Because not all companies use identical calculations, our presentation of EBITDA may not be comparable to similarly titled measures of other companies. Furthermore, EBITDA is not intended to be a measure of free cash flow for our management’s discretionary use, as it does not consider certain cash requirements such as tax and debt service payments. The amounts shown for EBITDA also differ from the amounts calculated under similarly titled definitions in our debt instruments, which are further adjusted to reflect certain other cash and non-cash charges and are used to determine compliance with financial covenants and our ability to engage in certain activities, such as incurring additional debt and making certain restricted payments.
133
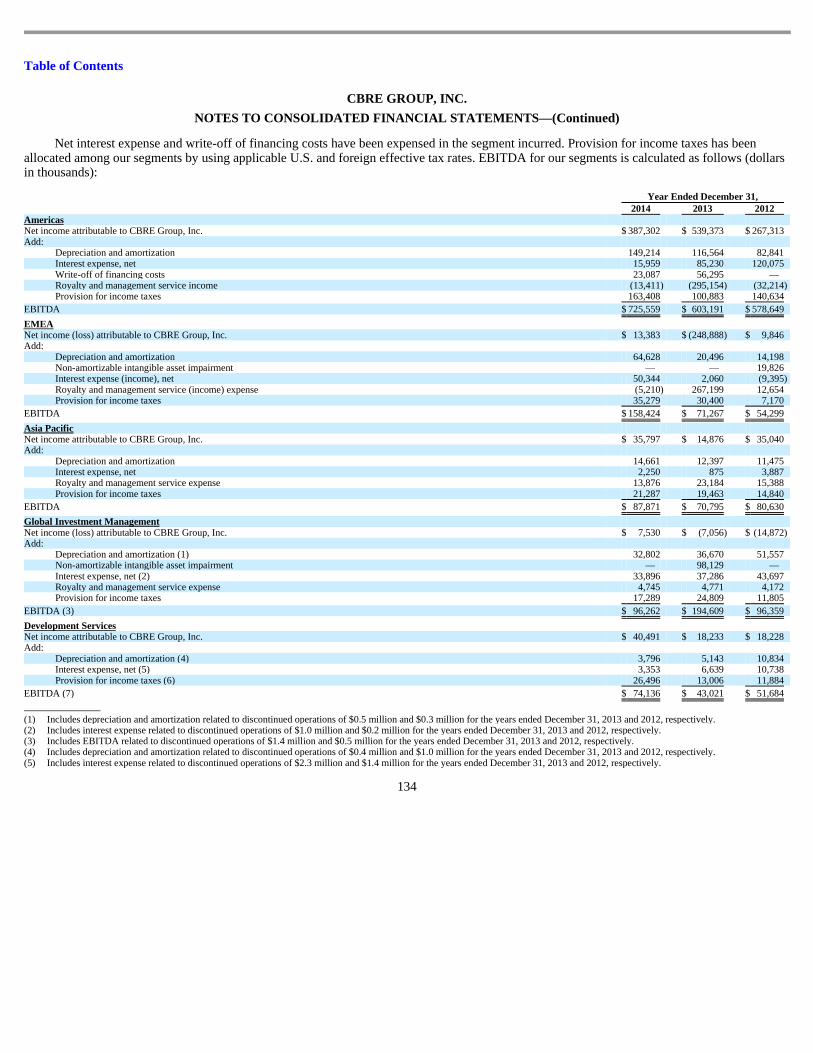
Table of Contents
CBRE GROUP, INC.
NOTES TO CONSOLIDATED FINANCIAL STATEMENTS —(Continued)
Net interest expense and write-off of financing costs have been expensed in the segment incurred. Provision for income taxes has been allocated among our segments by using applicable U.S. and foreign effective tax rates. EBITDA for our segments is calculated as follows (dollars in thousands):
134
Year Ended December 31, 2014 2013 2012 Americas Net income attributable to CBRE Group, Inc. $ 387,302 $ 539,373 $ 267,313 Add:
Depreciation and amortization 149,214 116,564 82,841 Interest expense, net 15,959 85,230 120,075 Write-off of financing costs 23,087 56,295 — Royalty and management service income (13,411 ) (295,154 ) (32,214 ) Provision for income taxes 163,408 100,883 140,634
EBITDA $ 725,559 $ 603,191 $ 578,649
EMEA Net income (loss) attributable to CBRE Group, Inc. $ 13,383 $ (248,888 ) $ 9,846 Add:
Depreciation and amortization 64,628 20,496 14,198 Non-amortizable intangible asset impairment — — 19,826 Interest expense (income), net 50,344 2,060 (9,395 ) Royalty and management service (income) expense (5,210 ) 267,199 12,654 Provision for income taxes 35,279 30,400 7,170
EBITDA $ 158,424 $ 71,267 $ 54,299
Asia Pacific Net income attributable to CBRE Group, Inc. $ 35,797 $ 14,876 $ 35,040 Add:
Depreciation and amortization 14,661 12,397 11,475 Interest expense, net 2,250 875 3,887 Royalty and management service expense 13,876 23,184 15,388 Provision for income taxes 21,287 19,463 14,840
EBITDA $ 87,871 $ 70,795 $ 80,630
Global Investment Management Net income (loss) attributable to CBRE Group, Inc. $ 7,530 $ (7,056 ) $ (14,872 ) Add:
Depreciation and amortization (1) 32,802 36,670 51,557 Non-amortizable intangible asset impairment — 98,129 — Interest expense, net (2) 33,896 37,286 43,697 Royalty and management service expense 4,745 4,771 4,172 Provision for income taxes 17,289 24,809 11,805
EBITDA (3) $ 96,262 $ 194,609 $ 96,359
Development Services Net income attributable to CBRE Group, Inc. $ 40,491 $ 18,233 $ 18,228 Add:
Depreciation and amortization (4) 3,796 5,143 10,834 Interest expense, net (5) 3,353 6,639 10,738 Provision for income taxes (6) 26,496 13,006 11,884
EBITDA (7) $ 74,136 $ 43,021 $ 51,684
(1) Includes depreciation and amortization related to discontinued operations of $0.5 million and $0.3 million for the years ended December 31, 2013 and 2012, respectively. (2) Includes interest expense related to discontinued operations of $1.0 million and $0.2 million for the years ended December 31, 2013 and 2012, respectively. (3) Includes EBITDA related to discontinued operations of $1.4 million and $0.5 million for the years ended December 31, 2013 and 2012, respectively. (4) Includes depreciation and amortization related to discontinued operations of $0.4 million and $1.0 million for the years ended December 31, 2013 and 2012, respectively. (5) Includes interest expense related to discontinued operations of $2.3 million and $1.4 million for the years ended December 31, 2013 and 2012, respectively.
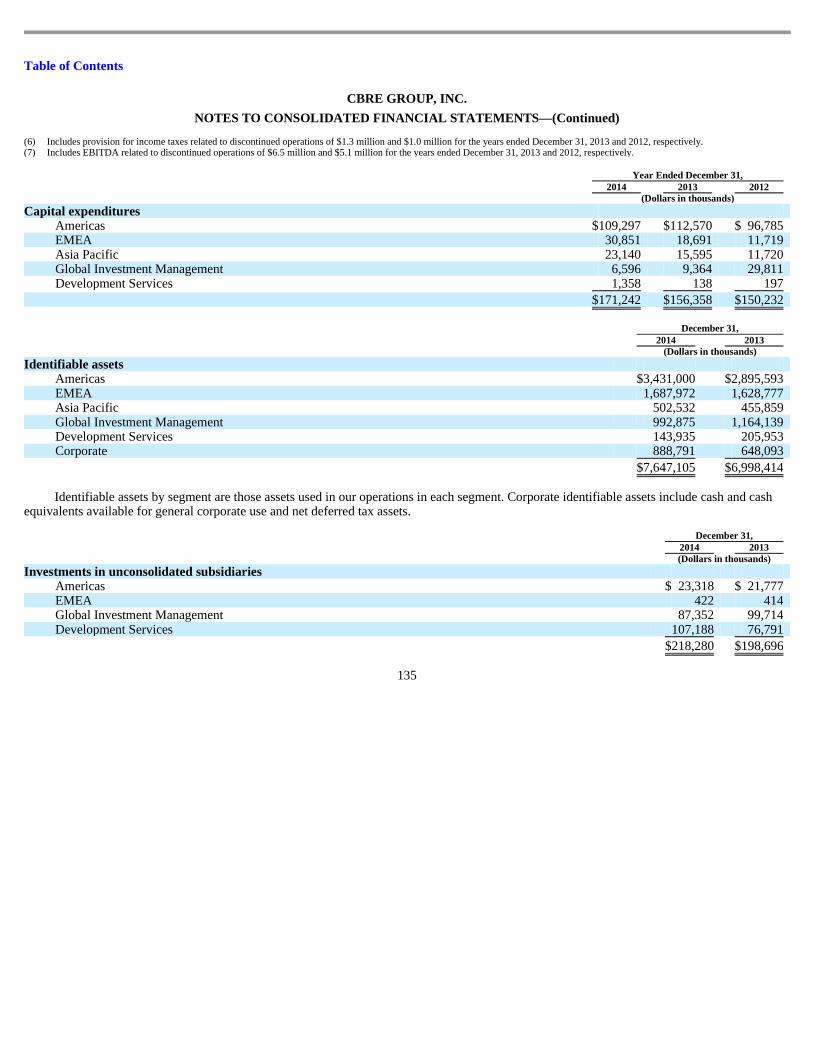
Table of Contents
CBRE GROUP, INC.
NOTES TO CONSOLIDATED FINANCIAL STATEMENTS —(Continued)
Identifiable assets by segment are those assets used in our operations in each segment. Corporate identifiable assets include cash and cash
equivalents available for general corporate use and net deferred tax assets.
135
(6) Includes provision for income taxes related to discontinued operations of $1.3 million and $1.0 million for the years ended December 31, 2013 and 2012, respectively. (7) Includes EBITDA related to discontinued operations of $6.5 million and $5.1 million for the years ended December 31, 2013 and 2012, respectively.
Year Ended December 31, 2014 2013 2012 (Dollars in thousands)
Capital expenditures Americas $ 109,297 $ 112,570 $ 96,785 EMEA 30,851 18,691 11,719 Asia Pacific 23,140 15,595 11,720 Global Investment Management 6,596 9,364 29,811 Development Services 1,358 138 197
$ 171,242 $ 156,358 $ 150,232
December 31, 2014 2013 (Dollars in thousands) Identifiable assets
Americas $ 3,431,000 $ 2,895,593 EMEA 1,687,972 1,628,777 Asia Pacific 502,532 455,859 Global Investment Management 992,875 1,164,139 Development Services 143,935 205,953 Corporate 888,791 648,093
$ 7,647,105 $ 6,998,414
December 31, 2014 2013 (Dollars in thousands) Investments in unconsolidated subsidiaries
Americas $ 23,318 $ 21,777 EMEA 422 414 Global Investment Management 87,352 99,714 Development Services 107,188 76,791
$ 218,280 $ 198,696
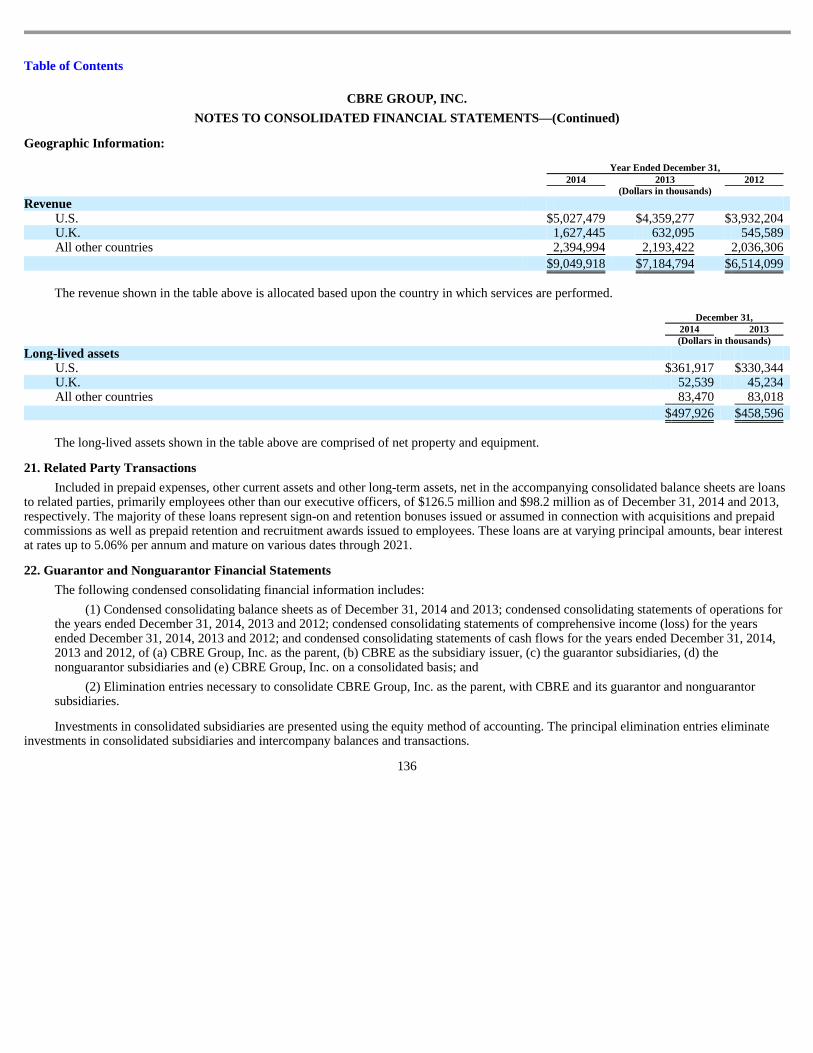
Table of Contents
CBRE GROUP, INC.
NOTES TO CONSOLIDATED FINANCIAL STATEMENTS —(Continued) Geographic Information:
The revenue shown in the table above is allocated based upon the country in which services are performed.
The long-lived assets shown in the table above are comprised of net property and equipment.
21. Related Party Transactions
Year Ended December 31, 2014 2013 2012 (Dollars in thousands) Revenue
U.S. $ 5,027,479 $ 4,359,277 $ 3,932,204 U.K. 1,627,445 632,095 545,589 All other countries 2,394,994 2,193,422 2,036,306
$ 9,049,918 $ 7,184,794 $ 6,514,099
December 31, 2014 2013 (Dollars in thousands) Long-lived assets
U.S. $ 361,917 $ 330,344 U.K. 52,539 45,234 All other countries 83,470 83,018
$ 497,926 $ 458,596
Included in prepaid expenses, other current assets and other long-term assets, net in the accompanying consolidated balance sheets are loans to related parties, primarily employees other than our executive officers, of $126.5 million and $98.2 million as of December 31, 2014 and 2013, respectively. The majority of these loans represent sign-on and retention bonuses issued or assumed in connection with acquisitions and prepaid commissions as well as prepaid retention and recruitment awards issued to employees. These loans are at varying principal amounts, bear interest at rates up to 5.06% per annum and mature on various dates through 2021. 22. Guarantor and Nonguarantor Financial Statements
The following condensed consolidating financial information includes:
(1) Condensed consolidating balance sheets as of December 31, 2014 and 2013; condensed consolidating statements of operations for the years ended December 31, 2014, 2013 and 2012; condensed consolidating statements of comprehensive income (loss) for the years ended December 31, 2014, 2013 and 2012; and condensed consolidating statements of cash flows for the years ended December 31, 2014, 2013 and 2012, of (a) CBRE Group, Inc. as the parent, (b) CBRE as the subsidiary issuer, (c) the guarantor subsidiaries, (d) the nonguarantor subsidiaries and (e) CBRE Group, Inc. on a consolidated basis; and
(2) Elimination entries necessary to consolidate CBRE Group, Inc. as the parent, with CBRE and its guarantor and nonguarantor
subsidiaries.
Investments in consolidated subsidiaries are presented using the equity method of accounting. The principal elimination entries eliminate investments in consolidated subsidiaries and intercompany balances and transactions.
136
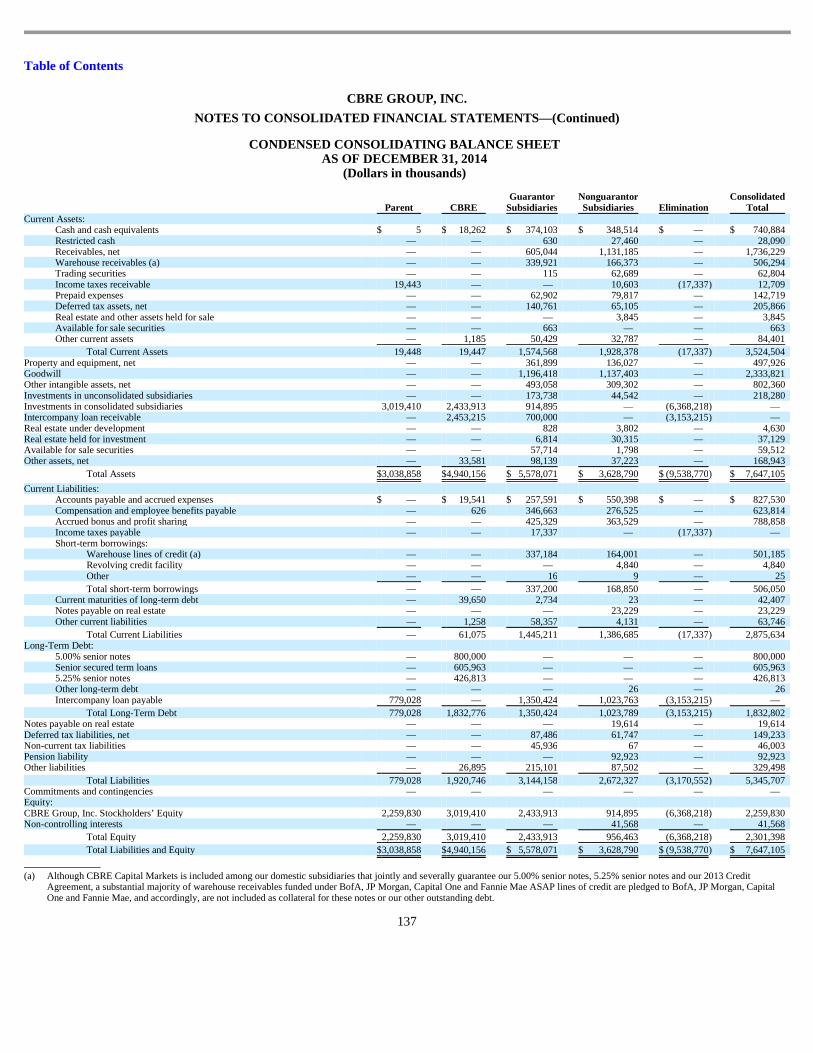
Table of Contents
CBRE GROUP, INC.
NOTES TO CONSOLIDATED FINANCIAL STATEMENTS —(Continued)
137
CONDENSED CONSOLIDATING BALANCE SHEET AS OF DECEMBER 31, 2014
(Dollars in thousands)
Parent CBRE Guarantor
Subsidiaries Nonguarantor Subsidiaries Elimination
Consolidated Total
Current Assets: Cash and cash equivalents $ 5 $ 18,262 $ 374,103 $ 348,514 $ — $ 740,884 Restricted cash — — 630 27,460 — 28,090 Receivables, net — — 605,044 1,131,185 — 1,736,229 Warehouse receivables (a) — — 339,921 166,373 — 506,294 Trading securities — — 115 62,689 — 62,804 Income taxes receivable 19,443 — — 10,603 (17,337 ) 12,709 Prepaid expenses — — 62,902 79,817 — 142,719 Deferred tax assets, net — — 140,761 65,105 — 205,866 Real estate and other assets held for sale — — — 3,845 — 3,845 Available for sale securities — — 663 — — 663 Other current assets — 1,185 50,429 32,787 — 84,401
Total Current Assets 19,448 19,447 1,574,568 1,928,378 (17,337 ) 3,524,504 Property and equipment, net — — 361,899 136,027 — 497,926 Goodwill — — 1,196,418 1,137,403 — 2,333,821 Other intangible assets, net — — 493,058 309,302 — 802,360 Investments in unconsolidated subsidiaries — — 173,738 44,542 — 218,280 Investments in consolidated subsidiaries 3,019,410 2,433,913 914,895 — (6,368,218 ) — Intercompany loan receivable — 2,453,215 700,000 — (3,153,215 ) — Real estate under development — — 828 3,802 — 4,630 Real estate held for investment — — 6,814 30,315 — 37,129 Available for sale securities — — 57,714 1,798 — 59,512 Other assets, net — 33,581 98,139 37,223 — 168,943
Total Assets $ 3,038,858 $ 4,940,156 $ 5,578,071 $ 3,628,790 $ (9,538,770 ) $ 7,647,105
Current Liabilities: Accounts payable and accrued expenses $ — $ 19,541 $ 257,591 $ 550,398 $ — $ 827,530 Compensation and employee benefits payable — 626 346,663 276,525 — 623,814 Accrued bonus and profit sharing — — 425,329 363,529 — 788,858 Income taxes payable — — 17,337 — (17,337 ) — Short-term borrowings:
Warehouse lines of credit (a) — — 337,184 164,001 — 501,185 Revolving credit facility — — — 4,840 — 4,840 Other — — 16 9 — 25
Total short-term borrowings — — 337,200 168,850 — 506,050 Current maturities of long-term debt — 39,650 2,734 23 — 42,407 Notes payable on real estate — — — 23,229 — 23,229 Other current liabilities — 1,258 58,357 4,131 — 63,746
Total Current Liabilities — 61,075 1,445,211 1,386,685 (17,337 ) 2,875,634 Long-Term Debt:
5.00% senior notes — 800,000 — — — 800,000 Senior secured term loans — 605,963 — — — 605,963 5.25% senior notes — 426,813 — — — 426,813 Other long-term debt — — — 26 — 26 Intercompany loan payable 779,028 — 1,350,424 1,023,763 (3,153,215 ) —
Total Long-Term Debt 779,028 1,832,776 1,350,424 1,023,789 (3,153,215 ) 1,832,802 Notes payable on real estate — — — 19,614 — 19,614 Deferred tax liabilities, net — — 87,486 61,747 — 149,233 Non-current tax liabilities — — 45,936 67 — 46,003 Pension liability — — — 92,923 — 92,923 Other liabilities — 26,895 215,101 87,502 — 329,498
Total Liabilities 779,028 1,920,746 3,144,158 2,672,327 (3,170,552 ) 5,345,707 Commitments and contingencies — — — — — — Equity: CBRE Group, Inc. Stockholders’ Equity 2,259,830 3,019,410 2,433,913 914,895 (6,368,218 ) 2,259,830 Non-controlling interests — — — 41,568 — 41,568
Total Equity 2,259,830 3,019,410 2,433,913 956,463 (6,368,218 ) 2,301,398
Total Liabilities and Equity $ 3,038,858 $ 4,940,156 $ 5,578,071 $ 3,628,790 $ (9,538,770 ) $ 7,647,105
(a) Although CBRE Capital Markets is included among our domestic subsidiaries that jointly and severally guarantee our 5.00% senior notes, 5.25% senior notes and our 2013 Credit
Agreement, a substantial majority of warehouse receivables funded under BofA, JP Morgan, Capital One and Fannie Mae ASAP lines of credit are pledged to BofA, JP Morgan, Capital One and Fannie Mae, and accordingly, are not included as collateral for these notes or our other outstanding debt.
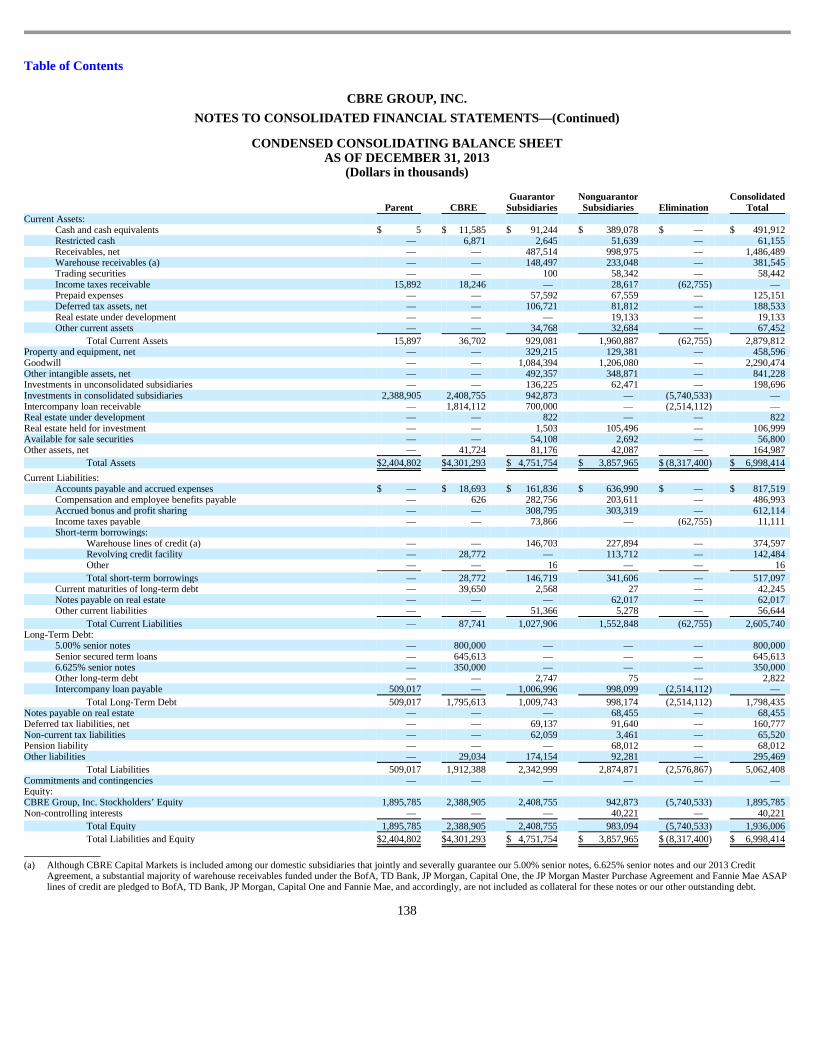
Table of Contents
CBRE GROUP, INC.
NOTES TO CONSOLIDATED FINANCIAL STATEMENTS —(Continued)
CONDENSED CONSOLIDATING BALANCE SHEET AS OF DECEMBER 31, 2013
(Dollars in thousands)
138
Parent CBRE Guarantor
Subsidiaries Nonguarantor Subsidiaries Elimination
Consolidated Total
Current Assets: Cash and cash equivalents $ 5 $ 11,585 $ 91,244 $ 389,078 $ — $ 491,912 Restricted cash — 6,871 2,645 51,639 — 61,155 Receivables, net — — 487,514 998,975 — 1,486,489 Warehouse receivables (a) — — 148,497 233,048 — 381,545 Trading securities — — 100 58,342 — 58,442 Income taxes receivable 15,892 18,246 — 28,617 (62,755 ) — Prepaid expenses — — 57,592 67,559 — 125,151 Deferred tax assets, net — — 106,721 81,812 — 188,533 Real estate under development — — — 19,133 — 19,133 Other current assets — — 34,768 32,684 — 67,452
Total Current Assets 15,897 36,702 929,081 1,960,887 (62,755 ) 2,879,812 Property and equipment, net — — 329,215 129,381 — 458,596 Goodwill — — 1,084,394 1,206,080 — 2,290,474 Other intangible assets, net — — 492,357 348,871 — 841,228 Investments in unconsolidated subsidiaries — — 136,225 62,471 — 198,696 Investments in consolidated subsidiaries 2,388,905 2,408,755 942,873 — (5,740,533 ) — Intercompany loan receivable — 1,814,112 700,000 — (2,514,112 ) — Real estate under development — — 822 — — 822 Real estate held for investment — — 1,503 105,496 — 106,999 Available for sale securities — — 54,108 2,692 — 56,800 Other assets, net — 41,724 81,176 42,087 — 164,987
Total Assets $ 2,404,802 $ 4,301,293 $ 4,751,754 $ 3,857,965 $ (8,317,400 ) $ 6,998,414
Current Liabilities: Accounts payable and accrued expenses $ — $ 18,693 $ 161,836 $ 636,990 $ — $ 817,519 Compensation and employee benefits payable — 626 282,756 203,611 — 486,993 Accrued bonus and profit sharing — — 308,795 303,319 — 612,114 Income taxes payable — — 73,866 — (62,755 ) 11,111 Short-term borrowings:
Warehouse lines of credit (a) — — 146,703 227,894 — 374,597 Revolving credit facility — 28,772 — 113,712 — 142,484 Other — — 16 — — 16
Total short-term borrowings — 28,772 146,719 341,606 — 517,097 Current maturities of long-term debt — 39,650 2,568 27 — 42,245 Notes payable on real estate — — — 62,017 — 62,017 Other current liabilities — — 51,366 5,278 — 56,644
Total Current Liabilities — 87,741 1,027,906 1,552,848 (62,755 ) 2,605,740 Long-Term Debt:
5.00% senior notes — 800,000 — — — 800,000 Senior secured term loans — 645,613 — — — 645,613 6.625% senior notes — 350,000 — — — 350,000 Other long-term debt — — 2,747 75 — 2,822 Intercompany loan payable 509,017 — 1,006,996 998,099 (2,514,112 ) —
Total Long-Term Debt 509,017 1,795,613 1,009,743 998,174 (2,514,112 ) 1,798,435 Notes payable on real estate — — — 68,455 — 68,455 Deferred tax liabilities, net — — 69,137 91,640 — 160,777 Non-current tax liabilities — — 62,059 3,461 — 65,520 Pension liability — — — 68,012 — 68,012 Other liabilities — 29,034 174,154 92,281 — 295,469
Total Liabilities 509,017 1,912,388 2,342,999 2,874,871 (2,576,867 ) 5,062,408 Commitments and contingencies — — — — — — Equity: CBRE Group, Inc. Stockholders’ Equity 1,895,785 2,388,905 2,408,755 942,873 (5,740,533 ) 1,895,785 Non-controlling interests — — — 40,221 — 40,221
Total Equity 1,895,785 2,388,905 2,408,755 983,094 (5,740,533 ) 1,936,006
Total Liabilities and Equity $ 2,404,802 $ 4,301,293 $ 4,751,754 $ 3,857,965 $ (8,317,400 ) $ 6,998,414
(a) Although CBRE Capital Markets is included among our domestic subsidiaries that jointly and severally guarantee our 5.00% senior notes, 6.625% senior notes and our 2013 Credit
Agreement, a substantial majority of warehouse receivables funded under the BofA, TD Bank, JP Morgan, Capital One, the JP Morgan Master Purchase Agreement and Fannie Mae ASAP lines of credit are pledged to BofA, TD Bank, JP Morgan, Capital One and Fannie Mae, and accordingly, are not included as collateral for these notes or our other outstanding debt.
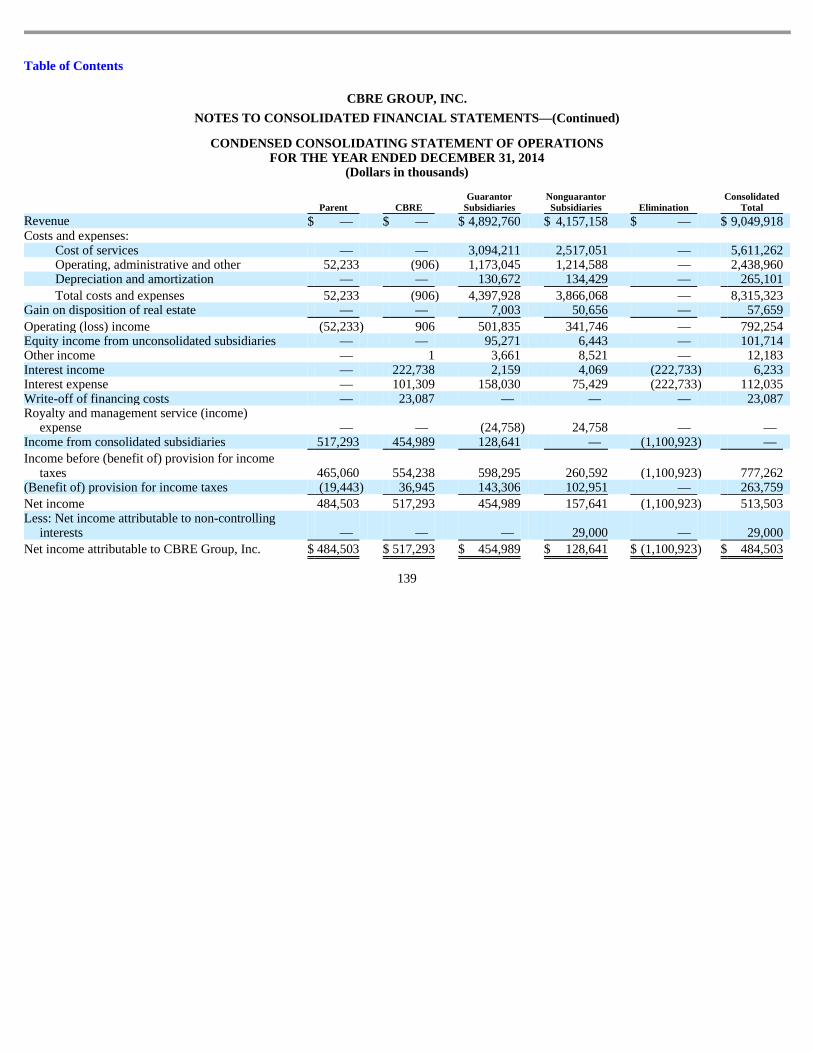
Table of Contents
CBRE GROUP, INC.
NOTES TO CONSOLIDATED FINANCIAL STATEMENTS —(Continued)
CONDENSED CONSOLIDATING STATEMENT OF OPERATIONS FOR THE YEAR ENDED DECEMBER 31, 2014
(Dollars in thousands)
139
Parent CBRE Guarantor
Subsidiaries Nonguarantor Subsidiaries Elimination
Consolidated Total
Revenue $ — $ — $ 4,892,760 $ 4,157,158 $ — $ 9,049,918 Costs and expenses:
Cost of services — — 3,094,211 2,517,051 — 5,611,262 Operating, administrative and other 52,233 (906 ) 1,173,045 1,214,588 — 2,438,960 Depreciation and amortization — — 130,672 134,429 — 265,101
Total costs and expenses 52,233 (906 ) 4,397,928 3,866,068 — 8,315,323 Gain on disposition of real estate — — 7,003 50,656 — 57,659
Operating (loss) income (52,233 ) 906 501,835 341,746 — 792,254 Equity income from unconsolidated subsidiaries — — 95,271 6,443 — 101,714 Other income — 1 3,661 8,521 — 12,183 Interest income — 222,738 2,159 4,069 (222,733 ) 6,233 Interest expense — 101,309 158,030 75,429 (222,733 ) 112,035 Write-off of financing costs — 23,087 — — — 23,087 Royalty and management service (income)
expense — — (24,758 ) 24,758 — — Income from consolidated subsidiaries 517,293 454,989 128,641 — (1,100,923 ) —
Income before (benefit of) provision for income taxes 465,060 554,238 598,295 260,592 (1,100,923 ) 777,262
(Benefit of) provision for income taxes (19,443 ) 36,945 143,306 102,951 — 263,759
Net income 484,503 517,293 454,989 157,641 (1,100,923 ) 513,503 Less: Net income attributable to non-controlling
interests — — — 29,000 — 29,000
Net income attributable to CBRE Group, Inc. $ 484,503 $ 517,293 $ 454,989 $ 128,641 $ (1,100,923 ) $ 484,503
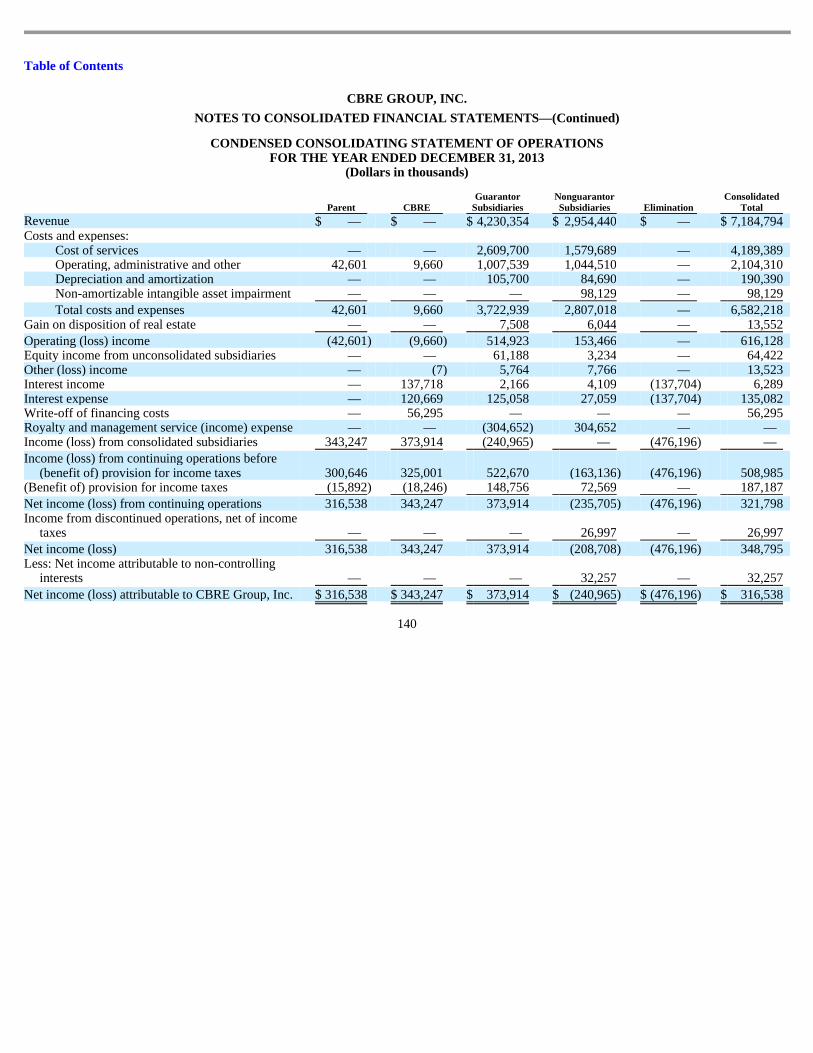
Table of Contents
CBRE GROUP, INC.
NOTES TO CONSOLIDATED FINANCIAL STATEMENTS —(Continued)
CONDENSED CONSOLIDATING STATEMENT OF OPERATIONS FOR THE YEAR ENDED DECEMBER 31, 2013
(Dollars in thousands)
140
Parent CBRE Guarantor
Subsidiaries Nonguarantor Subsidiaries Elimination
Consolidated Total
Revenue $ — $ — $ 4,230,354 $ 2,954,440 $ — $ 7,184,794 Costs and expenses:
Cost of services — — 2,609,700 1,579,689 — 4,189,389 Operating, administrative and other 42,601 9,660 1,007,539 1,044,510 — 2,104,310 Depreciation and amortization — — 105,700 84,690 — 190,390 Non-amortizable intangible asset impairment — — — 98,129 — 98,129
Total costs and expenses 42,601 9,660 3,722,939 2,807,018 — 6,582,218 Gain on disposition of real estate — — 7,508 6,044 — 13,552
Operating (loss) income (42,601 ) (9,660 ) 514,923 153,466 — 616,128 Equity income from unconsolidated subsidiaries — — 61,188 3,234 — 64,422 Other (loss) income — (7 ) 5,764 7,766 — 13,523 Interest income — 137,718 2,166 4,109 (137,704 ) 6,289 Interest expense — 120,669 125,058 27,059 (137,704 ) 135,082 Write-off of financing costs — 56,295 — — — 56,295 Royalty and management service (income) expense — — (304,652 ) 304,652 — — Income (loss) from consolidated subsidiaries 343,247 373,914 (240,965 ) — (476,196 ) —
Income (loss) from continuing operations before (benefit of) provision for income taxes 300,646 325,001 522,670 (163,136 ) (476,196 ) 508,985
(Benefit of) provision for income taxes (15,892 ) (18,246 ) 148,756 72,569 — 187,187
Net income (loss) from continuing operations 316,538 343,247 373,914 (235,705 ) (476,196 ) 321,798 Income from discontinued operations, net of income
taxes — — — 26,997 — 26,997
Net income (loss) 316,538 343,247 373,914 (208,708 ) (476,196 ) 348,795 Less: Net income attributable to non-controlling
interests — — — 32,257 — 32,257
Net income (loss) attributable to CBRE Group, Inc. $ 316,538 $ 343,247 $ 373,914 $ (240,965 ) $ (476,196 ) $ 316,538
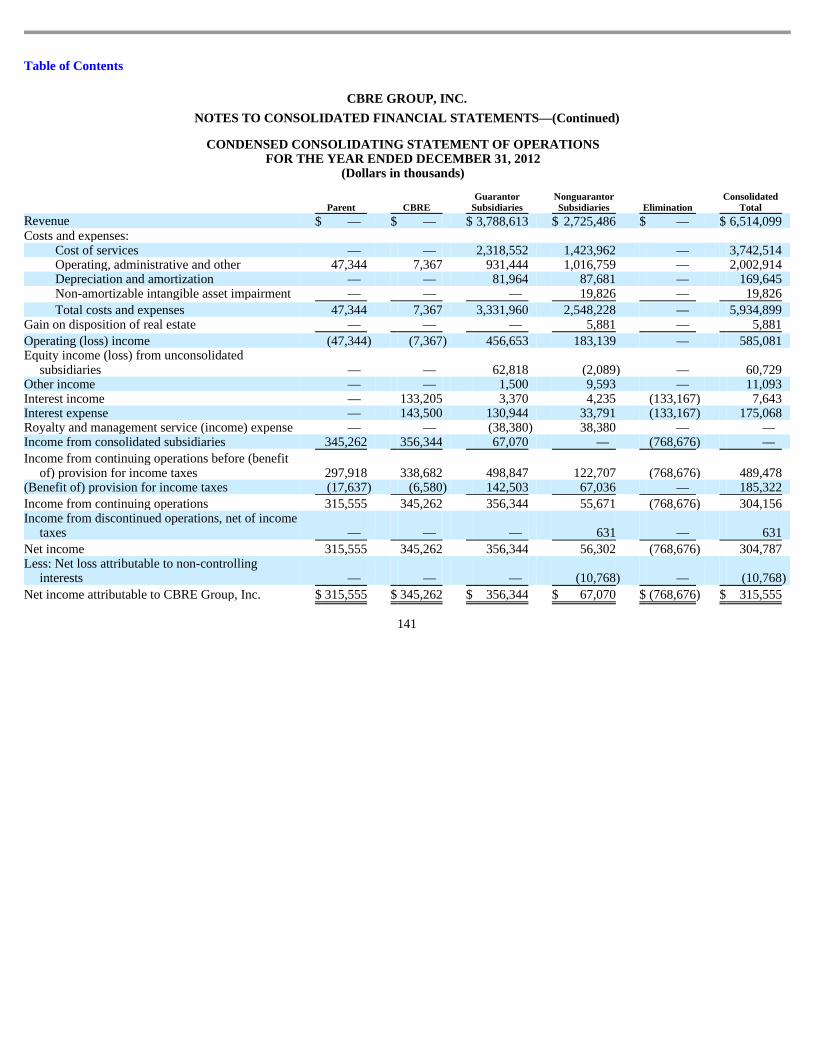
Table of Contents
CBRE GROUP, INC.
NOTES TO CONSOLIDATED FINANCIAL STATEMENTS —(Continued)
141
CONDENSED CONSOLIDATING STATEMENT OF OPERATIONS FOR THE YEAR ENDED DECEMBER 31, 2012
(Dollars in thousands)
Parent CBRE Guarantor
Subsidiaries Nonguarantor Subsidiaries Elimination
Consolidated Total
Revenue $ — $ — $ 3,788,613 $ 2,725,486 $ — $ 6,514,099 Costs and expenses:
Cost of services — — 2,318,552 1,423,962 — 3,742,514 Operating, administrative and other 47,344 7,367 931,444 1,016,759 — 2,002,914 Depreciation and amortization — — 81,964 87,681 — 169,645 Non-amortizable intangible asset impairment — — — 19,826 — 19,826
Total costs and expenses 47,344 7,367 3,331,960 2,548,228 — 5,934,899 Gain on disposition of real estate — — — 5,881 — 5,881
Operating (loss) income (47,344 ) (7,367 ) 456,653 183,139 — 585,081 Equity income (loss) from unconsolidated
subsidiaries — — 62,818 (2,089 ) — 60,729 Other income — — 1,500 9,593 — 11,093 Interest income — 133,205 3,370 4,235 (133,167 ) 7,643 Interest expense — 143,500 130,944 33,791 (133,167 ) 175,068 Royalty and management service (income) expense — — (38,380 ) 38,380 — — Income from consolidated subsidiaries 345,262 356,344 67,070 — (768,676 ) —
Income from continuing operations before (benefit of) provision for income taxes 297,918 338,682 498,847 122,707 (768,676 ) 489,478
(Benefit of) provision for income taxes (17,637 ) (6,580 ) 142,503 67,036 — 185,322
Income from continuing operations 315,555 345,262 356,344 55,671 (768,676 ) 304,156 Income from discontinued operations, net of income
taxes — — — 631 — 631
Net income 315,555 345,262 356,344 56,302 (768,676 ) 304,787 Less: Net loss attributable to non-controlling
interests — — — (10,768 ) — (10,768 )
Net income attributable to CBRE Group, Inc. $ 315,555 $ 345,262 $ 356,344 $ 67,070 $ (768,676 ) $ 315,555
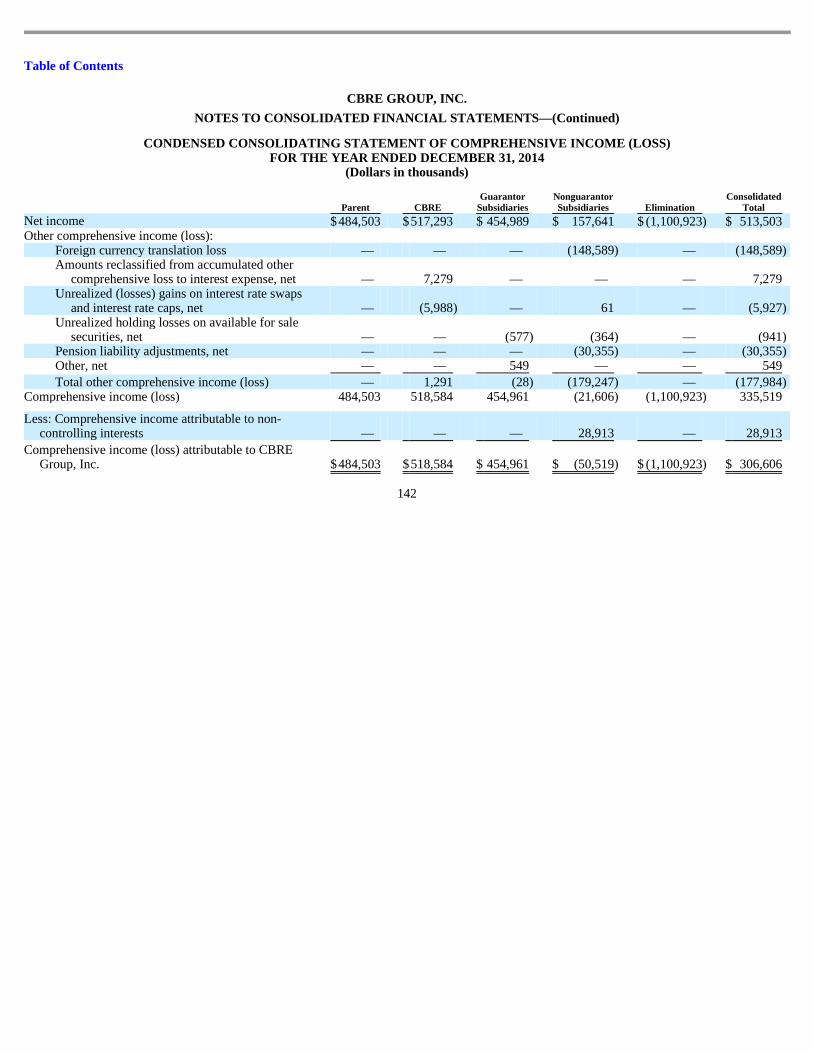
Table of Contents
CBRE GROUP, INC.
NOTES TO CONSOLIDATED FINANCIAL STATEMENTS —(Continued)
CONDENSED CONSOLIDATING STATEMENT OF COMPREHENSIVE INCOME (LOSS) FOR THE YEAR ENDED DECEMBER 31, 2014
(Dollars in thousands)
142
Parent CBRE Guarantor
Subsidiaries Nonguarantor Subsidiaries Elimination
Consolidated Total
Net income $ 484,503 $ 517,293 $ 454,989 $ 157,641 $ (1,100,923 ) $ 513,503 Other comprehensive income (loss):
Foreign currency translation loss — — — (148,589 ) — (148,589 ) Amounts reclassified from accumulated other
comprehensive loss to interest expense, net — 7,279 — — — 7,279 Unrealized (losses) gains on interest rate swaps
and interest rate caps, net — (5,988 ) — 61 — (5,927 ) Unrealized holding losses on available for sale
securities, net — — (577 ) (364 ) — (941 ) Pension liability adjustments, net — — — (30,355 ) — (30,355 ) Other, net — — 549 — — 549
Total other comprehensive income (loss) — 1,291 (28 ) (179,247 ) — (177,984 ) Comprehensive income (loss) 484,503 518,584 454,961 (21,606 ) (1,100,923 ) 335,519
Less: Comprehensive income attributable to non-controlling interests — — — 28,913 — 28,913
Comprehensive income (loss) attributable to CBRE Group, Inc. $ 484,503 $ 518,584 $ 454,961 $ (50,519 ) $ (1,100,923 ) $ 306,606
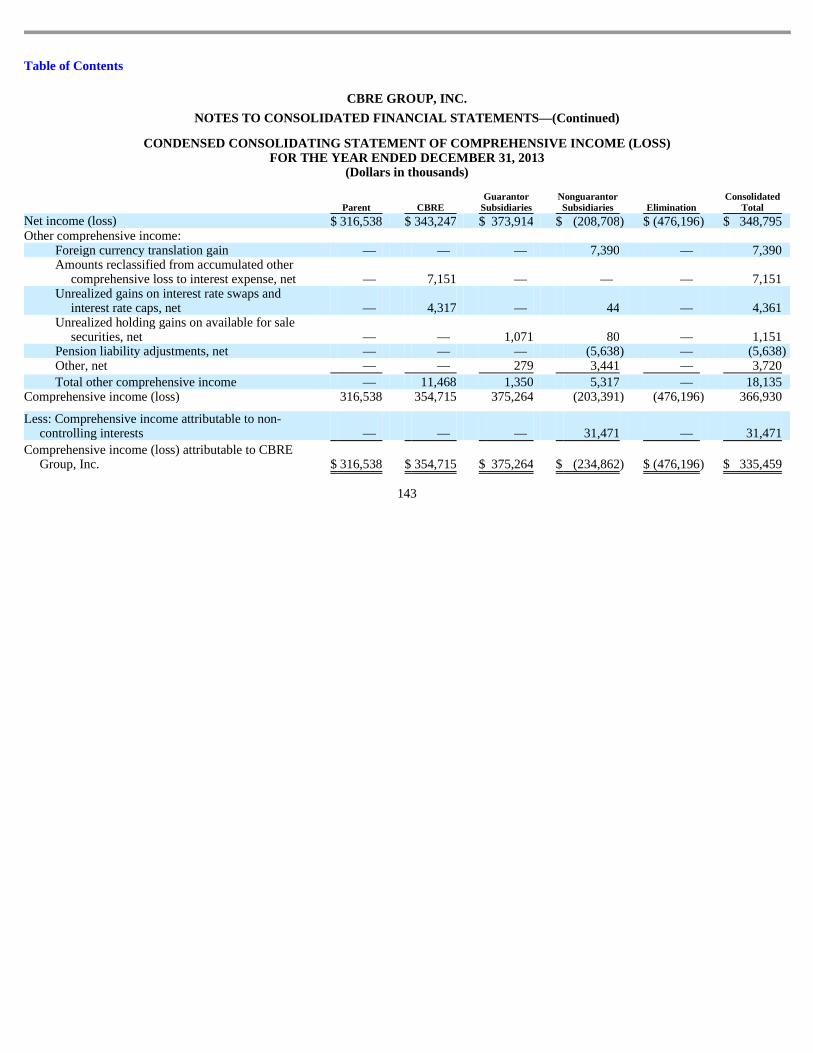
Table of Contents
CBRE GROUP, INC.
NOTES TO CONSOLIDATED FINANCIAL STATEMENTS —(Continued)
CONDENSED CONSOLIDATING STATEMENT OF COMPREHENSIVE INCOME (LOSS) FOR THE YEAR ENDED DECEMBER 31, 2013
(Dollars in thousands)
143
Parent CBRE Guarantor
Subsidiaries Nonguarantor Subsidiaries Elimination
Consolidated Total
Net income (loss) $ 316,538 $ 343,247 $ 373,914 $ (208,708 ) $ (476,196 ) $ 348,795 Other comprehensive income:
Foreign currency translation gain — — — 7,390 — 7,390 Amounts reclassified from accumulated other
comprehensive loss to interest expense, net — 7,151 — — — 7,151 Unrealized gains on interest rate swaps and
interest rate caps, net — 4,317 — 44 — 4,361 Unrealized holding gains on available for sale
securities, net — — 1,071 80 — 1,151 Pension liability adjustments, net — — — (5,638 ) — (5,638 ) Other, net — — 279 3,441 — 3,720
Total other comprehensive income — 11,468 1,350 5,317 — 18,135 Comprehensive income (loss) 316,538 354,715 375,264 (203,391 ) (476,196 ) 366,930
Less: Comprehensive income attributable to non-controlling interests — — — 31,471 — 31,471
Comprehensive income (loss) attributable to CBRE Group, Inc. $ 316,538 $ 354,715 $ 375,264 $ (234,862 ) $ (476,196 ) $ 335,459
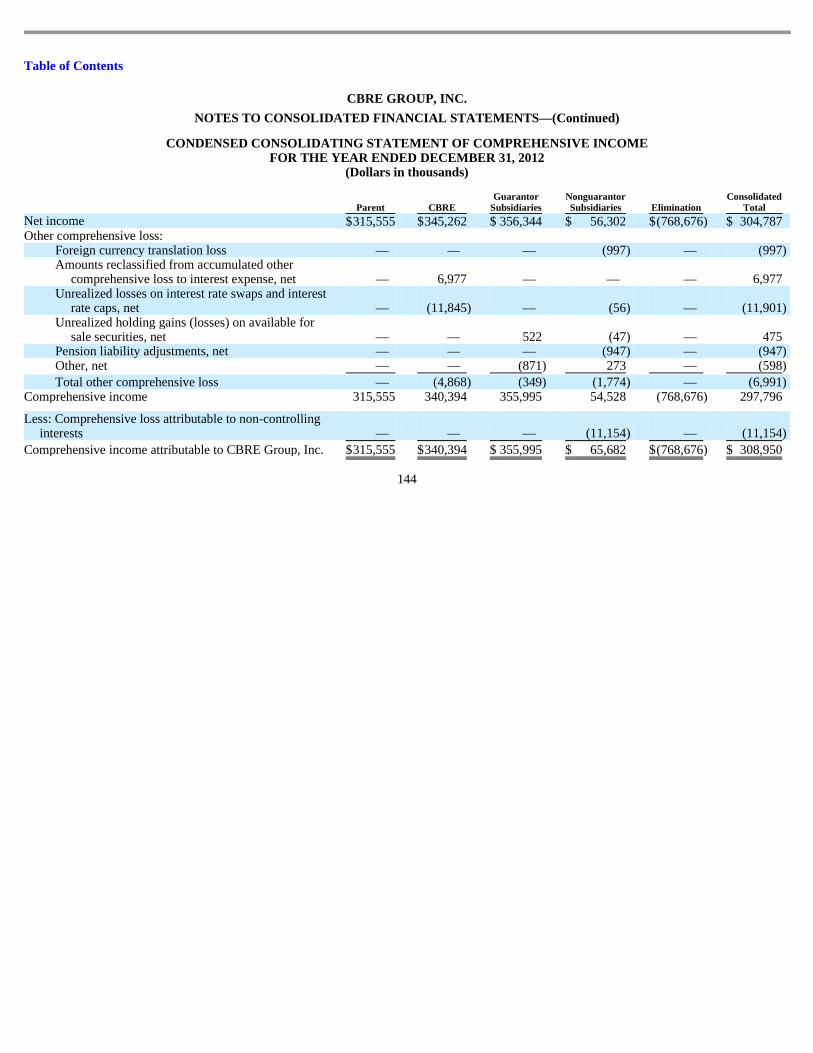
Table of Contents
CBRE GROUP, INC.
NOTES TO CONSOLIDATED FINANCIAL STATEMENTS —(Continued)
CONDENSED CONSOLIDATING STATEMENT OF COMPREHENSIVE INCOME FOR THE YEAR ENDED DECEMBER 31, 2012
(Dollars in thousands)
144
Parent CBRE Guarantor
Subsidiaries Nonguarantor Subsidiaries Elimination
Consolidated Total
Net income $ 315,555 $ 345,262 $ 356,344 $ 56,302 $ (768,676 ) $ 304,787 Other comprehensive loss:
Foreign currency translation loss — — — (997 ) — (997 ) Amounts reclassified from accumulated other
comprehensive loss to interest expense, net — 6,977 — — — 6,977 Unrealized losses on interest rate swaps and interest
rate caps, net — (11,845 ) — (56 ) — (11,901 ) Unrealized holding gains (losses) on available for
sale securities, net — — 522 (47 ) — 475 Pension liability adjustments, net — — — (947 ) — (947 ) Other, net — — (871 ) 273 — (598 )
Total other comprehensive loss — (4,868 ) (349 ) (1,774 ) — (6,991 ) Comprehensive income 315,555 340,394 355,995 54,528 (768,676 ) 297,796
Less: Comprehensive loss attributable to non-controlling interests — — — (11,154 ) — (11,154 )
Comprehensive income attributable to CBRE Group, Inc. $ 315,555 $ 340,394 $ 355,995 $ 65,682 $ (768,676 ) $ 308,950
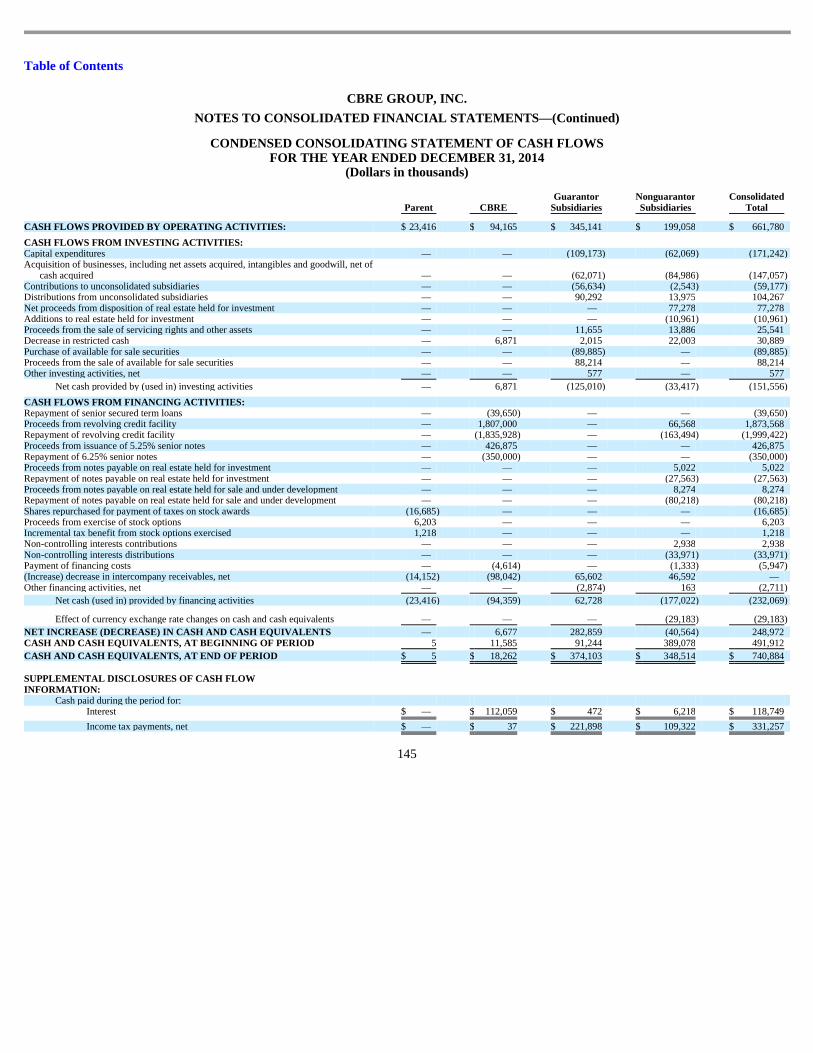
Table of Contents
CBRE GROUP, INC.
NOTES TO CONSOLIDATED FINANCIAL STATEMENTS —(Continued)
CONDENSED CONSOLIDATING STATEMENT OF CASH FLOWS FOR THE YEAR ENDED DECEMBER 31, 2014
(Dollars in thousands)
145
Parent CBRE Guarantor
Subsidiaries Nonguarantor Subsidiaries
Consolidated Total
CASH FLOWS PROVIDED BY OPERATING ACTIVITIES: $ 23,416 $ 94,165 $ 345,141 $ 199,058 $ 661,780
CASH FLOWS FROM INVESTING ACTIVITIES: Capital expenditures — — (109,173 ) (62,069 ) (171,242 ) Acquisition of businesses, including net assets acquired, intangibles and goodwill, net of
cash acquired — — (62,071 ) (84,986 ) (147,057 ) Contributions to unconsolidated subsidiaries — — (56,634 ) (2,543 ) (59,177 ) Distributions from unconsolidated subsidiaries — — 90,292 13,975 104,267 Net proceeds from disposition of real estate held for investment — — — 77,278 77,278 Additions to real estate held for investment — — — (10,961 ) (10,961 ) Proceeds from the sale of servicing rights and other assets — — 11,655 13,886 25,541 Decrease in restricted cash — 6,871 2,015 22,003 30,889 Purchase of available for sale securities — — (89,885 ) — (89,885 ) Proceeds from the sale of available for sale securities — — 88,214 — 88,214 Other investing activities, net — — 577 — 577
Net cash provided by (used in) investing activities — 6,871 (125,010 ) (33,417 ) (151,556 )
CASH FLOWS FROM FINANCING ACTIVITIES: Repayment of senior secured term loans — (39,650 ) — — (39,650 ) Proceeds from revolving credit facility — 1,807,000 — 66,568 1,873,568 Repayment of revolving credit facility — (1,835,928 ) — (163,494 ) (1,999,422 ) Proceeds from issuance of 5.25% senior notes — 426,875 — — 426,875 Repayment of 6.25% senior notes — (350,000 ) — — (350,000 ) Proceeds from notes payable on real estate held for investment — — — 5,022 5,022 Repayment of notes payable on real estate held for investment — — — (27,563 ) (27,563 ) Proceeds from notes payable on real estate held for sale and under development — — — 8,274 8,274 Repayment of notes payable on real estate held for sale and under development — — — (80,218 ) (80,218 ) Shares repurchased for payment of taxes on stock awards (16,685 ) — — — (16,685 ) Proceeds from exercise of stock options 6,203 — — — 6,203 Incremental tax benefit from stock options exercised 1,218 — — — 1,218 Non-controlling interests contributions — — — 2,938 2,938 Non-controlling interests distributions — — — (33,971 ) (33,971 ) Payment of financing costs — (4,614 ) — (1,333 ) (5,947 ) (Increase) decrease in intercompany receivables, net (14,152 ) (98,042 ) 65,602 46,592 — Other financing activities, net — — (2,874 ) 163 (2,711 )
Net cash (used in) provided by financing activities (23,416 ) (94,359 ) 62,728 (177,022 ) (232,069 )
Effect of currency exchange rate changes on cash and cash equivalents — — — (29,183 ) (29,183 )
NET INCREASE (DECREASE) IN CASH AND CASH EQUIVALENT S — 6,677 282,859 (40,564 ) 248,972 CASH AND CASH EQUIVALENTS, AT BEGINNING OF PERIOD 5 11,585 91,244 389,078 491,912
CASH AND CASH EQUIVALENTS, AT END OF PERIOD $ 5 $ 18,262 $ 374,103 $ 348,514 $ 740,884
SUPPLEMENTAL DISCLOSURES OF CASH FLOW INFORMATION:
Cash paid during the period for: Interest $ — $ 112,059 $ 472 $ 6,218 $ 118,749
Income tax payments, net $ — $ 37 $ 221,898 $ 109,322 $ 331,257
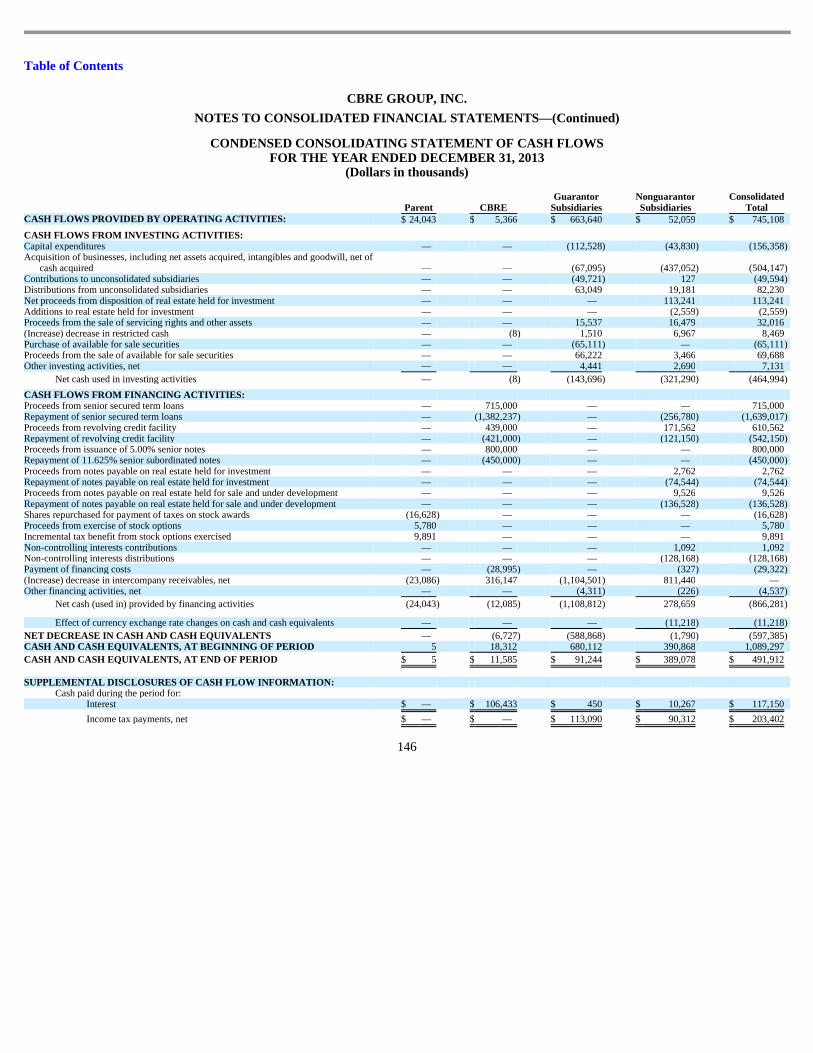
Table of Contents
CBRE GROUP, INC.
NOTES TO CONSOLIDATED FINANCIAL STATEMENTS —(Continued)
CONDENSED CONSOLIDATING STATEMENT OF CASH FLOWS FOR THE YEAR ENDED DECEMBER 31, 2013
(Dollars in thousands)
146
Parent CBRE Guarantor
Subsidiaries Nonguarantor Subsidiaries
Consolidated Total
CASH FLOWS PROVIDED BY OPERATING ACTIVITIES: $ 24,043 $ 5,366 $ 663,640 $ 52,059 $ 745,108
CASH FLOWS FROM INVESTING ACTIVITIES: Capital expenditures — — (112,528 ) (43,830 ) (156,358 ) Acquisition of businesses, including net assets acquired, intangibles and goodwill, net of
cash acquired — — (67,095 ) (437,052 ) (504,147 ) Contributions to unconsolidated subsidiaries — — (49,721 ) 127 (49,594 ) Distributions from unconsolidated subsidiaries — — 63,049 19,181 82,230 Net proceeds from disposition of real estate held for investment — — — 113,241 113,241 Additions to real estate held for investment — — — (2,559 ) (2,559 ) Proceeds from the sale of servicing rights and other assets — — 15,537 16,479 32,016 (Increase) decrease in restricted cash — (8 ) 1,510 6,967 8,469 Purchase of available for sale securities — — (65,111 ) — (65,111 ) Proceeds from the sale of available for sale securities — — 66,222 3,466 69,688 Other investing activities, net — — 4,441 2,690 7,131
Net cash used in investing activities — (8 ) (143,696 ) (321,290 ) (464,994 )
CASH FLOWS FROM FINANCING ACTIVITIES: Proceeds from senior secured term loans — 715,000 — — 715,000 Repayment of senior secured term loans — (1,382,237 ) — (256,780 ) (1,639,017 ) Proceeds from revolving credit facility — 439,000 — 171,562 610,562 Repayment of revolving credit facility — (421,000 ) — (121,150 ) (542,150 ) Proceeds from issuance of 5.00% senior notes — 800,000 — — 800,000 Repayment of 11.625% senior subordinated notes — (450,000 ) — — (450,000 ) Proceeds from notes payable on real estate held for investment — — — 2,762 2,762 Repayment of notes payable on real estate held for investment — — — (74,544 ) (74,544 ) Proceeds from notes payable on real estate held for sale and under development — — — 9,526 9,526 Repayment of notes payable on real estate held for sale and under development — — — (136,528 ) (136,528 ) Shares repurchased for payment of taxes on stock awards (16,628 ) — — — (16,628 ) Proceeds from exercise of stock options 5,780 — — — 5,780 Incremental tax benefit from stock options exercised 9,891 — — — 9,891 Non-controlling interests contributions — — — 1,092 1,092 Non-controlling interests distributions — — — (128,168 ) (128,168 ) Payment of financing costs — (28,995 ) — (327 ) (29,322 ) (Increase) decrease in intercompany receivables, net (23,086 ) 316,147 (1,104,501 ) 811,440 — Other financing activities, net — — (4,311 ) (226 ) (4,537 )
Net cash (used in) provided by financing activities (24,043 ) (12,085 ) (1,108,812 ) 278,659 (866,281 )
Effect of currency exchange rate changes on cash and cash equivalents — — — (11,218 ) (11,218 )
NET DECREASE IN CASH AND CASH EQUIVALENTS — (6,727 ) (588,868 ) (1,790 ) (597,385 ) CASH AND CASH EQUIVALENTS, AT BEGINNING OF PERIOD 5 18,312 680,112 390,868 1,089,297
CASH AND CASH EQUIVALENTS, AT END OF PERIOD $ 5 $ 11,585 $ 91,244 $ 389,078 $ 491,912
SUPPLEMENTAL DISCLOSURES OF CASH FLOW INFORMATION: Cash paid during the period for:
Interest $ — $ 106,433 $ 450 $ 10,267 $ 117,150
Income tax payments, net $ — $ — $ 113,090 $ 90,312 $ 203,402
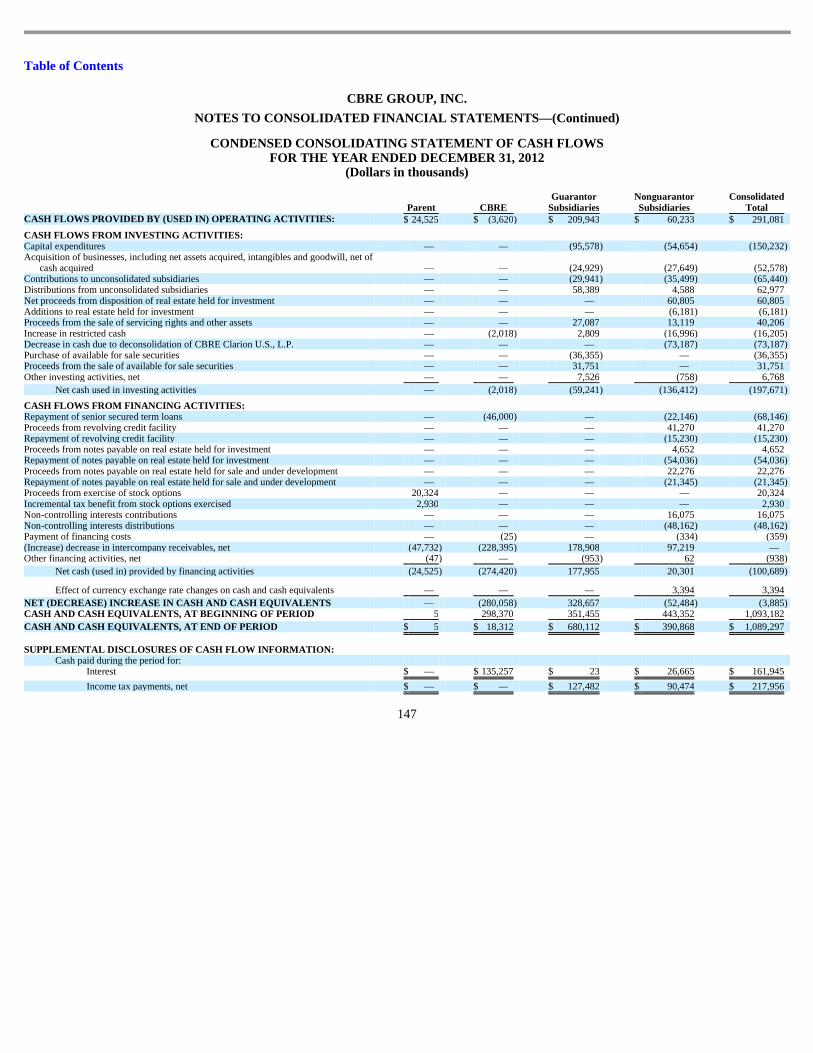
Table of Contents
CBRE GROUP, INC.
NOTES TO CONSOLIDATED FINANCIAL STATEMENTS —(Continued)
CONDENSED CONSOLIDATING STATEMENT OF CASH FLOWS FOR THE YEAR ENDED DECEMBER 31, 2012
(Dollars in thousands)
147
Parent CBRE Guarantor
Subsidiaries Nonguarantor Subsidiaries
Consolidated Total
CASH FLOWS PROVIDED BY (USED IN) OPERATING ACTIVITI ES: $ 24,525 $ (3,620 ) $ 209,943 $ 60,233 $ 291,081
CASH FLOWS FROM INVESTING ACTIVITIES: Capital expenditures — — (95,578 ) (54,654 ) (150,232 ) Acquisition of businesses, including net assets acquired, intangibles and goodwill, net of
cash acquired — — (24,929 ) (27,649 ) (52,578 ) Contributions to unconsolidated subsidiaries — — (29,941 ) (35,499 ) (65,440 ) Distributions from unconsolidated subsidiaries — — 58,389 4,588 62,977 Net proceeds from disposition of real estate held for investment — — — 60,805 60,805 Additions to real estate held for investment — — — (6,181 ) (6,181 ) Proceeds from the sale of servicing rights and other assets — — 27,087 13,119 40,206 Increase in restricted cash — (2,018 ) 2,809 (16,996 ) (16,205 ) Decrease in cash due to deconsolidation of CBRE Clarion U.S., L.P. — — — (73,187 ) (73,187 ) Purchase of available for sale securities — — (36,355 ) — (36,355 ) Proceeds from the sale of available for sale securities — — 31,751 — 31,751 Other investing activities, net — — 7,526 (758 ) 6,768
Net cash used in investing activities — (2,018 ) (59,241 ) (136,412 ) (197,671 )
CASH FLOWS FROM FINANCING ACTIVITIES: Repayment of senior secured term loans — (46,000 ) — (22,146 ) (68,146 ) Proceeds from revolving credit facility — — — 41,270 41,270 Repayment of revolving credit facility — — — (15,230 ) (15,230 ) Proceeds from notes payable on real estate held for investment — — — 4,652 4,652 Repayment of notes payable on real estate held for investment — — — (54,036 ) (54,036 ) Proceeds from notes payable on real estate held for sale and under development — — — 22,276 22,276 Repayment of notes payable on real estate held for sale and under development — — — (21,345 ) (21,345 ) Proceeds from exercise of stock options 20,324 — — — 20,324 Incremental tax benefit from stock options exercised 2,930 — — — 2,930 Non-controlling interests contributions — — — 16,075 16,075 Non-controlling interests distributions — — — (48,162 ) (48,162 ) Payment of financing costs — (25 ) — (334 ) (359 ) (Increase) decrease in intercompany receivables, net (47,732 ) (228,395 ) 178,908 97,219 — Other financing activities, net (47 ) — (953 ) 62 (938 )
Net cash (used in) provided by financing activities (24,525 ) (274,420 ) 177,955 20,301 (100,689 )
Effect of currency exchange rate changes on cash and cash equivalents — — — 3,394 3,394
NET (DECREASE) INCREASE IN CASH AND CASH EQUIVALENT S — (280,058 ) 328,657 (52,484 ) (3,885 ) CASH AND CASH EQUIVALENTS, AT BEGINNING OF PERIOD 5 298,370 351,455 443,352 1,093,182
CASH AND CASH EQUIVALENTS, AT END OF PERIOD $ 5 $ 18,312 $ 680,112 $ 390,868 $ 1,089,297
SUPPLEMENTAL DISCLOSURES OF CASH FLOW INFORMATION: Cash paid during the period for:
Interest $ — $ 135,257 $ 23 $ 26,665 $ 161,945
Income tax payments, net $ — $ — $ 127,482 $ 90,474 $ 217,956
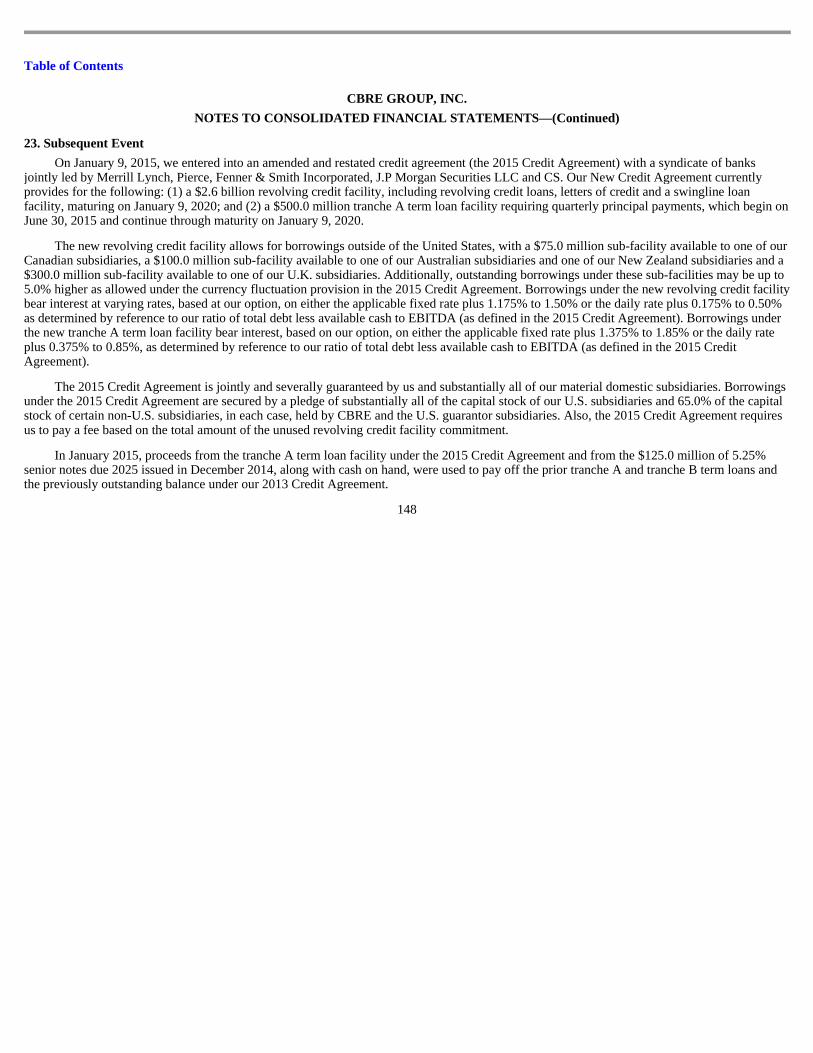
Table of Contents
CBRE GROUP, INC.
NOTES TO CONSOLIDATED FINANCIAL STATEMENTS —(Continued) 23. Subsequent Event
On January 9, 2015, we entered into an amended and restated credit agreement (the 2015 Credit Agreement) with a syndicate of banks jointly led by Merrill Lynch, Pierce, Fenner & Smith Incorporated, J.P Morgan Securities LLC and CS. Our New Credit Agreement currently provides for the following: (1) a $2.6 billion revolving credit facility, including revolving credit loans, letters of credit and a swingline loan facility, maturing on January 9, 2020; and (2) a $500.0 million tranche A term loan facility requiring quarterly principal payments, which begin on June 30, 2015 and continue through maturity on January 9, 2020.
The new revolving credit facility allows for borrowings outside of the United States, with a $75.0 million sub-facility available to one of our Canadian subsidiaries, a $100.0 million sub-facility available to one of our Australian subsidiaries and one of our New Zealand subsidiaries and a $300.0 million sub-facility available to one of our U.K. subsidiaries. Additionally, outstanding borrowings under these sub-facilities may be up to 5.0% higher as allowed under the currency fluctuation provision in the 2015 Credit Agreement. Borrowings under the new revolving credit facility bear interest at varying rates, based at our option, on either the applicable fixed rate plus 1.175% to 1.50% or the daily rate plus 0.175% to 0.50% as determined by reference to our ratio of total debt less available cash to EBITDA (as defined in the 2015 Credit Agreement). Borrowings under the new tranche A term loan facility bear interest, based on our option, on either the applicable fixed rate plus 1.375% to 1.85% or the daily rate plus 0.375% to 0.85%, as determined by reference to our ratio of total debt less available cash to EBITDA (as defined in the 2015 Credit Agreement).
The 2015 Credit Agreement is jointly and severally guaranteed by us and substantially all of our material domestic subsidiaries. Borrowings under the 2015 Credit Agreement are secured by a pledge of substantially all of the capital stock of our U.S. subsidiaries and 65.0% of the capital stock of certain non-U.S. subsidiaries, in each case, held by CBRE and the U.S. guarantor subsidiaries. Also, the 2015 Credit Agreement requires us to pay a fee based on the total amount of the unused revolving credit facility commitment.
In January 2015, proceeds from the tranche A term loan facility under the 2015 Credit Agreement and from the $125.0 million of 5.25% senior notes due 2025 issued in December 2014, along with cash on hand, were used to pay off the prior tranche A and tranche B term loans and the previously outstanding balance under our 2013 Credit Agreement.
148
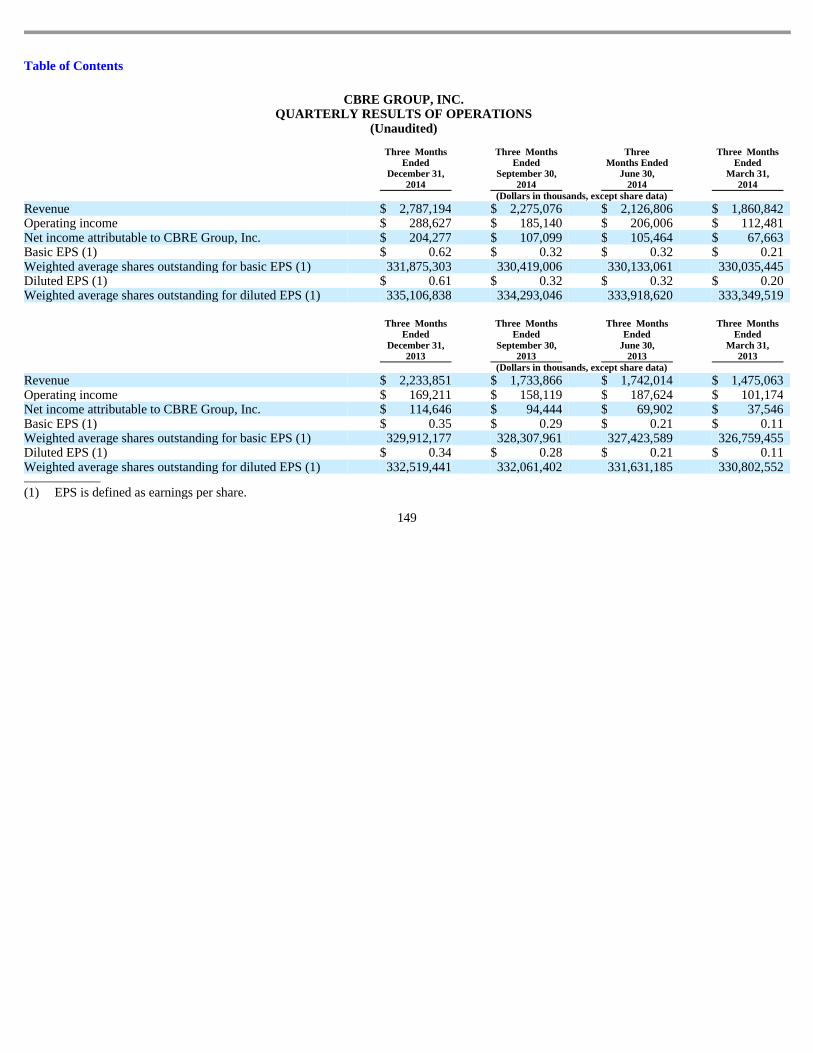
Table of Contents
149
CBRE GROUP, INC. QUARTERLY RESULTS OF OPERATIONS
(Unaudited)
Three Months Ended
December 31, 2014
Three Months Ended
September 30, 2014
Three Months Ended
June 30, 2014
Three Months Ended
March 31, 2014
(Dollars in thousands, except share data) Revenue $ 2,787,194 $ 2,275,076 $ 2,126,806 $ 1,860,842 Operating income $ 288,627 $ 185,140 $ 206,006 $ 112,481 Net income attributable to CBRE Group, Inc. $ 204,277 $ 107,099 $ 105,464 $ 67,663 Basic EPS (1) $ 0.62 $ 0.32 $ 0.32 $ 0.21 Weighted average shares outstanding for basic EPS (1) 331,875,303 330,419,006 330,133,061 330,035,445 Diluted EPS (1) $ 0.61 $ 0.32 $ 0.32 $ 0.20 Weighted average shares outstanding for diluted EPS (1) 335,106,838 334,293,046 333,918,620 333,349,519
Three Months Ended
December 31, 2013
Three Months Ended
September 30, 2013
Three Months Ended
June 30, 2013
Three Months Ended
March 31, 2013
(Dollars in thousands, except share data) Revenue $ 2,233,851 $ 1,733,866 $ 1,742,014 $ 1,475,063 Operating income $ 169,211 $ 158,119 $ 187,624 $ 101,174 Net income attributable to CBRE Group, Inc. $ 114,646 $ 94,444 $ 69,902 $ 37,546 Basic EPS (1) $ 0.35 $ 0.29 $ 0.21 $ 0.11 Weighted average shares outstanding for basic EPS (1) 329,912,177 328,307,961 327,423,589 326,759,455 Diluted EPS (1) $ 0.34 $ 0.28 $ 0.21 $ 0.11 Weighted average shares outstanding for diluted EPS (1) 332,519,441 332,061,402 331,631,185 330,802,552 (1) EPS is defined as earnings per share.
Table of Contents
Item 9. Changes in and Disagreements with Accountants on Accounting and Financial Disclosure
Not applicable. Item 9A. Controls and Procedures Management’s Report on Internal Control Over Financial Reporting
Our management is responsible for establishing and maintaining adequate internal control over financial reporting, as such term is defined in Securities Exchange Act Rules 13a-15(f), including maintenance of (i) records that in reasonable detail accurately and fairly reflect the transactions and dispositions of our assets, and (ii) policies and procedures that provide reasonable assurance that (a) transactions are recorded as necessary to permit preparation of financial statements in accordance with accounting principles generally accepted in the United States of America, (b) our receipts and expenditures are being made only in accordance with authorizations of management and our Board of Directors and (c) we will prevent or timely detect unauthorized acquisition, use, or disposition of our assets that could have a material effect on the financial statements.
Internal control over financial reporting cannot provide absolute assurance of achieving financial reporting objectives because of the inherent limitations of any system of internal control. Internal control over financial reporting is a process that involves human diligence and compliance and is subject to lapses of judgment and breakdowns resulting from human failures. Internal control over financial reporting also can be circumvented by collusion or improper overriding of controls. As a result of such limitations, there is risk that material misstatements may not be prevented or detected on a timely basis by internal control over financial reporting. However, these inherent limitations are known features of the financial reporting process. Therefore, it is possible to design into the process safeguards to reduce, though not eliminate, this risk.
Under the supervision and with the participation of our management, including our Chief Executive Officer and Chief Financial Officer, we conducted an evaluation of the effectiveness of our internal control over financial reporting based on the criteria established in Internal Control-Integrated Framework (2013) issued by the Committee of Sponsoring Organizations (COSO) of the Treadway Commission. Based on our evaluation under the COSO framework, our management concluded that our internal control over financial reporting was effective as of December 31, 2014. The effectiveness of internal control over financial reporting as of December 31, 2014 has been audited by KPMG LLP, an independent registered public accounting firm, as stated in their report which is included herein. Disclosure Controls and Procedures
Rule 13a-15 of the Securities and Exchange Act requires that we conduct an evaluation of the effectiveness of our disclosure controls and procedures as of the end of the period covered by this annual report, and we have a disclosure policy in furtherance of the same. This evaluation is designed to ensure that all corporate disclosure is complete and accurate in all material respects. The evaluation is further designed to ensure that all information required to be disclosed in our SEC reports is accumulated and communicated to management to allow timely decisions regarding required disclosures and recorded, processed, summarized and reported within the time periods and in the manner specified in the SEC’s rules and forms. Any controls and procedures, no matter how well designed and operated, can provide only reasonable assurance of achieving the desired control objectives. Our Chief Executive Officer and Chief Financial Officer supervise and participate in this evaluation, and they are assisted by our Deputy Chief Financial Officer and Chief Accounting Officer and other members of our Disclosure Committee. In addition to our Deputy Chief Financial Officer and Chief Accounting Officer, our Disclosure Committee consists of our General Counsel, the chief communication officer, senior officers of significant business lines and other select employees.
We conducted the required evaluation, and our Chief Executive Officer and Chief Financial Officer have concluded that our disclosure controls and procedures (as defined by Securities Exchange Act Rule 13a-15(e)) were effective as of the end of the period covered by this annual report to accomplish their objectives at the reasonable assurance level.
150
Table of Contents
Changes in Internal Controls Over Financial Reporting
No changes in our internal control over financial reporting occurred during the fiscal quarter that have materially affected, or are reasonably likely to materially affect, our internal control over financial reporting. Item 9B. Other Information
Not applicable.
PART III Item 10. Directors, Executive Officers and Corporate Governance
The information under the headings “Election of Directors” , “Corporate Governance”, “Executive Management” and “Stock Ownership” in the definitive proxy statement for our 2015 Annual Meeting of Stockholders is incorporated herein by reference.
We are filing the certifications by the Chief Executive Officer and Chief Financial Officer required under Section 302 of the Sarbanes-Oxley Act as exhibits to this Annual Report on Form 10-K. Item 11. Executive Compensation
The information contained under the headings “Corporate Governance” , “Compensation Discussion and Analysis” and “Executive Compensation” in the definitive proxy statement for our 2015 Annual Meeting of Stockholders is incorporated herein by reference. Item 12. Security Ownership of Certain Beneficial Owners and Management and Related Stockholder Matters Equity Compensation Plan Information
The following table summarizes information about our equity compensation plans as of December 31, 2014. All outstanding awards relate to our Class A common stock.
Plan category
Number of Securities to be Issued upon
Exercise of Outstanding Options, Warrants and Rights
(a)
Weighted-average Exercise Price of
Outstanding Options, Warrants and
Rights (b)
Number of Securities Remaining Available for Future Issuance under
Equity Compensation Plans (Excluding Securities
Reflected in Column (a)) (c)
Equity compensation plans approved by security holders (1) 8,694,558 $ 1.03 12,163,174
Equity compensation plans not approved by security holders — — —
Total 8,694,558 $ 1.03 12,163,174
(1) Consists of stock options and restricted stock units in our 2012 Equity Incentive Plan (the “2012 Plan”) and our Second Amended and
Restated 2004 Stock Incentive Plan (the “2004 Stock Incentive Plan”; no further awards may be issued under our 2004 Stock Incentive Plan, which was terminated in May 2012 in connection with the adoption of the 2012 Plan) and includes the following:
151
• 5,462,232 time-vesting restricted stock units, which generally vest and are exercisable 25% per year over four years from the grant date,
and which are exercisable for no consideration. Excluding these restricted stock units, the weighted average exercise price of outstanding options, warrants and rights would increase to $13.21.
Table of Contents
• 2,307,160 performance-based restricted stock units, consisting of (x) 1,284,546 restricted stock units cliff vesting in 2016 and (y) 1,022,614 restricted stock units cliff vesting in 2017, in each case, representing the maximum number of shares that would be issued based on achievement of the applicable performance goals. These awards are subject to the Company’s achievement of certain adjusted earnings-per-share (EPS) targets (over a minimum threshold) as measured on a cumulative basis over a two-year performance-measurement period, with full vesting of any earned amount on the third anniversary of the grant date. These awards were granted with a target number of restricted stock units, zero to 200% of which may be earned depending on the Company’s actual adjusted EPS over the performance period.
The information contained under the heading “Stock Ownership” in the definitive proxy statement for our 2015 Annual Meeting of
Stockholders is incorporated herein by reference. Item 13. Certain Relationships and Related Transactions, and Director Independence
• 246,828 restricted stock units that were initially subject to the Company achieving a minimum adjusted EBITDA threshold of $808,695,100 for the twelve month period ended June 30, 2014. The Company satisfied the threshold, such that the awards are scheduled to vest and become exercisable 25% per year over four years from the grant date, with the first tranche having vested in September 2014.
The information contained under the headings “Election of Directors” , “Corporate Governance” and “Related Party Transactions” in the definitive proxy statement for our 2015 Annual Meeting of Stockholders is incorporated herein by reference. Item 14. Principal Accountant Fees and Services
The information contained under the heading “Audit and Other Fees” in the definitive proxy statement for our 2015 Annual Meeting of Stockholders is incorporated herein by reference.
PART IV Item 15. Exhibits and Financial Statement Schedules
1. Financial Statements
See Index to Consolidated Financial Statements set forth on page 70.
2. Financial Statement Schedules
See Schedule II on page 153.
See Schedule III beginning on page 154.
3. Exhibits
See Exhibit Index beginning on page 158 hereof.
152
Table of Contents
CBRE GROUP, INC.
SCHEDULE II —VALUATION AND QUALIFYING ACCOUNTS (Dollars in thousands)
See accompanying report of independent registered public accounting firm.
153
Allowance for
Doubtful Accounts Balance, December 31, 2011 $ 33,915 Charges to expense 6,509 Write-offs, payments and other (4,932 )
Balance, December 31, 2012 $ 35,492 Charges to expense 9,579 Write-offs, payments and other (4,809 )
Balance, December 31, 2013 $ 40,262 Charges to expense 8,165 Write-offs, payments and other (6,596 )
Balance, December 31, 2014 $ 41,831
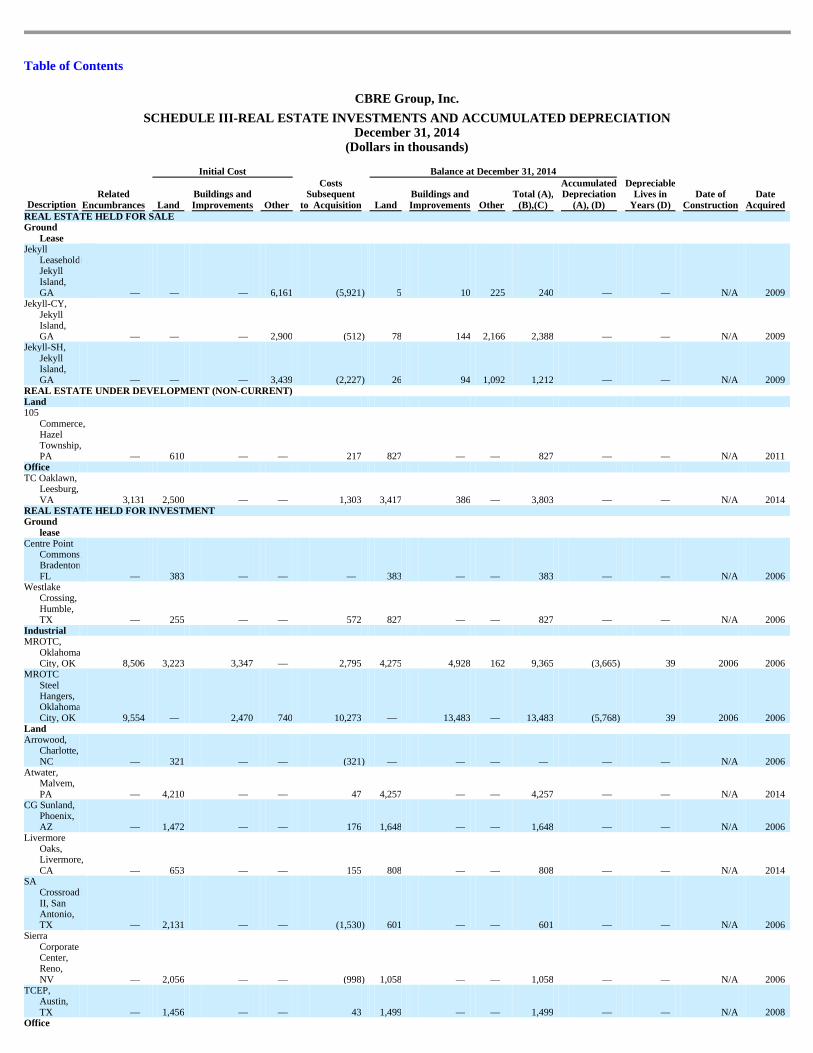
Table of Contents
CBRE Group, Inc.
SCHEDULE III -REAL ESTATE INVESTMENTS AND ACCUMULATED DEPRECIATIO N December 31, 2014
(Dollars in thousands) Initial Cost Balance at December 31, 2014
Description Related
Encumbrances Land Buildings and Improvements Other
Costs Subsequent
to Acquisition Land Buildings and Improvements Other
Total (A), (B),(C)
Accumulated Depreciation
(A), (D)
Depreciable Lives in
Years (D) Date of
Construction Date
Acquired REAL ESTATE HELD FOR SALE Ground
Lease Jekyll
Leaseholding, Jekyll Island, GA — — — 6,161 (5,921 ) 5 10 225 240 — — N/A 2009
Jekyll-CY, Jekyll Island, GA — — — 2,900 (512 ) 78 144 2,166 2,388 — — N/A 2009
Jekyll-SH, Jekyll Island, GA — — — 3,439 (2,227 ) 26 94 1,092 1,212 — — N/A 2009
REAL ESTATE UNDER DEVELOPMENT (NON -CURRENT) Land 105
Commerce, Hazel Township, PA — 610 — — 217 827 — — 827 — — N/A 2011
Office TC Oaklawn,
Leesburg, VA 3,131 2,500 — — 1,303 3,417 386 — 3,803 — — N/A 2014
REAL ESTATE HELD FOR INVESTMENT Ground
lease Centre Point
Commons, Bradenton, FL — 383 — — — 383 — — 383 — — N/A 2006
Westlake Crossing, Humble, TX — 255 — — 572 827 — — 827 — — N/A 2006
Industrial MROTC,
Oklahoma City, OK 8,506 3,223 3,347 — 2,795 4,275 4,928 162 9,365 (3,665 ) 39 2006 2006
MROTC Steel Hangers, Oklahoma City, OK 9,554 — 2,470 740 10,273 — 13,483 — 13,483 (5,768 ) 39 2006 2006
Land Arrowood,
Charlotte, NC — 321 — — (321 ) — — — — — — N/A 2006
Atwater, Malvem, PA — 4,210 — — 47 4,257 — — 4,257 — — N/A 2014
CG Sunland, Phoenix, AZ — 1,472 — — 176 1,648 — — 1,648 — — N/A 2006
Livermore Oaks, Livermore, CA — 653 — — 155 808 — — 808 — — N/A 2014
SA Crossroads II, San Antonio, TX — 2,131 — — (1,530 ) 601 — — 601 — — N/A 2006
Sierra Corporate Center, Reno, NV — 2,056 — — (998 ) 1,058 — — 1,058 — — N/A 2006
TCEP, Austin, TX — 1,456 — — 43 1,499 — — 1,499 — — N/A 2008
Office

154
814 Commerce, Oak Brook, IL 21,652 4,784 8,217 — 2,480 3,299 12,182 — 15,481 (2,848 ) 39 1972 2007
Total 42,843 $ 24,054 $ 14,034 $ 13,240 $ 6,552 $ 23,008 $ 31,227 $ 3,645 $ 57,880 $ (12,281 )

Table of Contents
155
(A) Includes costs and depreciation subsequent to December 20, 2006, the date we acquired Trammell Crow Company. (B) The aggregate cost for Federal Income Tax purposes is $76.5 million. (C) Reflects write downs for impairments of real estate and provisions for loss on real estate held for sale totaling $16.1 million on assets we
own at December 31, 2014. These charges were recorded in 2008 through 2014 as a result of capital market turmoil and weak real estate fundamentals in the United States, in addition to reduced anticipated holding periods of certain assets.
(D) Land, real estate under development and real estate held for sale are not depreciated.
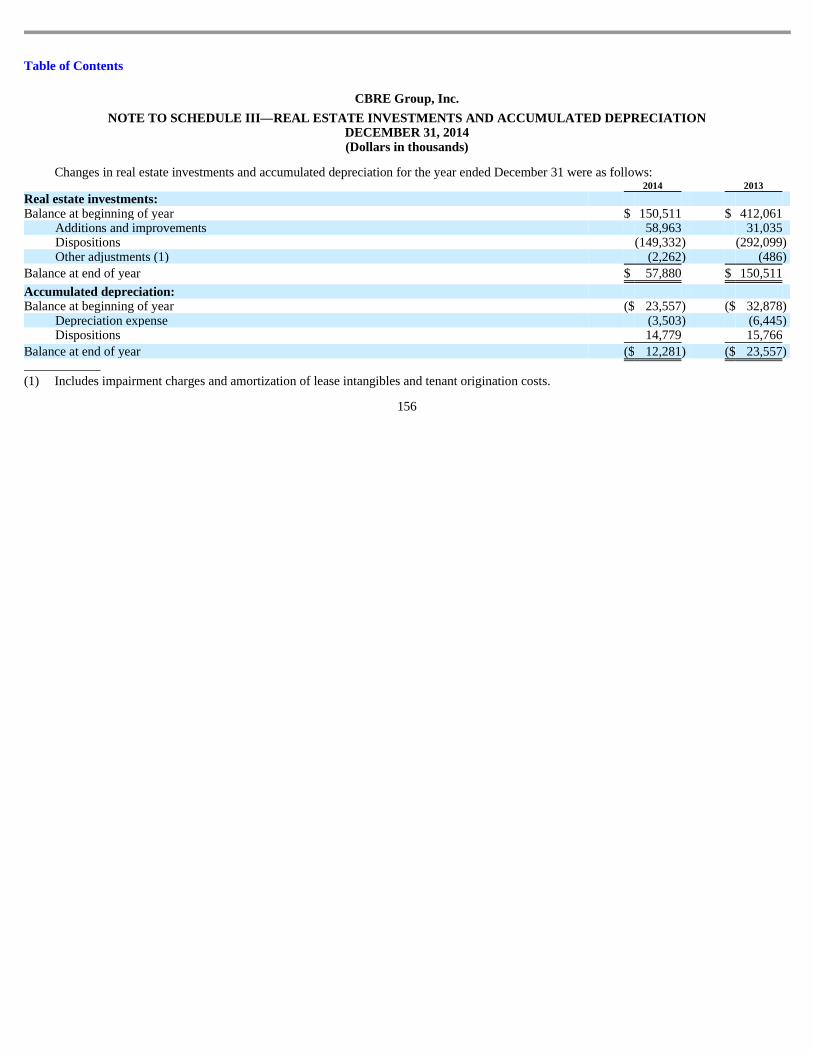
Table of Contents
CBRE Group, Inc.
NOTE TO SCHEDULE III —REAL ESTATE INVESTMENTS AND ACCUMULATED DEPRECIATIO N DECEMBER 31, 2014 (Dollars in thousands)
Changes in real estate investments and accumulated depreciation for the year ended December 31 were as follows:
156
2014 2013 Real estate investments:
Balance at beginning of year $ 150,511 $ 412,061 Additions and improvements 58,963 31,035 Dispositions (149,332 ) (292,099 ) Other adjustments (1) (2,262 ) (486 )
Balance at end of year $ 57,880 $ 150,511
Accumulated depreciation: Balance at beginning of year ($ 23,557 ) ($ 32,878 )
Depreciation expense (3,503 ) (6,445 ) Dispositions 14,779 15,766
Balance at end of year ($ 12,281 ) ($ 23,557 )
(1) Includes impairment charges and amortization of lease intangibles and tenant origination costs.
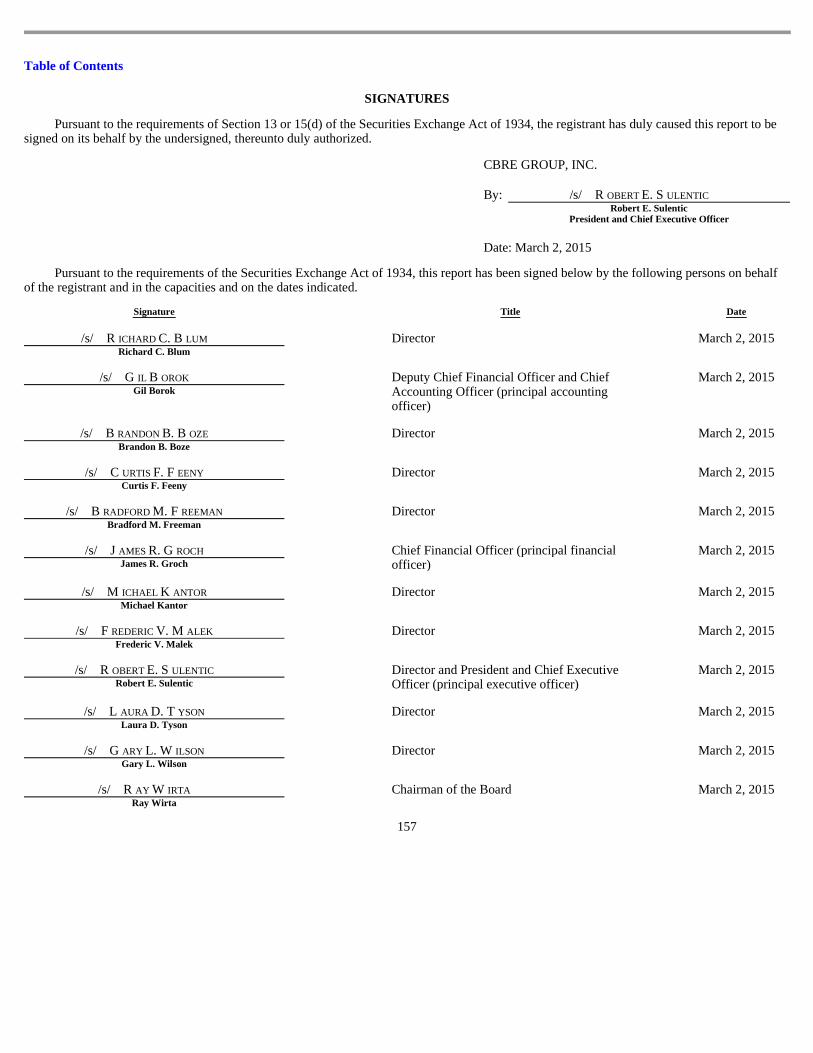
Table of Contents
SIGNATURES
Pursuant to the requirements of Section 13 or 15(d) of the Securities Exchange Act of 1934, the registrant has duly caused this report to be signed on its behalf by the undersigned, thereunto duly authorized.
Pursuant to the requirements of the Securities Exchange Act of 1934, this report has been signed below by the following persons on behalf
of the registrant and in the capacities and on the dates indicated.
157
CBRE GROUP, INC.
By: /s/ R OBERT E. S ULENTIC
Robert E. Sulentic
President and Chief Executive Officer
Date: March 2, 2015
Signature Title Date
/s/ R ICHARD C. B LUM Richard C. Blum
Director
March 2, 2015
/s/ G IL B OROK Gil Borok
Deputy Chief Financial Officer and Chief Accounting Officer (principal accounting officer)
March 2, 2015
/s/ B RANDON B. B OZE Brandon B. Boze
Director
March 2, 2015
/s/ C URTIS F. F EENY Curtis F. Feeny
Director
March 2, 2015
/s/ B RADFORD M. F REEMAN Bradford M. Freeman
Director
March 2, 2015
/s/ J AMES R. G ROCH James R. Groch
Chief Financial Officer (principal financial officer)
March 2, 2015
/s/ M ICHAEL K ANTOR Michael Kantor
Director
March 2, 2015
/s/ F REDERIC V. M ALEK Frederic V. Malek
Director
March 2, 2015
/s/ R OBERT E. S ULENTIC Robert E. Sulentic
Director and President and Chief Executive Officer (principal executive officer)
March 2, 2015
/s/ L AURA D. T YSON Laura D. Tyson
Director
March 2, 2015
/s/ G ARY L. W ILSON Gary L. Wilson
Director
March 2, 2015
/s/ R AY W IRTA Ray Wirta
Chairman of the Board
March 2, 2015
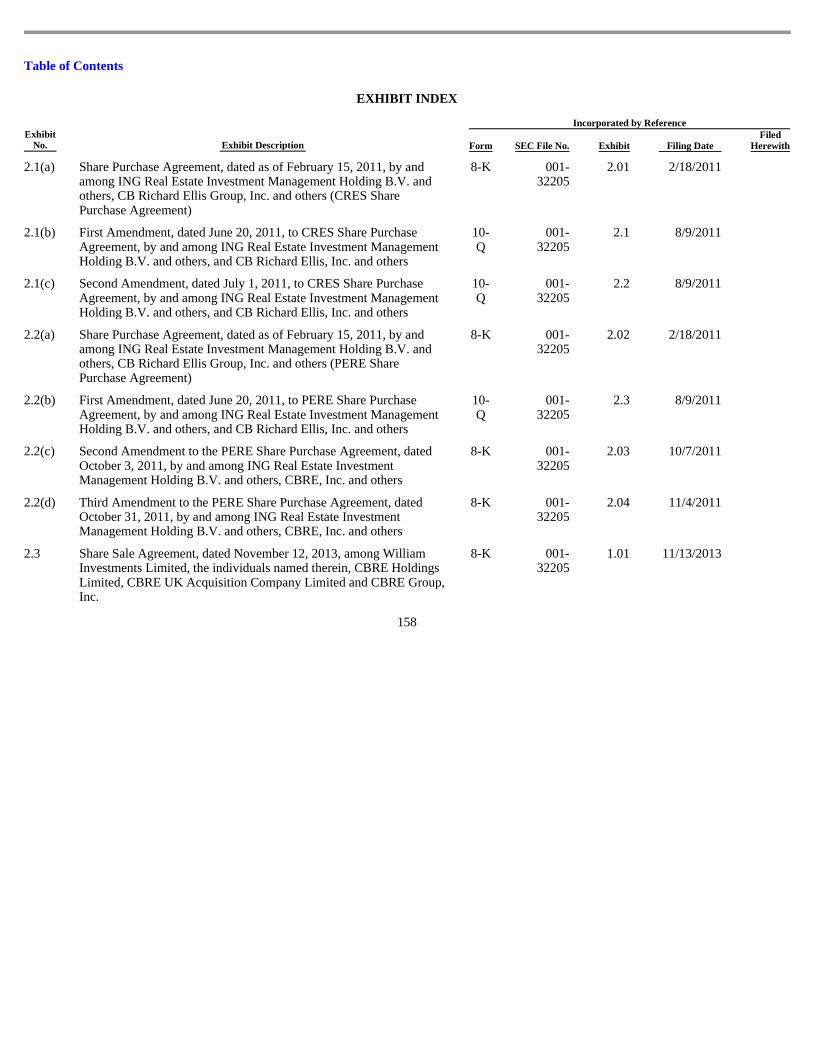
Table of Contents
EXHIBIT INDEX
158
Incorporated by Reference Exhibit
No. Exhibit Description Form SEC File No. Exhibit Filing Date Filed
Herewith
2.1(a)
Share Purchase Agreement, dated as of February 15, 2011, by and among ING Real Estate Investment Management Holding B.V. and others, CB Richard Ellis Group, Inc. and others (CRES Share Purchase Agreement)
8-K
001-32205
2.01
2/18/2011
2.1(b)
First Amendment, dated June 20, 2011, to CRES Share Purchase Agreement, by and among ING Real Estate Investment Management Holding B.V. and others, and CB Richard Ellis, Inc. and others
10-Q
001-32205
2.1
8/9/2011
2.1(c)
Second Amendment, dated July 1, 2011, to CRES Share Purchase Agreement, by and among ING Real Estate Investment Management Holding B.V. and others, and CB Richard Ellis, Inc. and others
10-Q
001-32205
2.2
8/9/2011
2.2(a)
Share Purchase Agreement, dated as of February 15, 2011, by and among ING Real Estate Investment Management Holding B.V. and others, CB Richard Ellis Group, Inc. and others (PERE Share Purchase Agreement)
8-K
001-32205
2.02
2/18/2011
2.2(b)
First Amendment, dated June 20, 2011, to PERE Share Purchase Agreement, by and among ING Real Estate Investment Management Holding B.V. and others, and CB Richard Ellis, Inc. and others
10-Q
001-32205
2.3
8/9/2011
2.2(c)
Second Amendment to the PERE Share Purchase Agreement, dated October 3, 2011, by and among ING Real Estate Investment Management Holding B.V. and others, CBRE, Inc. and others
8-K
001-32205
2.03
10/7/2011
2.2(d)
Third Amendment to the PERE Share Purchase Agreement, dated October 31, 2011, by and among ING Real Estate Investment Management Holding B.V. and others, CBRE, Inc. and others
8-K
001-32205
2.04
11/4/2011
2.3
Share Sale Agreement, dated November 12, 2013, among William Investments Limited, the individuals named therein, CBRE Holdings Limited, CBRE UK Acquisition Company Limited and CBRE Group, Inc.
8-K
001-32205
1.01
11/13/2013
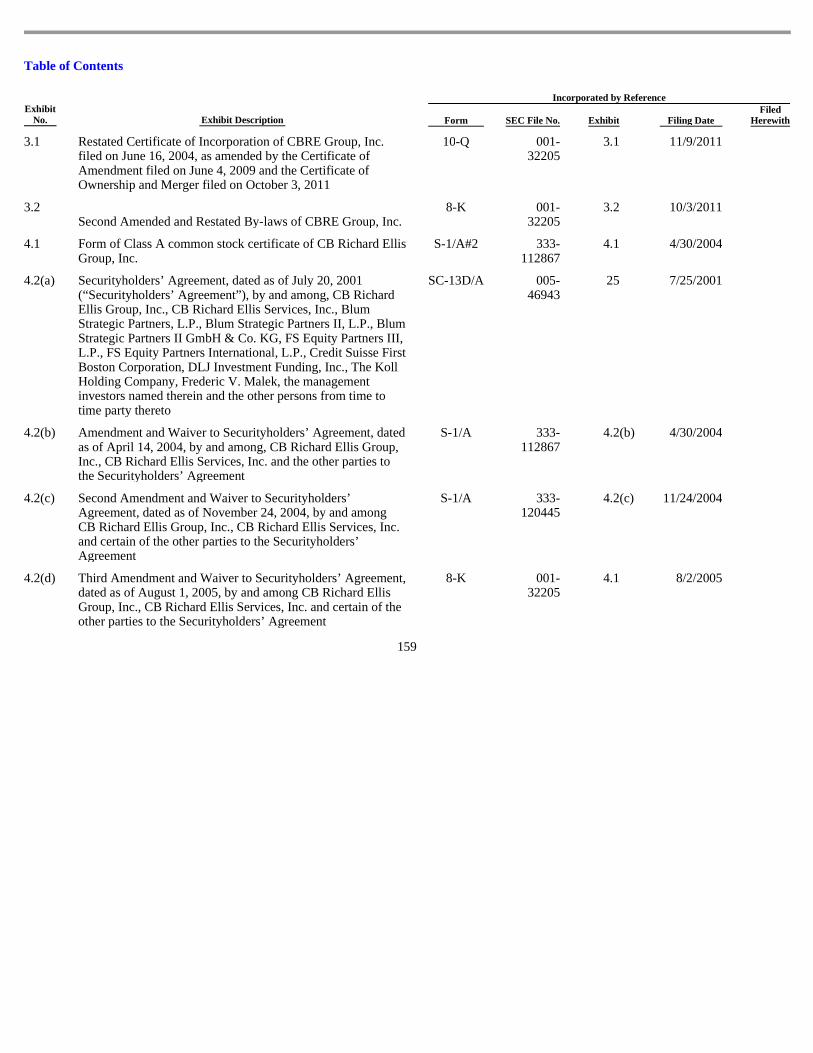
Table of Contents
159
Incorporated by Reference Exhibit
No. Exhibit Description Form SEC File No. Exhibit Filing Date Filed
Herewith
3.1
Restated Certificate of Incorporation of CBRE Group, Inc. filed on June 16, 2004, as amended by the Certificate of Amendment filed on June 4, 2009 and the Certificate of Ownership and Merger filed on October 3, 2011
10-Q
001-32205
3.1
11/9/2011
3.2 Second Amended and Restated By-laws of CBRE Group, Inc.
8-K
001-32205
3.2
10/3/2011
4.1
Form of Class A common stock certificate of CB Richard Ellis Group, Inc.
S-1/A#2
333-112867
4.1
4/30/2004
4.2(a)
Securityholders’ Agreement, dated as of July 20, 2001 (“Securityholders’ Agreement”), by and among, CB Richard Ellis Group, Inc., CB Richard Ellis Services, Inc., Blum Strategic Partners, L.P., Blum Strategic Partners II, L.P., Blum Strategic Partners II GmbH & Co. KG, FS Equity Partners III, L.P., FS Equity Partners International, L.P., Credit Suisse First Boston Corporation, DLJ Investment Funding, Inc., The Koll Holding Company, Frederic V. Malek, the management investors named therein and the other persons from time to time party thereto
SC-13D/A
005-46943
25
7/25/2001
4.2(b)
Amendment and Waiver to Securityholders’ Agreement, dated as of April 14, 2004, by and among, CB Richard Ellis Group, Inc., CB Richard Ellis Services, Inc. and the other parties to the Securityholders’ Agreement
S-1/A
333-112867
4.2 (b)
4/30/2004
4.2(c)
Second Amendment and Waiver to Securityholders’ Agreement, dated as of November 24, 2004, by and among CB Richard Ellis Group, Inc., CB Richard Ellis Services, Inc. and certain of the other parties to the Securityholders’ Agreement
S-1/A
333-120445
4.2 (c)
11/24/2004
4.2(d)
Third Amendment and Waiver to Securityholders’ Agreement, dated as of August 1, 2005, by and among CB Richard Ellis Group, Inc., CB Richard Ellis Services, Inc. and certain of the other parties to the Securityholders’ Agreement
8-K
001-32205
4.1
8/2/2005
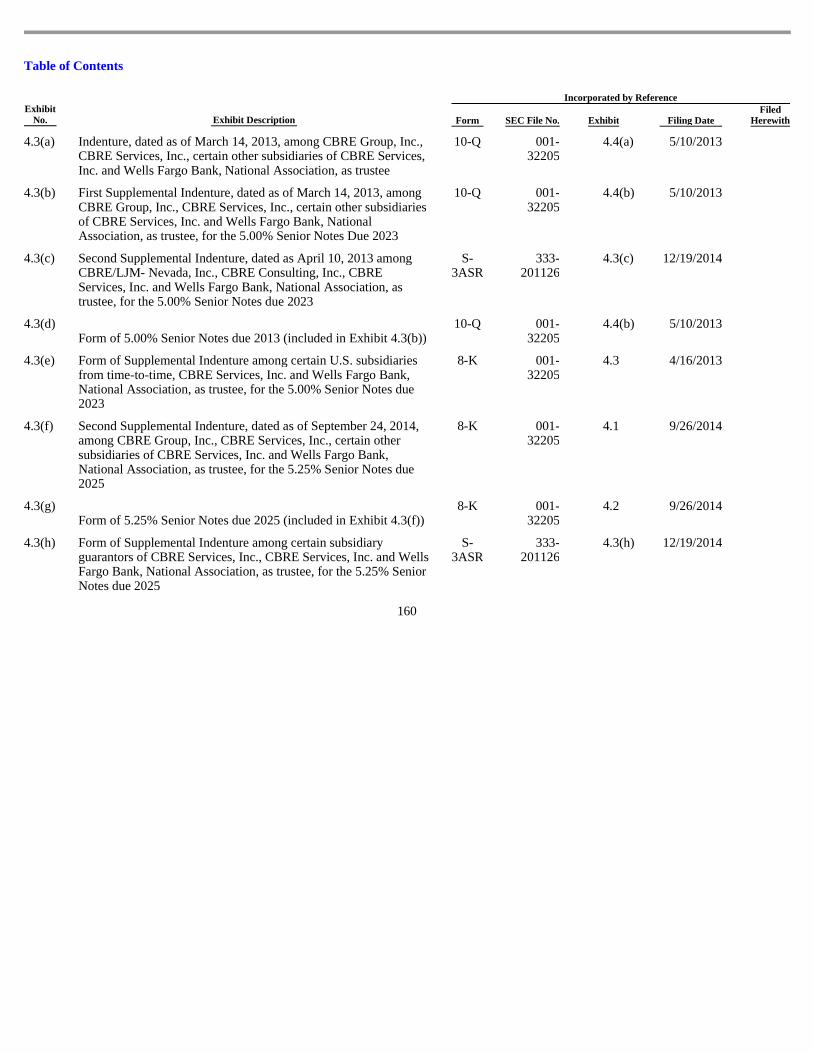
Table of Contents
160
Incorporated by Reference Exhibit
No. Exhibit Description Form SEC File No. Exhibit Filing Date Filed
Herewith
4.3(a)
Indenture, dated as of March 14, 2013, among CBRE Group, Inc., CBRE Services, Inc., certain other subsidiaries of CBRE Services, Inc. and Wells Fargo Bank, National Association, as trustee
10-Q
001-32205
4.4 (a)
5/10/2013
4.3(b)
First Supplemental Indenture, dated as of March 14, 2013, among CBRE Group, Inc., CBRE Services, Inc., certain other subsidiaries of CBRE Services, Inc. and Wells Fargo Bank, National Association, as trustee, for the 5.00% Senior Notes Due 2023
10-Q
001-32205
4.4 (b)
5/10/2013
4.3(c)
Second Supplemental Indenture, dated as April 10, 2013 among CBRE/LJM- Nevada, Inc., CBRE Consulting, Inc., CBRE Services, Inc. and Wells Fargo Bank, National Association, as trustee, for the 5.00% Senior Notes due 2023
S-3ASR
333-201126
4.3 (c)
12/19/2014
4.3(d) Form of 5.00% Senior Notes due 2013 (included in Exhibit 4.3(b))
10-Q
001-32205
4.4 (b)
5/10/2013
4.3(e)
Form of Supplemental Indenture among certain U.S. subsidiaries from time-to-time, CBRE Services, Inc. and Wells Fargo Bank, National Association, as trustee, for the 5.00% Senior Notes due 2023
8-K
001-32205
4.3
4/16/2013
4.3(f)
Second Supplemental Indenture, dated as of September 24, 2014, among CBRE Group, Inc., CBRE Services, Inc., certain other subsidiaries of CBRE Services, Inc. and Wells Fargo Bank, National Association, as trustee, for the 5.25% Senior Notes due 2025
8-K
001-32205
4.1
9/26/2014
4.3(g) Form of 5.25% Senior Notes due 2025 (included in Exhibit 4.3(f))
8-K
001-32205
4.2
9/26/2014
4.3(h)
Form of Supplemental Indenture among certain subsidiary guarantors of CBRE Services, Inc., CBRE Services, Inc. and Wells Fargo Bank, National Association, as trustee, for the 5.25% Senior Notes due 2025
S-3ASR
333-201126
4.3 (h)
12/19/2014
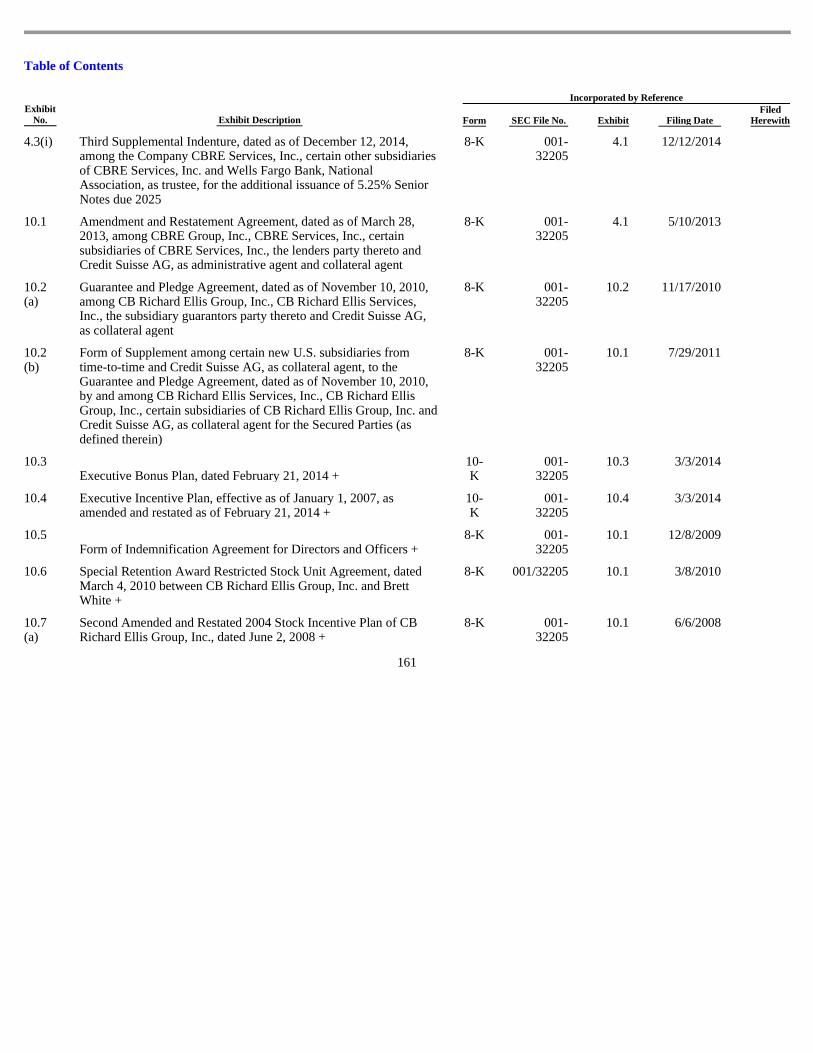
Table of Contents
161
Incorporated by Reference Exhibit
No. Exhibit Description Form SEC File No. Exhibit Filing Date Filed
Herewith
4.3(i)
Third Supplemental Indenture, dated as of December 12, 2014, among the Company CBRE Services, Inc., certain other subsidiaries of CBRE Services, Inc. and Wells Fargo Bank, National Association, as trustee, for the additional issuance of 5.25% Senior Notes due 2025
8-K
001-32205
4.1
12/12/2014
10.1
Amendment and Restatement Agreement, dated as of March 28, 2013, among CBRE Group, Inc., CBRE Services, Inc., certain subsidiaries of CBRE Services, Inc., the lenders party thereto and Credit Suisse AG, as administrative agent and collateral agent
8-K
001-32205
4.1
5/10/2013
10.2(a)
Guarantee and Pledge Agreement, dated as of November 10, 2010, among CB Richard Ellis Group, Inc., CB Richard Ellis Services, Inc., the subsidiary guarantors party thereto and Credit Suisse AG, as collateral agent
8-K
001-32205
10.2
11/17/2010
10.2(b)
Form of Supplement among certain new U.S. subsidiaries from time-to-time and Credit Suisse AG, as collateral agent, to the Guarantee and Pledge Agreement, dated as of November 10, 2010, by and among CB Richard Ellis Services, Inc., CB Richard Ellis Group, Inc., certain subsidiaries of CB Richard Ellis Group, Inc. and Credit Suisse AG, as collateral agent for the Secured Parties (as defined therein)
8-K
001-32205
10.1
7/29/2011
10.3 Executive Bonus Plan, dated February 21, 2014 +
10-K
001-32205
10.3
3/3/2014
10.4
Executive Incentive Plan, effective as of January 1, 2007, as amended and restated as of February 21, 2014 +
10-K
001-32205
10.4
3/3/2014
10.5 Form of Indemnification Agreement for Directors and Officers +
8-K
001-32205
10.1
12/8/2009
10.6
Special Retention Award Restricted Stock Unit Agreement, dated March 4, 2010 between CB Richard Ellis Group, Inc. and Brett White +
8-K
001/32205
10.1
3/8/2010
10.7(a)
Second Amended and Restated 2004 Stock Incentive Plan of CB Richard Ellis Group, Inc., dated June 2, 2008 +
8-K
001-32205
10.1
6/6/2008
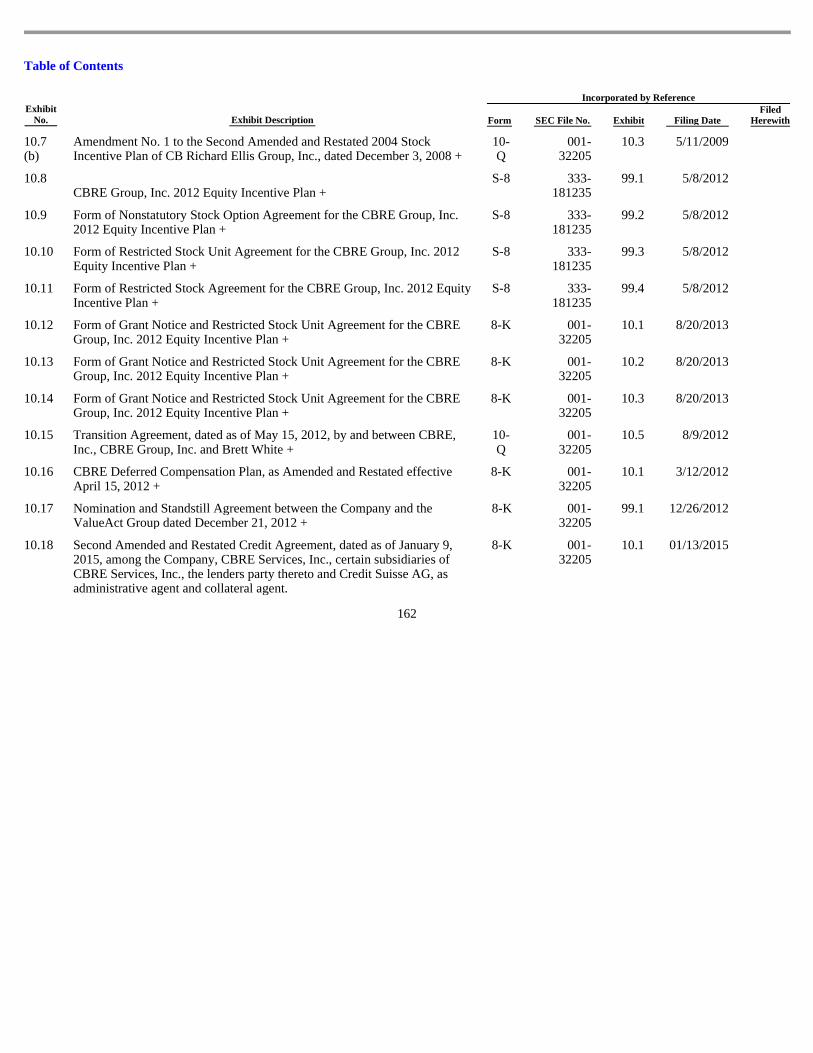
Table of Contents
162
Incorporated by Reference Exhibit
No. Exhibit Description Form SEC File No. Exhibit Filing Date Filed
Herewith
10.7(b)
Amendment No. 1 to the Second Amended and Restated 2004 Stock Incentive Plan of CB Richard Ellis Group, Inc., dated December 3, 2008 +
10-Q
001-32205
10.3
5/11/2009
10.8 CBRE Group, Inc. 2012 Equity Incentive Plan +
S-8
333-181235
99.1
5/8/2012
10.9
Form of Nonstatutory Stock Option Agreement for the CBRE Group, Inc. 2012 Equity Incentive Plan +
S-8
333-181235
99.2
5/8/2012
10.10
Form of Restricted Stock Unit Agreement for the CBRE Group, Inc. 2012 Equity Incentive Plan +
S-8
333-181235
99.3
5/8/2012
10.11
Form of Restricted Stock Agreement for the CBRE Group, Inc. 2012 Equity Incentive Plan +
S-8
333-181235
99.4
5/8/2012
10.12
Form of Grant Notice and Restricted Stock Unit Agreement for the CBRE Group, Inc. 2012 Equity Incentive Plan +
8-K
001-32205
10.1
8/20/2013
10.13
Form of Grant Notice and Restricted Stock Unit Agreement for the CBRE Group, Inc. 2012 Equity Incentive Plan +
8-K
001-32205
10.2
8/20/2013
10.14
Form of Grant Notice and Restricted Stock Unit Agreement for the CBRE Group, Inc. 2012 Equity Incentive Plan +
8-K
001-32205
10.3
8/20/2013
10.15
Transition Agreement, dated as of May 15, 2012, by and between CBRE, Inc., CBRE Group, Inc. and Brett White +
10-Q
001-32205
10.5
8/9/2012
10.16
CBRE Deferred Compensation Plan, as Amended and Restated effective April 15, 2012 +
8-K
001-32205
10.1
3/12/2012
10.17
Nomination and Standstill Agreement between the Company and the ValueAct Group dated December 21, 2012 +
8-K
001-32205
99.1
12/26/2012
10.18
Second Amended and Restated Credit Agreement, dated as of January 9, 2015, among the Company, CBRE Services, Inc., certain subsidiaries of CBRE Services, Inc., the lenders party thereto and Credit Suisse AG, as administrative agent and collateral agent.
8-K
001-32205
10.1
01/13/2015
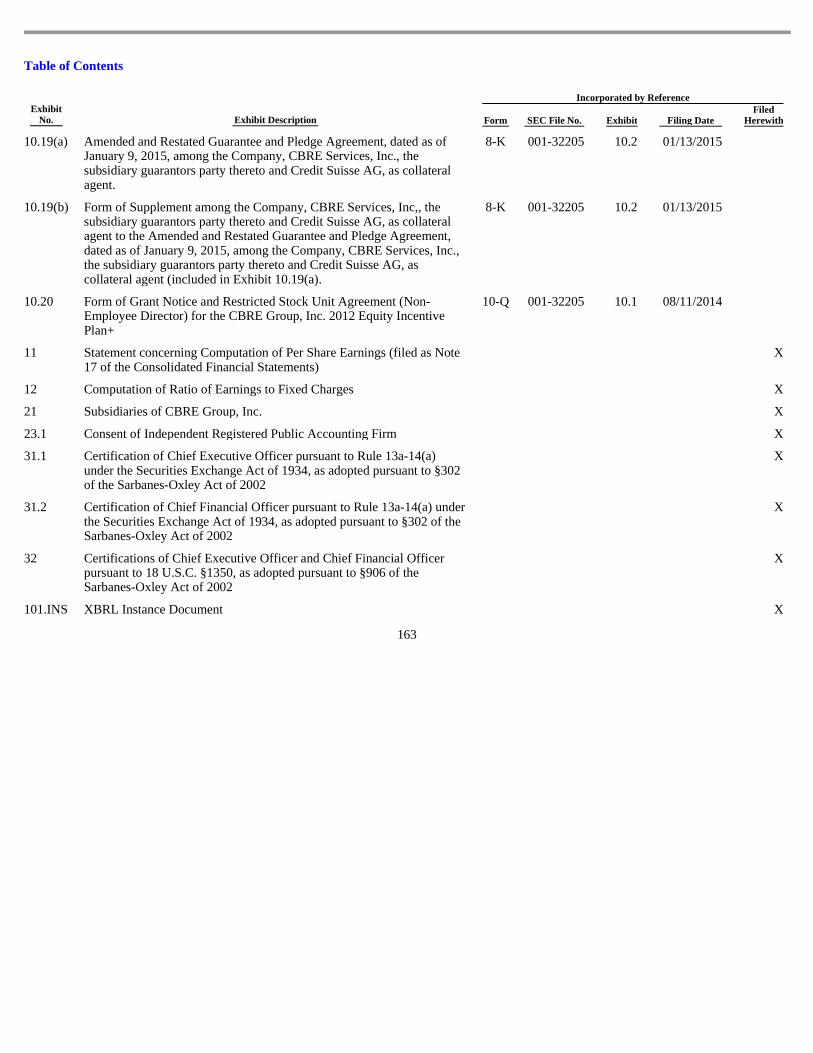
Table of Contents
163
Incorporated by Reference Exhibit
No. Exhibit Description Form SEC File No. Exhibit Filing Date Filed
Herewith
10.19(a)
Amended and Restated Guarantee and Pledge Agreement, dated as of January 9, 2015, among the Company, CBRE Services, Inc., the subsidiary guarantors party thereto and Credit Suisse AG, as collateral agent.
8-K
001-32205
10.2
01/13/2015
10.19(b)
Form of Supplement among the Company, CBRE Services, Inc,, the subsidiary guarantors party thereto and Credit Suisse AG, as collateral agent to the Amended and Restated Guarantee and Pledge Agreement, dated as of January 9, 2015, among the Company, CBRE Services, Inc., the subsidiary guarantors party thereto and Credit Suisse AG, as collateral agent (included in Exhibit 10.19(a).
8-K
001-32205
10.2
01/13/2015
10.20
Form of Grant Notice and Restricted Stock Unit Agreement (Non-Employee Director) for the CBRE Group, Inc. 2012 Equity Incentive Plan+
10-Q
001-32205
10.1
08/11/2014
11
Statement concerning Computation of Per Share Earnings (filed as Note 17 of the Consolidated Financial Statements)
X
12 Computation of Ratio of Earnings to Fixed Charges X
21 Subsidiaries of CBRE Group, Inc. X
23.1 Consent of Independent Registered Public Accounting Firm X
31.1
Certification of Chief Executive Officer pursuant to Rule 13a-14(a) under the Securities Exchange Act of 1934, as adopted pursuant to §302 of the Sarbanes-Oxley Act of 2002
X
31.2
Certification of Chief Financial Officer pursuant to Rule 13a-14(a) under the Securities Exchange Act of 1934, as adopted pursuant to §302 of the Sarbanes-Oxley Act of 2002
X
32
Certifications of Chief Executive Officer and Chief Financial Officer pursuant to 18 U.S.C. §1350, as adopted pursuant to §906 of the Sarbanes-Oxley Act of 2002
X
101.INS XBRL Instance Document X
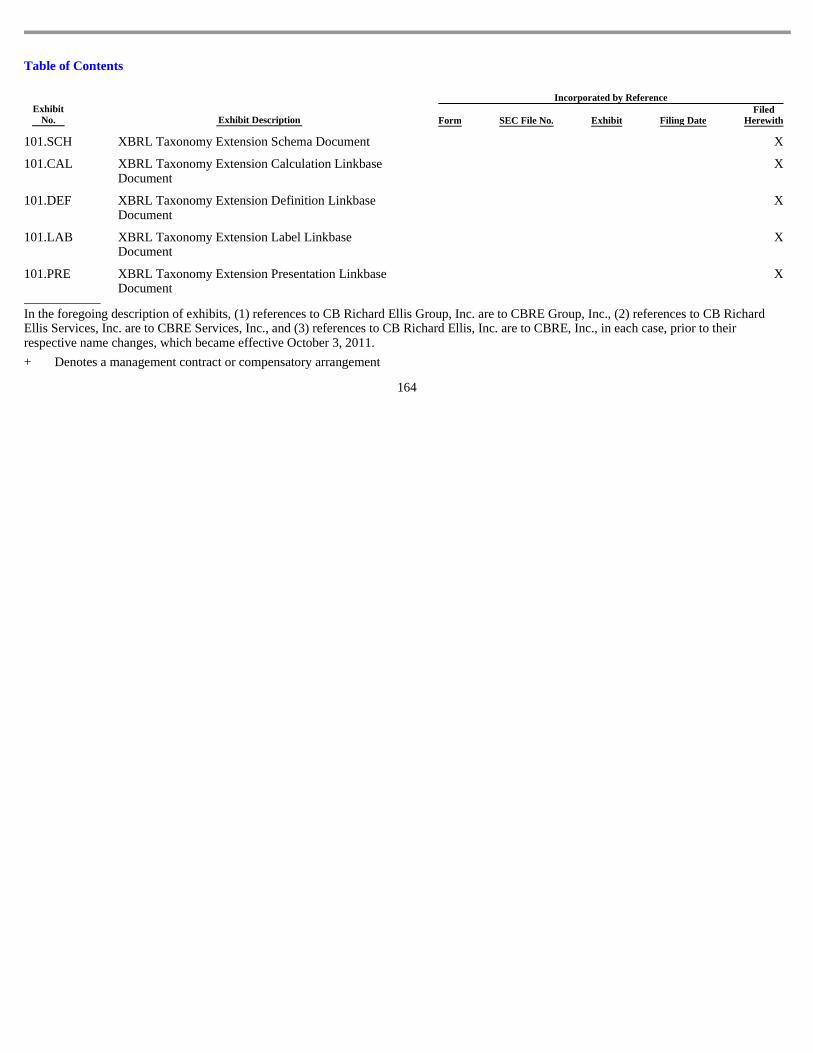
Table of Contents
In the foregoing description of exhibits, (1) references to CB Richard Ellis Group, Inc. are to CBRE Group, Inc., (2) references to CB Richard Ellis Services, Inc. are to CBRE Services, Inc., and (3) references to CB Richard Ellis, Inc. are to CBRE, Inc., in each case, prior to their respective name changes, which became effective October 3, 2011.
Incorporated by Reference Exhibit
No. Exhibit Description Form SEC File No. Exhibit Filing Date Filed
Herewith
101.SCH XBRL Taxonomy Extension Schema Document X
101.CAL
XBRL Taxonomy Extension Calculation Linkbase Document
X
101.DEF
XBRL Taxonomy Extension Definition Linkbase Document
X
101.LAB
XBRL Taxonomy Extension Label Linkbase Document
X
101.PRE
XBRL Taxonomy Extension Presentation Linkbase Document
X
164
+ Denotes a management contract or compensatory arrangement
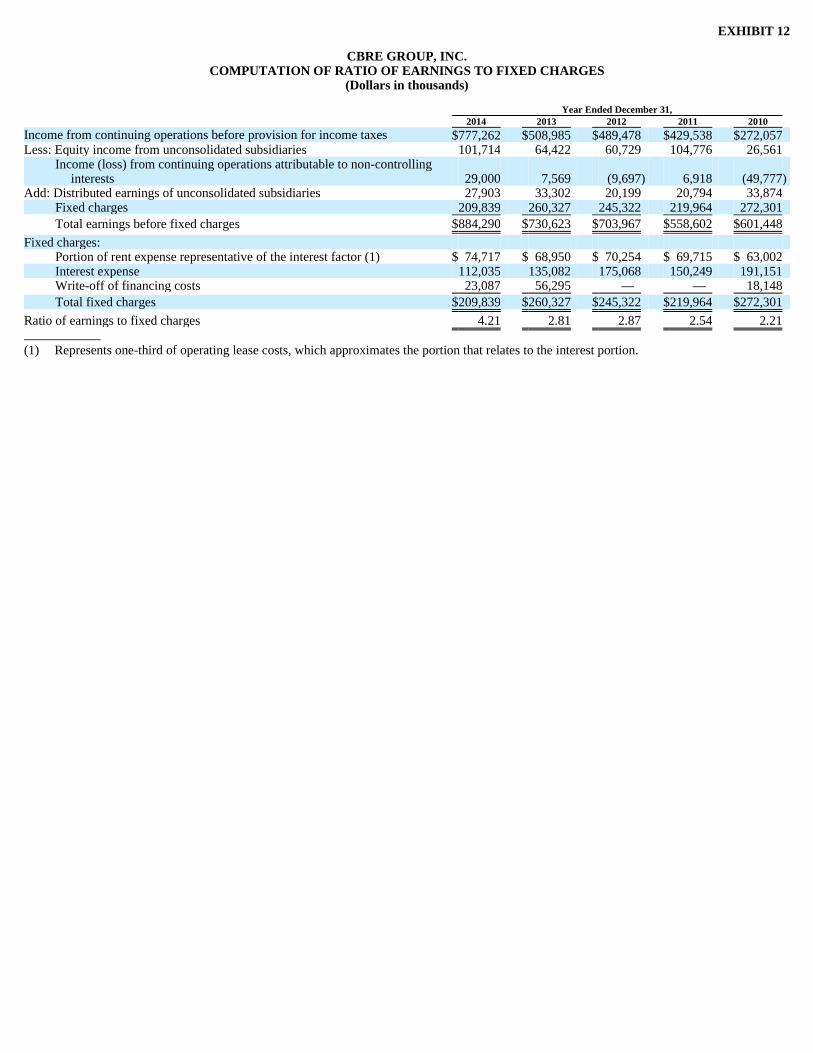
EXHIBIT 12
CBRE GROUP, INC. COMPUTATION OF RATIO OF EARNINGS TO FIXED CHARGES
(Dollars in thousands) Year Ended December 31, 2014 2013 2012 2011 2010 Income from continuing operations before provision for income taxes $ 777,262 $ 508,985 $ 489,478 $ 429,538 $ 272,057 Less: Equity income from unconsolidated subsidiaries 101,714 64,422 60,729 104,776 26,561
Income (loss) from continuing operations attributable to non-controlling interests 29,000 7,569 (9,697 ) 6,918 (49,777 )
Add: Distributed earnings of unconsolidated subsidiaries 27,903 33,302 20,199 20,794 33,874 Fixed charges 209,839 260,327 245,322 219,964 272,301
Total earnings before fixed charges $ 884,290 $ 730,623 $ 703,967 $ 558,602 $ 601,448
Fixed charges: Portion of rent expense representative of the interest factor (1) $ 74,717 $ 68,950 $ 70,254 $ 69,715 $ 63,002 Interest expense 112,035 135,082 175,068 150,249 191,151 Write-off of financing costs 23,087 56,295 — — 18,148
Total fixed charges $ 209,839 $ 260,327 $ 245,322 $ 219,964 $ 272,301
Ratio of earnings to fixed charges 4.21 2.81 2.87 2.54 2.21
(1) Represents one-third of operating lease costs, which approximates the portion that relates to the interest portion.
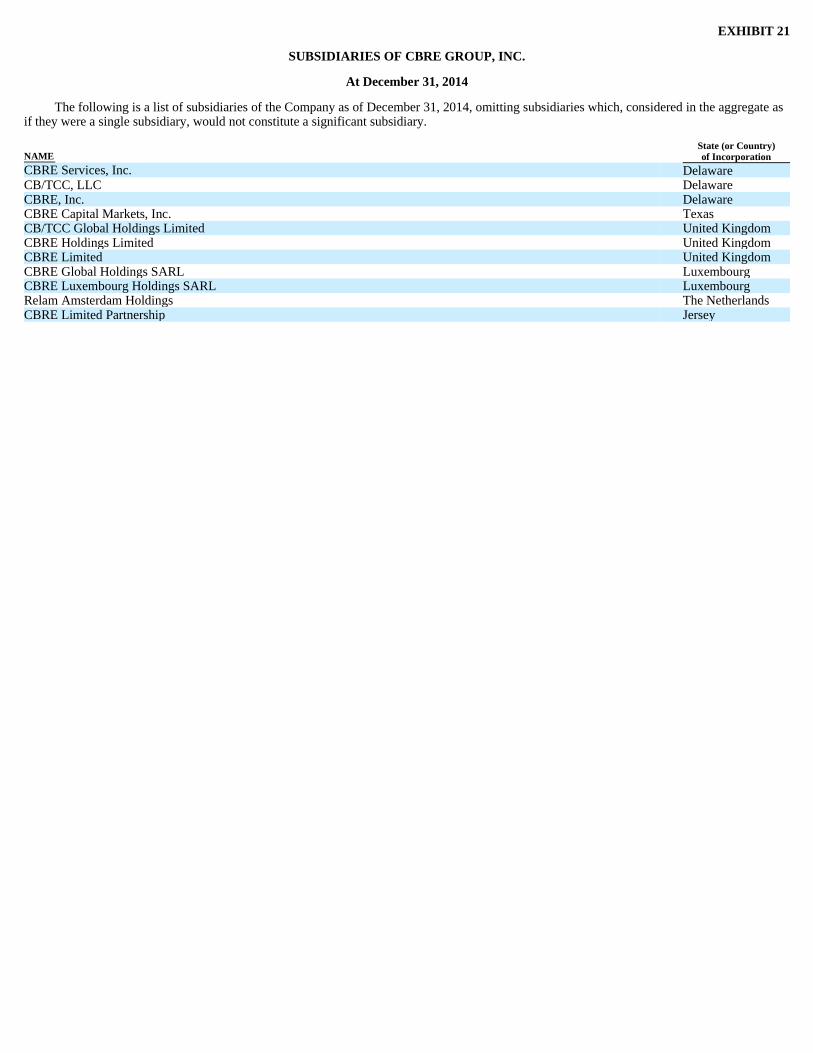
EXHIBIT 21
SUBSIDIARIES OF CBRE GROUP, INC.
At December 31, 2014
The following is a list of subsidiaries of the Company as of December 31, 2014, omitting subsidiaries which, considered in the aggregate as if they were a single subsidiary, would not constitute a significant subsidiary.
NAME State (or Country) of Incorporation
CBRE Services, Inc. Delaware CB/TCC, LLC Delaware CBRE, Inc. Delaware CBRE Capital Markets, Inc. Texas CB/TCC Global Holdings Limited United Kingdom CBRE Holdings Limited United Kingdom CBRE Limited United Kingdom CBRE Global Holdings SARL Luxembourg CBRE Luxembourg Holdings SARL Luxembourg Relam Amsterdam Holdings The Netherlands CBRE Limited Partnership Jersey

EXHIBIT 23.1
CONSENT OF INDEPENDENT REGISTERED PUBLIC ACCOUNTING FIRM The Board of Directors CBRE Group, Inc.:
We consent to the incorporation by reference in the registration statements (Nos. 333-116398, 333-119362, 333-161744 and 333-181235) on Form S-8 and No. 333-201126 on Form S-3 of CBRE Group, Inc. of our report dated March 2, 2015, with respect to the consolidated balance sheets of CBRE Group, Inc. and subsidiaries as of December 31, 2014 and 2013, and the related consolidated statements of operations, comprehensive income, cash flows and equity for each of the years in the three-year period ended December 31, 2014, and the related financial statement schedules, and the effectiveness of internal control over financial reporting as of December 31, 2014, which report appears in the December 31, 2014 annual report on Form 10-K of CBRE Group, Inc. Our report refers to a change in method of accounting for discontinued operations in 2014 due to the adoption of Financial Accounting Standards Board Accounting Standards Update No. 2014-08, Presentation of Financial Statements (Topic 205) and Property, Plant, and Equipment (Topic 360): Reporting Discontinued Operations and Disclosures of Disposals of Components of an Entity. /s/ KPMG LLP Los Angeles, California March 2, 2015
EXHIBIT 31.1
CERTIFICATIONS I, Robert E. Sulentic, certify that:
1) I have reviewed this annual report on Form 10-K of CBRE Group, Inc.;
2) Based on my knowledge, this report does not contain any untrue statement of a material fact or omit to state a material fact necessary
to make the statements made, in light of the circumstances under which such statements were made, not misleading with respect to the period covered by this report;
3) Based on my knowledge, the financial statements and other financial information included in this report, fairly present in all material
respects the financial condition, results of operations and cash flows of the registrant as of, and for, the periods presented in this report;
4) The registrant’s other certifying officer and I are responsible for establishing and maintaining disclosure controls and procedures (as
defined in Exchange Act Rules 13a-15(e) and 15d-15(e)) and internal control over financial reporting (as defined in Exchange Act Rules 13a-15(f) and 15d-15(f)) for the registrant and have:
a) Designed such disclosure controls and procedures, or caused such disclosure controls and procedures to be designed under our
supervision, to ensure that material information relating to the registrant, including its consolidated subsidiaries, is made known to us by others within those entities, particularly during the period in which this report is being prepared;
b) Designed such internal control over financial reporting, or caused such internal control over financial reporting to be designed
under our supervision, to provide reasonable assurance regarding the reliability of financial reporting and the preparation of financial statements for external purposes in accordance with generally accepted accounting principles;
c) Evaluated the effectiveness of the registrant’s disclosure controls and procedures and presented in this report our conclusions
about the effectiveness of the disclosure controls and procedures, as of the end of the period covered by this report based on such evaluation; and
d) Disclosed in this report any change in the registrant’s internal control over financial reporting that occurred during the
registrant’s most recent fiscal quarter (the registrant’s fourth fiscal quarter in the case of an annual report) that has materially affected, or is reasonably likely to materially affect, the registrant’s internal control over financial reporting; and
5) The registrant’s other certifying officer and I have disclosed, based on our most recent evaluation of internal control over financial
reporting, to the registrant’s auditors and the audit committee of the registrant’s board of directors (or persons performing the equivalent functions):
a) All significant deficiencies and material weaknesses in the design or operation of internal control over financial reporting
which are reasonably likely to adversely affect the registrant’s ability to record, process, summarize and report financial information; and
b) Any fraud, whether or not material, that involves management or other employees who have a significant role in the
registrant’s internal control over financial reporting.
Date: March 2, 2015 /s/ ROBERT E. SULENTIC Robert E. Sulentic President and Chief Executive Officer

EXHIBIT 31.2
CERTIFICATIONS I, James R. Groch, certify that:
1) I have reviewed this annual report on Form 10-K of CBRE Group, Inc.;
2) Based on my knowledge, this report does not contain any untrue statement of a material fact or omit to state a material fact necessary
to make the statements made, in light of the circumstances under which such statements were made, not misleading with respect to the period covered by this report;
3) Based on my knowledge, the financial statements and other financial information included in this report, fairly present in all material
respects the financial condition, results of operations and cash flows of the registrant as of, and for, the periods presented in this report;
4) The registrant’s other certifying officer and I are responsible for establishing and maintaining disclosure controls and procedures (as
defined in Exchange Act Rules 13a-15(e) and 15d-15(e)) and internal control over financial reporting (as defined in Exchange Act Rules 13a-15(f) and 15d-15(f)) for the registrant and have:
a) Designed such disclosure controls and procedures, or caused such disclosure controls and procedures to be designed under our
supervision, to ensure that material information relating to the registrant, including its consolidated subsidiaries, is made known to us by others within those entities, particularly during the period in which this report is being prepared;
b) Designed such internal control over financial reporting, or caused such internal control over financial reporting to be designed
under our supervision, to provide reasonable assurance regarding the reliability of financial reporting and the preparation of financial statements for external purposes in accordance with generally accepted accounting principles;
c) Evaluated the effectiveness of the registrant’s disclosure controls and procedures and presented in this report our conclusions
about the effectiveness of the disclosure controls and procedures, as of the end of the period covered by this report based on such evaluation; and
d) Disclosed in this report any change in the registrant’s internal control over financial reporting that occurred during the
registrant’s most recent fiscal quarter (the registrant’s fourth fiscal quarter in the case of an annual report) that has materially affected, or is reasonably likely to materially affect, the registrant’s internal control over financial reporting; and
5) The registrant’s other certifying officer and I have disclosed, based on our most recent evaluation of internal control over financial
reporting, to the registrant’s auditors and the audit committee of the registrant’s board of directors (or persons performing the equivalent functions):
a) All significant deficiencies and material weaknesses in the design or operation of internal control over financial reporting
which are reasonably likely to adversely affect the registrant’s ability to record, process, summarize and report financial information; and
b) Any fraud, whether or not material, that involves management or other employees who have a significant role in the
registrant’s internal control over financial reporting.
Date: March 2, 2015 /s/ JAMES R. GROCH James R. Groch Chief Financial Officer
EXHIBIT 32
CERTIFICATIONS PURSUANT TO SECTION 906 OF THE SARBANES-OXLEY ACT OF 2002
(18 U.S.C. SECTION 1350)
The undersigned, Robert E. Sulentic, Chief Executive Officer, and James R. Groch, Chief Financial Officer of CBRE Group, Inc. (the “Company”), hereby certify as of the date hereof, solely for the purposes of 18 U.S.C. §1350, that:
(i) the Annual Report on Form 10-K for the period ended December 31, 2014, of the Company (the “Report” ) fully complies with the requirements of Section 13(a) or 15(d), as applicable, of the Securities Exchange Act of 1934; and
(ii) the information contained in the Report fairly presents, in all material respects, the financial condition and results of operations of
the Company at the dates and for the periods indicated. Dated: March 2, 2015
The foregoing certification is being furnished solely pursuant to 18 U.S.C. Section 1350 and is not being filed as part of the Report or as a
separate disclosure document.
/s/ ROBERT E. SULENTIC Robert E. Sulentic President and Chief Executive Officer
/s/ JAMES R. GROCH James R. Groch Chief Financial Officer