PERNIX GROUP, INC.
125
3/28/2014 UNITED STATES http://www.sec.gov/Archives/edgar/data/1082198/000137647414000074/prnx_10k.htm 1/125 10-K 1 prnx_10k.htm FORM 10-K UNITED STATES SECURITIES AND EXCHANGE COMMISSION WASHINGTON, D.C. 20549 FORM 10-K (Mark one) ANNUAL REPORT PURSUANT TO SECTION 13 OR 15(d) OF THE SECURITIES EXCHANGE ACT OF 1934 FOR THE FISCAL YEAR ENDED DECEMBER 31, 2013 OR TRANSITION REPORT PURSUANT TO SECTION 13 OR 15(d) OF THE SECURITIES EXCHANGE ACT OF 1934 For the transition period from to Commission file number 333-92445 PERNIX GROUP, INC. (Exact name of Registrant as specified in its charter) Delaware 36-4025775 (State or other jurisdiction of incorporation or organization) (I.R.S. Employer Identification No.) 151 E. 22nd Street Lombard, Illinois 60148 (Address of principal executive offices, including zip code) (630) 620-4787 (Registrant’s telephone number, including area code) Securities registered pursuant to Section 12(b) of the Act: NO NE Securities registered pursuant to Section 12(g) of the Act: Common Stock, par value $0.01 per share (Title of Each Class) Indicate by check mark if the registrant is a well-known seasoned issuer, as defined in Rule 405 of the Securities Act. o Yes x No Indicate by check mark if the registrant is not required to file reports pursuant to Section 13 or Section 15(d) of the Act. o Yes x No Indicate by check mark whether the registrant (1) has filed all reports required to be filed by Section 13 or 15(d) of the Securities Exchange Act of 1934 during the preceding 12 months (or for such shorter period that the registrant was required to file such reports), and (2) has been subject to such filing requirements for the past 90 days. x Yes o No Indicate by check mark whether the registrant has submitted electronically and posted on its corporate Web site, if any, every Interactive Data File required to be submitted and posted pursuant to Rule 405 of Regulation S-T (§ 232.405 of this chapter) during the preceding 12 months (or for such shorter period that the registrant was required to submit and post such files). x Yes o No Indicate by check mark if disclosure of delinquent filers pursuant to Item 405 of Regulation S-K is not contained herein, and will not be contained to the best of registrant ’ s knowledge, in definitive proxy or information statements incorporated by reference in Part III of this Form 10-K or any amendment to this Form 10-K. x Indicate by check mark whether the registrant is a large accelerated filer, an accelerated filer, a non-accelerated filer, or a smaller reporting company. See the definitions of “large accelerated filer,” “accelerated filer” and “smaller reporting company” in Rule 12b-2 of the Exchange Act. (Check one): Large accelerated filer o Accelerated filer o Non-accelerated filer o (Do not check if a smaller reporting company) Smaller reporting company x Indicate by check mark whether the registrant is a shell company (as defined in Rule 12b-2 of the Exchange Act). o Yes x No The aggregate market value of registrant ’ s common stock held by non-affiliates on June 30, 2013 (the last business day of the registrant’s most recently completed second fiscal quarter), based upon the closing price of a share of the registrant’s common stock on
-
Upload
khangminh22 -
Category
Documents
-
view
1 -
download
0
Transcript of PERNIX GROUP, INC.

3/28/2014 UNITED STATES
http://www.sec.gov/Archives/edgar/data/1082198/000137647414000074/prnx_10k.htm 1/125
10-K 1 prnx_10k.htm FORM 10-K
UNITED STATES
SECURITIES AND EXCHANGE COMMISSIONWASHINGTON, D.C. 20549
FORM 10-K(Mark one)
ANNUAL REPORT PURSUANT TO SECTION 13 OR 15(d) OF THE SECURITIES EXCHANGE ACT OF 1934FOR THE FISCAL YEAR ENDED DECEMBER 31, 2013
OR
TRANSITION REPORT PURSUANT TO SECTION 13 OR 15(d) OF THE SECURITIES EXCHANGE ACT OF 1934For the transition period from to
Commission file number 333-92445
PERNIX GROUP, INC.(Exact name of Registrant as specified in its charter)
Delaware 36-4025775
(State or other jurisdiction of
incorporation or organization)
(I.R.S. Employer Identification No.)
151 E. 22nd StreetLombard, Illinois 60148
(Address of principal executive offices, including zip code)
(630) 620-4787(Registrant’s telephone number, including area code)
Securities registered pursuant to Section 12(b) of the Act: NO NE
Securities registered pursuant to Section 12(g) of the Act:
Common Stock, par value $0.01 per share(T itle of Each Class)
Indicate by check mark if the registrant is a well-known seasoned issuer, as defined in Rule 405 of the Securities Act. o Yes x No
Indicate by check mark if the registrant is not required to file reports pursuant to Section 13 or Section 15(d) of the Act. o Yes x No
Indicate by check mark whether the registrant (1) has filed all reports required to be filed by Section 13 or 15(d) of the Securities
Exchange Act of 1934 during the preceding 12 months (or for such shorter period that the registrant was required to file such reports), and
(2) has been subject to such filing requirements for the past 90 days. x Yes o No
Indicate by check mark whether the registrant has submitted electronically and posted on its corporate Web site, if any, every
Interactive Data File required to be submitted and posted pursuant to Rule 405 of Regulation S-T (§ 232.405 of this chapter) during the
preceding 12 months (or for such shorter period that the registrant was required to submit and post such files). x Yes o No
Indicate by check mark if disclosure of delinquent filers pursuant to Item 405 of Regulation S-K is not contained herein, and will not be
contained to the best of registrant ’s knowledge, in definitive proxy or information statements incorporated by reference in Part III of this
Form 10-K or any amendment to this Form 10-K. x
Indicate by check mark whether the registrant is a large accelerated filer, an accelerated filer, a non-accelerated filer, or a smaller
reporting company. See the definitions of “large accelerated filer,” “accelerated filer” and “smaller reporting company” in Rule 12b-2 of the
Exchange Act. (Check one):
Large accelerated filer o Accelerated filer o
Non-accelerated filer o
(Do not check if a smaller reporting company)
Smaller reporting company x
Indicate by check mark whether the registrant is a shell company (as defined in Rule 12b-2 of the Exchange Act). o Yes x No
The aggregate market value of registrant ’s common stock held by non-affiliates on June 30, 2013 (the last business day of the
registrant’s most recently completed second fiscal quarter), based upon the closing price of a share of the registrant’s common stock on

3/28/2014 UNITED STATES
http://www.sec.gov/Archives/edgar/data/1082198/000137647414000074/prnx_10k.htm 2/125
such date was approximately $764,270.
Number of shares of the registrant’s common stock outstanding as of March 26, 2014: 9,403,697
DO CUMENTS INCO RPO RATED BY REFERENCE: None

3/28/2014 UNITED STATES
http://www.sec.gov/Archives/edgar/data/1082198/000137647414000074/prnx_10k.htm 3/125
Table of Contents
TABLE OF CONTENTS
Page
PART I ITEM 1. DESCRIPTION OF BUSINESS 2ITEM 1A. RISK FACTORS 16ITEM 1B. UNRESOLVED STAFF COMMENTS 16ITEM 2. PROPERTIES 16ITEM 3. LEGAL PROCEEDINGS 17ITEM 4. MINE SAFETY DISCLOSURES 17
PART II 18ITEM 5. MARKET FOR REGISTRANT’S COMMON EQUITY, RELATED STOCKHOLDER MATTERS AND
ISSUER PURCHASES OF SECURITIES 18ITEM 6. SELECTED FINANCIAL DATA 18ITEM 7. MANAGEMENT’S DISCUSSION AND ANALYSIS OF FINANCIAL CONDITION AND RESULTS
OF OPERATIONS 19ITEM 7A. QUANTITATIVE AND QUALITATIVE DISCLOSURES ABOUT MARKET RISK 28ITEM 8. FINANCIAL STATEMENTS AND SUPPLEMENTARY DATA 29ITEM 9. CHANGES IN AND DISAGREEMENTS WITH ACCOUNTANTS ON ACCOUNTING AND
FINANCIAL DISCLOSURE 65ITEM 9A. CONTROLS AND PROCEDURES 65ITEM 9B. OTHER INFORMATION 65
PART III 66ITEM 10. DIRECTORS, EXECUTIVE OFFICERS AND CORPORATE GOVERNANCE 66ITEM 11. EXECUTIVE COMPENSATION 68ITEM 12. SECURITY OWNERSHIP OF CERTAIN BENEFICIAL OWNERS AND MANAGEMENT AND
RELATED STOCKHOLDER MATTERS 72ITEM 13. CERTAIN RELATIONSHIPS AND RELATED TRANSACTIONS, AND DIRECTOR INDEPENDENCE 73ITEM 14. PRINCIPAL ACCOUNTANT FEES AND SERVICES 73
PART IV 75ITEM 15. EXHIBITS AND FINANCIAL STATEMENT SCHEDULES 75
SIGNATURES 79

3/28/2014 UNITED STATES
http://www.sec.gov/Archives/edgar/data/1082198/000137647414000074/prnx_10k.htm 4/125
Table of Contents
Disclosure Regarding Forward-Looking Statements
You are cautioned that the Form 10-K contains “forward-looking statements” within the meaning of the Private SecuritiesLitigation Reform Act of 1995. When the words “believes,” “plans,” “anticipates,” “will likely result,” “will continue,”“projects,” “expects,” and similar expressions are used in the Form 10-K, they are intended to identify “forward-lookingstatements,” and such statements are subject to certain risks and uncertainties which would cause actual results to differmaterially from those projected. Furthermore, the Company strategizes and objectively plans based upon certain currentexpectations and intentions which are subject to change at any time at the discretion of management and the Board ofDirectors (the “Board”). These forward-looking statements speak only as of the date this report is filed. The Companydoes not intend to update the forward-looking statements contained in this report, so as to reflect events orcircumstances after the date hereof or to reflect the occurrence of unanticipated events, except as may occur as part of itsongoing periodic reports filed with the United States (U.S.) Securities and Exchange Commission (SEC).
1

3/28/2014 UNITED STATES
http://www.sec.gov/Archives/edgar/data/1082198/000137647414000074/prnx_10k.htm 5/125
Table of Contents
PART I
ITEM 1. DESCRIPTION OF BUSINESS
In this report, we use the terms “Pernix Group,” “Pernix,” “the Company,” “we,” “us” and “our” to refer to PernixGroup, Inc. (formerly known as Telesource International, Inc.) and its consolidated subsidiaries. Unless otherwisenoted, references to years are for calendar years. We refer to the calendar year ended December 31, 2013 as “2013”and the calendar year ended December 31, 2012, as “2012.”
Overview
Pernix Group is a global company managed from Lombard, Illinois and was originally formed in 1995 as TelesourceInternational, Inc. In 2001, the Company was incorporated in Delaware and became an SEC registrant. As of December 31,2013, Pernix Group employs 115 people and is 96.6% owned by Ernil Continental, S.A., BVI, Halbarad Group, Ltd., BVI, andAffiliates. The Company conducts its operations through the parent and its eleven subsidiaries. The Company’s twoprimary operating business segments are general construction and power generation services. In addition to these twooperating segments, the corporate operations are a separately reported segment that provides administrative support tothe operating segments and manages the Corporate headquarters building operations.
Pernix has full-scale construction and management capabilities, with subsidiaries in the South Pacific islands of Fiji andVanuatu, Africa, Azerbaijan, Kurdistan, United Arab Emirates and in the United States. We provide our services in abroad range of end markets, including construction, construction management, power and facility operations andmaintenance (O&M) services.
The construction and power segments offer diversified general contracting, design/build and construction managementservices to public and private agencies. We have provided construction and power services since 1995 and haveestablished a strong reputation within our markets by delivering complex projects and providing innovative facility O&Msolutions to clients world-wide with an unwavering commitment to safety, quality, social responsibility and total customersatisfaction. We have established internationally experienced, high-performance management teams with a proven trackrecord of successfully completing complex projects around the globe and in some of the most remote locations on theplanet. We have over fifteen years of experience providing all of our services in international territories. We believe thatthese attributes are the foundation of Pernix’s success.
We believe the unique collection of resources, experience, operational and financial attributes that Pernix possessproperly position the Company for future growth, diversification and financial success. The current management teamhas transformed the Company over the past several years noting the following achievements and potential:
• Earned three consecutive years of pretax income from continuing operations• Significant reduction in leverage, being debt free at December 31, 2013• The 2012 disposition of unprofitable business entities• Expansion of its customer base including our first domestic project awarded in early 2014• Growth in backlog since 2010• The Company has reached an inflection point from which growth should be increasingly profitable• Enhanced ability to form strategic relationships with vendors, subcontractors and project partners• Attracted two new board members that together have many years of construction/ power industry experience,Fortune 500 financial reporting and management experience and completed over 100 acquisitions• The Company has $71.9 million of net operating and capital loss carryforwards that we anticipate willsubstantially shield future earnings from U.S. federal and state tax payments.
Pernix Group provides its customers with solutions that meet their time and budget constraints. In doing so, Pernix Groupdeveloped strong partner and customer relationships, which are the drivers behind contracts and sole source awards andrelated change orders the Company received in 2012 and 2013 totaling over $140 million.
2

3/28/2014 UNITED STATES
http://www.sec.gov/Archives/edgar/data/1082198/000137647414000074/prnx_10k.htm 6/125
3/28/2014 UNITED STATES
http://www.sec.gov/Archives/edgar/data/1082198/000137647414000074/prnx_10k.htm 7/125
Table of Contents
Business Segments
General Construction Segment
Our general construction segment includes comprehensive pre-construction planning and construction managementservices. As a general contractor, we have responsibility from award through the successful completion of each project.
We have developed a global network of suppliers and subcontractors. Together with these strategic partners, we utilizeniche capabilities and experience that address customer design, budget and schedule requirements. All of ourconstruction management team members have worked on complex international projects. We have the expertise requiredto successfully conduct full-scale construction projects anywhere in the world. We have demonstrated that we canexecute the most technically and environmentally challenging projects within time and budget parameters while meetingthe exacting quality and safety requirements of the project, thereby exceeding our clients’ expectations at everyopportunity. Pernix Group has the ability to self-perform mechanical and electrical trades when doing so bringsefficiencies and value to a project and our customers.
To minimize overhead costs and maintain a worldwide capacity to handle complex projects, we have adopted a strategy ofaffiliating ourselves with highly capable subcontractors and business partners strategically located around the world. Byworking with “best in class” subcontractors and partners, Pernix Group is able to provide the best fit to fulfill ourcustomers’ project requirements. Our various joint venture partners, affiliates and business partners, combined with ourown teams and internal resources, provide Pernix Group the ability to offer its customers a best in class solution to theirconstruction needs, worldwide. These strategic partnerships not only assist Pernix Group in winning larger projects, butalso mitigate cost, design and other risks, provide experience managing larger projects, expand relations with moresubcontractors and vendors, and enhance the number and type of contract opportunities that Pernix can consider, qualifyfor, bid on and win.
Many of our construction projects are for governmental owners, such as the US Department of State’s Bureau ofOverseas Buildings Operations (OBO) as well as select foreign governments. In most instances the bidding processrequires an initial pre-qualification stage, followed by a proposal submission stage for qualified contractors. Pernix Groupfocuses its efforts in areas and on projects where we have a competitive advantage that is within our core competency.We minimize risk and develop winning strategies by thoroughly studying local markets, aligning ourselves with capablelocal or regional large prime-subcontractors, and establishing purchasing and logistics support locally, or regionally,whenever possible. Our performance history and record of client retention demonstrate the successful formula Pernix andits partners have developed allowing us to grow our business and achieve customer satisfaction, which is evidenced bythe stream of awarded contracts from OBO to Pernix and Pernix-Serka Joint Venture (PS JV).
Since 2011, OBO has awarded five projects to Pernix or PS JV, a highly effective venture with Serka Insaat ve Ticaret, A.S.(Serka) that is 52% owned by Pernix and 48% by Serka. PS JV has an office in Vienna, Virginia, in close proximity to U.S.Government agencies in order to closely manage its customer relationships (including OBO) and to provide effectivecontract execution and oversight for its customers on its mission critical, fast-track work efforts in Iraq, Africa andelsewhere.
In 2012 and 2013, the OBO awarded three projects to PSJV totaling approximately $136.7 million. The projects include asole source award (the Sather project) and related change orders that we estimate will generate revenue totalingapproximately $118.3 million to PS JV. This sole source Sather award had an original estimated value of between $103 and$117 million for design and construction services work related to the former Sather Air Base in Iraq (n.k.a. the BaghdadDiplomatic Support Center). Significant design and construction work began during the first half of 2012. On March 14,2013, the Company received an additional modification for a $10.8 million office building. As of December 31, 2013, PS JVreceived award notices and modifications totaling approximately $120.3 million on this project and the project is 89.1%complete. Substantial completion was reached in early 2014. The second award during the two year period wasannounced on May 30, 2013, when OBO awarded a $6.6 million sole source award to PS JV to construct various securityupgrade related structures at the U.S. Embassy in Baku, Azerbaijan (the Baku project). The Baku project began in mid-2013 and completion is anticipated to occur in early to mid-2014. In addition, the third project award was announced onSeptember 3, 2013, when PS JV was awarded a $10.8 million contract by the OBO for the installation of a rainwater captureand storage system at the U.S. Embassy

3/28/2014 UNITED STATES
http://www.sec.gov/Archives/edgar/data/1082198/000137647414000074/prnx_10k.htm 8/125
3
3/28/2014 UNITED STATES
http://www.sec.gov/Archives/edgar/data/1082198/000137647414000074/prnx_10k.htm 9/125
Table of Contents
in Freetown, Sierra Leone (the Freetown project). The Freetown project includes site improvements, rainwater capture andstorage systems, conveyance infrastructure, and water treatment for this embassy compound located in West Africa. OnDecember 18, 2013, the Company received the notice to proceed on the Freetown project.
PS JV participates in a multi-billion dollar Indefinite Delivery Indefinite Quantity (IDIQ) contract with OBO under whichthe Sather award was received. The first award under the IDIQ was received in April of 2011 (the Shield project). The IDIQprovides PS JV with the opportunity to bid on a significant number of task orders for Containerized Housing Units (CHU)to be built internationally. The size of each task order is dependent upon the scope of work and there is no guarantee thatPS JV will win any particular task order, but the overall IDIQ program is for five years and totals $12.0 billion. The amountof the awards to any one contractor cannot exceed $500 million in one base year or option year and $2.5 billion over thelife of the contract should all four option years be exercised. PS JV has actively responded to several Task Order ProposalRequests to bid under this IDIQ contract and has been awarded two contracts with revenue totaling over $220 millionunder this program since April 2011.
The Shield project was renamed the Baghdad Police Academy Annex. This Task Order provided PS JV with theopportunity to build Containerized Housing Units (CHU) in Iraq. Construction under this task order began in June, 2011and since the original award, PS JV received modifications amounting to $9.8 million bringing the adjusted total contractvalue to $102.5 million. In March 2012, we received a partial Termination for Convenience notice from OBO. The partialtermination was due to OBO’s internal program changes and not the result of any performance issues by PS JV. The TaskOrder was over 70% complete upon receipt of the partial Termination for Convenience notice. PS JV worked closely withthe Department of State toward a fair resolution resulting in a negotiated settlement with OBO for total contract value of$102.5 million. OBO remains a major customer vis-à-vis the award of the Sather task order to PS JV under the IDIQ contractduring 2012. In addition, in January 2014, the OBO exercised Option Year 3 under our base CHU IDIQ contract, extendingthe period within which additional Task Orders can be awarded to PS JV into January 2015.
OBO also awarded the Company a Niger embassy rehabilitation contract during August of 2011 and the Baku andFreetown embassy upgrade projects during 2013. The breadth and depth of experience in embassy construction issignificant to Pernix and is expected to be a key strategic component that the Company will utilize to bid on and win futurework with the Department of State as they intend to build or rehabilitate up to 33 embassies and consulates in the 2014through 2018 timeframe.
In the second quarter of 2011, the Company received an award notification from the OBO for an $18.1 million for anembassy rehabilitation project in Niger, Africa. On August 3, 2011 we received a Limited Notice to Proceed on theprocurement and shipping of items that will be required for the project. On August 16, 2011 OBO exercised a bid alternatefor this project valued at $6.6 million to renovate additional office spaces, bringing the total contract value for the Nigerrehabilitation project including change orders to $25.3 million. Pernix established a limited liability company in Niger inconnection with this contract. In early July, 2012, Pernix Group, Inc. received the Notice to Proceed (NTP). Constructionactivity on this project began during the third quarter of 2012 and is expected to continue into late 2014 or early 2015.
Our recent experiences with the OBO, have strategically strengthened our technical and management expertise anddeveloped relationships that enable us to provide our clients with a broad spectrum of services that leverage the expertiseand the construction resumes of our staff and our partners to the mutual benefit of all involved. In addition to PS JV,Pernix has also formed several additional strategic alliances with companies who possess niche capabilities in restorationwork as well as critical mass that enables Pernix to be part of a consortium of contractors with the intention of bidding andworking together on large scale projects which Pernix may not be able to access on a stand-alone basis.
During the third quarter of 2012, the Company established an office in Dubai (United Arab Emirates) to secure new andexisting customers in light of significant anticipated demand for construction services forecasted in the region over thenext decade. In connection with this effort, the Company organized Pernix Technical Works LLC (PTW), a limited liabilitycompany which is consolidated by Pernix Group, Inc. as the primary beneficiary of this variable interest entity.
4

3/28/2014 UNITED STATES
http://www.sec.gov/Archives/edgar/data/1082198/000137647414000074/prnx_10k.htm 10/125
Table of Contents
In 2006, the Company entered into a joint venture with SHBC, called Pernix/SHBC JV (formerly Telesource International,Inc./Sayed Hamid Behbehani & Sons Co., Joint Venture, L.P.). This joint venture operates out of the Company’s Lombard,Illinois office and is a limited partnership with an equity split of 51% for the Company and 49% for SHBC. The jointventure was created for the purpose of bidding on US Government construction and infrastructure development projects.In 2012, Telesource Fiji, Limited (TSF), a wholly-owned subsidiary of Pernix/SHBC JV, merged into Pernix Fiji, Limited(PFL), a wholly–owned subsidiary of Pernix. In late 2012, PFL was awarded a $1.6 million contract to design, procure andinstall underground cable in the Solomon Islands between Lungga Power Station and Ranadi Sub-station for the SolomonIslands Electricity Authority (SIEA). In early 2014, PFL was awarded a $29.1 million project to build a 36MW expansion tothe Kinoya diesel plant in Fiji. The project scope includes expansion design, procurement and installation.
We believe our experience and track record in Fiji and ongoing experience in Niger demonstrate our ability to bid on,obtain and successfully complete additional embassy and/or US Government projects as the Department of State intendsto build, rehab or upgrade more than 33 embassy and consulate facilities in the 2014 — 2018 timeframe.
Design Build
Pernix embraces the design/build model to ensure design excellence and successful completion of construction projectsfrom analysis, architecture and permitting, through engineering, construction, completion and customer acceptance. Byestablishing a singular point of responsibility, we deliver on our promise to fulfill all project requirements andspecifications on-time and on-budget.
We are committed to understanding the unique requirements and specifications of each project to provide acomprehensive single source solution. This value-added partnership leverages our ability to align and manage the bestresources for all aspects of the project.
Construction Management
Pernix Group’s nearly two decades of experience has proven that early involvement in a project and its design is one ofthe keys to its success. Our proven approach works in line with our customers’ needs and expectations to develop a planand an execution schedule that saves time and money and ensures timely completion of our projects. Our state-of-the-artConstruction Management services provide a systematic project review, including a comprehensive construction andstart-up schedule. By establishing a singular point of responsibility, we provide continuous updates on projectmilestones and ensure the safest working environment while we deliver projects on time and on budget.
Construction Segment Outlook
According to Global Construction 2025, construction today is a $8.7 trillion market and by 2025, it is estimatedconstruction economic output will have grown by 70% to $15 trillion. Globally, construction, accounted for 12.2% ofworld GDP in 2012, but by 2025 we forecast this will rise to over 13.5%, as growth in construction continues to rise morestrongly than GDP. Forecasts show the most dynamic growth for construction over the next decade is expected to comefrom emerging markets. Population growth will help drive this growth along with cyclical factors. Conversely,construction in most developed countries will be constrained by large public deficits, austerity programs, mutedpopulation growth and limited economic expansion.
Construction is expected to outpace world economic growth in the next decade as Asia and India markets continue todevelop rapidly and the US / North America will experience the highest developed region growth by registering an upturnin residential and non-residential construction. Qatar is forecasted to have average double-digit growth of 10% per yearbetween 2012 and 2025. Qatar will benefit from the country’s hosting of the FIFA 2022 World Cup and continuingdiversification within its economy. Growth in construction volumes in Qatar is set to slow significantly after 2020. Sub-Saharan Africa is also expected to be a high growth region for construction globally, driven by rising populations, rapidurbanization and much needed development of infrastructure.
As a result of the aforementioned divergence between developed and developing market economies, emerging marketsare expected to make up more than half of the global construction market by the end of this decade. In light of itsexperience, Pernix is uniquely qualified to perform in emerging markets which can be more remote and logistically

3/28/2014 UNITED STATES
http://www.sec.gov/Archives/edgar/data/1082198/000137647414000074/prnx_10k.htm 11/125
challenging environments. Furthermore, Pernix has a Middle East presence through PTW in Dubai and is already presentand operating in Africa in connection with its embassy upgrade project in Niger and the rainwater recapture project inSierra Leone.
5

3/28/2014 UNITED STATES
http://www.sec.gov/Archives/edgar/data/1082198/000137647414000074/prnx_10k.htm 12/125
Table of Contents
Power Generation Segment
In early 2013, the Company hired a VP of Power into a newly created role to manage Pernix's power business, includingO&M contract execution and construction, acquisition of new power generating facilities and related infrastructure in theU.S. and overseas. The VP of Power has over 35 years of experience in energy and independent power, structuringcomplex power projects including oversight of engineering, procurement and construction contract negotiations, fuelssupply, asset management, project and plant acquisitions, operations management and owner's construction oversight,program management, power project development and project finance. Under his leadership, the Company is activelyseeking to grow the power generation segment.
Although virtually everyone in the world relies on it, the needs and resources required to generate power can vary widelyfrom location to location. From the types of fuels used to the plethora of regulations governing the development,construction and operation of power generation plants, Pernix Group understands the unique needs and requirements ofdifferent projects in diverse geographic locations. Pernix focuses on construction and O&M for small to mid-size powerplants and has the experience to engineer, build, operate, and maintain power plants as well as transmission anddistribution grids and underground cable installation. We manage and operate many of the plants that we build. Due toour years of experience, we have developed strong relationships with engine and turbine manufacturers, suppliers ofparts for power plants and distribution/ transmission systems, software developers and suppliers for control systems,Customer Information Systems (CIS), and Geographic Information Systems (GIS).
Pernix focuses on operating efficiency and reliability while maintaining safety, security and environmental stewardship.We accomplish this by partnering with our customers throughout all project phases to understand and recognize theunique requirements of each customer and each project phase, and leverage our ability to align and manage the bestresources for all aspects of each particular project. The Pernix Group power segment prides itself in being a steward of theenvironment and the assets entrusted to us by the communities in which our operators work and live. Pernix Group powersegment employees are not absentee operators but ones who live and work in the community and depend upon the samepower being provided to our customers.
Our power business segment includes plant construction and O&M services. Specifically, Pernix Group provides plantengineering, design, procurement, construction, and operations & maintenance services from the power source throughthe distribution network on a worldwide basis. We have the capability to address a variety of power generatingrequirements from initial conceptual design to construction, through operating and maintaining power facilities. Pernixdifferentiates itself within the power industry as we can scale to various size projects, ranging from small to mid-sizedprojects on a stand-alone project basis and large projects in association with our strategic partners. This flexibility in thescale of projects on which we work reflects the well thought out design, agility and efficiency in our operations. Pernixalso has a wealth of experience in the upgrade of existing facilities to add additional capacity and to achieve operationalefficiency improvements by upgrading and replacing outdated equipment while endeavoring to use existing equipmentwhen possible. These upgrade projects typically produce significant cost savings to our customers and can often becarried out while the power plant continues to operate, resulting in even greater cost savings to our customers.
Power Plant Construction
Pernix Group’s general construction segment is complementary with our power plant construction offerings. We rely onour construction capability and strong affiliation with world-class design firms and subcontractors to providecomprehensive design-build and global power solutions. We have the resources to properly fit technology with ourcustomers’ special requirements, budget and environmental considerations and constraints. Power plants are a significantinvestment and become a crucial part of a community’s survival, hence we take great care to understand what ourcustomer requires, and ensure that the end product exceeds their expectations for today and contemplates their needs forthe future. As noted in the construction segment discussion above, our state-of-the-art construction managementservices provide a systematic project review, including a comprehensive construction and start-up schedule. Our powerplant construction methodology is not limited to building a facility; we also provide start up and commissioning servicesto ensure that the equipment is fully integrated with all other operating systems as well the transmission/distributionsystem and power grid. Furthermore, we provide the appropriate training for startup as well as future operations andmaintenance.

3/28/2014 UNITED STATES
http://www.sec.gov/Archives/edgar/data/1082198/000137647414000074/prnx_10k.htm 13/125
6

3/28/2014 UNITED STATES
http://www.sec.gov/Archives/edgar/data/1082198/000137647414000074/prnx_10k.htm 14/125
Table of Contents
In this segment we have also developed significant working relationships and joint-venture partners in order to expandour offerings, bring efficiencies to our projects and reduce costs for our customers. The Company has also formed astrategic alliance with UEI Holdings, LLC. This arrangement enables Pernix to expand its offerings and adds significantcapabilities. UEI Holdings has experience with diverse power sources and technologies and over the past 15 years hasmanaged, commissioned, designed, or helped build over 50,000MW of power generation facilities. The relationship bringsthis capability to the world market, and coupled with our own internal resources, we feel confident that our customers andpartners will greatly benefit from this alliance with UEI Holdings.
Operations and Maintenance
Pernix Group’s Power O&M services provide an integrated scope of services to effectively maintain and manage allaspects of power operations. We partner closely with public and private entities to improve plant processes, performance,reliability and customer service. Our focus is on ensuring a safe and efficient working environment while reducing costsas circumstances allow.
Pernix’s O&M services include maintenance & operations, engineering, on-going reliability studies, constructionmanagement, recovery/rebuild, specialty services and rehabilitation. We perform an audit of a customer’s operations andprovide a comprehensive plan, including timelines for assuming responsibility of the operation, as well as initial and long-term maintenance requirements. Our intense focus on machine performance and OEM maintenance requirements ensuresefficient and long term operation of equipment. In all cases, Pernix makes every effort to hire and train local staff. This ispart of our commitment to bring jobs and add value to the communities where we work and serve.
Transmission and Distribution Systems
Pernix Group has experience building Transmission & Distribution (T&D) systems, as well as maintaining and upgradingthem to ensure efficient operation throughout the power infrastructure. Our experience includes working in climates thatexperience extreme weather conditions such as cyclones and monsoons. We have developed our own unique methodsand systems for working under such conditions and our safety record is excellent. Safety is a major concern of any T&Dmaintenance program, and all projects start with proper training on equipment usage, communication and teamwork. Oursafety records are receiving recognition from local governments and utilities, and we continually monitor and retrain ourteam to ensure the continued safety of all. Our staff includes engineers with many years of experience designing,implementing and maintaining these systems. We can maintain an existing system or we can upgrade a system to the mostcurrent T&D technologies.
Build, Own, Operate, Transfer (BOOT)
Pernix Group believes in utilizing the BOOT model to help our customers finance and manage their current and potentialinfrastructure projects. Up-front costs are eliminated and the customer ultimately attains ownership of the final product.This is very similar in concept to a toll road. BOOT makes it easy for the customer to execute badly needed projects nowdespite budget constraints which would otherwise require deferring such projects well into the future.
Organizations such as the World Bank, US EX-IM Bank and other international finance institutions (IFIs) have a historyof lending money to aid customers in improving and privatizing their infrastructure. The BOOT model is another financialtool available to cash or budget constrained customers to achieve their infrastructure improvement goals. BOOT is one ofseveral financing options that the Pernix Group may be able to offer our clients.
7
3/28/2014 UNITED STATES
http://www.sec.gov/Archives/edgar/data/1082198/000137647414000074/prnx_10k.htm 15/125
Table of Contents
Current Power Operations
We invest in power projects as an independent power producer (IPP) or using the BOOT model. Our power projects todate have been in the North and South Pacific. Our Power Generation Services segment currently operates power plants inthe Republic of the Fiji Islands (Fiji) and the Republic of Vanuatu (Vanuatu) and it contributed $5.8 million, or 7.9% of our2013 revenue. Although the revenue from our Power operations represents just 7.9% and 4.3% of consolidated revenueduring 2013 and 2012, respectively, it consistently accounts for a significant portion of the Company’s pretax income fromcontinuing operations. Recent awards include the aforementioned $29.1 million early 2014 Kinoya expansion project awardreceived by PFL and the cable project in the Solomon Islands for SIEA. The expansion project will serve not only toprovide construction opportunities but operation and maintenance opportunities for the expansion capacity that willincrease production capacity at Kinoya by 48%.
Pernix Fiji Limited (f.k .a. Telesource Fiji, Limited)
Pernix Fiji Limited (PFL) is a wholly-owned subsidiary of Pernix that conducts power generation activities in Fiji. To betterexemplify its expanding and diversified capabilities, Telesource Fiji, Limited, (TFL) changed its name to Pernix Fiji Limited(PFL) during the second quarter of 2013. PFL has a 20 year contract with the Fiji Electricity Authority (FEA) to operateand maintain two separate diesel fired power generation plants and to sell electrical power produced, on a wholesale level,at a contractually determined rate, without risk of fuel price fluctuation. The O&M contracts for these plants expire in 2023and include management of a total of 74MW of diesel power generation capacity in Fiji.
The Company operates two power plants in Fiji. The Kinoya Power Plant, situated near Suva, the capital of Fiji, is part ofthe FEA grid and is the largest diesel fueled power plant in Fiji with an installed capacity of 50.3 MW. The Vuda PowerPlant, situated between Nadi and Lautoka is the second largest diesel fueled power plant in Fiji with an installed capacityof 24 MW for a total combined installed capacity of 74.3 MW. The Kinoya and Vuda Power Plants are fully compliant withthe applicable laws of Fiji relevant to power plant operations such as Labor Industrial Act and Environmental Act, andcomplies with manufacturers guidelines by applying prudent engineering practice in the operation and maintenance of thepower plant in both locations. PFL has a 20 year Operation & Maintenance agreement for both Kinoya and Vuda PowerPlants from 2003.
In early 2014, PFL was awarded a $29.1 million contract to design, supply, install and commission 36 MW of auxiliarypower equipment at the Kinoya Power Station. The contract price being denominated in 11.9 million Fijian Dollars for theonshore work and 16.1 million Euro for offshore work. On March 14, 2014, PFL entered into a 15.8 million Euro supplycontract with Wartsilla Finland Oy, and Wartsila Australia Pty Ltd, collectively referred to as the supplier, to supply anddeliver 4 engines and related equipment (the offshore work) and to provide technical assistance during installation andcommissioning of the engines at the Kinoya power station
Demonstrative of PFL’s outstanding O&M performance record, FEA, has rated the PFL-managed Vuda and Kinoya powerstations first and second out of five power stations in Fiji, and the FEA report stated that “it is no coincidence that thetwo Telesource (Pernix) stations are ranked first and second. They have a dedicated technically based health, safetyand environmental officer who is actively involved in carrying out frequent and regular in house risk managementchecks”. FEA is the regulatory agency that is charged with protecting the long-term interests of consumers with regard tothe price, quality, safety, and reliability of regulated services in Fiji and PFL takes pride in the positive recognition fromFEA.
Vanuatu Utilities and Infrastructure Limited
In late 2010, VUI was selected by the Government of the Republic of Vanuatu to provide O&M services for a power plantin Vanuatu. VUI earns a monthly fee based on man hours necessary to operate and maintain the facilities. The costsassociated with earning the management fee are included in salaries and employee benefits and also in general andadministrative expenses in the consolidated statement of operations. In 2011, Unelco, the former concessionaire, broughta case against the Republic of Vanuatu seeking judicial review in relation to the awarding of the electricity concession toVUI. This matter is described as Case No. 101 of 2011. The Republic of Vanuatu is the first defendant and VUI elected tojoin the suit as a second defendant in order to best preserve its interests. There are currently no claims in relation todamages or otherwise directed at VUI in the proceedings. Therefore, as of December 31, 2013 there are no potential VUI

3/28/2014 UNITED STATES
http://www.sec.gov/Archives/edgar/data/1082198/000137647414000074/prnx_10k.htm 16/125
losses that are probable and no accrual is deemed necessary.
In February 2014, during hearings in the Supreme Court of the Republic of Vanuatu (the Court), the Government ofVanuatu proposed a settlement with Unelco that would leave VUI without a claim to defend pertaining to the concessionand would effectively end the litigation in UNELCO’s favor. The proposed settlement called for a re-
8

3/28/2014 UNITED STATES
http://www.sec.gov/Archives/edgar/data/1082198/000137647414000074/prnx_10k.htm 17/125
Table of Contents
tender of the concession and required that any company who participates in the re-tender must waive any outstandingclaims against the Government of Vanuatu. VUI in response presented its position to the court arguing that VUI shouldhave an opportunity to be heard and that the Court should not accept the proposed settlement. The Justice is consideringVUI’s position and as of the date of this report has not yet rendered a decision. The Company anticipates that VUI willappeal any decision and stay the re-tender until appeals are complete which VUI’s counsel anticipates would not occurprior to July 2014. If the re-tender process would begin around July 2014, it would likely not be completed until at leastDecember 2014. The Company believes VUI will continue to provide O&M services until the retender is complete and along term concession deed is awarded. As of the date of this report, VUI continues to operate and maintain the systemand awaits a decision regarding the longer term concession deed.
In March 2014, the Utilities Regulatory Authority (URA or Commission) in Vanuatu has issued a decision on theelectricity tariff as it pertains to VUI operations. The terms of the ruling may result in lower revenue to VUI coupled withincreased responsibilities for street lighting maintenance and an opportunity to share in efficiency savings related to thehydro operations in Vanuatu, along with other measures. VUI has the opportunity to file a notice of grievance to theCommission on or before April 12, 2014; however, it is VUI’s intention to operate under the decision and reduce costs tomaximize the man-month fee to the extent allowed by the Court under the terms of any settlement accepted by the Court.In connection with these developments, the Company assessed if the related asset group was impaired as of December31, 2013 and found that it was not impaired.
The Utilities Regulatory Authority monitors and reports on the performance of electric utilities in Vanuatu. These reportsbring transparency to the performance of the power providers, having recently described how well VUI provided servicesto its customers since VUI began to manage the power structure on Vanuatu on January 1, 2011. This report found VUI tohave performed well in all areas including network performance, safety performance, customer service, reliability andquality of supply, and legislative and regulatory compliance.
Power Segment Outlook
According to ExxonMobil’s Outlook for Energy, from 2010 to 2040 (the “Outlook period”), the world’s population isprojected to grow from 7 billion to nearly 9 billion, and the global economy will more than double. As economies andpopulations grow, and as living standards improve for billions of people, the need for energy is expected to continue torise. Even with significant efficiency gains, global energy demand is projected to rise by about 35 percent from 2010 to2040. In the countries belonging to the Organization for Economic Cooperation and Development (OECD) - includingcountries in North America and Europe – energy saving practices and technologies are expected to keep power usagerelatively flat, even as these countries achieve economic growth and even higher living standards. In contrast, non-OECDpower demand is expected to grow by close to 65 percent due to growing prosperity and expanding economies. Billions ofpeople will be working to advance their living standards, thus requiring more power. The need for energy to makeelectricity is expected to remain the single biggest driver of demand. By 2040, electricity generation is expected to accountfor almost one half of the increase in global energy demand.
Utilities and other power producers around the world can choose from a variety of fuels to make electricity. They typicallyseek to use energy sources and technologies that enable reliable and relatively low-cost power generation while meetingenvironmental standards. Over the outlook period, we anticipate that public policies will continue to evolve to placetighter standards and/or higher costs on emissions while also promoting renewables. As a result, we expect the powersector to adopt combinations of fuels and technologies that reduce emissions but also raise the cost of electricity.
At the same time, the sector will also need to manage reliability challenges associated with increasing penetration ofintermittent renewables, like wind and solar. These renewables have a cost, related to reliability for times when the wind isnot blowing and the sun is not shining.
Fuel input to power generation is projected to rise by more than 50 percent, faster than any other sector, over the outlookperiod. In 2010, coal was the world’s number one fuel for power generation, accounting for about 45 percent of fueldemand. Though coal use will likely increase by about 55 percent in developing countries by 2040, it continues to loseground in developed countries – primarily to natural gas and renewables such as wind and solar.By 2040, demand for natural gas in the power generation sector is expected to rise by close to 80 percent. At that time,natural gas will be approaching coal as the world’s largest energy source for power generation, and coal’s share will have

3/28/2014 UNITED STATES
http://www.sec.gov/Archives/edgar/data/1082198/000137647414000074/prnx_10k.htm 18/125
dropped to about 30 percent.
9

3/28/2014 UNITED STATES
http://www.sec.gov/Archives/edgar/data/1082198/000137647414000074/prnx_10k.htm 19/125
Table of Contents
Increased local natural gas production in North America and elsewhere, along with expanded international trade, isexpected to supply the gas for power generation. By 2040, we expect that the use of nuclear power will approximatelydouble and renewables will increase by about 150 percent, led by wind and hydroelectric power.
Oil is expected to remain the largest single source of energy to 2040, growing around 25 percent. But the most significantshift in the energy mix occurs as natural gas displaces coal and is expected to become the second-largest fuel by 2025.Gas is expected to grow faster than any other major fuel source, with demand up 65 percent by 2040. An economical andclean fuel source, gas grows in importance as it helps meet rising power generation demand in the future. Because theyare abundant in supply and more economical to develop than other fuel sources, oil, natural gas and coal will continue toplay a major role in long-term energy supply. Together, these three fuels are expected to provide approximately 80 percentof total global energy by 2040 while nuclear, wind, solar and biomass will round out the balance of the fuel supply.
In recent years, a combination of two technologies in use for decades horizontal drilling and hydraulic fracturing hasenabled the energy industry to economically access and produce natural gas and oil found in shale and tight rock.Horizontal drilling allows a well to be drilled horizontally underground for thousands of feet, providing greater access toreservoirs to enhance and maximize productivity and economic resource recovery. This drilling practice also reduces theenvironmental footprint by enabling the drilling of multiple wells from a single location. In hydraulic fracturing, a solution– primarily water and sand, mixed with a small amount of chemicals – is injected into the rock thousands of feetunderground to open very thin cracks, allowing trapped natural gas and oil to migrate to the well. This technology hasbeen used in more than one million wells worldwide for the past six decades. Together these two technologies haveunlocked vast new supplies of natural gas and oil, which otherwise would not have been commercially viable. The resultsare changing the landscape of energy supply in North America, particularly in the United States. For example, six yearsago, production from North Dakota’s Bakken region registered a 100-fold increase in the last six years. Thesetechnologies now present new opportunities for construction of power plants and Pernix Group’s power segment is wellpositioned to pursue these opportunities.
Meanwhile, there is a growing demand to replace aging, coal-fueled power generation equipment. In addition, the U.S.government is seeking to improve efficiency and reduce energy consumption through seeking private energy facilitydevelopers to provide energy commodities and by replacing government owned and operated facilities with private sectorproviders. In the U.S., according to the U.S. Energy Information Administration , about 51% of all generating capacity (540gigawatts) was at least 30 years old at the end of 2012 and the industry anticipates the need for replacement and re-powering (and in some cases shutdown), principally with new natural gas fueled combined cycle power plants.
As mentioned above, Pernix is among few within the power industry that have constructed and operated power plants insome of the most remote locations in the world and we can readily scale to various size projects ranging from small to mid-sized, on a stand-alone project basis and to large projects in association with our partners. This flexibility in the scale ofprojects on which we serve reflects the well thought out design, agility and efficiency in our operations.
As noted above, PFL and VUI provide facility O&M services for diesel power plants under long term contracts ormemoranda of understanding. The Company has the capability to provide renewable power, including development,design, construction and facility O&M services for hydroelectric, solar and other green energy sources, and it is activelypursuing those opportunities in Fiji, Vanuatu, the Solomon Islands and other locations. Pernix is seeking stand alone andco-invest opportunities in the domestic and foreign power business with its one-stop shop approach which includes:development, design engineering, construction, commissioning and start-up, O&M and asset management.
10

3/28/2014 UNITED STATES
http://www.sec.gov/Archives/edgar/data/1082198/000137647414000074/prnx_10k.htm 20/125
Table of Contents
Corporate Segment
During the first quarter of 2013, the Company established Pernix RE, LLC, a limited liability company for the purpose ofpurchasing the land and building in which its corporate headquarters are maintained. The land and building werepurchased for $1.1 million from Baron Real Estate Holdings (Baron), a related party. The Company paid cash of $550,000and obtained seller financing from Baron for $550,000 with interest accruing at a rate of 4.0% per annum. As of December31, 2013, the note was fully paid. The assets were recorded at the carrying value utilized by Baron (a related party undercommon control as it is owned by Ernil Continental, S.A., BVI, Halbarad Group, Ltd., BVI, and Affiliates).
Discontinued Operations
Telesource CNMI, Inc.
On October 12, 2012 the Company sold its 100% interest in Telesource CNMI, Inc. (TCNMI) to Marianas EnergyTechnology, Inc., a Commonwealth of the Northern Mariana Islands company. The Company’s decision to sell its interestin TCNMI was approved by its Board of Directors and was intended to allow the Company to focus its efforts onoperations that are expected to provide a higher return on investment and higher potential growth. The buyer is anunrelated third party and the sale price was consistent with the fair market value at $1,000 settled in cash on the closingdate of October 12, 2012 plus buyer assumption of all liabilities. For the period from January 1, 2012 through October 12,2012, the loss from the TCNMI discontinued operations was $1.8 million. The gain on the sale of TCNMI was $1.1 millionand was recorded in the fourth quarter of 2012 as Additional Paid In Capital in accordance with accounting rules fordiscontinued operations occurring in connection with a quasi-reorganization.
RF Transmitter Design, Installation and Service
Until March 2012, we also operated an RF Transmitter Design, Manufacture and Installation segment through TransRadioSenderSysteme, Berlin, A.G. (TransRadio). Due to the violence and political turmoil from the “Arab Spring” in the MiddleEast coupled with the poor economic conditions in Europe, we received approval from the Pernix Board of Director’s todivest our 82% interest in TransRadio. This divestiture was intended to curtail losses that have been generated by theradio transmitter segment and allow the Pernix management team to focus its efforts on the construction and powergeneration services segments. On March 28, 2012, the Company sold its 82% interest in TransRadio to Bevita CommercialCorporation, a related party, for $1.2 million in cash. For the period from January 1, 2012 through March 28, 2012, the losson the discontinued operations ($1.1 million) and sale ($0.8 million) of TransRadio was $1.9 million.
Our Business Strategy
Our business strategy as a diversified contractor focuses on expanding our public (government funded or sponsored) aswell as private general construction, power construction and facilities O&M service segments. Key elements of ourstrategy include:
11

3/28/2014 UNITED STATES
http://www.sec.gov/Archives/edgar/data/1082198/000137647414000074/prnx_10k.htm 21/125
Table of Contents
Capitalize on opportunities in challenging geographic locations
Pernix has built its reputation on completing difficult projects in the most remote areas of the globe. For example, theCompany’s resume’ includes constructing a broadcasting station on the remote island of Tinian; managing the globallogistics necessary to construct or modify the US Embassies in Suva, Fiji and Niger; managing logistics and constructionof the containerized housing projects in Iraq, and finding and training a local workforce to bring electricity to regions inVanuatu that had never had electric service before. Pernix possesses the ability to help our clients understand, define andcomplete extraordinary projects of varying scale. Pernix Group understands what is required to execute and complete themost challenging projects regardless of whether the challenge is geographical, political, mechanical, or any combinationof the above. While many of our competitors are not equipped nor experienced to manage technically challenging projectsin remote geographic locations; Pernix Group specializes in and thrives on such challenges.
We intend to leverage our leading positions in the general construction, power construction and facilities O&Mcapabilities to continue to expand our services and revenue. We believe that the need for infrastructure upgrades,governmental facilities as well as diesel-fired, hydroelectric, biomass, natural gas fueled combined cycle and solar powerwill result in continued opportunities in our core markets. All of our business segments have unique integrationopportunities particularly in the construction and O&M markets. With our ability to manage projects internationally,successful track record and our global resources, we believe we are well-positioned to compete for projects in theseglobal markets.
Utilize our long-standing relationships with industry specialists
We have long-standing relationships with a number of industry specialists worldwide. These relationships have beenestablished to enhance our ability to satisfy our clients and deliver comprehensive solutions for customer needs. Bycollaboratively consolidating knowledge bases, skill sets, resources and contacts, we believe we have the ability toefficiently export our leading edge technical skills to any region in the world in which our clients may need them. We alsocontinually develop new relationships that provide us with the necessary agility and expertise to meet design,construction and operating needs of new and existing customers as their needs evolve.
Expand and foster positive relationships with governments, public agencies and private entities worldwide
We will continue to focus on maintaining and expanding our existing relationships with governments, public agencies andprivate entities worldwide and diversifying our customer base within these sectors both domestically and internationally.We intend to penetrate these markets through strategic relationships, co-invest opportunities and acquisitions. Webelieve that to develop new contacts and opportunities we must continue to consistently exceed existing customerexpectations; something we strive to do with every opportunity to serve. We will find new opportunities throughpromoting our Company’s resume and our reputation in the marketplace to targeted customers. These efforts will besupplemented by market intelligence gathering and providing customized solutions based upon an understanding of thespecific needs of each governmental agency and each private customer. Upon identifying these opportunities we willcontinue to expand our network of international contacts and communicate our capabilities which in turn, will furtherexpand our client base, as evidenced by our award in the Solomon Islands.
12
3/28/2014 UNITED STATES
http://www.sec.gov/Archives/edgar/data/1082198/000137647414000074/prnx_10k.htm 22/125
Table of Contents
Continue to pursue our acquisition strategy
We intend to consider acquisitions and co-investment opportunities to grow our general construction, powerconstruction, and facilities O&M businesses. The Pernix Group management team has defined what it considers to bedesired potential target characteristics including: companies of a scale and scope that will provide manageable growththat can be readily integrated, will be accretive to earnings, and will facilitate new client relationships. Ideal targets willalso expand Pernix Group’s domestic presence and diversify and balance the Company’s profile, credit risk and providemore consistency to Pernix Group’s revenue and earnings streams. We will search for other successful companies whosegrowth can be enhanced through a synergistic combination of respective resources. This approach will expand,strengthen and diversify our market leadership positions geographically and technically across end markets. We believethat the trend towards consolidation in the industries in which we operate will produce candidates that align with ouracquisition strategy.
Strengthen and support human capital
Our experienced employees and management are our most valuable resources. Attracting and retaining key personnel hasbeen and will remain critical to our success. Pernix Group’s CEO and V.P. of Construction each bring over 30 years ofsignificant industry experience to the Company. In addition, the Company’s V.P. of Power brings over 35 years ofprogressive industry experience in the energy and independent power businesses, having led successful development ofmore than 2,350 MW of power generation both in the U.S. and internationally. He has broad ranging experiencestructuring complex power projects, including EPC contract negotiations, fuels supply, asset management, projectdevelopment, project and plant acquisitions, operations, owner's construction oversight, program management, andproject finance. During his distinguished career, he has worked with power utilities, equipment manufacturers,independent power producers, construction firms and consulting firms. In his new capacity, he will be responsible forgrowing and managing Pernix's power business, including O&M contract execution and construction of new powergenerating facilities and related infrastructure in the U.S. and overseas. His role will include long-range/strategic planning,new project sourcing and evaluation, project pre-qualification and bidding, project finance and execution of awardedmandates. Additionally, he will oversee the company's existing power operations in the Pacific region.
Our customers benefit from the extensive experience of the Pernix team members; we have engineers at Pernix with projectexperience in dozens of different countries. The management team in the Finance and Administration areas have broughtPernix Group approximately 50 years of experience in investment banking, “Big 4” public accounting, and Fortune 250finance departments. During 2013, the Company significantly enhanced its business development and operationsmanagers in the construction segment. A large percentage of our employees have technical and professionalbackgrounds and undergraduate and/or advanced degrees.
We will continue to focus on providing our personnel with training and other personal and professional growthopportunities, performance-based incentives, opportunities for stock ownership and other competitive benefits in order tostrengthen and support our human capital base. The Company has three equity incentive plans and the Company hasbroadened participation in the equity plans based on performance.
13

3/28/2014 UNITED STATES
http://www.sec.gov/Archives/edgar/data/1082198/000137647414000074/prnx_10k.htm 23/125
(1)
Table of Contents
Effective December 31, 2013, Mr. Ralph Beck retired as the Chairman of the Company's Board of Directors after havingmade significant contributions during his tenure as a Director since 1999. In connection with Mr. Beck's retirement, theBoard appointed Mr. Don J. Gunther as the new Chairman of the Board. Mr. Gunther has served on the Company's Boardof Directors and on the Compensation Committee since December 2012 and he brings a wealth of construction and energyknowledge to the Board. He is currently serving as Chairman of the Board of INgage Networks, a high-tech company thatis a leading enterprise networking organization and is a director of WPX Energy, Inc., an oil and gas exploration andproduction company. Until his retirement from full time employment in 1999, Mr. Gunther was Vice Chairman and Directorof the Bechtel Group, where he had responsibility for all of the global industry units and all corporate functions, includingproject management, engineering, procurement, construction, information services, information technology and contracts.
The Board of Directors also filled the seat vacated as a result of Mr. Beck's retirement by appointing Mr. C. RobertCampbell as a new Director and Chairman of the Audit Committee. He also serves on the Compensation Committee. Mostrecently Mr. Campbell served as Executive Vice President and Chief Financial Officer of MasTec, Inc., a $4.3 billioninfrastructure construction company based in Coral Gables, Florida (NYSE: MTZ). He also currently serves as a Directorand Audit Committee Chairman of Forward Air, Inc., a $652 million NASDAQ-listed transportation company. Bobpreviously served as its Compensation Committee Chairman.
Our Business Segments
The following table sets forth the revenue attributable to our business segments for the periods indicated (1):
Year End December 31,
2013 2012
General Construction $ 67,776,314 $ 114,872,655
Power Generation Services 5,810,652 5,150,811
Corporate 175,182 —
Total revenue from ContinuedO perations $ 73,762,148 $ 120,023,466
Revenue from Discontinued Operations — 2,178,038
Total Revenue $ 73,762,148 $ 122,201,504
For additional financial information including net income by segment, see Note 22 in the notes to ourconsolidated financial statements.
Our Clients by Segment
The general construction segment has one major customer, the U.S. Department of State. The loss of this customer wouldhave a material adverse impact on the Company’s consolidated financial performance. This customer represents 90% ofthe consolidated total revenues of $73.8 million. The loss or reduction of business from this customer could materially andnegatively impact the Company’s net income, cash flows and financial condition.
As of December 31, 2013, the power generation services segment has three primary customers: the FEA, the Governmentof Vanuatu and Solomon Islands Electric Authority (SIEA). In 2013, none of these customers individually account formore than 10% of the consolidated total revenues. However, FEA and the Government of Vanuatu account for $0.8 millionand $1.0 million of the Company’s 2013 pre-tax income, respectively. The loss of either of these customers couldmaterially and negatively impact the Company’s net income, cash flows and financial condition. For additional discussionof 2014 developments pertaining to VUI operations see page 9.
14

3/28/2014 UNITED STATES
http://www.sec.gov/Archives/edgar/data/1082198/000137647414000074/prnx_10k.htm 24/125
Table of Contents
The Corporate revenue consists of rental income received from third parties for space leased in the corporate officeheadquarters in Lombard, Illinois. The Corporate segment does not have any major customers in 2013.
Joint Ventures and Other Arrangements
Some of our larger contracts may operate under joint ventures or other arrangements under which we team with otherreputable companies, typically companies with which we have worked for many years. This is often done where the scaleof the project dictates such an arrangement or when we the parties want to strengthen either its combined market positionor technical skills. One example of such an arrangement is PS JV, our joint venture with Serka. Several such joint venturesand strategic alliances have been established in the past several years and we continue to develop more strategicrelationships.
Competition
The professional, technical and management support services markets we serve are highly fragmented and we competewith a large number of regional, national and international companies. Certain of these competitors have greater financialand other resources than we do. Others are smaller, more specialized, and concentrate their resources in particular areas ofexpertise. The extent of our competition varies according to the particular markets and geographic area. The degree andtype of competition we face is also influenced by the type and scope of a particular project. Our clients make competitivedeterminations based upon qualifications, experience, performance, reputation, technology, customer relationships andability to provide the relevant services in a timely, safe and cost-efficient manner. Pernix Group utilizes partnerships andother key strategic relationships to obtain an advantage with regard to niche specialization, to obtain flexibility withregard to scale and scope of projects it may be involved with thereby enhancing the combined resumes of Pernix and itspartners. Pernix Group will continue to focus on providing the “best in class” procurement and contract executionprocesses as well as world class customer service in an agile fashion.
Insurance and Risk Management
We maintain insurance covering professional liability and claims involving bodily injury and property damage. Weconsider our present limits of coverage, deductibles, and reserves to be adequate. Wherever possible, we endeavor toeliminate or reduce the risk of loss on a project through the use of quality assurance/control, risk management, workplacesafety and similar methods. Risk management is an integral part of our project management approach and our projectexecution process.
Regulation
We are regulated in a number of fields in which we operate. In the United States, we primarily deal with the United StatesDepartment of State to bid and execute on the construction of U.S. embassies, containerized housing unit task orders andother projects. When working with this agency, we must comply with laws and regulations relating to the formation,administration and performance of contracts. These laws and regulations, among other things:
• require certification and disclosure of all cost or pricing data in connection with various contract negotiations;
• impose procurement regulations that define allowable and unallowable costs and otherwise govern our right toreimbursement under various cost-based U.S. government contracts; and
• restrict the use and dissemination of information classified for national security purposes and the exportation of certainproducts and technical data.
We are also subject to various government laws, regulations and/or applicable laws pertaining to the protection of theenvironment, primarily in the areas of water and air pollution, i.e. Council on Environmental Quality, the EnvironmentalProtection Agency (EPA) and FEA. These laws and regulations in many cases require a lengthy and complex process ofobtaining and maintaining licenses, permits and approvals from local agencies. As regulations are enacted or adopted inany of these jurisdictions, we cannot predict the effect of compliance therewith on our business. Our failure to complywith any applicable requirements could result in delays in proceeding with any projects under development or require

3/28/2014 UNITED STATES
http://www.sec.gov/Archives/edgar/data/1082198/000137647414000074/prnx_10k.htm 25/125
modifications to operating facilities. During periods of non-compliance, our operating facilities also may be forced to shutdown until the instances of non-compliance are corrected and/or be subject to fines or penalties. We are responsible forensuring compliance of facilities with applicable requirements and, accordingly, we attempt to minimize these risks bydealing with reputable contractors and using appropriate technology to measure compliance with the applicablestandards.
15

3/28/2014 UNITED STATES
http://www.sec.gov/Archives/edgar/data/1082198/000137647414000074/prnx_10k.htm 26/125
Table of Contents
Presently, neither the Customer Choice Act nor other similar proposed legislation dealing with U.S. power policies directlyimpact us because the legislation and restructuring plan pertain to the retail market or new contracts in wholesale markets.However, we could be impacted in the future by, among other things, increases in competition as a result of deregulation.Compliance with federal, state, local and foreign laws enacted for the protection of the environment have had nosignificant effect on our capital expenditures, earnings, or competitive position to date. We are actively monitoring thesedevelopments in power proceedings in order to evaluate the impact on existing projects, and also to evaluate newbusiness opportunities created by the restructuring of the electric utility industry and technological developmentstherein.
Contract Backlog
Backlog represents the amount of revenue the Company expects to realize from work to be performed on uncompletedconstruction contracts in progress at December 31, 2013, and from construction contractual agreements on which workhas not yet begun. The following summarizes changes in backlog on construction contracts during the fiscal year endedDecember 31, 2013:
Balance at December 31, 2012 $ 67,901,575
New construction contracts / amendments to contracts in 2013 37,000,391
Less: construction revenue earned as of December 31, 2013 (67,776,314)
Balance at December 31, 2013 $ 37,125,652
Management anticipates that the full backlog of $37.1 million as of December 31, 2013, will be recognized as revenueduring 2014. Additionally, the table does not include $45.5 million of new awards and modifications received in early 2014.The new awards include the $29.1 million contract awarded to PFL in February 2014 to add 36MW of capacity to theKinoya diesel power station or a $17.0 million contract awarded in February 2014 to Pernix / LTC JV to construct a twostory laboratory on the campus of Texas A&M University. The backlog table also does not include modificationsreceived in early 2014. Finally, the table does not include revenue associated with our long term contract or memo ofunderstanding for power operating and maintenance services or construction segment stipend income. The stipendincome is related to contracts that were not ultimately awarded to the Company as they are not directly related to coreconstruction work.
ITEM 1A. RISK FACTORS
Not applicable.
ITEM 1B. UNRESOLVED STAFF COMMENTS
Not applicable.
ITEM 2. PROPERTIES
Our corporate offices are located in Lombard, Illinois. We leased the office space until March 4, 2013, when we purchasedthe office building in which our corporate offices are located. In order to support our relationship with the U.S.Department of State and OBO, as well as to facilitate contract execution that exceeds our customers’ expectations, PS JVhas leased space in Vienna, Virginia. The lease term is for a period of 48 months beginning in January of 2012. In Fiji, ourpower generation subsidiary is leasing office space for a two year term that ends on June 30, 2014. In December 2013, weentered into a one year non-cancelable lease agreement effective beginning in March 2014 in Colorado to house a regionaladministrative office. During late 2012, we renewed a non-cancelable lease agreement effective on November 15, 2012 tohouse our United Arab Emirates regional office in Dubai. We believe our current properties are adequate for our businessoperations and are not currently underutilized. We may add additional facilities from time to time in the future as the needarises. In addition to corporate offices, we provide housing for several employees located in remote locations forconstruction and power facilities O&M work. These leases are not individually significant and are generally living

3/28/2014 UNITED STATES
http://www.sec.gov/Archives/edgar/data/1082198/000137647414000074/prnx_10k.htm 27/125
expenses that are considered in the cost and pricing of the related contracts and in some cases are billed to the jointventure under which the related contract work is being performed.
16

3/28/2014 UNITED STATES
http://www.sec.gov/Archives/edgar/data/1082198/000137647414000074/prnx_10k.htm 28/125
Table of Contents
ITEM 3. LEGAL PROCEEDINGS
As a government contractor, we are subject to various laws and regulations that are more restrictive than those applicableto non-government contractors. Intense government scrutiny of contractors’ compliance with those laws and regulationsthrough audits and investigations is inherent in government contracting, and, from time to time, we receive inquiries,subpoenas, and similar demands related to our ongoing business with government entities. Violations can result in civil orcriminal liability as well as suspension or debarment from eligibility for awards of new government contracts or optionrenewals.
The Company has been involved in various lawsuits arising in the ordinary course of business. Although the outcome ofour legal proceedings cannot be predicted with certainty and no assurances can be provided, except for the matterdiscussed below, in the opinion of our management, based upon current information and discussions with counsel, noneof the investigations, claims and lawsuits in which we are involved is expected to have a material adverse effect on ourconsolidated financial position, results of operations, cash flows, or our ability to conduct business. From time to time, weestablish reserves for litigation when we consider it probable that a loss will occur.
In late 2010, VUI was selected by the Government of the Republic of Vanuatu to provide O&M services for a power plantin Vanuatu. In 2011, Unelco, the former concessionaire, brought a case against the Republic of Vanuatu seeking judicialreview in relation to the awarding of the electricity concession to VUI. This matter is described as Case No. 101 of 2011.The Republic of Vanuatu is the first defendant and VUI elected to join the suit as a second defendant in order to bestpreserve its interests. There are currently no claims in relation to damages or otherwise directed at VUI in the proceedings.Therefore, as of December 31, 2013 there are no potential VUI losses that are probable and no accrual is deemednecessary.
In February 2014, during hearings in the Supreme Court of the Republic of Vanuatu (the Court), the Government ofVanuatu proposed a settlement with Unelco that would leave VUI without a claim to defend pertaining to the concessionand would effectively end the litigation in UNELCO's favor. The proposed settlement called for a re-tender of theconcession and required that any company who participates in the re-tender must waive any outstanding claims againstthe Government of Vanuatu. VUI in response presented its position to the court arguing that VUI should have anopportunity to be heard and that the Court should not accept the proposed settlement. The Justice is considering VUI'sposition and as of the date of this report has not yet rendered a decision. The Company anticipates that VUI will appealany decision and stay the re-tender until appeals are complete which VUI's counsel anticipates would not occur prior toJuly 2014. If the re-tender process would begin around July 2014, it would likely not be completed until at least December2014. The Company believes VUI will continue to provide O&M services until the retender is complete and a long termconcession deed is awarded. As of the date of this report, VUI continues to operate and maintain the system and awaits adecision regarding the longer term concession deed.
ITEM 4. MINE SAFETY DISCLOSURES
Not Applicable.
17

3/28/2014 UNITED STATES
http://www.sec.gov/Archives/edgar/data/1082198/000137647414000074/prnx_10k.htm 29/125
Table of Contents
PART II
ITEM 5. MARKET FOR REGISTRANT’S COMMON EQUITY, RELATED STOCKHOLDER MATTERS AND ISSUERPURCHASES OF SECURITIES
Our common stock is traded in the Over-the-Counter Bulletin Board (OTCBB) under the symbol “PRXG.” As of December31, 2013, there were 181 shareholders of record. The following table sets forth the low and high closing sales prices of ashare of our common stock during each of the fiscal quarters presented, based upon quotations on the OTCBB reportingsystem.
High Sales
Price ($) Low SalesPrice ($)
Fiscal 2013:
First quarter 2.75 2.75
Second quarter 5.00 2.49
Third quarter 2.50 2.50
Fourth quarter 2.69 2.50
High Sales
Price ($) Low SalesPrice ($)
Fiscal 2012:
First quarter 0.75 0.75
Second quarter 2.75 2.50
Third quarter 2.50 2.50
Fourth quarter 2.50 2.50
There were no stock transactions on the OTCBB during the first and fourth quarters of 2012. We have not paid a cashdividend on common stock since our inception and we currently have no plans to pay cash dividends on common stockin the foreseeable future.
The Company implemented an incentive stock option plan for employees (the “ISOP”) in December 2011, a long termincentive plan for non-employee directors and consultants in late 2012 and an equity incentive plan for employees anddirectors in late 2013. As of December 31, 2013 and 2012, there were 379,000 and 152,500 option awards outstanding underthe ISOP, respectively. There were 78,500 and zero option awards outstanding as of December 31, 2013 and 2012,respectively, under the LTIP plan. In February 2014, the Company awarded an additional 222,000 options and 153,000options to employees and to directors and consultants under the Equity Incentive Plan (EIP), respectively.
Unregistered Sales of Equity Securities and Use of Proceeds
In December 2013, Pernix Group, Inc. (the “Company”) entered into Preferred Stock Purchase Agreements (the “SPAs”)with each of Ernil Continental S.A., BVI (“Ernil”) and Halbarad, Ltd., BVI (“Halbarad”). Pursuant to the terms of the SPAs,Ernil and Halbarad made investments of $2,750,000 and $2,250,000, respectively, in the Company in the form of 550,000shares and 450,000 shares, respectively, of Series A Cumulative Convertible Preferred Stock. The SPA transactions closedon December 30, 2013 at which time the preferred stock certificates were issued and cash was received by the Company.No other unregistered securities have been issued since 2010. Previously issued unregistered securities were disclosed inprior periodic filings on Forms 10-Q and 10-K for those periods.
ITEM 6. SELECTED FINANCIAL DATA
Not applicable.
18

3/28/2014 UNITED STATES
http://www.sec.gov/Archives/edgar/data/1082198/000137647414000074/prnx_10k.htm 30/125
Table of Contents
ITEM 7. MANAGEMENT’S DISCUSSION AND ANALYSIS OF FINANCIAL CONDITION AND RESULTS OFOPERATIONS
You are cautioned that this Annual Report on Form 10-K and, in particular, the “Management’s Discussion and Analysisof Financial Condition and Results of Operations”, contains forward-looking statements concerning future operations andperformance of the Company within the meaning of the Private Securities Litigation Reform Act of 1995. You should notplace undue influence on these forward-looking statements. Forward-looking statements are subject to market, operatingand economic risks and uncertainties that may cause the Company’s actual results in future periods to be materiallydifferent from any future performance suggested herein. Factors that may cause such differences include, among others:increased competition, increased costs, changes in general market conditions, changes in the regulatory environment,changes in anticipated levels of government spending on infrastructure, and changes in loan relationships or sources offinancing, political instability or violence. Such forward-looking statements are made pursuant to the Safe HarborProvisions of the Private Securities Litigation Reform Act of 1995.
The Company effected an elective accounting quasi-reorganization as of September 30, 2012. The consolidated financialstatements as of December 31, 2013 and 2012 give effect to adjustments to the fair value of assets and liabilities that arenecessary when adopting “fresh-start” reporting and the subsequent amortization thereof.
In this report, we use the terms “Pernix Group”, “PGI”, “the Company”, ‘we”, “us”, and “our” to refer to PernixGroup, Inc. and its consolidated subsidiaries. Unless otherwise noted, references to years are for calendar years.
Executive Summary
The Executive Summary in this section is intended to highlight significant information and to provide context withinwhich to consider the Company’s results of operations. During 2013 and 2012, the Company earned revenues of $73.8million and $120.0 million, representing the two highest revenue generating years in company history. Although there wasa year over year reduction in revenue and pretax income, it is instructive to view the change in the context of the generaldirection of growth for the Company in the past five years as it grew revenues during that period from $14.8 million in 2009to the current levels as presented below:
Total Consolidated Revenue by year for 2009 through 2013 (in millions):
2009 2010 2011 2012 2013
$14.8 $26.2 $58.0 $120.0 $73.8
Management believes the 2013 revenue decline from record high levels to be temporary in nature and common in theconstruction industry reflective of the ebbs and flows due to the timing of winning new contracts. In 2013, the Companyexperienced a lower level of new contracts than in prior years. In early 2014, the Company has won contracts totaling over$45.5 million, more in line with our experience prior to 2013.
The Company earned consolidated pretax income from continuing operations attributable to Pernix shareholders of $0.4million and $3.3 million during 2013 and 2012, respectively. The year over year reduction reflects the reduction in Pernixshare of construction margin ($4.7 million) due to the completion and wind down of two large containerized housingprojects in late 2012 and 2013. The reduction was partially offset with lower operating expenses and higher pretax incomerelated to the Power generation segment. Further discussion regarding operating results is provided in Results ofOperations.
Net (loss) income attributable to Pernix common shareholders was ($4.7) million and $0.4 million in 2013 and 2012,respectively. Included in the 2013 net income results is a $4.9 million deferred income tax expense related to an increase inthe valuation allowance on deferred tax assets. This expense is a non-cash expense and has no impact on the Company’sliquidity, cash flows, or on its ability to execute projects or conduct ongoing operations. Management does not anticipatethis to be a recurring expense in the foreseeable future as the related deferred tax assets are fully reserved at December 31,2013. Central to management’s decision to increase the valuation allowance were its historical level of new business andchange orders won during 2013 compared to the preceding two years. In early 2014, the Company has received awardstotaling over $45.5 million, more in line with our experience prior to 2013. Of these recent awards, the $29.1 million award to

3/28/2014 UNITED STATES
http://www.sec.gov/Archives/edgar/data/1082198/000137647414000074/prnx_10k.htm 31/125
PFL in Fiji will not impact U.S. taxable income.
19

3/28/2014 UNITED STATES
http://www.sec.gov/Archives/edgar/data/1082198/000137647414000074/prnx_10k.htm 32/125
Table of Contents
Included in the 2012 net income attributable to Pernix common shareholders is a ($3.7) million net loss from discontinuedoperations. There were no such losses during 2013.
Adjusting 2013 and 2012 net income to exclude the net impact of the 2013 and 2012 tax expense (benefit) that was primarilydue to changes in the deferred tax valuation allowance and the 2012 losses of the discontinued operations of TransRadioand TCNMI, net income attributable to Pernix Group would have been $0.4 million ($0.04 basic and diluted earnings pershare) in 2013 and $3.3 million, ($0.35 basic and diluted per share) for 2012, as explained and reconciled in the table below.
We use pretax income from continuing operations attributable to Pernix Group, Inc to evaluate our performance, bothinternally and as compared with our peers, because this measures exclude certain tax items (primarily pertaining tochanges in the valuation allowance) and discontinued operations that may not be indicative of our core operating results,as well as items that can vary widely across different industries or among companies within the same industry.Additionally, these measures provide a baseline for analyzing trends in our underlying business. We believe this non-U.S. GAAP financial measure provides meaningful information and helps investors understand our financial results andassess our prospects for future performance. Because non-U.S. GAAP financial measures are not standardized, it may notbe possible to compare these financial measures with other companies' non-U.S. GAAP financial measures having thesame or similar names. This financial measure should not be considered in isolation from, as substitutes for, or alternativemeasures of, reported net income from continuing operations, diluted earnings per share from continuing operations andnet cash provided by operating activities, and should be viewed in conjunction with the most comparable GAAP financialmeasures and the provided reconciliations thereto. We believe these non-U.S. GAAP financial measures, when viewedwith our U.S. GAAP results and the related reconciliations, provide a more complete understanding of our business. Westrongly encourage investors to review our consolidated financial statements and publicly filed reports in their entiretyand not rely on any single financial measure.
The following table presents a reconciliation of net income attributable to Common Stockholders of Pernix Group, Inc. tonon-GAAP pretax income from continuing operations and non-GAAP basic earnings per share from continuingoperations attributable to Common Stockholders of Pernix Group, Inc:
Non-GAAP net income and basic earnings per share attributable to Pernix Group, Inc. Common Stockholdersreconciliation:
(in thousands, except per share data)
For the YearEnded December
31, 2013
For the YearEnded December
31, 2012
Net income attributable to Common Stockholders of Pernix Group, Inc. $ (4,680) $ 422
Plus:
Losses attributable to TransRadio and TCNMI sold in 2012 — 3,663
Less:
Net impact of income tax expense (benefit) 5,041 (773)
Non-GAAP Pretax Income from continuing operations attributable to
Common Stockholders of Pernix Group, Inc. $ 361 $ 3,312
Non-GAAP Basic earnings (loss) per share attributable to Pernix Group,
Inc. $ 0.04 $ 0.35
Non-GAAP Diluted earnings (loss) per share attributable to Pernix
Group, Inc. $ 0.04 $ 0.35
Basic weighted shares outstanding 9,403,697 9,403,697
Diluted weighted shares outstanding 9,403,697 9,403,697
After adjusting for these nonrecurring items, financial performance was positive in both periods. The constructionbacklog has decreased year over year from $67.9 million to $37.1 million. Management is keenly focused on bidding onand winning new contracts on a stand-alone basis as well as with our strategic partners. In early 2014, the Company hasentered into new contract awards totaling over $45.5 million thereby restoring and in fact exceeding the backlog thatexisted as of December 31, 2012. Of these new awards, $29.1 million is not U.S. taxable as it is a PFL project and as such istaxable in Fiji. Pernix will also continue to explore acquisition and co-investment opportunities in both business segmentsto obtain additional backlog, expand our customer base and optimize the use of our tax loss carryforwards.

3/28/2014 UNITED STATES
http://www.sec.gov/Archives/edgar/data/1082198/000137647414000074/prnx_10k.htm 33/125
Although the revenue from our Power generation segment represents just 7.9% and 4.3% of consolidated revenue, in 2013and 2012, respectively, it consistently accounts for a significant portion of the Company’s pretax income from continuingoperations.
20

3/28/2014 UNITED STATES
http://www.sec.gov/Archives/edgar/data/1082198/000137647414000074/prnx_10k.htm 34/125
Table of Contents
There are two significant recent developments in the power segment that significantly impact its future performance. First,in February 2014, PFL received an award to add 36MW (approximately 48% increase) of capacity to the Kinoya dieselpower station. In addition to providing construction margins from the construction project, the Company anticipatesoperating and maintaining the additional capacity along with its existing capacity for this customer through 2023, to be inline with our current long term concession deed. PFL has accounted for $0.8 million and $0.7 million of Pernixconsolidated pretax income during 2013 and 2012, respectively. Second, VUI is currently awaiting a decision by theVanuatu judiciary regarding a potential re-tender of the long term concession deed to operate and maintain the diesel andhydro power operations in Vanuatu. In addition, during March 2014, URA issued a decision on the electricity tariff as itpertains to VUI operations. The terms of the ruling may result in lower revenue to VUI coupled with increasedresponsibilities for street lighting maintenance and an opportunity to share in efficiency savings related to the hydrooperations in Vanuatu, along with other measures. VUI has the opportunity to file a notice of grievance to theCommission on or before April 12, 2014; however, it is VUI’s intention to operate under the decision and reduce costs to
maximize the man-month fee to the extent allowed by the Court under the terms of any settlement accepted by the Court. Ifa retender is completed and VUI is not awarded the concession deed or if the VUI is unable to sufficiently reduceoperating costs under the new tariff ruling, it could have a material and negative impact on the Company’s income, cashflows and financial condition. VUI accounted for $1.0 million of Pernix consolidated pretax income in 2013 and 2012. VUIhas received high ratings from the Utilities Regulatory Authority of Vanuatu for work performed under the MOU to datebut the Company does not know the likelihood of a successful retender bid by VUI or the financial impact of the new tariffruling.
Industry experts predict that construction in emerging markets will make up more than half of the global constructionmarket by the end of this decade. In light of its experience, Pernix is uniquely qualified to perform in emerging marketswhich can be more remote and logistically challenging environments. The combination of growing demand to supplementor replace aging power generation equipment, growing demand for power in non-OECD countries and demand to improvepower efficiency through the use of new power technologies presents a wealth of opportunities for construction anddistribution of power. Pernix Group’s power segment is well positioned to pursue these opportunities which are expectedto be smaller in size and fit well with our agile organizational structure.
Our revenue is dependent on our ability to attract and retain qualified and productive employees, identify businessopportunities, allocate our labor resources to profitable markets, align with strategic partners, secure new contractsand renew existing client agreements among other factors. Moreover, as a professional services company, maintaining thehigh quality of the work generated by our employees is integral to our revenue generation.
Our costs consist primarily of the compensation we pay to our employees, including salaries, fringe benefits, the costs ofhiring subcontractors and other project-related expenses, the costs associated with maintaining and operating dieselpower plants (fuel related costs) and sales, general and administrative costs.
Critical Accounting Policies and Estimates
Our financial statements are presented in accordance with accounting principles generally accepted in the United Statesof America (GAAP). Highlighted below are the accounting policies that management considers significant tounderstanding the operations of our business.
Basis of Presentation
The consolidated financial statements include the accounts of all majority-owned subsidiaries in which control does notrest with other entities, as well as joint ventures which are determined to be variable interest entities and in which theCompany is the primary beneficiary. During 2013 and 2012, the variable interest entities and related financial results arenot material. All inter-company accounts have been eliminated in consolidation. The Company effected an electiveaccounting quasi-reorganization as of September 30, 2012, which eliminated its accumulated deficit in retained earningsand accumulated other comprehensive income (loss) against additional paid-in-capital. The consolidated financialstatements as of December 31, 2013 and 2012 reflect the adjustments to fair value of assets and liabilities that wererecorded in connection with the implementation of the quasi-reorganization and subsequent amortization thereof. TransRadio and TCNMI results are presented as discontinued operations in the 2012 consolidated statement ofoperations. See Notes 1, 2 and 8 in our notes to our consolidated financial statements.

3/28/2014 UNITED STATES
http://www.sec.gov/Archives/edgar/data/1082198/000137647414000074/prnx_10k.htm 35/125
21

3/28/2014 UNITED STATES
http://www.sec.gov/Archives/edgar/data/1082198/000137647414000074/prnx_10k.htm 36/125
Table of Contents
Revenue Recognition
We offer our services through two operating business segments: General Construction and Power Generation Serviceswhich are supported by the Corporate segment. Prior to March 28, 2012, the Company also operated the RF TransmitterDesign, Installation and Service segment. Revenue recognition for each of the non-corporate segments is described bysegment below.
General Construction Revenue. Revenue from construction contracts is recognized using the percentage-of-completion
method of accounting based upon costs incurred and estimated total projected costs. Our current projects with theUnited States Government are design/build contracts with fixed contract prices and include provisions of termination forconvenience by the party contracting with us. Such provisions also allow payment to us for the work performed throughthe date of termination.
Revenues recognized under the percentage-of-completion method require applying a percentage (actual costs incurredthrough the reporting date divided by the total estimated costs to complete the project) to the fixed contract price. TheCompany only uses approved contract changes in its revenue recognition calculation. This method of revenuerecognition requires that we estimate future costs to complete a project. Estimating future costs requires judgment of thevalue and timing of material, labor, scheduling, product deliveries, contractual performance standards, liability claims,impact of change orders, contract disputes as well as productivity. In addition, sometimes clients, vendors andsubcontractors will present claims against us for recovery of costs they incurred in excess of what they expected to incur,or for which they believe they are not contractually responsible. In turn, we may also present claims to our clients,vendors and subcontractors for costs that we believe were not our responsibility or may be beyond our scope of work.The Company will include costs associated with these claims in its financial information when such costs can be reliablyidentified and estimated. Similarly, the Company will include in revenue amounts equal to costs for claims, where theoutcome is probable that the claim will be found in the favor of the Company. Our estimates, assumptions and judgmentsare continually evaluated based on known information and experience. However, the actual amounts could besignificantly different from our estimates. Costs and estimated earnings in excess of amounts billed to customers arerecognized as an asset. Amounts billed in excess of costs and estimated earnings are recognized as a liability. TheCompany will record a provision for losses when estimated costs exceed estimated revenues. To mitigate risks associatedwith cost overruns, the Company may employ fixed price contracts with subcontractors.
Unbilled accounts receivable (costs in excess of billings) are assets that represent the contract revenue recognized to dateusing the percentage-of-completion accounting method but not yet invoiced to the client due to contract terms or thetiming of the accounting invoicing cycle. Billings in excess of costs on uncompleted contracts represent the billings todate, as allowed under the terms of a contract, but not yet recognized as contract revenue using the percentage-of-completion accounting method.
Cost of Construction Revenue. Cost of construction revenue consists of direct costs on contracts, including labor andmaterials, amounts payable to subcontractors, direct and certain indirect overhead costs, equipment expense (primarilydepreciation, maintenance, and repairs), interest associated with construction projects, and insurance costs. TheCompany records a portion of depreciation in cost of revenue. Contracts frequently extend over a period of more than oneyear. Revisions in cost and profit estimates during construction are recognized in the accounting period in which the factsthat require the revision become known. Losses on contracts are provided for in total when determined, regardless of thedegree of project completion. Claims for additional contract revenue are recognized in the period when it is probable thatthe claim will result in additional revenue and the amount can be reasonably estimated.
Power Generation Service Revenue. The Company receives a combination of fixed and variable monthly payments ascompensation for its production of power. The variable payments are recognized based upon power produced and billedto the customer as earned during each accounting period.
RF Transmitter Design, Installation and Service Revenue. Any revenues associated with TransRadio contracts areincluded in the loss from discontinued operations for the year ended December 31, 2012. See Note 8 in the notes to ourconsolidated financial statements regarding this discontinued operation. Contracts for TransRadio products and servicesgenerally contained customer-specified acceptance provisions. The Company evaluated customer acceptance bydemonstrating objectively that the criteria specified in the contract acceptance provisions were satisfied and recognized

3/28/2014 UNITED STATES
http://www.sec.gov/Archives/edgar/data/1082198/000137647414000074/prnx_10k.htm 37/125
revenue on these contracts when the objective evidence and customer acceptance are
22

3/28/2014 UNITED STATES
http://www.sec.gov/Archives/edgar/data/1082198/000137647414000074/prnx_10k.htm 38/125
Table of Contents
demonstrated. Certain TransRadio contracts required training services separate from acceptance of provisions and aregenerally provided after the delivery of the product to the customer. These services were a separate element of thecontract that is accounted for as revenue was earned. The amount attributable to services is based on the fair value of theservices in the marketplace and is typically stipulated separately with the customer.
Claims Recognition
Claims are amounts in excess of the agreed contract price (or amounts not included in the original contract price) that weseek to collect from customers or others for delays, errors in specifications and designs, contract terminations, changeorders in dispute or unapproved as to both scope and price or other causes of unanticipated additional costs. TheCompany records contract revenue related to claims only if it is probable that the claim will result in additional contractrevenue and if the amount can be reliably estimated. In such cases, the Company records revenue only to the extent thatcontract costs relating to the claim have been incurred. The amounts recorded, if material, are disclosed in the notes to thefinancial statements. Costs attributable to claims are treated as costs of contract performance as incurred.
Stock Based Compensation
We recognize the expense associated with stock option awards over the period during which an employee, director orconsultant is required to provide services in exchange for the award, known as the requisite service period (usually thevesting period). The related option awards for employees and directors are classified as equity and as such are valued atthe grant date and are not subject to remeasurement thereafter. Estimates are revised if subsequent information indicatesthat forfeitures will differ from previous estimates, and the cumulative effect on compensation cost of a change in theestimated forfeitures is recognized in the period of the change. The option valuations are performed using a fair valueBlack Scholes model. Option valuation models require the input of highly subjective assumptions, and changes in theassumptions can materially affect fair value estimates.
See Note 19 in the notes to our consolidated financial statements for additional information pertaining to the stock basedcompensation plans. Income Taxes
Valuation Allowance. Deferred income taxes are recorded using the asset and liability method whereby deferred taxassets and liabilities are established for the difference between the financial reporting and income tax basis of assets andliabilities, as well as operating loss and tax credit carry forwards. Deferred tax assets and liabilities are adjusted for theeffects of changes in tax laws and rates on the date of enactment of such changes to laws and rates. In accordance withthe quasi-reorganization requirements tax benefits that existed at the date of the quasi-reorganization but that were notrecognized at the date of the quasi-reorganization will be recorded directly to equity.
Deferred tax assets are reduced by a valuation allowance when, in our opinion, it is more likely than not that some portionor all of the deferred tax assets may not be realized. Whether a deferred tax asset may be realized requires considerablejudgment by us. In considering the need for a valuation allowance, we consider a number of factors including the futurereversal of existing temporary differences, future taxable income exclusive of reversing temporary differences and carryforwards, taxable income in carry-back years if carry-back is permitted under tax law, and prudent and feasible tax planningstrategies that would normally be taken by management, in the absence of the desire to realize the deferred tax asset.Whether a deferred tax asset will ultimately be realized is also dependent on varying factors, including, but not limited to,changes in tax laws and audits by tax jurisdictions in which we operate.
We review the need for a valuation allowance at least quarterly. If we determine we will not realize all or part of ourdeferred tax asset in the future, we will record an additional valuation allowance. Conversely, if a valuation allowanceexists and we determine that all or part of the net deferred tax asset is more likely than not to be realized, then the amountof the valuation allowance will be reduced. This adjustment will increase or decrease income tax
23

3/28/2014 UNITED STATES
http://www.sec.gov/Archives/edgar/data/1082198/000137647414000074/prnx_10k.htm 39/125

3/28/2014 UNITED STATES
http://www.sec.gov/Archives/edgar/data/1082198/000137647414000074/prnx_10k.htm 40/125
Table of Contents
expense in the period of such determination. As noted above, in connection with this quarterly analysis as of September30, 2013, the valuation allowance was increased to fully reserve for all deferred tax assets, resulting in a 2013 deferred taxexpense of $4.9 million. Central to management's decision to increase the valuation allowance during the 2013 third quarterwas the level of new business and change orders won during the first nine months of 2013 compared to the prior yearperiod. The reduction of new business won year over year, when considered along with other positive and negativefactors, contributed to management's decision to increase the valuation allowance as of September 30, 2013 and to retain afull valuation allowance as of December 31, 2013. The valuation allowance may be reduced if and when additional newbusiness, tax planning strategies and other factors collectively support such a reduction from the fully reserved status.
The valuation allowance adjustment in 2012 resulted in an income tax expense of $0.6 million during 2012, consisting of a$0.8 million deferred benefit from continuing operations and a $1.4 million deferred expense on discontinued operationsand presented as such. As of December 31, 2013 and 2012, our gross deferred tax assets total $27.3 million and $28.2million net of a valuation allowance of $27.3 million and $23.3 million ($0.0 and $4.9 million net) on a post quasi-reorganization basis, respectively. The valuation allowance incorporates a full reserve on the deferred tax asset generatedby the October 12, 2012, sale of TCNMI by the Company that resulted in a taxable loss of $51.7 million. The federal andstate deferred tax assets arising from this loss on sale of TCNMI approximates $22.5 million and is fully reserved forthrough the valuation allowance resulting in a zero net impact on our deferred tax assets, net as of December 31, 2013. Undistributed Non-U.S. Earnings. The results of our operations outside of the United States are consolidated forfinancial reporting; however, earnings from investments in non-U.S. operations are included in domestic U.S. taxableincome only when actually or constructively received. No U.S. Federal or State deferred taxes have been provided on theundistributed earnings of non-U.S. operations of approximately $0.8 million and $1.6 million in 2013 and 2012, respectivelybecause we plan to permanently reinvest these earnings overseas. If we were to repatriate these earnings, additional taxeswould be due at that time. However, these additional U.S. taxes may be offset in part by the use of foreign tax credits. U.S.Tax liabilities are recorded from our earnings due to operations in Vanuatu as there are no income taxes in Vanuatu andPernix Group periodically repatriates these earnings.
Foreign Currency Translation
The Company’s functional currency is the U.S. dollar. Results of operations for foreign entities are translated to USdollars using the average exchange rates during the period. Assets and liabilities for foreign entities are translated usingthe exchange rates in effect as of the date of the balance sheet. Resulting translation adjustments are recordedas a foreign currency translation adjustment into other accumulated comprehensive income (loss) within stockholders’equity.
The Company may use forward exchange contracts from time to time to mitigate foreign currency risk. The Company limitsexposure to foreign currency fluctuations in most of its contracts through provisions that require client payments incurrencies corresponding to the currency in which costs are incurred. The Company did not employ any such contracts,nor were any such contracts outstanding during 2013 or 2012.
Results of Operations
Results of Operations for the calendar year ended December 31, 2013 compared to the calendar year ended December31, 2012
Revenues
As discussed in the Executive Summary, during 2013 and 2012, the Company earned the highest and second highestlevels of revenue in company history. The Company earned total revenues of $73.8 million and $120.0 million during 2013and 2012, respectively. The $46.3 million, or 38.5% decrease principally reflects lower general construction revenueattributable to two large containerized housing projects, which were completed or wound down in late 2012 and 2013. Thedecrease was partially offset by revenue increases associated with other construction projects, half of which wereawarded during 2013 ($13.1 million increase), and an increase in Power Generation revenue of $0.7 million.
24

3/28/2014 UNITED STATES
http://www.sec.gov/Archives/edgar/data/1082198/000137647414000074/prnx_10k.htm 41/125

3/28/2014 UNITED STATES
http://www.sec.gov/Archives/edgar/data/1082198/000137647414000074/prnx_10k.htm 42/125
Table of Contents
General Construction -Construction revenue was $67.8 million and $114.9 million for 2013 and 2012, respectively, or a$47.1 million (41.0%) decrease from the Company’s record high construction revenue. The decrease in constructionrevenue was triggered by the completion of the Shield containerized housing unit (CHU) project in late 2012 and thewinding down of the Sather CHU project in late 2013 ($52.7 million and $7.5 million decreases, respectively), partiallyoffset by revenue increases associated with other construction projects, half of which were awarded during 2013 ($13.1million increase). The Sather and Shield projects generated $51.1 million of revenue during 2013 compared to $111.2million during 2012. The projects advanced from 56% and 99% complete during 2012 to 89% and 100% complete during2013, respectively. In addition, the Niamey, Niger embassy rehabilitation project, generated $10.0 million of revenue in2013 compared to $3.2 million of revenue in 2012, the year in which the notice to proceed on the project was received.During 2013 and 2012, the progress on the Niger project advanced from 14% to 66% and from 1% complete to 14%complete, respectively. The Sather project was substantially completed during early 2014 and the Niger contract isexpected to be completed in late 2014 or early 2015. Meanwhile progress commenced on the Baku embassy upgrade andFreetown rainwater recapture upgrade projects during 2013. The projects are 26% and 4% complete, respectively atDecember 31, 2013.
Service fees— Total Power Generation revenue increased $0.7 million, or 12.1% to $5.8 million in 2013 compared to theprior year. The increase primarily reflects the higher use of PFL Kinoya and Vuda plant generated diesel power in Fiji dueto low water levels and half-life maintenance of the Wailoa hydro station,which is an alternate power source in Fiji. VUIrevenue also increased $0.1 million from $1.4 million in 2012 to $1.5 million for 2013. TCNMI was sold during 2012 and theoperations of TCNMI are reflected as discontinued operations in our consolidated statement of operations.
Costs and Expenses
General Construction Costs —( including Construction Costs — Related Party). Total construction costs decreased$38.4 million from 2012 to $63.9 million for 2013, primarily reflecting the reduction in costs on the Iraq CHU projects as theywere completed or wound down. These decreases were commensurate with expectations given the lower level of revenueon the projects, except for the Sather project which experienced an increase in security related costs in Iraq and higherindirect overhead charges allocable to the project, the impact of which was partially offset by lower than expected sitemanagement, insurance, communication / IT and business travel expenses.
Operations and Maintenance Costs — Power Generation Plant. Operations and maintenance costs — power generationplant decreased $0.2 million (8.2%) to $2.7 million in 2013 from $2.9 million in 2012, resulting from lower plannedmaintenance and breakdown costs at the Kinoya plant that were partially offset by higher planned maintenance andbreakdown costs at the Vuda plant.
Gross ProfitGross profit decreased by $7.6 million (51.5%) to $7.2 million for 2013 as compared to $14.8 million for the prior year,reflecting the net impact of lower construction revenue with a less than commensurate cost of sales reduction on theSather project, the combination of which was partially offset by the impact of higher power segment revenues and lowermaintenance and breakdown expenses.
Operating ExpensesSalaries and Employee Benefits. Salaries and employee benefits decreased $0.5 million (17%) to $2.9 million for 2013 from$3.4 million for 2012. This decrease was due to the decrease in indirect project management office (PMO) and Lombardoffice project support costs ($1.6 million) that was partially offset by an increase of $1.0 million related to salaries andbenefits for key hires into new positions including the V.P. of Power, construction business development and estimating,procurement and accounting personnel necessary to continue growing our power and construction businesses.
General and Administrative and Other Operating Expenses. General and administrative expenses totaled $2.3 million andwere $0.4 million lower in 2013 compared to 2012, principally reflecting a higher allocation of indirect costs to PSJVprojects cost of sales the impact of which was partially offset by individually insignificant increases in recruiting fees,travel fees related to the Kinoya expansion project bidding process and other expenses.
Other Income (Expense)Other expense decreased by $0.6 million during 2013 compared to 2012, reflecting the 2012 collection and recording of

3/28/2014 UNITED STATES
http://www.sec.gov/Archives/edgar/data/1082198/000137647414000074/prnx_10k.htm 43/125
insurance proceeds related to the 2011 PFL engine failure ($0.6 million). There were no such significant proceeds recordedin 2013.
25
3/28/2014 UNITED STATES
http://www.sec.gov/Archives/edgar/data/1082198/000137647414000074/prnx_10k.htm 44/125
Table of Contents
Income Tax Benefit (Expense)
The income tax expense from continuing operations increased by $5.8 million during 2013 to $5.0 million from a 2012 taxbenefit of ($0.7) million. The increase primarily reflects the deferred income tax expense of $4.9 million for 2013, whichconsists of $4.1 of federal deferred expense and $0.8 of deferred state expense and reflects an increase in the valuationallowance on deferred tax assets. This expense is a non-cash expense and has no impact on the Company's liquidity, cashflows, or its ability to execute projects or conduct ongoing operations. As a result of the increase in the valuationallowance, the deferred tax assets are fully reserved as of December 31, 2013. U.S. net operating and capital losscarryforwards totaling approximately $71.9 million are available to Pernix Group, Inc. as of December 31, 2013.
In 2012, the ($0.7) tax benefit primarily reflects a deferred state tax benefit of ($0.6) million recorded in connection with theapproaching expiration of the net operating loss utilization cap in the state of Illinois. Foreign tax expense was consistentyear over year at $0.2 million related to Fijian operations that are taxed at a 20% rate. The 2012 $1.4 million deferred taxexpenses associated with TCNMI was recorded in discontinued operations.
Consolidated Net Income from Continuing Operations attributable to Pernix stockholders
Consolidated net income attributable to Pernix stockholders from continuing operations decreased from $4.1 million in2012 to a ($4.7) million loss during 2013, principally reflecting the $7.6 million reduction in gross margin coupled with theincrease in income tax expense of $5.8 million and the $0.6 million reduction in insurance proceeds and was partially offsetby the $4.3 million reduction of income attributable to noncontrolling interests and the $1.0 million reduction in operatingexpenses.
Loss from Discontinued Operations, Net
The loss from discontinued operations was $3.7 million for 2012. The losses include the operations and loss ondivestitures of TransRadio and TCNMI which were sold in March and October of 2012, respectively. The TransRadio lossof $1.9 million included a $0.7 million loss on sale and the TCNMI loss of $1.8 million did not include any gain or loss onthe sale as the $1.1 million gain on sale was recorded into Additional Paid in Capital in accordance with quasi-reorganization accounting rules during 2012. The losses are presented net of the 2012 related tax effects of zero and $1.4million of tax expense for TransRadio and TCNMI, respectively. The 2012 deferred tax expense reflects the increase of theDTA NOL valuation allowance in connection with the change in strategy that resulted in the sale of TCNMI. TCNMIoperations were negatively impacted in 2012 by litigation expenses related to the Koblerville housing lawsuit and arepresented as discontinued operations.
Revenue for TransRadio and was $1.0 million in 2012. Having discontinued these underperforming operationsmanagement has curtailed the negative financial impact of these losses on Pernix and has allowed Pernix managementteam to focus its efforts on the strategic plan initiatives to grow the core construction and power businesses. Pernixmanagement believes that the Company’s continuing operations are well positioned for the future as a result of theseactions.
Consolidated Net Income Attributable to Common Shareholders
Net (loss) income attributable to Pernix common shareholders was ($4.7) million and $0.4 million in 2013 and 2012,respectively. Included in the 2012 net income attributable to Pernix common shareholders is a ($3.7) million loss fromdiscontinued operations. Included in the 2013 net income results is the $4.9 million deferred income tax expense related tomanagement's third quarter 2013 decision to record an increase in the valuation allowance on deferred tax assets. Thisexpense is a non-cash expense and has no impact on the Company's liquidity, cash flows, or on its ability to executeprojects or conduct ongoing operations. Central to management's decision to increase the valuation allowance during the2013 third quarter was the level of new business and change orders won during 2013 compared to the preceding twoyears. Management believes this decline to be temporary and in early 2014, the Company has received awards totalingover $45.5 million, more in line with experience prior to 2013. Of these new awards, $29.1 million is not U.S. taxable as it is aPFL project and as such is taxable in Fiji. As a result of the increase in the valuation allowance, the deferred tax assets arefully reserved as of December 31, 2013 and the Company is well positioned because approximately $71.9 million of netoperating and capital loss carryforwards are available in the coming years to shelter the Company from U.S. federal and

3/28/2014 UNITED STATES
http://www.sec.gov/Archives/edgar/data/1082198/000137647414000074/prnx_10k.htm 45/125
state income taxes through the utilization of these net operating and capital loss deferred tax assets.
26

3/28/2014 UNITED STATES
http://www.sec.gov/Archives/edgar/data/1082198/000137647414000074/prnx_10k.htm 46/125
Table of Contents
Liquidity and Capital Resources
December 31,
2013
December 31,
2012
Cash and cash equivalents $ 19,956,759 $ 21,406,898
Fiscal YearEnding
December 31,2013
Fiscal YearEnding
December 31,2012
Cash provided by operating activities $ 3,996,884 $ 19,567,064
Cash (used in) / provided by investing activities (1,028,685) 954,464
Cash used in financing activities (4,242,754) (2,473,687)
Effect of exchange rates on cash (175,584) 425,163
Increase / (decrease) in cash and cash equivalents $ (1,450,139) $ 18,473,004
Cash Requirements
We generate cash flows primarily from serving as the general contractor on construction projects for the U.S. Governmentand through the operation and maintenance of power generation plants, from financing obtained fromthird party banks and affiliated parties and through sales of common and preferred stock. In December 2013, the Companyrepaid $2.3 million of debt to a related party resulting in a debt free balance sheet as of December 31, 2013. The Companyalso sold Series A Preferred Stock to its majority shareholders in late December 2013, resulting in an inflow of $5.0 millionof proceeds available to the Company for future acquisitions and operations as needed. On May 14, 2012, the Company’sRegistration Statement became effective with the SEC thereby registering 5,000,000 shares of previously unissued stock ina primary fixed price offering and 6,245,585 shares on behalf of selling stockholders under a secondary offering. TheCompany anticipates this registration will augment our current sources of capital. The Company plans to update theregistration statement in March 2014. Beyond the cash expected to be generated by operations, from third party banksand the issuance of additional shares, the Company may seek debt financing or equity based support from its principalstockholders, Ernil Continental and Halbarad Group Ltd., on an as-needed basis only.
We also believe that collections on the outstanding receivables which are primarily U.S. Government receivables with atimely payment history as well as funds available from various funding sources will permit the construction operations tomeet the payment obligations to vendors and subcontractors. Distribution of the PS JV accumulated earnings are made ona quarterly basis and all such distributions have been made to Serka as of December 31, 2013. It is our opinion that, in theabsence of significant unanticipated cash demands, current and forecasted cash flow from our operations, combined withequity and debt financing capacity, will provide sufficient funds to meet anticipated operating requirements, capitalexpenditures, equity investments, and strategic acquisitions.
The Company has significant operating loss carryforward deferred tax assets that it may utilize in the future that if andwhen used would negate to a large degree current federal and state income tax cash payments other than those requiredunder the alternative minimum tax which are generally 2% of taxable income.
As of December 31, 2013, the Company’s total assets exceeded total liabilities by $11.3 million. This was a $4.7 milliondecrease from December 31, 2012 due to the increase in the valuation allowance to fully reserve our deferred tax assetsduring 2013. As of December 31, 2013, the Company had an accumulated deficit since the quasi-reorganization of $3.7million. The Company had an accumulated deficit of $68.6 million (prior to the quasi-reorganization) that was eliminatedagainst additional paid in capital at September 30, 2012. The Company will continue to maintain and disclose the “retaineddeficit ” or “retained earnings”, as is applicable, since the implementation date. Typically, quasi-reorganizations enhance acompany’s ability to raise capital and pay dividends as the operations have “turned a corner” to anticipated profitability.The adjustments from this “fresh start” accounting method have no effect on our cash flow and provide us with a furtherstreamlined balance sheet, which will better reflect the progress in our current and future business operations.
27

3/28/2014 UNITED STATES
http://www.sec.gov/Archives/edgar/data/1082198/000137647414000074/prnx_10k.htm 47/125

3/28/2014 UNITED STATES
http://www.sec.gov/Archives/edgar/data/1082198/000137647414000074/prnx_10k.htm 48/125
Table of Contents
The $1.5 million decrease in cash during 2013 is comprised of cash provided by operating activities of $4.0 million andproceeds of $5.0 million from the issuance of new preferred stock, which more than offset $2.7 million of debt repayment,the distribution of $6.5 million of cash to non-controlling interest holders and tax authorities on the behalf of non-controlling interest holders and $1.3 million for the purchase of the corporate headquarters land and building as well as anadvanced payment on concrete plant equipment. The $18.5 million increase in cash during 2012 is comprised of cashprovided by operating activities of $19.6 million, generally reflecting the cash provided by continuing operations, $1.2million of cash provided by the sale of TransRadio and $0.9 million of new borrowings which combined more than offsetthe use of cash to repurchase preferred stock ($1.2 million) and reduce debt payable to Bent Marketing ($0.7 million), aswell as the payment of $2.2 million of distributions to noncontrolling interest holders and tax authorities on the behalf ofnoncontrolling interest holders.
The Company does not currently have material commitments for capital expenditures as of December 31, 2013.
Recently Issued Accounting Pronouncements
In January 2014, the FASB issued ASU 2014-05, ‘‘Service Concession Arrangements.’’ This ASU clarifies that, unlesscertain circumstances are met, operating entities should not account for certain concession arrangements with public-sector entities as leases and should not recognize the related infrastructure as property, plant and equipment. This ASU iseffective for interim and annual reporting periods beginning after December 15, 2014. Management is in the process ofdetermining the impact on the company’s financial position, results of operations and cash flows.
Off-Balance Sheet Arrangements
The Company does not have any off-balance sheet arrangements as defined by Regulation S-K 303. However, we enterinto various arrangements not recognized in our consolidated balance sheets that have or could have an effect on ourfinancial condition, results of operations, liquidity, capital expenditures, or capital resources.
From time to time, the Company is required to utilize standby letters of credit or similar financial guarantees in the normalcourse of its business, and this is a typical practice for the industry segments in which the Company operates. Theamount, duration, and structure of such standby letters of credit or similar financial instruments varies depending on thenature and scope of the project involved. As of December 31, 2013 the Company had a FJD 1.0 million ($0.5 million USD)financial guarantee of PFL’s line of credit with ANZ. No amounts are drawn under the ANZ line of credit and theCompany does not anticipate any payment risk under this guarantee as of December 31, 2013. No such guarantees wereoutstanding as of December 31, 2012. In December 2012, the Company was awarded a $1.6 million project to install cablein the Solomon Islands. The Company accepted the award and begun the execution during 2013. In connection with thisaward, a performance guarantee was established with ANZ Bank. The project is 80.9% complete as of December 31, 2013and the Company does not anticipate any payment risk under this guarantee as of December 31, 2013.
ITEM 7A. QUANTITATIVE AND QUALITATIVE DISCLOSURES ABOUT MARKET RISK
Not applicable.
28

3/28/2014 UNITED STATES
http://www.sec.gov/Archives/edgar/data/1082198/000137647414000074/prnx_10k.htm 49/125
Table of Contents
ITEM 8. FINANCIAL STATEMENTS AND SUPPLEMENTARY DATA
PERNIX GROUP, INC.Index to Consolidated Financial Statements
December 31, 2013 and 2012
Reports of Independent Registered Public Accounting Firms 30
Consolidated Balance Sheets at December 31, 2013 and 2012 32
Consolidated Statements of Operations for the Years Ended December 31, 2013 and 2012 33 Consolidated Statements of Comprehensive Income (Loss) for the Years Ended December 31, 2013 and 2012 34 Consolidated Statements of Changes in Stockholders’ Equity for the Years Ended December 31, 2013 and 2012 35
Consolidated Statements of Cash Flows for the Years Ended December 31, 2013 and 2012 36
Notes to Consolidated Financial Statements 37
29
3/28/2014 UNITED STATES
http://www.sec.gov/Archives/edgar/data/1082198/000137647414000074/prnx_10k.htm 50/125
Table of Contents
Report of Independent Registered Public Accounting Firm
Board of Directors and Stockholders’Pernix Group, Inc.Lombard, Illinois
We have audited the accompanying consolidated balance sheet of Pernix Group, Inc. as of December 31, 2013 and therelated consolidated statements of operations, comprehensive income, stockholders’ equity, and cash flows for the yearended December 31, 2013. These financial statements are the responsibility of the Company’s management. Ourresponsibility is to express an opinion on these financial statements based on our audit.
We conducted our audit in accordance with the standards of the Public Company Accounting Oversight Board (UnitedStates). Those standards require that we plan and perform the audit to obtain reasonable assurance about whether thefinancial statements are free of material misstatement. The Company is not required to have, nor were we engaged toperform, an audit of its internal control over financial reporting. Our audit included consideration of internal control overfinancial reporting as a basis for designing audit procedures that are appropriate in the circumstances, but not for thepurpose of expressing an opinion on the effectiveness of the Company’s internal control over financial reporting.Accordingly, we express no such opinion. An audit also includes examining, on a test basis, evidence supporting theamounts and disclosures in the financial statements, assessing the accounting principles used and significant estimatesmade by management, as well as evaluating the overall financial statement presentation. We believe that our auditprovides a reasonable basis for our opinion.
In our opinion, the consolidated financial statements referred to above present fairly, in all material respects, the financialposition of Pernix Group, Inc. as of December 31, 2013, and the results of its operations and its cash flows for the yearended December 31, 2013, in conformity with accounting principles generally accepted in the United States of America.
/s/ BDO USA, LLP
Chicago, IllinoisMarch 28, 2014
30
3/28/2014 UNITED STATES
http://www.sec.gov/Archives/edgar/data/1082198/000137647414000074/prnx_10k.htm 51/125
Table of Contents
REPORT OF INDEPENDENT REGISTERED PUBLIC ACCOUNTING FIRM
The Board of Directors and Stockholders ofPernix Group, Inc.
We have audited the accompanying consolidated balance sheet of Pernix Group, Inc. as of December 31, 2012 and therelated consolidated statements of operations, comprehensive income (loss), stockholders' equity, and cash flows for theyear then ended. Pernix Group, Inc.'s management is responsible for these financial statements. Our responsibility is toexpress an opinion on these financial statements based on our audit.
We conducted our audit in accordance with the standards of the Public Company Accounting Oversight Board (UnitedStates). Those standards require that we plan and perform the audit to obtain reasonable assurance about whether thefinancial statements are free of material misstatement. The company is not required to have, nor were we engaged toperform, an audit of its internal control over financial reporting. Our audit included consideration of internal control overfinancial reporting as a basis for designing audit procedures that are appropriate in the circumstances, but not for thepurpose of expressing an opinion on the effectiveness of the company's internal control over financial reporting.Accordingly, we express no such opinion. An audit also includes examining, on a test basis, evidence supporting theamounts and disclosures in the financial statements, assessing the accounting principles used and significant estimatesmade by management, as well as evaluating the overall financial statement presentation. We believe that our auditprovides a reasonable basis for our opinion.
In our opinion, the consolidated financial statements referred to above present fairly, in all material respects, the financialposition of Pernix Group, Inc. as of December 31, 2012 and the results of its operations and its cash flows for the yearthen ended, in conformity with accounting principles generally accepted in the United States of America.of America.
/s/ CohnReznick LLP Chicago, IllinoisApril 1, 2013
31

3/28/2014 UNITED STATES
http://www.sec.gov/Archives/edgar/data/1082198/000137647414000074/prnx_10k.htm 52/125
Table of Contents
PERNIX GRO UP, INC.AND SUBSIDIARIES
Consolidated Balance Sheets
as of December 31, 2013 and 2012
Assets December 31,
2013 December 31,
2012Current assets:
Cash and cash equivalents $ 19,956,759 $ 21,406,898
Accounts receivable, net 9,223,230 8,545,419
Inventories 1,626,003 1,822,945
Cost in excess billings 56,679 —
Deferred tax asset, net — 1,033,098
Prepaid expenses and other current assets 1,066,747 725,873
Total current assets 31,929,418 33,534,233
Property and equipment, net 1,282,899 24,339
Deferred tax asset, net — 3,850,837
Other assets 260,712 90,960
Intangible assets, net: Construction and power contracts 157,934 221,136
Total assets $ 33,630,963 $ 37,721,505
Liabilities and Stockholders’ Equity
Current liabilit ies:
Accounts payable and accrued expenses $ 13,225,413 $ 9,758,236
Short term debt — 18,905
Short term debt - related party — 1,060,284
Accrued expenses - related party 529,466 447,491
Billings in excess of costs and estimated earnings 8,407,187 8,917,382
Deferred revenue 30,827 —
Dividend payable 186,137 130,887
Total current liabilit ies 22,379,030 20,333,185
Long-term debt - related party — 1,349,906
Total liabilit ies 22,379,030 21,683,091
Commitments and contingencies — —
Stockholders' Equity:
Pernix Group, Inc. and Subsidiaries Stockholders' equity
Series A convertible senior preferred stock, $0.01 par value. Authorized 1,000,000
shares, $1,500,000 and zero liquidation preference 1,000,000 and 0 shares issued
and outstanding at December 31, 2013 and 2012, respectively 10,000 —
Series B convertible senior preferred stock, $0.01 par value. Authorized 400,000
shares $170,000 involuntary liquidation preference, 170,000 shares issued and
outstanding at December 31, 2013 and 2012, respectively 1,700 1,700
Common stock, $0.01 par value. Authorized 20,000,000 shares, 9,403,697 issued
and outstanding 94,037 94,037
Additional paid-in capital 14,324,683 9,148,757
Accumulated deficit (deficit eliminated as a result of Quasi-Reorganization as of
September 30, 2012 - $68,626,283) — —
Retained (deficit) earnings - since September 30, 2012 (3,741,433) 938,810
Accumulated comprehensive (loss) income - since September 30, 2012 (222,469) 12,183
Total Pernix Group, Inc. and Subsidiaries Stockholders' equity 10,466,518 10,195,487
Non-controlling interest 785,415 5,842,927
Total Stockholders' equity 11,251,933 16,038,414
Total liabilit ies and Stockholders' equity $ 33,630,963 $ 37,721,505
See accompanying notes to consolidated financial statements.
32

3/28/2014 UNITED STATES
http://www.sec.gov/Archives/edgar/data/1082198/000137647414000074/prnx_10k.htm 53/125
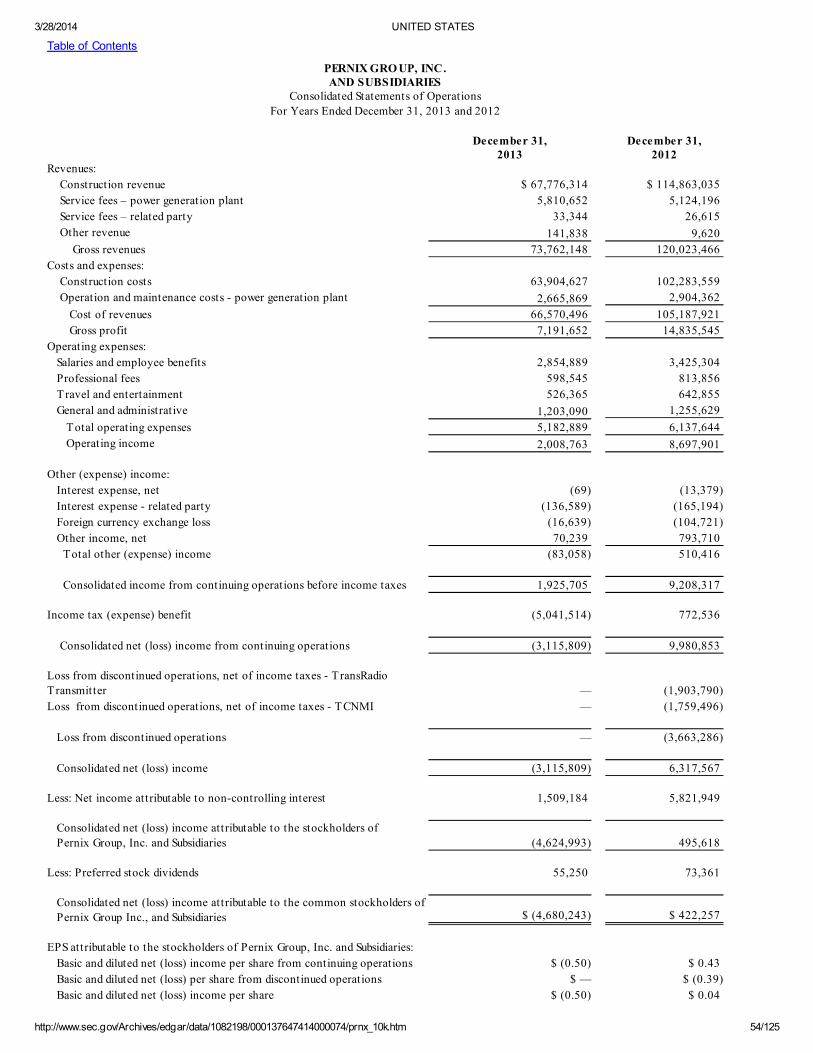
3/28/2014 UNITED STATES
http://www.sec.gov/Archives/edgar/data/1082198/000137647414000074/prnx_10k.htm 54/125
Table of Contents
PERNIX GRO UP, INC.AND SUBSIDIARIES
Consolidated Statements of Operations
For Years Ended December 31, 2013 and 2012
December 31,
2013 December 31,
2012Revenues:
Construction revenue $ 67,776,314 $ 114,863,035
Service fees – power generation plant 5,810,652 5,124,196
Service fees – related party 33,344 26,615
Other revenue 141,838 9,620
Gross revenues 73,762,148 120,023,466
Costs and expenses:
Construction costs 63,904,627 102,283,559
Operation and maintenance costs - power generation plant 2,665,869 2,904,362
Cost of revenues 66,570,496 105,187,921
Gross profit 7,191,652 14,835,545
Operating expenses:
Salaries and employee benefits 2,854,889 3,425,304
Professional fees 598,545 813,856
T ravel and entertainment 526,365 642,855
General and administrative 1,203,090 1,255,629
Total operating expenses 5,182,889 6,137,644
Operating income 2,008,763 8,697,901
Other (expense) income:
Interest expense, net (69) (13,379)
Interest expense - related party (136,589) (165,194)
Foreign currency exchange loss (16,639) (104,721)
Other income, net 70,239 793,710
Total other (expense) income (83,058) 510,416
Consolidated income from continuing operations before income taxes 1,925,705 9,208,317
Income tax (expense) benefit (5,041,514) 772,536
Consolidated net (loss) income from continuing operations (3,115,809) 9,980,853
Loss from discontinued operations, net of income taxes - TransRadio
Transmitter — (1,903,790)
Loss from discontinued operations, net of income taxes - TCNMI — (1,759,496)
Loss from discontinued operations — (3,663,286)
Consolidated net (loss) income (3,115,809) 6,317,567
Less: Net income attributable to non-controlling interest 1,509,184 5,821,949
Consolidated net (loss) income attributable to the stockholders of
Pernix Group, Inc. and Subsidiaries (4,624,993) 495,618
Less: Preferred stock dividends 55,250 73,361
Consolidated net (loss) income attributable to the common stockholders of
Pernix Group Inc., and Subsidiaries $ (4,680,243) $ 422,257
EPS attributable to the stockholders of Pernix Group, Inc. and Subsidiaries:
Basic and diluted net (loss) income per share from continuing operations $ (0.50) $ 0.43
Basic and diluted net (loss) per share from discontinued operations $ — $ (0.39)
Basic and diluted net (loss) income per share $ (0.50) $ 0.04

3/28/2014 UNITED STATES
http://www.sec.gov/Archives/edgar/data/1082198/000137647414000074/prnx_10k.htm 55/125
Weighted average shares outstanding - basic 9,403,697 9,403,697
Weighted average shares outstanding - diluted 9,403,697 9,403,697
See accompanying notes to consolidated financial statements.
33

3/28/2014 UNITED STATES
http://www.sec.gov/Archives/edgar/data/1082198/000137647414000074/prnx_10k.htm 56/125
Table of Contents
PERNIX GRO UP, INCAND SUBSIDIARIES
Consolidated Statements of Comprehensive (Loss) Income
For Years Ended December 31, 2013 and 2012
2013 2012
Consolidated net (loss) income $(3,115,809) $ 6,317,567
Other comprehensive (loss) income:
Foreign currency translation adjustment (262,806) 512,463
Total comprehensive (loss) income $(3,378,615) $ 6,830,030
Net income attributable to non-controlling interests $ 1,509,184 $ 5,821,949
Foreign currency translation attributable to non-controlling interests (28,154) 54,181
Total comprehensive income attributable to non-controlling interest $ 1,481,030 $ 5,876,130
Total comprehensive (loss) income attributable to the stockholders of Pernix Group, Inc.,
and Subsidiaries $(4,859,645) $ 953,900
See accompanying notes to consolidated financial statements.
34

3/28/2014 UNITED STATES
http://www.sec.gov/Archives/edgar/data/1082198/000137647414000074/prnx_10k.htm 57/125
Table of Contents
PERNIX GRO UP, INC.AND SUBSIDIARIES
Condensed Consolidated Statements of Changes in Stockholders’ Equity
For the Years Ended December 31, 2013 and 2012
Total
Retained(Deficit)Earnings
AccumulatedO ther
ComprehensiveIncome / (loss)
CommonStock
PreferredStock
Additionalpaid-incapital
Non-controlling
Interest
Balance at December 31, 2011 $ 11,487,910 $ (68,109,729) $ (538,451) $ 94,037 $ 3,893 $ 77,921,831 $ 2,116,329
Net income / (loss) $ 6,317,567 $ 495,618 $ — $ — $ — $ — $ 5,821,949
Foreign currency translation adjustment 512,463 — 458,282 — — — 54,181
Preferred Stock dividends (73,361) (73,361) — — — — —
Preferred Stock Repurchased (1,096,251) — — — (2,193) (1,094,058) —
Additional paid in capital from:
Incentive Stock Option Plan 29,339 — — — — 29,339 —
Securities Registration Cost (17,305) — — — — (17,305) —
Quasi-Reorganization Cost (91,851) — — — — (91,851) —
Change as a result of TransRadio
disposition 28,677 — — — — (5,236) 33,913
Change as a result of TCNMI disposition 1,124,671 — — — — 1,124,671 —
Quasi-Reorganization –
elimination of accumulated deficit — 68,626,282 92,352 — — (68,718,634) —
Distribution to Non-
controlling Interest Holders (2,193,058) — — — — — (2,193,058)
Change as a result of TFL/TSF merger 9,613 — — — — — 9,613
Balance at December 31, 2012 –
after quasi-reorganization $ 16,038,414 $ 938,810 $ 12,183 $ 94,037 $ 1,700 $ 9,148,757 $ 5,842,927
Balance at December 31, 2012 –
after quasi-reorganization $ 16,038,414 $ 938,810 $ 12,183 $ 94,037 $ 1,700 $ 9,148,757 $ 5,842,927
Net income / (loss) $ (3,115,809) $ (4,624,993) $ — $ — $ — $ — 1,509,184
Foreign currency translation adjustment (262,806) — (234,652) — — — (28,154)
Preferred Stock dividends (55,250) (55,250) - - - - -
Preferred Stock sale 5,000,000 — — — 10,000 4,990,000 —
Additional paid in capital from:
Incentive Stock Option Plan 103,016 — — — — 103,016 —
Long Term Incentive Plan 82,910 — — — — 82,910 —
Distribution to Non-
controlling Interest Holders (6,538,542) — — — — — (6,538,542)
Balance at December 31, 2013 $ 11,251,933 $ (3,741,433) $ (222,469) $ 94,037 $ 11,700 $ 14,324,683 $ 785,415
See accompanying notes to consolidated financial statements.
35
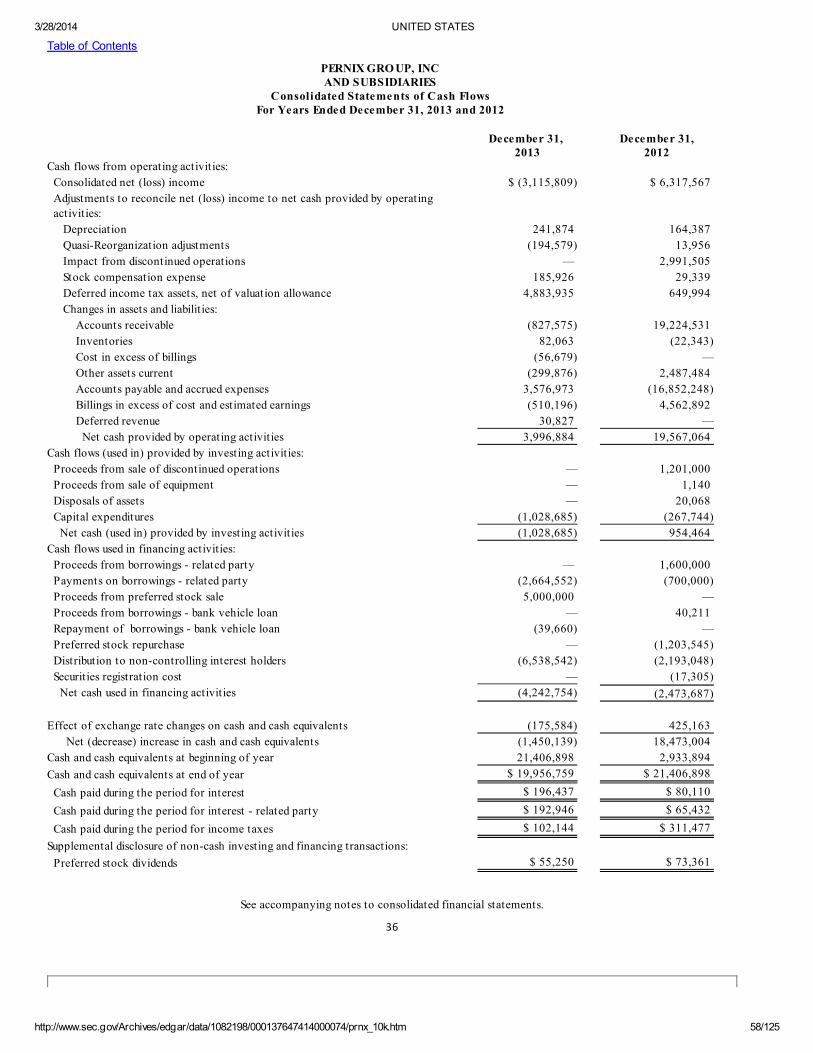
3/28/2014 UNITED STATES
http://www.sec.gov/Archives/edgar/data/1082198/000137647414000074/prnx_10k.htm 58/125
Table of Contents
PERNIX GRO UP, INCAND SUBSIDIARIES
Consolidated Statements of Cash FlowsFor Years Ended December 31, 2013 and 2012
December 31,
2013
December 31,2012
Cash flows from operating activities:
Consolidated net (loss) income $ (3,115,809) $ 6,317,567
Adjustments to reconcile net (loss) income to net cash provided by operating
activities:
Depreciation 241,874 164,387
Quasi-Reorganization adjustments (194,579) 13,956
Impact from discontinued operations — 2,991,505
Stock compensation expense 185,926 29,339
Deferred income tax assets, net of valuation allowance 4,883,935 649,994
Changes in assets and liabilit ies:
Accounts receivable (827,575) 19,224,531
Inventories 82,063 (22,343)
Cost in excess of billings (56,679) —
Other assets current (299,876) 2,487,484
Accounts payable and accrued expenses 3,576,973 (16,852,248)
Billings in excess of cost and estimated earnings (510,196) 4,562,892
Deferred revenue 30,827 —
Net cash provided by operating activities 3,996,884 19,567,064
Cash flows (used in) provided by investing activities:
Proceeds from sale of discontinued operations — 1,201,000
Proceeds from sale of equipment — 1,140
Disposals of assets — 20,068
Capital expenditures (1,028,685) (267,744)
Net cash (used in) provided by investing activities (1,028,685) 954,464
Cash flows used in financing activities:
Proceeds from borrowings - related party — 1,600,000
Payments on borrowings - related party (2,664,552) (700,000)
Proceeds from preferred stock sale 5,000,000 —
Proceeds from borrowings - bank vehicle loan — 40,211
Repayment of borrowings - bank vehicle loan (39,660) —
Preferred stock repurchase — (1,203,545)
Distribution to non-controlling interest holders (6,538,542) (2,193,048)
Securities registration cost — (17,305)
Net cash used in financing activities (4,242,754) (2,473,687)
Effect of exchange rate changes on cash and cash equivalents (175,584) 425,163
Net (decrease) increase in cash and cash equivalents (1,450,139) 18,473,004
Cash and cash equivalents at beginning of year 21,406,898 2,933,894
Cash and cash equivalents at end of year $ 19,956,759 $ 21,406,898
Cash paid during the period for interest $ 196,437 $ 80,110
Cash paid during the period for interest - related party $ 192,946 $ 65,432
Cash paid during the period for income taxes $ 102,144 $ 311,477
Supplemental disclosure of non-cash investing and financing transactions:
Preferred stock dividends $ 55,250 $ 73,361
See accompanying notes to consolidated financial statements.
36

3/28/2014 UNITED STATES
http://www.sec.gov/Archives/edgar/data/1082198/000137647414000074/prnx_10k.htm 59/125
Table of Contents
Pernix Group Inc. and Subsidiaries
NOTES TO CONSOLIDATED FINANCIAL STATEMENTS
1. Background
Pernix Group, Inc. (the "Company" or "Pernix") is a global company managed from Lombard, Illinois and was originallyformed in 1995 as Telesource International, Inc. In 2001, the Company was incorporated in Delaware and became an SECregistrant. As of December 31, 2013 and 2012, Pernix Group is over 96.0% owned by Ernil Continental, S.A., BVI., HalbaradGroup, Ltd., BVI, and Affiliates. The Company conducts its operations through the parent and its eleven subsidiaries.
Pernix Group is a diversified contractor that is engaged in two primary operating business segments: ConstructionServices as a design-build general contractor in the public and private markets and Power Generation Services as abuilder, manager and investor in power projects as an independent power producer and as a general contractor. Pernix hasfull-scale construction and management capabilities, with subsidiaries in the South Pacific islands of Fiji and Vanuatu, inNiger, in United Arab Emirates, in Azerbaijan, in Sierra Leone and in the U.S. We provide our services in a broad range ofend markets, including construction, construction management, power and facility operations and maintenance services.In addition to these two operating segments, the Corporate operations are a separately reported segment.
The Company's subsidiaries and consolidated joint ventures, which include Pernix-Serka Joint Venture (PS JV),Pernix/SHBC Joint Venture, formerly Pernix Group Inc./Sayed Hamid Behbehani & Sons Co., Joint Venture L.P. (SHBC),Pernix Niger LLC (Niger), Pernix Kurdistan, LLC, Pernix Azerbaijan, LLC, Pernix-Serka JV Sierra Leone and Pernix TechnicalWorks Co., LLC (PTW) located in Dubai, also bid on and /or execute construction projects with support from the Pernixcorporate office. PS JV has been awarded four significant projects from its primary customer and has funded itsoperations since its inception and cash of PSJV is not available for other purposes unless distributions are made to thepartners. As of December 31, 2013 and 2012, PSJV has $10.1 million and $18.6 million in cash, $6.5 million and $7.2 millionin other assets, $8.3 million and $8.8 million billings in excess of cost and $8.8 million and $7.8 million of other liabilities,respectively.
Pernix Group has two wholly-owned power segment subsidiaries that manage the construction and facilities operationsand management activities in Fiji, (Pernix Fiji, Ltd. a.k.a. PFL), and Vanuatu (Vanuatu Utilities and Infrastructure, a.k.a.VUI), respectively. The Company also has a strategic alliance with UEI Holdings, LLC. UEI Holdings has experience withalmost all power sources and technologies and over the past 15 years has managed, commissioned, designed or helpedbuild over 50,000MW of various power generation facilities. The technical capabilities and experience provided throughthis venture allow Pernix to expand its power segment construction and management offerings.
37

3/28/2014 UNITED STATES
http://www.sec.gov/Archives/edgar/data/1082198/000137647414000074/prnx_10k.htm 60/125
Table of Contents
The Company generates cash flows primarily from serving as the general contractor on construction projects for theUnited States of America (U.S.) Government and through the operation and maintenance of power generation plants, fromfinancing obtained from third party banks and affiliated parties and through sales of common and preferred stock. TheCompany anticipates its open registration statements, as it relates to primary fixed price offerings, will augment ourcurrent sources of capital. Beyond the cash expected to be generated by operations, from third party banks, and theissuance of additional shares, the Company may seek debt financing or equity based support from its principal
stockholders, Ernil Continental and Halbarad Group Ltd., on an as-needed basis only.
2. Quasi-Reorganization
In accordance with quasi-reorganization requirements, the Company elected to effect a quasi-reorganization afterassessing as of September 30, 2012, that it had reached a turning point in its operations and future profitable operationswere reasonably assured. The management team transformed the Company through the 2012 disposition of unprofitablebusiness entities and through implementation of efforts to become leaner in terms of leverage and stronger in formation ofstrategic relationships with customers, vendors and key government agencies. Since 2005 management has significantlyreduced debt, significantly increased equity, improved the profitability of its continuing operations, built its contractbacklog and expanded its customer base.
In connection with the application of quasi-reorganization accounting, the Company applied Accounting StandardCodification (ASC) 805, Business Combinations, to restate assets and liabilities at fair value. The Company with theassistance of a third-party valuation firm performed the fair value assessment and computed the estimated fair value of thebusiness enterprise as of September 30, 2012 based on the market and income approaches, the results of whichapproximated one another. In applying quasi-reorganization accounting as of September 30, 2012, the Company obtainedapproval from its shareholders and its Board of Directors to implement a quasi-reorganization and followed theseprinciples:
•The fair value of assets and liabilities was determined in conformity with the procedures specified by ASC 805, BusinessCombinations.
• The carrying values of the current assets and current and non-current liabilities generally approximated fair value prior tothe quasi-reorganization except for PFL inventory and related party debt. PFL inventory was adjusted to reflectreplacement cost and related party debt was adjusted to reflect the present value of the contractual debt paymentsdiscounted at a current market rate in light of the Company’s risk profile (approximately 3.75% while stated interest ratewas 5.0%).
•Plant and equipment assets and other long-lived assets were adjusted and all accumulated depreciation and amortizationwas eliminated.
• Deferred taxes were reported in conformity with applicable income tax accounting standards, principally ASC 740,Income Taxes, net of applicable valuation allowances. Deferred tax assets and liabilities were recognized for differencesbetween the assigned values and the tax basis of the recognized assets and liabilities to the extent they were deemedrealizable. In accordance with the quasi-reorganization requirements, tax benefits that existed, and were reserved forthrough a valuation allowance, at the date of the quasi-reorganization which are subsequently realized in periods after thequasi-reorganization will be recorded directly to equity when realized.
• Construction and power contracts were recognized as intangible assets and the sum of the fair values of the assets andliabilities exceeded net book value at the date of the quasi-reorganization.
• In compliance with SEC guidelines, no write-up of net assets was recorded as a result of the quasi-reorganization;therefore, the excess of fair value over existing net book value was reallocated as a pro rata reduction to certain non-current assets.
38

3/28/2014 UNITED STATES
http://www.sec.gov/Archives/edgar/data/1082198/000137647414000074/prnx_10k.htm 61/125

3/28/2014 UNITED STATES
http://www.sec.gov/Archives/edgar/data/1082198/000137647414000074/prnx_10k.htm 62/125
Table of Contents
• The Company’s accumulated deficit and accumulated other comprehensive income (loss) accounts of $68.6 million and($0.1) million, respectively, as of September 30, 2012 was eliminated, with a commensurate reduction in additional paid-incapital.
• The Company’s earnings and accumulated other comprehensive income (loss) subsequent to September 30, 2012 areseparately presented as “Retained (Deficit) - since September 30, 2012” on the face of the consolidated balance sheetsand this presentation will be carried forward for ten years until September 30, 2022.
• The estimates and assumptions used in the valuations are inherently subject to uncertainties and contingencies beyondthe control of the Company. Accordingly, there can be no assurance that the estimates, assumptions and values reflectedin the valuations will be realized, and actual results could vary materially. The preliminary estimates of the fair value of theCompany’s assets and liabilities, in connection with the application of quasi-reorganization accounting completed duringthe three months ended September 30, 2012, were based upon preliminary calculations and valuations. Our estimates andassumptions for each of these were subject to change as we obtained additional information for our estimates during therespective measurement periods (up to one year from the quasi-reorganization date). The primary areas of thosepreliminary estimates that were not finalized as of September 30, 2012 related to inventory and identifiable intangibleassets and during the fourth quarter of 2012 a downward revision of $0.3 million was recorded to the value allocable toinventory and an upward revision of $0.3 million was recorded to the value of contracts along with other minor revisions.
Below is a summary of assets and liabilities as of September 30, 2012 and the adjusted fair value for each type of asset andliability after reallocation.
Q uasi-Reorganization Adjustments
As ofSeptember 30,2012 CarryingValue Prior to
Q uasi-Reorganization
ComputedFair Value
% ofFair
Value Excess ValueReallocation
% ofReallocation
AdjustedCarrying Value
after Q uasi-Reorganization
Other current assets $ 28,224,080 $ 28,224,080 N/A N/A — $ 28,224,080
Inventories 1,488,543 1,701,133 N/A N/A — 1,701,133
Total current assets 29,712,623 29,925,213 N/A N/A — 29,925,213
Short term debt – related
party 1,018,089 1,078,000 N/A N/A — 1,078,000
Other current liabilit ies 19,319,030 19,319,030 N/A N/A — 19,319,030
Total current
liabilit ies 20,337,119 20,397,030 N/A N/A — 20,397,030
Net current assets 9,375,504 9,528,184 N/A N/A — 9,528,184
Non-current deferred
taxes, net 3,855,193 3,855,193 N/A N/A — 3,855,193
Non-current assets
(deposits) 57,863 57,863 N/A N/A — 57,863
Other non-current assets Plant and Equipment 415,174 427,163 0.06 409,480 0.06 17,684
Construction and
power contracts — 6,540,000 0.94 6,269,258 0.94 270,742
Total other non-current
assets (excludes
deferred taxes) 415,174 6,967,163 1.00 6,678,738 1.00 288,425
Non-current liabilit ies Long term debt – related
party 1,316,341 1,342,273 N/A N/A N/A 1,342,273
Total Net Non-current
assets (excluding deferred
taxes) (901,168) 5,624,890 1.00 6,678,738 1.00 (1,053,848)

3/28/2014 UNITED STATES
http://www.sec.gov/Archives/edgar/data/1082198/000137647414000074/prnx_10k.htm 63/125
Total Net Assets $ 12,387,392 $ 19,066,130 1.00 6,678,738 1.00 $ 12,387,392
39

3/28/2014 UNITED STATES
http://www.sec.gov/Archives/edgar/data/1082198/000137647414000074/prnx_10k.htm 64/125
Table of Contents
In addition to the adjustments above, the net effect of applying quasi-reorganization accounting to the Company’sconsolidated balance sheet at September 30, 2012 was to adjust the accumulated deficit and cumulative othercomprehensive income (loss) to zero balances with a commensurate reduction in our additional paid-in capital, forpurposes of establishing a new earned surplus account. The professional costs incurred in connection with the quasi-reorganization approximated $0.1 million and were charged directly to accumulated deficit in connection with thereclassification of the accumulated deficit to additional paid-in capital in connection with the quasi-reorganization. During2013, amortization of adjustments resulting from the quasi-reorganization increased pretax income approximately $0.2million and arose primarily from lower depreciation expense ($0.2 million), lower interest expense ($0.1 million) and highercontract amortization expense ($0.1 million). These items were not material for 2012 and are not expected to be materialduring 2014 and beyond.
3. Significant Accounting Policies
Principles of Consolidation and Presentation—The consolidated financial statements include the accounts of all
majority-owned subsidiaries over which the Company exercises control and joint ventures when determined to be variableinterest entities in which the Company is the primary beneficiary as of December 31, 2013. During 2013 and 2012, thevariable interest entities and related financial results are not material. All inter-company accounts have been eliminated inconsolidation. The 2013 and 2012 consolidated financial statements of the Company reflect the impact of quasi-reorganization accounting. See Notes 1 and 2 in the notes to our consolidated financial statements for more informationregarding joint ventures and the quasi-reorganization.
Use of Estimates—The preparation of financial statements in conformity with accounting principles generally accepted in
the United States (GAAP) requires management to make estimates and assumptions that affect the reported amounts ofassets and liabilities and disclosure of contingent assets and liabilities at the date of the financial statements and thereported amounts of revenues and expenses during the reporting period. The more significant estimates affectingamounts reported in the consolidated financial statements relate to revenues under long-term contracts, includingestimates of costs to complete projects and provisions for contract losses, valuation of options in connection withvarious share-based compensation plans, insurance accruals, the valuation allowance against deferred tax assets and theestimates and assumptions used in the valuations obtained in connection with the 2012 quasi-reorganization.Accordingly, there can be no assurance that the estimates, assumptions and values reflected in the valuations will berealized. Actual results could vary materially. During the fourth quarter of 2012, the Company had changes in estimatesrelated to the quasi-reorganization. See Note 2 in the notes to our consolidated financial statements. The Company alsohad a change in the estimates of anticipated costs associated with the close out, demobilization and other changes inestimate related to various projects that resulted in a $1.1 million decrease and a $0.9 million increase to pretax income afternon-controlling interest in 2013 and 2012, respectively.
Reclassification—Certain reclassifications were made to prior years’ amounts to conform to the 2013 presentation.
Revenue Recognition— Pernix offers our services through two operating business segments: General Construction and
Power Generation Services which are supported by the Corporate segment. Prior to March 28, 2012, the Company alsooperated the RF Transmitter Design, Installation and Service segment. Revenue recognition for each of the non-corporatesegments is described by segment below.
General Construction Revenue. Revenue from construction contracts is recognized using the percentage-of-completion
method of accounting based upon costs incurred and estimated total projected costs. Our current projects with the U.S.Government are design/build contracts with fixed contract prices and include provisions of termination for convenienceby the party contracting with us. Such provisions also allow payment to us for the work performed through the date oftermination.
The Company only uses approved contract changes in its revenue recognition calculation. This method of revenuerecognition requires that the Company estimate future costs to complete a project based upon the knowledge andexperience of the Company’s engineers, project managers and finance professionals. Estimating future costs requiresjudgment of the value and timing of material, labor, scheduling, product deliveries, contractual performance standards,liability claims, impact of change orders, contract disputes as well as productivity. In addition, sometimes clients, vendorsand subcontractors will present claims against us for recovery of costs they incurred in excess of what they expected to

3/28/2014 UNITED STATES
http://www.sec.gov/Archives/edgar/data/1082198/000137647414000074/prnx_10k.htm 65/125
incur, or for which they believe they are not contractually responsible. In turn, we may also present claims to our clients,vendors and subcontractors for costs that we believe were not our responsibility or may be beyond our scope of work.The Company will include costs associated with these claims in their financial
40

3/28/2014 UNITED STATES
http://www.sec.gov/Archives/edgar/data/1082198/000137647414000074/prnx_10k.htm 66/125
Table of Contents
information when such costs can be reliably identified and estimated. Similarly, the Company will include in revenueamounts equal to costs for claims, where the outcome is probable that the claim will be found in the favor of the Company.Costs and estimated earnings in excess of amounts billed to customers are recognized as an asset. Amounts billed inexcess of costs and estimated earnings are recognized as a liability. The Company will record a provision for losses whenestimated costs exceed estimated revenues. Contracts are generally completed in approximately 18 months from the dateon which the Company is ordered to proceed with substantial work. In situations where the Company is responsible forprocurement of construction materials, shipping and handling expenses are included in the contract costs of sales and inrevenue to the extent the contract is complete.
Power Generation Services Revenue. The Company receives variable monthly payments as compensation for its
production of power. The variable payments are recognized based upon power produced and billed to the customer asearned during each accounting period. The Company also received fixed payments in connection with the long termconcession deed for Operations and Maintenance (O&M) services in Fiji.
RF Transmitter Design, Installation and Service Revenue. Any revenues associated with TransRadio contracts are
included in the loss from discontinued operations for the year ended December 31, 2012. See Note 8 in the notes to ourconsolidated financial statements. Contracts for TransRadio products and services generally contained customer-specified acceptance provisions. The Company evaluated customer acceptance by demonstrating objectively that thecriteria specified in the contract acceptance provisions were satisfied and recognized revenue on these contracts whenthe objective evidence and customer acceptance were demonstrated. Certain contracts included prepayments, which wererecorded as a liability until the customer acceptance was received, at which time the prepayments were recorded asrevenue. Certain TransRadio contracts required training services separate from acceptance of provisions and weregenerally provided after the delivery of the product to the customer. These services were a separate element of thecontract that was accounted for as revenue was earned. The amount attributable to services was based on the fair valueof the services in the marketplace and was typically stipulated separately with the customer.
Cost of Construction Revenue. Cost of revenue consists of direct costs on contracts, including labor and materials,
amounts payable to subcontractors, direct overhead costs, equipment expense (primarily depreciation, maintenance, andrepairs), interest associated with construction projects, and insurance costs. The Company records a portion ofdepreciation in cost of revenue and indirect overhead dependent on the nature of charges and the related projectagreements. If not chargeable to individual projects, overhead costs are expensed in the period incurred. Contractsfrequently extend over a period of more than one year. Revisions in cost and profit estimates during construction arerecognized in the accounting period in which the facts that require the revision become known. Losses on contracts areprovided for in total when determined, regardless of the degree of project completion.
Contract Claims—The Company records contract revenue related to claims only if it is probable that the claim will result
in additional contract revenue and if the amount can be reliably estimated. In such cases, the Company records revenueonly to the extent that contract costs relating to the claim have been incurred. As of December 31, 2013 and 2012, theCompany had no significant receivables related to contract claims.
Cash and Cash Equivalents—The Company’s cash equivalents include highly liquid investments which have an initial
maturity of three months or less. See Note 16 to the consolidated financial statements.
Inventory — Inventories are valued at the lower of cost or market, generally using the first-in, first-out (FIFO) method
with certain exceptions for items that are homogenous in nature. The inventory reflects the write up of inventory that wason hand as of September 30, 2012 to fair value in connection with the quasi-reorganization as described below.
As a result of the quasi-reorganization, the carrying value of inventory was increased from $1.5 million to $1.7 million as ofSeptember 30, 2012. The new cost basis reflected the replacement cost of the inventory as of September 30, 2012. The $0.2million increase in the carrying value of the inventory will be expensed as the inventory is used and is inclusive of afourth quarter 2012 refinement ($0.3 million decrease) of the fair value estimate used as of the quasi-reorganizationimplementation date. There was no net impact on total assets related to these valuation refinements; rather simply areallocation of the values subject to the valuation cap in which total net

3/28/2014 UNITED STATES
http://www.sec.gov/Archives/edgar/data/1082198/000137647414000074/prnx_10k.htm 67/125
41

3/28/2014 UNITED STATES
http://www.sec.gov/Archives/edgar/data/1082198/000137647414000074/prnx_10k.htm 68/125
Table of Contents
assets cannot be written up in a quasi-reorganization. The carrying value of other current assets approximated the fairvalue and no adjustment was necessary for those other current assets in connection with the quasi-reorganization.
Property and Equipment - Property and equipment are initially recorded at cost and are depreciated over their estimated
useful lives using the straight-line method. Expenditures for maintenance and repairs are expensed as incurred. Typically,estimated useful lives range from three to ten years for equipment, furniture and fixtures and 39 years for buildings.Leasehold improvements are amortized on a straight-line basis over the shorter of their estimated useful lives or theremaining terms of the underlying lease agreement. As a result of the quasi-reorganization, the carrying value of propertyand equipment was reduced $0.4 million to an insignificant amount as of September 30, 2012, the new cost basis, and theaccumulated depreciation was also removed. The new cost basis will be amortized over the remaining estimated usefullives of these assets. In March 2013, the Company purchased the building where its corporate headquarters is located
from Baron Real Estate Holdings, a related party under common control for $1.1 million, which approximates the carryingvalue of the related party seller.
Long-lived assets to be held and used are reviewed for impairment whenever events or circumstances indicate that theassets may be impaired. For assets to be held and used, impairment losses are recognized based upon the excess of theasset’s carrying amount over the fair value of the asset. For long-lived assets to be disposed, impairment losses arerecognized at the lower of the carrying amount or fair value less cost to sell. There was no such impairment subsequent tothe quasi-reorganization through December 31, 2013.
Construction and power contracts – In connection with the refinement of quasi-reorganization asset valuations during
the fourth quarter of 2012, $0.3 million of contracts were recognized as intangible assets and will be amortized inproportion to the anticipated completion of the contracts. As of December 31, 2013 the remaining weighted average life oncontract intangible assets is 5.9 years. Amortization expense of the contract intangible assets was less than $0.1 millionfor the years ended December 31, 2013 and 2012, and is expected to be less than $0.1 million for the year ending December31, 2014 and immaterial after 2014. In response to the re-tendering of the operation and maintenance of the Vanuatu poweroperations the Company has accelerated the amortization period of the related power contract. See Note 24 to theconsolidated financial statements.
Income Taxes—PGI and PFL file separate corporate income tax returns. Pernix Group, Inc. is a U.S. corporation that files a
separate U.S. corporate income tax return. Pernix Fiji, Ltd. is a Fijian corporation and files a Fijian corporate tax return.
Deferred income taxes are accounted for under the asset and liability method. Deferred tax assets and liabilities arerecognized for the estimated future tax consequences attributable to differences between the financial statement carryingamounts of existing assets and liabilities and their respective income tax bases. Deferred tax assets and liabilities aremeasured using enacted tax rates expected to apply to taxable income in the years in which those temporary differencesare expected to be recovered or settled. The effect on deferred tax assets and liabilities of a change in tax rates isrecognized in income in the period that includes the enactment date.
A valuation reserve is recorded to offset the deferred tax benefit if management has determined it is more likely than notthat the deferred tax assets will not be realized. The need for a valuation allowance is assessed each quarter.
As previously mentioned, the Company sold its 82% interest in TransRadio in March 2012. Historically, TransRadioprepared its corporate income tax returns based on German tax code. The German tax liability is generally comprised ofthree components: corporate income tax of 15%, a solidarity tax and a trade tax. In connection with the 2009 acquisition ofthe controlling interest in TransRadio, a deferred tax liability of $0.6 million was recorded related to the intangiblecustomer relationship and backlog assets. Those assets have been amortized or written off and the related deferred taxliability has been reduced to zero in connection with the sale of TransRadio. German tax expense is included indiscontinued operations. In accordance with accounting guidance for deferred tax assets on discontinued operations, thedeferred tax benefit associated with the 2012 loss on discontinued operations is reflected as income tax benefit to theextent it is more likely than not that it will be realized in connection with future continuing operations. As of December 31,2013, this deferred tax asset is fully reserved for by a valuation allowance.
42

3/28/2014 UNITED STATES
http://www.sec.gov/Archives/edgar/data/1082198/000137647414000074/prnx_10k.htm 69/125

3/28/2014 UNITED STATES
http://www.sec.gov/Archives/edgar/data/1082198/000137647414000074/prnx_10k.htm 70/125
Table of Contents
As of June 30, 2012, the Company restored the $1.4 million valuation allowance on the TCNMI deferred tax asset inconnection with the uncertainty regarding the strategy as to whether or not it would continue to operate and / or ownTCNMI. On October 12, 2012, the Company sold its 100% interest in TCNMI, Inc., thereby triggering a $51.7 million U.S.federal and state tax loss for which the related deferred tax asset of $22.5 million is fully reserved with a valuationallowance as of December 31, 2013. Prior to the sale, the cumulative operating losses of the TCNMI operations were notincluded in U.S. taxable income because the CNMI is a separate tax jurisdiction. TCNMI historically prepared its corporateincome tax returns based on the local CNMI tax code. Any income tax due on the TCNMI source income is rebated to theextent that it exceeds local business gross receipts taxes. The rebate percent ranges from 90% decreasing to 50%depending upon the amount of taxable income. The amounts paid for the gross receipts tax amounted to zero and $24,390in 2013 and 2012, respectively, and are included in loss on discontinued operations in the consolidated statement ofoperations.
At the date of the quasi-reorganization, deferred taxes were reported in conformity with applicable income tax accountingstandards described above, net of applicable valuation allowances. Deferred tax assets and liabilities were recognized fordifferences between the assigned values and the tax basis of the recognized assets and liabilities. In accordance with thequasi-reorganization requirements tax benefits realized in periods after the quasi-reorganization that were not recognizedat the date of the quasi-reorganization will be recorded directly to equity.
Related Party Debt — As a result of the quasi-reorganization, the carrying values of related party debt were increased
from $1.0 million to $1.1 million for short term related party debt and from $1.2 million to $1.3 million, for the long termrelated party debt as of September 30, 2012. The new cost basis reflects the fair value of the debt as of the date of thequasi-reorganization in accordance with accounting guidance. The debt is a “financial instrument” and thus is not subjectto the net asset write-up limitation. The change in the carrying value of the debt was fully amortized in connection withthe repayment of the debt in December 2013.
Allowance for Doubtful Accounts—The Company records its accounts receivable net of an allowance for doubtful
accounts. This allowance for doubtful accounts is estimated based on management’s evaluation of the contracts involvedand the financial condition of its clients. The factors considered by the Company in its contract evaluations include, butare not limited to:
· Client type—domestic and foreign federal, state and local government or commercial client;
· Historical contract performance;
· Historical collection and delinquency trends;
· Client credit worthiness; and
· General economic conditions.
During 2013 and 2012, there were no bad debt write-offs of accounts receivable. As of December, 31, 2013 and 2012, therewas no allowance for doubtful accounts deemed necessary.
Fair Value of Financial Instruments—The Company determines the fair values of its financial instruments, including
short-term investments, debt instruments and derivative instruments based on inputs or assumptions that marketparticipants would use in pricing an asset or a liability. The Company categorizes its instruments using a valuationhierarchy for disclosure of the inputs used to measure fair value. This hierarchy prioritizes the inputs into three broadlevels as follows: Level 1 inputs are quoted prices (unadjusted) in active markets for identical assets or liabilities; Level 2inputs are quoted prices for similar assets and liabilities in active markets or inputs that are observable for the asset orliability, either directly or indirectly through market corroboration, for substantially the full term of the financialinstrument; Level 3 inputs are unobservable inputs based on the Company’s assumptions used to measure assets andliabilities at fair value. The classification of a financial asset or liability within the hierarchy is determined based on thelowest level input that is significant to the fair value measurement.
The carrying amounts of cash and cash equivalents, accounts receivable, accounts payable, accrued expenses and thedebt agreements approximate fair value because of the short maturities of these instruments
43

3/28/2014 UNITED STATES
http://www.sec.gov/Archives/edgar/data/1082198/000137647414000074/prnx_10k.htm 71/125

3/28/2014 UNITED STATES
http://www.sec.gov/Archives/edgar/data/1082198/000137647414000074/prnx_10k.htm 72/125
Table of Contents
and the related party loans were adjusted to fair value in connection with the quasi-reorganization and were repaid duringDecember 2013.
The Company’s fair value measurement methods may produce a fair value calculation that may not be indicative of netrealizable value or reflective of future fair values. Although the Company believes its valuation methods are appropriateand consistent with those used by other market participants, the use of different methodologies or assumptions todetermine fair value could result in a different fair value measurement at the reporting date.
From time to time, the Company holds financial instruments such as marketable securities, receivables related to sales-type leases, and foreign currency contracts. As of December 31, 2013 and 2012, the Company did not hold any suchfinancial instruments.
Intangible Assets—Certain identifiable intangibles are reviewed for impairment whenever events or changes in
circumstances indicate that the carrying amount of an asset may not be recoverable. Recoverability of assets to be heldand used is measured by a comparison of the carrying amount of an asset to future net cash flows expected to begenerated by the asset. If such assets are considered to be impaired, the impairment to be recognized is measured by theamount by which the carrying amount of the assets exceeds the fair value of the assets. Assets to be disposed of arereported at the lower of the carrying amount or fair value less costs to sell. Fair values are determined based on quotedmarket value, discounted cash flows or internal and external appraisals, as applicable. During 2012, Pernix Grouprecognized asset impairment charges of $0.5 million that are reflected as a component of loss on discontinued operationsin the consolidated statements of operations. The intangible construction and power contracts were measured at fairvalue and recorded subject to the quasi-reorganization rules as of September 30, 2012. These contract assets are notconsidered to be impaired as of December 31, 2013 or 2012.
Foreign Currency Translation—The functional currency of the Company’s foreign operations is the applicable local
currency with the exception of a Fijian division of the Pernix/SHBC JV. Until late 2012, the financial position and results ofoperations of the Company’s Fijian division of the Pernix/SHBC JV are recorded using the local currency (Fijian dollars);however, the Company’s functional currency was U.S. dollars. During late 2012, this subsidiary was combined intoanother Fijian subsidiary and at that time the functional currency designation was aligned to be consistent for all Fijianoperations and is now the Fijian dollar. The financial statements for this subsidiary are measured in U.S. dollars using thehistorical exchange rate for fixed assets and certain other assets and liabilities. The exchange rate at the end of thereporting period is used to convert all monetary assets and liabilities. An annual average exchange rate is used for eachperiod for revenues and expenses. The resulting foreign exchange transaction gains or (losses) are recorded in theconsolidated statement of operations. The functional currency is translated into U.S. dollars for balance sheet asset andliability accounts using current exchange rates in effect as of the balance sheet date and for revenue and expenseaccounts using a weighted-average exchange rate during the fiscal year. The translation adjustments are reflected as aseparate component of stockholders’ equity captioned accumulated other comprehensive income (loss). Gains or lossesresulting from transactions denominated in foreign currencies are included in other income (expense), net in theconsolidated statements of operations.
From time to time, the Company is exposed to foreign currency exchange risk on various foreign transactions and theCompany attempts to reduce this risk and manage cash flow exposure of certain payables and anticipated transactions byentering into forward exchange contracts. At December 31, 2013 and 2012, the foreign currency risk is not material andthere were no foreign exchange contracts outstanding. The Company historically has not applied hedge accountingtreatment to its forward exchange contracts.
Stock-Based Compensation—In December 2011, the Company’s shareholders and board of directors approved the 2012
Incentive Stock Option Plan (the “ISOP”) that provides for the issuance of qualified stock options to employees. Inconnection with the annual shareholder meeting held on November 12, 2012, the shareholders approved a long termincentive plan for non-employee directors (the “LTIP”) and consultants. During the annual shareholder meeting held inNovember 2013, the shareholders approved the Equity Incentive Plan (the “EIP”) for employees, non-employee directorsand consultants. Simultaneously with the approval of the EIP, the shareholders approved the transfer of the remainingundistributed shares from the ISOP and LTIP into the EIP. The EIP allows various types of awards including stockoptions, stock awards, restricted stock units and other types of awards.

3/28/2014 UNITED STATES
http://www.sec.gov/Archives/edgar/data/1082198/000137647414000074/prnx_10k.htm 73/125
44

3/28/2014 UNITED STATES
http://www.sec.gov/Archives/edgar/data/1082198/000137647414000074/prnx_10k.htm 74/125
Table of Contents
The Company recognizes the expense associated with stock option awards over the period during which an employee,director or consultant is required to provide services in exchange for the award, known as the requisite service period(usually the vesting period).
The related option awards for employees and directors are classified as equity and as such are valued at the grant dateand are not subject to remeasurement. Estimates are revised if subsequent information indicates that forfeitures will differfrom previous estimates, and the cumulative effect on compensation cost of a change in the estimated forfeitures isrecognized in the period of the change. The option valuation was performed using a fair value Black Scholes model.Option valuation models require the input of highly subjective assumptions, and changes in the assumptions canmaterially affect fair value estimates. Judgment is required in estimating stock price volatility, forfeiture rates, expecteddividends, and expected terms that options remain outstanding. During 2013 and 2012, the compensation expense relatedto the stock options was approximately $0.2 million and less than $0.1 million, respectively.
4. Recently Adopted Accounting Pronouncements
In March 2013, the FASB issued an ASU that clarifies that a cumulative translation adjustment should be released into netincome only if there is a sale or transfer of a controlling financial interest in a foreign subsidiary and only if the sale ortransfer results in the complete or substantially complete liquidation of the foreign entity. The guidance also clarifies thatexisting guidance for pro rata release of a cumulative translation adjustment continues to apply for equity methodinvestments in a foreign entity. This update is effective for fiscal years (and interim reporting periods within those years)beginning after December 15, 2013 and early adoption is permitted as of the beginning of the calendar year in whichadoption occurs. The Company complies with this guidance and as such released into income the cumulative translationadjustment of $0.4 million related to TransRadio during the first half of 2012 as it completely liquidated its investment inTransRadio. This release of the cumulative translation adjustment into income is reflected in the Statement of Changes inStockholders’ Equity.
In February 2013, the FASB issued an ASU that requires an entity to report items reclassified out of accumulated othercomprehensive income (loss) to enable users to understand the impact of such reclassifications on income or to a balancesheet account. The Company has complied with this reporting requirement during 2013 and 2012. As is reported in ourstatement of changes in stockholders' equity, in connection with the September 30, 2012 quasi-reorganization, theCompany has reclassified $0.1 million from accumulated other comprehensive income (loss) to additional paid in capital inaccordance with accounting guidance for "fresh start" accounting. In addition, the Company disclosed the $0.4 millionrelease of foreign currency translation into income in connection with the sale of TransRadio as mentioned above. Thisguidance does not have a material impact on our financial statements or disclosures.
In February 2013, the FASB issued an ASU that requires an entity to disclose obligations resulting from joint and severalliability arrangements for which the total amount of the obligation is fixed at the reporting date but the apportionment ofthe total is not determinable. The ASU is intended to help users understand how an entity has accounted for sucharrangements because U.S. GAAP previously did not include specific guidance on accounting for such obligations whichhas resulted in diversity in practice. The guidance in this Update requires an entity to measure obligations resulting fromjoint and several liability arrangements for which the total amount of the obligation within the scope of this guidance isfixed at the reporting date, as the sum of the amount the reporting entity agreed to pay on the basis of its arrangementamong its co-obligors plus any additional amount the reporting entity expects to pay on behalf of its co-obligors. Theguidance in this Update also requires an entity to disclose the nature and amount of the obligation as well as otherinformation about those obligations. The update is effective for fiscal years, and interim periods within those years,beginning after December 15, 2013. The Company has complied with the requirements of this update during 2013 and 2012and it is not expected to have a material impact on our financial statements or disclosures.
45

3/28/2014 UNITED STATES
http://www.sec.gov/Archives/edgar/data/1082198/000137647414000074/prnx_10k.htm 75/125
Table of Contents
5. Recently Issued Accounting Pronouncements
In January 2014, the FASB issued ASU 2014-05, ‘‘Service Concession Arrangements.’’ This ASU clarifies that, unlesscertain circumstances are met, operating entities should not account for certain concession arrangements with public-sector entities as leases and should not recognize the related infrastructure as property, plant and equipment. This ASU iseffective for interim and annual reporting periods beginning after December 15, 2014. Management is in the process ofdetermining the impact on the company’s financial position, results of operations and cash flows.
Other pronouncements issued recently are not expected to have a material impact on the company’s financial position,results of operations or cash flows.
6. Fair Value of Non-Financial Assets
The tradename intangible related to TransRadio was written down by $0.4 million to $0.5 million during 2011, based on theupdated relief from royalty rate method Level 3 valuation and the remainder of the tradename was written off inconnection with the sale of TransRadio in March 2012. As discussed in Note 2, customer contract intangibles totalingless than $0.3 million were recorded in connection with the quasi-reorganization and are based upon Level 3 valuationinputs. No other non-financial intangible assets remain as of December 31, 2013.
7. Contract Backlog
Backlog represents the amount of revenue the Company expects to realize from work to be performed on uncompletedconstruction contracts in progress at December 31, 2013 and 2012 and from construction contractual agreements on whichwork has not yet begun. The following summarizes changes in backlog on construction contracts during the years endedDecember 31, 2013 and 2012:
Contract Backlog Schedule
Balance at December 31, 2011 $ 70,996,164
New Construction Contracts / Amendments to contracts in 2012 111,708,446
Less: Construction contract revenue earned as of December 31, 2012 (114,803,035)
Balance at December 31, 2012 $ 67,901,575
Balance at December 31, 2012 $ 67,901,575
New Construction Contracts / Amendments to contracts in 2013 37,000,391
Less: Construction contract revenue earned as of December 31, 2013 (67,776,314)
Balance at December 31, 2013 $ 37,125,652
Management anticipates that the full backlog of $37.1 million as of December 31, 2013 will be recognized as revenueduring 2014. Additionally, the table does not include $45.5 million of new awards and modifications received in early 2014.The new awards include the $29.1 million contract awarded to PFL in February 2014 to add 35MW of capacity to theKinoya diesel power station and a $17.0 million contract awarded in February 2014 to Pernix / LTC JV, to construct a twostory laboratory on the campus of Texas A&M University. The backlog table also does not include the $0.6 millionmodification received on February 24, 2014 that will generate incremental revenue related settlements for customer relatedtime delays on the embassy rehabilitation project in Niger. Finally, the table does not include revenue associated with ourlong term contract or memo of understanding for power operating and maintenance services.
46

3/28/2014 UNITED STATES
http://www.sec.gov/Archives/edgar/data/1082198/000137647414000074/prnx_10k.htm 76/125
Table of Contents
8. Discontinued Operations
As part of a strategic plan formulated in early 2012, the Company embarked on a review of returns on its operatingactivities and decided to consider strategic options for two underperforming operating components. In connection withthis plan, the Company ultimately decided to discontinue two operating units in 2012. Effective October 12, 2012, theCompany sold 100% of its interest in TCNMI to Marianas Energy Technology, Inc., a CNMI Company, an unrelated thirdparty and the sale price was consistent with the fair market value at $1,000 settled in cash on the closing date coupledwith buyer assumption of all liabilities. For the period from January 1, 2012 through October 12, 2012, the date of the sale,the loss from the TCNMI discontinued operations was $1.8 million. The gain on the sale of TCNMI was $1.1 million, andwas reflected as a credit to Additional Paid in Capital in the fourth quarter of 2012 in accordance with accountingguidance pertaining to discontinued operations occurring in connection with a quasi-reorganization. Pernix Group, Inc.sold TCNMI to focus its efforts on construction services and power operations/power construction that are expected toprovide a higher return on investment and higher growth potential. In connection with the sale of TCNMI, Pernix Grouprealized a tax loss of $51.7 million and in October 2012 the Company booked a deferred tax asset of $22.5 million that isfully offset by a valuation allowance.
In March 2012, the Pernix Group management team requested and received approval from the Pernix Board of Director’s topursue an expedited divestiture of the 82% interest in TransRadio. This divestiture was intended to curtail losses that hadbeen generated by the radio transmitter segment and will allow the Pernix management team to focus its efforts on theConstruction and Power Generation Services operating segments which it intends to grow organically and throughacquisitions. The Company executed a stock sale and transfer agreement for its equity interest in TransRadio on March26, 2012 at an amount determined to be the fair value of TransRadio and closed the transaction on March 28, 2012 for $1.2million plus assumption of the liabilities of TransRadio by Bevita Commercial Corp., a related party for which the Companyis unable to determine the extent of common control. The 2012 losses from operations of TransRadio amounted to $1.2million and the loss on sale amounted to $0.7 million ($0.5 million of which related to the write-down of the tradenameintangible asset). These 2012 losses are presented as losses from discontinued operations in our consolidated statementsof operations.
Following is a summary of loss from the operations and sale of TransRadio and TCNMI for 2012 (in millions):
TransRadio TCNMI
2012 2012
Revenues $ 1.0 $ 1.2
Cost of Goods Sold 0.6 0.8
Operating expense and other 1.1 0.7
Operating loss before income tax expense (0.7) (0.2)
Income tax expense on discontinued operations and sale 0.0 (1.4)
Loss on sale of TransRadio discontinued operations, net (0.7) N/A
Gain on sale of TCNMI recorded in Additional Paid In Capital N/A 1.1
Loss on discontinued operations, net of income taxes $ (1.9) $ (1.8)
There were no net assets from discontinued operations for TransRadio and TCNMI included in the consolidated balancesheets as of December 31, 2013 or 2012.
47

3/28/2014 UNITED STATES
http://www.sec.gov/Archives/edgar/data/1082198/000137647414000074/prnx_10k.htm 77/125
Table of Contents
9. Accounts Receivable—Net
Receivables on construction contracts completed and in progress include amounts billed but not yet received fromcontract customers. Trade and other accounts receivable primarily arise from construction contract related sales tocommercial and governmental customers in the normal course of business. Accounts receivable consist of the followingat December 31, 2013 and 2012:
December 31,
2013 December 31,
2012
T rade construction contracts completed and in
progress $ 8,255,970 $ 7,109,308
Trade other (Power Generation receivables) 641,424 779,839
Less: allowance for doubtful accounts — —
Total accounts receivable trade, net $ 8,897,394 $ 7,889,147
Retainage receivables 200,000[1] 200,000[1]
Accounts receivable – related party 39,447 23,041
Other receivables 86,389 433,231
Total accounts receivable , net $ 9,223,230 $ 8,545,419
[1] Includes $200,000 retainage receivable from US Department of State’s Bureau of Overseas Buildings Operations (OBO)that the Company currently anticipates will be received in early 2014, as the final Shield project close-out is completed.
Gross Trade Receivable by MajorCustomers
December 31,2013
December 31,2012
OBO $ 8,255,970 $ 7,109,308
Government of Vanuatu (VUI) 266,258 390,881
Fiji Electricity Authority (FEA) 374,591 388,958
All others 575 —
Total 8,897,394 7,889,147
Less: Allowance for doubtful accounts — —
Total accounts receivable trade, net $ 8,897,394 $ 7,889,147
Retainage receivables 200,000[1] 200,000[1]
Accounts receivable - related party 39,447 23,041
Other Receivables 86,389 433,231
Total accounts receivable - net $ 9,223,230 $ 8,545,419
[1] Includes $200,000 retainage receivable from OBO that the Company currently anticipates will be received in early 2014,as the final Shield project close-out is completed.
10. Inventories
As of December 31, 2013 and 2012 the components of inventories are as follows:
December 31,
2013
December 31,
2012
Supplies $ 1,626,003 $ 1,822,945
Total inventories $ 1,626,003 $ 1,822,945
The supplies inventory represents the value of spare parts maintained by the Company for use in the diesel powergenerators. As a result of the quasi-reorganization, the carrying value of the PFL inventory was increased from $1.5million to $1.7 million reflecting the replacement cost of the inventory as of September 30, 2012. The increased carryingvalue of the inventory is being expensed as the inventory is used.
48

3/28/2014 UNITED STATES
http://www.sec.gov/Archives/edgar/data/1082198/000137647414000074/prnx_10k.htm 78/125

3/28/2014 UNITED STATES
http://www.sec.gov/Archives/edgar/data/1082198/000137647414000074/prnx_10k.htm 79/125
Table of Contents
11. Cost and Estimated Earnings on Uncompleted Contracts
Long-term construction contracts in progress are accounted for using the percentage-of-completion method. Billings,costs incurred, and estimated earnings on uncompleted contracts as of December 31, 2013 and 2012 were as follows:
Cost and Estimating Earnings on Uncompleted Contracts December 31, 2013 December 31, 2012
Cost incurred on uncompleted contracts $ 211,750,908 $ 147,874,837
Estimated earnings 18,207,952 14,332,709
Total cost and estimated earnings 229,958,860 162,207,546
Less: Billings to date 238,309,368 171,124,928
Net (8,350,508) (8,917,382)
These amounts are included in the accompanying consolidated balance sheets under the following captions:
Costs and estimated earnings in excess of billings on uncompleted
contracts $ 56,679
$ —
Billings in excess of costs and estimated earnings on uncompleted
contracts (8,407,187)
(8,917,382)
$ (8,350,508) $ (8,917,382)
12. Property and Equipment
The property and equipment carrying value as of December 31, 2013 reflects the revaluation performed in connection withthe quasi-reorganization implemented on September 30, 2012, coupled with the addition of new property and equipmentsince September 30, 2012. During the first quarter of 2013, the Company purchased the building and land on which itscorporate headquarters are now located for $1.1 million from Baron Real Estate Holdings, Inc. (“Baron”), a related party. Prior to the purchase Pernix Group, Inc. leased its corporate headquarters from Baron. In accordance with the applicableaccounting rules for such a transaction between related parties with the same parent, the assets acquired were recorded atthe carrying value utilized by Baron at the date of the acquisition, which approximated the amount paid by Pernix for theassets.
The property and equipment as of December 31, 2013 is as follows:
December 31,
2013
December 31,
2012
Building/leasehold improvements $ 785,240 $ 17,438
Land 420,000 —
Office furniture and equipment 121,693 2,438
Computer, software and communication
equipment 8,920
8,279
1,335,853 28,155
Less accumulated depreciation (52,954) (3,816)
Net property and equipment $ 1,282,899 $ 24,339
As a result of the quasi-reorganization, the carrying value of property and equipment acquired prior to the quasi-reorganization was reduced by $0.4 million to an insignificant amount referred to as the “new cost basis”. The new costbasis excludes the accumulated depreciation that had accrued on or before September 30, 2012. Total depreciationexpense was $250,761 for 2013 ($49,138 after the quasi-reorganization impact) and $167,997 for 2012 ($3,816 after the quasi-reorganization impact). Depreciation for construction machinery and equipment is recognized as a project expense whenappropriate.
49

3/28/2014 UNITED STATES
http://www.sec.gov/Archives/edgar/data/1082198/000137647414000074/prnx_10k.htm 80/125
Table of Contents
13. Short-term and long-term borrowings
Pernix Group, Inc. debt agreements
As of December 31, 2013 and 2012, the Company has $0.0 million and $2.3 million of outstanding debt under agreementswith related parties. Included in the debt outstanding as of December 31, 2012 was a $1.0 million short-term debtagreement with Bent Marketing Ltd., a related party, which was fully repaid in December 2013. Also included in theoutstanding debt as of December 31, 2012 was a $1.25 million long-term debt agreement with Bent Marketing that wasfully repaid in December 2013. The interest rate on the borrowings was 5% per annum. As a result of the quasi-reorganization, the carrying values of related party debt were increased from $1.0 million to $1.1 million for short termrelated party debt and from $1.25 million to $1.3 million for the long term related party debt. The interest expense during2013 and 2012 amounted to approximately $43,000 and $97,000, respectively, after the impact of the quasi-reorganizationamortization adjustment that reduced the interest expense by $65,799 and $20,044, respectively. See Notes 2 and 3 in thenotes to our consolidated financial statements.
In connection with the purchase of the land and building for the Company’s corporate headquarters during March 2013,Pernix borrowed $0.5 million under an agreement with Baron, a related party, with interest accruing at a rate of 4.0% perannum. The note was payable in twelve monthly installments beginning in March 2013. On December 23, 2013 theoutstanding balance of the note was fully repaid with accrued interest.
On November 28, 2011 the Company received an additional short-term loan from Bent Marketing, Ltd. in the amount of$350,000 that was repaid in May 2012 along with accrued interest.
During the fourth quarter of 2011 and the first quarter of 2012, the Company extended short term loans to TransRadio. Theinterest rate on both loans was 5% and the loans were due on June 30, 2012 and March 14, 2013, respectively. On March28, 2012, the Company sold its interest in TransRadio and the buyer, Bevita Commercial Corp., a related party, assumedthe loans. During May 2012, the loans of $350,000 and $325,000, respectively, for a total of $675,000 plus accrued interestof $13,052 were repaid.
PFL debt agreements
In December 2011, PFL entered into a line of credit agreement with Australia and New Zealand Banking Group Limited(ANZ) which provides borrowing capacity up to FJD 1 million ($0.5 million USD as of December 31, 2013 and $0.6 millionUSD as of December 31, 2012) and is secured by all real and personal property of PFL. During October 2013, PFLincreased the capacity under its line of credit agreement with ANZ to FJD 2 million ($1.1 million USD as of December 31,2013). The agreement remains secured by all real and personal property of PFL and a corporate guarantee of FJD 1 million($0.5 million USD) issued by Pernix Group to ANZ.
A FJD 2,500 ($1,380 USD) fee was paid in conjunction with the increase in the borrowing capacity under the line of creditas well as a commitment fee of 1% per annum in cases where the line of credit is not fully drawn within three months ofacceptance of the line of credit offer. The fee is calculated on the undrawn the line of credit balance, initially assessedthree months from the date of acceptance, and then monthly thereafter until the line of credit is fully drawn. The interestrate applicable to the line of credit is the Bank's published Index Rate minus a margin of 3.70% (Interest rate of 6.25% perannum at December 31, 2013).
As of October 2013, FJD 0.6 million of the line of credit established, was allocated to facilitate the issuance of theperformance security and advance payment guarantee to Solomon Islands Electricity Authority, while FJD 1.4 million, wasallocated to support projects on behalf of Pernix Group, Inc. An establishment fee of 1.75% of the guarantee amount wascharged followed by a semi-annual fee of 1.75%. For each bank guarantee, the fee is payable on the date of the drawdownand afterwards semi-annually. As of December 31, 2013 and 2012 there were no outstanding borrowings under the line ofcredit agreement.
In connection with the line of credit, PFL is subject to a “gearing ratio” covenant that limits net total liabilities less non-current subordinated debt to 2.1 times effective equity, as well as other customary covenants. As of December 31, 2013,the PFL gearing ratio is 0.65, well below the limit of 2.1. PFL is in compliance with all covenants as of December 31, 2013.

3/28/2014 UNITED STATES
http://www.sec.gov/Archives/edgar/data/1082198/000137647414000074/prnx_10k.htm 81/125
50

3/28/2014 UNITED STATES
http://www.sec.gov/Archives/edgar/data/1082198/000137647414000074/prnx_10k.htm 82/125
Table of Contents
14. Fair Value Measurements
The Company adopted the fair value measurement guidance for all nonfinancial assets and liabilities recognized ordisclosed at fair value in the financial statements on a nonrecurring basis. These assets and liabilities include items suchas customer relationships and trademarks and long lived assets that are measured at fair value resulting from impairment,if deemed necessary. Management reviews the recoverability of the assessed value of the intangibles, for impairment,whenever events or changes in circumstances indicate that the carrying value may not be recoverable. When therecovery is reviewed, if the carrying amounts of the assets are determined to be unrecoverable, an impairment loss wouldbe recorded. During 2012, the Company recognized a fair value impairment charge, with respect to its customerrelationships and trademark assets of $0.5 million. The Company does not have any nonfinancial assets and liabilitiesrecognized or disclosed at fair value on a non-recurring basis as of December 31, 2013 except for contracts recorded inconnection with the quasi-reorganization. See Note 2 to the consolidated financial statements.
15. Leases
The Company and its subsidiaries are lessees in non-cancelable leasing agreements for office buildings, equipment andvehicles which expire at various dates. The related lease payments are expensed on a straight-line basis over the leaseterm, including, as applicable, any free-rent period during which the Company has the right to use the asset. For leaseswith renewal options where the renewal is reasonably assured, the lease term, including the renewal period is used todetermine the appropriate lease classification and to compute periodic rental expense. None of the Company’s currentlease agreements have been determined to be capital leasing agreements.
In April 2011, Pernix Group leased its corporate headquarters at 151 E. 22nd Street in Lombard, Illinois under a five yearoperating lease with Baron, a related party, commencing May 1, 2011 and expiring on April 30, 2016. The lease called for abase rental payment of $7,015 per month in the first year with a free month of rent and a 3.0% escalation in the monthlyrate in each of the four subsequent years. In December 2012, the Company amended this lease agreement for thecorporate headquarters to accommodate its growing business. The lease amendment increased the leased space from6,475 square feet to 11,177 square feet. The amended monthly rent was $12,735which went into effect on January 1, 2013. In the first quarter of 2013, the Company purchased the land and building in which the corporate headquarters arelocated and in connection with this purchase the lease was terminated and no further commitment exists.
On January 1, 2012 the Company’s joint venture, PS JV, entered into a lease agreement with ICS Serka LLC for a term offour years from January 15, 2012 through January 14, 2016. The lease calls for a base rental payment of $10,748 per monthin the first year with a 2.5% escalation, in the monthly rate, in each of the three subsequent years. The base monthlyamount excludes operating charges. Pernix-Serka Joint Venture will be responsible for prorated operating charges duringeach calendar year.
On March 28, 2012, the Company sold its interest in TransRadio thereby reducing Pernix Group’s minimum leasecommitments. Prior to the sale, Pernix leased certain buildings, cars and equipment in Germany under non-cancelableoperating leases. TransRadio’s expense for the year ended December 31, 2012 was $0.1 million and was included in theloss from discontinued operations in the consolidated statement of operations for the period.
On September 11, 2013, the Company entered in to a twelve month lease for office space in Dubai. The lease period runsfrom November 15, 2013 to November 14, 2014 at cost of $3,000 per month. The purpose of this office is to facilitate themanagement of local and regional construction projects for new and existing customers.
51
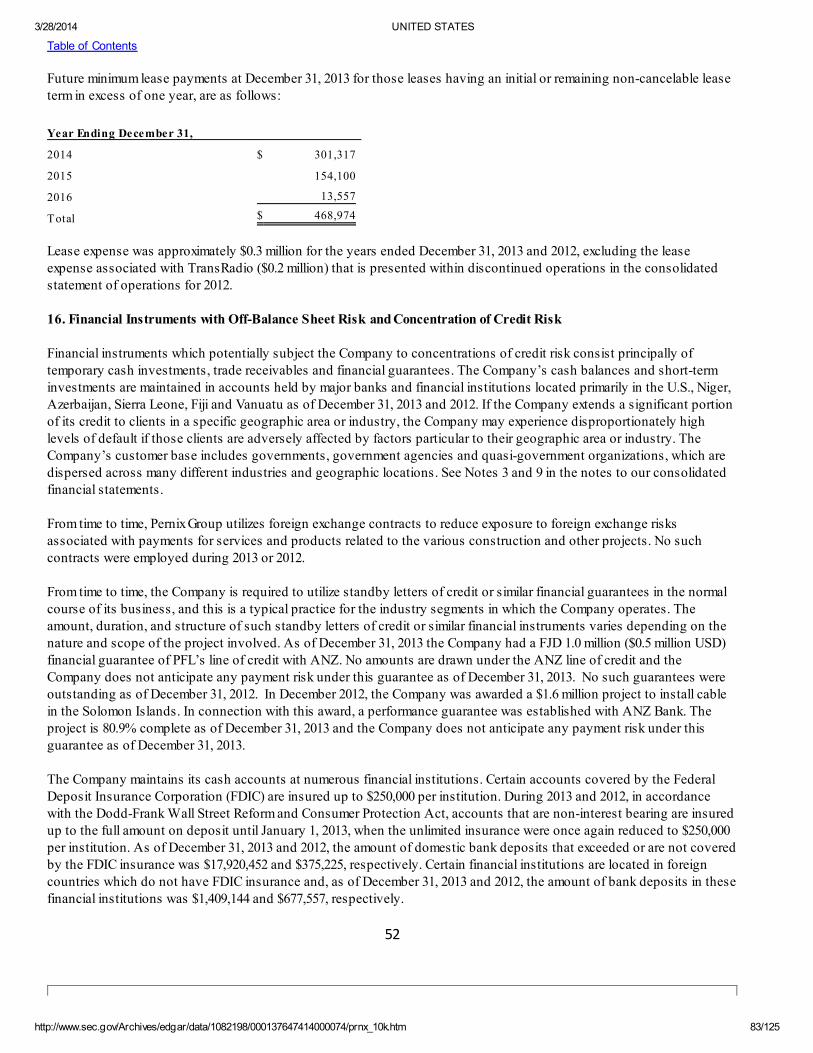
3/28/2014 UNITED STATES
http://www.sec.gov/Archives/edgar/data/1082198/000137647414000074/prnx_10k.htm 83/125
Table of Contents
Future minimum lease payments at December 31, 2013 for those leases having an initial or remaining non-cancelable leaseterm in excess of one year, are as follows:
Year Ending December 31,
2014 $ 301,317
2015 154,100
2016 13,557
Total $ 468,974
Lease expense was approximately $0.3 million for the years ended December 31, 2013 and 2012, excluding the leaseexpense associated with TransRadio ($0.2 million) that is presented within discontinued operations in the consolidatedstatement of operations for 2012.
16. Financial Instruments with Off-Balance Sheet Risk and Concentration of Credit Risk
Financial instruments which potentially subject the Company to concentrations of credit risk consist principally oftemporary cash investments, trade receivables and financial guarantees. The Company’s cash balances and short-terminvestments are maintained in accounts held by major banks and financial institutions located primarily in the U.S., Niger,Azerbaijan, Sierra Leone, Fiji and Vanuatu as of December 31, 2013 and 2012. If the Company extends a significant portionof its credit to clients in a specific geographic area or industry, the Company may experience disproportionately highlevels of default if those clients are adversely affected by factors particular to their geographic area or industry. TheCompany’s customer base includes governments, government agencies and quasi-government organizations, which aredispersed across many different industries and geographic locations. See Notes 3 and 9 in the notes to our consolidatedfinancial statements.
From time to time, Pernix Group utilizes foreign exchange contracts to reduce exposure to foreign exchange risksassociated with payments for services and products related to the various construction and other projects. No suchcontracts were employed during 2013 or 2012.
From time to time, the Company is required to utilize standby letters of credit or similar financial guarantees in the normalcourse of its business, and this is a typical practice for the industry segments in which the Company operates. Theamount, duration, and structure of such standby letters of credit or similar financial instruments varies depending on thenature and scope of the project involved. As of December 31, 2013 the Company had a FJD 1.0 million ($0.5 million USD)financial guarantee of PFL’s line of credit with ANZ. No amounts are drawn under the ANZ line of credit and theCompany does not anticipate any payment risk under this guarantee as of December 31, 2013. No such guarantees wereoutstanding as of December 31, 2012. In December 2012, the Company was awarded a $1.6 million project to install cablein the Solomon Islands. In connection with this award, a performance guarantee was established with ANZ Bank. Theproject is 80.9% complete as of December 31, 2013 and the Company does not anticipate any payment risk under thisguarantee as of December 31, 2013.
The Company maintains its cash accounts at numerous financial institutions. Certain accounts covered by the FederalDeposit Insurance Corporation (FDIC) are insured up to $250,000 per institution. During 2013 and 2012, in accordancewith the Dodd-Frank Wall Street Reform and Consumer Protection Act, accounts that are non-interest bearing are insuredup to the full amount on deposit until January 1, 2013, when the unlimited insurance were once again reduced to $250,000per institution. As of December 31, 2013 and 2012, the amount of domestic bank deposits that exceeded or are not coveredby the FDIC insurance was $17,920,452 and $375,225, respectively. Certain financial institutions are located in foreigncountries which do not have FDIC insurance and, as of December 31, 2013 and 2012, the amount of bank deposits in thesefinancial institutions was $1,409,144 and $677,557, respectively.
52

3/28/2014 UNITED STATES
http://www.sec.gov/Archives/edgar/data/1082198/000137647414000074/prnx_10k.htm 84/125
Table of Contents
17. Stockholders’ Equity
Certificate of Amendment of the Corporation’s Restated Certificate of Incorporation - In connection with the Series A
Preferred Stock sale that was effective on December 30, 2013, the Company amended its Restated Certificate ofIncorporation and its Certificate of Designation for Series A Preferred Stock to increase the total number of shares ofstock which the Company shall have authority to issue to twenty five million five hundred thousand (25,500,000),consisting of twenty million (20,000,000) shares of Common Stock, par value $.01 per share (“Common Stock”), and fivemillion five hundred thousand (5,500,000) shares of Preferred Stock, par value $.01 per share (“Preferred Stock”).
Preferred Stock—The Company has 5,500,000 shares of authorized Preferred Stock. 1,000,000 of these shares have been
designated as Series A Cumulative Convertible Preferred Stock (Series A Preferred Stock) and 400,000 shares weredesignated as Series B Cumulative Convertible Preferred Stock (Series B Preferred Stock).
On December 30, 2013 the Company sold 550,000 and 450,000 shares of Series A Preferred Stock to Ernil Continental, S.A.,BVI and Halbarad Group, Ltd., BVI, respectively for $5.00 per share, resulting in proceeds received by the Company of$5.0 million. The Company anticipates using the proceeds for potential acquisitions and operating activities as needed. Holders of Series A Preferred Stock are entitled to receive cumulative cash dividends at the annual rate of 8%, payablequarterly, have no voting rights and rank senior to common stock. As of December 31, 2013, 1,000,000 shares of theSeries A Preferred Stock were issued and outstanding. The Series A Preferred Stock is convertible into 1,428,572 shares ofPernix Group common stock computed by multiplying the number of shares to be converted by the purchase price of $5.00per share and dividing the result by the conversion price of $3.50. No dividends were accrued or paid on the Series APreferred Stock during 2013. As of December 31, 2012, no Series A Preferred Stock had been issued.
Holders of Series B Preferred Stock are entitled to receive cumulative dividends at an annual rate of $0.325 per share, haveno voting rights, and rank senior to common stock and are on parity with Series A Preferred Stock with respect todividends and upon liquidation. During 2013 and 2012, the Company issued no Series B Preferred Stock. Each share ofSeries B Preferred Stock is convertible into Pernix Group common stock using the conversion rate as defined in eachSeries B Preferred Stock Purchase Agreement. During 2011, in the Series B Preferred Stock conversion rate was amendedin connection with a reverse stock split to allow for conversion at a rate of 15:1 preferred into common shares on a postreverse stock split basis. On April 2, 2012, the Company repurchased 219,250 Series B Preferred Stock from its majorityshareholder, Ernil Continental, S.A. As of December 31, 2013 and 2012, 170,000 shares of the Series B Preferred Stock wereissued and outstanding and are convertible into 11,334 shares of common stock. As of December 31, 2013 and 2012,preferred stock dividends of $186,137 and $130,887, respectively, were accrued. The dividends for the years endedDecember 31, 2013 and 2012 were $55,250 and $73,361, respectively. Dividends of $0 and $107,295 were paid during 2013and 2012, respectively.
Common Stock —As of December 31, 2013 and 2012, 9,403,697 shares of the Company’s common stock were issued and
outstanding and over 96.0% of those shares were owned by Ernil Continental, S.A., BVI., Halbarad Group, Ltd., BVI andaffiliated companies.
53

3/28/2014 UNITED STATES
http://www.sec.gov/Archives/edgar/data/1082198/000137647414000074/prnx_10k.htm 85/125
Table of Contents
18. Earnings per share
A reconciliation of the numerator and denominator of basic and diluted earnings per share is provided as follows:
December 31,
2013 December 31,
2012
Numerator — Net income (loss) from continued operations $ (4,624,993) $ 4,158,904
Less: Preferred stock dividends 55,250 73,361
Basic net income/(loss) from continuing operations available to common
stockholders (4,680,243) 4,085,543
Denominator
Weighted average common shares outstanding:
Basic 9,403,697 9,403,697
Diluted 9,403,697 9,403,697
Basic (loss) earnings per share from continuing operations $ (0.50) $ 0.43
Diluted (loss) earnings per share from continuing operations $ (0.50) $ 0.43
Basic and diluted net (loss) earnings per common share have been computed using the weighted-average number ofshares of common stock outstanding during the periods. Diluted earnings per share is computed by dividing earnings bythe number of fully diluted shares, which includes the effect of dilutive potential issuances of common shares asdetermined using earnings from continuing operations. The impact of the potential issuances of common stock related tothe Company’s convertible preferred stock and outstanding stock options has been excluded from earnings per share forthe years ended December 31, 2013 and 2012, since inclusion would be anti-dilutive. See Note 19 in the notes to ourconsolidated financial statements for discussion of stock option plans.
19. Stock Compensation Plans
2014 Equity Incentive Plan- In late 2013, the Company’s shareholders and board of directors adopted the 2014 Equity
Incentive Plan (the “EIP”) that provides for the issuance of a variety of equity awards to employees, non-employeedirectors and consultants. Under the terms of this plan, 1.8 million shares, which were previously allocated for issuanceunder the LTIP and ISOP, are reserved for issuance under the EIP.
2013 Long Term Incentive Plan- During late 2012 the Company’s shareholders approved the Long-Term Incentive Plan
(the “LTIP”). The LTIP is a non-employee Director and Consultant compensation plan. Awards may
54

3/28/2014 UNITED STATES
http://www.sec.gov/Archives/edgar/data/1082198/000137647414000074/prnx_10k.htm 86/125
Table of Contents
include stock options, stock awards, restricted stock, restricted stock units, and other stock or cash awards. 785,000shares were allocated in total to cover any and all award types under the LTIP. On February 8, 2013, 78,500 options weregranted to six non-employee directors with a three year vesting schedule. As of December 31, 2013, the vesting of 13,500options was accelerated in connection with the retirement of a board member. No other options granted during 2013 underthis plan vest until the first anniversary of the grant date. The remaining 706,500 shares were transferred to the EIP asdescribed above during late 2013. No additional shares are anticipated to be awarded under the LTIP.
This plan will expire in December 2022. The Company incurred expense associated with the LTIP during 2013 in theamount of less than $0.1 million.
2012 Employee Incentive Stock Option Plan — In late 2011, the Company’s shareholders and board of directors
adopted the 2012 Incentive Stock Option Plan (the “ISOP”) that provides for the issuance of qualified stock options toemployees. Under the terms of this plan, 1.5 million shares were reserved for issuance. Options to purchase common stockare granted at not less than fair market value and vest ratably on the anniversary of each award grant date as defined bythe individual award agreement. The options expire 10 years from the grant date or upon plan expiration in late 2021,whichever is earlier. 175,000 options to buy shares of Pernix Group common stock were awarded on January 26, 2012 witha strike price equal to the fair market value of the Company’s common stock and a vesting schedule of 5 years.Additionally, as of February 8, 2013 a grant of 347,500 options (with a three year vesting schedule) to buy shares of PernixGroup common stock with a strike price equal to the fair market value of the Company’s common stock was made. Thisplan will expire in December 2021.
Option awards to employees and directors under the Company’s stock compensation plans are classified as equity andare valued at the grant date using the Black Scholes fair value model. The options vest ratably on the anniversary of thegrant date over a three to five year period. Pernix recognizes the cost over the period during which an employee isrequired to provide services in exchange for the award, known as the requisite service period (usually the vesting period).Cash flows resulting from the exercise of related options are included in financing cash flows. There were no optionsexercised during 2013 or 2012.
The Company will issue new shares of common stock upon exercise of the options.
The following summarizes stock option activity for the years ended December 31, 2013 and 2012:
2013 2012
Number of
O ptions
WeightedAverageExercise
Price Number of
O ptions
WeightedAverageExercise
Price
LTIP
Options outstanding, at beginning of year 0 $ 0 0 $ N/A
Granted 78,500 2.09 0 N/A
Exercised 0 N/A 0 N/A
Forfeited/expired 0 N/A 0 N/A
Options outstanding, at December 31 78,500 2.09 0 N/A
Options exercisable, at December 31 13,500 $ 2.09 0 $ N/A
55

3/28/2014 UNITED STATES
http://www.sec.gov/Archives/edgar/data/1082198/000137647414000074/prnx_10k.htm 87/125
Table of Contents
2013 2012
Number of
O ptions
WeightedAverageExercise
Price Number of
O ptions
WeightedAverageExercise
Price
ISO P
Options outstanding, at beginning of year 152,500 $ 2.09 0 $ 0
Granted 347,500 2.09 175,000 2.09
Exercised 0 N/A 0 N/A
Forfeited/expired 121,000 2.09 22,500 2.09
Options outstanding, at December 31 379,000 2.09 152,500 2.09
Options exercisable, at December 31 23,500 $ 2.09 0 $ 2.09
The following table summarizes information about stock options outstanding at December 31, 2013:
Plan Number
O utstanding
WeightedAverage
RemainingContractual
Life
WeightedAverageExercise
Price
AggregateGrant Date
IntrinsicValue
LTIP 78,500 9.1 $ 2.09 $ —
ISOP 379,000 8.8 $ 2.09 $ —
The weighted average grant date fair value of options outstanding during 2013 and 2012 was $1.01 and $1.04,respectively. The fair value of each option grant was estimated on the grant date using the Black-Scholes option-pricingmodel with the following weighted average assumptions:
Key assumptions:
2013 grant 2012 grant
Risk-free interest rate 1.1% 1.2%
Dividend yield 0.0% 0.0%
Expected volatility 50.0% 50.0%
Expected life in years 6.0 6.5
The use of the Black-Scholes option-pricing model requires us to make certain estimates and assumptions. The risk-freeinterest rate utilized is the implied yield on U.S. Treasury zero-coupon issues with a remaining term equal to the expectedterm assumption on the grant date, rounded to the nearest half year. A dividend yield assumption of 0% is used for allgrants based on the Company’s history of not paying a dividend to any common class of stock. Expected volatility isbased on volatilities of publicly traded competitors and companies from our peer group. The weighted average expectedlife in years for all grants as a group is then calculated for each year. During 2013 and 2012, the forfeiture rate utilized waszero as the plans were relatively new and no significant and reliable history regarding share option exercise and employeetermination patterns to estimate forfeiture rates existed until late 2013. Based on the data available late in 2013, theCompany estimated a forfeiture rate of 25% and will use this rate going forward subject to refinement as experiencechanges. See Note 24 in the notes to our consolidated financial statements.
56

3/28/2014 UNITED STATES
http://www.sec.gov/Archives/edgar/data/1082198/000137647414000074/prnx_10k.htm 88/125
Table of Contents
Total share-based compensation expense for the year ended December 31, 2013 and 2012 was $0.2 million and less than$0.1 million, respectively. As of December 31, 2013 and 2012, there was $0.3 million and $0.1 million, respectively of totalunrecognized compensation expense related to non-vested share-based awards. The compensation expense is expectedto be recognized over a remaining weighted average period of 3.5 years, which is equivalent to the average vesting period.
The Company received no cash during the year ended December 31, 2013 and 2012, respectively, related to stock awardsexercised as only 37,000 options were vested as of December 31, 2013 and no options were exercised during the periods.The options exercisable at December 31, 2013 have no intrinsic value. The Company did not realize any tax deductions forthis qualified ISOP plan options as the related expense is not tax deductible. 121,000 options and 22,500 options wereforfeited or cancelled during 2013 and 2012, respectively.
Other than the ISOP, LTIP and EIP, the Company did not have any equity related compensation plans as of December 31,2013. The Company has a 401K matching plan through which it contributes up to 8% of an employee’s salary at amatching rate of 50% of employee contributions, subject to an annual limitation of $4,000 per employee. The Companyincurred $91,567 and $67,174 of expense associated with the 401K match during 2013 and 2012, respectively.
20. Income Taxes
The components of income from continuing operations before income taxes for the period indicated are as follows:
2013 2012
Domestic $ (415,003) $ 2,691,650 Foreign $ 831,524 $ 694,718
Total $ 416,521 $ 3,386,368
57

3/28/2014 UNITED STATES
http://www.sec.gov/Archives/edgar/data/1082198/000137647414000074/prnx_10k.htm 89/125
Table of Contents
Income tax expense (benefit) consists of:
Year ended December 31, 2013 Current Deferred Total
Federal tax expense $ — $ 4,043,260 $ 4,043,260
State and local tax expense (benefit) (21,894) 840,675 818,781
Foreign tax expense 179,473 — 179,473
Total tax expense $ 157,579 $ 4,883,935 $ 5,041,514
Year ended December 31, 2012 Current Deferred Total
Federal tax (benefit) $ — $ (146,999) $ (146,999)
State and local tax (benefit) (152,041) (640,470) (792,511)
Foreign tax expense 166,974 — 166,974
Total tax expense (benefit), continuing operations 14,933 (787,469) (772,536)
Tax expense, discontinued operations — 1,395,808 1,395,808
Total tax expense $ 14,933 $ 608,339 $ 623,272
Current Tax Expense
The Company's major tax jurisdictions include Illinois, Virginia, the United States and Fiji. The related tax returns areexamined by the Illinois Department of Revenue, the Virginia Department of Revenue, the Internal Revenue Service andthe Fiji Islands Revenue and Customs Authority. Prior to the sale of TransRadio and TCNMI, the tax jurisdictions alsoincluded Germany and the Commonwealth of the Northern Mariana Islands, respectively with related tax returns examinedby the Federal Central Tax Office and the Division of Revenue and Taxation of the Commonwealth of the NorthernMariana Islands, respectively.
In 2013, the Company recorded consolidated pretax income for financial reporting purposes, however the Company had aU.S. taxable loss, primarily reflecting the fact that PFL income is not taxable in the United States coupled with the impactof various timing and permanent differences. Therefore, no U.S. federal, Illinois or Virginia current income tax expense hasbeen recorded in the accompanying consolidated statements of operations related to 2013, except for the $0.1 millioncurrent benefit related to a state income tax refund. A current foreign tax expense of $0.2 million was recorded inconnection with the Company’s PFL operations in Fiji and is based upon the taxable income within Fiji at a tax rate of 20%for 2013.
In 2012, the Company recorded consolidated pretax income for financial reporting purposes; however the Company didhave a sizable U.S. taxable loss, due to sale of its investments in TransRadio and TCNMI. Therefore, no U.S. federal,Illinois or Virginia current income tax expense was recorded in the accompanying consolidated statements of operationsrelated to 2012 operations except for the $0.2 million current benefit related to a state income tax refund. A current foreigntax expense of $0.2 million was recorded in connection with the Company’s operations in Fiji and is based upon thetaxable income within Fiji at a tax rate of 20% for 2012. Taxes related to TransRadio and TCNMI are presented within theloss from discontinued operations and amounted to no current benefit for TransRadio for 2012, and $1.4 million deferredtax expense for TCNMI in 2012.
Deferred Tax Expense or Benefit
The Company evaluated the need to maintain a valuation allowance for deferred tax assets based on our assessment ofwhether it is more likely than not that deferred tax benefits will be realized through the generation of future taxable income.Appropriate consideration is given to all available evidence, both positive and negative, in assessing the need for avaluation allowance. The evidence includes an estimate of future taxable income that is heavily reliant upon constructioncontract backlog and power facility operation and maintenance activities. Management also considers historical taxableincome and losses as well as other factors. Management believes that the valuation allowance reduces the recognition ofdeferred tax assets to a level that reflects the amount that is more likely than not to be realized in light of evidence.

3/28/2014 UNITED STATES
http://www.sec.gov/Archives/edgar/data/1082198/000137647414000074/prnx_10k.htm 90/125
The deferred income tax expense of $4.9 million for 2013 consists of $4.1 million of federal deferred tax expense and $0.8 ofdeferred state tax expense, reflecting management's decision to record an increase in the valuation allowance on deferredtax assets. This expense is a non-cash expense and has no impact on the Company's liquidity, cash flows, or its ability toexecute projects or conduct ongoing operations. As a result of the increase in the valuation allowance, the deferred taxassets are fully reserved as of December 31, 2013. U.S. net operating and capital loss carryforwards totaling approximately$71.9 million are available to Pernix Group, Inc. as of December 31, 2013.
58
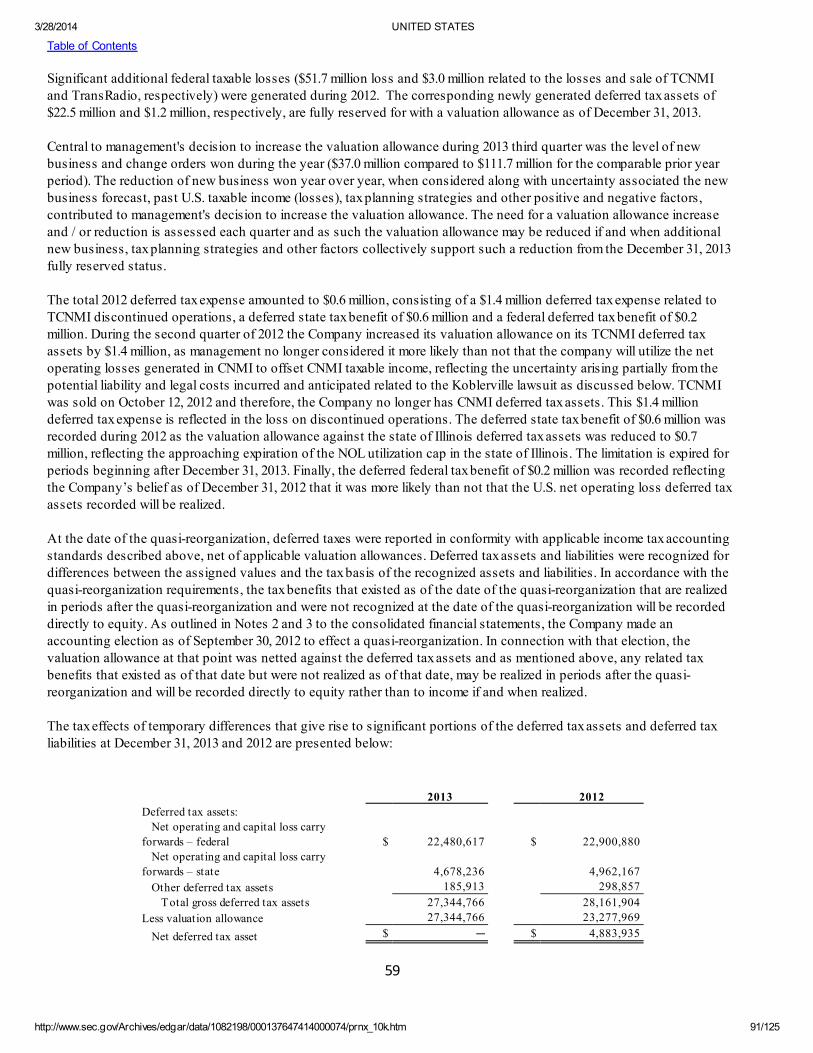
3/28/2014 UNITED STATES
http://www.sec.gov/Archives/edgar/data/1082198/000137647414000074/prnx_10k.htm 91/125
Table of Contents
Significant additional federal taxable losses ($51.7 million loss and $3.0 million related to the losses and sale of TCNMIand TransRadio, respectively) were generated during 2012. The corresponding newly generated deferred tax assets of$22.5 million and $1.2 million, respectively, are fully reserved for with a valuation allowance as of December 31, 2013.
Central to management's decision to increase the valuation allowance during 2013 third quarter was the level of newbusiness and change orders won during the year ($37.0 million compared to $111.7 million for the comparable prior yearperiod). The reduction of new business won year over year, when considered along with uncertainty associated the newbusiness forecast, past U.S. taxable income (losses), tax planning strategies and other positive and negative factors,contributed to management's decision to increase the valuation allowance. The need for a valuation allowance increaseand / or reduction is assessed each quarter and as such the valuation allowance may be reduced if and when additionalnew business, tax planning strategies and other factors collectively support such a reduction from the December 31, 2013fully reserved status.
The total 2012 deferred tax expense amounted to $0.6 million, consisting of a $1.4 million deferred tax expense related toTCNMI discontinued operations, a deferred state tax benefit of $0.6 million and a federal deferred tax benefit of $0.2million. During the second quarter of 2012 the Company increased its valuation allowance on its TCNMI deferred taxassets by $1.4 million, as management no longer considered it more likely than not that the company will utilize the netoperating losses generated in CNMI to offset CNMI taxable income, reflecting the uncertainty arising partially from thepotential liability and legal costs incurred and anticipated related to the Koblerville lawsuit as discussed below. TCNMIwas sold on October 12, 2012 and therefore, the Company no longer has CNMI deferred tax assets. This $1.4 milliondeferred tax expense is reflected in the loss on discontinued operations. The deferred state tax benefit of $0.6 million wasrecorded during 2012 as the valuation allowance against the state of Illinois deferred tax assets was reduced to $0.7million, reflecting the approaching expiration of the NOL utilization cap in the state of Illinois. The limitation is expired forperiods beginning after December 31, 2013. Finally, the deferred federal tax benefit of $0.2 million was recorded reflectingthe Company’s belief as of December 31, 2012 that it was more likely than not that the U.S. net operating loss deferred taxassets recorded will be realized.
At the date of the quasi-reorganization, deferred taxes were reported in conformity with applicable income tax accountingstandards described above, net of applicable valuation allowances. Deferred tax assets and liabilities were recognized fordifferences between the assigned values and the tax basis of the recognized assets and liabilities. In accordance with thequasi-reorganization requirements, the tax benefits that existed as of the date of the quasi-reorganization that are realizedin periods after the quasi-reorganization and were not recognized at the date of the quasi-reorganization will be recordeddirectly to equity. As outlined in Notes 2 and 3 to the consolidated financial statements, the Company made anaccounting election as of September 30, 2012 to effect a quasi-reorganization. In connection with that election, thevaluation allowance at that point was netted against the deferred tax assets and as mentioned above, any related taxbenefits that existed as of that date but were not realized as of that date, may be realized in periods after the quasi-reorganization and will be recorded directly to equity rather than to income if and when realized.
The tax effects of temporary differences that give rise to significant portions of the deferred tax assets and deferred taxliabilities at December 31, 2013 and 2012 are presented below:
2013 2012
Deferred tax assets:
Net operating and capital loss carry
forwards – federal $ 22,480,617 $ 22,900,880
Net operating and capital loss carry
forwards – state 4,678,236 4,962,167
Other deferred tax assets 185,913 298,857
Total gross deferred tax assets 27,344,766 28,161,904
Less valuation allowance 27,344,766 23,277,969
Net deferred tax asset $ — $ 4,883,935
59

3/28/2014 UNITED STATES
http://www.sec.gov/Archives/edgar/data/1082198/000137647414000074/prnx_10k.htm 92/125

3/28/2014 UNITED STATES
http://www.sec.gov/Archives/edgar/data/1082198/000137647414000074/prnx_10k.htm 93/125
Table of Contents
The $4.0 million increase in the valuation allowance during 2013 principally reflects the $4.9 million deferred tax expensecoupled with the impact of the expiration of the net operating loss utilization cap in the state of Illinois, the combination ofwhich more than offset a $1.2 million reclassification of a deferred tax asset and valuation allowance to pre quasi-reorganization from post quasi-reorganization status. The $8.2 million increase in the valuation allowance during 2012reflects the addition of fully reserved DTAs in connection with the sale of TCNMI and TransRadio and the relief of thevaluation allowance related to the TCNMI tax benefits that went away in connection with the sale of TCNMI as well asother activity.
At December 31, 2013 and 2012, the Company has total net operating and capital loss carry forwards from U.S. operationsof approximately $71.9 million and 70.7 million, respectively. The net operating loss carry forwards expire in the years 2016through 2033. The capital loss carryforwards expire in 2017. Certain of these net operating losses may be subject to alimitation on future utilization due to ownership changes, foreign and / or other tax laws.
A reconciliation of the differences between income taxes from continuing operations computed at the U.S. federalstatutory rate of 34%, the Fiji tax rate of 20% for 2013 and 2012, and the Company’s reported provision for income taxes isas follows:
Year Ended December 31,
2013 2012 Income tax benefit at statutory rate $ 141,617 $ 1,151,365
Increase of federal and state valuation allowance 5,047,933 (1,674,599) PFL tax expense (126,142) (97,261) Current State income tax benefit (21,894) (152,041) Income Tax Expense (Benefit) $ 5,041,514 $ (772,536)
There were no material interest expenses or penalties for the year to date. If there were material interest expenses orpenalties they would be reflected in the consolidated statement of operations as interest expense and general andadministrative expenses, respectively. The Company has analyzed filing positions in all of the federal, foreign and statejurisdictions where it is required to file income tax returns, as well as all open tax years in these jurisdictions. The onlyperiods subject to examination for the Company’s U.S. federal as well as Illinois and Virginia state tax returns are the 2010through 2013 tax years. The only periods subject to examination for the Company’s Fijian tax returns are the 2008 through2013 tax years. The Company believes that its income tax filing positions and deductions would be sustained on audit anddoes not anticipate any adjustments that would result in a material change to its financial position within the next twelvemonths.
No U.S. Federal or State deferred taxes have been provided on the undistributed earnings of non-U.S. operations ofapproximately $0.8 million and $0.7 million in 2013 and 2012, respectively, because we plan to permanently reinvest theseearnings in Fiji. If we were to repatriate these earnings, additional taxes would be due at that time. However, theseadditional U.S. taxes may be offset in part by the use of foreign tax credits. There is no intention to repatriate amountsearned by PFL; thus, no U.S. tax liability is recorded for historic PFL income and determination of a deferred tax liability isnot practicable related to these foreign earnings. Earnings from our Vanuatu operations are remitted regularly to the USand included in U.S. taxable income.
21. Commitments and Contingencies
In 1999, TCNMI was awarded a contract to build 45 housing units for the Northern Marianas Housing Agency, agovernment unit. The houses were built and subsequently occupied. The Northern Marianas Housing Corporation hasfiled a lawsuit against TCNMI and two other parties for $3.0 million in damages related to this project. These claimsinvolve allegations of various construction, design and other defects. Subsequently, homeowners in the project filed theirown and/or joined into this action. The consolidated matter is Case No. 06-0123, pending in the Superior Court for theCommonwealth of the Northern Mariana Islands. The Company and other defendants also have filed counter- and cross-claims. During 2012, the Company recorded an increase of $0.2 million of expense accruals for additional legal fees relatedto the Koblerville case bringing the total accrual to $1.1 million including $0.8 million offered to settle the litigation. Duringthe second quarter of 2012, the parties agreed to

3/28/2014 UNITED STATES
http://www.sec.gov/Archives/edgar/data/1082198/000137647414000074/prnx_10k.htm 94/125
60
3/28/2014 UNITED STATES
http://www.sec.gov/Archives/edgar/data/1082198/000137647414000074/prnx_10k.htm 95/125
Table of Contents
enter into “binding mediation” rather than go to trial. However, the mediation between the parties failed and the judgeoverseeing the mediation issued a binding, non-appealable decision on July 23, 2012 which resulted in a judgment of $4.45million against the three defendants. However, the judge failed to apportion the liability among the three defendants. Dueto the lack of an apportionment, the Company did not adjust the related $1.1 million accrual subsequent to receiving theJuly 23, 2012 ruling. On August 6, 2012, TCNMI filed a motion to request apportionment in order to obtain definition ofthe amount of liability that is attributable to TCNMI. The Company also requested in the motion the ruling pertaining tothe award of a portion of the liability as well as certain attorney costs awarded to NMHC be vacated. The judge indicatedin his July 23, 2012 decision that the plaintiffs were awarded reasonable attorney fees and requested the fees be submittedwithin ten days. On August 3, 2012, the plaintiffs filed a request for attorney fees for $2.0 million and asked the court tomultiply that award by 7 times to total $14.0 million.
As of October 12, 2012, no apportionment or other ruling requested in the motion filed by TCNMI had been issued. OnOctober 12, 2012, the Company sold its 100% equity interest in TCNMI for $1,000, consistent with its fair market value,coupled with buyer assumption of all liabilities, to Marianas Energy Technology, Inc., a local company owned andoperated from the CNMI, thereby curtailing the Company’s exposure to liability in connection with this matter.
Pernix Group’s power generation activities involve significant risks of environmental damage, equipment damage andfailures, personal injury and fines and costs imposed by regulatory agencies. Though management believes its safetyprograms and record is excellent and its insurance programs are adequate, if a liability claim is made against it, or if there isan extended outage or equipment failure or damage at one of the Company’s power plants for which it is inadequatelyinsured or subject to a coverage exclusion, and the Company is unable to defend against these claims successfully orobtain indemnification or warranty recoveries, the Company may be required to pay substantial amounts, which couldhave a materially adverse effect on its financial condition. In Fiji, the Company is liable for a deductible of FJD 1,250,000(or approx. $666,400 USD as of December 31, 2013) if found to be negligent or 750,000 FJD (or approx. $399,800 USD as ofDecember 31, 2013) if not found to be negligent in accordance with its agreement with the Fiji Electricity Authority. InVanuatu, during the MOU period, the insurance deductible is 10 million Vatu (or approx. $105,000 USD) as of December31, 2013.
On August 2, 2011, a diesel engine was damaged by a component failure resulting in an interruption of 10MW of powerproduction at a diesel power plant operated and maintained by PFL. PFL is insured for property damage and lost revenuedue to business interruption under a policy carried by Fiji Electricity Authority. PFL has not been found to be negligent inconnection with this incident. In May 2012, PFL paid a deductible of FJD 950,000 (or approx. $537,700 USD) related to theAugust 2011 engine failure and related business interruption in accordance with its agreement with the Fiji ElectricityAuthority. The deductible and ancillary costs including service engineer, overtime and other expenses totaling FJD300,237 ($168,463 USD) were accrued as of December 31, 2012. As of December 31, 2013 and 2012, this matter is closed andthere is no remaining related accrual or receivable.
The total business interruption claim was $0.6 million and the insurance proceeds were recorded as other income in the2012 consolidated statement of operations. The $0.2 million of proceeds that were receivable as of December 31, 2012 werereceived early in 2013. PFL performed certain restoration work in relation to the G8 engine that generated FJD 342,304(approximately $191,690 USD during 2012). The costs of the services PFL incurred in relation to the restoration work werenot significant. The G8 engine was re-commissioned on March 19, 2012 and is fully operational.
On June 1, 2012 an engine suffered a premature liner failure and fretting marks. The engine was repaired promptly and hadno significant impact on revenue during the period. The cost of the repairs was approximately $0.2 million and wasrecorded in cost of sales.
On August 5, 2013, PFL experienced a diesel engine incident. A 7.5 MW engine was damaged by what the Companybelieves to be a component failure. In November
61
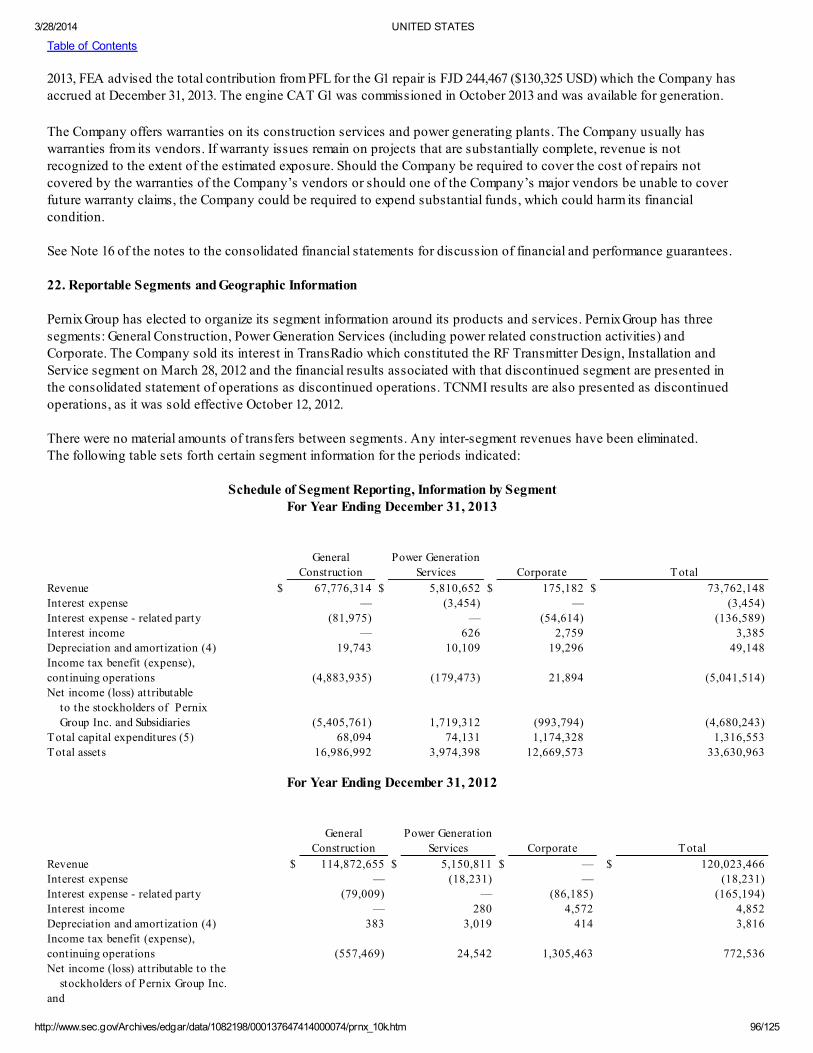
3/28/2014 UNITED STATES
http://www.sec.gov/Archives/edgar/data/1082198/000137647414000074/prnx_10k.htm 96/125
Table of Contents
2013, FEA advised the total contribution from PFL for the G1 repair is FJD 244,467 ($130,325 USD) which the Company hasaccrued at December 31, 2013. The engine CAT G1 was commissioned in October 2013 and was available for generation.
The Company offers warranties on its construction services and power generating plants. The Company usually haswarranties from its vendors. If warranty issues remain on projects that are substantially complete, revenue is notrecognized to the extent of the estimated exposure. Should the Company be required to cover the cost of repairs notcovered by the warranties of the Company’s vendors or should one of the Company’s major vendors be unable to coverfuture warranty claims, the Company could be required to expend substantial funds, which could harm its financialcondition.
See Note 16 of the notes to the consolidated financial statements for discussion of financial and performance guarantees.
22. Reportable Segments and Geographic Information
Pernix Group has elected to organize its segment information around its products and services. Pernix Group has threesegments: General Construction, Power Generation Services (including power related construction activities) andCorporate. The Company sold its interest in TransRadio which constituted the RF Transmitter Design, Installation andService segment on March 28, 2012 and the financial results associated with that discontinued segment are presented inthe consolidated statement of operations as discontinued operations. TCNMI results are also presented as discontinuedoperations, as it was sold effective October 12, 2012.
There were no material amounts of transfers between segments. Any inter-segment revenues have been eliminated.The following table sets forth certain segment information for the periods indicated:
Schedule of Segment Reporting, Information by SegmentFor Year Ending December 31, 2013
General
Construction
Power Generation
Services Corporate Total
Revenue $ 67,776,314 $ 5,810,652 $ 175,182 $ 73,762,148
Interest expense — (3,454) — (3,454)
Interest expense - related party (81,975) — (54,614) (136,589)
Interest income — 626 2,759 3,385
Depreciation and amortization (4) 19,743 10,109 19,296 49,148
Income tax benefit (expense),
continuing operations (4,883,935) (179,473) 21,894 (5,041,514)
Net income (loss) attributable
to the stockholders of Pernix
Group Inc. and Subsidiaries (5,405,761) 1,719,312 (993,794) (4,680,243)
Total capital expenditures (5) 68,094 74,131 1,174,328 1,316,553
Total assets 16,986,992 3,974,398 12,669,573 33,630,963
For Year Ending December 31, 2012
General
Construction
Power Generation
Services Corporate Total
Revenue $ 114,872,655 $ 5,150,811 $ — $ 120,023,466
Interest expense — (18,231) — (18,231)
Interest expense - related party (79,009) — (86,185) (165,194)
Interest income — 280 4,572 4,852
Depreciation and amortization (4) 383 3,019 414 3,816
Income tax benefit (expense),
continuing operations (557,469) 24,542 1,305,463 772,536
Net income (loss) attributable to the
stockholders of Pernix Group Inc.
and

3/28/2014 UNITED STATES
http://www.sec.gov/Archives/edgar/data/1082198/000137647414000074/prnx_10k.htm 97/125
Subsidiaries (1) 4,079,521 1,774,664 (1,768,641) 4,085,544
Total capital expenditures (3) 9,000 21,921 8,278 39,199
Total assets - continuing operations (2) 31,207,226 4,032,953 2,470,503 37,710,682
62

3/28/2014 UNITED STATES
http://www.sec.gov/Archives/edgar/data/1082198/000137647414000074/prnx_10k.htm 98/125
(1)
(2)
(3)(4)(5)
Table of Contents
Excluded from the table above is the loss from discontinued operations related to the sale of TransRadioTransmitter and TCNMI.Excluded from the table above is the total assets from discontinued operations related to the sale of TransRadioTransmitter and TCNMI.Total Capital Expenditures is shown net of Quasi-reorganization revaluation adjustment for 2012.Depreciation and amortization is shown net of Quasi-reorganization related adjustments for 2013 and 2012.Total Capital Expenditures for 2013 as presented in the segment table above includes the entire purchase price ofthe Corporate headquarters land and building, a portion of which is reflected as a financing activity on thestatement of cash flows due to repayment of the related loan more than 90 days after the building and landpurchase.
Geographical Information
The basis used to attribute revenues to individual countries is based upon the country associated with the contract (Ifthe contract is with a U.S. entity then the revenues are attributed to the U.S.).
Fixed assets located at PFL in Fiji were not material after the impact of the quasi-reorganization reflected in the December31, 2013 and 2012 fixed asset balances.
Total Revenue Fixed Assets - Net
Location – Revenue and net fixed assets
from continuing operations
Year ended
December 31,
2013
Year ended
December 31,
2012
December 31,
2013
December 31,
2012
United States $ 66,686,485 $ 114,899,270 $ 1,144,747 $ 5,436
Fiji 4,339,976 3,736,076 93,012 2,389
Vanuatu 1,470,676 1,388,120 6,966 16,514
Other 1,265,011 — 38,174 —
Total Revenue and net fixed assets
from continuing operations $ 73,762,148 $ 120,023,466 $ 1,282,899 $ 24,339
Major Customers
The OBO is a major customer primarily through the award of five projects since 2011 that generated revenue of $66.5million and $114.4 million for the years ended December 31, 2013 and 2012, respectively, accounting for 90% and 95% oftotal revenue from continuing operations for the periods. In January 2014, the OBO exercised Option Year 3 under ourbase CHU IDIQ contract, extending the period within which additional Task Orders can be awarded to PS JV to January 6,2015.
23. Related Party Transactions — Not Described Elsewhere
The Company’s shareholders include SHBC, which holds less than 6% of Pernix Group’s stock at December 31, 2013.SHBC is a civil, electrical and mechanical engineering firm and construction contractor with over 4,000 employees andover fifty (50) years’ experience.
As noted earlier, SHBC and Pernix Group have formed a joint venture (Pernix/SHBC JV). This joint venture wasestablished in part to construct the new U.S. Embassy in Fiji which is now complete. The joint venture limited partnershipagreement between SHBC and Pernix Group also provides for Pernix to make a payment to SHBC of 6.5% per annum of theunreturned capital. No such payments have been made to date though the Company has accrued interest expense of $0.1million during the twelve month periods ending December 31, 2013 and 2012 for this discretionary item.
Computhink is a related party as it is owned by a company related to SHBC. Computhink provided various facilitymanagement, computer software and other outside services related to the Corporate headquarters prior to the Company’spurchase of the land and building in March 2013. Charges from Computhink were less than $0.1 million for the yearsended December 31, 2013 and 2012. Subsequent to the Company’s purchase of the Corporate headquarter facilities, PernixGroup assumed as lessor the lease to Computhink. The lease term ends April 30, 2016 and Computhink rent amounts to

3/28/2014 UNITED STATES
http://www.sec.gov/Archives/edgar/data/1082198/000137647414000074/prnx_10k.htm 99/125
$5,054 per month, with a 3% rent escalation clause. Charges from Computhink were offset by the rent, buildingmanagement, utilities, personnel services, office supplies, photocopying and printing service charges from the Companyto Computhink. The Company’s charges to Computhink were less than $0.1 million for the twelve months endedDecember 31, 2013 and 2012.
63

3/28/2014 UNITED STATES
http://www.sec.gov/Archives/edgar/data/1082198/000137647414000074/prnx_10k.htm 100/125
Table of Contents
Future minimum lease payments at December 31, 2013, from Computhink under the non-cancelable lease, are as follows:
Year Ending December 31,
2014 $ 63,711 2015 65,622 2016 22,089 Total $ 151,422
Total related party accounts receivable and payables, net are summarized as follows:
December 31,
2013
December 31,
2012
Accounts receivable from Computhink $ 39,447 $ 12,218
Accounts receivable from Baron R.E. — 10,823
Accounts payable to SHBC (4,860) —
Accounts payable to Baron R.E. — (11,667)
Total $ 34,587 $ 11,374
24. Subsequent Events
Management has evaluated all material events occurring subsequent to the date of the financial statements up to the datethis annual report is filed on Form 10-K.
During early 2014, the Company received $45.5 million of new awards and modifications. The new awards include a $29.1million contract for PFL to design, supply, install and commission 36 MW of auxiliary power equipment at the KinoyaPower Station and a $17 million contract awarded in February 2014 to Pernix / LTC JV to construct a two-story laboratoryon the campus of Texas A&M University. Work on these projects has commenced during the first quarter of 2014.
The PFL $29.1 million project contract price is denominated in FJD 11.9 million for the onshore work and 16.1 million EUROfor offshore work. On March 14, 2014, PFL entered into a 15.8 million EURO supply contract with Wartsilla Finland Oy,and Wartsila Australia Pty Ltd, collectively referred to as the supplier, to supply and deliver 4 engines and relatedequipment (the offshore work) and to provide technical assistance during installation and commissioning of the enginesat the Kinoya power station.
On January 14, 2014, PFL modified its line of credit agreement with Australia and New Zealand Banking Group Limited(ANZ) to increase the available line from FJD 2 million ($1.1 million USD as of December 31, 2013) to FJD 6 million ($3.3million USD as of December 31, 2013) and an additional EURO 17.5 million ($24.2 million USD as of December 31, 2013). The remaining terms and conditions of the line of credit agreement remain substantially the same after the amendment. See Note 13 to the consolidated financial statements.
On February 8, 2014, the Company granted 375,000 stock options to employees, non-employee directors and one otherperson in the form of a special award under the EIP. The awards will vest ratably on the anniversary dates of the awardover a period of three years.
In February 2014, during hearings in the Supreme Court of the Republic of Vanuatu (the Court), the Government ofVanuatu proposed a settlement with Unelco that would leave VUI without a claim to defend pertaining to the concessionand would effectively end the litigation in UNELCO’s favor. The proposed settlement called for a re-tender of theconcession and required that any company who participates in the re-tender must waive any outstanding claims againstthe Government of Vanuatu. VUI in response presented its position to the court arguing that VUI should have anopportunity to be heard and that the Court should not accept the proposed settlement. The Justice is considering VUI’sposition and as of the date of this report has not yet rendered a decision. The Company anticipates that VUI will appealany decision and stay the re-tender until appeals are complete which VUI’s counsel anticipates would not occur prior toJuly 2014. If the re-tender process would begin around July 2014, it would likely not be completed until at least December2014. The Company believes VUI will continue to provide O&M services until the retender is complete and a long term

3/28/2014 UNITED STATES
http://www.sec.gov/Archives/edgar/data/1082198/000137647414000074/prnx_10k.htm 101/125
concession deed is awarded. As of the date of this report, VUI continues to operate and maintain the system and awaits adecision regarding the longer term concession deed.
In March 2014, the Utilities Regulatory Authority (URA or Commission) in Vanuatu has issued a decision on theelectricity tariff as it pertains to VUI operations. The terms of the ruling may result in lower revenue to VUI coupled withincreased responsibilities for street lighting maintenance and an opportunity to share in efficiency savings related to thehydro operations in Vanuatu, along with other measures. VUI has the opportunity to file a notice of
64
3/28/2014 UNITED STATES
http://www.sec.gov/Archives/edgar/data/1082198/000137647414000074/prnx_10k.htm 102/125
Table of Contents
grievance to the Commission on or before April 12, 2014; however, it is VUI’s intention to operate under the decision andreduce costs to maximize the man-month fee to the extent allowed by the Court under the terms of any settlement acceptedby the Court.
ITEM 9. CHANGES IN AND DISAGREEMENTS WITH ACCOUNTANTS ON ACCOUNTING AND FINANCIALDISCLOSURE
Not applicable.
ITEM 9A. CONTROLS AND PROCEDURES
Evaluation of Disclosure Controls and Procedures
The Company maintains disclosure controls and procedures that are designed to ensure that information required to bedisclosed in the reports that the Company files or submits under the Exchange Act is recorded, processed, summarized,and reported within the time periods specified in the SEC’s rules and forms, and that such information is accumulated andcommunicated to our management, including our Chief Executive Officer and Chief Financial Officer, as appropriate, toallow timely decisions regarding required disclosure.
The Company carried out an evaluation, under the supervision and with the participation of our management, includingour Chief Executive Officer and Chief Financial Officer, of the effectiveness of the design and operation of our disclosurecontrols and procedures (as defined in Rules 13a-15(e) and 15d-15(e) under the Exchange Act) as of the end of theCompany’s most recent fiscal year. Based upon this evaluation, the Company’s Chief Executive Officer and ChiefFinancial Officer concluded that the Company’s disclosure controls and procedures were effective as of December 31,2013.
Management’s Annual Report on Internal Control over Financial Reporting
The Company’s management is responsible for establishing and maintaining adequate internal control over financialreporting, as defined in Exchange Act Rule 13a-15(f). Under the direction of the Company’s Chief Executive Officer andChief Financial Officer, management has assessed the effectiveness of the Company’s internal control over financialreporting as of December 31, 2013. The Company’s management conducted an evaluation of the effectiveness of theCompany’s internal control over financial reporting based on the framework in Internal Control — Integrated Framework(1992) issued by the Committee of Sponsoring Organizations of the Treadway Commission. Based on this evaluation, theCompany’s management concluded that the Company’s internal control over financial reporting was effective as ofDecember 31, 2013.
This annual report does not include an attestation report of the Company’s registered public accounting firm regardinginternal control over financial reporting. As a smaller reporting company, management’s report was not subject toattestation by our independent registered public accounting firm pursuant to rules of the Securities and ExchangeCommission that permit us to provide only management’s report in this annual report on Form 10-K.
Changes in Internal Control over Financial Reporting
There were no changes in our internal control over financial reporting that occurred during our quarter ended December31, 2013 that has materially affected, or is reasonably likely to materially affect, our internal control over financialreporting.
ITEM 9B. OTHER INFORMATIONNone.
65
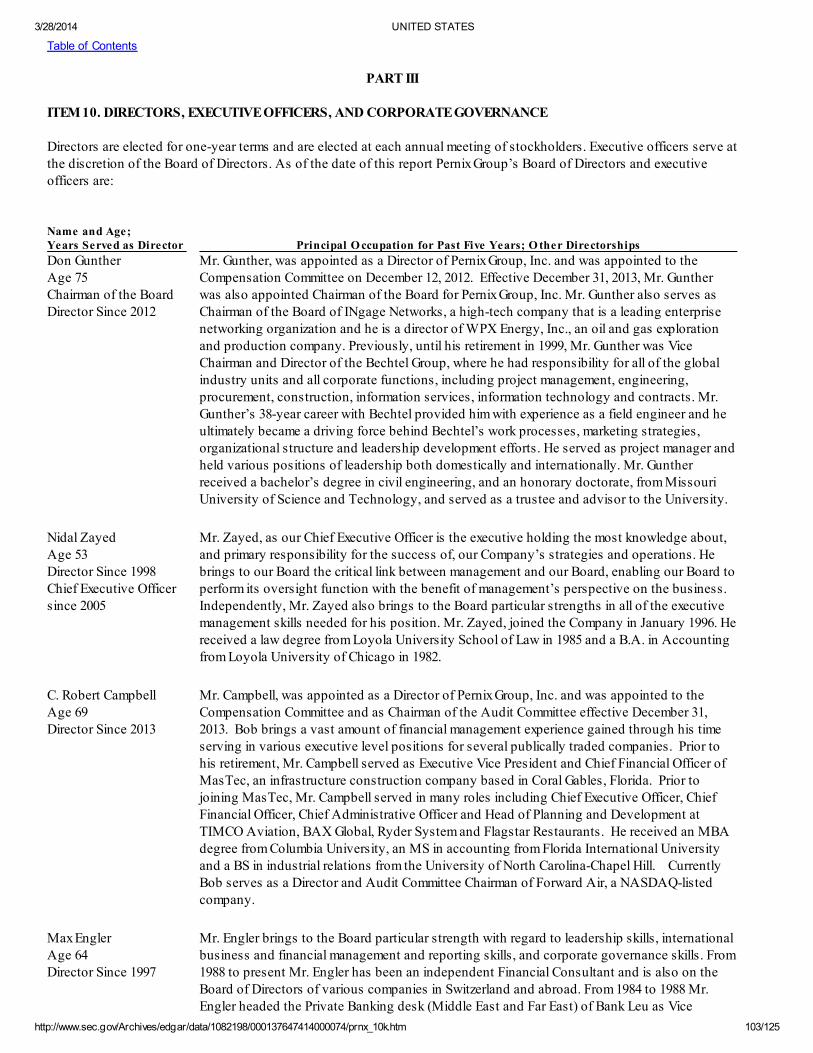
3/28/2014 UNITED STATES
http://www.sec.gov/Archives/edgar/data/1082198/000137647414000074/prnx_10k.htm 103/125
Table of Contents
PART III
ITEM 10. DIRECTORS, EXECUTIVE OFFICERS, AND CORPORATE GOVERNANCE
Directors are elected for one-year terms and are elected at each annual meeting of stockholders. Executive officers serve atthe discretion of the Board of Directors. As of the date of this report Pernix Group’s Board of Directors and executiveofficers are:
Name and Age;Years Served as Director Principal O ccupation for Past Five Years; O ther Directorships
Don Gunther Age 75Chairman of the BoardDirector Since 2012
Mr. Gunther, was appointed as a Director of Pernix Group, Inc. and was appointed to theCompensation Committee on December 12, 2012. Effective December 31, 2013, Mr. Guntherwas also appointed Chairman of the Board for Pernix Group, Inc. Mr. Gunther also serves asChairman of the Board of INgage Networks, a high-tech company that is a leading enterprisenetworking organization and he is a director of WPX Energy, Inc., an oil and gas explorationand production company. Previously, until his retirement in 1999, Mr. Gunther was ViceChairman and Director of the Bechtel Group, where he had responsibility for all of the globalindustry units and all corporate functions, including project management, engineering,procurement, construction, information services, information technology and contracts. Mr.Gunther’s 38-year career with Bechtel provided him with experience as a field engineer and heultimately became a driving force behind Bechtel’s work processes, marketing strategies,organizational structure and leadership development efforts. He served as project manager andheld various positions of leadership both domestically and internationally. Mr. Guntherreceived a bachelor’s degree in civil engineering, and an honorary doctorate, from MissouriUniversity of Science and Technology, and served as a trustee and advisor to the University.
Nidal Zayed Age 53 Director Since 1998 Chief Executive Officer since 2005
Mr. Zayed, as our Chief Executive Officer is the executive holding the most knowledge about,and primary responsibility for the success of, our Company’s strategies and operations. Hebrings to our Board the critical link between management and our Board, enabling our Board toperform its oversight function with the benefit of management’s perspective on the business.Independently, Mr. Zayed also brings to the Board particular strengths in all of the executivemanagement skills needed for his position. Mr. Zayed, joined the Company in January 1996. Hereceived a law degree from Loyola University School of Law in 1985 and a B.A. in Accountingfrom Loyola University of Chicago in 1982.
C. Robert Campbell Age 69 Director Since 2013
Mr. Campbell, was appointed as a Director of Pernix Group, Inc. and was appointed to theCompensation Committee and as Chairman of the Audit Committee effective December 31,2013. Bob brings a vast amount of financial management experience gained through his timeserving in various executive level positions for several publically traded companies. Prior tohis retirement, Mr. Campbell served as Executive Vice President and Chief Financial Officer ofMasTec, an infrastructure construction company based in Coral Gables, Florida. Prior tojoining MasTec, Mr. Campbell served in many roles including Chief Executive Officer, ChiefFinancial Officer, Chief Administrative Officer and Head of Planning and Development atTIMCO Aviation, BAX Global, Ryder System and Flagstar Restaurants. He received an MBAdegree from Columbia University, an MS in accounting from Florida International Universityand a BS in industrial relations from the University of North Carolina-Chapel Hill. CurrentlyBob serves as a Director and Audit Committee Chairman of Forward Air, a NASDAQ-listedcompany.
Max Engler Age 64 Director Since 1997
Mr. Engler brings to the Board particular strength with regard to leadership skills, internationalbusiness and financial management and reporting skills, and corporate governance skills. From1988 to present Mr. Engler has been an independent Financial Consultant and is also on theBoard of Directors of various companies in Switzerland and abroad. From 1984 to 1988 Mr.Engler headed the Private Banking desk (Middle East and Far East) of Bank Leu as Vice

3/28/2014 UNITED STATES
http://www.sec.gov/Archives/edgar/data/1082198/000137647414000074/prnx_10k.htm 104/125
President. He is a director of Computhink Incorporated, Belmoral S.A., Computhink Ltd., RetsaDevelopment Inc., FSD Holdings PLC, Litra Holdings AG, Linos Consulting AG, Trafex Ltd.,R.C.W. Enterprises S.A., and TransRadio SenderSysteme Berlin AG.

3/28/2014 UNITED STATES
http://www.sec.gov/Archives/edgar/data/1082198/000137647414000074/prnx_10k.htm 105/125
Ibrahim M. Ibrahim Age 66 Director Since 1999
Mr. Ibrahim brings to the Board particular strength with regard to financial skills, internationalbusiness skills and corporate governance skills. Mr. Ibrahim has recently retired after workingfor more than 40 years in leading positions for major banks in the United States and abroad. Hewas a Vice President and General Manger of Continental Bank in Chicago, Lebanon andBahrain (1969 — 1984). He also worked for First National Bank Chicago as Vice President andHead of Credit and Marketing for their Middle East head-quarter in Dubai (1984-1986). Then hemoved to Kuwait in 1986 and had been there for more than 23 years. He was the GeneralManager & Head of International Business at The Gulf Bank (1986 — 2001), and GeneralManger, Head of International Group at Commercial Bank of Kuwait (2001 — 2004). His lastposition before retirement was General Manager of Al Ahli Bank of Kuwait (2004 — 2009). Mr.Ibrahim received his M.B.A. in International Business from De Paul University in Chicago; hisM.S. in Taxation from University of Alexandria and his B.A. in Accounting from the Universityof Alexandria.
Trudy Clark Age 65 Director Since 2007
Major General (Ret.) Clark brings to the Board particular strength with respect to leadershipskills, crisis management skills, and strategic planning skills, as well as significant insight intoprocurement activities with the U.S. government and management and oversight of classifiedprojects. General Clark has over twenty years of experience in innovative delivery of supportservices at worldwide locations in units of 60-2000 members and budgets from $1 million - $2.9billion. General Clark is an experienced leader with exceptional organizational and facilitiesmanagement skills. She served as the Deputy Director of the Defense Threat ReductionAgency, directing approximately 4,000 government and contractor personnel at 30 locationsworldwide dealing with threats of weapons of mass destruction (WMD), and conductinginternational and homeland security exercises for the Department of Defense. Additionally,while serving as the Chief Information Officer and Director for Command, Control,Communications and Computers, US Strategic Command, General Clark supported thegovernment and contractors to develop software, lifecycle management and strategic planningfor modernization of over $5 billion of nuclear decision support systems. General Clark has aMasters in Guidance and Counseling from Troy State University in Alabama and hascompleted executive seminars at Syracuse, John Hopkins and Harvard Universities.
Carl Smith Age 65 Director Since 2007
Mr. Smith brings to the Board particular strength with regard to leadership skills, crisismanagement skills, and strategic planning skills, as well as significant insight into theCompany’s obligations with the U.S. government and for the management and oversight ofclassified projects. Mr. Smith, a graduate of the University of Hawaii, obtained his JurisDoctorate at University of California Law School and has over thirty years of experience ingovernment contracting, defense acquisition, international agreements, telecommunicationregulations, information security and is an expert in Cyber Law/Information Assurance, FiscalLaw, FOIA, Privacy Act and the Ethics in Government Act. Mr. Smith served as the GeneralCounsel for the Defense Information Systems Agency, offering advice and guidance to theAgency Director and the Senior Executive Team on a full spectrum of legal issues, includinggovernment contracting. While serving as the Chief Regulatory Counsel-Telecommunicationsfor the Department of Defense, Mr. Smith was responsible for advising the Office of Scienceand Technology Policy and the Assistant Secretary of Defense in TelecommunicationRegulatory matters that affected national security, emergency preparedness as well as theDepartment of Defense’s commercial interests. He is a member of the Hawaiian and D.C. BarAssociations.
Gregg PollackAge 52Chief Financial Officer Since January, 2012
Mr. Pollack joined the Company in late 2011 to manage financial and administrative functionsat the corporate level, bringing to Pernix over 25 years of experience in corporate finance,mergers & acquisitions, strategic planning, project finance and financial management. Mr.Pollack was most recently CEO of Tasmanian Dairy Products Co. Ltd., (TDP), an Australiandairy company formed to build and operate a $70 million milk processing plant, and he iscurrently a director of TDP. Prior to his work overseas, he was a Managing Director withChicago-based investment bank Dresner Partners, where he was employed for over 12 years,

3/28/2014 UNITED STATES
http://www.sec.gov/Archives/edgar/data/1082198/000137647414000074/prnx_10k.htm 106/125
advising middle market business owners and corporate boards with respect to capitalformation, mergers & acquisitions, business valuation and long-term strategy. He received aBS in Economics (concentration in Accounting) and an MBA in Finance from the WhartonSchool of the University of Pennsylvania, and he is a member of the AICPA and the IllinoisCPA Society.

3/28/2014 UNITED STATES
http://www.sec.gov/Archives/edgar/data/1082198/000137647414000074/prnx_10k.htm 107/125
Carol GroeberAge 49Controller and PrincipalAccounting Officer Since June, 2011
Ms. Groeber joined the Company in 2011 bringing 25 years of accounting and reportingexpertise to Pernix. Ms. Groeber is a seasoned accounting and reporting professional with 15years of management consulting experience with several fortune 500 companies includingWells Fargo, Allstate Insurance and various other firms. She practiced in various managementcapacities as the Director of Accounting Policy of Navistar, the Financial Reporting Managerof Nicor and a V.P. Group Finance Officer for Heller Financial, Inc. Ms. Groeber began hercareer in 1987 with Deloitte and Touche LLP in the audit practice for five years. Ms. Groebergraduated from the University of Northern Iowa (B.A. in Accounting) where she passed theCPA exam in 1987.
Code of Ethics
Our Code of Ethics sets a high standard for honesty and ethical behavior by every employee, including our principalexecutive officer, principal financial officer, controller and principal accounting officer. The Code is posted on our websiteat http://www.pernixgroup.com/ethics-compliance.asp and is incorporated by reference as Exhibit 14 to this Form 10-K. Toobtain a copy of the Code at no charge, submit a written request to the Corporate Secretary at 151 E. 22nd Street, Lombard,Illinois 60148. We will post on our website any required amendments to or waivers granted under our Code pursuant toSEC rules.
ITEM 11. EXECUTIVE COMPENSATION
The table below summarizes the total compensation earned by each of our Officers for the calendar years ended December31, 2013 and 2012:
SUMMARY COMPENSATION TABLE
Year Salary Bonus
Options
Awards
All other
Compensation Total
Name and Principal Position ($) (1) ($)(1) ($)(1) ($)(3) ($) (2) ($)
Nidal Zayed 2013 330,009 75,000 120,000 32,495 557,504
Chief Executive Officer 2012 314,442 100,000 62,400 22,926 499,768
Gregg Pollack 2013 207,020 25,000 50,000 19,883 301,903
Chief Financial Officer and VP
Administration
2012 206,769 31,500 36,400 16,454 291,123
Carol Groeber 2013 165,090 35,000 35,000 4,944 240,034
Controller &Principal Accounting
Officer
2012 154,615 30,000 23,400 4,903 212,918
(1) Includes salary paid by Pernix Group during 2013 and 2012, before any deductions for contributions to Pernix Group’s401(k) Savings Plan. Bonuses included are presented in the year for which they were earned and were paid during the firstquarter of the subsequent year.
(2) Pernix Group provided a vehicle to Mr. Zayed at a cost of $11,304 in 2013 and $2,925 in 2012. Pernix Group providedMr. Zayed with health insurance for him and his family at a cost of $17,191 in 2013 and $16,001 in 2012. The Companycontributed as part of its 401K match plan $4,000 during 2013 and 2012, to Mr. Zayed’s, Mr.
68

3/28/2014 UNITED STATES
http://www.sec.gov/Archives/edgar/data/1082198/000137647414000074/prnx_10k.htm 108/125
Table of Contents
Pollack’s and Ms. Groeber’s 401K account. In addition, the Company paid insurance premiums totaling $15,883 and$12,454 for Mr. Pollack and $944 and 903 for Ms. Groeber, respectively during 2013 and 2012.
(3) The amounts reported in this column reflect the aggregate fair value of stock options granted in the year computed inaccordance with FASB ASC Topic 718. These amounts are not paid to or realized by the Officers. Assumptions used inthe calculation of these values are included in Note 19 along with a description of equity compensation plans. Additionaloptions awarded in early 2014 are excluded from this table and valuation of the 2014 option awards is in process and willbe computed in accordance with ASC 718.
Stock Options
2012 Incentive Stock Option Plan- In December 2011, the Company’s board of directors adopted and shareholders
approved the 2012 Incentive Stock Option Plan (ISOP) that provides for the issuance of qualified stock options toemployees. Under the terms of the ISOP, 1.5 million shares were originally reserved for issuance, however with theapproval of the 2013 Equity Incentive Plan (the “EIP”) the remaining 977,500 unawarded shares were transferred to theEIP. Options to purchase common stock are granted at not less than fair market value and vest ratably on the anniversaryof each award grant date as defined by the individual award agreements. The options expire 10 years from the grant dateor upon expiration of the plan under which they were granted, whichever is earlier. 175,000 and 347,500 options to buyshares yet to be registered were granted on January 26, 2012 and February 8, 2013, respectively and 379,000 of theseoptions remain outstanding as of December 31, 2013, with a strike price equal to the fair market value of the Company’scommon stock as of the grant date ($2.09 per share) and a vesting schedule of five years.
The following summarizes stock option activity for the years ended December 31, 2013 and 2012:
2013 2012
Shares
WeightedAverageExercise
Price Shares
WeightedAverageExercise
Price Options outstanding, at beginning ofyear 152,500 $ 2.09 — $ — Granted 347,500 2.09 175,000 2.09 Exercised 0 N/A — N/A Forfeited/expired 121,000 2.09 22,500 2.09 Options outstanding, at December 31 379,000 2.09 152,500 2.09 Options exercisable, at December 31 23,500 $ 2.09 — $ 2.09
The following table summarizes information about stock options outstanding at December 31, 2013:
Number of sharestobe
issued uponexercise
of outstandingoptions
Weightedaverageexerciseprice of
outstandingoptions
Number of sharesremainingavailablefor futureissuance
under equitycompensation
plans
Equity compensation plans approved by shareholders 379,000 (1) 2.09 1,121,000 (2)
(1) Includes the number of shares that may be issued upon the exercise of outstanding options to purchase shares ofCommon Stock under the Company’s stock option plan. The Officer awardees were Mr. Nidal Zayed (180,000 options),Mr. Gregg Pollack (85,000 options) and Ms. Carol Groeber (57,500 options). This plan will expire in December 2021. The

3/28/2014 UNITED STATES
http://www.sec.gov/Archives/edgar/data/1082198/000137647414000074/prnx_10k.htm 109/125
options were valued at $1.00 per option at the date of grant.
69

3/28/2014 UNITED STATES
http://www.sec.gov/Archives/edgar/data/1082198/000137647414000074/prnx_10k.htm 110/125
(1)
Table of Contents
(2) Includes shares available for future issuance under the Company’s EIP, excluding shares quantified under Column 1. As noted above remaining unawarded and forfeited shares were transferred from the ISOP to the EIP for future issuances.
Outstanding Equity Awards as of December 31, 2013
The following table provides information on the holdings of stock options by our Officers as of December 31, 2013. Theoption awards granted in 2012 vest one-fifth per year beginning on the first anniversary of the grant date or on January26, 2013. The option awards granted in 2013 vest one-third per year beginning on the first anniversary of the grant date or February 8, 2014. The market value of the stock awards is based on the valuation of the stock as of the grant date as theshares are not actively traded on an exchange at this time. For additional information about the stock option awards seeNote 19 in the notes to our consolidated financial statements.
Number of
Securities
Number of
Securities
Underlying
Unexcercised
Underlying
Unexcercised
Option
Exercise
Option
Expiration
Name Options –
Exercisable
Options – Not
Exercisable
Price Dates
Nidal Z. Zayed 12,000 168,000 2.09 (1)
Gregg D. Pollack 7,000 78,000 2.09 (1)
Carol J. Groeber 4,500 53,000 2.09 (1)
180,000, 85,000 and 57,500 options expire for Mr. Zayed, Mr. Pollack and Ms. Groeber, respectively, uponexpiration of the ISOP in December 2021.
Directors Compensation
During mid-2012, during our review of director compensation, our analysis of competitive survey data and peer groupproxy information, confirmed that our non-employee director pay was below median in total compensation, including cashand equity compensation in comparison to our peer group of companies. Based upon these findings, managementpresented to the Board and the Board approved that this Proxy filing should include a Board recommendation that theStockholders approve the Proposed Long-Term Incentive Plan (the “LTIP”). 706,500 unused shares allocated to the LTIPwere transferred to the EIP as authorized by the Board of Directors in late 2013, for future grants to directors under theEIP.
Each non-employee director earned an average annual director fee of $29,000 in 2013 and $24,500 in 2012. For directorsthat served for only a portion of the years, the fee was prorated. Additionally, Mr. Beck received for his role as Chairmanof the Board $7,500 and $3,750 as director fees and Mr. Smith received $5,500 and $2,750 for his role as Chairman of theGovernment Security Committee during 2013 and 2012, respectively. During 2013 and 2012, each participating Directorreceived an additional $1,500 for their participation on the Government Security Committee or the CompensationCommittee. No director fees were paid to Mr. Gunther in 2012, as his services did not commence until very late in 2012;however, consulting fees were paid on Mr. Gunther’s behalf in the amount of $8,350 during 2012. Director fees are paid incash.
Directors
2013
Director’s
Fees 2013 Other
Compensation
2012
Director’s
Fees 2012 Other
Compensation
Max Engler $ 29,000 $ — $ 24,500 $ —
Ibrahim Ibrahim 29,000 750 24,500 —
Jeff Adams — — 20,875 563
Ralph Beck(1) 36,500 53,000 28,250 2,250
Trudy Clark 29,000 1,500 24,500 1,500
Carl Smith 34,500 3,750 27,250 2,250
Don J. Gunther 29,000 2,375 — 8,350
$ 187,000 $ 61,375 $ 149,875 $ 14,913

3/28/2014 UNITED STATES
http://www.sec.gov/Archives/edgar/data/1082198/000137647414000074/prnx_10k.htm 111/125
(1)
TOTAL
Mr. Beck retired from the Board effective December 31, 2013. Mr. C. Robert Campbell joined the board to fill thevacancy left by Mr. Beck. Mr. Don Gunther was appointed Chairman. No director or consulting fees were paid toMr. Campbell during 2013.
70

3/28/2014 UNITED STATES
http://www.sec.gov/Archives/edgar/data/1082198/000137647414000074/prnx_10k.htm 112/125
Table of Contents
The LTIP is a non-employee director and consultant compensation plan. The purpose of the Plan is to advance theinterests of the Company and its Stockholders by providing an incentive to attract, retain and reward persons performingservices as Directors and Consultants for the Company, to provide a means by which such eligible recipients may begiven an opportunity to benefit from increases in value of the Common Stock through the granting of Awards, and bymotivating such persons to contribute to the long-term growth and profitability of the Company. Awards may includestock options, stock awards, restricted stock, restricted stock units, and other stock or cash awards. 785,000 shares wereallocated in total to cover any and all award types under the LTIP. On February 8, 2013, 78,500 option awards with avesting period of three years were granted to six non-employee Directors.
The following summarizes stock option activity for the years ended December 31, 2013 and 2012:
2013 2012
Number of
O ptions
WeightedAverageExercise
Price Number of
O ptions
WeightedAverageExercise
Price
Options outstanding, at beginning of year 0 $ 0 0 $ N/A
Granted 78,500 2.09 0 N/A
Exercised 0 N/A 0 N/A
Forfeited/expired 0 N/A 0 N/A
Options outstanding, at December 31 78,500 2.09 0 N/A
Options exercisable, at December 31 13,500 $ 2.09 0 $ N/A
The following table summarizes information about stock options outstanding at December 31, 2013:
Number of sharestobe
issued uponexercise
of outstandingoptions
Weightedaverageexerciseprice of
outstandingoptions
Number of sharesremainingavailablefor futureissuance
under equitycompensation
plans
Equity compensation plans approved by shareholders 78,500 (1) 2.09 706,500 (2)
(1) Includes the number of shares that may be issued upon the exercise of outstanding options to purchase shares ofCommon Stock under the LTIP. The non-employee Director awardees were Mr. Ralph Beck (13,500 options), Ms. TrudyClark, Mr. Max Engler, Mr. Don Gunther, Mr. Ibrahim Ibrahim and Mr. Carl Smith (13,000 options, respectively). This planwill expire in December 2022. The options were valued at $1.00 per option at the date of grant.
(2) Includes shares available for future issuance under the LTIP, excluding shares quantified under Column 1. As notedabove the 706,500 unawarded options as of December 31, 2013 were transferred to EIP for future issuances.
2014 Equity Incentive Plan- In December 2013, the Company’s board of directors adopted the 2014 Equity Incentive Plan
(the “EIP”) that provides for the issuance of a variety of equity awards to employees, non-employee Directors andConsultants. Under the terms of this plan, 1.8 million shares are reserved for issuance under the EIP which weretransferred into the EIP from the LTIP and ISOP. The EIP document was filed as an appendix to the PRE14A Proxy filedwith the SEC on October 3, 2013.
For transactions in which we obtain employee services in exchange for an award of equity instruments, we measure thecost of the services based on the grant date fair value of the award. We recognize the cost over the period during whichan employee is required to provide services in exchange for the award, known as the requisite service period (usually thevesting period). Cash flows resulting from the exercise of related options are included in financing cash flows. There wereno options granted or exercised under the EIP during 2013.

3/28/2014 UNITED STATES
http://www.sec.gov/Archives/edgar/data/1082198/000137647414000074/prnx_10k.htm 113/125
The related option awards for employees and directors are classified as equity and as such are valued at the grant dateand are not subject to remeasurement thereafter. The options vest annually on the anniversary of the grant date over athree year period. The option valuations for future grants are expected to be performed using a fair value Black Scholesmodel.
71
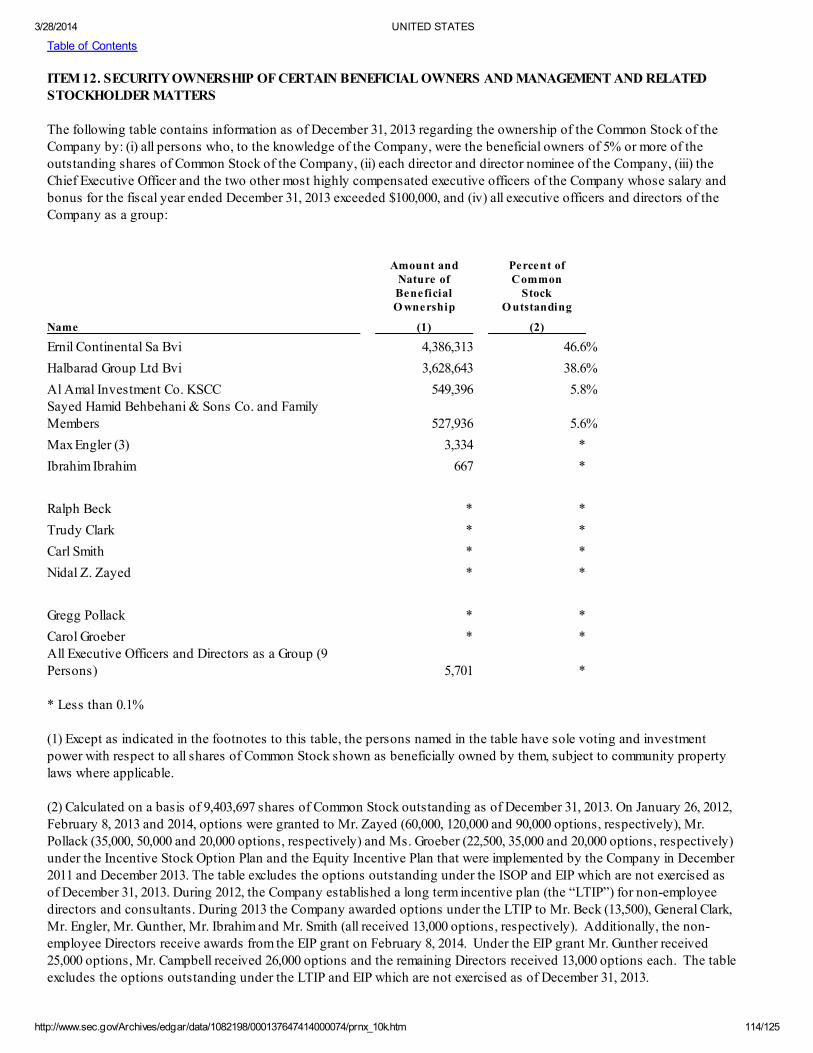
3/28/2014 UNITED STATES
http://www.sec.gov/Archives/edgar/data/1082198/000137647414000074/prnx_10k.htm 114/125
Table of Contents
ITEM 12. SECURITY OWNERSHIP OF CERTAIN BENEFICIAL OWNERS AND MANAGEMENT AND RELATEDSTOCKHOLDER MATTERS
The following table contains information as of December 31, 2013 regarding the ownership of the Common Stock of theCompany by: (i) all persons who, to the knowledge of the Company, were the beneficial owners of 5% or more of theoutstanding shares of Common Stock of the Company, (ii) each director and director nominee of the Company, (iii) theChief Executive Officer and the two other most highly compensated executive officers of the Company whose salary andbonus for the fiscal year ended December 31, 2013 exceeded $100,000, and (iv) all executive officers and directors of theCompany as a group:
Amount and
Nature of Percent ofCommon
BeneficialO wnership
StockO utstanding
Name (1) (2)
Ernil Continental Sa Bvi 4,386,313 46.6%
Halbarad Group Ltd Bvi 3,628,643 38.6%
Al Amal Investment Co. KSCC 549,396 5.8%Sayed Hamid Behbehani & Sons Co. and FamilyMembers 527,936 5.6%
Max Engler (3) 3,334 *
Ibrahim Ibrahim 667 *
Ralph Beck * *
Trudy Clark * *
Carl Smith * *
Nidal Z. Zayed * *
Gregg Pollack * *
Carol Groeber * * All Executive Officers and Directors as a Group (9Persons) 5,701 *
* Less than 0.1%
(1) Except as indicated in the footnotes to this table, the persons named in the table have sole voting and investmentpower with respect to all shares of Common Stock shown as beneficially owned by them, subject to community propertylaws where applicable.
(2) Calculated on a basis of 9,403,697 shares of Common Stock outstanding as of December 31, 2013. On January 26, 2012,February 8, 2013 and 2014, options were granted to Mr. Zayed (60,000, 120,000 and 90,000 options, respectively), Mr.Pollack (35,000, 50,000 and 20,000 options, respectively) and Ms. Groeber (22,500, 35,000 and 20,000 options, respectively)under the Incentive Stock Option Plan and the Equity Incentive Plan that were implemented by the Company in December2011 and December 2013. The table excludes the options outstanding under the ISOP and EIP which are not exercised asof December 31, 2013. During 2012, the Company established a long term incentive plan (the “LTIP”) for non-employeedirectors and consultants. During 2013 the Company awarded options under the LTIP to Mr. Beck (13,500), General Clark,Mr. Engler, Mr. Gunther, Mr. Ibrahim and Mr. Smith (all received 13,000 options, respectively). Additionally, the non-employee Directors receive awards from the EIP grant on February 8, 2014. Under the EIP grant Mr. Gunther received25,000 options, Mr. Campbell received 26,000 options and the remaining Directors received 13,000 options each. The tableexcludes the options outstanding under the LTIP and EIP which are not exercised as of December 31, 2013.

3/28/2014 UNITED STATES
http://www.sec.gov/Archives/edgar/data/1082198/000137647414000074/prnx_10k.htm 115/125
(3) Max Engler serves as a director for Litra Holding AG. Litra Holding AG owns directly 33,000 shares of Pernix Group’scommon stock. Based upon information provided to Pernix Group, Pernix Group does not consider these shares to bebeneficially owned by Mr. Engler.
72

3/28/2014 UNITED STATES
http://www.sec.gov/Archives/edgar/data/1082198/000137647414000074/prnx_10k.htm 116/125
Table of Contents
ITEM 13. CERTAIN RELATIONSHIPS AND RELATED TRANSACTIONS, AND DIRECTORS INDEPENDENCE
Certain of the Company’s executive officers, directors, and major stockholders are also owners, officers, and/or directorsof SHBC located in Kuwait. SHBC is a civil, electrical, and mechanical engineering firm and construction contractor withover 4,000 employees and over 50 years of experience. Ernil Continental, S.A., BVI., Halbarad Group, Ltd., BVI andaffiliated companies hold over 96.0% of the common stock outstanding, of Pernix Group, Inc. SHBC and Pernix Group bidand compete within the same industries; however, SHBC has agreed, in writing, not to bid on projects within the UnitedStates and its possessions.
During the first quarter of 2013, the Company purchased for $1.1 million, the building and land on which the Company’scorporate headquarters are located. These assets were purchased from Baron Real Estate Holdings, a related party. SeeNote 15 in the notes to our consolidated financial statements.
As of December 31, 2013 and 2012, the Company had $0 and $2.25 million of outstanding debt under agreements withrelated parties. The interest rate on the borrowings is 5% per annum. The interest expense during 2013 and 2012 amountedto approximately $108,000 and $97,000, respectively before adjustments related to the quasi reorganization.
Included in the debt outstanding as of December 31, 2012, was a $1.0 million short-term debt agreement with BentMarketing Ltd., a related party that was entered into during May of 2011. Pursuant to the terms of the agreement, PernixGroup, Inc. drew $2.0 million in $500,000 monthly installments beginning May 31 through August 31, 2011 and repaid $1.0million of this amount in October 2011. The remaining $1.0 million outstanding debt under this agreement, and relatedaccrued interest, was repaid in December 2013. Also included in the outstanding debt as of December 31, 2012 was a $1.25million long-term debt agreement with Bent Marketing that was entered into in February 2012 and was repaid in December2013. As a result of the quasi-reorganization, the carrying values of related party debt were increased from $1.0 million to$1.1 million for short term related party debt and from $1.2 million to $1.3 million, for the long term related party debt. SeeNotes 2 and 3 in the notes to our consolidated financial statements.
On November 28, 2011 the Company received an additional short-term loan from Bent Marketing, Ltd. in the amount of$350,000 that was repaid in May, 2012 along with accrued interest.
During the fourth quarter of 2011 and the first quarter of 2012, the Company extended short term loans to TransRadio. Theinterest rate on both loans was 5% and the loans were due on June 30, 2012 and March 14, 2013, respectively. On March28, 2012, the Company sold its interest in TransRadio and the buyer, Bevita Commercial Corp. (a related party) assumedthe loans. During May 2012, the loans of $350,000 and $325,000, respectively, for a total of $675,000 plus accrued interestof $13,052 were repaid.
Director Independence
The Company is a “Controlled Company” as that term is defined by the Listing Requirements of NASDAQ. As such, ifthe Company were a company listed on the NASDAQ trading market, it would not be required to comply with the directorindependence guidelines established thereby.
ITEM 14. PRINCIPAL ACCOUNTANT FEES AND SERVICES
The Audit Committee pre-approves all audit services and permitted non-audit services (including the fees and termsthereof) to be performed for the Company by its independent registered accountants. As disclosed in Item 9 above, in late2013, the Company terminated CohnReznick LLP as its principal accountant and in January 2014 the Company engagedBDO USA, LLP as its new principal accountant. The following table presents fees for professional services rendered byBDO USA, LLP, the principal accountant for the respective periods indicated:
73

3/28/2014 UNITED STATES
http://www.sec.gov/Archives/edgar/data/1082198/000137647414000074/prnx_10k.htm 117/125
1.
2.
3.
4.
Table of Contents
Services Performed 2013 (Note 4) 2012 (Note 3)
Audit Fees (Note 1) $ 209,436 $ —
Tax Fees (Note 2) 27,759 —
Total Fees $ 237,195 $ —
NOTES TO PRECEDING TABLE
Audit fees represent fees for professional services provided in connection with the audit of our annual financialstatements and certain transition procedures as well as audit services provided in connection with statutoryfilings.
Tax fees principally represent fees for tax preparation.
Principal accountant fees in relation to the year ended December 31, 2012 were paid to CohnReznick LLP. Feespaid for the year ended December 31, 2012 were $277,832 for audit fees, $68,400 for tax services and $111,046 forother accounting services.
Included in the fees above for the year ended December 31, 2013 are fees to be paid to BDO USA, LLP. Excludedfrom the table above are fees relating to services performed by CohnReznick LLP related to the year endedDecember 31, 2013 in the amounts of $138,500 for audit services, $1,560 for tax services and $9,012 of otheraccounting services.
74

3/28/2014 UNITED STATES
http://www.sec.gov/Archives/edgar/data/1082198/000137647414000074/prnx_10k.htm 118/125
Table of Contents
PART IV
ITEM 15. EXHIBITS AND FINANCIAL STATEMENT SCHEDULES
See the audited financial statements for the year ended December 31, 2013, presented in Item 8 above.
EXHIBITNUMBER EXHIBIT DESCRIPTIO N
2.01
Amended and Restated Agreement and Plan of Merger and Plan of Reorganization among Sixth BusinessService Group and Pernix Group , Inc. Appendix A (Incorporated by reference from Exhibit 2.01 to the FormS-4 filed on 12/9/1999)
3.01
Certificate of Incorporation of Pernix Group (Incorporated by reference from Exhibit 3.01 to the Form S-4 filedon 7/2/2001)
3.02 By-laws of Pernix Group (Incorporated by reference from Exhibit 3.02 to the Form S-4 filed on 7/2/2001)
3.03
Amendment to Certificate of Incorporation (Incorporated by reference from Exhibit 3.03 to the Form 10KSBfiled on 4/2/2007)
3.04
Certificate of Amendment to the Restated Certificate of Incorporation of Pernix Group, Inc. (Incorporated byreference from Appendix A of Schedule 14C filed on October 1, 2012)
3.05 Certificate of Amendment to the Restated Certificate of Incorporation of Pernix Group, Inc. **
4.01
Certificate of Designations- Series A Preferred Stock (Incorporated by reference from Exhibit 3.1 to the Form10-Q filed on August 12, 2011)
4.02
Certificate of Designations- Series B Cumulative Convertible Preferred Stock (Incorporated by reference fromExhibit 3.2 to the Form 10-Q filed on August 12, 2011)
4.03
Certificate of Amendment to the Certificate of Designation of Series A Preferred Stock of Pernix Group, Inc. (Incorporated by reference from Appendix B of Schedule 14C filed on October 1, 2012)
4.04
Certificate of Amendment to the Certificate of Designation of Series B Preferred Stock of Pernix Group, Inc.(Incorporated by reference from Appendix C of Schedule 14C filed on October 1, 2012)
4.05
Certificate of Amendment to the Certificate of Designation of Series A Preferred Stock of Pernix Group, Inc. **
10.01
Agreement for Design, Supply of Plant and Equipment, Private Construction, Maintenance and Operation,and Transfer of Ownership dated June 10, 1997 (Incorporated by reference from Exhibit 10.01 to the Form S-4filed on 12/9/1999)
10.02
Agreement for Design, Supply of Plant and Equipment, Private Construction, Maintenance and Operation,and Transfer of Ownership, Change Order Number 1, dated November 30, 1998 (Incorporated by referencefrom Exhibit 10.02 to the Form S-4 filed on 12/9/1999)
10.03
Agreement for Design, Supply of Plant and Equipment, Private Construction, Maintenance and Operation,and Transfer of Ownership, Change Order Number 2, dated November 30, 1998 (Incorporated by referencefrom Exhibit 10.03 to the Form S-4 filed on 12/9/1999)
10.04 Agreement and Contract for Construction of Koblerville Expansion Project between the Northern Mariana
Islands and Pernix Group dated July 28, 1998 (Incorporated by reference from Exhibit 10.04 to the Form S-4

3/28/2014 UNITED STATES
http://www.sec.gov/Archives/edgar/data/1082198/000137647414000074/prnx_10k.htm 119/125
filed on 12/9/1999)

3/28/2014 UNITED STATES
http://www.sec.gov/Archives/edgar/data/1082198/000137647414000074/prnx_10k.htm 120/125
10.05
Memorandum of Understanding between Sayed Hamid Behbehani & Sons, Co. W.L.L. and Pernix Group ,Inc. regarding right of first refusal for certain areas (Incorporated by reference from Exhibit 10.08 to the FormS-4 filed on 12/9/1999)
10.06
Memorandum of Understanding between Sayed Hamid Behbehani & Sons, Co. W.L.L. and Pernix Group ,Inc. regarding commission fees (Incorporated by reference from Exhibit 10.09 to the Form S-4 filed on12/9/1999)
10.07
Note Agreement between the Commercial Bank of Kuwait, New York Branch, and Telesource CNMI, Inc.dated August 20, 1998 (Incorporated by reference from Exhibit 10.12 to the Form S-4 filed on 12/9/1999)
10.08
Note Agreement between the Commercial Bank of Kuwait, New York Branch, and Telesource CNMI, Inc.dated December 11, 2001 (Incorporated by reference from Exhibit 10.08 to the Form ARS filed on 6/29/2009)
10.09
Term Loan Agreement between the Kuwait Real Estate Bank and Telesource CNMI, Inc. dated May 2, 1999(Incorporated by reference from Exhibit 10.11 to the Form S-4 filed on 8/2/2001)
10.10
Line of Credit Agreement between the Bank of Hawaii and Telesource CNMI, Inc. (Incorporated byreference from Exhibit 10.12 to the Form S-4 filed on 7)
10.11
Lease of Tinian Land between the Commonwealth Utilities Corporation and Telesource International CNMI,Inc. (Incorporated by reference from Exhibit 10.15 to the Form S-4 filed on 12/9/1999)
10.12
Loan Facility Agreement between Arab Banking Corporation and Telesource International Inc. dated March22, 2005 (Incorporated by reference from Exhibit 10.12 to the Form 10KSB filed on 4/2/2007)
10.13
Pernix Group , Inc. 2000 Incentive Stock Option Plan (Incorporated by reference from Exhibit 10.19 to theForm S-4 filed on 7/2/2001)*
10.14
Pernix Group , Inc. 2000 Non-Qualified Stock Options Plan (Incorporated by reference from Exhibit 10.20 tothe Form S-4 filed on 7/2/2001)*
10.15
Pernix Group , Inc. 2000 Non-Employee Director Stock Option Plan (Incorporated by reference from Exhibit10.21 to the Form S-4 filed on 7/2/2001)*
10.16
Warrant to Purchase 1,000,000 Shares of Common Stock between SHBC and Pernix Group , Inc.(Incorporated by reference from Exhibit 10.23 to the Form 10-K filed on 4/16/2002)
10.17
Pernix Group , Inc. Sayed Hamid Behbehani & Sons Co., Joint Venture, L.P. Agreement (Incorporated byreference from Exhibit 10.17 to the Form 10KSB filed on 4/2/2007)
10.18
Common Stock Purchase Agreement between Pernix Group , Inc. and Ernil Continental S.A., BVI datedFebruary 26, 2007. (Incorporated by reference from Exhibit 10.18 to the Form 10KSB filed on 4/2/2007)
10.19
Common Stock Purchase Agreement between Pernix Group , Inc. and Halbarad Group, LTD., BVI datedFebruary 26, 2007 (Incorporated by reference from Exhibit 10.19 to the Form 10KSB filed on 4/2/2007)
10.20
Common Stock Purchase Agreement between Pernix Group , Inc and Ernil Continental S.A., BVI datedJanuary 4, 2008 (Incorporated by reference from Exhibit 10.20 to the Form ARS filed on 6/29/2009)
10.21
Common Stock Purchase Agreement between Pernix Group , Inc. and Halbarad Group, LTD., BVI datedJanuary 4, 2008 (Incorporated by reference from Exhibit 10.21 to the Form ARS filed on 6/29/2009)

3/28/2014 UNITED STATES
http://www.sec.gov/Archives/edgar/data/1082198/000137647414000074/prnx_10k.htm 121/125
10.22
Pernix Group , Inc. 2012 Incentive Stock Option Plan (Incorporated by reference from Appendix A to thePRE14A Proxy filing with the SEC on October 27, 2011)*
10.23
Form of Stock Option Award Notice and Agreement (Incorporated by reference from Exhibit 10.2 to the Form8-K filed on January 31, 2012)

3/28/2014 UNITED STATES
http://www.sec.gov/Archives/edgar/data/1082198/000137647414000074/prnx_10k.htm 122/125
10.24
TransRadio Stock Purchase and Transfer Agreement(Incorporated by reference from Exhibit 10.24 to theForm 10-K filed on March 30, 2012)
10.25
Pernix Group , Inc. 2013 Long Term Incentive Plan (Incorporated by reference form Exhibit 10.4 to the Form 8-K filed on February 14, 2013)*
10.26
Form of LTIP Stock Option Award Notice and Agreement (Incorporated by reference from Exhibit 10.2 to theForm 8-K filed on February 14, 2013)*
10.27
Pernix Group , Inc. 2014 Equity Incentive Plan (Incorporated by reference from Appendix A to the PRE14AProxy filing with the SEC on October 3, 2013)*
10.28
Form of EIP Award Notice and Agreement ((Incorporated by reference from appendix to the PRE14A Proxyfiling with the SEC on October 3, 2013)*
10.29
Preferred Stock Purchase Agreement between Pernix Group , Inc and Ernil Continental S.A., BVI datedDecember 30, 2013 (Incorporated by reference from Exhibit 16.1 to the Form 8-K filed on December 23, 2013)
10.30
Preferred Stock Purchase Agreement between Pernix Group , Inc. and Halbarad Group, LTD., BVI datedDecember 30, 2013 (Incorporated by reference from Exhibit 16.2 to the Form 8-K filed on December 23, 2013)
14.0 Code of Ethics (Incorporated by reference from Exhibit 99.1 to the Form 10KSB filed on 7/31/2006)
16.0
Letter to the Securities and Exchange Commission from CohnReznick LLP, dated December 10, 2013regarding Change in Certifying Accountant (Incorporated by reference from Exhibit 16.1 to the Form 8-Kfiled on December 10, 2013)
21.0 List of Subsidiaries and their jurisdictions**
24.0
Unanimous Written Consent of the Board of Directors of Pernix Group, Inc. to Approve The Registrationand Sale of Common Shares
31.1 Rule 13a-14(a)/15d-14(a) Certification of CEO**
31.2 Rule 13a-14(a)/15d-14(a) Certification of CFO**
32.1 Section 1350 Certification — Chief Executive Officer**
32.2 Section 1350 Certification Chief Financial Officer**
(101.INS)*** XBRL Instance Document N/A
(101.SCH)*** XBRL Taxonomy Extension Schema Document N/A
(101.CAL)*** XBRL Taxonomy Extension Calculation Linkbase Document N/A
(101.LAB)*** XBRL Taxonomy Extension Label Linkbase Document N/A
(101.PRE)*** XBRL Taxonomy Extension Presentation Linkbase Document N/A
(101.DEF)*** XBRL Taxonomy Extension Definition Linkbase Document N/A
77

3/28/2014 UNITED STATES
http://www.sec.gov/Archives/edgar/data/1082198/000137647414000074/prnx_10k.htm 123/125
Table of Contents
* Management contracts and compensatory plans and arrangements required to be filed as exhibits pursuant to item 15(b)of this report.** Filed herewith*** Pursuant to Rule 406T of Regulation S-T, the interactive data files on Exhibit 101 hereto are deemed not filed or part ofa registration statement or prospectus for purposes of Sections 11 or 12 of the Securities Act of 1933, as amended, aredeemed not filed for purposes of Section 18 of the Exchange Act and otherwise are not subject to liability under thosesections.
All exhibits other than those indicated above are omitted because of the absence of the conditions under which they arerequired or because the information called for is shown in the consolidated financial statements and notes thereto in theAnnual Report on Form 10-K for the period ended December 31, 2013.
78

3/28/2014 UNITED STATES
http://www.sec.gov/Archives/edgar/data/1082198/000137647414000074/prnx_10k.htm 124/125
Table of Contents
SIGNATURES
PURSUANT TO THE REQUIREMENTS OF SECTION 13 OR 15(D) OF THE SECURITIES EXCHANGE ACT OF 1934, THEREGISTRANT HAS DULY CAUSED THIS REPORT TO BE SIGNED ON ITS BEHALF BY THE UNDERSIGNEDTHEREUNTO DULY AUTHORIZED.
PERNIX GROUP, INC.
(Registrant)
Dated: March 28, 2014 /s/ Nidal Zayed
Nidal Zayed
President and Chief Executive Officer
PURSUANT TO THE REQUIREMENTS OF THE SECURITIES EXCHANGE ACT OF 1934, THIS REPORT HAS BEENSIGNED BELOW BY THE FOLLOWING PERSONS ON BEHALF OF THE REGISTRANT AND IN THE CAPACITIESINDICATED ON March 28, 2014.
/s/ Don Gunther Chairman of the Board of Directors
Don Gunther /s/ Nidal Z. Zayed Director, President, Chief Executive Officer
Nidal Z. Zayed (Principal Executive Officer)
/s/ Max Engler Director
Max Engler /s/ C. Robert Campbell Director
C. Robert Campbell /s/ Trudy Clark Director
Trudy Clark
/s/ Carl Smith Director
Carl Smith
/s/ Ibrahim Ibrahim Director
Ibrahim Ibrahim
/s/ Gregg Pollack Chief Financial Officer & Vice President - Administration
Gregg Pollack (Principal Chief Financial Officer)

3/28/2014 UNITED STATES
http://www.sec.gov/Archives/edgar/data/1082198/000137647414000074/prnx_10k.htm 125/125
/s/ Carol Groeber Controller and Principal Accounting Officer
Carol Groeber (Principal Accounting Officer)
79