Apple Inc. - Mizuho Financial Group
104
Abhey Lamba Managing Director, Americas Research +1 415 268 5517 [email protected] Vijay Rakesh Managing Director, Americas Research +1 312 294 8682 [email protected] Neil A. Doshi Managing Director, Americas Research +1 415 268 5519 [email protected] Betty Chen Managing Director, Americas Research +1 415 268 5521 [email protected] Parthiv Varadarajan +1 415 268 5503 [email protected] San Q. Phan +1 212 205 7858 [email protected] Alex Pham +1 415 268 5522 [email protected] U.S. Equity Research June 8, 2016 Technology Research Hardware/Software Company Commentary Apple Inc. A Global Analysis of the Apple Ecosystem: India's Not China, But AAPL's Still Tasty - Buy Rating Buy Previous Rating No Change Price (6/07) $99.03 Price Target $120.00 Previous Price Target No Change Summary After analyzing Apple's current situation and evaluating its potential in India, we think there are no easy solutions in the near-term. India is unlikely to offset the slowdown in China. Over the next 5 years, India can drive 4-5% of Apple's revenue but that might not be enough to move the needle in the n-t. Inorganic options are fraught with increased risk and FCF dilution. However, our LTVC analysis of Apple's customers indicate that there is value in the stock at the current price. We remain positive ($120 PT) and see an attractive risk/reward. Key Points ■ Apple at a crossroads with no clear path to growth. The slowdown in the smartphone market combined with its significant size have made it tough for Apple to continue posting the strong growth it delivered over the last few years. Its initiatives to create a new category with Watch have delivered disappointing results. While management's focus on India is understandable, it offers unique challenges and is unlikely to yield any n-t benefits. ■ India unlikely to move the needle for Apple. Based on our extensive analysis of opportunities presented by India and its comparison with China, India is unlikely to help offset the slowdown in China due to lower wages, strong incumbents at very attractive price points, lack of carrier support and the political environment. Even if it gets full access to the Indian market, the region will likely contribute $9-10bn in revenue (4-5% of total sales), which might not be enough to move the needle. Over the next couple of years, India is unlikely to contribute more than 2-3% of total sales. ■ Inorganic initiatives are possible but present much greater execution risk. There is increased in interest in what can Apple buy to drive inorganic growth. Any such strategy is bound to create multiple new challenges for the company and will likely be dilutive to FCF in the n-t. We think a media company (Netflix or Time Warner) might make more sense than other alternatives but none of them offer relief in the n-t. ■ Reiterating Buy on Apple due to attractive risk-reward while supply chain also offers opportunities. At current price, Apple is not trading as a growth company and risk/reward seems attractive. Our analysis of the life time value of an iPhone customer indicates fair value of the stock in the $120-130 range. Within the supply chain, AVGO and NXPI offer good investment opportunities. Our Japan team recommends Sony. Key Data Symbol AAPL (NASDAQ) 52-Week Range $132.97 - $89.47 Market Cap ($mm) $542,429 Shares Outstanding (mm) 5,477.4 Float 5,147.9 Average Daily Volume 38,659,992 Dividend/Yield $1.98/2.0% PLEASE REFER TO PAGE 102 OF THIS REPORT FOR IMPORTANT DISCLOSURE AND ANALYST CERTIFICATION INFORMATION. Mizuho Securities USA Inc. does and seeks to do business with companies covered in its research reports. As a result, investors should be aware that the Firm may have a conflict of interest that could affect the objectivity of this report. Investors should consider this report as only a single factor in making their investment decision. Mizuho Securities USA Inc. www.mizuhosecurities.com/us
-
Upload
khangminh22 -
Category
Documents
-
view
3 -
download
0
Transcript of Apple Inc. - Mizuho Financial Group

Abhey LambaManaging Director, Americas Research
+1 415 268 [email protected]
Vijay RakeshManaging Director, Americas Research
+1 312 294 [email protected]
Neil A. DoshiManaging Director, Americas Research
+1 415 268 [email protected]
Betty ChenManaging Director, Americas Research
+1 415 268 [email protected]
Parthiv Varadarajan+1 415 268 5503
San Q. Phan+1 212 205 7858
Alex Pham+1 415 268 5522
U.S. Equity Research June 8, 2016
Technology ResearchHardware/Software
Company Commentary
Apple Inc.
A Global Analysis of the Apple Ecosystem: India'sNot China, But AAPL's Still Tasty - Buy
Rating BuyPrevious Rating No Change
Price (6/07) $99.03Price Target $120.00Previous Price Target No Change
Summary
After analyzing Apple's current situation and evaluating its potential in India,we think there are no easy solutions in the near-term. India is unlikely to offsetthe slowdown in China. Over the next 5 years, India can drive 4-5% of Apple'srevenue but that might not be enough to move the needle in the n-t. Inorganicoptions are fraught with increased risk and FCF dilution. However, our LTVCanalysis of Apple's customers indicate that there is value in the stock at thecurrent price. We remain positive ($120 PT) and see an attractive risk/reward.
Key�Points
■ Apple at a crossroads with no clear path to growth. The slowdown in thesmartphone market combined with its significant size have made it toughfor Apple to continue posting the strong growth it delivered over the lastfew years. Its initiatives to create a new category with Watch have delivereddisappointing results. While management's focus on India is understandable,it offers unique challenges and is unlikely to yield any n-t benefits.
■ India unlikely to move the needle for Apple. Based on our extensiveanalysis of opportunities presented by India and its comparison with China,India is unlikely to help offset the slowdown in China due to lower wages,strong incumbents at very attractive price points, lack of carrier support andthe political environment. Even if it gets full access to the Indian market, theregion will likely contribute $9-10bn in revenue (4-5% of total sales), whichmight not be enough to move the needle. Over the next couple of years, Indiais unlikely to contribute more than 2-3% of total sales.
■ Inorganic initiatives are possible but present much greater executionrisk. There is increased in interest in what can Apple buy to drive inorganicgrowth. Any such strategy is bound to create multiple new challenges forthe company and will likely be dilutive to FCF in the n-t. We think amedia company (Netflix or Time Warner) might make more sense than otheralternatives but none of them offer relief in the n-t.
■ Reiterating Buy on Apple due to attractive risk-reward while supplychain also offers opportunities. At current price, Apple is not trading asa growth company and risk/reward seems attractive. Our analysis of thelife time value of an iPhone customer indicates fair value of the stock inthe $120-130 range. Within the supply chain, AVGO and NXPI offer goodinvestment opportunities. Our Japan team recommends Sony.
Key DataSymbol AAPL (NASDAQ)
52-Week Range $132.97 - $89.47
Market Cap ($mm) $542,429
Shares Outstanding (mm) 5,477.4
Float 5,147.9
Average Daily Volume 38,659,992
Dividend/Yield $1.98/2.0%
PLEASE REFER TO PAGE 102 OF THIS REPORT FOR IMPORTANT DISCLOSURE AND ANALYST CERTIFICATIONINFORMATION. Mizuho Securities USA Inc. does and seeks to do business with companies covered in its research reports.As a result, investors should be aware that the Firm may have a conflict of interest that could affect the objectivity of thisreport. Investors should consider this report as only a single factor in making their investment decision.
Mizuho Securities USA Inc.www.mizuhosecurities.com/us

Table of Contents
Executive Summary: A Global Apple Analysis ........................................................................................................ 3
Overview of Apple’s Business: The Company at a Crossroads ................................................................................ 5
Apple’s Global Distribution: Running Out of New Markets? ................................................................................... 9
A Quick Look in the Rear View Mirror: Studying Apple’s Success in China ........................................................ 13
Long-Term India Opportunity: Could be Limited to 4-5% Of Apple’s Total Revenues ........................................ 16
Apple’s Far Reaching Impact: Robust Supply Chain with Combined Market Value of over $2 Trillion .............. 34
Checks from Japan Indicate Slower than Usual Momentum behind Next iPhone Launch ..................................... 52
Apple May Shift Drastically Toward OLED in 2017; Potential for Risks/Obstacles ............................................. 55
Apple’s Position in Services/Applications Does Not Seem as Exciting as Focused Players .................................. 59
Apple Watch Unlikely to be a Driver Anytime Soon .............................................................................................. 66
With Around $150 Billion in Net Cash, What Else Can Apple Do? ....................................................................... 77
A Survey of 1,000 Consumers Indicates Apple’s Franchise Remains Strong ......................................................... 82
Why Stay Positive On the Stock Despite the Growth Challenges? ......................................................................... 88
Financial Model ....................................................................................................................................................... 93
Appendix ................................................................................................................................................................. 97
June 8, 2016 2Mizuho Securities USA Inc.
Apple Inc.

Executive Summary: A Global Apple Analysis
Similar to many technology companies before it, Apple is at a crossroads. After
capitalizing on its initial success with the iPod and subsequently navigating the
transition to the smartphone era with the iPhone, the company appears to be facing
growth hurdles as it laps tough compares and the smartphone market reaches a point
of saturation. Given the sales and profitability concentration around the iPhone, the
stock, in turn, has largely begun to reflect the valuation of a pure hardware company
with peaks and troughs driven by product and refresh cycles. We agree with the bear
argument that the company needs to prove its ability to grow again but its valuation
combined with the strength of its core franchise keeps us on the constructive side.
Thus, although we recognize the significant challenges facing Apple and think that it
is no longer a growth company, we are reiterating our Buy rating and $120 price
target after thoroughly analyzing its near-term challenges and potentially limited
benefits from its efforts in India. Based on our updated ‘lifetime value of an iPhone
customer’ analysis, we think the stock should be worth $120-130.
In this report, we have done a deep dive across the various segments of Apple’s
portfolio in order to assess the potential for incremental growth. We have extensively
looked at Apple’s potential in India, its impact on the supply chain, challenges in
driving greater services revenue and potential for acquiring significantly large assets
to drive inorganic growth. We believe this is the first detailed analysis of these
opportunities and challenges.
After analyzing the factors that made it successful in China and studying the nuances
of the Indian smart phone market, we strongly believe that India cannot offset the
slowdown in revenues presented by China. We agree with management’s viewpoint
that India offers good potential over the next decade and demographics are highly
favorable, but progress will likely be very slow. We think the Indian market presents
many unique challenges to Apple like lower wages, strong incumbents at attractive
price points, diversity of the user base, tiered distribution model, lack of carrier
support, literacy levels of the population, and political environment. These factors
will likely limit its ability to meaningfully accelerate growth in the region, which can
potentially contribute 4-5% of Apple’s total revenue by 2020. While generating $9-
10 billion (our estimate) of revenue from the region will likely be a great
achievement for the company, we note that given Apple’s overall size, the amount is
unlikely to move the needle. The region’s revenues are likely to be 2-3% of total
sales over the next couple of years, clearly not enough to offset the significant
slowdown in China.
In terms of other growth areas, we think Watch has clearly not delivered and based
on our work, we think it is not even an attractive market for Apple to target.
Additionally, its features are not sufficient to drive significant incremental adoption.
We totally understand management’s increased focus on driving services revenue by
monetizing its installed base. However, we note that Apple lags behind pure-play
service providers (like Pandora, Spotify, Netflix etc.), which has made it tough for
June 8, 2016 3Mizuho Securities USA Inc.
Apple Inc.

the company to drive significant adoption within its installed base. Its storage
solution is gaining momentum but it is not a scalable offering, in our assessment.
We also looked at the company’s ability to drive inorganic growth by acquiring some
automobile or media assets. We think any of those acquisitions will be a significant
deviation for Apple and likely not a risk-free or straight-forward path to take. Having
said that, we think purchasing a media company like Netflix or Time Warner could
help the company by generating some revenue growth accretion, but it will likely
have to increase its capex outlays meaningfully. Within the automobile space,
purchasing a company like Tesla might help, but that would likely open a whole new
set of challenges even if management of the target company were retained.
While we look at Apple as a good value play, we think its supply chain, which
combined has a market cap of nearly five times as much as that of Apple itself, likely
offers more attractive and investable ideas. We would look at a broad diversified
name such as Avago that has significant share on the iPhone 7 and also has broad
exposure, with wired infrastructure and networking now contributing about 58% of
revenues. Also NXP Semiconductors (supplier of NFC on the iPhone 7 for Apple
Pay) could also be an attractive name especially as automotive, at about 40% of
revenue, continues to experience a multi-year secular tailwind with ADAS. And
lastly, Western Digital and Micron Technology as diversified value memory plays
are likely to benefit from improved 2H memory demand.
Our Japan team (Yasuo Nakane and Goto Fumihide) have also done an extensive
work on Apple’s supply chain. Based on their research, adoption of OLED displays
could help Apple drive near-term demand for the product. However, given the early
stages of the technology’s adoption, potential production bottlenecks, and limited
manufacturing capabilities, OLED might not become mainstream until 2019,
although we might see limited release in a premium offering as early as 2017. Within
their coverage area, Sony is Nakane’s top pick. Besides steady earnings growth from
the Game and Music business, CMOS sensors profitability will likely return to
normal level despite short term negative impact from the Kumamoto earthquake. He
assumes that Sony will keep 100% market share for CMOS sensors in iPhones and
iPads, and trend of dual camera adoption will contribute to Sony’s CMOS sensor
revenues and earnings. He reckons management’s decision to withdraw from dual
camera module assembly is very positive since they are not competitive enough in
the module assembly area.
June 8, 2016 4Mizuho Securities USA Inc.
Apple Inc.

Overview of Apple’s Business: The Company at a Crossroads
After hitting some troubled times and significant market share losses as a PC
company, Apple’s future reversed course once it launched its music device, the iPod.
In early 2000s, iPods revolutionized the way people listened to music and the way
content was distributed in the music industry. For the first time in history, music
albums were unbundled and distribution of music went totally digital instead of
relying on cassette tapes or CDs. As a result, iPods became almost ubiquitous, with
consumers building out their music playlists and relying on the portable digital
device for their music needs. The technology helped Apple in multiple ways. For
instance, the company was able to solidify its position as a preferred personal device
manufacturer for consumers. Secondly, its revenue started to grow again, reversing
course from a decline of 33% a year prior to the iPod launch to a CAGR of +35%
over five years after the iPod launch. By 2006, the year prior to launching iPhones,
iPods contributed 40% of Apple’s total revenues and were the primary contributors
of company’s profits. Additionally, iPods also re-energized the company’s PC
business as there were synergies between the two product categories since iPods had
to work with a desktop application.
The iPhone Turbocharged Apple’s Business
In 2007, the company capitalized on its success with iPods and revolutionized the
smartphone industry with the launch of the iPhone. Apple attempted to disrupt the
go-to-market model for smartphones in addition to launching a revolutionary new
personal device. Initially, Apple tried to sell iPhones without carrier subsidy and the
phones were priced at about $400 versus the $200 level (subsidized) that most other
smart phones were available for. The devices had slower initial adoption due to
higher price points. However, Apple soon decided to support the subsidy model for
the device, which resulted in acceleration in sales. The availability of iPhones for
around $200 in the US attracted a lot of subscribers who were impressed with the
ease of use and power of the device. The adoption also created a very strong eco-
system for the company as Apple started the AppStore, whereby users could
purchase applications and electronic books for the device in addition to music.
Additionally, it opened the door for the company to create a new category with iPads,
which had a strong start, but enthusiasm around the device soon faded – especially as
next generation laptops started competing with them from the upper end and
introduction of phablets (larger screen phones that could serve the same purpose as
tablets) impacted the category at the lower end. In the last fiscal year, iPads
contributed 10% of Apple’s revenue after peaking at about 20% in 2012. However,
iPhones have grown to be the majority revenue and profit contributor for Apple.
As shown in the following chart, the company has successfully transitioned from one
product category to another as its growth driver over the last 15 years. The
company’s revenue growth accelerated meaningfully with the advent of iPhones as it
posted revenue CAGR of 45% in FY07-FY12 versus average revenue growth of 33%
in five years prior to that. In the most recent fiscal year, 66% of the company’s
June 8, 2016 5Mizuho Securities USA Inc.
Apple Inc.
revenue came from iPhones and given their higher margins, profit contributions were
meaningfully higher. Another interesting aspect of Apple’s business model has been
that it has successfully migrated from one segment being the revenue and profit
driver to the next as its market segments matured and got cannibalized by new
innovative solutions – so being ‘at a crossroads’ isn’t really a new situation for
Apple. For instance, iPods had become around 40% of sales by FY06 while Apple
had historically been a personal computing company. Similarly, strong growth in
iPhones cannibalized the iPod market and smart phones became major segment for
the company versus iPods by FY09. Its importance has only grown since then.
Exhibit 1: Apple Revenue Breakdown by Product (millions)
$0
$50,000
$100,000
$150,000
$200,000
$250,000
iPhone iPad iPod Mac Others
0%
10%
20%
30%
40%
50%
60%
70%
80%
90%
100%
iPhone iPad iPod Mac Others
Source: Company data, Mizuho Securities USA estimates
Slowing Growth Engine Seems to be Creating Significant
Uncertainty
Apple has clearly led the innovation wave in personal computing over the last decade
and a half but its growth engine seems to be slowing down. The company’s revenues
are expected to decline year-over-year in FY16, which has not happened in the last
15 years. As shown in the following table, market growth rates of its underlying
focus areas are slowing down drastically. Additionally, we think Apple’s growth
rates are likely to end up below the levels likely to be seen in the underlying markets
for iPhones and tablets, as most of the growth might occur at the lower end of the
market where Apple does not participate. While the current macro environment is
clearly not its friend, the company also seems to have hit a point where it needs
another category to drive growth. Even if the company were to significantly outpace
its underlying market growth rates, this will likely not be enough to drive greater
than a mid-single digit growth rate for the entire company. The following charts
highlight historical as well as expected growth rates of the company’s end markets
and Apple’s growth rate in those areas over the last year.
June 8, 2016 6Mizuho Securities USA Inc.
Apple Inc.

Exhibit 2: Market Growth versus Apple Shipment Growth
Smartphone Desktop / LaptopTablet
21%
6%
23%
-1%
-2%
3%
8%
13%
18%
23%
2-year (Historical) 5-year (Projected)
CAGR
-5%
1%
-18%
-4%
-20%
-15%
-10%
-5%
0%
5%
2-year (Historical) 5-year (Projected)
CAGR
-9%
-3%
9%
-2%
-10%
-8%
-6%
-4%
-2%
0%
2%
4%
6%
8%
10%
2-year (Historical) 5-year (Projected)
CAGR
Mar
ket
Ap
ple
Source: Gartner, Company data, Mizuho Securities USA estimates
Watch Does Not Seem to be the Answer
The company introduced Apple Watch in 2015 to enter the wearables market and to
capitalize on its large installed base. The product has been a relative disappointment
so far, as it has not gained as much traction as initially expected. Based on several
estimates, the company has cumulatively sold about 12-15 million watches. While
we agree that Apple has likely sold more watches in the first year of their
introduction versus iPhones in their launch year, we note that there is a significant
difference in the two situations. In case of iPhones, Apple was creating a new market
with a completely new selling model, while simultaneously building a customer
following. Arguably, it did have iPod customers, but iPhones were a significant
extension of iPods and had a very different buying behavior. In contrast, the
company had a very loyal base of customers when it launched Apple Watch. Many
of the company’s phone users were waiting anxiously for the new product and these
users were some of the early adopters. However, enthusiasm for the watch has been
muted relative to initial iPhone users. Additionally, Watch does not do anything that
one cannot do with a phone and maybe even with a much cheaper fitness device.
Even if the company were to see accelerated sales of its watches, we do not expect
Watch to be the next revenue or profit driver as the company has a total revenue base
of over $200 billion and the category itself is not large enough to move the needle for
them.
Apple at a Crossroads: Accept Slow Growth or Buy Diverse
Assets?
We think this leaves Apple at a crossroads where the company has to decide whether
it is content becoming a slow growth large technology company that has a loyal
customer following, which can be monetized over time (i.e., a cash cow) or if it
should push to create another growth driver. Admittedly, the company is in a very
solid footing, but we think that it is unlikely to be content with giving up on growth
June 8, 2016 7Mizuho Securities USA Inc.
Apple Inc.

initiatives. The company still has one of the best balance sheets out there and is
generating a significant amount of cash. As shown in the following chart, Apple is
near the upper end among the companies in the Dow Jones Industrials in terms of its
FCF margin but it has the lowest valuation in terms of enterprise value to FCF. We
used consensus FY17 revenue growth rate for this chart, which could be at the higher
end for Apple but the company remains one of the top FCF generators among large
cap vendors. We excluded Exxon Mobil and Chevron from the following analysis as
growth has been volatile due to choppy commodity markets. Excluding financial
companies, the group’s average for revenue growth, free cash flow margin and
enterprise value to FCF multiple stand at about 4%, 17% and 19x, respectively,
compared with Apple’s 5%, 23% and 7x. Apple’s projected growth and profitability
is above average but its stock is trading at a deep discount to its peers in the index.
Additionally, the company’s management team and employees are unlikely to be
content with lack of growth. As such, we expect them to look at multiple avenues for
returning to growth.
Exhibit 3: Metrics Across Dow Jones Industrial Average Index Companies
Revenue Growth Free Cash Flow Margin EV to FCF Multiple
-14% -9% -4% 1% 6% 11%
Coca-Cola
McDonald's
Caterpillar
Merck
IBM
Verizon
General Electric
Procter & Gamble
Boeing
Cisco
3M
Average
Wal-Mart
United Technologies
Pfizer
Intel
Microsoft
Disney
Johnson & Johnson
Apple
Home Depot
UnitedHealth
Du Pont
Nike
Visa
0% 10% 20% 30% 40% 50%
Wal-Mart
UnitedHealth
Caterpillar
Boeing
Home Depot
Nike
United Technologies
General Electric
Verizon
Du Pont
IBM
Disney
3M
Procter & Gamble
Average
Intel
McDonald's
Coca-Cola
Apple
Johnson & Johnson
Cisco
Merck
Microsoft
Pfizer
Visa
5.0x 10.0x 15.0x 20.0x 25.0x 30.0x
Apple
Cisco
Boeing
Pfizer
Intel
UnitedHealth
Microsoft
IBM
Merck
Du Pont
Johnson & Johnson
United Technologies
Wal-Mart
Average
Verizon
Home Depot
Disney
Procter & Gamble
3M
Visa
General Electric
Caterpillar
Nike
Coca-Cola
McDonald's
Source: FactSet, Company data
Given that Apple has the financial wherewithal to practically do anything required to
drive growth, we think management is likely to take on multiple initiatives in its
quest for the next leg of growth. In this report we analyzed some potential areas the
company is likely to focus on. For instance, it is likely to look at means to expand its
user base, retain its user base with solid offerings, expand its wallet share among its
users and look for new product categories to expand its product portfolio.
June 8, 2016 8Mizuho Securities USA Inc.
Apple Inc.

Apple’s Global Distribution: Running Out of New Markets?
In order to see how Apple can expand its customer base with existing offerings, we
looked at the company’s global presence. Among all of its products, it makes sense
to focus on its most prevalent device, iPhones, as that has the largest installed base
out there and it is the largest revenue and profit contributor for the company.
According to Gartner, the iPhone installed base is over 500 million, assuming
average life of about 2-3 years for the device, which is about half of Apple’s total
device installed base. The company has built a presence in almost all the key regions
in the world with varying levels of penetration. Although management has indicated
global smartphone penetration of 40% as a potential metric to indicate that there is
significant growth opportunity ahead for the market, we are not fully convinced that
such growth would translate into greater penetration for iPhones due to its high price
points. Additionally, management’s statistic is significantly below Gartner’s reported
smart phone penetration levels of about 66%. It is tough to call which estimates are
more accurate, but we think it would be safe to assume that the real number could be
somewhere in between. Either way, future growth rates likely won’t match past
performance and, for the reasons cited above, the market may grow faster than
Apple. We are more comfortable assuming that most of the growth will occur in the
lower end of the market where Apple may choose not to participate due to lower
profitability metrics of devices at that level.
In order to estimate the potential for smartphone penetration as a driver for market
growth, we looked at penetration rates in various areas based on their average
monthly income. We plotted smartphone penetration against average monthly
income to identify areas where penetration can grow significantly. Not surprisingly,
the data shows that regions with higher average monthly income, where propensity to
pay for more expensive devices will be high as well, already have high smartphone
penetration rates. As such, we capped the upper limit of monthly income at $2,000 to
evaluate the regions where penetration can rise as monthly incomes rise. We lay the
data out in Exhibit 4, where size of the bubble is an indication of total population in
those regions. India seems like an obvious target for handset manufacturers looking
to benefit from growing penetration as it represents about 20% of the world’s
population and plots the lowest on smartphone penetration.
June 8, 2016 9Mizuho Securities USA Inc.
Apple Inc.

Exhibit 4: Monthly Wage vs Smartphone Penetration (Bubble Size Represents Population)
Indonesia
Thailand
India
Brazil
MexicoChina
Malaysia
Czech Republic
Portugal
Taiwan
Hungary
Poland
Hong Kong
South Africa
Greece
Saudi Arabia
0%
20%
40%
60%
80%
100%
120%
-$50 $450 $950 $1,450 $1,950
Sm
artp
ho
ne P
enet
rati
on
Monthly Wage
Source: ILO, World Bank, Gartner and Mizuho Securities USA estimates
Additionally, Apple’s market share within a region is highly correlated to income
levels in that region. Given that Apple’s devices are among the most expensive
phones out there, we are not surprised that the company commands higher market
share among smartphone manufacturers in regions with greater wages. In order to
better analyze Apple’s appeal particularly among various regions, we defined the
affordability index as average monthly wage divided by the local price of an iPhone
6S (converted to USD at the spot exchange rate); the higher the affordability index,
the higher the potential for Apple to gain meaningful share.
As shown in Exhibit 5, the company commands greater than 10% market share in
regions where the affordability index is around 1.5x or higher. In other words, Apple
has gained meaningful market share in markets where cost of an iPhone is up to two
thirds of a month’s average income. The company has achieved reasonable success
in China where the affordability index measures around 1x, though, we point out that
there have been some unique characteristics like the need to jumpstart its 4G
network, high wage disparity and aggressive initial subsidies upon launch of the
iPhone that allowed Apple to command share greater than the level indicated by the
trend-line. India, on the other hand, has an affordability index of less than 0.25x,
implying that average consumer will have to spend over four months’ salary to
purchase an iPhone. While it is the largest single region after China where Apple can
try to target over a billion people, the country clearly does not meet the affordability
criteria for iPhones. Moreover, we think India presents some very unique challenges
to Apple that we cover in subsequent sections. At a high level, India has the numbers
June 8, 2016 10Mizuho Securities USA Inc.
Apple Inc.

that could get Apple excited about the market, but the company’s price points will
make it extremely difficult to gain significant share based on our analysis.
Exhibit 5: Correlation Between iPhone Affordability & Market Share
India
China
US
UK
y = 0.0524x + 0.016
R² = 0.7724
0%
10%
20%
30%
40%
50%
60%
0.0x 1.0x 2.0x 3.0x 4.0x 5.0x 6.0x 7.0x 8.0x 9.0x
iPh
on
e M
arke
t Sh
are
iPhone Affordability Index
Source: ILO, Gartner, and Mizuho Securities USA estimates
We attempted to identify regions where Apple can generate about 10-20 million
phone sales a year, which would be about 5-10% of its current shipment volume, that
could help it to expand its user base beyond that from normal organic growth in its
current markets. Assuming about a two-to-three-year replacement cycle, we believe
such regions would need to have a population of greater than 100-150 million people
and be able to support average monthly wages of about 1.5x the price of the phone.
In other words we looked for regions with population greater than 100
million, iPhone affordability index of greater than 1.5x, and iPhone market
share less than 10% and there are none left.
For example, while Russia fulfills the population and iPhone share constraints, it falls
short on monthly wages with an affordability index less than 1x. We think this
situation highlights the biggest challenge Apple faces as it is running out of regions
to invest into where its phones are affordable.
As we did more of this analysis, we realized that easy pickings have been done for
the space and incremental growth is becoming harder especially in areas where
Apple has not already built a strong presence.
June 8, 2016 11Mizuho Securities USA Inc.
Apple Inc.

In simple words, if Apple does not have a strong presence in a particular
region, there is a good reason behind it and the dynamics are unlikely to
change over the next 3-5 years.
Having said that, we do not think we can completely write off Apple as a franchise as
the company commands a very loyal following among its user base. Based on all our
conversations, we do not come across many people who intend to switch from Apple
to a competing eco-system. Additionally, the company still attracts many consumers
that are first time smartphone users among pre-teens and teenagers in developed
markets. The company also continues to benefit from Android switchers. Based on
the company’s most recent earnings call, Apple added more switchers from Android
and other platforms in the first half of this year than any other six-month period, ever.
June 8, 2016 12Mizuho Securities USA Inc.
Apple Inc.

A Quick Look in the Rear View Mirror: Studying Apple’s Success in China
China has been a big focus area for Apple and the company has been able to
experience extremely strong growth in the region over the last few years. Greater
China (mainland China plus Hong Kong and Taiwan) contributed 25% of the
company’s revenue in FY15 versus 12% in FY11 (when the company started
breaking out its geographic contributions) as it posted revenue CAGR of 47% versus
the company’s average growth rate of 21% during the period. We think China is a
great case study for evaluating Apple’s future in emerging markets. Having said that,
we also note that there are certain items that are very specific to the Chinese market
and we need to be extremely careful about extrapolating them to other emerging
markets. As such, before evaluating the potential of Indian market for Apple, we
decided to better study Apple’s rise in the Chinese market and key factors that
enabled the outsized growth in the region.
By our assessment, a confluence of events led to the rapid growth of smartphone
shipments in China over the past few years, with Apple benefitting
disproportionately. As shown in Exhibit 6, China’s robust economic growth resulted
in rising wealth for its citizens, with GDP per capita growing around 80% over the
2010-2015 timeframe to just over $8,000, or a CAGR of 12%. Relatedly, Gartner
data shows that the total handset installed base rose from about 850 million in 2010
to over 1,080 million by 2015. Notably, the smartphone penetration rate increased
materially from around 5% in 2010 to around 65% by 2015.
While rising affordability and declining smartphone prices were key drivers
underpinning this growth, we also note that China’s rapid rollout of its next-
generation 4G-LTE cellular network during this period also helped smartphone
adoption. Against this backdrop, Apple experienced significant growth in its China
business. According to Gartner, the company shipped around 2 million units in 2010
after officially launching in the country the prior year. By 2015, Apple was shipping
around 53 million units annually as it aggressively expanded distribution and
extended its product line-up to include larger screen devices, all the while supported
by carrier handset subsidies as well as the broader underlying drivers mentioned
above. However, a combination of economic growth concerns in China, falling
carrier subsidies and exhaustion in premium smartphone demand has weighed on the
region’s growth in the last couple of quarters. In F2Q16, the company reported
Greater China revenue declined 26% year-over-year versus growth of 14% in F1Q16
and 81% in F2Q15.
June 8, 2016 13Mizuho Securities USA Inc.
Apple Inc.

Exhibit 6: Comparison of China and India
GDP per Capita Smartphone Penetration Apple Shipments & Market Share
$0
$1,000
$2,000
$3,000
$4,000
$5,000
$6,000
$7,000
$8,000
$9,000
2010 2011 2012 2013 2014 2015
$1,250
$1,300
$1,350
$1,400
$1,450
$1,500
$1,550
$1,600
$1,650
$1,700
2010 2011 2012 2013 2014 2015
0%
10%
20%
30%
40%
50%
60%
70%
0
200
400
600
800
1000
1200
2010 2011 2012 2013 2014 2015
Handset Installed Base (mm)*
Smartphone Penetration Rate (%)
0%
5%
10%
15%
20%
25%
0
200
400
600
800
1000
2010 2011 2012 2013 2014 2015
Handset Installed Base (mm)*
Smartphone Penetration Rate (%)
0%
2%
4%
6%
8%
10%
12%
14%
0
10
20
30
40
50
60
2010 2011 2012 2013 2014 2015
Apple Units (mm) Apple Market Share (%)
0.0%
0.5%
1.0%
1.5%
2.0%
2.5%
3.0%
0
1
1
2
2
3
2010 2011 2012 2013 2014 2015
Apple Units (mm) Apple Market Share (%)
China
India
Source: Gartner, World Bank, Mizuho Securities USA estimates
India is Not China
We compare and contrast this with Apple’s journey in India. On the F2Q16 earnings
call, management called out strong revenue growth in India at 56% year-over-year
which, in our view, was driven by iPhone sales. According to Gartner, Apple shipped
a little less than two million iPhones in India in 2015. We also note that Tim Cook
alluded to India being where China was 7-10 years ago, which we believe was meant
more to convey the immaturity of the Indian smartphone market versus China today.
We do not interpret it to mean that in 10 years India will be where China is today,
especially not after conducting this research. As management has pointed out, one
reason for this is the underdeveloped cellular network infrastructure in India,
particularly with respect to 3G and 4G technologies that are required for a high-
quality smartphone experience by consumers. Further, unlike the U.S. and China, the
primary channel of distribution in India is the retail network: only a very small
portion of volume passes through telecom carriers. This is, we believe, one of the
critical differences.
Apple appears to be making progress on expanding its distribution in the country
with plans to introduce its own retail stores to deliver a premium shopping
experience. However, in studying the smartphone landscape, we find that the biggest
hurdle to unit growth is the lack of affordability among Indian consumers, rather than
a lack of access to retail channels. In our view, while smartphone penetration is
almost certain to rise from current levels of around 40%, Apple’s ability to keep up
with the market growth will likely be inhibited by its high price points. Secondly, we
June 8, 2016 14Mizuho Securities USA Inc.
Apple Inc.

think the hole left by slowdown in China is so big that acceleration in sales in India is
unlikely to offset the impact. Although the company could pull multiple levers to
bring the average selling prices of its devices down from the $900+ level in India,
our work suggests that it might need to hit a $150-200 price point to experience
significant growth, which seems highly unlikely in the near-term. In the absence of
rolling out a significantly lower-priced device that would impair the company’s
margin profile, we conclude Apple is unlikely to be able to counteract slowing
iPhone growth in the near-to-medium term even with penetration of the billion-plus-
person Indian market.
June 8, 2016 15Mizuho Securities USA Inc.
Apple Inc.

Long-Term India Opportunity: Could be Limited to 4-5% Of Apple’s Total Revenue
When looking at the sheer magnitude of potential consumers, India ranks highly
among handset manufacturers. With a population of 1.25 billion people, skewed
heavily towards the age group of below 25 years (around 50%) who are likely
smartphone buyers, the Indian market remains relatively underpenetrated. However,
World Bank data shows that 68% of India’s population lives in rural areas that are
difficult for service providers to bring online. Additionally, given the market’s
reliance on retail network to sell phones, it is expensive and difficult to increase
penetration within those hard-to-reach areas. Smartphone adoption is likely to benefit
from rising Internet penetration due to the ongoing buildout of the country’s wireline
and wireless network communications infrastructure. We think most of the growth is
likely to occur in the rural areas where people’s ability to pay for higher end phones
will be very limited. Also, these areas are hard to service for manufacturers.
Indian Smartphone Market is Clearly Large Enough…
Based on data from Internet & Mobile Association of India (IAMAI), we note a clear
inflection point in growth of Internet users – it took close to ten years to get from 10
million users in 2001 to 100 million users in 2011. As shown in Exhibit 7, the user
base reached 200 million in 2013 and rose to 300 million by 2014. By June 2015, this
had grown to 354 million, or 17% growth in the first six months of the year and by
year-end India had overtaken the US to have the second largest Internet user base in
the world. However, while this may appear to be a large number in absolute terms,
India’s numbers still represent about a 30% penetration rate of the total population,
which is relatively low compared to US and China at 87% and 51%, respectively.
Exhibit 7: Internet User Base in India (millions)
*June 2016 estimate; 2010-2015 are year-end estimates
92125
158
215
302
402
462
70
130
205
306
371
0
50
100
150
200
250
300
350
400
450
500
2010 2011 2012 2013 2014 2015 2016*
Total Mobile
Source: IAMAI, Internet Live Stats, Mizuho Securities USA estimates
June 8, 2016 16Mizuho Securities USA Inc.
Apple Inc.

Looking specifically to mobile Internet users, as smartphone adoption picks up due
to a variety of factors such as lower ASPs and rising 3G and 4G connectivity, we
note a clear mix shift among India’s Internet citizens toward mobile-based usage. As
Exhibit 7 indicates, by year-end 2015, mobile user mix stood at around 75%, up from
around 45% in 2012. We believe such a high portion of Internet usage coming from
mobile users is exciting for smart phone manufacturers as it gives them a fertile user
base to sell into. Additionally and arguably, India has better wireless networks in
many hard to reach areas than wired networks, which also enhances the potential
offered by the mobile device market.
…But Most of the Growth is Happening at the Lower End
We attempted to triangulate data and commentary from various sources including
telecom carriers, regulatory authorities and handset manufacturers to gain an idea of
the potential size of the smartphone market in the country. For starters, we evaluated
data from the Telecom Regulatory Authority of India (TRAI) in Exhibit 8 below. The
data shows growth in wireless subscribers from around 584 million in 2010 to 970
million in 2015. We believe this growth was largely enabled by a nationwide
expansion of coverage of basic 2G services by telecom carriers with incremental 3G
and 4G rollouts contributing to growth post-2010. The expanded 2G coverage drove
strong adoption of wireless services among rural and smaller city subscribers as this
demographic notched a more than 2x increase between 2010 and 2015 versus a 65%
increase for the total wireless subscribers. We note that there is a sub-segment of
Indian population that carries more than one device, which makes the total subscriber
base a slightly choppy metric likely resulting in showing some declines in 2013 and
then growth in 2014. Based on our conversations, number of unique subscribers is
around 75% of the total subscriber base.
Exhibit 8: India’s Wireless Subscriber User Base (millions)
33 62112
191274
323 343 372414
132
199
280
393
538
596 525533
556
0
200
400
600
800
2007 2008 2009 2010 2011 2012 2013 2014 2015
584
Urb
anR
ural
905868919
812
392
261
165
970
Source: Telecom Regulatory Authority of India
June 8, 2016 17Mizuho Securities USA Inc.
Apple Inc.
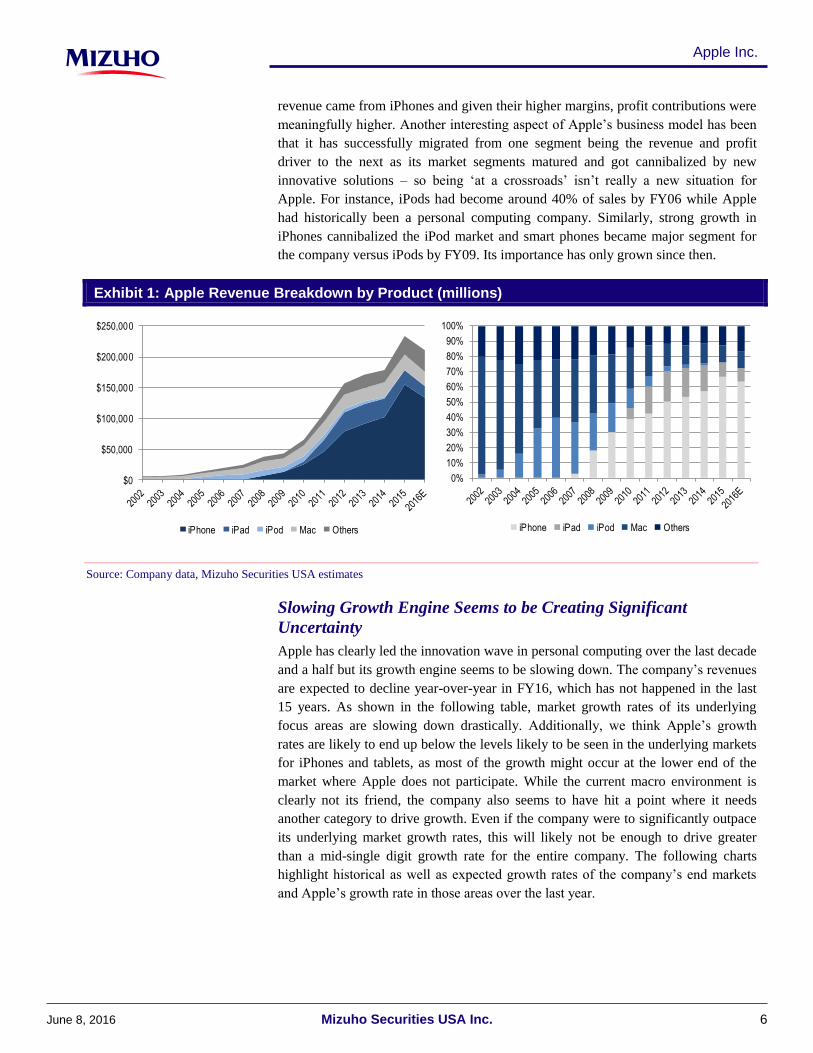
Segmenting the data differently, we observe the distribution of subscribers among
large metropolitan cities, Tier 2 and Tier 3 cities as well as rural areas. As shown in
Exhibit 9, we find evidence of strong growth in wireless subscribers in lower tier
cities, likely supported by urbanization trends, as well as rural areas (labeled Circle
‘B’ and Circle ‘C’ areas in the data) on the back of network coverage expansion.
Notably, the subscriber base in major metropolitan areas where disposable incomes
are likely to be higher, has been flat to slightly down since 2011, which TRAI has
attributed to the disconnection of ‘inactive mobile subscribers’. According to the
data, there were 99 million wireless subscribers in these metropolitan areas in 2015
whereas the number of subscribers in the rural areas was about four times as high.
Exhibit 9: India’s Distribution of Wireless Subscribers (millions)
62 71 97 104 92 95 99
137212
288 324 310 324 346147
224
319
364344 360
383
46
77
108
127122
126142
0
200
400
600
800
1,000
1,200
2009 2010 2011 2012 2013 2014 2015
Metros Circle 'A' Circle 'B' Circle 'C'
905868
919
812
584
392
970
Source: Telecom Regulatory Authority of India (TRAI)
With respect to smartphones and the addressable market for Apple, growth in
smartphone shipments has been exponential, aided by tailwinds such as rising
incomes among consumers, the introduction of low-cost devices, network coverage
expansion and falling prices of 3G and 4G plans. We acknowledge that estimates for
smartphone penetration vary significantly depending on the data sources. Industry
data indicates that India’s smartphone penetration rate is around 25-30% in 2015, up
from 13% in 2014 and 2% in 2010. As Exhibit 10 below shows, India experienced
shipment volume of just over 105 million in 2015, which is expected to grow at a
21% CAGR through 2020 to around 280 million units.
June 8, 2016 18Mizuho Securities USA Inc.
Apple Inc.

Exhibit 10: India’s Yearly Smartphone Shipments (millions)
0.02 0.39 13 16
37
75
107
139
175
207
253
283
0.00
50.00
100.00
150.00
200.00
250.00
300.00
2008 2009 2010 2011 2012 2013 2014 2015 2016 2017 2018 2019 2020
Source: Gartner, Mizuho Securities USA estimates
However, our conversations with distribution partners indicate that the vast majority
of this shipment volume will occur in the low-to-medium segment of the market. In
fact, industry data shows that three quarters of smartphone shipments in 2015 were
for devices priced $250 and below with 55% of the volume in the $120 and below
price band. The premium segment ($500+), on the other hand, accounted for around
5% of the market.
Exhibit 11: Smartphone Shipment Distribution in India by Price Band
55%
20%
20%
5%
<$120 $120 to $250 $250 to $500 >$500
Source: Gartner, Mizuho Securities USA estimates
June 8, 2016 19Mizuho Securities USA Inc.
Apple Inc.

Income Levels Make it Hard for Higher End Phones to Gain
Traction
To put these numbers in perspective, we looked at the rate and drivers of smartphone
adoption in China over the past few years and drew parallels to India. In 2010, China
had a smartphone penetration rate of around 7% while its GDP per capita was around
$4,500 (up around 20% year-over-year) and average monthly wage was around $350.
Looking at income distribution, the proportion of households earning $15,000 or
more per year rose from less than 1% in 2000 to almost 25% by 2015 and is expected
to rise further to 41% by 2020. This rapid growth in annual incomes created demand
for premium products such as the iPhone and played a role in driving smartphone
penetration to around 65% by 2015. In addition to rising affordability, we believe the
aggressive buildout of advanced 3G and 4G-LTE networks by Chinese telecom
carriers starting in 2009, as well as handset subsidies, played a significant role in this
trend.
India, on the other hand, is significantly behind China in terms of income
distribution. In India, the percentage of households making $15,000 or more per year
was very similar to levels seen in China in 2000. However, by 2015, only 13% of the
population was above that mark and 26% of the population is expected to exceed that
level by 2020. As such, India is clearly about 5-6 years behind China in its capacity
to afford higher priced items like iPhones. Further, it remains to be seen if the appeal
of Apple’s devices can remain as high once the Indian market reaches a point of
greater affordability of these devices as it is now.
Exhibit 12: Income Distribution in China versus India
5%
16%
39%43%
38%
95%
81%
49%
33%
21%
0%
10%
20%
30%
40%
50%
60%
70%
80%
90%
100%
2000 2005 2010 2015 2020
$5,000 or lower $5,000 to $15,000 $15,000 to $35,000 $35,000+
China
5%
15%
41%
50%53%
94%
82%
53%
37%
21%
0%
10%
20%
30%
40%
50%
60%
70%
80%
90%
100%
2000 2005 2010 2015 2020
$5,000 or lower $5,000 to $15,000 $15,000 to $35,000 $35,000+
India
Source: Euromonitor (2011), Mizuho Securities USA estimates
As previously noted, carriers in India do not offer handset subsidies, which likely
explains why the carrier channel accounts for just about 5% of total shipments.
Additionally, our work indicates that just about 15% of total wireless subscribers are
3G or 4G subscribers. Taken together, we believe low disposable incomes, lack of
handset subsidies and the slow roll-out of next-generation network connectivity is
June 8, 2016 20Mizuho Securities USA Inc.
Apple Inc.

likely to result in a protracted timeline for smartphone adoption in India, particularly
in the premium segment where Apple plays.
Indian Market is Intensely Competitive
Similar to the market in China, the Indian market is addressed by major global OEMs
such as Samsung, Apple and Lenovo in addition to homegrown brands such as
Micromax, Intex and Lava International that offer primarily low-end devices. In
terms of market share among global OEMs, Samsung leads with around 21% share
while Lenovo and Apple have 7% and 2% of the market, respectively. Among the
local brands, Micromax has around 17% of the market followed by Intex and Lava
with 10% and 7%, respectively.
Our work suggests that smartphone demand in India has high sensitivity in the low
price segment. While this is similar to the demand environment in China, we found
that in 2015, smartphone ASPs in China were close to 2x those in India ($130 in
China versus around $65 in India) likely due to lower disposable incomes,
urbanization rates and 3G/4G adoption in India. As previously laid out in Exhibit 11,
the low-end of the market constitutes the vast majority of shipments in India. In fact,
the next leg of growth is expected to be driven by switching activity among feature
phone users who are likely to purchase smartphones as prices fall into the sub-$100
territory. By comparison, Apple’s devices occupy the $500+ price range where
volumes make up around 5% of overall shipments. Looking at a few online shopping
sites where prices tend to be cheapest, the iPhone 6S and SE retail for around $695
and $560, respectively, versus their prices of $649 and $399 in the US. The big
difference in iPhone prices in the region versus the levels in the US is due to taxes
and custom duties.
We think many of the cheaper phones from vendors like LG, Samsung, or local
providers offer reasonable user experience for consumers making it tough for Apple
to justify its price premium. As highlighted in the exhibit below, most of the cheaper
phones run Android operating system and as such, many of the applications that are
available to high-end Android users work fine on them. However, many of these
cheaper devices sport lower memory levels or have older generation processors that
impact user experience to some extent or limit the number of applications or amount
of data that can be stored on them. In some cases, these devices might not be as
robust as higher end phones but price makes them attractive for a reasonable set of
Indian population. We don’t think Apple will compromise on quality, ever, to
participate at the lower end of the market but over time it can consider using older
generation phones to target the sub-segment. Having said that, we do not expect any
cheaper devices from Apple in the near-term.
June 8, 2016 21Mizuho Securities USA Inc.
Apple Inc.

Exhibit 13: Sample of Smartphones Available in India by Price Band
<$120
$120 to
$250
>$250
Samsung J7 16GB
$240
HTC Desire 16GB
$205
Moto X Play 16GB
$225
Moto G 16GB
$150
Lenovo A6000 16GB
$105
Intex Cloud 4G 16GB
$95
Samsung Core 8GB
$90
Micromax Canvas 16GB
$90
Lava Iris Atom 8GB
$45
iPhone 6S 16GB
$695
iPhone SE 16GB
$560
Samsung Galaxy S7 32GB
$850
Asus Zenfone 2 64GB
$315
Source: Flipkart, Mizuho Securities USA estimates
June 8, 2016 22Mizuho Securities USA Inc.
Apple Inc.

On a purchasing power basis, we note that iPhones have a high opportunity cost for
consumers. In Exhibit 14 below, we provide added perspective by evaluating the
opportunity cost of buying an iPhone in India based on an average smartphone user’s
living expenses. For instance, the amount spent on iPhone 6S could allow a
consumer to purchase five round-trip cross-country air tickets or pay for one month’s
rent for a two-bedroom apartment in a large, metropolitan city. Similarly a consumer
can pay for one year’s worth of groceries, or four years’ worth of cell phone
payments with the same amount. In contrast, in the US, smartphone users finance
their phones with only $200-300 paid up-front. Even if paid fully up-front, the
purchase only represents six months’ of cell phone bills or couple of months’ worth
of groceries.
Exhibit 14: Opportunity Cost of iPhone 6S in India
1 Yearof Grocery Bills
4 Yearsof Monthly Cell
Phone Payments
6 Monthsof Auto Loan
Payments
4 Monthsof K-12 School Tuition
Payments
1 Monthof Rent for a
2-bedroom Apartment
5 TicketsRoundtrip, Cross-
country Airfare
4 Yearsof Water &
Electric Bills
1 Yearof Gas
Spending
4 Yearsof Monthly Cable
Internet Bills
Source: Numbeo, Clipartpanda.com, Cliparts.co, Vorgebirgsschule.de, Mizuho Securities USA estimates
Given our belief that affordability, rather than limited 3G/4G adoption, is the primary
reason for tepid high-end smartphone demand in India, we remain skeptical of a
significant ramp in shipments for Apple in the near-term. Anecdotally, we see
evidence of this price resistance among consumers in the recent launch of the iPhone
6S in the country. According to the Times of India, the device launched for around
$900 to $1,300 (depending on the SKU) which was about $100 higher than iPhone
6/6+ prices at launch a year ago. However, due to weak initial sales in the first
month, Apple and its partners began to offer incentives of up to $500 in the way of
discounts and buyback schemes in order to stimulate demand.
June 8, 2016 23Mizuho Securities USA Inc.
Apple Inc.

Regarding the iPhone SE, while management expects uptake among emerging
markets, we believe demand in India is likely to be limited in the near-term. As
Counterpoint Research points out, with the continuing trend toward larger screen
devices, just about 10% of smartphone purchase intentions in India are for devices
with 4” screens, 75% of which are shipping in the <$75 range. Demand outside of
Apple’s existing 4” installed base, a portion of which is likely to upgrade to larger
form factors, will therefore be limited. We point to Gartner data that suggests that
Apple shipped around 2 million iPhones in India during 2015 (about 80% of which
were non-flagship models such as 4/4S/5/5S) with shipments expected to rise to
around 5 million by 2020. For comparison, the company shipped around 53 million
units in China during 2015. Overall, we believe that unless carriers induce easier
consumption by subsidizing these premium devices, we see a challenging path to
meaningful iPhone shipments in India despite a backdrop of rising smartphone
penetration.
Distribution is Not Easy in the Indian Market
Apple conducts business primarily through its network of distributors, each of which
has a significant presence in a particular region of the country. The company has
clearly communicated its intent to expand distribution across a variety of channels in
the near-term. Broadly, in evaluating smartphone distribution, our analysis indicates
the following channels:
Single-brand and Multi-brand retail stores (85% of shipment volume):
On the single-brand side, multi-national brands such as Samsung and
Lenovo operate under a franchisor model with stores exclusively carrying
their products in order to build brand perception among consumers. In
Apple’s case, we believe the company is working hard to procure the
necessary approvals to launch its own stores in India soon. However, it
seems to be running into regulatory hurdles. Based on recent media reports
after Tim Cook’s visit to India, Indian government is unlikely to relent and
allow Apple to open its stores unless it sources about 30% of the
components from India. Given the current political environment in India, we
do not expect the company to gain any permanent waivers to this policy in
the near-term. Based on some recent media articles, Indian government
seems to be contemplating offering a temporary waiver for 2-3 years giving
Apple time to start sourcing its components from local manufacturers. Even
if/when it gets all the necessary approvals, we believe roll-out efforts are
likely to be focused on major cities initially in order to cater to affluent,
urban customers. We are disinclined to believe that the launch of these retail
stores would lead to material increases in shipments in the near-term since
expanded distribution does little to overcome the significant affordability
hurdle. However, we do believe the initiative builds brand value with a
large, aspirational user base (growing middle class in India) by providing the
premium shopping experience that Apple is known for globally. Having said
that, at about 5-10% of India’s total population, middle class will likely not
June 8, 2016 24Mizuho Securities USA Inc.
Apple Inc.

be able to deliver the numbers needed to drive significant acceleration in
unit volumes.
With respect to the multi-brand channel, these retailers range from large,
branded chains with a nationwide presence to single-location, mom-and-pop
stores. Based on our conversations, these single-location stores seemingly
contribute a majority of total shipments in the retail channel. For a company
such as Apple with limited local experience, these fragmented stores pose a
challenge to its distribution efforts as they are often difficult and expensive
to reach, factors which both inhibit market share growth and maintenance of
margins, in our assessment. Moreover, while they remain mission critical to
Apple’s current distribution network in India, by the very nature of these
individually-owned shops, Apple is unable to exploit one of its key
attributes, i.e., the ability to control the user experience that helped it to build
near-dominance in other markets
Online retail (10% of shipment volume): Online shopping is a fairly
recent phenomenon in India with growth in this channel attributed to a rising
Internet and smartphone adoption among consumers. The companies leading
the charge here are Flipkart, Snapdeal and Amazon, the former two of which
are backed by significant venture capital funding. Up until a few months
ago, we picked up on heavy discounting activity among these online retailers
for a variety of smartphones including the iPhone. For example, during
Flipkart’s ‘Big Billion Days’ sales event, iPhone models were discounted
between 25-35% along with buyback offers and free data allowances.
However, our checks indicate that these discounts have slowed significantly
in recent months. We note that discounting in this channel is led by the
retailer, not the manufacturer. In the case of Flipkart and Snapdeal, we
believe a loss-leader strategy to grab market share is unsustainable beyond
the medium term considering venture capital funding cannot support
negative margins on a high-priced and potentially high-volume product such
as the iPhone. Additionally, Apple is unlikely to encourage significant
discounting of its products. As such, we do not see material shipment gains
for the company in the near-term.
Telecom carriers (5% of shipment volume): India stands in contrast to the
US and China where smartphone shipments, particularly in the early stages
of industry adoption, were aided by significant carrier subsidies. Major
carriers in India do not offer such incentives to subscribers since the vast
majority of them are pre-paid users unwilling to sign long-term contracts.
For Apple, our checks indicate that the carrier channel accounts between 5-
10% of shipments in India. We believe limited incentives to induce spending
on high-end devices such as the iPhone will cap shipment growth in the
near-term.
June 8, 2016 25Mizuho Securities USA Inc.
Apple Inc.
Can Premium Smartphone Demand Inflect Higher in the Near-
Term?
We fully acknowledge that although the pace of smartphone adoption in India could
shift based on near-to-medium term factors, the long-term trend toward high levels of
market penetration is very likely to play out. The country displays demographic
tailwinds in a young, growing population as well as rising disposable incomes and
urbanization rates. However, in our analysis, we look at more immediate trends that
have the potential to play out over the next 12-18 months to assess the impact to
Apple’s iPhone shipments through FY18.
Policy Liberalization May Help but Early Signs Are Discouraging
We first look to policy initiatives being undertaken by the Indian government to
attract foreign direct investment and the potential impact that these have on Apple’s
local operations. As previously mentioned and similar to China, iPhone prices are
materially higher in India for base model 6S (around $750) versus $649 in US. There
are various reasons for this delta including import tariffs, distributor margins and
currency volatility. In the case of tariffs, we note that government policy in India is
fairly protectionist in nature as local industries, especially technology, are quite
nascent. For imported goods, the government’s ‘Make in India’ initiative is one such
policy that requires that 30% of product components be sourced from local vendors
in order to qualify for tariff waivers.
According to media reports, Apple found it challenging to qualify for this waiver as
local component vendors were incapable of meeting Apple’s standards. Recent
reports from the Times of India suggest that the government may have relaxed this
requirement for ‘cutting-edge’ technology companies, for which Apple hoped to
qualify. However, the reports indicated that Apple was not able to attain a waiver
under this provision. There is also speculation regarding Foxconn, Apple’s contract
manufacturer, and the possibility that it could set up an assembly plant in the country
that could be operational in the next 12-18 months. Taken together, these
developments indicate that there are multiple levers that Apple is trying to pull to
potentially waive import duties of 10-12% at the state and national levels, thereby
lowering iPhone prices in addition to expanding distribution with its own retail
stores.
We think the situation is evolving and Apple’s chances are not looking that great for
any near-term resolution. The company might be able to enhance its position in the
region over the next 5-7 years, but that may be too late to aid current investors.
Additionally, we point out that even at lowered prices of $550, the iPhone would
remain simply out of reach for most Indian smartphone buyers.
Relatedly, we also note that the government recently rejected Apple’s application to
sell refurbished phones in the country, a move that, if approved, would have allowed
the company to gain share in the near-term and bring users into its ecosystem.
Apple’s CEO Tim Cook recently visited India to negotiate at the highest levels for
improving Apple’s prospects in the country. Based on some of the news articles, he
June 8, 2016 26Mizuho Securities USA Inc.
Apple Inc.

seems to have pushed for permission to sell used phones in the country to expand
presence at the low end. However, the company’s plans run counter to the country’s
policy of enhancing its manufacturing base. As such, we do not expect an easy way
out for the company unless it starts manufacturing some products in India, which
could take some time to materialize. In terms of future affordability, projections laid
out in Exhibit 15 show that GDP per capita in India is expected to rise around 250%
to about $5,000 by 2030. However, even at these projected levels and our estimate of
around $200 in monthly wages, the affordability index still comes in at less than 1x
,which is likely to mean limited share gains for Apple in India.
Exhibit 15: India GDP per Capita Projection
$1,890
$4,976
$0
$1,000
$2,000
$3,000
$4,000
$5,000
$6,000
Source: US Economic Research Service, Mizuho Securities USA estimates
Unlike the Chinese Market, 3G & 4G Network Roll-outs May Not Act as Catalysts
Management seems to be banking on 4G adoption in India to act as a catalyst for
smartphone adoption. However, we believe the 4G ramp in India is likely to be more
protracted than in China primarily because India’s demographic, on average, is less
urbanized, has lower literacy levels, earns smaller wages and is constrained by
infrastructure bottle-necks. We evaluated 3G and 4G-LTE coverage, speed and
adoption trends in order to gain an understanding of whether limited adoption of
wireless broadband network technologies is slowing smartphone growth in India.
However, to begin with, we looked at China’s rate of adoption of 3G and 4G services
and its underlying drivers over the past few years to determine if parallels can be
drawn to India. China’s telecom carrier landscape is made up of three major carriers:
China Mobile with 800 million+ wireless subscribers, or around 65% market share,
followed by China Unicom and China Telecom with around 23% and 12%,
respectively. We believe these carrier market share dynamics are important in
June 8, 2016 27Mizuho Securities USA Inc.
Apple Inc.

evaluating not only the uptake of mobile broadband services in the country, but also
Apple’s dramatic iPhone growth over the past few years.
We focus our case study on China’s largest carrier – China Mobile. By most
measures, China Mobile’s roll-out of its 3G network was unsuccessful. In the early
2000s, the carrier began the process of developing its own 3G standard, TD-
SCDMA, in order to minimize its reliance on western 3G technologies and the
payment of associated royalties that would eventually be required once mainland
adoption picked up. China Mobile’s decision was in stark contrast to that of China
Unicom and China Telecom who instead supported WCDMA and CDMA EV-DO,
respectively, both of which are globally accepted and compatible 3G technologies.
When it came time to launch its 3G network in 2008, China Mobile’s delayed
development efforts and a general immaturity of its technology resulted in poor
network performance and an inability to support data-hungry smartphones. This is,
quite likely, the reason for the lack of iPhone availability on China Mobile until
1Q14, long after its 2009 and 2012 launches on China Unicom and China Telecom,
respectively. Given poor 3G performance and limited handset options available
through the carrier, China Mobile came under significant pressure during 2010-2013
as the remaining carriers competed aggressively to take share, particularly in the
high-end segment. In order to stem subscriber defections, China Mobile began
heavily investing in its 4G infrastructure, which would be based on the TD-LTE
standard, a more globally-accepted technology. Similarly, the other two carriers
developed their 4G networks on the FDD-LTE standard which is recognized globally
as well.
In December 2013, the Chinese government issued the first 4G licenses to the
country’s carriers that allowed them to roll out their next-generation networks. The
government began with TD-LTE licenses, benefitting China Mobile and giving it a
six month head start on its 4G network launch (versus a mid-2014 launch for the
remaining carriers). The sheer size of China Mobile’s subscriber base coupled with
poor 3G adoption meant that the 4G upgrade cycle, in all likelihood, would be
significant. As Exhibit 16 shows, the growth of China Mobile’s 4G subscribers was
materially faster than the growth of its 3G subscribers, reaching 170 million
subscribers within the first 13 months of launch as compared with almost 48 months
for the same number of subscribers after the 3G launch.
June 8, 2016 28Mizuho Securities USA Inc.
Apple Inc.

Exhibit 16: China Mobile 3G and 4G Subscriber Growth (millions)
0
50
100
150
200
250
300
350
400
~48 months to achieve 170 million 3G
subscribers
~13 months to achieve 170 million 4G
subscribers
4G
3G
Source: China Mobile, Mizuho Securities USA estimates
More pertinent to Apple, we note that the company announced in December 2013,
not coincidentally, after nearly six years of negotiations, that it had reached an
agreement with China Mobile to sell its devices through the carrier. Taken together,
we believe it was the significant ramp in 4G subscribers, introduction of a larger-
screen smartphone in late 2014 and pent-up demand from China Mobile’s huge
subscriber base that resulted in dramatic growth of iPhone shipments for Apple from
4Q14 to 3Q15. Exhibit 17, based on Gartner data, charts this inflection with year-
over-year shipment growth increasing to 70-90% during this time period.
June 8, 2016 29Mizuho Securities USA Inc.
Apple Inc.

Exhibit 17: Quarterly iPhone Shipments in China
Mill
ions
of
units Y
/Y G
rowth
0%
10%
20%
30%
40%
50%
60%
70%
80%
90%
100%
0
2
4
6
8
10
12
14
16
1Q13 2Q13 3Q13 4Q13 1Q14 2Q14 3Q14 4Q14 1Q15 2Q15 3Q15 4Q15
Source: Gartner, Mizuho Securities USA estimates
Importantly, we believe this rapid iPhone growth was further stimulated by
significant subsidies offered by China’s carriers, wherein customers received
monthly rebates on their plan payments if smartphones were purchased at full retail
price. Carriers were able to provide these subsidies as average-revenue-per-user
(ARPU) of around $15-20 per month (according to GSMA Intelligence) allowed
carriers to recognize a recurring revenue stream over the life of the contract. More
recently, however, media reports suggest that China’s regulators have required
carriers to pare down subsidies on high-end devices and instead focus on providing
aggressive incentives to drive adoption of mass-market 4G devices ($150 and below
range). Subsidy levels by carriers have been coming down and we expect them to
keep moving lower over the next few years, which is likely to keep impacting iPhone
demand in the region.
India, on the other hand, stands in contrast to China. Based on our conversations with
local carriers, more than 95% of wireless subscribers in India are pre-paid users that
refill their voice and data plans on a monthly, if not weekly, basis. Further, ARPU of
around $5 per month is considerably lower than in China, which limits the carriers’
ability to offer up-front subsidies in exchange for locking in customers into a long-
term contract. We also note that the infrastructure supporting the extension of credit
in India to all but the wealthiest citizens is virtually non-existent. In the absence of
credit scores and history, carriers are understandably unwilling to sell high-end
devices at subsidized prices because they cannot ensure that these customers will
honor payments under their contract terms.
June 8, 2016 30Mizuho Securities USA Inc.
Apple Inc.

In attempting to tie this back to Apple’s shipment numbers, consider that 5% of
smartphone shipments occurs in the $500+ price band, as previously mentioned, and
further assume that Apple has 25% share of this segment. This still translates to just
3-4 million incremental units for the company in the near-term. Therefore, we
believe that the lack of subsidies compounded by limited affordability potentially
caps high-end smartphone adoption and Apple’s shipments in India.
We also evaluated the possibility of a rapid 4G ramp in India, as with China, and its
potential to inflect high-end smartphone shipment growth higher. As Exhibit 18
shows, India’s 3G and 4G coverage (defined as % of total population), while
modestly behind its more developed peers in Asia, is above average at around 75%.
However, while coverage may appear fairly robust, we believe that limited
development of quality spectrum and investments in network infrastructure by
carriers mean congested networks across the country. In fact, according to Cisco,
India’s average mobile connection speed was estimated at 1,016 kbps in 2015 and is
expected to rise to 3,122 kbps by 2020, which compares with global averages of
2,000 kbps and 6,500 kbps, respectively. We think these limitations have an impact
on user experience making it harder for them to justify spending significant amount
of their disposable incomes on devices that might not be able to deliver their full
capabilities.
Exhibit 18: 3G and 4G Coverage by Country (% of population)
0%
20%
40%
60%
80%
100%
Coo
k Is
land
s
Pak
ista
n
Vie
tnam
Ban
gla
desh
Chi
na
Indi
a
Cam
bodi
a
Mon
golia
Sri
Lank
a
Indo
nesi
a
Phi
llipp
ines
Mal
aysi
a
Tha
iland
Aus
tral
ia
Hon
g K
ong
Sou
th K
orea
Sin
gapo
re
Tai
wan
Japa
n
Asia Pacific
Average
Source: GSMA Intelligence (2014)
June 8, 2016 31Mizuho Securities USA Inc.
Apple Inc.

We acknowledge the ambiguity in estimates around subscriber numbers.
Consequently, we used various sources (industry associations, carriers and third party
research) to develop an idea of penetration rates. We believe that there may be
around 250 million 3G-capable devices in the country while 4G-capable devices
amount to around 50 million. However, our work suggests that the actual
subscription rates to 3G and 4G services may be around 50% of the device installed
base. This would suggest that 3G and 4G penetration rates are around 15% in India
compared to 50%+ in China. Our conversations indicate that 4G shipments are
expected to rise to 100 million and 150 million units by the end of 2016 and 2017,
respectively, which would translate to an incremental 4G subscriber base of 50-60
million users. Again we note that the majority of these device shipments are likely to
be in the sub-$150 price band as 3G and 4G plan prices converge and ASPs decline.
While this incremental growth is encouraging, we believe that low ARPUs coupled
with high network infrastructure investment costs may be hindering carriers’ ability
to aggressively build out their next-generation networks. Interestingly, our
conversation with a major carrier indicated that it only needs 10-15% of its
subscriber base to adopt 4G to support a nationwide roll-out over the next few years
given the large number of low ARPU subscribers. Additionally, the country’s 3G
network is still very robust and can help support a long tail of users in remote areas
or whose needs can be satisfied with feature phones or very low-end smart phones.
By moving more consumers to 4G networks, carriers are essentially freeing up
capacity to improve their service levels for a large population on the 3G network.
Contribution from India to be Limited over the Next Few Years
We used Gartner’s most recent data of about 2 million iPhones shipped in the region
as a starting point. Then we assumed that Apple’s market share would rise to the
level above the mark indicated by the trend line based on the country’s expected
monthly average wage and corresponding affordability index over the next few years.
We think Apple can push its penetration to slightly above the trend-line due to its
extensive efforts in the region. We used expected GDP growth rate as a proxy for
annual wage increases in the region. Additionally, we assumed a Mac attach rate of
10% for the region and iPad or Watch attach rate of 25% in our calculations. As
Exhibit 19 shows below, we believe India could contribute around $3-4 billion in
2016 and 2017 rising to around $9-10 billion by 2020 (CAGR of about 35-40%). We
note that we did not include services revenue in the analysis below as we do not
expect significant attach rate of services in the region. To put this in context,
revenues from India would represent about 4-5% of Apple’s total revenues over the
next few years through 2020. In absolute terms, these revenue numbers from India
would be strong; however, the contribution is unlikely to have a material impact on
the company as a whole.
June 8, 2016 32Mizuho Securities USA Inc.
Apple Inc.

Exhibit 19: India Contribution Over the Next Few Years (millions)
2016E 2017E 2018E 2019E 2020E
Monthly Wage $146 $156 $166 $178 $190
iPhone Affordability Index 0.2x 0.3x 0.3x 0.3x 0.3x
iPhone Market Share 2.2% 2.8% 3.2% 3.5% 4.0%
iPhone Shipments (mm) 3.1 5.0 6.7 8.8 11.3
YoY growth 64% 60% 35% 30% 29%
iPhone ASP $615 $609 $603 $597 $591
iPhone Revenue (mm) $1,914 $3,033 $4,052 $5,234 $6,662
Mac Shipments (mm) @ 10% Attach 0.3 0.5 0.7 0.9 1.1
Mac Revenue (mm) $389 $623 $840 $1,096 $1,409
iPad / Watch Shipments (mm) @ 25% Attach 0.8 1.2 1.7 2.2 2.8
iPad / Watch Revenue (mm) $350 $560 $756 $987 $1,268
Total India Revenue (mm) $2,655 $4,218 $5,651 $7,320 $9,344
Y/Y Growth 59% 34% 30% 28%
% of Apple's Total Revenue 1% 2% 3% 3% 4%
Source: US Economic Research Service, Mizuho Securities USA estimates
June 8, 2016 33Mizuho Securities USA Inc.
Apple Inc.

Apple’s Far Reaching Impact: Robust Supply Chain with Combined Market Value of over $2 Trillion
One of the key drivers to Apple’s success is a strong supply chain. With over 200
suppliers (Link-List of Apple Suppliers) and a combined market value of over $2
Trillion according to FactSet, Apple drives a robust supply chain that is carefully
synchronized and coordinated to drive timely ramp of new products and potentially
the best possible product to end users. Apple not only drives significant volumes but
also strong content growth with RF, memory, and leading edge design.
Just to refresh some of the market share commentary highlighted previously, Apple
arguably continues to be the king of smartphones. In 2015, Apple had the largest
market share of smartphone OEMs in the U.S. at 39%, with Samsung well behind,
around 22%. In China, there are emerging China OEMs that are battling with Apple
for share. Despite that, the Apple iPhone is seen as a status symbol and is the more
coveted choice, which combined with the reasons highlighted earlier in the report
likely helped propel the company to the smartphone leader in China at 20% market
share. While India remains a focus area for the company and it may have limited
success in the region, it nevertheless offers opportunity for some growth for Apple.
Exhibit 20: A Key Driver for Handset RF OEMs given Leading share - 2015 Smartphone Market Share
Apple2%
Samsung25%
Micromax13%
Lava9%
Lenovo7%
Intex6%
Xiaomi5%
Others33%
2015 India Smartphone Marketshare
Apple39%
Samsung21%
LG14%
Lenovo5%
Others21%
2015 U.S. Smartphone Marketshare
Apple20%
Huawei16%
Xiaomi8%
Samsung11%
OPPO10%
Meizu8%
BBK9%
Others18%
2015 China Smartphone Marketshare
Source: Mizuho Securities research, Gartner
Increasing Content with Every iPhone Generation: 2012-2016
A look at RF content from iPhone 4s to iPhone 6s+. As we show below, content
on the iPhone has been growing with every generation of iPhone as Apple adds 3G,
4G, LTE, LTE-Advanced and global band support on the iPhone. Total content on
the iPhone has increased 4-5x over the last 3-4 years, a significant growth combined
with unit growth from Apple. A key concern as we look forward is that while RF
content growth continues to be strong, year-over-year growth at Apple is slowing
down, driven by: 1) Global smartphone penetration; 2) Competition from lower
priced Chinese handsets; and 3) Continued need for innovation that drives a
compelling value proposition.
June 8, 2016 34Mizuho Securities USA Inc.
Apple Inc.
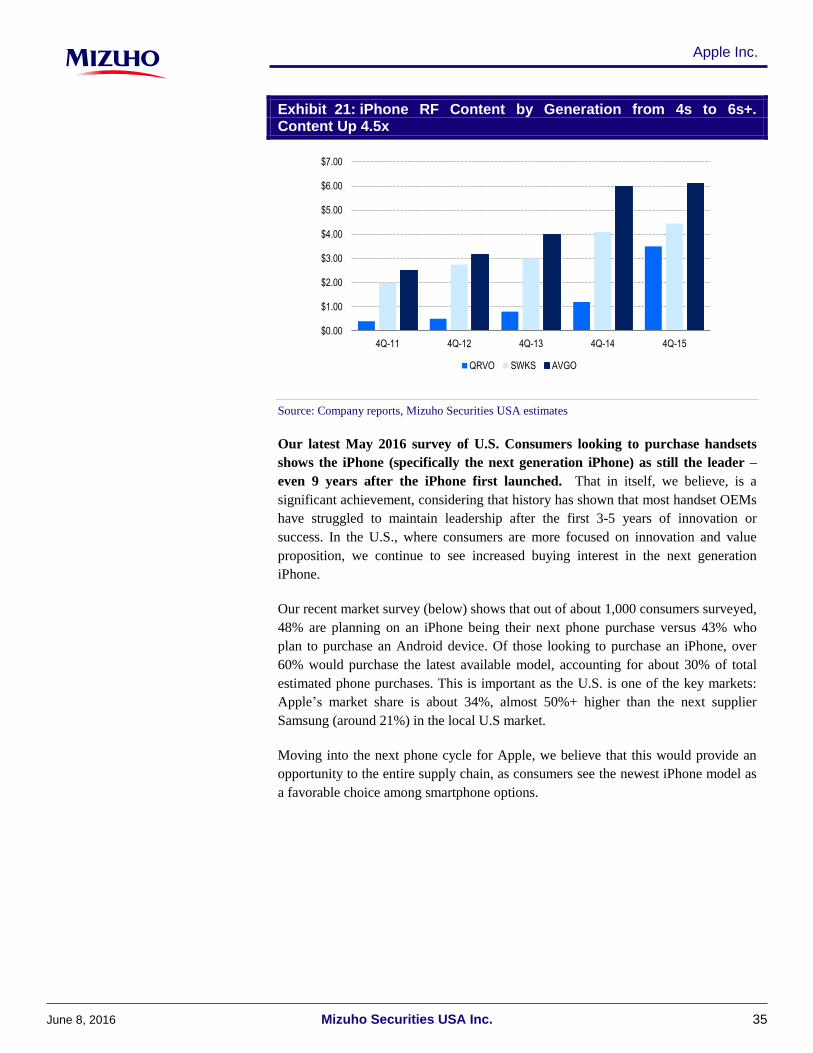
Exhibit 21: iPhone RF Content by Generation from 4s to 6s+. Content Up 4.5x
$0.00
$1.00
$2.00
$3.00
$4.00
$5.00
$6.00
$7.00
4Q-11 4Q-12 4Q-13 4Q-14 4Q-15
QRVO SWKS AVGO
Source: Company reports, Mizuho Securities USA estimates
Our latest May 2016 survey of U.S. Consumers looking to purchase handsets
shows the iPhone (specifically the next generation iPhone) as still the leader –
even 9 years after the iPhone first launched. That in itself, we believe, is a
significant achievement, considering that history has shown that most handset OEMs
have struggled to maintain leadership after the first 3-5 years of innovation or
success. In the U.S., where consumers are more focused on innovation and value
proposition, we continue to see increased buying interest in the next generation
iPhone.
Our recent market survey (below) shows that out of about 1,000 consumers surveyed,
48% are planning on an iPhone being their next phone purchase versus 43% who
plan to purchase an Android device. Of those looking to purchase an iPhone, over
60% would purchase the latest available model, accounting for about 30% of total
estimated phone purchases. This is important as the U.S. is one of the key markets:
Apple’s market share is about 34%, almost 50%+ higher than the next supplier
Samsung (around 21%) in the local U.S market.
Moving into the next phone cycle for Apple, we believe that this would provide an
opportunity to the entire supply chain, as consumers see the newest iPhone model as
a favorable choice among smartphone options.
June 8, 2016 35Mizuho Securities USA Inc.
Apple Inc.

Exhibit 22: Consumer’s Likely Next Phone Purchase
0%
10%
20%
30%
40%
50%
Apple iPhone Android Other Smartphone Feature Phone (with onlycalling/text features)
Next Phone Upgrades
NewestiPhone Model
PrioriPhone Model
Source: Mizuho Securities USA survey results
Increasing iPhone ASPs and Multiple Global-Mode iPhone
Launches have been Another Tailwind for RF Suppliers
Apple drove strong handset ASP through multiple generations, as shown below, from
2011 to 2016 YTD. The higher ASP has also implied a strong content uptake as
Apple has focused on the user experience to drive differentiation and loyalty. In
comparison to other handset OEMs such as Samsung and HTC, Apple handset ASPs
have continually remained up, driving opportunities for increasing RF and memory
content for semiconductor suppliers, while also maintaining a significant ASP
premium versus the average ASP at Samsung and HTC.
Exhibit 23: Increasing iPhone ASPs by Generation and Multiple Launches per Year - A Tailwind for RF suppliers
$0
$100
$200
$300
$400
$500
$600
$700
4Q11 1Q12 2Q12 3Q12 4Q12 1Q13 2Q13 3Q13 4Q13 1Q14 2Q14 3Q14 4Q14 1Q15 2Q15 3Q15 4Q15 1Q16
Handset ASPs
Samsung HTC Apple
Source: Mizuho Securities estimates, Company reports
June 8, 2016 36Mizuho Securities USA Inc.
Apple Inc.

Supply Chain Vendors with Displays, Memory, Connectivity, RF
and Security
Putting together the iPhone or the iPad is a work of art and a mammoth task. A very
simplistic list of the components going into the handset or tablet can be broken down
into: 1) RF Communications and NFC; 2) Antenna; 3) Audio; 4) Camera; 5) Casing;
6) Display and backlights; 7) Processors; 8) Connectors and analog components; and
9) Memory components.
RF Components: One of the key components of a handset or iPad is the RF
connectivity. The RF wireless connectivity is achieved by a combination of filters,
power amplifiers, and duplexers. Some of the key component suppliers for the radio
front end RF are Skyworks, Avago, and Qorvo (along with Japanese suppliers
Murata, TDK, and Taiyo Yuden). One of the key drivers of increased front end
content in the iPhone is also the limited spectrum and band crowding with 2G, 3G,
and 4G radios all operating on close frequencies and overlapping with WiFi-
Bluetooth radios. That spectrum complexity drives the need for increased RF, filters,
and integrated and optimized PAD content into handsets given multiple competing
radios from 2G, 3G, 4G, WiFi, Bluetooth, NFC, and BLE (Bluetooth low energy),
among others, all operating on crowded bands and limited spectrum. Another key
driver is the increasing need for bandwidth and the need to dynamically combine
frequencies to achieve bandwidth, or what is called Carrier aggregation. The key is
that going from 2G to 4G implies almost 2-4 times more RF content in handsets for
multimode power amplifiers, filters, switches, and the need for more optimized
integrated front-ends such as PADs (Power amplifiers duplexers).
Broadcom (formerly Avago): AVGO is one of the leaders in RF wireless
technology, leading the 4G wave with FBAR filters and increasing dollar content in
smartphones with its PAD technologies. The company recently merged with
Broadcom and is now operating under the Broadcom name. More importantly, in
March, AVGO filed an 8-K outlining a 3-year supply contract to Apple for its key
FBAR filters. We believe that ~15% of AVGO’s total revenues are attributed to
Apple. Avago supplies RF integrated circuit filters and duplexers using its
proprietary FBAR (film bulk acoustic resonator) technology. AVGO’s front-end
modules incorporate multiple RF amplifiers and filters using its FBAR technology
and are key to enabling modern wireless communication systems to support multiple
streams of data, voice, and video on multiple transmission protocols. Avago’s
FBAR-based front end modules have gained significant traction in the 3G/4G/LTE
handset markets, providing better battery life, improved call reception and fewer
dropped calls versus SAW (surface acoustic wave) filtering technology in incumbent
legacy 2G/3G front end modules. AVGO was among the first to deliver commercial
film bulk acoustic resonators, or FBAR, filters that offer technological advantages at
3G/4G and higher frequencies by separating frequencies on today’s congested RF
spectrum. AVGO is currently on its ninth generation of FBAR and therefore has a
significant lead over its competition, many of whom are just starting to produce these
filters. The trend to 4G/LTE, we believe, benefits AVGO the most as its filters
dominate the 2GHz to 2.7GHz space given superior filter characteristics.
June 8, 2016 37Mizuho Securities USA Inc.
Apple Inc.

Skyworks: We believe SWKS is one of the leaders in RF wireless technology,
leading the 4G wave with AVGO. We estimate that around 27% of revenues come
from Apple. The transition to 3G/4G from 2G/3G and increasing front end
complexity is driving more need for integrated RF front ends and is driving higher
dollar content opportunity. For SWKS, the integrated front ends have grown from
approximately 10-15% of revenues in 2011-12 to 60% of revenues in 2015, with
discrete amplifiers now a much smaller portion of shipments as handset OEMs want
full integrated multimode capable handsets and RF capabilities with 2G/3G/4G, Wi-
Fi, and Bluetooth all enabled. SWKS’s key new products in this segment include the
SkyOne, SkyOne Ultra, and SkyLite.
Qorvo, Murata, Qualcomm, Intel and Synaptics
Tear downs of the iPhone 6s/6s+, 6/6+ and iPhone SE, based on tear downs from
iFixit and Chipworks: SWKS appears to be seeing an increase in content with new
module content as shown in Exhibit 24, while we believe AVGO and QRVO are
mostly flat. We note that the teardowns do not show many of the filters or PADs and
hence may be understating content for the RF players significantly. While the NXPI
micro-controller appears to be integrated into the Apple A9 processor, NXPI appears
to be gaining with the display controller content in the 6s/6s+, which it had
previously supplied on the iPhone 5s/5c.
We took a look at the 4" iPhone SE (retailing at $399) versus the last 4" 5s (which
retailed at $449) and the 4.7"/5.5" 6s/6s+. The SE appears to carry the full RF
support, with only bands 23/43 support missing versus the 6s/6s+. The SE also
carries a 12MP camera versus 8MP in the 5s. As we show below, what stands out is
that RF content on the 4" SE is significantly higher than the 4" iPhone 5s, pointing to
a long term trend of increasing RF front-end content. This teardown of the iPhone SE
carries a QCOM baseband, though there is potential for subsequent iPhone models to
be second-sourced with an INTC modem for specific geographies. We believe 2016
could see iPhone 7 with an INTC modem, thereby pointing to a re-entry of INTC into
the Apple handset supply chain. Key will be INTC’s roadmap for the next generation
of iPhones with LTE advanced or 10nm/14nm cost effective shrinks. While not as
material to INTC revenues it is nonetheless a marquee win and a headline positive,
and depending on the allocation could be a 2H16 tailwind.
It is important to note is that performance has been key and so Apple has continued
to add RF content, with the next generation iPhone expected to have 3 or 4 band
carrier aggregation to drive bandwidth for multiple user applications. Apple has
focused on having almost seamless global wireless support on all its family of the
flagship 5.5”, 4.7”, and 4” family of phones (a significant tailwind for RF), while
using display sizes, memory and camera functionality to drive price differentiation
and user experience. Nonetheless, we believe the next generation iPhone 7 will see
storage densities move to 256GB, a historical high (and now compares to an SSD
enabled notebook) using 3D-NAND. The 3D-NAND theoretically should enable
Apple to achieve slimmer handsets as the prior generation planar NAND does not
June 8, 2016 38Mizuho Securities USA Inc.
Apple Inc.

have to be stacked. We would expect to see 3D-NAND adopted in Apple MacBook
Air and notebooks as well, driving increased content and thinner profile heights.
Exhibit 24: Content Variations by Generation 6/6 Plus, 6s/6s Plus, 5, 5S, SE
iPhone SE - 2016 iPhone 5s - 2013
GSM-CDMA
TD-LTE Bands
Part $ Content Part $ Content Part $ Content
Skyworks SKY77611 Power Amplifier Module $1.10 GSM-GPRS-EDGE PA $1.40 low Band LTE Pad 77810-12 $1.50
SKY77826-16 PAD $1.50 77491 CDMA PA Module $1.45 Mid Band PA 77355-12 $1.50
SKY77357-8 Power Amplifier $1.00 $2.85 $3.00
$3.60
Avago/ BCM5976 Touch Screen Controller $0.75 AFEM LTE B1-B3, Band13 +FBAR $1.50 A790720 PAD-4G $1.60
ACPM-8020 PAD $2.75 AVGO ACPM LTE 5613 $1.20 A7900 Pentaband MMPA $1.30
Other FBAR Filter/ Bands $1.00 $2.70 Other FBAR Filter/ Bands $0.50-$0.80
$4.50 $3.40
Qorvo TQF6410 EDGE PAD $1.30
ASM RF5159 $0.75
WLAN co-exist $2.05
Qualcomm MDM9625M Modem MDM9615 LTE Modem MDM9615M LTE Modem
WTR1625L RF Transceiver QCOM RTR8600 Transceiver ~$17-$18 WTR1605L Tranceiver ~$17-$18
QFE1100 envelope tracker $15-18
NXP (Integrated into A9 processor) Logic/Memory/Audio Interfaces M7 Motion Sensor Hub $0.60-$0.80
NXP 1610A3 Display Controller $0.30 8-Pin Connector Auth (NX20P) $0.80-$1.00 Logic/Memory/Audio Interfaces
NXP 66V10 NFC Controller+SE $1.20 8-Pin Connector Auth (NX20P) $0.80-$1.00
Logic/Memory/Audio Interfaces $0.40
iPhone 5 (Verizon) - 2012
1,2,3,4,5,13, 17, 25 1, 2, 3, 4, 5, 7,
8, 13, 17, 18, 19, 20, 2, 26,
38, 39, 40 (Tiered)
1,2,3,4,5,8,12
13,17,18,19,20,25,26, 29
TD-LTE (38,39,40,41)
Increasing iPhone Bands - Content Rich
GSM-CDMA
TD-LTE Bands
Part $ Content Part $ Content
Skyworks 77802 - Low Band LTE PAD $2.10 SKY77812 Power Amplifer Module $2.00
77356-8 Mid-Band PA+Filters $1.90 SKY77357 Power Amplifier Module $1.90
$4.00 SKY13701 WLAN Front-End Module $0.50
$4.40
Avago/
Broadcom A8020 High Band Pad $2.30 AFEM-8030 Power Amplifier Module $3.00
A8010 Ultra high Band PAD $2.00 Other FBAR Filter/ Bands $2-$3
Other FBAR Filter/ Bands $0.80-$1.00 $6.00
$5.30
Qorvo TQF6410 3G EDGE PA Module TQF6405 Power Amplifier Module $2.00
RF5159 Antenna Switch RF5150 Antenna Switch $1.50
$3.50
Qualcomm MDM9615M LTE Modem MDM9635M LTE Cat. 6 Modem
QCOM QFE1000 ET QFE1100 ET
RF Tranceiver/PMIC ~$20-$22 RF Tranceiver/PMIC ~$20-$22
NXP M8 Motion +Cortex M3 Hub $0.60-$0.65 (Integrated into A9 processor)
NFC+Secure Element -65V10 $0.90 NXP 1610A3 Display Controller
Logic/Memory/Audio Interfaces $0.80-$1.00 NXP 66V10 NFC Controller+SE $1.50
Logic/Memory/Audio Interfaces
Has VOLTE Has LTE-A and MIMO
iPhone 6 - 2014 iPhone 6s/6s+ - 2015
Added bands 28, 29, 41 Added bands 12, 23, 43
All Phones LTE-with Band700 Roaming All Phones LTE-with Band700 Roaming
Source: Apple Company reports, Chipworks, iFixit, Mizuho Securities USA research
As products become more advanced, the dollar content per unit increases with
increasing wireless band support, carrier aggregation, global roaming, and support.
Others in the Supply Chain
As we have noted with almost 200 suppliers, Apple maintains a vast but well-oiled
and nimble supply chain.
June 8, 2016 39Mizuho Securities USA Inc.
Apple Inc.

Apple has a long value chain in each of its sub-components from building out the
force touch value chain such as Mektron, TPK and GIS in Taiwan, backlights with
Minebea and Radiant, double ITO sensor for iPad from Nitto Denko, Nissha
Printing, and display OEMs Japan Display, Sharp, LG Display and Samsung
Display. Some of the force touch and battery charger components are delivered by
Foxlink and ZD Tech combined with system hardware integrator such as Hon Hai,
Pegatron, Wistron, Quanta and Compal.
Display OEMs. Apple uses multiple display OEMs in collaboration with
semiconductor component suppliers to assemble the high volume of iPhone handset
displays and displays for iPads and notebooks. Component suppliers such as
Synaptics, Himax, Minebea, and TPK continually have to interface with display
suppliers as next generation displays are ramped. Key display OEMs for Apple
include LG Display, Japan Display, Sharp, and Samsung Display. Historically, better
user interfaces with increases in display quality and resolution have been one of the
key upgrades on the iPad, iPhone, and Macbook computers, and resolutions have
more than doubled since initial launches. Subsequently, the cost of the
display/touchscreen on the iPhone has also approximately doubled in moving from
the iPhone 4 to the iPhone 6S, as noted in our bill of materials chart below, which is
a positive for suppliers.
Driver ICs. Primary IC suppliers for Apple include ST Micro, Texas Instruments,
and Synaptics. As shown in our teardown tables, there are a number of ST Micro and
TXN solutions used in multiple Apple products including the iPhone, iPad,
Macbook, and Watch. Synaptics is also a key display driver IC supplier with
Renesas. Apple is also beginning to integrate force-touch into its iPhone line, with
the 6s introducing the feature.
LED Backlight. The major LED backlight suppliers on Apple’s LCD displays today
are Minebea and Radiant.
Assembly. Apple also uses a fleet of assembly players, which includes Quanta,
Compal, Pegatron, and Hon Hai, to ramp its iPhone, iPad, and Notebooks.
Near-term, we believe key hardware enhancements on the next generation iPhone 7
could include higher base memory storage at 32GB, but increased NAND storage to
up to 256GB 3D-NAND, increased RF and bandwidth capabilities, and potential
camera enhancements. Longer-term we believe the 2017 iPhone could be a bigger
upgrade with displays and form factor changes.
June 8, 2016 40Mizuho Securities USA Inc.
Apple Inc.

Exhibit 25: Select Apple Supply Chain
Apple
Distributor
Display OEMs
LG
Sharp
Samsung
TDI
Driver ICs
ST Micro
Texas Instruments
Synaptics
Foxlink
LED Backlight
Minebea
Radiant
Processors
Qualcomm
TSMC
Intel
RF
TDK
Broadcom
Skyworks
Muarta
Qorvo
NXP
Taiyo Yuden
Assembly
Quanta
Compel
TPK
Pegatron
Hon Hai
Source: Mizuho Securities research, Company reports
Components: Significantly Higher Content versus China and
Korea Handset OEMs
Below, we compare the iPhone 6s content versus the new Huawei P9 and Samsung
Galaxy S7 Edge. We believe the iPhone continues to have higher RF content,
approximately $15-18 versus the Huawei’s newest product, the P9, which we
believe, has $5-7 in RF content, while the Galaxy S7 Edge falls somewhere in
between, in the $10-$12 range.
June 8, 2016 41Mizuho Securities USA Inc.
Apple Inc.

Exhibit 26: iPhone 6s Content Versus China and Korea Handset OEMs
GSM-CDMA
TD-LTE Bands
Part $ Content Part $ Content Part $ Content
SKY77812 Power Amplifer Module $2.00 SKY78117/4 Front-End Modules
SKY77357 Power Amplifier Module $1.90 SKY78113 Front-End Module
SKY13701 WLAN Front-End Module $0.50 SKY77621/0-2 Power Amplifiers $4.00
$4.40
AFEM-8030 Power Amplifier Module $3.00 BCM47531A1 controller $1.00 Avago AFEM-9040 multiband multimode module $1.50
Other FBAR Filter/ Bands $2-$3 BCM43455 5G Wi-Fi/Bluetooth Controller $1.00
$6.00 $2.00
TQF6405 Power Amplifier Module $2.00 TQF6297H Power Amplifier $2.00 Qorvo QM78064 high band RF fusion module $2.00
RF5150 Antenna Switch $1.50 Qorvo TQF6260 PA duplexer
$3.50 Qorvo QM63001A diversity receive module
MDM9635M LTE Cat. 6 Modem Qualcomm QFE3100 envelope tracker
QFE1100 ET HiSilicon Processor Qualcomm QFE2550 digital tuner
RF Tranceiver/PMIC ~$20-$22 Qualcomm WTR4905 & WTR3925 transceivers
Qualcomm PM8996 & PM8004 PMICs $20.00
(Integrated into A9 processor) NXP 54802 NFC Controller $0.75 NXP 67T05 NFC Controller $0.75
NXP 1610A3 Display Controller
NXP 66V10 NFC Controller+SE $1.50
Logic/Memory/Audio Interfaces
Samsung Galaxy S7 Edge - 2016
1, 2, 3, 4, 5, 7, 8, 12
18, 19, 20, 29, 30
34, 38, 39, 40, 41
NXP
Skyworks
38, 39, 40, B41
17, 18, 19, 20, 26, 28, 34
Avago/
Broadcom
Qorvo
Qualcomm
1, 2, 3, 4, 5, 6, 7, 8, 12
iPhone 6s/6s+ - 2015
All Phones LTE-with Band700 Roaming
Added bands 12, 23, 43
Has LTE-A and MIMO
Huawei P9 - 2016
$0.00
$2.00
$4.00
$6.00
$8.00
$10.00
$12.00
$14.00
$16.00
$18.00
$20.00
iPhone 6s Huawei P9 Samsung S7 Edge
RF Content per Handset
~$15-18
~$5-7
~$10-12
Source: iFixit, Phone Arena, Mizuho Securities research
A Look at Teardowns - iPhone versus a Huawei P9 and Samsung
Galaxy S7 Edge
Huawei P9 smartphone versus Apple iPhone: As we noted above, the iPhone
drives almost 3-4x more dollar content for the RF suppliers compared to the Chinese
handset maker and about 50% more than the Korean OEM.
June 8, 2016 42Mizuho Securities USA Inc.
Apple Inc.

Exhibit 27: iPhone 6s/Huawei P9/Samsung S7 Edge Teardowns
iPhone 6s Huawei P9 Samsung Galaxy S7 Edge
Display 1334x750 resolution (326 ppi) Retina HD display w/ 3D Touch 1080x1920 (423 ppi) IPS-NEO LCD AMOLED 1440 x 2560
Chips Apple A9 APL0898 SoC + Samsung 2 GB LPDDR4 RAM Samsung KLMBG2JENB 32 Gb eMMC Flash ST Micro LSM6DS3 6 Axis IMU
Qualcomm MDM9635M LTE Cat 6 Modem Texas Instruments BQ25892 fast charging IC NXP 67T05 NFC Controller
InvenSense MP67B Gyroscope and Accelerometer Combo HiSilicon Hi6402 audio codec IDT P9221 wireless power receiver
Bosch Sensortec 3P7 Accelerometer Broadcom BCM4345 5G Wi-FI and Bluetooth 4.0 Controller Bosch BMP280 Barometer
TriQuint TQF6405 PA Module Broadcom BCM47531A1 GMSS controller Hynix LPDDR4 SDRAM
Skyworks SKY77812 PA Module NXP 54802 NFC Controller Qualcomm Snapdragon 820
Avago AFEM-8039 PA Module 3x Skyworks SkyOne front-end modules for WCDMA/LTE and FDD/TDD LTE Samsung S6SMC41X Touch Screen Controller
Qualcomm QFE1100 Envelope Tracking IC Skyworks SKY77621 Power Amplifier Avago AFEM-9040 multiband multimode module
Toshiba THGBX5G7D2KLFXG 16 GB 19nm NAND Flash CPM1.0A IC EPCOS D5287 and D5275 antenna switch modules
Universal Scientific Industrial 339S00043 Wi-Fi Module CBP8.2d CDMA Murata FAJ15 front end module
NXP 66V10 NFC Controller FCI FC7712A CDMA RF Murata KM5D18098 WiFi Module
Apple/Dialog 338S00120 Power Management IC Skyworks SKY77360-2 Power Amplifier Qorvo QM78064 high band RF fusion module
Apple/Cirrus Logic 338S00105 Audio IC 2x Hi632 RF Qorvo TQF6260 PA duplexer
Qualcomm PMD9635 Power Management IC 2x Hi6421 Qorvo QM63001A diversity receive module
Skyworks SKY77357 PA Module Qorvo TQF6297H Front-End Module Qualcomm QFE3100 envelope tracker
Murata 240 Front-End Module Altek 6610 ISP Qualcomm QFE2550 digital tuner
RF Micro Devices RF5150 Antenna Switch Hi6402 HiFi Qualcomm WTR4905 & WTR3925 transceivers
NXP 1610A3 RFMD RF7305 AKM AK0991 compass
Apple/Cirrus Logic 338S1285 Audio IC Maxim C551GY5A time of flight sensor
Texas Instruments 65730AOP Power Management IC Maxim MAX77854 & MAX 77838 PMICs
Qualcomm WTR3925 RF Transceiver Maxim MAX98506BEWV amplifier
Qualcomm WCD9335 audio codec
Qualcomm PM8996 & PM8004 PMICs
Samsung C3 image processor
Samsung S2MPB02 PMIC
Samsung S6SA552x touch controller
ST Micro L2G2IS gyroscope
Source: ifixit, Chipworks
A look at the circuit boards of the iPhone 6s and the Huawei P9.
Exhibit 28: iPhone 6s (Left)/Huawei P9 (Right) Circuit Boards
Source: Apple iFixit, Mizuho Securities research
Increasing RF Complexity with Carrier Aggregation
Another key driver with iPhone and with global handset OEMs has been the move to
Carrier Aggregation (CA). This builds on the RF complexity given limited spectrum
and band crowding with 2G, 3G, 4G radios all operating on close frequencies and
June 8, 2016 43Mizuho Securities USA Inc.
Apple Inc.

overlapping with WiFi-Bluetooth radios. That spectrum complexity drives the need
for increased RF, filter, and integrated and optimized PAD content into handsets
given multiple competing radios from 2G, 3G, 4G, WiFi, Bluetooth, NFC, and BLE
(Bluetooth low energy), among others, all operating on crowded bands and limited
spectrum. Another key driver is the increasing need for bandwidth and the need to
dynamically combine frequencies to achieve bandwidth or what is called carrier
aggregation. The key is going from 2G to 4G implies almost 2-4 times more RF
content in handsets for multimode power amplifiers, filters, switches and the need for
more optimized integrated front-ends such as PADs (power amplifiers duplexers).
Another key market ramping with connectivity is the 802.11ac Wi-Fi market. SWKS
has almost $7-$10 of Wi-Fi content on the Apple Airport Extreme. Wi-Fi with
802.11ac is another key growth market driving more front end content in routers,
iPads and iPhones.
Increasing Bandwidth Requirements, Scarce Spectrum and the
2G-4G Transition Implies 2-4x Growth in RF Content
Limited Spectrum Availability – Adding to the need for increasing bandwidth is
the complexity of limited spectrum. The multiple co-existing wireless technologies
and lack of bandwidth with scarce Spectrum availability is driving increasing RF
complexity, in our view.
That Leads us to Increasing RF spectrum by “Virtual Bandwidth” or Carrier
Aggregation (CA) and Multiple-in Multiple-Out (MIMO)…
Carrier aggregation, read band aggregation or spectrum aggregation, is a way for the
handset OEMs to virtually combine disparate or non-contiguous (read: non-adjacent)
bands, carriers, or spectrum to drive a broader virtual bandwidth. Also,
approximately 70%+ of the carrier combinations to drive bandwidth use some
combination of a 2GHz to 2.1GHz+ bandwidth, which we think is driving the need
for high performance FBAR filters (Advantage: AVGO). While a baseline LTE RF
implementation can do with two receive chains, an LTE-A could require four
additional receive chains with switches, filters and duplexers. The Rx chains are also
more complex, needing FBAR filters with high segregation and noise rejection as
multiple frequencies are combined.
June 8, 2016 44Mizuho Securities USA Inc.
Apple Inc.

Exhibit 29: Carrier Aggregation
LTE - The 44 LTE BANDS - Spread from 700MHz to 3800MHz LTE - Advanced (LTE-A) - Almost ~95 Carrier Band Combinations
The 3GPP Rel-12 recommendation of Bands to Drive 100MHz Bandwidth
FDD LTE Bands & Frequencies TDD LTE Bands & Frequencies CA Band E-UTRA Band Requested By CA Band E-UTRA Band Requested ByLTE Downlink (MHz) Width of LTE Allocation Width of
CA_1-3 1 + 3 China Unicom CA_1-3-5 1 + 3 + 5 SK Telecom
1 3510 - 3600 90 33 1900 - 1920 20 CA_1-7 1 + 7 LGU + CA_1-3-8 1 + 3 + 8 KT
2 2110 - 2155 45 34 2010 - 2025 15 CA_1-8 1 + 8 Softbank CA_1-3-19 1 + 3 + 19 NTT DOCOMO
3 2110 - 2170 60 35 1850 - 1910 60 CA_1-11 1 + 11 Softbank CA_1-3-20 1 + 3 + 20 Vodafone
4 2110 - 2170 60 36 1930 - 1990 60 CA_1-18 1 + 18 KDDI CA_1-5-7 1 + 5 + 7 LGU +
5 2180 - 2200 20 37 1910 - 1930 20 CA_1-26 1 + 26 KDDI CA_1-7-20 1 + 7 + 20 Vodafone
6 2350 - 2360 10 38 2570 - 2620 50 CA_2-4 2 + 4 TMO-US CA_1-19-2 1 + 19 + 2 NTT DOCOMO
7 2585 - 2600 15 39 1880 - 1920 40 CA_2-5 2 + 5 AT&T CA_1-42-4 1 + 42 + 4 NTT DOCOMO
8 2600 - 2620 20 40 2300 - 2400 100 CA_2-12 2 + 12 US Cellular CA_2-2-13 2 + 2 + 13 Verizon Wireless
9 2620 - 2690 70 41 2496 - 2690 194
10 1475.9 - 1500.9 20 42 3400 - 3600 200 CA_2-13 2 + 13 Verizon CA_2-4-4 2 + 4 + 4 TMO-US
11 1495.5 - 1510.9 15 43 3600 - 3800 200
12 1525 - 1559 34 44 703 - 803 100 CA_3-19 3 + 19 NTT DOCOMO CA_2-4-5 2 + 4 + 5 US Cellular
13 1805 - 1880 75 CA_3-20 3 + 20 Telekom Austria CA_2-4-13 2 + 4 + 13 Verizon Wireless
14 1844.9 - 1879.9 35 CA_3-26 3 + 26 KT CA_2-5-12 2 + 5 + 12 US Cellular
15 1930 - 1990 60
16 1930 - 1995 65 CA_3-27 3 + 27 KT CA_2-5-30 2 + 5 + 30 AT&T
17 462.5 - 467.5 5 CA_3-28 3 + 28 eAccess CA_2-12-12 2 + 12 + 12 AT&T
18 717 - 728 11 CA_4-12 4 + 12 TMO-US CA_2-12-3 2 + 12 + 3 AT&T
19 728 - 746 18 CA_4-27 4 + 27 NII Holdings CA_2-29-3 2 + 29 + 3 AT&T
20 734 - 746 12 CA_5-7 5 + 7 LG Uplus CA_3-3-7 3 + 3 + 7 TeliaSonera
21 746 - 756 10 CA_5-25 5 + 25 US Cellular CA_3-7-7 3 + 7 + 7 Orange, DT
22 758 - 768 10 CA_7-20 7 + 20 Telekom Austria CA_3-7-20 3 + 7 + 20 Vodafone
23 758 - 803 45 CA_7-28 7 + 28 Telefonica CA_4-4-12 4 + 4 + 12 TMO-US
24 791 - 821 30 CA_8-11 8 + 11 Softbank CA_4-4-13 4 + 4 + 13 Verizon Wireless
25 852 - 869 17 CA_8-20 8 + 20 Vodafone CA_4-5-12 4 + 5 + 12 US Cellular
26 859 - 894 30 / 40 CA_12-2 12 + 2 US Cellular CA_4-5-30 4 + 5 + 30 AT&T
27 860 - 875 15 CA_19-2 19 + 2 NTT DOCOMO CA_4-12-14 4 + 12 + 14 AT&T
28 869 - 894 25 CA_20-3 20 + 3 (in UTRA CA_4-12-3 4 + 12 + 3 AT&T
29 875 - 885 10 CA_23-2 23 + 2 Dish CA_4-29-3 4 + 29 + 3 AT&T
30 875 - 890 15 CA_39-4 39 + 4 CMCC CA_19-42- 19 + 42 + NTT DOCOMO
31 925 - 960 35 CA_41-4 41 + 4 China Unicom, China Telecom
~ 95 CA Band Combinations
95% of LTE Bandshave Less than100 MHz Bandwidth
RF Complexity1,2,4 Band Aggregation
Source: 3GPP.org, Rel-12 for Carrier Aggregation in LTE-A, Mizuho Securities USA estimates
June 8, 2016 45Mizuho Securities USA Inc.
Apple Inc.

Increasing Base Station Content
2016-2017: Carrier Aggregation. While handset OEMs in 2016-17E will continue
to adopt CA and MIMO to drive broader virtual 100MHz bandwidth and another 20-
50% increase in RF content, another key area of content growth is the 4G base
station.
Base station carrier aggregation is key in the advancement of smartphone
capabilities. HKT (Hong Kong Telecom) noted it is expanding on its mobile
networking with plans to increase base station bandwidth by 50% in 2016. The
company is advancing its network to 450Mbps, up from 300Mbps, allowing handset
OEMs to obtain the higher network speeds demanded by consumers. We believe this
is but one example as increased 4G adoption, increased data traffic, and the cloud
will all drive increased base station spending and content growth.
China is expected to have almost 600-700K 4G base stations in 2016, up from 400K
in 2015. We believe the increasing adoption of 4G and smartphones positions China
for increased carrier aggregation and integrated front ends in the handset and base
station markets.
Exhibit 30: Base Station Carrier Aggregation
Source: HKT Company reports, Mizuho Securities USA research
A Tailwind with Potential China Subsidies?
Handset Subsidies in China from the Telecom carriers have seen a significant
decline, with the 3-year directive from the China Government in 2013-14. With
2015/16 being the last of the years for the subsidy controls, we believe there could be
a potential for 2017 subsidies to start increasing again and drive handset growth in
China. The subsidy reduction was mostly implemented to drive fair competition
among handset OEMs and carriers and lasts through 2016. But we believe a slowing
China handset market with multiple competing China handset OEMs in a slowing
handset market, could imply the need for a return of subsidies to drive further
June 8, 2016 46Mizuho Securities USA Inc.
Apple Inc.

adoption. Also, near-term slowing and more seasonal 4G adoption trends in China
could be a potential catalyst to revive carrier and OEM handset subsidies. While this
should be a positive for the handset OEMs, including Apple, and the RF component
suppliers from a unit perspective, it could also entail some pricing pressure in the
supply chain and continued pressure on potential licensing models such as QCOM.
We could also see handset OEMs move to more indigenous or cheaper solutions, to
sidestep license payments on slim handset margins.
We believe that after 3 years of weakening phone subsidies in China, there is an
opportunity for rebound in 2017 that could be a potential tailwind for the smartphone
suppliers to drive an increased adoption and a faster replacement cycle in China. The
initial directive was issued for 3 years and ends in 2016. With no subsequent new
directive reducing subsidies yet, we believe there is an opportunity for China carriers
to implement subsidies again to drive handset adoption and a faster replacement
cycle, which could be a potential tailwind for the smartphone suppliers.
Exhibit 31: Room for 2017 China Subsidies to Grow
13,31320,026 21,997 21,000
11,100 11,000
5,795
6,1027,798
4,645
2,847 2,800
15,641
21,75422,795
15,340
11,620 11,230
0
10,000
20,000
30,000
40,000
50,000
60,000
2011 2012 2013 2014 2015 2016E
CN
Ym
China Subsidies
CM CU CT
Source: Company reports, Mizuho Securities Asia research
The iPad
Below we look at the teardowns of an iPad 2, released in March of 2011, versus an
iPad Air 2, released in October 2014. While the display, memory and force touch and
display sensors account for ~50% of the bill of materials of an iPad, the need for
bandwidth also implies the need for a strong RF front end, security, and seamless
connectivity with other Apple platforms such as the iPhone.
The iPad Air 2 has the more powerful A8X processor versus the iPad 2’s A5 dual-
core processor. The newer Air 2 also has more memory: 2 GB LPPDR3 RAM versus
the iPad 2’s 512 MB DDR2 RAM.
June 8, 2016 47Mizuho Securities USA Inc.
Apple Inc.

Exhibit 32: iPad Air 2 vs. iPad 2 Teardown
iPad Air 2 iPad 2
Display IPS Multi-Touch LCD 2048x1536 resolution at 264 ppi 1024x768 LED with IPS
Chips Parade Technologies LCD Driver Broadcom BCM 5973KBFGH Microcontroller
Texas Instruments LCD Bias Solution for LCD Broadcom BCM5974CKFBGH touchscreen controller
Apple A8X 64-bit processor Broadcom BCM43291HKUBC Wi-Fi/Bluetooth/FM
Elpida/Micron Technology 8 Gb (1GB) Ram Apple A5 dual-core processor
SK Hynix 128Gb (16 GB) NAND Flash Toshiba 16 GB NAND Flash
NXP 65V10 NFC Controller Apple 343S0542 Power Management
Apple Audio Codec Texas Instruments G1 touchscreen line driver
NXP ARM Cortex-M3 Microprocessor S6T2MLC Power Management IC
Murata Wi-Fi Module Apple Audio Codec
Maxim Integrated Boosted Class Amplifier ST Micro 2103 gyroscope
Broadcom Digitizer Controller ST Micro LIS331DH accelerometer
Texas Instruments 343S0583
Fairchild FDMC 6683 and FDMC 6676BZBosch Sensortec Barometer BMP280 Accelerometer BMA280
Source: iFixit, Mizuho Securities USA research
Increasing iPad Memory and RF content. The iPad also drives significant content.
Similar to the iPhone, we note that the iPad through multiple generations has
continued to drive RF content. Below, we look at the circuit board of an iPad Air 2
using Apple’s A8X processor.
Exhibit 33: iPad Air 2 Circuit Board
Source: The Inquirer
Apple Watch
Apple Watch versus Samsung Gear Watch teardown. This new product category
has been another driver of connectivity, security, and mobility components.
June 8, 2016 48Mizuho Securities USA Inc.
Apple Inc.

Exhibit 34: Apple Watch versus Samsung Gear Watch
Apple Watch Samsung Gear
312x390 resolution (42 mm) 320x320 resolution (278 ppi)
ST Micro C451 gyroscope + accelerometer Maxin Integrated MAX77836 Low Voltage Input
Analog Devices AD7166 ARM Cortex M3-based toucschreen controller Broadcom BCM4334W Bluetooth 4.0/802.11a/b/g/n WiFi/FM
Texas Instruments OPA2376 Op Amp ST Micro STM32F401B Arm Cortex M4 MCU
NXP NFC Controller PN548 Samsung 512MB DRAM w/ Qualcomm APQ8026 SoC
Apple APU APL 0778 Qualcomm PM8226 power management IC
ST Micro STM32 MCU InvenSense MP92M 9-axis gyro+accelerometer+compass
IDT P9022 wireless charger Cypress CYTMA545 touchscreen controller
Maxim audio amp
ADI AD7149 touch controller
Dialog PMU D2238A
Skyworks Wi-Fi LNA + switch and PA
Broadcom BCM 43342
Source: iFixit, Mizuho Securities research
iPhone Bill of Materials
As shown in the chart below, the bill of materials for the iPhone is increasing as
models become more advanced, which is to be expected. We believe the cost to
produce an iPhone has almost doubled between the iPhone 4 and the most recent
iPhone 6S, and is now approaching $250 in materials. As consumers demand larger,
more powerful, and sharper iPhones, the key advancements driving these costs we
believe are: Processors (from $14 to $36); connectivity (from $3 to $24); and the
display (from $22 to $43). We believe this to be a positive for the iPhone supply
chain, as trends continue to show increased content with newer models.
Exhibit 35: iPhone Bill of Materials
$126.50
$189.75
$217.00$211.50
$227.00
$245.00
$0
$50
$100
$150
$200
$250
4 4S 5 5S 6 6S
iPhone BOM by Model
Display/Touchscreen
Battery
Camera
Connectivity
NAND
SDRAM
Processor
BB+XCR
Power Management
Non-Electric
Other
Supporting Materials
Assembly
Source: TechInsights, Mizuho Securities USA estimates
June 8, 2016 49Mizuho Securities USA Inc.
Apple Inc.

iPad Bill of Materials
A look at the bill of materials for the iPad shows modestly higher costs than an
iPhone, which can be expected given the increased size of the iPad. As shown, the
amount of NAND required differs per model, the key driver in the change of costs
between the 16GB/64GB/128GB models. The cellular version of the iPad Air 2 also
has additional wireless components versus the WiFi only model, driving costs higher,
but also allowing for higher retail sales, driving margins.
Exhibit 36: iPad Bill of Materials
Source: TechInsights, IHS
Changes are Coming… Displays and Components that Could Be
Brought In-House
With Apple’s size and cash supply, the company could very well bring a number of
components in-house. While it has started doing some insourcing already with its A9
and next gen A10 processors, the next step would be, we think, for Apple to produce
its own modem. The company could also begin producing its own display
technology, especially as it is believed to be transitioning to OLED for future
models. Currently, display technology is provided by Synaptics, who has no clear
path to an OLED solution at this time.
Within the RF chain, while it is possible that Apple could also do its own RF: the
company has recently signed a 3-year supply agreement with AVGO, potentially
signaling it has little near-term interest in bringing RF in-house, at least in the near to
mid-term, focusing we believe more on displays, storage, and application processors.
June 8, 2016 50Mizuho Securities USA Inc.
Apple Inc.
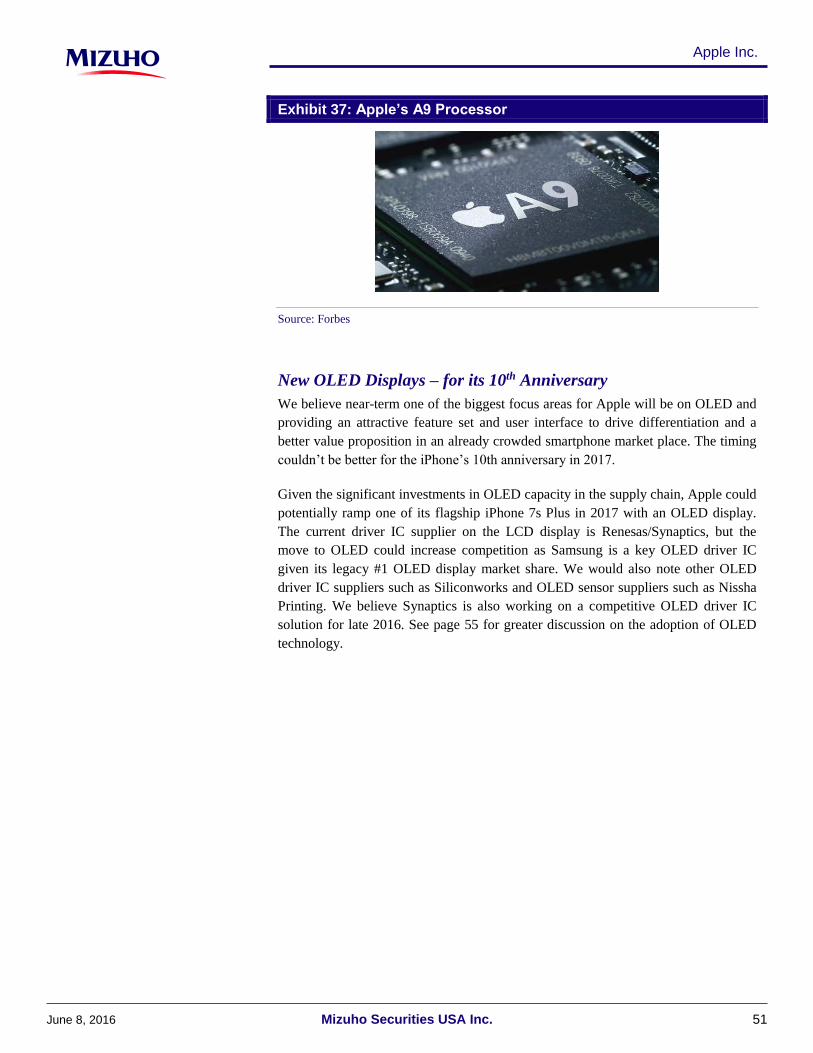
Exhibit 37: Apple’s A9 Processor
Source: Forbes
New OLED Displays – for its 10th Anniversary
We believe near-term one of the biggest focus areas for Apple will be on OLED and
providing an attractive feature set and user interface to drive differentiation and a
better value proposition in an already crowded smartphone market place. The timing
couldn’t be better for the iPhone’s 10th anniversary in 2017.
Given the significant investments in OLED capacity in the supply chain, Apple could
potentially ramp one of its flagship iPhone 7s Plus in 2017 with an OLED display.
The current driver IC supplier on the LCD display is Renesas/Synaptics, but the
move to OLED could increase competition as Samsung is a key OLED driver IC
given its legacy #1 OLED display market share. We would also note other OLED
driver IC suppliers such as Siliconworks and OLED sensor suppliers such as Nissha
Printing. We believe Synaptics is also working on a competitive OLED driver IC
solution for late 2016. See page 55 for greater discussion on the adoption of OLED
technology.
June 8, 2016 51Mizuho Securities USA Inc.
Apple Inc.

Checks from Japan Indicate Slower than Usual Momentum behind Next iPhone Launch
(Contributed by Yasuo Nakane and Goto Fumihide; Mizuho Securities Japan:
Originally published as part of “iPhone production forecast update” on April 28,
2016)
Our Japan analysts recently updated expectations from the supply chain and offered a
top down view on potential iPhone demand based on the global macro environment.
We note that our Japan team analyzes a large number of global companies involved
in iPhone components, materials, production equipment, assembly and distribution.
Based on their checks, it seems like Apple is more focused on profitability with the
iPhone 7 cycle and is very cautious about the level of new functionality being added
to the devices. As such, the upcoming product cycle might not have enough new
capabilities to drive significant upgrade volume.
Our team continues to believe that procurement in the March quarter was likely
around 40 million unit range as Apple seems to be aggressively focused on
consuming the excess quantity that it had procured in the 2Q-4Q15 period. For
C2Q16, overall assembly volume forecast seems to be around 37 million (-44% year-
over-year or -7% sequentially). By model, the forecast assumes 22 million units for
the 6 and 6s, 8 million units for the 6 Plus and 6s Plus, and 7 million units for the 5s
and SE models. For the full year 2016, procurement forecast calls for about 190
million units, which would be down 25% year-over-year. The full year forecast
assumes about 78 million iPhone 7 units, which is in line with the number quoted by
some recent media articles. Our team’s risk scenario indicates that downside risk to
shipments is about 180 million units. We believe it is hard to nail down exact
shipment numbers this early in the year as situation is evolving, but it seems clear to
us that iPhone 7 will likely not be a runaway success like iPhone 6 was. The
following table highlights our Japan team’s current estimates for iPhone assembly
volume.
Exhibit 38: End Product Assembly Volume for iPhones (Calendar Years)
2016
1Q15 2Q15 3Q15 4Q15 1Q16E 2Q16E 2H16E Minimum
iPhone 6 + 6S + 7 (4.7") 34 39 32 46 24 22 62 59 150 108 105
iPhone 6 Plus + 6S Plus + 7 Plus (5.5") 13 14 12 24 10 8 33 27 63 50 48
iPhone 5S + 5C + 5 + SE (4.0") 11 12 7 5 6 7 18 124 83 36 31 28
iPhone 4S 2 1 0 0 0 0 0 31 24 3 0 0
Total iPhone Assembly 60 66 51 75 40 37 113 155 193 252 189 181
year-over-year 60% 83% 34% -8% -34% -44% -10% 15% 25% 31% -25% -28%
quarter-over-quarter -26% 9% -22% 47% -47% -7%
2015 20162013 2014 2015 2016E
Source: Mizuho Securities Japan
June 8, 2016 52Mizuho Securities USA Inc.
Apple Inc.

Macro Approach Indicates 2016 iPhone Shipments Could Be
Around 190-195 Million
In a detailed report “iPhone production forecast update” published on March 10,
2016, our Japan team took a macro approach to estimating demand. After thoroughly
analyzing the shipments as replacement demand and new sales, the team further
estimated the effect of changes to the replacement cycle in order to come up with
estimates for 2016 unit volume. The handset replacement data reported by Verizon
and T-Mobile indicates that replacement cycles are most likely elongating. The chart
below shows changes in postpaid subscriber handset replacement rates at Verizon
and T-Mobile US. The replacement rates can be seen rising sharply in 4Q14
following the launch of the iPhone 6. The large uptick was driven by an increase in
promotional offers, stemming from increased competition among carriers trying to
poach subscribers, which occurred while replacement demand was increasing as a
result of the new model’s larger screen and enhanced 4G capabilities.
Exhibit 39: Handset Replacement Rates Among Postpaid Subscribers (VZ and TMUS)
4.0%
5.0%
6.0%
7.0%
8.0%
9.0%
10.0%
11.0%
12.0%
1Q12 2Q12 3Q12 4Q12 1Q13 2Q13 3Q13 4Q13 1Q14 2Q14 3Q14 4Q14 1Q15 2Q15 3Q15 4Q15 1Q16
Verizon T-mobile
iPhone 5 iPhone 5S iPhone 6 iPhone 6S
Source: Company data, Mizuho Securities USA estimates
However, the replacement rates at both Verizon and T-Mobile US started falling in
4Q15 following the launch of the iPhone 6s. It seems as though that replacement
demand ran out of steam because the pull of the larger screen and 4G capabilities
was no longer in play and handset functionality had reached a certain level of
maturity. If the decline in the replacement rate seen in 1Q16 (a roughly 1 percentage
point drop year-over-year) persists in the second half of 2016, then the 2016
replacement cycle at Verizon and T-Mobile US would be around 0.4 to 0.5 years
longer than the 2015 cycle. In other words, recent data from the US telecom carriers
implies that replacement demand could be even lower (i.e., the replacement cycle
June 8, 2016 53Mizuho Securities USA Inc.
Apple Inc.

would be even longer) than initially anticipated. Based on the updated data points for
replacement cycle, iPhone unit demand could end up around 190-195 million phones,
which would indicate slight risk to our current iPhone sell-in estimate of 200 million
units while we continue to monitor the supply chain and demand environments.
June 8, 2016 54Mizuho Securities USA Inc.
Apple Inc.

Apple May Shift Drastically Toward OLED in 2017; Potential for Risks/Obstacles
(Contributed by Yasuo Nakane; Mizuho Securities Japan: Originally published
as part of “Analyzing the adoption of OLED in the iPhone” on June 1, 2016)
Why OLED and What is the Expected Timetable?
One reason Apple will most likely adopt OLED technology for the iPhone is because
it facilitates greater form/appearance design flexibility compared with LCD. A
typical example is “foldable” panels that employ flexible substrates. We are not at all
surprised that Apple, which emphasizes appearance as well as performance, has
decided to adopt OLED technology that allows greater design flexibility. The
following is the expected timetable for OLED adoption. Under a quick-rollout
scenario, we envisage Apple initially using OLED in high-end models above the
iPhone 7s Plus (e.g., 5.8” version) in 2017, then expanding its use to 4.7” and 5.5”
iPhone 8 models in 2018, and finally adopting it in all iPhone 8s models (including
4.0”) in 2019. We think OLED will be used principally for curved panels at best
through 2019, and given Apple’s stringent quality requirements, we do not expect so-
called foldable panels until 2020 at the earliest. As for OLED technology, we expect
Apple to adopt the “RGB vapor deposition utilizing low-molecular EL materials”
process. Considering that major panel makers’ investment in production capacity will
likely overwhelm the level necessary for iPhone use, we believe Apple may
eventually adopt OLED for products like the iPad and MacBook as well.
Value Chain Benefits: First Equipment, Then Materials
Samsung Display, LG Display, Japan Display, and Sharp are all investing in capacity
to supply displays for the iPhone, and although not related to the iPhone, Chinese
makers (BOE, CSOT, Tianma) are also planning to invest in plant capacity through
2020, so value chain energy should remain high. Specifically, suppliers of OLED
manufacturing equipment (e.g., steppers, ion injectors, and other TFT front-end
equipment; vapor depositions systems and other OLED-related equipment; peripheral
equipment such as conveyor systems; modules, testers, and other back-end
equipment; laser lift-off systems and other equipment necessary to produced flexible
OLED) will benefit first. Thereafter, suppliers of key materials (luminescent
materials, flexible substrate, transparent electrodes, metal masks, etc.), external touch
panels, etc., should benefit. On the other hand, these new developments will
adversely affect makers of LCD-oriented equipment, including equipment related to
cell-process, backlights, and polarizers (from 2 for LCD to only 1 for OLED).
OLED Panel Supply Structure
Regarding our supply capacity assumptions, we currently estimate that by 3Q
CY2018 (commercial production of iPhone 8), Samsung Display (SDC) will have G6
substrate capacity of around 90K/M, and LG Display (LGD) will have capacity of
around 30K/M (K/M=thousand substrates per month). Additionally, we think JDI
could have production capacity of 15K/M–45K/M by 3Q CY2019, and Sharp could
have capacity of 50K/M by the following year. Accordingly, combined capacity by
June 8, 2016 55Mizuho Securities USA Inc.
Apple Inc.

3Q CY2018 could total over 270M/year (5.5” equivalent), which would be enough to
handle production for all current models, and total capacity could jump to
310M/year–380M/year (M=million units) by 3Q CY2019. Adding in Sharp’s
capacity, total production capacity should easily exceed 400m units per year
(425M/year–495M/year) by 3Q CY2020.
Samsung Display (SDC): Rapidly Expands A3 Plant
On the panel supply side, the participation of Samsung Display (SDC) is
indispensable. SDC has not supplied panels for the iPhone to date, so it will be a new
entrant. South Korean media have reported that SDC and Apple have inked a long-
term contract. The accuracy of those reports is unclear, but it is natural to assume that
a long-term agreement is in place. SDC is expected to meet the demand by
expanding its A3 plant (G6 substrate; G6 Half deposition). The plant’s current
production capacity is only 15K/M, but it is expected to be increased to 150K/M–
180K/M by 3Q 2018, with 90K/M of the total capacity dedicated to production for
the iPhone. Capacity of 90K/M is equivalent to over 200m 5.5” panels annually.
Although it depends to some degree on Apple’s requirements, we think SDC should
be able to supply panels for 2017 iPhone models, as it dominates the field in
development, design, and mass production technology, and has also finished sourcing
and ordering the necessary production equipment. Accordingly, SDC will likely be
the exclusive supplier for 2017 iPhone models.
LG Display (LGD): First E5 Plant at Kumi, Then Expansion to
Paju
The second largest player is LG Display (LGD). LGD uses the G4.5 substrate size,
but has mass produced displays for the Apple Watch. The company is currently
building an E5 plant on the site of its P6 plant in Kumi, and plans to invest in roughly
15K/M of G6 production capacity. LGD is also expected to invest in another E6 plant
in Paju, where multiple 15K/M production lines will be set up. The company should
have up to 30K/M of production capacity by 3Q 2018. In other words, we expect
LGD to supply OLED panels to Apple starting with 2018 models (iPhone 8).
Production capacity of 30K/M is equivalent to around 70m 5.5” panels annually, but
since the E5 plant will not be dedicated exclusively to Apple production, the actual
volume supplied to Apple should be less than 70M/year. We see some risk of
bottlenecks for two key reasons: first, LGD does not have commercial production
experience with G6 half-size vapor deposition systems, and second, the vapor
deposition equipment to be deployed at the E5 plant is likely to be Korean-made
equipment with no mass production track record.
Japan Display (JDI): From Ishikawa (G4.5) to Mobara (G6)
The third major player is Japan Display (JDI). With respect to OLED, JDI is one step
behind LGD. At its plant in Ishikawa, JDI is in the process of converting its G4.5
prototype line from white OLED to RGB deposition, and will soon commence trial
production. In a best-case scenario, JDI will set up a G6 Half line at its Mobara plant
(J1) and commence production from 3Q 2017, then establish a commercial
June 8, 2016 56Mizuho Securities USA Inc.
Apple Inc.

production line in 1H 2018 and commence commercial production sometime during
2018. JDI will likely supply displays for the iPhone starting with 2019 models
(iPhone 8s) rather than 2018 models. Production capacity will probably depend on
JDI’s own cash flow, financing situation, and possible financial support from Apple,
but we estimate capacity of between 15K/M and 45K/M.
Sharp: First Step is G4.5 Trial Production Line
The final player we discuss is the Sharp/Hon Hai Group alliance. They still lag well
behind the aforementioned three players, and have not even invested in a trial
production line yet. Sharp’s activity to date is limited to small-scale R&D (for
purposes of benchmarking vs. LCD) by its Tenri-based R&D team, and although Hon
Hai Group has a G3.5 prototype line at the former Toppoly (now Innolux), it has not
yet reached the commercial production stage. After receiving a capital injection from
Hon Hai Group, the best-case scenario we envisage for Sharp is the commencement
of G4.5 trial production in 3Q CY17, the commencement of G6 trial production in
2Q CY18, and the commencement of G6 commercial production (around 50K/M) in
2Q CY19. However, there are still financial as well as technological hurdles.
Including investment in LTPS substrate production capacity (regarding G6, Sharp has
only the Kameyama No.1 plant’s 22K/M of capacity, so additional investment is
needed), the company needs to invest around ¥400b–¥500b, which means it will need
another capital injection from Hon Hai. We believe 2020 is the earliest Sharp will be
ready to start supplying displays for the iPhone. Capacity of 50K/M is equivalent to
just over 100m 5.5” panels per year.
Focus on Adoption in 2017 Models
We currently envisage a 2017 model mix comprising an SE (4.0”/LCD), iPhone 7s
(4.7”/LCD), iPhone 7s Plus (5.5”/LCD), and a new model (5.8”/OLED). In this case,
we would expect panel demand for the new model to total around 20M–30M,
although it would depend on the phone’s retail price. However, based on overall
activity across the value chain, it seems that Apples’ production capacity demands are
premised on volume exceeding 100M. If so, it is conceivable that Apple might omit a
5.5” LCD model and instead release the iPhone 7s Plus with a 5.8” OLED display.
Under that scenario, the 5.5” LCD version’s share of demand (roughly 50M) would
shift over, potentially boosting panel demand related to the 5.8” OLED model to
70M–80M. This, of course, would be a huge tailwind for the OLED value chain, but
it would severely hurt the LCD value chain. Based on trends to date, the model
lineup will probably be settled around March 2017, and we caution that Apple’s 2017
model composition could have a significant impact on both the LCD camp and the
OLED camp.
OLED Hurdles: Image Sticking, Power Consumption, Life Span
The three main question marks with respect to OLED technology are image sticking,
power consumption, and life span. The majority of Samsung Electronics’ smartphone
models currently feature OLED panels, so there is verifiable evidence that
smartphones with OLED displays withstand everyday use. However, displaying the
June 8, 2016 57Mizuho Securities USA Inc.
Apple Inc.

same image continuously can cause image sticking (burn-in), which in one sense is a
fundamental problem with self-lighting displays. Premised on its use of OLED
panels, Samsung Electronics is overcoming the drawbacks of OLED technology
through ingenuity in both its displays and phone bodies. Apple basically intends to
buy OLED displays essentially as a single iPhone component, and thus will likely
have little tolerance for image sticking, which is not a major problem with LCDs. It
is conceivable that Apple might ultimately stop procuring panels from a particular
supplier if those panels fail to meet Apple’s quality standards. As that poses a risk
even to SDC, we caution that it could potentially be an even larger obstacle to
membership in the iPhone value chain for relative late-comers such as LGD and JDI.
Meanwhile, overcoming the problem of image sticking will be even more difficult
with respect to tablets, notebook PCs, and other applications that have larger screens
and regularly display still images and/or white backgrounds. We will therefore
continue to monitor related technology trends closely.
Refer to Appendix on page 98 for our outlook for various displays and panel makers’
capacity expansion plans in Japan and South Korea.
June 8, 2016 58Mizuho Securities USA Inc.
Apple Inc.

Apple’s Position in Services/Applications Does Not Seem as Exciting as Focused Players
Apple generated around $30 billion in revenues (about 13% of total sales) from
services and other products in its fiscal 2015. While some hardware devices like
Apple TV and accessories contributed about $10 billion, iTunes, software and other
Internet based services generated about $20 billion in sales. The company’s
accessories’ business is likely to remain tied to its other segments and is unlikely to
be a major profit driver in the near-term, in our view. However, we believe its
services/software business can be more profitable over time, especially as it has a
very loyal base of customers who arguably have greater propensity to spend versus
other eco-systems. We note that the company has about 500 million iPhone users
globally who purchase music or applications from its App Store, resulting in
revenues for Apple. Apple charges its partners 30% of total revenues from
music/application sales. The following chart shows the company’s services revenue
on a quarterly basis and its services revenue per iPhone installed. We calculated the
iPhone installed base using prior 2.5 years of shipments with the assumption that the
average life of iPhones is about 2.0-2.5 years. As Exhibit 40 shows below, after
growing slower than its iPhone installed base initially, Apple’s services revenues
have matched the growth in iPhone shipments more recently, resulting in relatively
flat per-user spending over the past year. Apple’s services revenue per device
installed has been declining as a trend line as new users are likely coming in at the
lower end of the market and their propensity to spend on services is likely lower than
earlier adopters of the platform. However, management seems to be very focused on
monetizing its installed base and seems likely to take steps to revert the trend. We
have seen some flat-lining in the average spend per iPhone installed over the last year
and a half.
June 8, 2016 59Mizuho Securities USA Inc.
Apple Inc.

Exhibit 40: Services Spending per iPhone User
$-
$10
$20
$30
$40
$50
$60
$70
-
100
200
300
400
500
600
2Q13
3Q13
4Q13
1Q14
2Q14
3Q14
4Q14
1Q15
2Q15
3Q15
4Q15
1Q16
2Q16
iPhone Installed Base Services Revenue per iPhone
Source: Company data, Mizuho Securities USA estimates
Below we discuss Apple’s various offerings and how they compare with other
solutions in the market. We do not disagree with the potential for Apple to monetize
its installed base, but we are not sure about its ability to move the needle for the
company.
iTunes – Song/Media/Application Downloads: Tough to Compete
Against Pure-play Vendors
Apple became a dominant player in the music industry due to the success of its iPod
offering. The company was one of the first to build a music player that did not rely
on traditional media such as CDs or cassettes and instead built a robust eco-system
around its iTunes offering. Apple was possibly the first company to convince record
labels to adopt online distribution via the Internet and, thereby, became a leading
music distributor before the arrival of several competing music streaming services.
According to the IFPI’s Global Music Report, the music industry saw $15 billion in
revenue in 2016 with the digital channel (downloads and streaming) accounting for
about $7 billion (up 10% year-over-year). We note that Apple collects 30% of
revenues generated from the sale of songs. With the advent of iPhones and iPads, the
company further expanded its offerings from music to videos and books with
purchased media available across all devices in its product portfolio.
Given Apple’s long history in digital music, it has dominant market share in the
traditional download market. However, over the past five years the market has
shifted away from purchasing music to streaming music, and Pandora quickly
became one of the top grossing apps on both the App Store and Google Play. In
2013, Apple tried to enter the streaming radio market with iTunes Radio, a free
Internet radio service, featuring over 200 stations, with songs based on music that
June 8, 2016 60Mizuho Securities USA Inc.
Apple Inc.

users downloaded from iTunes. Initially, Apple gained nice traction, trumping
Spotify in the U.S. in terms of listenership share, but was behind Pandora and
iHeartRadio. The trend toward streaming has only intensified on the back of adoption
of rising 4G penetration due to reductions in prices of data plans and changing
business models in the media industry. This has meant increasing popularity of
Spotify as users gravitate away from permanent downloads and an “ad-supported”
streaming music model to a paid (ad-free), “pick what you want and all you can eat”
streaming music model. The company has responded with its own streaming
offering, Apple Music, rolling its iTunes Radio offering into the service. Apple
Music is priced at $9.99 per user per month for unlimited access to its library of over
35 million songs. On the F2Q16 earnings call, management stated that paid Apple
Music subscribers was 13 million up from 11 million in the prior quarter. This
compares to 30 million paid subscribers at Spotify. We estimate that this paying
subscriber base amounts to around $1.5 billion in incremental revenues in the
Services segment. However, as Exhibit 42 indicates, several pure-play vendors such
as Spotify, Pandora, Netflix and Amazon Prime have already established strong
franchises in the space and Apple may find it challenging to take meaningful share
despite recent incremental traction.
Further, as the mix shifts from upfront sales to a more ratable revenue stream, we
expect the company’s revenues from music sales to keep coming under pressure as
the market shifts toward online streaming.
Exhibit 41: Comparison of Online Streaming Music Services
Subscribers
(millions)Price per Month
Number of
Songs (millions)
Free
Service
Ad
SupportedAudio Quality
Select
Streaming
Apple Music 13$9.99, $14.99
(Family Plan)37 Partial No 256 kbps Yes
Amazon Prime Music -- $10.99 >1 No No 256 kbps Yes
Google Play Music -- $10 35 Yes On Free 320 kbps Yes
Pandora3.9 Paid
(81 Active)Free w/ Ads; $4.99 >1 Yes On Free 64-192 kbps No
Spotify30 Paid
(100 Active)
Free w/ Ads
(10hrs/mon); $9.99>20 Partial On Free 160-320 kbps Yes
Tidal 3 $9.99; $19.99 HiFi 25 No No 1411 kbps Yes
Sound Cloud 150$7 Pro; $15 Pro
Unlimited100 Yes Yes 128 kbps Yes
Source: Company reports, Mizuho Securities USA estimates
We note that growth in users has been strongest with Spotify, per comScore data.
Apple certainly has an advantage in its ability to attract consumers from its installed
base of iPhone, iPad and even existing iTunes users. However, the service’s
June 8, 2016 61Mizuho Securities USA Inc.
Apple Inc.

relatively slow uptake, in our view, is likely due to a lack of social media
functionality. Gen Z and Millennials tend to gravitate to Spotify because they get to
listen to what they want and when they want it, and they can download music on the
go, all of which Apple Music allows. However, Spotify’s feature set allows sharing
of music and playlists and functionality to post playlists to social media outpaces
Apple Music, which may be the reason behind slower user growth on the platform.
Exhibit 42: Music Streaming Services’ Growth Trends (Monthly Unique Visitors)
Source: comScore Mobile Metrix, Mizuho Securities USA estimates
Online Storage: Offers Revenue Potential but Tough to Scale in a
Profitable Manner
Apple offers iCloud storage for its users to save their data in the cloud. The service
primarily competes with Google Drive, Dropbox and Microsoft OneDrive. The
company has been able to gain penetration as a result of cross-selling to its existing
installed base across iOS and Mac. iPhone users likely see convenience in backing
up, storing and sharing their photos and other media files using the iCloud service.
While the company can gain meaningful share in the space, we note that online
storage service is very difficult to scale. Unlike music where it can store a single
copy of music and refer to it across its installed base, the company cannot realize
synergies from storing users’ individual data. As such, we expect the service to be
less profitable. Further, as cloud storage becomes commoditized with ever-
decreasing prices from Amazon S3 and Microsoft Azure, emerging vendors focused
on the collaboration aspect of sharing media have come to market in larger numbers.
A comparison of cloud storage shows the price-competitive nature of the market.
June 8, 2016 62Mizuho Securities USA Inc.
Apple Inc.

Exhibit 43: Comparison of Cloud Storage Services (Monthly Pricing)
Free 50 GB 100 GB 200 GB 1 TB File Size Limit Note
iCloud 5 GB $1 -- $3 $10 15 GB
Amazon Cloud Drive -- -- -- -- -- 2 GBUnlimited Photos $12/year + 5 GB
$60 for unlimited storage
Box 10 GB -- $10 -- --250 MB Free
or 5 GBEnterprise geared platform
Drop Box 2 GB -- -- -- $1010 GB
(w/ website)Provides 30 days access to deleted files
Google Drive 15 GB -- $2 -- $10 5 TB Can be extended to 30 TB
Microsoft OneDrive 5 GB $2 -- -- $7 10 GB 1 TB plan comes with Office 365
Source: Company reports, Mizuho Securities USA estimates
Video Devices & Services: Lost its Initial Advantages to Strong
Competition
Another area where Apple has fallen behind, in our opinion, is around video devices
and services. Apple had an early start with the Apple TV and competed primarily
with the Roku box. However, over the past few years, Google and Amazon have
become very competitive in this space, offering cheaper, more elegant solutions that
allow users to stream video services onto their television sets. Apple’s original intent
was to sell high-margin hardware that would allow users to watch their purchased
video content from iTunes directly on their television. Users could buy or rent TV
shows or movies on iTunes, and then watch the content on their TV via an Apple TV.
Google and Amazon replicated the device – Google created the Chromecast, which
sells for only $35, and enables users to buy/rent content from Google Play or stream
videos from YouTube or other content partners. Amazon also replicated a similar
product to Apple TV, the Kindle Fire TV, but provided voice search and better
hardware. In Exhibit 44, we highlight different Video Streaming devices, and how
they compare. Apple TV still sells at a significant premium to the competition, but
given Amazon’s laser focus on offering quality at an affordable price (thus selling
hardware at breakeven margins), we believe that Apple has been losing share in this
market and is unlikely to recover in the near term.
June 8, 2016 63Mizuho Securities USA Inc.
Apple Inc.

Exhibit 44: Comparison of Video Streaming Devices
C Price Product Features Available Content Gaming
$150 Yes
$100 Yes
$35 No
Roku $50
Roku 2 $70
Roku 3 $100
Roku 4 $130
Yes
$50 Yes
$200 Yes
Apple TV
Amazon Fire TV
Google Chromecast
Roku
Google Nexus Player / Android TV
Nvidia Shield / Android TV
• Delivers polished video experience within the
familiar Apple interface• Siri Voice Search• AirPlay allows wireless streaming and mirroring
for content from Mac or iOS device• Dual-core Processor, 802.11ac MIMO wireless,
and Optical Audio Out
• 1080p
• Supports 4K
• Voice Search• Expandable storage• Interface favors Amazon Instant over other
services• Quad-core Processor and 802.11ac MIMO
• Chrome cast allows users to connect their
desktop or mobile devices to their TV using WiFi.
• Dual band 2.4 and 5GHz support
• 802.11ac MIMO wireless
• Roku 4 Supports 4K Ultra HD
• Voice Search• Faster Loading of Netflix and Youtube• Mobile App for Casting
• Quad-core Processor• 802.11ac MIMO wireless
• Includes all features of Chromecast
• 1080p• Intel Atom chipset• 8 GB flash memory
• No Ethernet connection
• Includes all features of Chromecast
• Compatible with 4K streaming service• upgradable to 128GB storage• Voice Search (Not for Netflix)
• Menu pushes uses to Google's media service• Tegra X1 chipset, 16 GB of internal storage,
USB 3.0 ports, gigabit Ethernet and dual-band
WiFi ac
• Good Selection of TV based apps
• AirPlay allow streaming from unsupported apps
• Thousands of popular streaming apps
• Few 4K channels
• Users can mirror any tab from the
Chrome Browser on their destop or mobile device onto their TV
• 2500+ channels
• 10 Channels offering 4K content
• TV based apps
• App based Games• Chromecast mirror from Chrome
browser
• TV based apps
• App based Games• Chromecast mirror from Chrome
browser
Source: Company reports, Mizuho Securities USA estimates
On the video services side, we remain concerned that leaders such as Netflix, Hulu
Amazon Prime Video, and YouTube Red could further marginalize Apple. Google
and Amazon are taking a hardware-centric approach to pushing their services, and it
appears to be working. Netflix is now the world’s most dominant streaming video
service, and plans to spend upwards of $6 billion on original content this year in
June 8, 2016 64Mizuho Securities USA Inc.
Apple Inc.

order to drive new subscribers and reduce churn. We believe that Apple missed an
opportunity to participate in the streaming video market, although it could purchase
companies like Hulu or Netflix and invest more aggressively to compete with the
other services.
Exhibit 45: Comparison of Video Streaming Services
Subscribers
(millions)Price per Month Content Device
Netflix 81.5 $8-10 for 1080p; $12 for Ultra HD Almost Universal
Hulu 9 Free, or $8-12 with ads Almost Universal
Amazon Prime Video ~22 $8.25
Not Available on few
devices such as Apple
TV
YouTube Red -- $10-13 on iOS
Available across all
devices with access to
YouTube
• Movies, Original Series, and past
seasons of popular shows• 4K Ultra HD• 7008 titles (4563 movies and 2445 TV
shows)
• Current and Previous ABC, Fox, and
NBC shows, older shows for CBS, and also has original series
• 10244 titles (6656 movies and 3588
shows)
• Movies, Original Series, and old HBO
series• 4K TV shows and Movies at no extra
charge
• 20386 titles (18405 movies and 1981 TV shows)
• Ad free viewing of YouTube
• YouTube Gaming• YouTube Kids• Special Premium content
Source: Company reports, Mizuho Securities USA estimates
June 8, 2016 65Mizuho Securities USA Inc.
Apple Inc.

Apple Watch Unlikely to be a Driver Anytime Soon
Apple Watch was considered to be the next revenue driver by many investors bullish
on the name but that enthusiasm has faded over the last few quarters. As mentioned
earlier in the report, while Apple might have sold more watches in its first year than
the number of iPads in their year of launch, we think comparison is unfair as Apple
had to seed a market for tablets and it did not have as a strong an installed base of
loyal customers as it has now. Watch was a highly anticipated gadget and Apple had
a very strong customer following by the time it was launched. Our survey indicates
that not only is the product not in the right category, it also lacks appeal among many
young consumers. The survey indicated that an increasing number of people do not
wear a watch any more. The ones who do wear watches largely prefer traditional
watches at lower price points.
According to the Euromonitor International, the global watch industry is expected to
grow from $64 billion in 2014 to $87 billion (6% CAGR) by 2019. The global
accessories market is estimated at $542 billion in 2014 and is projected to rise to
about $780 billion in 2019, reflecting an 8% CAGR. With rising global incomes and
a growing middle class, mid-tier watches priced $100-$1,000 are expected to grow
through 2019, led by Asia-Pacific at 8% CAGR, the Americas (including U.S.) at
about 6% CAGR, and EMEA at about 4% CAGR.
That said, recent Mizuho Securities USA surveys have shown declining watch
interest and ownership, especially among Millenials. Per our survey of U.S.
consumers, 60% currently own a traditional or fashion watch that only tells time.
When we dissected responses by age, we noticed declining watch ownership amongst
younger survey respondents. Of the respondents age 18-29, only 44% currently own
a traditional/fashion watch (only tells time) versus the general survey pool’s 60%.
Unsurprisingly, watch ownership percentage rose along with the age of respondents,
with those over 60 years old indicating the highest watch ownership at nearly 76%.
June 8, 2016 66Mizuho Securities USA Inc.
Apple Inc.

Exhibit 46: Waning Watch Ownership Amongst Millennials
Do you currently own a traditional/fashion watch (watch that only tells time and is not a fitness tracker)?
44.3%48.8%
61.8% 62.4%
75.8%
60.3%55.7%
51.2%
38.2% 37.6%
24.2%
39.7%
0%
10%
20%
30%
40%
50%
60%
70%
80%
Age 18-29 Age 30-39 Age 40-49 Age 50-59 Age 60+ All Respondents
Yes No
Source: Mizuho Securities USA survey results, Mizuho Securities USA estimates
Purchase activities in watches remain lackluster with 85% of participants citing they
have not purchased a watch in the last three months (1Q16), a slight increase from
our February poll in which 84% of respondents did not purchase recently. Only 8.5%
cited they have bought a watch, slightly shy of the 9.4% in the February poll.
June 8, 2016 67Mizuho Securities USA Inc.
Apple Inc.

Exhibit 47: Watch Purchases Appear Tepid Thus Far
No, I did not
purchase either one
85%
Yes, I
bought both1%
Yes, I bought a
smart watch5%
Yes, I bought a
traditional/fashionwatch that only
tells the time
9%
No, I did not
purchase either one
84%
Yes, I
bought both2%
Yes, I bought a
smart watch5%
Yes, I bought a
traditional/fashionwatch that only
tells the time
9%
Have you purchased a fashion watch or smart watch in the last 3 months? (Apr'16)
Have you purchased a fashion watch or smart watch in the last 3 months? (Feb'16)
Source: Mizuho Securities USA survey results, Mizuho Securities USA estimates
The outlook for both traditional/fashion watches and smart watches looks similarly
unfavorable for 2Q16. 87% of participants do not plan to purchase a watch over the
next three months, higher than our February poll in which 85% of participants stated
“I do not plan to purchase either one.” Specifically, purchase intent for
traditional/fashion watches and smartwatches remains tepid at 6% each, with only
1% of respondents (down from 3% in February) planning to purchase both in the
next three months.
June 8, 2016 68Mizuho Securities USA Inc.
Apple Inc.

Exhibit 48: Expect 2Q Watch Sales to Remain Sluggish
No, I do not plan to purchase either one
87%
Yes, I plan
to buy both1%
Yes, I plan to buy a
traditional/fashionwatch6%
Yes, I plan to buy
a smart watch6%
No, I do not plan to purchase either one
85%
Yes, I plan
to buy both3%
Yes, I plan to buy a
traditional/fashionwatch6%
Yes, I plan to buy
a smart watch6%
Do you plan on purchasing a fashion watch or smart watch in the next 3 months? (Apr'16)
Do you plan on purchasing a fashion watch or smart watch in the next 3 months? (Feb'16)
Source: Mizuho Securities USA survey results, Mizuho Securities USA estimates
We highlight that both traditional and smart watch shoppers remain highly price
sensitive with nearly 74% of purchases over the past three months in the sub-$300
category. We note similar price sensitivity in forward purchase intent (next three
months), with 80% of respondents planning to purchase in the sub-$300 category.
We believe pricing under $250 would enable greater mass adoption of smart
watches, which compares with cheapest Apple Watch being priced around $300.
June 8, 2016 69Mizuho Securities USA Inc.
Apple Inc.

Exhibit 49: Watch Purchases Remain Highly Price Sensitive
44%
23%
7% 5% 5%
3% 1% 2%
10%
1%
0%
10%
20%
30%
40%
50%
How much did you spend in total on your fashion watch or smart watch purchase in the last 3 months?
37%
31%
13%
8%
2% 1%
4%
1% 3%
1%
0%
10%
20%
30%
40%
How much do you plan to spend in total on your fashion watch or smart watch purchase in the next 3 months?
Source: Mizuho Securities USA survey results, Mizuho Securities USA estimates
Given consumer price sensitivity, it was not surprising to see Timex, Citizen, Seiko,
and Fossil dominate among top selling brands. In fact, per our February and April
2016 surveys, Timex and Citizen enhanced their market share of the traditional
watch market to 16% and 15%, respectively.
June 8, 2016 70Mizuho Securities USA Inc.
Apple Inc.

Exhibit 50: Traditional/Fashion Watch Purchase by Brand
1% 0%
1% 0%
1%
3% 3% 3% 3% 2%
7%
1%
9%
4%
6%
0%
6%
19%
7%
11%
34%
0% 1% 1% 1%
2% 2% 3% 3% 4%
5% 6% 6% 6% 6%
7% 7%
9%
13%
15% 16%
28%
0%
5%
10%
15%
20%
25%
30%
35%
40%
Feb'16 Apr'16
Which brand's fashion or traditional watch did you purchase in the last 3 months?
Source: Mizuho Securities USA survey results, Mizuho Securities USA estimates
In an analysis of watch purchases by age, smart watch buyers were more
concentrated among Millennials aged 21-29. Similar to trends we have seen in prior
surveys, Millennials demonstrated the highest level of traditional watch purchases,
with 16% of respondents aged 18-20 and 9% of those aged 21-29 buying a
traditional/fashion watch over the past 3 months.
Exhibit 51: Watch Purchases by Age
4% 6% 6% 6% 4% 5%
16%
9% 9% 9% 8% 6%2% 2% 2% 2% 1% 0%
78%82% 83% 83%
87% 89%
0%
10%
20%
30%
40%
50%
60%
70%
80%
90%
100%
18-20 21-29 30-39 40-49 50-59 60 or older
Yes, I bought a smart watch Yes, I bought a traditional/fashion watch that only tells the time Yes, I bought both No, I did not purchase either one
Source: Mizuho Securities USA survey results, Mizuho Securities USA estimates
June 8, 2016 71Mizuho Securities USA Inc.
Apple Inc.

As expected, those with higher household income are more likely to purchase a
watch (both traditional/fashion and smart watches). Specifically, nearly 17-20% of
those in the $75,000 and above income ranges own either a smart watch or
traditional/fashion watch, 5-10 points above the below $75k income brackets. We
believe it would be critical for smart watches to establish itself as a status symbol to
displace Swiss movement traditional watches.
Exhibit 52: Higher HHI = Higher Watch Purchases
2% 3% 5% 6%
14%
9% 5%
7% 11%
7% 11%
6% 8% 9%
1% 1% 1% 2% 0%
5% 1%
91%
85% 86%
81% 80% 78%
85%
0%
10%
20%
30%
40%
50%
60%
70%
80%
90%
100%
$0 to $24,999 $25,000 to $49,999 $50,000 to $74,999 $75,000 to $124,999 $125,000 to $174,999 $175,000 and up All Responses
Yes, I bought a smart watch Yes, I bought a traditional/fashion watch that only tells the time Yes, I bought both No, I did not purchase either one
Source: Mizuho Securities USA survey results, Mizuho Securities USA estimates
When polled regarding smart watch purchases this year, the Apple watch maintained
its dominant position (44% of responses) followed by LG (10%) and Samsung (8%).
Forward purchase intent by brand through the end of 2Q16 revealed similar
takeaways, with Apple (62%) capturing the majority of responses followed by
Samsung (23%).
June 8, 2016 72Mizuho Securities USA Inc.
Apple Inc.

Exhibit 53: Apple Remains Dominant within Smart Watches
0% 0% 2% 2% 2% 2% 2% 2%
4%
8% 10%
39%
44%
0%
5%
10%
15%
20%
25%
30%
35%
40%
45%
50%
Which brand's smart watch did you purchase in the last 3 months?
Source: Mizuho Securities USA survey results, Mizuho Securities USA estimates
Respondents cited fitness tracking was the top most important feature for smart
watches followed by battery life. Water proofing, call/text notification, and sleep
tracking were the third, fourth and fifth most important features. Given the cross
section of these lifestyle demands, we envision a crowded marketplace with
connected fitness devices, traditional/fashion watch makers, and smart watch players
to vie for consumer wallet share.
June 8, 2016 73Mizuho Securities USA Inc.
Apple Inc.

Exhibit 54: Critical Smart Watch Features
2%
17% 17% 19%
23% 27%
37% 37% 39%
44% 48%
52%
62%
81%
0%
10%
20%
30%
40%
50%
60%
70%
80%
90% What are the most important features for your smart watch?
Source: Mizuho Securities USA survey results, Mizuho Securities USA estimates
That said, shoppers are not rushing to purchase new smart watches. Only 14% plan
to purchase a smart watch within the next three months. In fact, nearly 17% plan to
buy a smart watch over a year from now and another 19% is waiting for the next
generation.
Even respondents aged 18-29 demonstrated a lack of urgency to purchase the smart
watch. Only 6% plan to purchase a smart watch within the next three months, 15%
within the next 6 months while nearly 25% are waiting a year from now and another
20% will be waiting for the next generation to be released.
June 8, 2016 74Mizuho Securities USA Inc.
Apple Inc.

Exhibit 55: Smart Watch Purchases Not in Near Horizon
14.0% 14.0%
7.7%
27.4%
16.5%
19.3%
1.1%
0.0%
5.0%
10.0%
15.0%
20.0%
25.0%
30.0%
Within the next 3months
Within the next 6months
Within the next 9months
Within the next 12months
Over 12 monthsfrom now
I plan to wait forthe next
generation
Other
When do you plan on buying the smart watch?
Source: Mizuho Securities USA survey results, Mizuho Securities USA estimates
When we polled reasons why a respondent may not be interested in a smart watch,
the top answer was preference for traditional/fashion watch followed by smart
watches being too expensive, waiting for the price to come down, and dislike on the
look and feel of the smart watches, in that order.
June 8, 2016 75Mizuho Securities USA Inc.
Apple Inc.

Exhibit 56: Why Do You Not Plan on Buying a Smart Watch?
2%
7% 8%
10%
17% 17%
30% 32%
35%
2%
8%
10%
13%
15%
19%
33%
29%
33%
0%
5%
10%
15%
20%
25%
30%
35%
40%
I am waiting fornew fashion watchdesigns to become
available
I would like a watchwith smart features
that looks like atraditional/fashion
watch
I prefer to let otherstest out thetechnology
I plan to buy oralready bought a
fitness trackerinstead
I do not like thelook and feel ofsmart watches
I am waiting forprice to come down
Smart watches aretoo expensive
Other (pleasespecify)
I prefer atraditional/fashion
watch that only tellstime
Apr'16 Feb'16
What are the reason(s) you do not plan on buying a smart watch or fashion watch? Check all that apply.
Source: Mizuho Securities USA survey results, Mizuho Securities USA estimates
June 8, 2016 76Mizuho Securities USA Inc.
Apple Inc.

With Around $150 Billion in Net Cash, What Else Can Apple Do?
A longstanding component of the bull thesis on the company has been that it has a
large cash balance. Over the years, management has taken steps to address this
growing cash position, initially declaring a dividend and subsequently authorizing
and expanding its share repurchase program. Given the company’s strong free cash
flow generation, Apple’s net cash position at the end of FY15 stood at $141 billion,
growing over $20 billion from FY14 after returning around $46 billion to
shareholders in the form of dividends and buybacks. We note that since FY13, the
company has returned an average of over 80% of free cash flow via dividends and
buybacks. Looking at the company’s M&A track record, management typically
favors smaller, tuck-in acquisitions with the largest transaction being Beats that was
valued at $3 billion. We note that a core part of the company’s ‘ease of use’ design
philosophy is grounded in tight integration of its product development and
manufacturing operations. In our view, larger acquisitions that require significant
integration efforts could pose an execution risk to Apple’s strategy, especially
considering the company’s annual cadence of product updates.
That said, as growth in the core iPhone franchise slows, we believe Apple may
consider diversifying its exposure away from the consumer electronics industry
towards areas where it may leverage its brand in order to expand its product portfolio
with larger acquisitions. To be clear, we are not recommending the company pursue
these transactions, instead, we just provide a representation of the impact to its
financials if it did. In our analysis, we assume a 50% takeout premium to the target’s
current stock price, a 4% cost of capital for Apple and modest synergies from 2016 to
2020. Also, we assume that Apple returns 75% of free cash flow generated to
shareholders via dividends and buybacks from 2016 to 2020.
Auto Manufacturers May Offer Revenue Growth but Would Be
Dilutive to Cash Flows and, Likely, the Multiple
In our previous note, “ADAS Global Report: Bridging the U.S., EU, Japan, and
Asia-Pacific”, we addressed recent reports that Apple may be considering an entry
into the auto industry by developing a car from the bottom-up. Another way for
Apple to participate in the market would be to purchase a company like Tesla. In
Tesla’s case, acknowledging its limited production capacity, we note that the
company has an accumulated YTD free cash flow burn of about $5 billion since the
company’s founding in 2003. The company has shipped very limited number of cars
until now and we think it would need to increase its capital expenses significantly to
ramp up the volumes. As such, we continue to believe that an acquisition of an
existing automobile OEM or building an automobile from scratch may not be the
optimal use of the company’s capital given the significant scale required for high-
volume manufacturing and Apple’s relative inexperience with the product. However,
we nevertheless evaluate the company’s pro-forma financials if it were to undertake
such a transaction. Looking at product and design philosophy, among the major
OEMs, we believe Tesla is most likely to fit for Apple with additional locational and
June 8, 2016 77Mizuho Securities USA Inc.
Apple Inc.

technological overlap. At a 50% premium to Tesla’s current price, the takeout value
of transaction would be around $45 billion net of Tesla’s cash and debt. On
profitability, based on our analysis, we see the transaction being dilutive to gross and
operating margins by around 100-200 bps. For operating cash flow and free cash
flow, we believe the acquisition is likely to be dilutive in the near-term and become
modestly accretive toward 2020. That said, we believe that Tesla’s current
manufacturing base is limited to around 100,000 units and that higher volume
manufacturing likely entails a significant ramp in capital spending over the next few
years, which would make the following analysis look significantly optimistic.
Exhibit 57: Tesla Pro Forma Impact to Financials
2016 2017 2018 2019 2020
Revenue Impact 221 bps 125 bps 253 bps 276 bps 250 bps
Gross Margin Impact -38 bps -69 bps -121 bps -118 bps -163 bps
Operating Margin Impact -74 bps -115 bps -175 bps -141 bps -174 bps
Incremental
Operating Income (mm) ($997) ($1,226) ($1,350) $870 $1,287
Capex (mm) ($2,024) ($2,116) ($1,728) ($1,846) ($1,789)
Free Cash Flow (mm) ($1,282) ($907) $380 $1,092 $1,909
Pro-forma Net Cash (bn) $125 $136 $148 $158 $170
Source: Company financials, FactSet, Mizuho Securities USA estimates
In addition to Tesla, we evaluate, as a thorough exercise, the impact of Apple
pursuing a larger acquisition of a luxury auto manufacturer such as BMW. We
believe such an acquisition would preserve the premium branding of the company’s
products while entering a market with an established participant operating at scale.
Our analysis shows that while Apple’s margin profile may move lower by around
500 bps, BMW’s strong cash flow generation and largely maintenance capital
expenditures would be significantly accretive to free cash flows early on. However,
at a 50% premium, the takeout value of around $80 billion would bring Apple’s net
cash balance down to around $100 billion over the next couple of years, which the
company might not like. Additionally, looking at BMW’s current earnings multiple
of around 7.5x based on consensus estimates, Apple’s multiple could compress from
current levels given the cyclical nature of the auto industry and its exposure to
broader macro cycles.
June 8, 2016 78Mizuho Securities USA Inc.
Apple Inc.

Exhibit 58: BMW Pro Forma Impact to Financials
2016 2017 2018 2019 2020
Revenue Impact 636 bps -86 bps 98 bps -155 bps -125 bps
Gross Margin Impact -492 bps -482 bps -478 bps -376 bps -437 bps
Operating Margin Impact -494 bps -503 bps -440 bps -288 bps -424 bps
Incremental
Operating Income (mm) $10,441 $10,256 $11,958 $16,323 $10,765
Capex (mm) ($7,167) ($7,451) ($7,428) ($7,023) ($7,534)
Free Cash Flow (mm) $4,809 $3,841 $5,221 $5,596 $6,811
Pro-forma Net Cash (bn) $97 $108 $122 $133 $146
Source: Company financials, FactSet, Mizuho Securities USA estimates
Media: Tough to Move the Needle While Increasing the Need for
Capital Outlays
Apple’s initial success in the pre-iPhone era can be very much tied to its dominant
position in the media distribution space with iTunes. The products remain
centerpieces of its media strategy with the company recently introducing iTunes
Music as a product extension to capitalize on the subscription market. We have
already noted that competition has intensified in the space with players such as
Pandora and Spotify offering similar services at competitive prices. Admittedly,
iTunes Music has been a limited success for Apple and we note that the offering is
largely a product of its Beats acquisition in 2014. We analyze the impact of another
acquisition in the space, Pandora, in order to boost its subscriber base. While the
takeout value of around $3 billion is more in-line with the company’s historical
acquisitions, the impact to Apple’s financials is limited as well. Margins would rise
by up to 75 bps by 2020 while the deal could be earnings accretive to the company
by up to $1.5 billion by 2020. However, it will be dilutive to cash flows in the near-
term. Additionally, we think Apple might need to increase investments to realize
value out of its acquisition.
June 8, 2016 79Mizuho Securities USA Inc.
Apple Inc.

Exhibit 59: Pandora Pro Forma Impact to Financials
2016 2017 2018 2019 2020
Revenue Impact 18 bps 9 bps 16 bps 14 bps 14 bps
Gross Margin Impact 39 bps 44 bps 54 bps 63 bps 71 bps
Operating Margin Impact 5 bps 11 bps 20 bps 33 bps 44 bps
Incremental
Operating Income (mm) $369 $571 $818 $1,203 $1,529
Capex (mm) ($43) ($42) ($47) ($59) ($68)
Free Cash Flow (mm) ($125) ($17) $122 $249 $382
Pro-forma Net Cash (bn) $167 $178 $190 $201 $212
Source: Company financials, FactSet, Mizuho Securities USA estimates
Another possibility for Apple is to extend its media strategy to get into the custom
content game. The industry has seen new original content providers emerge as
companies such as Netflix and Amazon have built out production studios in an
attempt to ease royalty and distribution costs. While this would be a highly
competitive market to enter organically, Apple certainly has the financial heft to
pursue a transaction that gives its access to a user base and original content in the
near-term. Such a transaction with Netflix would entail a takeout value of around $55
billion and would be modestly dilutive to profitability by 2020. On cash flows, the
impact would be dilutive in the near-term and modestly accretive in the out years.
Similar to Pandora, we think Apple might need to increase investments to accelerate
the contribution of the business to Apple’s bottom line. As such, the impact to free
cash flows could be much more negative than indicated by the amounts below.
Exhibit 60: Netflix Impact to Financials
2016 2017 2018 2019 2020
Revenue Impact 122 bps 84 bps 110 bps 102 bps 133 bps
Gross Margin Impact -24 bps -17 bps -6 bps 24 bps 74 bps
Operating Margin Impact -85 bps -79 bps -68 bps -47 bps -19 bps
Incremental
Operating Income (mm) ($1,662) ($1,043) ($323) $735 $2,081
Capex (mm) ($80) ($96) ($103) ($124) ($136)
Free Cash Flow (mm) ($821) ($522) $152 $1,287 $2,410
Pro-forma Net Cash (bn) $114 $125 $137 $148 $159
Source: Company financials, FactSet, Mizuho Securities USA estimates
June 8, 2016 80Mizuho Securities USA Inc.
Apple Inc.

We also evaluated the impact of a potential merger with Time Warner and the impact
to Apple’s model. Time Warner’s properties, including HBO and Warner Brothers,
could be attractive to Apple and give it a strong foothold in the customer content
market. Such a transaction would contribute materially to the top-line in the initial
year while being slightly dilutive to operating margins. Although free cash flows
could benefit early on post-acquisition, the significant size of the deal would weigh
materially on Apple’s cash balance in the early years.
Exhibit 61: Time Warner Pro Forma Impact to Financials
2016 2017 2018 2019 2020
Revenue Impact 214 bps 4 bps 76 bps 3 bps 70 bps
Gross Margin Impact 63 bps 76 bps 128 bps 134 bps 133 bps
Operating Margin Impact -17 bps -15 bps 45 bps 57 bps 78 bps
Incremental
Operating Income (mm) $3,202 $3,677 $5,293 $5,930 $7,029
Capex (mm) ($506) ($572) ($541) ($507) ($520)
Free Cash Flow (mm) $3,943 $4,322 $4,684 $5,011 $5,762
Pro-forma Net Cash (bn) $66 $78 $92 $103 $116
Source: Company financials, FactSet, Mizuho Securities USA estimates
June 8, 2016 81Mizuho Securities USA Inc.
Apple Inc.

A Survey of 1,000 Consumers Indicates Apple’s Franchise Remains Strong
Given that there appears to be significant challenges facing the company, we wanted
to double check the strength of its existing franchise. In a follow-up to our original
survey that we conducted in January this year, we polled consumers for a second
time in order to better understand Apple’s growth prospects and its ability to further
monetize its installed base. Our key takeaways are: 1) Apple’s brand loyalty remains
very strong among existing users; 2) The company is likely to remain a beneficiary
of switching activity from Android as well as pull-in of new smartphone users into
the ecosystem; and 3) There is still a significant number of iPhone users that are still
using pre-iPhone 6 devices, potentially an indicator of future iPhone shipments over
the next few years.
The 1,000+ respondents were primarily iOS (39% of participants) and Android
(42%) users while the remaining were users of other smartphone platforms (such as
Windows, BlackBerry), feature phones or users that do not own a cell phone
altogether.
Exhibit 62: Smartphone Share among Survey Respondents
27%
53%
7% 9%
3%
39%42%
4%
10%
4%
0%
10%
20%
30%
40%
50%
60%
Apple iPhone Android OtherSmartphone
Feature Phone None
Jan-16 May-16
Source: Mizuho Securities USA survey results
As such, within smartphone users, Apple had about 45% share which is higher than
January’s 31% number, however, there could be some lumpiness in quarterly data.
Apple seems to have gained share over Android over the last few quarters but the
order of magnitude of share gain is likely lower than the level indicated by our
survey participants. Apple’s customer loyalty remained very high which has been the
case since the launch of iPhones. About 90% of current iPhone users claimed that
they would purchase an iPhone for their next smartphone while 6% would consider a
June 8, 2016 82Mizuho Securities USA Inc.
Apple Inc.
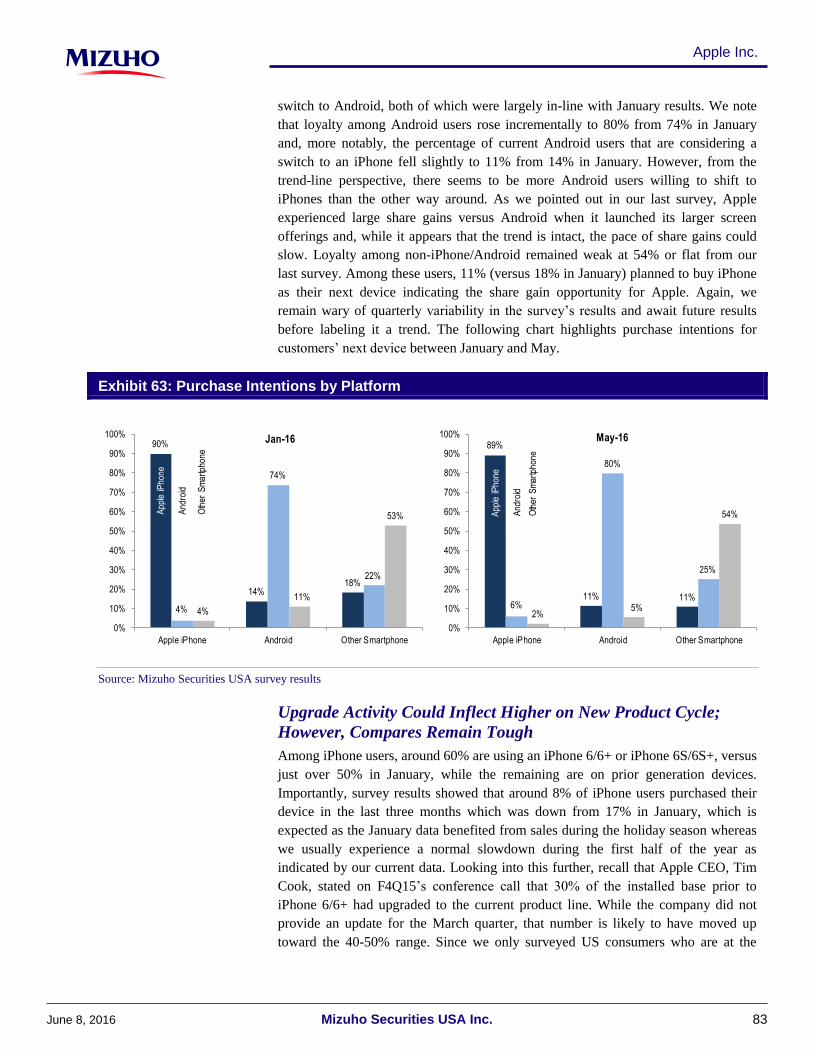
switch to Android, both of which were largely in-line with January results. We note
that loyalty among Android users rose incrementally to 80% from 74% in January
and, more notably, the percentage of current Android users that are considering a
switch to an iPhone fell slightly to 11% from 14% in January. However, from the
trend-line perspective, there seems to be more Android users willing to shift to
iPhones than the other way around. As we pointed out in our last survey, Apple
experienced large share gains versus Android when it launched its larger screen
offerings and, while it appears that the trend is intact, the pace of share gains could
slow. Loyalty among non-iPhone/Android remained weak at 54% or flat from our
last survey. Among these users, 11% (versus 18% in January) planned to buy iPhone
as their next device indicating the share gain opportunity for Apple. Again, we
remain wary of quarterly variability in the survey’s results and await future results
before labeling it a trend. The following chart highlights purchase intentions for
customers’ next device between January and May.
Exhibit 63: Purchase Intentions by Platform
90%
14%18%
4%
74%
22%
4%
11%
53%
0%
10%
20%
30%
40%
50%
60%
70%
80%
90%
100%
Apple iPhone Android Other Smartphone
App
le iP
hone
And
roid
Oth
er S
mar
tpho
ne
89%
11% 11%6%
80%
25%
2%5%
54%
0%
10%
20%
30%
40%
50%
60%
70%
80%
90%
100%
Apple iPhone Android Other Smartphone
App
le iP
hone
And
roid
Oth
er S
mar
tpho
ne
Jan-16 May-16
Source: Mizuho Securities USA survey results
Upgrade Activity Could Inflect Higher on New Product Cycle;
However, Compares Remain Tough
Among iPhone users, around 60% are using an iPhone 6/6+ or iPhone 6S/6S+, versus
just over 50% in January, while the remaining are on prior generation devices.
Importantly, survey results showed that around 8% of iPhone users purchased their
device in the last three months which was down from 17% in January, which is
expected as the January data benefited from sales during the holiday season whereas
we usually experience a normal slowdown during the first half of the year as
indicated by our current data. Looking into this further, recall that Apple CEO, Tim
Cook, stated on F4Q15’s conference call that 30% of the installed base prior to
iPhone 6/6+ had upgraded to the current product line. While the company did not
provide an update for the March quarter, that number is likely to have moved up
toward the 40-50% range. Since we only surveyed US consumers who are at the
June 8, 2016 83Mizuho Securities USA Inc.
Apple Inc.

leading edge of iPhone adoption, we believe the global penetration of the latest
products is very likely lower than the value indicated by our survey.
In terms of purchase intentions, as Exhibit 64 shows below, 51% and 16% of iPhone
users claimed to have last upgraded their phones between 1-2 years and more than 2
years ago, respectively, up from 45% and 14% in January.
Exhibit 64: Time Since Last iPhone Purchase
17%
23%
45%
14%
8%
26%
51%
16%
0%
10%
20%
30%
40%
50%
60%
Fewer than 3months ago
3-6 months ago 1-2 years ago More than 2 yearsago
Jan-16 May-16
Rising proportion of
respondents who last upgraded their device more than a year ago
Source: Mizuho Securities USA survey results
While this statistic may seem at odds with the uptick in 6/6+/6S/6S+ adoption
mentioned previously, we believe purchase intentions are a better indicator of the
demand environment the company is likely to face. Additionally, some customers
might have gone for the 5S model that was still available in the market. Considering
that the iPhone 6’s launch date was over 18 months ago, there is still a large pool of
iPhone users that could upgrade their devices over the next few years. The data
indicates that just over a third of current iPhone users plan to upgrade their device in
the next 12 months, which would indicate replacement demand of over 150 million
units based on our current assumptions of the installed base.
June 8, 2016 84Mizuho Securities USA Inc.
Apple Inc.

Exhibit 65: Time Until Next iPhone Purchase
8%
13%14%
20%
12%
18%
14%
9%
13%14%
17% 17%15%
16%
0%
5%
10%
15%
20%
25%
In the next 3months
In the next 6-9months
In the next 9-12months
In 12-18 months In 18-24 months After 24 months I do not plan onpurchasing a
new phone
Jan-16 May-16
Upgraders in the next 6-12 months remains stable potentially driving iPhone unit volume
Source: Mizuho Securities USA Survey results
iPhone Life Could Marginally Elongate, However, Likely to
Remain in the 2-3 Year Range
We surveyed respondents to compare the life, in months, of their previous
smartphone against the life of their current device to gauge the potential for demand
growth driven by an iPhone 7 upgrade cycle. Among current iPhone users who
intend to purchase an iPhone in the future, we found that the average device life is
expected to elongate in 83% of cases (or flat versus the January survey). We note that
average device life is expected to increase from 20 months for their last iPhone to 28
months for their current device, which is also mostly in-line with prior survey results.
Triangulating this finding with the data in Exhibit 66 suggests that a large proportion
of current users have owned their devices for more than one year, therefore
increasing the likelihood that iPhone shipments could remain reasonably strong over
the next few years (although there could be some volatility on a quarterly basis).
Additionally, we note that our view of elongation of iPhone lives is based on
consumers’ intent, whereas reality is that these devices break frequently forcing users
to upgrade. As such, we expect the life of iPhone to remain within the 2-3 year range.
June 8, 2016 85Mizuho Securities USA Inc.
Apple Inc.

Exhibit 66: iPhone Installed Base Previous vs Current Phone Life
Last Phone Current Phone
Jan-16 20 27
May-16 20 28
Expected Life (months)
83%
17%
Elongated Contracted
Source: Mizuho Securities USA Survey results
Interest in Apple’s Yearly Upgrade Option Remains Healthy;
However, We Await Concrete Data Points
It is likely that the premium price point of iPhones deters the average customer from
upgrading frequently. However, we find that Apple’s recent option launched with the
iPhone 6S to allow device upgrades on a yearly basis may shift customer behavior –
60% of survey respondents intending to buy an iPhone in the future were interested
in this option. However, we continue to await concrete data points to indicate that
customers are actually adopting the new pricing plan. Among those interested in the
program, just over 60% intend to purchase an iPhone in the next 12 months
compared with 55% in January. As such, if the offering actually gains momentum,
there could be upside to our and Street’s estimates, but we are cautious on the trend.
June 8, 2016 86Mizuho Securities USA Inc.
Apple Inc.

Exhibit 67: iPhone Model Purchase Intentions
4%7%
4%
15%18%
50%
2%2% 4% 4%
11% 11%
63%
4%
0%
10%
20%
30%
40%
50%
60%
70%
iPhone 5S iPhone 6 iPhone 6+ iPhone 6S iPhone 6S+ Latestavailable
iPhone
Other
Jan-16 May-16
iPhone model purchase intentions shiftingtoward 'latest available model' as we move into next product cycle
Source: Mizuho Securities USA Survey results
We note that 63% of those interested in purchasing an iPhone intend to purchase the
latest available device from Apple, up from 50% in January with the uptick, in our
view, likely due to the upcoming iPhone 7 product cycle. While clearly supporting
the case for long term health of the iPhone franchise, this behavior also reinforces
our belief that the company’s increasing reliance on smartphones for growth results
in product cycle driven valuation of its stock by investors. While brand loyalty
appears to be very strong for Apple, the features that we have seen built into ‘S/S+’
generation devices, in our view, have been marginal and unable to drive significant
upgrades in between next-generation product launches. We anticipate an
improvement in sentiment around the stock as we move toward the iPhone 7 launch
later this year.
Apple Watch Attach Rate Remains Low As Expected
Finally, we polled users regarding their purchase intentions of other devices such as
smartwatches, tablets and laptops over the next three months. Of note, around 7% of
respondents intended to buy an Apple Watch, 75% of them are existing Apple users.
We believe this is mostly in-line with our expectations as we do not expect Watch to
move the needle for the company.
June 8, 2016 87Mizuho Securities USA Inc.
Apple Inc.

Why Stay Positive On the Stock Despite the Growth Challenges?
Clearly, Apple is experiencing significant challenges in driving growth in its core
business. The company has had a great run over the last few years and its ability to
grow from the current level seems questionable. In light of this, the obvious question
is why we are still recommending investors to buy the stock. We think the answer
lies in the disconnect between the core strength of Apple’s franchise and its
valuation. At an 8x FCF multiple and 11x price to earnings multiple, the stock is not
trading as a growth company either. As shown in Exhibit 68, the company’s
valuation has come down significantly and at this point, it seems to be trading like a
value stock.
Exhibit 68: Historical EV to FCF Trend
0.0x
5.0x
10.0x
15.0x
20.0x
25.0x
12/31/2007 09/17/2008 06/05/2009 02/23/2010 11/08/2010 07/27/2011 04/13/2012 01/02/2013 09/19/2013 06/09/2014 02/25/2015 11/10/2015
Expanded 16%
Compressed 31%
Expanded 15%
Compressed 19%
Expanded 27%
Compressed 17%
Multiple bottomed at 5x in
2013 during the 5S cycle
when supply chain data
points turned negative
3G
3GS
4
4S5
5S
6
6S
Compressed 34%
Source: FactSet, Mizuho Securities USA
Historically, the stock trades on quarterly data points associated with its iPhone
supply chain. Management does not comment more than one quarter in advance,
which gives it enough flexibility to make adjustments to production schedules and
manage expectations as it launches new products. As such, there can be significant
volatility in supply chain information as Apple can adjust its orders with a 6-8 week
lead time. The stock had recovered from its recent lows as investor sentiment around
the market in general improved but it went down to about $90 in the last month as
underwhelming guidance indicated sharp deceleration in iPhone shipments in the
June 8, 2016 88Mizuho Securities USA Inc.
Apple Inc.

June quarter. The stock seems to have stabilized since then as there was chatter from
supply chain about slightly better than feared procurement numbers for iPhone 7.
Additionally, many value investors had started to step in around those levels. We
believe these quarterly data points may create trading opportunities for investors. In
addition, we think that the current pullback in the stock has likely created an
attractive risk-reward for investors. Having said that, we are still not expecting the
stock to trade like a growth company’s unless management can prove its ability to
sustainably grow again. Still, there appears to be a path to the $110-120 range, which
offers meaningful upside to justify our Buy rating.
Lifetime Value of an iPhone Customer Remains High
Based on our survey work and conversations with various stake holders, we think
Apple’s key asset is its extremely loyal customer base. While the company also has a
very dedicated and talented employee base as well as strongest balance sheet among
technology companies, Apple’s customer base is extremely important to sustain other
points of strength, in our view. In order to assign value to the company’s customer
base, we estimated the life time value of its customers (LTVC). As highlighted in
Exhibit 69, we estimate the life time value of the company’s customer to be about
$1,100. We note that our updated analysis indicates LTVC to be $100 lower than our
prior estimate as we have now likely more conservatively assumed services revenue
to decline by 5% per year versus our previous assumption of 5% growth. The change
in assumptions is largely due to additional conservatism and our belief many pure-
play vendors could make it tough for Apple to enhance service revenue per user.
Since iPhone is the company’s largest product segment and likely the most widely
owned device, we used iPhone customers as a base unit. We assumed that each
iPhone customer upgrades to a new version every two years and that each user is
currently purchasing about $50 of other services (applications on AppStore, Music,
iCloud etc.) in the first year with annual decline of about 5% in subsequent years. We
note that our estimate of about $50 of services is at the low end of the $50-55 per
phone range implied by the company’s FY15 revenues. Additionally, we assumed
that attach rate of Macs and iPads/Watch is about 15% and 50%, respectively. Our
attach rate assumptions are in line with Apple’s unit shipments of these two segments
as compared with its iPhone sales over the last few years.
Additionally, we assumed that the company’s total operating expenses would be
about 30% of its gross profit, which would also include the capital requirements to
support the infrastructure for servicing and acquiring customers. As such, the
company’s free cash flows from the customer should mimic its after tax net income
over time, which is relatively consistent with its historical performance. We
estimated the customer’s purchasing pattern to be repeatable for the next ten years.
For terminal value of the customer, we assumed it to be about 8x their average
contribution in the last five years of their life. We used average contribution in order
to smooth out any annual variability during the customer’s life with the company.
Finally, we used a discount rate of 10% for our calculations. Our analysis for LTVC
for Apple is highlighted below.
June 8, 2016 89Mizuho Securities USA Inc.
Apple Inc.

Exhibit 69: Life Time Value Analysis of iPhone Customer
Year: 1 2 3 4 5 6 7 8 9 10
Revenue
iPhone (assuming ASP growth of -1%) 650 0 644 0 637 0 631 0 624 0
Services (assuming YoY growth of -5%) 50 48 45 43 41 39 37 35 33 32
Macs ASP 1,250 0 0 1,250 0 0 1,250 0 0 1,250
15% attach rate 188 0 0 188 0 0 188 0 0 188
iPad/Watch (ASP) 450 0 0 450 0 0 450 0 0 450
50% attach rate 225 0 0 225 0 0 225 0 0 225
Total Revenue $1,113 $48 $689 $455 $678 $39 $1,080 $35 $658 $444
Gross Profit
iPhone @ 45% GM 293 0 290 0 287 0 284 0 281 0
Services @ 80% GM 40 38 36 34 33 31 29 28 27 25
Macs @ 20% GM 38 0 0 38 0 0 38 0 0 38
iPad/Watch @ 35% GM 79 0 0 79 0 0 79 0 0 79
Total Gross Profit $449 $38 $326 $151 $319 $31 $429 $28 $308 $141
SG&A @ 30% of Gross Profit 135 11 98 45 96 9 129 8 92 42
Operating Income 314 27 228 105 223 22 301 20 215 99
Tax Rate 26% 26% 26% 26% 26% 26% 26% 26% 26% 26%
Net Income $232 $20 $169 $78 $165 $16 $222 $14 $159 $73
PV of income from each customer (10% discount rate) $810
Terminal value of the customer @ 8.0x 5 year average income $300
Lifetime value of the customer (LTVC) $1,109
Source: Mizuho Securities USA
Apple Could be Worth Around $120-130 per Share Based on
Customer Value Analysis
We continue to think Apple has a very strong franchise and is likely to keep gaining
share in the smartphone space, but the pace of share gains will likely moderate
meaningfully as the market seems to have matured. We are assuming growth of
about 2% in the company’s installed base over the next 10 years, which would also
imply normalized shipment growth in the low single digits during the same period.
We note that the company’s annual iPhone shipment growth rates can vary based on
market conditions, timing of product launches or competitive environment. However,
a normalized growth rate in the low to mid-single digits seems reasonable despite
extremely high penetration rates of smartphones in the handset market as the
company is likely to keep gaining share by attracting a greater portion of new
smartphone users in addition to switchers from Android and other eco-systems.
Additionally, as we highlighted earlier in the report, while opportunity in India will
not be able to move the needle for Apple in the near-term, its contributions can help
enhance the installed base to some extent. Apple could experience greater growth at
the lower end of the market, especially in India and China (collectively about 40% of
world’s population), pressuring its ASPs, which can challenge some of our LTVC
assumptions highlighted above. However, in such a case, impact of greater growth in
the units could offset the pressure on ASPs.
Lastly, we recognize that the company has over $200 billion on its balance sheet as
net cash. However, most of the cash (over 90%) is overseas and the company will
need to pay incremental taxes to repatriate the cash to the US. As such, we made
June 8, 2016 90Mizuho Securities USA Inc.
Apple Inc.
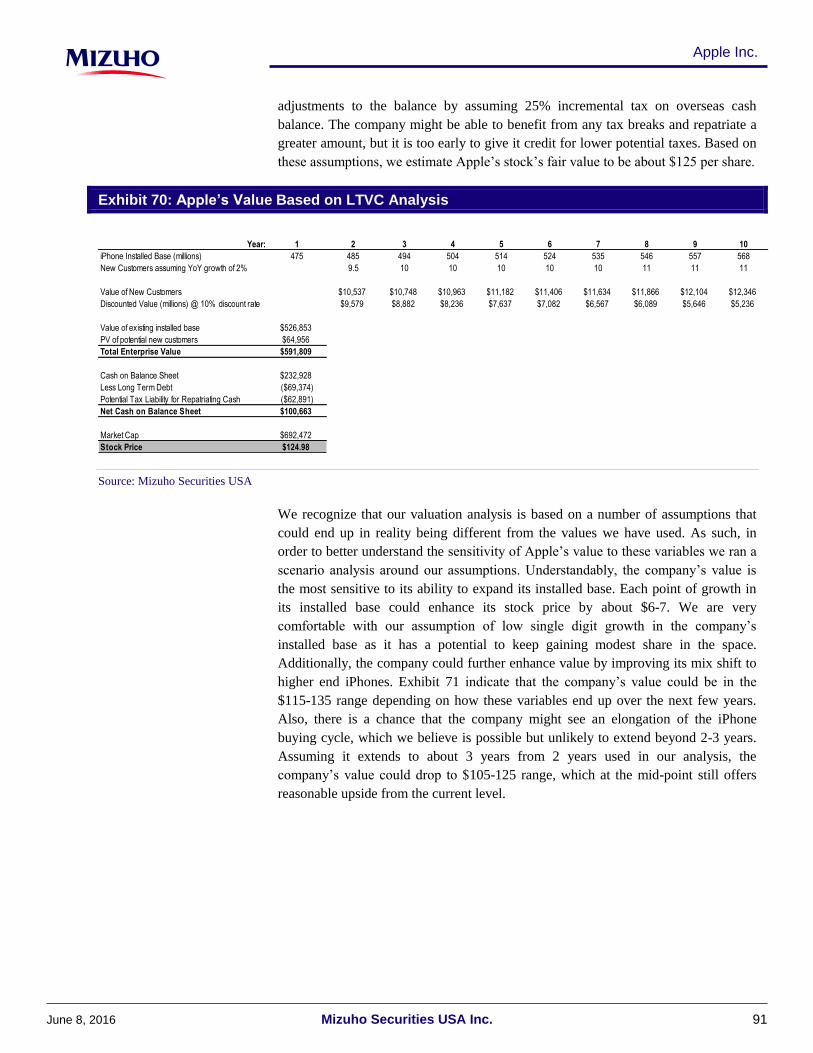
adjustments to the balance by assuming 25% incremental tax on overseas cash
balance. The company might be able to benefit from any tax breaks and repatriate a
greater amount, but it is too early to give it credit for lower potential taxes. Based on
these assumptions, we estimate Apple’s stock’s fair value to be about $125 per share.
Exhibit 70: Apple’s Value Based on LTVC Analysis
Year: 1 2 3 4 5 6 7 8 9 10
iPhone Installed Base (millions) 475 485 494 504 514 524 535 546 557 568
New Customers assuming YoY growth of 2% 9.5 10 10 10 10 10 11 11 11
Value of New Customers $10,537 $10,748 $10,963 $11,182 $11,406 $11,634 $11,866 $12,104 $12,346
Discounted Value (millions) @ 10% discount rate $9,579 $8,882 $8,236 $7,637 $7,082 $6,567 $6,089 $5,646 $5,236
Value of existing installed base $526,853
PV of potential new customers $64,956
Total Enterprise Value $591,809
Cash on Balance Sheet $232,928
Less Long Term Debt ($69,374)
Potential Tax Liability for Repatriating Cash ($62,891)
Net Cash on Balance Sheet $100,663
Market Cap $692,472
Stock Price $124.98
Source: Mizuho Securities USA
We recognize that our valuation analysis is based on a number of assumptions that
could end up in reality being different from the values we have used. As such, in
order to better understand the sensitivity of Apple’s value to these variables we ran a
scenario analysis around our assumptions. Understandably, the company’s value is
the most sensitive to its ability to expand its installed base. Each point of growth in
its installed base could enhance its stock price by about $6-7. We are very
comfortable with our assumption of low single digit growth in the company’s
installed base as it has a potential to keep gaining modest share in the space.
Additionally, the company could further enhance value by improving its mix shift to
higher end iPhones. Exhibit 71 indicate that the company’s value could be in the
$115-135 range depending on how these variables end up over the next few years.
Also, there is a chance that the company might see an elongation of the iPhone
buying cycle, which we believe is possible but unlikely to extend beyond 2-3 years.
Assuming it extends to about 3 years from 2 years used in our analysis, the
company’s value could drop to $105-125 range, which at the mid-point still offers
reasonable upside from the current level.
June 8, 2016 91Mizuho Securities USA Inc.
Apple Inc.

Exhibit 71: Sensitivity Analysis of Apple’s Value
$125 0% 1% 2% 3% 4%
-5% $108 $114 $119 $126 $132
-3% $111 $116 $122 $128 $135
-1% $113 $119 $125 $131 $138
1% $116 $122 $128 $135 $142
3% $119 $125 $131 $138 $145
YoY Installed Base Growth
iPh
on
e A
SP
Gro
wth
$125 0% 1% 2% 3% 4%
-9% $111 $117 $122 $129 $136
-7% $112 $118 $124 $130 $137
-5% $113 $119 $125 $131 $138
-3% $115 $120 $126 $133 $140
-1% $116 $122 $128 $135 $142Yo
Y S
ervi
ces
Gro
wth
YoY Installed Base Growth
Source: Mizuho Securities USA
June 8, 2016 92Mizuho Securities USA Inc.
Apple Inc.

Financial Model
Exhibit 72: Revenue Detail ($ in millions, except per share data
Apple Revenue Detail FY15A FY16E FY17E
1QA 2QA 3QA 4QA Total 1QA 2QA 3QE 4QE Total 1QE 2QE 3QE 4QE Total
Dec 14 Mar 15 Jun 15 Sep 15 FY15A Dec 15 Mar 16 Jun 16 Sep 16 FY16E Dec 16 Mar 17 Jun 17 Sep 17 FY17E
Mac 5,519 4,563 4,796 5,709 20,587 5,312 4,034 4,252 4,946 18,544 4,922 4,051 4,345 5,123 18,442
q/q growth 0.0% -17.3% 5.1% 19.0% -7.0% -24.1% 5.4% 16.3% -0.5% -17.7% 7.3% 17.9%
y/y growth 14.1% 10.3% 8.7% 3.4% 8.9% -3.8% -11.6% -11.3% -13.4% -9.9% -7.3% 0.4% 2.2% 3.6% -0.5%
ASP $1,258 $1,231 $1,257 $1,205 $1,237 $1,270 $1,266 $1,242 $1,202 $1,245 $1,264 $1,248 $1,250 $1,208 $1,241
q/q growth 4.8% -2.2% 2.2% -4.1% 5.3% -0.3% -1.9% -3.2% 5.1% -1.3% 0.2% -3.3%
y/y growth -4.8% -7.8% 0.2% 0.4% -2.9% 0.9% 2.9% -1.2% -0.3% 0.6% -0.5% -1.4% 0.6% 0.5% -0.3%
Mac Revenue $6,944 $5,615 $6,030 $6,882 $25,471 $6,746 $5,107 $5,282 $5,947 $23,082 $6,219 $5,055 $5,430 $6,191 $22,895
% of revenue 9.3% 9.7% 12.2% 13.4% 10.9% 8.9% 10.1% 12.8% 13.8% 11.0% 9.2% 10.0% 12.2% 13.1% 10.9%
q/q growth 4.8% -19.1% 7.4% 14.1% -2.0% -24.3% 3.4% 12.6% 4.6% -18.7% 7.4% 14.0%
y/y growth 8.6% 1.7% 8.8% 3.9% 5.8% -2.9% -9.0% -12.4% -13.6% -9.4% -7.8% -1.0% 2.8% 4.1% -0.8%
iTunes/Software/Services $4,799 $4,996 $5,028 $5,086 $19,909 $6,056 $5,991 $6,012 $6,172 $24,232 $6,765 $6,733 $6,766 $6,970 $27,234
% of revenue 6.4% 8.6% 10.1% 9.9% 8.5% 8.0% 11.8% 14.6% 14.3% 11.5% 10.0% 13.4% 15.3% 14.7% 13.0%
q/q growth 4.1% 4.1% 0.6% 1.2% 19.1% -1.1% 0.4% 2.7% 9.6% -0.5% 0.5% 3.0%
y/y growth 9.1% 9.2% 12.1% 10.4% 10.2% 26.2% 19.9% 19.6% 21.4% 21.7% 11.7% 12.4% 12.5% 12.9% 12.4%
iPhone Units (K) 74,468 61,170 47,534 48,046 231,218 74,779 51,193 38,965 40,576 205,514 69,236 51,443 42,137 44,585 207,400
q/q growth 89.6% -17.9% -22.3% 1.1% 55.6% -31.5% -23.9% 4.1% 70.6% -25.7% -18.1% 5.8%
y/y growth 45.9% 39.9% 35.0% 22.3% 36.6% 0.4% -16.3% -18.0% -15.5% -11.1% -7.4% 0.5% 8.1% 9.9% 0.9%
Implied ASP $687 $659 $660 $670 $671 $691 $642 $618 $619 $651 $644 $625 $612 $620 $628
q/q growth 14.0% -4.2% 0.2% 1.6% 3.0% -7.0% -3.6% 0.0% 4.1% -2.9% -2.1% 1.2%
y/y growth 7.9% 10.5% 17.6% 11.2% 11.3% 0.5% -2.5% -6.3% -7.7% -3.0% -6.7% -2.6% -1.0% 0.2% -3.5%`
iPhone Revenue $51,182 $40,282 $31,368 $32,209 $155,041 $51,635 $32,857 $24,098 $25,098 $133,688 $44,584 $32,173 $25,798 $27,635 $130,191
% of revenue 68.6% 69.4% 63.2% 62.5% 66.3% 68.1% 65.0% 58.5% 58.2% 63.4% 66.0% 63.9% 58.2% 58.4% 62.1%
q/q growth 116.2% -21.3% -22.1% 2.7% 60.3% -36.4% -26.7% 4.1% 77.6% -27.8% -19.8% 7.1%
y/y growth 57.5% 54.6% 58.8% 36.0% 52.0% 0.9% -18.4% -23.2% -22.1% -13.8% -13.7% -2.1% 7.1% 10.1% -2.6%
Accessories $2,689 $1,689 $2,641 $3,048 $10,067 $4,351 $2,189 $2,077 $2,430 $11,047 $4,006 $2,266 $2,733 $3,020 $12,026
% of revenue 3.6% 2.9% 5.3% 5.9% 4.3% 5.7% 4.3% 5.0% 5.6% 5.2% 5.9% 4.5% 6.2% 6.4% 5.7%
q/q growth 81.0% -37.2% 56.4% 15.4% 42.7% -49.7% -5.1% 17.0% 64.9% -43.4% 20.6% 10.5%
y/y growth 44.3% 19.0% 99.3% 105.1% 65.2% 61.8% 29.6% -21.4% -20.3% 9.7% -7.9% 3.5% 31.6% 24.3% 8.9%
iPad Units (K) 21,419 12,623 10,931 9,883 54,856 16,122 10,251 8,600 8,070 43,043 14,003 9,418 8,594 8,572 40,586
q/q growth 73.9% -41.1% -13.4% -9.6% 63.1% -36.4% -16.1% -6.2% 73.5% -32.7% -8.8% -0.3%
y/y growth -17.7% -22.8% -17.7% -19.8% -19.3% -24.7% -18.8% -21.3% -18.3% -21.5% -13.1% -8.1% -0.1% 6.2% -5.7%
Implied ASP $419 $430 $415 $433 $423 $439 $430 $429 $434 $434 $425 $438 $420 $413 $424
q/q growth -2.8% 2.5% -3.5% 4.2% 1.6% -2.0% -0.2% 1.0% -2.0% 3.0% -4.0% -1.8%
y/y growth -4.8% -7.6% -6.4% 0.2% -5.0% 4.7% 0.1% 3.4% 0.2% 2.6% -3.3% 1.7% -2.1% -4.9% -2.3%
Total iPad Revenue $8,985 $5,428 $4,538 $4,276 $23,227 $7,084 $4,413 $3,693 $3,500 $18,690 $5,952 $4,123 $3,612 $3,537 $17,223
% of revenue 12.0% 9.4% 9.1% 8.3% 9.9% 9.3% 8.7% 9.0% 8.1% 8.9% 8.8% 8.2% 8.1% 7.5% 8.2%
q/q growth 69.0% -39.6% -16.4% -5.8% 65.7% -37.7% -16.3% -5.2% 70.0% -30.7% -12.4% -2.1%
y/y growth -21.7% -28.7% -22.9% -19.6% -23.3% -21.2% -18.7% -18.6% -18.1% -19.5% -16.0% -6.6% -2.2% 1.0% -7.9%
Net Sales $74,599 $58,010 $49,605 $51,501 $233,715 $75,872 $50,557 $41,162 $43,147 $210,738 $67,527 $50,350 $44,339 $47,353 $209,569
q/q growth 77.1% -22.2% -14.5% 3.8% 47.3% -33.4% -18.6% 4.8% 56.5% -25.4% -11.9% 6.8%
y/y growth 29.5% 27.1% 32.5% 22.3% 27.9% 1.7% -12.8% -17.0% -16.2% -9.8% -11.0% -0.4% 7.7% 9.7% -0.6%
Source: Company data and Mizuho Securities USA estimates
June 8, 2016 93Mizuho Securities USA Inc.
Apple Inc.

Exhibit 73: Income Statement ($ in millions, except per share data)
FY15A FY16E FY17E
1QA 2QA 3QA 4QA Total 1QA 2QA 3QE 4QE Total 1QE 2QE 3QE 4QE Total
Dec 14 Mar 15 Jun 15 Sep 15 FY15A Dec 15 Mar 16 Jun 16 Sep 16 FY16E Dec 16 Mar 17 Jun 17 Sep 17 FY17E
Net Sales $74,599 $58,010 $49,605 $51,501 233,715 $75,872 $50,557 $41,162 $43,147 210,738 $67,527 $50,350 $44,339 $47,353 209,569
% growth q/q 77.1% -22.2% -14.5% 3.8% 47.3% -33.4% -18.6% 4.8% 56.5% -25.4% -11.9% 6.8%
% growth y/y 29.5% 27.1% 32.5% 22.3% 27.9% 1.7% -12.8% -17.0% -16.2% -9.8% -11.0% -0.4% 7.7% 9.7% -0.6%
Cost of Sales $44,858 $34,354 $29,924 $30,953 $140,089 $45,449 $30,636 $25,669 $26,957 $128,711 $41,372 $31,087 $27,868 $29,739 $130,066
% of revenue 60.1% 59.2% 60.3% 60.1% 59.9% 59.9% 60.6% 62.4% 62.5% 61.1% 61.3% 61.7% 62.9% 62.8% 62.1%
% growth q/q 71.8% -23.4% -12.9% 3.4% 46.8% -32.6% -16.2% 5.0% 53.5% -24.9% -10.4% 6.7%
% growth y/y 25.5% 24.0% 31.8% 18.5% 24.8% 1.3% -10.8% -14.2% -12.9% -8.1% -9.0% 1.5% 8.6% 10.3% 1.1%
Gross Margin $29,741 $23,656 $19,681 $20,548 $93,626 $30,423 $19,921 $15,493 $16,190 $82,027 $26,155 $19,263 $16,471 $17,614 $79,503
Gross Margin % 39.9% 40.8% 39.7% 39.9% 40.1% 40.1% 39.4% 37.6% 37.5% 38.9% 38.7% 38.3% 37.1% 37.2% 37.9%
Research and development $1,895 $1,918 $2,034 $2,220 $8,067 $2,404 $2,511 $2,614 $2,723 $10,252 $2,005 $2,350 $2,816 $2,988 $10,158
% of revenue 2.5% 3.3% 4.1% 4.3% 3.5% 3.2% 5.0% 6.4% 6.3% 4.9% 3.0% 4.7% 6.4% 6.3% 4.8%
% growth q/q 12.4% 1.2% 6.0% 9.1% 8.3% 4.5% 4.1% 4.2% -26.4% 17.2% 19.8% 6.1%
% growth y/y 42.5% 34.9% 26.9% 31.7% 33.5% 26.9% 30.9% 28.5% 22.7% 27.1% -16.6% -6.4% 7.7% 9.7% -0.9%
SG&A $3,600 $3,460 $3,564 $3,705 $14,329 $3,848 $3,423 $3,472 $3,643 $14,386 $3,762 $3,283 $3,407 $3,596 $14,049
% of revenue 4.8% 6.0% 7.2% 7.2% 6.1% 5.1% 6.8% 8.4% 8.4% 6.8% 5.6% 6.5% 7.7% 7.6% 6.7%
% growth q/q 14.0% -3.9% 3.0% 4.0% 3.9% -11.0% 1.4% 4.9% 3.3% -12.7% 3.8% 5.5%
% growth y/y 17.9% 18.0% 25.1% 17.3% 19.5% 6.9% -1.1% -2.6% -1.7% 0.4% -2.2% -4.1% -1.9% -1.3% -2.3%
Total operating expenses $5,495 $5,378 $5,598 $5,925 $22,396 $6,252 $5,934 $6,086 $6,366 $24,638 $5,767 $5,633 $6,223 $6,584 $24,207
% of revenue 7.4% 9.3% 11.3% 11.5% 9.6% 8.2% 11.7% 14.8% 14.8% 11.7% 8.5% 11.2% 14.0% 13.9% 11.6%
% growth q/q 13.4% -2.1% 4.1% 5.8% 5.5% -5.1% 2.6% 4.6% -9.4% -2.3% 10.5% 5.8%
% growth y/y 25.4% 23.5% 25.7% 22.3% 24.2% 13.8% 10.3% 8.7% 7.4% 10.0% -7.8% -5.1% 2.3% 3.4% -1.7%
Operating Income $24,246 $18,278 $14,083 $14,623 $71,230 $24,171 $13,987 $9,407 $9,824 $57,389 $20,388 $13,630 $10,248 $11,030 $55,296
Operating Margin % 32.5% 31.5% 28.4% 28.4% 30.5% 31.9% 27.7% 22.9% 22.8% 27.2% 30.2% 27.1% 23.1% 23.3% 26.4%
% growth q/q 22.6% -3.1% -9.9% 0.0% 12.2% -13.2% -17.4% -0.4% 32.6% -10.3% -14.6% 0.8%
% growth y/y 38.8% 34.5% 37.0% 31.0% 35.7% -0.3% -23.5% -33.2% -32.8% -19.4% -15.7% -2.6% 8.9% 12.3% -3.6%
Interest and other income $170 $286 $390 $439 $1,285 $402 $155 $303 $302 $1,162 $296 $316 $311 $306 $1,229
Income before taxes $24,416 $18,564 $14,473 $15,062 $72,515 $24,573 $14,142 $9,710 $10,126 $58,551 $20,684 $13,946 $10,559 $11,337 $56,526
Provision for income taxes (Benefit) $6,392 $4,995 $3,796 $3,938 $19,121 $6,212 $3,626 $2,476 $2,582 $14,896 $5,274 $3,556 $2,693 $2,891 $14,414
Effective tax rate 26.2% 26.9% 26.2% 26.1% 26.4% 25.3% 25.6% 25.5% 25.5% 25.4% 25.5% 25.5% 25.5% 25.5% 25.5%
Net Earnings $18,024 $13,569 $10,677 $11,124 $53,394 $18,361 $10,516 $7,234 $7,544 $43,655 $15,410 $10,390 $7,866 $8,446 $42,112
Net income (w ESO exp) $18,024 $13,569 $10,677 $11,124 $53,394 $18,361 $10,516 $7,234 $7,544 $43,655 $15,410 $10,390 $7,866 $8,446 $42,112
Net Margin % 24.2% 23.4% 21.5% 21.6% 22.8% 24.2% 20.8% 17.6% 17.5% 20.7% 22.8% 20.6% 17.7% 17.8% 20.1%
Basic shares outstanding 5,843.1 5,793.8 5,729.9 5,646.9 5,753.4 5,558.9 5,514.4 5,474 5,412 5,489.9 5,354 5,296 5,237 5,179 5,266.5
Basic EPS (w ESO exp) $3.20 $2.43 $1.97 $2.09 $9.71 $3.45 $2.05 $1.44 $1.53 $8.49 $3.04 $2.12 $1.64 $1.78 $8.59
% growth y/y 6.5% 4.4% 4.0% 7.5% 42.7% 0.2% -11.1% -18.4% -19.1% -12.5% -5.7% -0.8% 1.0% 2.0% 1.1%
Diluted shares outstanding 5,881.8 5,834.9 5,773.1 5,682.5 5793.1 5,594.1 5,540.9 5479.1 5417.0 5507.8 5359.1 5300.9 5242.4 5183.6 5271.5
Diluted EPS (ex ESO exp) $3.18 $2.41 $1.96 $2.08 $9.64 $3.43 $2.04 $1.44 $1.52 $8.47 $3.03 $2.11 $1.63 $1.77 $8.58
% growth y/y 47.6% 38.3% 43.8% 39.4% 42.4% 7.9% -15.5% -26.4% -26.6% -12.2% -11.5% 3.7% 13.3% 16.4% 1.4%
Diluted EPS (w ESO exp) $3.06 $2.33 $1.85 $1.96 $9.20 $3.28 $1.90 $1.32 $1.39 $7.89 $2.88 $1.96 $1.50 $1.63 $7.97
% growth y/y 47.9% 40.1% 44.5% 38.1% 43.0% 7.1% -18.4% -28.6% -28.9% -14.2% -12.4% 3.3% 13.7% 17.0% 0.9%
Source: Company data and Mizuho Securities USA estimates
June 8, 2016 94Mizuho Securities USA Inc.
Apple Inc.

Exhibit 74: Cash Flow Statement ($ in millions)
FY15 FY16 FY17
1QA 2QA 3QA 4QA Total 1QA 2QA 3QE 4QE Total 1QE 2QE 3QE 4QE Total
Dec 14 Mar 15 Jun 15 Sep 15 FY15 Dec 15 Mar 16 Jun 16 Sep 16 FY16 Dec 16 Mar 17 Jun 17 Sep 17 FY17
Operating Activities
Net Income $18,024 $13,569 $10,677 $11,124 $53,394 $18,361 $10,516 $7,234 $7,544 $43,655 $15,410 $10,390 $7,866 $8,446 $42,112
Adjustments to reconcile net income to net cash
Depreciation and Amortization 2,575 2,479 3,084 3,119 11,257 2,954 2,477 2,017 2,114 9,562 3,308 2,467 2,172 2,320 10,268
Stock compensation expense 888 927 856 915 3,586 1,078 1,048 899 961 3,986 1,132 1,100 944 1,009 4,185
Deferred income taxes 2,197 (318) 941 (1,438) 1,382 1,592 1,500 3,092 0
Loss on Sale of PP&E 0 0 0 0 0 0 0 0 0
Tax benefit from employee stock option plans 0 0 0 0 0 0 0 0 0
Non-Cash Restructuring 0 0 0 0 0 0 0 0 0
Cumulative effects fo accounting changes, net of taxes 0 0 0 0 0 0 0 0 0
Other non-cash items 0 0 0 0 0 0 0 0 0
Changes in operating assets and liabilities:
Accounts receivable 751 5,804 535 (6,479) 611 3,896 724 1,252 (4,844) 1,028 64 3,449 1,962 (4,912) 562
Inventories (172) (113) 354 (307) (238) (102) 170 (1) (114) (47) (362) 340 560 (786) (247)
Other current assets (3,508) 6,008 (2,278) (3,957) (3,735) 1,826 4,073 (1,857) (4,607) (565) 12,514 607 (8,768) (5,832) (1,479)
Other assets (1,648) 4,096 (162) (2,465) (179) (893) 1,193 3,353 (694) 2,959 (95) (384) 1,819 (1,126) 214
Accounts payable 9,003 (14,431) 2,165 8,663 5,400 (852) (8,623) (1,784) 8,528 (2,731) (2,217) (4,737) 491 9,330 2,867
Other liabilities 4,667 1,012 (1,231) 4,298 8,746 (368) (1,725) 2,022 3,201 3,130 (4,076) (2,389) 4,438 2,904 877
Deferred revenue 945 48 47 2 1,042 (29) 248 24 223 467 617 280 161 513 1,570
Net Cash from Operations $33,722 $19,081 $14,988 $13,475 $81,266 $27,463 $11,601 $13,159 $12,312 $64,535 $26,295 $11,123 $11,645 $11,865 $60,928
Year over Year Growth 49% 41% 46% 2% 36% -19% -39% -12% -9% -21% -4% -4% -12% -4% -6%
Net Income Growth 38% 31% 37% 33% 35% 3% -20% -30% -30% -17% -15% -1% 8% 11% -3%
Investing Activities
Purchase of marketable securities (44,915) (47,608) (45,001) (28,878) (166,402) (47,836) (38,406) (86,242) 0
Proceeds from maturity of marketable securities 2,807 3,064 4,045 4,622 14,538 3,514 5,634 9,148 0
Proceeds from sales of marketable securities 24,166 24,758 31,711 26,812 107,447 28,262 21,789 50,051 0
Purchases of other long-term investments 0 0 0
Payments for business acquisitions, net of cash (23) (92) (115) (113) (343) (86) (54) (140) 0
Acquisitions of property and equipment (3,217) (2,369) (2,043) (3,618) (11,247) (3,612) (2,336) (2,370) (4,269) (12,587) (4,154) (2,686) (2,725) (4,910) (14,475)
Acquisition of intangible assets (48) (107) (46) (40) (241) (394) (263) (657)
Other 65 23 46 (160) (26) (298) (24) (322) 0
Net Cash from Investing ($21,165) ($22,331) ($11,403) ($1,375) ($56,274) ($20,450) ($13,660) ($2,370) ($4,269) ($40,749) ($4,154) ($2,686) ($2,725) ($4,910) ($14,475)
Financing Activities
Proceeds from issuance of common stock 80 229 15 219 543 1 246 247 0
Excess tax benefits from stock-based comp 264 93 327 65 749 224 40 264 0
Cash used to net share settle equity awards (512) (96) (724) (167) (1,499) (597) (154) (751) 0
Proceeds from Issuance of Long-Term and Other Debt 0 0 0 0 0 0 0
Repurchase of common stock (5,030) (6,970) (10,000) (13,253) (35,253) (6,863) (6,667) (8,500) (8,500) (30,530) (8,500) (8,500) (8,500) (8,500) (34,000)
Proceeds from issuance of long term debt ,net 3,485 7,847 9,980 5,802 27,114 0 15,584 15,584
Repayments of commercial paper ,net (2,409) (99) 700 3,999 2,191 (1,240) 737 (503)
Dividend (2,801) (2,743) (3,053) (2,964) (11,561) (2,969) (2,902) (2,870) (2,837) (11,578) (2,807) (2,776) (2,746) (2,715) (11,044)
Net Cash from Financing ($6,923) ($1,739) ($2,755) ($6,299) ($17,716) ($11,444) $6,884 ($11,370) ($11,337) ($27,267) ###### ####### ($11,246) ($11,215) ($45,044)
Net Change in Cash $5,634 ($4,989) $830 $5,801 $7,276 ($4,431) $4,825 ($581) ($3,294) ($3,481) $10,834 ($2,840) ($2,326) ($4,259) $1,409
Beginning Cash Balance 13,844 19,478 14,489 15,319 13,844 21,120 16,689 21,514 20,933 21,120 17,639 28,473 25,634 23,308 17,639
Ending Cash Balance $19,478 $14,489 $15,319 $21,120 $21,120 $16,689 $21,514 $20,933 $17,639 $17,639 $28,473 $25,634 $23,308 $19,049 $19,049
Source: Company data and Mizuho Securities USA estimates
June 8, 2016 95Mizuho Securities USA Inc.
Apple Inc.

Exhibit 75: Balance Sheet ($ in millions)
Balance Sheet FY15 FY16 FY17
(in millions, except share amounts) 1QA 2QA 3QA 4QA Total 1QA 2QA 3QE 4QE Total 1QE 2QE 3QE 4QE Total
Dec 14 Mar 15 Jun 15 Sep 15 FY15 Dec 15 Mar 16 Jun 16 Sep 16 FY16 Dec 16 Mar 17 Jun 17 Sep 17 FY17
Assets
Cash and cash equivalents 19,478 14,489 15,319 21,120 21,120 16,689 21,514 20,933 17,639 17,639 28,473 25,634 23,308 19,049 19,049
Short-term Investments 12,985 18,607 19,384 20,481 20,481 21,385 33,769 33,769 33,769 33,769 33,769 33,769 33,769 33,769 33,769
Cash and short-term investments $32,463 $33,096 $34,703 $41,601 $41,601 $38,074 $55,283 $54,702 $51,408 $51,408 $62,242 $59,403 $57,077 $52,818 $52,818
Receivables 16,795 10,991 10,456 16,935 16,935 13,039 12,315 11,063 15,907 15,907 15,842 12,394 10,432 15,344 15,344
Allowance for doubtful accounts 86 86 86 86 86 86 86 86 86 86 86 86 86 86 86
Receivables, net 16,709 10,905 10,370 16,849 16,849 12,953 12,229 10,977 15,821 15,821 15,756 12,308 10,346 15,258 15,258
Inventories 2,283 2,396 2,042 2,349 2,349 2,451 2,281 2,282 2,396 2,396 2,758 2,418 1,858 2,643 2,643
Deferred Income Taxes , current 5,046 5,141 5,010 5,546 5,546 0 7,595 3,391 4,535 4,535 933 5,006 2,735 4,564 4,564
Other Current Assets 26,902 16,353 18,828 23,033 23,033 22,741 10,204 16,266 19,728 19,728 10,816 6,136 17,175 21,178 21,178
Total Current Assets $83,403 $67,891 $70,953 $89,378 $89,378 $76,219 $87,592 $87,617 $93,888 $93,888 $92,506 $85,270 $89,191 $96,462 $96,462
Long-Term Marketable Securities 145,492 160,443 168,145 164,065 164,065 177,665 177,645 177,645 177,645 177,645 177,645 177,645 177,645 177,645 177,645
Property and equipment, net 20,392 20,151 21,149 22,471 22,471 22,300 23,203 23,556 25,711 25,711 26,557 26,776 27,329 29,919 29,919
Goodwill 4,629 4,711 5,044 5,116 5,116 5,202 5,249 5,249 5,249 5,249 5,249 5,249 5,249 5,249 5,249
Aquired intangible assets, net 4,370 4,061 3,779 3,893 3,893 3,924 3,843 3,843 3,843 3,843 3,843 3,843 3,843 3,843 3,843
Other Long-Term Assets 3,608 3,937 4,081 5,556 5,556 7,974 7,745 4,392 5,086 5,086 5,181 5,565 3,746 4,872 4,872
Total Long-term Assets $178,491 $193,303 $202,198 $201,101 $201,101 $217,065 $217,685 $214,685 $217,535 $217,535 $218,475 $219,079 $217,812 $221,528 $221,528
Total Assets $261,894 $261,194 $273,151 $290,479 $290,479 $293,284 $305,277 $302,303 $311,423 $311,423 $310,981 $304,349 $307,003 $317,990 $317,990
Liabilities and Equity
Short-Term Debt 0 0 0 0 0 0 0 0 0 0 0 0 0 0 0
Accounts payable 38,001 23,159 26,474 35,490 35,490 33,312 25,098 23,314 31,842 31,842 29,625 24,888 25,379 34,709 34,709
Accrued expenses 22,724 22,827 22,724 25,181 25,181 24,032 23,208 25,230 28,431 28,431 24,356 21,966 26,405 29,309 29,309
Deferred revenue, current 8,987 8,944 9,088 8,940 8,940 8,989 9,461 9,586 9,754 9,754 10,163 10,507 10,766 10,881 10,881
Other Current Liabilities 3,899 3,799 6,999 10,999 10,999 9,759 10,498 6,890 6,544 6,544 6,107 7,380 7,726 14,330 14,330
Total Current Liabilities $73,611 $58,729 $65,285 $80,610 $80,610 $76,092 $68,265 $65,021 $76,571 $76,571 $70,251 $64,741 $70,276 $89,228 $89,228
Long-Term Debt 32,504 40,072 47,419 53,463 53,463 53,204 69,374 69,374 69,374 69,374 69,374 69,374 69,374 69,374 69,374
Deferred Revenue, non-current 3,480 3,571 3,474 3,624 3,624 3,546 3,322 3,221 3,277 3,277 3,484 3,419 3,321 3,720 3,720
Other Long-term liabilities 28,971 29,816 31,296 33,427 33,427 32,175 33,859 33,859 33,859 33,859 33,859 33,859 33,859 33,859 33,859
Total Liabilities $138,566 $132,188 $147,474 $171,124 $171,124 $165,017 $174,820 $171,475 $183,081 $183,081 $176,968 $171,394 $176,830 $196,181 $196,181
Common & Pfd. Stock & Add'l Paid-in Capital 24,187 25,376 26,327 27,416 27,416 28,253 29,484 29,484 29,484 29,484 29,484 29,484 29,484 29,484 29,484
Retained Earnings 97,178 100,920 98,252 92,284 92,284 101,494 102,021 110,154 118,659 118,659 135,200 146,690 155,501 164,955 164,955
Accumulated Other Comprehensive Income 1,963 2,710 1,098 (345) (345) (1,480) (1,048) (8,810) (19,800) (19,800) (30,671) (43,220) (54,811) (72,630) (72,630)
Total Shareholders' Equity $123,328 $129,006 $125,677 $119,355 $119,355 $128,267 $130,457 $130,828 $128,342 $128,342 $134,013 $132,955 $130,173 $121,809 $121,809
Total Liabilities and Equity $261,894 $261,194 $273,151 $290,479 $290,479 $293,284 $305,277 $302,303 $311,423 $311,423 $310,981 $304,349 $307,003 $317,990 $317,990
Source: Company data and Mizuho Securities USA estimates
June 8, 2016 96Mizuho Securities USA Inc.
Apple Inc.

Appendix
Exhibit 76: Outlook for iPhone, iPad
iPhone
iPad
iPhone 6S Plus
(2015)
IPS/FFS
5.5 inch
1920x1080
(401 ppi)
iPhone 3GS iPhone 4/4S iPhone 5/5S
Panel IPS IPS IPS/FFS
Size 3.5 inch 3.5 inch 4 inch
Resolution480x320
(163 ppi)
960x640
(326 ppi)
1136x640
(326 ppi)
Mid-term Forecasts
iPhone 5c
IPS/FFS
4 inch
1136x640
(326 ppi)
iPhone 6(2014)
IPS/FFS
4.7 inch
1334x750
(326 ppi)
iPhone 6 Plus
(2014)
IPS/FFS
5.5 inch
1920x1080
(401 ppi)
iPhone 4S: Low-end (2014 4Q EOL)
iPhone 5S/5C Middle-end (2015~)
(2014~) High-end
iPhone 6S(2015)
IPS/FFS
4.7 inch
1334x750
(326 ppi)
iPhone 7 Plus
IPS/FFS
5.5 inch
1920x1080
(401 ppi)
LTPS for 7/7S; OLED (LTPS + RBG)
perhaps as early as 7S? Giving up
on LTPO?
iPhone 9 2020?
iPhone 7S Plus+?
OLED(RGB)
5.7 inch
1920x1080
(386 ppi)
Successor to
iPhone 5S
iPhone 7
IPS/FFS
4.7 inch
1334x750
(326 ppi)
Some derivative
models w ith OLED
in 2017 or
Complete switch
over to OLED in 2018
No upgrade in resolution/appearance
iPhone 7S
IPS/FFS
4.7 inch
1334x750
(326 ppi)
iPhone 7S Plus
IPS/FFS
5.5 inch
1920x1080
(401 ppi)
Outlook for various displays
iPhone 8 Plus+?
OLED(RGB)
5.7 inch
1920x1080
(386 ppi)
iPhone 8
OLED(RGB)
4.7 inch
1334x750
(326 ppi)
iPhone 8 Plus
OLED(RGB)
5.5 inch
1920x1080
(401 ppi)
iPhone +
iPad ?
OLED
(Foldable)
6.x” + 8.x” ?
iPhone SE (2016)
IPS/FFS
4 inch
1136x640
(326 ppi)
iPad Mini
IPS
7.85 inch
1024x768
(164 ppi)
iPad Air
IPS
9.7 inch
2048x1536
(264 ppi)
iPad Mini 2
7.85 inch
2048x1536
(326 ppi)
IPSA-Si
OXIDE
iPad 1/2
Panel IPS
Size 9.7 inch
Resolution1024x768
(132 ppi)
iPad Pro (2015)
IPS (OXIDE)
12.9 inch
2732x2048
(264 ppi)
Apple Watch
Apple Watch
OLED (RGB)
1.34 inch 1.53 inch
340x272
(326 ppi)
382x312
(326 ppi)
Apple Watch
Sport / Edition
OLED (RGB)
1.34 inch 1.53 inch
340x272
(326 ppi)
382x312
(326 ppi)
iPad (large)
IPS (OXIDE)
12.9 inch
3840x2160
(342 ppi)
iPad (medium)
IPS (OXIDE)
9.7 inch
3840x2160
(454ppi)
Shift to
oxide
General shift to oxide? − Mass-production sy stems at Sharp, LGD, and SDC
− Low power consumption, high resolution (relativ e to A-Si) help reduce weight
− Low cost (compared to LTPS/OLED)- MacBook also mov ing to oxide?
− 12.9” 9.7” MacBook
A-Si− Continued use in popular dev ices?
− Cost superiority unchanged − Chinese makers like BOE could also enter the f ray
− Issues with power consumption, f rame, and resolution persist
OLED− Can be used f or f lexible display s
− Wide color gamut − Ample scope to reduce weight and power consumption
− Cost is a problem
− Focus on SDC, LGD, and JDI
LTPS− Low power consumption, high resolution
− Large number of suppliers − Production technology established
− Cost and y ields f or large-size panels an issue
iPad (extra-large)
IPS (OXIDE)
15 inch
3840x2160
(294 ppi)
iPad (small)
IPS (OXIDE)
7.85 inch
3840x2160
(561ppi)
Continue
or EOL?
15” class?
2012-2014
iPad Pro (2016)
IPS (OXIDE)
9.7 inch
2048x1536
(264 ppi)
Source: Mizuho Securities Japan Equity Research
June 8, 2016 97Mizuho Securities USA Inc.
Apple Inc.

Exhibit 77: TFT-LCD Panel Makers’ Capacity Expansion Plans (Japan, South Korea)
Technology Gen.Substrate
size
Max.
capacity
Current
Capacity
Start of
productiRemarks & Technology alliance partners
(mm) ('000/mth ('000/mth
Japan
Sharp/SDP
Mie No.2 A-Si 4.0 680 × 880 90 90 1Q01 Auto, Industrial
Tenri NF1 LTPS/Oxide 3.5 620 × 750 18 18 4Q02 To be shut dow n
Mie No.3 LTPS 4.0 730 × 920 100 100 2Q03 Smartphone, Game
Kameyama Fab2 A-Si/Oxide 8.0 2160 × 2460 72 72 3Q06 TV/NB/Tablet-Smartphone
Kameyama LTPS Fab1 LTPS 6.0 1500 × 1850 22 22 3Q12 Smartphone
Sakai Fab1 A-Si 10.0 2880 × 3130 72 72 3Q09 60"×8up, 70"×6up, 40" ×18up
Sakai OLED OLED 4.5 730 × 920 10 0 3Q17 R&D Line
Sakai Fab2 OLED 6.0 1500 × 1850 48 0 2Q18 Pilot line(12K)+Mass Production Line(36K) G6 Half
Japan Display
Higashiura LTPS 3.5 600 × 720 27 27 4Q99 OLED Backplane
Ishikaw a D1 LTPS 4.5 730 × 920 40 40 3Q06 Smartphone/OLED Backplane
Nomi D2 LTPS 5.5 1300 × 1500 25 25 2Q12 Smartphone
Ishikaw a OLED Test Line OLED 4.5 730 × 920 10 10 3Q14 Test line(WhiteOLED converted to RGB)
Mobara V3 LTPS 4.5 730 × 920 20 20 3Q01 Process for Pixel Eyes
Mobara J1 LTPS 6.0 1500 × 1850 50 50 2Q13 Smartphone
Hakusan D3 LTPS 6.0 1500 × 1850 50 25 3Q16 Smartphone(25K/25K)
Mobara OLED(test line) OLED 6.0 1500 × 1850 5 0 3Q17 Test line(Flexible OLED, G6 Half Cut)
Mobara OLED(Mass Production line) OLED 6.0 1500 × 1850 25 0 3Q18 OLED process for smartphone
Panasonic LCD
Himeji Fab1 A-Si 8.0 2200 × 2500 50 50 2Q10 32"TV, Tablet, Industrial
Korea
Samsung Display
Cheonan L5-1 A-Si 5.0 1100 × 1250 110 0 3Q02 To be closed
Cheonan L5-2 A-Si 5.0 1100 × 1250 110 0 2Q03 To be closed
Cheonan L6 A-Si 5.0 1100 × 1300 200 200 4Q03 Tablet/NB
Tangjeong T7 A-Si 7.0 1870 × 2200 140 140 2Q05 Monitor/TV
Tangjeong T7-2 A-Si 7.0 1870 × 2200 190 190 3Q08 Monitor/TV
Tangjeong T8 A-Si 8.0 2200 × 2500 170 170 3Q07 Monitor/TV
Tangjeong T8-2 A-Si 8.0 2200 × 2500 200 200 3Q10 Monitor/TV
Tangjeong A2 LTPS/OLED 5.5 1300 × 1500 150 130 2Q11 Smartphone/Tablets
Tangjeong A3 LTPS/OLED 6.0 1500 × 1850 180 15 2Q15 Smartphone/Tablets
Tangjeong V1/V2 LTPS/OLED 8.0 2200 × 2500 60 8 TBD 8K test production in 2012, TV, industrial
Suzhou Fab1 A-Si 8.0 2200 × 2500 120 120 1Q14 JV w ith TCL
Tangjeong T9 A-Si 11.0 TBD 120 0 TBD 65"×8up, 75"×6up?
LG Display
AP1 LTPS 4.5 730 × 920 75 75 2Q11 Smartphone
P6-3 LTPS 6.0 1500 × 1800 75 50 4Q13 Watch, Smartphone, Tablet
AP1 OLED OLED 4.5 730 × 920 10 10 3Q13 Watch, Smartphone
E5 OLED OLED 6.0 1500 × 1800 15 0 1Q17 Smartphone, Automobile
Kumi P4 A-Si 5.0 1000 × 1200 155 150 2Q02 Tablet/NB
Kumi P5 A-Si 5.0 1100 × 1250 150 150 2Q03 Tablet/NB
Kumi P6 A-Si 6.0 1500 × 1850 160 160 3Q04 Tablet/NB/Monitor/TV
Paju P7 A-Si 7.5 1950 × 2250 220 220 1Q06 Monitor/TV
Paju P8 A-Si 8.0 2200 × 2500 340 340 1Q09 32/47/55/22, P1-150K, P2-120K, P3-60K Total 300K
P9-1 A-Si 8.0 2200 × 2500 120 70 2Q12 Monitor/Tablet/TV
P8-3 Oxide/OLED 8.0 2200 × 2500 60 34 3Q14 55"/65"/77" TV
P10 Oxide/OLED 10.6 3300 × 3340 120 0 2018 TV/Auto
E6 OLED LTPS/OLED 6.0 1500 × 1850 90 0 3Q17 Auto/Tablet/Smartphone
Guangzhou Fab1 A-Si 8.0 2200 × 2500 120 90 3Q14 JV w ith Guanzhou City, Skyw orth
Guangzhou Fab2 A-Si 8.0 2200 × 2500 120 30 1Q16 to be 75K in 3Q16
Source: Company data, Mizuho Securities Japan Equity Research
June 8, 2016 98Mizuho Securities USA Inc.
Apple Inc.

Exhibit 78: TFT-LCD Panel Makers’ Capacity Expansion Plans (Japan, South Korea)
Technology Gen.Substrate
size
Max.
capacity
Current
Capacity
Start of
productiRemarks & Technology alliance partners
(mm) ('000/mth ('000/mth
Taiw an
AU Optronics
HsinchuL3 LTPS/OLED 3.5 610 × 720 20 20 2Q12 Smartphone
Singapore G4.5 LTPS/OLED 4.5 730 × 920 45 45 1Q13 Smartphone
Longtan L5A+L5B A-Si 5.0 1100 × 1250 120 120 2Q03 Mid-sized/NB/Monitor
Taichung L6A A-Si 6.0 1500 × 1850 150 150 2Q05 NB/Monitor/TV, conversion to Oxide
Taichung L5C A-Si 5.0 1100 × 1300 150 150 3Q05 Tablet/NB
Taichung L7A A-Si 7.5 1950 × 2250 80 80 2Q08 Monitor/TV
Taichung L7B-Located in L7B- A-Si 7.5 1950 × 2250 70 70 3Q09 TV
Taichung L8A-Located in L7B- A-Si/Oxide 8.0 2200 × 2500 45 45 2Q09 TV
Houli L10 A-Si 11.0 TBD 60 0 TBD TV
Houli L8B A-Si 8.0 2200 × 2500 120 60 2Q11 TV
AU Optronics, Ex.Quanta Display
Linko L5D A-Si 5.0 1100 × 1300 80 80 2Q03 NB/Monitor
Longtan L6B A-Si/Oxide 6.0 1500 × 1850 150 110 3Q08 Monitor/TV
Innolux, Ex. Chimei Optoelectronics
Tainan Fab3 A-Si 5.0 1100 × 1300 190 185 3Q03 Tablet/NB/Monitor
Tainan Fab4 A-Si 5.5 1300 × 1500 200 190 2Q05 Monitor/TV
Tainan Fab5 A-Si 5.0 1100 × 1300 200 195 3Q06 Tablet/NB/Monitor
Tainan Fab7 A-Si 7.5 1950 × 2250 120 120 2Q08 Monitor/TV
Tainan Fab6 A-Si 6.0 1500 × 1850 245 245 2Q08 Monitor/TV
Kaohsiung Fab8 A-Si 8.0 2200 × 2500 60 60 1Q10 TV
Kaohsiung Fab8-2 Plan1 LTPS 6.0 1500 × 1850 24 0 3Q16 Small and mid sized
Kaohsiung Fab8-2 Plan2 A-Si 8.6 2250 × 2600 40 0 4Q16 TV: 45"/50/58"
Innolux, Ex. Innolux
Chunan Fab1 A-Si 5.0 1100 × 1300 90 90 1Q05 Small and Mid sized
Chunan Fab2 A-Si 4.5 730 × 920 50 45 1Q05 Small and Mid sized
Chunan Fab3 A-Si 6.0 1500 × 1850 130 115 3Q09 Monitor/TV, to be expanded to 170K
Innolux, Ex.TPO
Chunan Fab1 LTPS 3.5 620 × 750 90 75 2Q02 Small and Mid sized
Chunghw a Picture Tube
Longtan L1-A/B A-Si 4.5 730 × 920 180 180 3Q03 Small and Mid sized
Longtan L2 A-Si 6.0 1500 × 1850 100 90 2Q07 Small and Mid sized/Monitor/TV
Hannstar Display
Tainan Fab1 A-Si 5.0 1200 × 1300 110 110 1Q05 Small and Mid sized
Tainan Fab2 A-Si 6.5? 1620 × 1970 30 0 TBD Small and Mid sized
Source: Company data, Mizuho Securities Japan Equity Research
June 8, 2016 99Mizuho Securities USA Inc.
Apple Inc.

Exhibit 79: TFT-LCD Panel Makers’ Capacity Expansion Plans (Japan, South Korea)
Technology Gen.Substrate
size
Max.
capacity
Current
Capacity
Start of
productiRemarks & Technology alliance partners
(mm) ('000/mth ('000/mth
China
BOE-OT
B1:Beijing Fab1 A-Si 5.0 1100 × 1300 60 60 3Q08 Small-Mid
B2:Chengdu Fab A-Si 4.5 730 × 920 60 41 1Q10 Small and Mid sized
B4:Beijing Fab2 A-Si 8.0 2200 × 2500 140 140 3Q11 Mid-sizes/TV
B3:Anhui-Hefei Fab1 A-Si 6.0 1500 × 1850 120 120 4Q10 Monitor/TV
B5:Anhui-Hefei Fab2 A-Si/Oxide 8.0 2200 × 2500 120 120 1Q14 Oxide process to be introduced, Tablet/TV
B6:Ordos Fab1 LTPS/OLED 5.5 1300 × 1500 40 25 2Q14 Smartphone/Tablet/TV
B8:Chongqing Fab1 A-Si/Oxide 8.0 2200 × 2500 120 120 2Q15 Tablet/NB/Monitor/TV
B7:Chengdu LTPS/flex OLED 6.0 1500 × 1850 60 0 3Q17 Small mid sizes
B9:Hefei A-Si 10.5 2900 × 3370 90 0 2Q18 65"×8up, 75"×6up
B10:Fuqing A-Si 8.0 2200 × 2500 120 0 3Q17 TV
B11:Mianyang A-Si 8.0 2200 × 2500 120 0 2018 TV, Change to G6 LTPS/OLED??
B12:Dalian A-Si 8.0 2200 × 2500 120 0 2019 TV
Kunshan Fab1 A-Si 5.0 1100 × 1300 120 120 1Q07 Small mid sized
Nanjing Fab1 A-Si 6.0 1500 × 1800 90 90 3Q11 Monitor/TV, Sharp's Kameyama Fab1 Facility + 20K
Nanjing Fab2 A-Si/Oxide 8.0 2200 × 2500 60 30 3Q15 Collaboration w ith Sharp
Xianyang Fab1 A-Si/Oxide 8.6 2250 × 2600 60 0 2018 Development by their ow n
Chengdu Fab1 A-Si/Oxide 8.6 2250 × 2600 60 0 2018 Development by their ow n
Shenzhen Fab1 A-Si 5.0 1200 × 1300 90 90 3Q09 Smartphone/NB/Monitor
Shenzhen Fab2 LTPS/OLED 5.0 1200 × 1300 20 20 1Q12 Smartphone
Shenzhen T1 A-Si 8.0 2200 × 2500 140 140 1Q12 TV
Shenzhen T2 A-Si 8.0 2200 × 2500 140 90 2Q15 TV
Wuhan T3 LTPS 6.0 1500 × 1850 60 0 1Q16 Small Mid sizes
Wuhan T4 LTPS/Flex OLED TBD TBD TBD 0 TBD Small Mid sizes
Shenzhen T5 A-Si 10.6 TBD TBD 0 2018 TBD
HKC
Chongqing Fab1 A-Si 8.6 2250 × 2600 70 0 3Q17 TV
Hehui
Shanghai Fab1 LTPS/OLED 4.5 730 × 920 15 15 2Q15 Smartphone
Shanghai Fab2 LTPS/OLED 6.0 1500 × 1850 60 0 2018 Smartphone
Tianma
Xiamen Fab1 LTPS 5.5 1300 × 1500 35 35 2Q13 Smartphone
Xiamen Fab2 LTPS 6.0 1500 × 1850 30 0 4Q16 Smartphone/CF capacity 60K
Shanghai Fab2 OLED process 6.0 1500 × 1850 30 0 1Q17 TBD
Wuhan LTPS/flex OLED 6.0 1500 × 1850 30 0 4Q17 TBD/No CF capacity
Tianma(Jonhon Optronic)
Shanghai Fab1 A-Si 5.0 1100 × 1300 70 70 1Q05 Small and Mid sized /Monitor
Visionox
Kunshan Fab1 LTPS/OLED 5.5 1300 × 1500 60 0 TBD Smartphone/Starting w ith 10K
Truly
Huizhou G4.5 LTPS/OLED 4.5 730 × 920 30 0 3Q16 Equipments bought from Samsung L4
China
Kunshan Fab2 LTPS 6.0 1500 × 1850 30 0 1Q17 AUO+Kunshan Government
Tianyi Display/Hon Hai Group
Zhengzhou Fab1 LTPS/OLED 6.0 1500 × 1850 60 0 TBD To be copied from Kaohsiung fab/Smartphone
Zhengzhou Fab2 Oxide? 8.0 2200 × 2500 60 0 TBD TBD
Guizhou Fab1 LTPS/OLED 6.0 1500 × 1850 60 0 TBD To be copied from Kaohsiung fab/Smartphone
Fuzhou Fab1 Oxide or LTPS 6.0 1500 × 1850 30 0 2017 Smartphone
IVO
CEC Panda
Century Display
Chinastar(TCL Group)
FVO
CPT Technology
Source: Company data, Mizuho Securities Japan Equity Research
June 8, 2016 100Mizuho Securities USA Inc.
Apple Inc.

Price Target Calculation and Key RisksOur price target is derived using an equally weighted three-pronged valuation approach,which includes a DCF, Enterprise Value (EV) to FCF, and EV to operating earningsanalysis. Our assumptions are based on comparables in the information technologyhardware universe.
Based on an EV to FCF multiple of 10.0x our 2016 estimate, we come up with a share priceof $122. For our EV to forward 12-month operating earnings analysis, we have calculateda share price of $124 based on a 12x multiple on our CY 2016 EPS estimate. Finally, ourDCF assumes a discount rate of 10% and a terminal FCF multiple of 12x, suggesting fairvalue 12 months hence of $115. This implies a free cash flow perpetuity growth rate ofabout 1.5%. Given these inputs, we reach our 12-month price target of $120.
On the downside, the biggest risk to Apple's stock could result from the company's inabilityto keep innovating. The current management team is very capable of delivering on SteveJobs's vision, however, the stock could be materially impacted if the company were to losesome key executives. Additionally, more than expected slowdown in iPhone sales couldpush the stock materially lower.
June 8, 2016 101Mizuho Securities USA Inc.
Apple Inc.

Companies Mentioned (prices as of 6/07 )Broadcom Limited (AVGO- Buy $164.84)CHINA TELECOM CORP LTD-ADR (CHA- Not Rated)Compal Computer (2324 TWDNA)Fossil Group, Inc. (FOSL- Neutral $29.34)Hon Hai Precision Industry (HHPD- Not Rated)Intel Corporation (INTC- Buy $31.88)LG Display (034220 KRW24,650.00)Micron Technology, Inc. (MU- Buy $13.00)Murata Mfg. (6981)Nissha Printing Co Ltd (7915)Pandora Media, Inc. (P- Neutral $12.08)Qorvo, Inc (QRVO- Buy $55.49)Qunata Computer (2382 TWDNA)Samsung Electronics (005930 KRW1,398,000.00)Sony Corp (SNE)Synaptics Inc. (SYNA- Neutral $65.42)Texas Instruments Incorporated (TXN- Neutral $61.56)T-Mobile US, Inc. (TMUS $43.74)Western Digital Corp (WDC- Buy $49.74)
China Mobile Ltd. (CHL)China Unicom Hong Kong Ltd. (CHU)Cypress Semiconductor Corporation (CY- Buy $11.04)Google (GOOG)HTC (2498 TWDNA)Lenovo (992 HK$NA)LG Electronics (066570 KRW54,300.00)Microsoft (MSFT- Not Rated)Netflix, Inc. (NFLX- Neutral $99.89)NXP Semiconductors NV (NXPI- Buy $90.49)Pegatron (4938 TWD70.60)QUALCOMM Incorporated (QCOM- Neutral $54.84)Renesas Technology (6723 ¥631.00)Skyworks Solutions, Inc. (SWKS- Buy $68.67)Sony Corp. (6758)TESLA MOTORS INC (TSLA- Not Rated)Time Warner Inc (TWX- Not Rated)TPK (3673 TWDNA)
IMPORTANT DISCLOSURESThe disclosures for the subject companies of this report as well as the disclosures for Mizuho Securities USA Inc. entire coverage universe can be foundat https://msusa.bluematrix.com/sellside/Disclosures.action or obtained by contacting [email protected] or via postal mailat Equity Research Editorial Department, Mizuho Securities USA Inc., 320 Park Avenue, 12th Floor, New York NY, 10022.
Ownership Disclosures and Material Conflicts of Interest or Position as Officer or DirectorNone
Receipt of CompensationMizuho Securities USA Inc. and or its affiliates makes a market in the following securities: Apple Inc., Broadcom Limited, CHINA TELECOM CORPLTD-ADR, China Mobile Ltd., China Unicom Hong Kong Ltd., Cypress Semiconductor Corporation, Fossil Group, Inc., Google, Intel Corporation,Microsoft, Micron Technology, Inc., Netflix, Inc., NXP Semiconductors NV, Pandora Media, Inc., QUALCOMM Incorporated, Qorvo, Inc, Sony Corp,Skyworks Solutions, Inc., Synaptics Inc., T-Mobile US, Inc., TESLA MOTORS INC, Time Warner Inc, Texas Instruments Incorporated and WesternDigital Corp
Mizuho Securities USA Inc. has provided non-securities-related services for Apple Inc. who is or was a client in the past 12 months.
Mizuho Securities USA Inc. and or its affiliates expects to receive or intends to seek compensation for investment banking services for RenesasTechnology, Sony Corp., Sony Corp, Time Warner Inc, Texas Instruments Incorporated and Western Digital Corp in the next 3 months.
Mizuho Securities USA Inc. and or its affiliates has received compensation for investment banking services for Sony Corp., Nissha Printing Co Ltd,Sony Corp, Time Warner Inc, Texas Instruments Incorporated and Western Digital Corp in the past 12 months.
Mizuho Securities USA Inc. and or its affiliates has managed or co-managed a public offering of securities for Sony Corp., Nissha Printing Co Ltd,Sony Corp, Time Warner Inc, Texas Instruments Incorporated and Western Digital Corp in the past 12 months.
Mizuho Securities USA Inc. and or its affiliates has received compensation for products or services other than investment banking services for TimeWarner Inc and Texas Instruments Incorporated in the past 12 months.
Mizuho Securities USA Inc. has provided non-investment banking securities-related services for Time Warner Inc and Texas Instruments Incorporatedwho are or were clients in the past 12 months.The compensation of the research analyst writing this report, in whole or part, is based on MSUSA's annual revenue and earnings and is not directly relatedto any specific investment banking compensation. MSUSA's internal policies and procedures prohibit research analysts from receiving compensationfrom companies covered in the research reports.
Regulation Analyst Certification (AC)I, Abhey Lamba, hereby certify that the views expressed in this research report accurately reflect my personal views about any and all the subjectcompanies. No part of my compensation was, is or will be, directly or indirectly, related to the specific recommendations or views expressed in thisresearch report.
Rating Definitions
Mizuho Securities USA investment ratings are based on the following definitions. Anticipated share price change is based on a 6- to 12-month timeframe. Return expectation excludes dividends.
Buy:Neutral:Underperform:
Stocks for which the anticipated share price appreciation exceeds 10%.Stocks for which the anticipated share price appreciation is within 10% of the share price.Stocks for which the anticipated share price falls by 10% or more.
June 8, 2016 102Mizuho Securities USA Inc.
Apple Inc.

RS:NR:
Rating Suspended - rating and price objective temporarily suspended.No Rating - not covered, and therefore not assigned a rating.
Rating Distribution(As of 6/07 ) % of coverage IB service past 12 moBuy (Buy) 47.06% 36.46%
Hold (Neutral) 50.98% 25.00%
Sell (Underperform) 1.96% 25.00%
For disclosure purposes only (NYSE and FINRA ratings distribution requirements), our Buy, Neutral and Underperform ratings are displayed as Buy, Hold and Sell,respectively.
For additional information: Please log on to http://www.mizuhosecurities.com/us or write to Mizuho Securities USA, 320 Park Ave, 12th FL, NewYork, NY 10020.
DisclaimersThis report has been prepared by Mizuho Securities USA Inc. (“MSUSA”), a subsidiary of Mizuho Securities Co., Ltd. (“MHSC”), solely for thepurpose of supplying information to the clients of MSUSA and/or its affiliates to whom it is distributed. This report is not, and should not be construedas, a solicitation or offer to buy or sell any securities or related financial products.
This report has been prepared by MSUSA solely from publicly available information. The information contained herein is believed to be reliable buthas not been independently verified. MSUSA makes no guarantee, representation or warranty, and MSUSA, MHSC and/or their affiliates, directors,employees or agents accept no responsibility or liability whatsoever as to the accuracy, completeness or appropriateness of such information or for anyloss or damage arising from the use or further communication of this report or any part of it. Information contained herein may not be current due to,among other things, changes in the financial markets or economic environment. Opinions reflected in this report are subject to change without notice.
This report does not constitute, and should not be used as a substitute for, tax, legal or investment advice. The report has been prepared without regard tothe individual financial circumstances, needs or objectives of persons who receive it. The securities and investments related to the securities discussedin this report may not be suitable for all investors, and the report is intended for distribution to Institutional Investors. Readers should independentlyevaluate particular investments and strategies, and seek the advice of a financial adviser before making any investment or entering into any transactionin relation to the securities mentioned in this report.
MSUSA has no legal responsibility to any investor who directly or indirectly receives this material. Investment decisions are to be made by and remainas the sole responsibility of the investor. Investment involves risks. The price of securities may go down as well as up, and under certain circumstancesinvestors may sustain total loss of investment. Past performance should not be taken as an indication or guarantee of future performance. Unlessotherwise attributed, forecasts of future performance represent analysts’ estimates based on factors they consider relevant. Actual performance mayvary. Consequently, no express or implied warranty can be made regarding future performance.
Any references in this report to Mizuho Financial Group, Inc. (“MHFG”), MHSC and/or its affiliates are based only on publicly available information.The authors of this report are prohibited from using or even obtaining any insider information. As a direct subsidiary of MHSC and indirect subsidiaryof MHFG, MSUSA does not, as a matter of corporate policy, cover MHFG or MHSC for investment recommendation purposes.
MSUSA or other companies affiliated with MHFG or MHSC, together with their respective directors and officers, may have or take positions in thesecurities mentioned in this report, or derivatives of such securities or other securities issued by companies mentioned in this report, for their ownaccount or the accounts of others, or enter into transactions contrary to any recommendations contained herein, and also may perform or seek to performbroking and other investment or securities related services for the companies mentioned in this report as well as other parties generally.
Restrictions on DistributionThis report is not directed to, or intended for distribution to or use by, any person who is a citizen or resident of, or entity located in, any locality, territory,state, country or other jurisdiction where such distribution, publication, availability or use would be contrary to or restricted by law or regulation. Personsor entities into whose possession this report comes should inform themselves about and observe such restrictions.
United States: Mizuho Securities USA Inc., a member of the MHSC Group, 320 Park Avenue, 12th Floor, New York, NY 10022, USA, contact number+1-212-209-9300, distributes or approves the distribution of this report in the United States and takes responsibility for it. Any transaction by a USinvestor resulting from the information contained in this report may be effected only through MSUSA. Interested US investors should contact theirMSUSA sales representative.
United Kingdom/European Economic Area: This report is distributed or has been approved for issue and distribution in the UK by MizuhoInternational plc (“MHI”), Bracken House, One Friday Street, London EC4M 9JA, a member of the MHSC Group. MHI is authorized and regulated
June 8, 2016 103Mizuho Securities USA Inc.
Apple Inc.

by the Financial Services Authority and is a member of the London Stock Exchange. For the avoidance of doubt this report is not intended for retailclients. This report may be distributed in other member states of the European Union.
Japan: This report is distributed in Japan by Mizuho Securities Co., Ltd. (“MHSC”), Otemachi First Square Otemachi 1-chome, Chiyoda-ku, Tokyo100-0004, Japan. Registered Financial Instruments Firm, No. 94 (Kinsho), issued by the Director, Kanto Local Finance Bureau. MHSC is a memberof the Japan Securities Dealers Association, the Japan Securities Investment Advisers Association and the Financial Futures Association of Japan, andthe Type II Financial Instruments Firms Association.
Singapore: This report is distributed or has been approved for distribution in Singapore by Mizuho Securities (Singapore) Pte. Ltd. (“MHSS”), amember of the MHSC Group, which is regulated by the Monetary Authority of Singapore. Any research report produced by a foreign Mizuho entity,analyst or affiliate is distributed in Singapore only to “Institutional Investors,” “Expert Investors” or “Accredited Investors” as defined in the Securitiesand Futures Act, Chap. 289 of Singapore. Any matters arising from, or in connection with this material, should be brought to the attention of MHSS.
Hong Kong: This report is being distributed in Hong Kong by Mizuho Securities Asia Limited (“MHSA”), a member of the MHSC Group, which islicensed and regulated by the Hong Kong Securities and Futures Commission.
Australia: This report is being distributed in Australia by MHSA, which is exempted from the requirement to hold an Australian financial serviceslicense under the Corporation Act 2001 (“CA”) in respect of the financial services provided to the recipients. MHSA is regulated by the Securities andFutures Commission under the laws of Hong Kong, which differ from Australian laws. Distribution of this report is intended only for recipients whoare “wholesale clients” within the meaning of the CA.
If you do not wish to receive our reports in the future, please contact your sales person and request to be removed from receiving this distribution.
© Mizuho Securities USA Inc. All Rights Reserved 2016. This document may not be altered, reproduced or redistributed, or passed on to any otherparty, in whole or in part, without the prior written consent of Mizuho Securities USA Inc.
June 8, 2016 104Mizuho Securities USA Inc.
Apple Inc.