General Information Sheet (GIS) for the Year 2022 - PDS Group
Upload
khangminh22Category
view
0download
0
1
PSE Number: E-5000 SEC Number: 152-747 File Number: ________
AYALA LAND, INC. ___________________________________
(Company’s Full Name)
31F Tower One and Exchange Plaza, Ayala Triangle, Ayala Avenue, Makati City 1226
___________________________________ (Company Address)
(632) 7908-3111 ___________________________________
(Telephone Number)
December 31, 2020 ___________________________________
(Year Ending)
Annual Report - SEC Form 17-A ___________________________________
(Form Type) ___________________________________
(Amendments – if applicable)
2
SECURITIES AND EXCHANGE COMMISSION
SEC FORM 17-A
ANNUAL REPORT PURSUANT TO SECTION 17 OF THE SECURITIES REGULATION CODE AND SECTION 141 OF THE CORPORATION CODE OF THE PHILIPPINES
1. For the fiscal year ended December 31, 2020 2. SEC Identification Number 152747 3. BIR Identification No. 000-153-790-000 4. Exact name of the issuer as specified in its charter: AYALA LAND, INC. 5. Province, Country or other jurisdiction of incorporation or organization: Makati City, Philippines 6. Industry Classification Code: _______ (SEC Use Only) 7. Address of principal office and postal code: 31F Tower One and Exchange Plaza,
Ayala Triangle, Ayala Avenue, Makati City 1226 8. Issuer’s telephone number, including area code: (632) 7908-3111 9. Former name, former address, former fiscal year: not applicable 10. Securities registered pursuant to Sections 8 and 12 of the SRC, or Sections 4 and 8 of the RSA: As of January 31, 2021 Title of each class Number of shares issued and outstanding Common shares 14,730,395,599 Preferred shares 13,066,494,759 Amount of debt outstanding: P126,900,000,000.00 (Registered) 11. Are any or all of these securities listed on a Stock Exchange? Yes [x] No [ ]
Name of Stock Exchange: Philippine Stock Exchange Class of securities listed: Common shares
14,553,556,858 common shares have been listed with the Philippine Stock Exchange.

3
12. Check whether the issuer: (a) has filed all reports required to be filed by Section 17 of the SRC and SRC Rule 17 thereunder or
Section 11 of the RSA and RSA Rule 11(a)-1 thereunder, and sections 26 and 141 of the Corporation Code of the Philippines during the preceding 12 months (or for such shorter period that the registrant was required to file such reports):
Yes [x] No [ ] (b) has been subject to such filing requirements for the past 90 days: Yes [x] No [ ] 13. Aggregate market value of the voting stock held by non-affiliates:
APPLICABLE ONLY TO ISSUERS INVOLVED IN INSOLVENCY/SUSPENSION OF PAYMENTS PROCEEDINGS
DURING THE PRECEEDING FIVE YEARS 14. Check whether the issuer has filed all documents and reports required to be filed by Section 17 of
the Code subsequent to the distribution of securities under a plan confirmed by a court or the Commission.
Yes [ ] No [ ] Not applicable
DOCUMENTS INCORPORATED BY REFERENCE 15. Briefly describe documents incorporated by reference and identify the part of the SEC Form 17-A
into which the document is incorporated:
2020 Audited Consolidated Financial Statements (incorporated as reference for Items 5, 7, 10 & 12 of SEC Form 17-A)

4
TABLE OF CONTENTS Page No. PART I - BUSINESS Item 1. Business 5 Item 2. Properties 17 Item 3. Legal Proceedings 19 Item 4. Submission of Matters to a Vote of Security Holders 20 PART II – SECURITIES OF THE REGISTRANT Item 5. Market for Issuer’s Common Equity and Related
Stockholder Matters 21 PART III – FINANCIAL INFORMATION Item 6. Management’s Discussion and Analysis and Results of Operation 25 Item 7. Financial Statements 41 Item 8. Information on Independent Accountant and
Other Related Matters 41 PART IV – MANAGEMENT AND CERTAIN SECURITY HOLDERS Item 9. Directors and Executive Officers of the Issuer 43 Item 10. Executive Compensation 56 Item 11. Security Ownership of Certain Beneficial
Owners and Management 58 Item 12. Certain Relationships and Related Transactions 59 PART V – CORPORATE GOVERNANCE Item 13. Compliance with Leading Practice on Corporate Governance 60 EXHIBITS AND SCHEDULES Item 14. Exhibits and Reports on SEC Form 17-C 61
(a) Exhibits (b) Reports on SEC Form 17-C SIGNATURES 63 INDEX TO EXHIBITS 64 INDEX TO SUPPLEMENTARY SCHEDULES 69

5
PART I - BUSINESS Item 1. Business
Background Ayala Land, Inc. (“Ayala Land” or the “Company”) was formerly the real estate division of Ayala Corporation and was incorporated on June 30, 1988 to focus on the development of its existing real estate assets. In July 1991, the Company became publicly-listed through an initial public offering (“IPO”) of its primary and secondary shares on the Makati and Manila Stock Exchanges (predecessors of the PSE). Ayala Corporation’s effective ownership in Ayala Land amounted to 88% as a result of the IPO. Over the years, several developments further reduced Ayala Corporation’s effective interest in Ayala Land; the exercise of stock options by respective employees of Ayala Corporation and Ayala Land, the disposal of Ayala Land shares by Ayala Corporation and Ayala Land’s issuance of new shares in relation to its acquisition of interest in companies owning properties in Canlubang, Laguna in 1993. Furthermore, the conversion of a P3.0 billion, convertible, long-term commercial paper to Ayala Land Common B Shares publicly issued in December 1994, exchanges under bonds due in 2001, and equity top-up placements conducted through an overnight book-built offering in July 2012, March 2013 and January 2015. In 2019, bond holders of the US$300 million exchangeable bonds issued by AYC Finance Limited, a wholly-owned subsidiary of Ayala Corporation, exercised their option to redeem shares of ALI. This decreased the shares directly owned by Ayala Corporation by 2.6%. As of December 31, 2020, Ayala Corporation’s effective ownership in Ayala Land is 44.44% with the remainder owned by the public. Ayala Land is listed with a total of 14,730,395,599 outstanding common shares and 13,066,494,759 voting preferred shares. Foreign ownership is 21.72% composed of 5,430,913,997 outstanding common shares and 607,264,635 voting preferred shares. Equity attributable to equity holders of Ayala Land amounted to ₱222.5 billion. Ayala Land has a total market capitalization of P602.5 billion based on the closing price of P40.90 per common share on December 29, 2020, the last trading day of the year. Ayala Land is the largest and most diversified real estate conglomerate in the Philippines. It is engaged in land acquisition, planning, and development of large scale, integrated, mixed-use, and sustainable estates, industrial estates, development and sale of residential and office condominiums, house and lots, and commercial and industrial lots, development and lease of shopping centers and offices, co-working spaces, and standard factory buildings and warehouses, and the development, management, and operation of hotels and resorts and co-living spaces. The Company is also engaged in construction, property management, retail electricity supply and airline services. It also has investments in AyalaLand Logistics Holdings Corp., Cebu Holdings, Inc., Ortigas Land Corp., MCT Bhd, Qualimed and Merkado Supermarket. Ayala Land has 30 estates, is present in in 57 growth centers nationwide and has a total land bank of 12,483 hectares at the end of 2020. Products / Business Lines Property Development Property Development is composed of the Strategic Land Bank Management Group, Visayas-Mindanao Group, Residential Business Group and MCT Bhd, Ayala Land’s listed subsidiary in Malaysia. The Strategic Land Bank Management Group handles the acquisition, planning and development of large scale, mixed-use, and sustainable estates, and the development and sale, or lease of its commercial lots in its estates in Metro Manila and the Luzon region.
6
The Visayas-Mindanao Group handles the acquisition, planning and development of large scale, mixed-use, and sustainable estates, and the development and sale, or lease of its commercial lots in its estates in key cities in the Visayas and Mindanao regions. The Residential Business Group handles the development and sale of residential and office condominiums and house and lots for the luxury, upscale, middle-income, affordable, and socialized housing segments, and the development and sale of commercial lots under the following brands: AyalaLand Premier (“ALP”) for luxury lots, residential and office condominiums, Alveo Land Corp. (“Alveo”) for upscale lots, residential and office condominiums, Avida Land Corp. (“Avida”) for middle-income lots, house and lot packages, and residential and office condominiums, Amaia Land Corp. (“Amaia”) for affordable house and lot packages and residential condominiums, and BellaVita Land Corp. (“BellaVita”) for socialized house and lot packages. MCT Bhd. is a publicly-listed property developer in Malaysia engaged in land acquisition, planning, and development of residential condominiums for sale for middle income segment. MCT has a land bank of 286 acres located in Subang Jaya, Cyberjaya and Petaling Jaya. Ayala Land owns 66.3% in MCT Bhd.
Commercial Leasing Commercial Leasing involves the development and lease of shopping centers through Ayala Malls, and offices, through Ayala Land Offices, co-working spaces through the “Clock In” brand, and standard factory buildings and warehouses under the “ALogis” brand, and the development, management, and operation of hotels and resorts through AyalaLand Hotels and Resorts, Inc. and co-living spaces through “The Flats” brand. Services Services include construction, property management, retail electricity supply and airline services. Construction of Ayala Land and third-party projects and land development is done through Makati Development Corporation (“MDC”). Property Management is done through Ayala Property Management Corporation (“APMC”). Retail electricity supply is done through Direct Power Services, Inc. (DPSI), Ecozone Power Management, Inc. (EPMI), and Philippine Integrated Energy Solutions, Inc. (PhilEnergy). Airline service is done through AirSWIFT for Ayala Land’s tourism estates in Lio, Palawan and Sicogon Island resort through its fleet of four modern turbo-prop aircrafts. Strategic Investments Ayala Land’s strategic investments include AyalaLand Logistics Holdings Corp. (71.68%) Cebu Holdings, Inc. (71.13%), MCT Bhd., (66.3%), Merkado Supermarket (50.0%), Qualimed (40.0%) and OCLP Holdings, Inc. (21.01%) Products / Business Lines (with 10% or more contribution to 2020 consolidated revenues before intercompany adjustments):
Property Development 67% Commercial Leasing 25% Services 7%

7
Distribution Methods of Products The Company’s residential products are distributed to a wide range of property buyers through various sales groups. Ayala Land has its own in-house sales team for ALP projects. In addition, it has a wholly-owned subsidiary, Ayala Land Sales, Inc. (“ALSI”), which employs commission-based sales people. Ayala Land uses a sales force of about 15,000 brokers and sales agents guided by a strict Code of Ethics. Separate sales groups have also been formed for Alveo, Avida, Amaia and BellaVita. Ayala Land and its subsidiaries also tap external brokers to complement these sales groups. Marketing to the Overseas Filipino (“OF”) market is handled by Ayala Land International Sales, Inc. (“ALISI”). Created in March 2005, ALISI leads the marketing, sales and channel development activities and marketing initiatives of the brands abroad through project websites, permanent sales offices or broker networks, and regular roadshows with strong follow-through marketing support in key cities abroad. ALISI has marketing offices in North America (Milpitas and San Francisco), Hong Kong, Singapore, Dubai, Rome, and London. ALISI likewise assumed operations of AyalaLand Int’l. Marketing in Italy and London, in 2014. In addition, the Ayala Group also developed “One Ayala,” a program which bundles the products and services of Ayala Land, BPI, and Globe Telecom, Inc. and gives access to potential Ayala Land clients overseas through BPI’s 17 overseas offices and 81 tie-ups. An Ayala Land-BPI Dream Deals program was also created to generate additional sales from the local market. Since 2008, all residential sales support transactions are undertaken by the shared services company Amicassa Process Solutions, Inc. (“APSI”) while all transactional accounting processes across the Ayala Land Group are handled by Aprisa Business Solutions, Inc. (“APRISA”) since 2010.
Development of the business of the registrant and its key operating subsidiaries/associates and joint ventures during the past three years 2020 Ayala Land endured the severe impact of COVID-19 in 2020 recording a 43% decline in consolidated revenues to P96.3 billion from P168.8 billion and a 74% drop in net income to P8.7 billion from P33.2 billion. Key indicators improved steadily from the third quarter to the fourth quarter reflecting a 49% growth in total revenues to P33.0 billion and a 28% jump in net income to P2.4 billion, sustaining the momentum for recovery. Despite limited sales mobility, sales reservations registered at P81.9 billion, 56% of the level in 2019. Office gross leasable area (GLA) increased to 1.23 million sq. meters while new hotel and resort rooms opened bringing the total to 4,030 rooms. Shopping center GLA was steady at 2.12 million sq. meters. Capital expenditures amounted to P63.67 billion, within the revised full-year budget of P70.0 billion. The company launched one new estate during the year namely: South Coast City in Cebu City. AREIT, Inc. (formerly One Dela Rosa Property Development, Inc.) was incorporated in September 4, 2006. As of September 30, 2020, the company is 44.58% owned by ALI, 9.85% owned by AyalaLand Offices, Inc. (ALOI), a wholly-owned entity of ALI, and 45.57% public after the company was listed in the Philippine Stock Exchange on August 13, 2020. Effectively, ALI’s ownership was reduced from 100.00% to 54.43% as a result of public offering. The company was organized primarily as a real estate investment trust, as provided under Republic Act No. 9856 (the Real Estate Investment Trust Act of 2009), including its implementing rules and regulations and other applicable laws.
Swift Aerodrome Services, Inc. was incorporated in January 20, 2020 and is 100% owned by ALI Capital Corporation (ALICAP), a wholly owned subsidiary of ALI. The company was organized primarily to manage and operate airports owned by ALI.

8
Altaraza Development Corporation was incorporated on May 27, 2020 and is 51% owned by ALI and 49% owned by Gregorio Araneta, Inc. and Araza Resources, Inc. (“Araneta Group”). The company was organized primarily to acquire and develop or hold land for investments in Altaraza Estate in Bulacan. 2019 Ayala Land’s net income grew by 13% to P33.2 billion from P29.2 billion in 2018. Total revenues increased by 2% to P168.8 billion from P166.3 billion mainly driven by real estate revenues which grew by 1% to P157.9 billion. Revenues were supported by office and commercial and industrial lot sales and higher contribution of new leasing assets. Sales reservations grew 3% to P145.9 billion, fueled by the growth of Alveo and Avida. The commercial leasing business continued to expand with shopping centers gross leasable area (GLA now at 2.12 million sq. meters, office GLA at 1.17 million sq. meters and hotel and resorts rooms at 3,705. Total capital expenditures reached P108.7 billion. The company launched three new estates during the year namely: Alveo’s Broadfield in Binan, Laguna, The Junction Place in Quezon City, and Cresendo in Tarlac. On July 19, 2019, AyalaLand Logistics Holdings, Corp. (ALLHC), formerly Prime Orion Philippines, Inc. acquired 100% ownership of Unity Realty & Development Corporation (URDC). URDC owns a 192-hectare property in Mabalacat City, Pampanga which will be developed into an industrial park. 2018 Ayala Land registered a solid topline and bottomline growth of 17% and 16% respectively, with revenues of P166.2 billion and net income of P29.2 billion. Property sales grew 16% to P141.9 billion driven by strong local and overseas Filipino demand. Its leasing business expanded with shopping centers gross leasable area (GLA) of 1.90 million sq, meters, office GLA of 1.11 million sq. meters and hotels and resorts rooms of 2,973. The total capital expenditure reached P110.1 billion. It launched two estates: Parklinks in the Quezon City – Pasig City corridor, and Habini Bay in Laguindingan, Misamis Oriental. On December 17, 2018, Asiatown Hotel Ventures, Inc., a wholly owned subsidiary of AyalaLand Hotels and Resorts Corp. (AHRC) was incorporated for the development of Seda Cebu IT Park. On November 15, 2018, AMC Japan Concepts, Inc. was incorporated primarily to manage the Glorietta Roofdeck – Japan Town. It is 75% owned by ALI Commercial Center, Inc. and 25% owned by MC Commercial Property Holdings, Inc. On September 12, 2018, One Makati Residential Ventures, Inc., a wholly owned subsidiary of AyalaLand Hotels and Resorts Corp. (AHRC) was incorporated for the development of One Ayala Residences. Bankruptcy, Receivership or Similar Proceedings None for any of the subsidiaries and affiliates above. Material Reclassification, Merger, Consolidation or Purchase or Sale of a Significant Amount of Assets (not ordinary) over the past three years 2020 On December 21, 2020, White Knight Holdings, Inc., a wholly-owned subsidiary of Ayala Land, Inc. (“ALI”) entered into a Share Purchase Agreement with Healthway Philippines, Inc. (“HPI”), a wholly-owned subsidiary of Ayala Healthcare Holdings, Inc. to sell its 39.20% share in the outstanding capital stock of Mercado General Hospital, Inc., the holding company for the QualiMed healthcare network of hospitals and clinics, (“MGHI”).

9
On September 16, 2020, ALO Prime Realty Corporation, a wholly owned subsidiary or Ayala Land, sold Teleperformance Cebu, a BPO office building located in Cebu IT Park, to AREIT for a total consideration of P1.45 billion. 2019 On December 2, 2019, Avida Land Corporation (Avida), a subsidiary of Ayala Land, Inc., together with Philippine Estates Corporation (PHES) and subsidiaries of Wellex Industries, Inc. (WIN), have mutually agreed to terminate the Memorandum of Agreement (MOA) executed by the parties in December 2012, for the proposed development of the 21-hectare property known as “Plastic City”, located in Valenzuela. On September 24, 2019, ALI sold to Manila Jockey Club, Inc. (MJC) its rights, titles and interest in Vertex One Building, located at Felix Huertas Road, Sta. Cruz, Manila, consisting of office units with an aggregate area of 13,517 sqm and 206 appurtenant parking spaces, resulting in MJC owning 100% of Vertex One for a total consideration of P511,653,100.00. On September 9, 2019, Orion Land, Inc. sold through a special block sale, 215,090,031 common shares of ALLHC to its affiliate, Avida Land Corporation for a total consideration of P628,062,891.00. On September 27, 2019, ALI acquired the 215,090,031 common shares of ALLHC from Avida Land Corp. through a special block sale at P2.92/share for a total consideration of P628,062,891.00. As a result of the transaction, ALI’s effective ownership in ALLHC increased to 71.68%. On September 3, 2019, Ayala Land acquired additional shares in Vesta Property Holdings, Inc., increasing its total ownership in the company to 78.41% from 70.00% previously. On July 19, 2019, AyalaLand Logistics Holdings, Corp. (ALLHC), formerly Prime Orion Philippines, Inc. acquired 100% ownership of Unity Realty & Development Corporation (URDC). URDC owns a 192-hectare property in Mabalacat City, Pampanga which will be developed into an industrial park. On June 10, 2019, ALI sold its 20% equity interest or 8,051 common shares in LTI to ALLHC for a consideration of P800 million. On May 24, 2019 the Board of Directors of Ayala Land Inc., (ALI) approved the acquisition of Avida Land, Corp., a wholly-owned subsidiary of Ayala Land, Inc., of 264,534,247 shares of AyalaLand Logistics Holdings Corp. (ALLHC) from Orion Land Inc., in exchange for a parcel of land in South Park District, Muntinlupa City. Subsequently, Avida will sell the 264,534,247 shares to Ayala Land, Inc., increasing its effective ownership in ALLHC to 71.68% On May 10, 2019, Prime Orion Philippines, Inc. (POPI) changed its corporate name to Ayalaland Logistics Holdings Corp. (ALLHC). On April 24, 2019, Ayala Land, Inc.'s (ALI) subsidiary, AyalaLand REIT, Inc. ("AREIT"), announced that it intends to publicly list as a Real Estate Investment Trust ("REIT") under the current Implementing Rules and Regulations of the Securities and Exchange Commission on REITs and following the minimum public ownership requirement of 67%. On April 17, 2019 ALI acquired additional 14,913,200 common shares of CHI through open market purchases using the trading facilities of the Philippine Stock Exchange totaling P88.7 million, resulting in ALI’s ownership from 70.4% to 71.1%. On February 4, 2019, The Executive Committee of Ayala Land, Inc. (ALI) approved the purchase of a 20% equity interest owned by Mitsubishi Corporation in Laguna Technopark, Inc. (LTI), equivalent to 8,051 common shares, with a total value of P800 million. Subsequently, ALI will exchange the 20% equity interest in LTI for additional shares of stock in AyalaLand Logistics Holdings, Corp. (ALLHC), equivalent to 323,886,640 common shares, subject to conditions to be fulfilled by ALLHC.

10
2018 In December 2018, ALI acquired 8,051 common shares of LTI for ₱800.0 million increasing its ownership to 95%. On November 7, 2018, Ayala Land, Inc., in partnership with Ayala Corporation, launched its 26th estate, Habini Bay in Misamis Oriental. The 526-hectare estate is positioned as a new center of trade and commerce in Northern Mindanao. On November 6, 2018, SEC approved the merger between CHI and CPVDC with CHI as the surviving entity. ALI acquired additional 59,631,200 common shares of CHI totaling to ₱352.8 million. Further, an additional 77,742,516 shares were acquired as a result of swap of CPVDC shares for a total consideration of ₱229.3 million which brings Parent Company’s ownership to 70.4%. On May 11, 2018, Ayala Land entered into a Memorandum of Understanding with Green Square Properties Corporation (GSPC) and Green Circle Properties and Resources, Inc. (GCPRI) for the formation of a joint-venture company (JVC) that will own and develop 27,852 hectares of land (the Properties), specifically located in Dingalan Aurora and General Nakar, Province of Quezon. ALI will own 51%, and GSPC and GCPRI will jointly own 49% of the JVC. On April 30, 2018, ALI and POPI executed a Deed of Exchange where ALI will subscribe to 1,225,370,620 common shares of POPI for an aggregate subscription price of P3.0 billion in exchange for 30,186 common shares of Laguna Technopark, Inc. (LTI). The subscription and exchange shall be subject to and deemed effective only upon the issuance by the SEC of the confirmation of valuation of the shares. On April 27, 2018 Ayala Land, Inc. issued and listed on the Philippine Dealing & Exchange Corp. a P10 billion bond due April 2028 with a coupon rate of 5.9203% p.a. for the initial five-year period of the ten-year term of the bond. The coupon rate will reprice on April 27, 2023, the fifth anniversary of the Issue Date, at the higher of (a) 5.9203% or (b) the prevailing 5-year benchmark plus 75 bps which shall apply to all interest payments thereafter. The Bond was assigned an issue credit rating of PRS AAA, with a Stable Outlook, by Philratings, the highest investment grade indicating minimal credit risk. The issuance is the fifth tranche of the Fixed Rate Bond series of the Company’s P50 billion Debt Securities Program as approved by the Securities and Exchange Commission (SEC) in March 2016. On April 4, 2018, Ayala Land, Inc. (ALI) signed a Deed of Absolute Sale with Central Azucarera de Tarlac, Inc. for the acquisition of several parcels of land with an aggregate area of approximately 290 hectares located in Barangay Central, City of Tarlac, Province of Tarlac. On March 23, 2018, the Executive Committee of Ayala Land approved the exchange of its 75% equity interest in Laguna Technopark, Inc. (LTI) into additional shares of stock in AyalaLand Logistics Holdings, Corp. formerly, Prime Orion Philippines, Inc. (POPI). The value of the transaction is P3.0 billion where POPI will issue 1,225,370,620 common shares to ALI in exchange for 30,186 LTI common shares and bring ALI’s direct ownership in POPI to 63.90% from 54.91%. On February 26, 2018, the Board of Directors of Cebu Holdings, Inc. (CHI) during its meeting, approved the merger of Cebu Property Ventures Development Corp. (CPVDC) with CHI as the surviving entity. The merger will consolidate CHI’s portfolio under one listed entity, creating a unified portfolio for its investments and is expected to result in operational synergies, efficient funds management and simplified reporting to government agencies, as a result of the merger. The plan of merger shall be submitted for approval of the stockholders of the two companies during their respective annual stockholders’ meeting to be held on April 10, 2018. On February 20, 2018, the Philippine Competition Commission (PCC) approved the setting up of a joint venture between the Company and Royal Asia Land, Inc. to acquire, own, and develop a 936-hectare commercial and residential project in Silang and Carmona, Cavite. Both firms will own 50% equity in the

11
joint venture vehicle while Royal Asia Land will receive a consultation fee of 2% of the joint venture firm's gross revenue for its participation in the planning and development of the property. ALI, meanwhile, will develop and market the project and receive a management fee of 12% and sales and marketing fee of 5% of the gross revenue. The PCC has deemed that the transaction does not result in a substantial lessening of competition because it will not have a structural effect on the market. On January 11, 2018, SIAL CVS Retailers, Inc., FamilyMart Co., Ltd., and ITOCHU Corporation have concluded the transaction to sell 100% of the outstanding shares of Philippine FamilyMart CVS, Inc. (PFM) to P-H-O-E-N-I-X Petroleum Philippines, Inc. (PNX), further to a Memorandum of Agreement (MOA) entered into by the parties last October 30, 2017. On January 2, 2018, Ayala Land, Inc., (ALI) through its wholly-owned subsidiary, Regent Wise Investments Limited (RWIL), signed a share purchase agreement to acquire an additional 17.24% share in MCT Bhd (MCT), subject to completion of certain conditions. This will bring ALI’s shareholding in MCT to 50.19% from 32.95%. Subsequently, on January 5, 2018, Regent Wise Investments Limited (RWIL), issued a notice of an unconditional mandatory take-over offer to the Board of Directors of MCT Bhd (MCT), to acquire all remaining shares of the company that are not already held by RWIL, following the completion of certain conditions to the share purchase agreement. The take-over offer is made in connection to the acquisition of additional shares in MCT, which increased ALI’s shareholding in MCT to 50.19%. On March 23, 2018, Ayala Land completed the acquisition process, increasing its ownership stake in MCT to 66.25%. Various diversification/ new product lines introduced by the company during the last three years The Flats Ayala Land opened its first co-living product, branded as “The Flats” in September 2018. It is located in Amorsolo, Makati and offers a total of 728 beds across 196 multiple occupancy rooms and communal spaces. The second branch was opened in January 2019 at 5th Ave. BGC which has a total of 1,316 beds and 375 rooms. Clock In In 2017, Ayala Land launched a co-working space product branded as “Clock In” with three operating branches in Makati and BGC. To date, it now has a total of 1,413 seats across 6,473 sq. meters of GLA with new branches in Vertis North, The 30th , Ayala North Exchange, Lio and Alabang Town Center. ALogis (Standard Factory Buildings and Warehouses) In 2018, Ayala Land started to offer standard factory buildings (SFB) and warehouses for lease inside industrial parks to capture the growing opportunities in manufacturing and logistics. In 2020 these were consolidated under the “ALogis” brand. Ayala Land has a total of 207,000 sq. meters of SFB and warehouse GLA across various locations such as Laguna Technopark, Cavite Technopark, the Tutuban complex in Manila, the ALogis Calamba in Laguna, and Alviera Industrial Park in Pampanga. Hospitals/Clinics Ayala Land entered into a strategic partnership with the Mercado Group in July 2013 to establish hospitals and clinics located in the Company’s integrated mixed-use developments branded as QualiMed. In 2014, QualiMed opened three (3) clinics in Trinoma, Fairview Terraces, McKinley Exchange Corporate Center, and Qualimed General Hospital in Atria Park, Iloilo while UP Town Center Clinic in Quezon City was opened in the end of 2015. In the 2nd Quarter of 2016, Qualimed opened a hospital in Altaraza San Jose Del Monte Bulacan. In the 3rd Quarter of 2017, Qualimed opened its 102-bed hospital in Nuvali, Sta. Rosa, Laguna. Supermarkets ALI Capital Corporation (formerly Varejo Corporation), a subsidiary of Ayala Land, entered into a joint venture agreement with Entenso Equities Incorporated, a wholly-owned entity of Puregold Price Club, Inc., to develop and operate mid-market supermarkets for some of Ayala Land’s mixed-use projects

12
branded as Merkado Supermarket. The first supermarket was opened in the 3rd quarter of 2015 at UP Town Center while its second store was opened in December 2017 at Ayala Malls Vertis North.
Competition
Ayala Land is the only full-line real estate developer in the Philippines with a major presence in almost all sectors of the industry. Ayala Land believes that, at present, there is no other single property company that has a significant presence in all sectors of the property market. Ayala Land has different competitors in each of its principal business lines. With respect to its shopping center business, Ayala Land’s main competitor is SM which owns numerous shopping centers around the country. Ayala Land is able to effectively compete for tenants given that most of its shopping centers are located inside its mixed-used estates, populated by residents and office workers. The design of Ayala Land’s shopping centers also features green open spaces and parks. For office rental properties, Ayala Land sees competition in smaller developers such as Kuok Properties (developer of Enterprise Building), Robinsons Land (developer of Robinsons Summit Center) and non-traditional developers such as the AIG Group (developer of Philam Towers) and RCBC (developer of RCBC towers). For BPO office buildings, Ayala Land competes with the likes of Megaworld, SM Prime Holdings and Robinsons Land. Ayala Land is able to effectively compete for tenants primarily based upon the quality and location of its buildings, reputation as a building owner and the quality of support services provided by its property manager, rental and other charges. With respect to residential lots and condominium products, Ayala Land competes with developers such as Megaworld, DMCI Homes, Robinsons Land, and SM Development Corporation. Ayala Land is able to effectively compete for purchasers primarily on the basis of reputation, price, reliability, and the quality and location of the community in which the relevant site is located. For the middle-income business, Ayala Land sees the likes of SM Development Corp, Megaworld, Filinvest Land and DMCI Homes as key competitors. Alveo and Avida are able to effectively compete for buyers based on quality and location of the project and availability of attractive in-house financing terms. For the affordable housing segment, Amaia competes with Camella Homes, DMCI Homes, Filinvest, Robinsons Land and SM Development Corporation. BellaVita, a player in the socialized housing market, will continue to aggressively expand its geographical footprint with product launches primarily located in provincial areas. Suppliers The Company has a broad base of suppliers, both local and foreign. The Company is not dependent on one or a limited number of suppliers. Customers Ayala Land has a broad market base including local and foreign individual and institutional clients. The Company does not have a customer that will account for twenty percent (20%) or more of its revenues. Transactions with related parties Please refer to Item 12 of this report (“Certain Relationships and Related Transactions).

13
Government approvals/regulations The Company secures various government approvals such as the environmental compliance certificate, development permits, license to sell, etc. as part of the normal course of its business. Employees
Ayala Land has a total workforce of 324 regular employees as of December 31, 2020. The breakdown as
follows:
Senior Management 28
Middle Management 217
Staff 79
Total 324 Employees take pride in being an ALI employee because of the company’s long history of bringing high quality developments to the Philippines. With the growth of the business, career advancement opportunities are created for employees. These attributes positively affect employee engagement and retention. The Company aims that its leadership development program and other learning interventions reinforce ALI’s operating principles and provide participants with a set of tools and frameworks to help them develop skills and desired qualities of an effective leader. The programs are also venues to build positive relations and manage networks within the ALI Group. ALI has a healthy relation with its employees’ union. Both parties openly discuss employee concerns without necessity of activating the formal grievance procedure. Further, employees are able to report fraud, violations of laws, rules and regulations, or misconduct in the organization thru reporting channels under the ALI Business Integrity Program. Ayala Land is subject to significant competition in each of its principal businesses of property development, commercial leasing and services. In property development, Ayala Land competes with other developers to attract condominium and house and lot buyers. In commercial leasing, it competes for shopping center and office space tenants, as well as customers of the retail outlets, restaurants, and hotels and resorts across the country. However, Ayala Land believes that, at present, there is no single property company that has a significant presence in all sectors of the property market. Risks Two major risk events occurred in 2020 which greatly impacted the Philippines and Ayala Land’s business operations. First was the eruption of the Taal volcano in January which affected the provinces of Batangas, Cavite and Laguna and neighboring provinces in the Southern Luzon area. This was followed by the spread of the COVID-19 pandemic globally which continues to affect the country up to this day. Even prior to the onset of COVID-19, pandemic risk was already identified as a key risk during Ayala Land’s 2019 risk review exercise. With its continuing impact to both global and local business operations in 2020, pandemic risk was elevated as one of the top risks of the Company moving forward. Through its business continuity management (BCM) program and digitalization initiatives, Ayala Land was able to mitigate the business disruptions brought by the pandemic. Plans and exercises based on different loss scenarios helped the Company to prepare and conduct business operations and processes during the following BCM scenarios;

14
• loss of premises or office
• loss of critical people
• loss of critical service provider To address the impact of the pandemic Ayala Land’s management team pivoted its strategy and introduced the 5-point action plan to not only ensure the survival of the company but to extend assistance to its various stakeholders. The key objective of this plan are as follows: Protecting the employees; Continuing to serve the customers; Helping the community; and Thinking ahead towards recovery. These were all underpinned with the goal of ensuring the financial sustainability of the Company. Notwithstanding the pandemic, Ayala Land continued to track its other key risks by conducting periodic review sessions with its strategic business units (SBUs). Listed below are the key risks identified from these sessions:
1. Pandemic 2. Project Execution and Delivery 3. Marginalization 4. Government / Political 5. Regulatory 6. Major Security, Health and Safety 7. Organizational 8. Environmental 9. Partnership and Alliances 10. Financial 11. Cyber Security
Project Execution risk and marginalization remain as the 2nd and 3rd ranked key risks due to aggressive competition in each of the business segments of Ayala Land. To date, there is no single property company that has a significant presence in all segments of the property sector.
High-End, Middle-Income, Affordable Residential, and Economic and Socialized Housing Developments With respect to high-end and middle-income land and condominium sales, Ayala Land continues to compete for buyers primarily on the basis of reputation, reliability, price, quality, and the location of the community in which the relevant site is located. For the affordable, economic and socialized housing markets, Ayala Land competes for buyers based on quality of projects, affordability of units and availability of financing. Ayala Land is also actively tapping the overseas Filipino market. In addition, it has seen demand from foreign buyers both residing in the country and abroad. Shopping Center, Office Space and Land Rental For its shopping centers, Ayala Land competes for tenants primarily based on the ability of the shopping center to attract customers. This is typically hinged on the location and the tenant-mix of the retail center, the reputation of the retail center owner, as well as rental and other charges. The market for shopping centers has become competitive and with the growing number of pipeline and new shopping center openings across the country. Some competing shopping centers are located within relatively close proximity of Ayala Land's commercial centers. With respect to its office rental properties, Ayala Land competes for tenants primarily based on the quality and location of the relevant building, reputation of the building's owner, quality of support services provided by the property manager, and rental and other charges. The Company is addressing the continuing demand from BPOs and corporate by providing fully integrated and well-maintained developments (high rise or campus facility) in key locations in the country.

15
Hotel and Resort Operations The local hotel and resort sector is largely driven by foreign and local travel for leisure or business purposes. Any slowdown in tourism and business activity due to global financial and local political turmoil and security concerns could potentially limit growth of the Company's hotels and resorts. Construction Ayala Land's construction business, Makati Development Corporation (MDC), is benefiting from the improved performance of the construction industry, particularly from an uptick in development activities mostly from the residential and retail sector. With booming construction across the country, Ayala Land must manage the risk of providing enough skilled workers to deploy to its various projects. Any slowdown in the construction business could potentially cap growth of the Company's construction arm. Property Management Ayala Land directly manages its properties as well as other third-party properties through Ayala Property Management Corporation (APMC). Its employees directly interface with customers and must ensure that Ayala Land’s brand, quality and reputation are upheld in the regular upkeep of managed properties. Employees must continuously be trained to be able to provide high-quality service in order to preserve Ayala Land’s brand equity.
Emerging Risks In addition to the 11 key risks, three emerging risks were also identified which may impact business operations in the near-term. First is the accelerating shift of customers to e-commerce and digital platforms which may change the business models of SBUs to address the needs of its customers. As new IT systems are introduced, the risk of cyberattacks also increase. To mitigate this, stringent cybersecurity measures and programs should be in place to ensure timely detection and handling of security breaches as well as ensure compliance with data privacy regulations. Second is market uncertainty due to the prolonged impact of COVID 19 which may negatively impact the office sector. While the sector has remained resilient in 2020, locators opt to reduce space requirements as a means to lower costs should the pandemic persist. Third is the upcoming national election in 2022 which will create uncertainty in the political environment. Other risks that the company may be exposed to are the following: - Changes in Philippine and international interest rates - Changes in the value of the Peso versus other currencies - Changes in construction material and labor costs, power rates and other costs - Changes in laws and regulations that apply to the Philippine real estate industry - Changes in the country's political and economic conditions - Changes in the country’s liquidity and credit exposures To mitigate the above-mentioned risks, Ayala Land shall continue to adopt appropriate risk management tools as well as conservative financial and operational controls and policies to manage the various business risks it faces. Working Capital Ayala Land finances its working capital requirements through a combination of internally-generated cash, pre-selling, joint ventures agreements, borrowings and issuance of bond proceeds from the sale of non-core assets.

16
Domestic and Export Sales The table below illustrates the amounts of revenue, profitability, and identifiable assets attributable to domestic and foreign operations for the years ended December 31, 2020, 2019, 2018: (in P’000)
2020 2019 2018
Consolidated revenues
Domestic 90,342,858 160,143,686 156,142,062
Foreign 4,811,872 6,561,646 7,604,756
95,154,730 166,705,332 163,746,818
Net operating income
Domestic 30,342,384 61,357,618 52,436,826
Foreign 127,350 1,228,417 1,129,534
30,469,734 62,586,035 53,566,360
Net Income Attributable to Equity Holders of ALI
Domestic 9,157,663 32,621,047 28,283,472
Foreign (430,508) 567,352 957,408
Total 8,727,155 33,188,399 29,240,880
Total Assets
Domestic 685,707,253 678,162,085 636,521,219
Foreign 35,787,120 35,761,193 32,299,263
Total 721,494,373 713,923,278 668,820,482

17
Item 2. Properties LAND BANK / PROPERTIES WITH MORTGAGE OF LIEN The following table provides summary information on ALI’s land bank as of December 31, 2020. Properties included are either wholly-owned or part of a joint venture and free of lien unless noted. In Estates Location Hectares Outside Estates Hectares
Metro Manila 168 Metro Manila 106
Makati CBD Makati City 46 Las Pinas 86 BGC Taguig City 27 QC 11 Arca South Taguig City 21 Pasig 4 Parklinks Quezon City - Pasig City 18 Paranaque 3 Ayala Alabang Muntinlupa City 18 Makati 2 Circuit Makati Makati City 17 Mandaluyong 0.6 Cloverleaf Quezon City 9 Manila 0.3 Vertis North Quezon City 7 Pasay 0.3 The Junction Place Quezon City 4 Southpark District Muntinlupa City 2 Luzon 5,041 Luzon 5,022
Nuvali Sta. Rosa, Laguna 1,429 Cavite 2,526
Alviera Porac, Pampanga 1,173 Batangas 988 Altaraza San Jose Del Monte, Bulacan 864 Laguna 755 Lio El Nido, Palawan 767 Bulacan 236 Vermosa Imus, Cavite 340 Bataan 220 Cresendo Tarlac City, Tarlac 276 Pampanga 197 Evo City Kawit, Cavite 160 Quezon 46 Broadfield Binan, Laguna 32 Camarines Sur 26 Rizal 15 Nueva Ecija 6 Tarlac 6 Cagayan - Tuguegarao 2 Visayas 899 Visayas 316
Sicogon Island Resort Iloilo 810 Cebu 172 North Point Talisay, Negros Occidental 23 Negros Occidental 87 Cebu Park District Cebu City, Cebu 22 Iloilo 58 Gatewalk Central Mandaue, Cebu 13 Seagrove Mactan Island, Cebu 11 Southcoast City Cebu City, Cebu 11 Atria Park District Mandurriao, Iloilo 8 Capitol Central Talisay, Negros Occidental 0.4 Mindanao 274 Mindanao 657
Habini Bay Laguindingan, Misamis Oriental 242 Davao del Sur 430 Azuela Cove Davao City, Davao del Sur 22 Misamis Oriental 227 Abreeza Davao City, Davao del Sur 6 Centrio Cagayan de Oro, Misamis Oriental 3
2020 Land Bank: 12,483 6,381 6,102
LEASED PROPERTIES The Company has an existing contract with BCDA to develop, under a lease agreement a mall with an estimated gross leasable area of 152,000 square meters on a 9.8-hectare lot inside Fort Bonifacio. The lease agreement covers 25 years, renewable for another 25 years subject to reappraisal of the lot at market value. The annual fixed lease rental amounts to P106.5 million while the variable rent ranges from 5% to 20% of gross revenues. Subsequently, the Company transferred its rights and obligations granted to or imposed under the lease agreement to SSECC, a subsidiary, in exchange for equity.

18
On January 28, 2011, a notice was given to the Company for the P4.0 billion development of a 7.4-hectare lot at the University of the Philippines’ Diliman East Campus, also known as the UP Integrated School, along Katipunan Avenue, Quezon City. The Company signed a 25-year lease contract for the property last June 22, 2011, with an option to renew 58,000 square meters for another 25 years by mutual agreement. The project involves the construction of a retail establishment with 63,000 square meters of available gross leasable area and a combination of Headquarter-and-BPO- type buildings with an estimated 8,000 square meters of office space. (For the complete list of leased properties, please refer to Audited FS) Rental Properties The Company’s properties for lease are largely shopping centers, office buildings and hotels and resorts. As of December 31, 2020, rental revenues from these properties amounted to P21.9 billion equivalent to 23% of consolidated revenues. This is 44% lower than P39.3 billion recorded in 2019. Property Acquisitions With 12,483 hectares in its land bank as of December 31, 2020, Ayala Land believes that it has sufficient properties for development in next 25 years. Nevertheless, the Company continues to seek new opportunities for additional, large-scale, master-planned developments in order to replenish its inventory and provide investors with an entry point into attractive long-term value propositions. The focus is on acquiring key sites in the Mega Manila area and other geographies with progressive economies that offer attractive potential and where projected value appreciation will be fastest. On July 19, 2019, AyalaLand Logistics Holdings, Corp. (ALLHC), formerly Prime Orion Philippines, Inc. acquired 100% ownership of Unity Realty & Development Corporation (URDC). URDC owns a 192-hectare property in Mabalacat City, Pampanga which will be developed into an industrial park.
On May 15, 2018, Ayala Land, Inc. (“ALI”) entered into a Memorandum of Understanding with Green Square Properties Corporation (“GSPC”) and Green Circle Properties and Resources, Inc. (“GCPRI”) on May 11, 2018 for the formation of a Joint-Venture Company (“JVC”) that will own and develop 27,852 hectares of land (“the Properties”), specifically located in Dingalan, Aurora and General Nakar, Province of Quezon. ALI will own 51%, and GSPC and GCPRI will jointly own 49% of the JVC. On April 4, 2018, Ayala Land, Inc. (ALI) signed a Deed of Absolute Sale with Central Azucarera de Tarlac, Inc. for the acquisition of several parcels of land with an aggregate area of approximately 290 hectares located in Barangay Central, City of Tarlac, Province of Tarlac. On February 20, 2018, the Philippine Competition Commission (PCC) approved the setting up of a joint venture between the Company and Royal Asia Land, Inc. to acquire, own, and develop a 936-hectare commercial and residential project in Silang and Carmona, Cavite. Both firms will own 50% equity in the joint venture vehicle while Royal Asia Land will receive a consultation fee of 2% of the joint venture firm's gross revenue for its participation in the planning and development of the property. ALI, meanwhile, will develop and market the project and receive a management fee of 12% and sales and marketing fee of 5% of the gross revenue. The PCC has deemed that the transaction does not result in a substantial lessening of competition because it will not have a structural effect on the market.
In June 2015, ALI, through SM-ALI Group consortium, participated and won in the bidding for Lot No. 8-B-1, containing an area of 263,384 sqm, which is a portion of Cebu City-owned lot located at the South Road Properties, Cebu City covered by Transfer Certificate of Title No. 107-2011000963 (the “Property”). SM-ALI Group consortium is a consortium among SM Prime Holdings, Inc. (“SM”), Ayala Land, and Cebu
19
Holdings, Inc. (“CHI”, together with ALI collectively referred to as the “ALI Group”). The SM-ALI Group will co-develop the property pursuant to a joint master plan. In April 2015, ALI purchased all of the 8.2 million common shares of Aegis PeopleSupport Realty Corporation amounting to P435 million. Aegis PeopleSupport Realty Corporation is a PEZA-registered entity and the owner of Aegis building along Villa Street, Cebu IT Park, Lahug, Cebu City. The building is a certified LEED-Gold Office with a gross leasable area of 18,092 sqm and is largely occupied by Teleperformance under a long-term lease. On February 6, 2015, ALI purchased the combined remaining interest of Allante Realty and Development Corporation (Allante) and DBH, Inc. (DBH) in North Triangle Depot Commercial Corporation (NTDCC) consisting of 167,548 common shares and 703,904 preferred shares amounting to P229 million. This brings ALIC) consisting of 167,548 common shares and 703,904 total outstanding capital stock of NTDCC. In January 2014, ALI entered and signed into a 50-50% joint venture agreement with AboitizLand, Inc. for the development of a 15-hectare mixed-use community in Mandaue City, Cebu. The first project of this joint venture will involve the construction of a mall and a residential condominium unit with an estimated initial cost of P3 billion. On November 23, 2013, ALI, through its wholly-owned subsidiary, Ayala Hotels and Resorts Corp, (AHRC) signed an agreement to acquire 100% interest in Asian Conservation Company, Inc. (ACCI) which effectively consolidates the remaining 40% interest in Ten Knots Development Corp. (TKDC) and Ten Knots Philippines Inc. (TKPI) (60%-owned subsidiary of the Company prior to this acquisition). The agreement resulted in the Company effectively obtaining 100% interest in TKPI and TKDC. On April 16, 2013, ALI entered into a Sale and Purchase Agreement (SPA) with Global International Technologies Inc. (GITI) to acquire the latter’s 32% interest in ALI Property Partners Co. (APPCo) for P3.52 billion. GITI is a 100% owned company of the Goldman Sachs Group Inc. The acquisition increased ALI’s stake in APPCo from 68% to 100%. APPCo owns BPO buildings in Makati, Quezon City and Laguna with a total gross leasable area of around 230,000 sqm. The carrying amount of the non-controlling interest is reduced to nil as APPCo became wholly owned by the Company. The difference between the fair value of the consideration paid and the amount by which the non-controlling interest is adjusted is recognized in equity attributable to the Company amounting to P2,722.6 million. MORTGAGE, LIEN OR ENCUMBRANCE OVER PROPERTIES The Company has certain properties in Makati City that are mortgaged with BPI in compliance with BSP rules on directors, officers, stockholders and related interests. Item 3. Legal Proceedings As of December 31, 2020, ALI, its subsidiaries, and its affiliates, are not involved in any litigation regarding an event which occurred during the past five (5) years that they consider material. However, there are certain litigation ALI is involved in which it considers material, and though the events giving rise to the said litigation occurred beyond the five (5) year period, the same are still unresolved, as follows:

20
Las Piñas Property
Certain individuals and entities have claimed an interest in ALI’s properties located in Las Piñas, Metro Manila.
Prior to purchasing the aforesaid properties, ALI conducted an investigation of titles to the properties and had no notice of any title or claim that was superior to the titles purchased by ALI. ALI traced its titles to their original certificates of title and ALI believes that it has established its superior ownership position over said parcels of land. ALI has assessed these adverse claims and believes that its titles are in general superior to the purported titles or other evidence of alleged ownership of these claimants. On this basis, beginning October 1993, ALI filed petitions in the Regional Trial Court of Makati and Las Piñas for quieting of title to nullify the purported titles or claims of these adverse claimants. These cases are at various stages of trial and appeal. Some of these cases have been decided by the Supreme Court (“SC”). These include decisions affirming the title of ALI to some of these properties, which have been developed and offered for sale to the public as Sonera, Ayala Southvale. The SC issued a decision adverse to ALI’s title over these properties dated 26 July 2017 and denied ALI’s motions for reconsideration. The land constitutes less than 1% of ALI’s landbank and will not materially affect ALI’s business, operations and financials.
ALI has made no allowance in respect of such actual or threatened litigation expenses. Item 4. Submission of Matters to a Vote of Security Holders Except for the matters taken up during the Annual Meeting of Stockholders, there was no other matter submitted to a vote of security holders during the period covered by this report.

21
PART II – SECURITIES OF THE REGISTRANT Item 5. Market for Issuer’s Common Equity and Related Stockholders Matters
Market Information
Ayala Land common shares are listed with the Philippine Stock Exchange.
Philippine Stock Exchange
Prices (in PhP/share)
High Low Close
2020 2019 2020 2019 2020 2019
First Quarter 45.30 45.75 19.44 40.60 30.20 44.90
Second Quarter 38.20 52.50 28.20 44.40 33.80 50.80
Third Quarter 37.70 53.85 26.50 46.30 29.70 49.45
Fourth Quarter 42.10 49.90 29.00 42.55 40.90 45.50
The market capitalization of ALI as of end-2020, based on the closing price of P40.90/share, was approximately P602.5 billion.
The price information as of the close of the latest practicable trading date April 14, 2021 is P33.25 per share.
Stockholders The following are the top 20 registered holders of the common equity securities of the Company:
Common Stockholders: There are 8,984 registered holders of common shares of the Company as of January 31, 2021:
Stockholder Name No. of Common Shares Percentage
(of common shares)
1. Ayala Corporation 6,545,946,579 44.4384%
2. PCD Nominee Corporation (Non-Filipino) 5,393,515,444 36.6149%
3. PCD Nominee Corporation (Filipino) 2,487,797,715 16.8889%
4. ESOWN Administrator 2020 14,845,498 0.1008%
5. ESOWN Administrator 2012 13,685,969 0.0929%
6. ESOWN Administrator 2015 12,618,236 0.0857%
7. ESOWN Administrator 2010 12,543,936 0.0852%
8. 0.0795%ESOWN Administrator 2016 11,711,440 0.0795%
9. ESOWN Administrator 2013 10,975,745 0.0745%
10. ESOWN Administrator 2019 10,064,002 0.0683%
11. ESOWN Administrator 2017 9,862,182 0.0670%
12. ESOWN Administrator 2011 9,859,663 0.0669%
13. ESOWN Administrator 2014 9,620,370 0.0653%
14. Antonino T. Aquino 8,973,208 0.0609%
15. ESOWN Administrator 2018 8,247,901 0.0560%
16. Emilio Lolito J. Tumbocon 7,340,134 0.0498%
17. Vincent Y. Tan 5,969,832 0.0405%
18. Estrellita B. Yulo 5,732,823 0.0389%
19 Jose Luis Gerardo Yulo 5,062,624 0.0344%
20 Ma. Angela Y. La’o 3,728,620 0.0253%

22
Voting Preferred Stockholders: There are approximately 2,854 registered holders of voting preferred shares of the Company as of January 31, 2021.
Stockholder Name No. of Voting Preferred Shares
Percentage (of voting preferred
shares)
1. Ayala Corporation 12,163,180,640 93.0868%
2. HSBC Manila OBO A/C 000-171512-554 512,777,000 3.9244%
3. Government Service Insurance System 156,350,871 1.1966%
4. HSBC Manila OBO A/C 000-171512-571 15,051,000 0.1152%
5. DB MLA OBO SSBTC Fund HG16 15,000,000 0.1148%
6. Wealth Securities, Inc. 14,825,373 0.1135%
7. Deutsche Bank AG Manila OBO SSBTC Fund OD67 AC 12087020417
13,670,744 0.1046%
8. Samuel Villes Santos and/or Luzviminda Lat Santos
12,001,800 0.0919%
9. DB MLA OBO SSBTC Fund C021 8,497,223 0.0650%
10. Investors Securities, Inc. 6,251,770 0.0478%
11. First Metro Securities Brokerage Corp. 5,103,853 0.0391%
12. Deutsche Regis Partners Inc. 3,961,757 0.0303%
13. DB MLA OBO SSBTC Fund FA20 3,951,800 0.0302%
14. Papa Securities Corporation 3,536,538 0.0271%
15. DB MLA OBO SSBTC Fund FA2N 3,534,608 0.0271%
16. Ansaldo, Godinez & Co. Inc. 3,388,848 0.0259%
17. HSBC Manila OBO A/C 000-171512-551 2,800,874 0.0214%
18. Belson Securities, Inc. 2,725,700 0.0209%
19. CBNA FAO 6002079572 CITIMNFOR c/o Carmelynna C. Malabanan
2,700,000 0.0207%
20. Maybank ATR Kim Eng Securities, Inc. 2,666,714 0.0204%
Dividends
STOCK DIVIDEND (Per Share)
PERCENT DECLARATION DATE RECORD DATE PAYMENT DATE
20% February 1, 2007 May 22, 2007 June 18, 2007
CASH DIVIDEND (Per Common Share)
PESO AMOUNT DECLARATION DATE RECORD DATE PAYMENT DATE
0.2400 Feb. 20, 2017 Mar. 06, 2017 Mar. 22, 2017
0.2400 Aug. 18, 2017 Sept. 05, 2017 Sept. 15, 2017
0.2520 Feb. 20, 2018 Mar. 12, 2018 April 3, 2018
0.2520 Aug. 17, 2018 Sep. 6, 2018 Oct. 2, 2018
0.2600 Feb. 27, 2019 Mar. 13, 2019 March 29, 2019
0.2600 Oct. 31, 2019 Nov. 15, 2019 Nov. 29, 2019
0.2680 Feb. 20, 2020 Mar. 06, 2020 March 20, 2020
0.1358 Feb. 23, 2021 Mar. 10, 2021 Mar. 25, 2021
CASH DIVIDEND (Per Voting Preferred Share)
PESO AMOUNT DECLARATION DATE RECORD DATE PAYMENT DATE
0.00474786 Feb. 26, 2016 June 15, 2016 June 29, 2016
0.00474786 Feb. 20, 2017 June 15, 2017 June 29, 2017
0.00474786 Feb. 20, 2018 June 15, 2018 June 29, 2018

23
Dividend policy
Dividends declared by the Company on its shares of stocks are payable in cash or in additional shares of
stock. The payment of dividends in the future will depend upon the earnings, cash flow and financial
condition of the Company and other factors.
Special cash dividends are declared depending on the availability of cash, taking into account the
Company’s CAPEX and project requirements and the progress of its ongoing asset rationalization
program.
Cash dividends are subject to approval by the Company's Board but no stockholder approval is required.
Property dividends which may come in the form of additional shares of stock are subject to approval by
both the Company's Board of Directors and the Company's stockholders. In addition, the payment of
stock dividends is likewise subject to the approval of the SEC and PSE.
Recent Sale of Securities
For the past three years, common shares were issued representing the exercise of stock options by the
Company’s executives under the Executive Stock Option Plan (ESOP) and the subscription to the
common shares under the Executive Stock Ownership Plan (ESOWN) as follows:
Year No. of Shares
ESOP* ESOWN
(exercised) (subscribed)
2019 - 10.5 million
2020 - 14.8 million
*not offered starting 2015
The aforesaid issuance of shares was covered by the Commission’s approval of the Company’s Stock
Option Plan on July 1991 and subsequently on March 2006.
On March 12, 2013, Ayala Corporation executed the placement of, and subscription to the Company’s
399,528,229 common shares at P30.50 per share or an aggregate of P12.2 billion. The placement price
of P30.50 per share was at a 3.6% discount on the 5-day volume-weighted average price of the
Company’s stock and was the agreed clearing price among the purchasers of the shares and the
placement agent, UBS Investment Bank.
On January 12, 2015, Ayala Corporation executed the placement of, and subscription to the Company’s
484,848,500 common shares at P33.00 per share or an aggregate of P16 billion. The placement price of
P33.00 per share was at a 3.9% discount on the 5-day volume-weighted average price of the Company’s
stock and was the agreed clearing price among the purchasers of the shares and the placement agent,
UBS AG.
The Company filed Notices of Exemption with the SEC for the issuance of the 399,528,229 and
484,848,500 common shares under the following provisions of the SRC:
SRC Subsection 10.1 (e), The sale of capital stock of a corporation to its own stockholders exclusively, where no commission or other remuneration is paid or given directly or indirectly in connection with the sale of such capital stock.
24
SRC Subsection 10.1 (h), “Broker’s transaction, executed upon customer’s orders, on any registered
Exchange or other trading market.”
SRC Subsection 10.1 (k), “The sale of securities by an issuer to fewer than twenty (20) persons in the
Philippines during any twelve-month period.”
SRC Subsection 10.1 (l), “The sale of securities to banks, insurance companies, and investment
companies.”
Corporate Governance i. The evaluation system which was established to measure or determine the level of compliance of
the Board and top-level management with its Revised Manual of Corporate Governance consists of a Customer Satisfaction Survey which is filled up by the various functional groups indicating the compliance rating of certain institutional units and their activities. The evaluation process also includes a Board Performance Assessment which is accomplished by the Board indicating the compliance ratings. The above are submitted to the Compliance Officer who issues the Annual Corporate Governance Report to the Securities and Exchange Commission.
ii. To ensure good governance, the Board establishes the vision, strategic objectives, key policies, and
procedures for the management of the Company, as well as the mechanism for monitoring and evaluating Management’s performance. The Board also ensures the presence and adequacy of internal control mechanisms for good governance.
iii. There were no deviations from the Company’s Revised Manual of Corporate Governance. The
Company has adopted in the Manual of Corporate Governance the leading practices and principles of good corporate governance, and full compliance therewith has been made since the adoption of the Revised Manual.
iv. The Company is taking further steps to enhance adherence to principles and practices of good
corporate governance.

25
PART III – FINANCIAL INFORMATION Item 6. Management’s Discussion and Analysis of Financial Condition and Results of Operation Review of FY 2020 operations vs FY 2019 Ayala Land endured the severe impact of COVID-19 in 2020 recording a 43% decline in consolidated revenues to P96.27 billion from P168.79 billion and a 74% drop in net income to P8.73 billion from P33.19 billion. Key indicators improved steadily from the third quarter to the fourth quarter reflecting a 49% growth in total revenues to P32.95 billion and a 28% jump in net income to P2.36 billion, sustaining the momentum for recovery. Real Estate revenues, composed of Property Development, Commercial Leasing, and Services registered at P85.97 billion, a 46% decline from P157.85 billion due to construction restrictions, lower bookings, and restrained mall and hotel operations. Capital expenditures amounted to P63.67 billion, within the revised full-year budget of P69.82 billion and financial sustainability initiatives strengthened the balance sheet with the net gearing ratio improving to 0.74:1 from 0.78:1 in FY 2019. Business Segments The details of the individual performance of each business segment are discussed as follows: Property Development. This includes the sale of residential lots and units, office spaces, and commercial and industrial lots, and operations of MCT Bhd, Ayala Land’s consolidated subsidiary based in Malaysia. The Property Development business generated revenues of P57.86 billion, a 47% dip from P109.69 billion due to construction restrictions and lower bookings.
Residential. Revenues from the sale of residential lots and units and MCT Bhd’s operations declined 44% to P47.79 billion from P86.09 billion, however, in the fourth quarter, this amounted to P21.6 billion, a 54% improvement from the third quarter.
AyalaLand Premier (ALP) posted revenues of P15.01 billion, 39% lower than P24.45 billion, due to the lower percentage-of-completion (POC) of West Gallery Place in BGC, Park Central South Tower and Garden Tower 2 in Makati CBD and Arbor Lanes in Arca South and lower bookings from Park Central North Tower in Makati CBD and combined lower bookings and POC of The Alcoves in Cebu and Cerilo in Nuvali.
ALVEO recorded revenues of P8.05 billion, a decline of 58% from P19.00 billion owing to lower POC of High Park 2 in Vertis North and Park Triangle Residences in BGC, lower bookings from Orean Place 1 & 2 in Vertis North, The Residences at Evo City 1, Venido in Biñan Laguna, and combined lower bookings and POC of Travertine in Portico. Avida meanwhile registered revenues of P14.42 billon, a 47% decrease from P27.36 billion, attributed to lower bookings from The Montane in BGC, Avida Towers Asten 3 in Makati, Avida Towers Sola 1 and 2 in Vertis North, Avida Northdale Settings in Nuvali, Avida Towers Vireo 1 in Arca South and Avida Towers Prime Taft 3 in Manila. Amaia reached P4.69 billion in revenues, a 36% reduction from P7.37 billion relating to lower bookings from Skies Cubao Tower 2, Skies Shaw Tower 1, Skies Sta. Mesa and Skies Avenida Tower 1. BellaVita meanwhile recognized revenues of P790.65 million, 34% less than P1.20 billion because of lower bookings from projects in Cagayan de Oro, Batangas and Laguna.

26
MCT Bhd contributed P4.85 billion in revenues, a 28% decline from P6.71 billion as the inventory of projects in Lakefront and Cybersouth are almost sold-out and construction activities in the 2nd quarter and 4th quarters were limited under Malaysia’s movement control order (MCO). These factors offset the contribution from projects under Market Homes, its affordable housing segment.
Office for Sale. Revenues from the sale of office units came down by 72% to P3.51 billion from P12.34 billion, owing to limited inventory and lower incremental completion of remaining projects such as ALVEO Financial Tower in Makati CBD, Park Triangle Corporate Plaza, Park Triangle Tower and High Street South Corporate Plaza 2, all in BGC.
Commercial and Industrial Lots. Revenues from the sale of commercial and industrial decelerated by 42% to P6.56 billion from P11.27 billion mainly due to slower take-up of inventory in Broadfield and limited inventory in Altaraza, Evo City and Nuvali.
Sales Reservations. Despite limited sales mobility, sales reservations registered at P81.90 billion, 56% of the level in 2019. This translates to an average of P6.8 billion in monthly sales. Fourth quarter sales reservations reached 55-75% of pre-COVID levels due to sustained property demand, totaling P21.08 billion, equivalent to an average of P7.0 billion in monthly sales. Local and overseas Filipinos accounted for 89% of total sales with the balance of 11% from other nationalities. Sales from local Filipinos which comprise 74%, amounted to P60.4 billion, 42% lower year-on-year, while sales from overseas Filipinos which represented 15% of the total, amounted to P12.6 billion, a decline of 35%year-on-year. Meanwhile, sales to other nationalities amounted to P8.9 billion, a 60% drop, primarily as sales to mainland Chinese buyers which comprise 28% decreased by 70% to only P2.5 billion.
Project Launches. A total of 13 projects totaling P10.59 billion were launched in 2020. In the first quarter, Ayala Land was able to launch five (5) projects with a total value of P4.99 billion. These are Avida Greendale Settings at Alviera in Pampanga, Amaia Steps Aria at The Junction Place in Quezon City, Amaia Scapes Cabuyao Series 3 area 2, and Bellavita Alaminos 2, both in Laguna. No new residential projects were launched in the second quarter of 2020. However, with improving demand in the third quarter, three (3) sequel projects were launched amounting to P2.19 billion. These are Andacillo Phase 3A in Nuvali, Laguna, Amaia Scapes Series 4A in Sta. Maria, Bulacan and Bellavita Alaminos 2. Meanwhile, five (5) sequel projects amounting to P3.41 billion were launched in the fourth quarter. These are Andacillo Phase 4 in Nuvali, Laguna, Amaia Scapes Gen. Trias S3 and S4 in Cavite, and two tranches of additional units in Bellavita Alaminos 2 in Laguna.
Commercial Leasing. This includes the operation of Shopping Centers, Office Buildings and Hotels and Resorts. Total revenues from commercial leasing declined 44% to P21.86 billion from P39.31 billion given restrained mall and hotel operations.
Shopping Centers. Revenues from shopping centers dropped 59% to P9.06 billion from P22.02 billion. Operating GLA and foot traffic as a percentage of pre-COVID levels improved towards the end of 2020. In the fourth quarter, operating GLA reached 64% from 62% in the third quarter. Likewise, foot traffic reached 35-45% in the fourth quarter from 30-35% in the third quarter as the less strict general community quarantine restriction was maintained, boosted by the holiday season. These improvements resulted in P1.69 billion in mall revenues in the fourth quarter, a 10% recovery from the third quarter of 2020. Average tenant sales also improved quarter on quarter reaching 53% in the fourth quarter from 41% in the third quarter. The average occupancy rate for all malls is 85% and 90% for stable malls. Total Malls GLA stands at 2.12 million square meters.
Offices. Revenues from office leasing was sustained at P9.41 billion from P9.67 billion on account of
continuing BPO and HQ office operations. The average occupancy rate for all offices is 88% and 94%

27
for stable offices. Total office leasing GLA increased to 1.23 million square meters with the completion of BGC Corporate Center 2 and Central Bloc Corporate Center 2 in October and December, respectively.
Hotels and Resorts. Revenues from hotels and resorts ended 56% lower to P3.39 billion from P7.62 billion. The average occupancy for all hotels was 41% and 44% for stable hotels. Meanwhile, the average occupancy for all and stable resorts stood at 16%. In the fourth quarter, El Nido Resorts and the Lio Estate were able to host more travel bubbles to the public, in close coordination with the Department of Tourism and the Local government. From only four (4) in the third quarter, a total of 37 travel bubbles were launched in the fourth quarter, driving a 52% increase in revenues to P787 million from the third quarter. The hotels and resorts segment ended 2020 with a total of 4,030 rooms in its portfolio with the completion of 345 rooms in the first half as it opened Seda Central Bloc in Cebu and additional rooms in Seda Residences Ayala North Exchange and Seda BGC. The hotels and resorts business manages 660 hotel rooms in its international brand segment—312 from Fairmont Hotel and Raffles Residences and 348 from Holiday Inn & Suites, both of which are in the Ayala Center, Makati CBD.
There are 11 Seda Hotels, operating 2,712 rooms—Atria, Iloilo (152 rooms); BGC, Taguig (521); Centrio, Cagayan de Oro (150); Abreeza, Davao (186); Nuvali, Santa Rosa, Laguna (150); Vertis North, Quezon City (438); Capitol Central, Bacolod (154); Lio, Palawan (153); Ayala Center Cebu (301); Seda Residences Ayala North Exchange (293) and Seda Central Bloc (214); and Circuit Corporate Residences (255).
El Nido Resorts operates 193 rooms from its four island resorts—Pangulasian, Lagen, Miniloc, and Apulit. The Lio Tourism Estate currently has 132 rooms under its Bed and Breakfast (B&B) and Dormitel offerings, while the Sicogon Tourism Estate in Iloilo currently has 78 B&B rooms.
Services. This is composed mainly of the construction business through Makati Development Corporation (MDC), property management, through Ayala Property Management Corporation (APMC), and businesses engaged in power services such as Direct Power Services, Inc. (DPSI), Ecozone Power Management, Inc. (EPMI), and Philippine Integrated Energy Solutions, Inc. (PhilEnergy) and AirSWIFT, the airline for the hotels and resorts in Palawan and Sicogon. Total revenues amounted to P6.25 billion, 29% lower than P8.85 billion due to the restricted construction activity of MDC, lower power consumption of power subsidiary customers during the lock down, and very limited operations of AirSWIFT.
Construction. Net construction revenues totaled P3.28 billion, only 3% lower than P3.40 billion last year. Property Management and Others. APMC, power services companies and AirSWIFT registered revenues of P2.97 billion, 46% less than P5.45 billion. Blended EBITDA margins of the Services segment stood at 7%, lower than 10% in 2019 owing to COVID-19 related expenses.
Equity in Net Earnings of Investees, Interest, Fees, Investment and Other Income Equity in net earnings of associates and JV companies, particularly Ortigas and FBDC companies, declined 39% to P586.50 million from P965.79 million. Interest income from real estate sales increased 9% to P8.60 billion from P7.89 billion in 2019 driven by increased sale of real estate receivables. Meanwhile, Interest and investment income registered a 58% drop to P394.70 million from P930.45 million owing to lower balances and yields from short term investments.

28
Other income, composed mainly of marketing and management fees from joint ventures, among others, decreased 38% to P723.27 million from P1,157.94 million. This decline was largely due to the higher base in 2019 given the gain recognized from the sale of Vertex One office building in Santa Cruz Manila to Manila Jockey Club, Inc. Expenses Total expenses stood at P81.22 billion, 31% lower than P117.96 billion as real estate expenses decreased by 40% to P56.67 billion from P94.75 billion. General and administrative expenses declined 14% to P8.01 billion from P9.37 billion on account of a lower topline. This resulted in a GAE ratio of 8.3% and an EBIT margin of 25.9%. Interest, other financing charges and other expenses, which includes interest expense related to PFRS 16 (Leases) totaled P16.53 billion. This was a 19% increase from P13.84 billion due the higher discounting cost related to the sale of accounts receivables, interest expense from the higher average loan balance and bank charges related to loan prepayments. The average cost of debt registered at 4.7%, 50 basis points lower than 5.2% at the end of December 2019. Of the total, 95% is locked in fixed rates, while 96% is contracted for a long-term basis. Capital Expenditures Capital expenditures reached P63.67 billion for the full-year of 2020. These were mainly spent for the completion of residential and commercial leasing assets. 45% was spent on residential projects, 23% on commercial projects, 15% for land acquisition and 14% for the development of estates. The full year capex estimate was reduced to P70.0 billion from the original estimate of P110.0 billion. Financial Condition Financial sustainability initiatives strengthened the balance sheet with the net gearing ratio improving to 0.74:1 from 0.78:1 in FY 2019. Total borrowings registered at P211.95 billion which translated to a debt-to-equity ratio of 0.81:1 from 0.87:1. Cash and cash equivalents, including short-term investments and financial assets at fair value through profit or loss stood at P18.36 billion resulting in a current ratio of 1.62:1. Return on equity was at 4.03% as of December 31, 2020.
End-December 2020 End-December 2019
Current ratio 1 1.62:1 1.30:1
Debt-to-equity ratio 2 0.81:1 0.87:1
Net debt-to-equity ratio 3 0.74:1 0.78:1
Profitability Ratios:
Return on assets 4 1.53% 5.43%
Return on equity 5 4.03% 16.66%
Asset to Equity ratio 6 2.77:1 2.94:1
Interest Rate Coverage Ratio 7 2.96 6.27 1 Current assets / current liabilities 2 Total debt/ consolidated stockholders’ equity, (Total debt includes short-term debt, long-term debt and current portion of long-term debt) 3 Net debt/ consolidated stockholders’ equity (Net debt is total debt less cash and cash equivalents, short term investments and financial assets through FVPL)

29
4 Net income / average total assets 5 Net income attributable to equity holders of ALI / average total stockholders’ equity attributable to equity holders of ALI 6 Total Assets /Total stockholders’ equity 7 EBITDA/Interest expense
There are no events that will trigger direct or contingent financial obligations that are material to the company, including any default or acceleration of an obligation. There are no material off-balance sheet transactions, arrangements, obligations (including contingent obligations), and other relationships of the company with unconsolidated entities or other persons created in FY 2020.
Causes for any material changes (+/- 5% or more) in the financial statements Income Statement items – For the year ended December 31, 2020 and 2019 Real estate and hotel revenues decreased by 46% due to construction restrictions, lower bookings, and restrained mall and hotel operations. Equity in net earnings decreased by 39% mainly due to lower income contributions from Ortigas Land Corporation (OLC) and Fort Bonifacio Development Corp. (FBDC). Interest income from real estate sales increased by 9% owing to higher sale of real estate receivables. Interest and investment income decreased by 58% driven by lower balance and lower yield from short-term investments. Other Income decreased by 38% due to higher gain recognized in 2019 from sale of Vertex One building in Santa Cruz Manila. Cost of real estate sales decreased by 40% due to lower real estate and hotel revenues. General administrative expenses decreased by 14% mainly from manpower costs including security and janitorial, rent and dues and fees, transportation and travel, and other overhead expenses. Interest, other financing charges and other expenses increased by 19% due to higher discounting cost related to sale of trade receivables, interest expense from higher average loan balance, and bank charges related to loan repayments. Provision for income tax decreased by 70% due to lower taxable income. Balance Sheet items - As at December 2020 versus 2019 Cash and cash equivalents - decreased by 17% mainly due to lower collection from customers, payments of capital expenditures, interest expense from borrowings, and cash dividends, partially offset by proceeds from initial public offering of AREIT, Inc, sale of trade receivables, and loan availments. Short-term investments decreased by 42% due to reallocation to investments with higher yield. Financial asset at fair value through profit and loss increased by 99% attributable to increase in investments in UITF and treasury bills. Real Estate Inventories increased by 22% as a driven by land acquisitions, incremental POC, reclassification from investment property, partially offset by lower real estate sales.
30
Other current assets increased by 19% mainly due to payment of advances to contractors and suppliers, payment of CWT, and building classified as held for sale. Investments in associates and joint ventures increased by 5% owing to the increase in investments in joint ventures, and equity in net earnings for the period net of dividend received. Investment properties decreased by 8% due to reclassification of land to inventory, and depreciation expense for the period. Deferred tax assets increased by 5% coming from accrued expenses, allowances for probable losses, and NOLCO. Other noncurrent assets decreased by 9% mainly from recoupment of advances to contractors and suppliers, partially offset by increase in deferred input VAT. Short-term debt decreased by 49% due to various payments during the year. Account and other payables decreased by 11% due to payments of accounts payable and accrued operating expenses, lower taxes payables and interest payable, and other accrued expenses. Income tax payable decreased by 31% due to lower taxable income. Current portion of lease liabilities decreased by 36% due to payments to lessors. Current portion of long-term debt increased by 9% attributable to maturing bonds and bank loans within 12 months. Long-term debt – net of current portion increased by 5% due to increase in bonds issuance and bank loans. Pension liabilities increased by 52% mainly due to increase in benefit obligation and remeasurement loss for the current period. Deferred tax liabilities higher by 17% mainly due to timing difference between tax and book basis of accounting for real estate transactions and right-of-use assets. Deposit and other noncurrent liabilities increased by 14% mainly coming from unrealized revenues from collected receivables and security deposits from tenants, partially offset by payment for contractors payable, purchased land and collected output VAT. Stock options outstanding decreased by 49% attributable to the exercise of stock options. Remeasurement loss on defined benefit plans increased by 143% due to actuarial loss from change in pension liability assumptions. Fair value reserve of financial assets at FVOCI increased by 64% attributable to unrealized fair value loss from cash flow hedging of loans bearing interest at floating rate. Cumulative translation adjustments decreased by 33% mainly due to translation loss on financial statements of MCT Bhd. Equity reserves increased by 108% attributable to gain on sale ownership in AREIT, Inc. to Non-controlling Interest (NCI). Treasury Stock increased by 14% as a result of share buy-backs during the year.

31
Non-controlling interests increased by 19% as a result of public listing of AREIT, Inc. Review of 2019 operations vs 2018 In 2019, net income after tax (attributable to equity holders) of Ayala Land, Inc. (ALI or “the company”) grew by 13% to PHP33.19 billion from PHP29.24 billion in 2018. Total revenues (which includes real estate sales, interest income from real estate sales, equity in net earnings, and interest and investment income, and other income) increased by 2% to PHP168.79 billion from PHP166.25 billion the previous year, mainly driven by real estate revenues which grew by 1% to PHP157.85 billion from PHP155.95 billion in 2018. Revenues were also supported by office and commercial and industrial lot sales and higher contribution of new leasing assets. The company introduced three new estates and successfully launched PHP158.96-billion worth of projects, surpassing its initial estimate of PHP130 billion. Its leasing portfolio continued to expand to 2.1 million and 1.2 million sq. meters of gross leasing area for malls and offices, respectively, and to 3,705 rooms for hotels and resorts. Capital expenditure reached PHP108.72 billion to support the buildup of residential and leasing projects. Business Segments The details of the individual performance of each business segment are discussed as follows: Property Development. This segment includes the sale of residential lots and units, office spaces, and commercial and industrial lots, and the operations of the Malaysia-based consolidated subsidiary MCT Bhd. Property development revenues amounted to PHP109.69 billion, a 3% dip from 2018’s PHP113.36 billion.
Residential. Revenues from the sale of residential lots and units and MCT Bhd’s operations were lower by 9% at PHP86.09 billion from PHP94.63 billion in 2018. The decline was due to the lower contribution of AyalaLand Premier (13% drop from PHP28.00 billion in 2018 to PHP24.45 billion in 2019) and ALVEO (28% decrease from 26.28 billion in 2018 to PHP19.00 billion last year). Most of their vertical projects recognized in 2019 were booked in previous periods and are now nearing completion.
Contributions from new AyalaLand Premier (ALP) projects and higher completion progress of Park Central South Tower in Makati City, One Vertis Plaza in Vertis North, Quezon City and West Gallery Place in Bonifacio Global City (BGC) were offset by lower incremental percentage of completion (POC) from East Gallery Place and The Suites in BGC and Garden Towers in Makati City as they near completion.
ALVEO’s revenues were primarily affected by lower incremental POC of Verve Residences 1 and 2 in BGC and Ardia Phase 3 in Vermosa, Cavite.
On the other hand, Avida’s revenues grew by 13% to PHP27.36 billion in 2019 from previous year’s PHP24.22 billion, with completion progress of Avida Towers Sola 2 in Vertis North, Quezon City and new bookings and incremental POC of Avida Verra Settings Vermosa Phase 1 in Vermosa, Cavite and Avida Towers Vireo Tower 1 in Arca South, Taguig City.

32
Amaia’s revenues remained flat, at PHP7.37 billion from previous year’s PHP7.36 billion with lower bookings and higher incremental POC of Amaia Steps Alabang Delicia in Muntinlupa City; Amaia Steps Capitol Central South in Bacolod City, Negros Occidental; and Amaia Steps Nuvali Parkway in Sta. Rosa, Laguna. Meanwhile, BellaVita’s revenues rose by 4% to PHP1.20 billion from PHP1.15 billion in 2018, due to bookings from projects in Alaminos and Pila, both in Laguna, and in Iloilo.
The average GP (gross profit) of vertical projects improved to 39% from 34% due to ALP’s Park Central South Tower, Garden Towers 2, and East Gallery Place; ALVEO’s Orean Place Tower 1, Celadon, and Travertine; and Avida Towers Sola Tower 2. The average GP of horizontal projects slightly rose to 45% from 44%.
MCT Bhd recognized revenues of PHP6.71 billion in 2019, 12% lower than previous year’s PHP7.60 billion, due to the sellout of projects in CyberSouth in Klang Valley, Malaysia.
Office for Sale. Revenues from the sale of office spaces grew by 12% to PHP12.34 billion from PHP11.0 billion in 2018 due to completion progress and new bookings from ALVEO High Street South Corporate Plaza, Park Triangle Corporate Plaza, and ALVEO Financial Tower. Improved margins of ALVEO High Street South Corporate Plaza, ALVEO Park Triangle Towers, and ALVEO Financial Tower significantly improved the average GP of offices for sale to 43%.
Commercial and Industrial Lots. Revenues from the sale of commercial and industrial lots increased by 46% to PHP11.27 billion from PHP7.73 billion, due to lot sales from Altaraza, Vermosa, Nuvali, and Broadfield. GP margins of commercial and industrial lots substantially increased to 62% from 50%, due to higher margins of commercial lots sold in Nuvali, Arca South, Altaraza, and Broadfield.
Total sales reservations grew by 3% to PHP145.9 billion from PHP141.9 billion in 2018. ALVEO and Avida fueled the growth, even as ALP tempered the same with few launches during the period. Sales reservations by Philippines-based Filipinos also grew by 3% and accounted for 71% (valued at PHP104.2 billion) of all reservations, while those by Filipinos based abroad grew by 24%, accounting for 13% (valued at PHP19.4 billion) of the total. Sales to other nationals, accounting for 16%, dipped by 10% to PHP22.2 billion from previous year’s PHP24.8 billion. Participation of mainland Chinese buyers, who dominate sales to non-Filipinos, declined by 22% to PHP8.3 billion from PHP10.7 billion in 2018, resulting in a drop in their share in sales to other nationals to 38% from previous year’s 49%. ALI launched PHP158.96-billion worth of property development projects in 2019, surpassing the initial estimate of PHP130 billion. Commercial Leasing. Total revenues from commercial leasing, consisting of the operations of shopping centers, office buildings, and hotels and resorts, increased by 13% to PHP39.31 billion from P34.91 billion in 2018, driven by the higher contribution of new leasing assets.
Shopping Centers. Revenues from shopping centers grew by 11% to PHP22.02 billion from PHP19.91 billion, supported by same-mall revenue growth of 8%, with increased contribution of new malls such as Ayala Malls Feliz, Capitol Central, and Circuit Makati. EBITDA (earnings before interest, taxes, depreciation, and amortization) margin was sustained at 66%. The average occupancy rate of all malls was 88%, with the occupancy rate of stable malls at 93%. The GLA of all malls now stands at 2.12 million sq. meters with the addition of 213,000 sq. meters from the opening of Ayala North Exchange Retail, Ayala Malls Manila Bay, and Ayala Malls Central Bloc Cebu.

33
Offices. Revenues from office leasing increased by 12% to PHP9.67 billion from previous year’s PHP8.61 billion, with the new offices in Ayala North Exchange, Vertis North, and Circuit Makati improving the segment’s performance. It registered a slightly lower EBITDA margin of 90% from 91% in 2018. The average occupancy rate of all offices was 96%, with the occupancy rate of stable offices at 97%. Total office leasing GLA is now 1.17 million sq. meters, with 70,000 sq. meters added by the completion of Ayala North Exchange BPO, Manila Bay BPO Tower, and Central Bloc Corporate Center Tower 1 in Cebu. Hotels and Resorts. Revenues from this segment grew by 19% to PHP7.62 billion from PHP6.39 billion in 2018 on strong patronage of Seda Ayala Center Cebu and Seda Lio. Higher occupancy and revenues per available room (REVPAR) at these two hotels were also responsible for increasing the overall EBITDA margin of hotels and resorts by 32% from previous year’s 29%. The average occupancy rate remains at healthy levels—70% for all hotels, 63% for all resorts, 78% for stable hotels, and 63% for stable resorts. The addition of 129 rooms—57 from SEDA BGC and 72 from SEDA Residences Ayala North Exchange—brings the total to 3,705 rooms. The hotels and resorts business manages 660 hotel rooms in its international brand segment—312 from Fairmont Hotel and Raffles Residences and 348 from Holiday Inn & Suites, both of which are in the Ayala Center, Makati CBD. There are now have 11 Seda Hotels, operating 2,367 rooms—Atria, Iloilo (152 rooms); BGC, Taguig (468); Centrio, Cagayan de Oro (150); Abreeza, Davao (186); Nuvali, Santa Rosa, Laguna (150); Vertis North, Quezon City (438); Capitol Central, Bacolod (154); Lio, Palawan (153); Ayala Center Cebu (301); Seda Residences Ayala North Exchange (215); and Circuit Corporate Residences (255). El Nido Resorts operates 193 rooms from its four island resorts—Pangulasian, Lagen, Miniloc, and Apulit. The Lio Tourism Estate currently has 152 rooms under its Bed and Breakfast (B&B) and Dormitel offerings, while the Sicogon Tourism Estate in Iloilo currently has 78 B&B rooms.
Services. This segment consists of ALI’s construction business through Makati Development Corporation (MDC); property management through Ayala Property Management Corporation (APMC); and other companies engaged in power services ( Direct Power Services, Inc.; Ecozone Power Management, Inc.; and Philippine Integrated Energy Solutions, Inc.) and airline services for the hotels and resorts business (AirSWIFT). Total revenues from the services business amounted to PHP8.85 billion, 15% higher than previous year’s PHP7.69 billion. Net construction revenues reached PHP3.40 billion, 42% higher than previous year’s PHP2.39 billion, gained from higher revenues from external contracts. APMC and the power services companies posted revenues of P5.45 billion, 3% higher than previous year’s PHP5.30 billion. Blended EBITDA margins of the services business stayed relatively flat to 10% from 9% in 2018. Equity in Net Earnings of Investees, Interest, Fees, Investment and Other Income Equity in net earnings of associates and joint ventures totaled PHP965.79 million, 29% higher than the PHP749.92 million posted in 2018. FBDC companies more than doubled their revenues due to commercial lot sales and to leasing assets in BGC (One Bonifacio High Street and ALVEO High Street South Corporate Plaza Retail). Meanwhile, Ortigas Holdings grew its revenues from property sales and leasing by 29%.

34
Interest and investment income, consisting of interest income on real estate sales and accretion, amounted to P8.82 billion, 10% higher than previous year’s PHP8.00 billion, despite lower interest income from short-term investments. Other income, mostly from marketing and management fees from joint ventures, amounted to PHP1.16 billion, 25% lower than previous year’s PHP1.54 billion which included the one-time sale transaction of assets by MCT Bhd. Expenses Total expenses were lower by 3% at PHP117.96 billion from previous year’s PHP121.04 billion, as real estate expenses decreased by 6% to PHP94.75 billion from PHP101.08 billion in 2018. General and administrative expenses (GAE) reached PHP9.37 billion, 3% higher than 2018’s PHP9.10 billion as overhead costs rose in line with inflation. This resulted in a GAE ratio of 5.5% and improved EBIT margin of 34.25% from 30.37% the previous year. Interest, other financing charges and other expenses rose by 27% increase to PHP13.84 billion from PHP10.86 billion the previous year billion as a result of higher interest expense on a higher average daily loan balance. Project and Capital Expenditure ALI’s capital expenditure amounted to PHP108.72 billion in 2019, mainly in support of the buildup of residential and leasing projects. Forty percent (40%) of the amount was spent on residential projects, 26% on commercial leasing, 17% on land acquisition, 14% on estate development, and 5% on other investments. Financial Condition As in previous years, the company’s balance sheet is solidly positioned to support its growth plans. Cash and cash equivalents, including short-term investments and financial assets at fair value through profit or loss , stood at PHP21.52 billion resulting in a current ratio of 1.30:1. Total borrowings registered at PHP211.10 billion, translating to a debt-to-equity ratio of 0.87:1 and a net debt-to-equity ratio of 0.78:1. Return on equity was at 16.66% as of December 31, 2019.
End-December 2019 End-December 2018
Current ratio 1 1.30:1 1.26:1
Debt-to-equity ratio 2 0.87:1 0.85:1
Net debt-to-equity ratio 3 0.78:1 0.72:1
Profitability Ratios:
Return on assets 4 5.43% 5.35%
Return on equity 5 16.66% 16.52%
Asset to Equity ratio 6 2.94:1 3.04:1
Interest Rate Coverage Ratio 7 6.27 6.09
1 Current assets / current liabilities 2 Total debt/ consolidated stockholders’ equity (Total debt includes short-term debt, long-term debt and current portion of long-term debt) 3 Net debt/ consolidated stockholders’ equity (Net debt is total debt less cash and cash equivalents, short term investments and financial assets through FVPL) 4 Total Net income / average total assets 5 Net income attributable to equity holders of ALI / average total stockholders’ equity attributable to equity holders of ALI
35
6 Total Assets /Total stockholders’ equity 7 EBITDA/Interest expense There are no events that will trigger direct or contingent financial obligation that is material to the company, including any default or acceleration of an obligation. There are no material off-balance sheet transactions, arrangements, obligations (including contingent obligations), and other relationships of the company with unconsolidated entities or other persons created in 2019. Causes for any material changes (+/- 5% or more) in the financial statements Income Statement items – December 2019 versus December 2018 Interest income from real estate sales and interest & investment income higher by 10% due to higher yield from residential business. Equity in net earnings of associates and joint ventures grew by 29% mainly coming from increased performance of FBDC companies, OHI's property sales, malls and offices, partially offset by negative equity pick-up of Rize Ayala (RWIL). Other Income lower by 25% due to recognition of Gain on sale of MCT Bhd's subsidiaries (One City Properties SDN BHD and Ecity Hotel SDN BHD) P237M and P265M respectively in 2018, partially offset by Gain on sale of Vertex One Bldg. amounted to P177M. Interest and other financing charges and other charges grew by 27% mainly due to increase in interest expense due higher ADB and this year's recognition of Interest expense-PFRS 16. Provision for income tax increased by 11% due to higher taxable income mainly coming from real estate. Balance Sheet items – December 2019 versus December 2018 Cash and cash equivalents decreased by 15% due to capital expenditures from Residential, Leasing and Land acquisitions. Short-term investments went down by 80% due to capital expenditures from Residential, Leasing and Land acquisitions. Real estate Inventories increased by 15% mainly from new launches from residential projects. Other current assets higher by 10% mostly due to presentation of Advances to Contractors from Accounts and Notes Receivable to Other current assets, and also due to the increase in CWT and Input VAT mainly from residential projects. Non-current Accounts and Notes Receivable increased by 17% primarily due to higher bookings of AR. Investments in associates and jointly controlled entities grew by 8% attributable to additional investments to AKL and ALI Eton. Investment properties up by 8% due to completion of investment properties from leasing and resorts. Property and equipment improved by 20% mainly coming from the increase in Hotel PPE and MCT Bhd.

36
Other noncurrent assets higher by 22% mainly due increase in bookings of leasehold rights and deposits. Short-term debt grew by 25% due to increase in borrowing to support property development, mall operations and land acquisitions. Account and other payables decreased by 5% due to capital expenditures from Residential, Leasing and Land acquisitions. Current portion of long-term debt lower by 26% due to settlement of matured long-term loans. Deposit and other current liabilities increased by 11% primarily due to the increase in deposits and reservation fees from various residential projects and offices group's one year advance rental income from tenants. Long-term debt up by 18% mainly from availment of new long-term loans. Deposit and other noncurrent liabilities lower by 14% primarily driven by leasing group's decrease in security deposits, reservations and advance rental deposits. Review of 2018 operations vs 2017
2018 was another year of robust growth for Ayala Land, Inc. (ALI or “the Company”), posting total revenues of P166.25 billion and net income of P29.24 billion, for a solid top line and bottomline growth of 17% and 16%, respectively. The strong performance of property development and commercial leasing, supported by the full consolidation of Malaysia-based subsidiary MCT Bhd, boosted revenues from Real Estate by 17% to P155.96 billion. Earnings before interest and taxes (EBIT) margin improved by a quarter percentage point, to 30.37% from 30.11% in 2017. BUSINESS SEGMENTS Property Development. This segment includes the sale of residential lots and units, office spaces, commercial and industrial lots, and the operations of MCT Bhd. Total revenues from Property Development grew by 18%, to P113.36 billion from P96.39 billion previous year.
Residential. Driven by new bookings and project completions, revenues from the sale of Ayala Land residential lots and units and from MCT Bhd’s operations reached P94.63 billion, an 18% growth from previous year’s P79.90 billion.
Revenues generated by AyalaLand Premier (ALP) rose by 6% to P28.00 billion from P26.50 billion previous year, due to bookings from The Courtyards in Vermosa, Cavite and The Alcoves in Cebu Business Park and higher completion of The Suites at the Bonifacio Global City, Taguig, Metro Manila. Alveo posted slightly higher revenues at P26.29 billion from previous year’s P26.17 billion. The increase is attributed to bookings from Orean Place Tower 1 at Vertis North, Quezon City, Metro Manila and Travertine Tower at Portico, Pasig City, Metro Manila, and higher completion at The Residences at Evo City in Kawit, Cavite. Bookings from Avida Towers Sola Tower 2 at Vertis North; Altura Tower 2 at South Park District, Muntinlupa City, Metro Manila; Asten Tower 3 at Makati City; and higher completion of Sola Tower 1 at Vertis North fueled Avida’s 16% revenue growth to

37
P24.22 billion from previous year’s P20.84 billion. Amaia posted a 20% improvement in revenues, to P7.36 billion from P5.74 billion, as a result of bookings and higher completion from Amaia Skies Shaw Tower 1 in Mandaluyong City, Metro Manila; Amaia Skies Cubao Tower 2 in Quezon City; Amaia Scapes General Trias in Cavite; and Amaia Steps Nuvali, Laguna. Meanwhile, bookings from BellaVita’s projects in Pililia, Rizal; Cabanatuan East, Nueva Ecija; and Iloilo almost doubled its revenues to P1.15 billion from P652 million previous year.
Overall, the average GP (gross profit) of Ayala Land’s vertical projects improved to 34% from 30% due to higher margins from Alveo’s High Park Tower 2, Orean Place Tower 1 and Avida’s Sola Tower 2 in Vertis North and Avida’s project in Southpark District, Altura Tower 2. On the other hand, the average GP of horizontal projects decreased to 44% from 47% due to the lower contribution of higher margin projects.
MCT Bhd recognized revenues of P7.60 billion from sales and completion progress of its projects in Cybersouth, an integrated development in Southern Klang Valley, and Lakefront, a residential project in Cyberjaya.
Office for Sale. Higher bookings from One Vertis Plaza in Vertis North and The Stiles East Enterprise Plaza in Circuit Makati and higher completion progress of Park Triangle Corporate Plaza in BGC and the Alveo Financial Tower in Makati CBD hiked revenues from the sale of office spaces by 16%, to P11.00 billion from P9.45 billion previous year. However, the lack of higher margin inventory resulted in a lower GP margin of 33% from 37% the previous year.
Commercial and Industrial Lots. Revenues from the sale of commercial and industrial lots grew by 10% to P7.73 billion from P7.04 billion, driven by commercial lot sales in the Vis-Min estates and in Evo City, Cavite, and industrial lot sales in Alviera, Pampanga and in the Cavite Technopark. The sale of commercial lots in Arca South, Alviera, Evo City and Lio and of industrial lots in Alviera and Cavite Technopark moved the GP margin of this segment upwards to 50% from previous year’s 40%. Strong demand from both local and overseas Filipinos fueled a full-year 16% increase in sales reservations, reaching P141.9 billion from previous year’s P121.96 billion. In the fourth quarter alone, reservation sales grew by 21% to PHP 33.8 billion. On the other hand, net booked sales reached P110.8 billion, a 14% increase from previous year’s P96.9 billion, with the fourth quarter number growing by 9% to P32.7 billion.
In 2018, Ayala Land launched P139.4-billion worth of residential and office-for-sale projects.
Commercial Leasing. This segment covers the operation of shopping centers, office buildings, and hotels and resorts. Total revenues from commercial leasing amounted to P34.91 billion, 17% higher than P29.94 billion posted a year ago.
Shopping Centers. The contribution of Greenbelt and Glorietta in Makati City and the improved performance of newly opened malls in Quezon City, such as UP Town Center, Ayala Malls Cloverleaf and Vertis North, and in Pasig City, namely Ayala Malls Feliz and The 30th boosted the segment’s revenues by 13% to P19.91 billion from P17.66 billion. EBITDA (Earnings Before Interest, Taxes, Depreciation and Amortization) margin was maintained at 66%. The average monthly lease rate was at P1,073 per sq. meter, while same mall rental grew by 6%. The average occupancy rate for all malls was 89%, while the occupancy rate of stable malls was higher at 95%. The Company opened three new malls in 2018—Circuit Mall in Makati with 52,000 sq. meters of gross leasable area (GLA), Capitol Central Mall in Bacolod with 67,000 sq. meters, and One

38
Bonifacio High Street in Taguig with 23,000 sq. meters—bringing the shopping centers’ year-end GLA to 1.90 million sq. meters. Offices. Revenues from office leasing rose by 29% to P8.61 billion from P6.66 billion due to the stabilized occupancy of new offices such as Vertis Corporate Center in Quezon City, Circuit Corporate Center in Makati City, and The 30th Corporate Center in Pasig City. Office leasing EBITDA margin was sustained at 91%. The monthly lease rate for offices averaged P755 per sq. meter. The average occupancy rate for all offices was 91%, while the occupancy rate of stable offices was 96%. The Company completed four new offices in 2018—Bacolod Capitol Corporate Center with 11,000-sq. meters GLA, Vertis North Corporate Center 3 with 38,000 sq. meters, Ayala North Exchange HQ Tower with 20,000 sq. meters and another 22,000 sq. meters in its BPO Tower—bringing the offices’ year-end GLA to 1.11 million sq. meters. Hotels and Resorts. Full-year operations of Seda Vertis North, Seda Capitol Central Bacolod and the recently renovated Apulit Island Resort in El Nido, Palawan coupled with the improved performance of our B&B’s nudged revenues from our hotels and resorts higher by 14%, to reach P6.39 billion from previous year’s P5.62 billion. Average revenue-per-available-room (REVPAR) of all hotels and resorts slightly decreased by 1% to P3,531 and P7,989 a night, respectively. Meanwhile, REVPAR of stable hotels increased by 6% to P4,369 a night; that of stable resorts increased by 12% to P10,896. EBITDA margin of this segment improved to 29% from 28% previous year. The average room rate a night of all hotels was P5,020, while that of stable hotels was PHP 5,593. Meanwhile, the average room rate a night of all resorts was P12,593, while that of stable resorts was P17,035. The average occupancy rates of all hotels and resorts were at 70% and 63%, respectively, while those of stable hotels and stable resorts were at 78% and 64%, respectively. A total of 390 rooms were added to the portfolio—Seda Capitol Central, 108; Seda Lio, 118; Circuit Residences, 80; Lio Dormitel, 42; Huni Sicogon, 19; Drift Hostel Sicogon, 16; and Sicogon Dormitel, 7—bringing the total number of rooms in operation to 2,973 by end-2018. The hotels and resorts business operates 660 hotel rooms under its international brand segment—312 for Fairmont Hotel and Raffles Residences, and 348 for Holiday Inn & Suites, both locked in Ayala Center, Makati CBD. Our homegrown Seda Hotels operates 1,828 rooms—Atria, Iloilo, 152; BGC, Taguig, 179; Centrio, Cagayan de Oro, 150; Abreeza, Davao, 186; Nuvali, Santa Rosa, Laguna, 150; Vertis North, Quezon City, 438; Capitol Central, Bacolod, 154; Lio, Palawan, 118; and Ayala Center Cebu, 301. El Nido Resorts operates 193 rooms in its four island resorts (Pangulasian, Lagen, Miniloc and Apulit), and Lio Tourism Estate currently has 144 rooms under its Bed and Breakfast (B&B) category and Dormitel offerings. Lastly, the Sicogon Tourism Estate in Iloilo currently operates 68 B&B rooms.
Services. This segment is composed of the Company’s construction business through Makati Development Corporation (MDC); property management, through Ayala Property Management Corporation (APMC), power services, through Direct Power Services, Inc. (DPSI), Ecozone Power Management, Inc. (EPMI), and Philippine Integrated Energy Solutions, Inc. (PhilEnergy); and airline services firm AirSWIFT, for the hotels and resorts business. Total revenues of this segment rose by 5% to P76.72 billion from P72.81 billion previous year.
Construction. The increased order book of projects from the Ayala Land group resulted in a corresponding increase in construction revenues, reaching P71.42 billion, 6% more than previous year’s P67.40 billion.

39
Property Management and Others. APMC, the power services companies, and AirSWIFT together posted revenues of P5.30 billion, a slight 2% decrease from the year-ago figure of P5.41 billion due to decreasing external retail electricity supply contracts.
Blended EBITDA margins of the Services business slightly declined to 9% from 10%. Equity in Net Earnings of Investees, Interest, Interest on Real Estate Sales, Fees, Investment, and Other Income The full consolidation of MCT Bhd into Ayala Land resulted in a 13% decrease in equity in net earnings of associates and JVs, to P750 million from previous year’s P866 million. Meanwhile, interest, interest from real estate sales and investment income increased by 31% to P8.00 billion from P6.09 billion previous year due to higher interest income from money market placements and accretion on installment sales. Other income reached P1.54 billion, 31% lower year-on-year. Project and Capital Expenditures Ayala Land spent P110.1 billion in capital expenditures to support the aggressive completion of new projects, 41% of which was spent on residential projects; 23% on commercial projects; 15%, land acquisition; 12%, development of estates; and 9%, on investments. Financial Condition Ayala Land’s balance sheet solidly positions the Company to pursue its growth plans. Cash and cash equivalents, including short-term investments and UITF investments classified as FVPL, stood at P27.56 billion, resulting in a current ratio of 1.26:1. Total borrowings amounted to P187.10 billion, translating to a debt-to-equity ratio of 0.85:1 and a net debt-to-equity ratio of 0.72:1. Return on equity as of December 31, 2018 was at 16.5%.
End-December 2018 End-December 2017
Current ratio 1 1.26:1 1.30:1
Debt-to-equity ratio 2 0.85:1 0.91:1
Net debt-to-equity ratio 3 0.72:1 0.77:1
Profitability Ratios:
Return on assets 4 5.35% 5.07%
Return on equity 5 16.52% 16.09%
Asset to Equity ratio 6 3.04:1 2.99:1
Interest Rate Coverage Ratio 7 6.1 6.0
1 Current assets / current liabilities 2 Total debt/ consolidated stockholders’ equity (Total debt includes short-term debt, long-term debt and current portion of long-term debt) 3 Net debt/ consolidated stockholders’ equity (Net debt is total debt less cash and cash equivalents, short term investments and financial assets through FVPLl) 4 Total Net income / average total assets 5 Net income attributable to equity holders of ALI / average total stockholders’ equity attributable to equity holders of ALI 6 Total Assets /Total stockholders’ equity 7 EBITDA/Interest expense There are no events that will trigger direct or contingent financial obligation that is material to the company, including any default or acceleration of an obligation.

40
There are no material off-balance sheet transactions, arrangements, obligations (including contingent obligations), and other relationships of the company with unconsolidated entities or other persons created in 2017. Causes for any material changes (+/- 5% or more) in the financial statements Real estate revenues increased by 17% due to the consistent growth of property development and commercial leasing. Property development grew by 18% driven by new bookings and project completions from residential projects and sales of office spaces, commercial and industrial lots. Commercial leasing was higher by 17% coming from improved performance of newly opened malls. Interest income from real estate sales and interest & investment income higher by 31% mainly due to higher rate in 2018 from short-term investments. Equity in net earnings of associates and joint ventures went down by 13% primarily due to the consolidation of ALI’s investment in MCT Bhd in 2018 from equity pickup treatment in 2017. Other Income lower by 31% mainly due to the impact of the reversal of Comtrust impairment in 2017. Real estate costs increased by 15% primarily driven by higher sales and incremental project completions from residential and leasing businesses. General and administrative expenses higher by 25% due to the consolidation of ALI’s investment in MCT Bhd in 2018. Interest and other financing charges and other charges grew by 19% due to the increase in interest expense on banks as a result of higher average loan balance and bank rate in 2018. Provision for income tax increased by 22% due to higher taxable income driven by higher real estate revenues. Non-controlling interests higher by 39% as a result of the consolidation of ALI’s investment in MCT Bhd in 2018. Balance Sheet items – December 2018 versus December 2017 Cash and cash equivalents up by 14% primarily due to the consolidation of ALI’s investment in MCT Bhd in 2018. Short-term investments went down by 35% mainly coming from matured money market placements of Ayala Hotels Inc., BG West Properties, Inc., and Roxas Land Corp. Financial assets at fair value through profit or loss lower by 12% due to the maturity of some investments in ARCH Capital Funds. Real estate Inventories higher by 15% primarily due to the impact of PIC Q&A No. 2018-11 on the classification of land by real estate developer. Other current assets lower by 8% mainly due to the decrease in input VAT, partly offset by increase in CWT mostly from residential projects. Non-current accounts and notes receivable went down by 92% due to reclass to Contract asset, impact of the PFRS 15 Revenue from Contracts with Customers implementation in 2018. Investments in associates and joint ventures lower by 13% driven by the consolidation of ALI’s investment in MCT Bhd in 2018 from equity pickup treatment in 2017.

41
Investment properties up by 12% primarily due to the impact of PIC Q&A No. 2018-11 on the classification of land by real estate developer. Property and equipment increased by 25% mainly coming from inclusion of ALI’s investment in MCT Bhd in 2018. Deferred tax assets higher by 22% due to additional DTA from PAS Straight-line recognition of revenue (Accounting Standard vs BIR) of leasing group. Other noncurrent assets grew by 36% due to the increase in bookings of pre-operating expenses, deferred input VAT and deferred charges. Account and other payables up by 25% mostly due to the consolidation of ALI’s investment in MCT Bhd in 2018. Short-term debt dropped by 18% due to conversion to long term debt from short term debt. Income tax payable up by 165% due to higher taxable income primarily from real estate revenues. Current portion of long-term debt increased by 254% due to incremental debt (bonds and loans) of Ayala Land Inc., Amorsedia Development Corp., and Alveo Land Corp., and inclusion of ALI’s investment in MCT Bhd in 2018. Deposit and other current liabilities declined by 69% due to the decrease in customers' deposits from real estate customers who reached the 10% threshold for sales bookings. Deferred tax liabilities higher by 66% primarily coming from the recognition of deferred tax liability for the uncollected receivables from residential development. Total Equity attributable to equity holders of Ayala Land, Inc. grew by 12% due to the increase in equity reserve as a result of the consolidation of ALI’s investment in MCT Bhd in 2018. Non-controlling interests up by 29% largely due to NIAT share of subsidiaries and consolidation of ALI’s investment in MCT Bhd in 2018. Item 7. Financial Statements The 2020 consolidated financial statements of the Company are incorporated in the accompanying Index to Exhibits. Item 8. Information on Independent Accountant and Other Related Matters Independent Public Accountants (a) The principal accountant and external auditor of the Company is SyCip Gorres Velayo & Co. (SGV &
Co.). The same accounting firm is being recommended for re-election at the annual stockholders’ meeting.
(b) Representatives of SGV & Co. for the current year and for the most recently completed fiscal year are
expected to be present at the annual stockholders’ meeting. They will have the opportunity to make a statement if they desire to do so and are expected to be available to respond to appropriate questions

42
Pursuant to the General Requirements of SRC Rule 68, Par. 3 (Qualifications and Reports of Independent Auditors), the Company has engaged SGV & Co. as external auditor, and Mr. Michael C. Sabado is the Partner-in-charge for the audit years 2020, 2019 and 2018 while Ms. Lucy L. Chan served as such for the audit years 2017 to 2018.
Changes in and Disagreements with Accountants on Accounting and Financial Disclosure
The Company has engaged the services of SGV & Co. during the two most recent fiscal years. There were no disagreements with the SGV & Co. on any matter of accounting and financial disclosure.
(c) Audit and Audit-Related Fees
ALI and its various subsidiaries and affiliates paid SGV & Co, the following fees in the past two years: (in Php million; with VAT)
Year Audit & Audit-related Fees Tax Fees Other Fees
2020 34.61* 13.08**
2019 35.12* 17.24** * Pertains to audit fees. **SGV fees for the validation of stockholders’ votes during the annual stockholders’ meeting and other assurance fees.
(d) Tax Fees
Tax consultancy services are secured from entities other than the external auditor.
Under paragraph 3.3 (a) of the ALI Audit Committee Charter, the Audit Committee (composed of Cesar V. Purisima, Chairman, and Rex Ma. A. Mendoza, and Antonino T. Aquino, members) recommends to the Board the appointment of the external auditor and the audit fees.

43
PART IV – MANAGEMENT AND CERTAIN SECURITY HOLDERS Item 9. Directors and Executive Officers of the Registrant The write-ups below include positions held as of December 31, 2020 and in the past five years, and personal data as of December 31, 2020 of directors and executive officers.
Board of Directors Fernando Zobel de Ayala Jaime Augusto Zobel de Ayala Bernard Vincent O. Dy Antonino T. Aquino Arturo G. Corpuz Rizalina G. Mantaring Rex Ma. A. Mendoza Sherisa P. Nuesa Cesar V. Purisima
Fernando Zobel de Ayala, Filipino, 60, has served as Chairman of the Board of ALI since April 1999. He
holds the following positions in publicly listed companies: President and Chief Operating Officer of Ayala
Corporation; Chairman of Manila Water Company, Inc. and AC Energy Corporation (formerly AC Energy
Philippines, Inc.).; Director of Bank of The Philippine Islands, Globe Telecom, Inc. and Integrated Micro-
Electronics, Inc.; and Independent Director of Pilipinas Shell Petroleum Corporation. He is the Chairman
of AC International Finance Ltd., Liontide Holdings, Inc., AC Energy and Infrastructure Corporation
(formerly AC Energy, Inc.), Ayala Healthcare Holdings, Inc., Automobile Central Enterprise, Inc., Alabang
Commercial Corporation, Accendo Commercial Corp. and Hero Foundation, Inc.; Co- Chairman of Ayala
Foundation, Inc. and Ayala Group Club, Inc.; Vice-Chairman of AC Industrial Technology Holdings, Inc.,
ALI Eton Property Development Corporation, Ceci Realty Inc., Fort Bonifacio Development Corporation,
Bonifacio Land Corporation, Emerging City Holdings, Inc., Columbus Holdings, Inc., Berkshires Holdings,
Inc. AKL Properties, Inc., AC Ventures Holdings Corp., and Bonifacio Art Foundation, Inc.; Director of LiveIt
Investments, Ltd., AG Holdings Ltd., AC Infrastructure Holdings Corporation, Altaraza Development,
Corporation, Asiacom Philippines, Inc., Ayala Retirement Fund Holdings, Inc., Honda Cars Philippines,
Inc., Isuzu Philippines Corporation, and Manila Peninsula; Member of the Board of INSEAD Business
School and Georgetown University; Member of the International Advisory Board of Tikehau Capital and of
the Hispanic Society Museum & Library International Advisory Council; Vice Chairman of the Philippine-
Singapore Business Council, member of the Chief Executives Organization; Chairman of Habitat for
Humanity International’s Asia-Pacific Capital Campaign Steering Committee; and Member of the Board of
Trustees of Caritas Manila, Pilipinas Shell Foundation, and the National Museum. He graduated with B.A.
Liberal Arts at Harvard College in 1982 and holds a CIM from INSEAD, France.. Jaime Augusto Zobel de Ayala, Filipino, 61, Director of Ayala Corporation since May 1987. He is the Chairman and CEO of Ayala Corporation since April 2006. He holds the following positions in publicly listed companies: Chairman of Globe Telecom, Inc., Integrated Micro-Electronics, Inc. and Bank of the Philippine Islands; and Vice Chairman of Ayala Land, Inc., Manila Water Company, Inc. and AC Energy Corporation (formerly AC Energy Philippines, Inc.). He is also the Chairman of Ayala Retirement Fund Holdings, Inc., AC Industrial Technology Holdings, Inc., AC Ventures Holding Corp., AC Infrastructure Holdings Corporation, and Asiacom Philippines, Inc.; Co-Chairman of Ayala Foundation, Inc. and Ayala Group Club, Inc.; Director of Alabang Commercial Corporation, Ayala International Pte. Ltd., AC Energy and Infrastructure Corporation (formerly AC Energy, Inc.), Ayala Healthcare Holdings, Inc., Light Rail Manila Holdings, Inc. and AG Holdings Ltd. Outside the Ayala group, he is a member of various business and socio- civic organizations in the Philippines and abroad, including the JP Morgan International Council, JP Morgan Asia Pacific Council, and Mitsubishi Corporation International Advisory Council. He

44
sits on the board of the Singapore Management University and on various advisory boards of Harvard University, including the Global Advisory Council, HBS Board of Dean’s Advisors, and HBS Asia-Pacific Advisory Board, which he chairs. He is Chairman Emeritus of the Asia Business Council, a member of the Global Board of Adviser of the Council on Foreign Relations, and Co-Vice Chairman of the Makati Business Club, Chairman of Endeavor Philippines, and a board member of Eisenhower Fellowships. He was awarded the Presidential Medal of Merit in 2009, the Philippine Legion of Honor with rank of Grand Commander in 2010, and the Order of Mabini with rank of Commander in 2015 by the President of the Philippines in recognition of his outstanding public service. In 2017, he was recognized as a United Nations Sustainable Development Goals Pioneer by the UN Global Compact for his work in sustainable business strategy and operations. The first recipient of the award from the Philippines, he was one of 10 individuals recognized for championing sustainability and the pursuit of the 17 SDGs in business. He graduated with B.A. in Economics (Cum Laude) from Harvard College in 1981 and obtained an MBA from the Harvard Graduate School of Business in 1987.
Bernard Vincent O. Dy, Filipino, 57, has led Ayala Land, Inc. as President and Chief Executive Officer since April 7, 2014. He is also a Senior Managing Director of Ayala Corporation and has been a member of the Ayala Group Management Committee since April 2014. He was the Head of Residential Business, Commercial Business and Corporate Marketing and Sales. He is also the Chairman of Ayala Property Management Corporation; Makati Development Corporation; Alveo Land Corporation; Amaia Land Corporation; Bellavita Land Corporation; Ayagold Retailers, Inc.; Station Square East Commercial Corporation; Aviana Development Corp.; Cagayan De Oro Gateway Corp.; BGSouth Properties, Inc.; BGNorth Properties, Inc.; BGWest Properties, Inc.; Portico Land Corporation.; Philippine Integrated Energy Solutions, Inc.; Avencosouth Corp.; Nuevocentro, Inc. and Cebu Holdings, Inc. Mr. Dy also serves as Vice Chairman of Ayala Greenfield Development Corporation and Alviera Country Club, Inc.He is also President of President of Bonifacio Land Corporation; Emerging City Holdings, Inc.; Columbus Holdings, Inc.; Berkshires Holdings, Inc.; Fort Bonifacio Development Corporation; Aurora Properties Incorporated; Vesta Property Holdings, Inc.; Ceci Realty Inc.; Alabang Commercial Corporation; and Accendo Commercial Corporation. Mr. Dy also serves as Director of AyalaLand Logistics Holdings Corp.; MCT Bhd of Malaysia; Avida Land Corporation; Amicassa Process Solutions, Inc.; Whiteknight Holdings, Inc.; AyalaLand Medical Facilities Leasing, Inc.; Serendra, Inc.; Alveo-Federal Land Communities, Inc.; ALI Eton Property Development Corporation; and AKL Properties, Inc. Mr. Dy is the President of Hero Foundation Inc. and Bonifacio Art Foundation, Inc. He is also a member of Ayala Foundation, Inc. and Ayala Group Club, Inc. In 2015, he was inducted as member of the Advisory Council of the National Advisory Group for the Police Transformation Development of the Philippine National Police. He has also been a Director of the Junior Golf Foundation of the Philippines since 2010 and has served as Vice Chairman since 2017. He earned a Bachelor’s Degree in Business Administration from the University of Notre Dame in 1985, He received his MBA in 1989 and MA International Relations in 1997, both at the University of Chicago. Antonino T. Aquino, Filipino, 73, has served as Director of ALI since April 2009. He is also a Director of Manila Water Company, Inc. (MWC), another publicly listed company, since 1998. He was the President of ALI from April 2009 to April 2014, MWC from April 1999 to April 2009, and Ayala Property Management Corporation from 1989 to 1999. Currently, he is a Board member of Philippine American Life & General Insurance Company, Nuevocentro, Inc., Anvaya Beach & Nature Club and Mano Amiga Academy, Inc. He is also a private sector representative in the Multi Sectoral Advisory Board of the Philippine Army and the Multi Sector Governance Council of the Armed Forces of the Philippines. He was named “Co-Management Man of the Year 2009” by the Management Association of the Philippines. In 2020, he was awarded Honorary Fellow by the Institute of Corporate Directors. He earned a degree in BS Management and completed academic requirements for Masters in Business from the Ateneo de Manila University in 1968 and 1975, respectively. Arturo G. Corpuz, Filipino, 64, has served as a Director of ALI since April 2016. He was a member of the Management Committee of ALI from 2008 to December 31, 2016. He is also a member of the Board of Ceci Realty, Inc. Aurora Properties, Inc., Vesta Properties Holdings, Inc., Nuevocentro, Inc., and Alviera Country Club, Inc. He is a former President of the Philippine Economic Society and a Fellow of the Foundation for Economic Freedom and the Philippine Institute of Environmental Planning. Mr. Corpuz

45
received his baccalaureate degree in Architecture from the University of the Philippines in 1977 and his masteral and doctoral degrees in urban and regional planning from Cornell University in 1984 and 1989. Rizalina G. Mantaring, Filipino, 61, has served as an Independent Director of ALI since April 2014. Concurrently, she also holds the following positions: Director, Sun Life Grepa Financial, Inc.; an Independent Director of Ayala Corporation, First Philippine Holdings Corp. Inc., PHINMA Corp. Inc., Universal Robina Corp. Inc., East Asia Computer Center Inc. and Microventures Foundation Inc. She is also a member of the Boards of Trustees of the Makati Business Club, and Philippine Business for Education. A recipient of the Asia Talent Management Award in the Asia Business Leaders Award organized by the global business news network CNBC. She was selected as one of the 100 Most Outstanding Alumni of the past century by the University of the Philippines College of Engineering, and was 2019 PAX awardee of St. Scholastica’s College Manila, the highest award given by the school to outstanding alumni. She holds a BS Electrical Engineering degree from the University of the Philippines where she graduated with honors in 1982. She obtained her MS degree in Computer Science from the State University of New York at Albany in 1993.
Rex Ma. A. Mendoza, Filipino, 58, has served as the Independent Director of Ayala Land, Inc. since April 22, 2020. He is the President and CEO of Rampver Financials, a financial services firm and the leading non-bank mutual funds distributor in the country. He currently serves as the lead independent director of Globe Telecom, Inc. (publicly listed company) and an independent director of two (2) listed firms, Ayalaland Logistics Holdings Corp. andthe National Reinsurance Corporation of the Philippines. He is also a director of Esquire Financing, Inc., the Cullinan Group, TechnoMarine Philippines, Seven Tall Trees Events Company, Inc., and Mobile Group, Inc. Rex is a member of Bro. Bo Sanchez’ Mastermind Group, and is cited by many as one of the best leadership, business strategy, investments, marketing and sales speakers in the country. He is the author of two books, Trailblazing Success and Firing On All Cylinders, both certified national bestsellers. He served as the President & CEO of Philam Life, one of the country’s most trusted financial services conglomerates and was Chairman of its affiliates and subsidiaries. He was also Senior Adviser to the Chief Executive Officer of the AIA Group. Prior to this, he was previously Senior Vice President and Chief Marketing and Sales Officer of ALI. He was also Chairman of Ayala Land International Sales, Inc., President of Ayala Land Sales, Inc., and Avida Sales Corporation. He has a Master’s Degree in Business Management with distinction from the Asian Institute of Management. He was one of the 10 Outstanding Graduates of his batch at the University of the Philippines where he obtained a BSBA degree with a double major in marketing and finance. He was awarded Most Distinguished Alumnus of the UP Cesar Virata School of Business. He is also a Fellow with Distinction at the Life Management Institute of Atlanta, Georgia, USA, a Registered Financial Planner (RFP) and a four-time member of the Million Dollar Round Table (MDRT). He was a professor of Marketing and Computational Finance at the De La Salle University Graduate School of Business. He taught strategic marketing, services marketing and services strategy. He has served as Chairman of the Marketing Department and was awarded as one of the University’s most outstanding professors.
Sherisa P. Nuesa, Filipino, 66, has served as an Independent Director of Ayala Land, Inc. since April 22, 2020. She is the President and Director of the ALFM Mutual Funds Group until March 31, 2021. She is also an Independent Director of Far Eastern University, Integrated Micro-electronics, Inc., Manila Water Company, Inc., and AC Energy Corporation (formerly AC Energy Philippines, Inc.) She is also an Independent Director of East Asia Computer Center, Inc. and FERN Realty Corporation. She is a member of the Boards of Trustees of the Institute of Corporate Directors (Vice Chair), the Judicial Reform Initiative (Chairperson), and the Financial Executives (FINEX) Foundation. She is a Senior Adviser to the Boards of Metro Retail Stores Group, Inc. and Vicsal Development Corporation. She retired as a Managing Director of Ayala Corporation in 2011, and held various senior positions in finance and management operations. She was the Chief Finance Officer and concurrently, Chief Administration Officer of IMI from 2009 to 2010. She was the Chief Finance Officer of Manila Water Company, Inc. from 2000 to 2008. She also served in Ayala Land, Inc. from 1989 to1999 as Vice President/Controller, then as the Group Head of its Commercial Centers Group. She was awarded the ING-FINEX CFO of the Year for 2008. She received a Master of Business Administration degree from the Ateneo Graduate School of Business in Manila. She also attended post-graduate courses in Harvard Business School and in Stanford

46
University. She graduated summa cum laude with a degree of Bachelor of Science in Commerce from the Far Eastern University in 1974. She is a Certified Public Accountant. Cesar V. Purisima, Filipino, 60, has served as an Independent Director of ALI in April 18, 2018. He is an Asia Fellow of Milken Institute, a global non-profit, non-partisan think tank. He is a founding partner at IKHLAS Capital, a pan-ASEAN private equity platform. He currently serves on the boards of the AIA Group, World Wildlife Fund-Philippines, De La Salle University, Ayala Land, Universal Robina Corporation, Jollibee Foods Corporation, Bank of the Philippine Islands, and the International School of Manila. He is a member of Sumitomo Mitsui Banking Corporation’s Global Advisory Council and Singapore Management University’s International Advisory Council in the Philippines. From 2010 to 2016, Purisima was the Secretary of Finance of the Philippines and the Chair of Economic Development Cluster of the President’s Cabinet. He briefly served as Finance Secretary in 2005 and Trade and Industry Secretary from 2004 to 2005. Additionally, he was a member of the Monetary Board of the Philippines Central Bank, and the Governor for the Philippines at the Asian Development Bank and the World Bank. He served as Alternate Governor for the Philippines at the International Monetary Fund. Under his leadership, the Philippines received its first investment-grade ratings. He was named Finance Minister of the Year seven times in six consecutive years by a number of publications, a first for the Philippines. Prior to his stints in the government service, he was the Chairman & Country Managing Partner of the Philippines' largest professional services firm SGV & Co., and was a member of the Global Executive Board and Global Practice Council of Ernst & Young. Purisima obtained his Bachelor of Science degree in Commerce Major in Accounting and Financial Institutions from De La Salle University in 1979. He earned his Master of Business Administration degree from Kellogg School of Management, Northwestern University, Illinois in 1983. He was conferred a Knight in the National Order of the Legion of Honour by the French Republic (Chevalier dans l’Ordre National de la Legion d’Honneur) in 2017. In 2016, Purisima was awarded the Order of Lakandula with the rank of Grand Cross (Bayani) for his contributions to the Philippine economy. The Order of Lakandula is one of the highest civilian honors conferred by the President of the Republic of the Philippines. Nominees to the Board of Directors for election at the stockholders’ meeting: All the incumbent directors. Management Committee Members / Key Executive Officers
Bernard Vincent O. Dy* President and Chief Executive Officer Dante M. Abando Senior Vice President Augusto D. Bengzon Senior Vice President, Chief Finance Officer, Treasurer,
& Chief Compliance Officer Anna Ma. Margarita B. Dy Senior Vice President Jose Emmanuel H. Jalandoni Senior Vice President Robert S. Lao Senior Vice President Laurent P. Lamasuta*** Senior Vice President Jaime E. Ysmael** Senior Vice President Lyle A. Abadia Vice President Amelia Ann T. Alipao Vice President***, Chief Information Officer and Data Protection Officer Aniceto V. Bisnar, Jr. Vice President Manuel A. Blas II** Vice President Ma. Luisa D. Chiong*** Vice President Dindo R. Fernando Vice President Rufino Hermann S. Gutierrez Vice President Javier D. Hernandez Vice President Ma. Carmela K. Ignacio** Vice President Joseph Carmichael Z. Jugo Vice President

47
Ma. Divina Y. Lopez*** Vice President Michael Alexis C. Legaspi** Vice President Christopher B. Maglanoc Vice President Michael F. Magpusao Vice President Ferdie M. Mangali Vice President Romeo T. Menpin, Jr. Vice President Carol T. Mills Vice President June Vee D. Monteclaro-Navarro*** Vice President Rodelito J. Ocampo Vice President Ginaflor C. Oris Vice President Darwin L. Salipsip Vice President Angelica L. Salvador** Vice President Eliezer C. Tanlapco Vice President Maria Rowena Victoria M. Tomeldan Vice President Jennylle S. Tupaz Vice President Annabeth R. Bernardo**** Chief Audit Executive Solomon M. Hermosura Group General Counsel & Corporate Secretary *Member of the Board of Directors **Until December 31, 2020 ***Appointed November 26, 2020 effective January 1, 2021 ****Appointed November 26, 2020 effective January 2, 2021
Dante M. Abando, Filipino, 56, is a Senior Vice President and Member of the Management Committee of ALI. He is the President and CEO of Makati Development Corporation. He is also the Chairman of MDC BuildPlus, Inc., MDC Concrete, Inc., MDC Equipment Solutions, Inc. and MDBI Construction Corp., a joint venture of Makati Development Corporation and Bouygues Batiment International. He was the past President and now a Board Member of Alveo Land Corporation. He is currently a Board Member of Avida Land Corporation, Serendra, Inc., Ayala Property Management Corporation and Anvaya Cove Golf & Sports Club, Inc. He was the Chairman and President of the Philippine Constructors Association (PCA) in 2016-2017 and a member of the Board of Trustees of the University of the Philippines Alumni Engineers (UPAE) since 2015-2018. He graduated with a degree in Bachelor of Science in Civil Engineering from the University of the Philippines in 1986 and earned his Master’s degree in Business Administration in 1995 from the same university. In 2012, he completed the Executive Program on Real Estate Management at Harvard University Graduate School of Business. Augusto D. Bengzon, Filipino, 57, joined ALI in December 2004 and currently serves as its Senior Vice President, Chief Finance Officer, Chief Compliance Officer & Treasurer. He is a Director of AREIT, Inc. and Treasurer of Cebu Holdings Inc. and AyalaLand Logistics Holding Corp., the publicly listed subsidiaries of ALI. His other significant positions include: Chairman of Aprisa Business Process Solutions Inc.; Director, Treasurer & Compliance Officer of Anvaya Cove Golf and Sports Club Inc.; Director and Chief Finance Officer of Altaraza Development Corporation; Director and Treasurer of ALI Eton Property Development Corp., Amaia Land Corp., Aurora Properties Inc., Avida Land Corp., Ayala Property Management Corp., Bellavita Land Corp., BGNorth Properties Inc., BGSouth Properties Inc., BGWest Properties Inc., Ceci Realty Inc., Philippine Integrated Energy Solutions Inc., Serendra Inc. and Vesta Property Holdings Inc.; Director & Assistant Treasurer of Ayala Greenfield Development Corp.; Director of AG Counselors Corporation, Alviera Country Club Inc., Alveo Land Corp., Ayala Land Premier Inc., Makati Development Corp., Nuevocentro Inc., Northgate Hotel Ventures, Inc., Portico Land Corp., Station Square East Commercial Corp. and Southcrest Hotel Ventures, Inc.; Treasurer of Alabang Commercial Corporation, AKL Properties, Inc. and Hero Foundation, Inc.; Assistant Treasurer of Ayala Greenfield Golf & Leisure Club, Inc. and Trustee of the Philippine National Police Foundation, Inc. He received his Bachelor of Science degree in Business Management from the Ateneo de Manila University and is a graduate of the Philippine Trust Institute. He was granted the Andres K. Roxas scholarship at the Asian Institute of Management where he received his Masters in Business Management degree..

48
Anna Ma. Margarita B. Dy, Filipino, 51, is a Senior Vice President since January 1, 2015 and a member of the Management Committee of ALI since August 2008. She is the Head of the Strategic Landbank Management (SLMG) of ALI. She is also the President of Cebu Holdings, Inc. one of the publicly listed subsidiaries of ALI. Her other significant positions are: Chairman and President of Bonifacio Global City Estate Association and Taft Punta Engano Property, Inc.; Chairman of Adauge Commercial Corporation, Amorsedia Development Corporation, AyalaLand Estates, Inc, Buendia LandHoldings, Inc., Bonifacio Estate Services Corporation, Crimson Field Enterprises, Inc., and Red Creek Properties, Incorporated; Vice Chairman and President of Vesta Properties Holdings, Inc.; Director and Executive Vice President of Bonifacio Land Corporation and Fort Bonifacio Development Corporation; Director and President of Altaraza Development Corporation, ALI Eton Property Development Corporation, Aurora Properties, Inc., Nuevocentro, Inc., and Alviera Country Club, Inc; Director of Accendo Commercial Corp., Alveo Land Corp., Aviana Development Corp., Avida Land Corp., Ayala Greenfield Development Corporation, Berkshires Holdings, Inc., Cagayan de Oro Gateway Corp., Columbus Holdings, Inc., Emerging City Holdings, Inc., CECI Realty, Inc., Crans Montana Property Holdings Corporation, AyalaLand Medical Facilities Leasing, Inc., and HLC Development Corporation, Next Urban Alliance Development Corp.; Trustee of Alagang Ayala Land Foundation Inc.; and, Trustee and Treasurer of Bonifacio Art Foundation, Inc. Prior to joining ALI, she was a Vice President of Benpres Holdings Corporation. She graduated magna cum laude from Ateneo De Manila University with BS of Arts Degree in Economics Honors Program. She earned her Master’s degree in Economics from London School of Economics and Political Science UK 1991 and MBA at Harvard Graduate School of Business Administration in Boston. Jose Emmanuel H. Jalandoni, Filipino, 53, is a Senior Vice President and a member of the Management Committee of ALI. He is the Group Head of commercial businesses including malls, offices, hotels, resorts and Chairman of ALI Capital Corporation. He is Chairman of AREIT, Inc., AyalaLand Logistics Holdings Corp. and Director of Cebu Holdings, Inc., publicly listed subsidiaries of ALI. His other significant positions are: Chairman of the Board of ALI Commercial Center, Inc., ALI Makati Hotel and Residences, Inc., ALI Makati Hotel Property, Inc., ALI Triangle Hotel Ventures, Inc., Arca South Hotel Ventures, Inc., AsiaTown Hotel Ventures, Inc., Ayala Hotels, Inc., AyalaLand Hotels and Resorts Corporation, AyalaLand Medical Facilities Leasing, Inc., AyalaLand Offices, Inc., Bacuit Bay Development Corporation, Bay Area Hotel Ventures, Inc., Bonifacio Hotel Ventures, Inc., Capitol Central Hotel Ventures, Inc., Cebu Insular Hotel Company, Inc., Central Bloc Hotel Ventures, Inc. Chirica Resorts Corporation, Circuit Makati Hotel Ventures, Inc., Direct Power Services, Inc., Ecoholdings Company Inc., Econorth Resort Ventures, Inc., EcoSouth Hotel Ventures, Inc., Enjay Hotels, Inc., Greenhaven Property Ventures, Inc., Integrated Eco-Resort, Inc., Lio Resort Ventures, Inc., Lio Tourism Estate Management Corporation, Makati North Hotel Ventures, North Eastern Commercial Corporation, North Liberty Resort Ventures, Inc., North Triangle Hotel Ventures., Inc., Northgate Hotel Ventures, Inc., One Makati Hotel Ventures, Inc., Pangulasian Island Resort Corporation, Paragua Eco-Resort Ventures, Inc., Regent Horizons Conservation Company, Inc., Sentera Hotel Ventures, Inc., Sicogon Island Tourism Sicogon Town Hotel, Inc., Estate Corporation, Soltea Commercial Corporation, Southcrest Hotel Ventures, Inc., Ten Knots Development Corporation, Ten Knots Philippines, Inc., Whiteknight Holdings, Inc. and One Makati Residential Ventures, Inc. He is also Director of the following companies: Accendo Commercial Corporation, Alabang Commercial Corporation, Arca South Integrated Terminal, Inc., Ayagold Retailers, Inc., Ayala Property Management Corporation, Cagayan de Oro Gateway Corporation, Columbus Holdings, Inc., Fort Bonifacio Development Corporation, Makati Cornerstone Leasing Corporation, Makati Development Corporation, Philippine FamilyMart CVS, Inc., Philippine Integrated Energy Solutions, Inc., Station Square East Commercial Corporation. He joined ALI in 1996 and held various positions in the Company. He graduated with a degree of Bachelor of Science in Legal Management from Ateneo de Manila University. He earned his Master’s Degree in Business Administration from Asian Institute of Management. He is a Chartered Financial Analyst. Robert S. Lao, Filipino, 47, has been Senior Vice President of ALI and a member of the Management Committee of Ayala Land, Inc. since April 19, 2017. He is also the Group Head of Ayala Land’s Residential Business Group and the Group Head of the Central Land Acquisition Unit. He is concurrently the President of Alveo Land Corp and Amaia Land Corp., BellaVita Land Corporation, AKL Properties Inc., BGSouth Properties, Inc., and President and Chief Operating Officer of Portico Land Corp.; He is the Chairman of the Board of Avida Land Corp., . He is also the Chairman of the Board and President of

49
Serendra, Inc. Prior to joining Ayala Land, Inc., he served as a Senior Process Engineer of Fujitsu Computer Products Corporation of the Philippines (FCPP) and Lead Process Engineer of PT. Quantum Electronics in Indonesia. He is a licensed Real Estate Broker. He studied at the University of Santo Tomas (UST) and graduated cum laude in Bachelor of Science in Industrial Engineering in 1995. He completed his Master’s in Business Management (MBM) degree in 2001 from the Asian Institute of Management (AIM) and attended the International Student Exchange Program from University of Cologne
in Germany. Laurent P. Lamasuta, Filipino, 55, was designated as Senior Vice President of Ayala Land, Inc. in 2021 and is currently the President and Chief Executive Officer of Ayala Property Management Corporation (APMC) and the Chairman and President of Prime Support Services, Inc. Prior to joining APMC, he was President and CEO of Ten Knots Development Corporation, developer, operator and manager of El Nido Resorts comprising of four eco-tourism island resorts in Palawan. Mr. Lamasuta has had several posts with the international luxury hotel industry with stints in independent top properties like The Ritz in Paris, the Dorchester in London, The Manila Hotel in Manila as well as international brands like Intercontinental Hotels, Ritz-Carlton Hotels and Le Meridien Hotels. Previously he was a Senior Advisor of Ayala Land for member and customer relations of its Residential Business Group. He Joined Ayala Land in 2005 to open Ayala Greenfield Golf and Leisure Club, Inc. and Anvaya Cove Beach and Nature Club. He graduated from Collège “La Rostagne,” in Antibes, France, and further gained a degree in tourism and hotel management in 1985 with the following qualifications: Certificat d’Aptitude Professionnelle (C.A.P.), Brevet d’Enseignement Professionel (B.E.P.), and Brevet de Technicien Hôtelier (B.T.H.) from the Lycée d’Hôtellerie et de Tourisme, in Nice, France. He is a recipient of the Hotel and Catering International Management Association (HCIMA) Certificate and License in Hotel Management given by the Westminster College in London, England.
Jaime E. Ysmael, Filipino, 60, was a Senior Vice President of ALI until December 31, 2020 He was a Managing Director of Ayala Corporation and Chairman, President & Chief Executive Officer of Ortigas Land Corporation (formerly OCLP Holdings, Inc.) and Concrete Aggregates Corporation. He is the Chairman of the Board of Directors of Anvaya Cove Beach and Nature Club, Inc. and Anvaya Golf and Sports Club, Inc. He is also a member of the Board of Directors of various Ayala Land subsidiaries and affiliates. Outside of the company, he is a Trustee of the Shareholders Association of the Philippines, FINEX Research and Development Foundation, Inc. and the CIBI Foundation. He is also a Trustee and President of the Alumni Tree Project. Mr. Ysmael holds a degree in Business Administration, Major in Accounting (Summa Cum Laude) at the University of the East, Manila, Philippines and is a Certified Public Accountant. He earned an MBA, Major in Finance, at The Wharton School and an MA in International Studies at The School of Arts and Sciences of the University of Pennsylvania in Philadelphia, USA, as a fellow of The Joseph H. Lauder Institute of Management and International Studies. Lyle A. Abadia, Filipino, 63, has served as Vice President of ALI since November 2016. Currently, he is the Head of Special Projects reporting to the Office of the President of ALI. Likewise, he is a Director of ALI’s wholly-owned subsidiaries namely, Amicassa Process Solutions, Inc. and BellaVita Land Corporation. Prior to joining Ayala Land, Inc. in 2004, he held various executive positions in two (2) ALI’s subsidiaries, commencing in 1982 under Ayala Theatres Management, Inc. and moved to join Laguna Technopark, Inc. in 1991 as one of the pioneering executive officers who crafted the successful transformation of the 650 hectares former sugarcane plantation into what is now known as one of the word- class industrial estates in the country. He likewise set up BellaVita Land Corporation, a socialized housing arm of ALI, and took the helm as President from 2011 to 2017.Mr. Abadia holds a degree in Bachelor of Science in Commerce, Major in Accounting at the Colegio De San Jose – Recoletos. He completed a Basic Management Program at the Asian Institute of Management and in-house program for Harvard Leadership Acceleration Program. Amelia Ann T. Alipao, Filipino, 58, is currently Vice President and Chief Information Officer of ALI. She is also the Group Data Protection Officer for ALI Group of Companies and presently a member of the Data Privacy Council for Real Estate of the National Privacy Commission. She sits on the board of APRISA Business Process Solutions, Inc and HCX Technology Partners Inc. She is also Vice President for Ka-

50
uSAP inc, a non-profit organization for SAP User Group of the Philippines. She is currently a member of the ALI Corporate Bidding Committee. She previously occupied this role in 2009-2011 and acted as Chairperson. Before joining ALI, she took on dual roles in SAP Philippines as Account Manager, handling government accounts, and project manager for SAP Implementation. She served as Assistant Vice President in Coca-Cola Bottlers Philippines, Inc., where she held various IT systems implementation projects. She started her IT career as an IT Instructor in I/Act of SyCip Gorres Velayo & Co. She holds a Bachelor of Arts in Biology and a Bachelor of Science in Business Management from De La Salle University. Aniceto V. Bisnar, Jr., Filipino, 57, serves as Vice President of ALI since January 2009 and the Senior Vice President & Chief Operating Officer of Ortigas Land Corporation. His other significant positions are: Chairman of Adauge Commercial Corp., Central Block Developers, Inc. and Amaia Southern Properties, Inc.; Chairman and President of North Point Estate Association, Inc., Asian I-Office Properties, Inc., Cebu Leisure Company, Inc., Cebu Business Park Association, Inc. and Asia Town I.T. Park Association, Inc.; and Vice Chairman of Avenco South Corporation. He is the President of Aviana Development Corporation and Lagdigan Land Corporation. He is also the Vice President of Solinea, Inc. He is a Director of Accendo Commercial Corporation, Cebu District Property Enterprise, Inc., Cagayan de Oro Gateway Corp., Taft Punta Engaño Property, Inc., and a Member of the Board of Trustee of Hero Foundation, Inc. Manuel A. Blas II, Filipino, 65, served as Vice President of Ayala Land Inc. until December 31, 2020. He is the Head of the Corporate Services Group of Ayala Land Estates (HR, Corporate & Estates Marketing, Innovation and Design, Urban Planning, and Sustainability). He is a board director of the following companies: Fort Bonifacio Development Corporation, Bonifacio Estate Corporation, Bonifacio Transport Corporation, Bonifacio Water Corporation, Bonifacio Gas Corporation, Berkshire Holdings, Inc., Bonifacio Land Corporation, Capital Consortium, Inc., Columbus Holdings, Inc., Crimson Field Enterprises Inc., and Emerging City Holdings, Inc. He is a trustee in Fort Bonifacio Development Foundation, Inc., Bonifacio Global City Estate Association, Makati Central Estate Association, One Bonifacio Condominium Corporation, and Tower One and Exchange Plaza Condominium Corporation. He graduated from De La Salle University and has a Master’s degree in Religious Studies from Maryhill School of Theology. Ma. Luisa D. Chiong, Filipino, 49, is currently a Vice President and the Controller of Ayala Land, Inc. Prior to this role, she was the Chief Finance Officer and Compliance Officer of Cebu Holdings, Inc., a publicly listed company, and Chief Finance Officer of the Estates Group from 2017 to 2020. Her other significant positions include: Director of Cebu Leisure Company, Inc. and Central Block Developers, Inc.; Director and Treasurer of Asian I-Office Properties, Inc., North Point Estate Association, Inc. and Vertis North Estate Association, Inc.; Director, Treasurer & Chief Finance Officer of Adauge Commercial Corporation; Director & Chief Finance Officer of ALInet.com, Inc.; Treasurer and a member of the Board of Trustees of Lakeside Evozone Association, Inc.; Trustee, Treasurer of Altaraza Town Center Estate Association, Inc. and Arca South Estate Association Inc.; Treasurer and Chief Finance Officer of Accendo Commercial Corp., Cagayan de Oro Gateway Corp. and Taft Punta Engano Property, Inc.; Chief Finance Officer of Aurora Properties Incorporated, Aviana Development Corp., CECI Realty Inc. and Vesta Property Holdings, Inc.; and the Comptroller of Nuevocentro, Inc. She completed the academic requirements for a Master in Business Administration degree from De La Salle University in 1998 and obtained her Bachelor of Science in Commerce Major in Accounting degree from the same university in 1991. She is a Certified Public Accountant, garnering 5th place in the May 1992 CPA Board Examinations and is a member of the Philippine Institute of Certified Public Accountants (PICPA). Dindo R. Fernando, Filipino, 52, has been Vice President of ALI. since April 2017. He currently heads the company’s External Affairs Division. Moreover, he is the Treasurer of Anvaya Beach and Nature Club, Corporate Secretary of Santa Rosa (Laguna) Business Club, Board Member of the Calamba City Business Club and Vice President of Avida Towers Makati West Condominium Corporation. Prior to joining ALI, he was Head of Political Research at the Makati Business Club where he oversaw congressional research, analysis and publication. He graduated with a degree in AB Political Science from the Lyceum of the Philippines in 1989.

51
Rufino Hermann S. Gutierrez, Filipino, 48, is a Vice President of ALI effective January 1, 2020, and is currently the Chief Operating Officer and Project Development Group Head of Alveo Land Corp. He is concurrently President of Alveo Federal Land Communities, Inc. and Solinea, Inc. Furthermore, he is currently the Vice Chairman of Ayala Land International Sales, Inc. and a Director of Amicassa Process Solutions, Inc. He is also part of Portico Land Corp.’s Executive Committee. In his more than 17 years in the company, he has handled and led various functions in residential, commercial, office and leisure development, such as project development, business development, sales, marketing and human resources management. He graduated from the De La Salle University with a degree in BS Industrial Engineering with minor in Mechanical Engineering in 1994 and completed his MBA from the Asian Institute of Management in 2000. He completed the Advanced Management Program from the National University of Singapore in 2016. He is also a licensed Real Estate Broker. Javier D. Hernandez, Filipino, 52, has been Vice President of ALI since April 2017. He is now the Chief Operating Officer of AyalaLand Hotels & Resorts Corporation concurrent to his present role as President of the Ten Knots Group - Ten Knots Philippines, Inc., Bacuit Bay Development Corporation, Ecoholdings Company, Inc., Regent Horizons Conservation Company,Inc., Lio Tourism Estate Management Corp., Ten Knots Development Corp., Chirica Resorts Corporation, Pangulasian Island Resort Corp., Lio Resort Ventures, Inc., North Liberty Resort Ventures, Inc. and Paragua Eco-Resort Ventures, Inc. He is responsible for the overall management of all Seda properties, El Nido Resorts and LIO Estate in El Nido, Palawan. President and Chief Executive Officer of Sicogon Island Tourism Estate Corp.; Director and Treasurer of El Nido Foundation; and Vice President for Operations of Alabang Commercial Corporation. He is a Director in South Innovative Theater Management Inc., North Triangle Depot Commercial Corporation, Primavera Towncentre, Inc., Ayalaland Malls Vismin, Inc., He has worked for Ayala Land for 29 years, spending seven years with Ayala Malls, four years with the Sales and Marketing Group, thereafter rejoining Ayala Malls for another 13 years before transferring to AyalaLand Hotels and Resorts mid-2016. He graduated with a Bachelors Degree in Business Administration from the San Francisco State University. Ma. Carmela K. Ignacio, Filipino, 53, was a Vice President of ALI until December 31, 2020. She is the Estate Development Head of Ayala Land, Inc.’s (ALI) Strategic Landbank Management Group. She concurrently serves as Chairman and President of Altaraza Town Center Estate Association, Inc., Crans Montana Property Holdings Corporation, HLC Development Corporation; Chairman of Altaraza Prime Realty Corporation; Vice Chairman of Ayala Land Estates, Inc.; Director and President of Buendia LandHoldings, Inc.; and, Director of Amorsedia Development Corporation. She has handled various roles in ALI such as the Leasing and Project Development Head of the Offices Group and Customer Relations Head under Marketing and Sales Group. She joined ALI in 1993. She graduated with a Bachelor of Science degree in Management Engineering from Ateneo de Manila University in 1988 and obtained a Master’s Degree in Business Management from the Asian Institute of Management in 1993. Joseph Carmichael Z. Jugo, Filipino, 46, is a Vice President of Ayala Land, Inc. and President of Ayala Land Premier, Inc. He is concurrently Chairman & President of Roxas Land Corp., OLC Development Corp., Southportal Properties, Inc.; Vice Chairman & President of Ayala Hotels., Inc.; Chairman of Ayala Land Sales, Inc., Ayala Land Club Management, Inc., Verde Golf Development Corp.; President & Chief Executive Officer of Ayala Greenfield Development Corp., Ayala Greenfield Golf & Leisure Club, Inc.; President of BGWest Properties, Inc.; Anvaya Cove Golf & Sports Club, Inc. Director of Anvaya Cove Beach & Nature Club, Inc., Amicassa Process Solutions, Inc., Serendra, Inc. and Ayala Center Estate Association. In his more than 18 years in the company, he has been a part of and handled various business lines including business development for the retail and malls group, project development for the residential business group, project development for the leisure group and sales for the local and international markets. He graduated from the Ateneo de Manila with a degree in Management Economics in 1997 and completed his MBM from the Asian Institute of Management (with Distinction) in 2002. He attended the International Graduate Student Exchange Program at the Tuck School of Business, Dartmouth College in 2002 and completed the INSEAD Asian International Executive Programme (AIEP) in 2015.

52
Ma. Divina Y. Lopez, Filipino, 49, is currently Vice President and Chief Finance Officer the Estates Group. Prior to this she was Chief Audit Executive of ALI. She is a member of the Institute of Internal Auditors Philippines (IIAP). Prior to this post, she was President of Amicassa Process Solutions, Inc. and Chief Finance Officer of the Residential Business Group of ALI. She holds a Bachelor of Science degree in Business Administration and Accountancy from the University of the Philippines and placed 11th in the CPA Board Examinations in 1993. She obtained a Master of Science degree in Computational Finance from De La Salle University in 2002. Michael Alexis C. Legaspi, Filipino, 63, served as Vice President of ALI until December 31, 2021. He currently served as a consultant of ALI and sits as a board member of all hotel and resort owning companies while handling the branded hotel line of the company. He also represents ALI in related government and industry networks, including the Philippine Hotel Owners Association where he sits as Vice President and Director. He is a graduate of the Philippine Science High School and the University of the Philippines, Diliman. Christopher B. Maglanoc, Filipino, 50, is a Vice President of ALI since April 2013 and the Chairman and President of Ayalaland Malls, Inc starting December 2020. Currently, he is also the Chairman and President of various companies under the Malls Group of ALI.. Prior to this, he was the President of Avida Land Corporation. He was Chief Operating Officer and Head of Project and Strategic Management in Avida Land before he was elected as President of the Company on January 1, 2012. Prior to his stint in Avida in 2004, he occupied Management positions in various business units in ALI (i.e. Commercial Centers, Corporate Planning, and Alveo Land, Inc.). His other significant positions are Chairman of Avida Sales Corp.; President of Avencosouth Corp.; and Director of AmicaSSA Process Solutions, Inc., BellaVita, Blue Horizons Holdings Pte Ltd., and BGNorth Properties, Inc. He graduated from UP Los Baños with degrees in BA Sociology and BS Economics in 1990 and 1992, respectively. He finished his MBA from the Asian Institute of Management and attended the International Student Exchange Program in Copenhagen Business School in Denmark in 1997. Michael F. Magpusao, Filipino, 47, was appointed Vice President & Chief Engineer of Ayala Land, Inc. in 2019, currently serves as the Chief Operating Officer and Corporate Chief Engineer of Ayala Property Management Corporation (APMC), and the President of Philippine Integrated Energy Solutions, Inc. (PhilEnergy). He is also a currently Professor of the Mechanical Engineering Department at the Mapua Institute of Technology, a position he has held since 1996. He is also concurrently APMC’s Corporate Safety Officer, Corporate Professional Mechanical Engineer, and Corporate Energy Manager. He is a Professional Mechanical Engineer since 2001, a licensed OSH Consultant as certified by the Department of Labor and Employment, and Certified ASEAN Energy Manager by AEMAS. Mr. Magpusao has over 20 years of industry experience and has held the following positions prior to his appointment: Executive Director and Head of Global Real Estate of JP Morgan Chase & Co.(Philippine Branch) from 2010 to 2016; Vice President and Corporate Realty Services Asset Manager of Citibank, N.A. (Manila Branch) from 2004 to 2010; Property Manager, Technical Support Group Manager and Project Manager of APMC from 1996 to 2004; and Operation Engineer of Procter and Gamble Philippines from 1995 to 1996. He earned his Bachelor of Science Degrees in Mechanical Engineering and Electrical Engineering both from the Mapua Institute of Technology in 1995 and 2001, respectively. He also has a Post Baccalaureate Diploma in Fire Safety Technology from the University of Makati in 2004. Ferdie M. Mangali, Filipino, 51, is a Vice President of ALI effective January 1, 2020. He has headed the Corporate Resource and Services Group of Makati Development Corporation since May 2013 and concurrently acting as Head of Corporate Labor Relations for the Ayalaland Group. He is a member of the Board of MDC Equipment Solutions Inc. and a member of the Board Trustee of the Philippine Constructors Association. He is the former Head of the Corporate Human Resources, Customer Care and Product delivery Group of Avida Land Corporation, Business Group HR Head of the Ayala Land Commercial and Residential Group, HR Head of Amicassa Process Solutions, Inc., Amaia Land Corp., and BelaVita Land Corp. Prior to ALI, he was Labor Relations Manager of Pfizer Inc., HR Manager of Warner Lambert Inc., Business Group HR Officer of Intel Philippines and Manufacturing Plant HR Officer of Matsushita Electric Philippines Corporation (PANASONIC Philippines). He has a total 29 years of experience in Human Resource Management, Labor Relations and Organizational Development. He

53
graduated from Polytechnic University of the Philippines with a degree in Bachelor in Human Behavior Technology major in Clinical Psychology and finished his Master's Degree in Labor and industrial Relations from the University of the Philippines, Diliman. Romeo T. Menpin, Jr., Filipino, 51, is a Vice President of ALI since January 2014. He is currently the Head of the Construction Methods and Solutions Group of Makati Development Corporation (MDC). He is also currently the President of MDC Equipment Solutions, Inc. and MDC Conqrete, Inc. He is also a Director of Philippine Integrated Energy Solutions, Inc. (PhilEnergy) Before joining MDC, he was a Director, President and Chief Operating Officer of Ayala Property Management Corporation (APMC) and also the President of PhilEnergy. He joined ALI in May 2008 from Kuok Group of Companies where he was a Vice President and Head of Mall Operations of Shangri-la Plaza Corporation. Prior to this, he also held various management positions from APMC and Laguna Technopark, Inc.. He graduated with a degree of Bachelor of Science in Mechanical Engineering from Mapua Institute of Technology and completed units in Masters in Business Administration from De La Salle University in 2001 Carol T. Mills, Filipino, 48, has served as Vice President of ALI since November 2016. She is the President of Ayala Land Offices, Inc., Director, President and Chief Executive Officer of AREIT, Inc., Chairman and President of various Ayala Land Offices subsidiaries namely UP North Property Holdings, Inc., First Gateway Real Estate Corp., ALO Prime Realty Corp., Glensworth Development Inc., Hillsford Property Corp., and Sunnyfield E-Office Corp.; President of North Eastern Commercial Corp. and Makati Cornerstone Leasing Corp as well as Director of ALI Capital Corp., DirectPower Services, Inc. and Central Block Developers Inc. She joined ALI in 1993 and prior to her current position, she was Deputy Head of Business Development for Ayala Malls from 2008 to 2013, General Manager for Alabang Town Center from 2004 to 2008, and Operations Manager for Glorietta from 2000 to 2004. She graduated Magna Cum Laude from the University of the Philippines in 1993 with a Bachelor of Science degree in Business Administration and earned her Masters in Business Administration from the Amos Tuck School of Business, Dartmouth College in New Hampshire, USA in 1998. June Vee D. Monteclaro-Navarro, Filipino, 49, is a Vice President and Chief Legal Counsel of Ayala Land, Inc. Concurrently, she is the Corporate Secretary of Cebu Holdings, Inc. and AyalaLand Logistics Holdings Corp. and the Assistant Corporate Secretary of AREIT, Inc. She is also the Corporate Secretary of Alveo Land Corp., Avida Land Corp., AKL Properties, Inc., ALI Eton Property Development Corporation and Altaraza Development Corporation. She served as Director (management position) and Corporate Secretary of Ayala Group Legal from 2012 to 2020. She was Legal Officer at Ayala Land, Inc. from 2007 to 2012 and Senior Associate at SyCip Salazar Hernandez & Gatmaitan prior to that. She graduated from the University of St. La Salle in Bacolod with a Bachelor of Arts with a Major in Economics and a Bachelor of Science in Commerce Major in Data Processing in 1993. She earned a Bachelor of Laws degree from the University of the Philippines in 1997. She finished the Program on Negotiation at Harvard Law School in 2012 and the Leadership in Corporate Counsel Executive Education at Harvard Law School in 2016. Rodelito J. Ocampo, Filipino, 58, is a Vice President of ALI since December 2010. He is currently Makati Development Corporation’s (MDC’s) Head of Construction Operations Group 1 and the President of MDC BuildPlus, Inc. Before his MDC assignment, he served as Technical Services Head of Avida Land Corp. and Alveo Land Corp., wholly owned subsidiaries of ALI, and Head of the Construction Management of ALI Residential Buildings. Prior to joining ALI, he was employed by a construction firm where he held various engineering and project management positions for a period of 10 years. He is a licensed Civil Engineer. He graduated from Mapua Institute of Technology with a degree in BS Civil Engineering in 1983. He also took Management Development Program in 2006 and Construction Management Course in 1994 at Asian Institute of Management. Ginaflor C. Oris, Filipino, 53, is currently a Vice President of ALI and the Chief Finance Officer and Corporate Finance and Procurement Group Head of Makati Development Corporation (MDC), positions she has held since 2014. She is a board director of MDC, MDC Buildplus Inc., MDC Conqrete Inc., MDC Equipment Solutions Inc., MDBI Construction Corp and MDC Subic, Inc. Prior to her assignment to MDC, she was the Managing Director for Corporate Finance and Asset Management of Ayala Corporation (AC).
54
She was concurrently the CFO of Azalea Group, which held AC’s various investments in information and communications technology (ICT), business process outsourcing (BPO), venture capital funds and emerging market funds. She brings with her extensive experience gained from AC and BPI Capital Corporation covering strategic financial management, execution of mergers, acquisitions and divestment transactions, financial reporting, controls, risk management and oversight of some of AC’s portfolio investments and other assets. She graduated Honorable Mention from the Ateneo de Manila University with a degree of B.S. Mathematics major in Computer Science in 1987. She took up Master in Business Management at the Asian Institute of Management as an Asian Development Bank scholar and graduated in 1992. Darwin L. Salipsip, Filipino, 48, is a Vice President of ALI and is currently the Head of Construction Operations Group 3 of Makati Development Corporation (MDC). He is concurrently a Vice President and member of the Management Committee of MDC. He is likewise the President of MDBI, a joint venture partnership between MDC and Bouygues Batiment International (BBI). In his more than 20 years with the Company, he has been part of the various business lines of residential and commercial businesses as Construction Management Manager. Prior to his current role, he served as MDC’s Construction Management Group Head and Commercial Group Head. He graduated with honors (cum laude) from the University of the Philippines with a Bachelor’s degree in Civil Engineering in 1993 and completed his Masters of Engineering from Massachusetts Institute of Technology in 1997. He is a licensed Civil Engineer, ranked Top 2 when he took the National Licensure Examination for Civil Engineers. Angelica L. Salvador, Filipino, 58, was a Vice President of ALI, and Controller of the Company until December 2020. She holds the following positions: are as President of Aprisa Business Process Solutions, Inc. and Director of Amaia Land Corp., AmicaSSa Process Solutions, Inc., and North Triangle Depot Commercial Corp. Prior to her current assignment, she was the Chief Finance Officer of the ALI Residential Business Group and of various ALI-owned subsidiaries including Alveo Land Corp., Ayala Property Management Corp., Ayala Land International Sales, Inc., and Laguna Technopark, Inc. Before joining ALI, she was part of the Internal Audit Team of Ayala Corporation. She graduated cum laude from the University of the Philippines Diliman with Bachelor of Science degree in Business Administration and Accountancy, and obtained her Master in Business Management (MBM) degree from the Asian Institute of Management. Eliezer C. Tanlapco, Filipino, 71, is the Group Head of Human Resources and Public Affairs and member of the Management Committee of ALI. Prior to this role, he was a Human Resources Consultant for Ayala Group Legal and Ayala Corporation from which he retired as Employee Relations and Services Director. He was ALI’s Vice President for Human Resources; Vice Chair of Ayala Group HR Council, Ayala Group Corporate Security Council, and Champion of Ayala Group Labor Relations Network He is a member of the Board of Directors of Ayala Multi-Purpose Cooperative. He has had extensive work experience as Senior Leader in Human Resources and Community Development for multinational companies locally and abroad. He practiced law with a law firm and with the Office of the President of the Philippines. He holds a Bachelor of Arts degree from the University of the Philippines and earned his Law Degree at Ateneo de Manila University. He completed his Management Development Program from the Asian Institute of Management, and Strategic Business Economics Program from the University of Asia and the Pacific, both with distinction. Maria Rowena Victoria M. Tomeldan, Filipino, 59, is the Vice President and Head of the Real Estate Logistics and Special Investments of Ayala Land, Inc (ALI). She is the President and Chief Executive of AyalaLand Logistics Holdings Inc., a publicly listed subsidiary of ALI, which developed and manages Laguna Technopark, Cavite Technopark, Laguindingan Technopark, Mabalacat Technopark, Tutuban Center and Southpark Mall. Her other significant positions include: Chairman of the Board of Laguna Technopark, Inc (LTI); Ecozone Power Management, Inc ((EPMI); LCI Commercial Ventures, Inc; Unity Realty & Development Corp. Chairman and President of AMSI, Inc., Orion Property Development, Inc.; FLT Prime Insurance Corporation; ESTA Galleria, a wholesale distributor of premium quality tiles. She was a board member of the International Council of Shopping Centers (ICSC), Asia Pacific Advisory Board from 2008 until 2020. She is a 2015 ICSC Trustees Distinguished Service Awardee. She graduated as cum laude of Bachelor of Arts in Economics from the University of the Philippines in 1983 and earned

55
her Masters in Business Administration degree from the same university in 1988. She finished the Executive Development Program at the Aresty Institute of Executive Education in Wharton University, Pennsylvania, USA in 2005.
Jennylle S. Tupaz, Filipino, 48, is Vice President of ALI and Estate Development Head. Prior to this post she was the President of Ayala Land Malls, Inc. Prior to joining the commercial business of ALI in 2018, she was involved in the residential development business for over 21 years. She was president of Alveo Land Corp., ALI’s upscale residential brand, where she spent 11 years leading project development. She held earlier positions in Avida and the then Leisure & Lifestyle Communities Group of ALI. She holds a Bachelor of Science degree in Statistics from the University of the Philippines, and a Master’s Degree in Business Administration from the University of Chicago Booth School of Business. Annabeth R. Bernardo, Filipino, 38, was appointed Chief Audit Executive of Ayala Land, Inc. (ALI) effective January 2021. Prior to this position she was the Head of Control & Analysis handling management reports and financial analyses of Makati Development Corporation (MDC), a wholly-owned subsidiary of ALI. She also served as its Head of Internal Audit and as Chief Finance Officer of one of MDC’s Construction Divisions. She was the Internal Audit Manager of ALI prior to her secondment to MDC. She is a Certified Public Accountant (CPA), Certified Internal Auditor (CIA), Certification in Control Self-Assessment (CCSA) holder, and a member of the Institute of Internal Auditors Philippines (IIAP). She holds a Bachelor of Science degree in Business Administration and Accountancy, Cum Laude, from the University of the Philippines and was awarded with the Certificate of Honor for being part of the Top 25 successful CIA examinees worldwide back in 2007. Solomon M. Hermosura, Filipino, 58, has served as the Corporate Secretary of the Company since April 2011 and the Group General Counsel of the Company since April 2014. He is a Managing Director of Ayala Corporation since 1999 and a member of its Management Committee since 2009 and the Ayala Group Management Committee since 2010. He is the Group Head of Corporate Governance, Chief Legal Officer, Compliance Officer, Corporate Secretary and Data Protection Officer of Ayala Corporation. He is the CEO of Ayala Group Legal. He also serves as Corporate Secretary of Globe Telecom, Inc., Manila Water Company, Inc., Integrated Micro-Electronics, Inc., Ayala Foundation, Inc., AREIT, Inc. and AC Energy Philippines, Inc. He also serves as a Corporate Secretary and a member of the Board of Directors of a number of companies in the Ayala group. Mr. Hermosura is currently a member of the faculty of the College of Law of San Beda University. He graduated valedictorian with Bachelor of Laws degree from San Beda College in 1986 and placed third in the 1986 Bar Examination.
Significant Employees
The Company considers its human resources working as a team as a key element for its continued success. But the Company has no employee who is not an executive officer and who is expected to make individually on his own a significant contribution to the business. Family Relationships Fernando Zobel de Ayala, Chairman of the Board of Directors, and Jaime Augusto Zobel de Ayala, Vice Chairman, are brothers. Involvement in Certain Legal Proceedings (over the past 5 years) None of the Directors or Executive Officers is involved in any material pending legal proceedings in any court or administrative agency of the government. a. None of them has been involved in any bankruptcy petition. b. None of them has been convicted by final judgment in a criminal proceeding or being subject to a
pending criminal proceeding, both domestic and foreign.

56
c. None of them has been subject to any order, judgment or decree of any court of competent
jurisdiction (domestic or foreign) permanently or temporarily enjoining, barring, suspending or otherwise limiting their involvement in any type of business, securities, commodities or banking activities.
d. None of them has been found by a domestic or foreign court of competent jurisdiction (in a civil
action), the Commission or comparable foreign body, or a domestic or foreign exchange or other organized trading market or self regulatory organization, to have violated a securities or commodities law or regulation.
Item 10. Executive Compensation Directors and Executive Officers Directors. Article IV Section 17 of the Company’s By-Laws provides:
“Section 17 – Each director of the Corporation shall be entitled to receive from the Corporation, pursuant to a resolution of the Board of Directors, fees and other compensation for his services as director. The Board of Directors shall have the sole authority to determine the amount, form, and structure of the fees and other compensation of directors. In no case shall the total yearly compensation of directors exceed one percent (1%) of the net income before income tax of the Corporation during the preceding year.
The compensation and remuneration committee of the Board of Directors shall have the responsibility for recommending to the Board of Directors the fees and other compensation for directors. In discharging this duty, the committee shall be guided by the objective of ensuring that the level of compensation should fairly pay directors for work required in a company of the Corporation’s size and scope.” (As amended on April 13, 2011.)
During the 2011 annual stockholders’ meeting, the stockholders ratified the resolution increasing the remuneration of non-executive directors as follows:
From To
Retainer Fee: P 500,000.00 P 1,000,000.00
Board Meeting Fee per meeting attended: P 100,000.00 P 200,000.00
Committee Meeting Fee per meeting attended: P 20,000.00 P 100,000.00
None of the directors, in their personal capacity, has been contracted and compensated by the Company for services other than those provided as a director. Officers. The Company adopts a performance-based compensation scheme. The total annual compensation of the President and top four (4) highly compensated executives amounted to P238.72 million in 2019 and P240 million in 2020. The projected total annual compensation for the current year is P200.92 million. Total compensation paid to all senior personnel from Manager and up amounted to P1,076.91 million in 2019 and P1,098.88 million in 2020. The projected total annual compensation for the current year is P934.36 million.

57
Name and Principal Position Year Salary Other Variable Pay
Bernard Vincent O. Dy* President & CEO Dante M. Abando Senior Vice President Augusto D. Bengzon Senior Vice President Anna Ma. Margarita B. Dy Senior Vice President Jose Emmanuel H. Jalandoni Senior Vice President
CEO & Most Highly Compensated Executive Officers
Actual 2019 P135.03M **P103.69M
Actual 2020 P140.3M **P99.7M
Projected 2021 P141.1M **P59.82M
All other officers*** as a group unnamed
Actual 2019 P716.49M **P360.42M
Actual 2020 P722.28M **P376.6M
Projected 2021 P708.4M **P225.96M * Compensation includes full year effect of CEO and market adjustments to selected officers for retention purposes.
** Exclusive of Stock Option exercise. *** Managers and up.
The total annual compensation paid to all senior personnel from Manager and up was all paid in cash. The total annual compensation includes the basic salary and other variable pay (guaranteed bonus and performance bonus).
The Company has no other arrangement with regard to the remuneration of its existing directors and officers aside from the compensation received as herein stated.
Each executive officer executed an employment contract with the Company for an indefinite period (the terms and conditions of which are in accordance with existing laws) and is entitled to receive retirement benefits in accordance with the terms and conditions of the Company’s BIR-registered Employees’ Retirement Fund. There is no plan or arrangement by which the Executive Officers will receive from the Company any form of compensation in case of a change-in-control of the Company or change in the officers’ responsibilities following such change-in-control. Options Outstanding Since 1998, the Company has offered its officers options to acquire common shares under its executive stock option plan (ESOP).
There were no ESOP shares available as of end-December 2020

58
Item 11. Security Ownership of Certain Record and Beneficial Owners and Management
(a) Security Ownership of Record and Beneficial Owners of more than 5% as of January 31, 2021:
Title of Class
Name, Address of Record Owner and Relationship with Issuer
Name of Beneficial Owner and Relationship with Record Owner
Citizenship No. of Shares Held
Percent (of total outstanding shares)
Common Ayala Corporation1 32/F to 35/F, Tower One and Exchange Plaza Ayala Triangle Ayala Ave., Makati City
Ayala Corporation2 Filipino 6,545,946,579 67.3065%
Preferred 12,163,180,640
43.77377%
Common PCD Nominee Corporation (Non-Filipino)3 G/F MSE Bldg. Ayala Ave., Makati City
PCD participants acting for themselves or for their customers4
Various Non-Filipino
5,395,515,444 19.4105%
Common PCD Nominee Corporation (Filipino)1 G/F MSE Bldg. Ayala Ave., Makati City
PCD participants acting for themselves or for their customers2
Filipino 2,487,797,715 8.9499%
(b) Security Ownership of Directors and Management (Executive Officers) as of January 31, 2021. Title of Class
Name of Beneficial Owner
Amount and Nature of Beneficial Ownership
Citizenship Percent (of total outstanding shares)
Directors
Common Fernando Zobel de Ayala5 (direct) 183,000 Filipino 0.00066%
Common Jaime Augusto Zobel de Ayala5 (direct) 12,000 Filipino 0.00004%
Common Bernard Vincent O. Dy (direct & indirect) 16,599,602 Filipino 0.05972%
Common Antonino T. Aquino (direct & indirect) 20,305,226 Filipino 0.07305%
Common Arturo G. Corpuz (direct & indirect) 5,843,711 Filipino 0.02102%
Common Rizalina G. Mantaring (direct & indirect) 39,401 Filipino 0.00014%
Common Rex Ma. A. Mendoza (direct & indirect) 3,914,201 Filipino 0.01438%
Common Sherisa P. Nuesa (direct & indirect) 3,998,509 Filipino 0.00066%
Common Cesar V. Purisima (direct) 1 Filipino 0.00000%
CEO and Most Highly Compensated Executive Officers
Common Bernard Vincent O. Dy (direct & indirect) 16,599,602 Filipino 0.05972%
Common Dante M. Abando (direct & indirect) 5,756,197 Filipino 0.02071%
Common Augusto D. Bengzon (direct & indirect) 3,307,760 Filipino 0.01190%
Common Anna Ma. Margarita B. Dy (indirect) 6,943,890 Filipino 0.02498%
Common Jose Emmanuel H. Jalandoni (direct & indirect) 7,484,575 Filipino 0.02693%
Other Executive Officers
Common Lyle A. Abadia (indirect) 881,872 Filipino 0.00317%
Common Amelia Ann T. Alipao (indirect) 1,636,447 Filipino 0.00589%
1 Ayala Corporation (“AC”) is the parent of the Company. 2 Under the By-Laws of AC and the Revised Corporation Code, the AC Board has the power to decide how AC’s shares are to be voted. 3 PCD is not related to the Company. 4 Each beneficial owner of shares through a PCD participant is the beneficial owner to the extent of the number of shares in his account with the PCD participant. The beneficial owner, with certification of ownership of shares from the PCD Participant, has the power to vote in absentia or through the Chairman of the meeting as proxy. Out of the 7,883,313,159 common shares registered in the name of PCD Nominee Corporation, 2,041,673,920 or 7.3450% of the voting stock is for the account of Deutsche Bank Manila (DB), while 1,132,051,136 or 4.0726% of the voting stock is for the account of The Hongkong and Shanghai Banking Corporation (HSBC). The Company did not receive any report from HSBC, DB or any of its customers stating that they beneficially own more than 5% of the Company’s common shares. 5 Mr. Fernando Zobel de Ayala and Mr. Jaime Zobel de Ayala indirectly owns 12.50476% and 12.50526% of ALI, respectively,
pursuant to SEC Memorandum Circular No. 15, series of 2019.

59
Common Annabeth R. Bernardo (indirect) 18,779 Filipino 0.00007%
Common Aniceto V. Bisnar, Jr. (indirect) 2,018,546 Filipino 0.00726%
Common Manny A. Blas II* (direct & indirect) 2,331,385 Filipino 0.00839%
Common Ma. Luisa D. Chiong (direct & indirect) 717,252 Filipino 0.00258%
Common Dindo R. Fernando (indirect) 884,592 Filipino 0.00318%
Common Rufino Hermann S. Gutierrez (indirect) 656,473 Filipino 0.00236%
Common Solomon M. Hermosura (direct) 480 Filipino 0.00000%
Preferred (direct) 480 0.00000%
Common Javier D. Hernandez (indirect) 543,157 Filipino 0.00195%
Common Ma. Carmela K. Ignacio* (indirect) 2,976,675 Filipino 0.01071%
Common Joseph Carmichael Z. Jugo (indirect) 874,097 Filipino 0.00314%
Common Laurent P. Lamasuta (indirect) 3,322,290 Filipino 0.01195%
Voting Preferred
(direct) 1,977,234 0.00711%
Common Robert S. Lao (indirect) 2,034,758 Filipino 0.00732%
Common Michael Alexis C. Legaspi* (indirect) 4,631,451 Filipino 0.01666%
Common Ma Divina Y. Lopez (indirect) 639,776 Filipino 0.00230%
Common Christopher B. Maglanoc (indirect) 1,050,577 Filipino 0.00378%
Common Michael F. Magpusao (indirect) 372,077 Filipino 0.00134%
Common Ferdie M. Mangali (indirect) 895,466 Filipino 0.00322%
Common Romeo T. Menpin (indirect) 579,869 Filipino 0.00209%
Common Carol T. Mills (indirect) 830,092 Filipino 0.00299%
Common June Vee D. Monteclaro-Navarro
(indirect) 274,510 Filipino 0.00099%
Voting Preferred
(direct) 180,218 0.00065%
Common Rodelito J. Ocampo (direct & indirect) 2,901,421 Filipino 0.01044%
Common Ginaflor C. Oris (indirect) 982,951 Filipino 0.00354%
Common Darwin L. Salipsip (indirect) 724,259 Filipino 0.00261%
Common Angelica L. Salvador* (direct & indirect) 1,331,462 Filipino 0.00479%
Common Eliezer C. Tanlapco (indirect) 365,638 Filipino 0.00132%
Common Maria Rowena Victoria M. Tomeldan
(direct & indirect)1,544,683 Filipino 0.00556%
Common Jennylle S. Tupaz (indirect) 1,071,241 Filipino 0.00385%
Common Jaime E. Ysmael* (direct & indirect) 8,843,248 Filipino 0.03181%
All Directors and Officers as a group 122,481,529 0.44063%
None of the members of the Company’s directors and management owns 2.0% or more of the outstanding capital stock of the Company.
(c) Voting Trust Holders of 5% or more
The Company knows of no persons holding more than 5% of common shares under a voting trust or similar agreement.
(d) Changes in Control
No change of control in the Company has occurred since the beginning of its last fiscal year. Item 12. Certain Relationships and Related Transactions Related Party Transactions The Company and its subsidiaries (the “Group”), in their regular conduct of business, have entered into transactions with associates and other related parties principally consisting of advances and reimbursement of expenses, purchase and sale of real estate properties, construction contracts, and development, management, underwriting, marketing, leasing and administrative service agreements. Sales and purchases of goods and services to and from related parties are made on an arm’s length basis and at current market prices at the time of the transactions.

60
However, no other transaction, without proper disclosure, was undertaken by the Group in which any director or executive officer, any nominee for election as director, any beneficial owner of more than 5% of the Company’s outstanding shares (direct or indirect) or any member of his immediate family was involved or had a direct or indirect material interest. ALI employees are required to promptly disclose any business and family-related transactions with the Company to ensure that potential conflicts of interest are surfaced and brought to the attention of management. Parent Company / Major Holders As of January 31, 2021, Ayala Corporation owns 67.31% of the total outstanding voting shares of the Company. PART V – CORPORATE GOVERNANCE Item 13. Compliance with leading practice on Corporate Governance Ayala Land has always been committed to strong and transparent corporate governance, going well beyond mere compliance with the code mandated by law. Ayala Land made several important improvements to its governance in 2004, focusing on increasing the involvement of various governance bodies, strengthening performance management, and ensuring compliance with Philippine Accounting Standards. In 2007, the Company adopted several initiatives aimed toward achieving governance excellence. These include conduct of a Self-Assessment Survey by the Board of Directors and Board Committees, development of Business Contingency Plans, adoption of risk-based audit approach and independent quality review of the Internal Audit function. Ayala Land believes that these changes will streamline its existing business models, improve execution, reduce risks, and better safeguard the collective and individual interests of its diverse set of shareholders. Ayala Land seeks to promote and enhance compliance to good corporate governance. Ayala Land requires the observance of best practices and transparency in all of its subsidiaries, including those that are not listed on the PSE and not covered by the SEC Code of Corporate Governance. The evaluation system which was established to measure or determine the level of compliance of the Board of Directors and top-level management with its Revised Manual of Corporate Governance (the “Revised Manual”) consists of a Customer Satisfaction Survey which is filled up by the various functional groups indicating the compliance rating of certain institutional units and their activities. The evaluation process also includes a Board Performance Assessment which is accomplished by the Board of Directors indicating the compliance ratings. The above are submitted to the Compliance Officer who issues the required certificate of compliance with the Revised Manual of the SEC. To ensure good governance, the Board establishes the vision, strategic objectives, key policies, and procedures for the management of the company, as well as the mechanism for monitoring and evaluating Management’s performance. The Board also makes certain the presence and adequacy of internal control mechanisms for good governance. There were no deviations from the Revised Manual. The Company has adopted in the Revised Manual the leading practices and principles of corporate transparency, and full compliance therewith has been made since the adoption of the Revised Manual. The Company is taking further steps to further strengthen adherence to principles and practices of good corporate governance.

61
Item 14. Exhibits and Reports on SEC Form 17-C (a) Exhibits - See accompanying Index to Exhibits The following exhibit is incorporated by reference in this report:
2020 Consolidated Audited Financial Statements The other exhibits, as indicated in the Index to Exhibits are either not applicable to the Company
or require no answer. (b) Reports on SEC Form 17-C The following current reports have been reported by Ayala Land during the year 2020.
Unstructured Disclosures • Clarification on the U.P. - Ayala Land Technohub Development Lease Agreement
• Notice of FY 2019 Analysts' Briefing
• AREIT, Inc. Files Application for REIT Offering
• Ayala Land's FY 2019 results
• Notice and Agenda of the 2020 Stockholders' Meeting
• Results of the Regular Meeting of the Board of Directors (20 Feb 2020)
• ALI Audited Financial Statements as of year ended December 31, 2019
• Reply to the SEC on the impact of COVID-19 on operations
• Ayala Land's 1Q 2020 results
• Results of the Regular Meeting of the Board of Directors (26 May 2020)
• Ayala Land's 2-year fixed rate bond due 2022
• ALI lists P10-billion 2-year fixed-rate bond on PDEx
• AREIT P15B IPO obtains SEC Pre-Effective Approval
• AREIT P15-billion initial public offering obtains PSE approval
• AREIT prices its Initial Public Offering at Php27 per share
• Notice of 1H 2020 Analyst Briefing
• AREIT Offer Period Completed
• Ayala Land's 1H 2020 results
• Ayala Land’s new 5-year fixed rate bond with an exchange offer for the existing 4.625% bonds due 10 Oct 2020
• 2020 ESOWN Grant
• Ayala Land's 9M 2020 results
• Amendments to the Corporate Governance Manual, Board Charter and Corporate Governance and Nomination Committee Charter
• Setting of 2021 Annual Stockholders' Meeting • Sale of the shares of White Knight Holdings, Inc. in Mercado General Hospital, Inc. to Healthway
Phillippines, Inc.
Clarification of News Reports • Ayala Land files first REIT in PH
• ALI liquid but cuts capex
• ALI aims to raise P6.5B via bond sale
• ALI aims to raise P10B for rebound bid
(c) Reports under SEC Form 17-C filed None.

62
(d) Material events subsequent to the end of the reporting period that have not been reflected in the financial statements of the reporting period On January 5, 2021, AREIT, Inc. (AREIT), purchased 9.8 hectares of land owned by Technopark Land, Inc. (TLI), a subsidiary of Ayala Corporation, in Laguna Technopark through a deed of sale for ₱1.1 billion, VAT-inclusive. The purchase is payable in cash upon execution of the deed of sale and on January 21, 2021. The land is composed of four (4) parcels which is being leased by Integrated Micro-Electronics, Inc. (IMI), a related party, for its manufacturing operations for the next seven years from January 1, 2021 until December 31, 2027 with annual escalation rate of 5%. On January 15, 2021, Ayala Land entered into a Deed of Sale with AREIT, Inc. for the disposition of The 30th Commercial Development for ₱5.1 billion (VAT inclusive). Located along Meralco Avenue in Pasig City, it is a building with a total GLA of 75,000 sqm composed of an office tower and a retail podium. On February 23, 2021, the Board of Directors of Ayala Land approved the following:
1. The merger of the Company and its listed subsidiary, Cebu Holdings, Inc. (CHI) as well as its other subsidiaries, Asian I-Office Properties, Inc. (AiO), Arca South Commercial Ventures Corp. (ASCVC) and Central Block Developers Inc. (CBDI), with Ayala Land as the surviving entity. The plan of merger will be submitted for the approval of Ayala Land’s stockholders during the annual meeting scheduled on April 21, 2021.
2. Ayala Land has a 71.1% stake in CHI. ASCVC is Ayala Land’s wholly-owned subsidiary, while AiO is a wholly-owned subsidiary of CHI. CBDI is 55% owned by CHI and 45% owned by ALI. The merger is an internal restructuring as well as a consolidation of Ayala Land’s Cebu portfolio under one listed entity. The merger is expected to result in operational synergies, efficient funds management and simplified reporting to government agencies.
3. The amendment of Ayala Land’s ESOWN Plan to increase the share allocation for ESOWN grants from 2.5% to 3% of the Company’s authorized capital stock. This will be presented to Ayala Land’s stockholders for approval on April 21, 2021.
4. The filing with the Securities and Exchange Commission of a new three (3)-year shelf registration of up to ₱50 billion of debt securities.
5. The raising of up to ₱41 billion through the issuance of retail bonds and/or corporate notes for listing on the PDEx, and/or bilateral term loans for the purpose of refinancing outstanding loans, and to partially finance the Company’s general corporate requirements.
6. The declaration of cash dividends of ₱0.1358 per outstanding common share payable on March 25, 2021 to Ayala Land’s stockholders of common shares as of record date March 10, 2021.
On February 26, 2021, White Knight Holdings, Inc. a wholly-owned subsidiary of Ayala Land, Inc. (ALI) completed the sale of its shares in Mercado General Hospital, Inc. to Healthway Philippines, Inc. with fulfilment of the conditions precedent. On March 15, 2021, the Executive Committee of Ayala Land, Inc. (ALI) approved the infusion of its identified key commercial properties into AREIT, Inc. (AREIT) valued at P15,464,140,000.00 under a property-for-share swap transaction wherein ALI will subscribe to 483,254,375 primary common shares of AREIT at a price of P32.00 per share, as validated by a third-party fairness opinion, subject to the approval of AREIT shareholders at their annual meeting on April 23, 2021 and pertinent regulatory bodies.
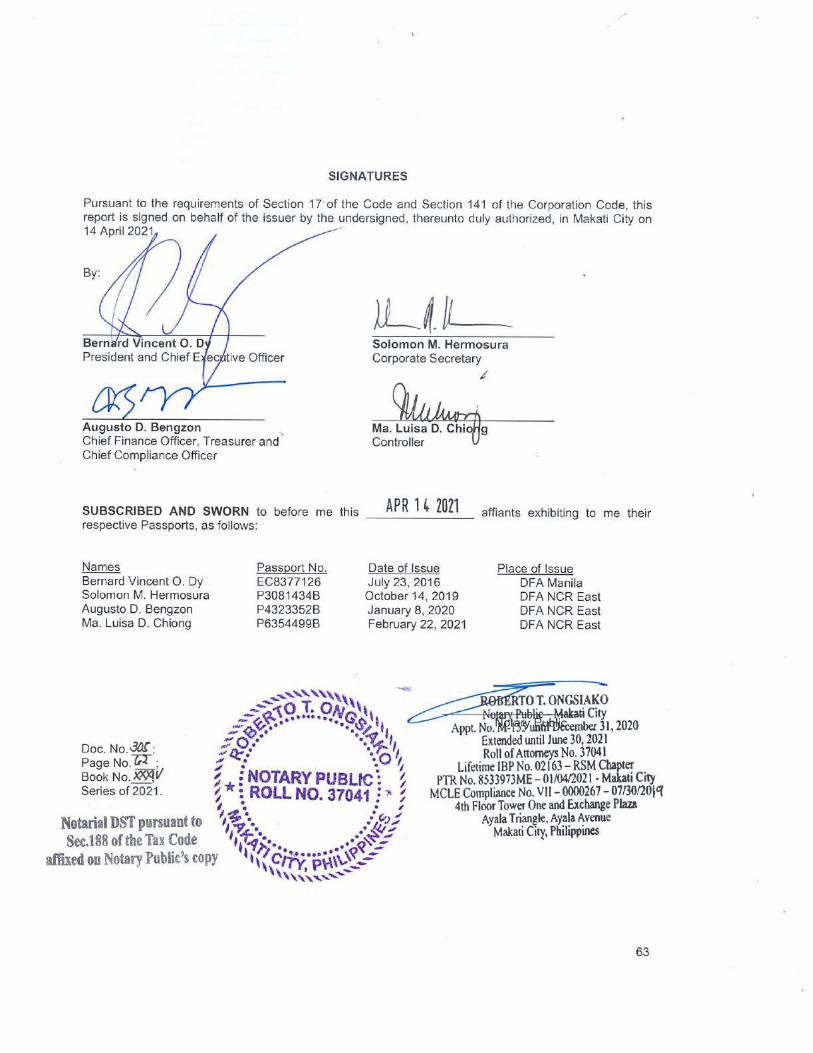

64
AYALA LAND, INC. INDEX TO EXHIBITS Form 17-A – Item 7
No.
(3) Plan of Acquisition, Reorganization, Arrangement, Liquidation, or Succession n.a. (5) Instruments Defining the Rights of Security Holders, Including Indentures n.a. (8) Voting Trust Agreement n.a. (9) Material Contracts n.a. (10) 2019 Consolidated Financial Statements: Ayala Land, Inc. and Subsidiaries (with notarized Statement of Management Responsibility)
Attached 2020 Financial Statements of “significant” subsidiaries/affiliates which are not consolidated n.a. (13) Letter re: Change in Certifying Accountant n.a. (16) Report Furnished to Security Holders n.a. (18) Subsidiaries of the Registrant 65 (19) Published Report Regarding Matters Submitted to Vote of Security Holders n.a. (20) Consent of Experts and Independent Counsel n.a. (21) Power of Attorney n.a. (29) Additional Exhibits n.a. ------- n.a. Not applicable or require no answer.

65
AYALA LAND, INC. – SUBSIDIARIES, ASSOCIATES AND JOINT VENTURES (As of December 31, 2020)
The consolidated financial statements represent the consolidation of the financial statements of Ayala Land and the following subsidiaries, associates, and joint ventures as of December 31, 2020:
Effective Ownership %*
Real Estate: Alveo Land Corporation (Alveo) 100%
Serendra, Inc. 39 Solinea, Inc. (Solinea) 65 BGSouth Properties, Inc. (BGS) 50 Portico Land Corp. (Portico) 60
Serendra, Inc. 28 Amorsedia Development Corporation 100
OLC Development Corporation and Subsidiary 100 HLC Development Corporation 100 Allysonia International Ltd. 100
Avida Land Corporation (Avida) 100 Buklod Bahayan Realty and Development Corp. 100 Avida Sales Corp. and Subsidiaries 100 Amicassa Process Solutions, Inc. 100 Avencosouth Corp. (Avencosouth) 70 BGNorth Properties, Inc. (BGN) 50
Amaia Land Co. (Amaia) 100 Amaia Southern Properties, Inc. (ASPI) 65
AyalaLand Premier, Inc. 100 Ayala Land International Sales, Inc. (ALISI) 100
Ayalaland International Marketing, Inc. (AIMI) 100 Ayala Land International (Singapore) Pte. Ltd. 100 Ayalaland International Marketing (Hong Kong) Limited (ALIM HK) 100 Ayala Land International Marketing , SRL (ALIM SRL) 100 Ayala Land International Marketing London 100
Ayala Land Sales, Inc. 100 Southportal Properties, Inc. 65 Buendia Landholdings, Inc. 100 Crans Montana Holdings, Inc. 100 Crimson Field Enterprises, Inc. 100 Ecoholdings Company, Inc. (ECI) 100 NorthBeacon Commercial Corporation NBCC) 100 Red Creek Properties, Inc. 100 Regent Time International, Limited (Regent Time) (British Virgin Islands) 100 North Eastern Commercial Corp. (formerly Asterion Technopod, Incorporated) 100 Westview Commercial Ventures Corp. (formerly Crestview E-Office Corporation) (Westview)
100
North Ventures Commercial Corp. (formerly Fairview Prime Commercial Corp. (formerly Gisborne Property Holdings, Inc.)
100
Hillsford Property Corporation (HPC) 100 Primavera Towncentre, Inc. (PTI) 100 Summerhill E-Office Corporation (Summerhill) 100 Sunnyfield E-Office Corporation (Sunnyfield) 100 Subic Bay Town Centre, Inc. 100 Regent Wise Investments Limited (Regent Wise) (Hongkong company) 100
AyalaLand Real Estate Investments Inc. 100 AyalaLand Advisory Broadway Inc. 100 AyalaLand Development (Canada) Inc. 100

66
AyalaLand OpenAsia Holdings PTE, Limited 100 Blue Horizons Holdings PTE, Limited 100 Modular Construction Technology (MCT) Bhd. 66
AREIT Fund Manager, Inc. (formerly AyalaLand Commercial REIT, Inc. (ALCRI)) 100 Arvo Commercial Corporation (Arvo) 100 BellaVita Land Corporation (BellaVita) 100 Nuevo Centro, Inc. (Nuevo Centro) 54
Alviera Country Club, Inc.** 50 Cavite Commercial Town Center, Inc. 100 AREIT, Inc. (formerly One Dela Rosa Property Development, Inc.) 54 AyalaLand Offices, Inc. (ALO) (formerly ALI Property Partners Corp. (APPCo)) 100
First Gateway Real Estate Corp. 100 Glensworth Development, Inc. (Glensworth) 100 UP North Property Holdings, Inc. 100
ALO Prime Realty Corporation 100 Makati Cornerstone Leasing Corp. 100 Arca South Commercial Ventures Corp. 100 Capitol Central Commercial Ventures Corp. 100 Bay City Commercial Ventures Corp. 100 Aurora Properties Incorporated 81
Soltea Commercial Corp. 16 Vesta Property Holdings, Inc. 78 Altaraza Prime Realty Corporation 100 Altaraza Development Corporation 51 Prow Holdings Inc 55 Station Square East Commercial Corporation (SSECC) 69 AREIT Property Managers, Inc. (formerly Next Urban Alliance Development Corp.)
100
Accendo Commercial Corp. (Accendo) 67 Avencosouth Corp. 20 Aviana Development Corporation 7
Aviana Development Corporation 50 Cagayan de Oro Gateway Corp. (CDOGC) 70 Ceci Realty, Inc. (Ceci) 60
Soltea Commercial Corp. 12 Soltea Commercial Corp. 60 CMPI Holdings, Inc. 60
CMPI Land, Inc. 36 ALI-CII Development Corporation (ALI-CII) 50 Roxas Land Corporation (RLC) 50 Adauge Commercial Corporation (Adauge) 60 Ayalaland Estates, Inc. (formerly Southgateway Development Corp.) 100 Ayalaland MetroNorth, Inc. (AMNI) 100 Verde Golf Development Corporation 100 North Triangle Depot Commercial Corporation (NTDCC) 73 BGWest Properties, Inc. (BGW) 50 Lagdigan Land Corporation 60 Central Block Developers, Inc. 45 Cebu Holdings, Inc. (CHI) 71
Cebu Leisure Company, Inc. 71 CBP Theatre Management Inc. 71 Taft Punta Engaño Property Inc. (TPEPI) 39 Cebu Insular Hotel Company, Inc. (CIHCI) 26 Solinea, Inc. 25 Amaia Southern Properties, Inc. (ASPI) 25 Southportal Properties, Inc. 25

67
Central Block Developers, Inc.*** 39 Asian I-Office Properties, Inc. (AIOPI) 71
Alabang Commercial Corporation (ACC) 50 South Innovative Theater Management (SITMI) 50
ALI Commercial Center Inc. 100 AMC Japan Concepts, Inc. 75
AyalaLand Logistics Holdings Corp. 71 FLT Prime Insurance Corp. 56 Orion Solutions, Inc 71 Orion I Holdings Philippines, Inc. 71 OE Holdings, Inc. 71 Orion Land Inc. 71 Lepanto Ceramics, Inc. 71 Laguna Technopark, Inc. (LTI) 68
Ecozone Power Management, Inc. 68 Unity Realty & Development Corp. 71
Ayalaland Malls Synergies, Inc. 100 Ayala Land Malls, Inc. (formerly Solerte, Inc.) 100
AyalaLand Malls Vismin, Inc. 100 AyalaLand Malls NorthEast, Inc. 100
Construction: Makati Development Corporation (MDC) 100
MDC Subic, Inc. 100 MDC Build Plus, Inc. 100 MDC Conqrete, Inc. (MCI) 100 MDC Equipment Solutions, Inc. (MESI) 100 MDBI Construction Corp. (formerly MDC Triangle) 67
Hotels and Resorts: Ayala Hotels, Inc. (AHI) 50 AyalaLand Hotels and Resorts Corporation (AHRC) and Subsidiaries 100
ALI Makati Hotel & Residences, Inc. (formerly KHI-ALI Manila, Inc.) 80 ALI Makati Hotel Property, Inc. (formerly KHI Manila Property, Inc.) 80 Asian Conservation Company Limited and Subsidiary 100 Enjay Hotels, Inc. (Enjay) 100 Greenhaven Property Venture, Inc. (GPVI) 100 Cebu Insular Hotel Company, Inc. (CIHCI) 63 Bonifacio Hotel Ventures, Inc. 100 Southcrest Hotel Ventures, Inc. 67 Northgate Hotel Ventures, Inc. 70 North Triangle Hotel Ventures, Inc. 100 Ecosouth Hotel Ventures, Inc. 100 Sentera Hotel Ventures Inc. 100 Econorth Resorts Ventures, Inc. 100 ALI Triangle Hotel Ventures, Inc. 100 Circuit Makati Hotel Ventures, Inc. 100 Capitol Centre Hotel Ventures, Inc. 100 Arca South Hotel Ventures, Inc. 100 Sicogon Town Hotel, Inc. 100 Bay Area Hotel Ventures, Inc. 100 Makati North Hotel Ventures, Inc. 100 One Makati Hotel Ventures, Inc. 100 Sicogon Island Tourism Estate, Corp. 100 Asiatown Hotel Ventures, Inc. 100 One Makati Residential Ventures, Inc. 100

68
ALI Makati Hotel & Residences, Inc. (formerly KHI-ALI Manila, Inc.) 20 ALI Makati Hotel Property, Inc. (formerly KHI Manila Property, Inc.) 20 Ten Knots Phils., Inc. (TKPI) 60
Bacuit Bay Development Corporation 60 Lio Resort Ventures Inc. 60 North Liberty Resort Ventures Inc. 60 Paragua Eco-Resort Ventures Inc. 60 Lio Tourism Estate Management Corp. 60
Ten Knots Development, Corp. (TKDC) 60 Chirica Resorts Corp. 60 Kingfisher Capital Resources Corp. 60 Pangalusian Island Resort Corporation 60
Integrated Eco-resort Inc. 100 Property Management: Ayala Property Management Corporation (APMC) 100
Prime Support Services, Inc. 100 Ayala Theatres Management, Inc. and Subsidiaries 100 DirectPower Services, Inc. (DirectPower) 100 Philippine Integrated Energy Solutions, Inc. (PhilEnergy) 100 Entertainment: Five Star Cinema, Inc. 100 Leisure and Allied Industries Philippines, Inc. (LAIP) 50 Others: ALInet.com, Inc. (ALInet) 100 First Longfield Investments Limited (First Longfield) (Hongkong company) 100
Green Horizons Holdings Limited 100 PCM Formosa Company Limited 50
Esta Galleria, Inc. 50 Horizon Wealth Holding Ltd. 100
Aprisa Business Process Solutions, Inc. (Aprisa) 100 AyalaLand Club Management, Inc. 100 ALI Capital Corp. (formerly Varejo Corp.) 100
Airswift Transport, Inc. (formerly Island Transvoyager, Inc.) 100 Swift Aerodrome Services, Inc.. 100
Arca South Integrated Terminal, Inc. 100 Whiteknight Holdings, Inc. (WHI) 100 Ayalaland Medical Facilities Leasing Inc. (Ayala Land Healthcare Leasing Inc.) 100 Anvaya Cove Beach and Nature Club, Inc.** 73 Anvaya Cove Golf and Sports Club, Inc.** 76
*Includes the Ayala Land group’s percentage and effective ownership ** Consolidated in compliance with Philippine Interpretations Committee (PIC) Q&A 2016-02 PAS 32 and PAS 38 - Accounting Treatment of Club Shares Held by an Entity *** includes CPVD interest in CBDI
AC owns the other 50.0% of AHI. The Company exercises control over AHI. Likewise, the Company, through its 50.0% effective ownership and by virtue of a management contract or shareholders’ agreement, exercises control over the operations and management of ACC, BGWest, BGNorth, BGSouth, RLC, ALI-CII and LAIP. Accordingly, the accounts of AHI, ACC, BGWest, BGNorth, BGSouth, RLC, ALI-CII and LAIP are consolidated to the accounts of the Company.
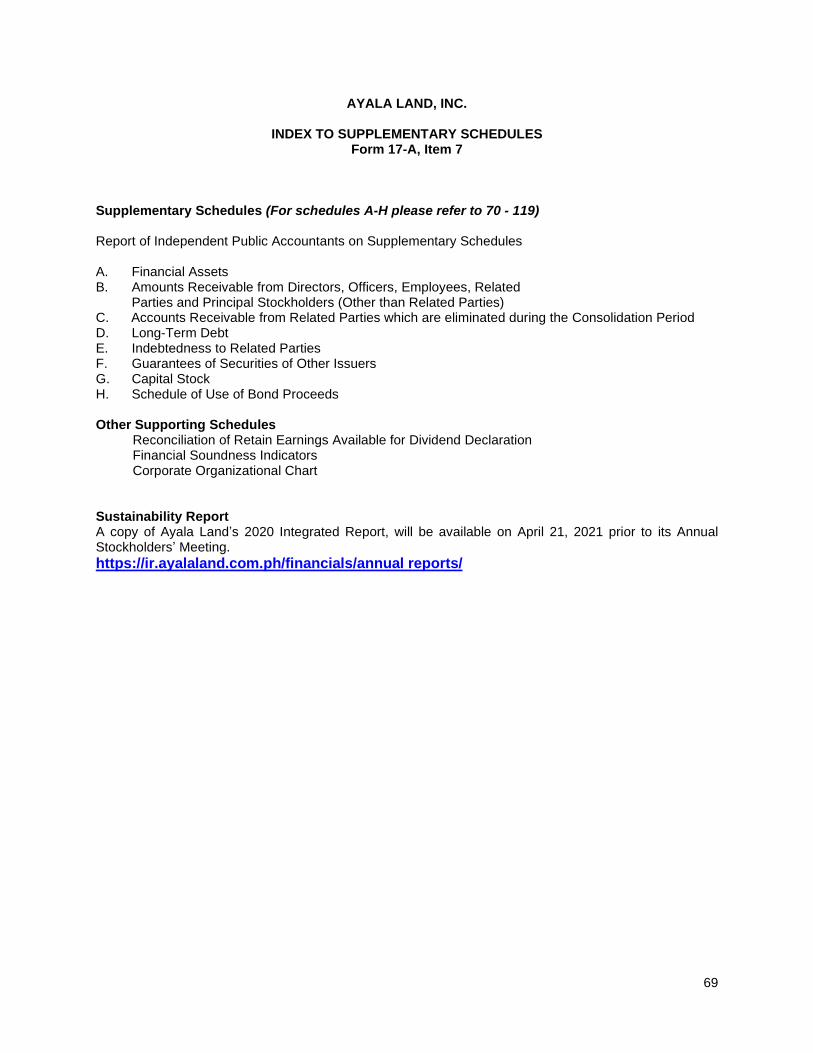
69
AYALA LAND, INC.
INDEX TO SUPPLEMENTARY SCHEDULES Form 17-A, Item 7
Supplementary Schedules (For schedules A-H please refer to 70 - 119) Report of Independent Public Accountants on Supplementary Schedules A. Financial Assets B. Amounts Receivable from Directors, Officers, Employees, Related Parties and Principal Stockholders (Other than Related Parties) C. Accounts Receivable from Related Parties which are eliminated during the Consolidation Period D. Long-Term Debt E. Indebtedness to Related Parties F. Guarantees of Securities of Other Issuers G. Capital Stock H. Schedule of Use of Bond Proceeds Other Supporting Schedules Reconciliation of Retain Earnings Available for Dividend Declaration Financial Soundness Indicators Corporate Organizational Chart Sustainability Report A copy of Ayala Land’s 2020 Integrated Report, will be available on April 21, 2021 prior to its Annual Stockholders’ Meeting.
https://ir.ayalaland.com.ph/financials/annual reports/

*SGVFSM005262*
INDEPENDENT AUDITOR’S REPORTON SUPPLEMENTARY SCHEDULES
The Stockholders and the Board of DirectorsAyala Land, Inc.31st Floor, Tower One and Exchange Plaza, Ayala TriangleAyala Avenue, Makati City
We have audited in accordance with Philippine Standards on Auditing, the consolidated financialstatements of Ayala Land, Inc. and its subsidiaries as at December 31, 2020 and 2019, and for each ofthe three years in the period ended December 31, 2020, included in this Form 17-A and have issued ourreport thereon dated February 23, 2021. Our audits were made for the purpose of forming an opinion onthe basic consolidated financial statements taken as a whole. The schedules listed in the Index to theConsolidated Financial Statements and Supplementary Schedules are the responsibility of the Group’smanagement. These schedules are presented for purposes of complying with the Revised SecuritiesRegulation Code Rule 68, and are not part of the basic consolidated financial statements. Theseschedules have been subjected to the auditing procedures applied in the audit of the basic consolidatedfinancial statements and, in our opinion, fairly state, in all material respects, the financial informationrequired to be set forth therein in relation to the basic consolidated financial statements taken as a whole.
SYCIP GORRES VELAYO & CO.
Michael C. SabadoPartnerCPA Certificate No. 89336SEC Accreditation No. 0664-AR-4 (Group A), November 11, 2019, valid until November 10, 2022Tax Identification No. 160-302-865BIR Accreditation No. 08-001998-073-2020, December 3, 2020, valid until December 2, 2023PTR No. 8534357, January 4, 2021, Makati City
February 23, 2021
SyCip Gorres Velayo & Co.6760 Ayala Avenue1226 Makati CityPhilippines
Tel: (632) 8891 0307Fax: (632) 8819 0872ey.com/ph
BOA/PRC Reg. No. 0001, October 4, 2018, valid until August 24, 2021SEC Accreditation No. 0012-FR-5 (Group A),
November 6, 2018, valid until November 5, 2021
A member firm of Ernst & Young Global Limited

*SGVFSM005262*
INDEPENDENT AUDITOR’S REPORT ONCOMPONENTS OF FINANCIAL SOUNDNESS INDICATORS
The Stockholders and the Board of DirectorsAyala Land, Inc.31st Floor, Tower One and Exchange Plaza, Ayala TriangleAyala Avenue, Makati City
We have audited in accordance with Philippine Standards on Auditing, the consolidated financialstatements of Ayala Land, Inc. and Subsidiaries (the Group) as at December 31, 2020 and for each of thethree years in the period ended December 31, 2020, and have issued our report thereon datedFebruary 23, 2021. Our audits were made for the purpose of forming an opinion on the basic consolidatedfinancial statements taken as a whole. The Supplementary Schedule on Financial Soundness Indicators,including their definitions, formulas, calculation, and their appropriateness or usefulness to the intendedusers, are the responsibility of the Group’s management. These financial soundness indicators are notmeasures of operating performance defined by Philippine Financial Reporting Standards (PFRS) andmay not be comparable to similarly titled measures presented by other companies. This schedule ispresented for the purpose of complying with the Revised Securities Regulation Code Rule 68 issued bythe Securities and Exchange Commission, and is not a required part of the basic consolidated financialstatements prepared in accordance with PFRS. The components of these financial soundness indicatorshave been traced to the Group’s consolidated financial statements as at December 31, 2020 and for eachof the three years in the period ended December 31, 2020 and no material exceptions were noted.
SYCIP GORRES VELAYO & CO.
Michael C. SabadoPartnerCPA Certificate No. 89336SEC Accreditation No. 0664-AR-4 (Group A), November 11, 2019, valid until November 10, 2022Tax Identification No. 160-302-865BIR Accreditation No. 08-001998-073-2020, December 3, 2020, valid until December 2, 2023PTR No. 8534357, January 4, 2021, Makati City
February 23, 2021
SyCip Gorres Velayo & Co.6760 Ayala Avenue1226 Makati CityPhilippines
Tel: (632) 8891 0307Fax: (632) 8819 0872ey.com/ph
BOA/PRC Reg. No. 0001, October 4, 2018, valid until August 24, 2021SEC Accreditation No. 0012-FR-5 (Group A),
November 6, 2018, valid until November 5, 2021
A member firm of Ernst & Young Global Limited
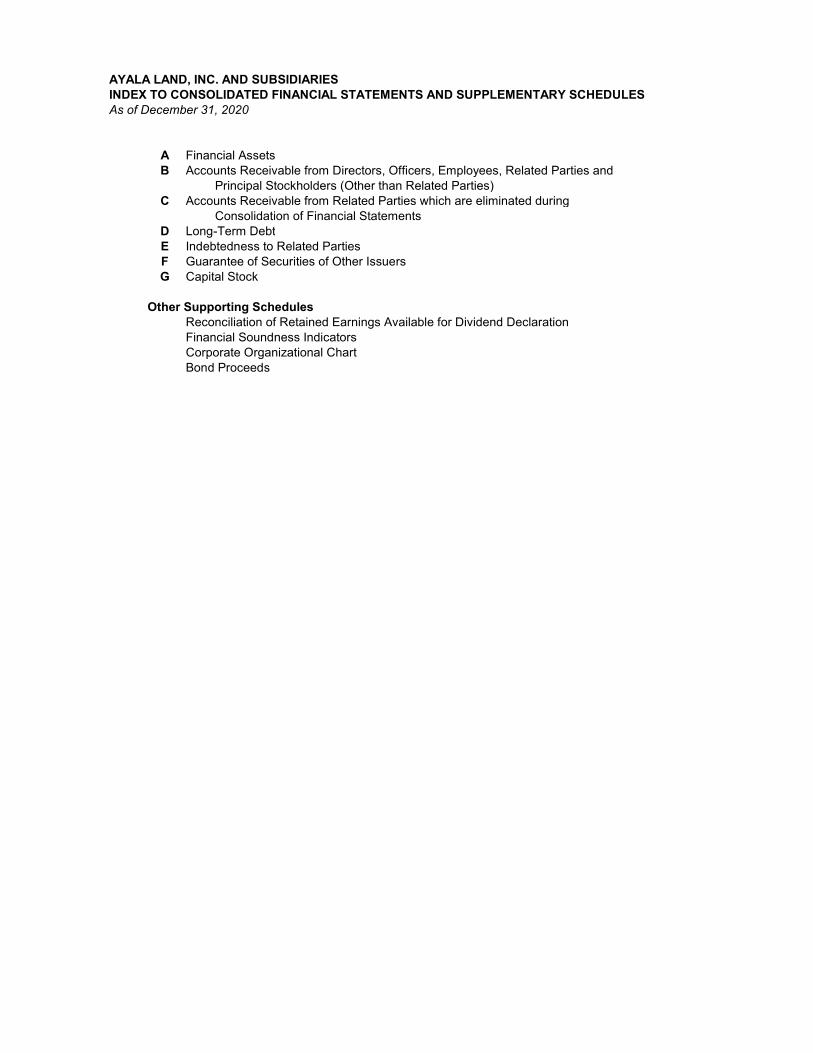
AYALA LAND, INC. AND SUBSIDIARIESINDEX TO CONSOLIDATED FINANCIAL STATEMENTS AND SUPPLEMENTARY SCHEDULES As of December 31, 2020
A Financial AssetsB Accounts Receivable from Directors, Officers, Employees, Related Parties and
Principal Stockholders (Other than Related Parties)C Accounts Receivable from Related Parties which are eliminated during
Consolidation of Financial StatementsD Long-Term DebtE Indebtedness to Related PartiesF Guarantee of Securities of Other IssuersG Capital Stock
Other Supporting SchedulesReconciliation of Retained Earnings Available for Dividend DeclarationFinancial Soundness IndicatorsCorporate Organizational ChartBond Proceeds

AYALA LAND, INC. AND SUBSIDIARIESSCHEDULE A - Financial AssetsAs of December 31, 2020
NAME OF ISSUING ENTITY AND ASSOCIATION OF EACH ISSUE
AMOUNT IN THE STATEMENT OF FINANCIAL
POSITION
INCOME RECEIVED & ACCRUED
Loans and ReceivablesA. Cash in Bank 13,678,488,230Php 111,208,195Php
BPIPeso 3,413,751,589 11,737,696 Foreign Currency 69,820,655 324,479
Other Banks Peso 3,231,862,935 23,201,919 Foreign Currency 6,963,053,052 75,944,100
B. Cash Equivalents 1/ 3,294,555,413 60,035,438 BPI
Special Savings Account 1,896,916 Time Deposits 47,486,002 6,074,317 Others 2,011,628
Other BanksSpecial Savings Account 3,532,568 Time Deposits 3,247,069,411 30,468,246 Others 16,051,764
C. Loans and receivable 78,295,170,839 4,038,968,108 Trade 78,295,170,839 4,038,968,108 Advances to other companiesInvestment in bonds classified as loans and receivables 2/ - -
D . Financial Assets at FVPL 706,019,210 6,221,617 Investment in UITF 378,065,912 6,221,617 Investment in Funds 327,953,298
E. AFS Financial assets 1,511,442,706 - TOTAL : 97,485,676,398Php 4,216,433,358Php
1/ Cash equivalents are short term, highly liquid investments that are made for varying period of up to three (3) months depending on the immediate cash requirements of the group and earn interest at the respective short term rates.
2/ Investment in bonds classified as loans and receivables pertain to the Company's investment in unsecured subordinated notes of Land Bank of the Philippines and Development Bank of the Philippines and Company's investment in collateralized bonds of First Metro Investment Corp.

AYALA LAND, INC. AND SUBSIDIARIESSCHEDULE B - Amounts Receivable from Directors, Officers, Employees, Related Partiesand Principal Stockholders (Other than Related Parties)As of December 31, 2020
EmployeesNotes Receivable 901,262,867Php 728,872,086Php 787,629,337Php 697,282,993Php 145,222,623Php 842,505,615Php
BALANCE AT END OF PERIOD
NAME AND DESIGNATION OF DEBTOR
BALANCE AT BEGINNING OF PERIOD
ADDITIONSAMOUNTS
COLLECTEDCURRENT NON-CURRENT

AYALA LAND INC. AND SUBSIDIARIESSchedule C - Accounts Receivable from Related Parties which are Eliminated during the Consolidation PeriodAs of December 31, 2020
Receivable Balance per ALI-PARENT
Payable Balance per ALI SUBSIDIARIES
Current Non-Current
Ayala Land, Inc. (ALI) Subsidiaries: Accendo Commercial Corp 1,163,885,783 1,163,885,783 1,163,885,783 Adauge Commercial Corp. 9,384,606 9,384,606 9,384,606 Alabang Commercial Corporation (Conso) 40,002,390 40,002,390 40,002,390 ALI Capital Corp. (Conso) 181,646,739 181,646,739 181,646,739 ALI Commercial Center, Inc. (Conso) 714,833,249 714,833,249 714,833,249 ALI-CII Development Corporation 4,181,521 4,181,521 4,181,521 ALO Prime Realty Corporation 3,138,579 3,138,579 3,138,579 Altaraza Development Corporation 56,000 56,000 56,000 Alveo Land Corporation (Conso) 3,653,530,956 3,653,530,956 3,653,530,956 Amaia Land Corporation (Conso) 2,532,649,835 2,532,649,835 2,532,649,835 Amorsedia Development Corporation (Conso) 644,742,089 644,742,089 644,742,089 Anvaya Cove Beach and Nature Club Inc 593,300 593,300 593,300 Anvaya Cove Golf and Sports Club Inc. 78,865,388 78,865,388 78,865,388 APRISA Business Process Solutions, Inc 2,160,623 2,160,623 2,160,623 Arca South Commercial Ventures Corp. 1,114,525,210 1,114,525,210 1,114,525,210 Arca South Integrated Terminal, Inc 33,608,349 33,608,349 33,608,349 Arvo Commercial Corporation 377,818,226 377,818,226 377,818,226 Aurora Properties, Inc. 71,708,403 71,708,403 71,708,403 Aviana Development Corporation 87,588,673 87,588,673 87,588,673 Avida Land Corporation (Conso) 5,775,377,945 5,775,377,945 5,775,377,945 Ayala Hotels Inc. 975,159,480 975,159,480 975,159,480 Ayala Land International Sales, Inc.(Conso) 143,920,716 143,920,716 143,920,716 Ayala Land Sales Inc. 60,349,214 60,349,214 60,349,214 Ayala Property Management Corporation (Conso) 34,712,251 34,712,251 34,712,251 Ayala Theaters Management, Inc. 713,177 713,177 713,177 AyalaLand Club Management, Inc. 25,134,107 25,134,107 25,134,107 AREIT Fund Manager, Inc. 16,807,036 16,807,036 16,807,036 Ayalaland Estates, Inc. 2,222,118,631 2,222,118,631 2,222,118,631 AyalaLand Hotels and Resorts Corp. (Conso) 1,741,709,045 1,741,709,045 1,741,709,045 Ayalaland Logistics Holdings Corp. (Conso) 1,002,731,574 1,002,731,574 1,002,731,574 Ayalaland Malls Synergies, Inc. 40,770,046 40,770,046 40,770,046 AyalaLand Malls, Inc. (Conso) 24,432,172 24,432,172 24,432,172 Ayalaland Medical Facilities Leasing Inc. 18,592,201 18,592,201 18,592,201 Ayalaland Metro North, Inc. 2,453,232 2,453,232 2,453,232 AyalaLand Offices, Inc. (Conso) 116,691,021 116,691,021 116,691,021 Ayalaland Premier, Inc. 79,309 79,309 79,309 Bay City Commercial Ventures Corp. 8,893,963,398 8,893,963,398 8,893,963,398 BellaVita Land Corp. 985,170,272 985,170,272 985,170,272 BG West Properties, Inc 789,566,692 789,566,692 789,566,692 Buendia Landholdings, Inc. 196,716 196,716 196,716 Cagayan De Oro Gateway Corporation 376,141,781 376,141,781 376,141,781 Capitol Central Commercial Ventures Corp. 1,881,019,039 1,881,019,039 1,881,019,039 Cavite Commercial Towncenter Inc. 507,797,012 507,797,012 507,797,012 Cebu Holdings, Inc. (Conso) 3,296,216,343 3,296,216,343 3,296,216,343 CECI Realty Corp. 257,160,877 257,160,877 257,160,877 Crans Montana Property Holdings Corporation 24,049,610 24,049,610 24,049,610 Crimson Field Enterprises, Inc. 195,962,176 195,962,176 195,962,176 Direct Power Services Inc. 16,034,142 16,034,142 16,034,142 Ecoholdings Company, Inc. 702,706 702,706 702,706 First Longfield Investments Ltd. 64,753 64,753 64,753 FIVE STAR Cinema Inc. 65,094 65,094 65,094 Hillsford Property Corporation 139,799 139,799 139,799 Integrated Eco-Resort Inc. 123,862 123,862 123,862 Lagdigan Land Corporation 574,917 574,917 574,917 Leisure and Allied Industries Phils. Inc. 4,394,020 4,394,020 4,394,020 Makati Cornerstone Leasing Corp. 4,297,649,954 4,297,649,954 4,297,649,954 Makati Development Corporation (Conso) 61,363,513 61,363,513 61,363,513 AREIT Property Managers, Inc. 362,294 362,294 362,294 North Eastern Commercial Corp. 959,957,919 959,957,919 959,957,919 North Triangle Depot Commercial Corp 868,382,531 868,382,531 868,382,531 North Ventures Commercial Corp. 57,684,083 57,684,083 57,684,083 NorthBeacon Commercial Corporation 13,017,872 13,017,872 13,017,872 Nuevocentro, Inc. (Conso) 2,264,420,036 2,264,420,036 2,264,420,036
Amount Owed by Ayala Land, Inc. (ALI) Subsidiaries to ALI PARENT
Page 1 of 27

AREIT, Inc. 1,161,020,165 1,161,020,165 1,161,020,165 Philippine Integrated Energy Solutions, Inc. 7,419,878 7,419,878 7,419,878 Primavera Towncentre, Inc. 46,858,168 46,858,168 46,858,168 Red Creek Properties, Inc. 237,202,714 237,202,714 237,202,714 Regent Time International, Limited 98,243,136 98,243,136 98,243,136 Regent Wise Investments Limited(Conso) 6,128,969,611 6,128,969,611 6,128,969,611 Roxas Land Corp. 8,642,020 8,642,020 8,642,020 Serendra Inc. 173,509,184 173,509,184 173,509,184 Soltea Commercial Corp. 289,247,413 289,247,413 289,247,413 Southportal Properties, Inc. 309,830,041 309,830,041 309,830,041 Station Square East Commercial Corp 1,180,167,993 1,180,167,993 1,180,167,993 Subic Bay Town Center Inc. 5,206,230 5,206,230 5,206,230 Summerhill Commercial Ventures Corp. 45,036,991 45,036,991 45,036,991 Sunnyfield E-Office Corp 11,552,409 11,552,409 11,552,409 Ten Knots Development Corporation(Conso) 22,470,675 22,470,675 22,470,675 Ten Knots Philippines, Inc.(Conso) 46,507,168 46,507,168 46,507,168 Verde Golf Development Corporation 94,548,747 94,548,747 94,548,747 Vesta Property Holdings Inc. 27,464,765 27,464,765 27,464,765 Westview Commercial Ventures Corp. 22,275,333 22,275,333 22,275,333 Whiteknight Holdings, Inc. 33,184,355 33,184,355 33,184,355
Sub-Total 58,618,209,485 58,618,209,485 58,618,209,485 -
Receivable Balance per ALI SUBSIDIARIES
Payable Balance per ALI PARENT
Current Non-Current
Ayala Land, Inc. (ALI) Subsidiaries: Accendo Commercial Corp 14,257,338 14,257,338 14,257,338 Alabang Commercial Corporation (Conso) 53,462,105 53,462,105 53,462,105 ALI Capital Corp. (Conso) 67,073 67,073 67,073 ALI Commercial Center, Inc. (Conso) 32,521,088 32,521,088 32,521,088 ALI-CII Development Corporation 987 987 987 ALO Prime Realty Corporation 790,887,665 790,887,665 790,887,665 Altaraza Prime Realty Corporation 2,516,892 2,516,892 2,516,892 Alveo Land Corporation (Conso) 704,470,573 704,470,573 704,470,573 Amaia Land Corporation (Conso) 2,611,255 2,611,255 2,611,255 Amorsedia Development Corporation (Conso) 120,706,662 120,706,662 120,706,662 Anvaya Cove Golf and Sports Club Inc. 5,500 5,500 5,500 APRISA Business Process Solutions, Inc 8,894,548 8,894,548 8,894,548 Arvo Commercial Corporation 978,410,844 978,410,844 978,410,844 Aurora Properties, Inc. 220,458,791 220,458,791 220,458,791 Avida Land Corporation (Conso) 2,842,204,974 2,842,204,974 2,842,204,974 Ayala Hotels Inc. 3,281,624,685 3,281,624,685 3,281,624,685 Ayala Land International Sales, Inc.(Conso) 74,279,198 74,279,198 74,279,198 Ayala Land Sales Inc. 25,371,552 25,371,552 25,371,552 Ayala Property Management Corporation (Conso) 401,251,196 401,251,196 401,251,196 AyalaLand Club Management, Inc. 231,823 231,823 231,823 AREIT Fund Manager, Inc. 7,009,550 7,009,550 7,009,550 Ayalaland Estates, Inc. 150,054,296 150,054,296 150,054,296 AyalaLand Hotels and Resorts Corp. (Conso) 36,023,915 36,023,915 36,023,915 Ayalaland Logistics Holdings Corp. (Conso) 636,325,283 636,325,283 636,325,283 AyalaLand Malls, Inc. (Conso) 25,062,699 25,062,699 25,062,699 Ayalaland Metro North, Inc. 51,059,595 51,059,595 51,059,595 AyalaLand Offices, Inc. (Conso) 1,169,469,570 1,169,469,570 1,169,469,570 Ayalaland Premier, Inc. 6,375,221 6,375,221 6,375,221 BellaVita Land Corp. 57,982,970 57,982,970 57,982,970 BG West Properties, Inc 4,451,958 4,451,958 4,451,958 Buendia Landholdings, Inc. 21,525 21,525 21,525 Cagayan De Oro Gateway Corporation 5,117,937 5,117,937 5,117,937 Cavite Commercial Towncenter Inc. 23,926 23,926 23,926 Cebu Holdings, Inc. (Conso) 207,639,102 207,639,102 207,639,102 CECI Realty Corp. 520,710,596 520,710,596 520,710,596 Crans Montana Property Holdings Corporation 92,728,430 92,728,430 92,728,430 Crimson Field Enterprises, Inc. 23,065,218 23,065,218 23,065,218 Direct Power Services Inc. 35,885,552 35,885,552 35,885,552 First Longfield Investments Ltd. 15,362,571 15,362,571 15,362,571 Hillsford Property Corporation 6,601 6,601 6,601 Makati Cornerstone Leasing Corp. 178,369,960 178,369,960 178,369,960 Makati Development Corporation (Conso) 5,488,555,707 5,488,555,707 5,488,555,707 North Eastern Commercial Corp. 97,236,832 97,236,832 97,236,832 North Triangle Depot Commercial Corp 186,116,033 186,116,033 186,116,033 North Ventures Commercial Corp. 53,698,157 53,698,157 53,698,157
Amount Owed by ALI PARENT to ALI SUBSIDIARIES
Page 2 of 27
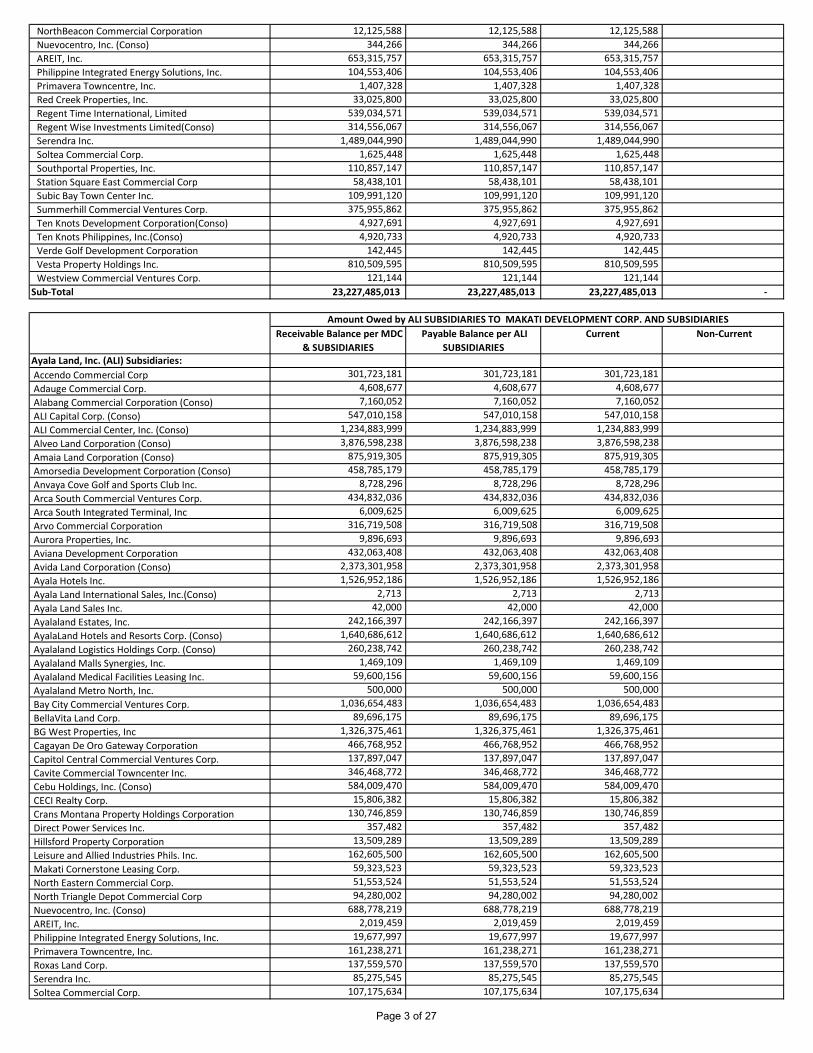
NorthBeacon Commercial Corporation 12,125,588 12,125,588 12,125,588 Nuevocentro, Inc. (Conso) 344,266 344,266 344,266 AREIT, Inc. 653,315,757 653,315,757 653,315,757 Philippine Integrated Energy Solutions, Inc. 104,553,406 104,553,406 104,553,406 Primavera Towncentre, Inc. 1,407,328 1,407,328 1,407,328 Red Creek Properties, Inc. 33,025,800 33,025,800 33,025,800 Regent Time International, Limited 539,034,571 539,034,571 539,034,571 Regent Wise Investments Limited(Conso) 314,556,067 314,556,067 314,556,067 Serendra Inc. 1,489,044,990 1,489,044,990 1,489,044,990 Soltea Commercial Corp. 1,625,448 1,625,448 1,625,448 Southportal Properties, Inc. 110,857,147 110,857,147 110,857,147 Station Square East Commercial Corp 58,438,101 58,438,101 58,438,101 Subic Bay Town Center Inc. 109,991,120 109,991,120 109,991,120 Summerhill Commercial Ventures Corp. 375,955,862 375,955,862 375,955,862 Ten Knots Development Corporation(Conso) 4,927,691 4,927,691 4,927,691 Ten Knots Philippines, Inc.(Conso) 4,920,733 4,920,733 4,920,733 Verde Golf Development Corporation 142,445 142,445 142,445 Vesta Property Holdings Inc. 810,509,595 810,509,595 810,509,595 Westview Commercial Ventures Corp. 121,144 121,144 121,144
Sub-Total 23,227,485,013 23,227,485,013 23,227,485,013 -
Receivable Balance per MDC & SUBSIDIARIES
Payable Balance per ALI SUBSIDIARIES
Current Non-Current
Ayala Land, Inc. (ALI) Subsidiaries: Accendo Commercial Corp 301,723,181 301,723,181 301,723,181 Adauge Commercial Corp. 4,608,677 4,608,677 4,608,677 Alabang Commercial Corporation (Conso) 7,160,052 7,160,052 7,160,052 ALI Capital Corp. (Conso) 547,010,158 547,010,158 547,010,158 ALI Commercial Center, Inc. (Conso) 1,234,883,999 1,234,883,999 1,234,883,999 Alveo Land Corporation (Conso) 3,876,598,238 3,876,598,238 3,876,598,238 Amaia Land Corporation (Conso) 875,919,305 875,919,305 875,919,305 Amorsedia Development Corporation (Conso) 458,785,179 458,785,179 458,785,179 Anvaya Cove Golf and Sports Club Inc. 8,728,296 8,728,296 8,728,296 Arca South Commercial Ventures Corp. 434,832,036 434,832,036 434,832,036 Arca South Integrated Terminal, Inc 6,009,625 6,009,625 6,009,625 Arvo Commercial Corporation 316,719,508 316,719,508 316,719,508 Aurora Properties, Inc. 9,896,693 9,896,693 9,896,693 Aviana Development Corporation 432,063,408 432,063,408 432,063,408 Avida Land Corporation (Conso) 2,373,301,958 2,373,301,958 2,373,301,958 Ayala Hotels Inc. 1,526,952,186 1,526,952,186 1,526,952,186 Ayala Land International Sales, Inc.(Conso) 2,713 2,713 2,713 Ayala Land Sales Inc. 42,000 42,000 42,000 Ayalaland Estates, Inc. 242,166,397 242,166,397 242,166,397 AyalaLand Hotels and Resorts Corp. (Conso) 1,640,686,612 1,640,686,612 1,640,686,612 Ayalaland Logistics Holdings Corp. (Conso) 260,238,742 260,238,742 260,238,742 Ayalaland Malls Synergies, Inc. 1,469,109 1,469,109 1,469,109 Ayalaland Medical Facilities Leasing Inc. 59,600,156 59,600,156 59,600,156 Ayalaland Metro North, Inc. 500,000 500,000 500,000 Bay City Commercial Ventures Corp. 1,036,654,483 1,036,654,483 1,036,654,483 BellaVita Land Corp. 89,696,175 89,696,175 89,696,175 BG West Properties, Inc 1,326,375,461 1,326,375,461 1,326,375,461 Cagayan De Oro Gateway Corporation 466,768,952 466,768,952 466,768,952 Capitol Central Commercial Ventures Corp. 137,897,047 137,897,047 137,897,047 Cavite Commercial Towncenter Inc. 346,468,772 346,468,772 346,468,772 Cebu Holdings, Inc. (Conso) 584,009,470 584,009,470 584,009,470 CECI Realty Corp. 15,806,382 15,806,382 15,806,382 Crans Montana Property Holdings Corporation 130,746,859 130,746,859 130,746,859 Direct Power Services Inc. 357,482 357,482 357,482 Hillsford Property Corporation 13,509,289 13,509,289 13,509,289 Leisure and Allied Industries Phils. Inc. 162,605,500 162,605,500 162,605,500 Makati Cornerstone Leasing Corp. 59,323,523 59,323,523 59,323,523 North Eastern Commercial Corp. 51,553,524 51,553,524 51,553,524 North Triangle Depot Commercial Corp 94,280,002 94,280,002 94,280,002 Nuevocentro, Inc. (Conso) 688,778,219 688,778,219 688,778,219 AREIT, Inc. 2,019,459 2,019,459 2,019,459 Philippine Integrated Energy Solutions, Inc. 19,677,997 19,677,997 19,677,997 Primavera Towncentre, Inc. 161,238,271 161,238,271 161,238,271 Roxas Land Corp. 137,559,570 137,559,570 137,559,570 Serendra Inc. 85,275,545 85,275,545 85,275,545 Soltea Commercial Corp. 107,175,634 107,175,634 107,175,634
Amount Owed by ALI SUBSIDIARIES TO MAKATI DEVELOPMENT CORP. AND SUBSIDIARIES
Page 3 of 27
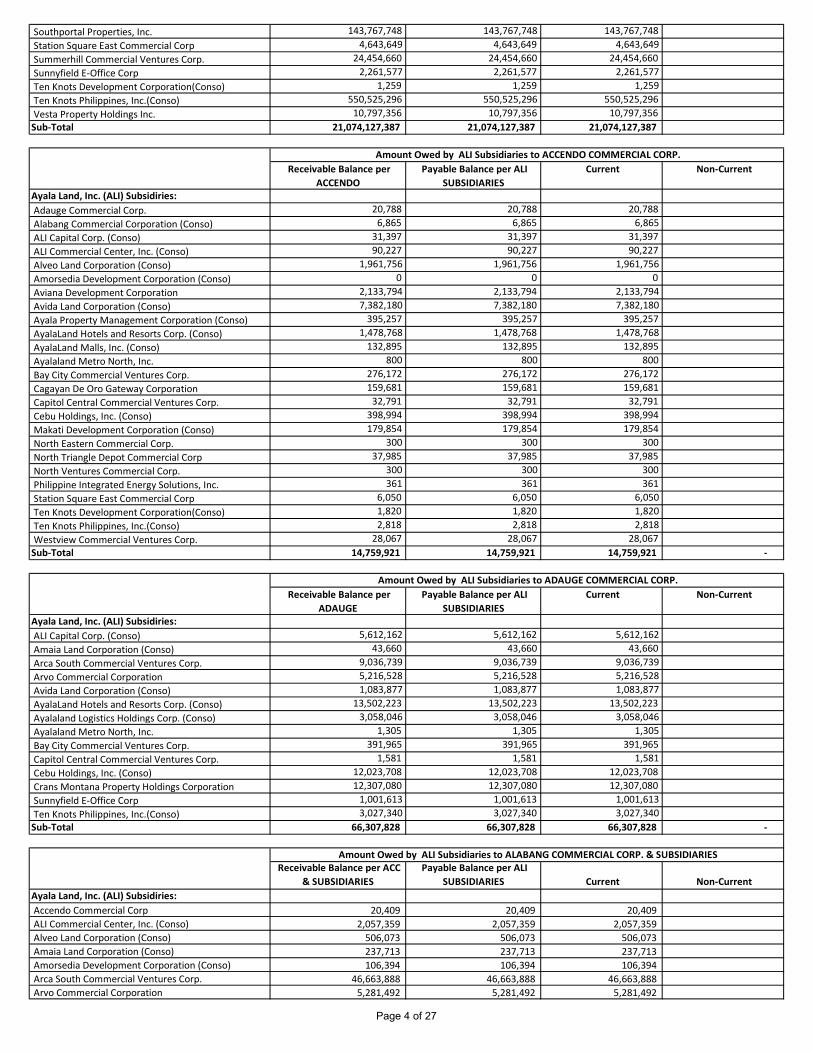
Southportal Properties, Inc. 143,767,748 143,767,748 143,767,748 Station Square East Commercial Corp 4,643,649 4,643,649 4,643,649 Summerhill Commercial Ventures Corp. 24,454,660 24,454,660 24,454,660 Sunnyfield E-Office Corp 2,261,577 2,261,577 2,261,577 Ten Knots Development Corporation(Conso) 1,259 1,259 1,259 Ten Knots Philippines, Inc.(Conso) 550,525,296 550,525,296 550,525,296 Vesta Property Holdings Inc. 10,797,356 10,797,356 10,797,356 Sub-Total 21,074,127,387 21,074,127,387 21,074,127,387
Receivable Balance per ACCENDO
Payable Balance per ALI SUBSIDIARIES
Current Non-Current
Ayala Land, Inc. (ALI) Subsidiries: Adauge Commercial Corp. 20,788 20,788 20,788 Alabang Commercial Corporation (Conso) 6,865 6,865 6,865 ALI Capital Corp. (Conso) 31,397 31,397 31,397 ALI Commercial Center, Inc. (Conso) 90,227 90,227 90,227 Alveo Land Corporation (Conso) 1,961,756 1,961,756 1,961,756 Amorsedia Development Corporation (Conso) 0 0 0 Aviana Development Corporation 2,133,794 2,133,794 2,133,794 Avida Land Corporation (Conso) 7,382,180 7,382,180 7,382,180 Ayala Property Management Corporation (Conso) 395,257 395,257 395,257 AyalaLand Hotels and Resorts Corp. (Conso) 1,478,768 1,478,768 1,478,768 AyalaLand Malls, Inc. (Conso) 132,895 132,895 132,895 Ayalaland Metro North, Inc. 800 800 800 Bay City Commercial Ventures Corp. 276,172 276,172 276,172 Cagayan De Oro Gateway Corporation 159,681 159,681 159,681 Capitol Central Commercial Ventures Corp. 32,791 32,791 32,791 Cebu Holdings, Inc. (Conso) 398,994 398,994 398,994 Makati Development Corporation (Conso) 179,854 179,854 179,854 North Eastern Commercial Corp. 300 300 300 North Triangle Depot Commercial Corp 37,985 37,985 37,985 North Ventures Commercial Corp. 300 300 300 Philippine Integrated Energy Solutions, Inc. 361 361 361 Station Square East Commercial Corp 6,050 6,050 6,050 Ten Knots Development Corporation(Conso) 1,820 1,820 1,820 Ten Knots Philippines, Inc.(Conso) 2,818 2,818 2,818 Westview Commercial Ventures Corp. 28,067 28,067 28,067 Sub-Total 14,759,921 14,759,921 14,759,921 -
Receivable Balance per ADAUGE
Payable Balance per ALI SUBSIDIARIES
Current Non-Current
Ayala Land, Inc. (ALI) Subsidiries: ALI Capital Corp. (Conso) 5,612,162 5,612,162 5,612,162 Amaia Land Corporation (Conso) 43,660 43,660 43,660 Arca South Commercial Ventures Corp. 9,036,739 9,036,739 9,036,739 Arvo Commercial Corporation 5,216,528 5,216,528 5,216,528 Avida Land Corporation (Conso) 1,083,877 1,083,877 1,083,877 AyalaLand Hotels and Resorts Corp. (Conso) 13,502,223 13,502,223 13,502,223 Ayalaland Logistics Holdings Corp. (Conso) 3,058,046 3,058,046 3,058,046 Ayalaland Metro North, Inc. 1,305 1,305 1,305 Bay City Commercial Ventures Corp. 391,965 391,965 391,965 Capitol Central Commercial Ventures Corp. 1,581 1,581 1,581 Cebu Holdings, Inc. (Conso) 12,023,708 12,023,708 12,023,708 Crans Montana Property Holdings Corporation 12,307,080 12,307,080 12,307,080 Sunnyfield E-Office Corp 1,001,613 1,001,613 1,001,613 Ten Knots Philippines, Inc.(Conso) 3,027,340 3,027,340 3,027,340 Sub-Total 66,307,828 66,307,828 66,307,828 -
Receivable Balance per ACC & SUBSIDIARIES
Payable Balance per ALI SUBSIDIARIES Current Non-Current
Ayala Land, Inc. (ALI) Subsidiries: Accendo Commercial Corp 20,409 20,409 20,409 ALI Commercial Center, Inc. (Conso) 2,057,359 2,057,359 2,057,359 Alveo Land Corporation (Conso) 506,073 506,073 506,073 Amaia Land Corporation (Conso) 237,713 237,713 237,713 Amorsedia Development Corporation (Conso) 106,394 106,394 106,394 Arca South Commercial Ventures Corp. 46,663,888 46,663,888 46,663,888 Arvo Commercial Corporation 5,281,492 5,281,492 5,281,492
Amount Owed by ALI Subsidiaries to ALABANG COMMERCIAL CORP. & SUBSIDIARIES
Amount Owed by ALI Subsidiaries to ACCENDO COMMERCIAL CORP.
Amount Owed by ALI Subsidiaries to ADAUGE COMMERCIAL CORP.
Page 4 of 27

Avida Land Corporation (Conso) 955,514 955,514 955,514 Ayala Land Sales Inc. 571,187 571,187 571,187 Ayalaland Logistics Holdings Corp. (Conso) 913 913 913 Ayalaland Metro North, Inc. 6,200 6,200 6,200 AyalaLand Offices, Inc. (Conso) 8,816,168 8,816,168 8,816,168 Bay City Commercial Ventures Corp. 84,638,335 84,638,335 84,638,335 Cagayan De Oro Gateway Corporation 3,506,515 3,506,515 3,506,515 Cavite Commercial Towncenter Inc. 10,506 10,506 10,506 Cebu Holdings, Inc. (Conso) 11,008,536 11,008,536 11,008,536 FIVE STAR Cinema Inc. 6,754,131 6,754,131 6,754,131 Hillsford Property Corporation 15,015,365 15,015,365 15,015,365 Leisure and Allied Industries Phils. Inc. 44,128,711 44,128,711 44,128,711 North Eastern Commercial Corp. 8,940 8,940 8,940 North Triangle Depot Commercial Corp 340,435 340,435 340,435 North Ventures Commercial Corp. 5,900 5,900 5,900 NorthBeacon Commercial Corporation 41,800 41,800 41,800 Serendra Inc. 161,620 161,620 161,620 Soltea Commercial Corp. 77,866 77,866 77,866 Station Square East Commercial Corp 112,401 112,401 112,401 Summerhill Commercial Ventures Corp. 600 600 600 Ten Knots Philippines, Inc.(Conso) 10,016,561 10,016,561 10,016,561 Sub-Total 241,051,531 241,051,531 241,051,531
Receivable Balance per ALI CAPITAL CORP. &
SUBSIDIARIES
Payable Balance per ALI SUBSIDIARIES
Current Non-Current
Ayala Land, Inc. (ALI) Subsidiries: ALI Capital Corp. (Conso) - - - Amaia Land Corporation (Conso) 38,217,091 38,217,091 38,217,091 Arca South Commercial Ventures Corp. 83,885,918 83,885,918 83,885,918 Arvo Commercial Corporation 10,637,755 10,637,755 10,637,755 AyalaLand Hotels and Resorts Corp. (Conso) 8,640,866 8,640,866 8,640,866 Ayalaland Medical Facilities Leasing Inc. 5,913,391 5,913,391 5,913,391 Bay City Commercial Ventures Corp. 95,212,065 95,212,065 95,212,065 Cebu Holdings, Inc. (Conso) 13,054,413 13,054,413 13,054,413 Makati Development Corporation (Conso) 177,658 177,658 177,658 Ten Knots Development Corporation(Conso) 33,836,413 33,836,413 33,836,413 Ten Knots Philippines, Inc.(Conso) 17,687,771 17,687,771 17,687,771 Whiteknight Holdings, Inc. 21,773,797 21,773,797 21,773,797 Sub-Total 329,037,138 329,037,138 329,037,138
Receivable Balance per ACCI & SUBSIDIARIES
Payable Balance per ALI SUBSIDIARIES
Current Non-Current
Ayala Land, Inc. (ALI) Subsidiries: Accendo Commercial Corp 2,453,603 2,453,603 2,453,603 Alabang Commercial Corporation (Conso) 3,249,204 3,249,204 3,249,204 ALI Capital Corp. (Conso) 1,488,500 1,488,500 1,488,500 ALI-CII Development Corporation 92,695 92,695 92,695 Alveo Land Corporation (Conso) 46,939 46,939 46,939 Amaia Land Corporation (Conso) 489,215 489,215 489,215 APRISA Business Process Solutions, Inc 10,400 10,400 10,400 Arca South Commercial Ventures Corp. 117,331,958 117,331,958 117,331,958 Arvo Commercial Corporation 2,992,843 2,992,843 2,992,843 Avida Land Corporation (Conso) 8,227,401 8,227,401 8,227,401 Ayala Hotels Inc. 4,050 4,050 4,050 Ayala Property Management Corporation (Conso) 29,962,511 29,962,511 29,962,511 Ayala Theaters Management, Inc. 2,653,984 2,653,984 2,653,984 AyalaLand Hotels and Resorts Corp. (Conso) 3,111,039 3,111,039 3,111,039 Ayalaland Logistics Holdings Corp. (Conso) 320,162 320,162 320,162 Ayalaland Malls Synergies, Inc. 3,648,376 3,648,376 3,648,376 AyalaLand Malls, Inc. (Conso) 5,288,657 5,288,657 5,288,657 Ayalaland Medical Facilities Leasing Inc. 197,632 197,632 197,632 Ayalaland Metro North, Inc. 264,166 264,166 264,166 Ayalaland Premier, Inc. 422,922 422,922 422,922 Bay City Commercial Ventures Corp. 19,025,574 19,025,574 19,025,574 BellaVita Land Corp. 227,938 227,938 227,938 Cagayan De Oro Gateway Corporation 2,592,773 2,592,773 2,592,773 Capitol Central Commercial Ventures Corp. 1,195,933 1,195,933 1,195,933 Cavite Commercial Towncenter Inc. 281,341 281,341 281,341
Amount Owed by ALI Subsidiaries to ALI CAPITAL CORP.
Amount Owed by ALI Subsidiaries to ALI COMMERCIAL CENTER INC.
Page 5 of 27

Cebu Holdings, Inc. (Conso) 4,793,076 4,793,076 4,793,076 Crans Montana Property Holdings Corporation 682,469 682,469 682,469 Direct Power Services Inc. 12,672 12,672 12,672 FIVE STAR Cinema Inc. 22,485 22,485 22,485 Leisure and Allied Industries Phils. Inc. 7,462,999 7,462,999 7,462,999 Makati Cornerstone Leasing Corp. 799,666 799,666 799,666 Makati Development Corporation (Conso) 147,564 147,564 147,564 North Eastern Commercial Corp. 2,436,212 2,436,212 2,436,212 North Triangle Depot Commercial Corp 7,480,926 7,480,926 7,480,926 North Ventures Commercial Corp. 1,053,389 1,053,389 1,053,389 NorthBeacon Commercial Corporation 461,972 461,972 461,972 AREIT, Inc. 91,261 91,261 91,261 Primavera Towncentre, Inc. 105,300 105,300 105,300 Serendra Inc. 103,109 103,109 103,109 Soltea Commercial Corp. 905,506 905,506 905,506 Station Square East Commercial Corp 2,971,969 2,971,969 2,971,969 Subic Bay Town Center Inc. 540,397 540,397 540,397 Summerhill Commercial Ventures Corp. 768,344 768,344 768,344 Ten Knots Philippines, Inc.(Conso) 1,327,851 1,327,851 1,327,851 Westview Commercial Ventures Corp. 183,295 183,295 183,295 Sub-Total 237,930,279 237,930,279 237,930,279
Receivable Balance per ALI-CII
Payable Balance per ALI SUBSIDIARIES
Current Non-Current
Ayala Land, Inc. (ALI) Subsidiries: Amaia Land Corporation (Conso) 1,572,242 1,572,242 1,572,242 Arca South Integrated Terminal, Inc 1,201,493 1,201,493 1,201,493 Arvo Commercial Corporation 1,202,827 1,202,827 1,202,827 Avida Land Corporation (Conso) 764,115 764,115 764,115 AyalaLand Hotels and Resorts Corp. (Conso) 93,129 93,129 93,129 Ayalaland Logistics Holdings Corp. (Conso) 1,514,431 1,514,431 1,514,431 Ayalaland Medical Facilities Leasing Inc. 17,134,393 17,134,393 17,134,393 Bay City Commercial Ventures Corp. 56,448,169 56,448,169 56,448,169 Cagayan De Oro Gateway Corporation 1,514,346 1,514,346 1,514,346 Capitol Central Commercial Ventures Corp. 2,004,246 2,004,246 2,004,246 Cebu Holdings, Inc. (Conso) 13,143,986 13,143,986 13,143,986 Leisure and Allied Industries Phils. Inc. 18,151 18,151 18,151 Soltea Commercial Corp. 18,810,349 18,810,349 18,810,349 Sub-Total 115,421,878 115,421,878 115,421,878 -
Receivable Balance per ALO PRIME REALTY CORP.
Payable Balance per ALI SUBSIDIARIES
Current Non-Current
Ayala Land, Inc. (ALI) Subsidiries: AREIT, Inc. (7,326,316) (7,326,316) (7,326,316)Sub-Total (7,326,316) (7,326,316) (7,326,316) -
Receivable Balance per ALVEO LAND CORP. &
SUBSIDIARIES
Payable Balance per ALI SUBSIDIARIES
Current Non-Current
Ayala Land, Inc. (ALI) Subsidiries: Accendo Commercial Corp 283,924,587 283,924,587 283,924,587 Adauge Commercial Corp. 28,238 28,238 28,238 ALI Capital Corp. (Conso) 15,091,671 15,091,671 15,091,671 ALI Commercial Center, Inc. (Conso) 68,526 68,526 68,526 Alveo Land Corporation (Conso) (1,668,936,549) (1,668,936,549) (1,668,936,549) Amaia Land Corporation (Conso) 150,739,120 150,739,120 150,739,120 Amorsedia Development Corporation (Conso) 96,735,377 96,735,377 96,735,377 Arca South Commercial Ventures Corp. 3,900,681 3,900,681 3,900,681 Arca South Integrated Terminal, Inc 402,487 402,487 402,487 Arvo Commercial Corporation 6,686,486 6,686,486 6,686,486 Aurora Properties, Inc. 104,089,669 104,089,669 104,089,669 Avida Land Corporation (Conso) 4,885,898 4,885,898 4,885,898 Ayala Land International Sales, Inc.(Conso) 9,008,072 9,008,072 9,008,072 Ayala Property Management Corporation (Conso) 2,462,836 2,462,836 2,462,836 AyalaLand Hotels and Resorts Corp. (Conso) 40,226,704 40,226,704 40,226,704 Ayalaland Logistics Holdings Corp. (Conso) 30,806,596 30,806,596 30,806,596 Ayalaland Malls Synergies, Inc. 454,086 454,086 454,086 AyalaLand Malls, Inc. (Conso) 54,613 54,613 54,613 Ayalaland Medical Facilities Leasing Inc. 270,413 270,413 270,413 Bay City Commercial Ventures Corp. 37,455,531 37,455,531 37,455,531
Amount Owed by ALI Subsidiaries to ALI-CII DEVELOPMENT CORP
Amount Owed by ALI Subsidiaries to ALO PRIME REALTY CORP.
Amount Owed by ALI Subsidiaries to ALVEO LAND CORP. & SUBSIDIARIES
Page 6 of 27

BellaVita Land Corp. 907,729,136 907,729,136 907,729,136 BG West Properties, Inc 242,082,075 242,082,075 242,082,075 Cagayan De Oro Gateway Corporation 16,374 16,374 16,374 Capitol Central Commercial Ventures Corp. 6,105,873 6,105,873 6,105,873 Cebu Holdings, Inc. (Conso) 37,458,083 37,458,083 37,458,083 Crans Montana Property Holdings Corporation 1,108,482 1,108,482 1,108,482 Direct Power Services Inc. 12,742 12,742 12,742 Makati Cornerstone Leasing Corp. 7,780 7,780 7,780 Makati Development Corporation (Conso) 17,852,924 17,852,924 17,852,924 North Eastern Commercial Corp. 4,987 4,987 4,987 North Triangle Depot Commercial Corp 48,968 48,968 48,968 Nuevocentro, Inc. (Conso) 431,894,906 431,894,906 431,894,906 Primavera Towncentre, Inc. 321,912 321,912 321,912 Serendra Inc. 65,223,557 65,223,557 65,223,557 Soltea Commercial Corp. 2,329,450 2,329,450 2,329,450 Summerhill Commercial Ventures Corp. 12,436,524 12,436,524 12,436,524 Ten Knots Philippines, Inc.(Conso) 42,536,702 42,536,702 42,536,702 Vesta Property Holdings Inc. 357,210,586 357,210,586 357,210,586 Sub-Total 1,242,736,101 1,242,736,101 1,242,736,101 -
Receivable Balance per AMAIA LAND, INC. &
SUBSIDIARIES
Payable Balance per ALI Subsidiaries
Current Non-Current
Ayala Land, Inc. (ALI) Subsidiries: Alveo Land Corporation (Conso) 150,000 150,000 150,000 Amaia Land Corporation (Conso) 2,367,846 2,367,846 2,367,846 Avida Land Corporation (Conso) 10,997,619 10,997,619 10,997,619 Ayala Property Management Corporation (Conso) (37,946) (37,946) (37,946) BellaVita Land Corp. 94,942,975 94,942,975 94,942,975 Makati Development Corporation (Conso) 2,985,115 2,985,115 2,985,115 Sub-Total 111,405,609 111,405,609 111,405,609 -
Receivable Balance per AMORSEDIA DEVPT. CORP. &
SUBSIDIARIES
Payable Balance per ALI SUBSIDIARIES
Current Non-Current
Ayala Land, Inc. (ALI) Subsidiaries: Amorsedia Development Corporation (Conso) - - - Ayala Land Sales Inc. 472,264 472,264 472,264 Bay City Commercial Ventures Corp. 5,049,416 5,049,416 5,049,416 BellaVita Land Corp. 15,288,000 15,288,000 15,288,000 Cagayan De Oro Gateway Corporation 63,340,455 63,340,455 63,340,455 AREIT, Inc. 7,213,976 7,213,976 7,213,976 Ten Knots Development Corporation(Conso) 5,205 5,205 5,205 Sub-Total 91,369,316 91,369,316 91,369,316 -
Receivable Balance per ANVAYA COVE BEACH
Payable Balance per ALI SUBSIDIARIES Current Non-Current
Ayala Land, Inc. (ALI) Subsidiries: Anvaya Cove Golf and Sports Club Inc. 2,360,936 2,360,936 2,360,936 Ayala Property Management Corporation (Conso) 105,872 105,872 105,872 Makati Development Corporation (Conso) 368,552 368,552 368,552 Sub-Total 2,835,360 2,835,360 2,835,360
Receivable Balance per ANVAYA COVE GOLF
Payable Balance per ALI SUBSIDIARIES Current Non-Current
Ayala Land, Inc. (ALI) Subsidiries: Anvaya Cove Beach and Nature Club Inc 423,927 423,927 423,927 Makati Development Corporation (Conso) 398,008 398,008 398,008 Sub-Total 821,935 821,935 821,935
Receivable Balance per APRISA
Payable Balance per ALI SUBSIDIARIES
Current Non-Current
Ayala Land, Inc. (ALI) Subsidiries: Accendo Commercial Corp 131,466 131,466 131,466 Adauge Commercial Corp. 39,043 39,043 39,043 ALI Commercial Center, Inc. (Conso) 2,455,208 2,455,208 2,455,208
Amount Owed by ALI Subsidiaries to AMAIA LAND, INC. & SUBSIDIARIES
Amount Owed by ALI Subsidiaries to AMORSEDIA DEVPT. CORP. & SUBSIDIARIES
Amount Owed by ALI Subsidiaries to ANVAYA COVE BEACH & NATURE CLUB, INC.
Amount Owed by ALI Subsidiaries to ANVAYA COVE GOLF & NATURE CLUB, INC.
Amount Owed by ALI Subsidiaries to APRISA BUSINESS SOLUTIONS, INC.
Page 7 of 27

ALO Prime Realty Corporation 192,651 192,651 192,651 Amaia Land Corporation (Conso) 1,204,011 1,204,011 1,204,011 Arvo Commercial Corporation 724,186 724,186 724,186 Aurora Properties, Inc. 60,637 60,637 60,637 Aviana Development Corporation 22,098 22,098 22,098 Avida Land Corporation (Conso) 4,618,824 4,618,824 4,618,824 AyalaLand Hotels and Resorts Corp. (Conso) 300,106 300,106 300,106 Ayalaland Logistics Holdings Corp. (Conso) 1,148,631 1,148,631 1,148,631 Bay City Commercial Ventures Corp. 74,870,061 74,870,061 74,870,061 BellaVita Land Corp. 365,747 365,747 365,747 Cagayan De Oro Gateway Corporation 5,782,961 5,782,961 5,782,961 Cavite Commercial Towncenter Inc. 138,542 138,542 138,542 Cebu Holdings, Inc. (Conso) 13,474,429 13,474,429 13,474,429 CECI Realty Corp. 63,123 63,123 63,123 Crans Montana Property Holdings Corporation 7,044,174 7,044,174 7,044,174 Lagdigan Land Corporation 1,736 1,736 1,736 Makati Cornerstone Leasing Corp. 1,319,295 1,319,295 1,319,295 Makati Development Corporation (Conso) 1,581,642 1,581,642 1,581,642 North Eastern Commercial Corp. 1,459,411 1,459,411 1,459,411 North Triangle Depot Commercial Corp 159,113 159,113 159,113 North Ventures Commercial Corp. 408,901 408,901 408,901 NorthBeacon Commercial Corporation 151,816 151,816 151,816 Nuevocentro, Inc. (Conso) 232,340 232,340 232,340 Soltea Commercial Corp. 669,648 669,648 669,648 Subic Bay Town Center Inc. 65,690 65,690 65,690 Summerhill Commercial Ventures Corp. 1,045,372 1,045,372 1,045,372 Ten Knots Philippines, Inc.(Conso) 5,503,548 5,503,548 5,503,548 Vesta Property Holdings Inc. 67,670 67,670 67,670 Sub-Total 125,302,080 125,302,080 125,302,080
Receivable Balance per AREIT FUND MANAGER, INC.
Payable Balance per ALI SUBSIDIARIES
Current Non-Current
Ayala Land, Inc. (ALI) Subsidiries: Accendo Commercial Corp 7,571,042 7,571,042 7,571,042 ALI Commercial Center, Inc. (Conso) 12,108,673 12,108,673 12,108,673 Amaia Land Corporation (Conso) 32,348,254 32,348,254 32,348,254 Amorsedia Development Corporation (Conso) 25,656,860 25,656,860 25,656,860 Arca South Commercial Ventures Corp. 2,902,079 2,902,079 2,902,079 AyalaLand Hotels and Resorts Corp. (Conso) 19,850,000 19,850,000 19,850,000 Ayalaland Logistics Holdings Corp. (Conso) 35,066,840 35,066,840 35,066,840 Cagayan De Oro Gateway Corporation 10,903,293 10,903,293 10,903,293 Capitol Central Commercial Ventures Corp. 2,029,127 2,029,127 2,029,127 Cebu Holdings, Inc. (Conso) 63,384,509 63,384,509 63,384,509 Crans Montana Property Holdings Corporation 32,791,240 32,791,240 32,791,240 Direct Power Services Inc. 36,516 36,516 36,516 AREIT, Inc. 37,373,124 37,373,124 37,373,124 Soltea Commercial Corp. 25,543,093 25,543,093 25,543,093 Ten Knots Philippines, Inc.(Conso) 18,023 18,023 18,023 Sub-Total 307,582,672 307,582,672 307,582,672
Receivable Balance per AREIT PROPERTY MANAGER,
INC.
Payable Balance per ALI SUBSIDIARIES
Current Non-Current
Ayala Land, Inc. (ALI) Subsidiries: AREIT, Inc. 28,598,120 28,598,120 28,598,120 Sub-Total 28,598,120 28,598,120 28,598,120
Receivable Balance per AREIT, INC.
Payable Balance per ALI SUBSIDIARIES
Current Non-Current
Ayala Land, Inc. (ALI) Subsidiries: Accendo Commercial Corp 11,930 11,930 11,930 ALI Capital Corp. (Conso) 2,550,667 2,550,667 2,550,667 ALI Commercial Center, Inc. (Conso) 15,022,155 15,022,155 15,022,155 Alveo Land Corporation (Conso) 33,114 33,114 33,114 Amaia Land Corporation (Conso) 2,030,502 2,030,502 2,030,502 Amorsedia Development Corporation (Conso) 24,393,442 24,393,442 24,393,442 Arca South Commercial Ventures Corp. 118,928,479 118,928,479 118,928,479
Amount Owed by ALI Subsidiaries to AREIT, INC.
Amount Owed by ALI Subsidiaries to AREIT PROPERTY MANAGER, INC.
Amount Owed by ALI Subsidiaries to AREIT FUND MANAGER, INC.
Page 8 of 27

Arvo Commercial Corporation 205,762,016 205,762,016 205,762,016 Ayala Property Management Corporation (Conso) 561,175 561,175 561,175 AyalaLand Hotels and Resorts Corp. (Conso) 2,402,164,501 2,402,164,501 2,402,164,501 Ayalaland Logistics Holdings Corp. (Conso) 103,238,318 103,238,318 103,238,318 Ayalaland Malls Synergies, Inc. 2,507,137 2,507,137 2,507,137 AyalaLand Offices, Inc. (Conso) 8,432,222 8,432,222 8,432,222 Bay City Commercial Ventures Corp. 22,539,460 22,539,460 22,539,460 BellaVita Land Corp. 39,830 39,830 39,830 Cagayan De Oro Gateway Corporation 26,479,453 26,479,453 26,479,453 Capitol Central Commercial Ventures Corp. 88,744,234 88,744,234 88,744,234 Cavite Commercial Towncenter Inc. 25,607,965 25,607,965 25,607,965 Cebu Holdings, Inc. (Conso) 390,127,085 390,127,085 390,127,085 Crans Montana Property Holdings Corporation 117,088,223 117,088,223 117,088,223 Hillsford Property Corporation 10,009,511 10,009,511 10,009,511 Leisure and Allied Industries Phils. Inc. 20,050,000 20,050,000 20,050,000 Nuevocentro, Inc. (Conso) 11,072,450 11,072,450 11,072,450 Soltea Commercial Corp. 59,689,408 59,689,408 59,689,408 Sunnyfield E-Office Corp 150 150 150 Ten Knots Philippines, Inc.(Conso) 121,237,212 121,237,212 121,237,212 Westview Commercial Ventures Corp. 1,816,394 1,816,394 1,816,394 Sub-Total 3,780,137,034 3,780,137,034 3,780,137,034
Receivable Balance per ARVO COMMERCIAL CORP.
Payable Balance per ALI SUBSIDIARIES
Current Non-Current
Ayala Land, Inc. (ALI) Subsidiries: Alabang Commercial Corporation (Conso) 1,860 1,860 1,860 ALI Commercial Center, Inc. (Conso) 35,590 35,590 35,590 Cavite Commercial Towncenter Inc. 168,114 168,114 168,114 Leisure and Allied Industries Phils. Inc. 1,300,314 1,300,314 1,300,314 North Triangle Depot Commercial Corp 6,520 6,520 6,520 Primavera Towncentre, Inc. 308,275 308,275 308,275 Soltea Commercial Corp. 13,450 13,450 13,450 Station Square East Commercial Corp 1,670 1,670 1,670 Sub-Total 1,835,793 1,835,793 1,835,793
Receivable Balance per AURORA PROPERTIES, INC.
Payable Balance per ALI SUBSIDIARIES
Current Non-Current
Ayala Land, Inc. (ALI) Subsidiries: ALI Capital Corp. (Conso) 559,161 559,161 559,161 Alveo Land Corporation (Conso) 1,003,294 1,003,294 1,003,294 Amaia Land Corporation (Conso) 25,000 25,000 25,000 Amorsedia Development Corporation (Conso) 129,857,980 129,857,980 129,857,980 Arca South Commercial Ventures Corp. 3,809,405 3,809,405 3,809,405 Arvo Commercial Corporation 21,148,801 21,148,801 21,148,801 Avida Land Corporation (Conso) 8,896,669 8,896,669 8,896,669 AyalaLand Hotels and Resorts Corp. (Conso) 6,794,937 6,794,937 6,794,937 Ayalaland Metro North, Inc. 871 871 871 Bay City Commercial Ventures Corp. 94,021 94,021 94,021 Cagayan De Oro Gateway Corporation 18,412,867 18,412,867 18,412,867 Cavite Commercial Towncenter Inc. 637,669 637,669 637,669 CECI Realty Corp. 167,851 167,851 167,851 Crans Montana Property Holdings Corporation 10,037,500 10,037,500 10,037,500 Makati Development Corporation (Conso) 7,680 7,680 7,680 Nuevocentro, Inc. (Conso) 53,868,547 53,868,547 53,868,547 Soltea Commercial Corp. 11,010,774 11,010,774 11,010,774 Summerhill Commercial Ventures Corp. 5,300,456 5,300,456 5,300,456 Ten Knots Development Corporation(Conso) 726 726 726 Vesta Property Holdings Inc. 27,739 27,739 27,739 Sub-Total 271,661,946 271,661,946 271,661,946
Receivable Balance per AVIANA DEVELOPMENT
CORP.
Payable Balance per ALI SUBSIDIARIES
Current Non-Current
Ayala Land, Inc. (ALI) Subsidiries: Alveo Land Corporation (Conso) 403,644,975 403,644,975 403,644,975 Sub-Total 403,644,975 403,644,975 403,644,975
Amount Owed by ALI Subsidiaries to ARVO COMMERCIAL CORP.
Amount Owed by ALI Subsidiaries to AURORA PROPERTIES, INC.
Amount Owed by ALI Subsidiaries to AVIANA DEVELOPMENT CORP.
Amount Owed by ALI Subsidiaries to AVIDA LAND CORP. & SUBSIDIARIES
Page 9 of 27

Receivable Balance per AVIDA LAND CORP. &
SUBSIDIARIES
Payable Balance per ALI SUBSIDIARIES
Current Non-Current
Ayala Land, Inc. (ALI) Subsidiries: Accendo Commercial Corp 123,879,478 123,879,478 123,879,478 ALI Capital Corp. (Conso) 1,499,977 1,499,977 1,499,977 ALI-CII Development Corporation 75,000 75,000 75,000 Alveo Land Corporation (Conso) 32,035,194 32,035,194 32,035,194 Amaia Land Corporation (Conso) 105,206,103 105,206,103 105,206,103 Amorsedia Development Corporation (Conso) 443,199,340 443,199,340 443,199,340 Arca South Commercial Ventures Corp. 22,588,798 22,588,798 22,588,798 Arvo Commercial Corporation 27,176,272 27,176,272 27,176,272 Aurora Properties, Inc. 38,953,608 38,953,608 38,953,608 Aviana Development Corporation 55,000 55,000 55,000 Avida Land Corporation (Conso) 26,508,607 26,508,607 26,508,607 Ayala Hotels Inc. 25,702 25,702 25,702 Ayala Land International Sales, Inc.(Conso) 12,517,676 12,517,676 12,517,676 Ayala Property Management Corporation (Conso) 8,427,240 8,427,240 8,427,240 Ayala Theaters Management, Inc. 69,503 69,503 69,503 Ayalaland Estates, Inc. 328,898,856 328,898,856 328,898,856 AyalaLand Hotels and Resorts Corp. (Conso) 314,877 314,877 314,877 Ayalaland Logistics Holdings Corp. (Conso) 154,862,171 154,862,171 154,862,171 Ayalaland Malls Synergies, Inc. 242,413 242,413 242,413 Bay City Commercial Ventures Corp. 6,141,701 6,141,701 6,141,701 BellaVita Land Corp. 339,083,997 339,083,997 339,083,997 BG West Properties, Inc 1,200,226,411 1,200,226,411 1,200,226,411 Cagayan De Oro Gateway Corporation 415,001,205 415,001,205 415,001,205 Cebu Holdings, Inc. (Conso) 44,563,114 44,563,114 44,563,114 CECI Realty Corp. 112,000 112,000 112,000 Crans Montana Property Holdings Corporation 19,239 19,239 19,239 Makati Development Corporation (Conso) 15,703,446 15,703,446 15,703,446 Nuevocentro, Inc. (Conso) 340,478,284 340,478,284 340,478,284 Roxas Land Corp. 242,508 242,508 242,508 Serendra Inc. 2,498,773 2,498,773 2,498,773 Soltea Commercial Corp. 2,191 2,191 2,191 Station Square East Commercial Corp 420,337 420,337 420,337 Summerhill Commercial Ventures Corp. 41,319 41,319 41,319 Ten Knots Philippines, Inc.(Conso) 30,106,648 30,106,648 30,106,648 Vesta Property Holdings Inc. 16,868 16,868 16,868 Sub-Total 3,721,193,858 3,721,193,858 3,721,193,858 -
Receivable Balance per AHI Payable Balance per ALI SUBSIDIARIES
Current Non-Current
Ayala Land, Inc. (ALI) Subsidiries: Accendo Commercial Corp 164,570 164,570 164,570 ALI Capital Corp. (Conso) 63,733,181 63,733,181 63,733,181 ALI Commercial Center, Inc. (Conso) 38,618 38,618 38,618 Alveo Land Corporation (Conso) 18,258 18,258 18,258 Amaia Land Corporation (Conso) 361,784,964 361,784,964 361,784,964 Amorsedia Development Corporation (Conso) 72,418,125 72,418,125 72,418,125 Arca South Commercial Ventures Corp. 133,478,660 133,478,660 133,478,660 Arca South Integrated Terminal, Inc 1,002,800 1,002,800 1,002,800 Arvo Commercial Corporation 182,627,058 182,627,058 182,627,058 Avida Land Corporation (Conso) 2,152,829 2,152,829 2,152,829 Ayala Land International Sales, Inc.(Conso) 4,500,000 4,500,000 4,500,000 AyalaLand Hotels and Resorts Corp. (Conso) 386,716,050 386,716,050 386,716,050 Ayalaland Logistics Holdings Corp. (Conso) 193,192,342 193,192,342 193,192,342 Ayalaland Medical Facilities Leasing Inc. 71,072,508 71,072,508 71,072,508 Ayalaland Metro North, Inc. 198,822 198,822 198,822 Bay City Commercial Ventures Corp. 331,815,652 331,815,652 331,815,652 Cagayan De Oro Gateway Corporation 274,581,637 274,581,637 274,581,637 Capitol Central Commercial Ventures Corp. 67,787,812 67,787,812 67,787,812 Cavite Commercial Towncenter Inc. 131,072,537 131,072,537 131,072,537 Cebu Holdings, Inc. (Conso) 294,995,142 294,995,142 294,995,142 Crans Montana Property Holdings Corporation 153,607,627 153,607,627 153,607,627 North Triangle Depot Commercial Corp 24,959 24,959 24,959 Nuevocentro, Inc. (Conso) 8,746,092 8,746,092 8,746,092 Primavera Towncentre, Inc. 47,334,065 47,334,065 47,334,065 Soltea Commercial Corp. 23,640,093 23,640,093 23,640,093 Summerhill Commercial Ventures Corp. 7,348,017 7,348,017 7,348,017
Amount Owed by ALI Subsidiaries to AYALA HOTELS, INC.
Page 10 of 27

Ten Knots Development Corporation(Conso) 16,117 16,117 16,117 Ten Knots Philippines, Inc.(Conso) 61,631,191 61,631,191 61,631,191 Sub-Total 2,875,699,725 2,875,699,725 2,875,699,725
Receivable Balance per ALISI & SUBSIDIARIES
Payable Balance per ALI SUBSIDIARIES
Current Non-Current
Ayala Land, Inc. (ALI) Subsidiries: Alveo Land Corporation (Conso) 49,637,690 49,637,690 49,637,690 Amaia Land Corporation (Conso) 22,374,347 22,374,347 22,374,347 Amorsedia Development Corporation (Conso) 350,771 350,771 350,771 Arca South Commercial Ventures Corp. 13,731,788 13,731,788 13,731,788 Avida Land Corporation (Conso) 119,467,795 119,467,795 119,467,795 AyalaLand Hotels and Resorts Corp. (Conso) 4,734,498 4,734,498 4,734,498 BellaVita Land Corp. 1,516,186 1,516,186 1,516,186 Cebu Holdings, Inc. (Conso) (507,452) (507,452) (507,452) Crans Montana Property Holdings Corporation 4,039,464 4,039,464 4,039,464 Nuevocentro, Inc. (Conso) 18,613 18,613 18,613 Sub-Total 215,363,701 215,363,701 215,363,701
Receivable Balance per ALSI Payable Balance per ALI Subsidiaries
Current Non-Current
Ayala Land, Inc. (ALI) Subsidiries: Alveo Land Corporation (Conso) 6,222,868 6,222,868 6,222,868 Amaia Land Corporation (Conso) 11,706,631 11,706,631 11,706,631 Amorsedia Development Corporation (Conso) 18,153,604 18,153,604 18,153,604 Aviana Development Corporation (154,252) (154,252) (154,252) Avida Land Corporation (Conso) 4,120,463 4,120,463 4,120,463 Ayalaland Estates, Inc. 3,753,909 3,753,909 3,753,909 AyalaLand Hotels and Resorts Corp. (Conso) 104,271 104,271 104,271 Bay City Commercial Ventures Corp. 21,454,246 21,454,246 21,454,246 BellaVita Land Corp. 52,832 52,832 52,832 Cavite Commercial Towncenter Inc. 5,022,618 5,022,618 5,022,618 Cebu Holdings, Inc. (Conso) 12,018,333 12,018,333 12,018,333 Nuevocentro, Inc. (Conso) 474,686 474,686 474,686 Roxas Land Corp. 482,666 482,666 482,666 Soltea Commercial Corp. 31,618,231 31,618,231 31,618,231 Ten Knots Philippines, Inc.(Conso) 6,712,830 6,712,830 6,712,830 Sub-Total 121,743,936 121,743,936 121,743,936
Receivable Balance per APMC & SUBSIDIARIES
Payable Balance per ALI SUBSIDIARIES Current Non-Current
Ayala Land, Inc. (ALI) Subsidiries: Accendo Commercial Corp 6,367,208 6,367,208 6,367,208 Adauge Commercial Corp. 352,294 352,294 352,294 ALI Capital Corp. (Conso) 64,773 64,773 64,773 ALI Commercial Center, Inc. (Conso) 12,690,599 12,690,599 12,690,599 Alveo Land Corporation (Conso) 14,675,556 14,675,556 14,675,556 Amaia Land Corporation (Conso) 130,187,837 130,187,837 130,187,837 Amorsedia Development Corporation (Conso) 40,187,820 40,187,820 40,187,820 APRISA Business Process Solutions, Inc 2,917,203 2,917,203 2,917,203 Arvo Commercial Corporation 10,872,775 10,872,775 10,872,775 Aurora Properties, Inc. 76,380 76,380 76,380 Avida Land Corporation (Conso) 29,081,462 29,081,462 29,081,462 Ayala Hotels Inc. 1,430,717 1,430,717 1,430,717 Ayala Land International Sales, Inc.(Conso) 144,000 144,000 144,000 Ayalaland Estates, Inc. 192,495 192,495 192,495 AyalaLand Hotels and Resorts Corp. (Conso) 27,522,437 27,522,437 27,522,437 Ayalaland Logistics Holdings Corp. (Conso) 11,987,653 11,987,653 11,987,653 Ayalaland Medical Facilities Leasing Inc. 2,464,000 2,464,000 2,464,000 Ayalaland Metro North, Inc. 182,326 182,326 182,326 AyalaLand Offices, Inc. (Conso) 2,669,470 2,669,470 2,669,470 Bay City Commercial Ventures Corp. 2,766,859 2,766,859 2,766,859 BellaVita Land Corp. 33,546 33,546 33,546 BG West Properties, Inc 2,592,342 2,592,342 2,592,342 Cagayan De Oro Gateway Corporation 58,742,380 58,742,380 58,742,380 Capitol Central Commercial Ventures Corp. 132,634 132,634 132,634 Cavite Commercial Towncenter Inc. 187,326 187,326 187,326 Cebu Holdings, Inc. (Conso) 93,619,402 93,619,402 93,619,402
Amount Owed by ALI Subsidiaries to AYALA LAND INTERNATIONAL SALES, INC. & SUBS.
Amount Owed by ALI Subsidiaries to AYALA LAND SALES, INC.
Amount Owed by ALI Subsidiaries to AYALA PROPERTY MANAGEMENT CORP. & Subsidiaries
Page 11 of 27

CECI Realty Corp. 145,830 145,830 145,830 Crans Montana Property Holdings Corporation 122,386,835 122,386,835 122,386,835 Hillsford Property Corporation 43,496 43,496 43,496 Leisure and Allied Industries Phils. Inc. 60,156,250 60,156,250 60,156,250 Makati Cornerstone Leasing Corp. 2,360,981 2,360,981 2,360,981 Makati Development Corporation (Conso) 627,200 627,200 627,200 North Eastern Commercial Corp. 2,682,444 2,682,444 2,682,444 North Triangle Depot Commercial Corp 182,326 182,326 182,326 North Ventures Commercial Corp. 13,536,627 13,536,627 13,536,627 NorthBeacon Commercial Corporation 187,704 187,704 187,704 Nuevocentro, Inc. (Conso) 3,296,537 3,296,537 3,296,537 AREIT, Inc. 19,771,482 19,771,482 19,771,482 Philippine Integrated Energy Solutions, Inc. 90,589,509 90,589,509 90,589,509 Roxas Land Corp. 5,403,834 5,403,834 5,403,834 Serendra Inc. 17,836,281 17,836,281 17,836,281 Soltea Commercial Corp. 9,498,666 9,498,666 9,498,666 Southportal Properties, Inc. 4,625,911 4,625,911 4,625,911 Subic Bay Town Center Inc. 136,744 136,744 136,744 Summerhill Commercial Ventures Corp. 254,949 254,949 254,949 Sunnyfield E-Office Corp 750,134 750,134 750,134 Ten Knots Philippines, Inc.(Conso) 23,730,521 23,730,521 23,730,521 Vesta Property Holdings Inc. 502,807 502,807 502,807 Sub-Total 830,848,562 830,848,562 830,848,562 -
Receivable Balance per ATMI Payable Balance per ALI Subsidiaries
Current Non-Current
Ayala Land, Inc. (ALI) Subsidiries: Accendo Commercial Corp 127 127 127 ALI Commercial Center, Inc. (Conso) 3,000 3,000 3,000 AyalaLand Malls, Inc. (Conso) 7,993 7,993 7,993 Bay City Commercial Ventures Corp. 49,610 49,610 49,610 Cagayan De Oro Gateway Corporation 205 205 205 Cebu Holdings, Inc. (Conso) 880 880 880 Makati Cornerstone Leasing Corp. (1,000) (1,000) (1,000) North Eastern Commercial Corp. 159,936 159,936 159,936 North Ventures Commercial Corp. 89,992 89,992 89,992 NorthBeacon Commercial Corporation 44,464 44,464 44,464 Summerhill Commercial Ventures Corp. 44,800 44,800 44,800 Sub-Total 400,007 400,007 400,007 -
Receivable Balance per ACMI Payable Balance per ALI SUBSIDIARIES
Current Non-Current
Ayala Land, Inc. (ALI) Subsidiries: Anvaya Cove Beach and Nature Club Inc 8,431,242 8,431,242 8,431,242 Anvaya Cove Golf and Sports Club Inc. 5,361,353 5,361,353 5,361,353 APRISA Business Process Solutions, Inc 4,500 4,500 4,500 Ayala Land Sales Inc. 99,000 99,000 99,000 Ayalaland Estates, Inc. 73,500 73,500 73,500 AyalaLand Malls, Inc. (Conso) 500 500 500 AyalaLand Offices, Inc. (Conso) 1,500 1,500 1,500 Ayalaland Premier, Inc. 319,500 319,500 319,500 Nuevocentro, Inc. (Conso) 2,469,000 2,469,000 2,469,000 Sub-Total 16,760,095 16,760,095 16,760,095 -
Receivable Balance per AEI Payable Balance per ALI Subsidiaries
Current Non-Current
Ayala Land, Inc. (ALI) Subsidiries: ALI Capital Corp. (Conso) 169,582 169,582 169,582 ALI Commercial Center, Inc. (Conso) 55,401,807 55,401,807 55,401,807 Altaraza Development Corporation 750,000 750,000 750,000 Amorsedia Development Corporation (Conso) 38,148,730 38,148,730 38,148,730 Arca South Commercial Ventures Corp. 2,003,208 2,003,208 2,003,208 Arvo Commercial Corporation 3,756,915 3,756,915 3,756,915 Avida Land Corporation (Conso) 15,032 15,032 15,032 AyalaLand Hotels and Resorts Corp. (Conso) 838,433 838,433 838,433 Bay City Commercial Ventures Corp. 24,785,782 24,785,782 24,785,782 Cagayan De Oro Gateway Corporation 57,381 57,381 57,381 Cebu Holdings, Inc. (Conso) 7,001,866 7,001,866 7,001,866
Amount Owed by ALI Subsidiaries to AYALALAND ESTATES, INC.
Amount Owed by ALI Subsidiaries to AYALA THEATERS MANAGEMENT, INC.
Amount Owed by ALI Subsidiaries to AYALALAND CLUB MANAGEMENT, INC.
Page 12 of 27

CECI Realty Corp. 8,092 8,092 8,092 CMPI Holdings, Inc (Conso) 67,760 67,760 67,760 Crans Montana Property Holdings Corporation 32,781,171 32,781,171 32,781,171 Leisure and Allied Industries Phils. Inc. 16,842,000 16,842,000 16,842,000 Makati Development Corporation (Conso) 53,150 53,150 53,150 North Eastern Commercial Corp. 46,192,647 46,192,647 46,192,647 Nuevocentro, Inc. (Conso) 208,444,323 208,444,323 208,444,323 Soltea Commercial Corp. 455,349 455,349 455,349 Vesta Property Holdings Inc. 7,416 7,416 7,416 Sub-Total 437,780,646 437,780,646 437,780,646
Receivable Balance per AHRC & SUBSIDIARIES
Payable Balance per ALI SUBSIDIARIES
Current Non-Current
Ayala Land, Inc. (ALI) Subsidiries: Accendo Commercial Corp 7,000 7,000 7,000 Ayala Hotels Inc. 362 362 362 Ayala Property Management Corporation (Conso) 370,404 370,404 370,404 AyalaLand Hotels and Resorts Corp. (Conso) 167 167 167 AyalaLand Malls, Inc. (Conso) 2,946 2,946 2,946 AyalaLand Offices, Inc. (Conso) 3,030 3,030 3,030 BellaVita Land Corp. 427 427 427 Cebu Holdings, Inc. (Conso) 2,129,747 2,129,747 2,129,747 Integrated Eco-Resort Inc. 29,568 29,568 29,568 Makati Development Corporation (Conso) 4,553 4,553 4,553 Ten Knots Development Corporation(Conso) 16,874,771 16,874,771 16,874,771 Ten Knots Philippines, Inc.(Conso) 12,768,462 12,768,462 12,768,462 Sub-Total 32,191,436 32,191,436 32,191,436 -
Receivable Balance per ALLHC & SUBSIDIARIES
Payable Balance per ALI SUBSIDIARIES
Current Non-Current
Ayala Land, Inc. (ALI) Subsidiries: Accendo Commercial Corp 6,056,282 6,056,282 6,056,282 Alabang Commercial Corporation (Conso) 35,390 35,390 35,390 ALI Capital Corp. (Conso) 34,302,096 34,302,096 34,302,096 ALI Commercial Center, Inc. (Conso) 7,674,031 7,674,031 7,674,031 Amaia Land Corporation (Conso) 21,877,777 21,877,777 21,877,777 Amorsedia Development Corporation (Conso) 12,570,513 12,570,513 12,570,513 Arca South Commercial Ventures Corp. 815,744 815,744 815,744 Arvo Commercial Corporation 14,469,867 14,469,867 14,469,867 Avida Land Corporation (Conso) 17,663,368 17,663,368 17,663,368 Ayala Property Management Corporation (Conso) 1,233 1,233 1,233 AyalaLand Hotels and Resorts Corp. (Conso) 4,570,979 4,570,979 4,570,979 Ayalaland Malls Synergies, Inc. 193,837 193,837 193,837 Ayalaland Metro North, Inc. 6,021,883 6,021,883 6,021,883 Bay City Commercial Ventures Corp. 108,887,038 108,887,038 108,887,038 BellaVita Land Corp. 5,015,233 5,015,233 5,015,233 Cagayan De Oro Gateway Corporation 15,336,897 15,336,897 15,336,897 Capitol Central Commercial Ventures Corp. 79,308,973 79,308,973 79,308,973 Cavite Commercial Towncenter Inc. 10,159,952 10,159,952 10,159,952 Cebu Holdings, Inc. (Conso) 14,713,208 14,713,208 14,713,208 Crans Montana Property Holdings Corporation 1,004,411 1,004,411 1,004,411 Leisure and Allied Industries Phils. Inc. (50,600) (50,600) (50,600) Makati Development Corporation (Conso) 62,727 62,727 62,727 North Eastern Commercial Corp. (738,135) (738,135) (738,135) North Triangle Depot Commercial Corp 500 500 500 North Ventures Commercial Corp. 356,417 356,417 356,417 Nuevocentro, Inc. (Conso) 1,649,123 1,649,123 1,649,123 Soltea Commercial Corp. 6,430,586 6,430,586 6,430,586 Station Square East Commercial Corp 400 400 400 Summerhill Commercial Ventures Corp. 56,224 56,224 56,224 Ten Knots Philippines, Inc.(Conso) 38,005 38,005 38,005 Sub-Total 368,483,959 368,483,959 368,483,959
Receivable Balance per AMSI Payable Balance per ALI SUBSIDIARIES
Current Non-Current
Ayala Land, Inc. (ALI) Subsidiries: Arca South Commercial Ventures Corp. 4,121,354 4,121,354 4,121,354 AREIT Fund Manager, Inc. 345 345 345
Amount Owed by ALI Subsidiaries to AYALA HOTELS & RESORTS GROUP
Amount Owed by ALI Subsidiaries to AYALALAND LOGISTICS HOLDINGS CORP. (Conso)
Amount Owed by ALI Subsidiaries to AYALALAND MALLS SYNERGIES, INC.
Page 13 of 27
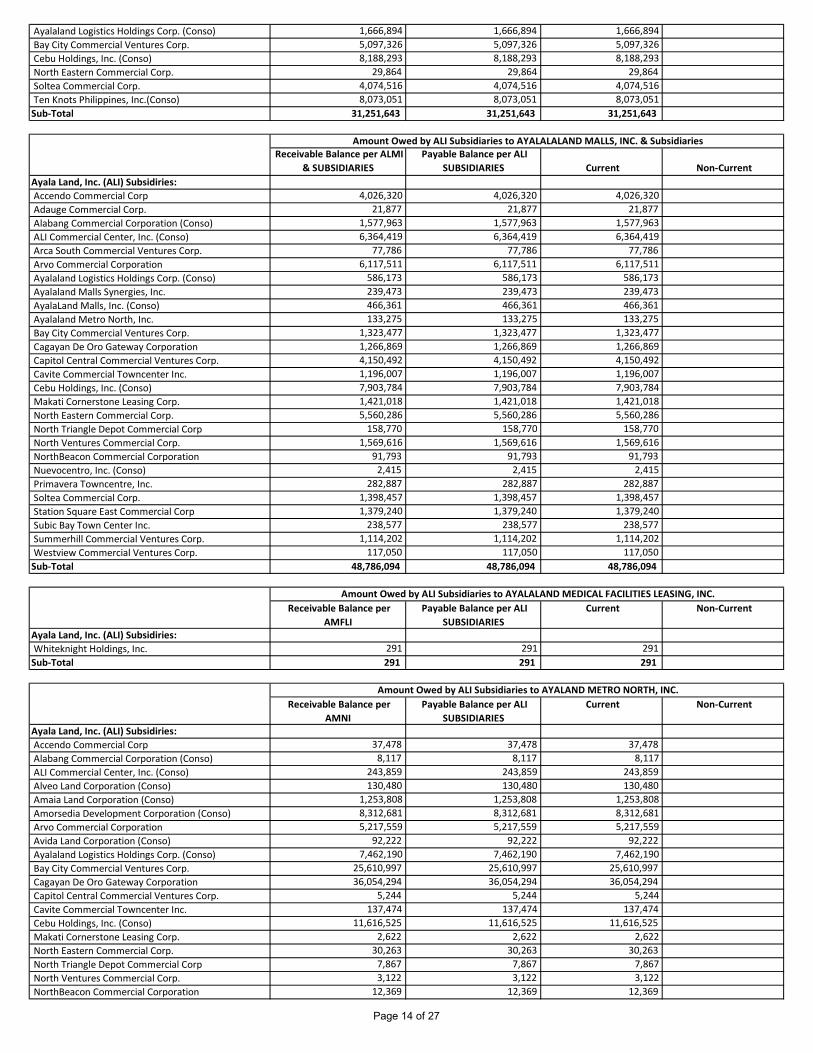
Ayalaland Logistics Holdings Corp. (Conso) 1,666,894 1,666,894 1,666,894 Bay City Commercial Ventures Corp. 5,097,326 5,097,326 5,097,326 Cebu Holdings, Inc. (Conso) 8,188,293 8,188,293 8,188,293 North Eastern Commercial Corp. 29,864 29,864 29,864 Soltea Commercial Corp. 4,074,516 4,074,516 4,074,516 Ten Knots Philippines, Inc.(Conso) 8,073,051 8,073,051 8,073,051 Sub-Total 31,251,643 31,251,643 31,251,643
Receivable Balance per ALMI & SUBSIDIARIES
Payable Balance per ALI SUBSIDIARIES Current Non-Current
Ayala Land, Inc. (ALI) Subsidiries: Accendo Commercial Corp 4,026,320 4,026,320 4,026,320 Adauge Commercial Corp. 21,877 21,877 21,877 Alabang Commercial Corporation (Conso) 1,577,963 1,577,963 1,577,963 ALI Commercial Center, Inc. (Conso) 6,364,419 6,364,419 6,364,419 Arca South Commercial Ventures Corp. 77,786 77,786 77,786 Arvo Commercial Corporation 6,117,511 6,117,511 6,117,511 Ayalaland Logistics Holdings Corp. (Conso) 586,173 586,173 586,173 Ayalaland Malls Synergies, Inc. 239,473 239,473 239,473 AyalaLand Malls, Inc. (Conso) 466,361 466,361 466,361 Ayalaland Metro North, Inc. 133,275 133,275 133,275 Bay City Commercial Ventures Corp. 1,323,477 1,323,477 1,323,477 Cagayan De Oro Gateway Corporation 1,266,869 1,266,869 1,266,869 Capitol Central Commercial Ventures Corp. 4,150,492 4,150,492 4,150,492 Cavite Commercial Towncenter Inc. 1,196,007 1,196,007 1,196,007 Cebu Holdings, Inc. (Conso) 7,903,784 7,903,784 7,903,784 Makati Cornerstone Leasing Corp. 1,421,018 1,421,018 1,421,018 North Eastern Commercial Corp. 5,560,286 5,560,286 5,560,286 North Triangle Depot Commercial Corp 158,770 158,770 158,770 North Ventures Commercial Corp. 1,569,616 1,569,616 1,569,616 NorthBeacon Commercial Corporation 91,793 91,793 91,793 Nuevocentro, Inc. (Conso) 2,415 2,415 2,415 Primavera Towncentre, Inc. 282,887 282,887 282,887 Soltea Commercial Corp. 1,398,457 1,398,457 1,398,457 Station Square East Commercial Corp 1,379,240 1,379,240 1,379,240 Subic Bay Town Center Inc. 238,577 238,577 238,577 Summerhill Commercial Ventures Corp. 1,114,202 1,114,202 1,114,202 Westview Commercial Ventures Corp. 117,050 117,050 117,050 Sub-Total 48,786,094 48,786,094 48,786,094
Receivable Balance per AMFLI
Payable Balance per ALI SUBSIDIARIES
Current Non-Current
Ayala Land, Inc. (ALI) Subsidiries: Whiteknight Holdings, Inc. 291 291 291 Sub-Total 291 291 291
Receivable Balance per AMNI
Payable Balance per ALI SUBSIDIARIES
Current Non-Current
Ayala Land, Inc. (ALI) Subsidiries: Accendo Commercial Corp 37,478 37,478 37,478 Alabang Commercial Corporation (Conso) 8,117 8,117 8,117 ALI Commercial Center, Inc. (Conso) 243,859 243,859 243,859 Alveo Land Corporation (Conso) 130,480 130,480 130,480 Amaia Land Corporation (Conso) 1,253,808 1,253,808 1,253,808 Amorsedia Development Corporation (Conso) 8,312,681 8,312,681 8,312,681 Arvo Commercial Corporation 5,217,559 5,217,559 5,217,559 Avida Land Corporation (Conso) 92,222 92,222 92,222 Ayalaland Logistics Holdings Corp. (Conso) 7,462,190 7,462,190 7,462,190 Bay City Commercial Ventures Corp. 25,610,997 25,610,997 25,610,997 Cagayan De Oro Gateway Corporation 36,054,294 36,054,294 36,054,294 Capitol Central Commercial Ventures Corp. 5,244 5,244 5,244 Cavite Commercial Towncenter Inc. 137,474 137,474 137,474 Cebu Holdings, Inc. (Conso) 11,616,525 11,616,525 11,616,525 Makati Cornerstone Leasing Corp. 2,622 2,622 2,622 North Eastern Commercial Corp. 30,263 30,263 30,263 North Triangle Depot Commercial Corp 7,867 7,867 7,867 North Ventures Commercial Corp. 3,122 3,122 3,122 NorthBeacon Commercial Corporation 12,369 12,369 12,369
Amount Owed by ALI Subsidiaries to AYALALALAND MALLS, INC. & Subsidiaries
Amount Owed by ALI Subsidiaries to AYALALAND MEDICAL FACILITIES LEASING, INC.
Amount Owed by ALI Subsidiaries to AYALAND METRO NORTH, INC.
Page 14 of 27

Nuevocentro, Inc. (Conso) 147,386 147,386 147,386 Soltea Commercial Corp. 10,753,821 10,753,821 10,753,821 Station Square East Commercial Corp 10,707 10,707 10,707 Subic Bay Town Center Inc. 5,244 5,244 5,244 Summerhill Commercial Ventures Corp. 7,867 7,867 7,867 Ten Knots Philippines, Inc.(Conso) 12,027,360 12,027,360 12,027,360 Sub-Total 119,191,556 119,191,556 119,191,556 -
Receivable Balance per ALO & SUBSIDIARIES
Payable Balance per ALI SUBSIDIARIES
Current Non-Current
Ayala Land, Inc. (ALI) Subsidiries: Accendo Commercial Corp 470,980 470,980 470,980 Alabang Commercial Corporation (Conso) 79,262 79,262 79,262 ALI Capital Corp. (Conso) 7,654,409 7,654,409 7,654,409 ALI Commercial Center, Inc. (Conso) 25,789 25,789 25,789 ALO Prime Realty Corporation 3,020,501 3,020,501 3,020,501 Amaia Land Corporation (Conso) 97,720,188 97,720,188 97,720,188 Amorsedia Development Corporation (Conso) 325,528,530 325,528,530 325,528,530 Arca South Commercial Ventures Corp. 100,638 100,638 100,638 Arca South Integrated Terminal, Inc 2,506,999 2,506,999 2,506,999 Arvo Commercial Corporation (21,194,305) (21,194,305) (21,194,305) Avida Land Corporation (Conso) 1,762,451 1,762,451 1,762,451 Ayala Property Management Corporation (Conso) 555,088 555,088 555,088 Ayalaland Estates, Inc. (0) (0) (0) AyalaLand Hotels and Resorts Corp. (Conso) 46,808,856 46,808,856 46,808,856 Ayalaland Logistics Holdings Corp. (Conso) 94,296,363 94,296,363 94,296,363 Ayalaland Metro North, Inc. 269,993 269,993 269,993 AyalaLand Offices, Inc. (Conso) 62,662,682 62,662,682 62,662,682 Bay City Commercial Ventures Corp. 43,920,376 43,920,376 43,920,376 BellaVita Land Corp. 31,323 31,323 31,323 Cagayan De Oro Gateway Corporation 27,624,101 27,624,101 27,624,101 Capitol Central Commercial Ventures Corp. 26,422,229 26,422,229 26,422,229 Cebu Holdings, Inc. (Conso) 461,448,622 461,448,622 461,448,622 CECI Realty Corp. 5,008,433 5,008,433 5,008,433 Crans Montana Property Holdings Corporation 73,711,182 73,711,182 73,711,182 Direct Power Services Inc. 28,234 28,234 28,234 Hillsford Property Corporation 373,841 373,841 373,841 Makati Cornerstone Leasing Corp. 3,383,552 3,383,552 3,383,552 Makati Development Corporation (Conso) 560,464 560,464 560,464 North Eastern Commercial Corp. 3,627,573 3,627,573 3,627,573 North Ventures Commercial Corp. 129,848 129,848 129,848 Nuevocentro, Inc. (Conso) 4,013,317 4,013,317 4,013,317 AREIT, Inc. 5,868,325 5,868,325 5,868,325 Soltea Commercial Corp. 6,497,627 6,497,627 6,497,627 Sunnyfield E-Office Corp 53,623,922 53,623,922 53,623,922 Ten Knots Philippines, Inc.(Conso) 13,619,234 13,619,234 13,619,234 Westview Commercial Ventures Corp. 396,383,226 396,383,226 396,383,226 Sub-Total 1,748,543,850 1,748,543,850 1,748,543,850 -
Receivable Balance per AYALALAND PREMIER, INC.
Payable Balance per ALI SUBSIDIARIES
Current Non-Current
Ayala Land, Inc. (ALI) Subsidiries: Ayala Property Management Corporation (Conso) 823,023 823,023 823,023 Sub-Total 823,023 823,023 823,023 -
Receivable Balance per BAY CITY
Payable Balance per ALI Subsidiaries
Current Non-Current
Ayala Land, Inc. (ALI) Subsidiries: Alabang Commercial Corporation (Conso) 500 500 500 ALI Commercial Center, Inc. (Conso) 37,820 37,820 37,820 Arca South Commercial Ventures Corp. (193,344) (193,344) (193,344) Arca South Integrated Terminal, Inc 9,181 9,181 9,181 Arvo Commercial Corporation 145,869 145,869 145,869 Avida Land Corporation (Conso) 562,155 562,155 562,155 Cagayan De Oro Gateway Corporation 17,889 17,889 17,889 Cebu Holdings, Inc. (Conso) 2,431 2,431 2,431 Makati Cornerstone Leasing Corp. 10,000,000 10,000,000 10,000,000 North Eastern Commercial Corp. 146,394 146,394 146,394
Amount Owed by ALI Subsidiaries to AYALALAND OFFICES, INC. & Subsidiaries
Amount Owed by ALI Subsidiaries to AYALALAND PREMIER, INC.
Amount Owed by ALI Subsidiaries to BAY CITY COMMERCIAL VENTURES CORP.
Page 15 of 27
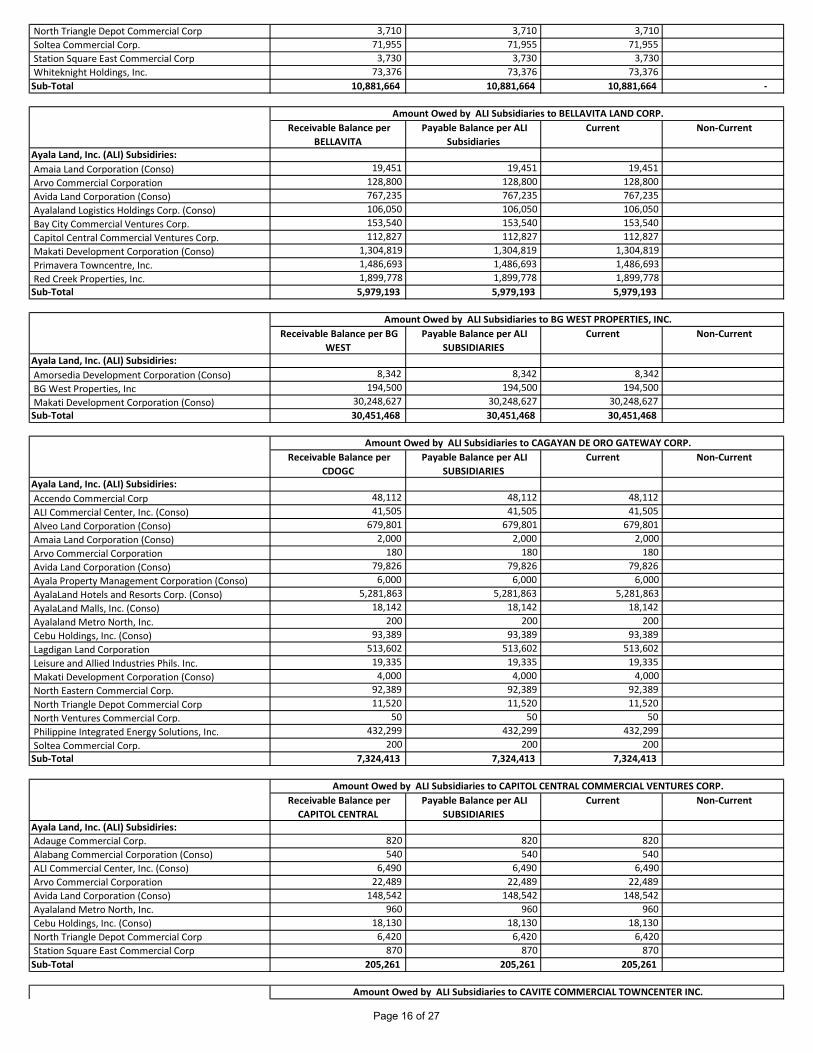
North Triangle Depot Commercial Corp 3,710 3,710 3,710 Soltea Commercial Corp. 71,955 71,955 71,955 Station Square East Commercial Corp 3,730 3,730 3,730 Whiteknight Holdings, Inc. 73,376 73,376 73,376 Sub-Total 10,881,664 10,881,664 10,881,664 -
Receivable Balance per BELLAVITA
Payable Balance per ALI Subsidiaries
Current Non-Current
Ayala Land, Inc. (ALI) Subsidiries: Amaia Land Corporation (Conso) 19,451 19,451 19,451 Arvo Commercial Corporation 128,800 128,800 128,800 Avida Land Corporation (Conso) 767,235 767,235 767,235 Ayalaland Logistics Holdings Corp. (Conso) 106,050 106,050 106,050 Bay City Commercial Ventures Corp. 153,540 153,540 153,540 Capitol Central Commercial Ventures Corp. 112,827 112,827 112,827 Makati Development Corporation (Conso) 1,304,819 1,304,819 1,304,819 Primavera Towncentre, Inc. 1,486,693 1,486,693 1,486,693 Red Creek Properties, Inc. 1,899,778 1,899,778 1,899,778 Sub-Total 5,979,193 5,979,193 5,979,193
Receivable Balance per BG WEST
Payable Balance per ALI SUBSIDIARIES
Current Non-Current
Ayala Land, Inc. (ALI) Subsidiries: Amorsedia Development Corporation (Conso) 8,342 8,342 8,342 BG West Properties, Inc 194,500 194,500 194,500 Makati Development Corporation (Conso) 30,248,627 30,248,627 30,248,627 Sub-Total 30,451,468 30,451,468 30,451,468
Receivable Balance per CDOGC
Payable Balance per ALI SUBSIDIARIES
Current Non-Current
Ayala Land, Inc. (ALI) Subsidiries: Accendo Commercial Corp 48,112 48,112 48,112 ALI Commercial Center, Inc. (Conso) 41,505 41,505 41,505 Alveo Land Corporation (Conso) 679,801 679,801 679,801 Amaia Land Corporation (Conso) 2,000 2,000 2,000 Arvo Commercial Corporation 180 180 180 Avida Land Corporation (Conso) 79,826 79,826 79,826 Ayala Property Management Corporation (Conso) 6,000 6,000 6,000 AyalaLand Hotels and Resorts Corp. (Conso) 5,281,863 5,281,863 5,281,863 AyalaLand Malls, Inc. (Conso) 18,142 18,142 18,142 Ayalaland Metro North, Inc. 200 200 200 Cebu Holdings, Inc. (Conso) 93,389 93,389 93,389 Lagdigan Land Corporation 513,602 513,602 513,602 Leisure and Allied Industries Phils. Inc. 19,335 19,335 19,335 Makati Development Corporation (Conso) 4,000 4,000 4,000 North Eastern Commercial Corp. 92,389 92,389 92,389 North Triangle Depot Commercial Corp 11,520 11,520 11,520 North Ventures Commercial Corp. 50 50 50 Philippine Integrated Energy Solutions, Inc. 432,299 432,299 432,299 Soltea Commercial Corp. 200 200 200 Sub-Total 7,324,413 7,324,413 7,324,413
Receivable Balance per CAPITOL CENTRAL
Payable Balance per ALI SUBSIDIARIES
Current Non-Current
Ayala Land, Inc. (ALI) Subsidiries: Adauge Commercial Corp. 820 820 820 Alabang Commercial Corporation (Conso) 540 540 540 ALI Commercial Center, Inc. (Conso) 6,490 6,490 6,490 Arvo Commercial Corporation 22,489 22,489 22,489 Avida Land Corporation (Conso) 148,542 148,542 148,542 Ayalaland Metro North, Inc. 960 960 960 Cebu Holdings, Inc. (Conso) 18,130 18,130 18,130 North Triangle Depot Commercial Corp 6,420 6,420 6,420 Station Square East Commercial Corp 870 870 870 Sub-Total 205,261 205,261 205,261
Amount Owed by ALI Subsidiaries to CAPITOL CENTRAL COMMERCIAL VENTURES CORP.
Amount Owed by ALI Subsidiaries to CAVITE COMMERCIAL TOWNCENTER INC.
Amount Owed by ALI Subsidiaries to CAGAYAN DE ORO GATEWAY CORP.
Amount Owed by ALI Subsidiaries to BELLAVITA LAND CORP.
Amount Owed by ALI Subsidiaries to BG WEST PROPERTIES, INC.
Page 16 of 27

Receivable Balance per CCTCI
Payable Balance per ALI SUBSIDIARIES
Current Non-Current
Ayala Land, Inc. (ALI) Subsidiries: Alveo Land Corporation (Conso) (124,911) (124,911) (124,911) Amaia Land Corporation (Conso) 306,654 306,654 306,654 Avida Land Corporation (Conso) 131,494 131,494 131,494 Ayala Property Management Corporation (Conso) 564,520 564,520 564,520 Ayalaland Malls Synergies, Inc. 114,261 114,261 114,261 AyalaLand Malls, Inc. (Conso) 4,000 4,000 4,000 Bay City Commercial Ventures Corp. 1,199 1,199 1,199 Capitol Central Commercial Ventures Corp. 28,644 28,644 28,644 Leisure and Allied Industries Phils. Inc. 367,798 367,798 367,798 Makati Cornerstone Leasing Corp. 6,116 6,116 6,116 Makati Development Corporation (Conso) 39,280 39,280 39,280 North Ventures Commercial Corp. 4,690 4,690 4,690 Soltea Commercial Corp. 38,758 38,758 38,758 Summerhill Commercial Ventures Corp. 137,276 137,276 137,276 Sub-Total 1,619,779 1,619,779 1,619,779
Receivable Balance per CHI & SUBSIDIARIES
Payable Balance per ALI SUBSIDIARIES
Current Non-Current
Ayala Land, Inc. (ALI) Subsidiries: Accendo Commercial Corp 2,233,499 2,233,499 2,233,499 Adauge Commercial Corp. 136,282 136,282 136,282 Alabang Commercial Corporation (Conso) 38,864 38,864 38,864 ALI Capital Corp. (Conso) 21,064,031 21,064,031 21,064,031 ALI Commercial Center, Inc. (Conso) 1,074,057 1,074,057 1,074,057 Alveo Land Corporation (Conso) 253,692,283 253,692,283 253,692,283 Amaia Land Corporation (Conso) 39,520,135 39,520,135 39,520,135 Arca South Integrated Terminal, Inc 10,017,569 10,017,569 10,017,569 Arvo Commercial Corporation 26,604,757 26,604,757 26,604,757 Aviana Development Corporation 900 900 900 Avida Land Corporation (Conso) 338,063,060 338,063,060 338,063,060 Ayala Land International Sales, Inc.(Conso) 29,587 29,587 29,587 Ayala Land Sales Inc. 4,108,053 4,108,053 4,108,053 Ayala Property Management Corporation (Conso) 31,191 31,191 31,191 AyalaLand Hotels and Resorts Corp. (Conso) 34,644,187 34,644,187 34,644,187 Ayalaland Logistics Holdings Corp. (Conso) 96,728,640 96,728,640 96,728,640 AyalaLand Malls, Inc. (Conso) 71,581 71,581 71,581 Ayalaland Medical Facilities Leasing Inc. 8,035,701 8,035,701 8,035,701 Ayalaland Metro North, Inc. 16,160 16,160 16,160 Bay City Commercial Ventures Corp. 23,753,599 23,753,599 23,753,599 Cagayan De Oro Gateway Corporation 23,156,849 23,156,849 23,156,849 Capitol Central Commercial Ventures Corp. 13,549,636 13,549,636 13,549,636 Cebu Holdings, Inc. (Conso) 18,841,458 18,841,458 18,841,458 Crans Montana Property Holdings Corporation 40,451,037 40,451,037 40,451,037 Leisure and Allied Industries Phils. Inc. 160,649 160,649 160,649 Makati Development Corporation (Conso) 2,560,201 2,560,201 2,560,201 North Triangle Depot Commercial Corp 853,516 853,516 853,516 North Ventures Commercial Corp. 200 200 200 NorthBeacon Commercial Corporation 19,644 19,644 19,644 Nuevocentro, Inc. (Conso) 9,050,071 9,050,071 9,050,071 Serendra Inc. 18,854 18,854 18,854 Soltea Commercial Corp. 36,210,834 36,210,834 36,210,834 Southportal Properties, Inc. 257,802 257,802 257,802 Subic Bay Town Center Inc. 943 943 943 Summerhill Commercial Ventures Corp. 8,354,406 8,354,406 8,354,406 Ten Knots Philippines, Inc.(Conso) 792,648 792,648 792,648 Westview Commercial Ventures Corp. 5,866 5,866 5,866 Sub-Total 1,014,148,750 1,014,148,750 1,014,148,750 -
Receivable Balance per CECI Payable Balance per ALI SUBSIDIARIES
Current Non-Current
Ayala Land, Inc. (ALI) Subsidiries: ALI Capital Corp. (Conso) 5,594,805 5,594,805 5,594,805 Alveo Land Corporation (Conso) 965 965 965 Amaia Land Corporation (Conso) 51,705,336 51,705,336 51,705,336 Amorsedia Development Corporation (Conso) 35,971,589 35,971,589 35,971,589 Arvo Commercial Corporation 25,085,038 25,085,038 25,085,038
Amount Owed by ALI Subsidiaries to CEBU HOLDINGS, INC. & Subsidiaries
Amount Owed by ALI Subsidiaries to CECI REALTY, INC.
Page 17 of 27

Aurora Properties, Inc. 14,882,016 14,882,016 14,882,016 Avida Land Corporation (Conso) 5,517,161 5,517,161 5,517,161 AyalaLand Hotels and Resorts Corp. (Conso) 80,448,822 80,448,822 80,448,822 Ayalaland Logistics Holdings Corp. (Conso) 56,996,399 56,996,399 56,996,399 Ayalaland Malls Synergies, Inc. 55,211 55,211 55,211 Ayalaland Medical Facilities Leasing Inc. 120,981,683 120,981,683 120,981,683 AyalaLand Offices, Inc. (Conso) 894,468 894,468 894,468 Bay City Commercial Ventures Corp. 102,397,385 102,397,385 102,397,385 Cavite Commercial Towncenter Inc. 50,329,063 50,329,063 50,329,063 Cebu Holdings, Inc. (Conso) 108,288,647 108,288,647 108,288,647 Crans Montana Property Holdings Corporation 240,163,984 240,163,984 240,163,984 Direct Power Services Inc. 15,459 15,459 15,459 Leisure and Allied Industries Phils. Inc. 108,300 108,300 108,300 Makati Development Corporation (Conso) 4,607,188 4,607,188 4,607,188 Nuevocentro, Inc. (Conso) 15,047,051 15,047,051 15,047,051 Soltea Commercial Corp. 93,702,399 93,702,399 93,702,399 Ten Knots Philippines, Inc.(Conso) 5,684,121 5,684,121 5,684,121 Vesta Property Holdings Inc. 17,991,937 17,991,937 17,991,937 Sub-Total 1,036,469,028 1,036,469,028 1,036,469,028 -
Receivable Balance per CRANS MONTANA
Payable Balance per ALI SUBSIDIARIES
Current Non-Current
Ayala Land, Inc. (ALI) Subsidiries: Ayala Property Management Corporation (Conso) 58,812 58,812 58,812 Ayalaland Medical Facilities Leasing Inc. 153,655 153,655 153,655 Crans Montana Property Holdings Corporation 100 100 100 Sub-Total 212,567 212,567 212,567
Receivable Balance per CRIMSON FIELD
ENTERPRISES, INC.
Payable Balance per ALI SUBSIDIARIES
Current Non-Current
Ayala Land, Inc. (ALI) Subsidiries: AyalaLand Hotels and Resorts Corp. (Conso) 1,005,320 1,005,320 1,005,320 Crans Montana Property Holdings Corporation 3,015,959 3,015,959 3,015,959 Sub-Total 4,021,278 4,021,278 4,021,278
Receivable Balance per DPSI Payable Balance per ALI SUBSIDIARIES
Current Non-Current
Ayala Land, Inc. (ALI) Subsidiries: Alabang Commercial Corporation (Conso) 5,893,377 5,893,377 5,893,377 ALI Capital Corp. (Conso) 240,806 240,806 240,806 ALI Commercial Center, Inc. (Conso) 16,029,239 16,029,239 16,029,239 ALI-CII Development Corporation 1,464,561 1,464,561 1,464,561 Alveo Land Corporation (Conso) 1,598,480 1,598,480 1,598,480 Amaia Land Corporation (Conso) 4,599 4,599 4,599 Arvo Commercial Corporation 2,666,770 2,666,770 2,666,770 Avida Land Corporation (Conso) (437,153) (437,153) (437,153) Ayalaland Logistics Holdings Corp. (Conso) (3,523) (3,523) (3,523) Ayalaland Metro North, Inc. (39,290) (39,290) (39,290) AyalaLand Offices, Inc. (Conso) 17,408,608 17,408,608 17,408,608 Bay City Commercial Ventures Corp. 280,663 280,663 280,663 Cagayan De Oro Gateway Corporation 30,070 30,070 30,070 Cavite Commercial Towncenter Inc. 1,007,945 1,007,945 1,007,945 Cebu Holdings, Inc. (Conso) 17,445,007 17,445,007 17,445,007 Crans Montana Property Holdings Corporation (3,342) (3,342) (3,342) Hillsford Property Corporation 2,981 2,981 2,981 Makati Cornerstone Leasing Corp. 303,972 303,972 303,972 North Eastern Commercial Corp. 3,454,397 3,454,397 3,454,397 North Triangle Depot Commercial Corp 9,571,620 9,571,620 9,571,620 NorthBeacon Commercial Corporation 4,524,468 4,524,468 4,524,468 AREIT, Inc. 3,317,064 3,317,064 3,317,064 Philippine Integrated Energy Solutions, Inc. 13,450,225 13,450,225 13,450,225 Primavera Towncentre, Inc. 34,787 34,787 34,787 Serendra Inc. 6,299,763 6,299,763 6,299,763 Station Square East Commercial Corp 10,205,022 10,205,022 10,205,022 Subic Bay Town Center Inc. 1,593,852 1,593,852 1,593,852 Summerhill Commercial Ventures Corp. 5,670,880 5,670,880 5,670,880 Ten Knots Philippines, Inc.(Conso) (9,023) (9,023) (9,023)
Amount Owed by ALI Subsidiaries to CRANS MONTANA PROPERTY HOLDINGS CORP.
Amount Owed by ALI Subsidiaries to CRIMSON FIELD ENTERPRISES, INC.
Amount Owed by ALI Subsidiaries to DIRECT POWER SERVICES, INC.
Page 18 of 27

Sub-Total 122,006,825 122,006,825 122,006,825 -
Receivable Balance per ECI Payable Balance per ALI SUBSIDIARIES
Current Non-Current
Ayala Land, Inc. (ALI) Subsidiries: Ten Knots Philippines, Inc.(Conso) 94,668,752 94,668,752 94,668,752 Sub-Total 94,668,752 94,668,752 94,668,752 -
Receivable Balance per FLIL Payable Balance per ALI SUBSIDIARIES
Current Non-Current
Ayala Land, Inc. (ALI) Subsidiries: ALI Capital Corp. (Conso) 81,881,250 81,881,250 81,881,250 Arca South Integrated Terminal, Inc 10,798,555 10,798,555 10,798,555 Ayalaland Malls Synergies, Inc. 2,210,503 2,210,503 2,210,503 Sub-Total 94,890,308 94,890,308 94,890,308 -
Receivable Balance per FSCI Payable Balance per ALI SUBSIDIARIES
Current Non-Current
Ayala Land, Inc. (ALI) Subsidiries: Alabang Commercial Corporation (Conso) 1,470,459 1,470,459 1,470,459 Cebu Holdings, Inc. (Conso) 15,055,000 15,055,000 15,055,000 Soltea Commercial Corp. 2,790 2,790 2,790 Summerhill Commercial Ventures Corp. (49,420) (49,420) (49,420)Sub-Total 16,478,829 16,478,829 16,478,829 -
Receivable Balance per HILLSFORD
Payable Balance per ALI SUBSIDIARIES
Current Non-Current
Ayala Land, Inc. (ALI) Subsidiries: Amaia Land Corporation (Conso) 11,737 11,737 11,737 Cebu Holdings, Inc. (Conso) 18,154 18,154 18,154 North Eastern Commercial Corp. 1,550 1,550 1,550 Sub-Total 31,441 31,441 31,441 -
Receivable Balance per INTEGRATED ECO-RESORT,
INC.
Payable Balance per ALI SUBSIDIARIES
Current Non-Current
Ayala Land, Inc. (ALI) Subsidiries: AyalaLand Hotels and Resorts Corp. (Conso) 78,123 78,123 78,123 Bay City Commercial Ventures Corp. 112,341 112,341 112,341 Ten Knots Philippines, Inc.(Conso) 522,964,668 522,964,668 522,964,668 Sub-Total 523,155,131 523,155,131 523,155,131 -
Receivable Balance per LAGDIGAN
Payable Balance per ALI SUBSIDIARIES
Current Non-Current
Ayala Land, Inc. (ALI) Subsidiries: Arca South Commercial Ventures Corp. 32,685 32,685 32,685 Bay City Commercial Ventures Corp. 61,192 61,192 61,192 Cagayan De Oro Gateway Corporation 48,057,528 48,057,528 48,057,528 Sub-Total 48,151,404 48,151,404 48,151,404
Receivable Balance per LAIP Payable Balance per ALI SUBSIDIARIES
Current Non-Current
Ayala Land, Inc. (ALI) Subsidiries: AyalaLand Hotels and Resorts Corp. (Conso) 32,000 32,000 32,000 Sub-Total 32,000 32,000 32,000
Receivable Balance per MAKATI CORNERSTONE
Payable Balance per ALI SUBSIDIARIES
Current Non-Current
Ayala Land, Inc. (ALI) Subsidiries: Accendo Commercial Corp 3,415 3,415 3,415 Alabang Commercial Corporation (Conso) 5,715 5,715 5,715 ALI Capital Corp. (Conso) 2,378,607 2,378,607 2,378,607 ALI Commercial Center, Inc. (Conso) 1,050,992 1,050,992 1,050,992
Amount Owed by ALI Subsidiaries to LAGDIGAN LAND CORP.
Amount Owed by ALI Subsidiaries to LEISURE AND ALLIED INDUSTRIES PHILS., INC.
Amount Owed by ALI Subsidiaries to MAKATI CORNERSTONE LEASING CORP.
Amount Owed by ALI Subsidiaries to INTEGRATED ECO-RESORT, INC.
Amount Owed by ALI Subsidiaries to ECOHOLDINGS COMPANY, INC.
Amount Owed by ALI Subsidiaries to FIRST LONGFIELD INVESTMENTS LTD.
Amount Owed by ALI Subsidiaries to FIVE STAR CINEMA, INC.
Amount Owed by ALI Subsidiaries to HILLSFORD PROPERTY CORP.
Page 19 of 27

Amaia Land Corporation (Conso) 102,860 102,860 102,860 Amorsedia Development Corporation (Conso) 2,507,617 2,507,617 2,507,617 Arvo Commercial Corporation 1,257,738 1,257,738 1,257,738 Avida Land Corporation (Conso) 292,573 292,573 292,573 Ayala Theaters Management, Inc. 2,250 2,250 2,250 Ayalaland Logistics Holdings Corp. (Conso) 3,056,090 3,056,090 3,056,090 Bay City Commercial Ventures Corp. 340,794 340,794 340,794 BellaVita Land Corp. 185,030 185,030 185,030 Cagayan De Oro Gateway Corporation 5,021,027 5,021,027 5,021,027 Capitol Central Commercial Ventures Corp. 8,544,223 8,544,223 8,544,223 Cavite Commercial Towncenter Inc. 6,830 6,830 6,830 Cebu Holdings, Inc. (Conso) 12,047,670 12,047,670 12,047,670 North Eastern Commercial Corp. 4,415 4,415 4,415 North Triangle Depot Commercial Corp 46,950 46,950 46,950 North Ventures Commercial Corp. 27,195 27,195 27,195 NorthBeacon Commercial Corporation 3,415 3,415 3,415 Soltea Commercial Corp. 201,053 201,053 201,053 Station Square East Commercial Corp 14,730 14,730 14,730 Summerhill Commercial Ventures Corp. 151,206 151,206 151,206 Ten Knots Philippines, Inc.(Conso) 10,011,706 10,011,706 10,011,706 Westview Commercial Ventures Corp. 561 561 561 Sub-Total 47,264,661 47,264,661 47,264,661
Receivable Balance per NECC Payable Balance per ALI SUBSIDIARIES
Current Non-Current
Ayala Land, Inc. (ALI) Subsidiries: Accendo Commercial Corp 10,019,989 10,019,989 10,019,989 Alabang Commercial Corporation (Conso) 12,110 12,110 12,110 ALI Capital Corp. (Conso) 11,230,347 11,230,347 11,230,347 ALI Commercial Center, Inc. (Conso) 7,917,510 7,917,510 7,917,510 ALI-CII Development Corporation 470 470 470 Alveo Land Corporation (Conso) 1,579,768 1,579,768 1,579,768 Amaia Land Corporation (Conso) 25,824,434 25,824,434 25,824,434 Amorsedia Development Corporation (Conso) 40,789,854 40,789,854 40,789,854 Arca South Commercial Ventures Corp. 20,137,766 20,137,766 20,137,766 Arvo Commercial Corporation 83,199,523 83,199,523 83,199,523 Avida Land Corporation (Conso) 4,186,265 4,186,265 4,186,265 Ayalaland Estates, Inc. 1,557,435 1,557,435 1,557,435 AyalaLand Hotels and Resorts Corp. (Conso) 221,982,728 221,982,728 221,982,728 Ayalaland Logistics Holdings Corp. (Conso) 270,227,856 270,227,856 270,227,856 Ayalaland Malls Synergies, Inc. 2,755,867 2,755,867 2,755,867 AyalaLand Malls, Inc. (Conso) 4,005 4,005 4,005 Ayalaland Metro North, Inc. 18,964 18,964 18,964 Bay City Commercial Ventures Corp. 100,832,039 100,832,039 100,832,039 Cagayan De Oro Gateway Corporation 82,062,939 82,062,939 82,062,939 Capitol Central Commercial Ventures Corp. 22,123,824 22,123,824 22,123,824 Cebu Holdings, Inc. (Conso) 297,553,911 297,553,911 297,553,911 Crans Montana Property Holdings Corporation 35,195,750 35,195,750 35,195,750 Direct Power Services Inc. 23,047 23,047 23,047 Hillsford Property Corporation 3,778 3,778 3,778 Leisure and Allied Industries Phils. Inc. 205,679 205,679 205,679 Makati Development Corporation (Conso) 50,060,307 50,060,307 50,060,307 North Eastern Commercial Corp. (5,167) (5,167) (5,167) North Triangle Depot Commercial Corp 184,522 184,522 184,522 North Ventures Commercial Corp. 12,561 12,561 12,561 NorthBeacon Commercial Corporation 7,551 7,551 7,551 Soltea Commercial Corp. 65,447,672 65,447,672 65,447,672 Station Square East Commercial Corp 13,810 13,810 13,810 Subic Bay Town Center Inc. 14,177 14,177 14,177 Summerhill Commercial Ventures Corp. 1,627,789 1,627,789 1,627,789 Ten Knots Philippines, Inc.(Conso) 88,396,362 88,396,362 88,396,362 Sub-Total 1,445,205,442 1,445,205,442 1,445,205,442
Receivable Balance per NTDCC
Payable Balance per ALI SUBSIDIARIES
Current Non-Current
Ayala Land, Inc. (ALI) Subsidiries: Accendo Commercial Corp 8,067 8,067 8,067 Alabang Commercial Corporation (Conso) 117,060 117,060 117,060 ALI Capital Corp. (Conso) 875,769 875,769 875,769
Amount Owed by ALI Subsidiaries to NORTH EASTERN COMMERCIAL CORP.
Amount Owed by ALI Subsidiaries to NORTH TRIANGLE DEPOT COMMERCIAL CORP.
Page 20 of 27

ALI Commercial Center, Inc. (Conso) 6,234,302 6,234,302 6,234,302 Alveo Land Corporation (Conso) 211,443 211,443 211,443 Amaia Land Corporation (Conso) 223,794 223,794 223,794 Amorsedia Development Corporation (Conso) 794,606 794,606 794,606 Arca South Commercial Ventures Corp. 14,935 14,935 14,935 Arvo Commercial Corporation 1,844,346 1,844,346 1,844,346 Avida Land Corporation (Conso) 83,006 83,006 83,006 AyalaLand Hotels and Resorts Corp. (Conso) 2,061,294 2,061,294 2,061,294 Ayalaland Logistics Holdings Corp. (Conso) 865,280 865,280 865,280 AyalaLand Malls, Inc. (Conso) 29,770 29,770 29,770 Ayalaland Medical Facilities Leasing Inc. 119,340 119,340 119,340 Ayalaland Metro North, Inc. 93,095 93,095 93,095 Bay City Commercial Ventures Corp. 293,971 293,971 293,971 Cagayan De Oro Gateway Corporation 296,968 296,968 296,968 Cebu Holdings, Inc. (Conso) 1,095,336 1,095,336 1,095,336 Crans Montana Property Holdings Corporation 145,428 145,428 145,428 Leisure and Allied Industries Phils. Inc. 817,785 817,785 817,785 Makati Development Corporation (Conso) 838,832 838,832 838,832 North Eastern Commercial Corp. 391,287 391,287 391,287 North Ventures Commercial Corp. 146,706 146,706 146,706 NorthBeacon Commercial Corporation 3,362 3,362 3,362 Nuevocentro, Inc. (Conso) 115,145 115,145 115,145 Soltea Commercial Corp. 416,155 416,155 416,155 Station Square East Commercial Corp 112,102 112,102 112,102 Subic Bay Town Center Inc. 1,811 1,811 1,811 Summerhill Commercial Ventures Corp. 673,602 673,602 673,602 Ten Knots Development Corporation(Conso) 19,019 19,019 19,019 Ten Knots Philippines, Inc.(Conso) 1,630,526 1,630,526 1,630,526 Sub-Total 20,574,145 20,574,145 20,574,145
Receivable Balance per NVCC Payable Balance per ALI SUBSIDIARIES
Current Non-Current
Ayala Land, Inc. (ALI) Subsidiries: Accendo Commercial Corp 60,447 60,447 60,447 Alabang Commercial Corporation (Conso) 14,690 14,690 14,690 ALI Capital Corp. (Conso) 52,576,949 52,576,949 52,576,949 ALI Commercial Center, Inc. (Conso) 1,271,658 1,271,658 1,271,658 Alveo Land Corporation (Conso) 54,626 54,626 54,626 Amaia Land Corporation (Conso) 1,765,035 1,765,035 1,765,035 Amorsedia Development Corporation (Conso) 8,034,607 8,034,607 8,034,607 Arca South Commercial Ventures Corp. 3,053,808 3,053,808 3,053,808 Arca South Integrated Terminal, Inc 5,053,751 5,053,751 5,053,751 Arvo Commercial Corporation 19,609,984 19,609,984 19,609,984 Avida Land Corporation (Conso) 270,303 270,303 270,303 Ayala Property Management Corporation (Conso) 1,790,801 1,790,801 1,790,801 AyalaLand Hotels and Resorts Corp. (Conso) 10,821,521 10,821,521 10,821,521 Ayalaland Logistics Holdings Corp. (Conso) 55,553,004 55,553,004 55,553,004 Ayalaland Malls Synergies, Inc. 845 845 845 AyalaLand Malls, Inc. (Conso) 110 110 110 Ayalaland Medical Facilities Leasing Inc. 193,932 193,932 193,932 Bay City Commercial Ventures Corp. 171,934,606 171,934,606 171,934,606 Cagayan De Oro Gateway Corporation 5,800 5,800 5,800 Capitol Central Commercial Ventures Corp. 90,312,898 90,312,898 90,312,898 Cebu Holdings, Inc. (Conso) 75,307,985 75,307,985 75,307,985 Crans Montana Property Holdings Corporation 9,521,797 9,521,797 9,521,797 Leisure and Allied Industries Phils. Inc. 21,422,904 21,422,904 21,422,904 Makati Development Corporation (Conso) 2,742,315 2,742,315 2,742,315 North Eastern Commercial Corp. 909,306 909,306 909,306 North Triangle Depot Commercial Corp 304,506 304,506 304,506 NorthBeacon Commercial Corporation 1,600 1,600 1,600 Soltea Commercial Corp. 23,170,655 23,170,655 23,170,655 Station Square East Commercial Corp 20,130 20,130 20,130 Summerhill Commercial Ventures Corp. 282,084 282,084 282,084 Ten Knots Development Corporation(Conso) 38,816 38,816 38,816 Ten Knots Philippines, Inc.(Conso) 3,424 3,424 3,424 Sub-Total 556,104,899 556,104,899 556,104,899 -
Receivable Balance per NBCC Payable Balance per ALI SUBSIDIARIES
Current Non-Current
Amount Owed by ALI Subsidiaries to NORTH VENTURES COMMERCIAL CORP.
Amount Owed by ALI Subsidiaries to NORTH BEACON COMMERCIAL CORP.
Page 21 of 27

Ayala Land, Inc. (ALI) Subsidiries: Accendo Commercial Corp 11,252 11,252 11,252 Alabang Commercial Corporation (Conso) 9,372 9,372 9,372 ALI Capital Corp. (Conso) 16,428,022 16,428,022 16,428,022 ALI Commercial Center, Inc. (Conso) 164,079 164,079 164,079 Alveo Land Corporation (Conso) 343,834 343,834 343,834 Amaia Land Corporation (Conso) 23,861,524 23,861,524 23,861,524 APRISA Business Process Solutions, Inc 1,200 1,200 1,200 Arvo Commercial Corporation 29,310,596 29,310,596 29,310,596 Avida Land Corporation (Conso) 26,596 26,596 26,596 AyalaLand Hotels and Resorts Corp. (Conso) 5,530,437 5,530,437 5,530,437 Ayalaland Logistics Holdings Corp. (Conso) 100,522,713 100,522,713 100,522,713 AyalaLand Malls, Inc. (Conso) 14,658 14,658 14,658 Ayalaland Metro North, Inc. 20,423 20,423 20,423 Bay City Commercial Ventures Corp. 108,503,470 108,503,470 108,503,470 Cagayan De Oro Gateway Corporation 20,397,715 20,397,715 20,397,715 Capitol Central Commercial Ventures Corp. 7,420,365 7,420,365 7,420,365 Cavite Commercial Towncenter Inc. 66,865,451 66,865,451 66,865,451 Cebu Holdings, Inc. (Conso) 27,851,534 27,851,534 27,851,534 Hillsford Property Corporation 5,898 5,898 5,898 Leisure and Allied Industries Phils. Inc. 106,033 106,033 106,033 Makati Cornerstone Leasing Corp. 124,842 124,842 124,842 North Eastern Commercial Corp. 69,958 69,958 69,958 North Triangle Depot Commercial Corp 102,089 102,089 102,089 North Ventures Commercial Corp. 1,334 1,334 1,334 Nuevocentro, Inc. (Conso) 4,444,809 4,444,809 4,444,809 Soltea Commercial Corp. 19,094,266 19,094,266 19,094,266 Station Square East Commercial Corp 17,048 17,048 17,048 Subic Bay Town Center Inc. 4,300 4,300 4,300 Sub-Total 431,253,819 431,253,819 431,253,819
Receivable Balance per NUEVOCENTRO
Payable Balance per ALI SUBSIDIARIES
Current Non-Current
Ayala Land, Inc. (ALI) Subsidiries: ALI Capital Corp. (Conso) 8,534 8,534 8,534 Alveo Land Corporation (Conso) 9,000 9,000 9,000 Amaia Land Corporation (Conso) 8,503 8,503 8,503 Amorsedia Development Corporation (Conso) - - - Arvo Commercial Corporation 157,510 157,510 157,510 Aurora Properties, Inc. 100 100 100 Avida Land Corporation (Conso) 15,634 15,634 15,634 Ayalaland Estates, Inc. 46,100 46,100 46,100 AyalaLand Hotels and Resorts Corp. (Conso) 496,136 496,136 496,136 Ayalaland Logistics Holdings Corp. (Conso) 9,865,346 9,865,346 9,865,346 Bay City Commercial Ventures Corp. 381,944 381,944 381,944 CECI Realty Corp. 154,209 154,209 154,209 Crans Montana Property Holdings Corporation 151,580 151,580 151,580 Nuevocentro, Inc. (Conso) - - - Prow Holdings, Inc. 199,255,639 199,255,639 199,255,639 Vesta Property Holdings Inc. 26,154 26,154 26,154 Sub-Total 210,576,390 210,576,390 210,576,390 -
Receivable Balance per PHIL. ENERGY
Payable Balance per ALI SUBSIDIARIES
Current Non-Current
Ayala Land, Inc. (ALI) Subsidiries: Accendo Commercial Corp 12,642,317 12,642,317 12,642,317 Alabang Commercial Corporation (Conso) 3,328,295 3,328,295 3,328,295 ALI Capital Corp. (Conso) 667,140 667,140 667,140 ALI Commercial Center, Inc. (Conso) 6,577,505 6,577,505 6,577,505 Amaia Land Corporation (Conso) 38,129,413 38,129,413 38,129,413 Arvo Commercial Corporation 5,113,686 5,113,686 5,113,686 AyalaLand Hotels and Resorts Corp. (Conso) 14,525,714 14,525,714 14,525,714 Bay City Commercial Ventures Corp. 20,563,240 20,563,240 20,563,240 Cagayan De Oro Gateway Corporation 11,674,762 11,674,762 11,674,762 Capitol Central Commercial Ventures Corp. 370,296 370,296 370,296 Cavite Commercial Towncenter Inc. 10,045,236 10,045,236 10,045,236 Cebu Holdings, Inc. (Conso) 34,849,470 34,849,470 34,849,470 North Triangle Depot Commercial Corp 7,592,467 7,592,467 7,592,467 Summerhill Commercial Ventures Corp. (167,000) (167,000) (167,000)
Amount Owed by ALI Subsidiaries to NUEVOCENTRO INC., (Conso)
Amount Owed by ALI Subsidiaries to PHILIPPINE INTEGRATED ENERGY SOLUTIONS, INC.
Page 22 of 27

Ten Knots Philippines, Inc.(Conso) 19,985,691 19,985,691 19,985,691 Westview Commercial Ventures Corp. 16,787 16,787 16,787 Sub-Total 185,915,019 185,915,019 185,915,019 -
Receivable Balance per PRIMAVERA
Payable Balance per ALI SUBSIDIARIES
Current Non-Current
Ayala Land, Inc. (ALI) Subsidiries: Amaia Land Corporation (Conso) 127,183 127,183 127,183 Arvo Commercial Corporation 401,906 401,906 401,906 Avida Land Corporation (Conso) 93,317 93,317 93,317 AyalaLand Malls, Inc. (Conso) 5,705 5,705 5,705 AyalaLand Offices, Inc. (Conso) 837,584 837,584 837,584 Cavite Commercial Towncenter Inc. 4,554,045 4,554,045 4,554,045 North Ventures Commercial Corp. 3,749 3,749 3,749 Sub-Total 6,023,489 6,023,489 6,023,489 -
Receivable Balance per RCPI Payable Balance per ALI SUBSIDIARIES
Current Non-Current
Ayala Land, Inc. (ALI) Subsidiaries: BellaVita Land Corp. 51,729,293 51,729,293 51,729,293 Crans Montana Property Holdings Corporation 5,026,598 5,026,598 5,026,598 Sub-Total 56,755,891 56,755,891 56,755,891 -
Receivable Balance per RWIL & SUBSIDIARIES
Payable Balance per ALI SUBSIDIARIES
Current Non-Current
Ayala Land, Inc. (ALI) Subsidiaries: Regent Wise Investments Limited(Conso) 444,313,683 444,313,683 444,313,683 Sub-Total 444,313,683 444,313,683 444,313,683 -
Receivable Balance per SERENDRA
Payable Balance per ALI SUBSIDIARIES
Current Non-Current
Ayala Land, Inc. (ALI) Subsidiaries: Accendo Commercial Corp 25,732 25,732 25,732 Alveo Land Corporation (Conso) 2,243,214 2,243,214 2,243,214 Amaia Land Corporation (Conso) 1,852,521 1,852,521 1,852,521 Amorsedia Development Corporation (Conso) 73,399 73,399 73,399 Avida Land Corporation (Conso) 3,567,509 3,567,509 3,567,509 Ayala Land International Sales, Inc.(Conso) - - - Ayala Property Management Corporation (Conso) 7,781,588 7,781,588 7,781,588 Bay City Commercial Ventures Corp. 60,633 60,633 60,633 BellaVita Land Corp. 958 958 958 BG West Properties, Inc 17,001,618 17,001,618 17,001,618 Cagayan De Oro Gateway Corporation 37,862 37,862 37,862 Cebu Holdings, Inc. (Conso) 3,505,347 3,505,347 3,505,347 Leisure and Allied Industries Phils. Inc. 127,284,551 127,284,551 127,284,551 Makati Development Corporation (Conso) 183,195 183,195 183,195 Sub-Total 163,618,126 163,618,126 163,618,126
Receivable Balance per SOLTEA
Payable Balance per ALI SUBSIDIARIES
Current Non-Current
Ayala Land, Inc. (ALI) Subsidiaries: Accendo Commercial Corp 15,294 15,294 15,294 Alabang Commercial Corporation (Conso) 27,124 27,124 27,124 ALI Commercial Center, Inc. (Conso) 1,050,404 1,050,404 1,050,404 Alveo Land Corporation (Conso) 311,592 311,592 311,592 Amaia Land Corporation (Conso) 107,736 107,736 107,736 Arvo Commercial Corporation 36,154 36,154 36,154 Avida Land Corporation (Conso) 1,274,241 1,274,241 1,274,241 Ayalaland Malls Synergies, Inc. 595,123 595,123 595,123 AyalaLand Malls, Inc. (Conso) 410 410 410 Ayalaland Metro North, Inc. 18,584 18,584 18,584 Bay City Commercial Ventures Corp. 15,294 15,294 15,294 Cagayan De Oro Gateway Corporation 15,294 15,294 15,294 Cavite Commercial Towncenter Inc. 68,697 68,697 68,697 Cebu Holdings, Inc. (Conso) 45,188 45,188 45,188 Makati Cornerstone Leasing Corp. 15,294 15,294 15,294
Amount Owed by ALI, ALI-Subsidiaries to SERENDRA
Amount Owed by ALI-Subsidiaries to SOLTEA COMMERCIAL CORP.
Amount Owed by ALI, ALI-Subsidiaries to REGENT WISE INVESTMENTS, LTD. & Subsidiaries
Amount Owed by ALI Subsidiaries to PRIMAVER TOWNCENTRE, INC.
Amount Owed by ALI-Subsidiaries to RED CREEK PROPERTIES, INC.
Page 23 of 27

North Eastern Commercial Corp. 52,382 52,382 52,382 North Triangle Depot Commercial Corp 93,124 93,124 93,124 North Ventures Commercial Corp. 16,794 16,794 16,794 NorthBeacon Commercial Corporation 16,164 16,164 16,164 Serendra Inc. 15,294 15,294 15,294 Station Square East Commercial Corp 23,990 23,990 23,990 Summerhill Commercial Ventures Corp. 19,694 19,694 19,694 Sub-Total 3,833,873 3,833,873 3,833,873 -
Elimination Entry #201 Receivable Balance per
SOUTHPORTAL Payable Balance per ALI
Subsidiaries Current Non-Current
Ayala Land, Inc. (ALI) Subsidiaries: Accendo Commercial Corp 42,599 42,599 42,599 ALI Capital Corp. (Conso) 15,490,237 15,490,237 15,490,237 Alveo Land Corporation (Conso) 304 304 304 Amaia Land Corporation (Conso) 14,298,690 14,298,690 14,298,690 Amorsedia Development Corporation (Conso) 1,146,207 1,146,207 1,146,207 Arca South Commercial Ventures Corp. 16,660,250 16,660,250 16,660,250 Arvo Commercial Corporation 523,367 523,367 523,367 Avida Land Corporation (Conso) 146,675 146,675 146,675 AyalaLand Hotels and Resorts Corp. (Conso) 16,823,427 16,823,427 16,823,427 Ayalaland Logistics Holdings Corp. (Conso) 5,476,488 5,476,488 5,476,488 Ayalaland Medical Facilities Leasing Inc. 7,269,286 7,269,286 7,269,286 Ayalaland Metro North, Inc. 3,452 3,452 3,452 Bay City Commercial Ventures Corp. 3,991,523 3,991,523 3,991,523 Cagayan De Oro Gateway Corporation 126,509 126,509 126,509 Capitol Central Commercial Ventures Corp. 10,527,648 10,527,648 10,527,648 Cebu Holdings, Inc. (Conso) 30,050,495 30,050,495 30,050,495 Makati Cornerstone Leasing Corp. 11,014 11,014 11,014 Makati Development Corporation (Conso) 112,430 112,430 112,430 Summerhill Commercial Ventures Corp. 543,740 543,740 543,740 Ten Knots Development Corporation(Conso) 90,346 90,346 90,346 Ten Knots Philippines, Inc.(Conso) 1,200,708 1,200,708 1,200,708
Sub-Total 124,535,394 124,535,394 124,535,394
Elimination Entry #202 Receivable Balance per
SSECC Payable Balance per ALI
SUBSIDIARIES Current Non-Current
Ayala Land, Inc. (ALI) Subsidiaries: Accendo Commercial Corp 101,262 101,262 101,262 Alabang Commercial Corporation (Conso) 50,344 50,344 50,344 ALI Capital Corp. (Conso) 35,537,682 35,537,682 35,537,682 ALI Commercial Center, Inc. (Conso) 2,381,793 2,381,793 2,381,793 Alveo Land Corporation (Conso) 1,214,374 1,214,374 1,214,374 Amaia Land Corporation (Conso) 18,329,332 18,329,332 18,329,332 Amorsedia Development Corporation (Conso) 27,337,476 27,337,476 27,337,476 APRISA Business Process Solutions, Inc 131,438 131,438 131,438 Arca South Commercial Ventures Corp. 8,041,025 8,041,025 8,041,025 Arca South Integrated Terminal, Inc 3,003,731 3,003,731 3,003,731 Arvo Commercial Corporation 14,965,393 14,965,393 14,965,393 Avida Land Corporation (Conso) 4,011,919 4,011,919 4,011,919 AyalaLand Hotels and Resorts Corp. (Conso) 207,599,556 207,599,556 207,599,556 Ayalaland Logistics Holdings Corp. (Conso) 241,428 241,428 241,428 AyalaLand Malls, Inc. (Conso) 19,118 19,118 19,118 Ayalaland Metro North, Inc. 19,077 19,077 19,077 Bay City Commercial Ventures Corp. 62,172,875 62,172,875 62,172,875 BellaVita Land Corp. 16,092 16,092 16,092 Cagayan De Oro Gateway Corporation 22,379,019 22,379,019 22,379,019 Capitol Central Commercial Ventures Corp. 66,934,494 66,934,494 66,934,494 Cavite Commercial Towncenter Inc. 9,047 9,047 9,047 Cebu Holdings, Inc. (Conso) 15,190,185 15,190,185 15,190,185 Crans Montana Property Holdings Corporation 48,491,000 48,491,000 48,491,000 Leisure and Allied Industries Phils. Inc. 2,070,442 2,070,442 2,070,442 Makati Cornerstone Leasing Corp. 29,971 29,971 29,971 Makati Development Corporation (Conso) 983,593 983,593 983,593 North Eastern Commercial Corp. 2,099,778 2,099,778 2,099,778 North Triangle Depot Commercial Corp 315,182 315,182 315,182 North Ventures Commercial Corp. 21,437 21,437 21,437 NorthBeacon Commercial Corporation 23,027 23,027 23,027 Serendra Inc. 879,121 879,121 879,121
Amount Owed by SOUTHPORTAL PROPERTIES, INC.
Amount Owed by STATION SQUARE EAST COMMERCIAL CORP.
Page 24 of 27

Soltea Commercial Corp. 15,461,021 15,461,021 15,461,021 Subic Bay Town Center Inc. 1,500 1,500 1,500 Ten Knots Philippines, Inc.(Conso) 216 216 216 Sub-Total 560,062,948 560,062,948 560,062,948 -
Elimination Entry #189 Receivable Balance per
SBTCI Payable Balance per ALI
SUBSIDIARIES Current Non-Current
Ayala Land, Inc. (ALI) Subsidiaries: Accendo Commercial Corp 47,548 47,548 47,548 Alabang Commercial Corporation (Conso) 1,740 1,740 1,740 ALI Commercial Center, Inc. (Conso) 79,198 79,198 79,198 Amaia Land Corporation (Conso) 156,221,978 156,221,978 156,221,978 Arvo Commercial Corporation 18,241,511 18,241,511 18,241,511 AyalaLand Hotels and Resorts Corp. (Conso) 1,010,514 1,010,514 1,010,514 Ayalaland Logistics Holdings Corp. (Conso) 20,034,222 20,034,222 20,034,222 Ayalaland Metro North, Inc. 980 980 980 Bay City Commercial Ventures Corp. 8,888,132 8,888,132 8,888,132 Cebu Holdings, Inc. (Conso) 24,654,448 24,654,448 24,654,448 Crans Montana Property Holdings Corporation 17,896,430 17,896,430 17,896,430 Leisure and Allied Industries Phils. Inc. 366,329 366,329 366,329 North Triangle Depot Commercial Corp 34,885 34,885 34,885 North Ventures Commercial Corp. 1,500 1,500 1,500 NorthBeacon Commercial Corporation 14,000 14,000 14,000 Soltea Commercial Corp. 5,694,766 5,694,766 5,694,766 Station Square East Commercial Corp 1,000 1,000 1,000 Ten Knots Philippines, Inc.(Conso) 57,465 57,465 57,465 Sub-Total 253,246,645 253,246,645 253,246,645
Elimination Entry #181 Receivable Balance per
SUMMERHILL Payable Balance per ALI
SUBSIDIARIES Current Non-Current
Ayala Land, Inc. (ALI) Subsidiaries: Accendo Commercial Corp 870 870 870 Alabang Commercial Corporation (Conso) 12,150 12,150 12,150 ALI Capital Corp. (Conso) 145,258 145,258 145,258 ALI Commercial Center, Inc. (Conso) 1,471,792 1,471,792 1,471,792 Amaia Land Corporation (Conso) 3,500 3,500 3,500 Arca South Commercial Ventures Corp. 6,301,353 6,301,353 6,301,353 Arvo Commercial Corporation 61,500,567 61,500,567 61,500,567 Ayalaland Logistics Holdings Corp. (Conso) 16,947,416 16,947,416 16,947,416 Ayalaland Malls Synergies, Inc. (327,033) (327,033) (327,033) Ayalaland Metro North, Inc. 7,073 7,073 7,073 AyalaLand Offices, Inc. (Conso) 1,394 1,394 1,394 Bay City Commercial Ventures Corp. 13,510,788 13,510,788 13,510,788 Cebu Holdings, Inc. (Conso) 740 740 740 Direct Power Services Inc. 153,013 153,013 153,013 Leisure and Allied Industries Phils. Inc. (794,586) (794,586) (794,586) Makati Development Corporation (Conso) 793,050 793,050 793,050 North Eastern Commercial Corp. 10,436 10,436 10,436 North Triangle Depot Commercial Corp 270,813 270,813 270,813 North Ventures Commercial Corp. 4,280 4,280 4,280 NorthBeacon Commercial Corporation 2,593 2,593 2,593 Soltea Commercial Corp. 5,287,352 5,287,352 5,287,352 Station Square East Commercial Corp 36,700 36,700 36,700 Subic Bay Town Center Inc. 1,380 1,380 1,380 Sub-Total 105,340,899 105,340,899 105,340,899 -
Elimination Entry #180 Receivable Balance per
SUNNYFIELD Payable Balance per ALI
SUBSIDIARIES Current Non-Current
Ayala Land, Inc. (ALI) Avida Land Corporation (Conso) 117,809 117,809 117,809 Sub-Total 117,809 117,809 117,809 -
Elimination Entry #179 Receivable Balance per TKDC Payable Balance per ALI
SUBSIDIARIES Current Non-Current
Ayala Land, Inc. (ALI) ALI Capital Corp. (Conso) 4,800,220 4,800,220 4,800,220 ALI Commercial Center, Inc. (Conso) 10,382 10,382 10,382
Amount Owed by ALI-Subsidiaries to SUBIC BAY TOWN CENTER, INC.
Amount Owed by ALI to SUMMERHILL COMMERCIAL VENTURES CORP.
Amount Owed by ALI to SUNNYFIELD E-OFFICE CORP.
Amount Owed by ALI to TEN KNOTS DEVELOPMENT CORP.
Page 25 of 27

Alveo Land Corporation (Conso) 248,497 248,497 248,497 AyalaLand Hotels and Resorts Corp. (Conso) 87,161,115 87,161,115 87,161,115 Direct Power Services Inc. 9,458 9,458 9,458 Ecoholdings Company, Inc. 500 500 500 Integrated Eco-Resort Inc. 50,000 50,000 50,000 Makati Development Corporation (Conso) 103,021 103,021 103,021 Soltea Commercial Corp. 94,511 94,511 94,511 Ten Knots Philippines, Inc.(Conso) 449,375,222 449,375,222 449,375,222 Sub-Total 541,852,926 541,852,926 541,852,926 -
Elimination Entry #180 Receivable Balance per TKPI Payable Balance per ALI
SUBSIDIARIES Current Non-Current
Ayala Land, Inc. (ALI) Adauge Commercial Corp. 9,105 9,105 9,105 ALI Capital Corp. (Conso) 34,666,725 34,666,725 34,666,725 AyalaLand Hotels and Resorts Corp. (Conso) 37,402,356 37,402,356 37,402,356 Cebu Holdings, Inc. (Conso) 57,385 57,385 57,385 Ecoholdings Company, Inc. 1,939,655 1,939,655 1,939,655 Integrated Eco-Resort Inc. 3,460,013 3,460,013 3,460,013 Philippine Integrated Energy Solutions, Inc. 2,350 2,350 2,350 Ten Knots Development Corporation(Conso) 70,820,136 70,820,136 70,820,136 Ten Knots Philippines, Inc.(Conso) - - - Sub-Total 148,357,725 148,357,725 148,357,725 -
Elimination Entry #180 Receivable Balance per VPHI Payable Balance per ALI
SUBSIDIARIES Current Non-Current
Ayala Land, Inc. (ALI) Accendo Commercial Corp 131,898 131,898 131,898 ALI Capital Corp. (Conso) 47,835,724 47,835,724 47,835,724 ALI Commercial Center, Inc. (Conso) 9,716,301 9,716,301 9,716,301 Alveo Land Corporation (Conso) 34,866,018 34,866,018 34,866,018 Amaia Land Corporation (Conso) 16,048,746 16,048,746 16,048,746 Amorsedia Development Corporation (Conso) 78,676,863 78,676,863 78,676,863 Arca South Commercial Ventures Corp. 8,413,411 8,413,411 8,413,411 Arca South Integrated Terminal, Inc 10,007,168 10,007,168 10,007,168 Arvo Commercial Corporation 120,958,303 120,958,303 120,958,303 Aurora Properties, Inc. 150 150 150 Avida Land Corporation (Conso) 12,441,854 12,441,854 12,441,854 Ayala Land International Sales, Inc.(Conso) 188,476 188,476 188,476 AyalaLand Hotels and Resorts Corp. (Conso) 11,089,243 11,089,243 11,089,243 Ayalaland Logistics Holdings Corp. (Conso) 14,718,701 14,718,701 14,718,701 Ayalaland Medical Facilities Leasing Inc. 2,795,983 2,795,983 2,795,983 Bay City Commercial Ventures Corp. 334,675,563 334,675,563 334,675,563 Cagayan De Oro Gateway Corporation 4,512,364 4,512,364 4,512,364 Cavite Commercial Towncenter Inc. 37,922,071 37,922,071 37,922,071 Cebu Holdings, Inc. (Conso) 149,738,299 149,738,299 149,738,299 Crans Montana Property Holdings Corporation 5,022,084 5,022,084 5,022,084 Hillsford Property Corporation 2,502,378 2,502,378 2,502,378 Makati Development Corporation (Conso) 15,000 15,000 15,000 North Eastern Commercial Corp. 35,150 35,150 35,150 Nuevocentro, Inc. (Conso) 9,338,921 9,338,921 9,338,921 Soltea Commercial Corp. 3,380,463 3,380,463 3,380,463 Summerhill Commercial Ventures Corp. 21,624,557 21,624,557 21,624,557 Ten Knots Philippines, Inc.(Conso) 25,218,426 25,218,426 25,218,426 Sub-Total 961,874,118 961,874,118 961,874,118 -
Elimination Entry #180 Receivable Balance per
WESTVIEW Payable Balance per ALI
SUBSIDIARIES Current Non-Current
Ayala Land, Inc. (ALI) Adauge Commercial Corp. 2,900 2,900 2,900 Amaia Land Corporation (Conso) 577,624 577,624 577,624 Avida Land Corporation (Conso) 326,282 326,282 326,282 Capitol Central Commercial Ventures Corp. 154,518 154,518 154,518 Cebu Holdings, Inc. (Conso) 5,210 5,210 5,210 North Triangle Depot Commercial Corp 5,210 5,210 5,210 Subic Bay Town Center Inc. 9,983 9,983 9,983 Sub-Total 1,081,728 1,081,728 1,081,728 -
Amount Owed by ALI to TEN KNOTS PHILIPPINES, INC.
Amount Owed by ALI to VESTA PROPERTY HOLDINGS, INC.
Amount Owed by ALI to WESTVIEW COMMERCIAL VENTURES CORP.
Page 26 of 27
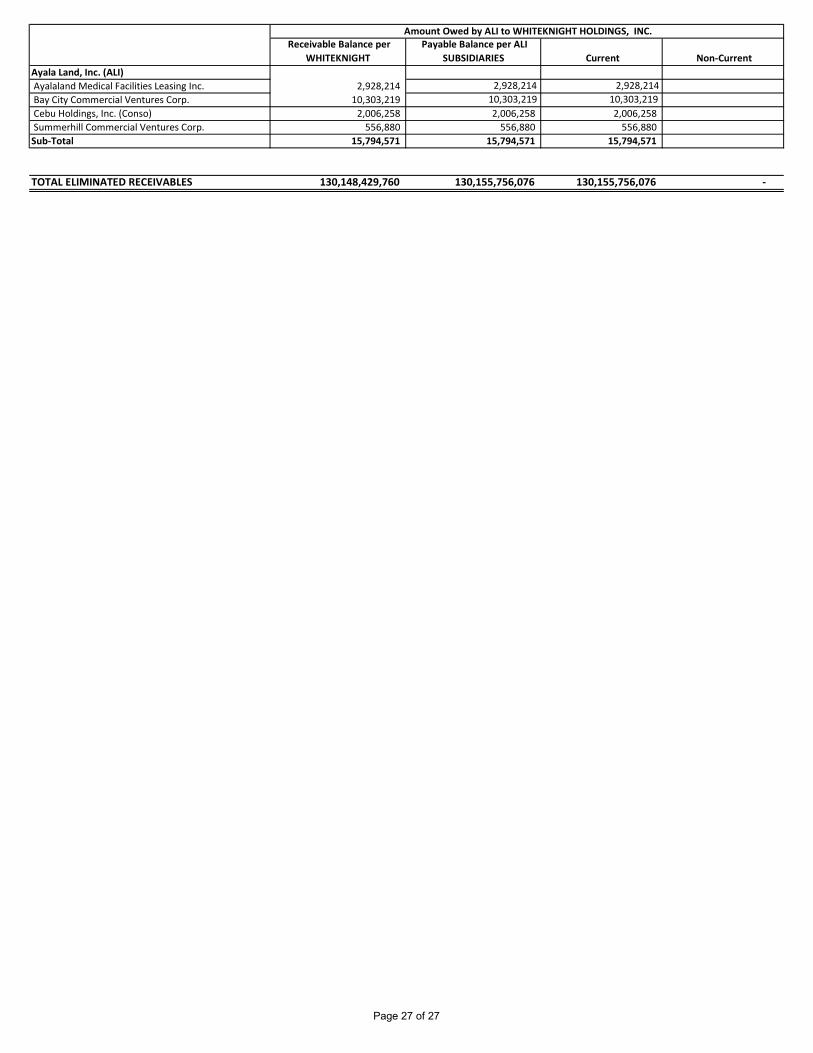
Elimination Entry #180 Receivable Balance per
WHITEKNIGHT Payable Balance per ALI
SUBSIDIARIES Current Non-Current Ayala Land, Inc. (ALI) Ayalaland Medical Facilities Leasing Inc. 2,928,214 2,928,214 2,928,214 Bay City Commercial Ventures Corp. 10,303,219 10,303,219 10,303,219 Cebu Holdings, Inc. (Conso) 2,006,258 2,006,258 2,006,258 Summerhill Commercial Ventures Corp. 556,880 556,880 556,880 Sub-Total 15,794,571 15,794,571 15,794,571
TOTAL ELIMINATED RECEIVABLES 130,148,429,760 130,155,756,076 130,155,756,076 -
Amount Owed by ALI to WHITEKNIGHT HOLDINGS, INC.
Page 27 of 27
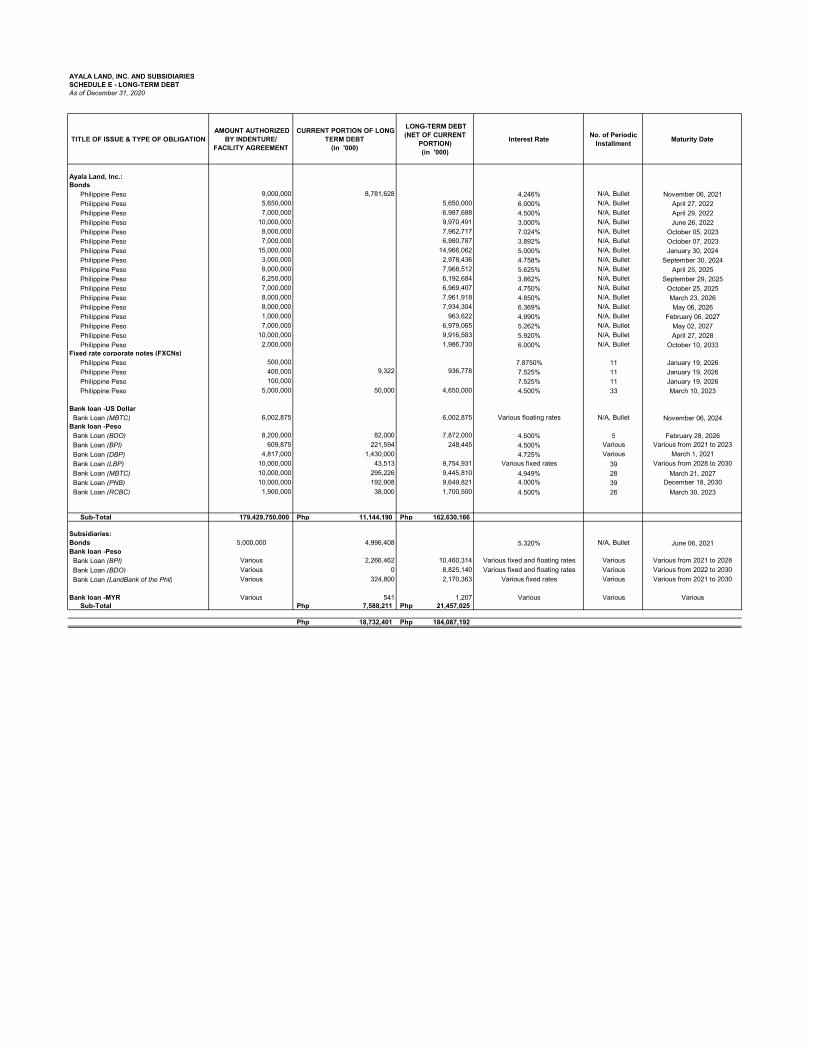
AYALA LAND, INC. AND SUBSIDIARIESSCHEDULE E - LONG-TERM DEBTAs of December 31, 2020
TITLE OF ISSUE & TYPE OF OBLIGATION AMOUNT AUTHORIZED
BY INDENTURE/ FACILITY AGREEMENT
CURRENT PORTION OF LONG-TERM DEBT
(in '000)
LONG-TERM DEBT (NET OF CURRENT
PORTION)(in '000)
Interest RateNo. of Periodic
InstallmentMaturity Date
Ayala Land, Inc.:Bonds
Philippine Peso 9,000,000 8,781,628 4.246% N/A, Bullet November 06, 2021
Philippine Peso 5,650,000 5,650,000 6.000% N/A, Bullet April 27, 2022
Philippine Peso 7,000,000 6,987,688 4.500% N/A, Bullet April 29, 2022
Philippine Peso 10,000,000 9,970,491 3.000% N/A, Bullet June 26, 2022
Philippine Peso 8,000,000 7,962,717 7.024% N/A, Bullet October 05, 2023
Philippine Peso 7,000,000 6,980,787 3.892% N/A, Bullet October 07, 2023
Philippine Peso 15,000,000 14,966,062 5.000% N/A, Bullet January 30, 2024
Philippine Peso 3,000,000 2,978,436 4.758% N/A, Bullet September 30, 2024
Philippine Peso 8,000,000 7,968,512 5.625% N/A, Bullet April 25, 2025
Philippine Peso 6,250,000 6,192,684 3.862% N/A, Bullet September 29, 2025
Philippine Peso 7,000,000 6,969,407 4.750% N/A, Bullet October 25, 2025
Philippine Peso 8,000,000 7,961,918 4.850% N/A, Bullet March 23, 2026
Philippine Peso 8,000,000 7,934,304 6.369% N/A, Bullet May 06, 2026
Philippine Peso 1,000,000 963,622 4.990% N/A, Bullet February 06, 2027
Philippine Peso 7,000,000 6,979,065 5.262% N/A, Bullet May 02, 2027
Philippine Peso 10,000,000 9,916,583 5.920% N/A, Bullet April 27, 2028
Philippine Peso 2,000,000 1,986,730 6.000% N/A, Bullet October 10, 2033Fixed rate corporate notes (FXCNs)
Philippine Peso 500,000 7.8750% 11 January 19, 2026
Philippine Peso 400,000 7.525% 11 January 19, 2026
Philippine Peso 100,000 7.525% 11 January 19, 2026
Philippine Peso 5,000,000 50,000 4,650,000 4.500% 33 March 10, 2023
Bank loan -US Dollar Bank Loan (MBTC) 6,002,875 6,002,875 Various floating rates N/A, Bullet November 06, 2024Bank loan -Peso Bank Loan (BDO) 8,200,000 82,000 7,872,000 4.500% 5 February 28, 2026 Bank Loan (BPI) 609,875 221,594 248,445 4.500% Various Various from 2021 to 2023
Bank Loan (DBP) 4,817,000 1,430,000 4.725% Various March 1, 2021
Bank Loan (LBP) 10,000,000 43,513 9,754,931 Various fixed rates 39 Various from 2028 to 2030
Bank Loan (MBTC) 10,000,000 295,226 9,445,810 4.949% 28 March 21, 2027 Bank Loan (PNB) 10,000,000 192,908 9,649,821 4.000% 39 December 18, 2030
Bank Loan (RCBC) 1,900,000 38,000 1,700,500 4.500% 26 March 30, 2023
Sub-Total 179,429,750,000 11,144,190Php 162,630,166Php
Subsidiaries:Bonds 5,000,000 4,996,408 5.320% N/A, Bullet June 06, 2021Bank loan -Peso Bank Loan (BPI) Various 2,266,462 10,460,314 Various fixed and floating rates Various Various from 2021 to 2028
Bank Loan (BDO) Various 0 8,825,140 Various fixed and floating rates Various Various from 2022 to 2030
Bank Loan (LandBank of the Phil) Various 324,800 2,170,363 Various fixed rates Various Various from 2021 to 2030
Bank loan -MYR Various 541 1,207 Various Various VariousSub-Total 7,588,211Php 21,457,025Php
18,732,401Php 184,087,192Php
9,322 936,778

AYALA LAND, INC. AND SUBSIDIARIESSCHEDULE E - Indebtedness to Related Parties (Long-Term Loans from Related Parties)(Long Term Loans from Related Companies) As of December 31, 2020
BALANCE AT BALANCE ATBEGINNING OF PERIOD END OF PERIOD
(in '000) (in '000)
Bank of the Philippine Islands 14,315,498Php 13,196,816Php
NAME OF RELATED PARTY

AYALA LAND, INC. AND SUBSIDIARIESSCHEDULE F - GUARANTEES OF SECURITIES OF OTHER ISSUERSAs of December 31, 2020
NAME OF ISSUING ENTITY OF SECURITIES GUARANTEED BY THE COMPANY FOR W/C THIS STATEMENT IS FILED
TITLE OF ISSUE OF EACH CLASS OF
SECURITIES GUARANTEED
TOTAL AMOUNT GUARANTEED & OUTSTANDING
AMOUNT OWNED BY PERSON FOR W/C
STATEMENT IS FILED
NATURE OFGUARANTEE
NOT APPLICABLE

AYALA LAND, INC. AND SUBSIDIARIESSCHEDULE G- CAPITAL STOCKAs of December 31, 2020
ISSUED SUBSCRIBEDTREASURY
SHARESTOTAL
Common Stock 20,000,000,000 14,635,298,644 124,881,701 (29,784,746) 14,730,395,599 - 6,545,946,579 154,255,829 Preferred Stock 15,000,000,000 13,066,494,759 13,066,494,759 12,163,180,640 2,157,932
OTHERSTITLE OF ISSUENUMBER OF
SHARES AUTHORIZED
NUMBER OF SHARES ISSUED AND OUTSTANDING AT SHOWN UNDER RELATED STATEMENT OF FINANCIAL POSITION CAPTION
NUMBER OF SHARES
RESERVED FOR OPTIONS,
WARRANTS, CONVERSION AND OTHER
RIGHTS
NUMBER OF SHARES HELD BY RELATED PARTIES
DIRECTORS, OFFICERS AND
EMPLOYEES

AYALA LAND, INC.RECONCILIATION OF RETAINED EARNINGS AVAILABLE FOR DIVIDEND DECLARATIONDecember 31, 2020
Amount (In Thousands)Unappropriated Retained Earnings, beginning 61,663,731,309Php Less adjustments:
Treasury shares -Php Deferred tax assets (1,831,740,899) Fair Value adjustment (593,852,588)
Unappropriated Retained Earnings, as adjusted, beginning 59,238,137,822 Net Income based on the face of AFS 14,624,811,526Php Less: Non-actual/unrealized income net of tax
Amount of provision for deferred tax during the year (729,345,936) Unrealized foreign exchange gain - net (except those
attributable to Cash and Cash Equivalents) Unrealized actuarial gainFair value adjustment (M2M gains) Fair value adjustment of Investment Property resulting to gain
adjustment due to deviation from PFRS/GAAP-gain Other unrealized gains or adjustments to the retained earnings as a
result of certain transactions accounted for under the PFRSAdd: Non-actual losses
Depreciation on revaluation increment (after tax)Adjustment due to deviation from PFRS/GAAP – loss Loss on fair value adjustment of investment property (after tax)
Net Income Actual/Realized 13,895,465,590Php Less: Other adjustments
Dividend declarations during the period (4,006,666,131) Treasury Shares (1,260,780,037)
8,628,019,422 Unappropriated Retained Earnings, as adjusted, ending 67,866,157,244
Items

AYALA LAND, INC. AND SUBSIDIARIESSCHEDULE FINANCIAL SOUNDNESS INDICATORSDecember 31, 2020
Ratio Formula Current Year Prior Year
Current ratio Current assets / Current liabilities 1.62 1.30
Acid test ratio Quick assets (Total current assets excluding inventory) / Current liabilities)
0.89 0.77
Solvency ratio EBITDA / Total debt (Total debt includes short-term debt, long-termdebt and current portion of long-term debt)
0.15 0.31
Debt-to-equity ratio Total debt / Consolidated stockholders’ equity 0.81 0.87
Asset-to-equity ratio Total assets / Consolidated stockholders’ equity 2.77 2.94
Interest rate coverage ratio EBITDA / Interest expense 2.96 6.27
Return on equityNet income attributable to equity holders of the company / Average total stockholders’ equity
0.04 0.17
Return on assets Net income after tax / Average total assets 0.02 0.06
Net profit marginNet income attributable to equity holders of the company / Total consolidated revenue
0.09 0.20

AYALA LAND, INC. AND SUBSIDIARIESCORPORATE ORGANIZATIONAL CHARTAs of December 31, 2020
44.4% 35.1% 100% 100%
50% 100% 0.06% 30.8%50%
40% 100% 30.81% 33.5%60% 2.05% 20.0%
100% 100% 78.1% 100%
100% 100% 100% 100%
100% 78.8% 60% 100%
Legend:% of ownership appearing outside the box - direct % of economic ownership % of ownership appearing inside the box - effective % of economic ownership
47.3%
16.23% 52.03%
0.04%
100% 100% 100%
AYALA CORPORATION
MERMAC, INC.
AYALA LAND, INC.MANILA WATER
COMPANY, INC. (51.4%)
AC INDUSTRIAL TECHNOLOGY
HOLDINGS, INC.AC ENERGY, INC.
AYALA HOTELS, INC. (72.2%)
LAGDIGAN LAND CORPORATION (66.7%)
PHILWATER HOLDINGS COMPANY, INC.
MICHIGAN HOLDINGS, INC.
INTEGRATED MICROELECTRONICS,
INC. (52.1%)
AC INFRASTRUCTURE HOLDINGS CORPORATION
AYALA HEALTHCARE HOLDINGS, INC.
AC VENTURES HOLDING CORP.
BANK OF THE PHILIPPINE ISLANDS
(48.5%)
GLOBE TELECOM, INC.
iPEOPLE, INC.
LIONTIDE HOLDINGS INC.
AYALA AVIATION CORPORATION
AG COUNSELORS CORPORATION
HCX TECHNOLOGY PARTNERS, INC.
AZALEA INTERNATIONAL VENTURE PARTNERS
LIMITED
DARONG AGRICULTURAL AND DEVELOPMENT
CORPORATION
TECHNOPARK LAND, INC.
ASIACOM PHILIPPINES, INC.
BESTFULL HOLDINGS LIMITED
AC INTERNATIONALFINANCE LIMITED
AYC FINANCE LIMITEDPUREFOODS
INTERNATIONAL LIMITED

Subsidiaries Ayala Land, Inc.
Alveo Land Corporation
(100%)
Serendra, Inc. (39%)
Solinea, Inc. (formerly Bigfoot
Palms, Inc.) (65%)
BGSouth Properties, Inc. (50%)
Portico Land Corp. (60%)
Alveo-Federal Land Communities, Inc.
(50%)
Serendra, Inc. (28%)
Amorsedia Developmen
t Corporation
(100%)
OLC Developmen
t Corporation
(100%)
Ayala Greenfield
Development Corp. (50%)
HLC Developmen
t Corporation
(100%)
Allysonia International Ltd (100%)
Avida Land Corporation
(100%)
Buklod Bahayan
Realty and Developmen
t Corp. (100%)
Avida Sales Corp. (100%)
Amicassa Process
Solutions, Inc. (100%)
BGNorth Properties, Inc. (50%)
Avenco South
Corporation (70%)
Buendia Landholdings, Inc. (100%)
Ayala Land Sales, Inc.
(100%)
Amaia Land Co. (formerly First Realty
Communities, Inc.) (100%)
Amaia Southern
Properties, Inc. (65%)
Ayala Land International
Sales, Inc. (100%)
Ayalaland International Marketing, Inc. (AIMI)
(100%)
Ayala Land International (Singapore)
Pte. Ltd. (100%)
Ayalaland International
Marketing (Hong Kong)
Limited (100%)
Ayala Land International Marketing , SRL (100%)
Ayala Land International
Marketing London (100%)
Crans Montana Holdings,
Inc. (100%)
Crimson Field
Enterprises, Inc. (100%)
Ecoholdings Company, Inc. (100%)
NorthBeacon Commercial Corporation
(100%)
Red Creek Properties, Inc. (100%)
Ayala Land, Inc.
Regent Time
International, Limited
(100%)
North Eastern Commercial
Corp. (formerly Asterion
Technopod, Incorporated)
(100%)
Westview Commercial
Ventures Corp (formerly
Crestview E-Office
Corporation) (100%)
North Ventures Commercial
Corp. (formerly Fairview Prime
Commercial Corp.)
(100%)
Hillsford Property
Corporation (100%)
Primavera Towncentr
e, Inc. (100%)
Summerhill E-Office
Corporation (100%)
Sunnyfield E-Office
Corporation (100%)
Subic Bay Town
Centre, Inc. (100%)
Regent Wise
Investments Limited (100%)
AyalaLand Real Estate
AyalaLand Advisory
AyalaLand Development (Canada) Inc.
Tianjin Eco City Ayala Land
MCT Bhd. (66.25%)
Blue Horizons Holdings PTE,
AyalaLand OpenAsia
Holdings PTE,
AREIT Fund Manager, Inc. (formerly AyalaLand
Commercial REIT, Inc.) (100%)
Arvo Commercial Corporation
(100%)
BellaVita Land
Corporation (100%)
ALO Prime Realty
Corporation (100%)
AyalaLand Offices, Inc. (ALO) (formerly ALI Property Partners
Corp. (APPCo)) (100%)
First Gateway
AREIT, Inc. (formerly One Dela Rosa
Property Development, Inc.)
(54%)

Bonifacio Land Corp.
(5%)(An
Associate of ALI Group)
Fort Bonifacio Development Corporation
(55%)
(100%) (100%) Estate Investments Inc.
(100%)
Rize-AyalaLand (Kingsway) GP Inc.,
(49%) (An Associate of ALI
Group)
Advisory Broadway Inc.
(100%)
Development (Canada) Inc.
(100%)
Tianjin Eco City Ayala Land
Development Co., Ltd. (40%)
(An Associate of ALI Group)
MCT Bhd. (66.25%)
Holdings PTE, Limited (100%)
OpenAsia Holdings PTE, Ltd. (100%)
First Gateway Real Estate
Corp. (100%)
Glensworth Development,
Inc. (100%)
UP North Property Holdings,
Inc. (100%)
Ayala Land, Inc.
Aurora Properties,
Incorporated (81%)Soltea
Commercial Corp. (20%)
Vesta Property
Holdings, Inc. (78%)
Station Square East
Commercial Corporation
(69%)
Accendo Commercial Corp. (67%)
Avenco South Corporation
(30%)Aviana
Development Corporation
(10%)
Cagayan de Oro
Gateway Corp. (70%)
Ceci Realty, Inc. (60%)
Soltea Commerci
al Corp. (20%)
CMPI Holdings, Inc.
(60%)CMPI
Land, Inc. (60%)
ALI-CII Development Corporation
(50%)
Roxas Land Corporation
(50%)
Makati Development
Corporation (100%)MDC -Subic
(100%)MDC -
Build Plus (100%)
MDC Equipment Solutions, Inc. (100%)
MDC Conqrete
Inc. (100%)MDBI
Construction Corp. (67%)
Ayala Hotels, Inc. (50%)
AyalaLand Hotels and Resorts Corporation
(100%)Enjay Hotels, Inc.
(100%)Cebu Insular Hotel
Company, Inc. (63%)
Greenhaven Property Venture, Inc. (100%)
Bonifacio Hotel Ventures, Inc. (100%)
Southcrest Hotel Ventures, Inc. (67%)
Northgate Hotel Ventures, Inc. (70%)
North Triangle Hotel Ventures, Inc. (100%)
Ecosouth Hotel Ventures, Inc. (100%)ALI Makati Hotels &
Residences, Inc. (80%)ALI Makati Hotel
Property, Inc. (80%)
Regent Horizons Conservation Company, Inc. (formerly Asian
Conservation Company, Inc. (100%)Ten Knots Phils, Inc. and
Subsidiary (40%)
Ten Knots Development, Corp. and Subs (40%)Sentera Hotel
Ventures Inc. (100%)Econorth Resorts
Ventures, Inc. (100)ALI Triangle Hotel
Ventures, Inc. (100%)ArcaSouth Hotel
Ventures, Inc. (ASHVI) (100%)
Capitol Central Hotel Ventures, Inc. (CCHVI) (100%)
Circuit Makati Hotel Ventures,
Lagdian Land Corporation (60%)

Circuit Makati Hotel Ventures, Inc. (CMHVI) (100%)
Sicogon Town Hotel, Inc.
(100%)Sicogon Island Tourism
Estate, Corp. (100%)
Bay Area Hotel Ventures, Inc. (100%)
Makati North Hotel Ventures, Inc. (100%)
One Makati Hotel Ventures, Inc. (100%)
One Makati Residential Ventures, Inc. (100%)
Asiatown Hotel Ventures, Inc. (100%)
Ayala Land, Inc.
Ten Knots Phils, Inc. (60%)
Bacuit Bay Development
Corporation (100%)
Paragua Eco-Resort Ventures Inc. (100%)
North Liberty Resort Ventures Inc. (100%)
Lio Resort Ventures Inc.
(100%)
Lio Tourism Estate Management Corp(100%)
Ten Knots Development Corp.
(60%)
Chirica Resorts Corp. (100%)
Kingfisher Capital Resources Corp.
(100%)
Pangalusian Island Resort Corporation
(100%)
Ayala Property Management
Corporation (100%)
Prime Support Services, Inc. (100%)
Ayala Theatres Management, Inc.
(100%)Five Star
Cinema, Inc. (100%)
Leisure and Allied Industries
Philippines, Inc. (50%)
ALInet.com, Inc. (100%)
Cavite Commercial Town
Center, Inc. (100%)
First Longfield Investments Limited
(100%)
Green Horizons Holdings Limited (100%)
PCM Formosa Company Limited (50%)
Esta Galleria, Inc. (100%)
Horizon Wealth Holdings Limited (100%)
Aprisa Business Process
Solutions, Inc. (100%)
DirectPower Services, Inc. (100%)
Philippine Integrated Energy Solutions, Inc.
(100%)ALI Capital Corp. (formerly Varejo
Corporation) (100%)
Airswift Transport, Inc. (formerly Island Transvoyager, Inc.)
(100%)
Swift Aerodrome Services, Inc. (100%)
SIAL Specialty Retailers, Inc. (50%)
(Joint Venture Entity of ALI group)
AyaGold Retailers, Inc. (50%) (Joint
Venture Entity of ALI group)
Integrated Eco-resort Inc. (100%)
Adauge Commercial
Corporation (60%)
Ayalaland Estates, Inc. (formerly Southgateway Development Corp.) (100%)

Ayala Land, Inc.
Central Block Developers, Inc.. (45%)
Central Bloc Hotel Ventures, Inc. (100%)
AyalaLand Club Management, Inc. (100%)
North Triangle Depot Commercial Corporation
(73%)
Soltea Commercial Corp. (60%)
Cebu Holdings, Inc. (71%)
Taft Punta Engaño Property Inc. (55%)
Asian I-Office Properties, Inc. (100%)
Cebu Leisure Company, Inc. (100%)
CBP Theatre Management Inc.
(100%)
Cebu Insular Hotel Company, Inc. (37%)
Solinea, Inc. (formerly Bigfoot Palms, Inc.
(35%)
Amaia Southern Properties, Inc. (35%)
Cebu District Property Enterprise, Inc. (15%)
Southportal Properties, Inc. (35%)
Central Block Developers, Inc. (55%)
Central Bloc Hotel Ventures, Inc. (100%)
BGWest Properties, Inc.
(50%)
Verde Golf Development
Corporation (100%)Alabang Commercial Corporation (50%)
South Innovative Theater Management,
Inc. (100%)
Whiteknight Holdings, Inc.
(100%)
Mercado General Hospital, Inc. (33%) (An Associate of ALI
Group)
Ayala Land, Inc.
AREIT Property Managers, Inc. (formerly Next Urban Alliance Development Corp.) (100%)
Arca South Integrated
Transport System, Inc. (100%)
Nuevo Centro, Inc. (54%)
Alviera Country Club (93%)
Ayalaland MetroNorth, Inc. (100%)
Southportal Properties, Inc. (65%)
Arca South Commercial
Ventures Corp.(100%)
Bay City Commercial
Ventures Corp. (100%)
Capitol Central Commercial
Ventures Corp.(100%)
Aviana Development Corporation (50%)
Ayala Land Malls, Inc.
(formerly Solerte, Inc.)(100%)
AyalaLand Malls Vismin, Inc. (100%)
AyalaLand Malls NorthEast, Inc.
(100%)
Ayalaland Medical Facilities Leasing Inc.
(100%)

Direct Investments in Joint Ventures Direct Investments in Associates
Ayala Land, Inc.
Ayalaland Malls
Synergies, Inc. (100%)
Altaraza Prime Realty Corporation
(100%)
Altaraza Development
Corporation(51%)
AyalaLand Premier,
Inc.(100%)
Makati Cornerstone Leasing Corp.(100%)
Anvaya Cove Golf and Sports Club, Inc. (76%)
Anvaya Cove Beach and Nature Club, Inc.
(73%)
Ayalaland Logistics Holdings Corp.
(71%)
Orion Land Inc. (100%)
Orion Property
Development, Inc. (100%)
Tutuban Properties, Inc. (100%)
TPI Holdings Corporation
(100%)
FLT Prime Insurance Corp. (78.77%)
Orion Solutions, Inc.
(100%)
OE Holdings,
Inc. (100%)
Orion Maxis Inc.
(100%)
ZHI Holdings,
Inc. (100%)
Orion I Holdings
Philippines, Inc. (100%)
Lepanto Ceramics,
Inc. (100%)
Laguna Technopark, Inc. (95%)
Ecozone Power Management, Inc.
(100%)
Unity Realty & Development Corp.
(100%)
Prow Holdings Inc. (55%)
ALI Commercial Center, Inc. (100%)
AMC Japan Concepts, Inc.
(75%)
Ayala Land, Inc. Ayala Land, Inc.

Ayala Land, Inc.
Cebu District Property Enterprise,
Inc. (35%)
Emerging City Holdings, Inc. (50%)
Columbus Holdings, Inc. (70%)
Berkshires Holdings, Inc. (50%)
Columbus Holdings, Inc. (30%)
ALI Eton Property Development
Corporation (50%)
AKL Properties, Inc. (50%)
Ayala Land, Inc.
Bonifacio Land Corp. (5%)
(An Associate of the Group)
Fort Bonifacio Development Corp.
(55%)
Lagoon Development
Corporation (30%)
ALI Makati Hotels & Residences, Inc. (20%)
(Subsidiary of the Group)
ALI Makati Property, Inc. (20%) (Subsidiary
of the Group)
OCLP Holdings, Inc. (21%)
Ortigas and Company Limited
Partnership (99.5%)
Bonifacio Land Corp. (70%)
Fort Bonifacio Development Corp. (55%)

AYALA LAND, INC. AND SUBSIDIARIESANNEX I – BOND PROCEEDS
P6.3 Billion Fixed Rate Bonds due 2025
ESTIMATED (In pesos) PER PROSPECTUSIssue Amount 6,250,000,000.00 6,250,000,000.00Less: Estimated Upfront Expenses SEC Registration & Legal Research Fee 1,578,155.00 1,578,155.00 Documentary Stamp Tax 46,875,000.00 46,875,000.00 Underwriting Fee 23,437,500.00 23,437,500.00 Estimated Professional Expenses & Agency fees 5,000,000.00 5,520,092.00 Marketing/Printing/Photocopying Costs and OPEs 1,000,000.00 274,183.33 Listing Fee 100,000.00 100,000.00Total Expenses 77,990,655.00 77,784,930.33Net Proceeds 6,172,009,345.00 6,172,215,069.67
Balance of Proceeds as of 12.31.2020 NIL
P10.0 Billion Fixed Rate Bonds due 2022 NIL
ESTIMATED (In pesos) PER PROSPECTUSIssue Amount 10,000,000,000.00 10,000,000,000.00Less: Estimated Upfront Expenses SEC Registration & Legal Research Fee 3,093,125.00 1,578,155.00 Documentary Stamp Tax 75,000,000.00 46,875,000.00 Underwriting Fee 37,500,000.00 23,437,500.00 Estimated Professional Expenses & Agency fees 9,000,000.00 5,478,301.00 Marketing/Printing/Photocopying Costs and OPEs 1,000,000.00 428,993.33 Listing Fee 150,000.00 100,000.00Total Expenses 125,743,125.00 77,897,949.33Net Proceeds 9,874,256,875.00 9,922,102,050.67
Balance of Proceeds as of 12.31.2020 NIL
P9.0 Billion Fixed Rate Bonds due 2021 and P1.0 Billion Fixed Rate Bonds due 2027
ESTIMATED (In pesos) PER PROSPECTUSIssue Amount 10,000,000,000.00 10,000,000,000.00Less: Estimated Upfront Expenses SEC Registration & Legal Research Fee 3,093,125.00 3,093,125.00 Documentary Stamp Tax 75,000,000.00 75,000,000.00 Underwriting Fee 37,500,000.00 37,500,000.00 Estimated Professional Expenses & Agency fees 9,000,000.00 4,206,571.43 Marketing/Printing/Photocopying Costs and OPEs 1,000,000.00 118,285.00 Listing Fee 150,000.00 253,611.12Total Expenses 125,743,125.00 124,378,163.98Net Proceeds 9,874,256,875.00 9,875,621,836.02
Balance of Proceeds as of 12.31.2020 NIL
P3.0 Billion Fixed Rate Bonds due 2024 NIL
ESTIMATED (In pesos) PER PROSPECTUSIssue Amount 3,000,000,000.00 3,000,000,000.00Less: Estimated Upfront Expenses SEC Registration & Legal Research Fee 757,500.00 757,500.00 Documentary Stamp Tax 22,500,000.00 22,500,000.00 Underwriting Fee 11,250,000.00 11,025,000.00 Estimated Professional Expenses & Agency fees 9,000,000.00 3,965,234.71 Marketing/Printing/Photocopying Costs and OPEs 1,000,000.00 69,300.00 Listing Fee 150,000.00 151,708.34
Ayala Land raised from the Bonds gross proceeds of P10.0 billion. After issue-related expenses, actual net proceeds amounted to approximately P9.88 billion. Net proceeds were used to partially finance various projects.
ACTUAL
Ayala Land raised from the Bonds gross proceeds of P6.3 billion. After issue-related expenses, actual net proceeds amounted to approximately P6.17 billion. Net proceeds were used to refinance the Company’s 4.725% per annum ₱1.8 billion term loan maturity on September 29, 2020, 4.625% per annum ₱4.0 billion bond maturity on October 10, 2020 and a portion of its existing short-term loans.
ACTUAL
Ayala Land raised from the Bonds gross proceeds of P10.0 billion. After issue-related expenses, actual net proceeds amounted to approximately P9.92 billion. Net proceeds were used to partially finance the Company’s general corporate requirements.
ACTUAL
ACTUAL
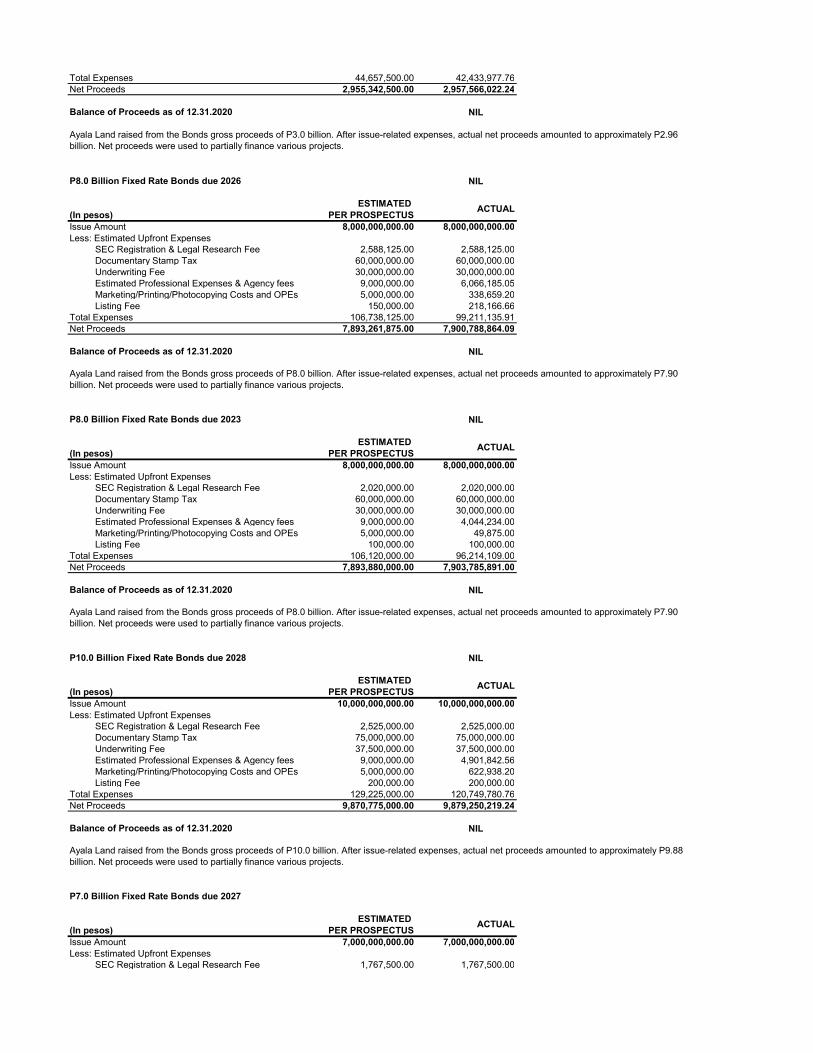
Total Expenses 44,657,500.00 42,433,977.76Net Proceeds 2,955,342,500.00 2,957,566,022.24
Balance of Proceeds as of 12.31.2020 NIL
P8.0 Billion Fixed Rate Bonds due 2026 NIL
ESTIMATED (In pesos) PER PROSPECTUSIssue Amount 8,000,000,000.00 8,000,000,000.00Less: Estimated Upfront Expenses SEC Registration & Legal Research Fee 2,588,125.00 2,588,125.00 Documentary Stamp Tax 60,000,000.00 60,000,000.00 Underwriting Fee 30,000,000.00 30,000,000.00 Estimated Professional Expenses & Agency fees 9,000,000.00 6,066,185.05 Marketing/Printing/Photocopying Costs and OPEs 5,000,000.00 338,659.20 Listing Fee 150,000.00 218,166.66Total Expenses 106,738,125.00 99,211,135.91Net Proceeds 7,893,261,875.00 7,900,788,864.09
Balance of Proceeds as of 12.31.2020 NIL
P8.0 Billion Fixed Rate Bonds due 2023 NIL
ESTIMATED (In pesos) PER PROSPECTUSIssue Amount 8,000,000,000.00 8,000,000,000.00Less: Estimated Upfront Expenses SEC Registration & Legal Research Fee 2,020,000.00 2,020,000.00 Documentary Stamp Tax 60,000,000.00 60,000,000.00 Underwriting Fee 30,000,000.00 30,000,000.00 Estimated Professional Expenses & Agency fees 9,000,000.00 4,044,234.00 Marketing/Printing/Photocopying Costs and OPEs 5,000,000.00 49,875.00 Listing Fee 100,000.00 100,000.00Total Expenses 106,120,000.00 96,214,109.00Net Proceeds 7,893,880,000.00 7,903,785,891.00
Balance of Proceeds as of 12.31.2020 NIL
P10.0 Billion Fixed Rate Bonds due 2028 NIL
ESTIMATED (In pesos) PER PROSPECTUSIssue Amount 10,000,000,000.00 10,000,000,000.00Less: Estimated Upfront Expenses SEC Registration & Legal Research Fee 2,525,000.00 2,525,000.00 Documentary Stamp Tax 75,000,000.00 75,000,000.00 Underwriting Fee 37,500,000.00 37,500,000.00 Estimated Professional Expenses & Agency fees 9,000,000.00 4,901,842.56 Marketing/Printing/Photocopying Costs and OPEs 5,000,000.00 622,938.20 Listing Fee 200,000.00 200,000.00Total Expenses 129,225,000.00 120,749,780.76Net Proceeds 9,870,775,000.00 9,879,250,219.24
Balance of Proceeds as of 12.31.2020 NIL
P7.0 Billion Fixed Rate Bonds due 2027
ESTIMATED (In pesos) PER PROSPECTUSIssue Amount 7,000,000,000.00 7,000,000,000.00Less: Estimated Upfront Expenses SEC Registration & Legal Research Fee 1,767,500.00 1,767,500.00
Ayala Land raised from the Bonds gross proceeds of P3.0 billion. After issue-related expenses, actual net proceeds amounted to approximately P2.96 billion. Net proceeds were used to partially finance various projects.
ACTUAL
Ayala Land raised from the Bonds gross proceeds of P8.0 billion. After issue-related expenses, actual net proceeds amounted to approximately P7.90 billion. Net proceeds were used to partially finance various projects.
ACTUAL
Ayala Land raised from the Bonds gross proceeds of P8.0 billion. After issue-related expenses, actual net proceeds amounted to approximately P7.90 billion. Net proceeds were used to partially finance various projects.
ACTUAL
Ayala Land raised from the Bonds gross proceeds of P10.0 billion. After issue-related expenses, actual net proceeds amounted to approximately P9.88 billion. Net proceeds were used to partially finance various projects.
ACTUAL

Documentary Stamp Tax 35,000,000.00 35,000,000.00 Underwriting Fee 26,250,000.00 26,250,000.00 Estimated Professional Expenses & Agency fees 9,000,000.00 3,161,187.20 Marketing/Printing/Photocopying Costs and OPEs 5,000,000.00 990,430.17 Listing Fee 100,000.00 100,000.00Total Expenses 74,617,500.00 67,269,117.37Net Proceeds 6,925,382,500.00 6,932,730,882.63
Balance of Proceeds as of 12.31.2020 NIL
P7.0 Billion Fixed Rate Bonds due 2023 and P3.0 Billion Homestarter Bonds due 2019
ESTIMATED (In pesos) PER PROSPECTUSIssue Amount 10,000,000,000.00 10,000,000,000.00Less: Estimated Upfront Expenses SEC Registration & Legal Research Fee 2,525,000.00 2,525,000.00 Documentary Stamp Tax 50,000,000.00 50,000,000.00 Underwriting Fee 44,250,000.00 26,250,000.00 Estimated Professional Expenses & Agency fees 9,000,000.00 2,960,000.00 Marketing/Printing/Photocopying Costs and OPEs 5,000,000.00 201,849.33 Listing Fee 200,000.00 200,000.00Total Expenses 110,975,000.00 82,136,849.33Net Proceeds 9,889,025,000.00 9,917,863,150.67
Balance of Proceeds as of 12.31.2020 NIL
P7.0 Billion Fixed Rate Bonds due 2025
ESTIMATED (In pesos) PER PROSPECTUSIssue Amount 7,000,000,000.00 8,000,000,000.00Less: Estimated Upfront Expenses SEC Registration & Legal Research Fee 1,767,500.00 1,767,500.00 Documentary Stamp Tax 35,000,000.00 35,000,000.00 Underwriting Fee 26,250,000.00 26,250,000.00 Estimated Professional Expenses & Agency fees 7,500,000.00 2,301,963.00 Marketing/Printing/Photocopying Costs and OPEs 2,500,000.00 248,847.18 Listing Fee 100,000.00 100,000.00Total Expenses 73,117,500.00 65,668,310.18Net Proceeds 6,926,882,500.00 6,934,331,689.82
Balance of Proceeds as of 12.31.2020 NIL
P8.0 Billion Fixed Rate Bonds due 2026 NIL
ESTIMATED (In pesos) PER PROSPECTUSIssue Amount 8,000,000,000.00 8,000,000,000.00Less: Estimated Upfront Expenses SEC Registration & Legal Research Fee 2,588,125.00 2,588,125.00 Documentary Stamp Tax 40,000,000.00 40,000,000.00 Underwriting Fee 30,000,000.00 30,000,000.00 Estimated Professional Expenses & Agency fees 7,500,000.00 3,651,246.00 Marketing/Printing/Photocopying Costs and OPEs 2,500,000.00 398,937.60 Listing Fee 100,000.00 100,000.00Total Expenses 82,688,125.00 76,738,308.60Net Proceeds 7,917,311,875.00 7,923,261,691.40
Balance of Proceeds as of 12.31.2020 NIL
P7.0 Billion Fixed Rate Bonds due 2022 NIL
ESTIMATED
Ayala Land raised from the Bonds gross proceeds of P10.0 billion. After issue-related expenses, actual net proceeds amounted to approximately P9.9 billion. Net proceeds were used to partially finance various projects.
Ayala Land raised from the Bonds gross proceeds of P10.0 billion. After issue-related expenses, actual net proceeds amounted to approximately P6.92 billion. Net proceeds were used to partially finance various projects.
ACTUAL
ACTUAL
Ayala Land raised from the Bonds gross proceeds of P7.0 billion. After issue-related expenses, actual net proceeds amounted to approximately P6.9 billion. Net proceeds were used to partially finance various projects.
ACTUAL
Ayala Land raised from the Bonds gross proceeds of P8.0 billion. After issue-related expenses, actual net proceeds amounted to approximately P7.9 billion. Net proceeds were used to partially finance various projects.
ACTUAL
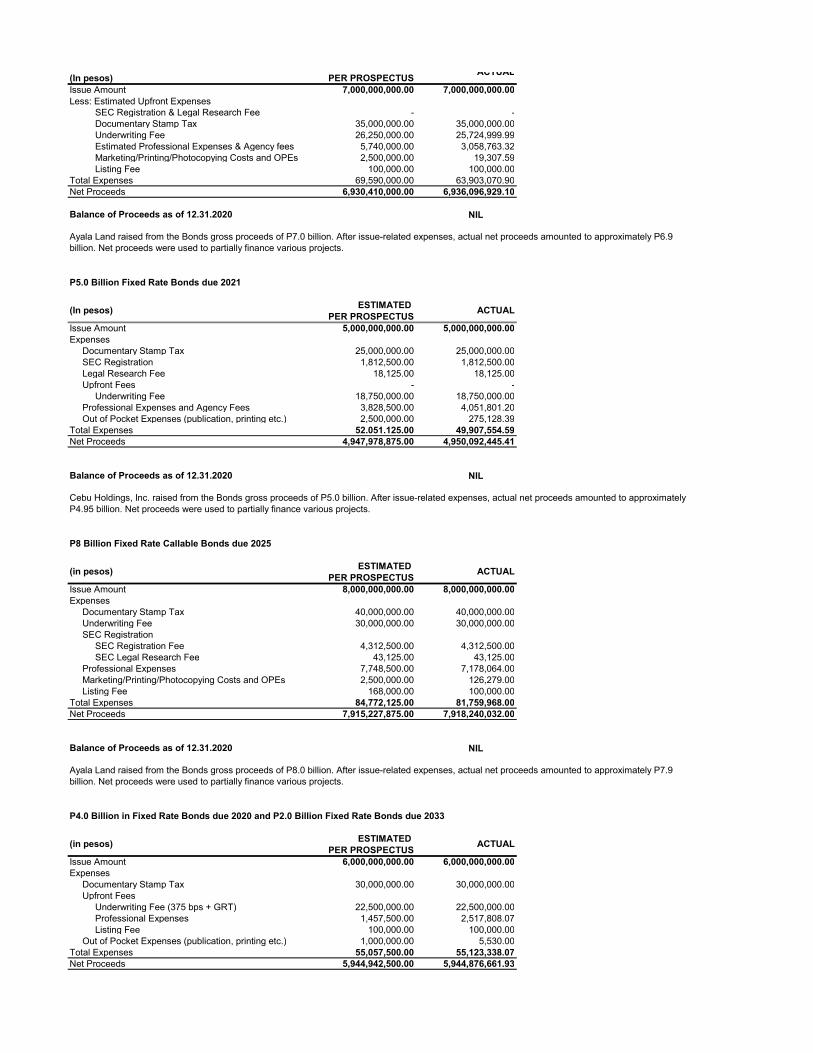
(In pesos) PER PROSPECTUSIssue Amount 7,000,000,000.00 7,000,000,000.00Less: Estimated Upfront Expenses SEC Registration & Legal Research Fee - - Documentary Stamp Tax 35,000,000.00 35,000,000.00 Underwriting Fee 26,250,000.00 25,724,999.99 Estimated Professional Expenses & Agency fees 5,740,000.00 3,058,763.32 Marketing/Printing/Photocopying Costs and OPEs 2,500,000.00 19,307.59 Listing Fee 100,000.00 100,000.00Total Expenses 69,590,000.00 63,903,070.90Net Proceeds 6,930,410,000.00 6,936,096,929.10
Balance of Proceeds as of 12.31.2020 NIL
P5.0 Billion Fixed Rate Bonds due 2021
ESTIMATED PER PROSPECTUS
Issue Amount 5,000,000,000.00 5,000,000,000.00Expenses Documentary Stamp Tax 25,000,000.00 25,000,000.00 SEC Registration 1,812,500.00 1,812,500.00 Legal Research Fee 18,125.00 18,125.00 Upfront Fees - - Underwriting Fee 18,750,000.00 18,750,000.00 Professional Expenses and Agency Fees 3,828,500.00 4,051,801.20 Out of Pocket Expenses (publication, printing etc.) 2,500,000.00 275,128.39Total Expenses 52.051.125.00 49,907,554.59Net Proceeds 4,947,978,875.00 4,950,092,445.41
Balance of Proceeds as of 12.31.2020 NIL
P8 Billion Fixed Rate Callable Bonds due 2025
ESTIMATED PER PROSPECTUS
Issue Amount 8,000,000,000.00 8,000,000,000.00Expenses Documentary Stamp Tax 40,000,000.00 40,000,000.00 Underwriting Fee 30,000,000.00 30,000,000.00 SEC Registration SEC Registration Fee 4,312,500.00 4,312,500.00 SEC Legal Research Fee 43,125.00 43,125.00 Professional Expenses 7,748,500.00 7,178,064.00 Marketing/Printing/Photocopying Costs and OPEs 2,500,000.00 126,279.00 Listing Fee 168,000.00 100,000.00Total Expenses 84,772,125.00 81,759,968.00Net Proceeds 7,915,227,875.00 7,918,240,032.00
Balance of Proceeds as of 12.31.2020 NIL
P4.0 Billion in Fixed Rate Bonds due 2020 and P2.0 Billion Fixed Rate Bonds due 2033
ESTIMATED PER PROSPECTUS
Issue Amount 6,000,000,000.00 6,000,000,000.00Expenses Documentary Stamp Tax 30,000,000.00 30,000,000.00 Upfront Fees Underwriting Fee (375 bps + GRT) 22,500,000.00 22,500,000.00 Professional Expenses 1,457,500.00 2,517,808.07 Listing Fee 100,000.00 100,000.00 Out of Pocket Expenses (publication, printing etc.) 1,000,000.00 5,530.00Total Expenses 55,057,500.00 55,123,338.07Net Proceeds 5,944,942,500.00 5,944,876,661.93
Ayala Land raised from the Bonds gross proceeds of P8.0 billion. After issue-related expenses, actual net proceeds amounted to approximately P7.9 billion. Net proceeds were used to partially finance various projects.
ACTUAL
Ayala Land raised from the Bonds gross proceeds of P7.0 billion. After issue-related expenses, actual net proceeds amounted to approximately P6.9 billion. Net proceeds were used to partially finance various projects.
(In pesos) ACTUAL
Cebu Holdings, Inc. raised from the Bonds gross proceeds of P5.0 billion. After issue-related expenses, actual net proceeds amounted to approximately P4.95 billion. Net proceeds were used to partially finance various projects.
(in pesos) ACTUAL
(in pesos) ACTUAL

Balance of Proceeds as of 12.31.2020 NIL
P15.0 Billion Fixed Rate Bonds due 2024
ESTIMATED PER PROSPECTUS
Issue Amount 15,000,000,000.00 15,000,000,000.00Expenses Documentary Stamp Tax 75,000,000.00 75,000,000.00 SEC Registration 5,812,500.00 5,812,500.00 Legal Research Fee 58,125.00 58,125.00 Upfront Fees Underwriting Fee 56,250,000.00 56,250,000.00 Professional Expenses 7,336,000.00 401,082.05 Trustee 20,000.00 20,000.00 Registry Account Opening Fee 150,000.00 150,000.00 Listing Fee 100,000.00 100,000.00 Out of Pocket Expenses (publication, printing etc.) 2,500,000.00 97,807.91Total Expenses 147,226,625.00 137,889,514.96Net Proceeds 14,852,773,375.00 14,862,110,485.04
Balance of Proceeds as of 12.31.2020 NIL
P9.35 Billion Fixed Rate Callable Bonds due 2019 and P5.65 Billion Fixed Rate Callable Bonds due 2022
ESTIMATED PER PROSPECTUS
Issue Amount 15,000,000,000.00 15,000,000,000.00Expenses Documentary Stamp Tax 75,000,000.00 75,000,000.00 Underwriting Fee 54,035,000.00 54,035,000.00 Rating Fee 5,040,000.00 4,125,000.00 SEC Registration SEC Registration Fee 4,312,500.00 4,312,500.00 SEC Legal Research Fee 43,125.00 43,125.00 Professional Expenses 1,960,000.00 3,064,146.00 Marketing/Printing/Photocopying Costs and OPEs 500,000.00 383,755.82 Registry and Paying Agency Fee 337,500.00 1,056,314.87 Trustee Fees 112,500.00 20,000.00 Listing Fee 100,000.00 443,666.68Total Expenses 141,440,625.00 142,483,508.37Net Proceeds 14,858,559,375.00 14,857,516,491.63
Balance of Proceeds as of 12.31.2020 NIL
(in pesos) ACTUAL
Ayala Land raised from the Bonds gross proceeds of P15.0 billion. After issue-related expenses, actual net proceeds amounted to approximately P14.9 billion. Net proceeds were used to partially finance various projects.
Ayala Land raised from the Bonds gross proceeds of P6.0 billion. After issue-related expenses, actual net proceeds amounted to approximately P5.9 billion. Net proceeds were used to partially finance various projects.
(in pesos) ACTUAL
Ayala Land raised from the Bonds gross proceeds of P15.0 billion. After issue-related expenses, actual net proceeds amounted to approximately P14.9 billion. Net proceeds were used to partially finance various projects.


*SGVFSM005262*
C O V E R S H E E Tfor
AUDITED FINANCIAL STATEMENTS
SEC Registration Number
1 5 2 7 4 7
C O M P A N Y N A M E
A Y A L A L A N D , I N C . A N D S U B S I D I A R
I E S
PRINCIPAL OFFICE ( No. / Street / Barangay / City / Town / Province )
3 1 s t F l o o r , T o w e r O n e a n d E x c h
a n g e P l a z a , A y a l a T r i a n g l e , A y
a l a A v e n u e , M a k a t i C i t y
Form Type Department requiring the report Secondary License Type, If Applicable
A A F S
C O M P A N Y I N F O R M A T I O N
Company’s Email Address Company’s Telephone Number Mobile Number
[email protected] 7 908-3677
No. of Stockholders Annual Meeting (Month / Day) Fiscal Year (Month / Day)
11,862 04/22 12/31
CONTACT PERSON INFORMATION
The designated contact person MUST be an Officer of the Corporation
Name of Contact Person Email Address Telephone Number/s Mobile Number
Ma. Luisa D. Chiong [email protected]
7 908-3681
CONTACT PERSON’s ADDRESS
30th Floor, Tower One and Exchange Plaza, Ayala Triangle, Ayala Avenue, Makati City
NOTE 1 : In case of death, resignation or cessation of office of the officer designated as contact person, such incident shall be reported to the Commission withinthirty (30) calendar days from the occurrence thereof with information and complete contact details of the new contact person designated.
2 : All Boxes must be properly and completely filled-up. Failure to do so shall cause the delay in updating the corporation’s records with the Commissionand/or non-receipt of Notice of Deficiencies. Further, non-receipt of Notice of Deficiencies shall not excuse the corporation from liability for its deficiencies.
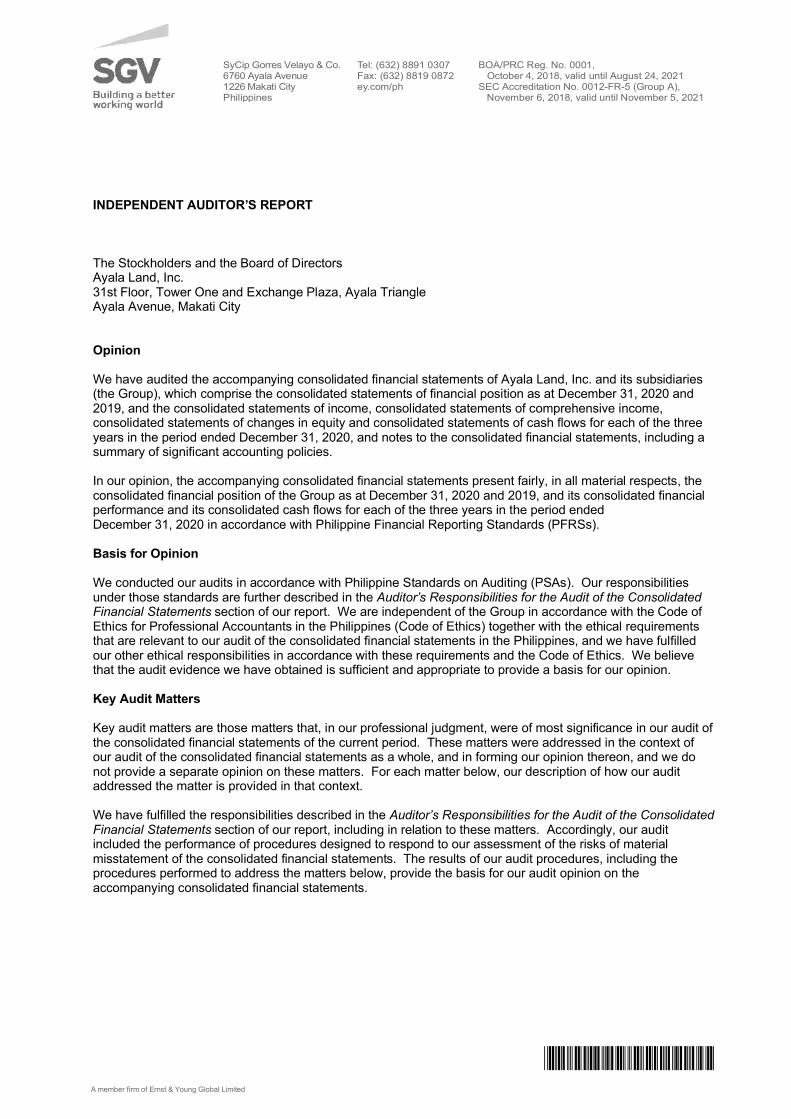
*SGVFSM005262*
INDEPENDENT AUDITOR’S REPORT
The Stockholders and the Board of DirectorsAyala Land, Inc.31st Floor, Tower One and Exchange Plaza, Ayala TriangleAyala Avenue, Makati City
Opinion
We have audited the accompanying consolidated financial statements of Ayala Land, Inc. and its subsidiaries(the Group), which comprise the consolidated statements of financial position as at December 31, 2020 and2019, and the consolidated statements of income, consolidated statements of comprehensive income,consolidated statements of changes in equity and consolidated statements of cash flows for each of the threeyears in the period ended December 31, 2020, and notes to the consolidated financial statements, including asummary of significant accounting policies.
In our opinion, the accompanying consolidated financial statements present fairly, in all material respects, theconsolidated financial position of the Group as at December 31, 2020 and 2019, and its consolidated financialperformance and its consolidated cash flows for each of the three years in the period endedDecember 31, 2020 in accordance with Philippine Financial Reporting Standards (PFRSs).
Basis for Opinion
We conducted our audits in accordance with Philippine Standards on Auditing (PSAs). Our responsibilitiesunder those standards are further described in the Auditor’s Responsibilities for the Audit of the ConsolidatedFinancial Statements section of our report. We are independent of the Group in accordance with the Code ofEthics for Professional Accountants in the Philippines (Code of Ethics) together with the ethical requirementsthat are relevant to our audit of the consolidated financial statements in the Philippines, and we have fulfilledour other ethical responsibilities in accordance with these requirements and the Code of Ethics. We believethat the audit evidence we have obtained is sufficient and appropriate to provide a basis for our opinion.
Key Audit Matters
Key audit matters are those matters that, in our professional judgment, were of most significance in our audit ofthe consolidated financial statements of the current period. These matters were addressed in the context ofour audit of the consolidated financial statements as a whole, and in forming our opinion thereon, and we donot provide a separate opinion on these matters. For each matter below, our description of how our auditaddressed the matter is provided in that context.
We have fulfilled the responsibilities described in the Auditor’s Responsibilities for the Audit of the ConsolidatedFinancial Statements section of our report, including in relation to these matters. Accordingly, our auditincluded the performance of procedures designed to respond to our assessment of the risks of materialmisstatement of the consolidated financial statements. The results of our audit procedures, including theprocedures performed to address the matters below, provide the basis for our audit opinion on theaccompanying consolidated financial statements.
SyCip Gorres Velayo & Co.6760 Ayala Avenue1226 Makati CityPhilippines
Tel: (632) 8891 0307Fax: (632) 8819 0872ey.com/ph
BOA/PRC Reg. No. 0001, October 4, 2018, valid until August 24, 2021SEC Accreditation No. 0012-FR-5 (Group A),
November 6, 2018, valid until November 5, 2021
A member firm of Ernst & Young Global Limited

*SGVFSM005262*
- 2 -
Real Estate Revenue Recognition
The Group’s revenue recognition process, policies and procedures are significant to our audit because theseinvolve application of significant judgment and estimation: (1) assessment of the probability that the entity willcollect the consideration from the buyer; (2) application of the output method as the measure of progress indetermining real estate revenue; (3) determination of the actual costs incurred as cost of sales; and (4)recognition of cost to obtain a contract.
In evaluating whether collectability of the amount of consideration is probable, the Group considers thesignificance of the buyer’s initial payments (buyer’s equity) in relation to the total contract price. Collectability isalso assessed by considering factors such as past history with buyers, age of residential and officedevelopment receivables and pricing of the property. Management regularly evaluates the historical salescancellations and back-outs, after considering the impact of coronavirus pandemic, if it would still support itscurrent threshold of buyers’ equity before commencing revenue recognition.
In measuring the progress of its performance obligation over time, the Group uses the output method. Thismethod measures progress based on physical proportion of work done on the real estate project which requirestechnical determination by the Group’s specialists (project engineers). This is based on the monthly projectaccomplishment report prepared by the third party surveyor as approved by the construction manager whichintegrates the surveys of performance to date of the construction activities for both sub-contracted and thosethat are fulfilled by the Group itself.
In determining the actual costs incurred to be recognized as cost of sales, the Group estimates costs incurredon materials, labor and overhead which have not yet been billed by the contractor.
The Group identifies sales commission after contract inception as the cost of obtaining the contract. Forcontracts which qualified for revenue recognition, the Group capitalizes the total sales commission due to salesagent as cost to obtain contract and recognizes the related commission payable. The Group uses percentageof completion (POC) method in amortizing sales commission consistent with the Group’s revenue recognitionpolicy.
The disclosures related to real estate revenue are included in Notes 2 and 3 to the consolidated financialstatements.
Audit Response
We obtained an understanding of the Group’s revenue recognition process.
For the buyers’ equity, we evaluated management’s basis of the buyer’s equity by comparing this to thehistorical analysis of sales cancellations from buyers with accumulated payments above the collectionthreshold. We also considered the impact of the coronavirus pandemic to the level of cancellations during theyear. We traced the analysis to supporting documents such as deed of cancellations.
For the application of the output method, in determining real estate revenue, we obtained an understanding ofthe Group’s processes for determining the POC, and performed tests of the relevant controls. We obtained thecertified POC reports prepared by the project engineers and assessed their competence and objectivity byreference to their qualifications, experience and reporting responsibilities. For selected projects, we conductedocular inspections, made relevant inquiries, including inquiries on how the coronavirus pandemic affected thePOC during the period and obtained the supporting details of POC reports showing the completion of the majoractivities of project construction.
A member firm of Ernst & Young Global Limited

*SGVFSM005262*
- 3 -
For the cost of sales, we obtained an understanding of the Group’s cost accumulation process and performedtests of the relevant controls. For selected projects, we traced costs accumulated, including those incurred butnot yet billed costs, to supporting documents such as invoices and accomplishment reports from thecontractors and official receipts.
For the recognition of cost to obtain a contract, we obtained an understanding of the sales commissionprocess. For selected contracts, we agreed the basis for calculating the sales commission capitalized and theportion recognized in profit or loss, particularly: (a) the percentage of commission due against contracts withsales agents, (b) the total commissionable amount (i.e., net contract price) against the related contract to sell,and, (c) the POC against the POC used in recognizing the related revenue from real estate sales.
Accounting for Lease Concessions
In line with the rental relief framework implemented by the government to support businesses and the broadereconomy due to the impact of Covid-19, the Group waived its right to collect rent and other charges as part ofvarious lease concessions it granted to lessees such as lease payment holidays or lease payment reductions.The Group assessed that the lease concessions it granted to lessees do not qualify as lease modificationssince the terms and conditions under the corresponding lease contracts have not been modified by the waiver.The Group accounted for the lease concessions in the form of negative variable rent which the Group recordedwhen the concession is granted regardless of the period to which the concession pertains. The Group’saccounting for lease concession under PFRS 16 is significant to our audit because there were numerous leaseconcessions granted to lessees during the period; the recorded amounts are material to the consolidatedfinancial statements; and accounting for lease concession involves the application of significant judgment indetermining whether or not the lease concession is a lease modification.
The disclosures related to the lease concession granted by the Group are included in Notes 3 and 33 to theconsolidated financial statements.
Audit Response
We determined the population of lease contracts and obtained an understanding of the type, extent andperiods covered under the various lease concessions granted by the Group to the lessees during the year.
On a sample basis, we tested the population of lease agreements covered by the lease concessions bycomparing the lease contracts under the operations report against lease contract database which includecontract number, contract name, contract type and rental rate, among others.
On a test basis, we obtained and inspected the communications of the Group to the lessees and traced therelevant information to the schedule of calculation of the amounts of lease concession. On a sample basis, wetest computed the amounts of lease concessions. We obtained management’s assessment supporting theconclusion that the lease concessions granted by the Group to the lessees do not qualify as leasemodifications. We reviewed the legal opinion issued by the Group’s external legal counsel to support theGroup’s assessment and conclusion about the waiver of its right to collect rent and other charges from lessees.We involved our internal specialist in evaluating the legal basis supporting management assessment. We alsoreviewed the disclosures relating to the lease concessions.
A member firm of Ernst & Young Global Limited
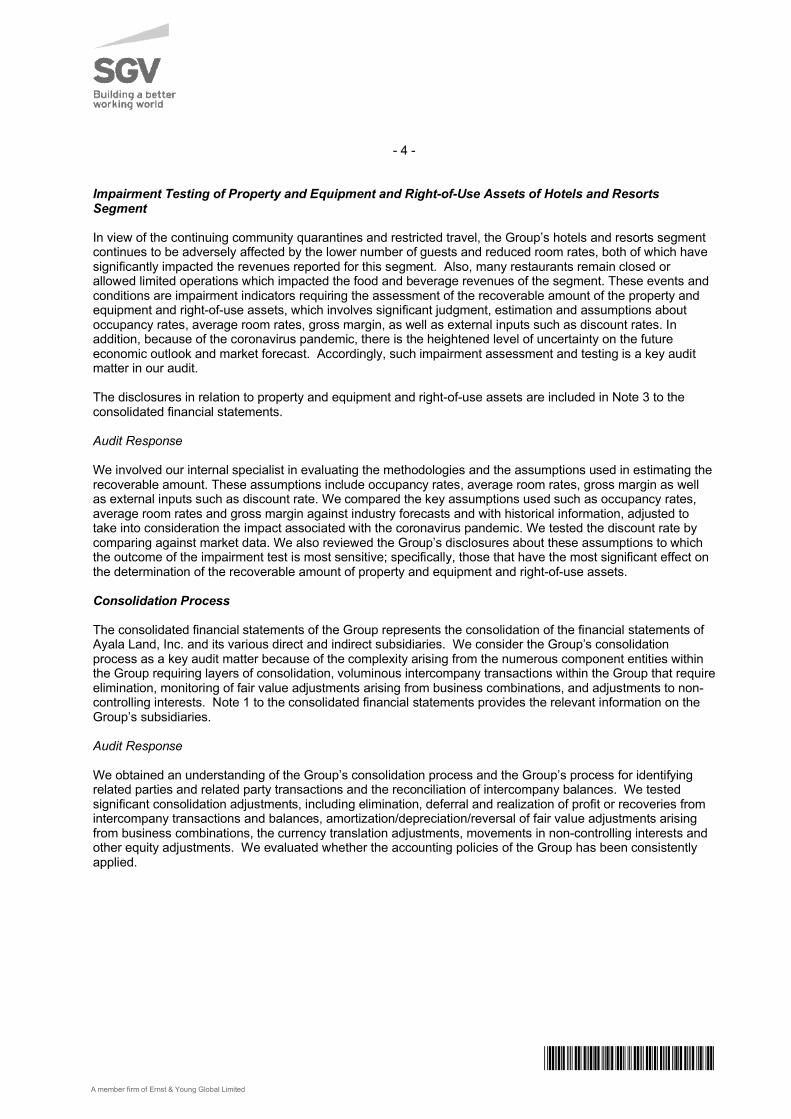
*SGVFSM005262*
- 4 -
Impairment Testing of Property and Equipment and Right-of-Use Assets of Hotels and ResortsSegment
In view of the continuing community quarantines and restricted travel, the Group’s hotels and resorts segmentcontinues to be adversely affected by the lower number of guests and reduced room rates, both of which havesignificantly impacted the revenues reported for this segment. Also, many restaurants remain closed orallowed limited operations which impacted the food and beverage revenues of the segment. These events andconditions are impairment indicators requiring the assessment of the recoverable amount of the property andequipment and right-of-use assets, which involves significant judgment, estimation and assumptions aboutoccupancy rates, average room rates, gross margin, as well as external inputs such as discount rates. Inaddition, because of the coronavirus pandemic, there is the heightened level of uncertainty on the futureeconomic outlook and market forecast. Accordingly, such impairment assessment and testing is a key auditmatter in our audit.
The disclosures in relation to property and equipment and right-of-use assets are included in Note 3 to theconsolidated financial statements.
Audit Response
We involved our internal specialist in evaluating the methodologies and the assumptions used in estimating therecoverable amount. These assumptions include occupancy rates, average room rates, gross margin as wellas external inputs such as discount rate. We compared the key assumptions used such as occupancy rates,average room rates and gross margin against industry forecasts and with historical information, adjusted totake into consideration the impact associated with the coronavirus pandemic. We tested the discount rate bycomparing against market data. We also reviewed the Group’s disclosures about these assumptions to whichthe outcome of the impairment test is most sensitive; specifically, those that have the most significant effect onthe determination of the recoverable amount of property and equipment and right-of-use assets.
Consolidation Process
The consolidated financial statements of the Group represents the consolidation of the financial statements ofAyala Land, Inc. and its various direct and indirect subsidiaries. We consider the Group’s consolidationprocess as a key audit matter because of the complexity arising from the numerous component entities withinthe Group requiring layers of consolidation, voluminous intercompany transactions within the Group that requireelimination, monitoring of fair value adjustments arising from business combinations, and adjustments to non-controlling interests. Note 1 to the consolidated financial statements provides the relevant information on theGroup’s subsidiaries.
Audit Response
We obtained an understanding of the Group’s consolidation process and the Group’s process for identifyingrelated parties and related party transactions and the reconciliation of intercompany balances. We testedsignificant consolidation adjustments, including elimination, deferral and realization of profit or recoveries fromintercompany transactions and balances, amortization/depreciation/reversal of fair value adjustments arisingfrom business combinations, the currency translation adjustments, movements in non-controlling interests andother equity adjustments. We evaluated whether the accounting policies of the Group has been consistentlyapplied.
A member firm of Ernst & Young Global Limited

*SGVFSM005262*
- 5 -
Other Information
Management is responsible for the other information. The other information comprises the information includedin the SEC Form 20-IS (Definitive Information Statement), SEC Form 17-A and Annual Report for the yearended December 31, 2020, but does not include the consolidated financial statements and our auditor’s reportthereon. The SEC Form 20-IS (Definitive Information Statement), SEC Form 17-A and Annual Report for theyear ended December 31, 2020 are expected to be made available to us after the date of this auditor’s report.
Our opinion on the consolidated financial statements does not cover the other information and we will notexpress any form of assurance conclusion thereon.
In connection with our audits of the consolidated financial statements, our responsibility is to read the otherinformation identified above when it becomes available and, in doing so, consider whether the other informationis materially inconsistent with the consolidated financial statements or our knowledge obtained in the audits, orotherwise appears to be materially misstated.
Responsibilities of Management and Those Charged with Governance for the Consolidated FinancialStatements
Management is responsible for the preparation and fair presentation of the consolidated financial statements inaccordance with PFRSs, and for such internal control as management determines is necessary to enable thepreparation of consolidated financial statements that are free from material misstatement, whether due to fraudor error.
In preparing the consolidated financial statements, management is responsible for assessing the Group’s abilityto continue as a going concern, disclosing, as applicable, matters related to going concern and using the goingconcern basis of accounting unless management either intends to liquidate the Group or to cease operations,or has no realistic alternative but to do so.
Those charged with governance are responsible for overseeing the Group’s financial reporting process.
Auditor’s Responsibilities for the Audit of the Consolidated Financial Statements
Our objectives are to obtain reasonable assurance about whether the consolidated financial statements as awhole are free from material misstatement, whether due to fraud or error, and to issue an auditor’s report thatincludes our opinion. Reasonable assurance is a high level of assurance, but is not a guarantee that an auditconducted in accordance with PSAs will always detect a material misstatement when it exists. Misstatementscan arise from fraud or error and are considered material if, individually or in the aggregate, they couldreasonably be expected to influence the economic decisions of users taken on the basis of these consolidatedfinancial statements.
As part of an audit in accordance with PSAs, we exercise professional judgment and maintain professionalskepticism throughout the audit. We also:
Identify and assess the risks of material misstatement of the consolidated financial statements, whetherdue to fraud or error, design and perform audit procedures responsive to those risks, and obtain auditevidence that is sufficient and appropriate to provide a basis for our opinion. The risk of not detecting amaterial misstatement resulting from fraud is higher than for one resulting from error, as fraud may involvecollusion, forgery, intentional omissions, misrepresentations, or the override of internal control.
Obtain an understanding of internal control relevant to the audit in order to design audit procedures thatare appropriate in the circumstances, but not for the purpose of expressing an opinion on the effectivenessof the Group’s internal control.
A member firm of Ernst & Young Global Limited
*SGVFSM005262*
- 6 -
Evaluate the appropriateness of accounting policies used and the reasonableness of accounting estimatesand related disclosures made by management.
Conclude on the appropriateness of management’s use of the going concern basis of accounting and,based on the audit evidence obtained, whether a material uncertainty exists related to events or conditionsthat may cast significant doubt on the Group’s ability to continue as a going concern. If we conclude that amaterial uncertainty exists, we are required to draw attention in our auditor’s report to the relateddisclosures in the consolidated financial statements or, if such disclosures are inadequate, to modify ouropinion. Our conclusions are based on the audit evidence obtained up to the date of our auditor’s report.However, future events or conditions may cause the Group to cease to continue as a going concern.
Evaluate the overall presentation, structure and content of the consolidated financial statements, includingthe disclosures, and whether the consolidated financial statements represent the underlying transactionsand events in a manner that achieves fair presentation.
Obtain sufficient appropriate audit evidence regarding the financial information of the entities or businessactivities within the Group to express an opinion on the consolidated financial statements. We areresponsible for the direction, supervision and performance of the audit. We remain solely responsible forour audit opinion.
We communicate with those charged with governance regarding, among other matters, the planned scope andtiming of the audit and significant audit findings, including any significant deficiencies in internal control that weidentify during our audit.
We also provide those charged with governance with a statement that we have complied with relevant ethicalrequirements regarding independence, and to communicate with them all relationships and other matters thatmay reasonably be thought to bear on our independence, and where applicable, related safeguards.
From the matters communicated with those charged with governance, we determine those matters that were ofmost significance in the audit of the consolidated financial statements of the current period and are thereforethe key audit matters. We describe these matters in our auditor’s report unless law or regulation precludespublic disclosure about the matter or when, in extremely rare circumstances, we determine that a matter shouldnot be communicated in our report because the adverse consequences of doing so would reasonably beexpected to outweigh the public interest benefits of such communication.
The engagement partner on the audit resulting in this independent auditor’s report is Michael C. Sabado.
SYCIP GORRES VELAYO & CO.
Michael C. SabadoPartnerCPA Certificate No. 89336SEC Accreditation No. 0664-AR-4 (Group A), November 11, 2019, valid until November 10, 2022Tax Identification No. 160-302-865BIR Accreditation No. 08-001998-073-2020, December 3, 2020, valid until December 2, 2023PTR No. 8534357, January 4, 2021, Makati City
February 23, 2021
A member firm of Ernst & Young Global Limited

*SGVFSM005262*
AYALA LAND, INC. AND SUBSIDIARIESCONSOLIDATED STATEMENTS OF FINANCIAL POSITION(Amounts in Thousands)
December 312020 2019
ASSETSCurrent AssetsCash and cash equivalents (Notes 4 and 29) P=17,037,347 P=20,413,041Short-term investments (Notes 5 and 29) 358,120 617,149Financial assets at fair value through profit or loss
(Notes 6 and 29) 965,171 485,436Accounts and notes receivable (Notes 7 and 29) 101,145,909 105,039,306Inventories (Note 8) 146,743,592 120,287,686Other current assets (Note 9) 58,020,962 48,591,632 Total Current Assets 324,271,101 295,434,250
Noncurrent AssetsNoncurrent accounts and notes receivable (Notes 7 and 29) 46,021,255 45,563,869Financial assets at fair value through other comprehensive income
(FVOCI) (Notes 10 and 29) 1,511,443 1,529,179Investments in associates and joint ventures (Note 11) 26,601,254 25,317,581Right-of-use assets (Note 33) 13,008,175 13,564,472Investment properties (Note 12) 222,684,850 243,043,448Property and equipment (Note 13) 43,446,968 43,062,357Deferred tax assets - net (Note 23) 12,121,515 11,527,645Other noncurrent assets (Notes 14 and 26) 31,827,813 34,880,477 Total Noncurrent Assets 397,223,273 418,489,028
P=721,494,374 P=713,923,278
LIABILITIES AND EQUITYCurrent LiabilitiesShort-term debt (Notes 16 and 29) P=9,131,325 P=18,032,830Accounts and other payables (Notes 15 and 29) 144,625,922 162,979,169Income tax payable 1,455,612 2,123,379Current portion of lease liabilities (Note 33) 466,801 724,859Current portion of long-term debt (Notes 16 and 29) 18,732,401 17,250,706Deposits and other current liabilities (Note 17) 25,317,246 25,472,581 Total Current Liabilities 199,729,307 226,583,524
Noncurrent LiabilitiesLong-term debt - net of current portion (Notes 16 and 29) 184,087,192 175,813,345Pension liabilities (Note 26) 3,020,797 1,987,605Lease liabilities - net of current portion (Note 33) 17,289,042 16,738,846Deferred tax liabilities - net (Note 23) 7,148,534 6,090,754Deposits and other noncurrent liabilities (Notes 18 and 29) 50,040,170 44,003,636 Total Noncurrent Liabilities 261,585,735 244,634,186 Total Liabilities 461,315,042 471,217,710
(Forward)

*SGVFSM005262*
- 2 -
December 312020 2019
Equity (Note 19)Equity attributable to equity holders of Ayala Land, Inc. Paid-in capital P=62,953,585 P=62,772,446 Retained earnings 161,660,724 156,940,236 Stock options outstanding (Note 28) ‒ 42,279 Remeasurement loss on defined benefit plans (Note 26) (818,101) (337,210) Fair value reserve of financial assets at FVOCI (Note 10) (748,220) (457,358)
Cumulative translation adjustments 167,395 250,440 Equity reserves (Note 1) 585,256 (7,056,459)
Treasury stock (1,260,780) (1,104,353)222,539,859 211,050,021
Non-controlling interests (Note 19) 37,639,473 31,655,547 Total Equity 260,179,332 242,705,568
P=721,494,374 P=713,923,278
See accompanying Notes to Consolidated Financial Statements.

*SGVFSM005262*
AYALA LAND, INC. AND SUBSIDIARIESCONSOLIDATED STATEMENTS OF INCOME(Amounts in Thousands, Except Earnings Per Share Figures)
Years Ended December 312020 2019 2018
REVENUE (Note 20)Real estate sales (Notes 20 and 30) P=85,965,453 P=157,848,573 P=155,954,816Interest income from real estate sales (Notes 7 and 20) 8,602,775 7,890,972 7,042,078Equity in net earnings of associates and
joint ventures (Notes 11 and 20) 586,502 965,787 749,92495,154,730 166,705,332 163,746,818
Interest and investment income (Notes 6, 21 and 25) 394,701 930,445 958,236Other income (Notes 21 and 24) 723,268 1,157,935 1,540,717
1,117,969 2,088,380 2,498,95396,272,699 168,793,712 166,245,771
COSTS AND EXPENSESCost of real estate sales (Note 22) 56,673,184 94,751,939 101,079,130General and administrative expenses
(Notes 22, 26 and 28) 8,011,813 9,367,359 9,101,328Interest and other financing charges (Note 22) 12,745,720 12,199,758 9,594,003Other expenses (Note 22) 3,788,771 1,644,982 1,270,281
81,219,488 117,964,038 121,044,742
INCOME BEFORE INCOME TAX 15,053,211 50,829,674 45,201,029
PROVISION FOR INCOME TAX (Note 23)Current 4,687,956 12,455,010 13,390,637Deferred (628,983) 859,633 (1,406,197)
4,058,973 13,314,643 11,984,440
NET INCOME P=10,994,238 P=37,515,031 P=33,216,589
Net income attributable to: Equity holders of Ayala Land, Inc. (Note 27) P=8,727,155 P=33,188,399 P=29,240,880 Non-controlling interests 2,267,083 4,326,632 3,975,709
P=10,994,238 P=37,515,031 P=33,216,589
Earnings Per Share (Note 27)Net income attributable to equity holders of Ayala Land,
Inc.: Basic and diluted P=0.59 P=2.25 P=1.98
See accompanying Notes to Consolidated Financial Statements.

*SGVFSM005262*
AYALA LAND, INC. AND SUBSIDIARIESCONSOLIDATED STATEMENTS OF COMPREHENSIVE INCOME(Amounts in Thousands)
Years Ended December 312020 2019 2018
NET INCOME P=10,994,238 P=37,515,031 P=33,216,589
Other comprehensive income (loss)Item that may be reclassified to profit or loss in
subsequent years:Cumulative translation adjustment (237,531) (617,831) 451,195
Items that will not be reclassified to profit or loss insubsequent years:
Fair value reserve of financial assets at FVOCI(Note 10) (426,088) (3,220) 71,938
Remeasurement gain on pension liabilities (Note 26) (686,987) (167,754) (85,381) Income tax effect 206,096 50,326 25,614
(1,144,510) (738,479) 463,366
TOTAL COMPREHENSIVE INCOME P=9,849,728 P=36,776,552 P=33,679,955
Total comprehensive income attributable to: Equity holders of of Ayala Land, Inc. P=7,872,357 P=32,449,920 P=29,701,637 Non-controlling interests 1,977,371 4,326,632 3,978,318
P=9,849,728 P=36,776,552 P=33,679,955
See accompanying Notes to Consolidated Financial Statements.

*SGVFSM005262*
AYALA LAND, INC. AND SUBSIDIARIESCONSOLIDATED STATEMENTS OF CHANGES IN EQUITY(Amounts in Thousands)
Attributable to equity holders of Ayala Land, Inc.
Capital Stock(Note 19)
AdditionalPaid-inCapital
(Note 19)Subscriptions
Receivable
AppropriatedRetainedEarnings(Note 19)
UnappropriatedRetainedEarnings(Note 19)
StockOptions
Outstanding
RemeasurementGain (Loss)on Defined
BenefitPlans
(Note 26)
Fair valuereserve of
financialassets at
FVOCI (Note 10)
CumulativeTranslation
Adjustments(Note 19)
EquityReserves
(Note 19)
TreasuryStocks
(Note 19) Total
Non-Controlling
Interests Total EquityAs of January 1, 2020 P=16,051,984 P=48,598,641 (P=1,878,179) P=8,000,000 P=148,940,236 P=42,279 (P=337,210) (P=457,358) P=250,440 (P=7,056,459) (P=1,104,353) P=211,050,021 P=31,655,547 P=242,705,568Net income − − − − 8,727,155 − − − − − − 8,727,155 2,267,083 10,994,238Other comprehensive loss ‒ ‒ ‒ ‒ ‒ ‒ (480,891) (290,862) (83,045) ‒ ‒ (854,798) (289,712) (1,144,510)Total comprehensive income ‒ ‒ ‒ ‒ 8,727,155 ‒ (480,891) (290,862) (83,045) ‒ ‒ 7,872,357 1,977,371 9,849,728Cost of stock options ‒ 154,199 ‒ ‒ ‒ (42,279) ‒ ‒ ‒ ‒ ‒ 111,920 ‒ 111,920Collection of subscription receivable ‒ ‒ 26,940 ‒ ‒ ‒ ‒ ‒ ‒ ‒ ‒ 26,940 ‒ 26,940Stock options exercised 14,845 396,672 (411,517) ‒ ‒ ‒ ‒ ‒ ‒ ‒ ‒ ‒ ‒ ‒Acquisition of treasury shares ‒ ‒ ‒ ‒ ‒ ‒ ‒ ‒ ‒ ‒ (156,427) (156,427) ‒ (156,427)Disposal of non-controlling interest ‒ ‒ ‒ ‒ ‒ ‒ ‒ ‒ ‒ 7,641,715 ‒ 7,641,715 ‒ 7,641,715Increase in non-controlling interests ‒ ‒ ‒ ‒ ‒ ‒ ‒ ‒ ‒ ‒ ‒ ‒ 4,937,740 4,937,740Cash dividends declared ‒ ‒ ‒ ‒ (4,006,667) ‒ ‒ ‒ ‒ ‒ ‒ (4,006,667) (931,185) (4,937,852)As of December 31, 2020 P=16,066,829 P=49,149,512 (P=2,262,756) P=8,000,000 P=153,660,724 P=‒ (P=818,101) (P=748,220) P=167,395 P=585,256 (P=1,260,780) P=222,539,859 P=37,639,473 P=260,179,332
As of January 1, 2019, as previously reported P=16,041,530 P=47,985,990 (P=1,676,556) P=8,000,000 P=124,090,020 P=65,462 (P=219,782) (P=454,138) P=868,271 (P=7,400,945) P=− P=187,299,852 P=32,921,345 P=220,221,197Effect of adoption of PFRS 16, Leases − − − − (616,823) − − ‒ − − − (616,683) (299,348) (916,031)Balances at January 1, 2019, as restated 16,041,530 47,985,990 (1,676,556) 8,000,000 123,473,337 65,462 (219,782) (454,138) 868,271 (7,400,945) − 186,683,169 32,621,997 219,305,166Net income − − − − 33,188,399 − − − − − − 33,188,399 4,326,632 37,515,031Other comprehensive loss − − − − − − (117,428) (3,220) (617,831) − − (738,479) − (738,479)Total comprehensive income − − − − 33,188,399 − (117,428) (3,220) (617,831) − − 32,449,920 4,326,632 36,776,552Cost of stock options − 166,039 − − − (23,183) − − − − − 142,856 − 142,856Collection of subscription receivable − − 255,443 − − − − − − − − 255,443 − 255,443Stock options exercised 10,454 446,612 (457,066) − − − − − − − − − − −Acquisition of treasury shares − − − − − − − − − − (1,104,353) (1,104,353) − (1,104,353)Acquisition of non-controlling interests − − − − − − − − − 344,486 − 344,486 (3,991,324) (3,646,838)Cash dividends declared − − − − (7,721,500) − − − − − − (7,721,500) (1,301,758) (9,023,258)As of December 31, 2019 P=16,051,984 P=48,598,641 (P=1,878,179) P=8,000,000 P=148,940,236 P=42,279 (P=337,210) (P=457,358) P=250,440 (P=7,056,459) (P=1,104,353) P=211,050,021 P=31,655,547 P=242,705,568

*SGVFSM005262*
- 2 -
Attributable to equity holders of Ayala Land, Inc.
Capital Stock(Note 19)
AdditionalPaid-inCapital
(Note 19)Subscriptions
Receivable
AppropriatedRetainedEarnings(Note 19)
UnappropriatedRetainedEarnings(Note 19)
StockOptions
Outstanding
RemeasurementGain (Loss)on Defined
BenefitPlans
(Note 26)
Fair valuereserve of
financial assetsat FVOCI (Note 10)
CumulativeTranslation
Adjustments(Note 19)
EquityReserves(Note 19)
TreasuryStocks
(Note 19) Total
Non-Controlling
Interests Total Equity
As of January 1, 2018, as previously reported P=16,031,596 P=47,454,241 (P=1,537,126) P=8,000,000 P=101,976,450 P=99,064 (P=160,015) P=40,530 P=1,001,986 (P=6,152,115) P=− P=166,754,611 P=25,508,747 P=192,263,358Effect of adoption of new accounting
standards − − − − 358,605 − − (563,997) − − − (205,392) 205,392 −Balances at January 1, 2018, as restated 16,031,596 47,454,241 (1,537,126) 8,000,000 102,335,055 99,064 (160,015) (523,467) 1,001,986 (6,152,115) − 166,549,219 25,714,139 192,263,358Net income − − − − 29,240,880 − − − − − − 29,240,880 3,975,709 33,216,589Other comprehensive income (loss) − − − − − − (59,767) 69,329 451,195 − − 460,757 2,609 463,366Total comprehensive income − − − − 29,240,880 − (59,767) 69,329 451,195 − − 29,701,637 3,978,318 33,679,955Cost of stock options − 132,121 − − − (33,602) − − − − − 98,519 − 98,519Collection of subscription receivable − − 270,132 − − − − − − − − 270,132 − 270,132Stock options exercised 9,934 399,628 (409,562) − − − − − − − − − − −Acquisition of control on previously held interest − − − − − − − − (584,910) − − (584,910) 4,773,524 4,188,614Acquisition of non-controlling interests − − − − − − − − − (1,248,830) − (1,248,830) (509,596) (1,758,426)Cash dividends declared − − − − (7,485,915) − − − − − − (7,485,915) (1,035,040) (8,520,955)As of December 31, 2018 P=16,041,530 P=47,985,990 (P=1,676,556) P=8,000,000 P=124,090,020 P=65,462 (P=219,782) (P=454,138) P=868,271 (P=7,400,945) P=− P=187,299,852 P=32,921,345 P=220,221,197
See accompanying Notes to Consolidated Financial Statements.

*SGVFSM005262*
AYALA LAND, INC. AND SUBSIDIARIESCONSOLIDATED STATEMENTS OF CASH FLOWS(Amounts in Thousands)
Years Ended December 312020 2019 2018
CASH FLOWS FROM OPERATING ACTIVITIESIncome before income tax P=15,053,211 P=50,829,674 P=45,201,029Adjustments for: Interest and other financing charges (Note 22) 12,745,720 12,199,758 9,594,003 Depreciation and amortization (Notes 12, 13, 14, 22
and 33) 9,572,572 9,058,710 6,318,929 Dividends received from investees (Note 11) 758,714 386,241 331,461 Provision for impairment losses (Note 22) 977,849 568,775 146,974 Cost of share-based payments (Note 28) 111,920 142,856 98,519 Unrealized (gain) loss on financial assets at fair
value through profit or loss (Note 6) 40,116 1,965 (4,633) Gain on sale of property and equipment (Note 21) (23,265) (40,870) (46,570) Equity in net earnings of associates and joint
ventures (Note 11) (586,502) (965,787) (749,924)Gain on sale of investment in associates and jointly controlled entities − − (588)Gain on business combination (Note 21) − − (59,475)
Interest income (8,971,289) (8,780,320) (7,952,628)Operating income before changes in working capital 29,679,046 63,401,002 52,877,097Changes in operating assets and liabilities: Decrease (increase) in: Accounts and notes receivable – trade 683,154 14,849,682 (83,557,042) Inventories (Note 8) (10,253,170) (5,315,783) 12,136,508 Other current assets (Note 9) (8,477,188) (4,520,502) 3,629,678 Increase (decrease) in: Accounts and other payables (16,164,090) (15,725,408) 25,998,377 Deposits and other current liabilities (Note 17) (155,341) (3,071,965) 15,430,961 Pension liabilities (Note 26) 346,206 319,979 (45,240)Cash generated from operations (4,341,383) 49,937,005 26,470,339Interest received 8,925,394 8,768,302 7,940,610Income tax paid (5,355,723) (11,683,232) (12,832,593)Interest paid (11,735,785) (11,009,836) (9,810,439)Net cash provided by (used in) operating activities (12,507,497) 36,012,239 11,767,917
CASH FLOWS FROM INVESTING ACTIVITIESProceeds from: Sale/redemption of short-term investments 397,875 2,490,543 2,519,341
Sale/redemption of financial assets at FVTPL 1,917,237 765,763 71,690 Sale of investments in FVOCI (Note 10) 21,112 56,858 51,384 Disposal of property and equipment (Note 13) 161,997 124,832 3,744,743 Disposal of investment properties (Note 12) 2,203,774 3,669,275 1,722,933
Disposal of investments in associates and jointly controlled entities 326,602 − 83,957
(Forward)

*SGVFSM005262*
- 2 -
Years Ended December 312020 2019 2018
Additions to:Short-term investments (P=138,846) (P=22,293) (P=865,006)Financial assets at fair value through profit or loss (2,437,088) (776,919) (2,696)Financial assets at FVOCI (Note 10) (98,951) (93,463) −Investments in associates and joint ventures (Note 11) (1,837,901) (1,529,688) (3,724,958)Investment properties (Note 12) (5,544,790) (29,215,224) (32,803,016)Property and equipment (Note 13) (3,098,436) (10,519,576) (2,842,787)
Net decrease (increase) in:Accounts and notes receivable - nontrade (Note 7) 2,046,114 (564,222) 41,657,193Other noncurrent assets (Note 14) 2,865,904 (6,957,950) (7,906,689)
Net decrease in cash from business combination (Note 24) − − (4,684,335)Net cash used in investing activities (3,215,397) (42,572,063) (2,978,246)
CASH FLOWS FROM FINANCING ACTIVITIESProceeds from short and long-term debt (Note 16) 226,900,910 165,401,684 128,994,834Payments of short and long-term debt (Note 16) (225,720,204) (140,675,538) (119,970,061)Payments of principal portion of lease liability (Note 33) (1,334,674) (1,179,645) −Increase (decrease) in deposits and other noncurrent
liabilities 5,706,022 (6,241,773) (5,584,237)Acquisition of non-controlling interest (Note 19) − (3,646,838) (1,758,426)Increase in non-controlling interests 235,994 − −Proceeds from IPO sponsorship (Note 19) 12,343,461 − −Proceeds from capital stock subscriptions (Note 19) 26,940 255,443 270,132Acquisition of treasury shares (Note 19) (156,427) (1,104,353) −Dividends paid to non-controlling interests (931,185) (1,301,758) (1,035,040)Dividends paid to equity holders of Ayala Land, Inc.
(Note 19) (4,397,061) (7,754,047) (7,181,498)Net cash provided by (used in) financing activities 12,673,776 3,753,175 (6,264,296)
NET INCREASE (DECREASE) IN CASH ANDCASH EQUIVALENTS (3,049,118) (2,806,649) 2,525,375
EFFECT OF CHANGES IN FOREIGN CURRENCY (326,576) (776,880) 473,106
CASH AND CASH EQUIVALENTS AT BEGINNINGOF YEAR 20,413,041 23,996,570 20,998,089
CASH AND CASH EQUIVALENTS AT ENDOF YEAR (Note 4) P=17,037,347 P=20,413,041 P=23,996,570
See accompanying Notes to Consolidated Financial Statements.

*SGVFSM005262*
AYALA LAND, INC. AND SUBSIDIARIESNOTES TO CONSOLIDATED FINANCIAL STATEMENTS
1. Corporate Information
Ayala Land, Inc. (the Parent Company or ALI) is domiciled and was incorporated on June 30, 1988 inthe Republic of the Philippines with corporate life of fifty years. The Parent Company’s parent is AyalaCorporation (AC). AC is a publicly listed company which is 47.28%-owned by Mermac, Inc. and therest by the public as of December 31, 2020. The Parent Company’s registered office and principalplace of business is 31st Floor, Tower One and Exchange Plaza, Ayala Triangle, Ayala Avenue,Makati City.
The Parent Company and its Subsidiaries (the Group) are incorporated to hold, develop, manage,administer, sell, convey, encumber, purchase, acquire, rent or otherwise deal in and dispose of, foritself or for others, residential including, but not limited to, all kinds of housing projects, commercial,industrial, urban or other kinds of real property; to acquire, purchase, hold, manage, develop and sellsubdivision lots, with or without buildings or improvements; to erect, construct, alter, manage,operate, lease, in whole or in part, buildings and tenements of the Group or of other persons; and toengage or act as real estate broker. The Group is also involved in hotels and resorts operations.
The consolidated financial statements of Ayala Land, Inc. and Subsidiaries as of December 31, 2020and 2019, and for each of the three years in the period ended December 31, 2020 were endorsed forapproval by the Audit Committee on February 16, 2021 and were approved and authorized for issueby the Board of Directors (BOD) on February 23, 2021.
The consolidated financial statements represent the consolidation of the financial statements of theParent Company and the following domestic and foreign subsidiaries:
December 312020* 2019*
Real Estate:Alveo Land Corporation (Alveo) 100% 100%
Serendra, Inc. 39 39Solinea, Inc. (Solinea) 65 65BGSouth Properties, Inc. (BGS) 50 50Portico Land Corp. (Portico) 60 60
Serendra, Inc. 28 28Amorsedia Development Corporation (ADC) 100 100
OLC Development Corporation and Subsidiary 100 100HLC Development Corporation 100 100Allysonia International Ltd. 100 100
Avida Land Corporation (Avida) 100 100Buklod Bahayan Realty and Development Corp. 100 100Avida Sales Corp. 100 100Amicassa Process Solutions, Inc. 100 100Avencosouth Corp. (Avencosouth) 70 70BGNorth Properties, Inc. (BGN) 50 50
Amaia Land Co. (Amaia) 100 100Amaia Southern Properties, Inc. (ASPI) 65 65
AyalaLand Premier, Inc. 100 100Ayala Land International Sales, Inc. (ALISI) 100 100
Ayala Land International Marketing, Inc. (AIMI) 100 100Ayala Land International (Singapore) Pte. Ltd 100 100Ayala Land International Marketing (Hong Kong) Ltd 100 100Ayala Land International Marketing, SRL (ALIM SRL) 100 100

- 2 -
*SGVFSM005262*
December 312020* 2019*
Ayala Land International Marketing London 100% 100%Ayala Land Sales, Inc. 100 100Southportal Properties, Inc. (Southportal) 65 65Buendia Landholdings, Inc. 100 100Crans Montana Holdings, Inc. 100 100Crimson Field Enterprises, Inc. 100 100Ecoholdings Company, Inc. (ECI) 100 100NorthBeacon Commercial Corporation (NBCC) 100 100Red Creek Properties, Inc. 100 100Regent Time International, Limited (Regent Time) (British
Virgin Islands)100 100
North Eastern Commercial Corp. (NECC) 100 100Westview Commercial Ventures Corp. (Westview) 100 100North Ventures Commercial Corporation 100 100Hillsford Property Corporation (Hillsford) 100 100Primavera Towncentre, Inc. (PTI) 100 100Summerhill E-Office Corporation (Summerhill) 100 100Sunnyfield E-Office Corporation (Sunnyfield) 100 100Subic Bay Town Centre, Inc. (SBTCI) 100 100Regent Wise Investments Limited (Regent Wise)
(Hongkong company)100 100
AyalaLand Real Estate Investments Inc. (Canada) 100 100AyalaLand Advisory Broadway Inc. (Canada) 100 100AyalaLand Development (Canada) Inc. 100 100AyalaLand OpenAsia Holdings PTE, Ltd (Singapore) 100 100Blue Horizons Holdings PTE, Ltd (Singapore) 100 100Modular Construction Technology (MCT) Bhd.(Malaysia)
66 66
AREIT Fund Manager, Inc. (formerly AyalaLandCommercial REIT, Inc. (ALCRI))
100 100
Arvo Commercial Corporation (Arvo) 100 100BellaVita Land Corporation (BellaVita) 100 100Nuevo Centro, Inc. (Nuevo Centro) 54 54
Alviera Country Club, Inc. (Alviera) 50 50Cavite Commercial Town Center, Inc. (CCTCI) 100 100AREIT, Inc. (formerly One Dela Rosa Property
Development, Inc.) 54 100AyalaLand Offices, Inc. (ALO) 100 100
First Gateway Real Estate Corp. 100 100Glensworth Development, Inc. (Glensworth) 100 100UP North Property Holdings, Inc. 100 100
ALO Prime Realty Corporation 100 100Makati Cornerstone Leasing Corp. (MCLC) 100 100Arca South Commercial Ventures Corp. 100 100Capitol Central Commercial Ventures Corp. 100 100Bay City Commercial Venture Corp. (BCCVC) 100 100Aurora Properties Incorporated 81 81
Soltea Commercial Corp. 16 16Vesta Property Holdings, Inc. (VPHI) 78 78Altaraza Prime Realty Corporation 100 100Altaraza Development Corporation 51 −Prow Holdings, Inc. 55 55Station Square East Commercial Corporation (SSECC) 69 69

- 3 -
*SGVFSM005262*
December 312020* 2019*
AREIT Property Managers, Inc. (formerly Next UrbanAlliance Development Corp.)
100% 100%
Accendo Commercial Corp. (Accendo) 67 67Avencosouth Corp. 20 20Aviana Development Corporation 7 7
Aviana Development Corporation 50 50Cagayan de Oro Gateway Corp. (CDOGC) 70 70Ceci Realty, Inc. (Ceci) 60 60
Soltea Commercial Corp. 12 12Soltea Commercial Corp. 60 60CMPI Holdings, Inc. 60 60
CMPI Land, Inc. 36 36ALI-CII Development Corporation (ALI-CII) 50 50Roxas Land Corporation (RLC) 50 50Adauge Commercial Corporation (Adauge) 60 60AyalaLand Estates, Inc 100 100Ayalaland MetroNorth, Inc. (AMNI) 100 100Verde Golf Development Corp. 100 100North Triangle Depot Commercial Corporation (NTDCC) 73 73BGWest Properties, Inc. (BGW) 50 50Lagdigan Land Corp. (Lagdigan) 60 60Central Block Developers, Inc. (CBDI) 45 45
Central Bloc Hotel Ventures, Inc. 45 45Cebu Holdings, Inc. (CHI) 71 71
Cebu Leisure Company, Inc. 71 71CBP Theatre Management Inc. 71 71Taft Punta Engaño Property Inc. (TPEPI) 39 39Cebu Insular Hotel Company, Inc. (CIHCI) 26 26Solinea, Inc. 25 25Amaia Southern Properties, Inc. (ASPI) 25 25Southportal Properties, Inc. (Southportal) 25 25Central Block Developers, Inc. (CBDI) 39 39Asian I-Office Properties. Inc. (AIOPI) 71 71
Alabang Commercial Corporation (ACC) 50 50South Innovative Theater Management (SITMI) 50 50
ALI Commercial Center, Inc. 100 100AMC Japan Concepts, Inc. 75 75
AyalaLand Logistics Holdings Corp. (ALLHC) (formerlyPrime Orion Philippines, Inc.)
71 71
Orion Solutions, Inc. 71 71Orion I Holdings Philippines, Inc. 71 71OE Holdings, Inc. 71 71Orion Land, Inc. 71 71Lepanto Ceramics, Inc. 71 71Laguna Technopark, Inc. and Subsidiary 68 68Unity Realty & Development Corp. (URDC) 71 71FLT Prime Insurance Corporation 56 56
Ayalaland Malls Synergies, Inc. 100 100Ayalaland Malls, Inc. (formerly Solerte, Inc.) 100 100
Ayalaland Malls Vismin, Inc. 100 100Ayalaland Malls NorthEast, Inc. 100 100

- 4 -
*SGVFSM005262*
December 312020* 2019*
Construction:Makati Development Corporation (MDC) 100% 100%
MDC Subic, Inc. 100 100MDC Build Plus, Inc. 100 100MDC Conqrete, Inc. (MCI) 100 100MDC Equipment Solutions, Inc. (MESI) 100 100MDBI Construction Corp. 67 67
Hotels and Resorts:Ayala Hotels, Inc. (AHI) 50 50AyalaLand Hotels and Resorts Corporation (AHRC)
and Subsidiaries 100 100ALI Makati Hotel & Residences, Inc. 80 80ALI Makati Hotel Property, Inc. 80 80Regent Horizons Conservation Company, Inc. 100 100Enjay Hotels, Inc. (Enjay) 100 100Greenhaven Property Venture, Inc. (GPVI) 100 100Cebu Insular Hotel Company, Inc. (CIHCI) 63 63Bonifacio Hotel Ventures, Inc. 100 100Southcrest Hotel Ventures, Inc. 67 67Northgate Hotel Ventures, Inc. 70 70North Triangle Hotel Ventures, Inc. 100 100Ecosouth Hotel Ventures, Inc. 100 100Sentera Hotel Ventures, Inc. 100 100Econorth Resorts Ventures, Inc. 100 100ALI Triangle Hotel Ventures, Inc. 100 100Circuit Makati Hotel Ventures, Inc. 100 100Capitol Central Hotel Ventures, Inc. 100 100Arca South Hotel Ventures, Inc. 100 100Sicogon Town Hotel, Inc. 100 100Bay Area Hotel Ventures, Inc. 100 100Makati North Hotel Ventures, Inc. (MNHVI) 100 100One Makati Hotel Ventures, Inc. (OMHVI) 100 100Sicogon Island Tourism Estate Corp. (SITE Corp.) 100 100Asiatown Hotel Ventures, Inc. 100 100One Makati Residential Ventures, Inc. 100 100
ALI Makati Hotels & Residences, Inc. 20 20ALI Makati Hotel Property, Inc. 20 20Ten Knots Phils., Inc. (TKPI) 60 60
Bacuit Bay Development Corporation 60 60Lio Resort Ventures, Inc. 60 60North Liberty Resort Ventures, Inc. 60 60Paragua Eco-Resort Ventures, Inc. 60 60Lio Tourism Estate Management Corporation 60 60
Ten Knots Development, Corp. (TKDC) 60 60Chirica Resorts Corp. 60 60Kingfisher Capital Resources Corp. 60 60Pangulasian Island Resort Corporation 60 60
Integrated Eco-resort Inc. 100 100Property Management:
Ayala Property Management Corporation (APMC) 100 100Prime Support Services, Inc. 100 100
Ayala Theatres Management, Inc. (ATMI) and Subsidiaries 100 100DirectPower Services, Inc. (DirectPower) 100 100Philippine Integrated Energy Solutions, Inc. (PhilEnergy) 100 100

- 5 -
*SGVFSM005262*
December 312020* 2019*
Entertainment:Five Star Cinema, Inc. 100% 100%Leisure and Allied Industries Philippines, Inc. (LAIP) 50 50
Others:ALInet.com, Inc. (ALInet) 100 100First Longfield Investments Limited (First Longfield)
(Hongkong Company)100 100
Green Horizons Holdings Limited and Subsidiaries 100 100Aprisa Business Process Solutions, Inc. (Aprisa) 100 100AyalaLand Club Management, Inc. 100 100ALI Capital Corp. (formerly Varejo Corp.) (ALICap) 100 100
Airswift Transport, Inc. (formerly Island Transvoyager,Inc.) (Airswift) 100 100Swift Aerodrome Services, Inc. (SASI) 100 −
Integrated Eco-resort, Inc. 100 100Arca South Integrated Terminal, Inc. (ASITI) 100 100Whiteknight Holdings, Inc. 100 100Ayalaland Medical Facilities Leasing, Inc. 100 100Anvaya Cove Beach and Nature Club, Inc. (Anvaya CoveBeach) 73 73Anvaya Cove Golf and Sports Club, Inc. (Anvaya CoveGolf) 76 76
*represents the Group’s percentage and effective ownership
The above companies are domiciled in the Philippines except for the foreign entities which aredomiciled and incorporated in the country as mentioned above.
AC owns the other 50.0% of AHI. The Parent Company exercises control over AHI. Likewise, theParent Company, through its 50.0% effective ownership and by virtue of a management contract orshareholders’ agreement, exercises control over the operations and management of ACC, BGWest,BGNorth, BGSouth, RLC, ALI-CII and LAIP. Accordingly, the accounts of AHI, ACC, BGWest,BGNorth, BGSouth, RLC, ALI-CII and LAIP are consolidated to the accounts of the Parent Company(see Note 3).
The following were the changes in the group structure during 2020:
AREIT, Inc. (formerly One Dela Rosa Property Development, Inc.) was incorporated in September 4,2006. As of December 31, 2020, the company is 45.04% owned by ALI, 9.39% owned by AyalaLandOffices, Inc. (ALOI), a wholly-owned entity of ALI, and 45.57% public after the company was listed inthe Philippine Stock Exchange on August 13, 2020. Effectively, ALI’s effective ownership is now at54.43% from 100.00% as a result of public offering. The company was organized primarily as a realestate investment trust, as provided under Republic Act No. 9856 (the Real Estate Investment TrustAct of 2009), including its implementing rules and regulations and other applicable laws.
Swift Aerodrome Services, Inc. was incorporated on January 20, 2020 and is 100% owned by ALICapital Corporation (ALICAP), a wholly owned subsidiary of ALI. The company was organizedprimarily to manage and operate airports owned by ALI.
Altaraza Development Corporation was incorporated on May 27, 2020 and is 51% owned subsidiaryof ALI and 49% owned by Gregorio Araneta, Inc. and Araza Resources, Inc. (“Araneta Group”). Thecompany was organized primarily to acquire and develop or hold land for investments in AltarazaEstate in Bulacan.
- 6 -
*SGVFSM005262*
2. Summary of Significant Accounting Policies
Basis of PreparationThe consolidated financial statements of the Group have been prepared using the historical costbasis, except for financial assets at fair value through profit or loss (FVPL) and financial assets at fairvalue through other comprehensive income (FVOCI) that have been measured at fair value. Theconsolidated financial statements are presented in Philippine Peso (P=), which is also the ParentCompany’s functional currency and all values are rounded to the nearest thousand (P=000), exceptwhen otherwise indicated.
The consolidated financial statements provide comparative information in respect of the previousperiod. While there are recent signs of increased market activity with the easing of quarantinemeasures in key areas in the Philippines, management believes that the impact of COVID-19situation remains fluid and evolving and the pace of recovery remains uncertain.
Statement of ComplianceThe consolidated financial statements of the Group have been prepared in compliance with PhilippineFinancial Reporting Standards (PFRSs), which include the availment of the relief granted by the SECunder Memorandum Circular (MC) Nos. 14-2018 and 3-2019, that deferred the implementation of thefollowing accounting pronouncements until December 31, 2020. These accounting pronouncementsaddress the issues of PFRS 15, Revenue from Contracts with Customers affecting the real estateindustry.
Deferral of the following provisions of Philippine Interpretations Committee (PIC) Q&A 2018-12,PFRS 15 Implementation Issues Affecting the Real Estate Industry
a. Treatment of land in the determination of the percentage-of-completion (POC)b. Assessing if the transaction price includes a significant financing component (as amended by PIC
Q&A 2020-04)c. Treatment of uninstalled materials in the determination of the POC (as amended by PIC Q&A
2020-02); andd. Accounting to Common Usage Service Area (CUSA) Charges
Deferral of the adoption of PIC Q&A 2018-14: Accounting for Cancellation of Real Estate Sales (asamended by PIC Q&A 2020-05)
The Group did not avail the relief under SEC MC No. 4-2020 to defer the adoption of IFRIC AgendaDecision on Over Time Transfers of Constructed Goods under PAS 23, Borrowing Cost (the IFRICAgenda Decision on Borrowing Cost) and is already in full compliance with the requirements of theIFRIC Agenda Decision.
In December 2020, the SEC issued MC No. 34-2020, allowing the further deferral of the adoption ofprovisions (a) and (b) above of PIC Q&A 2018-12 and the IFRIC Agenda Decision on Borrowing Cost,for another (three) 3 years or until December 31, 2023.
The details and the impact of the adoption of the above financial reporting reliefs are discussed in theAdoption of New and Amended Accounting Standards and Interpretations section of Note 2.
PFRSs include Philippine Financial Reporting Standards, Philippine Accounting Standards andInterpretations issued by the Philippine Interpretations Committee (PIC).
Basis of ConsolidationThe consolidated financial statements comprise the financial statements of the Group as ofDecember 31, 2020 and 2019 and for each of the three years in the period endedDecember 31, 2020.

- 7 -
*SGVFSM005262*
Control is achieved when the Group is exposed, or has rights, to variable returns from its involvementwith the investee and has the ability to affect that return through its power over the investee.Specifically, the Group controls an investee if and only if the Group has: Power over the investee (i.e. existing rights that give it the current ability to direct the relevant
activities of the investee), Exposure, or rights, to variable returns from its involvement with the investee, and The ability to use its power over the investee to affect its returns.
When the Group has less than a majority of the voting or similar rights of an investee, the Groupconsiders all relevant facts and circumstances in assessing whether it has power over an investee,including: The contractual arrangement with the other vote holders of the investee Rights arising from other contractual arrangements The Group’s voting rights and potential voting rights
The Group re-assesses whether or not it controls an investee if facts and circumstances indicate thatthere are changes to one or more of the three elements of control. Consolidation of a subsidiarybegins when the Group obtains control over the subsidiary and ceases when the Group loses controlof the subsidiary. Assets, liabilities, income and expenses of a subsidiary acquired or disposed ofduring the year are included or excluded in the consolidated financial statements from the date theGroup gains control or until the date the Group ceases to control the subsidiary.
The financial statements of the subsidiaries are prepared for the same reporting period as the ParentCompany, using consistent accounting policies. All intra-group balances, transactions, unrealizedgains and losses resulting from intra-group transactions and dividends are eliminated in full.
Non-controlling interests pertain to the equity in a subsidiary not attributable, directly or indirectly tothe Parent Company. Any equity instruments issued by a subsidiary that are not owned by the ParentCompany are non-controlling interests including preferred shares and options under share-basedtransactions. The portion of profit or loss and net assets in subsidiaries not wholly-owned arepresented separately in the consolidated statement of income, consolidated statement ofcomprehensive income, consolidated statement of changes in equity and consolidated statement offinancial position, separately from the Parent Company’s equity. Non-controlling interests are net ofany outstanding subscription receivable.
A change in the ownership interest of a subsidiary, without loss of control, is accounted for as anequity transaction. If the Group loses control over a subsidiary, it:
Derecognizes the assets (including goodwill) and liabilities of the subsidiary, the carrying amountof any non-controlling interest and the cumulative translation differences recorded in equity.
Recognizes the fair value of the consideration received, the fair value of any investment retainedand any surplus or deficit in profit or loss.
Reclassifies the parent’s share of components previously recognized in other comprehensiveincome to profit or loss or retained earnings, as appropriate.
Adoption of New and Amended Accounting Standards and InterpretationsThe accounting policies adopted in the preparation of the Group’s consolidated financial statementsare consistent with those of the previous financial year except for the adoption of the following newaccounting pronouncements which became effective January 1, 2020. The Group has not earlyadopted any standard, interpretation or amendment that has been issued but is not yet effective.
Amendments to PFRS 3, Definition of a Business
The amendments to PFRS 3 clarifies that to be considered a business, an integrated set ofactivities and assets must include, at a minimum, an input and a substantive process thattogether significantly contribute to the ability to create output. Furthermore, it clarifies that a

- 8 -
*SGVFSM005262*
business can exist without including all of the inputs and processes needed to create outputs.These amendments may impact future periods should the Group enter into any businesscombinations.
These amendments will apply on future business combinations of the Group.
Amendments to PFRS 7, Financial Instruments: Disclosures and PFRS 9, Financial Instruments,Interest Rate Benchmark Reform
The amendments to PFRS 9 provide a number of reliefs, which apply to all hedging relationshipsthat are directly affected by the interest rate benchmark reform. A hedging relationship is affectedif the reform gives rise to uncertainties about the timing and or amount of benchmark-based cashflows of the hedged item or the hedging instrument.
These amendments do not have a significant impact on the Group.
Amendments to PAS 1, Presentation of Financial Statements, and PAS 8, Accounting Policies,Changes in Accounting Estimates and Errors, Definition of Material
The amendments provide a new definition of material that states “information is material ifomitting, misstating or obscuring it could reasonably be expected to influence decisions that theprimary users of general purpose financial statements make on the basis of those financialstatements, which provide financial information about a specific reporting entity.”
The amendments clarify that materiality will depend on the nature or magnitude of information,either individually or in combination with other information, in the context of the financialstatements. A misstatement of information is material if it could reasonably be expected toinfluence decisions made by the primary users.
These amendments do not have a significant impact on the Group.
Conceptual Framework for Financial Reporting issued on March 29, 2018
The Conceptual Framework is not a standard, and none of the concepts contained thereinoverride the concepts or requirements in any standard. The purpose of the ConceptualFramework is to assist the standard-setters in developing standards, to help preparers developconsistent accounting policies where there is no applicable standard in place and to assist allparties to understand and interpret the standards.
The revised Conceptual Framework includes new concepts, provides updated definitions andrecognition criteria for assets and liabilities and clarifies some important concepts.
Amendments to PFRS 16, COVID-19-related Rent Concessions
The amendments provide relief to lessees from applying the PFRS 16 requirement on leasemodifications to rent concessions arising as a direct consequence of the COVID-19 pandemic. Alessee may elect not to assess whether a rent concession from a lessor is a lease modification ifit meets all of the following criteria:• The rent concession is a direct consequence of COVID-19;• The change in lease payments results in a revised lease consideration that is substantially
the same as, or less than, the lease consideration immediately preceding the change;• Any reduction in lease payments affects only payments originally due on or before June 30,
2021; and• There is no substantive change to other terms and conditions of the lease.

- 9 -
*SGVFSM005262*
A lessee that applies this practical expedient will account for any change in lease paymentsresulting from the COVID-19 related rent concession in the same way it would account for achange that is not a lease modification, i.e., as a variable lease payment.
The amendments are effective for annual reporting periods beginning on or after June 1, 2020.Early adoption is permitted.
This amendment is not applicable to the Group as there are no rent concessions granted to theGroup as a lessee.
Adoption of PIC Q&A 2020-03, Q&A No. 2018-12-D: STEP 3- On the accounting of the differencewhen the percentage of completion is ahead of the buyer’s payment
PIC Q&A 2020-03 was issued by the PIC on September 30, 2020. The latter aims to provide anadditional option to the preparers of financial statements to present as receivables, the differencebetween the POC and the buyer’s payment, with the POC being ahead. This PIC Q&A isconsistent with the PIC guidance issued to the real estate industry in September 2019.
The adoption of this PIC Q&A did not impact the consolidated financial statements of the Groupsince it has previously adopted the additional guidance issued by the PIC in September 2019.
Standards Issued but not yet EffectivePronouncements issued but not yet effective are listed below. Unless otherwise indicated, the Groupdoes not expect that the future adoption of the said pronouncements will have a significant impact onits consolidated financial statements. The Group intends to adopt the following pronouncements whenthey become effective.
Effective beginning on or after January 1, 2021
Amendments to PFRS 9, PFRS 7, PFRS 4 and PFRS 16, Interest Rate Benchmark Reform –Phase 2The amendments provide the following temporary reliefs which address the financial reportingeffects when an interbank offered rate (IBOR) is replaced with an alternative nearly risk-freeinterest rate (RFR):• Practical expedient for changes in the basis for determining the contractual cash flows as a
result of IBOR reform• Relief from discontinuing hedging relationships• Relief from the separately identifiable requirement when an RFR instrument is designated as a
hedge of a risk component
The Group shall also disclose information about:• The about the nature and extent of risks to which the entity is exposed arising from financial
instruments subject to IBOR reform, and how the entity manages those risks; and• Their progress in completing the transition to alternative benchmark rates, and how the entity
is managing that transition
The amendments are effective for annual reporting periods beginning on or after January 1, 2021and must be applied retrospectively.
Effective beginning on or after January 1, 2022
Amendments to PFRS 3, Reference to the Conceptual FrameworkThe amendments are intended to replace a reference to the Framework for the Preparation andPresentation of Financial Statements, issued in 1989, with a reference to the ConceptualFramework for Financial Reporting issued in March 2018 without significantly changing itsrequirements. The amendments added an exception to the recognition principle of PFRS 3,
- 10 -
*SGVFSM005262*
Business Combinations to avoid the issue of potential ‘day 2’ gains or losses arising for liabilitiesand contingent liabilities that would be within the scope of PAS 37, Provisions, ContingentLiabilities and Contingent Assets or Philippine-IFRIC 21, Levies, if incurred separately.
At the same time, the amendments add a new paragraph to PFRS 3 to clarify that contingentassets do not qualify for recognition at the acquisition date.
The amendments are effective for annual reporting periods beginning on or after January 1, 2022and apply prospectively.
Amendments to PAS 16 , Plant and Equipment: Proceeds before Intended UseThe amendments prohibit entities deducting from the cost of an item of property, plant andequipment, any proceeds from selling items produced while bringing that asset to the locationand condition necessary for it to be capable of operating in the manner intended by management.Instead, an entity recognizes the proceeds from selling such items, and the costs of producingthose items, in profit or loss.
The amendment is effective for annual reporting periods beginning on or after January 1, 2022and must be applied retrospectively to items of property, plant and equipment made available foruse on or after the beginning of the earliest period presented when the entity first applies theamendment.
The amendments are not expected to have a material impact on the Group.
Amendments to PAS 37, Onerous Contracts – Costs of Fulfilling a ContractThe amendments specify which costs an entity needs to include when assessing whether acontract is onerous or loss-making. The amendments apply a “directly related cost approach”.The costs that relate directly to a contract to provide goods or services include both incrementalcosts and an allocation of costs directly related to contract activities. General and administrativecosts do not relate directly to a contract and are excluded unless they are explicitly chargeable tothe counterparty under the contract.
The amendments are effective for annual reporting periods beginning on or after January 1,2022. The Group will apply these amendments to contracts for which it has not yet fulfilled all itsobligations at the beginning of the annual reporting period in which it first applies theamendments.
Annual Improvements to PFRSs 2018-2020 Cycleo Amendments to PFRS 1, First-time Adoption of Philippines Financial Reporting Standards,
Subsidiary as a first-time adopter
The amendment permits a subsidiary that elects to apply paragraph D16(a) of PFRS 1 tomeasure cumulative translation differences using the amounts reported by the parent, basedon the parent’s date of transition to PFRS. This amendment is also applied to an associate orjoint venture that elects to apply paragraph D16(a) of PFRS 1.
The amendment is effective for annual reporting periods beginning on or after January 1,2022 with earlier adoption permitted. The amendments are not expected to have a materialimpact on the Group.
o Amendments to PFRS 9, Financial Instruments, Fees in the ’10 per cent’ test forderecognition of financial liabilities
The amendment clarifies the fees that an entity includes when assessing whether the termsof a new or modified financial liability are substantially different from the terms of the originalfinancial liability. These fees include only those paid or received between the borrower and

- 11 -
*SGVFSM005262*
the lender, including fees paid or received by either the borrower or lender on the other’sbehalf. An entity applies the amendment to financial liabilities that are modified or exchangedon or after the beginning of the annual reporting period in which the entity first applies theamendment.
The amendment is effective for annual reporting periods beginning on or after January 1,2022 with earlier adoption permitted. The Group will apply the amendments to financialliabilities that are modified or exchanged on or after the beginning of the annual reportingperiod in which the entity first applies the amendment. The amendments are not expected tohave a material impact on the Group.
o Amendments to PAS 41, Agriculture, Taxation in fair value measurements
The amendment removes the requirement in paragraph 22 of PAS 41 that entities excludecash flows for taxation when measuring the fair value of assets within the scope of PAS 41.
An entity applies the amendment prospectively to fair value measurements on or after thebeginning of the first annual reporting period beginning on or after January 1, 2022 withearlier adoption permitted. The amendments are not expected to have a material impact onthe Group.
Effective beginning on or after January 1, 2023
Amendments to PAS 1, Classification of Liabilities as Current or Non-currentThe amendments clarify paragraphs 69 to 76 of PAS 1, Presentation of Financial Statements, tospecify the requirements for classifying liabilities as current or non-current. The amendmentsclarify:o What is meant by a right to defer settlemento That a right to defer must exist at the end of the reporting periodo That classification is unaffected by the likelihood that an entity will exercise its deferral righto That only if an embedded derivative in a convertible liability is itself an equity instrument
would the terms of a liability not impact its classification
The amendments are effective for annual reporting periods beginning on or after January 1, 2023and must be applied retrospectively. The Group is currently assessing the impact theamendments will have on current practice and whether existing loan agreements may requirerenegotiation.
PFRS 17, Insurance ContractsPFRS 17 is a comprehensive new accounting standard for insurance contracts coveringrecognition and measurement, presentation and disclosure. Once effective, PFRS 17 will replacePFRS 4, Insurance Contracts. This new standard on insurance contracts applies to all types ofinsurance contracts (i.e., life, non-life, direct insurance and re-insurance), regardless of the typeof entities that issue them, as well as to certain guarantees and financial instruments withdiscretionary participation features. A few scope exceptions will apply.
The overall objective of PFRS 17 is to provide an accounting model for insurance contracts that ismore useful and consistent for insurers. In contrast to the requirements in PFRS 4, which arelargely based on grandfathering previous local accounting policies, PFRS 17 provides acomprehensive model for insurance contracts, covering all relevant accounting aspects. The coreof PFRS 17 is the general model, supplemented by:
• A specific adaptation for contracts with direct participation features (the variable feeapproach)
• A simplified approach (the premium allocation approach) mainly for short-duration contracts
- 12 -
*SGVFSM005262*
PFRS 17 is effective for reporting periods beginning on or after January 1, 2023, withcomparative figures required. Early application is permitted.
The new standard is not applicable to the Group since none of the entities within the Group haveactivities that are predominantly connected with insurance or issue insurance contracts.
Deferred Effectivity
Amendments to PFRS 10, Consolidated Financial Statements, and PAS 28, Sale or Contributionof Assets between an Investor and its Associate or Joint VentureThe amendments address the conflict between PFRS 10 and PAS 28 in dealing with the loss ofcontrol of a subsidiary that is sold or contributed to an associate or joint venture. Theamendments clarify that a full gain or loss is recognized when a transfer to an associate or jointventure involves a business as defined in PFRS 3. Any gain or loss resulting from the sale orcontribution of assets that does not constitute a business, however, is recognized only to theextent of unrelated investors’ interests in the associate or joint venture.
On January 13, 2016, the Financial Reporting Standards Council deferred the original effectivedate of January 1, 2016 of the said amendments until the International Accounting StandardsBoard (IASB) completes its broader review of the research project on equity accounting that mayresult in the simplification of accounting for such transactions and of other aspects of accountingfor associates and joint ventures.
The Group is currently assessing the impact of adopting these amendments.
Deferral of Certain Provisions of PIC Q&A 2018-12, PFRS 15 Implementation Issues Affecting theReal Estate Industry (as amended by PIC Q&As 2020-02 and 2020-04)
On February 14, 2018, the PIC issued PIC Q&A 2018-12 which provides guidance on somePFRS 15 implementation issues affecting the real estate industry. On October 25, 2018 andFebruary 08, 2019, the Philippine Securities and Exchange Commission (SEC) issued SEC MCNo. 14-2018 and SEC MC No. 3-2019, respectively, providing relief to the real estate industry bydeferring the application of certain provisions of this PIC Q&A for a period of three years untilDecember 31, 2020. On December 15, 2020, the Philippine SEC issued SEC MC No. 34-2020which further extended the deferral of certain provisions of this PIC Q&A until December 31,2023. A summary of the PIC Q&A provisions covered by the SEC deferral and the relateddeferral period follows:
Deferral Perioda. Assessing if the transaction price includes a significant financing
component as discussed in PIC Q&A 2018-12-D (as amended by PICQ&A 2020-04)
Until December 31, 2023
b. Treatment of land in the determination of the POC discussed in PICQ&A 2018-12-E
Until December 31, 2023
c. Treatment of uninstalled materials in the determination of the POCdiscussed in PIC Q&A 2018-12-E (as amended by PIC Q&A 2020-02)
Until December 31, 2020
d. Accounting for CUSA Charges discussed in PIC Q&A No. 2018-12-H Until December 31, 2020
The SEC Memorandum Circulars also provided the mandatory disclosure requirements should anentity decide to avail of any relief. Disclosures should include:a. The accounting policies applied.b. Discussion of the deferral of the subject implementation issues in the PIC Q&A.c. Qualitative discussion of the impact on the financial statements had the concerned
application guidelines in the PIC Q&A been adopted.d. Should any of the deferral options result into a change in accounting policy (e.g., when an
entity excludes land and/or uninstalled materials in the POC calculation under the previousstandard but opted to include such components under the relief provided by the circular),

- 13 -
*SGVFSM005262*
such accounting change will have to be accounted for under PAS 8, i.e., retrospectively,together with the corresponding required quantitative disclosures.
In November 2020, the PIC issued the following Q&As which provide additional guidance on thereal estate industry issues covered by the above SEC deferrals: PIC Q&A 2020-04, which provides additional guidance on determining whether the
transaction price includes a significant financing component PIC Q&A 2020-02, which provides additional guidance on determining which uninstalled
materials should not be included in calculating the POC
The Group has adopted PIC Q&A 2020-02 and has included the uninstalled customizedmaterials in the measurement of progress. This is consistent with the Group’s policy.
After the deferral period, real estate companies would have to adopt PIC Q&A No. 2018-12 andany subsequent amendments thereto retrospectively or as the SEC will later prescribe.
The Group availed of the SEC reliefs to defer the above specific provisions of PIC Q&A No. 2018-12. Had these provisions been adopted, the Group assessed that the impact would have been asfollows:
a. The mismatch between the POC of the real estate projects and right to an amount ofconsideration based on the schedule of payments provided for in the contract to sell mightconstitute a significant financing component. In case of the presence of significant financingcomponent, the guidance should have been applied retrospectively and would have resultedin restatement of prior year financial statements. Adoption of this guidance would haveimpacted interest income, interest expense, revenue from real estate sales, installmentcontracts receivable, provision for deferred income tax, deferred tax asset or liability for allyears presented, and the opening balance of retained earnings. The Group believes that thethe mismatch for its contract to sell does not constitute a significant financing componentbased on the examples provided in the PIC letter dated November 11, 2020.
b. The exclusion of land in the determination of POC would have reduced the percentage ofcompletion of real estate projects. Adoption of this guidance would have reduced revenuefrom real estate sales, cost of sales and installment contracts receivable; increased realestate inventories and would have impacted deferred tax asset or liability and provision fordeferred income tax for all years presented, and the opening balance of retained earnings.
c. Had the Group accounted for the revenue from air-conditioning services, CUSA and handlingservices as principal, this would have resulted in the gross presentation of the relatedrevenue, costs and expenses. The Group opts to use alternative presentation of CUSA asother income as the gross amount of revenue and related costs and expenses are notindividually material. There is no impact on opening retained earnings, income and expenseand the related balance sheet accounts.
The above would have impacted the cash flows from operations and cash flows from financingactivities for all years presented.
As prescribed by SEC MC No. 34-2020, for financial reporting periods beginning on or afterJanuary 1, 2021, the availment of the above deferral will impact the Group’s financial reportingduring the period of deferral as follows:
a. The financial statements are not considered to be in accordance with PFRS and shouldspecify in the “Basis of Preparation of the Financial Statements” section of the financialstatements that the accounting framework is:

- 14 -
*SGVFSM005262*
PFRS, as modified by the application of the following financial reporting reliefs issued andapproved by the Securities and Exchange Commission in response to the COVID-19pandemic:1) Treatment of land in the determination of the percentage-of-completion; and2) Assessing if the transaction price includes a significant financing component (as
amended by PIC Q&A 2020-04)
b. The Auditor’s report will:i. reflect in the Opinion paragraph that the financial statements are prepared in accordance
with the compliance framework described in the notes to the financial statements; andii. include an Emphasis of Matter paragraph to draw attention to the basis of accounting that
has been used in the preparation of the financial statements.
Upon full adoption of the above deferred guidance, the accounting policies will have to be appliedusing full retrospective approach following the guidance under PAS 8, Accounting Policies,Changes in Accounting Estimates and Errors.
Deferral of PIC Q&A 2018-14, Accounting for Cancellation of Real Estate Sales (as amended byPIC Q&A 2020-05)
On June 27, 2018, PIC Q&A 2018-14 was issued providing guidance on accounting forcancellation of real estate sales. Under SEC MC No. 3-2019, the adoption of PIC Q&A No. 2018-14 was deferred until December 31, 2020. After the deferral period, real estate companies willadopt PIC Q&A No. 2018-14 and any subsequent amendments thereto retrospectively or as theSEC will later prescribe.
On November 11, 2020, PIC Q&A 2020-05 was issued which supersedes PIC Q&A 2018-14. ThisPIC Q&A adds a new approach where the cancellation is accounted for as a modification of thecontract (i.e., from non-cancellable to being cancellable). Under this approach, revenues andrelated costs previously recognized shall be reversed in the period of cancellation and theinventory shall be reinstated at cost. PIC Q&A 2020-05 will have to be applied prospectively fromapproval date of the Financial Reporting Standards Council which was November 11, 2020.
The Group availed of the SEC relief to defer of adoption of this PIC Q&A until December 31,2020. Currently, the Group records the repossessed inventory at cost. The Group has opted toimplement approach 3 in its accounting for sales cancellation.
Current and Noncurrent ClassificationThe Group presents assets and liabilities in the consolidated statement of financial position based oncurrent/noncurrent classification. An asset is current when:
(a) Expected to be realized or intended to be sold or consumed in normal operating cycle;(b) Held primarily for the purpose of trading;(c) Expected to be realized within 12 months after reporting date; or(d) Cash or cash equivalent unless restricted from being exchanged or used to settle a liability for at
least 12 months after reporting date.
All other assets are classified as noncurrent.
A liability is current when:
It is expected to be settled in the normal operating cycle; It is held primarily for the purpose of trading; It is due to be settled within 12 months after reporting date; or There is no unconditional right to defer the settlement of the liability for at least 12 months after
reporting date.

- 15 -
*SGVFSM005262*
The Group classifies all other liabilities as noncurrent.
Deferred tax assets and liabilities are classified as noncurrent assets and liabilities, respectively.
Fair Value MeasurementFair value is the price that would be received to sell an asset or paid to transfer a liability in an orderlytransaction between market participants at the measurement date. The fair value measurement isbased on the presumption that the transaction to sell the asset or transfer the liability takes placeeither: In the principal market for the asset or liability, or In the absence of a principal market, in the most advantageous market for the asset or liability
The principal or the most advantageous market must be accessible to the Group.
The fair value of an asset or a liability is measured using the assumptions that market participantswould use when pricing the asset or liability, assuming that market participants act in their economicbest interest.
A fair value measurement of a non-financial asset takes into account a market participant's ability togenerate economic benefits by using the asset in its highest and best use or by selling it to anothermarket participant that would use the asset in its highest and best use.
The Group uses valuation techniques that are appropriate in the circumstances and for whichsufficient data are available to measure fair value, maximizing the use of relevant observable inputsand minimizing the use of unobservable inputs.
All assets for which fair value is measured or disclosed in the consolidated financial statements arecategorized within the fair value hierarchy, described as follows, based on the lowest level input thatis significant to the fair value measurement as a whole: Level 1 - Quoted (unadjusted) market prices in active markets for identical assets or liabilities Level 2 - Valuation techniques for which the lowest level input that is significant to the fair value
measurement is directly or indirectly observable Level 3 - Valuation techniques for which the lowest level input that is significant to the fair value
measurement is unobservable.
For assets and liabilities that are recognized in the consolidated financial statements on a recurringbasis, the Group determines whether transfers have occurred between Levels in the hierarchy by re-assessing categorization (based on the lowest level input that is significant to the fair valuemeasurement as a whole) at the end of each reporting period.
External valuers are involved for valuation of significant assets, such as investment properties.Involvement of external valuers is decided upon annually by corporate finance after discussion withand approval by the Parent Company’s audit committee. Selection criteria include market knowledge,reputation, independence and whether professional standards are maintained.
The Group, in conjunction with the external valuers, also compares each of the changes in the fairvalue of each asset with relevant external sources to determine whether the change is reasonable.
For the purpose of fair value disclosures, the Group has determined classes of assets on the basis ofthe nature, characteristics and risks of the asset and the level of the fair value hierarchy as explainedabove.
Cash and Cash EquivalentsCash includes cash on hand and in banks. Cash equivalents are short-term, highly liquid investmentsthat are readily convertible to known amounts of cash with original maturities of three (3) months orless from dates of placement and that are subject to an insignificant risk of change in value.

- 16 -
*SGVFSM005262*
Financial InstrumentsDate of recognitionThe Group recognizes a financial asset or a financial liability in the consolidated statement of financialposition when it becomes a party to the contractual provisions of the instrument. Purchases or salesof financial assets that require delivery of assets within the time frame established by regulation orconvention in the marketplace are recognized on the settlement date.
a. Financial assets
Initial recognition of financial instrumentsFinancial assets are classified, at initial recognition, as subsequently measured at amortized cost, fairvalue through other comprehensive income (OCI), and fair value through profit or loss.
The classification of financial assets at initial recognition depends on the financial asset’s contractualcash flow characteristics and the Group’s business model for managing them. The Group initiallymeasures a financial asset at its fair value plus, in the case of a financial asset not at fair valuethrough profit or loss, transaction costs. Trade receivables, except for contracts with customers inresidential, commercial and office development receivables, are measured at the transaction pricedetermined under PFRS 15. Refer to the accounting policies on Revenue from contracts withcustomers.
In order for a financial asset to be classified and measured at amortized cost or fair value throughOCI, it needs to give rise to cash flows that are ‘solely payments of principal and interest (SPPI)’ onthe principal amount outstanding. This assessment is referred to as the SPPI test and is performed atan instrument level.
The Group’s business model for managing financial assets refers to how it manages its financialassets in order to generate cash flows. The business model determines whether cash flows will resultfrom collecting contractual cash flows, selling the financial assets, or both.
Purchases or sales of financial assets that require delivery of assets within a time frame establishedby regulation or convention in the market place (regular way trades) are recognised on the trade date,i.e., the date that the Group commits to purchase or sell the asset.
Subsequent measurementFor purposes of subsequent measurement, financial assets are classified in four categories: Financial assets at amortized cost (debt instruments) Financial assets at fair value through OCI with recycling of cumulative gains and losses (debt
instruments) Financial assets designated at fair value through OCI with no recycling of cumulative gains and
losses upon derecognition (equity instruments) Financial assets at fair value through profit or loss
Financial assets at amortized costThis category is the most relevant to the Group. The Group measures financial assets at amortisedcost if both of the following conditions are met: The financial asset is held within a business model with the objective to hold financial assets in
order to collect contractual cash flows; and The contractual terms of the financial asset give rise on specified dates to cash flows that are
solely payments of principal and interest on the principal amount outstanding.
Financial assets at amortized cost are subsequently measured using the effective interest (EIR)method and are subject to impairment. Interest income and impairment losses or reversals arerecognized in the consolidated statement of comprehensive income. Gains and losses are recognizedin profit or loss when the asset is derecognized, modified or impaired.

- 17 -
*SGVFSM005262*
The Group’s financial assets at amortized cost includes cash and cash equivalents, short-terminvestments and accounts and notes receivables.
Disposal of financial assets at amortized costWhen financial assets at amortized cost are disposed, these are assessed whether the Group isconsistent with its objective of collecting contractual cash flows until maturity. In the event thatdisposals have been concluded as infrequent and insignificant, the financial assets continue to beaccounted at amortized cost (see Note 7).
Financial assets at fair value through OCI (debt instruments)The Group measures debt instruments at fair value through OCI if both of the following conditions aremet: The financial asset is held within a business model with the objective of both holding to collect
contractual cash flows and selling; and The contractual terms of the financial asset give rise on specified dates to cash flows that are solely
payments of principal and interest on the principal amount outstanding.
For debt instruments at fair value through OCI, interest income, foreign exchange revaluation andimpairment losses or reversals are recognized in the consolidated statement of income and computedin the same manner as for financial assets measured at amortized cost. The remaining fair valuechanges are recognized in OCI. Upon derecognition, the cumulative fair value change recognized inOCI is recycled to profit or loss.
This category includes investment in bonds classified as financial assets at fair value through OCI.
Financial assets designated at fair value through OCI (equity instruments)Upon initial recognition, the Group can elect to classify irrevocably its equity investments as equityinstruments designated at fair value through OCI when they meet the definition of equity underPAS 32, Financial Instruments: Presentation and are not held for trading. The classification isdetermined on an instrument-by-instrument basis.
Gains and losses on these equity instruments are never recycled to profit or loss. Dividends arerecognized as other income in the consolidated statement of income when the right of payment hasbeen established, except when the Group benefits from such proceeds as a recovery of part of thecost of the financial asset, in which case, such gains are recorded in OCI. Equity instrumentsdesignated at fair value through OCI are not subject to impairment assessment.
The Group’s financial assets at fair value through OCI includes investments in quoted and unquotedequity instruments.
Financial assets at fair value through profit or lossFinancial assets at fair value through profit or loss include financial assets held for trading, financialassets designated upon initial recognition at fair value through profit or loss, or financial assetsmandatorily required to be measured at fair value. Financial assets are classified as held for trading ifthey are acquired for the purpose of selling or repurchasing in the near term. Derivatives, includingseparated embedded derivatives, are also classified as held for trading unless they are designated aseffective hedging instruments. Financial assets with cash flows that are not solely payments ofprincipal and interest are classified and measured at fair value through profit or loss, irrespective ofthe business model. Notwithstanding the criteria for debt instruments to be classified at amortisedcost or at fair value through OCI, as described above, debt instruments may be designated at fairvalue through profit or loss on initial recognition if doing so eliminates, or significantly reduces, anaccounting mismatch.
Financial assets at fair value through profit or loss are carried in the consolidated statement of financialposition at fair value with net changes in fair value recognized in the consolidated statement of income.

- 18 -
*SGVFSM005262*
Investments in Unit Investment Trust Fund (UITF), treasury bills and investment in ARCH CapitalAsian Partners L.P. (ARCH Capital Fund) are held for trading and classified as financial assets atFVPL.
DerecognitionA financial asset (or, where applicable, a part of a financial asset or part of a group of similar financialassets) is primarily derecognized (i.e., removed from the Group’s consolidated statement of financialposition) when: The rights to receive cash flows from the asset have expired, or The Group has transferred its rights to receive cash flows from the asset or has assumed an
obligation to pay the received cash flows in full without material delay to a third party under a‘pass-through’ arrangement; and either (a) the Group has transferred substantially all the risksand rewards of the asset, or (b) the Group has neither transferred nor retained substantially allthe risks and rewards of the asset, but has transferred control of the asset.
When the Group has transferred its rights to receive cash flows from an asset or has entered into apass-through arrangement, it evaluates if, and to what extent, it has retained the risks and rewards ofownership. When it has neither transferred nor retained substantially all of the risks and rewards ofthe asset, nor transferred control of the asset, the Group continues to recognize the transferred assetto the extent of its continuing involvement. In that case, the Group also recognizes an associatedliability. The transferred asset and the associated liability are measured on a basis that reflects therights and obligations that the Group has retained.
Continuing involvement that takes the form of a guarantee over the transferred asset is measured atthe lower of the original carrying amount of the asset and the maximum amount of consideration thatthe Group could be required to repay.
Modification of financial assetsThe Group derecognizes a financial asset when the terms and conditions have been renegotiated tothe extent that, substantially, it becomes a new asset, with the difference between its carrying amountand the fair value of the new asset recognized as a derecognition gain or loss in profit or loss, to theextent that an impairment loss has not already been recorded.
When the contractual cash flows of a financial asset are renegotiated or otherwise modified and therenegotiation or modification does not result in the derecognition of that financial asset, the Grouprecalculates the gross carrying amount of the financial asset as the present value of the renegotiatedor modified contractual cash flows discounted at the original EIR (or credit-adjusted EIR forpurchased or originated credit-impaired financial assets) and recognizes a modification gain or loss inthe consolidated statement of income.
Impairment of Financial AssetsThe Group recognizes an allowance for expected credit losses (ECLs) for all debt instruments notheld at fair value through profit or loss. ECLs are based on the difference between the contractualcash flows due in accordance with the contract and all the cash flows that the Group expects toreceive, discounted at an approximation of the original effective interest rate. The expected cashflows will include cash flows from the sale of collateral held or other credit enhancements that areintegral to the contractual terms.
For trade receivables, the Group applies a simplified approach in calculating ECLs. Therefore, theGroup does not track changes in credit risk, but instead recognizes a loss allowance based onlifetime ECLs at each reporting date. The Group has established a provision matrix for tradereceivables and a vintage analysis for residential, commercial and office development receivablesthat is based on historical credit loss experience, adjusted for forward-looking factors specific to thedebtors and the economic environment.

- 19 -
*SGVFSM005262*
For other financial assets such as accrued receivable, receivable from related parties and advancesto other companies, ECLs are recognized in two stages. For credit exposures for which there has notbeen a significant increase in credit risk since initial recognition, ECLs are provided for credit lossesthat result from default events that are possible within the next 12-months (a 12-month ECL). Forthose credit exposures for which there has been a significant increase in credit risk since initialrecognition, a loss allowance is required for credit losses expected over the remaining life of theexposure, irrespective of the timing of the default (a lifetime ECL).
For cash and cash equivalents and short-term investments, the Group applies the low credit risksimplification. The probability of default and loss given defaults are publicly available and areconsidered to be low credit risk investments. It is the Group’s policy to measure ECLs on suchinstruments on a 12-month basis. However, when there has been a significant increase in credit risksince origination, the allowance will be based on the lifetime ECL. The Group uses the ratings fromStandard and Poor’s (S&P), Moody’s and Fitch to determine whether the debt instrument hassignificantly increased in credit risk and to estimate ECLs.
The Group considers a debt investment security to have low credit risk when its credit risk rating isequivalent to the globally understood definition of ‘investment grade’.
The key inputs in the model include the Group’s definition of default and historical data of three yearsfor the origination, maturity date and default date. The Group considers trade receivables in defaultwhen contractual payments are 90 days past due, except for certain circumstances when the reasonfor being past due is due to reconciliation with customers of payment records which are administrativein nature which may extend the definition of default to 90 days and beyond. However, in certaincases, the Group may also consider a financial asset to be in default when internal or externalinformation indicates that the Group is unlikely to receive the outstanding contractual amounts in fullbefore taking into account any credit enhancements held by the Group.
Determining the stage for impairmentAt each reporting date, the Group assesses whether there has been a significant increase in creditrisk for financial assets since initial recognition by comparing the risk of default occurring over theexpected life between the reporting date and the date of initial recognition. The Group considersreasonable and supportable information that is relevant and available without undue cost or effort forthis purpose. This includes quantitative and qualitative information and forward-looking analysis.
The Group considers that there has been a significant increase in credit risk when contractualpayments are more than 90 days past due.
An exposure will migrate through the ECL stages as asset quality deteriorates. If, in a subsequentperiod, asset quality improves and also reverses any previously assessed significant increase incredit risk since origination, then the loss allowance measurement reverts from lifetime ECL to 12-months ECL.
b. Financial liabilities
Initial recognition and measurementFinancial liabilities are classified, at initial recognition, as financial liabilities at fair value through profitor loss, loans and borrowings, payables, or as derivatives designated as hedging instruments in aneffective hedge, as appropriate.
All financial liabilities are recognized initially at fair value and, in the case of loans and borrowings andpayables, net of directly attributable transaction costs.
Directly attributable transaction costs are documentary stamp tax, underwriting and selling fees,regulatory filing fees and other fees.
- 20 -
*SGVFSM005262*
The Group’s financial liabilities include “Accounts and other payables” (other than “Taxes payable”which is covered by another accounting standard), “Short-term and long-term debts”, “Deposits andOther Liabilities” and “Lease liabilities”.
Subsequent measurementThe measurement of financial liabilities depends on their classification, as described below:
Financial liabilities at fair value through profit or lossFinancial liabilities at fair value through profit or loss include financial liabilities held for trading andfinancial liabilities designated upon initial recognition as at fair value through profit or loss.
Financial liabilities are classified as held for trading if they are incurred for the purpose ofrepurchasing in the near term. This category also includes derivative financial instruments enteredinto by the Group that are not designated as hedging instruments in hedge relationships as definedby PFRS 9. Separated embedded derivatives are also classified as held for trading unless they aredesignated as effective hedging instruments.
Gains or losses on liabilities held for trading are recognized in the consolidated statement of income.
Only if the criteria in PFRS 9 are satisfied, the designation of financial liabilities at fair value throughprofit or loss at the initial date of recognition is allowed. The Group has not designated any financialliability as at fair value through profit or loss.
Loans and borrowingsThis is the category most relevant to the Group. After initial recognition, interest-bearing loans andborrowings are subsequently measured at amortized cost using the EIR method. Gains and lossesare recognized in profit or loss when the liabilities are derecognized as well as through the EIRamortization process.
Amortized cost is calculated by taking into account any discount or premium on acquisition and feesor costs that are an integral part of the EIR. The EIR amortization is included as finance costs in thestatement of profit or loss.
This category generally applies to short term and long term debt.
DerecognitionA financial liability is derecognized when the obligation under the liability is discharged or cancelled orexpires. When an existing financial liability is replaced by another from the same lender onsubstantially different terms, or the terms of an existing liability are substantially modified, such anexchange or modification is treated as the derecognition of the original liability and the recognition ofa new liability. The difference in the respective carrying amounts is recognized in the consolidatedstatement of income.
c. Offsetting Financial Instruments
Financial assets and financial liabilities are offset and the net amount reported in the consolidatedstatement of financial position, if, and only if, there is a currently enforceable legal right to offset therecognized amounts and there is an intention to settle on a net basis, or to realize the asset and settlethe liability simultaneously.
DerivativesThe Group uses derivative financial instruments, such as non-deliverable forwards, cross currencyswaps, interest rate swaps and principal only swaps contracts to hedge its foreign currency risks andinterest rate risks. Such derivative financial instruments are initially recognized at fair value on thedate on which a derivative contract is entered into and are subsequently remeasured at fair value.Derivatives are carried as financial assets when the fair value is positive and as financial liabilitieswhen the fair value is negative.
- 21 -
*SGVFSM005262*
Refundable DepositsRefundable deposits are measured initially at fair value. After initial recognition, refundable depositsare subsequently measured at amortized cost using the effective interest method.
The difference between the cash received and its fair value is deferred and amortized using thestraight-line method under the “Real estate revenue” account in the consolidated statement ofincome.
Non-refundable deposits that are applicable against costs of services incurred or goods delivered aremeasured at fair value.
Concession ReceivableThe Group accounts for its concession arrangement with the DOTr under the Financial Asset modelas it has an unconditional contractual right to receive cash or other financial asset for its constructionservices from or at the direction of the grantor. Under the concession arrangement, the Group isawarded the right to build and operate an integrated transport terminal for Metro Manila and itsadjacent provinces. The legal title to these assets shall be transferred to the government at the end ofthe concession period.
The “Concession Financial Receivable” (shown as part of “Other Noncurrent Assets”) pertains to thefair value of the Annual Grantor Payment related to the operating and maintenance services andrecovery of construction costs of the terminal facility. These are amortized using the effective interestrate over the life of the related concession.
In addition, the Group recognizes and measures construction revenues and costs in accordance with‘percentage of completion method’. Contract revenue and costs from construction works arerecognized as “Construction Revenue” and “Construction Costs”, respectively, in profit or loss in theperiod in which the work is performed.
InventoriesProperty acquired or being constructed for sale in the ordinary course of business, rather than to beheld for rental or capital appreciation, is held as inventory and is measured at the lower of cost andnet realizable value (NRV).
Cost includes: Land cost Land improvement cost Amounts paid to contractors for construction and development Planning and design costs, costs of site preparation, professional fees, property transfer taxes,
construction overheads and other related costs.
Inventories that are leased out at market rates to earn revenues to partly cover for expenses on thecondition that the intent to sell in the ordinary course of business has not changed are accounted andpresented as inventory. The rent income from inventories that are leased out is included in otherincome in the consolidated statement of comprehensive income.
NRV is the estimated selling price in the ordinary course of the business, based on market prices atthe reporting date, less estimated costs of completion and the estimated costs of sale.
Prepaid ExpensesPrepaid expenses are carried at cost less the amortized portion. These typically compriseprepayments for commissions, marketing fees, advertising and promotions, taxes and licenses, andinsurance.
With the exception of commission which is amortized using percentage of completion, other prepaidexpenses are amortized as incurred.

- 22 -
*SGVFSM005262*
Input Value-Added Tax (VAT)Input VAT arises from the purchase of goods and services. These are applied against output VAT.The remaining balance is recoverable in future periods. These are carried at cost less allowance forimpairment loss, if any. Impairment loss is recognized when input VAT can no longer be recovered.
Materials, Parts and SuppliesMaterials, parts and supplies are valued at the lower of cost or NRV. Cost is determined using themoving average method. NRV is the estimated selling price in the ordinary course of business, lessestimated costs of completion and estimated costs necessary to make the sale.
An allowance for inventory losses is provided for slow-moving, obsolete and defective materials, partsand supplies based on management’s physical inspection and evaluation. When inventories are sold,the cost and related allowance is removed from the account and the difference is charged againstoperations.
Advances to Other Companies and Advances to Contractors and SuppliersAdvances to other companies and advances to contractors and suppliers are carried at cost lessimpairment losses, if any.
Investments in Associates and Joint VenturesInvestments in associates and joint ventures (investee companies) are accounted for under the equitymethod of accounting. An associate is an entity in which the Group has significant influence andwhich is neither a subsidiary nor a joint venture. A joint arrangement is a contractual arrangementwhereby two or more parties undertake an economic activity that is subject to joint control, and a jointventure is a joint arrangement that involves the establishment of a separate entity in which eachventurer has an interest.
An investment is accounted for using the equity method from the day it becomes an associate or jointventure. On acquisition of investment, the excess of the cost of investment over the investor’s sharein the net fair value of the investee’s identifiable assets, liabilities and contingent liabilities isaccounted for as subsumed goodwill and included in the carrying amount of the investment and notamortized. Any excess of the investor’s share of the net fair value of the investee’s identifiableassets, liabilities and contingent liabilities over the cost of the investment is excluded from thecarrying amount of the investment, and instead included in the determination of the share in theearnings of the investees.
Under the equity method, the investments in the investee companies are carried in the consolidatedstatement of financial position at cost plus post-acquisition changes in the Group’s share in the netassets of the investee companies, less any impairment in values. The consolidated statement ofincome reflects the share of the results of the operations of the investee companies. The Group’sshare of post-acquisition movements in the investee’s equity reserves is recognized directly in equity.Profits and losses resulting from transactions between the Group and the investee companies areeliminated to the extent of the interest in the investee companies and for unrealized losses to theextent that there is no evidence of impairment of the asset transferred. Dividends received aretreated as a reduction of the carrying value of the investment.
The Group discontinues applying the equity method when their investments in investee companiesare reduced to zero. Unless otherwise, additional losses are not recognized when the Group hasguaranteed certain obligations of the investee companies. When the investee companiessubsequently report net income, the Group will resume applying the equity method but only after itsshare of that net income equals the share of net losses not recognized during the period the equitymethod was suspended.
The reporting dates of the investee companies and the Group are identical and the investeecompanies’ accounting policies conform to those used by the Group for like transactions and eventsin similar circumstances.
- 23 -
*SGVFSM005262*
Upon loss of significant influence over the investee companies, the Group measures and recognizesany retaining investment at its fair value. Any difference between the carrying amount of theassociate upon loss of significant influence and the fair value of the retaining investment andproceeds from disposal is recognized in the consolidated statement of income.
Interest in Joint OperationMakati Development Corporation (MDC), a subsidiary of the Parent Company, has an interest in jointarrangement, whereby the parties have a contractual arrangement that establishes joint control. MDCrecognizes its share of jointly held assets, liabilities, income and expenses of the joint operation withsimilar items, line by line, in its financial statements.
The financial statements of the joint operation are prepared for the same reporting period as theGroup. Where necessary, adjustments are made to bring the accounting policies in line with those ofthe Group.
Investment PropertiesInvestment properties comprise completed property and property under construction or under re-development that are held to earn rentals or capital appreciation or both and that are not occupied bythe companies in the Group.
The Group uses the cost model in measuring investment properties since this represents thehistorical value of the properties subsequent to initial recognition. Investment properties, except forland, are carried at cost less accumulated depreciation and amortization and any impairment inresidual value. Land is carried at cost less any impairment in value.
Expenditures incurred after the investment property has been put in operation, such as repairs andmaintenance costs, are normally charged against income in the period in which the costs areincurred.
Assets that are under construction are carried at cost and transferred to the related investmentproperty account when the construction and related activities to prepare the property for its intendeduse are complete, and the property is ready for occupation or under the condition as intended by theGroup.
Depreciation of investment properties are computed using the straight-line method over the estimateduseful lives of the assets. The estimated useful lives and the depreciation method are reviewedperiodically to ensure that the period and method of depreciation are consistent with the expectedpattern of economic benefits from items of investment properties.
The estimated useful lives of investment properties which comprised of buildings, range from 20-40years.
Investment properties are derecognized when either they have been disposed of, or when theinvestment property is permanently withdrawn from use and no future economic benefit is expectedfrom its disposal. Any gain or loss on the retirement or disposal of an investment property isrecognized in the consolidated statement of income in the year of retirement or disposal.
A transfer is made to investment property when there is a change in use, evidenced by ending ofowner-occupation, commencement of an operating lease to another party or ending of construction ordevelopment. A transfer is made from investment property when and only when there is a change inuse, evidenced by commencement of owner-occupation or commencement of development with aview to sale. A transfer between investment property, owner-occupied property and inventory doesnot change the carrying amount of the property transferred nor does it change the cost of thatproperty for measurement or disclosure purposes.
The Group discloses the fair values of its investment properties in accordance with PAS 40. TheGroup engages independent valuation specialist to assess the fair values as at December 31, 2020

- 24 -
*SGVFSM005262*
and 2019. The Group’s investment properties consist of land and building pertaining to landproperties, retail (malls) and office properties. These are valued by reference to market-basedevidence using comparable prices adjusted for specific market factors such as nature, location andcondition of the property and income approach by reference to the value of income, cash flow or costsaving generated by the asset.
Property and EquipmentProperty and equipment, except for land, are carried at cost less accumulated depreciation andamortization and any impairment in value. Land is carried at cost less any impairment in value. Theinitial cost of property and equipment comprises its construction cost or purchase price and anydirectly attributable costs of bringing the asset to its working condition and location for its intendeduse.
Major repairs are capitalized as part of property and equipment only when it is probable that futureeconomic benefits associated with the item will flow to the Group and the cost of the items can bemeasured reliably. All other repairs and maintenance are charged against current operations asincurred.
Depreciation and amortization of property and equipment commences once the property andequipment are available for use and are computed on a straight-line basis over the estimated usefullives of the property and equipment as follows:
YearsBuildings and improvements 20-40Machinery and construction equipment 5Furniture, fixtures and equipment 3-10Transportation equipment 3-5Hotel property and equipment 20-50
The assets’ residual values, estimated useful lives and depreciation and amortization method arereviewed periodically to ensure that the amounts, periods and method of depreciation andamortization are consistent with the expected pattern of economic benefits from items of property andequipment.
When property and equipment items are retired or otherwise disposed of, the cost and the relatedaccumulated depreciation and amortization and accumulated provision for impairment losses, if any,are removed from the accounts and any resulting gain or loss is credited to or charged againstcurrent operations.
Intangible AssetsIntangible assets acquired separately are measured on initial recognition at cost. The cost ofintangible assets acquired in a business combination is its fair value as at the date of acquisition.Following initial recognition, intangible assets are carried at cost less any accumulated amortizationand accumulated impairment losses, if any. Internally generated intangible assets, excludingcapitalized development costs, are not capitalized and expenditure is reflected in the consolidatedstatement of income in the year in which the expenditure is incurred.
Leasehold rights with finite lives are amortized using the straight-line method over the estimateduseful life of 20 to 23 years and assessed for impairment whenever there is an indication that theintangible asset may be impaired. The amortization period and the amortization method for anintangible asset with a finite useful life are reviewed at least at the end of each reporting period.Changes in the expected useful life or the expected pattern of consumption of future economicbenefits embodied in the asset is accounted for by changing the amortization period or method, asappropriate, and are treated as changes in accounting estimates. The amortization expense onintangible assets with finite lives is recognized in the consolidated statement of income in theexpense category consistent with the function of the intangible assets.

- 25 -
*SGVFSM005262*
Gains or losses arising from derecognition of an intangible asset are measured as the differencebetween the net disposal proceeds and the carrying amount of the asset and are recognized in theconsolidated statement of income.
As of December 31, 2020 and 2019 intangible asset pertaining to leasehold right is included under“Other noncurrent assets”.
Buildings Classified as Held for SaleBuildings classified as held for sale are stated at the lower of its carrying amount and fair value lesscosts to sell. These are classified as held for sale if their carrying amounts will be recovered througha sale transaction rather than through continuing use. This condition is regarded as met only whenthe sale is highly probable and the asset or disposal group is available for immediate sale in itspresent condition. The Group must be committed to the sale, which should be expected to qualify forrecognition as a completed sale within one year from the date of classification.
Business Combinations and GoodwillBusiness combinations are accounted for using the acquisition method which involves recognizingand measuring the identifiable assets acquired, the liabilities assumed and any non-controllinginterests in the acquiree. The identifiable assets acquired and liabilities assumed of the acquiree arerecognized as of the acquisition date and measured at fair value as at that date. For each businesscombination, the acquirer measures the non-controlling interest in the acquiree at fair value of theacquiree’s identifiable net assets. Acquisition related costs are expensed in the period which thecosts are incurred and included in administrative expenses.
When the Group acquires a business, it assesses the financial assets and liabilities assumed forappropriate classification and designation in accordance with the contractual terms, economiccircumstances and pertinent conditions as at the acquisition date. This includes the separation ofembedded derivatives in host contracts by the acquiree.
If the business combination is achieved in stages, the acquisition date fair value of the acquirer’spreviously held equity interest in the acquiree is remeasured to fair value at the acquisition datethrough profit or loss.
Any contingent consideration to be transferred by the acquirer will be recognized at fair value at theacquisition date. Subsequent changes to the fair value of the contingent consideration which isdeemed to be an asset or liability will be recognized in accordance with PFRS 9 either in profit or lossor as a change to other comprehensive income. If the contingent consideration is classified as equity,it should not be remeasured until it is finally settled within equity.
Goodwill is initially measured at cost being the excess of the aggregate of the considerationtransferred and the amount recognized for non-controlling interest over the net identifiable assetsacquired and liabilities assumed. If this consideration is lower than the fair value of the net assets ofthe subsidiary acquired, the difference is recognized in profit or loss as bargain purchase gain. TheGroup reassesses whether it has correctly identified all of the assets acquired and all of the liabilitiesassumed and reviews the procedures used to measure amounts to be recognized at the acquisitiondate.
After initial recognition, goodwill is measured at cost less any accumulated impairment losses. Forthe purpose of impairment testing, goodwill acquired in a business combination is, from theacquisition date, allocated to each of the Group’s cash-generating units that are expected to benefitfrom the combination, irrespective of whether other assets or liabilities of the acquiree are assigned tothose units.
Where goodwill forms part of a cash-generating unit and part of the operation within that unit isdisposed of, the goodwill associated with the operation disposed of is included in the carrying amountof the operation when determining the gain or loss on disposal of the operation. Goodwill disposed of
- 26 -
*SGVFSM005262*
in this circumstance is measured based on the relative values of the operation disposed of and theportion of the cash-generating unit retained.
If the initial accounting for a business combination can be determined only provisionally by the end ofthe period in which the combination is effected because either the fair values to be assigned to theacquiree’s identifiable assets, liabilities or contingent liabilities or the cost of the combination can bedetermined only provisionally, the acquirer shall account for the combination using those provisionalvalues. The acquirer shall recognize any adjustments to those provisional values as a result ofcompleting the initial accounting within twelve (12) months of the acquisition date as follows: (i) thecarrying amount of the identifiable asset, liability or contingent liability that is recognized or adjustedas a result of completing the initial accounting shall be calculated as if its fair value at the acquisitiondate had been recognized from that date; (ii) goodwill or any gain recognized shall be adjusted by anamount equal to the adjustment to the fair value at the acquisition date of the identifiable asset,liability or contingent liability being recognized or adjusted; and (iii) comparative information presentedfor the period before the initial accounting for the combination is complete shall be presented as if theinitial accounting has been completed from the acquisition date.
Combinations of entities under common controlBusiness combinations of entities under common control are accounted for using the pooling ofinterests method. The pooling of interests method is generally considered to involve the following:
The assets and liabilities of the combining entities are reflected in the consolidated financialstatements at their carrying amounts. No adjustments are made to reflect fair values, orrecognize any new assets or liabilities, at the date of the combination. The only adjustments thatare made are those adjustments to harmonize accounting policies.
No new goodwill is recognized as a result of the combination. The only goodwill that isrecognized is any existing goodwill relating to either of the combining entities. Any differencebetween the consideration paid or transferred and the equity acquired is reflected within equity.
The consolidated statement of income reflects the results of the combining entities for the fullyear, irrespective of when the combination took place.
Comparatives are presented as if the entities had always been combined.
The effects of intercompany transactions on current assets, current liabilities, revenues, and cost ofsales for the current period presented and on retained earnings at the beginning of the current periodpresented are eliminated to the extent possible.
Asset AcquisitionsIf the assets acquired and liabilities assumed in an acquisition transaction do not constitute abusiness as defined under PFRS 3, the transaction is accounted for as an asset acquisition. TheGroup identifies and recognizes the individual identifiable assets acquired (including those assets thatmeet the definition of, and recognition criteria for, intangible assets) and liabilities assumed. Theacquisition cost is allocated to the individual identifiable assets and liabilities on the basis of theirrelative fair values at the date of purchase. Such transaction or event does not give rise to goodwill.Where the Group acquires a controlling interest in an entity that is not a business, but obtains lessthan 100% of the entity, after it has allocated the cost to the individual assets acquired, it notionallygrosses up those assets and recognizes the difference as non-controlling interests.
Impairment of Nonfinancial AssetsThe Group assesses at each reporting date whether there is an indication that an asset may beimpaired (e.g. investments in associates and joint ventures, investment properties, property andequipment and right-of-use assets). If any such indication exists, or when annual impairment testingfor an asset is required, the Group makes an estimate of the asset’s recoverable amount. An asset’srecoverable amount is the higher of an asset’s or CGU’s fair value less costs to sell and its value inuse and is determined for an individual asset, unless the asset does not generate cash inflows thatare largely independent of those from other assets or groups of assets. Where the carrying amountof an asset exceeds its recoverable amount, the asset is considered impaired and is written down toits recoverable amount. In assessing value in use, the estimated future cash flows are discounted to

- 27 -
*SGVFSM005262*
their present value using a pre-tax discount rate that reflects current market assessments of the timevalue of money and the risks specific to the asset. Impairment losses of continuing operations arerecognized in the consolidated statement of income in those expense categories consistent with thefunction of the impaired asset.
For assets excluding goodwill, an assessment is made at each reporting date as to whether there isany indication that previously recognized impairment losses may no longer exist or may havedecreased. If any such indication exists, the recoverable amount is estimated. A previouslyrecognized impairment loss is reversed only if there has been a change in the assumptions used todetermine the asset’s recoverable amount since the last impairment loss was recognized. If such isthe case, the carrying amount of the asset is increased to its recoverable amount. That increasedamount cannot exceed the carrying amount that would have been determined, net of depreciationand amortization, had no impairment loss been recognized for the asset in prior years. Such reversalis recognized in the consolidated statement of income unless the asset is carried at revalued amount,in which case, the reversal is treated as a revaluation increase. After such reversal, the depreciationand amortization charge is adjusted in future periods to allocate the asset’s revised carrying amount,less any residual value, on a systematic basis over its remaining useful life.
The following criteria are also applied in assessing impairment of specific assets:
Investments in associates and joint venturesAfter application of the equity method, the Group determines whether it is necessary to recognize anyadditional impairment loss with respect to the Group’s net investment in the investee companies. TheGroup determines at each reporting date whether there is any objective evidence that the investmentin associates or joint ventures is impaired. If this is the case, the Group calculates the amount ofimpairment as being the difference between the recoverable amount and the carrying value of theinvestee company and recognizes the difference in the consolidated statement of income.
ProvisionsProvisions are recognized when the Group has a present obligation (legal or constructive) as a resultof a past event, it is probable that an outflow of resources embodying economic benefits will berequired to settle the obligation, and a reliable estimate can be made of the amount of the obligation.Where the Group expects a provision to be reimbursed, the reimbursement is recognized as aseparate asset but only when the reimbursement is virtually certain. If the effect of the time value ofmoney is material, provisions are determined by discounting the expected future cash flows at a pre-tax rate that reflects current market assessments of the time value of money and, where appropriate,the risks specific to the liability. Where discounting is used, the increase in the provision due to thepassage of time is recognized as interest expense. Provisions are reviewed at each reporting dateand adjusted to reflect the current best estimate.
Pension CostPension cost is actuarially determined using the projected unit credit method. This method reflectsservices rendered by employees up to the date of valuation and incorporates assumptions concerningemployees’ projected salaries. Actuarial valuations are conducted with sufficient regularity, withoption to accelerate when significant changes to underlying assumptions occur. Pension costincludes: a) service costs comprising current service costs, past-service costs, b) gains and losses oncurtailments and non-routine settlements, and c) net interest cost on benefit obligation.
Remeasurements, comprising of actuarial gains or losses, the effect of the asset ceiling, excludingnet interest cost and the return on plan assets (excluding net interest), are recognized immediately inthe consolidated statement of financial position with a corresponding debit or credit to OCI in theperiod in which they occur. Remeasurements are not reclassified to profit or loss in subsequentperiods.
The liability recognized in the consolidated statement of financial position in respect of defined benefitpension plans is the present value of the defined benefit obligation at the reporting date less fair valueof the plan assets. The defined benefit obligation is calculated annually by independent actuaries

- 28 -
*SGVFSM005262*
using the projected unit credit method. The present value of the defined benefit obligation isdetermined by using risk-free interest rates of long-term government bonds that have terms tomaturity approximating the terms of the related pension liabilities or applying a single weightedaverage discount rate that reflects the estimated timing and amount of benefit payments.
Share-based PaymentsThe Group has equity-settled, share-based compensation plans with its employees.
PFRS 2 OptionsFor options granted after November 7, 2002 that have not vested on or before January 1, 2005, thecost of equity-settled transactions with employees is measured by reference to the fair value at thedate on which they are granted. The fair value is determined using the Black-Scholes model, furtherdetails of which are given in Note 28.
The cost of equity-settled transactions is recognized, together with a corresponding increase inequity, over the period in which the performance conditions are fulfilled, ending on the date on whichthe relevant employees become fully entitled to the award (vesting date). The cumulative expenserecognized for equity-settled transactions at each reporting date until the vesting date reflects theextent to which the vesting period has expired and the Group’s best estimate of the number of equityinstrument that will ultimately vest. The income or expense for a period represents the movement incumulative expense recognized as at the beginning and end of that period.
No expense is recognized for awards that do not ultimately vest, except for awards where vesting isconditional upon a market condition, which are treated as vesting irrespective of whether or not themarket condition is satisfied, provided that all other performance conditions are satisfied.
Where the terms of an equity-settled award are modified, as a minimum, an expense is recognized.In addition, an expense is recognized for any increase in the value of the transaction as a result of themodification, as measured at the date of modification. Where an equity-settled award is cancelled, itis treated as if it had vested on the date of cancellation, and any expense not yet recognized for theaward is recognized immediately. However, if a new award is substituted for the cancelled award,and designated as a replacement award on the date that it is granted, the cancelled and new awardsare treated as if they were a modification of the original award, as described in the previousparagraph.
Pre-PFRS 2 OptionsFor options granted before November 7, 2002 that has vested before January 1, 2005, the intrinsicvalue of stock options determined as of grant date is recognized as expense over the vesting period.
The dilutive effect of outstanding options is reflected as additional share dilution in the computation ofdiluted earnings per share (see Note 28).
Employee Stock Ownership PlanThe Parent Company has an employee stock ownership plan (ESOWN) which allows the grantees topurchase the Parent Company’s shares. The Parent Company recognizes stock compensationexpense over the holding period. The Parent Company treats its ESOWN plan as option exercisablewithin a given period. These are accounted for similar to the PFRS 2 options. Dividends paid on theawards that have vested are deducted from equity and those paid on awards that are unvested arecharged to profit or loss. For the unsubscribed shares where the employees still have the option tosubscribe in the future, these are accounted for as options.
EquityWhen the shares are sold at a premium, the difference between the proceeds and the par value iscredited to “Additional paid-in capital” account. Direct costs incurred related to equity issuance arechargeable to “Additional paid-in capital” account. If additional paid-in capital is not sufficient, theexcess is charged against retained earnings. When the Group issues more than one class of stock, aseparate account is maintained for each class of stock and the number of shares issued.

- 29 -
*SGVFSM005262*
Subscriptions receivable pertains to the uncollected portion of the subscribed shares.
Retained earnings represent accumulated earnings of the Group less dividends declared.
Equity reserves pertain to the excess of the cost of business combinations over the net carryingamounts of the assets and liabilities of the acquired companies. Changes in a parent’s ownershipinterest in a subsidiary that do not result in a loss of control are accounted for as equity transactions(i.e., transactions with owners in their capacity as owners). In such circumstances, the carryingamounts of the controlling and non-controlling interests shall be adjusted to reflect the changes intheir relative interests in the subsidiary. Any difference between the amount by which the non-controlling interests are adjusted and the fair value of the consideration paid shall be recognizeddirectly in equity and included under “Equity reserves” account in the equity section of theconsolidated statement of financial position.
Own equity instruments which are reacquired (treasury shares) are recognized at cost and deductedfrom equity. No gain or loss is recognized in the profit or loss on the purchase, sale, issue orcancellation of the Parent Company’s own equity instruments. Any difference between the carryingamount and the consideration, if reissued, is recognized in additional paid-in capital. Voting rightsrelated to treasury shares are nullified for the Group and no dividends are allocated to themrespectively. When the shares are retired, the capital stock account is reduced by its par value andthe excess of cost over par value upon retirement is debited to additional paid-in capital when theshares were issued and to retained earnings for the remaining balance.
Revenue from Contract with CustomersThe Group primarily derives its real estate revenue from the sale of vertical and horizontal real estateprojects. Revenue from contracts with customers is recognized when control of the goods or servicesare transferred to the customer at an amount that reflects the consideration to which the Groupexpects to be entitled in exchange for those goods or services. Except for the provisioning of water,electricity, air-conditioning and common use service area in its mall retail spaces, wherein it is actingas agent, the Group has generally concluded that it is the principal in its revenue arrangements.
The disclosures of significant accounting judgments, estimates and assumptions relating to revenuefrom contracts with customers are provided in Note 3.
Real estate salesThe Group derives its real estate revenue from sale of lots, house and lot and condominium units.Revenue from the sale of these real estate projects under pre-completion stage are recognized overtime during the construction period (or percentage of completion) since based on the terms andconditions of its contract with the buyers, the Group’s performance does not create an asset with analternative use and the Group has an enforceable right to payment for performance completed todate.
In measuring the progress of its performance obligation over time, the Group uses the output method.The Group recognizes revenue and the related trade receivables on the basis of directmeasurements of the value to customers of the goods or services transferred to date, relative to theremaining goods or services promised under the contract. Progress is measured using survey ofperformance completed to date. This is based on the monthly project accomplishment reportprepared by the third party surveyor as approved by the construction manager which integrates thesurveys of performance to date of the construction activities for both sub-contracted and those thatare fulfilled by the developer itself.
Any excess of progress of work over the right to an amount of consideration that is unconditional, isrecognized as trade receivables under residential and office development receivables account. Anyexcess of collections over the total of recognized trade receivables is included in the “customer’sdeposit” account in the liabilities section of the consolidated statement of financial position. Theimpact of the significant financing component on the transaction price has not been considered sincethe Group availed the relief granted by the SEC under Memorandum Circular Nos. 14-2018 as of

- 30 -
*SGVFSM005262*
2018 for the implementation issues of PFRS 15 affecting the real estate industry. Under the SECMemorandum Circular No. 34, the relief has been extended until December 31, 2023.
Cost recognitionThe Group recognizes costs relating to satisfied performance obligations as these are incurred takinginto consideration the contract fulfillment assets such as connection fees. These include costs ofland, land development costs, building costs, professional fees, depreciation, permits and licenses.These costs are allocated to the saleable area, with the portion allocable to the sold area beingrecognized as costs of sales while the portion allocable to the unsold area being recognized as part ofreal estate inventories.
Contract costs include all direct materials and labor costs and those indirect costs related to contractperformance. Expected losses on contracts are recognized immediately when it is probable that thetotal contract costs will exceed total contract revenue. Changes in contract performance, contractconditions and estimated profitability, including those arising from contract penalty provisions, andfinal contract settlements which may result in revisions to estimated costs and gross margins arerecognized in the year in which the changes are determined.
Marketing fees, management fees from administration and property management are recognized asexpense when services are incurred.
Hotel and resorts revenue (part of real estate sales in the consolidated statement of income)The Group recognizes room accommodation services over time since the guest simultaneouslyreceives and consumes the services provided by the Group. The Group considers whether there areother promises in the contract that are separate performance obligations to which a portion of thetransaction price needs to be allocated. Revenue from banquets and other special events arerecognized when the events take place.
Cost of hotel operations (part of cost of real estate sales in the consolidated statement of income)Cost of hotel operations pertains to expenses incurred in relation to sale of goods and rendering ofservices. These are recognized when a decrease in future economic benefits related to a decreasein an asset or an increase of a liability has arisen than can be measured reliably. These arerecognized when incurred and measured at the amount paid or payable.
Construction revenue (part of real estate sales in the consolidated statement of income) and costRevenue from fixed price construction contracts are recognized overtime using the milestone-basedrevenue recognition which is in reference to the output method. The output method is determinedbased on the start and completion of a task of the contract work inclusive of uninstalled goods andmaterials delivered to the site.
Contract costs include all direct materials and labor costs and those indirect costs related to contractperformance. Expected losses on contracts are recognized immediately when it is probable that thetotal contract costs will exceed total contract revenue. Changes in contract performance, contractconditions and estimated profitability, including those arising from contract penalty provisions, andfinal contract settlements which may result in revisions to estimated costs and gross margins arerecognized in the year in which the changes are determined.
Rental income (part of real estate sales in the consolidated statement of income)Rental income under noncancellable and cancellable leases on investment properties is recognizedin the consolidated statement of income on a straight-line basis over the lease term and the terms ofthe lease, respectively, and/or based on a certain percentage of the gross revenue of the tenants, asprovided under the terms of the lease contract.
No rental income is recognized when the Group waives its right to collect rent and other charges. Thisis recognized as a rent concession and reported as a variable payment (see Note 33).
Rooms revenue from hotel and resort operations is recognized when the services are rendered.

- 31 -
*SGVFSM005262*
Revenue from banquets and other special events are recognized when the events take place.
Interest income is recognized as it accrues using the effective interest method.
Dividend income is recognized when the Group’s right to receive the payment is established.
Customers’ depositCustomers’ deposit is a contract liability which is the obligation to transfer goods or services to acustomer for which the Group has received consideration (or an amount of consideration is due) fromthe customer. If a customer pays consideration before the Group transfers goods or services to thecustomer, a customers’ deposit is recognized when the payment is made or the payment is due(whichever is earlier). Customers’ deposit are recognized as revenue when the control of the goodsor services are transferred to the customers by the Group which is essentially fulfillment of itsperformance obligation under the contract.
Customers’ deposit also include payments received by the Group from the customers for whichrevenue recognition has not yet commenced.
Costs to obtain contractThe incremental costs of obtaining a contract with a customer are recognized as an asset if the Groupexpects to recover them. The Group has determined that commissions paid to brokers and marketingagents on the sale of pre-completed real estate units are deferred when recovery is reasonablyexpected and are charged to expense in the period in which the related revenue is recognized asearned. Commission expense is included in the “Real estate costs and expenses” account in theconsolidated statement of income.
Costs incurred prior to obtaining contract with customer are not capitalized but are expensed asincurred.
Amortization, de-recognition and impairment of capitalized costs to obtain a contractFollowing the pattern of real estate revenue recognition, the Group amortizes capitalized costs toobtain a contract to cost of sales over the expected construction period using percentage ofcompletion. The amortization is included within cost of sales.
A capitalized cost to obtain a contract is derecognized either when it is disposed of or when no furthereconomic benefits are expected to flow from its use or disposal.
At each reporting date, the Group determines whether there is an indication that cost to obtain acontract maybe impaired. If such indication exists, the Group makes an estimate by comparing thecarrying amount of the assets to the remaining amount of consideration that the Group expects toreceive less the costs that relate to providing services under the relevant contract. In determining theestimated amount of consideration, the Group uses the same principles as it does to determine thecontract transaction price, except that any constraints used to reduce the transaction price is removedfor the impairment test.
Where the relevant costs or specific performance obligations are demonstrating marginal profitabilityor other indicators of impairment, judgement is required in ascertaining whether or not the futureeconomic benefits from these contracts are sufficient to recover these assets. In performing thisimpairment assessment, management is required to make an assessment of the costs to completethe contract. The ability to accurately forecast such costs involves estimates around cost savings tobe achieved over time, anticipated profitability of the contract, as well as future performance againstany contract-specific performance indicators that could trigger variable consideration, or servicecredits. Where a contract is anticipated to make a loss, these judgements are also relevant indetermining whether or not an onerous contract provision is required and how this is to be measured.
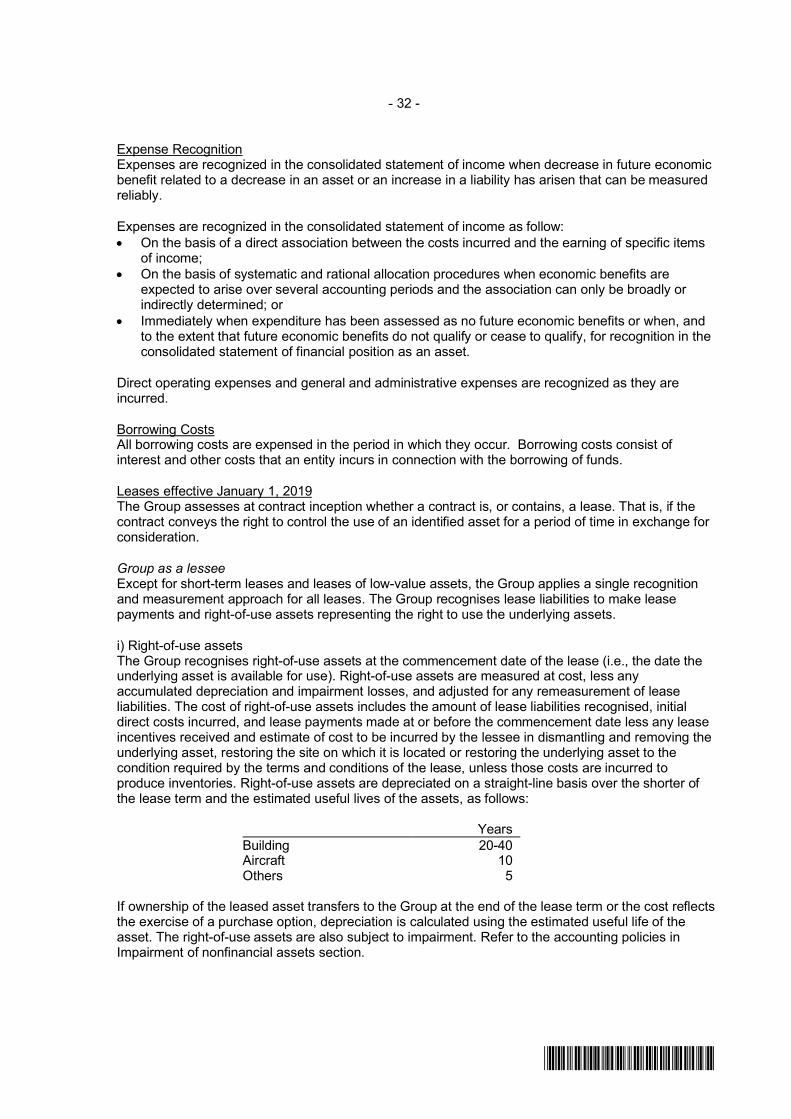
- 32 -
*SGVFSM005262*
Expense RecognitionExpenses are recognized in the consolidated statement of income when decrease in future economicbenefit related to a decrease in an asset or an increase in a liability has arisen that can be measuredreliably.
Expenses are recognized in the consolidated statement of income as follow: On the basis of a direct association between the costs incurred and the earning of specific items
of income; On the basis of systematic and rational allocation procedures when economic benefits are
expected to arise over several accounting periods and the association can only be broadly orindirectly determined; or
Immediately when expenditure has been assessed as no future economic benefits or when, andto the extent that future economic benefits do not qualify or cease to qualify, for recognition in theconsolidated statement of financial position as an asset.
Direct operating expenses and general and administrative expenses are recognized as they areincurred.
Borrowing CostsAll borrowing costs are expensed in the period in which they occur. Borrowing costs consist ofinterest and other costs that an entity incurs in connection with the borrowing of funds.
Leases effective January 1, 2019The Group assesses at contract inception whether a contract is, or contains, a lease. That is, if thecontract conveys the right to control the use of an identified asset for a period of time in exchange forconsideration.
Group as a lesseeExcept for short-term leases and leases of low-value assets, the Group applies a single recognitionand measurement approach for all leases. The Group recognises lease liabilities to make leasepayments and right-of-use assets representing the right to use the underlying assets.
i) Right-of-use assetsThe Group recognises right-of-use assets at the commencement date of the lease (i.e., the date theunderlying asset is available for use). Right-of-use assets are measured at cost, less anyaccumulated depreciation and impairment losses, and adjusted for any remeasurement of leaseliabilities. The cost of right-of-use assets includes the amount of lease liabilities recognised, initialdirect costs incurred, and lease payments made at or before the commencement date less any leaseincentives received and estimate of cost to be incurred by the lessee in dismantling and removing theunderlying asset, restoring the site on which it is located or restoring the underlying asset to thecondition required by the terms and conditions of the lease, unless those costs are incurred toproduce inventories. Right-of-use assets are depreciated on a straight-line basis over the shorter ofthe lease term and the estimated useful lives of the assets, as follows:
YearsBuilding 20-40Aircraft 10Others 5
If ownership of the leased asset transfers to the Group at the end of the lease term or the cost reflectsthe exercise of a purchase option, depreciation is calculated using the estimated useful life of theasset. The right-of-use assets are also subject to impairment. Refer to the accounting policies inImpairment of nonfinancial assets section.

- 33 -
*SGVFSM005262*
ii) Lease liabilitiesAt the commencement date of the lease, the Group recognises lease liabilities measured at thepresent value of lease payments to be made over the lease term. The lease payments include fixedpayments (including in-substance fixed payments) less any lease incentives receivable, variablelease payments that depend on an index or a rate, and amounts expected to be paid under residualvalue guarantees. The lease payments also include the exercise price of a purchase optionreasonably certain to be exercised by the Group and payments of penalties for terminating the lease,if the lease term reflects the Group exercising the option to terminate. Variable lease payments thatdo not depend on an index or a rate are recognised as expenses (unless they are incurred to produceinventories) in the period in which the event or condition that triggers the payment occurs.
In calculating the present value of lease payments, the Group uses its incremental borrowing rate atthe lease commencement date because the interest rate implicit in the lease is not readilydeterminable. After the commencement date, the amount of lease liabilities is increased to reflect theaccretion of interest and reduced for the lease payments made. In addition, the carrying amount oflease liabilities is remeasured if there is a modification, a change in the lease term, a change in thelease payments (e.g., changes to future payments resulting from a change in an index or rate used todetermine such lease payments) or a change in the assessment of an option to purchase theunderlying asset.
iii) Short-term leasesThe Group applies the short-term lease recognition exemption to its short-term leases of office space(i.e., those leases that have a lease term of 12 months or less from the commencement date and donot contain a purchase option). Lease payments on short-term leases are recognised as expense ona straight-line basis over the lease term.
Group as a lessorLeases in which the Group does not transfer substantially all the risks and rewards incidental toownership of an asset are classified as operating leases. Initial direct costs incurred in negotiatingand arranging an operating lease are added to the carrying amount of the leased asset andrecognised over the lease term on the same basis as rental income. Contingent rents are recognizedas revenue in the period in which they are earned.
Leases prior to January 1, 2019The determination of whether an arrangement is, or contains, a lease is based on the substance ofthe arrangement at inception date whether the fulfillment of the arrangement is dependent on the useof a specific asset or assets or the arrangement conveys a right to use the asset. A reassessment ismade after inception of the lease only if one of the following applies:
(a) There is a change in contractual terms, other than a renewal or extension of the arrangement;(b) A renewal option is exercised or extension granted, unless the term of the renewal or extension
was initially included in the lease term;(c) There is a change in the determination of whether fulfillment is dependent on a specified asset; or(d) There is substantial change to the asset.
Where a reassessment is made, lease accounting shall commence or cease from the date when thechange in circumstances gave rise to the reassessment for scenarios (a), (c), or (d) and at the date ofrenewal or extension period for scenario (b).
Group as lesseeLeases where the lessor retains substantially all the risks and benefits of ownership of the asset areclassified as operating leases. Fixed lease payments are recognized as an expense in theconsolidated statement of income on a straight-line basis while the variable rent is recognized as anexpense based on terms of the lease contract.

- 34 -
*SGVFSM005262*
Group as lessorLeases where the Group does not transfer substantially all the risk and benefits of ownership of theassets are classified as operating leases. Lease payments received are recognized as an income inthe consolidated statement of income on a straight-line basis over the lease term. Initial direct costsincurred in negotiating operating leases are added to the carrying amount of the leased asset andrecognized over the lease term on the same basis as the rental income. Contingent rents arerecognized as revenue in the period in which they are earned.
Current TaxCurrent tax assets and liabilities for the current and prior periods are measured at the amountexpected to be recovered from or paid to the tax authority. The tax rates and tax laws used tocompute the amount are those that are enacted or substantively enacted as at the end of thereporting period.
Deferred TaxDeferred tax is provided, using the liability method, on all temporary differences, with certainexceptions, at the reporting date between the tax bases of assets and liabilities and their carryingamounts for financial reporting purposes.
Deferred tax liabilities are recognized for all taxable temporary differences, with certain exceptions.Deferred tax assets are recognized for all deductible temporary differences, carryforward benefits ofunused tax credits from excess of minimum corporate income tax (MCIT) over the regular corporateincome tax and unused net operating loss carryover (NOLCO), to the extent that it is probable thattaxable income will be available against which the deductible temporary differences and carryforwardbenefits of unused tax credits and NOLCO can be utilized.
Deferred tax liabilities are not provided on nontaxable temporary differences associated withinvestments in domestic associates and interests in joint ventures.
The carrying amount of deferred tax assets is reviewed at each reporting date and reduced to theextent that it is no longer probable that sufficient taxable income will be available to allow all or part ofthe deferred tax assets to be utilized. Unrecognized deferred tax assets are reassessed at eachreporting date and are recognized to the extent that it has become probable that future taxableincome will allow all or part of the deferred tax assets to be recovered.
Deferred tax assets and liabilities are measured at the tax rate that is expected to apply to the periodwhen the asset is realized or the liability is settled, based on tax rates and tax laws that have beenenacted or substantively enacted at the reporting date. Movements in the deferred income tax assetsand liabilities arising from changes in tax rates are charged against or credited to income for theperiod.
Deferred tax assets and liabilities are offset, if a legally enforceable right exists to set off current taxassets against current tax liabilities and the deferred income taxes relate to the same taxable entityand the same taxation authority.
Foreign Currency TransactionsEach entity in the Group determines its own functional currency and items included in the financialstatements of each entity are measured using that functional currency. Transactions in foreigncurrencies are initially recorded using the exchange rate at the date of the transactions. Monetaryassets and liabilities denominated in foreign currencies are restated using the closing exchange rateprevailing at the reporting date. Exchange gains or losses arising from foreign exchange transactionsare credited to or charged against operations for the year.

- 35 -
*SGVFSM005262*
As at reporting date, the assets and liabilities of subsidiaries whose functional currency is not thePhilippines Peso are translated into the presentation currency of the Parent Company (the PhilippinePeso) at the closing rate as at the reporting date, and the consolidated statement of income accountsare translated at monthly weighted average exchange rate. The exchange differences arising on thetranslation are taken directly to a separate component of equity under “Cumulative translationadjustments” account. Upon disposal of a foreign subsidiary, the deferred cumulative amountrecognized in other comprehensive income relating to that particular foreign operation is recognizedin the consolidated statement of income.
Investments in foreign associates are translated to Philippine Peso using the closing exchange rateprevailing at reporting date. The Group’s share in the results of operations of the foreign investee istranslated using the exchange rate at the dates of the transactions or, where practicable, the rate thatapproximates the exchange rates at the dates of the transactions, such as the average rate for theperiod. Any resulting exchange difference is recognized as a separate component of equity.
Earnings Per Share (EPS)Basic EPS is computed by dividing net income for the year attributable to common equity holders ofthe Parent Company by the weighted average number of common shares issued and outstandingduring the year adjusted for any subsequent stock dividends declared. Diluted EPS is computed bydividing net income for the year attributable to common equity holders of the Parent Company by theweighted average number of common shares issued and outstanding during the year plus theweighted average number of common shares that would be issued on conversion of all the dilutivepotential common shares into common shares. Calculation of dilutive EPS considers the potentialordinary shares of subsidiaries, associates and joint ventures that have dilutive effect on the basicEPS of the Parent Company. The calculation of diluted earnings per share does not assumeconversion, exercise, or other issue of potential common shares that would have an antidilutive effecton earnings per share.
Segment ReportingThe Group’s operating businesses are organized and managed separately according to the nature ofthe products and services provided, with each segment representing a strategic business unit thatoffers different products and serves different markets. Financial information on business segments ispresented in Note 30 of the consolidated financial statements.
ContingenciesContingent liabilities are not recognized in the consolidated financial statements. They are disclosedunless the possibility of an outflow of resources embodying economic benefits is remote. Contingentassets are not recognized in the consolidated financial statements but disclosed when an inflow ofeconomic benefits is probable.
Events after the Reporting PeriodPost year-end events that provide additional information about the Group’s position at the reportingdate (adjusting events) are reflected in the consolidated financial statements. Post year-end eventsthat are not adjusting events are disclosed in the consolidated financial statements when material.
3. Significant Accounting Judgments and Estimates
The preparation of the accompanying consolidated financial statements in conformity with PFRSsrequires management to make estimates and assumptions that affect the amounts reported in theconsolidated financial statements and accompanying notes. The estimates and assumptions used inthe accompanying consolidated financial statements are based upon management’s evaluation ofrelevant facts and circumstances as of the date of the consolidated financial statements. Actualresults could differ from such estimates.
- 36 -
*SGVFSM005262*
JudgmentsIn the process of applying the Group’s accounting policies, management has made the followingjudgments, apart from those involving estimations, which have the most significant effect on theamounts recognized in the consolidated financial statements:
Existence of a contractThe Group’s primary document for a contract with a customer is a signed contract to sell. It hasdetermined, however, that in cases wherein contract to sell are not signed by both parties, thecombination of its other duly executed and signed documentation such as reservation agreement,official receipts, buyers’ computation sheets and invoices, would contain all the criteria to qualify ascontract with the customer under PFRS 15.
In addition, part of the assessment process of the Group before revenue recognition is to assess theprobability that the Group will collect the consideration to which it will be entitled in exchange for thereal estate property that will be transferred to the customer. In evaluating whether collectability of anamount of consideration is probable, an entity considers the significance of the customer’s initialpayments in relation to the total contract price. Collectability is also assessed by considering factorssuch as past history with the customer, age and pricing of the property. Management regularlyevaluates the historical cancellations and back-outs if it would still support its current threshold ofcustomers’ equity before commencing revenue recognition.
Revenue recognition method and measure of progressThe Group concluded that revenue for real estate sales is to be recognized over time because: (a)the Group’s performance does not create an asset with an alternative use and; (b) the Group has anenforceable right for performance completed to date. The promised property is specifically identifiedin the contract and the contractual restriction on the Group’s ability to direct the promised property foranother use is substantive. This is because the property promised to the customer is notinterchangeable with other properties without breaching the contract and without incurring significantcosts that otherwise would not have been incurred in relation to that contract. In addition, under thecurrent legal framework, the customer is contractually obliged to make payments to the developer upto the performance completed to date. In addition, the Group requires a certain percentage of buyer'spayments of total selling price (buyer's equity), to be collected as one of the criteria in order to initiaterevenue recognition. Reaching this level of collection is an indication of buyer’s continuingcommitment and the probability that economic benefits will flow to the Group. The Group considersthat the initial and continuing investments by the buyer of about 10% would demonstrate the buyer’scommitment to pay.
The Group has determined that the output method used in measuring the progress of theperformance obligation (i.e. percentage of completion) faithfully depicts the Group’s performance intransferring control of real estate development to the customers.
Distinction of land between real estate inventories and investment propertiesThe Group determines whether a property will be classified as real estate inventories or investmentproperties. In making this judgment, the Group considers whether the property will be sold in thenormal operating cycle (real estate inventories) and even if the real estate inventories are leased out,the classification remains on the condition that the intent to sell remains. All other properties that arenot yet determined to be sold in the normal operating cycle are classified as investment properties.
Consolidation of entities in which the Group holds only 50% or less than majority of voting rightsThe Group considers that it controls the following entities even though it owns 50% or less thanmajority of the voting rights. Control is achieved when the Group is exposed, or has rights, to variablereturns from its involvement with the investee and has the ability to affect that return through its powerover the investee.

- 37 -
*SGVFSM005262*
ACCFor ACC, ALI holds 50% of the voting rights, and is also the single largest shareholder and theremaining 50% of the equity shares are held by several shareholders. The second largeststockholder of ACC holds 8.3% share while the other shareholders’ equity interest ranges from 2.1%to 8.3%. In addition, ALI has an existing management services agreement with ACC which gives ALIthe exclusive control and decision over the relevant activities of ACC.
BG Entities (BGWest, BGNorth and BGSouth)For the BG entities, wherein ALI and the other shareholder each own 50% of the voting rights, ALIcontrols the investee through exercise of its exclusive project development and marketing agreementas well as the ability to decide on the financing, operating and strategic policies of the investees. Thisenabled ALI to conclude that it has control.
AHI, RLC, ALI-CII and LAIPALI has an existing management services agreement with AHI, RLC, ALI-CII and LAIP which givesALI the exclusive control and decision over the relevant activities of AHI, RLC, ALI-CII and LAIP.
Service concession agreementThe Group has made a judgment that the concession agreement with DOTr qualifies under PhilippineInterpretation IFRIC 12, Service Concession Arrangements (see Note 36). Management hasassessed that DOTr controls and regulates the service, determines to whom this service will beprovided and controls the price. In addition, management has also determined that the DOTr has thesignificant control over the residual interest of the Terminal at the end of the term. Management hasalso made a judgment that the Terminal and commercial assets (mall facilities) are physicallyseparable and are capable of being operated independently.
Management has further assessed that said concession agreement qualifies under the FinancialAsset model as it has an unconditional contractual right to receive cash or other financial assets (i.e.the Annual Grantor Payment) for its construction, operating and maintenance services directly fromDOTr.
ContingenciesThe Group is currently involved in various legal proceedings. The estimate of the probable costs forthe resolution of these claims has been developed in consultation with outside counsel handling thedefense of these matters and is based upon an analysis of potential results. The Group currentlydoes not believe that these proceedings will have a material effect on the Group’s consolidatedfinancial statements (see Note 35).
Sale of real estate receivablesThe Group has entered into arrangements with banks wherein it discounted its real estate receivableswithout recourse. The Group believes that the sales transactions are not more than infrequent andthat the receivables discounted is insignificant in value both individually and in aggregate.Accordingly, the Group continues to present trade receivables at amortized cost as it remains to holdtrade receivables with the objective of collecting contractual cash flows until maturity.
Definition of default and credit-impaired financial assetsThe Group defines a financial instrument as in default, which is fully aligned with the definition ofcredit-impaired, when it meets one or more of the following criteria:
Quantitative criteria – for residential, commercial and office development receivables, the customerreceives a notice of cancellation and does not continue the payments.
Qualitative criteriaThe customer meets unlikeliness to pay criteria, which indicates the customer is in significant financialdifficulty. These are instances where:a. The customer is experiencing financial difficulty or is insolventb. The customer is in breach of financial covenant(s)

- 38 -
*SGVFSM005262*
c. An active market for that financial assets has disappeared because of financial difficultiesd. Concessions or deferrals have been granted by the Group, for economic or contractual reasons
relating to the customer’s financial difficulty (e.g. Bayanihan Acts I and II considerations)e. It is becoming probable that the customer will enter bankruptcy or other financial reorganization
The criteria above have been applied to the financial instruments held by the Group and areconsistent with the definition of default used for internal credit risk management purposes. Thedefault definition has been applied consistently to model the Probability of Default (PD), Loss GivenDefault (LGD) and Exposure at Default (EAD) throughout the Group’s expected loss calculation.
Incorporation of forward-looking informationThe Group incorporates forward-looking information into both its assessment of whether the creditrisk of an instrument has increased significantly since its initial recognition and its measurement ofECL.
To do this, the Group considers a range of relevant forward-looking macro-economic assumptions forthe determination of unbiased general industry adjustments and any related specific industryadjustments that support the calculation of ECLs. Based on the Group’s evaluation and assessmentand after taking into consideration external actual and forecast information, the Group formulates a‘base case’ view of the future direction of relevant economic variables as well as a representativerange of other possible forecast scenarios. This process involves developing two or more additionaleconomic scenarios and considering the relative probabilities of each outcome. External informationincludes economic data and forecasts published by governmental bodies, monetary authorities andselected private-sector and academic institutions.
The base case represents a most-likely outcome and is aligned with information used by the Groupfor other purposes such as strategic planning and budgeting. The other scenarios represent moreoptimistic and more pessimistic outcomes. Periodically, the Group carries out stress testing of moreextreme shocks to calibrate its determination of these other representative scenarios.
The Group has identified and documented key drivers of credit risk and credit losses of each portfolioof financial instruments and, using an analysis of historical data, has estimated relationships betweenmacro-economic variables and credit risk and credit losses.
Determination of lease term of contracts with renewal and termination options – Group as a lesseeThe Group determines the lease term as the non-cancellable term of the lease, together with anyperiods covered by an option to extend the lease if it is reasonably certain to be exercised, or anyperiods covered by an option to terminate the lease, if it is reasonably certain not to be exercised.
The Group has several lease contracts that include extension and termination options. The Groupapplies judgment in evaluating whether the provisions to renew or terminate the lease is enforceable.For leases where the Group has the unilateral option to renew or terminate, it then applies judgmenton whether it is reasonably certain or not to exercise the option. That is, it considers all relevantfactors that create an economic incentive for it to exercise either the renewal or termination. After thecommencement date, the Group reassesses the lease term if there is a significant event or change incircumstances that is within its control and affects its ability to exercise or not to exercise the option torenew or to terminate (e.g., construction of significant leasehold improvements or significantcustomisation to the leased asset).
Assessment on whether lease concessions granted constitute a lease modificationIn line with the rental relief framework implemented by the government to support businesses and thebroader economy due to the impact of COVID-19, the Group waived its right to collect rent and othercharges as part of various lease concessions it granted to lessees such as lease payment holidays orlease payment reductions.
The Group applies judgment when assessing whether the rent concessions granted is considered alease modification under PFRS 16.

- 39 -
*SGVFSM005262*
In making this judgment, the Group determines whether the rent concessions granted has changedthe scope of the lease, or the consideration thereof, that was not part of the original terms andconditions of the lease. The Group assessed that the lease concessions it granted to lessees do notqualify as lease modifications since the terms and conditions under the corresponding lease contractshave not been modified by the waiver and therefore, is not a lease modification under PFRS 16.
The rent concessions granted by the Group for the year ended December 31, 2020 amounted toP=6.15 billion.
Judgements made in determining taxable profit (tax loss), tax bases, unused tax losses, unused taxcredits and tax rates applying paragraph 122 of PAS 1, Presentation of Financial StatementsUpon adoption of the Interpretation, the Group has assessed whether it has any uncertain taxposition. The Group applies significant judgement in identifying uncertainties over its income taxtreatments. The Group determined, based on its assessment, in consultation with its tax counsel,that it is probable that its uncertain income tax treatments (including those for the subsidiaries) will beaccepted by the taxation authorities.
Management’s Use of EstimatesThe key assumptions concerning the future and other key sources of estimation uncertainty at thereporting date, that have a significant risk of causing a material adjustment to the carrying amounts ofassets and liabilities within the next financial year are discussed below.
Revenue recognition on real estate projectsThe Group’s revenue recognition policy requires management to make use of estimates andassumptions that may affect the reported amounts of revenues. The Group’s revenue from realestate is recognized based on the percentage of completion and this is measured principally on thebasis of the estimated completion of a physical proportion of the contract work. Apart from involvingsignificant estimates in determining the quantity of imports such as materials, labor and equipmentneeded, the assessment process for the POC is complex and the estimated project developmentcosts requires technical determination by management’s specialists (project engineers). The Groupalso includes land in the calculation of POC since the Group availed the relief granted by the SECunder Memorandum Circular Nos. 14-2018 as of 2018 for the implementation issues of PFRS 15affecting the real estate industry. See Notes 20 and 22 for the related balances.
Following the pattern of real estate revenue recognition, the cost to obtain a contract (e.g.commission), is determined using the percentage of completion. In view of the continuing communityquarantines and restricted mobility, the progress of the Group's performance obligation is adverselyaffected which resulted to lower percentage-of-completion in 2020.
Evaluation of net realizable value of real estate inventoriesThe Group adjusts the cost of its real estate inventories to net realizable value based on itsassessment of the recoverability of the inventories. NRV for completed real estate inventories isassessed with reference to market conditions and prices existing at the reporting date and isdetermined by the Group in the light of recent market transactions. NRV in respect of real estateinventories under construction is assessed with reference to market prices at the reporting date forsimilar completed property, less estimated costs to complete construction and less estimated costs tosell. The amount and timing of recorded expenses for any period would differ if different judgmentswere made or different estimates were utilized. In line with the impact of COVID-19, the Groupexperienced limited selling activities that resulted to lower sales in 2020. In evaluating NRV, recentmarket conditions and current market prices have been considered. See Note 8 for the relatedbalances.
Share-based paymentsThe expected life of the options is based on the expected exercise behavior of the stock optionholders and is not necessarily indicative of the exercise patterns that may occur. The volatility isbased on the average historical price volatility which may be different from the expected volatility ofthe shares of stock of the Group. See Note 28 for the related balances.

- 40 -
*SGVFSM005262*
Estimating pension liabilities and other retirement benefitsThe determination of the Group’s obligation and cost for pension and other retirement benefits isdependent on selection of certain assumptions used by actuaries in calculating such amounts. Theseinclude the determination of the discount rates, future salary increases, mortality rates and futurepension increases. Significant assumptions are disclosed in Note 26 and include among others,discount rate and salary increase rate.
In determining the appropriate discount rate, management considers the interest rates of governmentbonds that are denominated in the currency in which the benefits will be paid, with extrapolatedmaturities corresponding to the expected duration of the defined benefit obligation.
The mortality rate is based on 1994 Group Annuity Mortality Table and is modified accordingly withestimates of mortality improvements. Future salary increases and pension increases are based onexpected future inflation rates.
While the Group believes that the assumptions are reasonable and appropriate, significantdifferences in actual experience or significant changes in assumptions could materially affectretirement obligations. See Note 26 for the related balances.
Fair value of financial instrumentsWhen the fair values of financial assets and financial liabilities recorded or disclosed in theconsolidated statement of financial position cannot be derived from active markets, they aredetermined using internal valuation techniques using generally accepted market valuation models.The inputs to these models are taken from observable markets where possible, but where this is notfeasible, estimates are used in establishing fair values. These estimates may include considerationsof liquidity, volatility and correlation. Certain financial assets and liabilities were initially recorded attheir fair values by using the discounted cash flow methodology. See Note 29 for the relatedbalances.
Provision for expected credit losses of trade receivablesThe Group uses a provision matrix to calculate ECLs for trade receivables other than residential,commercial and office development receivables. The provision rates are based on days past due forgroupings of various customer segments that have similar loss patterns.
The provision matrix is initially based on the Group’s historical observed default rates. The Group willcalibrate the matrix to adjust the historical credit loss experience with forward-looking informationsuch as inflation and GDP growth rates. At every reporting date, the historical observed default ratesare updated and changes in the forward-looking estimates are analyzed.
The Group uses vintage analysis approach to calculate ECLs for residential, commercial and officedevelopment receivables. The vintage analysis accounts for expected losses by calculating thecumulative loss rates of a given loan pool. It derives the probability of default from the historical dataof a homogenous portfolio that share the same origination period. The information on the number ofdefaults during fixed time intervals of the accounts is utilized to create the PD model. It allows theevaluation of the loan activity from its origination period until the end of the contract period.
The assessment of the correlation between historical observed default rates, forecast economicconditions (inflation and interest rates) and ECLs is a significant estimate. The amount of ECLs issensitive to changes in circumstances and of forecast economic conditions. The Group’s historicalcredit loss experience and forecast of economic conditions may also not be representative ofcustomer’s actual default in the future.
The Group has considered impact of COVID-19 pandemic and revised its assumptions in determiningthe macroeconomic variables and loss rates in the computation of ECL. The changes in the grosscarrying amount of receivables from sale of real estate during the year and impact of COVID-19pandemic did not materially affect the allowance for ECLs.

- 41 -
*SGVFSM005262*
The information about the ECLs on the Group’s trade receivables is disclosed in Notes 7 and 29.
Estimating the incremental borrowing rate for leasesThe Group uses its incremental borrowing rate (IBR) to measure lease liabilities because the interestrate implicit in the lease is not readily determinable. The IBR is the rate of interest that the Groupwould have to pay to borrow over a similar term, and with a similar security, the funds necessary toobtain an asset of a similar value to the right-of-use asset in a similar economic environment. The IBRtherefore reflects what the Group ‘would have to pay’, which requires estimation when no observablerates are available (such as for subsidiaries that do not enter into financing transactions) or when theyneed to be adjusted to reflect the terms and conditions of the lease (for example, when leases are notin the subsidiary’s functional currency). The Group estimates the IBR using observable inputs (suchas market interest rates) when available and is required to make certain entity-specific estimates(such as the subsidiary’s stand-alone credit rating).
The Group’s lease liabilities as of December 31, 2020 and 2019 amounted to P=17,755.8 million andP=17,463.7 million, respectively (see Note 33).
Evaluation of impairment of nonfinancial assetsThe Group assesses whether there are any indicators of impairment for all nonfinancial assets (i.e.,property and equipment, investment properties, right of use assets and other current assets) at eachfinancial reporting date. These nonfinancial assets are tested for impairment when there areindicators that the carrying amounts may not be recoverable.
An impairment loss is recognized whenever the carrying amount of an asset exceeds its recoverableamount. The recoverable amount of an asset is the higher of its fair value less cost to sell and valuein use. Recoverable amounts are estimated for individual assets or, if it is not possible, for the CGUto which the asset belongs, while value in use is the present value of estimated future cash flowsexpected to arise from the continuing use of an asset and from its disposal at the end of its useful life.
In view of the continuing community quarantines and restricted travel, the Group’s hotels and resortssegment continues to be adversely affected by the lower number of guests and reduced room rates,both of which have significantly impacted the revenues reported for this segment. Also, manyrestaurants remain closed or allowed limited operations which impacted the food and beveragerevenues of the segment. In addition, because of the coronavirus pandemic, there is the heightenedlevel of uncertainty on the future economic outlook and market forecast. These events and conditionsare impairment indicators requiring the assessment of the recoverable amount of the property andequipment and right-of-use assets.
The carrying value of the property and equipment and right-of-use assets of the hotels and resortssegment amounted to P=21,527.0 million and P=198.2 million, respectively, as of December 31, 2020.
The Group estimates the recoverable amount through value in use. In determining the present valueof estimated future cash flows expected to be generated from the continued use of these assets ofthe hotels and resorts segment, the Group is required to make estimates and assumptions that mayaffect the nonfinancial assets. The significant assumptions used in the valuation are discount rates of7.00% to 12.00% with an average growth rate of 3.00%. The Group also considered in itsassumptions the impact of the pandemic on the occupancy rate and room rates which are notexpected to normalize until 2024. No impairment loss was recognized in 2020.

- 42 -
*SGVFSM005262*
4. Cash and Cash Equivalents
This account consists of:
2020 2019(In Thousands)
Cash on hand P=64,303 P=73,215Cash in banks 13,678,488 14,555,033Cash equivalents 3,294,556 5,784,793
P=17,037,347 P=20,413,041
Cash in banks earn interest at the respective bank deposit rates. Cash equivalents are short-term,highly liquid investments that are made for varying periods of up to three (3) months depending onthe immediate cash requirements of the Group, and earn interest at the respective short-term rates.
The annual interest rates of the cash equivalents are as follows:
2020 2019Philippine Peso 0.5% to 1.8% 2.8% to 4.0%US Dollar 0.1% to 0.25% 1.1% to 1.8%
There is no restriction on the Group’s cash and cash equivalents balances as of December 31, 2020and 2019.
5. Short-term Investments
Short-term investments consist of money market placements made for varying periods of more thanthree (3) months and up to one (1) year and earn interest at the respective short-term investmentrates.
The annual interest rates of the short-term investments are as follows:
2020 2019Philippine Peso 0.75% 3.0%US Dollar 0.05% to 0.10% 1.8% to 2.0%
6. Financial Assets at FVTPL
This account consists of:
2020 2019(In Thousands)
Investment in Unit Investment Trust Funds (UITF) P=378,066 P=96,405Investment in ARCH Capital Fund 327,953 389,031Investment in Treasury Bills 259,152 −
P=965,171 P=485,436
The Group invests in money market UITF which aims to generate liquidity and stable income byinvesting in a diversified portfolio of primarily short-term fixed income instruments and with nominimum holding period requirement.
Investment in ARCH Capital Fund pertains to monetary interest in a fund in which the managementtakes the view that these are held for trading and it is a portfolio of identified property funds investedand managed by professional managers.

- 43 -
*SGVFSM005262*
In 2020, the Group also invested in Treasury Bills which are short-term secure investments issued bythe Philippine government through the Bureau of Treasury (BTr) and these are held for trading.
The Group’s investment in UITF includes investment in BPI. As of December 31, 2020, the Groupinvested in UITF with a fair value of P=209 million for BPI Money Market Fund and P=95 million for BPIUSD Short Term Funds. The Funds’ Net Asset Value (NAV) was at P=61,961.9 million with duration of255 days and P=41,101.9 million with duration of 307 days, respectively.
As of December 31, 2019, the Group invested in BPI MMF with a fair value of P=80.9 million. The BPIMMF’s NAV was at P=23,980.6 million with duration of 131 days.
The following table provides the fair value hierarchy of the Group’s financial assets at FVTPL whichare measured at fair value as of December 31, 2020 and 2019:
2020
Date of Valuation
Fair value measurement using
Total
Quoted prices inactive markets
(Level 1)
Significantobservable
inputs(Level 2)
Significantunobservable
inputs(Level 3)
(In Thousands)Investment in Unit Investment Trust
Fund (UITF) December 31, 2020 P=378,066 P=− P=378,066 P=−Investment in ARCH Capital Fund December 31, 2020 327,953 − − 327,953Investment in Treasury Bills December 31, 2020 259,152 − 259,152 −
2019
Date of Valuation
Fair value measurement using
Total
Quoted prices inactive markets
(Level 1)
Significantobservable inputs
(Level 2)
Significantunobservable
inputs(Level 3)
(In Thousands)Investment in Unit Investment Trust
Fund (UITF) December 31, 2019 P=96,405 P=− P=96,405 P=−Investment in ARCH Capital Fund December 31, 2019 389,031 − − 389,031
The fair value of the investment in UITF is based on net asset values as of reporting dates.
The fair value of the investment in ARCH Capital Fund is determined using the discounted cash flow(DCF) method. Under the DCF method in fund fair valuation, it is estimated using assumptionsregarding the benefits and liabilities of ownership over the underlying asset’s life including an exit orterminal value. This method involves the projection of a series of cash flows on a real propertyinterest. To this projected cash flow series, a market-derived discount rate is applied to establish thepresent value of the income stream, associated with the underlying asset. The exit yield is normallyseparately determined and differs from the discount rate. Significant inputs considered were rental,growth and discount rates. The higher the rental and growth rates, the higher the fair value. Thehigher the discount rates, the lower the fair value.
The fair value of investment in treasury bills is based on BVAL reference rates on governmentsecurities. For the year ended December 31, 2020, the BVAL reference rates range from 1.002% to3.953%.
Reconciliation of fair value measurement of Investment in ARCH Fund is shown below:
2020 2019(In Thousands)
Balance at beginning of year P=389,031 P=390,521Redemptions (12,478) (24,387)Additions − 30,145Unrealized loss (48,600) (7,248)Balance at end of year P=327,953 P=389,031

- 44 -
*SGVFSM005262*
Reconciliation of fair value measurement of Investment in UITF is shown below:
2020 2019(In Thousands)
Balance at beginning of year P=96,405 P=85,724Redemptions (1,904,759) (741,376)Additions 2,177,936 746,774Unrealized gains included under “Other income” 8,484 5,283Balance at end of year P=378,066 P=96,405
7. Accounts and Notes Receivable
Accounts and notes receivable account consists of:
2020 2019(In Thousands)
Trade: Residential, commercial and office development P=101,328,095 P=104,260,962 Shopping centers 5,414,606 3,684,650 Corporate business 3,948,672 3,828,160 Construction contracts 1,774,741 1,553,320 Management fees 124,553 99,263 Others 4,717,601 4,558,543Advances to other companies 17,686,292 18,984,210Accrued receivables 7,786,399 7,788,796Receivables from related parties (Note 25) 5,489,159 6,130,303Receivables from employees 842,506 901,261
149,112,624 151,789,468Less allowance for impairment losses 1,945,460 1,186,293
147,167,164 150,603,175Less noncurrent portion 46,021,255 45,563,869
P=101,145,909 P=105,039,306
The classes of trade receivables of the Group are as follows: Residential, commercial and office development - pertain to receivables from the sale of high-
end, upper middle-income and affordable residential lots and units; economic and socializedhousing units and sale of commercial lots; sale of office units; and leisure communitydevelopments.
Shopping centers - pertain to lease receivables from retail spaces Corporate business - pertain to lease receivables from office and factory buildings and
receivables from sale of industrial lots Construction contracts - pertain to receivables from third party construction projects Management fees - pertain to receivables from facilities management services Others - pertain to receivables from hotel operations and other support services
Residential, commercial and office development receivables are collectible in monthly installmentsover a period of one (1) to ten (10) years. These are carried at amortized cost using the effectiveinterest rate method with annual interest rates ranging from 5.75% to 16.00%. Titles to real estateproperties are transferred to the buyers only once full payment has been made.
Corporate business receivables are collectible on a monthly or quarterly basis depending on theterms of the lease contracts.
Receivables from shopping centers, construction contracts and management fees are due within 30days upon billing.

- 45 -
*SGVFSM005262*
Receivables from hotel operations and other support services included under other trade receivablesare normally due within 30 to 90 days upon billing.
Advances to other companies includes advances made to joint venture partners that have been madein consideration of project costs and purchases of land that are still subject to completion. Thedocumentation for these advances provides that these will be payable over a fixed term or ondemand in order to allow for repayment of the advances when closing does not occur or not settled.The advances are liquidated when proceeds from the sale of the related projects are applied.
Advances to other companies also includes receivables from MRT Development Corporation(MRTDC) shareholders which pertains to interest-bearing advances made by NTDCC to MRTDCequivalent to the Pre-2006 Development Rights Payment (DRP) Payables and the Residual DepotDRP which is due more than one year, in relation to the funding and repayment agreement. As ofDecember 31, 2020 and 2019, receivables including interest from MRTDC shareholders amounted toP=441.1 million and P=422.3 million, respectively.
On December 17, 2014, NTDCC and MRTDC shareholders executed a “funding and repaymentagreement” wherein the latter agrees to repay NTDCC, for the account of MRTDC, its respective prorata share in the Total Depot DRP Advances (the Pre-2006 DRP Payables and the Residual DepotDRP, including 15% interest rate accrued on such DRP payables).
Commencing on January 1, 2015, the MRTDC Shareholders shall effect the repayment of theirrespective pro rata share in the Total Depot DRP Payables, through a set-off against their respectiveshare in the commercial center royalties to be received from the Group.
Set off shall be effective as of the beginning of every calendar month, commencing January 30, 2015and shall result in the settlement of the portion of the Total DRP Payables to the extent of the amountof the commercial center royalties then the balance will fall due to the relevant MRTDC Shareholders.
Accrued receivables and receivables from related parties are due and demandable. Receivables fromemployees pertain to housing, car, salary and other loans granted to the Group’s employees whichare collectible through salary deduction, are interest-bearing (6.0% per annum) and payable onvarious maturity dates.
Receivables amounting to P=1,945.5 million and P=1,186.3 million as of December 31, 2020 and 2019,respectively, were impaired and fully provided for. Movements in the allowance for impairment lossesfollow:
2020
TradeResidential
and officeDevelopment
ShoppingCenters
ConstructionContracts
CorporateBusiness
ManagementFees Others
Advances toOther
Companies Total(In Thousands)
Balance at beginning of year P=13,555 P=772,513 P=37,778 P=182,208 P=6,678 P=110,409 P=63,152 P=1,186,293Provisions during the year
(Note 22) 40,665 298,587 ‒ 338,870 ‒ 69,520 58,165 805,807
Reversal (Note 22) (3,453) (11,043) ‒ (7,962) ‒ (30,683) (25) (53,166)Accounts written off ‒ ‒ ‒ (2,116) ‒ ‒ ‒ (2,116)Translation adjustment ‒ ‒ ‒ 8,642 ‒ ‒ ‒ 8,642Balance at end of year P=50,767 P=1,060,057 P=37,778 P=519,642 P=6,678 P=149,246 P=121,292 P=1,945,460

- 46 -
*SGVFSM005262*
2019Trade
Residentialand office
DevelopmentShopping
CentersConstruction
ContractsCorporate
BusinessManagement
Fees Others
Advances toOther
Companies Total(In Thousands)
Balance at beginning of year P=13,555 P=558,059 P=26,547 P=86,663 P=5,948 P=175,596 P=5,900 P=872,268Provisions during the year
(Note 22) − 269,619 11,231 128,692 730 12,310 253,341 675,923
Reversal (Note 22) − (13,599) − (16,192) − (76,319) (1,038) (107,148)Accounts written off − (41,314) − (16,955) − (1,178) (195,051) (254,498)Translation adjustment − (252) − − − − − (252)Balance at end of year P=13,555 P=772,513 P=37,778 P=182,208 P=6,678 P=110,409 P=63,152 P=1,186,293
On March 25, 2020, Republic Act No. 11469, otherwise known as the Bayanihan to Heal as One Act(“Bayanihan 1 Act”) was enacted. Bayanihan 1 Act provides that all covered institutions shallimplement a 30-day grace period for all loans with principal and/or interest and lease amortizationfalling due within the ECQ Period without incurring interest on interest, penalties, fees and othercharges. Subsequently, on September 11, 2020, Republic Act No. 11494, otherwise known as theBayanihan to Recover as One Act (“Bayanihan 2 Act”), was enacted. Under Bayanihan 2 Act, a one-time sixty (60)-day grace period is granted for the payment of all existing, current and outstandingloans falling due, or any part thereof, on or before December 31, 2020, without incurring interest oninterests, penalties, fees, or other charges and thereby extending the maturity of the said loans.Furthermore, a minimum 30-day grace period shall also be granted by covered institutions to allpayments due within the period of community quarantine on rent and utility-related expenditureswithout incurring penalties, interest and other charges.
In 2020, the Group, provided reliefs under Bayanihan 1 Act and Bayanihan 2 Act, which offered financialreliefs to its borrowers/counterparties as a response to the effect of the COVID-19 pandemic. Theserelief measures included the restructuring of existing receivables including extension of payment terms.
Based on the Group’s assessment, the modifications in the contractual cash flows as a result of theabove reliefs are not substantial and therefore do not result in the derecognition of the affectedfinancial assets.
As of December 31, 2020 and 2019, nominal amounts of trade receivables from residential,commercial and office development totaling P=115,407.8 million and P=122,258.0 million, respectively,were recorded initially at fair value. The fair values of the receivables were obtained by discountingfuture cash flows using the applicable rates of similar types of instruments.
Movements in the unamortized discount of the Group’s receivables as of December 31, 2020 and2019 follow:
2020 2019(In Thousands)
Balance at beginning of year P=17,997,007 P=17,427,468Additions during the year 4,685,456 8,460,511Accretion for the year (Note 20) (8,602,775) (7,890,972)Balance at end of year P=14,079,688 P=17,997,007
The Group entered into agreements with BPI Asset Management and Trust Corporation in 2019 forthe assignment of interest-bearing employee receivables amounting to P=108.9 million (nil in 2020).The transactions were without recourse and did not result to any gain or loss.
The Group sold residential receivables on a without recourse basis to partner mortgage banks, whichinclude BPI Family Savings Bank, a related party, amounting to P=20,458.0 million in 2020 andP=9,976.3 million in 2019. These were sold at a discount with total proceeds of P=18,431.9 million andP=9,281.2 million, respectively. The Group recognized loss on sale (under “Other expenses”)amounting to P=2,064.0 million and P=775.2 million in 2020 and 2019, respectively (see Note 22).

- 47 -
*SGVFSM005262*
8. Inventories
This account consists of:2020 2019
(In Thousands)Real estate - at cost Residential and condominium units P=84,011,309 P=65,659,786 Residential and commercial lots 61,137,607 52,363,671Offices - at cost 1,594,676 2,264,229
P=146,743,592 P=120,287,686
A summary of the movements in inventories is set out below:
2020
Residential andcommercial lots
Residential andcondominium
units Offices Total(In Thousands)
Balances at beginning of year P=52,363,671 P=65,659,786 P=2,264,229 P=120,287,686Land acquired during the year 3,269,732 17,744,257 − 21,013,989Construction/development costs incurred 7,148,687 14,786,408 220,314 22,155,409Disposals (recognized as cost of real estate
sales) (Note 22) (15,932,741) (16,093,619) (889,867) (32,916,227)Transfers from (to) investment properties
(Notes 12 and 37) 14,288,258 1,914,477 − 16,202,735Balances at end of year P=61,137,607 P=84,011,309 P=1,594,676 P=146,743,592
2019
Residential andcommercial lots
Residential andcondominium
units Offices Total(In Thousands)
Balances at beginning of year P=52,116,837 P=49,675,074 P=2,579,700 P=104,371,611Land acquired during the year 7,598,083 − − 7,598,083Construction/development costs incurred 7,160,927 42,984,189 6,248,089 56,393,205Borrowing costs capitalized − 122,682 − 122,682Disposals (recognized as cost of real estate
sales) (Note 22) (15,772,399) (37,211,541) (6,369,061) (59,353,001)Transfers from (to) investment properties
(Notes 12 and 37) 1,260,223 10,089,382 (194,499) 11,155,106Balances at end of year P=52,363,671 P=65,659,786 P=2,264,229 P=120,287,686
The Group has no purchase commitments pertaining to its inventories as of December 31, 2020 and2019.
There are no liens and encumbrances on the Group’s real estate inventories.
9. Other Current Assets
This account consists of:2020 2019
(In Thousands)Advances to contractors and suppliers P=18,139,411 P=11,014,287Prepaid expenses 16,756,037 16,401,610Value-added input tax 12,575,713 14,515,697Creditable withholding taxes 8,321,770 4,710,840Buildings classified as held for sale
(Notes 12 and 13) 952,142 −Materials, parts and supplies - at cost 732,881 999,883Others 543,008 949,315
P=58,020,962 P=48,591,632

- 48 -
*SGVFSM005262*
Advances to contractors and suppliers represents prepayments for the construction of inventories.These are recouped from billings which are expected to occur in a short period of time.
Prepaid expenses consist of prepayments for commissions, marketing fees, advertising andpromotions, taxes and licenses, rentals and insurance. The cost to obtain contracts whichincludes prepaid commissions and advances to brokers amounted to P=3,281.1 million andP=2,876.2 million in 2020 and 2019, respectively. In line with the Group's accounting policy, as set outin Note 2, if a contract or specific performance obligation exhibited marginal profitability or otherindicators of impairment, judgment was applied to ascertain whether or not the future economicbenefits from these contracts were sufficient to recover these assets. In performing this impairmentassessment, management is required to make an assessment of the costs to complete the contract.The ability to accurately forecast such costs involves estimates around cost savings to be achievedover time, anticipated profitability of the contract, as well as future performance against any contract-specific key performance indicators that could trigger variable consideration, or service credits(Note 14).
Value-added input tax is applied against value-added output tax. The remaining balance isrecoverable in future periods.
Creditable withholding taxes are applied against income tax payable.
Buildings classified as held for sale include Qualimed Hospitals in Iloilo City, Santa Rosa and SanJose del Monte City which are being sold within the first quarter of 2021 in a move to transferhealthcare-related properties to AC Healthcare Holdings, Inc.
Materials, parts and supplies pertain to inventories to be used in the construction and maintenance ofprojects.
Others include deferred charges and letters of credit. Deferred charges pertain to project-relatedcosts already paid but not yet consumed in the actual construction activities.
10. Financial Assets at Fair Value through OCI
This account consists of:
2020 2019(in Thousands)
Shares of stock: Quoted P=1,578,590 P=1,478,444 Unquoted 483,177 505,484
2,061,767 1,983,928Net unrealized loss (550,324) (454,749)
P=1,511,443 P=1,529,179
Investments in quoted shares of stock include shares held for clubs wherein the Group does notexercise control or demonstrate significant influence.
Investments in unquoted shares of stock include unlisted shares of public utility companies which theGroup will continue to carry as part of the infrastructure that it provides to its real estate projects.
The Group made additional investments in equity instruments amounting to P=99.0 million andP=93.5 million in 2020 and 2019, respectively. The Group also disposed investments amounting toP=21.1 million and P=56.9 million in 2020 and 2019, respectively. No gain or loss was recognized fromthe disposal.

- 49 -
*SGVFSM005262*
Movements in the reserves for financial assets at FVOCI as of December 31, 2020 and 2019 are asfollows:
2020 2019(In Thousands)
Balance at beginning of year (P=454,749) (P=451,529)Fair value changes during the year (426,088) (3,220)Balance at end of year (P=880,837) (P=454,749)
The Group entered into and designated interest rate swaps as hedging instruments as a cashflowhedge from loans bearing interest at floating rate. The fair value of the interest rate swap is estimatedusing valuation techniques with observable inputs, which uses present value calculations andincorporate various input including interest rate curves. Total fair value amounted to P=330 million.
As of December 31, 2020 and 2019 reserves for financial assets at FVOCI attributable to non-controlling interests amounted to P=132.6 million and P=2.6 million, respectively.
The following table provides the fair value hierarchy of the Group’s financial assets at fair valuethrough OCI which are measured at fair value as of December 31, 2020 and 2019 (in thousands):
December 31, 2020
Date of Valuation
Fair value measurement using
Total
Quotedprices in
activemarkets(Level 1)
Significantobservable
inputs(Level 2)
Significantunobservable
inputs(Level 3)
Shares of stock: Quoted
Real estate December 31, 2020 P=484,705 P=484,705 P=− P=− Tourism and leisure December 31, 2020 263,041 263,041 − −
Retail December 31, 2020 54,980 54,980 − − Utilities and energy December 31, 2020 34,300 34,300 − − Telecommunication December 31, 2020 6,929 6,929 − − Financial asset management December 31, 2020 500 500 − − Unquoted Tourism and leisure Various 556,260 − − 556,260 Financial asset management Various 82,599 − − 82,599 Utilities and energy Various 19,787 − − 19,787 Real estate Various 7,468 − − 7,468 Telecommunication Various 874 − − 874
P=1,511,443 P=844,455 P=− P=666,988
December 31, 2019
Date of Valuation
Fair value measurement using
Total
Quotedprices in
activemarkets(Level 1)
Significantobservable
inputs(Level 2)
Significantunobservable
inputs(Level 3)
Shares of stock: Quoted
Real estate December 31, 2019 P=525,541 P=525,541 P=− P=− Tourism and leisure December 31, 2019 282,927 282,927 − −
Financial asset management December 31, 2019 81,622 81,622 − − Retail December 31, 2019 54,658 54,658 − − Utilities and energy December 31, 2019 15,965 15,965 − − Telecommunication December 31, 2019 2,816 2,816 − −
(Forward)
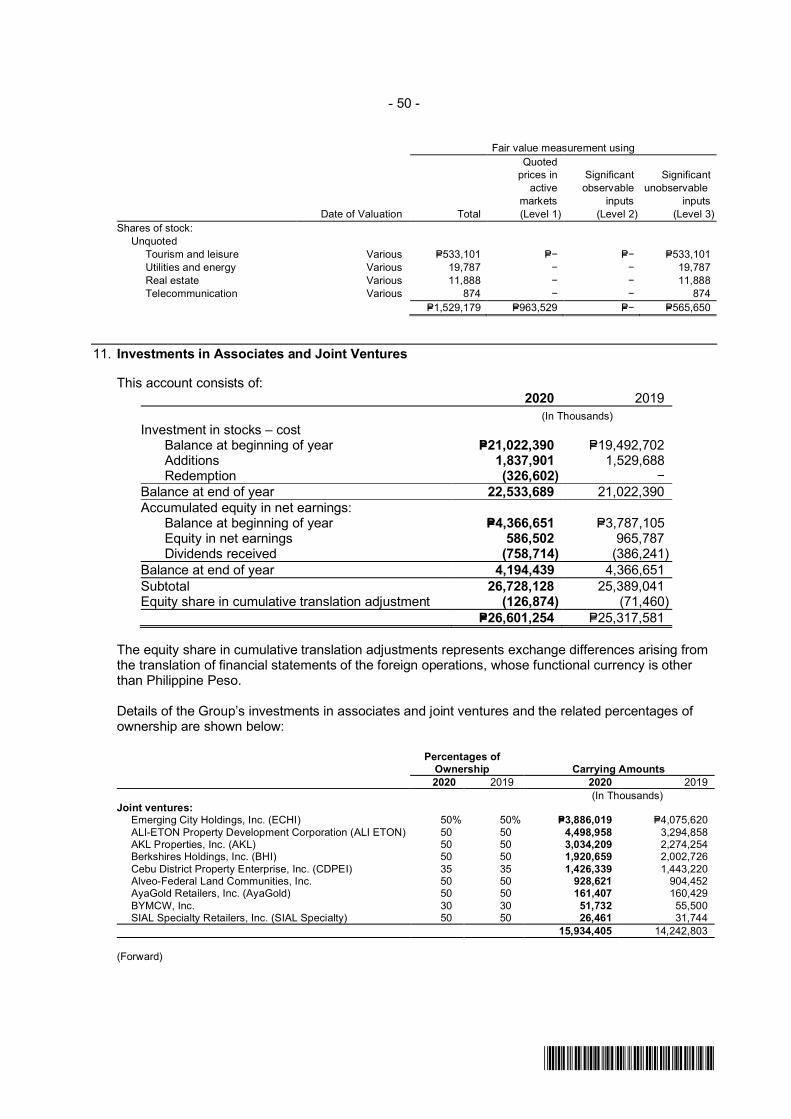
- 50 -
*SGVFSM005262*
Date of Valuation
Fair value measurement using
Total
Quotedprices in
activemarkets(Level 1)
Significantobservable
inputs(Level 2)
Significantunobservable
inputs(Level 3)
Shares of stock: Unquoted Tourism and leisure Various P=533,101 P=− P=− P=533,101 Utilities and energy Various 19,787 − − 19,787 Real estate Various 11,888 − − 11,888 Telecommunication Various 874 − − 874
P=1,529,179 P=963,529 P=− P=565,650
11. Investments in Associates and Joint Ventures
This account consists of:2020 2019
(In Thousands)Investment in stocks – cost Balance at beginning of year P=21,022,390 P=19,492,702 Additions 1,837,901 1,529,688 Redemption (326,602) −Balance at end of year 22,533,689 21,022,390Accumulated equity in net earnings: Balance at beginning of year P=4,366,651 P=3,787,105 Equity in net earnings 586,502 965,787 Dividends received (758,714) (386,241)Balance at end of year 4,194,439 4,366,651Subtotal 26,728,128 25,389,041Equity share in cumulative translation adjustment (126,874) (71,460)
P=26,601,254 P=25,317,581
The equity share in cumulative translation adjustments represents exchange differences arising fromthe translation of financial statements of the foreign operations, whose functional currency is otherthan Philippine Peso.
Details of the Group’s investments in associates and joint ventures and the related percentages ofownership are shown below:
Percentages ofOwnership Carrying Amounts2020 2019 2020 2019
(In Thousands)Joint ventures: Emerging City Holdings, Inc. (ECHI) 50% 50% P=3,886,019 P=4,075,620 ALI-ETON Property Development Corporation (ALI ETON) 50 50 4,498,958 3,294,858
AKL Properties, Inc. (AKL) 50 50 3,034,209 2,274,254 Berkshires Holdings, Inc. (BHI) 50 50 1,920,659 2,002,726
Cebu District Property Enterprise, Inc. (CDPEI) 35 35 1,426,339 1,443,220Alveo-Federal Land Communities, Inc. 50 50 928,621 904,452
AyaGold Retailers, Inc. (AyaGold) 50 50 161,407 160,429BYMCW, Inc. 30 30 51,732 55,500SIAL Specialty Retailers, Inc. (SIAL Specialty) 50 50 26,461 31,744
15,934,405 14,242,803
(Forward)

- 51 -
*SGVFSM005262*
Percentages ofOwnership Carrying Amounts2020 2019 2020 2019
(In Thousands)Associates:
OCLP Holdings, Inc.(OHI) 21 21 P=8,676,598 P=8,540,155 Bonifacio Land Corp. (BLC) 10 10 1,405,759 1,479,284 Rize-Ayalaland (Kingsway) GP, Inc. (Rize-Ayalaland) 49 49 401,194 448,613 Tianjin Eco-City Ayala Land Development Co., Ltd (Tianjin
Eco-City) 40 40 153,982 474,486 Lagoon Development Corporation 30 30 29,316 35,689 Mercado General Hospital, Inc. (MGHI) 33 33 ‒ 96,551
10,666,849 11,074,778P=26,601,254 P=25,317,581
The Parent Company considers an associate and a joint venture with material interest if its net assetsexceed 5% of its total consolidated net assets of the Group as of reporting period and considers therelevance of the nature of activities of the associate and joint venture compared to other operations ofthe Group. The financial information on the Parent Company’s significant associates and jointventures with material interest follows:
Financial information of the associate with material interest
OHI
Consistent with its thrust of expanding its operations to other areas within and outside of Metro Manilathrough partnerships, ALI acquired a 21.1% stake in OHI. The acquisition was made possible via thepurchase of shares from existing OHI shareholders. OHI owns 99.5% interest in Ortigas & CompanyLimited Partnership (OCLP), an entity engaged in real estate development and leasing businesses.
Set out below is the summarized financial information for OHI:
2020 2019(In Thousands)
Current assets P=17,440,519 P=20,459,694Noncurrent assets 22,507,390 19,563,645Current liabilities (11,410,775) (13,360,788)Noncurrent liabilities (18,597,214) (17,374,206)Equity 9,939,920 9,288,345Proportion of Group’s ownership 21.1% 21.1%Group’s share in identifiable net assets 2,097,323 1,959,841Carrying amount of the investment 8,676,598 8,540,155Fair value adjustments 6,589,215 6,580,314Negative Goodwill P=148,046 P=148,046Dividends received P=33,558 P=36,555
Net assets attributable to the equity holders of OHI amounted to P=9,939.9 million and P=9,288.3 millionas of December 31, 2020 and 2019, respectively.
2020 2019(In Thousands)
Revenue P=7,204,436 P=12,214,233Cost and expenses (6,398,747) (9,877,006)Net income (continuing operations) 805,689 2,337,227Group’s share in net income for the year 170,000 493,155Total comprehensive income 805,689 2,337,227Group’s share in total comprehensive income
for the year 170,000 493,155

- 52 -
*SGVFSM005262*
BLC
The Group has a 10% interest in BLC, which is involved in the purchase, subscription or otherwisedisposal of real and personal properties. BLC is a private company incorporated on October 20, 1994and there is no quoted market price available for its shares. Its registered office and principal place ofbusiness is Taguig City, Philippines.
Set out below is the summarized financial information for BLC:
2020 2019(In Thousands)
Current assets P=3,261,099 P=10,996,893Noncurrent assets 38,420,664 32,437,784Current liabilities (2,534,735) (3,066,467)Noncurrent liabilities (7,285,960) (7,175,865)Equity 31,861,068 33,192,345Less: noncontrolling interest 14,292,676 14,896,099Equity attributable to Parent Company 17,568,392 18,296,246Proportion of Group’s ownership 10.1% 10.1%Group’s share in identifiable net assets 1,774,408 1,847,933Carrying amount of the investment 1,405,759 1,479,284Negative goodwill (P=368,649) (P=368,649)Dividends received P=155,508 P=80,836
Net assets attributable to the equity holders of BLC amounted to P=17,568.4 million andP=18,296.2 million as of December 31, 2020 and 2019, respectively.
2020 2019(In Thousands)
Revenue P=3,869,359 P=5,790,288Cost and expenses (2,466,924) (3,150,446)Net income (continuing operations) 1,402,435 2,639,842Net loss attributable to minority interest (590,732) (1,242,515)Net income attributable to parent 811,703 1,397,327Group’s share in net income for the year 81,982 141,130Total comprehensive income attributable to equity
holders of the Parent Company 811,703 1,397,327Group’s share in total comprehensive
income for the year 81,982 141,130
Aggregate financial information on the associates with immaterial interest (Rize-Ayalaland, TianjinEco-City, LDC and MGHI) follows:
2020 2019(In Thousands)
Carrying amount P=584,492 P=1,055,339Share in net loss from continuing operations (89,529) (231,629)Share in total comprehensive loss (89,529) (231,629)

- 53 -
*SGVFSM005262*
Financial information of joint ventures
ECHI
2020 2019(In Thousands)
Current assets P=11,741,302 P=11,219,613Noncurrent assets 30,017,735 32,437,964Current liabilities (2,863,497) (3,395,804)Noncurrent liabilities (7,285,960) (7,175,865)Equity 31,609,580 33,085,908Less: noncontrolling interest 23,307,423 24,244,695Equity attributable to Parent Company 8,302,157 8,841,213Proportion of Group’s ownership 50% 50%Group’s share in identifiable net assets 4,151,079 4,420,607Carrying amount of the investment 3,886,019 4,075,620Dividends received P=397,854 P=175,000
Net assets attributable to the equity holders of ECHI amounted to P=8,302.2 million andP=8,841.2 million as of December 31, 2020 and 2019, respectively.
2020 2019(In Thousands)
Revenue P=3,872,498 P=5,795,508Cost and expenses (2,475,532) (3,158,836)Net income (continuing operations) 1,396,966 2,636,672Net loss attributable to noncontrolling interest (980,460) (1,916,480)Net income attributable to parent 416,506 720,192Group’s share in net income for the year 208,253 360,096Total comprehensive income attributable to equity
holders of the Parent Company 416,506 722,037Group’s share in total comprehensive income
for the year 208,253 361,019
ALI Eton
2020 2019(In Thousands)
Current assets P=12,838,898 P=12,416,374Noncurrent assets 3,985,368 4,670,632Current liabilities (8,394,044) (9,902,359)Noncurrent liabilities (3,390,318) (2,949,942)Equity 5,039,904 4,234,705Proportion of Group’s ownership 50% 50%Group’s share in identifiable net assets 2,519,952 2,117,353Carrying amount of the investment 4,498,958 3,294,858
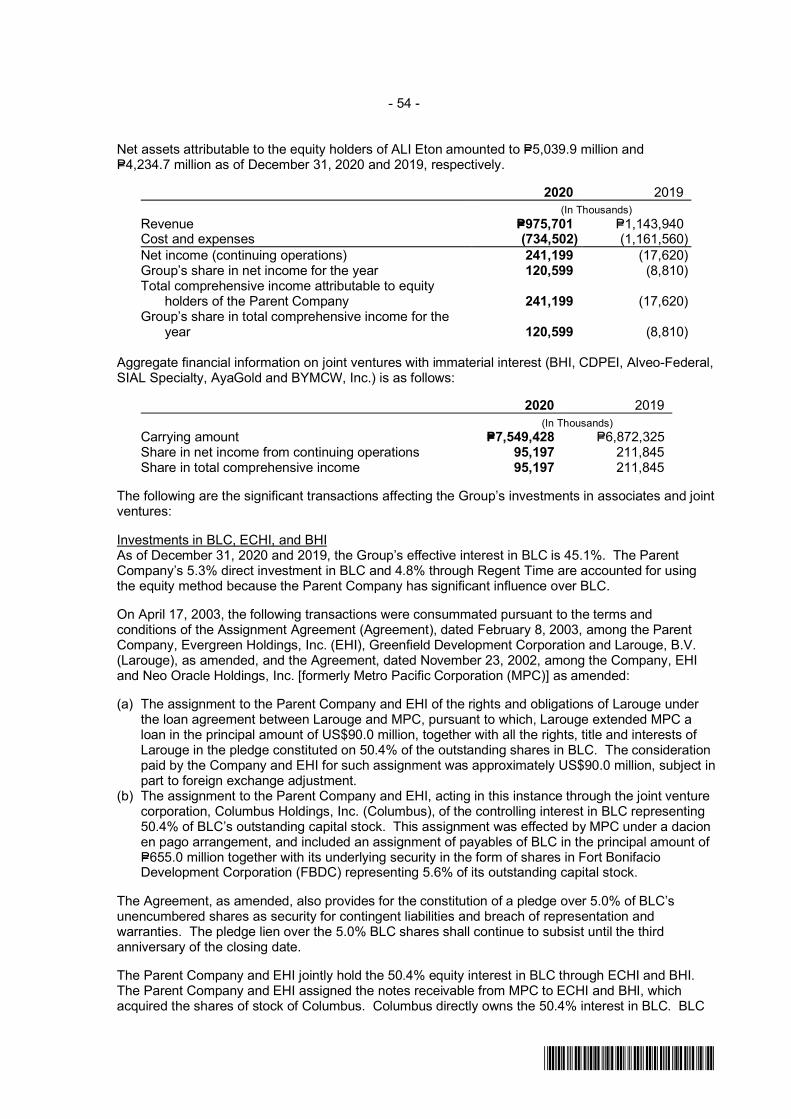
- 54 -
*SGVFSM005262*
Net assets attributable to the equity holders of ALI Eton amounted to P=5,039.9 million andP=4,234.7 million as of December 31, 2020 and 2019, respectively.
2020 2019(In Thousands)
Revenue P=975,701 P=1,143,940Cost and expenses (734,502) (1,161,560)Net income (continuing operations) 241,199 (17,620)Group’s share in net income for the year 120,599 (8,810)Total comprehensive income attributable to equity
holders of the Parent Company 241,199 (17,620)Group’s share in total comprehensive income for the
year 120,599 (8,810)
Aggregate financial information on joint ventures with immaterial interest (BHI, CDPEI, Alveo-Federal,SIAL Specialty, AyaGold and BYMCW, Inc.) is as follows:
2020 2019(In Thousands)
Carrying amount P=7,549,428 P=6,872,325Share in net income from continuing operations 95,197 211,845Share in total comprehensive income 95,197 211,845
The following are the significant transactions affecting the Group’s investments in associates and jointventures:
Investments in BLC, ECHI, and BHIAs of December 31, 2020 and 2019, the Group’s effective interest in BLC is 45.1%. The ParentCompany’s 5.3% direct investment in BLC and 4.8% through Regent Time are accounted for usingthe equity method because the Parent Company has significant influence over BLC.
On April 17, 2003, the following transactions were consummated pursuant to the terms andconditions of the Assignment Agreement (Agreement), dated February 8, 2003, among the ParentCompany, Evergreen Holdings, Inc. (EHI), Greenfield Development Corporation and Larouge, B.V.(Larouge), as amended, and the Agreement, dated November 23, 2002, among the Company, EHIand Neo Oracle Holdings, Inc. [formerly Metro Pacific Corporation (MPC)] as amended:
(a) The assignment to the Parent Company and EHI of the rights and obligations of Larouge underthe loan agreement between Larouge and MPC, pursuant to which, Larouge extended MPC aloan in the principal amount of US$90.0 million, together with all the rights, title and interests ofLarouge in the pledge constituted on 50.4% of the outstanding shares in BLC. The considerationpaid by the Company and EHI for such assignment was approximately US$90.0 million, subject inpart to foreign exchange adjustment.
(b) The assignment to the Parent Company and EHI, acting in this instance through the joint venturecorporation, Columbus Holdings, Inc. (Columbus), of the controlling interest in BLC representing50.4% of BLC’s outstanding capital stock. This assignment was effected by MPC under a dacionen pago arrangement, and included an assignment of payables of BLC in the principal amount ofP=655.0 million together with its underlying security in the form of shares in Fort BonifacioDevelopment Corporation (FBDC) representing 5.6% of its outstanding capital stock.
The Agreement, as amended, also provides for the constitution of a pledge over 5.0% of BLC’sunencumbered shares as security for contingent liabilities and breach of representation andwarranties. The pledge lien over the 5.0% BLC shares shall continue to subsist until the thirdanniversary of the closing date.
The Parent Company and EHI jointly hold the 50.4% equity interest in BLC through ECHI and BHI.The Parent Company and EHI assigned the notes receivable from MPC to ECHI and BHI, whichacquired the shares of stock of Columbus. Columbus directly owns the 50.4% interest in BLC. BLC

- 55 -
*SGVFSM005262*
owns 55.0% interest in FBDC, the primary developer of certain areas in Fort Bonifacio Global City forresidential, commercial and business development. Columbus accounted for the acquisition of the50.4% interest in BLC using the purchase method.
Subsequent to this, the Parent Company and EHI acquired additional shares of BLC through acombination of direct acquisition and through its associates at varying dates:
On July 31, 2008, the Group acquired, through the Parent Company, Regent Time and Columbus,additional 4,360,178 shares of BLC from FBDC amounting to P=689.0 million, equivalent to 7.7%ownership in BLC. In January and October 2009, a total of 2,295,207 BLC shares were acquiredfrom Development Bank of the Philippines and MPC, pertaining to the pledged shares, throughColumbus amounting to P=362.6 million. This resulted in an increase in Group’s effective interest inBLC to 45.1% and unchanged thereafter.
Investment in Rize-AyalalandRize-Ayalaland (Kingsway) GP, Inc. was incorporated on January 25, 2013 under the laws of BritishColumbia, Canada. The Company's effective ownership is 49.0% through its Vancouver-basedsubsidiary, AyalaLand Real Estate Investments, Inc.
Investment in Tianjin Eco-CityTianjin Eco-City is a registered Sino-foreign equity joint venture between RWIL and Sino-SingaporeTianjin Eco-City Investment & Development Co. (SSTEC) under the law of of the People’s Republic ofChina to operate for 50 years until 2060. The agreement was entered into to develop a 19-towerresidential complex in China, marking its initially foray into the growing China market. It’s principalactivities include property development rental, management property and parking lot management.
In 2020, Tianjin Eco-City reduced its registered capital from RMB292.75 million to RMB176.25 million,with each shareholder getting back capital in proportion to its current share of ownership. After thecapital reduction, the shareholders’ share of ownership remain unchanged. The Group’s share in thecapital reduction amounted to P=326.60 million.
Investment in Cebu District Property Enterprise, Inc.Cebu District Property Enterprise, Inc. (CDPEI) was incorporated on February 20, 2014 and is a50:50 joint venture between the Company and Aboitiz Land, Inc. CDPEI’s main purpose is to createa mixed-use commercial and residential district with the 15.4 hectare property in Subangdaku,Mandaue.
Investment in Alveo-Federal Land Communities, Inc.Alveo Land Corp. signed a Joint Venture Agreement (JVA) with Federal Land, Inc. last April 29, 2015for equal ownership over AFLCI. The JV is for the development of Treveia Nuvali located in Lagunanear Nuvali.
Investment in ALI-ETON Property Development CorporationALI-ETON Property Development Corporation was incorporated on March 13, 2016. The company isa joint venture between Ayala Land, Inc. and LT Group, Inc. ALI and LT Group, Inc. entered into anagreement on January 21, 2016 to jointly develop a project along the C5 corridor. The project isenvisioned to be a township development that spans portions of Pasig City and Quezon City.
In 2020 and 2019, the Parent Company and LT Group, Inc. made additional equity infusions to ALI-Eton to fund the development requirements of Parklinks amounting to P=1,083.5 million and P=1,195.0million as of December 31, 2020 and 2019 respectively.
Investment in BYMCW, Inc.On August 2, 2017, Bouygues Travaux Publics Philippines Inc. (BYTPPI) incorporated BYMCW Inc.(BYMCW) to engage in general building and contracting business. BYMCW’s registered officeaddress is at 2nd floor, Welfare Building, LRTA Compound, Aurora Blvd., Barangay 189, Pasay City,Metro Manila.

- 56 -
*SGVFSM005262*
On December 6, 2017, MDC acquired 30% ownership over BYMCW after buying fifty one (51) millionshares held by BYTPPI.
Investment in AyaGold Retailers, Inc.AyaGold Retailers, Inc., a joint venture between Entenso Equities Incorporated (EEI, a wholly ownedsubsidiary of Puregold Price Club, Inc.) and ALI Capital Corp. (a wholly owned subsidiary of theCompany and the holding company for its retail-related initiatives), was incorporated onOctober 2, 2013. It is organized primarily to finance, build and operate mid-market supermarkets forsome of Company’s new integrated and mixed-use developments. The mid-market supermarkets willbe carried under a new brand to be jointly developed by both ALI Capital Corp. and EEI. Thepartnership with EEI will enable the Company to support its mixed-use developments and, at thesame time, grow its recurring income portfolio.
Investment in SIAL SpecialtySIAL Specialty was incorporated on September 27, 2012 as a joint venture between ALI Capital Corp.and Store Specialist, Inc. (SSI). ALICap is a wholly owned subsidiary of the Parent Company. SSI isone of the largest specialty retail companies in the Philippines with the exclusive distribution rights toza variety of brands from around the world.
The partnership, which combines the ALI Capital Corp.’s expertise in developing mixed-usedevelopments and SSI’s proven track record in retail, is aimed at pursuing retail solutions to addressthe growing and changing lifestyle needs of the market.
SIAL Specialty was organized primarily for the investment and operation of mid-market departmentstores and to pursue other investment opportunities in the Philippine retail sector.
Investment in MGHIIn July 2013, the Parent Company entered into an agreement with the Mercado Family to acquireWhiteknight Holdings, Inc. (WHI), a 33% equity stockholder of MGHI. Its acquisition of WHI will allowthe Parent Company to build a strategic partnership with the Mercado Group and support MGHI’sfuture growth. This partnership also enhances the potential of Ayala Land’s development of mixed-use communities by offering the critical component of medical services to complement the residential,shopping centers, office and hotel developments therein.
Investment in AKLIn 2018, the Parent Company invested P=1,959.7 million in AKL, which is a 50:50 joint venturebetween the Parent Company and Royal Asia Land, Inc. (RALI), and is organized primarily for futuremixed-use development in South Luzon area.
On June 26, 2019, the Parent Company approved the equity call to fund the advance payment toManila Jockey Club, Inc. (MJCI) upon signing the Memorandum of Agreement (MOA) for the 60hectares. Property in Carmona, Cavite between AKL and MJCI. The Parent Company’s share in theadditional total capital requirement amounted to P=250.0 million.
On September 12, 2019, the Parent Company approved the equity call for the minimum subscriptionto increase the Authorized Capital Stock (ACS) of AKL from P=4,545.0 million to P=7,250.0 millionwhich was approved in the AKL board meeting on May 14, 2019. The increase in the ACS shallcover the land acquisition requirements in Carmona and Silang, Cavite for the next 3 years. The 50%share of the Parent Company in the minimum paid-up capital (25% of the minimum subscription) ofthe increase amounted to P=84.7 million.
On July 13, 2020, the Parent Company paid the equity call for the existing subscription and for theadditional subscription to AKL for a total of P=508.4 million. The additional subscription will cover thescheduled infusion of the parcels for the first phase of Project Newton Residential as per joint ventureagreement (JVA). RALI also entered with the same subscription agreement with AKL.
- 57 -
*SGVFSM005262*
On December 7, 2020, the Parent Company entered into another subscription agreement with AKLamounting to P=246.0 million which will cover the amount due for the DOAS of Dolfo and Ledescoparcels of land for the first phase of Project Newton Residential. RALI also entered with the samesubscription agreement with AKL.
12. Investment Properties
The rollforward analysis of this account follows:
2020
Land BuildingsConstruction
in Progress Total(In Thousands)
CostBalance at beginning of year P=87,592,430 P=127,132,394 P=64,013,813 P=278,738,637Additions 1,523,773 2,010,308 2,081,919 5,616,000Disposals (562,236) (1,812,086) (157,541) (2,531,863)Buildings classified as held for sale (Note 9) – (1,080,859) – (1,080,859)Cumulative translation difference (150,753) (61,320) – (212,073)Transfers (Notes 8,13, and 37) (17,638,674) 844,294 – (16,794,380)Balance at end of year 70,764,540 127,032,731 65,938,191 263,735,462Accumulated DepreciationBalance at beginning of year – 35,592,364 – 35,592,364Depreciation (Note 22) – 5,590,050 – 5,590,050Disposals – (328,089) – (328,089)Buildings classified as held for sale – (130,786) – (130,786)Cumulative translation difference – (960) – (960)Balance at end of year – 40,722,579 – 40,722,579Accumulated impairment lossesBalance at beginning of year 102,825 – – 102,825Impairment losses (Note 22) – 225,208 – 225,208Balance at the end of year 102,825 225,208 – 328,033Net Book Value P=70,661,715 P=86,084,944 P=65,938,191 P=222,684,850
2019
Land BuildingsConstructionin Progress Total
(In Thousands)CostBalance at beginning of year, as previously
reported P=83,523,538 P=117,553,349 P=55,359,319 P=256,436,206Effect of adoption of PFRS 16 – – 888,774 888,774Balance at beginning of year, as restated 83,523,538 117,553,349 56,248,093 257,324,980Additions 16,965,958 10,567,896 9,484,719 37,018,573Disposals (1,341,800) (2,502,913) (3,146) (3,847,859)Cumulative translation difference (93,531) (135,484) − (229,015)Transfers (Notes 8,13, 33 and 37) (11,461,735) 1,649,546 (1,715,853) (11,528,042)Balance at end of year 87,592,430 127,132,394 64,013,813 278,738,637
Accumulated DepreciationBalance at beginning of year – 31,327,471 – 31,327,471Depreciation (Note 22) – 4,404,491 – 4,404,491Disposals – (178,584) – (178,584)Cumulative translation difference – (406) – (406)Transfers – 39,392 – 39,392Balance at end of year – 35,592,364 – 35,592,364Accumulated impairment lossesBalance at beginning and end of year 102,825 – – 102,825Net Book Value P=87,489,605 P=91,540,030 P=64,013,813 P=243,043,448

- 58 -
*SGVFSM005262*
Certain parcels of land are leased to several individuals and corporations. Some of the leasecontracts provide, among others, that within a certain period from the expiration of the contracts, thelessee will have to demolish and remove any and all improvements (such as buildings) introduced orbuilt within the leased properties. Otherwise, the lessor will cause the demolition and removal thereofand charge the cost to the lessee unless the lessor occupies and appropriates the same for its useand benefit.
Construction in progress pertain to buildings under construction to be leased as retail and officespaces upon completion. The development and construction period normally range from three yearsto five years and depends heavily on the size of the assets.
The aggregate fair value of the Group’s investment properties amounted to P=458,146.2 million andP=495,845.1 million as of December 31, 2020 and 2019, respectively.
The fair values of the investment properties were determined by independent professionally qualifiedappraisers.
The following table provides the fair value hierarchy of the Group’s investment properties as ofDecember 31, 2020 and 2019:
2020
Date of Valuation
Fair value measurement using
Total
Quoted pricesin activemarkets(Level 1)
Significantobservable
inputs(Level 2)
Significantunobservable
inputs(Level 3)
(In Thousands)Land properties Various P=266,211,236 P=– P=– P=266,211,236Retail properties Various 84,187,480 – – 84,187,480Office properties Various 106,441,044 – – 106,441,044Hospital properties Various 1,306,435 – – 1,306,435
2019
Date of Valuation
Fair value measurement using
Total
Quoted pricesin activemarkets
(Level 1)
Significantobservable
inputs(Level 2)
Significantunobservable
inputs(Level 3)
(In Thousands)Land properties Various P=278,165,996 P=– P=– P=278,165,996Retail properties Various 109,835,314 – – 109,835,314Office properties Various 106,628,343 – – 106,628,343Hospital properties Various 1,215,483 – – 1,215,483
The values of the land were arrived using the Market Data Approach. Market Data Approachprovides an indication of value by comparing the subject asset with identical or similar assets forwhich price information is available. This approach was used for the land as it is commonly used inthe property market since inputs and data for this approach are available. For Market Data Approach,the higher the price per sqm., the higher the fair value.
The values of the buildings (retail, office, hospital) were arrived using the Income Approach. IncomeApproach provides an indication of value by converting future cash flow to a single current value.Under the income approach, the value of an asset is determined by reference to the value of income,cash flow or cost saving generated by the asset.
The significant unobservable inputs to valuation of investment properties ranges from P=1,500-P=278,000 per sqm.
Interest capitalized amounted to P=40.1 million, P=22.8 million and P=19.0 million in 2020, 2019 and2018, respectively. The capitalization rates are 2.63% - 5.18%, 4.41%-7.00% and 2.00%-7.65% in2020, 2019 and 2018, respectively (see Note 16).

- 59 -
*SGVFSM005262*
Consolidated rental income from investment properties amounted to P=18,468.9 million,P=31,687.1 million and P=28,522.4 million in 2020, 2019 and 2018, respectively (see Note 20).Consolidated direct operating expenses arising from the investment properties in 2020, 2019 and2018 amounted to P=7,467.0 million, P=6,822.3 million and P=5,906.2 million, respectively (see Note 22).
Depreciation and amortization expense pertaining to investment properties amounted toP=5,590.1 million, P=4,404.5 million and P=4,052.3 million in 2020, 2019 and 2018, respectively(see Note 22).
The Group has no restrictions on the realisability of its investment properties and no contractualobligations to purchase, construct or develop investment properties or for repairs, maintenance andenhancements.
Certain short-term and long-term debt are secured by real estate mortgages dated September 2,2014 and March 14, 2016 covering both land and building of the Greenbelt Mall. Net book value ofthe investment property amounted to P=2,288.3 million and P=2,451.2 million as of December 31, 2020and 2019, respectively (see Note 16).
13. Property and Equipment
The rollforward analysis of this account as of December 31 follow:
2020Land,
Buildings andImprovements
Machinery andConstruction
Equipment
Furniture,Fixtures and
EquipmentTransportation
Equipment
HotelProperty and
Equipment Total(In Thousands)
CostBalance at beginning of year P=14,515,989 P=14,435,222 P=8,645,130 P=3,462,991 P=24,049,471 P=65,108,803Additions 863,343 454,190 850,886 46,325 883,692 3,098,436Disposals (67,608) (293,624) (212,201) (150,638) – (724,071)Foreign currency exchange
difference (87,818) (262,678) (4,531) (1,757) – (356,784)Building held for sale (Note 9) (2,442) – – – – (2,442)Transfers (Notes 12 and 37) 591,645 – – – – 591,645Balance at end of year 15,813,109 14,333,110 9,279,284 3,356,921 24,933,163 67,715,587Accumulated Depreciation
and AmortizationBalance at beginning of year P=4,208,323 P=8,864,301 P=4,687,040 P=1,446,549 P=2,840,233 P=22,046,446Depreciation and amortization
(Note 22) 787,280 961,935 430,778 304,116 565,920 3,050,029Disposals (37,863) (269,194) (209,348) (68,934) – (585,339)Foreign currency exchange
difference (8,333) (229,061) (3,204) (1,546) – (242,144)Building held for sale (Note 9) (373) – – – – (373)Balance at end of year 4,949,034 9,327,981 4,905,266 1,680,185 3,406,153 24,268,619Net Book Value P=10,864,075 P=5,005,129 P=4,374,018 P=1,676,736 P=21,527,010 43,446,968
2019Land,
Buildings andImprovements
Machinery andConstruction
Equipment
Furniture,Fixtures and
EquipmentTransportation
Equipment
HotelProperty and
Equipment Total(In Thousands)
CostBalance at beginning of year P=11,822,391 P=14,042,526 P=6,657,181 P=3,331,104 P=18,927,960 P=54,781,162Additions 2,880,599 948,850 1,999,517 165,395 4,525,214 10,519,575Disposals (16,107) (502,089) (7,578) (31,885) − (557,659)Foreign currency exchange
difference (46,248) (54,065) (3,990) (1,623) − (105,926)Transfers (Notes 12 and 37) (124,646) − − − 596,297 471,651Balance at end of year 14,515,989 14,435,222 8,645,130 3,462,991 24,049,471 65,108,803
(Forward)

- 60 -
*SGVFSM005262*
Land,Buildings and
Improvements
Machinery andConstruction
Equipment
Furniture,Fixtures and
EquipmentTransportation
Equipment
HotelProperty and
Equipment Total(In Thousands)
Accumulated Depreciation andAmortization
Balance at beginning of year P=3,546,838 P=7,741,047 P=4,174,491 P=1,206,464 P=2,363,122 P=19,031,962Depreciation and amortization
(Note 22) 954,929 1,553,999 550,519 275,265 516,270 3,850,982Disposals (20,903) (421,333) (9,090) (22,371) − (473,697)Foreign currency exchange
difference (30,535) 896 9,247 4,873 (15,519)Transfers (39,392) − − − − (39,392)Others (202,614) (10,308) (38,127) (17,682) (39,159) (307,890)Balance at end of year 4,208,323 8,864,301 4,687,040 1,446,549 2,840,233 22,046,446Net Book Value P=10,307,666 P=5,570,921 P=3,958,090 P=2,016,442 P=21,209,238 P=43,062,357
The depreciation and amortization of property and equipment (included under various consolidatedstatements of income accounts) amounted to P=3,050.0 million, P=3,851.0 million and P=1,882.6 millionin 2020, 2019 and 2018, respectively. No interest was capitalized in 2020 and 2019 (see Note 16).
The Group has no restrictions on its property and equipment and none of these have been pledgedas security for its obligations. Capital expenditures for hotel buildings in the course of constructionamounted to P=6,775.47 million and P=5,915.92 as of December 31, 2020 and 2019, respectively, andare included in property and equipment. The total contractual commitments arising from awardedcontracts for the acquisition, development and construction of property and equipment amounted toP=368.71 million.
The Group performed impairment testing on its hotel property and equipment with a carrying value ofP=21,527.0 million as of December 31, 2020, by assessing its recoverable amount through estimationof its value in use (VIU). VIU is the present value of the future cash flows expected to be derivedfrom an asset. The significant assumptions used in the valuation are discount rates of 7.00% to12.00% with an average growth rate of 3.00%. The Group also considered in its assumptions theimpact of the pandemic on the occupancy rate and room rates which are not expected to normalizeuntil 2024. Based on the impairment testing, there is no impairment loss on the Group’s hotel propertyand equipment (see Note 3).
14. Other Noncurrent Assets
This account consists of:
2020 2019(In Thousands)
Prepaid expenses P=10,544,253 P=10,667,666Advances to contractors and suppliers 9,387,018 13,664,137Leasehold rights 3,506,816 3,684,840Deferred input VAT 2,918,601 1,676,155Deposits – others 2,339,575 2,452,299Investment in bonds 2,309,440 2,309,867Net pension assets (Note 26) 12,220 74,332Development rights 49,791 63,314Others 760,099 287,867
P=31,827,813 P=34,880,477
Prepaid expenses consist of project costs incurred for unlaunched projects of the Group, advancerental payments and noncurrent prepaid management fees. This also includes the noncurrent portionof cost to obtain contracts (see Note 9) which includes prepaid commissions and advances tobrokers, which amounted to P=914.8 million and P=442.4 million in 2020 and 2019, respectively.
- 61 -
*SGVFSM005262*
Advances to contractors and suppliers represents prepayments for the construction of investmentproperties and property and equipment.
Leasehold rights consist of the following: Through the acquisition of ALLHC, ALI acquired leasehold rights arising from their lease
agreement with Philippine National Railways (PNR) which amounted to P=2,905.15 million andP=3,062.19 million as of December 31, 2020 and 2019, respectively (see Note 33).
TKPI’s leasehold rights pertains to the right to use the property in Apulit Island located in Taytay,Palawan expiring on December 31, 2029 which amounted to P=60.09 million and P=66.76 million asof December 31, 2020 and 2019, respectively.
NTDCC’s leasehold rights refer to development rights on an 8.3-hectare portion of the MRTDevelopment Corporation, which is located on the North Triangle property, and enabled theGroup to develop and construct a commercial center which amounted to P=541.58 million andP=555.89 million as of December 31, 2020 and 2019, respectively.
Movements of leasehold rights follow:
2020 2019(In Thousands)
As of January 1, 2020 P=3,684,840 P=3,868,532Additions 8,736 –Amortizations (186,760) (183,692)Balance at end of year P=3,506,816 P=3,684,840
Deposits - others pertain to various utility deposits and security deposits for leases.
Investment in bonds pertain to non-interest bearing bonds with a term of 36-months. The Grouprecorded the investment as financial asset at fair value through other comprehensive income. Thefair value of the investment in bonds is determined using the binomial lattice approach. The fair valueof the investment is categorized under Level 3.
Deferred input VAT pertains to unamortized VAT portion from purchases of capital goods.
Development rights pertain to the saleable and non-saleable development rights acquired by theParent Company. The non-saleable portion is allocated to the gross floor area of a structure in aparticular lot that can be developed in the future. The amortization of development rights arecapitalized as additional cost of the structure once the development commences.
Others pertain to prepayments for expenses that is amortized for more than one year.
15. Accounts and Other Payables
This account consists of:
2020 2019(In Thousands)
Accounts payable P=77,332,265 P=84,659,801Taxes payable 19,215,550 22,488,327Accrued project costs 18,220,433 18,269,215Liability for purchased land 9,316,978 9,936,887Accrued salaries and employee benefits 5,669,563 5,792,122Retentions payable 4,131,302 4,094,175Accrued professional and management fees 2,448,396 3,837,477
(Forward)

- 62 -
*SGVFSM005262*
2020 2019(In Thousands)
Interest payable P=1,775,627 P=2,156,213Accrued repairs and maintenance 1,634,398 1,902,797Payable to related parties (Note 25) 1,128,192 1,034,283Accrued advertising and promotions 968,291 1,317,500Accrued utilities 697,231 2,334,623Accrued rentals 369,960 1,082,496Dividends payable 241,604 632,000Other accrued expenses 1,476,132 3,441,253
P=144,625,922 P=162,979,169
Accounts payable and accrued expenses are noninterest-bearing and are normally settled on30- to 60-day terms.
Taxes payable pertains to the Group’s output VAT, expanded withholding tax, capital gains tax andfringe benefit tax.
Accrued project costs are billings not yet received from suppliers for direct materials, and servicesfrom subcontractors. These are accruals of project costs such as equipment charges, materials,labor, overhead, and provision for repairs and maintenance.
Liability for purchased land pertains to the current portion of unpaid unsubdivided land acquiredpayable during the year. These are normally payable in quarterly or annual installment payments orupon demand.
Retentions payable pertains to the amount withheld by the Group on contractor’s billings to bereleased after the guarantee period, usually one (1) year after the completion of the project or upondemand. The retention serves as a security from the contractor should there be defects in the project.
Other accrued expenses consist mainly of accruals from commissions, royalty, transportation andtravel, janitorial and security, postal and communication and other expenses.
16. Short-term and Long-term Debts
The short-term debt amounting to P=9,131.3 million and P=18,032.8 million as of December 31, 2020and 2019, respectively, represents both peso and foreign currency-denominated bank loans. Peso-denominated short-term loans had a weighted average cost of 4.0% and 4.98%per annum in 2020and 2019, respectively.
In compliance with BSP rules on directors, officers, stockholders and related interests, certain short-term and long-term debt with a carrying value of P=13,231.3 million and P=24,416.9 million as ofDecember 31, 2020 and 2019 are secured by real estate mortgages dated September 2, 2014 andMarch 14, 2016 covering both land and building of the Greenbelt Mall. Net book value of the propertyamounted to P=2,288.3 million and P=2,451.2 million as of December 31, 2020 and 2019, respectively,which is accounted as part of the “Investment properties” account.

- 63 -
*SGVFSM005262*
Long-term debt consists of:
2020 2019(In Thousands)
Parent Company: Bonds:
Due 2020 P=− P=4,000,000Due 2021 9,000,000 9,000,000Due 2022 22,650,000 12,650,000Due 2023 15,000,000 15,000,000Due 2024 18,000,000 18,000,000Due 2025 21,250,000 15,000,000Due 2026 16,000,000 16,000,000Due 2027 8,000,000 8,000,000Due 2028 10,000,000 10,000,000Due 2033 2,000,000 2,000,000
Fixed rate corporate notes (FXCNs) 5,650,000 5,710,000 Php - denominated long-term loan 41,230,039 41,885,094 US Dollar - denominated long-term loan 6,002,875 6,329,375
174,782,914 163,574,469Subsidiaries:
Bonds 5,000,000 5,000,000Bank loans - Philippine Peso 24,152,698 24,046,410Bank loans - Malaysian Ringgit 1,749 4,875Fixed rate corporate notes − 1,350,000
29,154,447 30,401,285203,937,361 193,975,754
Less unamortized transaction costs 1,117,768 911,703202,819,593 193,064,051
Less current portion 18,732,401 17,250,706P=184,087,192 P=175,813,345
ALI ParentBelow is the summary of the outstanding Peso bonds issued by the Parent Company:
YearIssued
Term(Years)
Interestrate
PrincipalAmount
(In thousands)
Carrying Value(In thousands) Features2020 2019
2012 10.0 6.0000% 5,650,000 P=5,650,000 P=5,645,304 Fixed rate bond due 20222013 7.0 4.6250% 4,000,000 − 3,995,321 Fixed rate bond due 20202013 20.0 6.0000% 2,000,000 1,986,730 1,985,276 Fixed rate bond due 20332013 10.5 5.0000% 15,000,000 14,966,062 14,936,647 Fixed rate bond due 20242014 11.0 5.6250% 8,000,000 7,968,512 7,952,880 Fixed rate bond due 20252015 7.0 4.5000% 7,000,000 6,987,688 6,968,807 Fixed rate bond due 20222016 9.5 4.7500% 7,000,000 6,969,407 6,955,765 Fixed rate bond due 20252016 10.0 4.8500% 8,000,000 7,961,918 7,946,612 Fixed rate bond due 20262016 7.0 3.8915% 7,000,000 6,980,787 6,961,631 Fixed rate bond due 20232017 10.0 5.2624% 7,000,000 6,979,065 6,972,611 Fixed rate bond due 20272018 10.0 5.9203% 10,000,000 9,916,583 9,896,154 Fixed rate bond due 20282018 5.0 7.0239% 8,000,000 7,962,717 7,925,898 Fixed rate bond due 20232019 7.0 6.3690% 8,000,000 7,934,304 7,909,802 Fixed rate bond due 20262019 5.0 4.7580% 3,000,000 2,978,436 2,979,164 Fixed rate bond due 20242019 2.0 4.2463% 9,000,000 8,781,628 8,937,450 Fixed rate bond due 20212019 7.25 4.9899% 1,000,000 963,622 952,029 Fixed rate bond due 20272020 2.0 3.0000% 10,000,000 9,970,491 − Fixed rate bond due 20222020 5.0 3.8620% 6,250,000 6,192,684 − Fixed rate bond due 2025Total P=121,150,634 P=108,921,351
Philippine Rating Services Corporation (PhilRatings) rated the Parent Company’s 2020 bond issue“PRS Aaa” with a stable outlook, and maintained the “PRS Aaa” rating with a stable outlook for allother outstanding bonds. PRS Aaa is the highest rating assigned by PhilRatings, indicating that

- 64 -
*SGVFSM005262*
obligor’s capacity to meet its financial commitment on the obligation is extremely strong and that ithas the smallest degree of investment risk. On the other hand, an Outlook is an indication as to thepossible direction of any rating change within a one year period and serves as a further refinement tothe assigned credit rating for the guidance of investors, regulators, and the general public. A StableOutlook indicates that the rating is likely to be maintained or to remain unchanged in the next twelvemonths
Philippine Peso 10-year Bonds due 2022In April 2012, the Parent Company issued a P=5,650.0 million bond due 2022 at a fixed rate equivalentto 6.0% p.a. PhilRatings assigned a PRS Aaa rating on the bonds indicating that it has the smallestdegree of investment risk. Interest payments are protected by a large or by an exceptionally stablemargin and principal is assured. While the various protective elements are likely to change, suchchanges as can be visualized are most unlikely to impair the fundamentally strong position of suchissues. PRS Aaa is the highest credit rating possible on PhilRatings’ rating scales for long-termissuances.
Philippine Peso 5-year and 10-year and 6-month Bonds due 2024In July 2013, the Parent Company issued a total of P=15,000.0 million bonds due 2024 at a fixed rateequivalent to 5.0% p.a. Credit Rating and Investors Services Philippines, Inc. (CRISP) assigned a"AAA" on the bonds indicating that it has a minimal credit risk owing to the Company’s capacity torepay its debt obligations. AAA is the highest rating assigned by CRISP. In 2019, the ParentCompany issued a total of P=3,000.0 million bonds due 2024 at a fixed rate equivalent to 4.758% p.a.under its new shelf registration. PhilRatings assigned a PRS Aaa rating on the bonds.
Philippine Peso 7-Year and 20-year Bonds due 2020 and 2033In October 2013, the Parent Company issued a total of P=6,000.0 million bonds, broken down into aP=4,000.0 million bond due 2020 at a fixed rate equivalent to 4.6% p.a. and a P=2,000.0 million bonddue 2033 at a fixed rate equivalent to 6.0% p.a. CRISP assigned a "AAA" rating on the bondsindicating that it has a minimal credit risk owing to the Parent Company’s capacity to repay its debtobligations. AAA is the highest rating assigned by CRISP.
Philippine Peso 11-year Bonds due 2025In April 2014, the Parent Company issued a total of P=8,000.0 million bonds due 2025 at a fixed rateequivalent to 5.6% p.a. The Bonds were assigned an issue credit rating of PRS Aaa, with a StableOutlook, by PhilRatings.
Philippine Peso 7.0 Billion Fixed Rate Bonds due 2022In April 2015, the Parent Company issued a total of P=7,000.0 million bonds due 2022 at a fixed rateequivalent to 4.5% p.a. The Bonds were assigned an issue credit rating of PRS Aaa, with a StableOutlook, by PhilRatings.
Philippine Peso 9-year and 6-month Bonds due 2025In April 2016, the Parent Company issued a total of P=7,000.0 million bonds due 2025 at a fixed rateequivalent to 4.75% p.a. The Bonds is the second tranche of the Fixed-rate Bonds Series under theParent Company's P=50,000.0 million Debt Securities Program registered in the SEC. The Bondswere assigned an issue credit rating of PRS Aaa, with a Stable Outlook, by PhilRatings.
Philippine Peso 7-year and 10-year Bonds due 2026In March 2016, the Parent Company issued a total of P=8,000.0 million bonds due 2026 at a fixed rateequivalent to 4.85% p.a. The Bonds is the first tranche of the Fixed-rate Bonds Series under theParent Company's P=50,000 million Debt Securities Program registered in the SEC. The Bonds wereassigned an issue credit rating of PRS Aaa, with a Stable Outlook, by PhilRatings. In May 2019, theParent Company issued an P=8,000.0 million fixed rate bond due 2026 at a rate equivalent to 6.369%p.a. The Bonds represent the first tranche of debt securities issued under the Parent Company's newP=50,000.0 million Debt Securities Program registered with the SEC, and listed on the PDEx. TheBonds have been rated PRS Aaa with a Stable Outlook by PhilRatings.

- 65 -
*SGVFSM005262*
Philippine Peso 7-year Bonds due 2023In October 2016, the Parent Company issued a P=7,000.0 million fixed rate bond due 2023 at a rateequivalent to 3.8915% p.a. The Bonds represent the third tranche of the Fixed-rate Bonds Seriesissued under the Parent Company's P=50,000.0 million Debt Securities Program registered with theSEC, and listed in the PDEx. The Bonds have been rated PRS Aaa with a Stable Outlook byPhilRatings.
Philippine Peso 7-year and 3-month and 10-year Bonds due 2027In May 2017, the Parent Company issued a P=7,000.0 million fixed rate bond due 2027 at a rateequivalent to 5.2624% p.a. The Bonds represent the fourth tranche of the Fixed-rate Bonds Seriesissued under the Parent Company's P=50,000.0 million Debt Securities Program registered with theSEC, and listed in PDEx. The Bonds have been rated PRS Aaa with a Stable Outlook by PhilRatings.In November 2019, the Parent Company issued a P=1,000.0 million fixed rate bond due 2027 at a rateequivalent to 4.9899 % p.a. This was the third tranche of bonds issued under the new P=50,000.0million shelf registration of the Parent Company. The Bonds have been rated PRS Aaa with a StableOutlook by PhilRatings.
Philippine Peso 10-year Bonds due 2028In April 2018, the Parent Company issued a P=10,000.0 million fixed rate bond due 2028 at a rateequivalent to 5.9203% p.a. and subject to repricing on 27 April 2023, the fifth anniversary of the IssueDate, at the higher of 5.9203% or the prevailing 5-year benchmark plus 75 bps. The Bonds representthe fifth tranche of the Fixed-rate Bonds Series issued under the Parent Company's P=50,000.0 millionDebt Securities Program registered with the SEC,and listed in the PDEx. The Bonds have been ratedPRS Aaa with a Stable Outlook by PhilRatings.
Philippine Peso 5-year Bonds due 2023In October 2018, the Parent Company issued a P=8,000.0 million fixed rate bond due 2023 at a rateequivalent to 7.0239% p.a. The Bonds represent the sixth and final tranche of the Fixed-rate BondsSeries issued under the Parent Company's P=50,000.0 million Debt Securities Program registered withthe SEC, and listed on the PDEx. The Bonds have been rated PRS Aaa with a Stable Outlook byPhilRatings.
Philippine Peso 2-year Bonds due 2021In November 2019, the Parent Company issued a P=9,000.0 million fixed rate bond due 2021 at a rateequivalent to 4.2463% p.a. The Bonds form part of the third tranche of debt securities issued underthe Parent Company's new P=50,000.0 million Debt Securities Program registered with the SEC, andlisted on the PDEx. The Bonds have been rated PRS Aaa with a Stable Outlook by PhilRatings.
Philippine Peso 2-year Bonds due 2022In June 2020, the Parent Company issued a P=10,000.0 million fixed rate bond due 2022 at a rateequivalent to 3.00% p.a. The Bonds form part of the fourth tranche of debt securities issued under theParent Company's new P=50,000.0 million Debt Securities Program registered with the SEC, and thefirst issuer to hold a virtual listing ceremony on the PDEx. The Bonds have been rated PRS Aaa with aStable Outlook by PhilRatings and the first corporate bond to bookbuild, price, and issue within thecommunity quarantine period.
Philippine Peso 5-year Bonds due 2025In September 2020, the Parent Company issued a P=6,250.0 million fixed rate bond due 2025 at a rateequivalent to 3.862% p.a. The Bonds represent the fifth tranche of debt securities issued under theParent Company's new P=50,000.0 million Debt Securities Program registered with the SEC and listedon the PDEx. The Bonds have been rated PRS Aaa with a Stable Outlook by PhilRatings and thelargest 5-year bond issuance during the quarantine period.
Philippine Peso 5-, 10-, 15-Year FXCN due on 2016, 2021 and 2026In January 2011, the Parent Company issued P=10,000.0 million FXCNs to various financialinstitutions and retail investors. The notes will mature on various dates up to 2026. The FXCNs bearfixed interest rates ranging from 5.6% to 7.5% p.a. depending on the term of the notes.

- 66 -
*SGVFSM005262*
The Parent Company prepaid P=1,950.0 million of notes due in 2016 on January 19, 2013. Thereafter,the Parent Company either prepaid the loans before its maturity or paid the loans upon maturity.From 2014 until 2020, the Parent Company paid a total of P=7,100.0 million, in which P=10.0 millionwere each paid in 2020 and 2019. As of December 31, 2020 and 2019, the remaining balance of theFXCN amounted to P=950.0 million and P=960.0 million, respectively.
Philippine Peso 10-year Note due 2023In December 2012, the Parent Company executed a P=5,000.0 million committed Corporate Notefacility with a local bank, of which an initial P=3,500.0 million was drawn in 2012. The balance ofP=1,500.0 million was subsequently drawn in January 2013. Notes currently bear a fixed interest rateof 4.5% p.a. The Corporate Notes will mature on the third month succeeding the tenth anniversary ofthe initial drawdown date. In 2015, P=50.0 million was prepaid by the Company. Thereafter, theParent Company paid the P=50.0 million loan amortizations until 2020. From 2016 until 2020, theParent Company paid a total of P=250.0 million, in which P=50.0 million amortizations were each paid in2020 and 2019. As of December 31, 2020 and 2019, the remaining balance of the note amounted toP=4,700.0 million and P=4,750.0 million, respectively.
Peso-denominated Long-term Loans In August to September 2015, the Parent Company assumed an aggregate of P=15,526.9 million
various long-term facilities of some subsidiaries from various banks. The loans bear fixed interestrates ranging from 4.5% to 4.7% p.a. and terms ranging from 4.4 years to 10.5 years. As ofDecember 31, 2020 and 2019, the remaining balance of the assumed long-term facilities amounted toP=11,592.5 million and P=14,107.8 million respectively.
In March 2017, the Parent Company executed a P=10,000.0 million long-term facility with a domesticbank, in which the Parent Company had simultaneously drawn an initial P=5,000.0 million. The loancarries a fixed interest rate of 4.949% p.a. and a term of 10 years. The balance under the long-termfacility of P=5,000.0 million was drawn in April 2017.
In March 2018, the Parent Company executed a P=5,000.0 million long-term facility with a domesticbank, in which the Parent Company had simultaneously drawn the entire facility amount.
In March 2019, the Parent Company executed a P=13,000.0 million long-term facility with a domesticbank, in which the Parent Company had simultaneously drawn an initial P=6,500.0 million. The loancarries a fixed interest rate of 6.272% p.a. and a term of 10 years. The P=6,500.0 million balance wasdrawn in April 2019 at an interest rate of 6.307% per annum. In June 2020, the Parent Companyprepaid the remaining long-term balance of P=12,662.0 million with a pre-termination fee ofP=126.6 million recorded under interest expense and other financing charges account.
In January 2020, the Parent Company executed and availed a P=5,000.0 million 10-year long-termfacility with a domestic bank. The loan carries a fixed interest rate of 4.500% p.a. for the initial 5years. In December 2020, the Parent Company also executed and availed a P=10,000.0 million 10-year long-term facility with a domestic bank. The loan carries a fixed interest rate of 4.000% p.a. forthe first 7 years. Both loans will be repriced on the 5th and 7th anniversary, respectively.
As of December 31, 2020 and 2019, remaining aggregate balance of the Peso-denominatedlong-term loans amounted to P=41,230.0 million and P=41,885.1 million, respectively.
US Dollar-denominated Long-term LoansIn November 2019, the Parent Company executed and had simultaneously drawn a US$125.0 millionlong-term facility. The loan bears a floating interest rate based on a credit spread over the three-month US Dollar London Interbank Offered Rate (LIBOR), repriceable quarterly. All proceeds wereonlent to MCT to refinance its existing loans. The loan will mature on the fifth anniversary of the initialdrawdown date.

- 67 -
*SGVFSM005262*
As of December 31, 2020 and 2019, the remaining aggregate balance of US Dollar-denominated longterm loans amounted to P=6,002.9 million and P=6,329.4 million, respectively.
SubsidiariesThe subsidiaries’ loans will mature on various dates up to 2030. Peso-denominated loans bearvarious floating interest rates at 60 bps to 80 bps spread over the benchmark 91-day PDST-R2 orand fixed interest rates ranging from 3.89% to 3.92% p.a. Certain loans which are subject to floatinginterest rates are subject to floor floating interest rates equivalent to (i) 95.0% or par of the OvernightReverse Repurchase Agreement Rate of the Bangko Sentral ng Pilipinas (BSP Overnight Rate) or(ii) the BSP Overnight Rate plus a spread of 20 bps to 75 bps p.a. or (iii) the average of the BangkoSentral ng Pilipinas Overnight Deposit Rate and Term Deposit Facility with a term closed to the 90-day interest period.
In 2020 and 2019, the subsidiaries made a total bank loan availment of P=9,600.0 million andP=6,083.0 million, respectively. In 2019, the subsidiaries made a total bank loan payment ofP=5,943.96 million. In 2020, the subsidiaries paid a total bank loan of P=9,496.67 million and anotherP=1,350.0 million for the matured fixed rate corporate notes. The total outstanding balance of thesubsidiaries’ loans as of December 31, 2020 and 2019 amounted to P=24,154.45 million andP=25,401.29 million loans, respectively.
Philippine Peso 5.0 Billion Fixed Rate Bonds due 2021In June 2014, Cebu Holdings, Inc. issued a total of P=5,000.0 million bonds due 2021 at a fixed rateequivalent to 5.3% p.a. The Bonds have been rated PRS Aaa by PhilRatings, indicating that obligor’scapacity to meet its financial commitment on the obligation is extremely strong.
The loan agreements contain some or all of the following restrictions: material changes in nature ofbusiness; maintenance of debt-to-equity ratio; payment of dividends and additional loans maturingbeyond a year which will result to non-compliance of the required debt-to-equity ratios; merger orconsolidation where the Company/subsidiary is not the surviving corporation; guarantees oradvances; encumbrance for borrowed money; and sale of substantially all assets. These restrictionsand requirements were complied with by the Group as of December 31, 2020 and 2019.
Interest capitalized amounted to P=40.1 million, P=145.5 million, P=196.2 million in 2020, 2019 and 2018respectively. The capitalization rates are 2.63% - 5.18% in 2020, 4.41%-7.01% in 2019 and2%-7.65% in 2018 (see Note 8 and 12).
Transaction costs capitalized amounted to P=423.0 million, P=333.8 million, P=251.4 million in 2020,2019 and 2018, respectively. Amortization amounted to P=216.93 million, P=151.9 million andP=178.2 million in 2020, 2019 and 2018, respectively, and included under “Interest and other financingcharges” (see Note 22).
17. Deposits and Other Current Liabilities
This account consists of:
2020 2019(In Thousands)
Current portion of customers’ deposits P=19,760,584 P=20,487,113Security deposits 5,311,506 4,642,202Others 245,156 343,266
P=25,317,246 P=25,472,581
Customers’ deposits consist of collections from real estate customers which have not reached the10% threshold to qualify for revenue recognition and excess of collections over the recognizedreceivables based on percentage of completion.

- 68 -
*SGVFSM005262*
The amount of revenue recognized from amounts included in customers’ deposits at the beginning ofthe year amounted to P=21,087.9 million, P=22,826.6 million and P=11,479.4 million in 2020, 2019 and2018, respectively.
Security deposits are equivalent to three (3) to six (6) months’ rent of tenants with cancellable leasecontracts and whose lease term will end in the succeeding year. This will be refunded to the lesseesat the end of the lease term or be applied to the last months' rentals on the related contracts.
Other current liabilities mostly pertain to estimated liability on property development and unearnedincome.
18. Deposits and Other Noncurrent Liabilities
This account consists of:
2020 2019(In Thousands)
Deposits P=19,712,684 P=13,646,810Customers’ deposit - noncurrent portion 13,708,188 8,809,357Retentions payable 6,058,579 6,752,120Contractors payable 5,711,140 6,595,611Liability for purchased land 2,111,165 5,341,766Deferred output VAT 1,457,411 1,721,402Subscriptions payable 498,175 498,175Other liabilities 782,828 638,395
P=50,040,170 P=44,003,636
Deposits include security deposits from tenants of retail and office spaces and deferred credits arisingfrom sale of real estate properties. Security deposits are equivalent to three (3) to six (6) months’ rentof long-term tenants with noncancellable leases. This will be refunded to the lessees at the end ofthe lease term or applied to the last months' rentals on the related contracts. Deferred credits pertainto advances from buyers of real estate properties to cover various processing fees including, but notlimited to, fees related to transfer of title such as registration fees, documentary taxes and transfertaxes. Payments made by the Group for the processing of title are charged to this account.
Customers’ deposits consist of collections from real estate customers which have not reached the10% threshold to qualify for revenue recognition and excess of collections over the recognizedreceivables based on percentage of completion.
Retentions payable pertains to the amount withheld by the Group on contractor’s billings to bereleased after the guarantee period, usually one (1) year after the completion of the project or upondemand. The retention serves as a security from the contractor when there are claims for defects inprojects requiring rework.
Contractors payable represents accrued costs incurred for property development that are not yetbilled.
Liability for purchased land pertains to the portion of unpaid unsubdivided land acquired during theyear. These are normally payable in quarterly or annual installment payments within three (3) orfive (5) years.
Deferred output VAT pertains to output VAT on receivables for which sales recognition has beendeferred based on sales collection threshold for VAT recognition purposes.
The Group’s subscription payable pertains to ALLHC’s investment in Cyber Bay.

- 69 -
*SGVFSM005262*
On April 25, 1995, Central Bay, a wholly owned subsidiary of Cyber Bay, entered into a Joint VentureAgreement with the Philippine Reclamation Authority (PRA; formerly Public Estates Authority) for thecomplete and entire reclamation and horizontal development of a portion of the Manila-Cavite CoastalRoad and Reclamation Project (the Project) consisting of three partially reclaimed and substantiallyeroded islands (the Three Islands) along Emilio Aguinaldo Boulevard in Parañaque and Las Piñas,Metro Manila with a combined total area of 157.8 hectares, another area of 242.2 hectarescontiguous to the Three Islands and, at Central Bay’s option as approved by the PRA, an additional350 hectares more or less to regularize the configuration of the reclaimed area.
On March 30, 1999, the PRA and Central Bay executed an Amended Joint Venture Agreement(AJVA) to enhance the Philippine Government’s share and benefits from the Project which wasapproved by the Office of the President of the Philippines on May 28, 1999.
On July 9, 2002, the Supreme Court (SC) (in the case entitled “Francisco Chavez vs. Amari CoastalBay and Reclamation Corp.”) issued a ruling declaring the AJVA null and void. Accordingly, PRA andCentral Bay were permanently enjoined from implementing the AJVA.
On July 26, 2002, Central Bay filed a Motion for Reconsideration (MR) of said SC decision. OnMay 6, 2003, the SC En Banc denied with finality Central Bay’s MR. On May 15, 2003, Central Bayfiled a Motion for Leave to Admit Second MR. In an En Banc Resolution of the SC datedJuly 8, 2003, the SC resolved to admit the Second MR of Central Bay.
On November 11, 2003, the SC rendered a 7-7 split decision on Central Bay’s Second MR. Becauseof the new issues raised in the SC’s latest resolution that were never tried or heard in the case,Central Bay was constrained to file on December 5, 2003 a Motion for Re-deliberation of the SC’slatest resolution which motion was denied with finality by the SC.
With the nullification of the AJVA, Central Bay has suspended all Project operations. OnAugust 10, 2007, in view of the failure by the PRA to comply with its obligations and representationsunder the AJVA, Cyber Bay and Central Bay have filed their claims for reimbursement of Projectexpenses in the amount of P=10,200.0 million with the PRA. Cyber Bay and Central Bay provided thePRA with the summary and details of their claims on September 5, 2007. On July 15, 2008, CyberBay sent a follow-up letter to the PRA. The PRA, in its letter dated July 18, 2008, informed CyberBay that its claim is still being evaluated by the PRA.
As at December 31, 2020 and 2019, the Group has unpaid subscription in Cyber Bay amounting toP=481.7 million. The investment in Cyber Bay under “financial assets through FVOCI” amounted toP=472.0 million and P=513.6 million as of December 31, 2020 and 2019, respectively (see Note 10).
Other liabilities include nontrade payables, accrued payables and warranty payables.
19. Equity
The details of the number of shares follow:
December 31, 2020Number of Shares Amount
Preferred Common Preferred Common(In Thousands)
Authorized 15,000,000 20,000,000 P=1,500,000 P=20,000,000Issued* 13,066,495 14,635,298 P=1,306,649 P=14,635,298Subscribed ‒ 124,882 ‒ 124,882
13,066,495 14,760,180 P=1,306,649 P=14,760,180*Out of the total issued shares, 29,785 shares or P=1,260,780 as of December 31, 2020 pertain to Treasury shares

- 70 -
*SGVFSM005262*
December 31, 2019
Number of Shares AmountPreferred Common Preferred Common
(In Thousands)Authorized 15,000,000 20,000,000 P=1,500,000 P=20,000,000Issued* 13,066,495 14,632,062 P=1,306,649 P=14,632,062Subscribed – 113,273 – 113,273
13,066,495 14,745,335 P=1,306,649 P=14,745,335*Out of the total issued shares, 25,373 shares or P=1,104,353 as of December 31, 2019 pertain to Treasury shares
Preferred Shares (P=0.10 par value per share)The Parent Company’s preferred shares prior to 2012 were subscribed and issued through a stockrights offer with the following features: (a) non-voting; (b) dividend rate of 4.6% p.a., payable annually,noncumulative; (c) nonparticipating; (d) convertible at the option of the holder at a ratio of one (1)preferred share to one (1) common share commencing on the 10th year from issue date at anexercise price equivalent to the higher of (i) the 30-day average closing price or (ii) closing price ofcommon shares immediately preceding the exercise date, less the par value of the preferred shares;(e) no pre-emptive rights; (f) non-redeemable; (g) non-listed; and, (h) preferred in liquidation to theextent of par value.
The dividends for preferred shares are declared upon the sole discretion of the Parent Company’sBOD.
On February 20, 2012, the BOD approved the following restructuring exercise in order to comply withthe regulatory requirement on Filipino-ownership following the Supreme Court’s ruling that nonvotingshares do not count as equity when computing for a Parent Company’s Filipino-ownership level:
a. Redemption and retirement of the 13.0 billion outstanding preferred shares with par value ofP=0.10.
b. Reclassification of the 1,970.0 million unissued preferred shares to voting preferred sharesthrough an amendment of Article Seventh of the Articles of Incorporation.
c. Increase in authorized capital stock by P=1,300.0 million creating new voting preferred shares anda stock rights offer of 13,000 million voting preferred shares from the increase in the authorizedcapital stock.
On April 18, 2012, the stockholders ratified the BOD resolution on the capital restructuring. Thevoting preferred shares shall have the following features, rights, and privileges: (a) voting;(b) dividend rate of 4.7% per annum, equivalent to 90.0% of the 10-year PDST R2 (repriced every ten(10) years from issue date), payable annually, non-cumulative; (c) convertible at the option of theholder at a ratio of one (1) voting preferred share to one (1) common share commencing on the 10thyear from issue date at an exercise price equivalent to the higher of (i) the 30-day average closingprice or (ii) closing price of common shares immediately preceding the exercise date, less the parvalue of the preferred shares; (d) no pre-emptive rights; (e) redeemable at par at the sole option ofthe corporation; (f) non-listed; and, (g) preferred in liquidation to the extent of par value.
The SEC approved on January 31, 2013 the following:
a. The decrease in authorized capital stock by P=1,303.5 million, the aggregate par value of the13,034.6 million preferred shares which have been redeemed and retired, from P=22,803.5 millionto P=21,500.0 million, and
b. The amendments to Articles of Incorporation reflecting the decrease in capital stock.
As of December 31, 2020 and 2019, the Parent Company’s authorized and outstanding preferredshares amounted to P=1,500.0 million and P=1,306.6 million, respectively at P=0.10 par value per share.

- 71 -
*SGVFSM005262*
Common Shares (P=1.00 par value per share)On April 7, 2014, the stockholders resolved to approve the amendment of the Seventh Article of theArticles of Incorporation exempting from pre-emptive rights (1) the issuance of 1 billion commonshares for properties or assets needed for the business of the Parent Company or for cash to acquireproperties or assets needed for the business of the Parent Company or in payment of a debtcontracted prior to the issuance of such shares, and (2) the issuance of common shares covered bythe Parent Company’s Stock Option Plans for members of the management committees of the ParentCompany’s subsidiaries or affiliates.
Likewise, the stockholders resolved to approve the amendment of the Stock Option Plan of theParent Company to include the members of the Management Committees of the Parent Company’ssubsidiaries and affiliates as eligible grantees of stock options.
The rollforward analysis of the common shares follows:
Number of Shares Amount2020 2019 2020 2019
(In Thousands)Issued capital stock*
At beginning of year 14,632,062 14,614,387 P=14,632,062 P=14,614,387Issued shares 3,236 17,675 3,236 17,675At end of year 14,635,298 14,632,062 14,635,298 14,632,062
Subscribed capital stockAt beginning of year 113,273 120,494 113,273 120,494Issued shares (3,236) (17,675) (3,236) (17,675)Additional subscriptions 14,845 10,454 14,845 10,454At end of year 124,882 113,273 124,882 113,273
14,760,180 14,745,335 P=14,760,180 P=14,745,335*Out of the total issued shares, 29,785 shares or P=1,260,780 as of December 31, 2020 and 25,373 shares or P=1,104,353 as of December 31,2019 pertain to Treasury shares
No transfer of stock or interest which will reduce the ownership of Filipino citizens to less than therequired percentage of the capital stock as provided by existing laws shall be allowed or permitted tobe recorded in the books of the Parent Company.
The Parent Company’s track record of capital stock is as follows:
Type of Shares
Number ofshares
registeredIssue/
Offer priceDate of
approval
Number ofholders of
securities as of2020
Number ofholders of
securities as of2019
Class B shares 800,000,000
Par Value - P1.00/Issue Price
P26.00 April 18, 1991 8,985 9,009Class B shares 400,000,000 Par Value - P1.00* July 06, 1992Class A shares 900,000,000 Par Value - P1.00** July 05, 1993Class B shares 600,000,000 Par Value - P1.00** July 05, 1993Note: Class A Shares and Class B Shares were declassified into one type of Common Shares on September 12, 1997.*increase in authorized capital stock, registered to cover the shares held by the directors and 20% stock dividend amounting toP108,662,000.00**increase in authorized capital stock, registered to cover the 20% stock dividend amounting to P391,240,953.00
On January 9, 2015, the Executive Committee of the Parent Company approved a top-up placementof 484,848,500 common shares of the Parent Company at a price of P=33.00 per share. Theplacement was conducted via an accelerated bookbuilt offering structured as a top-up placement,whereby AC sold 484,848,500 listed common shares of stock to qualified third party buyers andsubscribe to the same number of new shares from the Parent Company. The Parent Companycompleted the placement on January 12, 2015, raising an aggregate of P=16,000.0 million in paid-upcapital. The price was at 3.9% discount on the 5-day volume-weighted average price of ALI shares.Transaction cost charged to additional paid-in capital amounted to P=194.0 million.

- 72 -
*SGVFSM005262*
On April 13, 2013, the stockholders resolved to approve the amendment of the Seventh Article of theCompany’s Articles of Incorporation for the purpose of excluding or exempting treasury shares fromthe pre-emptive rights of stockholders.
On March 6, 2013, the Parent Company’s Board resolved to approve the placement made by AC ofits existing 320,000,000 listed common shares of the Company to certain qualified third party buyersor investors at P=30.50 per share. The Parent Company completed the top-up placement, raising anaggregate of P=12,200.0 million in paid up capital. The price was at 3.6% discount on the 5-dayvolume-weighted average price of ALI shares. Transaction cost charged to additional paid-in capitalamounted to P=162.4 million.
On July 10, 2012, the Parent Company’s executive committee approved the placement of 680 millionlisted common shares of stock with par value of P=1.00 per share, at a price of P=20.00 per share, andthe issuance of equal number of new shares of the Parent Company, at the same price ofP=20.00 per share, with AC as the seller of the placement tranche and subscriber of the subscriptiontranche. The Parent Company completed the top-up placement, raising an aggregate of P=13,600million in paid up capital. The price was at 5.0% discount to the closing price. Transaction costcharged to additional paid-in capital amounted to P=200.0 million.
On April 2, 2008, the Parent Company’s stockholders approved the allotment and subsequentissuance of the shares for the above-mentioned purposes and for the further amendment of theAmended Articles of Incorporation of the Parent Company to exclude the issuance of shares from thepre-emptive rights of the stockholders pursuant to Section 39 of the Philippine Corporation Code.
On February 12, 2008, the BOD approved the allotment and subsequent issuance of up to 1 billioncommon shares of stock with an aggregate par value of P=1,000.0 million for the purpose ofexchanging such shares for properties or assets and/or to raise funds to acquire properties or assetsneeded for the business of the Parent Company via issuance of equity or equity-linked instruments,the price and the terms and conditions of which shall be determined by the BOD based on prevailingmarket conditions or on agreements negotiated.
On July 5, 1991, the Parent Company launched its initial public offering where a total of 400 millioncommon shares were offered at an offering price of P=26.00 per share. The registration statementwas approved on July 20, 1992. The Parent Company has 8,985 and 9,009 existing shareholders asof December 31, 2020 and 2019, respectively.
Treasury SharesOn February 28, March 11, March 12, and March 16, 2020, Ayala Land, Inc. purchased a total of4,412,000 common shares at an average price of P=35.67 per share for a total consideration ofP=156.4 million, pursuant to its share buyback program.
On February 21, 2020, the Board of Directors of Ayala Land, Inc. at its regular meeting approved theincrease of an additional P=25 billion to the Company’s current share buyback program bringing theavailable balance to P=26.1 billion. The program will be implemented through open market purchasesexecuted via the trading facilities of the Philippine Stock Exchange.
On March 5, 2019, the Parent Company purchased a total of 10,372,746 of its common shares atP=43.20 per share through open market purchases using the trading facilities of the Philippine StockExchange for a total purchase price of P=448.10 million in relation to its share buyback program. OnNovember 26, 2019, the Parent Company also acquired a total of 15,000,000 of its common sharesat P=43.75 per share for a total purchase price of P=656.25 million.
The amendment of the Articles of Incorporation on April 17, 2013 allowed the re-selling of the79,528,299 listed common shares as part of the top-up placement transaction completed inJuly 2013. Treasury common shares were sold at P=30.50 per share resulting to additional paid-incapital of P=1,601.6 million.
- 73 -
*SGVFSM005262*
On August 12, 2008, the BOD approved a share buyback program. It is part of the ParentCompany’s balance sheet management program and aims to (i) improve the Parent Company’sbalance sheet structure and capital efficiency and (ii) enhance shareholder value through therepurchase of shares whenever the stock is trading at a price discount perceived by the ParentCompany as not reflective of its fair corporate value.
In 2008, the Parent Company repurchased a total of 79,528,228 of its common shares through openmarket purchases using the trading facilities of the Philippine Stock Exchange for a total purchaseprice of P=823.9 million in relation to its share buyback program. These have been reported astreasury shares.
Retained EarningsThe BOD approved the declaration and payment from unappropriated retained earnings of cashdividends of P=0.27, P=0.52 and P=0.51 per share in 2020, 2019 and 2018, respectively, to all issuedand outstanding shares.
On February 20, 2020, the BOD during its meeting approved the declaration of cash dividends ofP=0.27 per outstanding common share. The cash dividend was paid on March 20, 2020 tostockholders of common shares as of record date March 6, 2020.
On May 26, 2020, the BOD during its meeting approved the declaration of cash dividends ofP=0.00474786 per outstanding preferred share. The cash dividend was paid on June 25, 2020 tostockholders of preferred shares as of record date June 9, 2020.
On February 27, 2019, the BOD approved the declaration of cash dividends amounting toP=0.26 per outstanding common share and was paid on March 29, 2019 to the shareholders on recordas of March 13, 2019.
On May 27, 2019, the BOD declared annual cash dividends of 4.7% per year or P=0.0047 per shareto all shareholders of the Parent Company’s unlisted voting preferred shares. These were paid onJune 21, 2019 to the shareholders on record as of June 7, 2019.
On October 31, 2019, the BOD approved the declaration of cash dividends amounting to P=0.26 peroutstanding common share and was paid on November 29, 2019 to the shareholders on record as ofNovember 15, 2019.
On February 20, 2018, the BOD approved the declaration of cash dividends amounting to P=0.252 peroutstanding common share and was paid out on April 3, 2018 to the shareholders on record as ofMarch 12, 2018. Further, on the same date, the BOD declared annual cash dividends of 4.8% peryear or P=0.0047 per share to all shareholders of the Parent Company’s unlisted voting preferredshares. These were paid on June 29, 2018 to the shareholders on record as of June 15, 2018.
On August 17, 2018, the BOD approved the declaration and payment from unappropriated retainedearnings of cash dividends of P=0.252 per share. The cash dividend was paid out onOctober 2, 2018 to stockholders of common shares on record as of September 6, 2018.
Total dividends for common shares declared for 2020, 2019 and 2018 amounted to P=3,944.6 million,P=7,659.5 million and P=7,423.9 million, respectively. Total dividends for preferred shares declared for2020, 2019 and 2018 amounted to P=62.0 million each year.
As of December 31, 2020 and 2019, retained earnings of P=8,000.0 million are appropriated for futureexpansion. The increase of P=2,000.0 million in 2016 represents a continuing appropriation for landbanking activities and planned building construction projects. Each year, the Parent Company incurscapital expenditures for property development which include among others land banking and buildingconstruction projects. The appropriation is being fully utilized to cover part of the annual expenditurerequirement of the Parent Company.
- 74 -
*SGVFSM005262*
The Parent Company has earmarked additional funds for expansion projects in the residential,shopping centers, office and hotel business segments, as well as various infrastructure projects forthe Parent Company’s mixed-use developments.
The following are among the major capital expenditures of the Parent Company which were approvedby the BOD:
a) Ayala Triangle Garden 2 with product offering for a Triple A HQ Office Building, a 5-Star Hoteland 3-level Retail Podium with gardens and civic spaces which was approved by the Board onMay 29, 2015. The project was launched in June 2015 and expected to be completed inApril 2021.
b) Ayala Center Redevelopment which will offer intermodal transport facility, a 5-storey regionalmall, 2 BPO towers, a SEDA hotel and a 300-units residential for lease was approved by theBoard on November 27, 2015. The project was launched in January 2016 and expected to becompleted in 2021.
Retained earnings also include undistributed net earnings amounting to P=92,123.69 million andP=92,044.45 million as of December 31, 2020 and 2019, respectively, representing accumulatedequity in the net earnings of subsidiaries, associates and joint ventures. These are not available fordividend distribution unless declared by subsidiaries and other investees.
In accordance with SEC Memorandum Circular No. 11 issued in December 2008, the ParentCompany’s retained earnings available for dividend declaration as of December 31, 2020 and 2019amounted to P=67.87 billion and P=58.1 billion, respectively.
Retained earnings are further restricted for the payment of dividends to the extent of the cost oftreasury shares.
Cumulative Translation AdjustmentThe cumulative translation adjustments represents exchange differences arising from the translationof financial statements of the foreign operations, whose functional currency is other than PhilippinePeso.
Equity ReservesOn August 13, 2020, ALI sold through a public listing its 49.0% effective noncontrolling interest inAREIT, Inc. at P=27.0 per share. Subsequently during a one-month stabilization process, BPI CapitalCorporation acquired a 3.4% interest in AREIT at an average price of P=26.0/share and redeliveredthis to ALI. As a result of the sale and buy-back transactions, ALI’s ownership interest in AREIT wasdiluted from 100.00% to 54.4%. In relation to the dilution without loss of control, the impact to ALI’snet equity reserve amounted to P=7,641.7 million. ALI’s non-controlling interest increased by P=4,701.7million, as a result of the public offering of AREIT Inc. The difference between the consideration andcarrying value of the non-controlling interest was credited to equity reserve as shown below:
2020
Considerationreceived
Carrying value ofNon-controlling
interests deemeddisposed
Differencerecognized withinEquity as Equity
Reserve(In Thousands)
45.6% in AREIT P=12,343,461 P=4,701,746 P=7,641,715
In September 2019, ALI purchased additional 648,177 shares of VPHI for P=799.4 million increasingthe Parent Company’s ownership to 78.41%.
On April 17, 2019 ALI acquired additional 14,913,200 common shares of CHI through open marketpurchases using the trading facilities of the Philippine Stock Exchange totaling P=88.7 million resultingin ALI’s ownership from 70.4% to 71.1%.

- 75 -
*SGVFSM005262*
On April 30, 2018, ALI and ALLHC executed a Deed of Exchange where ALI will subscribe to1,225,370,620 common shares of ALLHC for an aggregate subscription price of P=3.0 billion inexchange for 30,186 common shares of LTI. The subscription and exchange shall be subject to anddeemed effective only upon the issuance by the SEC of the confirmation of valuation of the shares.The SEC issued its approval on February 28, 2019. This increased ALI’s ownership to 69.50%. Thisresulted in an decrease in equity reserve amounting to P=664.9 million.
On February 4, 2019, The Executive Committee of Ayala Land, Inc. (ALI) approved the purchase of a20% equity interest owned by Mitsubishi Corporation in Laguna Technopark, Inc. (LTI), equivalent to8,051 common shares, with a total value of P=800 million. Subsequently, ALI will exchange the 20%equity interest in LTI for additional shares of stock in Prime Orion Philippines, Inc. (POPI), equivalentto 323,886,640 common shares, subject to conditions to be fulfilled by POPI. On May 10, 2019, PrimeOrion Philippines, Inc., changed its corporate name to Ayalaland Logistics Holdings Corp. (ALLHC).On June 10, 2019, ALI sold its 20% equity interest or 8,051 common shares in LTI to ALLHC for aconsideration of P=800 million resulting to increase in ALI’s ownership from 69.5% to 70.36%.
On September 9, 2019, OLI sold through a special block sale, 215,090,031 common shares ofALLHC to Avida Land Corporation, a wholly-owned subsidiary of ALI, for a total consideration ofP=628.1 million. Subsequently, these shares were acquired by ALI through a special block sale for atotal consideration of P=628.1 million. This resulted to ALI’s effective ownership in ALLHC from70.36% to 71.46%.
The transactions were accounted for as an equity transaction since there were no changes in control.The movements within equity are accounted for as follows:
2019
Consideration paid
Carrying value ofNon-controlling
interests acquired
Differencerecognized withinEquity as Equity
Reserve(In Thousands)
8.41% in VPHI P=799,420 P=68,916 P=730,5040.69% in CHI 88,734 73,977 14,7570.86% in ALLHC 800,000 825,447 (25,447)1.10% in ALLHC 628,100 1,033,335 (405,235)
P=2,316,254 P=2,001,675 P=314,579
In January 2018, ALI purchased additional 202,774,547 shares of ALLHC from Genez InvestmentCorporation for P=497.7 million increasing the Parent Company’s ownership from 62.9% to 67%.
In December 2018, ALI acquired 8,051 common shares of LTI for P=800.0 million increasing itsownership from 75% to 95%.
In 2018, ALI acquired additional 59,631,200 common shares of CHI totaling to P=352.8 million.Further, an additional 77,742,516 shares was acquired as a result of swap of CPVDC shares for atotal consideration of P=229.3 million which brings Parent Company’s ownership to 70.4%.
In March 2018, the Irredeemable Convertible Unsecured Loan Stock of Dato Sri Tong and Tan SriBarry Go, founders of MCT, were converted into 122,218,357 shares. This resulted in a 6.07%dilution of ALI’s stake in MCT as of date of share issuance. As such, the current ownership stake ofALI in MCT is 66.25%. This resulted in an increase in Equity reserve amounting to P=1,044.5 million.
The transactions were accounted for as an equity transaction since there were no changes in control.

- 76 -
*SGVFSM005262*
The movements within equity are accounted for as follows:
2018
Considerationpaid
Carrying value ofNon-controlling
interests acquired
Differencerecognized withinEquity as Equity
Reserve(In Thousands)
4.14% in ALLHC P=497,652 P=315,951 P=181,70120.00% in LTI 800,000 528,295 271,7051.53% net reduction in CHI 582,106 826,752 (244,646)
P=1,879,758 P=1,670,998 P=208,760
In 2017, ALI purchased additional 97,763,900 common shares of CHI from BPI SecuritiesCorporation totaling P=575.0 million which increased the Company’s ownership to 72% of the totaloutstanding capital stock of CHI.
In February 2017, ALI purchased additional 631,000 common shares of ALLHC from BPI SecuritiesCorporation for P=1.26 million. ALI’s interest remains at 51% of the total ALLHC’s outstanding capitalstock.
In June 2017, Orion Land, Inc. (OLI), a subsidiary of ALLHC, acquired 512,480,671 common sharesequivalent to 11.69% ownership at P=2.45 share amounting to P=1,255.58 million. The acquisition ofALLHC shares by OLI was treated as an acquisition of non-controlling interest resulting to a debit toequity reserve of P=405.18 million. This increased ALI’s effective ownership from 51.36% to 63.05%.
The transactions were accounted for as an equity transaction since there were no change in control.The movements within equity are accounted for as follows:
Considerationpaid
Carrying value ofNon-controlling
interests acquired
Differencerecognized withinEquity as Equity
Reserve(In Thousands)
5.09% in CHI P=574,994 P=394,907 P=180,08711.69% in ALLHC 1,258,579 852,656 405,923
P=1,833,573 P=1,247,563 P=586,010
In August 2017, AHRC entered into a memorandum of agreement with Sicogon DevelopmentCorporation (SIDECO) and an individual to develop Sicogon Island into a new leisure destination. Theinvestment of SIDECO and an individual to SITEC changed the ownership interest of AHRC in SITECfrom 100% to 77% without a loss of control. The difference between the amount by which non-controlling interest of 23% are adjusted and the fair value of consideration paid is recognized directlyto equity amounting to P=134.1 million.
Below are several acquisitions of shares in existing subsdiaries in 2013 up to 2016 that resulted toequity reserves. Details follow:
Consideration paid
Carrying value ofNon-controlling
interests acquired
Difference recognizedwithin Equity
as Equity Reserve(In Thousands)
201610.5% in CHI P=1,209,784 P=748,746 P=461,03820156.7% in CHI P=649,927 P=434,074 P=215,8539.4% in NTDCC 778,356 174,770 603,5861.9% in API 58,157 45,540 12,617
P=1,486,440 P=654,384 P=832,056
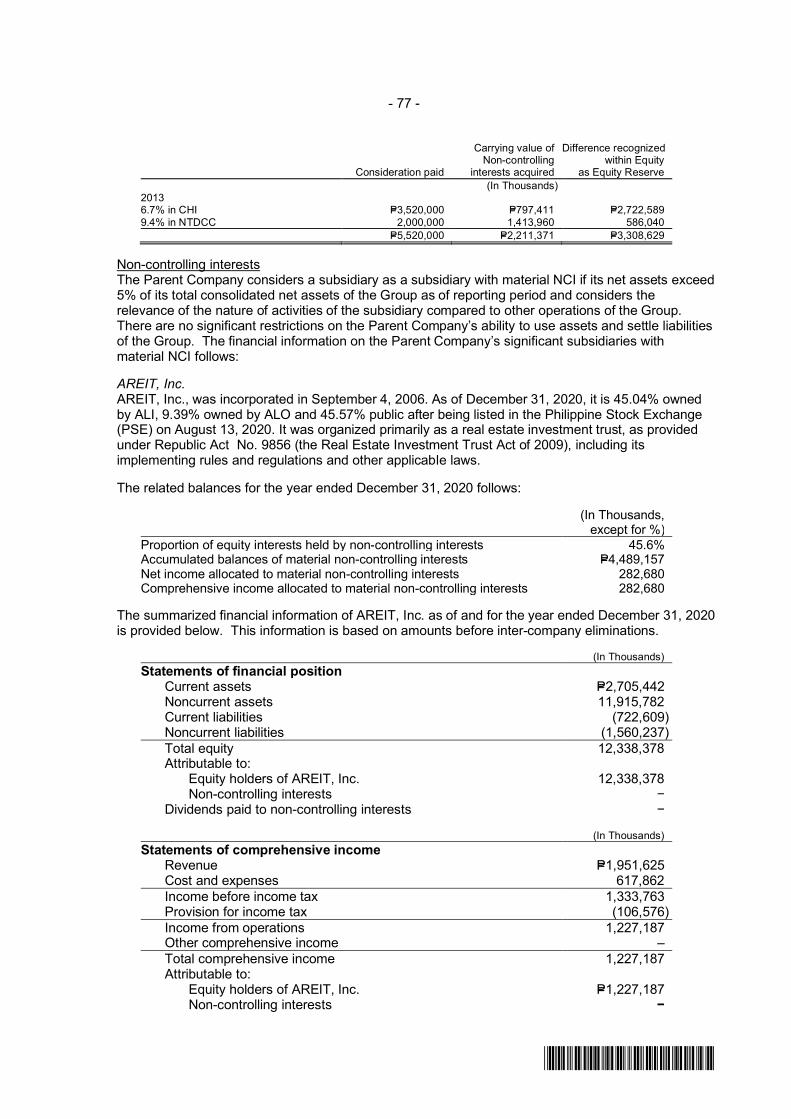
- 77 -
*SGVFSM005262*
Consideration paid
Carrying value ofNon-controlling
interests acquired
Difference recognizedwithin Equity
as Equity Reserve(In Thousands)
20136.7% in CHI P=3,520,000 P=797,411 P=2,722,5899.4% in NTDCC 2,000,000 1,413,960 586,040
P=5,520,000 P=2,211,371 P=3,308,629
Non-controlling interestsThe Parent Company considers a subsidiary as a subsidiary with material NCI if its net assets exceed5% of its total consolidated net assets of the Group as of reporting period and considers therelevance of the nature of activities of the subsidiary compared to other operations of the Group.There are no significant restrictions on the Parent Company’s ability to use assets and settle liabilitiesof the Group. The financial information on the Parent Company’s significant subsidiaries withmaterial NCI follows:
AREIT, Inc.AREIT, Inc., was incorporated in September 4, 2006. As of December 31, 2020, it is 45.04% ownedby ALI, 9.39% owned by ALO and 45.57% public after being listed in the Philippine Stock Exchange(PSE) on August 13, 2020. It was organized primarily as a real estate investment trust, as providedunder Republic Act No. 9856 (the Real Estate Investment Trust Act of 2009), including itsimplementing rules and regulations and other applicable laws.
The related balances for the year ended December 31, 2020 follows:
(In Thousands,except for %)
Proportion of equity interests held by non-controlling interests 45.6%Accumulated balances of material non-controlling interests P=4,489,157Net income allocated to material non-controlling interests 282,680Comprehensive income allocated to material non-controlling interests 282,680
The summarized financial information of AREIT, Inc. as of and for the year ended December 31, 2020is provided below. This information is based on amounts before inter-company eliminations.
(In Thousands)Statements of financial position Current assets P=2,705,442 Noncurrent assets 11,915,782 Current liabilities (722,609) Noncurrent liabilities (1,560,237) Total equity 12,338,378 Attributable to: Equity holders of AREIT, Inc. 12,338,378 Non-controlling interests − Dividends paid to non-controlling interests −
(In Thousands)Statements of comprehensive income Revenue P=1,951,625 Cost and expenses 617,862 Income before income tax 1,333,763 Provision for income tax (106,576) Income from operations 1,227,187 Other comprehensive income ‒ Total comprehensive income 1,227,187 Attributable to: Equity holders of AREIT, Inc. P=1,227,187 Non-controlling interests −

- 78 -
*SGVFSM005262*
(In Thousands)Statements of cash flows Operating activities P=1,475,827 Investing activities (1,849,491) Financing activities 310,461Net increase in cash and cash equivalents (P=63,203)
The fair value of the investment in AREIT, Inc. amounted to P=12,526.4 million as ofDecember 31, 2020.
CHI and SubsidiariesCHI, a publicly-listed company, was incorporated in the Republic of the Philippines. It is engaged inreal estate development, sale of subdivided land, residential and office condominium units, sportsclub shares, and lease of commercial spaces. The registered office address of CHI is at 20F ACCTower, Bohol St., Cebu Business Park, Cebu City, Philippines.
2020 2019(In Thousands, except for %)
Proportion of equity interests held by non-controllinginterests 28.9% 28.9%
Accumulated balances of material non-controlling interests P=2,528,941 P=2,315,716Net income allocated to material non-controlling interests 201,523 478,743Comprehensive income allocated to material non-
controlling interests 201,523 478,743
The summarized financial information of CHI is provided below. This information is based onamounts before inter-company eliminations.
2020 2019(In Thousands)
Statements of financial position Current assets P=4,154,937 P=4,295,804 Noncurrent assets 24,894,482 24,946,742 Current liabilities (14,911,598) (10,240,011) Noncurrent liabilities (1,661,300) (6,877,676) Total equity 12,476,521 12,124,859 Attributable to: Equity holders of CHI 9,744,862 9,401,730 Non-controlling interests 2,731,659 2,723,129 Dividends paid to non-controlling interests − −
For the years ended December 312020 2019
(In Thousands)Statements of comprehensive income Revenue P=2,933,252 P=4,797,053 Cost and expenses (2,506,461) (2,631,960) Income before income tax 426,791 2,165,093 Provision for income tax (26,374) (495,612) Income from operations 400,417 1,669,481 Other comprehensive (loss) income (48,755) 5,266 Total comprehensive income 351,662 1,674,747 Attributable to: Equity holders of CHI P=343,132 P=1,662,834 Non-controlling interests 8,530 11,913

- 79 -
*SGVFSM005262*
For the years ended December 312020 2019
(In Thousands)Statements of cash flows Operating activities P=1,170,848 P=2,559,418 Investing activities (1,220,472) (2,800,650) Financing activities (78,000) 329,653
Effect of exchange rate changes (337) 207Net increase in cash and cash equivalents (P=127,961) P=88,628
The fair value of the investment in CHI amounted to P=9,050.7 million and P=9,971.1 million as ofDecember 31, 2020 and 2019, respectively.
ALLHC and SubsidiariesALLHC was incorporated in the Republic of the Philippines. It is engaged in real estate and propertydevelopment, manufacturing and retailing/distribution, non-life insurance and other allied services,organized under a number of intermediate holding companies. The Company wholly owns TutubanProperties, Inc., which holds the lease and development rights over Tutuban Center in downtownDivisoria.
2020 2019(In Thousands, except for %)
Proportion of equity interests held by non-controllinginterests 29.1% 29.1%
Accumulated balances of material non-controllinginterests P=4,192,761 P=3,924,400
Net income allocated to material non-controllinginterests 178,995 215,944
Comprehensive income allocated to material non-controlling interests 178,995 215,944
The summarized financial information of ALLHC is provided below. This information is based onamounts before inter-company eliminations (In Thousands).
December 31,2020
December 31,2019
Statements of financial position Current assets P=6,652,483 P=6,661,508 Noncurrent assets 12,768,607 12,684,534 Current liabilities (5,053,355) (5,542,833) Noncurrent liabilities (2,526,349) (2,625,391) Total equity 11,841,386 11,177,818 Attributable to: Equity holders of ALLHC P=11,564,113 P=11,056,221 Non-controlling interests 138,637 121,597 Dividends paid to non-controlling interests ‒ −
For the years ended December 312020 2019
Statements of comprehensive income Revenue P=3,751,070 P=5,345,981 Cost and expenses (2,915,978) (4,584,689) Income before income tax 835,092 761,292 Provision for income tax (133,079) (119,873) Income from operations 702,013 641,419 Other comprehensive income ‒ − Total comprehensive income 702,013 641,419

- 80 -
*SGVFSM005262*
For the years ended December 312020 2019
Attributable to: Equity holders of ALLHC P=680,864 P=595,838 Non-controlling interests 21,149 45,581
Statements of cash flows Operating activities P=744,162 P=546,946 Investing activities (883,705) (2,919,486) Financing activities 139,194 2,311,988Net decrease in cash and cash equivalents (P=349) (P=60,552)
The fair value of the investment in ALLHC amounted to P=15,190.4 million and P=13,135.2 million as ofDecember 31, 2020 and 2019, respectively.
Capital ManagementThe primary objective of the Group’s capital management policy is to ensure that debt and equitycapital are mobilized efficiently to support business objectives and maximize shareholder value. TheGroup establishes the appropriate capital structure for each business line that properly reflects itspremier credit rating and allows it the financial flexibility, while providing it sufficient cushion to absorbcyclical industry risks.
The Group considers debt as a stable source of funding. The Group lengthened the maturity profileof its debt portfolio and makes it a point to spread out its debt maturities by not having a significantpercentage of its total debt maturing in a single year.
The Group manages its capital structure and makes adjustments to it, in the light of changes ineconomic conditions. It monitors capital using leverage ratios on both a gross debt and net debtbasis. As of December 31, 2020 and 2019, the Group had the following ratios:
2020 2019Debt to equity 0.81:1 0.87:1Net debt to equity 0.74:1 0.78:1
Debt consists of short-term and long-term debts. Net debt includes short-term and long-term debtless cash and cash equivalents, short-term investments and financial assets at FVPL. Equity, whichthe Group considers as capital, pertains to the total equity. The Group excludes the “Fair valuereserve of financial assets at FVOCI” attributable to the equity holders of the Company in computingthe debt to equity ratio.
The Group is subject to externally imposed capital requirements due to loan covenants (see Note 16).No changes were made in the objectives, policies or processes for managing capital during the yearsended December 31, 2020 and 2019.
Financial risk assessmentThe Group’s financial condition and operating results would not be materially affected by the currentchanges in interest, currency, credit, liquidity and market conditions.
Exposure to changes in interest rates is reduced by a debt portfolio mix of both fixed and floatinginterest rates. The Group’s ratio of fixed to floating rate debt stood at 95:5 and 90:10 as ofDecember 31, 2020 and 2019, respectively. As a result, any adverse movement in interest rates ismitigated.
Exposure to foreign currency holdings is at MYR193.7 million and US$18.0 million as ofDecember 31, 2020, and MYR278.4 million and US$8.3 million as of December 31, 2019,respectively.

- 81 -
*SGVFSM005262*
Credit risks continue to be managed through defined credit policies and continuing monitoring ofexposure to credit risks. The Group’s base of counterparties remains diverse. As such, it is notexposed to large concentration of credit risk.
Liquidity risk is addressed with long term funding already locked in, while funds are placed on cashequivalents, short term investment and financial assets at FVTPL.
20. Revenue
This account consists of:
2020 2019 2018(In Thousand)
Revenue from contracts withcustomers
Residential development P=66,461,372 P=117,580,972 P=120,396,794Hotels and resorts 3,388,190 7,624,159 6,386,896Construction 3,278,557 3,394,744 2,393,683Others 2,971,238 5,452,595 5,297,101
Rental income (Notes 12 and 33) 18,468,871 31,687,075 28,522,420Equity in net earnings of associates
and joint venture 586,502 965,787 749,924Total Revenue P=95,154,730 P=166,705,332 P=163,746,818
The Group derives revenue from the transfer of goods and services over time and at a point in time indifferent product types. The Group’s disaggregation of each sources of revenue from contracts withcustomers are presented below:
Residential development2020 2019 2018
(In thousands)Type of ProductMiddle income housing P=21,239,940 P=36,023,183 P=35,046,620Coremid 20,445,730 34,813,550 33,694,884Condominium 18,231,721 29,326,334 33,401,701Lot only 6,543,981 17,417,905 18,253,589
P=66,461,372 P=117,580,972 P=120,396,794
All of the Group’s real estate sales from residential development are revenue from contracts withcustomers recognized over time.
Hotels and resorts2020 2019 2018
(In thousands)Type of ProductRooms P=1,775,632 P=4,447,172 P=3,909,395Food and beverage 731,812 2,090,953 2,116,548Others 273,424 324,322 296,049Other operated department 607,322 761,712 64,904
P=3,388,190 P=7,624,159 P=6,386,896
The Group’s revenue from hotels and resorts is attributed to the operations from the development andmanagement of hotels and resorts/serviced apartments. In view of the continuing communityquarantines and restricted travel, the Group’s hotels and resorts segment continues to be adverselyaffected by the lower number of guests and reduced room rates, both of which have significantlyimpacted the revenues reported under this segment. Also, many restaurants remain closed orallowed limited operations which impacted the food and beverage revenues of the segment.

- 82 -
*SGVFSM005262*
The Group’s construction revenue pertains to transactions with related parties such as joint venturesand associates.
Others are mainly composed of property management facilities of the Group and third party projects.
In line with the rental relief framework implemented by the government to support businesses and thebroader economy due to the impact of COVID-19, the Group waived its right to collect rent and othercharges as part of various lease concessions it granted to lessees such as lease payment holidays orlease payment reductions. Rent discounts and concessions given vary for merchants that are (1)forced to close and those that are still (2) operational. Rental fees and common charges of merchantswho were forced to close during the quarantine period were waived with 50% discount in theircommon area usage expenses.
Set-out below is the reconciliation of contracts with customers with the amounts disclosed in segmentinformation (in millions):
2020
ResidentialDevelopment International Construction
Hotelsand Reosrts
PropertyManagement
and Others TotalSales to external
customer P=53,014 P=4,845 P=3,279 P=3,388 P=2,971 P=67,497Interest 8,603 − − − − 8,603Total revenue from
contracts withcustomers P=61,617 P=4,845 P=3,279 P=3,388 P=2,971 P=76,100
2019
ResidentialDevelopment International Construction
Hotelsand Reosrts
PropertyManagement
and Others TotalSales to external
customer P=102,981 P=6,709 P=3,395 P=7,624 P=5,453 P=126,162Interest 7,891 − − − − 7,891Total revenue from
contracts withcustomers P=110,872 P=6,709 P=3,395 P=7,624 P=5,453 P=134,053
2018
ResidentialDevelopment International Construction
Hotelsand Reosrts
PropertyManagement
and Others TotalSales to external
customer P=105,752 P=7,602P=2,394 P=6,387
P=238 P=122,373Interest 7,042 − − − − 7,042Total revenue from
contracts withcustomers P=112,794 P=7,602 P=2,394 P=6,387 P=238 P=129,415
21. Interest and Investment Income and Other Income
Interest and investment income consists of:
2020 2019 2018(In Thousands)
Interest income from banks P=293,354 P=724,817 P=657,920Interest income from advances to
officers/employees and othercompanies 75,160 164,531 252,630
(Forward)

- 83 -
*SGVFSM005262*
2020 2019 2018(In Thousands)
Gain on sale of equipment and otherproperties P=23,265 P=40,870 P=46,570
Gain on sale of investments – – 588Others 2,922 227 528
P=394,701 P=930,445 P=958,236
Other income consists of:
2020 2019 2018(In Thousands)
Marketing and management fees P=219,937 P=297,423 P=477,967Others - net (Note 24) 503,331 860,512 1,062,750
P=723,268 P=1,157,935 P=1,540,717
Other income mainly consists of gain on business combination, realized and unrealized gain onfinancial asset at FVTPL, financial impact of net foreign exchange transactions and gain fromdisposal of subsidiary.
22. Costs and Expenses and Other Charges
Real estate costs and expenses consist of:
2020 2019 2018(In Thousands)
Cost of real estate sales (Note 8) P=32,916,227 P=59,353,001 P=67,784,088Depreciation and amortization 7,651,383 7,419,920 4,858,275Hotels and resorts operations 2,990,397 3,001,616 3,030,787Manpower costs 1,925,639 2,046,960 1,800,424Marketing and management fees 1,274,861 4,678,323 5,165,668Rental 863,622 483,645 3,960,419Materials and overhead 43,759 999,999 1,341,224Direct operating expenses: Taxes and licenses 4,078,001 3,665,445 2,873,125 Commission 1,912,056 3,946,907 2,124,226 Repairs and maintenance 1,663,775 2,213,593 1,582,239 Light and water 439,464 3,934,328 4,440,156 Professional fees 245,787 199,848 172,226 Insurance 213,150 204,256 271,700 Transportation and travel 67,353 161,113 170,781 Entertainment, amusement
and recreation 14,756 25,971 28,243 Others 372,954 2,417,014 1,475,549
P=56,673,184 P=94,751,939 P=101,079,130

- 84 -
*SGVFSM005262*
General and administrative expenses consist of:
2020 2019 2018(In Thousands)
Manpower costs (Notes 26 and 28) P=4,166,178 P=4,719,739 P=4,685,180Taxes and licenses 1,096,167 1,115,766 818,797Depreciation and amortization 945,283 825,766 640,608Security and Janitorial 274,754 691,011 603,404Professional fees 419,557 386,146 744,679Utilities 266,391 340,805 324,402Repairs and maintenance 332,586 324,277 304,003Rent 10,642 100,295 195,669Transport and travel 46,996 96,894 106,366Dues and fees 52,251 90,733 61,447Supplies 44,393 70,795 64,550Advertising 42,970 69,163 103,423Donations and contribution 57,628 53,482 76,059Training and seminars 14,357 46,776 79,023Entertainment, amusement and
recreation 26,047 38,203 41,970Insurance 37,306 23,917 74,139Others 178,307 373,591 177,609
P=8,011,813 P=9,367,359 P=9,101,328
Manpower costs included in the consolidated statements of income follows:
2020 2019 2018(In Thousands)
Real estate costs and expensesCost of real estate P=1,761,580 P=1,784,450 P=1,534,290Hotels and resorts operations 164,059 262,510 266,134
General and administrative expenses 4,166,178 4,719,739 4,685,180P=6,091,817 P=6,766,699 P=6,485,604
Depreciation and amortization expense included in the consolidated statements of income follows:
2020 2019 2018(In Thousands)
Real estate costs and expenses: Cost of real estate P=7,651,383 P=7,419,920 P=4,858,275 Hotels and resorts operations 975,906 813,024 633,563General and administrative expenses 945,283 825,766 640,608
P=9,572,572 P=9,058,710 P=6,132,446
Other expenses consist of:
2020 2019 2018(In Thousands)
Financial expenses and othercharges (Note 7) P=2,810,922 P=1,076,207 P=1,123,307
Net provision for (reversals of)impairment losses on:
Receivables (Note 7) 752,641 568,775 146,974 Investment properties (Note 12) 225,208 − −
P=3,788,771 P=1,644,982 P=1,270,281

- 85 -
*SGVFSM005262*
Interest and other financing charges consist of:
2020 2019 2018(In Thousands)
Interest expense on: Long-term debt P=9,705,852 P=9,153,067 P=7,259,118 Short-term debt 1,164,767 1,206,577 1,668,340
Lease liabilities (Note 33) 1,430,607 1,066,543 −Other financing charges 444,494 773,571 666,545
P=12,745,720 P=12,199,758 P=9,594,003
23. Income Tax
Net deferred tax assets:
2020 2019(In Thousands)
Deferred tax assets on: Difference between tax and book basis of
accounting for real estate transactions P=8,678,138 P=9,148,055Lease liabilities 3,628,273 3,681,191
Accrued expenses 1,131,316 524,891 Allowance for probable losses 792,783 667,194 NOLCO 336,510 14,853 Retirement benefits 144,837 505,768
Unrealized foreign exchange losses 105,275 − Others 417,950 385,883
15,235,082 14,927,835Deferred tax liabilities on:
Right-of-use assets (2,491,661) (2,862,294) Capitalized interest and other expenses (436,181) (485,077)
Unrealized foreign exchange gains (119,900) (45,027) Others (65,825) (7,792)
(3,113,567) (3,400,190)P=12,121,515 P=11,527,645
Net deferred tax liabilities:
2020 2019(In Thousands)
Deferred tax assets on:Lease liabilities P=535,218 P=555,071Difference between tax and book basis of accounting for real estate transactions 301,965 P=92,021Accrued expense 110,114 184,672
NOLCO 72,669 3,871 Allowance for probable losses 54,074 51,820 Unrealized foreign exchange loss 6,502 11,664 Others 315,267 192,762
1,395,809 1,091,881
(Forward)

- 86 -
*SGVFSM005262*
2020 2019(In Thousands)
Deferred tax liabilities on: Fair value adjustment arising from business
combination (P=3,912,586) (P=3,904,145) Difference between tax and book basis of
accounting for real estate transactions (3,648,480) (2,018,940)Right-of-use assets (616,339) (462,684)
Capitalized interest and other expenses (106,013) (297,873) Retirement benefits (23,631) (27,480) Prepaid expenses (5,357) − Unrealized foreign exchange gain − (3,047)
Insurance recovery − (98,244) Others (231,937) (370,222)
(8,544,343) (7,182,635)(P=7,148,534) (P=6,090,754)
As of December 31, 2020 and 2019 deferred tax liabilities have not been recognized on theundistributed earnings and cumulative translation adjustment of foreign subsidiaries since the timingof the reversal of the temporary difference can be controlled by the Group and management does notexpect the reversal of the temporary differences in the foreseeable future.
Certain subsidiaries of the Parent Company have NOLCO amounting to P=1,681.7 million andP=2,244.6 million as of December 31, 2020 and 2019, respectively, and MCIT amounting toP=142.7 million and P=152.0 million as of December 31, 2020 and 2019, respectively. Deferred taxassets are recognized only to the extent that taxable income will be available against which thedeferred tax assets can be used. As of December 31, 2020 and 2019, total unrecognized NOLCOamounted to P=317.7 million and P=2,182.2 million, respectively. As of December 31, 2020 and 2019,total unrecognized MCIT amounted to P=126.4 million and P=150.9 million, respectively. Thesubsidiaries will recognize a previously unrecognized deferred tax asset to the extent that it hasbecome probable that future taxable income will allow the deferred tax asset to be recovered.
On September 30, 2020, the BIR issued Revenue Regulations No. 25-2020 implementing Section4(bbbb) of “Bayanihan to Recover As One Act” which states that the NOLCO incurred for taxableyears 2020 and 2021 can be carried over and claimed as a deduction from gross income for the nextfive (5) consecutive taxable years immediately following the year of such loss.
As of December 31, 2020, the Group has incurred NOLCO which can be claimed as deduction fromthe regular taxable income for the next three (3) consecutive taxable years, as follows:
Year Incurred Amount Used/Expired Balance Expiry Year(In Thousands)
2017 P=666,258 P=666,258 P=− 20202018 990,792 − 990,792 20212019 587,561 − 587,561 2022
P=2,244,611 P=666,258 P=1,578,353
As of December 31, 2020, the Group has incurred NOLCO in taxable year 2020 which can beclaimed as deduction from the regular taxable income for the next five (5) consecutive taxable yearspursuant to the Bayanihan to Recover As One Act, as follows:
Year Incurred Amount Used/Expired Balance Expiry Year(In Thousands)
2020 P=103,323 P=− P=103,323 2025

- 87 -
*SGVFSM005262*
The carryover MCIT that can be used as deductions against income tax liabilities is as follows:
Year Incurred Amount Used/Expired Balance Expiry Year(In Thousands)
2017 P=16,332 P=16,332 P=− 20202018 130,127 − 130,127 20212019 5,576 − 5,576 20222020 6,992 − 6,992 2023
P=159,027 P=16,332 P=142,695
Reconciliation between the statutory and the effective income tax rates follows:
2020 2019 2018Statutory income tax rate 30.00% 30.00% 30.00%Tax effect of: Equity in net earnings of associates and joint
ventures (3.90) (1.90) (1.66)Income under tax holiday and other nontaxable
income (0.88) (0.96) (0.92) Interest income and capital gains taxed at lower
rates (0.25) (0.53) (0.30) Others - net 1.99 (0.42) (0.60)Effective income tax rate 26.96% 26.19% 26.51%
Deferred tax related to remeasurement gain on defined benefit plans recognized in OCI amounted toP=252.5 million and P=50.3 million in 2020 and 2019, respectively.
Republic Act (RA) No.10963 or the Tax Reform for Acceleration and Inclusion Act (TRAIN) wassigned into law on December 19, 2017 and took effect January 1, 2018, making the new tax lawenacted as of the reporting date. Although the TRAIN changes existing tax law and includes severalprovisions that will generally affect businesses on a prospective basis, the management assessedthat the same will not have any significant impact on the financial statement balances as of thereporting date.
Corporate Recovery and Tax Incentives for Enterprises Act” or “CREATE”On February 1, 2021, the Bicameral Conference Committee, under the 18th Congress of thePhilippines, approved the reconciled version of the House Bill No. 4157 and Senate Bill No.1357 (theCREATE). The general features of the CREATE bill are the following: Reduction in current income tax rate effective July 1, 2020; Proprietary educational institutions and hospitals which are nonprofit previously subject to a tax of
10% on their taxable income, shall be imposed a tax rate of 1% beginning July 1, 2020 until June30, 2023;
Increased threshold on sale of real estate properties that is exempt from VAT; Regional operating headquarters of multinational companies previously subject to a tax of 10%
on their taxable shall be subject to the regular corporate income tax effective December 31, 2020;and
Effective July 1, 2020 until June 30,2023, the MCIT rate shall be one percent 1%.
As at February 23, 2021, the harmonized copy of the CREATE bill has been transmitted to the Officeof the President for signing or approval into law.
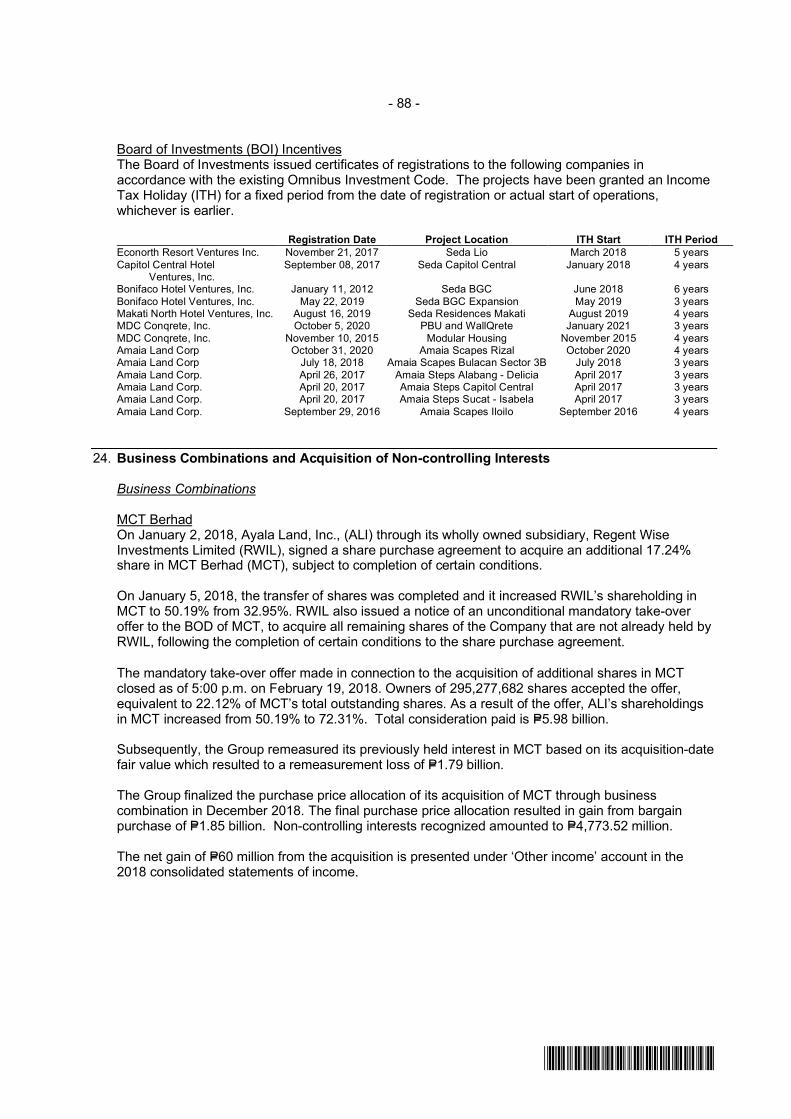
- 88 -
*SGVFSM005262*
Board of Investments (BOI) IncentivesThe Board of Investments issued certificates of registrations to the following companies inaccordance with the existing Omnibus Investment Code. The projects have been granted an IncomeTax Holiday (ITH) for a fixed period from the date of registration or actual start of operations,whichever is earlier.
Registration Date Project Location ITH Start ITH PeriodEconorth Resort Ventures Inc. November 21, 2017 Seda Lio March 2018 5 yearsCapitol Central Hotel Ventures, Inc.
September 08, 2017 Seda Capitol Central January 2018 4 years
Bonifaco Hotel Ventures, Inc. January 11, 2012 Seda BGC June 2018 6 yearsBonifaco Hotel Ventures, Inc. May 22, 2019 Seda BGC Expansion May 2019 3 yearsMakati North Hotel Ventures, Inc. August 16, 2019 Seda Residences Makati August 2019 4 yearsMDC Conqrete, Inc. October 5, 2020 PBU and WallQrete January 2021 3 yearsMDC Conqrete, Inc. November 10, 2015 Modular Housing November 2015 4 yearsAmaia Land Corp October 31, 2020 Amaia Scapes Rizal October 2020 4 yearsAmaia Land Corp July 18, 2018 Amaia Scapes Bulacan Sector 3B July 2018 3 yearsAmaia Land Corp. April 26, 2017 Amaia Steps Alabang - Delicia April 2017 3 yearsAmaia Land Corp. April 20, 2017 Amaia Steps Capitol Central April 2017 3 yearsAmaia Land Corp. April 20, 2017 Amaia Steps Sucat - Isabela April 2017 3 yearsAmaia Land Corp. September 29, 2016 Amaia Scapes Iloilo September 2016 4 years
24. Business Combinations and Acquisition of Non-controlling Interests
Business Combinations
MCT BerhadOn January 2, 2018, Ayala Land, Inc., (ALI) through its wholly owned subsidiary, Regent WiseInvestments Limited (RWIL), signed a share purchase agreement to acquire an additional 17.24%share in MCT Berhad (MCT), subject to completion of certain conditions.
On January 5, 2018, the transfer of shares was completed and it increased RWIL’s shareholding inMCT to 50.19% from 32.95%. RWIL also issued a notice of an unconditional mandatory take-overoffer to the BOD of MCT, to acquire all remaining shares of the Company that are not already held byRWIL, following the completion of certain conditions to the share purchase agreement.
The mandatory take-over offer made in connection to the acquisition of additional shares in MCTclosed as of 5:00 p.m. on February 19, 2018. Owners of 295,277,682 shares accepted the offer,equivalent to 22.12% of MCT’s total outstanding shares. As a result of the offer, ALI’s shareholdingsin MCT increased from 50.19% to 72.31%. Total consideration paid is P=5.98 billion.
Subsequently, the Group remeasured its previously held interest in MCT based on its acquisition-datefair value which resulted to a remeasurement loss of P=1.79 billion.
The Group finalized the purchase price allocation of its acquisition of MCT through businesscombination in December 2018. The final purchase price allocation resulted in gain from bargainpurchase of P=1.85 billion. Non-controlling interests recognized amounted to P=4,773.52 million.
The net gain of P=60 million from the acquisition is presented under ‘Other income’ account in the2018 consolidated statements of income.

- 89 -
*SGVFSM005262*
The following are the fair values of the identifiable assets and liabilities assumed (in thousands):
AssetsCash and cash equivalents P=1,078,224Trade and other receivables 2,833,560Inventories 13,620,873Investment properties 5,712,635Property, plant and equipment 4,599,423Other noncurrent assets 69,222
27,913,937LiabilitiesAccounts and other payables P=5,506,336Borrowings 2,752,114Income tax payable 128,551Deferred tax liabilities 2,287,772
10,674,773Net assets 17,239,164Total net assets acquired 12,465,640Acquisition cost (10,611,567)Negative goodwill P=1,854,073
The fair value of the trade and other receivables approximate their carrying amounts since these areshort-term in nature. None of the trade receivables have been impaired and it is expected that the fullcontractual amounts can be collected.
From January 8 to December 31, 2018, the Group’s share in MCT’s revenue and net incomeamounted to P=7.6 billion and P=1.3 billion.
Acquisition of Non-controlling Interests
Ayala Land Logistics Holdings Corp. (ALLHC)On April 30, 2018, ALI and ALLHC executed a Deed of Exchange where ALI will subscribe to1,225,370,620 common shares of ALLHC for an aggregate subscription price of P=3.0 billion inexchange for 30,186 common shares of LTI. The subscription and exchange shall be subject to anddeemed effective only upon the issuance by the SEC of the confirmation of valuation of the shares.The SEC issued its approval on February 28, 2019. This increased ALI’s ownership to 69.50%.
On February 4, 2019, The Executive Committee of ALI approved the purchase of a 20% equityinterest owned by Mitsubishi Corporation in LTI, equivalent to 8,051 common shares, with a totalvalue of P=800.0 million. Subsequently, ALI will exchange the 20% equity interest in LTI for additionalshares of stock in ALLHC, equivalent to 323,886,640 common shares, subject to conditions to befulfilled by ALLHC.
On June 10, 2019, ALI sold its 20% equity interest or 8,051 common shares in LTI to ALLHC for aconsideration of P=800.0 million. This increased ALI’s ownership to 70.36%.
On September 9, 2019, OLI sold through a special block sale, 215,090,031 common shares ofALLHC to Avida Land Corporation, a wholly-owned subsidiary of ALI, for a total consideration ofP=628.1 million. Subsequently, these shares were acquired by ALI through a special block sale for atotal consideration of P=628.1 million. This increased ALI’s effective ownership in ALLHC from 70.36%to 71.46%.
Cebu Holdings, Inc. (CHI)On April 17, 2019 ALI acquired additional 14,913,200 common shares of CHI through open marketpurchases using the trading facilities of the Philippine Stock Exchange totaling P88.7 million resultingin ALI’s ownership from 70.4% to 71.1%.

- 90 -
*SGVFSM005262*
25. Related Party Transactions
Parties are considered to be related if one party has the ability, directly or indirectly, to control theother party or exercise significant influence over the other party in making financial and operatingdecisions. Parties are also considered to be related if they are subject to common control or commonsignificant influence which include affiliates.
In its regular conduct of business, the Group has entered into transactions with its parent company,associates and other related parties principally consisting of advances and reimbursement ofexpenses, purchase and sale of real estate properties, construction contracts, development,management, underwriting, marketing, leasing and administrative service agreements.
Terms and Conditions of Transactions with Related PartiesTransactions with related parties are made at normal market prices. Outstanding balances at yearend are unsecured, interest free and settlement occurs generally in cash, except otherwise indicated.There have been no guarantees provided or received for any related party receivables or payables.The Group does not provide any allowance relating to receivable from related parties.
This assessment is undertaken each financial year through examining the financial position of therelated parties and the markets in which the related parties operate.
The following tables provide the total amount of transactions that have been entered into with relatedparties for the relevant financial year (in thousands):
a. Transactions with Bank of the Philippine Islands (BPI), an associate of Ayala Corporation (AC)
Cash and cash equivalents earn interest from 2.5% to 6.0% per annum for Philippine Peso-denominated and 1.0% to 3.0% per annum for USD-denominated investments. Investment inFVPL are UITF which earns interest depending on the duration of time invested in the fund.Interest earned with investments in BPI for the year amounted to P=24.70 million, P=125.5 million,and P=129.3 million in 2020, 2019 and 2018, respectively.
Short-term debts are secured peso denominated bank loans with interest rate ranging from 5.5%to 5.6% while long-term debts bear fixed rates ranging from 4.5% to 6.9% and floating ratesranging from 5.4% to 6.5% per annum with remaining terms ranging from less than a year to9.9 years. Interest expense incurred on borrowings from BPI amounted to P=723.29 million,P=740.8 million, and P=1,460.0 million for the years ended December 31, 2020, 2019 and 2018,respectively.
As of December 31, 2020 and 2019, the Group maintains current and savings account, moneymarket placements and short-term and long-term debt payable with BPI broken down as follows:
2020 2019(In Thousands)
Cash in bank P=3,510,108 P=3,942,497Cash equivalents 47,486 906,296Marketable securities 305,136 80,000Short term debt 2,600,500 9,399,330Long-term debt 13,231,337 14,315,498
b. Outstanding balances with parent company, associates and other related party
Receivables from/payables to other related parties pertain mostly to advances andreimbursement of operating expenses related to development cost and land acquisitions.Payables to related parties consist of expenses incurred on utilities, professional services andother miscellaneous services as well as purchases of vehicles. These are generally trade-related, noninterest-bearing and settled within one year.
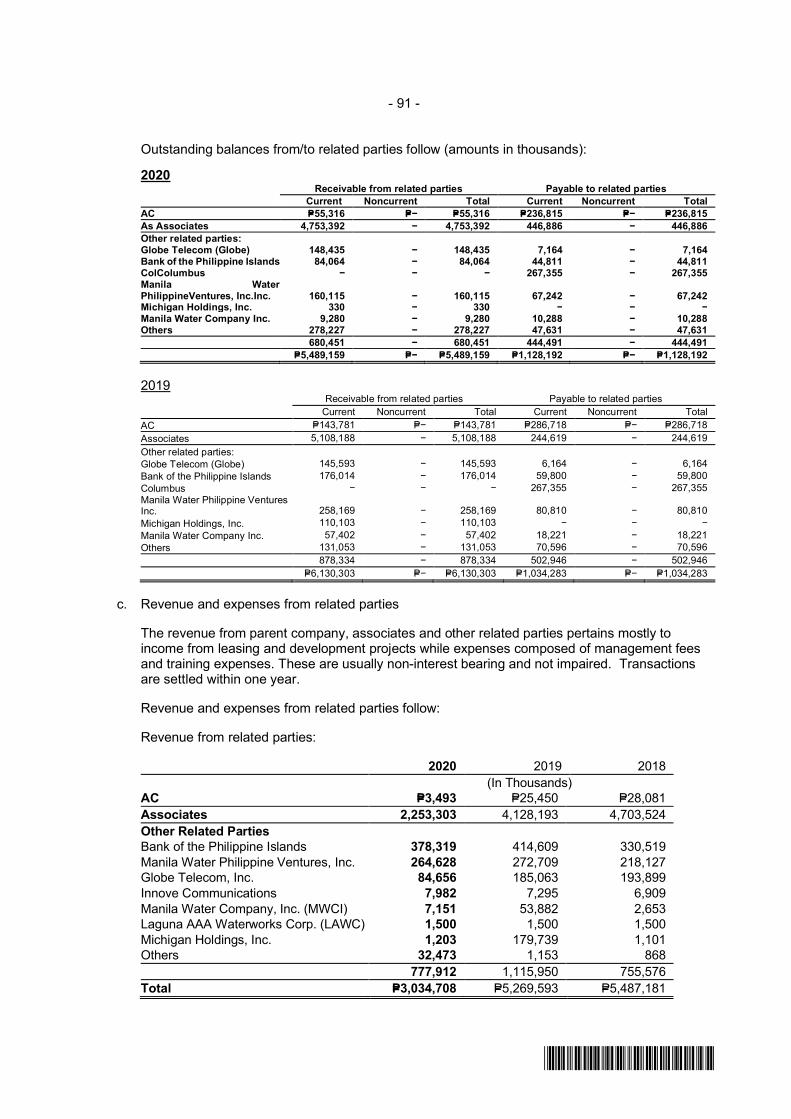
- 91 -
*SGVFSM005262*
Outstanding balances from/to related parties follow (amounts in thousands):
2020Receivable from related parties Payable to related parties
Current Noncurrent Total Current Noncurrent TotalAC P=55,316 P=− P=55,316 P=236,815 P=− P=236,815As Associates 4,753,392 − 4,753,392 446,886 − 446,886Other related parties:Globe Telecom (Globe) 148,435 − 148,435 7,164 − 7,164Bank of the Philippine Islands 84,064 − 84,064 44,811 − 44,811ColColumbus − − − 267,355 − 267,355Manila WaterPhilippineVentures, Inc.Inc. 160,115 − 160,115 67,242 − 67,242Michigan Holdings, Inc. 330 − 330 − − −Manila Water Company Inc. 9,280 − 9,280 10,288 − 10,288Others 278,227 − 278,227 47,631 − 47,631
680,451 − 680,451 444,491 − 444,491P=5,489,159 P=− P=5,489,159 P=1,128,192 P=− P=1,128,192
2019Receivable from related parties Payable to related parties
Current Noncurrent Total Current Noncurrent TotalAC P=143,781 P=− P=143,781 P=286,718 P=− P=286,718Associates 5,108,188 − 5,108,188 244,619 − 244,619Other related parties:Globe Telecom (Globe) 145,593 − 145,593 6,164 − 6,164Bank of the Philippine Islands 176,014 − 176,014 59,800 − 59,800Columbus − − − 267,355 − 267,355Manila Water Philippine VenturesInc. 258,169 − 258,169 80,810 − 80,810Michigan Holdings, Inc. 110,103 − 110,103 − − −Manila Water Company Inc. 57,402 − 57,402 18,221 − 18,221Others 131,053 − 131,053 70,596 − 70,596
878,334 − 878,334 502,946 − 502,946P=6,130,303 P=− P=6,130,303 P=1,034,283 P=− P=1,034,283
c. Revenue and expenses from related parties
The revenue from parent company, associates and other related parties pertains mostly toincome from leasing and development projects while expenses composed of management feesand training expenses. These are usually non-interest bearing and not impaired. Transactionsare settled within one year.
Revenue and expenses from related parties follow:
Revenue from related parties:
2020 2019 2018(In Thousands)
AC P=3,493 P=25,450 P=28,081Associates 2,253,303 4,128,193 4,703,524Other Related PartiesBank of the Philippine Islands 378,319 414,609 330,519Manila Water Philippine Ventures, Inc. 264,628 272,709 218,127Globe Telecom, Inc. 84,656 185,063 193,899Innove Communications 7,982 7,295 6,909Manila Water Company, Inc. (MWCI) 7,151 53,882 2,653Laguna AAA Waterworks Corp. (LAWC) 1,500 1,500 1,500Michigan Holdings, Inc. 1,203 179,739 1,101Others 32,473 1,153 868
777,912 1,115,950 755,576Total P=3,034,708 P=5,269,593 P=5,487,181

- 92 -
*SGVFSM005262*
Expenses from related parties:
2020 2019 2018(In Thousands)
AC P=10,950 P=4,216 P=1,035Associates 201,558 322,114 3,153,547
Other Related PartiesManila Water Company, Inc. 234,167 398,648 385,925Bank of the Philippine Islands 434,707 213,257 296,002Innove Communications, Inc. 73,060 92,003 68,805AG Counselors Corp. 206,354 199,222 60,718Globe Telecom, Inc. 66,483 88,188 53,920Manila Water Philippine Ventures,
Inc. 125,617 108,765 53,038Others 988,788 432,865 377,544
2,129,176 1,532,948 1,295,952Total P=2,341,684 P=1,859,278 P=4,450,534
The following describe the nature of the material transactions of the Group with related parties asof December 31, 2020 and 2019:
On January 12, 2016, the Parent Company has entered into a partnership with Manila WaterPhilippine Ventures, Inc., a wholly owned subsidiary of Manila Water Company, Inc., for thewaterworks of ALI’s projects nationwide. The MOA was signed by ALI and its subsidiariesand affiliates, Cebu Holdings, Inc. and Cebu Property Ventures and Development Corp.Revenue and expense in 2020 amounted to P=264.6 million and P=125.6 million, respectively,and P=272.7 million and P=108.8 million amounted in 2019, respectively.
Certain credit facilities with BPI with a total carrying value of P=13,231.3 million and P=24,416.9million as of December 31, 2020 and 2019, respectively, are secured by a real estatemortgage. This is in compliance with BSP ruling on directors, officers, stockholders andrelated interests.
In October 2012 and July 2013, BG South, a subsidiary of Alveo, entered into a contract withFBDC for the purchase of land in Bonifacio Global City. Land cost amounting to P=122.7million and P=816.0 million were recognized in profit or loss in 2020 and 2019, respectively.
On May 20, 2013, DirectPower and its customers, which are all within the Ayala Group,entered into a Retail Electricity Supply contract wherein DirectPower agreed to supplyelectricity at a specific rate pursuant to the provisions and implementing rules and regulationsof R.A. No. 9136 or the Electric Power Industry Reform Acts of 2001. Among the customersof Direct Power are FBDC, LDC, BPI, San Lazaro BPO Complex and 6750 Ayala Ave.
The Group sold residential receivables on a without recourse basis to BPI Family SavingsBank, Inc., a related party, amounting to P=20,458.0 million and P=9,976.3 million in 2020 and2019, respectively. Proceeds of receivables sold to BPI amounted to P=18,431.9 million in2020 and P=9,281.2 million in 2019. The Group recognized loss on sale (under “Othercharges”) amounting to P=2,064.0 million and P=775.2 million in 2020 and 2019, respectively.
The Group entered into agreements with BPI Asset Management and Trust Corporation in2019 for the assignment of interest-bearing employee receivables amounting to P=108.9million (nil in 2020).
Revenue from Globe pertains to development management fee and for lease of spaces. As of December 31, 2020 and 2019, the funds include investment in securities of its related
parties with carrying value of P=1.5 billion and P=1.7 billion, respectively (see Note 26).
d. Remuneration of Key Management Personnel (KMP)
Key management personnel of the Group include all officers with position of vice president andup. Compensation of key management personnel amounted to P=207.8 million and P=197.2 millionin 2020 and 2019, respectively.

- 93 -
*SGVFSM005262*
Compensation of key management personnel by benefit type follows:
2020 2019(In Thousands)
Short-term employee benefits P=192,301 P=185,540Post-employment benefits (Note 26) 15,497 11,622
P=207,798 P=197,162
The Related Party Transaction Review Committee shall approve all material related partytransactions before their commencement. Material related party transactions shall be identifiedtaking into account the related party registry. Transactions amounting to ten percent (10%) ormore of the total assets of the corporation that were entered into with an unrelated party thatsubsequently becomes a related party may be excluded from the limits and approval processrequirement.
26. Retirement Plan
The Group has funded, noncontributory tax-qualified defined benefit type of retirement plans (thePlan) covering substantially all of their employees. The benefits are based on a defined benefitformula.
The Plan aims to maintain a full funding, i.e., the Plan’s assets fully covered the Plan’s liabilities, asmeasured through generally accepted actuarial methodologies. Such will provide a higher level ofassurance that all promised benefits can be paid from existing assets and expected investmentreturns. The target funded status is within the range of 80% to 100%.
The Group’s fund is in the form of a trust fund being maintained by the trustee banks such as BPIAsset Management and Trust Corporation (collectively the “Retirement Fund”). The primary objectiveof the Retirement Fund is to achieve the highest total rate of return possible, consistent with a prudentlevel of risk. The investment strategy articulated in the asset allocation policy has been developed inthe context of long-term capital market expectations, as well as multi-year projections of actuarialliabilities. Accordingly, the investment objectives and strategies emphasize a long-term outlook, andinterim performance fluctuations will be viewed with the corresponding perspective.
The components of expense (included in manpower costs under “General and administrativeexpenses”) in the consolidated statements of income follows:
2020 2019 2018(In Thousands)
Current service cost P=398,979 P=443,364 P=310,759Past service cost − − 10,563Net interest cost on benefit obligation 104,867 117,607 77,418Total pension expense P=503,846 P=560,971 P=398,740

- 94 -
*SGVFSM005262*
The remeasurement effects recognized in other comprehensive income (included in Equity under“Remeasurement loss on defined benefit plans”) in the consolidated statements of financial positionfollow:
2020 2019 2018(In Thousands)
Return (loss) on plan assets (excludingamount included in net interest) (P=15,785) P=75,922 P=184,923
Remeasurement (loss) gain due to liabilityexperience (47,859) 1,544 101,979
Remeasurement (loss) gain due to liabilityassumption changes - demographic (5,641) 145 (2,476)
Remeasurement loss due to liabilityassumption changes - economic (617,702) (245,365) (369,807)
Remeasurements in other comprehensiveincome (P=686,987) (P=167,754) (P=85,381)
The funded status and amounts recognized in the consolidated statement of financial position for theretirement plan as of December 31, 2020 and 2019, are as follows:
2020 2019(In Thousands)
Benefit obligations P=5,094,096 P=4,365,274Plan assets (2,085,519) (2,452,003)Net pension liability position P=3,008,577 P=1,913,271
As of December 31, 2020 and 2019 pension assets (included under “Other noncurrent assets”)amounted to P=12.2 million and P=74.3 million, respectively, and pension liabilities amounted toP=3,020.8 million and P=1,987.6 million, respectively.

- 95 -
*SGVFSM005262*
Changes in net defined benefit liability of funded plans in 2020 are as follows (in thousands):Remeasurements in other comprehensive income
Net benefit cost in consolidated statement of income Return
Remeasurementloss
due to
Remeasurementloss
due toliability
assumption
Remeasurementloss
due toliability
assumption NetJanuary 1,
2020Current
service costPast service
costNet
interest SubtotalBenefits
paidon planAssets*
liabilityexperience
changes -demographic
changes-economic
remeasure-ment loss
Contributionby employer
Transferin /(out)
December 31,2020
Present value of defined benefitobligation P=4,365,274 P=398,979 P=– P=210,090 P=609,069 (P=550,903) P=– P=47,859 P=5,641 P=617,702 P=671,202 P=– (P=546) P=5,094,096
Fair value of plan assets (2,452,003) – – (105,223) (105,223) 698,183 15,785 – – – 15,785 (242,807) 546 (2,085,519)Net defined benefit liability P=1,913,271 P=398,979 P=– P=104,867 P=503,846 P=147,280 P=15,785 P=47,859 P=5,641 P=617,702 P=686,987 (P=242,807) P=– P=3,008,577*excluding amount included in net interest
Changes in net defined benefit liability of funded plans in 2019 are as follows (in thousands):
Remeasurements in other comprehensive income
Net benefit cost in consolidated statement of income Return
Remeasurementgain
due to
Remeasurementgain
due toliability
assumption
emeasurementloss
due toliability
assumption NetJanuary 1,
2019Current
service costPast service
costNet
interest SubtotalBenefits
paidon planAssets*
liabilityexperience
changes -demographic
Rchanges -economic
remeasure-ment loss
Contributionby employer
Transferin /(out)
December 31,2019
Present value of defined benefitobligation P=3,676,584 P=443,364 P=– P=279,339 P=722,703 (P=277,699) P=– (P=1,544) (P=145) P=245,365 P=243,676 P=– P=10 P=4,365,274
Fair value of plan assets (2,188,451) – – (161,732) (161,732) 335,918 (75,922) – – – (75,922) (361,816) – (2,452,003)Net defined benefit liability P=1,488,133 P=443,364 P=– P=117,607 P=560,971 P=58,219 (P=75,922) (P=1,544) (P=145) P=245,365 P=167,754 (P=361,816) P=10 P=1,913,271*excluding amount included in net interest
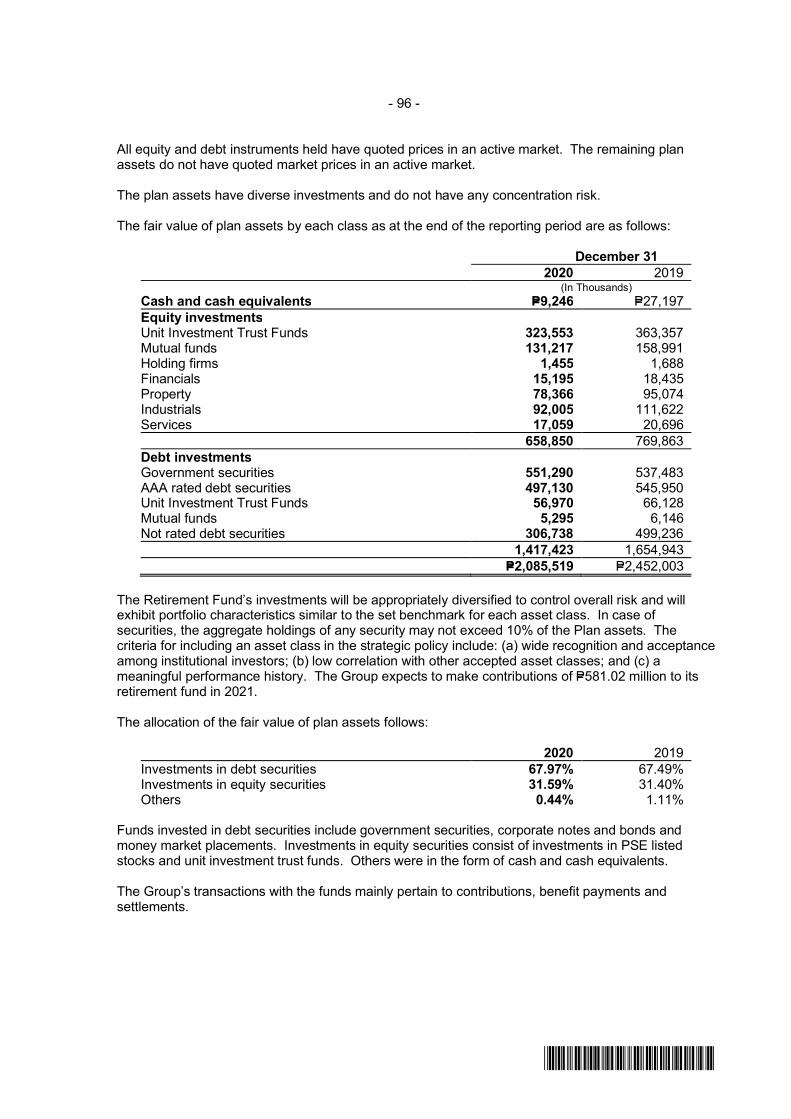
- 96 -
*SGVFSM005262*
All equity and debt instruments held have quoted prices in an active market. The remaining planassets do not have quoted market prices in an active market.
The plan assets have diverse investments and do not have any concentration risk.
The fair value of plan assets by each class as at the end of the reporting period are as follows:
December 312020 2019
(In Thousands)Cash and cash equivalents P=9,246 P=27,197Equity investmentsUnit Investment Trust Funds 323,553 363,357Mutual funds 131,217 158,991Holding firms 1,455 1,688Financials 15,195 18,435Property 78,366 95,074Industrials 92,005 111,622Services 17,059 20,696
658,850 769,863Debt investmentsGovernment securities 551,290 537,483AAA rated debt securities 497,130 545,950Unit Investment Trust Funds 56,970 66,128Mutual funds 5,295 6,146Not rated debt securities 306,738 499,236
1,417,423 1,654,943P=2,085,519 P=2,452,003
The Retirement Fund’s investments will be appropriately diversified to control overall risk and willexhibit portfolio characteristics similar to the set benchmark for each asset class. In case ofsecurities, the aggregate holdings of any security may not exceed 10% of the Plan assets. Thecriteria for including an asset class in the strategic policy include: (a) wide recognition and acceptanceamong institutional investors; (b) low correlation with other accepted asset classes; and (c) ameaningful performance history. The Group expects to make contributions of P=581.02 million to itsretirement fund in 2021.
The allocation of the fair value of plan assets follows:
2020 2019Investments in debt securities 67.97% 67.49%Investments in equity securities 31.59% 31.40%Others 0.44% 1.11%
Funds invested in debt securities include government securities, corporate notes and bonds andmoney market placements. Investments in equity securities consist of investments in PSE listedstocks and unit investment trust funds. Others were in the form of cash and cash equivalents.
The Group’s transactions with the funds mainly pertain to contributions, benefit payments andsettlements.

- 97 -
*SGVFSM005262*
As of December 31, 2020 and 2019, the funds include investment in securities of its related parties(see Note 25). Details of the investment per type of security are as follows:
December 31, 2020December 31,
2019Carrying
ValueFair
ValueUnrealized
(Gain) LossFair
Value(In Thousands)
Investments in debt securities P=885,050 P=916,337 (P=31,287) P=1,142,062Investments in equity securities 627,611 624,975 2,636 603,857Others 13,319 13,393 (74) 13,393
P=1,525,980 P=1,554,705 (P=28,725) P=1,759,312
The plan assets include shares of stock of the Parent Company with fair value amounting toP=40.58 million and P=38.56 million as of December 31, 2020 and 2019, respectively. The ParentCompany gives the trustee bank the discretion to exercise voting rights over the shares. The planassets include debt securities of the Parent Company amounting to P=68.42 million and P=66.8 millionas of December 31, 2020 and 2019, respectively. The gain of the fund arising from investment indebt and equity securities of the Parent Company is P=1.62 million.
The cost of defined benefit pension plans and other post-employment medical benefits as well as thepresent value of the pension liabilities are determined using actuarial valuations. The actuarialvaluation involves making various assumptions. The principal assumptions used in determiningpension and post-employment medical benefit obligations for the defined benefit plans are shownbelow:
2020 2019Discount rates 3.73 to 5.50% 4.74 to 5.50%Future salary increases 3.00 to 8.00% 4.00 to 8.00%
The sensitivity analysis below has been determined based on reasonably possible changes of eachsignificant assumption on the defined benefit obligation as of the end of the reporting period,assuming all other assumptions were held constant:
2020
Effect on income before incometax Increase (decrease)
Change in basis points+ 100 basis
points- 100 basis
points(In Thousands)
Discount rate (P=335,855) P=508,470Salary increase rate 489,491 (320,960)
2019
Effect on income before income taxIncrease (decrease)
Change in basis points+ 100 basis
points- 100 basis
points(In Thousands)
Discount rate (P=348,241) P=382,527Salary increase rate 363,629 (387,094)

- 98 -
*SGVFSM005262*
Shown below is the maturity analysis of the undiscounted benefit payments:
Year ending: 2020 2019(In Thousands)
1 year and less P=191,339 P=666,659more than 1 years to 5 years 980,921 1,837,060more than 5 years to 10 years 2,877,953 2,580,119more than 10 years to 15 years 7,263,178 14,122,637more than 15 years to 20 years 8,418,881 2,696,046more than 20 years 14,802,379 26,270,099
The average duration of the defined benefit obligation is 7.0 to 24.0 years and 11.0 to 24.0 years in2020 and 2019, respectively.
27. Earnings Per Share
The following tables present information necessary to compute EPS (amounts in thousands exceptEPS):
EPS on net income attributable to equity holders of Ayala Land, Inc. are as follows:
2020 2019 2018(In Thousands)
Net income attributable to equity holders of Ayala Land, Inc. P=8,727,155 P=33,188,399 P=29,240,880Less: dividends on preferred stock (62,038) (62,038) (62,038)Net income attributable to equity holders of the Parent
Company for basic and diluted earnings per share P=8,665,117 P=33,126,361 P=29,178,842Weighted average number of common shares for basic EPS 14,721,234 14,742,690 14,730,049Add: dilutive shares arising from stock options 2,296 3,783 966Adjusted weighted average number of common shares for
diluted EPS 14,723,530 14,746,473 14,731,015Basic and diluted EPS P=0.59 P=2.25 P=1.98
Basic EPS is computed by dividing net income for the year attributable to common equity holders ofthe Parent Company by the weighted average number of common shares issued and outstandingduring the year adjusted for any subsequent stock dividends declared.
Diluted EPS is computed by dividing net income for the year attributable to common equity holders ofthe Parent Company by the weighted average number of common shares issued and outstandingduring the year plus the weighted average number of common shares that would be issued onconversion of all the dilutive potential common shares into common shares. The calculation of dilutedearnings per share does not assume conversion, exercise, or other issue of potential common sharesthat would have an antidilutive effect on earnings per share.
The convertibility of the preferred shares will start on the 10th year from the issue date which was in2012. This has an antidilutive effect on the computation of diluted EPS.
28. Stock Options and Ownership Plans
The Parent Company has stock option plans for key employees covering 2.5% of the ParentCompany’s authorized capital stock. The grantee is selected based on certain criteria likeoutstanding performance over a three-year period.

- 99 -
*SGVFSM005262*
ESOPThe ESOP grantees may exercise in whole or in part the vested allocation in accordance with thevesting percentage and vesting schedule stated in the ESOP. Also, the grantee must be anemployee of the Parent Company or any of its subsidiaries during the 10-year option period. In casethe grantee retires, he is given 3 years to exercise his vested and unvested options. In case thegrantee resigns, he is given 90 days to exercise his vested options.
The Parent Company has no ESOP grant and availment during 2020, 2019 and 2018.
ESOWNIn November 2001, the Parent Company offered all its ESOWN subscribers with outstanding ESOWNsubscriptions the option to cancel the subscriptions within the 5-year holding period. InDecember 2001, the program for ESOWN was indefinitely suspended.
In 2005, the Parent Company introduced a revised ESOWN Plan (the Plan) wherein grantees maysubscribe in whole or in part to the shares awarded to them based on a discounted market price thatwas determined by the Compensation Committee as the offer price set at grant date. The granteespaid for the shares subscribed through installments over a maximum period of ten (10) years. Thesubscription is subject to a holding period stated in the plan. To subscribe, the grantee must be anemployee of the Parent Company or any of its subsidiaries during the ten (10)-year payment period.In case the grantee resigns, unsubscribed shares are cancelled, while the subscription may be paidup to the percent of holding period completed and payments may be converted into the equivalentnumber of shares. In case the grantee is separated, not for cause, but through retrenchment andredundancy, subscribed shares may be paid in full, unsubscribed shares may be subscribed, orpayments may be converted into the equivalent number of shares. In case the grantee retires, thegrantee may subscribe to the unsubscribed shares anytime within the ten (10)-year period. The plandoes not allow sale or assignment of the shares. All shares acquired through the Plan are subject tothe Parent Company’s right to repurchase.
The subscribed shares are effectively treated as options exercisable within a given period which isthe same time as the grantee’s payment schedule. The fair values of stock options granted areestimated on the date of grant using the Black-Scholes Merton (BSM) Formula and Binomial TreeModel (BTM), taking into account the terms and conditions upon which the options were granted.The BSM Formula and BTM Model requires six inputs to produce an option stock value namely;market value of the share, book value of the share, time to maturity, volatility rate, dividend yield, andrisk free rate. The expected volatility was determined based on an independent valuation.
Movements in the number of options outstanding and weighted average exercise prices (WAEP)under ESOWN follow:
2020 WAEP 2019 WAEPAt January 1 305,415 P=35.94 5,601,470 P=32.71Granted 18,194,618 11,610,720Subscribed (14,845,498) 27.72 (10,453,766) 43.70Availment 39,436 487,585Cancelled (3,693,971) (6,940,594)At December 31 − P=− 305,415 P=35.94

- 100 -
*SGVFSM005262*
The fair value of stock options granted under ESOWN at grant date and the assumptions used todetermine the fair value of the stock options follow:
Grant DateAugust 17,
2020March 21,
2019March 28,
2018March 01,
2017April 05,
2016March 20,
2015March 20,
2014March 18,
2013Number of unsubscribed
shares − − − − 181,304 − 1,369,887 1,713,868Fair value of each option
(BTM) P=− P=− P=− P=8.48 P=13.61 P=16.03 P=12.60 P=16.05Fair value of each option
(BSM) P=9.12 P=17.13 P=12.71 P=− P=18.21 P=20.63 P=12.16 P=11.85Weighted average share price P=32.61 P=44.70 P=41.02 P=39.72 P=35.58 P=36.53 P=31.46 P=30.00Exercise price P=27.72 P=44.49 P=45.07 P=35.81 P=26.27 P=29.58 P=22.55 P=21.45Expected volatility 25.05% 31.48% 34.04% 30.95% 32.03% 31.99% 33.50% 36.25%Dividend yield 0.81% 1.16% 1.22% 1.34% 1.27% 1.02% 1.42% 1.93%Interest rate 1.13% 5.57% 4.14% 4.41% 4.75% 4.11% 3.13% 2.78%
Total expense (included under “General and administrative expenses”) recognized in 2020, 2019 and2018 in the consolidated statements of income arising from share-based payments amounted toP=111.92 million, P=142.86 million, and P=98.52 million, respectively (see Note 22).
ALLHCALLHC introduced the ESOWN Plan (the Plan) wherein grantees (employees within ALLHCGroup) may subscribe in whole or in part to the shares awarded to them based on a discountedmarket price, but in no case lower than the par value, that was determined at grant date. Thegrantees paid for the shares subscribed through installments over a maximum period of ten (10)years. To subscribe, the grantee must be an employee, officer or director of ALLHC as of June 30,2015. In case the grantee resigns, unsubscribed shares are cancelled and returned to the plan pool,while the subscription payments may be converted into the equivalent number of shares. In case thegrantee is separated, not for cause, but through retrenchment and redundancy, subscribed sharesmay be paid in full, unsubscribed shares may be subscribed, or payments may be converted into theequivalent number of shares. In case the grantee retires, the grantee may subscribe to theunsubscribed shares anytime within the ten (10)-year period. The plan does not allow sale orassignment of the shares.
The BOD of ALLHC approved the allocation of 32 million shares (first tranche) for ESOWN plan whichwill be taken from the remaining unissued shares (with grant date in 2016) and the increase inauthorized of stock of ALLHC, which was approved by the SEC in July 2016. In 2017, notice of grantfor the 218 million shares (second tranche of ESOWN plan) was issued to employees for the right tosubscribe to the common shares of ALLHC at P=1.68 per share which were fully availed as ofDecember 31, 2018. In 2020 and 2019, ALLHC has no ESOWN grant.
29. Financial Assets and Liabilities
Fair Value InformationThe following tables set forth the carrying values and estimated fair values of the Group’s financialassets and liabilities recognized as of December 31, 2020 and 2019:
December 31, 2020 December 31, 2019Carrying
Value Fair ValueCarrying
Value Fair Value(In Thousands)
Financial Assets at FVPL P=965,171 P=965,171 P=485,436 P=485,436Financial Assets at FVOCIUnquoted equity securities 666,988 666,988 565,650 565,650Quoted equity securities 844,455 844,455 963,529 963,529
1,511,443 1,511,443 1,529,179 1,529,179P=2,476,614 P=2,476,614 P=2,014,615 P=2,014,615

- 101 -
*SGVFSM005262*
December 31, 2020 December 31, 2019Carrying
Value Fair ValueCarrying
Value Fair Value(In Thousands)
Financial assets at amortized costNoncurrent trade residential and office
development P=42,547,808 P=45,313,900 P=42,994,112 P=47,326,247Receivable from employees 842,506 844,542 901,261 903,299
P=43,390,314 P=46,158,442 P=43,895,373 P=48,229,546
Other financial liabilitiesLong-term debt P=202,819,593 P=211,109,769 P=193,064,051 P=196,618,780Deposits and other noncurrent liabilities 48,582,759 36,367,004 42,282,234 36,225,888
P=251,402,352 P=247,476,773 P=235,346,285 P=232,844,668
The methods and assumptions used by the Group in estimating the fair value of the financialinstruments are as follows:
Cash and cash equivalents, short-term investments and current receivables, accounts and otherpayables, current payables and short term debt - Carrying amounts approximate fair values due tothe relatively short-term maturities of these financial instruments.
Financial assets at FVPL - These are investments in fund and treasury bills. Fair value of the funds isbased on net asset values as of reporting dates.
Noncurrent accounts and notes receivables - The fair values of residential accounts and notesreceivable, and receivable from employees, are based on the discounted value of future cash flowsusing the applicable rates for similar types of instruments. The discount rates used ranged from5.75% to 16.00% and 6.25% to 13.50% as of December 31, 2020 and 2019.
Financial assets at FVOCI quoted equity securities - fair values are based on quoted prices publishedin markets.
Financial assets at FVOCI unquoted equity securities – fair values are based on the latest sellingprice available.
Liabilities - The fair value of noncurrent unquoted instruments (long-term debt and deposits) areestimated using the discounted cash flow methodology using the Group’s current incrementalborrowing rates for similar borrowings with maturities consistent with those remaining for the liabilitybeing valued. The discount rates used ranged 1.84% to 7.50% and 3.18% to 7.02% as ofDecember 31, 2020 and 2019, respectively. The fair value of noncurrent unquoted debt instrumentswith floating rates are estimated using discounted cash flow - last repricing method.
Fair Value HierarchyThe Group uses the following hierarchy for determining and disclosing the fair value of the financialinstruments by valuation technique:
Level 1: quoted (unadjusted prices) in active markets for identical assets and liabilitiesLevel 2: other techniques for which all inputs which have a significant effect on the recorded fair valueare observable, either directly or indirectlyLevel 3: techniques which use inputs which have a significant effect on the recorded fair value thatare not based on observable market data
The Group categorizes trade receivable, receivable from employees, long-term debt and deposits andother noncurrent liabilities under Level 3. The fair value of these financial instruments is determinedby discounting future cash flows using the applicable rates of similar types of instruments plus acertain spread. This spread is the unobservable input and the effect of changes to this is that thehigher the spread, the lower the fair value.

- 102 -
*SGVFSM005262*
Quoted FVOCI financial assets amounting to P=844.5 million and P=963.5 million as of December 31,2020, and 2019, respectively, were classified under Level 1 (see Note 10).
Unquoted FVOCI financial assets amounting to P=667.0 million and P=565.7 million as of December 31,2020 and 2019, respectively, were classified under Level 3 (see Note 10).
Investment in Arch Capital Fund amounting to P=328.0 million and P=389.0 million as of December 31,2020, and 2019, respectively, were classified under Level 3 (see Note 6).
Investment in Unit Investment Trust Fund (UITF) amounting to P=378.1 million and P=96.4 million as ofDecember 31, 2020, and 2019, respectively, were classified under Level 2 (see Note 6).
Investment in Treasury bills amounting to P=259.2 million as of December 31, 2020, were classifiedunder Level 2 (see Note 6).
There have been no reclassifications from Level 1 to Level 2 categories in 2020 and 2019.
Financial Risk Management Objectives and PoliciesThe Group’s principal financial instruments comprise of cash and cash equivalents, short-terminvestment, financial assets at FVPL, AFS quoted and unquoted equity securities, investments inbonds, bank loans, corporate notes and bonds. The financial debt instruments were issued primarilyto raise financing for the Group’s operations. The Group has various financial assets such as tradereceivables and trade payables which arise directly from the conduct of its operations.
Exposure to liquidity, credit, interest rate, currency and equity risks arise in the normal course of theGroup’s business activities. The main objectives of the Group’s financial risk management are asfollows:
to identify and monitor such risks on an ongoing basis; to minimize and mitigate such risks; and to provide a degree of certainty about costs.
The use of derivative financial instruments, if any, is solely for management of the Group’s financialrisk exposures. It is the Group’s policy not to enter into derivative transactions for speculativepurposes.
The Group’s financing and treasury function operates as a centralized service for managing financialrisks and activities as well as providing optimum investment yield and cost-efficient funding for theGroup.
There were no changes in the Group’s financial risk management objectives and policies in 2020 and2019.
Liquidity riskLiquidity risk is defined by the Group as the risk of losses arising from funding difficulties due todeterioration in market conditions and/or the financial position of the Group that make it difficult for theGroup to raise the necessary funds or that forces the Group to raise funds at significantly higherinterest rates than usual.
This is also the possibility of experiencing losses due to the inability to sell or convert marketablesecurities into cash immediately or in instances where conversion to cash is possible but at a lossdue to wider than normal bid-offer spreads.

- 103 -
*SGVFSM005262*
The Group employs scenario analysis and contingency planning to actively manage its liquidityposition and guarantee that all operating, investing and financing needs are met. The Group hascome up with a three-layered approach to liquidity through the prudent management of sufficient cashand cash equivalents, the potential sale of accounts receivables and the maintenance of short-termrevolving credit facilities.
Cash and cash equivalents are maintained at a level that will enable it to fund its general andadministrative expenses as well as to have additional funds as buffer for any opportunities oremergencies that may arise. Management develops viable funding alternatives through a continuousprogram for the sale of its receivables and ensures the availability of ample unused short-termrevolving credit facilities from both local and foreign banks as back-up liquidity.
The Group ascertains that its cash is invested in short-term bank placements and special depositaccounts, as well as in high-quality and marketable government and corporate securities.
Credit lineThe Group has a total available credit line up to P=84.43 billion and P=68.0 billion with various localbanks as of December 31, 2020 and 2019, respectively
The table summarizes the maturity profile of the Group’s financial liabilities at December 31, 2020and 2019 based on contractual undiscounted payments:
December 31, 2020
< 1 year >1 to < 5 years > 5 years Total(In Thousands)
Accounts and other payables P=123,634,745 P=– P=– P=123,634,745Short-term debt 9,131,325 – – 9,131,325Long-term debt 18,732,401 127,500,906 56,586,286 202,819,593Deposits and other current liabilities 25,072,090 – – 25,072,090Deposits and other noncurrent
liabilities – 42,521,168 1,771,715 44,292,883176,570,561 170,022,074 58,358,001 404,950,636
Interest payable* P=7,834,302 P=30,705,781 P=14,496,618 P=53,036,701*includes future interest payment
December 31, 2019
< 1 year >1 to < 5 years > 5 years Total(In Thousands)
Accounts and other payables P=138,334,629 P=– P=– P=138,334,629Short-term debt 18,032,830 – – 18,032,830Long-term debt 17,250,706 85,827,970 89,985,375 193,064,051Deposits and other current liabilities 25,129,315 – – 25,129,315Deposits and other noncurrent
liabilities – 34,002,066 1,684,557 35,686,623198,747,480 119,830,036 91,669,932 410,247,448
Interest payable* P=8,136,242 P=34,485,567 P=7,151,134 P=49,799,943*includes future interest payment
Cash and cash equivalents, short-term investments and financial assets at FVPL are used for theGroup’s liquidity requirements. Please refer to the terms and maturity profiles of these financialassets shown on the maturity profile of the interest-bearing financial assets and liabilities disclosed inthe interest rate risk section. There are no undrawn loan commitments from long-term credit facilitiesas of December 31, 2020 and 2019.
Credit riskCredit risk is a risk that a counterparty will not meet its obligation under its financial instrument orcustomer contract leading to a financial loss.

- 104 -
*SGVFSM005262*
The Group’s credit risks are primarily attributable to installments receivable, rental receivables andother financial assets. To manage credit risks, the Group maintains defined credit policies andmonitors its exposure to credit risks on a continuous basis.
In respect of installments receivable from the sale of properties, credit risk is managed primarilythrough credit reviews and an analysis of receivables on a continuous basis. The Group alsoundertakes supplemental credit review procedures for certain installment payment structures. TheGroup’s stringent customer requirements and policies in place contribute to lower customer defaultthan its competitors. Customer payments are facilitated through various collection modes includingthe use of postdated checks and auto-debit arrangements. Exposure to bad debts is not significantas title to real estate properties are not transferred to the buyers until full payment has been madeand the requirement for remedial procedures is minimal given the profile of buyers.
Credit risk arising from rental income from leasing properties is primarily managed through a tenantselection process. Prospective tenants are evaluated on the basis of payment track record and othercredit information. In accordance with the provisions of the lease contracts, the lessees are requiredto deposit with the Group security deposits and advance rentals which helps reduce the Group’scredit risk exposure in case of defaults by the tenants. For existing tenants, the Group has put inplace a monitoring and follow-up system. Receivables are aged and analyzed on a continuous basisto minimize credit risk associated with these receivables. Regular meetings with tenants are alsoundertaken to provide opportunities for counseling and further assessment of paying capacity.
Other financial assets are comprised of cash and cash equivalents excluding cash on hand, short-term investments, financial assets at FVPTL and financial assets at FVOCI. The Group adheres tofixed limits and guidelines in its dealings with counterparty banks and its investment in financialinstruments. Bank limits are established on the basis of an internal rating system that principallycovers the areas of liquidity, capital adequacy and financial stability. The rating system likewisemakes use of available international credit ratings. Given the high credit standing of its accreditedcounterparty banks, management does not expect any of these financial institutions to fail in meetingtheir obligations. Nevertheless, the Group closely monitors developments over counterparty banksand adjusts its exposure accordingly while adhering to pre-set limits.
The Group’s maximum exposure to credit risk as of December 31, 2020 and 2019 is equal to thecarrying values of its financial assets.
Given the Group’s diverse base of counterparties, it is not exposed to large concentrations of creditrisk.
An impairment analysis is performed at each reporting date using a provision matrix to measureexpected credit losses. The provision rate based on days past due of all customers as they havesimilar loss patterns. Generally, trade receivables are written off if past due for more than one yearand are not subject to enforcement activity. The security deposits and advance rental are consideredin the calculation of impairment as recoveries. As of December 31, 2020 and 2019, the exposure atdefault amounts to P=12,400.1 million and P=14,354.9 million, respectively. The expected credit lossrate is 7.2% and 5.3% that resulted in the ECL of P=1,945.5 million and P=1,186.3 million as ofDecember 31, 2020 and December 31, 2019, respectively.

- 105 -
*SGVFSM005262*
As of December 31, 2020 and 2019, the aging analysis of past due but not impaired trade receivables presented per class follow:
December 31, 2020
NeitherPast Due nor Past Due but not Impaired
Impaired <30 days 30-60 days 61-90 days 91-120 days >120 days Total Impaired Total(In Thousands)
Trade:Residential, commercial and office
development P=87,579,407 P=8,312,810 P=677,149 P=1,854,465 P=585,788 P=2,267,709 P=13,697,921 P=50,767 P=101,328,095Shopping centers 2,524,233 195,961 298,868 230,567 203,055 901,865 1,830,316 1,060,057 5,414,606Construction contracts 949,706 77,648 142,559 49,836 100,432 416,782 787,257 37,778 1,774,741Corporate business 3,402,084 1,309 1,683 ‒ 1,288 22,666 26,946 519,642 3,948,672Management fees 31,292 2,464 13,335 13,539 554 56,691 86,583 6,678 124,553Others 3,821,778 472,721 13,640 53,938 76,192 130,086 746,577 149,246 4,717,601
Advances to other companies 9,973,795 2,025 1,086,998 60,143 23,959 6,418,080 7,591,205 121,292 17,686,292Accrued receivables 6,311,028 191,008 193,169 21,920 10,473 1,058,801 1,475,371 ‒ 7,786,399Related parties 5,472,155 86 2,661 86 3,664 10,507 17,004 ‒ 5,489,159Receivables from employees 709,628 10,631 6,638 4,069 561 110,979 132,878 ‒ 842,506
P=120,775,106 P=9,266,663 P=2,436,700 P=2,288,563 P=1,005,966 P=11,394,166 P=26,392,058 P=1,945,460 P=149,112,624
December 31, 2019
NeitherPast Due nor Past Due but not Impaired
Impaired <30 days 30-60 days 61-90 days 91-120 days >120 days Total Impaired Total(In Thousands)
Trade:Residential, commercial and office
development P=93,504,125 P=4,304,075 P=911,803 P=589,709 P=670,084 P=4,267,611 P=10,743,282 P=13,555 P=104,260,962Shopping centers 1,041,277 700,200 244,308 224,441 210,370 491,541 1,870,860 772,513 3,684,650Construction contracts 582,635 24,010 10,479 42,662 186 855,570 932,907 37,778 1,553,320Corporate business 3,174,308 21,857 65,603 20,766 52,067 311,351 471,644 182,208 3,828,160Management fees 42,060 − 13,630 11,729 6,727 18,439 50,525 6,678 99,263Others 4,237,501 63,107 9,499 12,496 25,981 99,550 210,633 110,409 4,558,543
Advances to other companies 12,017,162 217,231 847,194 72,611 160,274 5,606,586 6,903,896 63,152 18,984,210Accrued receivables 6,087,195 124,387 97,970 11,424 90,977 1,376,843 1,701,601 − 7,788,796Related parties 6,106,390 19,152 2,452 1,030 348 931 23,913 − 6,130,303Receivables from employees 780,533 6,086 3,725 1,501 1,318 108,098 120,728 − 901,261
P=127,573,186 P=5,480,105 P=2,206,663 P=988,369 P=1,218,332 P=13,136,520 P=23,029,989 P=1,186,293 P=151,789,468

- 106 -
*SGVFSM005262*
The table below shows the credit quality of the Company’s financial assets as of December 31, 2020 and 2019:
December 31, 2020
Neither Past Due nor Impaired Past Due butHigh Grade Medium Grade Low Grade Unrated Total not Impaired Impaired Total
(In Thousands)Cash and cash equivalents (excluding
cash on hand) P=16,973,044 P=‒ P=‒ P=‒ P=16,973,044 P=‒ P=‒ P=16,973,044Short-term investments 358,120 ‒ ‒ ‒ 358,120 ‒ ‒ 358,120Financial assets at FVPL 965,171 ‒ ‒ ‒ 965,171 ‒ ‒ 965,171Accounts and notes receivables:
Trade: Residential, commercial and office development 75,749,759 6,844,468 4,985,180 ‒ 87,579,407 13,697,921 50,767 101,328,095Shopping centers 1,538,614 539,226 446,393 ‒ 2,524,233 1,830,316 1,060,057 5,414,606Construction contracts 932,957 16,749 ‒ ‒ 949,706 787,257 37,778 1,774,741Corporate business 3,396,865 1,038 4,181 ‒ 3,402,084 26,946 519,642 3,948,672Management fees 30,140 ‒ 1,152 ‒ 31,292 86,583 6,678 124,553Others 3,053,903 694,945 72,930 ‒ 3,821,778 746,577 149,246 4,717,601
Advances to other companies 9,607,267 6,753 359,775 ‒ 9,973,795 7,591,205 121,292 17,686,292Accrued receivables 6,300,452 48 10,528 ‒ 6,311,028 1,475,371 ‒ 7,786,399Related parties 2,282,777 615,718 2,573,660 ‒ 5,472,155 17,004 ‒ 5,489,159Receivable from employees 706,106 795 2,727 ‒ 709,628 132,878 ‒ 842,506
Financial Assets at FVOCI:Unquoted ‒ ‒ ‒ 844,455 844,455 ‒ ‒ 844,455Quoted 666,988 ‒ ‒ ‒ 666,988 ‒ ‒ 666,988
P=122,562,163 P=8,719,740 P=8,456,526 P=844,455 P=140,582,884 P=26,392,058 P=1,945,460 P=168,920,402

- 107 -
*SGVFSM005262*
December 31, 2019
Neither Past Due nor Impaired Past Due butHigh Grade Medium Grade Low Grade Unrated Total not Impaired Impaired Total
(In Thousands)Cash and cash equivalents (excluding
cash on hand) P=20,339,826 P=− P=− P=− P=20,339,826 P=− P=− P=20,339,826Short-term investments 617,149 − − − 617,149 − − 617,149Financial assets at FVPL 485,436 − − − 485,436 − − 485,436Accounts and notes receivables:
Trade:Residential, commercial and offce
development 81,411,415 8,158,202 3,934,508 − 93,504,125 10,743,282 13,555 104,260,962Shopping centers 1,041,277 − − − 1,041,277 1,870,860 772,513 3,684,650Construction contracts 582,635 − − − 582,635 932,907 37,778 1,553,320Corporate business 3,155,230 5,539 13,539 − 3,174,308 471,644 182,208 3,828,160Management fees 23,478 8,762 9,820 − 42,060 50,525 6,678 99,263Others 4,237,501 − − − 4,237,501 210,633 110,409 4,558,543
Advances to other companies 10,341,028 1,128,079 548,055 − 12,017,162 6,903,896 63,152 18,984,210Accrued receivables 6,087,195 − − − 6,087,195 1,701,601 − 7,788,796Related parties 6,106,390 − − − 6,106,390 23,913 − 6,130,303Receivable from employees 780,533 − − − 780,533 120,728 − 901,261
Financial Assets at FVOCI:Unquoted − − − 565,650 565,650 − − 565,650Quoted 963,529 − − − 963,529 − − 963,529
P=136,172,622 P=9,300,582 P=4,505,922 P=565,650 P=150,544,776 P=23,029,989 P=1,186,293 P=174,761,058

- 108 -
*SGVFSM005262*
The credit quality of the financial assets was determined as follows:
Cash and cash equivalents, short-term investments, financial assets at FVTPL, financial assets atFVOCI quoted securities - based on the nature of the counterparty and the Group’s internal ratingsystem;
Receivables - high grade pertains to receivables with no default in payment; medium grade pertainsto receivables with up to 3 defaults in payment; and low grade pertains to receivables with more than3 defaults in payment;
The unquoted financial assets at FVOCI are unrated.
Interest rate riskInterest rate risk is the risk that the fair value or future cash flows of a financial instrument willfluctuate because of changes in market interest rates.
The Group’s interest rate risk management policy centers on reducing the overall interest expenseand exposure to changes in interest rates. Changes in market interest rates relate primarily to theGroup’s interest-bearing debt obligations with floating interest rate as it can cause a change in theamount of interest payments.
The Group manages its interest rate risk by leveraging on its premier credit rating and increasing thefixed interest component of its debt portfolio. The Company’s ratio of fixed to floating rate debt stoodat around 95:5 and 90:10 as of December 31, 2020 and 2019, respectively.
The following tables demonstrate the sensitivity of the Group’s profit before tax and equity to areasonably possible change in interest rates on December 31, 2020 and 2019, with all variables heldconstant, (through the impact on floating rate borrowings):
December 31, 2020Effect on income before income tax
Increase (decrease)
Change in basis points+ 100 basis
points- 100 basis
points(In Thousands)
Floating rate borrowings (P=116,402) P=116,402
December 31, 2019Effect on income before income tax
Increase (decrease)
Change in basis points+ 100 basis
points- 100 basis
points(In Thousands)
Floating rate borrowings (P=209,993) P=209,993
The assumed change in rate is based on the currently observable market environment. There is noother impact on the Group’s equity other than those already affecting the net income.

- 109 -
*SGVFSM005262*
The terms and maturity profile of the interest-bearing financial assets and liabilities, together with their corresponding nominal amounts and carrying values are shown inthe following table (in thousands):
December 31, 2020
Interest terms (p.a.) Rate Fixing Period Nominal Amount < 1 year 1 to 5 years > 5 years Carrying ValueGroupCash and cash equivalents
(excluding cash on hand) Fixed at the date of investment Various P=16,973,044 P=16,973,044 P=− P=− P=16,973,044Short-term investments Fixed at the date of investment or revaluation cut-off Various 358,120 358,120 − − 358,120Accounts and notes receivable Fixed at the date of sale Date of sale 842,506 697,283 145,223 − 842,506
P=18,173,670 P=18,028,447 P=145,223 P=− P=18,173,670Parent CompanyShort-term debtFloating-Peso Variable Monthly P=6,640,500 P=6,640,500 P=− P=− P=6,640,500Long-term debtFixed Peso Fixed at 6.0000% 10 years 5,650,000 − 5,650,000 − 5,650,000 Peso Fixed at 5.0% to 6.0% 10.5 and 20 years 17,000,000 − 14,966,062 1,986,730 16,952,792 Peso Fixed at 5.6250% 11 years 8,000,000 − 7,968,512 − 7,968,512 Peso Fixed at 4.5000% 7 years 7,000,000 − 6,987,688 − 6,987,688 Peso Fixed at 5.6250% to 7.5% 5, 10 and 15 years 950,000 9,322 936,778 − 946,100 Peso Fixed at 4.50 to 6.307% Up to 10.5 years 45,930,039 2,353,240 17,269,507 26,052,000 45,674,747 Peso Fixed at 3.8915 to 4.85% 7, 9.5 and 10 years 22,000,000 − 21,912,113 − 21,912,113 Peso Fixed at 5.2624% 10 years 7,000,000 − − 6,979,065 6,979,065 Peso Fixed at 5.9203% 10 years 10,000,000 − − 9,916,583 9,916,583 Peso Fixed at 7.0239% 5 years 8,000,000 − 7,962,717 − 7,962,717 Peso Fixed at 3.1764% to 3.187% 5 years 6,002,875 − 6,002,875 − 6,002,875 Peso Fixed at 4.2463% to 6.369% 2, 5, 7 and 7.25 years 21,000,000 8,781,628 10,912,739 963,622 20,657,989 Peso Fixed at 3.00% to 3.86% 2 and 5 years 16,250,000 − 16,163,175 − 16,163,175SubsidiariesShort-term debtFloating Peso Variable Monthly 2,490,825 2,490,825 − − 2,490,825Long-term debt
Fixed Peso Fixed at 4.5% to 5.265% 5 to 10 years 26,349,083 7,412,259 8,999,777 9,828,979 26,241,015Floating Peso Variable 3 months 2,805,364 175,952 1,768,963 859,307 2,804,222
P=213,068,686 P=27,863,726 P=127,500,906 P=56,586,286 P=211,950,918
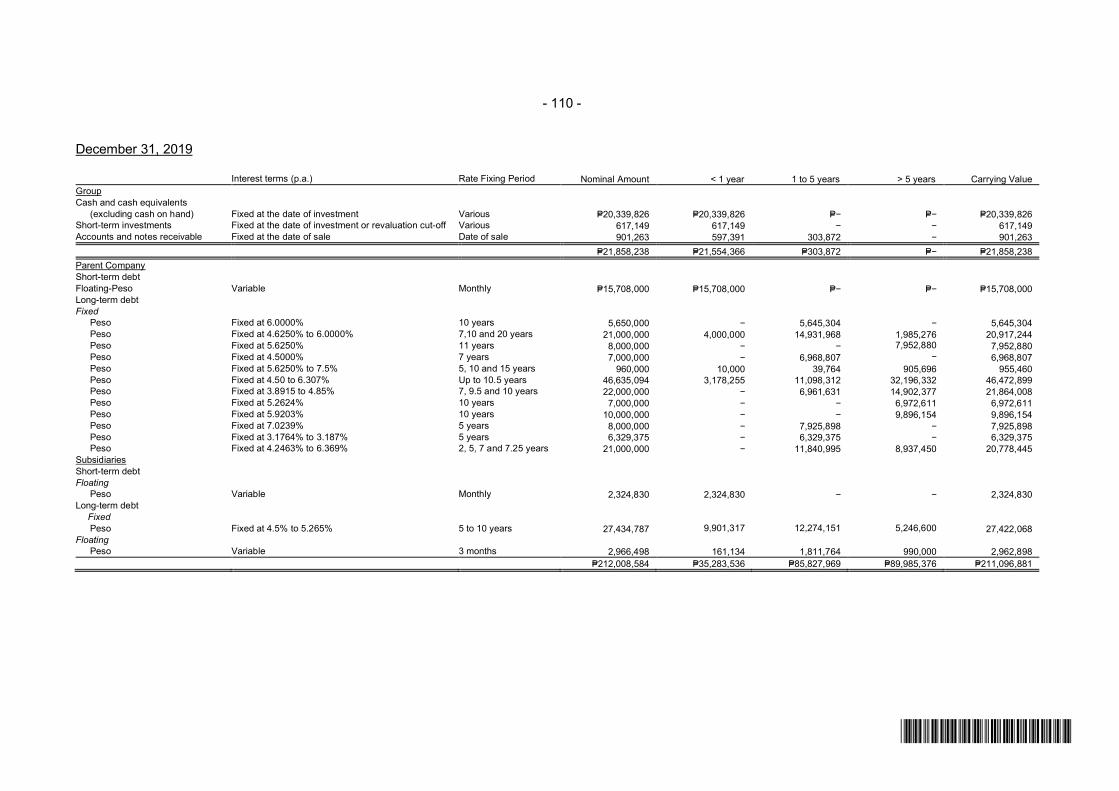
- 110 -
*SGVFSM005262*
December 31, 2019
Interest terms (p.a.) Rate Fixing Period Nominal Amount < 1 year 1 to 5 years > 5 years Carrying ValueGroupCash and cash equivalents
(excluding cash on hand) Fixed at the date of investment Various P=20,339,826 P=20,339,826 P=− P=− P=20,339,826Short-term investments Fixed at the date of investment or revaluation cut-off Various 617,149 617,149 − − 617,149Accounts and notes receivable Fixed at the date of sale Date of sale 901,263 597,391 303,872 − 901,263
P=21,858,238 P=21,554,366 P=303,872 P=− P=21,858,238Parent CompanyShort-term debtFloating-Peso Variable Monthly P=15,708,000 P=15,708,000 P=− P=− P=15,708,000Long-term debtFixed Peso Fixed at 6.0000% 10 years 5,650,000 − 5,645,304 − 5,645,304 Peso Fixed at 4.6250% to 6.0000% 7,10 and 20 years 21,000,000 4,000,000 14,931,968 1,985,276 20,917,244 Peso Fixed at 5.6250% 11 years 8,000,000 − − 7,952,880 7,952,880 Peso Fixed at 4.5000% 7 years 7,000,000 − 6,968,807 − 6,968,807 Peso Fixed at 5.6250% to 7.5% 5, 10 and 15 years 960,000 10,000 39,764 905,696 955,460 Peso Fixed at 4.50 to 6.307% Up to 10.5 years 46,635,094 3,178,255 11,098,312 32,196,332 46,472,899 Peso Fixed at 3.8915 to 4.85% 7, 9.5 and 10 years 22,000,000 − 6,961,631 14,902,377 21,864,008 Peso Fixed at 5.2624% 10 years 7,000,000 − − 6,972,611 6,972,611 Peso Fixed at 5.9203% 10 years 10,000,000 − − 9,896,154 9,896,154 Peso Fixed at 7.0239% 5 years 8,000,000 − 7,925,898 − 7,925,898 Peso Fixed at 3.1764% to 3.187% 5 years 6,329,375 − 6,329,375 − 6,329,375 Peso Fixed at 4.2463% to 6.369% 2, 5, 7 and 7.25 years 21,000,000 − 11,840,995 8,937,450 20,778,445SubsidiariesShort-term debtFloating Peso Variable Monthly 2,324,830 2,324,830 − − 2,324,830Long-term debt
Fixed Peso Fixed at 4.5% to 5.265% 5 to 10 years 27,434,787 9,901,317 12,274,151 5,246,600 27,422,068Floating Peso Variable 3 months 2,966,498 161,134 1,811,764 990,000 2,962,898
P=212,008,584 P=35,283,536 P=85,827,969 P=89,985,376 P=211,096,881

- 111 -
*SGVFSM005262*
Foreign currency riskForeign currency risk is the risk that the fair value or future cash flows of a financial instrument willfluctuate because of changes in foreign exchange rates. Financial assets and credit facilities of theGroup, as well as major contracts entered into for the purchase of raw materials, are mainlydenominated in Philippine Peso. The Group’s placements in foreign currencies amounted to $140.98million and MYR 838.17 million as of December 31, 2020 and $162.61 million and MYR 658.34million as of December 31, 2019. The amount of the Group’s foreign currency-denominated debtamounting to $ 158.68 million and MYR 1,031.90 million as of December 31, 2020 and $154.29million and MYR 936.71 million as of December 31, 2019. We have expected a decrease on financialassets due to the impact of COVID-19 outbreak and imposition of enhanced community quarantine(ECQ) by the government throughout the Philippines in March, extended until 2nd and 3rd quarter ofthe year. Considering that the Group is in the hospitality sector, the operations of the company weregreatly affected. Aside from the aforementioned finding, the Group’s foreign currency risk is minimal.
The following table shows the Group’s consolidated foreign currency-denominated monetary assetsand liabilities and their peso equivalents as of December 31, 2020 and December 31, 2019:
December 312020 2019
US Dollar MYR ringgitPhp
Equivalent US Dollar MYR ringgit Php EquivalentFinancial AssetsCash and cash equivalents $10,616 MYR 562,482 P=7,185,405 $22,910 MYR450,225 P=6,688,920Short-term investments 4,790 38,503 686,990 8,483 − 429,573Accounts and notes receivable - net 92,220 184,592 6,619,424 88,724 169,418 6,573,423Other current assets 32,856 52,594 2,202,034 42,116 35,376 2,567,158Other noncurrent assets 497 − 23,876 380 3,324 60,064
Total 140,979 838,171 16,717,729 162,613 658,343 16,319,138Financial LiabilitiesAccounts and other payables 22,858 971,788 12,631,008 21,757 935,811 12,593,561Other current liabilities 7,758 − 372,540 5,115 − 259,013Short-term debt − 25,000 296,703 − − −Long-term debt 125,000 147 6,004,625 125,000 397 6,334,870Other noncurrent liabilities 3,064 34,961 562,058 2,419 501 128,645
Total 158,680 1,031,896 19,866,934 154,291 936,709 19,316,089Net foreign currency denominated
financial instruments ($17,701) (MYR193,725) (P=3,149,205) $8,322 (MYR278,366) (P=2,996,951)
In translating the foreign currency-denominated monetary assets in peso amounts, the exchange ratesused were P=48.02 to US$1.00 and P=50.64 to US$1.00, the Philippine Peso - US dollar exchange ratesas of December 31, 2020 and 2019, respectively. The Philippine Peso- MY ringgit exchange rate as ofDecember 31, 2020 and 2019 used was P=11.87 to MYR1.00 and P=12.28 to MYR1.00, respectively.
The following table demonstrates the sensitivity to a reasonably possible change in the Philippine peso-US dollar exchange rate, with all variables held constant, of the Group’s profit before tax (due tochanges in the fair value of monetary assets and liabilities) and the Group’s equity.
Change in exchange rate
Effect on income before taxIncrease (decrease)
2020 2019USD P=1.00 (P=17,701) P=8,322 (P=1.00) 17,701 (8,322)
MYR P=1.00 (P=193,725) (P=278,366) (P=1.00) 193,725 278,366
There is no other impact on the Group’s equity other than those already affecting the net income.
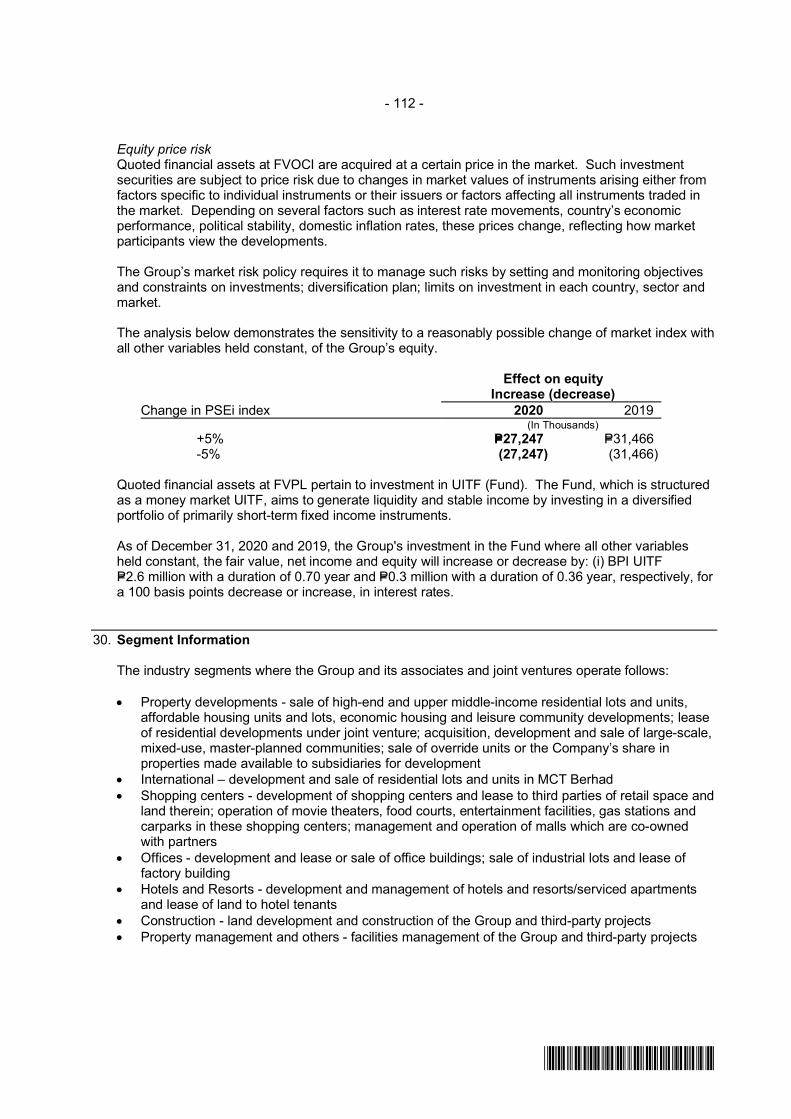
- 112 -
*SGVFSM005262*
Equity price riskQuoted financial assets at FVOCI are acquired at a certain price in the market. Such investmentsecurities are subject to price risk due to changes in market values of instruments arising either fromfactors specific to individual instruments or their issuers or factors affecting all instruments traded inthe market. Depending on several factors such as interest rate movements, country’s economicperformance, political stability, domestic inflation rates, these prices change, reflecting how marketparticipants view the developments.
The Group’s market risk policy requires it to manage such risks by setting and monitoring objectivesand constraints on investments; diversification plan; limits on investment in each country, sector andmarket.
The analysis below demonstrates the sensitivity to a reasonably possible change of market index withall other variables held constant, of the Group’s equity.
Effect on equityIncrease (decrease)
Change in PSEi index 2020 2019(In Thousands)
+5% P=27,247 P=31,466-5% (27,247) (31,466)
Quoted financial assets at FVPL pertain to investment in UITF (Fund). The Fund, which is structuredas a money market UITF, aims to generate liquidity and stable income by investing in a diversifiedportfolio of primarily short-term fixed income instruments.
As of December 31, 2020 and 2019, the Group's investment in the Fund where all other variablesheld constant, the fair value, net income and equity will increase or decrease by: (i) BPI UITFP=2.6 million with a duration of 0.70 year and P=0.3 million with a duration of 0.36 year, respectively, fora 100 basis points decrease or increase, in interest rates.
30. Segment Information
The industry segments where the Group and its associates and joint ventures operate follows:
Property developments - sale of high-end and upper middle-income residential lots and units,affordable housing units and lots, economic housing and leisure community developments; leaseof residential developments under joint venture; acquisition, development and sale of large-scale,mixed-use, master-planned communities; sale of override units or the Company’s share inproperties made available to subsidiaries for development
International – development and sale of residential lots and units in MCT Berhad Shopping centers - development of shopping centers and lease to third parties of retail space and
land therein; operation of movie theaters, food courts, entertainment facilities, gas stations andcarparks in these shopping centers; management and operation of malls which are co-ownedwith partners
Offices - development and lease or sale of office buildings; sale of industrial lots and lease offactory building
Hotels and Resorts - development and management of hotels and resorts/serviced apartmentsand lease of land to hotel tenants
Construction - land development and construction of the Group and third-party projects Property management and others - facilities management of the Group and third-party projects

- 113 -
*SGVFSM005262*
Assets, liabilities, revenues and expenses of the Strategic Landbank Management and Visayas-Mindanao segment were reallocated to other business segments namely, shopping centers,corporate businesses and residential developments according to the nature of the products andservices provided.
The Company and its subsidiaries generally account for inter-segment sales and transfers as if thesales and transfers were to third parties at current market prices.
Management committee monitors the operating results of its business units separately for thepurpose of making decisions about resource allocation and performance assessment.
For the years ended December 31, 2020, 2019 and 2018, there were no revenue transactions with asingle external customer which accounted for 10% or more of the consolidated revenue from externalcustomers.

- 114 -
*SGVFSM005262*
Business segmentsThe following tables regarding business segments present assets and liabilities as of December 31 and revenue and profit information for each of the three years in theperiod ended December 31 (in millions):
2020
PropertyDevelopment International
ShoppingCenters Offices
Hotels andResorts Construction
PropertyManagement
and Others CorporateIntersegmentAdjustments Consolidated
RevenueRevenues from contracts with customers P=53,014 P=4,845 P=− P=− P=3,388 P=3,279 P=2,971 P=− P=− P=67,497Interest income from real estate sales 8,603 − − − − − − − − 8,603Rental revenue − − 9,063 9,405 − − − − − 18,468Intersegment sales − − − − − 32,601 − − (32,601) −Equity in net earnings of associates and joint ventures 148 − 2 380 − (4) (4) 65 − 587Total revenue 61,765 4,845 9,065 9,785 3,388 35,876 2,967 65 (32,601) 95,155Real estate costs and expenses 40,897 3,917 7,156 1,653 4,079 34,886 5,244 225 (33,372) 64,685Gross margin (loss) 20,868 928 1,909 8,132 (691) 990 (2,277) (160) 771 30,470Interest and investment income 395Other charges (3,789)Interest and other financing charges (12,746)Other income 723Provision for income tax (4,059)Net income P=10,994Net income attributable to: Equity holders of Ayala Land, Inc. 8,727 Non-controlling interests 2,267
P=10,994Other InformationSegment assets P=557,840 P=23,233 P=205,505 P=106,848 P=55,147 P=49,218 P=11,607 P=93,761 (P=420,388) P=682,771Investment in associates and joint ventures 17,101 − 38 − − 52 188 9,222 − 26,601
574,941 23,233 205,543 106,848 55,147 49,270 11,795 102,983 (420,388) 709,372Deferred tax assets 1,818 96 1,178 309 324 145 220 1,485 6,547 12,122Total assets P=576,759 P=23,329 P=206,721 P=107,157 P=55,471 P=49,415 P=12,015 P=104,468 (P=413,841) P=721,494Segment liabilities P=235,380 P=12,605 P=79,334 P=24,521 P=19,059 P=40,451 P=5,989 P=197,589 (P=160,762) P=454,166Deferred tax liabilities 2,888 − 186 127 12 1 21 (112) 4,026 7,149Total liabilities P=238,268 P=12,605 P=79,520 P=24,648 P=19,071 P=40,452 P=6,010 P=197,477 (P=156,736) P=461,315Segment additions to:Property and equipment P=211 P=83 P=73 P=40 P=991 P=335 P=630 P=735 P=− P=3,098Investment properties P=1,032 P=463 P=1,188 P=1,030 P=46 P=68 P=23 P=1,766 P=− P=5,616Depreciation and amortization P=618 P=189 P=4,411 P=1,779 P=875 P=998 P=483 P=220 P=− P=9,573Non-cash expenses other than depreciation and amortization P=− P=− P=− P=− P=− P=− P=− P=− P=− P=−Impairment losses P=37 P=− P=288 P=331 P=− P=− P=97 P=225 P=− P=978

- 115 -
*SGVFSM005262*
2019
PropertyDevelopment International
ShoppingCenters Offices
Hotels andResorts Construction
PropertyManagement
and Others CorporateIntersegmentAdjustments Consolidated
RevenueRevenues from contracts with customers P=102,981 P=6,709 P=− P=− P=7,624 P=3,395 P=5,453 P=− P=− P=126,162Interest income from real estate sales 7,891 − − − − − − − 7,891Rental revenue − − 22,019 9,668 − − − − − 31,687Intersegments sales − − − − − 61,557 − (61,557) −Equity in net earnings of associates and joint ventures 698 − 14 − − − − 254 − 966Total revenue 111,570 6,709 22,033 9,668 7,624 64,952 5,453 254 (61,557) 166,706Real estate costs and expenses 75,986 4,665 8,921 3,197 5,667 60,423 5,778 976 (61,494) 104,119Gross margin (loss) 35,584 2,044 13,112 6,471 1,957 4,529 (325) (722) (63) 62,587Interest and investment income 930Other charges (1,645)Interest and other financing charges (12,200)Other income 1,158Provision for income tax (13,315)Net income P=37,515Net income attributable to: Equity holders of Ayala Land, Inc. 33,188 Non-controlling interests 4,327
P=37,515Other InformationSegment assets P=556,914 P=− P=204,115 P=105,863 P=81,288 P=55,349 P=6,731 P=63,481 (P=396,663) P=677,078Investment in associates and joint ventures 24,938 − 36 − − 55 192 97 − 25,318
581,852 − 204,151 105,863 81,288 55,404 6,923 63,578 (396,663) 702,396Deferred tax assets 1,890 − 811 170 333 85 60 1,351 6,827 11,527Total assets P=583,742 P=− P=204,962 P=106,033 P=81,621 P=55,489 P=6,983 P=64,929 (P=389,836) P=713,923Segment liabilities P=242,826 P=− P=135,933 P=55,563 P=64,617 P=46,101 P=3,274 P=52,870 (P=136,057) P=465,127Deferred tax liabilities 1,902 − 189 125 9 − − 24 3,842 6,091Total liabilities P=244,728 P=− P=136,122 P=55,688 P=64,626 P=46,101 P=3,274 P=52,894 (P=132,215) P=471,218Segment additions to:Property and equipment P=254 P=1,891 P=1,652 P=41 P=4,151 P=1,752 P=131 P=648 P=− P=10,520Investment properties P=4,970 P=8,733 P=19,446 P=3,012 P=201 P=163 P=262 P=232 P=− P=37,019Depreciation and amortization P= 676 P= 85 P= 3,949 P=1,769 P= 783 P=975 P= 454 P= 368 P=− P=9,059Non-cash expenses other than depreciation and amortization P=− P=− P=− P=− P=− P=− P=− P=− P=− P=−Impairment losses P=− P=− P=256 P=− P=− P=11 P=189 P=113 P=− P=569

- 116 -
*SGVFSM005262*
2018
PropertyDevelopment International
ShoppingCenters Offices
Hotels andResorts Construction
PropertyManagement
and Others CorporateIntersegmentAdjustments Consolidated
RevenueRevenues from contracts with customers P=105,753 P=7,602 P=− P=− P=6,387 P=2,394 P=5,297 P=− P=− P=127,433Interest income from real estate sales 7,042 – – – – – – – – 7,042Rental revenue − − 19,908 8,614 − − − − − 28,522Intersegments sales − − − − − 69,027 − − (69,027) −Equity in net earnings of associates and joint ventures 451 − 10 − − − − 289 − 750Total revenue 113,246 7,602 19,918 8,614 6,387 71,421 5,297 289 (69,027) 163,747Real estate costs and expenses 81,662 5,528 9,001 3,204 4,994 66,111 5,919 1,302 (67,541) 110,180Gross margin (loss) 31,584 2,074 10,917 5,410 1,393 5,310 (622) (1,013) (1,486) 53,567Interest and investment income 958Other charges (1,271)Interest and other financing charges (9,594)Other income 1,541Provision for income tax (11,984)Net income P=33,217Net income attributable to: Equity holders of Ayala Land, Inc. P=29,241 Non-controlling interests 3,976
P=33,217Other InformationSegment assets P=274,128 P=21,774 P=69,488 P=46,013 P=34,190 P=54,955 P=6,590 P=460,890 (P=335,639) P=632,389Investment in associates and joint ventures 21,667 − 38 − − 56 − 1,629 − 23,390
295,795 21,774 69,526 46,013 34,190 55,011 6,590 462,519 (335,639) 655,779Deferred tax assets 3,164 − 333 137 339 56 44 2,615 6,353 13,041Total assets P=298,959 P=21,774 P=69,859 P=46,150 P=34,529 P=55,067 P=6,634 P=465,134 (P=329,286) P=668,820Segment liabilities P=170,872 P=10,348 P=27,659 P=16,855 P=13,631 P=47,355 P=3,176 P=264,436 (P=111,628) P=442,704Deferred tax liabilities 1,721 − 271 40 10 4 8 18 3,823 5,895Total liabilities P=172,593 P=10,348 P=27,930 P=16,895 P=13,641 P=47,359 P=3,184 P=264,454 (P=107,805) P=448,599Segment additions to:Property and equipment (P=1,008) P=4,570 (P=426) P=833 P=524 P=2,774 P=833 (P=658) P=– P=7,442Investment properties P=4,289 P=7,683 P=6,143 P=3,883 P=3,337 P=787 (P=1) P=16,881 (P=438) P=42,564Depreciation and amortization P=707 P=618 P=2,537 P=1,555 P=207 P=1,475 P=242 P=266 (P=1,475) P=6,132Non-cash expenses other than depreciation and amortization P=– P=– P=– P=– P=– P=– P=– P=– P=– P=–Impairment losses P=− P=– (P=2) P=– P=– P=– P=142 P=7 P=– P=147

- 117 -
*SGVFSM005262*
31. Performance Obligations
Information about the Group’s performance obligations are summarized below:
Real estate salesThe Group entered into contracts to sell with one identified performance obligation which is the saleof the real estate unit together with the services to transfer the title to the buyer upon full payment ofcontract price. The amount of consideration indicated in the contract to sell is fixed and has novariable consideration.
The sale of real estate unit may cover the contract for either the (i) serviced lot; (ii) service lot andhouse, and (ii) condominium unit and the Group concluded that there is one performance obligation ineach of these contracts. The Group recognizes revenue from the sale of these real estate projectsunder pre-completed contract over time during the course of the construction.
Payment commences upon signing of the contract to sell and the consideration is payable in cash orunder various financing schemes entered with the customer. The financing scheme would includepayment of 10% of the contract price spread over a certain period (e.g., one to two years) at a fixedmonthly payment with the remaining balance payable (a) in full at the end of the period either throughcash or external financing; or (b) through in-house financing which ranges from two (2) to ten (10)years with fixed monthly payment. The amount due for collection under the amortization schedule foreach of the customer does not necessarily coincide with the progress of construction, which results toeither an unbilled receivable or customers’ deposit.
After the delivery of the completed real estate unit, the Group provides one year warranty to repairminor defects on the delivered serviced lot and house and condominium unit. This is assessed by theGroup as a quality assurance warranty and not treated as a separate performance obligation.
Hotels and resortsRooms revenue from hotel and resort operations is recognized when the services are rendered.Revenue from banquets and other special events are recognized when the events take place.
ConstructionRevenue from fixed price construction contracts are recognized overtime using the milestone-basedrevenue recognition which is in reference to output method. The output method is determined basedon the start and completion of a task of the contract work inclusive of uninstalled goods and materialsdelivered to the site.
The transaction price allocated to the remaining performance obligations (unsatisfied or partiallysatisfied) as at December 31, 2020 and 2019 are as follows:
2020 2019(In Thousands)
Within one year P=31,535,337 P=42,267,120More than one year 62,554,555 56,363,261
P=94,089,892 P=98,630,381
The remaining performance obligations expected to be recognized within one year and in more thanone year relate to the continuous development of the Group’s real estate projects. The Group’scondominium units are completed within three to five years, from start of construction while servicedlots and serviced lots and house are expected to be completed within two to three years from start ofdevelopment.
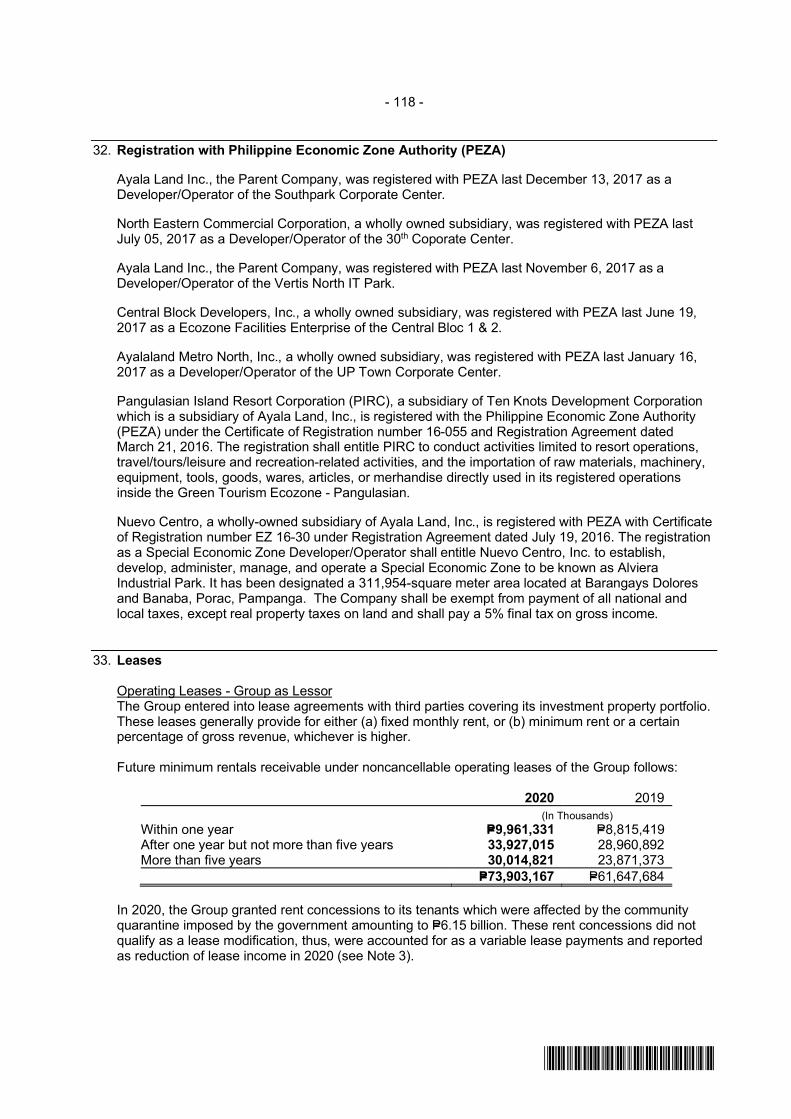
- 118 -
*SGVFSM005262*
32. Registration with Philippine Economic Zone Authority (PEZA)
Ayala Land Inc., the Parent Company, was registered with PEZA last December 13, 2017 as aDeveloper/Operator of the Southpark Corporate Center.
North Eastern Commercial Corporation, a wholly owned subsidiary, was registered with PEZA lastJuly 05, 2017 as a Developer/Operator of the 30th Coporate Center.
Ayala Land Inc., the Parent Company, was registered with PEZA last November 6, 2017 as aDeveloper/Operator of the Vertis North IT Park.
Central Block Developers, Inc., a wholly owned subsidiary, was registered with PEZA last June 19,2017 as a Ecozone Facilities Enterprise of the Central Bloc 1 & 2.
Ayalaland Metro North, Inc., a wholly owned subsidiary, was registered with PEZA last January 16,2017 as a Developer/Operator of the UP Town Corporate Center.
Pangulasian Island Resort Corporation (PIRC), a subsidiary of Ten Knots Development Corporationwhich is a subsidiary of Ayala Land, Inc., is registered with the Philippine Economic Zone Authority(PEZA) under the Certificate of Registration number 16-055 and Registration Agreement datedMarch 21, 2016. The registration shall entitle PIRC to conduct activities limited to resort operations,travel/tours/leisure and recreation-related activities, and the importation of raw materials, machinery,equipment, tools, goods, wares, articles, or merhandise directly used in its registered operationsinside the Green Tourism Ecozone - Pangulasian.
Nuevo Centro, a wholly-owned subsidiary of Ayala Land, Inc., is registered with PEZA with Certificateof Registration number EZ 16-30 under Registration Agreement dated July 19, 2016. The registrationas a Special Economic Zone Developer/Operator shall entitle Nuevo Centro, Inc. to establish,develop, administer, manage, and operate a Special Economic Zone to be known as AlvieraIndustrial Park. It has been designated a 311,954-square meter area located at Barangays Doloresand Banaba, Porac, Pampanga. The Company shall be exempt from payment of all national andlocal taxes, except real property taxes on land and shall pay a 5% final tax on gross income.
33. Leases
Operating Leases - Group as LessorThe Group entered into lease agreements with third parties covering its investment property portfolio.These leases generally provide for either (a) fixed monthly rent, or (b) minimum rent or a certainpercentage of gross revenue, whichever is higher.
Future minimum rentals receivable under noncancellable operating leases of the Group follows:
2020 2019(In Thousands)
Within one year P=9,961,331 P=8,815,419After one year but not more than five years 33,927,015 28,960,892More than five years 30,014,821 23,871,373
P=73,903,167 P=61,647,684
In 2020, the Group granted rent concessions to its tenants which were affected by the communityquarantine imposed by the government amounting to P=6.15 billion. These rent concessions did notqualify as a lease modification, thus, were accounted for as a variable lease payments and reportedas reduction of lease income in 2020 (see Note 3).

- 119 -
*SGVFSM005262*
Group as LesseeThe Group entered into lease agreements with third parties. These leases generally provide foreither (a) fixed monthly rent, or (b) minimum rent or a certain percentage of gross revenue, whicheveris higher.
Future minimum rentals payable under noncancellable operating leases of the Group follows:
2020 2019(In Thousands)
Within one year P=2,761,184 P=1,126,912After one year but not more than five years 7,534,150 4,598,276More than five years 52,179,626 56,765,009
P=62,474,960 P=62,490,197
Set out below are the carrying amounts of right-of-use assets recognized and the movements in 2020and 2019:
2020Land Building Aircraft Others Total
(in thousands)CostAt January 1 P=14,710,930 P=216,836 P=1,595,614 P=219,920 P=16,743,300Additions − 25,488 106,209 64,653 196,350At December 31 14,710,930 242,324 1,701,823 284,573 16,939,650Accumulated Depreciation and
AmortizationAt January 1 2,769,184 139,603 245,608 24,433 3,178,828Depreciation 440,221 32,270 190,186 83,056 745,733Capitalized as investment
property − 6,183 − 731 6,914At December 31 3,209,405 178,056 435,794 108,220 3,931,475Net Book Value P=11,501,525 P=64,268 P=1,266,029 P=176,353 P=13,008,175
2019Land Building Aircraft Others Total
(in thousands)CostAt January 1, as previously
reported P=− P=− P=− P=− P=−Effect of adoption of standard 14,482,586 187,042 1,595,614 219,920 16,485,162At January 1, as restated 14,482,586 187,042 1,595,614 219,920 16,485,162Additions 228,344 29,794 − − 258,138At December 31 14,710,930 216,836 1,595,614 219,920 16,743,300Accumulated Depreciation and
AmortizationAt January 1 − − − − −Effect of adoption of standard 2,265,749 89,223 86,047 19,549 2,460,568At January 1, as restated 2,265,749 89,223 86,047 19,549 2,460,568Depreciation 408,306 50,380 159,561 1,298 619,545Capitalized as investment
property 95,129 − − 3,586 98,715At December 31 2,769,184 139,603 245,608 24,433 3,178,828Net Book Value P=11,941,746 P=77,233 P=1,350,006 P=195,487 P=13,564,472

- 120 -
*SGVFSM005262*
The rollforward analysis of lease liabilities follows:
2020 2019At January 1, 2020 P=17,463,705 P=16,985,922Additions 171,901 251,419Accretion of interest expense (Note 22) 1,430,607 1,066,543Capitalized interest 24,210 388,242Foreign exchange gain (loss) 94 (48,776)Payments (1,334,674) (1,179,645)As at December 31, 2020 P=17,755,843 P=17,463,705Current lease liabilities 466,801 724,859Noncurrent lease liabilities P=17,289,042 P=16,738,846
The following are the amounts recognized in the consolidated statement of income:
2020 2019Depreciation expense of right-of-use assets P=745,733 P=619,545Accretion of interest expense on lease liabilities
(Note 22) 1,430,607 1,066,543Rent expense - short-term leases 4,562 7,031Rent expense - variable lease payments 306,813 323,093Foreign exchange (gain) loss 94 (48,776)Total amounts recognized in the consolidated
statement of income P=2,487,809 P=1,967,436
The Group has lease contracts for land that contains variable payments based on a certainpercentage of gross rental income of the commercial centers. These terms are negotiated bymanagement for certain commercial spaces without steady customer demand. Management’sobjective is to align the lease expense with the revenue earned. The following provides information onthe Group’s variable lease payments, including the magnitude in relation to fixed payments:
2020
Fixed PaymentsVariable
Payments TotalFixed P=1,504,945 P=− P=1,504,945Variable rent with minimum payment 115,669 164,885 280,554Variable rent only − 146,490 146,490At December 31 P=1,620,614 P=311,375 P=1,931,989
2019
Fixed PaymentsVariable
Payments TotalFixed P=1,098,425 P=− P=1,098,425Variable rent with minimum payment 151,221 159,229 310,450Variable rent only − 170,895 170,895At December 31 P=1,249,646 P=330,124 P=1,579,770
The significant leases entered into by the Group are as follows:
Parent CompanyOn January 2017, the Parent Company signed a Lease Agreement with Philippine Racing Club, Inc.for the lease of land located in Circuit Makati, Brgy. Carmona, Makati City with an aggregate area of12,793 sqm. The term of the lease shall be twenty-three years and three months commencing fromDelivery Date. The Lessee shall have the option to renew the lease under the same terms andconditions for another period of five years, provided that renewal period shall be mutually agreed bythe Parties. For the period commencing from delivery date until sixty-three (63) months thereafter, theLessee shall pay the Lessor the rent amounting to P=100.00 million. Commencing on the sixty fourth

- 121 -
*SGVFSM005262*
month from execution of the contract until the end of the lease term, the Lessee shall pay the Lessorthe rent equal to fifty percent (50%) of the Gross Income of the Lessee.
On September 2018, the Parent Company signed a Lease Agreement with Manila Seedling BankFoundation, Inc. (MSBFI) for the lease of a 4.5-hectare portion of land located at the corner of EDSAand Quezon Avenue, Diliman, Quezon City. The term of the lease shall be coterminous with theLessor’s usufruct over the Leased Premises, or until September 20, 2027.
Bay CityOn September 2, 2014, Parent Company signed a Lease Agreement with D.M. Wenceslao &Associates Inc. for the lease of several parcels of land along Asean Avenue and MacapagalBoulevard, Aseana City, Paranaque City with an aggregate area of 92,317 sqm. Parent Companysigned a 45-year lease contract with an option to renew for another 45 years subject to such termsand conditions as may be mutually agreed upon by the lessor and the Parent Company. The ParentCompany assigned the parcels of land to Bay City in December 2017.
ALI also signed the Air Rights and Basement Rights over the leased property with an aggregate areaof 1,686.48 sqm and 8,294 sqm, respectively, subject to the same terms and conditions as thecontract of lease dated September 2, 2014.
AMNIOn January 28, 2011, the Board of Regents of the University of the Philippines awarded to the ParentCompany the P=4.0 billion development of a 7.4-hectare lot at the University of the Philippines’ DilimanEast Campus, also known as the UP Integrated School, along Katipunan Avenue, Quezon City. TheParent Company signed a 25-year lease contract for the property last June 22, 2011, with an optionto renew for another 25 years subject to mutual agreement of the parties. The lease payments shallcommence as soon as sales are registered by the merchants. The rights were subsequently assignedby ALI to the Company in 2015.
A retail establishment with about 63,000 sqm of gross leasable area and an office/BPO building about8,000 sqm of gross leasable area have been constructed on the property.
NTDCCThe Company entered into an assignment agreement with MRTDC wherein the latter has assignedits development rights to the Company in exchange for the Company's assumption of DRP obligationbeginning January 1, 2006. The DRP obligation is payable annually for 42 years from the date ofassumption, renewable upon expiration with escalation rate of 3% annually starting inception.
In consideration of the lease, the Group will be charged an annual rent related to the original DRPobligation on the MRTDC and 5% of the rental income from the Group’s commercial center business.Of the 5% variable amount due, 2.42% shall be directly paid by the Group to the minorityshareholders of Monumento Rail Transit Corporation, 28.47% shall be paid directly to Metro GlobalHoldings Corporation and the remaining 69.11% shall be applied against receivables.
On January 13, 2006, the deed of assignment between MRTDC and NTDCC was acknowledged byDOTC making MRTDC and NTDCC jointly and severally liable for the DRP and all other obligationsattached thereto. NTDCC has been paying rent to DOTC in behalf of MRTDC since January 1, 2006.The DRP obligation is payable annually for 42 years from the date of assumption, renewable uponexpiration. As of December 31, 2020 and 2019, the DRP obligation amounted to P=3,703.3 millionand P=3,778.2 million, respectively.Total DRP obligation paid amounted to P=244.0 million andP=236.4 million in 2020 and 2019, respectively.
On October 29, 2015, the Company entered into a non-cancellable land lease agreement with GERIfor the lease of an aggregate of 10,994.86 square meters undivided portions of the North Avenue LotPad A and North Avenue Lot Pad B to which the latter is entitled to development rights. Theagreement shall be effective until August 8, 2047, subject to the extension of the development rightsperiod.

- 122 -
*SGVFSM005262*
During 2016, the Company entered into non-cancellable land lease agreement with Anglo, DBH andAllante which shall be effective until August 8, 2047.
ALICAPIn December 2017, the Company entered into 120-month lease agreement with NAC Aviation for abrand new ATR72-600 with MSN 1440 which will commence at the date of delivery. Commitment feeor refundable deposit required for the lease amounted to US$0.42 million. The ATR72-600 with MSN1440 was delivered to the Company in February 2018 and has started flight operations in March2018. The Company, per lease contract, has the option to purchase the ATR72-600 with MSN 1440at the end of lease term for US$14.16 million.
In June 2018, the Company entered into another 120-month lease agreement with NAC Aviation for abrand new ATR72-600 with MSN 1492 which will commence at the date of delivery. Commitment feeor refundable deposit required for the lease amounted to US$0.42 million. The ATR72-600 with MSN1492 was delivered to the Company on the same month and has started flight operations in August2018. The Company, per lease contract, has the option to purchase the ATR72-600 with MSN 1440at the end of lease term amounting to US$14.16 million.
AHRCOn January 30, 2018, the Company signed a Lease Agreement with Dunes & Eagle LandDevelopment Corporation for the lease of ten parcels of land located at Barangay Mactan, Lapu-LapuCity, Mactan Island, Cebu with an aggregate area of 144,087 sqm. The term of the lease shall be fora period of fifty (50) years commencing from the date of execution of the agreement. Rent paymentshould be as follows: (a) P=70 million per annum for the first 5 years (b) 5% of Gross Revenues orP=70 million per annum whichever is higher for the 6th year to the 30th year, and (c) 5.5%of GrossRevenues or P=70 million per annum whichever is higher for the 31st year to the 50th year.
On July 26, 2012, ALI entered into a renewable contract of lease with Province of Negros Occidentalfor 40,481 square meters area of land with a monthly lease of P=73.00 per square meter which shallbe escalated every five years by ten percent (10%) of the current rate of rent. The term of the leaseshall be for a period of fifty (50) years commencing from the date of delivery subject to renewal bymutual agreement of the parties under such terms and conditions as may be mutually acceptable.The Company has assessed that the lease agreement is a non-cancellable lease. On December 23,2014, ALI assigned its rights and obligations to Capitol Central Hotel Ventures, Inc. under theContract of Lease Assignment over a portion on which Seda Capitol Central was constructedequivalent to an area of 3,714.80 square meters. The agreement on lease assignment transfers andconveys the Company to take over the lease of the assigned portion subject to the same terms andconditions contained in the contract of lease.
Bonifacio Hotel Ventures, Inc. entered into a non-cancellable and renewable contract of lease withFort Bonifacio Development Corporation for the land on which Seda BGC Tower 1 was constructedwith initial term of twenty-five (25) years commencing from the date that the Hotel first commencesbusiness or start of commercial operation. The lease agreement provides for the payment of rentbased on 3% of the Hotel’s gross income for its 1st year of operation, 4% of the Hotel’s gross incomefor its 2nd year of operation, and 5% of the Hotel’s gross income for the succeeding years or P=350per square meter for the 1st year, P=375 per square meter for the 2nd year and P=400 per squaremeter for the 3rd year, whichever is higher, and starting on the 4th year of operations, rent shall beescalated at a rate of 3% per year until the end of the lease period. The Company entered intoanother non-cancellable and renewable contract of lease with Fort Bonifacio DevelopmentCorporation for the land on which the Seda BGC Tower 2 was constructed with initial term of twenty-five (25) years commencing from the date that the Hotel first commences business or start ofcommercial operation. The lease agreement provides for the payment of rent based on 3% of theHotel’s gross income for its 1st year of operation, 4% of the Hotel’s gross income for its 2nd year ofoperation, and 5% of the Hotel’s gross income for the succeeding years or P=575 per square meter forthe 1st year, P=616.06 per square meter for the 2nd year and P=657.15 per square meter for the 3rdyear, whichever is higher, and starting on the 4th year of operations, rent shall be escalated at a rateof 3% per year until the end of the lease period.

- 123 -
*SGVFSM005262*
ALLHCOn August 28, 1990, the Company, through a Deed of Assignment, acquired all the rights, titles,interests and obligations of Gotesco Investment, Inc. in a contract of lease of the land owned by PNRfor the Tutuban Terminal. The contract provided for a payment of a guaranteed minimum annualrental plus a certain percentage of gross sales. The lease covers a period of 25 years until 2014 andis automatically renewable for another 25 years, subject to compliance with the terms and conditionsof the lease agreement. On December 22, 2009, ALLHC entered into an agreement with PNR for therenewal of its lease contract for another 25 years beginning September 5, 2014.
SSECCThe Company has an existing contract with Bases Conversion and Development Authority (BCDA) todevelop, under a lease agreement signed on July 2000, a mall with an estimated gross leasable areaof 152,000 sqm on a 9.8-hectare lot inside Fort Bonifacio. Subsequently, the Company transferred itsrights and obligations granted to or imposed under the lease agreement to SSECC, a subsidiary, inexchange for equity. The lease agreement covers 25 years, renewable for another 25 years subjectto reappraisal of the lot at market value. The annual fixed lease rental amounts to P=106.5 millionwhile the variable rent ranges from 5% to 20% of gross revenues.
CapitolOn April 26, 2012 Parent Company signed a Lease Agreement with the Province of NegrosOccidental for the lease of a parcel of land with an aggregate area of 40,481 sq. m. located alongGatuslao cor. North and South Capitol Roads, Bacolod City, registered in the name of the Province ofNegros Occidental. The Parent Company signed a 50-year lease contract with an option to renew asmay be mutually agreed upon by the lessor and the Company. The Parent Company assigned theparcels of land to Capitol in December 2017.
ArvoOn October 15, 2014, Arvo entered into a property lease agreement with Rotonda DevelopmentCorporation for the construction, development and operation of a commercial and mall center. Theterms of the lease shall be 42 years, with an option to renew for another 40 years subject to mutualagreement of the parties. The lease agreement provided rent-free period of 2 years and leasepayments shall commence thereafter. Lease payments shall be paid annually at P=60.00 per sqm,subject to an annual escalation of 4%.
The Group performed impairment testing on its right-of-use assets with a carrying value ofP=198.2 million as of December 31, 2020, by assessing its recoverable amount through estimation ofits value in use. Based on the impairment testing, there is no impairment loss on the Group’s hoteland resorts right-of-use assets (see Note 3).
34. Interest in Joint Operation
MDC has a 51.0% interest in Makati Development Corporation - First Balfour, Inc. Joint Venture (theJoint Venture), a joint operation whose purpose is to design and build St. Luke’s Medical Center (theProject) in Fort Bonifacio Global City, Taguig. The application of PFRS 11 does not have significantimpact on the Group’s accounting of its interest in joint operation since it already reported its share ininterest in joint operation using proportionate consolidation.
The Project, which started on January 31, 2007, is a world-class medical facility comprising, more orless, of a 611-bed hospital and a 378-unit medical office building, with an approximate gross floorarea of 154,000 sqm, which meets international standards, and all standards and guidelines ofapplicable regulatory codes of the Philippines and complies with the criteria of the Environment ofCare of the Joint Commission International Accreditation. The project was completed on October 30,2009. Activities in 2011 to 2020 mainly pertain to winding down operations.

- 124 -
*SGVFSM005262*
MDC classified its joint arrangement with First Balfour, Inc. as “Joint Operation” since the jointarrangement’s legal form does not confer separation between the parties and separate vehicle, theparties have the rights to the assets and obligations for the liabilities in proportion to the interestsagreed by parties and there is an indication that the parties have no rights to the net assets of theJoint Operation.
The share of MDC in the net assets and liabilities of the Joint Venture at December 31, 2020 and2019 which are included in the consolidated financial statements follow:
2020 2019(In Thousands)
Current assets:Cash and cash equivalents P=7,078 P=7,100Other current assets 37,368 37,368Total assets P=44,446 P=44,468Total liabilities P= P=‒
The following is the share of the MDC on the net income of the Joint Venture:
2020 2019(In Thousands)
Construction costs (P=7) (P=125)Interest and other income (charges) (14) 6,315Income before income tax (21) 6,190Provision for final tax (1) (14)Net income (loss) (22) P=6,176
There were no dividends declared in 2020 and 2019. Provision for income tax pertains to the final taxon interest income.
35. Long-term Commitments and Contingencies
Commitmentsa. On December 8, 2017, ALI assigned to NTDCC development rights on certain portions of the
North Triangle lot pads covered by a Deed of Assignment and Encroachment SettlementAgreement amounting to P=631.2 million.
b. ALI and LT Group, Inc. (LTG) entered into an agreement on January 21, 2016 to jointly develop aproject along the C5 corridor. The project is envisioned to be an estate development that spansportions of Pasig City and Quezon City. A new company named, ALI-ETON PropertyDevelopment Corporation, was incorporated on May 13, 2016.
On January 15, 2018, the estate, named Parklinks was launched and is the greenest urbanestate of Ayala Land in partnership with Eton Properties Inc. The first residential project of AyalaLand Premier, Parklinks North Tower was launched on the same year, while the Parklinkslifestyle mall broke ground as well, expected to provide a new destination for residents and officeworkers within the area when it opens in 2025. With the brisk residential sales of ALP’s firstproject, the Parklinks South tower was launched in 2019, together with Alveo’s first residentialdevelopment “The Lattice”.
Also set to rise within the estate will be an iconic bridge that will conveniently connect the QC andPasig parcels, offering a new route that can help ease vehicular traffic in the north eastern andeastern portions of Metro Manila. The bridge is expected to be completed by late 2021.

- 125 -
*SGVFSM005262*
c. On August 11, 2015, the Group won the bid for the Integrated Transport System Project – SouthTerminal (“ITS South Project"). The Company was awarded by the Department of Transportationand Communications (“DOTC”) with a 35-year concession agreement to build and operate theITS South Project and will likewise have the right to develop and operate commercial leasingfacilities on the same 5.57 hectare former Food Terminal Inc. property on which the futuretransport terminal will be built. The site of the ITS South Project is right next to ARCA South,where the Company is developing an integrated mixed-use estate.
d. On June 30, 2015, the Parent Company, through SM-ALI Group Consortium (the Consortium),participated and won in the bidding for Lot No. 8-B-1, containing an area of 263,384 sqm, whichis portion of Cebu City-owned lot located at the South Road Properties, Cebu City covered byTransfer Certificate of Title No. 107-2011000963. The Consortium is a consortium among SMPHI,the Company and CHI (together with the Company collectively referred to as the “ALI Group”).Consistent with the agreed payment schedule in the Deed of Absolute Sale, as of August 1, 2018the ALI Group has fully paid P=4.56 billion, excluding taxes. The SM-ALI Group finished the jointmasterplan and secured the development permit last November 2019 from the Cebu City Council.
On January 29, 2020, SM-ALI Group broke ground the 263,384sqm development and theconstruction of road networks and underground utilities commence on February 18, 2020.
As of December 2020, the construction completion is at 47.51% and is forecasted to be finishedin May 2022.
The development is positioned to be the Entertainment Capital of the Region which are theepicenter of fun, strategically located and accessible and celebrated Cebu experience.
It is envisioned to create a commercially viable mixed-use development and to create a living,vibrant community with world-class facilities, a well-designed urban setting, and lush, extensivelandscaping.
e. On August 8, 1997, an “Assignment Agreement” was executed between Department ofTransportation and Communications (DOTC), Metro Rail and MRTDC whereby MRTDC agreedto be bound by all obligations in respect of the Development Rights and make payments toDOTC.
f. On June 4, 2014, AHRC, a wholly owned subsidiary of the Parent Company has signed along-term management agreement with the Mandarin Oriental Hotel Group to develop andoperate luxury hotel in Makati City. Set to open its doors by 2023, the new Mandarin OrientalManila will be featuring 276 spacious rooms complemented by an extensive range of modernamenities including premium selection of restaurants and a signature spa. AHRC is committed topay $5 million (P=223.6 million) to Manila Mandarin Hotel, Inc. upon the opening of the New Hotelor June 30, 2017, whichever is earlier. In 2017, the Group fully paid the said amount.
g. On May 12, 2014, ALI has signed the terms of reference with Sureste Properties, Inc. (SPI), awholly owned subsidiary of Bloomberry Resorts Corp. (BLOOM) for the retail area to be openedin the new Phase 1-A of Solaire Resort & Casino. The Company will be the leasing andmarketing agent of the said area with gross leasable area of more than 5,000 sqm.
ContingenciesThe Group has various contingent liabilities arising in the ordinary conduct of business including acase related to property restriction violation. The estimate of the probable cost for the resolution ofthis claim has been developed in consultation with outside counsel handling the defense in this matterand is based upon an analysis of potential results. In the opinion of management and its legalcounsel the eventual liability under these lawsuits or claims, if any, will not have a material or adverseeffect on the Group’s financial position and results of operations. Accordingly, no provision for anyliability has been made in the consolidated financial statements.

- 126 -
*SGVFSM005262*
Disclosures required by PAS 37, Provisions, Contingent Liabilities and Contingent Assets, were notprovided as it may prejudice the Group’s position in ongoing claims and it can jeopardize the outcomeof the claims and contingencies.
36. Concession Agreement with Department of Transportation (DOTr)
On January 26, 2016, the Group through ASITI entered into a Concession Agreement (CA) with theDepartment of Transportation (DOTr). The CA sets forth the rights and obligations of ASITI asconcessionaire, including the construction and operation of the South Integrated Transport SystemProject (the Project) of DOTr. During the concession period, DOTr will monitor and review theperformance of the concessionaire.
The concession will run for a period of 35 years from the start of the construction of the Project.Under the terms of the concession agreement, ASITI will design, engineer, construct, operate andmaintain a mass transportation intermodal terminal at the outskirts of Metro Manila. The operation ofthe Project includes the collection and remittance of terminal fees to DOTr of the concessionaireduring the concession period. In addition, ASITI will be permitted to develop and operate commercialleasing facilities.
Upon the start of the construction of the Project, DOTr will give ASITI the full, exclusive anduninterrupted use and possession of a 5.57 hectare property known as the Project Land. Ownershipof the Project Land shall remain with DOTr at all times while the possession, custody and risk of lossor deterioration of the Project and commercial assets shall vest in the concessionaire during theconcession period. ASITI shall transfer the Project and the related assets, free from any liens orencumbrances, to DOTr at the end of the concession period. ASITI will be entitled to annualpayments from DOTr amounting to P=277.9 million during the 35-year concession period, subject tomeeting benchmarks set for certain key performance indicators enumerated in the CA.
As of December 31, 2020, construction of the Project has not yet commenced.
37. Notes to Consolidated Statements of Cash Flows
Disclosed below is the rollforward of liabilities under financing activities:
2020
January 1, 2020 Cash flowsNon-cashchanges
Foreignexchange
movementDecember 31,
2020(In Thousands)
Short-term debt P=18,032,830 (P=8,901,505) P=− P=− P=9,131,325Current long-term debt 17,250,706 (17,250,706) 18,732,401 − 18,732,401Non-current long-term debt 175,813,346 27,332,917 (18,732,401) (326,670) 184,087,192Dividends payable (Note 15) 632,000 (5,328,246) 4,937,852 − 241,606Lease liabilities 17,463,705 (1,334,674) 1,626,718 94 17,755,843Deposits and other noncurrent liabilities 44,003,636 5,706,022 330,512 − 50,040,170Total liabilities from financing activities P=273,196,223 P=223,808 P=6,895,082 (P=326,576) P=279,988,537
2019
January 1, 2019 Cash flowsNon-cashchanges
Foreignexchange
movementDecember 31,
2019(In Thousands)
Short-term debt P=14,386,717 P=3,646,113 P=− P=− P=18,032,830Current long-term debt 23,265,173 (23,265,173) 17,250,706 − 17,250,706Non-current long-term debt 149,446,949 44,345,206 (17,250,706) (728,104) 175,813,345Dividends payable (Note 15) 664,546 (7,754,046) 7,721,500 − 632,000Lease liabilities 16,985,922 (1,179,645) 1,706,204 (48,776) 17,463,705Deposits and other noncurrent liabilities 50,922,906 (6,241,774) (677,496) − 44,003,636Total liabilities from financing activities P=255,672,213 P=9,550,681 P=8,750,208 (P=(776,880) P=273,196,222

- 127 -
*SGVFSM005262*
The noncash activities of the Group pertain the following:
2020 Transfer from investment properties to inventories amounting to P=18,563.9 million Transfer from investment properties to property and equipment amounting to P=591.6 million Transfer from investment properties and property and equipment to building classified as held for
sale amounting to P=950.1 million and P=2.1 million, respectively Transfer from inventories to investment properties amounting to P=2,361.2 million Transfer from right-of-use assets and lease liabilities to investment properties amounting to P=6.9
million and P=24.2 million, respectively Capitalized interest amounted to to P=40.1 million
2019 transfer from investment properties to inventories amounting to P=11,830.0 million transfer from inventories to investment properties amounting to P=674.9 million transfer from investment properties to property and equipment amounting to P=644.1 million transfer from property and equipment to investment properties to amounting to P=133.1 million transfer from right-of-use assets to investment properties amounting to P=98.7 million unpaid acquisition of investment properties amounting to P=7,392.2 million
38. Events After Reporting Date
On January 5, 2021, AREIT, Inc. (AREIT), purchased 9.8 hectares of land owned by TechnoparkLand, Inc. (TLI), a subsidiary of Ayala Corporation, in Laguna Technopark through a deed of sale forP=1.1 billion, VAT-inclusive. The purchase is payable in cash upon execution of the deed of sale andon January 21, 2021. The land is composed of four (4) parcels which is being leased by IntegratedMicro-Electronics, Inc. (IMI), a related party, for its manufacturing operations for the next seven yearsfrom January 1, 2021 until December 31, 2027 with annual escalation rate of 5%.
On February 23, 2021, the BOD approved the following:
a. The merger of the Parent Company and its listed subsidiary, Cebu Holdings, Inc. (CHI) as well asits other subsidiaries, Asian I-Office Properties, Inc. (AiO), Arca South Commercial VenturesCorp. (ASCVC) and Central Block Developers Inc. (CBDI), with Ayala Land Inc., as the survivingentity. The plan of merger will be submitted for the approval of our stockholders during theirannual meeting on April 21, 2021.
CHI is 71.1% subsidiary. ASCVC is our wholly owned subsidiary, while AiO is a wholly ownedsubsidiary of CHI, and CBDI is 55% owned by CHI and 45% owned by ALI. The merger is aninternal restructuring as well as a consolidation of the Group’s Cebu portfolio under one listedentity. The merger is expected to result in operational synergies, efficient funds management andsimplified reporting to government agencies.
b. The amendment of ESOWN Plan to increase the share allocation for ESOWN grants from 2.5%to 3% of our authorized capital stock. This will be presented to the stockholders for approval onApril 21, 2021.
c. The filing with the SEC of a new 3-year shelf registration of up to P=50 billion of debt securities(the “Shelf Registration”).
d. The raising of up to P=41 billion through the issuance of retail bonds and/or corporate notes forlisting on the Philippine Dealing and Exchange Corporation, and/or bilateral term loans for thepurpose of refinancing outstanding loans and to partially finance our general corporaterequirements.

- 128 -
*SGVFSM005262*
e. The declaration of cash dividends of P=0.136 per outstanding common share payable on March25, 2021 to stockholders of common shares as of record date March 10, 2021. This reflects a49% decrease from the cash dividends declared in the first half of 2020 amounting to P=0.268 pershare.
On February 26, 2021, White Knight Holdings, Inc., a wholly-owned subsidiary of Ayala Land, Inc.(“ALI”) entered into a Share Purchase Agreement with Healthway Philippines, Inc. (“HPI”), a wholly-owned subsidiary of Ayala Healthcare Holdings, Inc. to sell its 39.20% share in the outstandingcapital stock of Mercado General Hospital, Inc., the holding company for the QualiMed healthcarenetwork of hospitals and clinics, (“MGHI”). The sale of White Knight Holdings, Inc’s interest in MGHIwill allow ALI to redeploy capital and focus on its core businesses.
39. Other Matters
The declaration of COVID-19 by the World Health Organization (WHO) as a pandemic anddeclaration of nationwide state of calamity and implementation of community quarantine measuresthroughout the country starting March 16, 2020 have caused disruptions in the Group's businessactivities. While there are recent signs of increased market activity with the easing of quarantinemeasures in key areas in the Philippines, management believes that the impact of COVID-19situation remains fluid and evolving and the pace of recovery remains uncertain.
As of reporting date, all shopping malls have reopened at adjusted operating hours and constructionworks for commercial and residential projects have resumed while following the safety protocolsmandated by the national government. Most hotels remained open throughout the communityquarantine period, catering mostly to business process outsourcing employees and returningoverseas Filipino workers.


*SGVFSM006234*
C O V E R S H E E Tfor
AUDITED FINANCIAL STATEMENTS
SEC Registration Number
1 5 2 7 4 7
C O M P A N Y N A M E
A Y A L A L A N D , I N C .
PRINCIPAL OFFICE ( No. / Street / Barangay / City / Town / Province )
3 1 s t F l o o r , T o w e r O n e a n d E x c h
a n g e P l a z a , A y a l a T r i a n g l e , A y
a l a A v e n u e , M a k a t i C i t y
Form Type Department requiring the report Secondary License Type, If Applicable
A A P F S S E C
C O M P A N Y I N F O R M A T I O N
Company’s Email Address Company’s Telephone Number Mobile Number
[email protected] 7 908-3681
No. of Stockholders Annual Meeting (Month / Day) Fiscal Year (Month / Day)
12/31
CONTACT PERSON INFORMATION
The designated contact person MUST be an Officer of the Corporation
Name of Contact Person Email Address Telephone Number/s Mobile Number
Ma. Luisa D. Chiong [email protected]
7 908-3681
CONTACT PERSON’s ADDRESS
30th Floor, Tower One and Exchange Plaza, Ayala Triangle, Ayala Avenue, Makati City
NOTE 1 : In case of death, resignation or cessation of office of the officer designated as contact person, such incident shall be reported to the Commission withinthirty (30) calendar days from the occurrence thereof with information and complete contact details of the new contact person designated.
2 : All Boxes must be properly and completely filled-up. Failure to do so shall cause the delay in updating the corporation’s records with the Commissionand/or non-receipt of Notice of Deficiencies. Further, non-receipt of Notice of Deficiencies shall not excuse the corporation from liability for its deficiencies.

*SGVFSM006234*
INDEPENDENT AUDITOR’S REPORT
The Stockholders and Board of DirectorsAyala Land, Inc.31st Floor, Tower One and Exchange Plaza, Ayala TriangleAyala Avenue, Makati City
Opinion
We have audited the accompanying parent company financial statements of Ayala Land, Inc.(the Parent Company), which comprise the parent company statements of financial position as atDecember 31, 2020 and 2019, and the parent company statements of income, parent companystatements of comprehensive income, parent company statements of changes in equity and parentcompany statements of cash flows for the years then ended, and notes to the parent company financialstatements, including a summary of significant accounting policies.
In our opinion, the accompanying parent company financial statements present fairly, in all materialrespects, the financial position of the Parent Company as at December 31, 2020 and 2019, and itsfinancial performance and its cash flows for the years then period ended in accordance with PhilippineFinancial Reporting Standards (PFRSs).
Basis for Opinion
We conducted our audits in accordance with Philippine Standards on Auditing (PSAs). Ourresponsibilities under those standards are further described in the Auditor’s Responsibilities for the Auditof the Parent Company Financial Statements section of our report. We are independent of the ParentCompany in accordance with the Code of Ethics for Professional Accountants in the Philippines (Code ofEthics) together with the ethical requirements that are relevant to our audit of the parent companyfinancial statements in the Philippines, and we have fulfilled our other ethical responsibilities inaccordance with these requirements and the Code of Ethics. We believe that the audit evidence we haveobtained is sufficient and appropriate to provide a basis for our opinion.
Responsibilities of Management and Those Charged with Governance for the Parent CompanyFinancial Statements
Management is responsible for the preparation and fair presentation of the parent company financialstatements in accordance with PFRSs, and for such internal control as management determines isnecessary to enable the preparation of parent company financial statements that are free from materialmisstatement, whether due to fraud or error.
In preparing the parent company financial statements, management is responsible for assessing theParent Company’s ability to continue as a going concern, disclosing, as applicable, matters related togoing concern and using the going concern basis of accounting unless management either intends toliquidate the Parent Company or to cease operations, or has no realistic alternative but to do so.
Those charged with governance are responsible for overseeing the Parent Company’s financial reportingprocess.
SyCip Gorres Velayo & Co.6760 Ayala Avenue1226 Makati CityPhilippines
Tel: (632) 8891 0307Fax: (632) 8819 0872ey.com/ph
BOA/PRC Reg. No. 0001, October 4, 2018, valid until August 24, 2021SEC Accreditation No. 0012-FR-5 (Group A),
November 6, 2018, valid until November 5, 2021
A member firm of Ernst & Young Global Limited

*SGVFSM006234*
- 2 -
Auditor’s Responsibilities for the Audit of the Parent Company Financial Statements
Our objectives are to obtain reasonable assurance about whether the parent company financialstatements as a whole are free from material misstatement, whether due to fraud or error, and to issue anauditor’s report that includes our opinion. Reasonable assurance is a high level of assurance, but is not aguarantee that an audit conducted in accordance with PSAs will always detect a material misstatementwhen it exists. Misstatements can arise from fraud or error and are considered material if, individually orin the aggregate, they could reasonably be expected to influence the economic decisions of users takenon the basis of these parent company financial statements.
As part of an audit in accordance with PSAs, we exercise professional judgment and maintainprofessional skepticism throughout the audit. We also:
Identify and assess the risks of material misstatement of the parent company financial statements,whether due to fraud or error, design and perform audit procedures responsive to those risks, andobtain audit evidence that is sufficient and appropriate to provide a basis for our opinion. The risk ofnot detecting a material misstatement resulting from fraud is higher than for one resulting from error,as fraud may involve collusion, forgery, intentional omissions, misrepresentations, or the override ofinternal control.
Obtain an understanding of internal control relevant to the audit in order to design audit proceduresthat are appropriate in the circumstances, but not for the purpose of expressing an opinion on theeffectiveness of the Parent Company’s internal control.
Evaluate the appropriateness of accounting policies used and the reasonableness of accountingestimates and related disclosures made by management.
Conclude on the appropriateness of management’s use of the going concern basis of accounting and,based on the audit evidence obtained, whether a material uncertainty exists related to events orconditions that may cast significant doubt on the Parent Company’s ability to continue as a goingconcern. If we conclude that a material uncertainty exists, we are required to draw attention in ourauditor’s report to the related disclosures in the parent company financial statements or, if suchdisclosures are inadequate, to modify our opinion. Our conclusions are based on the audit evidenceobtained up to the date of our auditor’s report. However, future events or conditions may cause theParent Company to cease to continue as a going concern.
Evaluate the overall presentation, structure and content of the parent company financial statements,including the disclosures, and whether the parent company financial statements represent theunderlying transactions and events in a manner that achieves fair presentation.
We communicate with those charged with governance regarding, among other matters, the plannedscope and timing of the audit and significant audit findings, including any significant deficiencies ininternal control that we identify during our audit.
We also provide those charged with governance with a statement that we have complied with relevantethical requirements regarding independence, and to communicate with them all relationships and othermatters that may reasonably be thought to bear on our independence, and where applicable, relatedsafeguards.
A member firm of Ernst & Young Global Limited
*SGVFSM006234*
- 3 -
Report on the Supplementary Information Required Under Revenue Regulations 15-2010
Our audits were conducted for the purpose of forming an opinion on the parent company financialstatements taken as a whole. The supplementary information required under Revenue Regulations15-2010 in Note 34 to the parent company financial statements is presented for purposes of filing with theBureau of Internal Revenue and is not a required part of the basic parent company financial statements.Such information is the responsibility of the management of Ayala Land, Inc. The information has beensubjected to the auditing procedures applied in our audit of the basic parent company financialstatements. In our opinion, the information is fairly stated, in all material respects, in relation to the basicparent company financial statements taken as a whole.
The engagement partner on the audit resulting in this independent auditor’s report is Michael C. Sabado.
SYCIP GORRES VELAYO & CO.
Michael C. SabadoPartnerCPA Certificate No. 89336SEC Accreditation No. 0664-AR-4 (Group A), November 11, 2019, valid until November 10, 2022Tax Identification No. 160-302-865BIR Accreditation No. 08-001998-073-2020, December 3, 2020, valid until December 2, 2023PTR No. 8534357, January 4, 2021, Makati City
February 23, 2021
A member firm of Ernst & Young Global Limited

*SGVFSM006234*
AYALA LAND, INC.PARENT COMPANY STATEMENTS OF FINANCIAL POSITION
December 312020 2019
ASSETSCurrent AssetsCash and cash equivalents (Notes 4, 22 and 26) P=1,128,996,762 P=1,846,669,697Financial assets at fair value through profit or loss
(Notes 5, 22 and 26) 146,068,531 2,054,808Accounts and notes receivable (Notes 6, 22 and 26) 99,131,975,650 97,010,983,622Inventories (Note 7) 32,607,893,429 29,250,263,207Other current assets (Note 8) 16,107,839,267 12,965,312,551
Total Current Assets 149,122,773,639 141,075,283,885Noncurrent AssetsNoncurrent accounts and notes receivable (Notes 6 and 26) 17,849,478,634 15,377,893,378Financial assets at fair value through other comprehensive income
(Notes 9 and 26) 292,857,497 257,877,497Investments in subsidiaries, associates and joint ventures
(Note 10) 167,037,941,980 167,037,117,517Right-of-use assets (Note 29) 304,954,992 347,026,728Investment properties (Note 11) 87,722,277,273 84,293,206,476Property and equipment (Note 12) 2,463,955,890 1,507,293,370Deferred tax assets - net (Note 21) 1,963,005,850 1,292,052,333Other noncurrent assets (Note 13) 3,696,946,854 3,851,644,073
Total Noncurrent Assets 281,331,418,970 273,964,111,372P=430,454,192,609 P=415,039,395,257
LIABILITIES AND EQUITYCurrent LiabilitiesShort-term debt (Notes 15, 22 and 26) P=6,640,500,000 P=15,708,000,000Accounts and other payables (Notes 14, 22 and 26) 79,403,354,256 83,874,912,683Current portion of lease liabilities (Note 29) 19,374,161 16,187,902Current portion of long-term debt (Notes 15, 22 and 26) 11,144,189,998 7,188,254,688Deposits and other current liabilities (Note 16) 14,953,296,315 13,252,612,229
Total Current Liabilities 112,160,714,730 120,039,967,502Noncurrent LiabilitiesLong-term debt - net of current portion (Notes 15, 22 and 26) 162,630,166,428 155,490,830,377Pension liabilities - net (Note 23) 1,802,159,288 1,626,840,803Lease liabilities - net of current portion (Note 29) 251,787,728 269,242,178Deposits and other noncurrent liabilities (Notes 17 and 26) 12,204,715,912 6,784,664,867
Total Noncurrent Liabilities 176,888,829,356 164,171,578,225Total Liabilities 289,049,544,086 284,211,545,727
Equity (Note 18)Paid-in capital 62,953,584,301 62,772,445,971Stock options outstanding (Note 25) − 42,278,712Treasury shares (1,260,780,037) (1,104,352,627)Retained earnings 80,281,876,704 69,663,731,309Fair value reserve of financial assets at FVOCI (Note 9) 53,039,285 13,789,928Remeasurement loss on defined benefit plans (Note 23) (623,071,730) (560,043,763)
Total Equity 141,404,648,523 130,827,849,530P=430,454,192,609 P=415,039,395,257
See accompanying Notes to Parent Company Financial Statements.

*SGVFSM006234*
AYALA LAND, INC.PARENT COMPANY STATEMENTS OF INCOME
Years Ended December 312020 2019
REVENUEReal estate (Note 19) P=19,758,747,597 P=36,639,425,039Interest income from real estate sales (Notes 6 and 19) 3,701,041,649 3,413,181,338
23,459,789,246 40,052,606,377Interest income (Notes 4 and 22) 794,693,813 529,530,487Dividend income 7,634,477,726 9,413,464,200Other income (Notes 10 and 20) 8,535,550,532 927,523,395
16,964,722,071 10,870,518,08240,424,511,317 50,923,124,459
COSTS AND EXPENSES (Note 20)Real estate 11,995,182,065 23,667,591,274General and administrative expenses 1,729,276,974 2,022,586,873Interest expense and other financing charges 11,994,578,412 10,345,753,816Other charges and expenses 424,228,582 43,353,517
26,143,266,033 36,079,285,480
INCOME BEFORE INCOME TAX 14,281,245,284 14,843,838,979
PROVISION FOR (BENFEFIT FROM) INCOME TAX (Note 21) (343,566,242) 1,618,731,567
NET INCOME P=14,624,811,526 P=13,225,107,412
Earnings Per Share (Note 24)Basic and diluted P=0.99 P=0.89
See accompanying Notes to Parent Company Financial Statements.

*SGVFSM006234*
AYALA LAND, INC.PARENT COMPANY STATEMENTS OF COMPREHENSIVE INCOME
Years Ended December 312020 2019
NET INCOME P=14,624,811,526 P=13,225,107,412
Other comprehensive income (loss)Items that may be reclassified to profit or loss in
subsequent years: Fair value reserve of financial assets at FVOCI (Note 9) 39,249,357 (55,383,950)Items that will not be reclassified to profit or loss in
subsequent years: Remeasurement loss on pension liability (Note 23) (90,039,953) (361,442,600) Income tax effect 27,011,986 108,432,780
Total other comprehensive loss - net of tax (23,778,610) (308,393,770)
TOTAL COMPREHENSIVE INCOME P=14,601,032,916 P=12,916,713,642
See accompanying Notes to Parent Company Financial Statements.

*SGVFSM006234*
AYALA LAND, INC.PARENT COMPANY STATEMENTS OF CHANGES IN EQUITY
Capital Stock(Note 18)
AdditionalPaid-in Capital
(Note 18)
SubscriptionsReceivable
(Note 18)
AppropriatedRetainedEarnings(Note 18)
UnappropriatedRetainedEarnings(Note 18)
Stock OptionsOutstanding
(Note 25)
Fair Value Reserveof Financial Assets
at FVOCI(Note 9)
RemeasurementLoss on Defined
Benefit Plans(Note 23) Treasury Shares Total
As of January 1, 2020, as previously reported P=16,051,984,323 P=48,598,640,228 (P=1,878,178,580) P=8,000,000,000 P=61,663,731,309 P=42,278,712 P=13,789,928 (P=560,043,763) (P=1,104,352,627) P=130,827,849,530Net income − − − − 14,624,811,526 − − − − 14,624,811,526Other comprehensive loss − − − − − − 39,249,357 (63,027,967) − (23,778,610)Total comprehensive income − − − − 14,624,811,526 − 39,249,357 (63,027,967) − 14,601,032,916Cost of stock options − 154,199,135 − − − (42,278,712) − − − 111,920,423Acquisition of treasury shares − − − − − − − − (156,427,410) (156,427,410)Collections of subscription receivable − − 26,939,195 − − − − − − 26,939,195Stock options exercised 14,845,498 396,671,707 (411,517,205) − − − − − − −Cash dividends declared − − − − (4,006,666,131) − − − − (4,006,666,131)As of December 31, 2020 P=16,066,829,821 P=49,149,511,070 (P=2,262,756,590) P=8,000,000,000 P=72,281,876,704 P=− P=53,039,285 (P=623,071,730) (P=1,260,780,037) P=141,404,648,523
As of January 1, 2019, as previously reported P=16,041,530,557 P=47,985,989,001 (P=1,676,555,381) P=8,000,000,000 P=56,244,722,057 P=65,461,806 P=69,173,878 (P=307,033,943) P=− P=126,423,287,975Effect of adoption of PFRS 16, Leases − − − − (84,597,959) − − − − (84,597,959)Balances at January 1, 2019, as restated 16,041,530,557 47,985,989,001 (1,676,555,381) 8,000,000,000 56,160,124,098 65,461,806 69,173,878 (307,033,943) − 126,338,690,016Net income − − − − 13,225,107,412 − − − − 13,225,107,412Other comprehensive loss − − − − − − (55,383,950) (253,009,820) − (308,393,770)Total comprehensive income − − − − 13,225,107,412 − (55,383,950) (253,009,820) − 12,916,713,642Cost of stock options − 166,039,180 − − − (23,183,094) − − − 142,856,086Acquisition of treasury shares − − − − − − − − (1,104,352,627) (1,104,352,627)Collections of subscription receivable − − 255,442,614 − − − − − − 255,442,614Stock options exercised 10,453,766 446,612,047 (457,065,813) − − − − − − −Cash dividends declared − − − − (7,721,500,201) − − − − (7,721,500,201)As of December 31, 2019 P=16,051,984,323 P=48,598,640,228 (P=1,878,178,580) P=8,000,000,000 P=61,663,731,309 P=42,278,712 P=13,789,928 (P=560,043,763) (P=1,104,352,627) P=130,827,849,530
See accompanying Notes to Parent Company Financial Statements.

*SGVFSM006234*
AYALA LAND, INC.PARENT COMPANY STATEMENTS OF CASH FLOWS
Years Ended December 312020 2019
CASH FLOWS FROM OPERATING ACTIVITIESIncome before income tax P=14,281,245,284 P=14,843,838,979Adjustments for:
Interest expense and amortization of transaction cost(Note 15 and 20) 11,994,578,412 10,345,753,816
Depreciation (Notes 11, 12 and 20) 1,278,012,143 1,332,205,610 Cost of share-based payments (Note 23) 111,920,423 142,856,085 Gain on foreign exchange (Note 20) (187,339,286) (174,507,160)
Provision for impairment losses and write-offs (Note 20) 424,235,038 43,353,517Unrealized gain on financial assets at fair value through profit
or loss (Note 20) (701,744) (85,779)Gain on sale of property and equipment (Note 20) (13,352,764) (9,233,657)
Dividend income (7,634,477,726) (9,413,464,200)Gain on sale of investment in subsidiaries, associates and
joint ventures (Note 20) (7,760,796,086) (49,300,386) Interest income (794,693,813) (529,530,487) Gain on sale of investment property (Note 20) − (176,544,327)Operating income before changes in working capital 11,698,629,881 16,355,342,011Changes in operating assets and liabilities: Decrease (increase) in: Accounts and notes receivable (Note 6) 307,236,843 15,830,603,218 Inventories (Notes 7 and 29) 2,805,348,915 (434,329,005) Other current assets (1,359,464,707) 342,352,158 Increase (decrease) in: Other current liabilities 1,700,684,086 179,855,054 Pension liabilities (Note 23) 85,278,532 50,594,400 Accounts and other payables (Note 14) (4,994,604,106) (7,084,549,639)Cash generated from operations 10,243,109,444 25,239,868,197Dividends received 8,106,011,760 9,578,008,880Interest received 794,844,135 529,534,271Income tax paid (2,083,437,298) (2,268,568,279)Interest paid (12,024,944,495) (10,030,205,154)Net cash provided by operating activities 5,035,583,546 23,048,637,915
CASH FLOWS FROM INVESTING ACTIVITIESProceeds from disposal/redemption of: Investments in subsidiaries, associates
and joint ventures (Note 10) 12,441,028,798 2,248,453,150 Investment properties (Note 11) 969,095,826 8,314,063,635 Property and equipment (Note 12) 13,365,766 12,390,160 Financial assets at fair value through profit of loss 1,168,915,490 − Financial assets at fair value through other comprehensive
income 4,420,000 −Purchases/additions to: Financial assets at fair value through other comprehensive
income (150,643) (65,860,000)Financial assets at fair value through profit of loss (1,312,227,469) −
(Forward)

*SGVFSM006234*
- 2 -
Years Ended December 312020 2019
Property and equipment (Note 12) (P=1,155,175,418) (P=647,161,452) Investment properties (Note 11) (11,466,843,711) (8,281,012,167) Investments in subsidiaries, associates and joint ventures
(Note 10) (4,681,057,175) (17,737,467,927)Decrease in other noncurrent assets 154,697,219 268,330,016Decrease (Increase) in accounts and notes receivable – nontrade
(Note 6) (5,708,364,462) (19,519,979,172)Net cash used in investing activities (9,572,295,779) (35,408,243,757)
CASH FLOWS FROM FINANCING ACTIVITIESProceeds from short-term and long-term debts (Note 15) 207,576,508,712 149,281,502,931Proceeds from capital stock subscriptions 26,939,195 255,442,615Decrease in deposits and other noncurrent liabilities (Note 17) 5,847,831,700 (83,063,372)Payments of lease liability (38,770,466) (108,471,353)Acquisition of treasury shares (156,427,410) (1,104,352,627)Payments of cash dividends (Note 18) (4,006,666,131) (7,721,500,201)Payments of short-term and long-term debts (Note 15) (205,429,054,688) (127,463,478,122)Net cash provided by financing activities 3,820,360,912 13,056,079,871
NET INCREASE (DECREASE) IN CASHAND CASH EQUIVALENTS (716,351,321) 696,474,029
EFFECT OF FOREIGN EXCHANGE CHANGES (1,321,614) 26,727,025
CASH AND CASH EQUIVALENTS AT BEGINNING OF YEAR 1,846,669,697 1,123,468,643
CASH AND CASH EQUIVALENTS AT END OF YEAR (Note 4) P=1,128,996,762 P=1,846,669,697
See accompanying Notes to Parent Company Financial Statements.

*SGVFSM006234*
AYALA LAND, INC.NOTES TO PARENT COMPANY FINANCIAL STATEMENTS
1. Corporate Information
Ayala Land, Inc. (the “Parent Company”, or “ALI”) is domiciled and was incorporated onJune 30, 1988 in the Republic of the Philippines with corporate life of fifty years. The ParentCompany is a subsidiary of Ayala Corporation (AC). AC is a publicly-listed company, 47.28%-ownedby Mermac, Inc. and the rest by the public as of December 31, 2020. The Parent Company’sregistered office and principal place of business is 31st Floor, Tower One and Exchange Plaza, AyalaTriangle, Ayala Avenue, Makati City.
The Parent Company is incorporated to hold, develop, manage, administer, sell, convey, encumber,purchase, acquire, rent or otherwise deal in and dispose of, for itself or for others, residentialincluding, but not limited to, all kinds of housing projects, commercial, industrial, urban or other kindsof real property; to acquire, purchase, hold, manage, develop and sell subdivision lots, with or withoutbuildings or improvements; to erect, construct, alter, manage, operate, lease, in whole or in part,buildings and tenements of the Parent Company or of other persons; and to engage or act as realestate broker.
The accompanying parent company financial statements were endorsed for approval by the AuditCommittee on February 16, 2021 and were approved and authorized for issue by the Board ofDirectors (BOD) on February 23, 2021.
2. Summary of Significant Accounting Policies
Basis of PreparationThe parent company financial statements have been prepared using the historical cost basis, exceptfor financial assets at fair value through profit or loss (FVPL) and financial assets at fair value throughother comprehensive income (FVOCI) that have been measured at fair value. The parent companyfinancial statements are presented in Philippine Peso (P=), which is also the Parent Company’sfunctional currency and all amounts are rounded to the nearest peso, except when otherwiseindicated.
The parent company financial statements provide comparative information in respect of the previousperiod. While there are recent signs of increased market activity with the easing of quarantinemeasures in key areas in the Philippines, management believes that the impact of COVID-19situation remains fluid and evolving and the pace of recovery remains uncertain.
Statement of ComplianceThe parent company financial statements of Ayala Land, Inc., which are prepared for submission tothe Philippine Securities and Exchange Commission (SEC) and to the Bureau of Internal Revenue(BIR), have been prepared in compliance with Philippine Financial Reporting Standards (PFRSs),which include the availment of the relief granted by the SEC under Memorandum Circular (MC) Nos.14-2018 and 3-2019, that deferred the implementation of the following accounting pronouncementsuntil December 31, 2020. These accounting pronouncements address the issues of PFRS 15,Revenue from Contracts with Customers affecting the real estate industry.
Deferral of the following provisions of Philippine Interpretations Committee (PIC) Q&A 2018-12,PFRS 15 Implementation Issues Affecting the Real Estate Industry
a. Treatment of land in the determination of the percentage-of-completion (POC)b. Assessing if the transaction price includes a significant financing component (as amended by PIC
Q&A 2020-04)c. Treatment of uninstalled materials in the determination of the POC (as amended by PIC Q&A
2020-02); and

- 2 -
*SGVFSM006234*
d. Accounting to Common Usage Service Area (CUSA) Charges
Deferral of the adoption of PIC Q&A 2018-14: Accounting for Cancellation of Real Estate Sales (asamended by PIC Q&A 2020-05)
The parent company financial statements did not avail the relief under SEC MC No. 4-2020 to deferthe adoption of IFRIC Agenda Decision on Over Time Transfers of Constructed Goods under PAS 23,Borrowing Cost (the IFRIC Agenda Decision on Borrowing Cost) and is already in full compliance withthe requirements of the IFRIC Agenda Decision.
In December 2020, the SEC issued MC No. 34-2020, allowing the further deferral of the adoption ofprovisions (a) and (b) above of PIC Q&A 2018-12 and the IFRIC Agenda Decision on Borrowing Cost,for another other (three) 3 years or until December 31, 2023.
The details and the impact of the adoption of the above financial reporting reliefs are discussed in theAdoption of New and Amended Accounting Standards and Interpretations section of Note 2.
PFRSs include Philippine Financial Reporting Standards, Philippine Accounting Standards andInterpretations issued by the Philippine Interpretations Committee (PIC).
The Parent Company also prepares and issues consolidated financial statements presented incompliance with PFRSs which can be obtained from the Parent Company’s registered address.
Adoption of New and Amended Accounting Standards and InterpretationsThe accounting policies adopted in the preparation of the parent company financial statements areconsistent with those of the previous financial year except for the adoption of the following newaccounting pronouncements which became effective January 1, 2020. The Parent Company has notearly adopted any standard, interpretation or amendment that has been issued but is not yet effective.
Amendments to PFRS 3, Definition of a Business
The amendments to PFRS 3 clarifies that to be considered a business, an integrated set ofactivities and assets must include, at a minimum, an input and a substantive process thattogether significantly contribute to the ability to create output. Furthermore, it clarifies that abusiness can exist without including all of the inputs and processes needed to create outputs.These amendments may impact future periods should the Parent Company enter into anybusiness combinations.
These amendments will apply on future business combinations of the Parent Company.
Amendments to PFRS 7, Financial Instruments: Disclosures and PFRS 9, Financial Instruments,Interest Rate Benchmark Reform
The amendments to PFRS 9 provide a number of reliefs, which apply to all hedging relationshipsthat are directly affected by the interest rate benchmark reform. A hedging relationship is affectedif the reform gives rise to uncertainties about the timing and or amount of benchmark-based cashflows of the hedged item or the hedging instrument.
These amendments do not have a significant impact on the Parent Company.
Amendments to PAS 1, Presentation of Financial Statements, and PAS 8, Accounting Policies,Changes in Accounting Estimates and Errors, Definition of Material
The amendments provide a new definition of material that states “information is material ifomitting, misstating or obscuring it could reasonably be expected to influence decisions that theprimary users of general purpose financial statements make on the basis of those financialstatements, which provide financial information about a specific reporting entity.”

- 3 -
*SGVFSM006234*
The amendments clarify that materiality will depend on the nature or magnitude of information,either individually or in combination with other information, in the context of the financialstatements. A misstatement of information is material if it could reasonably be expected toinfluence decisions made by the primary users.
These amendments do not have a significant impact on the Parent Company.
Conceptual Framework for Financial Reporting issued on March 29, 2018
The Conceptual Framework is not a standard, and none of the concepts contained thereinoverride the concepts or requirements in any standard. The purpose of the ConceptualFramework is to assist the standard-setters in developing standards, to help preparers developconsistent accounting policies where there is no applicable standard in place and to assist allparties to understand and interpret the standards.
The revised Conceptual Framework includes new concepts, provides updated definitions andrecognition criteria for assets and liabilities and clarifies some important concepts.
Amendments to PFRS 16, COVID-19-related Rent Concessions
The amendments provide relief to lessees from applying the PFRS 16 requirement on leasemodifications to rent concessions arising as a direct consequence of the COVID-19 pandemic.A lessee may elect not to assess whether a rent concession from a lessor is a lease modificationif it meets all of the following criteria:
• The rent concession is a direct consequence of COVID-19;• The change in lease payments results in a revised lease consideration that is
substantially the same as, or less than, the lease consideration immediately precedingthe change;
• Any reduction in lease payments affects only payments originally due on or before June30, 2021; and
• There is no substantive change to other terms and conditions of the lease.
A lessee that applies this practical expedient will account for any change in lease paymentsresulting from the COVID-19 related rent concession in the same way it would account for achange that is not a lease modification, i.e., as a variable lease payment. The amendments areeffective for annual reporting periods beginning on or after June 1, 2020. Early adoption ispermitted.
This amendment is not applicable to the Parent Company as there are no rent concessionsgranted to the Parent Company as a lessee.
Adoption of PIC Q&A 2020-03, Q&A No. 2018-12-D: STEP 3- On the accounting of the differencewhen the percentage of completion is ahead of the buyer’s payment
PIC Q&A 2020-03 was issued by the PIC on September 30, 2020. The latter aims to provide anadditional option to the preparers of financial statements to present as receivables, the differencebetween the POC and the buyer’s payment, with the POC being ahead. This PIC Q&A isconsistent with the PIC guidance issued to the real estate industry in September 2019.
The adoption of this PIC Q&A did not impact the financial statements of the Parent Companysince it has previously adopted the additional guidance issued by the PIC in September 2019.
Standards Issued but not yet EffectivePronouncements issued but not yet effective are listed below. Unless otherwise indicated, the ParentCompany does not expect that the future adoption of the said pronouncements will have a significantimpact on its parent company financial statements. The Parent Company intends to adopt thefollowing pronouncements when they become effective.

- 4 -
*SGVFSM006234*
Effective beginning on or after January 1, 2021
Amendments to PFRS 9, PFRS 7, PFRS 4 and PFRS 16, Interest Rate Benchmark Reform –Phase 2
The amendments provide the following temporary reliefs which address the financial reportingeffects when an interbank offered rate (IBOR) is replaced with an alternative nearly risk-freeinterest rate (RFR):• Practical expedient for changes in the basis for determining the contractual cash flows as a
result of IBOR reform• Relief from discontinuing hedging relationships• Relief from the separately identifiable requirement when an RFR instrument is designated as a
hedge of a risk component
The Parent Company shall also disclose information about:• The about the nature and extent of risks to which the entity is exposed arising from financial
instruments subject to IBOR reform, and how the entity manages those risks; and• Their progress in completing the transition to alternative benchmark rates, and how the entity
is managing that transition
The amendments are effective for annual reporting periods beginning on or after January 1, 2021and apply retrospectively, however, the Parent company is not required to restate prior periods.
Effective beginning on or after January 1, 2022
Amendments to PFRS 3, Reference to the Conceptual Framework
The amendments are intended to replace a reference to the Framework for the Preparation andPresentation of Financial Statements, issued in 1989, with a reference to the ConceptualFramework for Financial Reporting issued in March 2018 without significantly changing itsrequirements. The amendments added an exception to the recognition principle of PFRS 3,Business Combinations to avoid the issue of potential ‘day 2’ gains or losses arising for liabilitiesand contingent liabilities that would be within the scope of PAS 37, Provisions, ContingentLiabilities and Contingent Assets or Philippine-IFRIC 21, Levies, if incurred separately.
At the same time, the amendments add a new paragraph to PFRS 3 to clarify that contingentassets do not qualify for recognition at the acquisition date.
The amendments are effective for annual reporting periods beginning on or after January 1, 2022and apply prospectively.
Amendments to PAS 16 , Plant and Equipment: Proceeds before Intended Use
The amendments prohibit entities deducting from the cost of an item of property, plant andequipment, any proceeds from selling items produced while bringing that asset to the locationand condition necessary for it to be capable of operating in the manner intended by management.Instead, an entity recognizes the proceeds from selling such items, and the costs of producingthose items, in profit or loss.
The amendment is effective for annual reporting periods beginning on or after January 1, 2022and must be applied retrospectively to items of property, plant and equipment made available foruse on or after the beginning of the earliest period presented when the entity first applies theamendment.
The amendments are not expected to have a material impact on the Parent Company.
- 5 -
*SGVFSM006234*
Amendments to PAS 37, Onerous Contracts – Costs of Fulfilling a Contract
The amendments specify which costs an entity needs to include when assessing whether acontract is onerous or loss-making. The amendments apply a “directly related cost approach”.The costs that relate directly to a contract to provide goods or services include both incrementalcosts and an allocation of costs directly related to contract activities. General and administrativecosts do not relate directly to a contract and are excluded unless they are explicitly chargeable tothe counterparty under the contract.
The amendments are effective for annual reporting periods beginning on or after January 1,2022. The Parent Company will apply these amendments to contracts for which it has not yetfulfilled all its obligations at the beginning of the annual reporting period in which it first applies theamendments.
Annual Improvements to PFRSs 2018-2020 Cycle
o Amendments to PFRS 1, First-time Adoption of Philippines Financial Reporting Standards,Subsidiary as a first-time adopter
The amendment permits a subsidiary that elects to apply paragraph D16(a) of PFRS 1 tomeasure cumulative translation differences using the amounts reported by the parent, basedon the parent’s date of transition to PFRS. This amendment is also applied to an associate orjoint venture that elects to apply paragraph D16(a) of PFRS 1.
The amendment is effective for annual reporting periods beginning on or after January 1,2022 with earlier adoption permitted. The amendments are not expected to have a materialimpact on the Parent Company.
o Amendments to PFRS 9, Financial Instruments, Fees in the ’10 per cent’ test forderecognition of financial liabilities
The amendment clarifies the fees that an entity includes when assessing whether the termsof a new or modified financial liability are substantially different from the terms of the originalfinancial liability. These fees include only those paid or received between the borrower andthe lender, including fees paid or received by either the borrower or lender on the other’sbehalf. An entity applies the amendment to financial liabilities that are modified or exchangedon or after the beginning of the annual reporting period in which the entity first applies theamendment.
The amendment is effective for annual reporting periods beginning on or after January 1,2022 with earlier adoption permitted. The Parent Company will apply the amendments tofinancial liabilities that are modified or exchanged on or after the beginning of the annualreporting period in which the entity first applies the amendment. The amendments are notexpected to have a material impact on the Parent Company.
o Amendments to PAS 41, Agriculture, Taxation in fair value measurements
The amendment removes the requirement in paragraph 22 of PAS 41 that entities excludecash flows for taxation when measuring the fair value of assets within the scope ofPAS 41.
An entity applies the amendment prospectively to fair value measurements on or after thebeginning of the first annual reporting period beginning on or after January 1, 2022 withearlier adoption permitted. The amendments are not expected to have a material impact onthe Parent Company.

- 6 -
*SGVFSM006234*
Effective beginning on or after January 1, 2023
Amendments to PAS 1, Classification of Liabilities as Current or Non-current
The amendments clarify paragraphs 69 to 76 of PAS 1, Presentation of Financial Statements, tospecify the requirements for classifying liabilities as current or non-current. The amendmentsclarify:o What is meant by a right to defer settlemento That a right to defer must exist at the end of the reporting periodo That classification is unaffected by the likelihood that an entity will exercise its deferral righto That only if an embedded derivative in a convertible liability is itself an equity instrumentwould the terms of a liability not impact its classification
The amendments are effective for annual reporting periods beginning on or after January 1, 2023and must be applied retrospectively. The Parent Company is currently assessing the impact theamendments will have on current practice and whether existing loan agreements may requirerenegotiation.
PFRS 17, Insurance Contracts
PFRS 17 is a comprehensive new accounting standard for insurance contracts coveringrecognition and measurement, presentation and disclosure. Once effective, PFRS 17 will replacePFRS 4, Insurance Contracts. This new standard on insurance contracts applies to all types ofinsurance contracts (i.e., life, non-life, direct insurance and re-insurance), regardless of the typeof entities that issue them, as well as to certain guarantees and financial instruments withdiscretionary participation features. A few scope exceptions will apply.
The overall objective of PFRS 17 is to provide an accounting model for insurance contracts that ismore useful and consistent for insurers. In contrast to the requirements in PFRS 4, which arelargely based on grandfathering previous local accounting policies, PFRS 17 provides acomprehensive model for insurance contracts, covering all relevant accounting aspects. The coreof PFRS 17 is the general model, supplemented by:
• A specific adaptation for contracts with direct participation features (the variable feeapproach)
• A simplified approach (the premium allocation approach) mainly for short-duration contracts
PFRS 17 is effective for reporting periods beginning on or after January 1, 2023, withcomparative figures required. Early application is permitted.
The new standard is not applicable to the Parent Company since it has no activities that arepredominantly connected with insurance or issue insurance contracts.
Deferred Effectivity
Amendments to PFRS 10, Consolidated Financial Statements, and PAS 28, Sale or Contributionof Assets between an Investor and its Associate or Joint Venture
The amendments address the conflict between PFRS 10 and PAS 28 in dealing with the loss ofcontrol of a subsidiary that is sold or contributed to an associate or joint venture. Theamendments clarify that a full gain or loss is recognized when a transfer to an associate or jointventure involves a business as defined in PFRS 3. Any gain or loss resulting from the sale orcontribution of assets that does not constitute a business, however, is recognized only to theextent of unrelated investors’ interests in the associate or joint venture.

- 7 -
*SGVFSM006234*
On January 13, 2016, the Financial Reporting Standards Council deferred the original effectivedate of January 1, 2016 of the said amendments until the International Accounting StandardsBoard (IASB) completes its broader review of the research project on equity accounting that mayresult in the simplification of accounting for such transactions and of other aspects of accountingfor associates and joint ventures.
The Parent Company is currently assessing the impact of adopting these amendments.
Deferral of Certain Provisions of PIC Q&A 2018-12, PFRS 15 Implementation Issues Affecting theReal Estate Industry (as amended by PIC Q&As 2020-02 and 2020-04)
On February 14, 2018, the PIC issued PIC Q&A 2018-12 which provides guidance on somePFRS 15 implementation issues affecting the real estate industry. On October 25, 2018 andFebruary 08, 2019, the Philippine Securities and Exchange Commission (SEC) issued SEC MCNo. 14-2018 and SEC MC No. 3-2019, respectively, providing relief to the real estate industry bydeferring the application of certain provisions of this PIC Q&A for a period of three years untilDecember 31, 2020. On December 15, 2020, the Philippine SEC issued SEC MC No. 34-2020which further extended the deferral of certain provisions of this PIC Q&A until December 31,2023. A summary of the PIC Q&A provisions covered by the SEC deferral and the relateddeferral period follows:
Deferral Perioda. Assessing if the transaction price includes a significant financing
component as discussed in PIC Q&A 2018-12-D (as amended by PICQ&A 2020-04)
Until December 31, 2023
b. Treatment of land in the determination of the POC discussed in PICQ&A 2018-12-E
Until December 31, 2023
c. Treatment of uninstalled materials in the determination of the POCdiscussed in PIC Q&A 2018-12-E (as amended by PIC Q&A 2020-02)
Until December 31, 2020
d. Accounting for CUSA Charges discussed in PIC Q&A No. 2018-12-H Until December 31, 2020
The SEC Memorandum Circulars also provided the mandatory disclosure requirements should anentity decide to avail of any relief. Disclosures should include:a. The accounting policies applied.b. Discussion of the deferral of the subject implementation issues in the PIC Q&A.c. Qualitative discussion of the impact on the financial statements had the concerned
application guidelines in the PIC Q&A been adopted.d. Should any of the deferral options result into a change in accounting policy (e.g., when an
entity excludes land and/or uninstalled materials in the POC calculation under the previousstandard but opted to include such components under the relief provided by the circular),such accounting change will have to be accounted for under PAS 8, i.e., retrospectively,together with the corresponding required quantitative disclosures.
In November 2020, the PIC issued the following Q&As which provide additional guidance on thereal estate industry issues covered by the above SEC deferrals: PIC Q&A 2020-04, which provides additional guidance on determining whether the
transaction price includes a significant financing component PIC Q&A 2020-02, which provides additional guidance on determining which uninstalled
materials should not be included in calculating the POC
The Group has adopted PIC Q&A 2020-02 and has included the uninstalled customized materialsin the measurement of progress. This is consistent with the Group’s policy.
After the deferral period, real estate companies would have to adopt PIC Q&A No. 2018-12 andany subsequent amendments thereto retrospectively or as the SEC will later prescribe.

- 8 -
*SGVFSM006234*
The Parent Company availed of the SEC reliefs to defer the above specific provisions of PIC Q&ANo. 2018-12. Had these provisions been adopted, the Parent Company assessed that the impactwould have been as follows:a. The mismatch between the POC of the real estate projects and right to an amount of
consideration based on the schedule of payments provided for in the contract to sell mightconstitute a significant financing component. In case of the presence of significant financingcomponent, the guidance should have been applied retrospectively and would have resultedin restatement of prior year financial statements. Adoption of this guidance would haveimpacted interest income, interest expense, revenue from real estate sales, installmentcontracts receivable, provision for deferred income tax, deferred tax asset or liability for allyears presented, and the opening balance of retained earnings. The Parent Company has yetto assess if the mismatch constitutes a significant financing component based on theexamples provided in the PIC letter dated November 11, 2020.
b. The exclusion of land in the determination of POC would have reduced the percentage ofcompletion of real estate projects. Adoption of this guidance would have reduced revenuefrom real estate sales, cost of sales, and installment contracts receivable; and would haveimpacted real estate inventories, deferred tax asset or liability, and provision for deferredincome tax for all years presented, and the opening balance of retained earnings.
c. Had the Parent Company accounted for the revenue from air-conditioning services, CUSAand handling services as principal, this would have resulted in the gross presentation of therelated revenue, costs and expenses. The Parent Company opts to use alternativepresentation of CUSA as other income as the gross amount of revenue and related costs andexpenses are not individually material. There is no impact on opening retained earnings,income and expense and the related balance sheet accounts.
The above would have impacted the cash flows from operations and cash flows from financingactivities for all years presented.
As prescribed by SEC MC No. 34-2020, for financial reporting periods beginning on or afterJanuary 1, 2021, the availment of the above deferral will impact the Parent Company’s financialreporting during the period of deferral as follows:
a. The parent company financial statements are not considered to be in accordance with PFRSand should specify in the “Basis of Preparation of the Parent Company Financial Statements”section of the parent company financial statements that the accounting framework is:
PFRS, as modified by the application of the following financial reporting reliefs issued andapproved by the Securities and Exchange Commission in response to the COVID-19pandemic:1) Treatment of land in the determination of the percentage-of-completion; and2) Assessing if the transaction price includes a significant financing component (as
amended by PIC Q&A 2020-04)
b. The Auditor’s report will:i. reflect in the Opinion paragraph that the parent company financial statements are
prepared in accordance with the compliance framework described in the notes to theparent company financial statements; and
ii. include an Emphasis of Matter paragraph to draw attention to the basis of accounting thathas been used in the preparation of the parent company financial statements.
Upon full adoption of the above deferred guidance, the accounting policies will have to be appliedusing full retrospective approach following the guidance under PAS 8, Accounting Policies,Changes in Accounting Estimates and Errors.
Deferral of PIC Q&A 2018-14, Accounting for Cancellation of Real Estate Sales (as amended byPIC Q&A 2020-05)

- 9 -
*SGVFSM006234*
On June 27, 2018, PIC Q&A 2018-14 was issued providing guidance on accounting forcancellation of real estate sales. Under SEC MC No. 3-2019, the adoption of PIC Q&A No. 2018-14 was deferred until December 31, 2020. After the deferral period, real estate companies willadopt PIC Q&A No. 2018-14 and any subsequent amendments thereto retrospectively or as theSEC will later prescribe.On November 11, 2020, PIC Q&A 2020-05 was issued which supersedes PIC Q&A 2018-14. ThisPIC Q&A adds a new approach where the cancellation is accounted for as a modification of thecontract (i.e., from non-cancellable to being cancellable). Under this approach, revenues andrelated costs previously recognized shall be reversed in the period of cancellation and theinventory shall be reinstated at cost. PIC Q&A 2020-05 will have to be applied prospectively fromapproval date of the Financial Reporting Standards Council which was November 11, 2020.
The Parent Company availed of the SEC relief to defer of adoption of this PIC Q&A untilDecember 31, 2020. Currently, the Parent Company records the repossessed inventory at cost.The Parent Company opted to implement approach 3 in its accounting for sales cancellation.
Current and Noncurrent ClassificationThe Parent Company presents assets and liabilities in parent company statement of financial positionbased on current/noncurrent classification. An asset is current when it is:
Expected to be realized or intended to be sold or consumed in normal operating cycle; Held primarily for the purpose of trading; Expected to be realized within 12 months after reporting date; or Cash or cash equivalent unless restricted from being exchanged or used to settle a liability for at
least 12 months after reporting date.
All other assets are classified as noncurrent.
A liability is current when:
It is expected to be settled in the normal operating cycle; It is held primarily for the purpose of trading; It is due to be settled within 12 months after reporting date; or There is no unconditional right to defer the settlement of the liability for at least 12 months after
reporting date.
The Parent Company classifies all other liabilities as noncurrent.
Deferred tax assets and liabilities are classified as noncurrent assets and liabilities, respectively.
Fair Value MeasurementFair value is the price that would be received to sell an asset or paid to transfer a liability in an orderlytransaction between market participants at the measurement date. The fair value measurement isbased on the presumption that the transaction to sell the asset or transfer the liability takes placeeither: In the principal market for the asset or liability, or In the absence of a principal market, in the most advantageous market for the asset or liability
The principal or the most advantageous market must be accessible to the Parent Company.
The fair value of an asset or a liability is measured using the assumptions that market participantswould use when pricing the asset or liability, assuming that market participants act in their economicbest interest.

- 10 -
*SGVFSM006234*
A fair value measurement of a non-financial asset takes into account a market participant's ability togenerate economic benefits by using the asset in its highest and best use or by selling it to anothermarket participant that would use the asset in its highest and best use.
The Parent Company uses valuation techniques that are appropriate in the circumstances and forwhich sufficient data are available to measure fair value, maximizing the use of relevant observableinputs and minimizing the use of unobservable inputs.All assets for which fair value is measured or disclosed in the parent company financial statementsare categorized within the fair value hierarchy, described as follows, based on the lowest level inputthat is significant to the fair value measurement as a whole: Level 1 - Quoted (unadjusted) market prices in active markets for identical assets or liabilities Level 2 - Valuation techniques for which the lowest level input that is significant to the fair value
measurement is directly or indirectly observable Level 3 - Valuation techniques for which the lowest level input that is significant to the fair value
measurement is unobservable.
For assets and liabilities that are recognized in the financial statements on a recurring basis, theParent Company determines whether transfers have occurred between Levels in the hierarchy by re-assessing categorization (based on the lowest level input that is significant to the fair valuemeasurement as a whole) at the end of each reporting period.
External valuers are involved for valuation of significant assets, such as investment properties.Involvement of external valuers is decided upon annually by corporate finance after discussion withand approval by the Parent Company’s audit committee. Selection criteria include market knowledge,reputation, independence and whether professional standards are maintained.
The Parent Company, in conjunction with the external valuers, also compares each of the changes inthe fair value of each asset with relevant external sources to determine whether the change isreasonable.
For the purpose of fair value disclosures, the Parent Company has determined classes of assets onthe basis of the nature, characteristics and risks of the asset and the level of the fair value hierarchyas explained above.
Cash and Cash EquivalentsCash includes cash on hand and in banks. Cash equivalents are short-term, highly liquid investmentsthat are readily convertible to known amounts of cash with original maturities of three (3) months orless from dates of placement and that are subject to an insignificant risk of changes in value.
Financial InstrumentsDate of recognitionThe Parent Company recognizes a financial asset or a financial liability in the parent companystatement of financial position when it becomes a party to the contractual provisions of theinstrument. Purchases or sales of financial assets that require delivery of assets within the timeframe established by regulation or convention in the marketplace are recognized on the settlementdate.
a. Financial assets
Initial recognition of financial instrumentsFinancial assets are classified, at initial recognition, as subsequently measured at amortized cost, fairvalue through other comprehensive income (OCI), and fair value through profit or loss.
The classification of financial assets at initial recognition depends on the financial asset’s contractualcash flow characteristics and the Parent Company’s business model for managing them. The ParentCompany initially measures a financial asset at its fair value plus, in the case of a financial asset notat fair value through profit or loss, transaction costs. Trade receivables, except for residential,

- 11 -
*SGVFSM006234*
commercial and office development receivables, are measured at the transaction price determinedunder PFRS 15. Refer to the accounting policies on Revenue from contracts with customers.
In order for a financial asset to be classified and measured at amortized cost or fair value throughOCI, it needs to give rise to cash flows that are ‘solely payments of principal and interest (SPPI)’ onthe principal amount outstanding. This assessment is referred to as the SPPI test and is performedat an instrument level.The Parent Company’s business model for managing financial assets refers to how it manages itsfinancial assets in order to generate cash flows. The business model determines whether cash flowswill result from collecting contractual cash flows, selling the financial assets, or both.
Purchases or sales of financial assets that require delivery of assets within a time frame establishedby regulation or convention in the market place (regular way trades) are recognized on the trade date,i.e., the date that the Parent Company commits to purchase or sell the asset.
Subsequent measurementFor purposes of subsequent measurement, financial assets are classified in four categories: Financial assets at amortized cost (debt instruments) Financial assets at fair value through OCI with recycling of cumulative gains and losses (debt
instruments) Financial assets designated at fair value through OCI with no recycling of cumulative gains and
losses upon derecognition (equity instruments) Financial assets at fair value through profit or loss
Financial assets at amortized costThis category is the most relevant to the Parent Company. The Parent Company measures financialassets at amortized cost if both of the following conditions are met: The financial asset is held within a business model with the objective to hold financial assets in
order to collect contractual cash flows; and The contractual terms of the financial asset give rise on specified dates to cash flows that are
solely payments of principal and interest on the principal amount outstanding.
Financial assets at amortized cost are subsequently measured using the effective interest (EIR)method and are subject to impairment. Interest income and impairment losses or reversals arerecognized in the parent company statement of comprehensive income. Gains and losses arerecognized in profit or loss when the asset is derecognized, modified or impaired.
The Parent Company’s financial assets at amortized cost includes “Cash and cash equivalents” and“Accounts and notes receivables”.
Disposal of financial assets at amortized costWhen financial assets at amortized cost are disposed, these are assessed whether the ParentCompany is consistent with its objective of collecting contractual cash flows until maturity. In theevent that disposals have been concluded as infrequent and insignificant, the financial assetscontinue to be accounted at amortized cost (see Note 6).
Financial assets at fair value through OCI (debt instruments)The Parent Company measures debt instruments at fair value through OCI if both of the followingconditions are met: The financial asset is held within a business model with the objective of both holding to collect
contractual cash flows and selling; and The contractual terms of the financial asset give rise on specified dates to cash flows that are solely
payments of principal and interest on the principal amount outstanding.
For debt instruments at fair value through OCI, interest income, foreign exchange revaluation andimpairment losses or reversals are recognized in the consolidated statement of income and computedin the same manner as for financial assets measured at amortized cost. The remaining fair value

- 12 -
*SGVFSM006234*
changes are recognized in OCI. Upon derecognition, the cumulative fair value change recognized inOCI is recycled to profit or loss.
The Parent Company does not have debt instruments at fair value through OCI.
Financial assets designated at fair value through OCI (equity instruments)Upon initial recognition, the Parent Company can elect to classify irrevocably its equity investmentsas equity instruments designated at fair value through OCI when they meet the definition of equityunder PAS 32, Financial Instruments: Presentation and are not held for trading. The classification isdetermined on an instrument-by-instrument basis.
Gains and losses on these financial assets are never recycled to profit or loss. Dividends arerecognized as other income in the parent company statement of income when the right of paymenthas been established, except when the Parent Company benefits from such proceeds as a recoveryof part of the cost of the financial asset, in which case, such gains are recorded in OCI. Equityinstruments designated at fair value through OCI are not subject to impairment assessment.
The Parent Company’s financial assets at fair value through OCI includes investments in quoted andunquoted equity instruments.
Financial assets at fair value through profit or lossFinancial assets at fair value through profit or loss include financial assets held for trading, financialassets designated upon initial recognition at fair value through profit or loss, or financial assetsmandatorily required to be measured at fair value. Financial assets are classified as held for trading ifthey are acquired for the purpose of selling or repurchasing in the near term. Derivatives, includingseparated embedded derivatives, are also classified as held for trading unless they are designated aseffective hedging instruments. Financial assets with cash flows that are not solely payments ofprincipal and interest are classified and measured at fair value through profit or loss, irrespective ofthe business model. Notwithstanding the criteria for debt instruments to be classified at amortisedcost or at fair value through OCI, as described above, debt instruments may be designated at fairvalue through profit or loss on initial recognition if doing so eliminates, or significantly reduces, anaccounting mismatch.
Financial assets at fair value through profit or loss are carried in the parent company statement offinancial position at fair value with net changes in fair value recognized in the parent companystatement of income.
Investments in Unit Investment Trust Fund (UITF) and treasury bills are held for trading and classifiedas financial assets at FVPL.
DerecognitionA financial asset (or, where applicable, a part of a financial asset or part of a group of similar financialassets) is primarily derecognized (i.e., removed from the Parent Company’s statement of financialposition) when: The rights to receive cash flows from the asset have expired; or The Parent Company has transferred its rights to receive cash flows from the asset or has
assumed an obligation to pay the received cash flows in full without material delay to a third partyunder a ‘pass-through’ arrangement; and either (a) the Parent Company has transferredsubstantially all the risks and rewards of the asset, or (b) the Parent Company has neithertransferred nor retained substantially all the risks and rewards of the asset, but has transferredcontrol of the asset
When the Parent Company has transferred its rights to receive cash flows from an asset or hasentered into a pass-through arrangement, it evaluates if, and to what extent, it has retained the risksand rewards of ownership. When it has neither transferred nor retained substantially all of the risksand rewards of the asset, nor transferred control of the asset, the Parent Company continues to
- 13 -
*SGVFSM006234*
recognize the transferred asset to the extent of its continuing involvement. In that case, the ParentCompany also recognizes an associated liability. The transferred asset and the associated liabilityare measured on a basis that reflects the rights and obligations that the Parent Company hasretained.
Continuing involvement that takes the form of a guarantee over the transferred asset is measured atthe lower of the original carrying amount of the asset and the maximum amount of consideration thatthe Parent Company could be required to repay.
Modification of financial assetsThe Parent Company derecognizes a financial asset when the terms and conditions have beenrenegotiated to the extent that, substantially, it becomes a new asset, with the difference between itscarrying amount and the fair value of the new asset recognized as a derecognition gain or loss inprofit or loss, to the extent that an impairment loss has not already been recorded.
When the contractual cash flows of a financial asset are renegotiated or otherwise modified and therenegotiation or modification does not result in the derecognition of that financial asset, the ParentCompany recalculates the gross carrying amount of the financial asset as the present value of therenegotiated or modified contractual cash flows discounted at the original EIR (or credit-adjusted EIRfor purchased or originated credit-impaired financial assets) and recognizes a modification gain orloss in the parent company statement of income.
Impairment of Financial AssetsThe Parent Company recognizes an allowance for expected credit losses (ECLs) for all debtinstruments not held at fair value through profit or loss. ECLs are based on the difference betweenthe contractual cash flows due in accordance with the contract and all the cash flows that the ParentCompany expects to receive, discounted at an approximation of the original effective interest rate.The expected cash flows will include cash flows from the sale of collateral held or other creditenhancements that are integral to the contractual terms.
For trade receivables, the Parent Company applies a simplified approach in calculating ECLs.Therefore, the Parent Company does not track changes in credit risk, but instead recognizes a lossallowance based on lifetime ECLs at each reporting date. The Parent Company has established aprovision matrix for trade receivables and a vintage analysis for residential, commercial and officedevelopment receivables that is based on historical credit loss experience, adjusted for forward-looking factors specific to the debtors and the economic environment.
For other financial assets such as accrued receivable, receivable from related parties and advancesto other companies, ECLs are recognized in two stages. For credit exposures for which there has notbeen a significant increase in credit risk since initial recognition, ECLs are provided for credit lossesthat result from default events that are possible within the next 12 months (a 12-month ECL). Forthose credit exposures for which there has been a significant increase in credit risk since initialrecognition, a loss allowance is required for credit losses expected over the remaining life of theexposure, irrespective of the timing of the default (a lifetime ECL).
For cash and cash equivalents, the Parent Company applies the low credit risk simplification. Theprobability of default and loss given defaults are publicly available and are considered to be low creditrisk investments. It is the Parent Company’s policy to measure ECLs on such instruments on a 12-month basis. However, when there has been a significant increase in credit risk since origination, theallowance will be based on the lifetime ECL. The Parent Company uses the ratings from Standardand Poor’s (S&P), Moody’s, and Fitch to determine whether the debt instrument has significantlyincreased in credit risk and to estimate ECLs.
The Parent Company considers a debt investment security to have low credit risk when its credit riskrating is equivalent to the globally understood definition of ‘investment grade’.

- 14 -
*SGVFSM006234*
The key inputs in the model include the Parent Company’s definition of default and historical data ofthree years for the origination, maturity date and default date. The Parent Company considers tradereceivables and contract assets in default when contractual payment are 90 days past due, except forcertain cases when the reason for being past due is due to reconciliation with customers of paymentrecords which are administrative in nature which may extend the definition of default to 90 days andbeyond. However, in certain cases, the Parent Company may also consider a financial asset to be indefault when internal or external information indicates that the Parent Company is unlikely to receivethe outstanding contractual amounts in full before taking into account any credit enhancements heldby the Parent Company.
Determining the stage for impairmentAt each reporting date, the Parent Company assesses whether there has been a significant increasein credit risk for financial assets since initial recognition by comparing the risk of default occurringover the expected life between the reporting date and the date of initial recognition. The ParentCompany considers reasonable and supportable information that is relevant and available withoutundue cost or effort for this purpose. This includes quantitative and qualitative information andforward-looking analysis.
The Parent Company considers that there has been a significant increase in credit risk whencontractual payments are more than 90 days past due.
An exposure will migrate through the ECL stages as asset quality deteriorates. If, in a subsequentperiod, asset quality improves and also reverses any previously assessed significant increase incredit risk since origination, then the loss allowance measurement reverts from lifetime ECL to 12-months ECL.
b. Financial liabilitiesInitial recognition and measurementFinancial liabilities are classified, at initial recognition, as financial liabilities at fair value through profitor loss, loans and borrowings, payables, or as derivatives designated as hedging instruments in aneffective hedge, as appropriate.
All financial liabilities are recognized initially at fair value and, in the case of loans and borrowings andpayables, net of directly attributable transaction costs.
Directly attributable transaction costs are documentary stamp tax, underwriting and selling fees,regulatory filing fees and other fees.
The Parent Company’s financial liabilities include “Accounts and other payables” (other than “Taxespayable which is covered by other accounting standard), “Short-term and long-term debts”, “Depositsand Other Liabilities” and “Lease liabilities”.
Subsequent measurementThe measurement of financial liabilities depends on their classification, as described below:
Financial liabilities at fair value through profit or lossFinancial liabilities at fair value through profit or loss include financial liabilities held for trading andfinancial liabilities designated upon initial recognition as at fair value through profit or loss.
Financial liabilities are classified as held for trading if they are incurred for the purpose ofrepurchasing in the near term. This category also includes derivative financial instruments enteredinto by the Parent Company that are not designated as hedging instruments in hedge relationships asdefined by PFRS 9. Separated embedded derivatives are also classified as held for trading unlessthey are designated as effective hedging instruments.

- 15 -
*SGVFSM006234*
Gains or losses on liabilities held for trading are recognized in the parent company statement ofincome.
The designation of financial liabilities at fair value through profit or loss at the initial date of recognitionis allowed and only if the criteria in PFRS 9 are satisfied. The Parent Company has not designatedany financial liability as at fair value through profit or loss.
Loans and borrowingsThis is the category most relevant to the Parent Company. After initial recognition, interest-bearingloans and borrowings are subsequently measured at amortized cost using the EIR method. Gainsand losses are recognized in profit or loss when the liabilities are derecognized as well as through theEIR amortization process.
Amortized cost is calculated by taking into account any discount or premium on acquisition and feesor costs that are an integral part of the EIR. The EIR amortization is included as finance costs in thestatement of income.
This category generally applies to short-term and long-term debt.
DerecognitionA financial liability is derecognized when the obligation under the liability is discharged or cancelled orexpires. When an existing financial liability is replaced by another from the same lender onsubstantially different terms, or the terms of an existing liability are substantially modified, such anexchange or modification is treated as the derecognition of the original liability and the recognition ofa new liability. The difference in the respective carrying amounts is recognized in the parent companystatement of income.
c. Offsetting Financial InstrumentsFinancial assets and financial liabilities are offset and the net amount reported in the parent companystatement of financial position, if, and only if, there is a currently enforceable legal right to offset therecognized amounts and there is an intention to settle on a net basis, or to realize the asset and settlethe liability simultaneously.
Refundable DepositsRefundable deposits are measured initially at fair value. After initial recognition, refundable depositsare subsequently measured at amortized cost using the effective interest method.
The difference between the cash received and its fair value is deferred and amortized using thestraight-line method under the “Real estate revenue” account in the parent company statement ofincome.
Non-refundable deposits that are applicable against costs of services incurred or goods delivered aremeasured at fair value.
InventoriesProperty acquired or being constructed for sale in the ordinary course of business, rather than to beheld for rental or capital appreciation, is held as inventory and is measured at the lower of cost or netrealizable value (NRV).
Cost includes: Land cost Land improvement cost Amounts paid to contractors for construction and development Planning and design costs, costs of site preparation, professional fees, property transfer taxes,
construction overheads and other related costs

- 16 -
*SGVFSM006234*
NRV is the estimated selling price in the ordinary course of the business, based on market pricesat the reporting date, less estimated costs of completion and the estimated costs of sale.
Prepaid ExpensesPrepaid expenses are carried at cost less the amortized portion. These typically compriseprepayments for commissions, marketing fees, advertising and promotions, taxes and licenses, andinsurance.
With the exception of commission which is amortized using percentage of completion, other prepaidexpenses are amortized as incurred.
Input Value-Added Tax (VAT)Input VAT arises from the purchase of goods and services. These are applied against output VAT.The remaining balance is recoverable in future periods. These are carried at cost less allowance forimpairment loss, if any. Impairment loss is recognized when input VAT can no longer be recovered.
Advances to Other Companies, Advances to Contractors and Suppliers and Deposits on LandPurchasesAdvances to other companies, advances to contractors and suppliers and deposits on land purchasesare carried at cost less impairment losses, if any.
Investments in Subsidiaries, Associates and Joint VenturesThe Parent Company’s investments in its subsidiaries, associates and joint ventures are accountedfor under the cost method and are carried at cost less accumulated provisions for impairment losses,if any. A subsidiary is an entity over which the Parent Company has control. The Parent Companycontrols an entity when it is exposed, or has rights to variable returns from its involvement with theentity and has the ability to affect those returns through its power over the entity. An associate is anentity in which the Parent Company has a significant influence and which is neither a subsidiary nor ajoint venture. A joint arrangement is a contractual arrangement whereby two or more partiesundertake an economic activity that is subject to joint control, and a joint venture is a jointarrangement that involves the establishment of a separate entity in which each venturer has aninterest.
The Parent Company recognizes income from the investment only to the extent that the ParentCompany receives distributions from accumulated profits of the investee arising after the date ofacquisition. Distributions received in excess of such profits are regarded as recovery of investmentand are recognized as a reduction of the cost of the investment.
The Parent Company reduces the carrying value of its investment based on average acquisition costper share (historical cost) when the Parent Company disposes the investment or the investeereacquires its own equity instruments from the Parent Company.
Investment PropertiesInvestment properties comprise completed property and property under construction orre-development that are held to earn rentals or capital appreciation or both and that are not occupiedby the Parent Company. It also includes land intended as investment property or with unintendedfuture use.
The Parent Company uses the cost model in measuring investment properties since this representsthe historical value of the properties subsequent to initial recognition. Investment properties, exceptfor land, are carried at cost less accumulated depreciation and amortization and any impairment inresidual value. Land is carried at cost less any impairment in value.
Expenditures incurred after the investment property has been put in operation, such as repairs andmaintenance costs, are normally charged against income in the period in which the costs areincurred.

- 17 -
*SGVFSM006234*
Assets that are under construction are carried at cost and transferred to the related investmentproperty account when the construction and related activities to prepare the property for its intendeduse are complete, and the property is ready for occupation or under the condition as intended by theParent Company.
Depreciation of investment properties are computed using the straight-line method over the estimateduseful lives of the assets. The estimated useful lives and the depreciation method are reviewedperiodically to ensure that the period and method of depreciation are consistent with the expectedpattern of economic benefits from items of investment properties.
The estimated useful lives of investment properties, which is comprised of buildings, ranges from 20to 40 years.
Investment properties are derecognized when either they have been disposed of, or when theinvestment property is permanently withdrawn from use and no future economic benefit is expectedfrom its disposal. Any gain or loss on the retirement or disposal of an investment property isrecognized in the parent company statement of income in the year of retirement or disposal.
A transfer is made to investment property when there is a change in use, evidenced by ending ofowner-occupation, commencement of an operating lease to another party or ending of construction ordevelopment. A transfer is made from investment property when and only when there is a change inuse, evidenced by commencement of owner-occupation or commencement of development with aview to sale. A transfer between investment property, owner-occupied property and inventory doesnot change the carrying amount of the property transferred nor does it change the cost of thatproperty for measurement or disclosure purposes.
The Parent Company discloses the fair values of its investment properties in accordance withPAS 40. The Parent Company engaged independent valuation specialist to assess fair value as atDecember 31, 2020 and 2019. The Parent Company’s investment properties consist of land andbuilding pertaining to land properties, retail spaces and office properties. Land were valued byreference to market-based evidence using comparable prices adjusted for specific market factorssuch as nature, location and condition of the property. Buildings (retail, office, hospital) were valuedusing income approach by reference to the valie of income, cash flow or cost saving generated by theasset.
Property and EquipmentProperty and equipment, except for land, are carried at cost less accumulated depreciation andamortization and any impairment in value. Land is carried at cost less any impairment in value. Theinitial cost of property and equipment comprises its construction cost or purchase price and anydirectly attributable costs of bringing the asset to its working condition and location for its intendeduse.
Major repairs are capitalized as part of property and equipment only when it is probable that futureeconomic benefits associated with the item will flow to the Parent Company and the cost of the itemscan be measured reliably. All other repairs and maintenance are charged against current operationsas incurred.
Depreciation and amortization of property and equipment commences once the property andequipment are available for use and is computed on a straight-line basis over the estimated usefullives of the property and equipment as follows:
YearsBuildings and improvements 20-40Furniture, fixtures and office equipment 3-10Transportation equipment 3-5

- 18 -
*SGVFSM006234*
The assets’ residual values, estimated useful lives and depreciation and amortization method arereviewed periodically to ensure that the amounts, periods and method of depreciation andamortization are consistent with the expected pattern of economic benefits from items of property andequipment.
When property and equipment are retired or otherwise disposed of, the cost and the relatedaccumulated depreciation and amortization and accumulated provision for impairment losses, if any,are removed from the accounts and any resulting gain or loss is credited to or charged againstcurrent operations.
Impairment of Nonfinancial AssetsThe Parent Company assesses at each reporting date whether there is an indication that an assetmay be impaired (investments in subsidiaries, associates and joint ventures, investment properties,property and equipment and right-of-use assets). If any such indication exists, or when annualimpairment testing for an asset is required, the Parent Company makes an estimate of the asset’srecoverable amount. An asset’s recoverable amount is the higher of an asset’s or CGU’s fair valueless costs to sell and its value in use and is determined for an individual asset, unless the asset doesnot generate cash inflows that are largely independent of those from other assets or ParentCompanys of assets. Where the carrying amount of an asset exceeds its recoverable amount, theasset is considered impaired and is written down to its recoverable amount. In assessing value inuse, the estimated future cash flows are discounted to their present value using a pre-tax discountrate that reflects current market assessments of the time value of money and the risks specific to theasset. Impairment losses of continuing operations are recognized in the parent company statementof income in those expense categories consistent with the function of the impaired asset.
An assessment is made at each reporting date as to whether there is any indication that previouslyrecognized impairment losses may no longer exist or may have decreased. If any such indicationexists, the recoverable amount is estimated. A previously recognized impairment loss is reversedonly if there has been a change in the estimates used to determine the asset’s recoverable amountsince the last impairment loss was recognized. If such is the case, the carrying amount of the assetis increased to its recoverable amount. That increased amount cannot exceed the carrying amountthat would have been determined, net of depreciation, had no impairment loss been recognized forthe asset in prior years. Such reversal is recognized in the parent company statement of incomeunless the asset is carried at revalued amount, in which case, the reversal is treated as a revaluationincrease. After such reversal, the depreciation charge is adjusted in future periods to allocate theasset’s revised carrying amount, less any residual value, on a systematic basis over its remaininguseful life.
The following criteria are also applied in assessing impairment of specific assets:
Investments in subsidiaries, associates and joint venturesThe Parent Company determines at each reporting date whether there is any objective evidence thatthe investment in subsidiaries, associates or joint ventures is impaired. If this is the case, the ParentCompany calculates the amount of impairment as being the difference between the recoverableamount and the carrying value of the investee company and recognizes the difference in the parentcompany statement of income.
ProvisionsProvisions are recognized when the Parent Company has a present obligation (legal or constructive)as a result of a past event, it is probable that an outflow of resources embodying economic benefitswill be required to settle the obligation, and a reliable estimate can be made of the amount of theobligation. Where the Parent Company expects a provision to be reimbursed, the reimbursement isrecognized as a separate asset but only when the reimbursement is virtually certain. If the effect ofthe time value of money is material, provisions are determined by discounting the expected futurecash flows at a pre-tax rate that reflects current market assessments of the time value of money and,where appropriate, the risks specific to the liability. Where discounting is used, the increase in the

- 19 -
*SGVFSM006234*
provision due to the passage of time is recognized as interest expense. Provisions are reviewed ateach reporting date and adjusted to reflect the current best estimate.
Pension CostPension cost is actuarially determined using the projected unit credit method. This method reflectsservices rendered by employees up to the date of valuation and incorporates assumptions concerningemployees’ projected salaries. Actuarial valuations are conducted with sufficient regularity, withoption to accelerate when significant changes to underlying assumptions occur. Pension costincludes: a) service costs comprising current service costs and past-service costs b) gains and losseson curtailments and non-routine settlements, and c) net interest cost on benefit obligation.
Remeasurements, comprising of actuarial gains or losses, the effect of the asset ceiling excluding netinterest cost and the return on plan assets (excluding net interest), are recognized immediately in theparent company statement of financial position with a corresponding debit or credit to OCI in theperiod in which they occur. Remeasurements are not reclassified to profit or loss in subsequentperiods.
The liability recognized in the parent company statement of financial position in respect of definedbenefit pension plans is the present value of the defined benefit obligation at the reporting date lessfair value of the plan assets. The defined benefit obligation is calculated annually by independentactuaries using the projected unit credit method. The present value of the defined benefit obligationis determined by using risk-free interest rates of long-term government bonds that have terms tomaturity approximating the terms of the related pension liabilities or applying a single weightedaverage discount rate that reflects the estimated timing and amount of benefit payments.
Share-based PaymentsThe Parent Company has equity-settled, share-based compensation plans with its employees.
PFRS 2 optionsFor options granted after November 7, 2002 that have not vested on or before January 1, 2005, thecost of equity-settled transactions with employees is measured by reference to the fair value at thedate on which they are granted. The fair value is determined by using the Black-Scholes model,further details of which are presented in Note 25.
The cost of equity-settled transactions is recognized, together with a corresponding increase inequity, over the period in which the performance conditions are fulfilled, ending on the date on whichthe relevant employees become fully entitled to the award (vesting date). The cumulative expenserecognized for equity-settled transactions at each reporting date until the vesting date reflects theextent to which the vesting period has expired and the Parent Company’s best estimate of thenumber of equity instrument that will ultimately vest. The income or expense for a period representsthe movement in cumulative expense recognized as at the beginning and end of that period.
No expense is recognized for awards that do not ultimately vest, except for awards where vesting isconditional upon a market condition, which are treated as vesting irrespective of whether or not themarket condition is satisfied, provided that all other performance conditions are satisfied.
Where the terms of an equity-settled award are modified, as a minimum, an expense is recognized.In addition, an expense is recognized for any increase in the value of the transaction as a result of themodification, as measured at the date of modification. Where an equity-settled award is cancelled, itis treated as if it had vested on the date of cancellation, and any expense not yet recognized for theaward is recognized immediately. However, if a new award is substituted for the cancelled award,and designated as a replacement award on the date that it is granted, the cancelled and new awardsare treated as if they were a modification of the original award, as described in the previousparagraph.

- 20 -
*SGVFSM006234*
Pre-PFRS 2 optionsFor options granted before November 7, 2002 that has vested before January 1, 2005, the intrinsicvalue of stock options determined as of grant date is recognized as expense over the vesting period.
The dilutive effect of outstanding options is reflected as additional share dilution in the computation ofdiluted earnings per share (see Note 24).
Employee Stock Ownership PlanThe Parent Company has an employee stock ownership plan (ESOWN) which allows the grantees topurchase the Parent Company’s shares. The Parent Company recognizes stock compensationexpense over the holding period. The Parent Company treats its ESOWN plan as option exercisablewithin a given period. These are accounted for similar to the PFRS 2 options. Dividends paid on theawards that have vested are deducted from equity and those paid on awards that are unvested arecharged to profit or loss. For the unsubscribed shares where the employees still have the option tosubscribe in the future, these are accounted for as options.
EquityWhen the shares are sold at a premium, the difference between the proceeds and the par value iscredited to “Additional paid-in capital” account. Direct costs incurred related to equity issuance arechargeable to “Additional paid-in capital” account. If additional paid-in capital is not sufficient, theexcess is charged against retained earnings. When the Parent Company issues more than one classof stock, a separate account is maintained for each class of stock and the number of shares issued.
Subscriptions receivable pertains to the uncollected portion of the subscribed shares.
Retained earnings represent accumulated earnings of the Parent Company less dividends declared.
Own equity instruments which are reacquired (treasury shares) are recognized at cost and deductedfrom equity. No gain or loss is recognized in the parent company statement of income on thepurchase, sale, issue or cancellation of its own equity instruments. Any difference between thecarrying amount and the consideration, if reissued, is recognized under “Additional paid-in capital”.Voting rights related to treasury shares are nullified for the Parent Company and no dividends areallocated to them respectively. When the shares are retired, the capital stock account is reduced byits par value and the excess of cost over par value upon retirement is debited to additional paid-incapital when the shares were issued and to retained earnings for the remaining balance.
Revenue from Contract with CustomersThe Parent Company primarily derives its real estate revenue from the sale of vertical and horizontalreal estate projects. Revenue from contracts with customers is recognized when control of the goodsor services are transferred to the customer at an amount that reflects the consideration to which theParent Company expects to be entitled in exchange for those goods or services. Except for theprovisioning of water, electricity, air-conditioning and common use service area in its mall retailspaces, wherein it is acting as agent, the Parent Company has generally concluded that it is theprincipal in its revenue arrangements.
The disclosures of significant accounting judgements, estimates and assumptions relating to revenuefrom contracts with customers are provided in Note 3.
Real estate salesThe Parent Company derives its real estate revenue from sale of lots, house and lot andcondominium units. Revenue from the sale of these real estate projects under pre-completion stageare recognized over time during the construction period (or percentage of completion) since based onthe terms and conditions of its contract with the buyers, the Parent Company’s performance does notcreate an asset with an alternative use and the Parent Company has an enforceable right to paymentfor performance completed to date.

- 21 -
*SGVFSM006234*
In measuring the progress of its performance obligation over time, the Parent Company uses theoutput method. The Parent Company recognizes revenue on the basis of direct measurements of thevalue to customers of the goods or services transferred to date, relative to the remaining goods orservices promised under the contract. Progress is measured using survey of performance completedto date. This is based on the monthly project accomplishment report prepared by the third partysurveyor as approved by the construction manager which integrates the surveys of performance todate of the construction activities for both sub-contracted and those that are fulfilled by the developeritself.
Any excess of progress of work over the right to an amount of consideration that is unconditional,recognized as trade receivables under residential, commercial and office development receivablesaccount. Any excess of collections over the total of recognized trade receivables is included in thecustomers’ deposit account in the liabilities section of the parent company statements of financialposition. The impact of the significant financing component on the transaction price has not beenconsidered since the Parent Company availed the relief granted by the SEC under MemorandumCircular Nos. 14-2018 as of 2018 for the implementation issues of PFRS 15 affecting the real estateindustry. Under the SEC Memorandum Circular No. 34, the relief has been extended untilDecember 31, 2023
Cost recognitionThe Parent Company recognizes costs relating to satisfied performance obligations as these areincurred taking into consideration the contract fulfillment assets such as connection fees. Theseinclude costs of land, land development costs, building costs, professional fees, depreciation, permits,and licenses. These costs are allocated to the saleable area, with the portion allocable to the soldarea being recognized as costs of sales while the portion allocable to the unsold area beingrecognized as part of real estate inventories.
Contract costs include all direct materials and labor costs and those indirect costs related to contractperformance. Expected losses on contracts are recognized immediately when it is probable that thetotal contract costs will exceed total contract revenue. Changes in contract performance, contractconditions and estimated profitability, including those arising from contract penalty provisions, andfinal contract settlements which may result in revisions to estimated costs and gross margins arerecognized in the year in which the changes are determined.
Service fees, which include marketing fees, management fees from administration and propertymanagement, are recognized when services are rendered.
Interest income is recognized as it accrues using the effective interest method.
Dividend income is recognized when the Parent Company’s right to receive the payment isestablished.
Customers’ depositA customers’ deposit is the obligation to transfer goods or services to a customer for which the ParentCompany has received consideration (or an amount of consideration is due) from the customer. If acustomer pays consideration before the Parent Company transfers goods or services to thecustomer, a customers’ deposit is recognized when the payment is made or the payment is due(whichever is earlier). Customers’ deposit are recognized as revenue when the control of the goodsor services are transferred to the customers by the Parent Company which is essentially fulfillment ofits performance obligation under the contract.Customers’ deposit also include payments received by the Parent Company from the customers forwhich revenue recognition has not yet commenced.
Costs to Obtain ContractThe incremental costs of obtaining a contract with a customer are recognized as an asset if theParent Company expects to recover them. The Parent Company has determined that commissions

- 22 -
*SGVFSM006234*
paid to brokers and marketing agents on the sale of pre-completed real estate units are deferredwhen recovery is reasonably expected and are charged to expense in the period in which the relatedrevenue is recognized as earned. Commission expense is included in the “Real estate costs andexpenses” account in the parent company statement of income.
Costs incurred prior to obtaining contract with customer are not capitalized but are expensed asincurred.
Amortization, de-recognition and impairment of capitalized costs to obtain a contractFollowing the pattern of real estate revenue recognition, the Parent Company amortizes capitalizedcosts to obtain a contract to cost of sales over the expected construction period using percentage ofcompletion. The amortization is included within cost of sales.
A capitalized cost to obtain a contract is derecognized either when it is disposed of or when no furthereconomic benefits are expected to flow from its use or disposal.
At each reporting date, the Parent Company determines whether there is an indication that cost toobtain a contract maybe impaired. If such indication exists, the Parent Company makes an estimateby comparing the carrying amount of the assets to the remaining amount of consideration that theParent Company expects to receive less the costs that relate to providing services under the relevantcontract. In determining the estimated amount of consideration, the Parent Company uses the sameprinciples as it does to determine the contract transaction price, except that any constraints used toreduce the transaction price will be removed for the impairment test.
Where the relevant costs or specific performance obligations are demonstrating marginal profitabilityor other indicators of impairment, judgement is required in ascertaining whether or not the futureeconomic benefits from these contracts are sufficient to recover these assets. In performing thisimpairment assessment, management is required to make an assessment of the costs to completethe contract. The ability to accurately forecast such costs involves estimates around cost savings tobe achieved over time, anticipated profitability of the contract, as well as future performance againstany contract-specific performance indicators that could trigger variable consideration, or servicecredits. Where a contract is anticipated to make a loss, these judgements are also relevant indetermining whether or not an onerous contract provision is required and how this is to be measured.
Rental income (part of real estate sales in the parent company statement of income)Rental income under noncancellable and cancellable leases on investment properties is recognizedin the parent company statement of income on a straight-line basis over the lease term and the termsof the lease, respectively, or based on a certain percentage of the gross revenue of the tenants, asprovided under the terms of the lease contract.
No rental income is recognized when the Parent Company waive its right to collect rent and othercharges. This is recognized as a rent concession and reported as a variable payment (see Note 29).
Expense RecognitionExpenses are recognized in the parent company statement of income when decrease in futureeconomic benefit related to a decrease in an asset or an increase in a liability has arisen that can bemeasured reliably.
Expenses are recognized in the parent company statement of income as follow: On the basis of a direct association between the costs incurred and the earning of specific items
of income; On the basis of systematic and rational allocation procedures when economic benefits are
expected to arise over several accounting periods and the association can only be broadly orindirectly determined; or
Immediately when expenditure produces no future economic benefits or when, and to the extentthat, future economic benefits do not qualify or cease to qualify, for recognition in the parentcompany statement of financial position as an asset.

- 23 -
*SGVFSM006234*
Direct operating expenses and general and administrative expenses are recognized as they areincurred.
Borrowing CostsAll borrowing costs are expensed in the period in which they occur. Borrowing costs consist ofinterest and other costs that an entity incurs in connection with the borrowing of funds.
Leases effective January 1, 2019The Parent Company assesses at contract inception whether a contract is, or contains, a lease. Thatis, if the contract conveys the right to control the use of an identified asset for a period of time inexchange for consideration.
Parent Company as lesseeExcept for short-term leases and leases of low-value assets, the Parent Company applies a singlerecognition and measurement approach for all leases. The Parent Company recognises leaseliabilities to make lease payments and right-of-use assets representing the right to use the underlyingassets.
i) Right-of-use assetsThe Parent Company recognises right-of-use assets at the commencement date of the lease (i.e., thedate the underlying asset is available for use). Right-of-use assets are measured at cost, less anyaccumulated depreciation and impairment losses, and adjusted for any remeasurement of leaseliabilities. The cost of right-of-use assets includes the amount of lease liabilities recognised, initialdirect costs incurred, and lease payments made at or before the commencement date less any leaseincentives received and estimate of cost to be incurred by the lessee in dismantling and removing theunderlying asset, restoring the site on which it is located or restoring the underlying asset to thecondition required by the terms and conditions of the lease, unless those costs are incurred toproduce inventories. Right-of-use assets are depreciated on a straight-line basis over the shorter ofthe lease term and the estimated useful lives of the assets. The Parent Company’s right-of-useassets include lease of land which is depreciated based on the term of the lease ranging from 5 to 47years.
If ownership of the leased asset transfers to the Parent Company at the end of the lease term or thecost reflects the exercise of a purchase option, depreciation is calculated using the estimated usefullife of the asset. The right-of-use assets are also subject to impairment. Refer to the accountingpolicies in Impairment of nonfinancial assets section.
ii) Lease liabilitiesAt the commencement date of the lease, the Parent Company recognises lease liabilities measuredat the present value of lease payments to be made over the lease term. The lease payments includefixed payments (including in-substance fixed payments) less any lease incentives receivable, variablelease payments that depend on an index or a rate, and amounts expected to be paid under residualvalue guarantees. The lease payments also include the exercise price of a purchase optionreasonably certain to be exercised by the Parent Company and payments of penalties for terminatingthe lease, if the lease term reflects the Parent Company exercising the option to terminate. Variablelease payments that do not depend on an index or a rate are recognised as expenses (unless theyare incurred to produce inventories) in the period in which the event or condition that triggers thepayment occurs.
In calculating the present value of lease payments, the Parent Company uses its incrementalborrowing rate at the lease commencement date because the interest rate implicit in the lease is notreadily determinable. After the commencement date, the amount of lease liabilities is increased toreflect the accretion of interest and reduced for the lease payments made. In addition, the carryingamount of lease liabilities is remeasured if there is a modification, a change in the lease term, achange in the lease payments (e.g., changes to future payments resulting from a change in an indexor rate used to determine such lease payments) or a change in the assessment of an option topurchase the underlying asset.

- 24 -
*SGVFSM006234*
iii) Short-term leasesThe Parent Company applies the short-term lease recognition exemption to its short-term leases ofoffice space (i.e., those leases that have a lease term of 12 months or less from the commencementdate and do not contain a purchase option). Lease payments on short-term leases are recognised asexpense on a straight-line basis over the lease term.
Parent Company as lessorLeases where the Parent Company does not transfer substantially all the risk and benefits ofownership of the assets are classified as operating leases. Initial direct costs incurred in negotiatingoperating leases are added to the carrying amount of the leased asset and recognized over the leaseterm on the same basis as the rental income. Contingent rents are recognized as revenue in theperiod in which they are earned.
Leases prior to January 1, 2019The determination of whether an arrangement is, or contains, a lease is based on the substance ofthe arrangement at inception date whether the fulfillment of the arrangement is dependent on the useof a specific asset or assets or the arrangement conveys a right to use the asset. A reassessment ismade after inception of the lease only if one of the following applies:
(a) There is a change in contractual terms, other than a renewal or extension of the arrangement;(b) A renewal option is exercised or extension granted, unless the term of the renewal or extension
was initially included in the lease term;(c) There is a change in the determination of whether fulfillment is dependent on a specified asset; or(d) There is substantial change to the asset.
Where a reassessment is made, lease accounting shall commence or cease from the date when thechange in circumstances gave rise to the reassessment for scenarios (a), (c), or (d) and at the date ofrenewal or extension period for scenario (b).
Operating Lease - Parent Company as lesseeLeases where the lessor retains substantially all the risks and benefits of ownership of the asset areclassified as operating leases. Fixed lease payments are recognized as an expense in the parentcompany statement of income on a straight-line basis while the variable rent is recognized as anexpense based on terms of the lease contract.
Operating Lease - Parent Company as lessorLeases where the Parent Company does not transfer substantially all the risk and benefits ofownership of the assets are classified as operating leases. Lease payments received are recognizedas an income in the parent company statement of income on a straight-line basis over the lease term.Initial direct costs incurred in negotiating operating leases are added to the carrying amount of theleased asset and recognized over the lease term on the same basis as the rental income. Contingentrents are recognized as revenue in the period in which they are earned.
Finance Lease - Parent Company as LessorA lease is classified as a finance lease if the Parent Company transfers substantially all the risks andrewards incidental to ownership of an underlying asset. At the commencement date, the ParentCompany shall recognize assets held under a finance lease in its statement of financial position andpresent them as a receivable at an amount equal to the net investment in the lease. The ParentCompany shall use the interest rate implicit in the lease to measure the net investment in the lease.Finance income is recognized over the lease term, based on a pattern reflecting a constant periodicrate of return on the Parent Company's net investment in the lease.
Current TaxCurrent tax assets and liabilities for the current and prior periods are measured at the amountexpected to be recovered from or paid to the tax authority. The tax rates and tax laws used tocompute the amount are those that are enacted or substantively enacted as at the end of thereporting period.

- 25 -
*SGVFSM006234*
Deferred TaxDeferred tax is provided, using the liability method, on all temporary differences, with certainexceptions, at the reporting date between the tax bases of assets and liabilities and their carryingamounts for financial reporting purposes.
Deferred tax liabilities are recognized for all taxable temporary differences, with certain exceptions.Deferred tax assets are recognized for all deductible temporary differences, carryforward benefits ofunused tax credits from excess of minimum corporate income tax (MCIT) over the regular corporateincome tax and unused net operating loss carryover (NOLCO), to the extent that it is probable thattaxable income will be available against which the deductible temporary differences and carryforwardbenefits of unused tax credits and NOLCO can be utilized.
Deferred tax liabilities are not provided on nontaxable temporary differences associated withinvestments in domestic subsidiaries, associates and interests in joint ventures.The carrying amount of deferred tax assets is reviewed at each reporting date and reduced to theextent that it is no longer probable that sufficient taxable income will be available to allow all or part ofthe deferred tax assets to be utilized. Unrecognized deferred tax assets are reassessed at eachreporting date and are recognized to the extent that it has become probable that future taxable profitwill allow all or part of the deferred tax assets to be recovered.
Deferred tax assets and liabilities are measured at the tax rate that is expected to apply to the periodwhen the asset is realized or the liability is settled, based on tax rates and tax laws that have beenenacted or substantively enacted at the reporting date. Movements in the deferred tax assets andliabilities arising from changes in tax rates are charged against or credited to income for the period.
Deferred tax assets and liabilities are offset, if a legally enforceable right exists to set off current taxassets against current tax liabilities and the deferred income taxes relate to the same taxable entityand the same taxation authority.
Foreign Currency TransactionsTransactions in foreign currencies are initially recorded using the exchange rate at the date of thetransactions. Monetary assets and liabilities denominated in foreign currencies are restated using theclosing exchange rates prevailing at reporting date. Exchange gains or losses arising from foreignexchange transactions are credited to or charged against operations for the year.
Earnings Per Share (EPS)Basic EPS is computed by dividing net income for the year attributable to common equity holders ofthe Parent Company by the weighted average number of common shares issued and outstandingduring the year adjusted for any subsequent stock dividends declared. Diluted EPS is computed bydividing net income for the year attributable to common equity holders of the Parent Company by theweighted average number of common shares issued and outstanding during the year plus theweighted average number of common shares that would be issued on conversion of all the dilutivepotential common shares into common shares. Calculation of dilutive EPS considers the potentialordinary shares of subsidiaries, associates and joint ventures that have dilutive effect on the basicEPS of the Parent Company. The calculation of diluted earnings per share does not assumeconversion, exercise, or other issue of potential common shares that would have an antidilutive effecton earnings per share.
Segment ReportingThe Parent Company’s operating businesses are organized and managed separately according tothe nature of the products and services provided, with each segment representing a strategicbusiness unit that offers different products and serves different markets. Financial information onbusiness segments is presented in Note 27 of the parent company financial statements.

- 26 -
*SGVFSM006234*
ContingenciesContingent liabilities are not recognized in the parent company financial statements. These aredisclosed unless the possibility of an outflow of resources embodying economic benefits is remote.Contingent assets are not recognized in the parent company financial statements but disclosed whenan inflow of economic benefits is probable.
Events after the Reporting DatePost year-end events that provide additional information about the Parent Company’s position at thereporting date (adjusting events) are reflected in the parent company financial statements. Post year-end events that are not adjusting events are disclosed in the parent company financial statementswhen material.
3. Significant Accounting Judgments and Estimates
The preparation of the accompanying parent company financial statements in conformity with PFRSsrequires management to make estimates and assumptions that affect the amounts reported in theparent company financial statements and accompanying notes. The estimates and assumptionsused in the accompanying parent company financial statements are based upon management’sevaluation of relevant facts and circumstances as of the date of the parent company financialstatements. Actual results could differ from such estimates.
JudgmentsIn the process of applying the Parent Company’s accounting policies, management has made thefollowing judgments, apart from those involving estimations, which have the most significant effect onthe amounts recognized in the parent company financial statements:
Existence of a contractThe Parent Company’s primary document for a contract with a customer is a signed contract to sell. Ithas determined, however, that in cases wherein contract to sell are not signed by both parties, thecombination of its other duly executed and signed documentation such as reservation agreement,official receipts, buyers’ computation sheets and invoices, would contain all the criteria to qualify ascontract with the customer under PFRS 15.
In addition, part of the assessment process of the Parent Company before revenue recognition is toassess the probability that the Parent Company will collect the consideration to which it will be entitledin exchange for the real estate property that will be transferred to the customer. In evaluatingwhether collectability of an amount of consideration is probable, an entity considers the significanceof the customer’s initial payments in relation to the total contract price. Collectability is also assessedby considering factors such as past history with the customer, age and pricing of the property.Managament regularly evaluates the historical cancellations and back-outs if it would still support itscurrent threshold of customers’ equity before commencing revenue recognition.
Revenue recognition method and measure of progressThe Parent Company concluded that revenue for real estate sales is to be recognized over timebecause: (a) the Parent Company’s performance does not create an asset with an alternative useand; (b) the Parent Company has an enforceable right for performance completed to date. Thepromised property is specifically identified in the contract and the contractual restriction on the ParentCompany’s ability to direct the promised property for another use is substantive. This is because theproperty promised to the customer is not interchangeable with other properties without breaching thecontract and without incurring significant costs that otherwise would not have been incurred in relationto that contract. In addition, under the current legal framework, the customer is contractually obligedto make payments to the developer up to the performance completed to date. In addition, the ParentCompany requires a certain percentage of buyer's payments of total selling price (buyer's equity), tobe collected as one of the criteria in order to initiate revenue recognition. Reaching this level ofcollection is an indication of buyer’s continuing commitment and the probability that economic benefits

- 27 -
*SGVFSM006234*
will flow to the Parent Company. The Parent Company considers that the initial and continuinginvestments by the buyer of about 10% would demonstrate the buyer’s commitment to pay.
The Parent Company has determined that output method used in measuring the progress of theperformance obligation (i.e. percentage of completion) faithfully depicts the Parent Company’sperformance in transferring control of real estate development to the customers.
Distinction of land between real estate inventories and investment propertiesThe Parent Company determines whether a property will be classified as real estate inventories orinvestment properties. In making this judgment, the Parent Company considers whether the propertywill be sold in the normal operating cycle (real estate inventories) and even if the real estateinventories are leased out, the classification remains on the condition that the intent to sell remains.All other properties that are not yet determined to be sold in the normal operating cycle are classifiedas investment properties.
Control of entities in which the Parent Company holds only 50% or less than majority of voting rightsThe Parent Company considers that it controls the following entities even though it owns 50% or lessthan majority of the voting rights. Control is achieved when the Parent Company is exposed, or hasrights, to variable returns from its involvement with the investee and has the ability to affect that returnthrough its power over the investee.
Alabang Commercial Corp. (ACC)For ACC, the Parent Company holds 50% of the voting rights, and is also the single largestshareholder and the remaining 50% of the equity shares are held by several shareholders. Thesecond largest stockholder of ACC holds 8.3% share while the other shareholders’ equity interestranges from 2.1% to 8.3%. In addition, the Parent Company has an existing management servicesagreement with ACC which gives the Parent Company the exclusive control and decision over therelevant activities of ACC.
BGWest Properties, Inc. (BG West)For the BG West, wherein the Parent Company and the other shareholder each own 50% of thevoting rights, the Parent Company controls the investee through exercise of its exclusive projectdevelopment and marketing agreement as well as the ability to decide on the financing, operating andstrategic policies of the investees. This enabled the Parent Company to conclude that it has control.
Ayala Hotels, Inc. (AHI), Roxas Land Corp. (RLC), ALI-CII Development Corp. (ALI-CII) and Leisureand Allied Industries Philippines, Inc. (LAIP).Parent Company has an existing management services agreement with AHI, RLC, ALI-CII and LAIPwhich gives Parent Company the exclusive control and decision over the relevant activities of AHI,RLC, ALI-CII and LAIP.
ContingenciesThe Parent Company is currently involved in various legal proceedings. The estimate of the probablecosts for the resolution of these claims has been developed in consultation with outside counselhandling the defense in these matters and is based upon an analysis of potential results. The ParentCompany currently does not believe that these proceedings will have a material effect on the ParentCompany’s financial position (see Note 30).
Sale of real estate receivablesThe Parent Company has entered into arrangements with banks wherein it discounted its real estatereceivables without recourse. The Parent Company believes that the sales transactions are not morethan infrequent and that the receivables discounted is insignificant in value both individually and inaggregate. Accordingly, the Parent Company continues to present trade receivables at amortizedcost as it remains to hold trade receivables with the objective of collecting contractual cash flows untilmaturity.

- 28 -
*SGVFSM006234*
Definition of default and credit-impaired financial assetsThe Parent Company defines a financial instrument as in default, which is fully aligned with thedefinition of credit-impaired, when it meets one or more of the following criteria:
Quantitative criteria – for residential, commercial and office development receivables, the customerreceives a notice of cancellation and does not continue the payments.
Qualitative criteriaThe customer meets unlikeliness to pay criteria, which indicates the customer is in significant financialdifficulty. These are instances where:a. The customer is experiencing financial difficulty or is insolventb. The customer is in breach of financial covenant(s)c. An active market for that financial assets has disappeared because of financial difficultiesd. Concessions or deferrals have been granted by the Parent Company, for economic or contractual
reasons relating to the customer’s financial difficulty (e.g. Bayanihan Acts I and II considerations)e. It is becoming probable that the customer will enter bankruptcy or other financial reorganization
The criteria above have been applied to the financial instruments held by the Parent Company andare consistent with the definition of default used for internal credit risk management purposes. Thedefault definition has been applied consistently to model the Probability of Default (PD), Loss GivenDefault (LGD) and Exposure at Default (EAD) throughout the Parent Company’s expected losscalculation.
Incorporation of forward-looking informationThe Parent Company incorporates forward-looking information into both its assessment of whetherthe credit risk of an instrument has increased significantly since its initial recognition and itsmeasurement of ECL.
To do this, the Parent Company considers a range of relevant forward-looking macro-economicassumptions for the determination of unbiased general industry adjustments and any related specificindustry adjustments that support the calculation of ECLs. Based on the Parent Company’sevaluation and assessment and after taking into consideration external actual and forecastinformation, the Parent Company formulates a ‘base case’ view of the future direction of relevanteconomic variables as well as a representative range of other possible forecast scenarios. Thisprocess involves developing two or more additional economic scenarios and considering the relativeprobabilities of each outcome. External information includes economic data and forecasts publishedby governmental bodies, monetary authorities and selected private-sector and academic institutions.
The base case represents a most-likely outcome and is aligned with information used by the ParentCompany for other purposes such as strategic planning and budgeting. The other scenariosrepresent more optimistic and more pessimistic outcomes. Periodically, the Parent Company carriesout stress testing of more extreme shocks to calibrate its determination of these other representativescenarios.
The Parent Company has identified and documented key drivers of credit risk and credit losses ofeach portfolio of financial instruments and, using an analysis of historical data, has estimatedrelationships between macro-economic variables and credit risk and credit losses.
Determination of lease term of contracts with renewal and termination options – Parent Company asa lesseeThe Parent Company determines the lease term as the non-cancellable term of the lease, togetherwith any periods covered by an option to extend the lease if it is reasonably certain to be exercised,or any periods covered by an option to terminate the lease, if it is reasonably certain not to beexercised.

- 29 -
*SGVFSM006234*
The Parent Company has several lease contracts that include extension and termination options.The Parent Company applies judgment in evaluating whether the provisions to renew or terminate thelease is enforceable. For leases where the Parent Company has the unilateral option to renew orterminate, it then applies judgment on whether it is reasonably certain or not to exercise the option.That is, it considers all relevant factors that create an economic incentive for it to exercise either therenewal or termination. After the commencement date, the Parent Company reassesses the leaseterm if there is a significant event or change in circumstances that is within its control and affects itsability to exercise or not to exercise the option to renew or to terminate (e.g., construction ofsignificant leasehold improvements or significant customisation to the leased asset).
Assessment on whether lease concessions granted constitute a lease modificationIn line with the rental relief framework implemented by the government to support businesses and thebroader economy due to the impact of COVID-19, the Parent Company waived its right to collect rentand other charges as part of various lease concessions it granted to lessees such as lease paymentholidays or lease payment reductions.
The Parent Company applies judgment when assessing whether the rent concessions granted isconsidered a lease modification under PFRS 16.
In making this judgment, the Parent Company determines whether the rent concessions granted haschanged the scope of the lease, or the consideration thereof, that was not part of the original termsand conditions of the lease. The Parent Company assessed that the lease concessions it granted tolessees do not qualify as lease modifications since the terms and conditions under the correspondinglease contracts have not been modified by the waiver and therefore, is not a lease modification underPFRS 16.
The rent concessions granted by the Parent Company for the year ended December 31, 2020amounted to P=89.5 million.
Judgements made in determining taxable profit (tax loss), tax bases, unused tax losses, unused taxcredits and tax rates applying paragraph 122 of PAS 1, Presentation of Financial StatementsUpon adoption of the Interpretation, the Parent Company has assessed whether it has any uncertaintax position. The Parent Company applies significant judgement in identifying uncertainties over itsincome tax treatments. The Parent Company determined, based on its assessment, in consultationwith its tax counsel, that it is probable that its uncertain income tax treatments (including those for thesubsidiaries) will be accepted by the taxation authorities. Accordingly, the interpretation did not havean impact on the parent company financial statements.
Management’s Use of EstimatesThe key assumptions concerning the future and other key sources of estimation uncertainty at thereporting date, that have a significant risk of causing a material adjustment to the carrying amounts ofassets and liabilities within the next financial year are discussed below.
Revenue recognition on real estate projectsThe Parent Company’s revenue recognition policy requires management to make use of estimatesand assumptions that may affect the reported amounts of revenues. The Parent Company’s revenuefrom real estate is recognized based on the percentage of completion and this is measured principallyon the basis of the estimated completion of a physical proportion of the contract work. Apart frominvolving significant estimates in determining the quanitity of imports such as materials, labor andequipment needed, the assessment process for the POC is complex and the estimated projectdevelopment costs requires technical determination by management’s specialists (project engineers).The Parent Company also includes land in calculation of POC since the Parent Company availed therelief granted by the SEC under Memorandum Circular Nos. 14-2018 as of 2018 for theimplementation issues of PFRS 15 affecting the real estate industry. See Note 19 for the relatedbalances.

- 30 -
*SGVFSM006234*
Following the pattern of real estate revenue recognition, the cost to obtain a contract (e.g.commission), is determined using the percentage of completion. In view of the continuing communityquarantines and restricted mobility, the progress of the Parent Company's performance obligation isadversely affected which resulted to lower percentage-of-completion in 2020.
Evaluation of net realizable value of real estate inventoriesThe Parent Company adjusts the cost of its real estate inventories to net realizable value based on itsassessment of the recoverability of the inventories. NRV for completed real estate inventories isassessed with reference to market conditions and prices existing at the reporting date and isdetermined by the Parent Company in the light of recent market transactions. NRV in respect of realestate inventories under construction is assessed with reference to market prices at the reportingdate for similar completed property, less estimated costs to complete construction and less estimatedcosts to sell. The amount and timing of recorded expenses for any period would differ if differentjudgments were made or different estimates were utilized. In line with the impact of COVID-19, theParent Company experienced limited selling activities that resulted to lower sales in 2020. Inevaluating NRV, recent market conditions and current market prices have been considered. SeeNote 7 for the related balances.
Share-based paymentsThe expected life of the options is based on the expected exercise behavior of the stock optionholders and is not necessarily indicative of the exercise patterns that may occur. The volatility isbased on the average historical price volatility which may be different from the expected volatility ofthe shares of stock of the Parent Company. See Note 25 for the related balances.
Estimating pension liabilities and other retirement benefitsThe determination of the Parent Company’s obligation and cost for pension and other retirementbenefits is dependent on selection of certain assumptions used by actuaries in calculating suchamounts. These include the determination of the discount rates, future salary increases, mortalityrates and future pension increases. Significant assumptions are disclosed in Note 23 and includeamong others, discount rate and salary increase rate.
In determining the appropriate discount rate, management considers the interest rates of governmentbonds that are denominated in the currency in which the benefits will be paid, with extrapolatedmaturities corresponding to the expected duration of the defined benefit obligation.
The mortality rate is based on publicly available mortality tables and is modified accordingly withestimates of mortality improvements. Future salary increases and pension increases are based onexpected future inflation rates.
While the Parent Company believes that the assumptions are reasonable and appropriate, significantdifferences in actual experience or significant changes in assumptions could materially affectretirement obligations. See Note 23 for the related balances.
Fair value of financial instrumentsWhen the fair values of financial assets and financial liabilities recorded and disclosed in the parentcompany statement of financial position cannot be derived from active markets, they are determinedusing internal valuation techniques and generally accepted market valuation models. The inputs tothese models are taken from observable markets where possible, but where this is not feasible,estimates are used in establishing fair values. These estimates may include considerations ofliquidity, volatility, and correlation. Certain financial assets and liabilities were initially recorded at theirfair values by using the discounted cash flow methodology. See Note 26 for the related balances.

- 31 -
*SGVFSM006234*
Provision for expected credit losses of trade receivablesThe Parent Company uses a provision matrix to calculate ECLs for trade receivables other thanresidential, commercial and office development receivables. The provision rates are based on dayspast due for groupings of various customer segments that have similar loss patterns.
The provision matrix is initially based on the Parent Company’s historical observed default rates. TheParent Company will calibrate the matrix to adjust the historical credit loss experience with forward-looking information such as inflation and GDP growth rates. At every reporting date, the historicalobserved default rates are updated and changes in the forward-looking estimates are analyzed.
The Parent Company uses vintage analysis approach to calculate ECLs for residential, commercialand office development receivables. The vintage analysis accounts for expected losses bycalculating the cumulative loss rates of a given loan pool. It derives the probability of default from thehistorical data of a homogenous portfolio that share the same origination period. The information onthe number of defaults during fixed time intervals of the accounts is utilized to create the PD model. Itallows the evaluation of the loan activity from its origination period until the end of the contract period.
The assessment of the correlation between historical observed default rates, forecast economicconditions (inflation and interert rates) and ECLs is a significant estimate. The amount of ECLs issensitive to changes in circumstances and of forecast economic conditions. The Parent Company’shistorical credit loss experience and forecast of economic conditions may also not be representativeof customer’s actual default in the future.
The Parent Company has considered the impact of COVID-19 pandemic and revised its assumptionsin determining the macroeconomic variables and loss rates in the computation of ECL. The changesin the gross carrying amount of receivables from sale of real estate during the year and impact ofCOVID-19 pandemic did not materially affect the allowance for ECLs.The information about the ECLs on the Parent Company’s trade receivables is disclosed inNotes 6 and 26.
Estimating the incremental borrowing rate for leasesThe Parent Company uses its incremental borrowing rate (IBR) to measure lease liabilities becausethe interest rate implicit in the lease is not readily determinable. The IBR is the rate of interest that theParent Company would have to pay to borrow over a similar term, and with a similar security, thefunds necessary to obtain an asset of a similar value to the right-of-use asset in a similar economicenvironment. The IBR therefore reflects what the Parent Company ‘would have to pay’, whichrequires estimation when no observable rates are available or when they need to be adjusted toreflect the terms and conditions of the lease. The Parent Company estimates the IBR usingobservable inputs (such as market interest rates) when available.
The Parent Company’s lease liabilities as of December 31, 2020 and 2019 amounted to ₱271.2million and P=285.4 million, respectively (see Note 29).
Finance lease commitments – Parent Company as lessorThe Parent Company has entered into a lease agreement on the parcel of land and buildingpertaining to MECC. The Parent Company has determined, based on evaluation of the terms andarrangement, particularly on the economic life, that the Parent Company has transferred substantiallyall the significant risks and rewards of ownership of this property to the lessee and accounts for theagreement as finance lease
Evaluation of impairment of nonfinancial assetsThe Parent Company assesses whether there are any indicators of impairment for all nonfinancialassets (i.e., investment in subsidiaries, associates and joint ventures, property and equipment,investment properties, right of use assets and other current assets) at each financial reporting date.These nonfinancial assets are tested for impairment when there are indicators that the carryingamounts may not be recoverable.

- 32 -
*SGVFSM006234*
An impairment loss is recognized whenever the carrying amount of an asset exceeds its recoverableamount. The recoverable amount of an asset is the higher of its fair value less cost to sell and valuein use. Recoverable amounts are estimated for individual assets or, if it is not possible, for the CGUto which the asset belongs, while value in use is the present value of estimated future cash flowsexpected to arise from the continuing use of an asset and from its disposal at the end of its useful life.
For investment in subsidiaries, associates and joint ventures, the Parent Company calculates theamount of impairment as the difference between the recoverable amount and the carrying value ofthe investee company and recognizes the difference in the parent company statement of income.
No impairment loss was recognized in 2020 and 2019.
4. Cash and Cash Equivalents
This account consists of:
2020 2019Cash on hand P=6,060,826 P=900,827Cash in banks 1,121,420,650 1,683,708,046Cash equivalents 1,515,286 162,060,824
P=1,128,996,762 P=1,846,669,697
Cash in banks earns interest at the respective bank deposit rates. Cash equivalents are short-term,highly liquid investments that are made for varying periods of up to three (3) months depending onthe immediate cash requirements of the Parent Company, and earn interest at the respective short-term investment rates.
The annual interest rates of the cash equivalents are as follows:
2020 2019Philippine Peso 0.1% to 3.3% 3.5% to 4.0%US Dollar − 3.0%
There is no restriction on the Parent Company’s cash and cash equivalents balances as ofDecember 31, 2020 and 2019.
5. Financial Assets at FVPL
This account consists of:
2020 2019Investment in Unit Investment Trust Funds (UITF) P=10,758,924 P=2,054,808Investment in Treasury Bills 135,309,607 −
P=146,068,531 P=2,054,808
The Parent Company has investments in the BPI Money Market Fund, BPI USD Short Term Fundand Chinabank Short Term Fund (the Fund). The Fund, which is structured as a money market UITF,aims to generate liquidity and stable income by investing in a diversified portfolio of primarily short-term fixed income instruments and with no minimum holding period requirement.
As of December 31, 2020, the Parent Company invested in the Fund with a fair value of P=3.4 millionfor BPI Money Market Fund, P=7.2 million for BPI USD Short Term Fund and P=0.2 million forChinabank Short Term Fund. The Fund’s Net Asset Value (NAV) was at P=61,961.9 million with

- 33 -
*SGVFSM006234*
duration of 255 days, P=41,101.9 million with duration of 307 days, and P=14,930.0 million with durationof 186 days, respectively.
As of December 31, 2019, the Parent Company invested in the Fund with a fair value of P=2.1 million.The Fund’s NAV was at P=23,980.6 million with duration of 131 days.
In 2020, the Group also invested in Treasury Bills which are short-term secure investments issued bythe Philippine government through the Bureau of Treasury (BTr) and these are held for trading.
The following table provides the fair value hierarchy of the Parent Company’s financial assets atFVPL which are measured at fair value as of December 31, 2020 and 2019:
2020
Date of Valuation
Fair value measurement using
Total
Quoted prices inactive markets
(Level 1)
Significantobservable
inputs(Level 2)
Significantunobservable
inputs(Level 3)
Investment in UITF December 31, 2020 P=10,758,924 P=− P=10,758,924 P=−Investment in Treasury Bills December 31, 2020 P=135,309,607 − 135,309,607 −
2019
Date of Valuation
Fair value measurement using
Total
Quoted prices inactive markets
(Level 1)
Significantobservable
inputs(Level 2)
Significantunobservable
inputs(Level 3)
Investment in UITF December 31, 2019 P=2,054,808 P=− P=2,054,808 P=−
The fair value of the investment in UITF is based on net asset values as of reporting dates.
The fair value of investment in treasury bills is based on BVAL reference rates on governmentsecurities. For the year ended December 31, 2020, the BVAL reference rates range from 1.002% to3.953%.
Reconciliation of fair value measurement of Investment in UITF is shown below:
2020 2019Balance at beginning of year P=2,054,808 P=1,969,029Additions 1,176,917,862 −Disposals (1,168,915,490) −Unrealized gains included under “Other income”
(see Note 20) 701,744 85,779Balance at end of year P=10,758,924 P=2,054,808
6. Accounts and Notes Receivable
Accounts and notes receivable account consists of:
2020 2019Trade Residential, commercial and office
development P=38,639,960,287 P=39,478,590,890 Corporate business 921,327,719 773,533,547 Shopping centers 811,036,125 489,161,708 Others 1,899,271,418 1,837,546,247
(Forward)

- 34 -
*SGVFSM006234*
2020 2019Receivable from related parties (Notes 22 and 29) P=59,661,105,816 P=55,068,731,831Advances to other companies 13,931,837,341 12,956,085,671Dividends receivable 1,347,983,753 1,819,517,787Receivable from employees 169,419,494 167,019,787Interest receivable (Note 22) 12,557,298 12,707,620
117,394,499,251 112,602,895,088Less allowance for impairment losses 413,044,967 214,018,088
116,981,454,284 112,388,877,000Less noncurrent portion 17,849,478,634 15,377,893,378
P=99,131,975,650 P=97,010,983,622
The classes of trade receivables of the Parent Company follow: Residential, commercial and office development - pertains to receivables from the sale of high-end
and upper middle-income residential lots and units, sale of commercial lots, sale of office units andleisure community developments.
Corporate business - pertain to lease receivables of office buildings. Shopping centers - pertain to lease receivables from retail spaces Others - pertain mainly to receivables from lease of land, facility management and other support
services.
Residential, commercial and office development receivables are collectible in monthly installmentsover a period of one (1) to ten (10) years. These are carried at amortized cost using the effectiveinterest rate method with annual interest rates ranging from 5.8% to 10.5%. Titles to real estateproperties are transferred to the buyers only once full payment has been made.
Corporate business receivables are collectible on a monthly or quarterly basis depending on theterms of the lease contracts.
Receivables from shopping centers, and rent receivables included under other trade receivables aredue within 30 days upon billing.
Receivables from facility management and other support services included under other tradereceivables are normally due within 30 to 90 days upon billing.Receivable from related parties, dividends receivable and interest receivable are due anddemandable.
Advances to other companies includes advances made to joint venture partners that have been madein consideration of project costs and purchases of land that are still subject to completion. Thedocumentation for these advances provides that these will be payable over a fixed term or ondemand in order to allow for repayment of the advances when closing does not occur or not settled.The advances are liquidated when proceeds from the sale of the related projects are applied.
Receivables from employees pertain to housing, car, salary and other loans granted to the ParentCompany’s employees which are collectible through salary deduction, are interest-bearing (6.0% perannum) and payable on various maturity dates.

- 35 -
*SGVFSM006234*
Receivables amounting to P=413.0 million and P=214.0 million as of December 31, 2020 and 2019,respectively, were impaired and fully provided with allowance. The movements in the allowance forECLs on receivables follow:
2020Trade
ShoppingCenters
CorporateBusiness
Advances toOther Companies Total
Balance at beginning of year P=41,565,700 P=114,287,589 P=58,164,799 P=214,018,088Provisions during the year (Note 20) 160,319,768 22,207,111 16,500,000 199,026,879Balance at end of year P=201,885,468 P=136,494,700 P=74,664,799 P=413,044,967
2019Trade
ShoppingCenters
CorporateBusiness
Advances toOther Companies Total
Balance at beginning of year P=41,565,700 P=70,934,072 P=58,164,799 P=170,664,571Provisions during the year (Note 20) − 43,353,517 − 43,353,517Balance at end of year P=41,565,700 P=114,287,589 P=58,164,799 P=214,018,088
On March 25, 2020, Republic Act No. 11469, otherwise known as the Bayanihan to Heal as One Act(“Bayanihan 1 Act”) was enacted. Bayanihan 1 Act provides that all covered institutions shallimplement a 30-day grace period for all loans with principal and/or interest and lease amortizationfalling due within the ECQ Period without incurring interest on interest, penalties, fees and othercharges. Subsequently, on September 11, 2020, Republic Act No. 11494, otherwise known as theBayanihan to Recover as One Act (“Bayanihan 2 Act”), was enacted. Under Bayanihan 2 Act, a one-time sixty (60)-day grace period is granted for the payment of all existing, current and outstandingloans falling due, or any part thereof, on or before December 31, 2020, without incurring interest oninterests, penalties, fees, or other charges and thereby extending the maturity of the said loans.Furthermore, a minimum 30-day grace period shall also be granted by covered institutions to allpayments due within the period of community quarantine on rent and utility-related expenditureswithout incurring penalties, interest and other charges.
In 2020, the Parent Company provided reliefs under Bayanihan 1 Act and Bayanihan 2 Act, whichoffered financial reliefs to its borrowers/counterparties as a response to the effect of the COVID-19pandemic. These relief measures included the restructuring of existing receivables includingextension of payment terms.
Based on the Parent Company’s assessment, the modifications in the contractual cash flows as aresult of the above reliefs are not substantial and therefore do not result in the derecognition of theaffected financial assets.
As of December 31, 2020 and 2019, nominal amount of trade receivables from residentialdevelopment amounting to P=44,188.1 million and P=47,168.3 million, respectively, were recordedinitially at fair value. The fair values of the receivables were obtained by discounting future cash flowsusing the applicable rates of similar types of instruments.
Movements in the unamortized discount of the Parent Company’s receivables as of December 31,2020 and 2019 follow:
2020 2019Balance at beginning of year P=7,689,704,311 P=6,197,764,825Additions during the year 1,559,492,490 4,905,120,824Accretion for the year (Note 19) (3,701,041,649) (3,413,181,338)Balance at end of year P=5,548,155,152 P=7,689,704,311

- 36 -
*SGVFSM006234*
The Parent Company entered into agreements with BPI Asset Management and Trust Corporation in2019 for the assignment of interest-bearing employee receivables amounting to P=108.9 million (nil in2020). The transactions were without recourse and did not result to any gain or loss.
The Parent Company sold receivables on a without recourse basis to partner mortgage banks, whichinclude BPI Family Savings Bank, a related party, amounting to P=11,533.5 million in 2020 andP=5,538.1 million in 2019. These were sold at discount with total proceeds of P=10,283.5 million andP=5,157.2 million, respectively. The Parent Company recognized loss on sale (under “Interestexpense and other financing charges”) amounting to P=1,270.6 million and P=422.5 million in 2020 and2019, respectively (see Note 20).
7. Inventories
This account consists of:
2020 2019
Real estate – at costResidential and commercial lots P=21,268,063,057 P=16,292,433,316
Residential and commercial units 11,339,830,372 12,957,829,891P=32,607,893,429 P=29,250,263,207
A summary of the movements in inventories is set out below:
2020
Residential andcommercial lots
Residentialand commercial
units TotalBalances at beginning of year P=16,292,433,316 P=12,957,829,891 P=29,250,263,207Construction/development costs
incurred/adjustments 3,302,764,617 991,696,495 4,294,461,112Disposals (recognized as cost of real
estate sales) (Note 20) (2,554,070,009) (4,545,740,018) (7,099,810,027)Transfers from investment property
(Note 11) 4,226,935,133 1,936,044,004 6,162,979,137Balances at end of year P=21,268,063,057 P=11,339,830,372 P=32,607,893,429
2019
Residential andcommercial lots
Residentialand commercial
units TotalBalances at beginning of year P=17,430,924,850 P=7,944,107,544 P=25,375,032,394Construction/development costs
incurred/adjustments 778,541,506 15,736,029,226 16,514,570,732Disposals (recognized as cost of real
estate sales) (Note 20) (4,293,590,495) (11,786,651,232) (16,080,241,727)Transfers from investment property
(Note 11) 2,376,557,455 1,064,344,353 3,440,901,808Balances at end of year P=16,292,433,316 P=12,957,829,891 P=29,250,263,207
The Parent Company has no purchase commitments pertaining to its inventories as ofDecember 31, 2020 and 2019.
There are no liens and encumbrances on the Parent Company’s real estate inventories.

- 37 -
*SGVFSM006234*
8. Other Current Assets
This account consists of:
2020 2019Prepaid taxes and licenses P=8,338,065,414 P=6,498,340,008Advances to contractors and suppliers 4,633,555,230 3,821,719,059Prepaid expenses 2,403,989,283 2,328,056,090Value-added input tax – net 732,229,340 317,197,394
P=16,107,839,267 P=12,965,312,551
Prepaid taxes and licenses pertains to the excess of payments made against current income tax duewhich can be claimed against income tax for future periods, and prepayments on other taxes andlicenses.
Advances to contractors and suppliers represents prepayments for the construction of inventories.
Prepaid expenses mainly include prepayments for commissions, marketing and management fees,and rentals and insurance. The cost to obtain contracts which includes prepaid commissions,amounted to P=593.2 million and P=282.95 million in 2020 and 2019, respectively. In line with theParent Company's accounting policy, as set out in Note 2, if a contract or specific performanceobligation exhibited marginal profitability or other indicators of impairment, judgement was applied toascertain whether or not the future economic benefits from these contracts were sufficient to recoverthese assets. In performing this impairment assessment, management is required to make anassessment of the costs to complete the contract. The ability to accurately forecast such costsinvolves estimates around cost savings to be achieved over time, anticipated profitability of thecontract, as well as future performance against any contract-specific key performance indicators thatcould trigger variable consideration, or service credits (see Note 13).
Value-added input tax is applied against value-added output tax. The remaining balance isrecoverable in future periods
9. Financial Assets at Fair Value through OCI
As of December 31, 2020 and 2019, financial assets at FVOCI consists of investments in:
2020 2019Shares of stock: Unquoted P=152,621,007 P=157,041,007 Quoted 87,197,205 87,046,562
239,818,212 244,087,569Net unrealized gain 53,039,285 13,789,928
P=292,857,497 P=257,877,497
Investments in quoted shares of stock include shares held for clubs wherein the Parent Companydoes not exercise control or demonstrate significant influence.
Investments in unquoted shares of stock include unlisted shares of public utility companies which theParent Company will continue to carry as part of the infrastructure that it provides to its real estateprojects.
Brightnote Assets Corporation redeemed shares at par value amounting to P=4.4 million in 2020. Nogain or loss was recognized from the redemption. The redemption pertains to the investment of theParent Company with Brightnote Assets Corporation formerly known as Batangas AssetsCorporation.

- 38 -
*SGVFSM006234*
Movements in the reserves for financial assets at FVOCI as of December 31, 2020 and 2019 are asfollows:
2020 2019Balance at beginning of year P=13,789,928 P=69,173,878Fair value changes during the year 39,249,357 (55,383,950)Balance at end of year P=53,039,285 P=13,789,928
The following tables provide the fair value hierarchy of the Parent Company’s financial assets atFVOCI which are measured at fair value as of December 31, 2020 and 2019:
2020Fair value measurement using
Date of Valuation Total
Quoted pricesin activemarkets(Level 1)
Significantobservable
inputs(Level 2)
Significantunobservable
inputs(Level 3)
Shares of stock: Quoted Tourism and leisure December 31, 2020 P=133,300,000 P=133,300,000 P=– P=– Unquoted Tourism and leisure Various 143,500,000 – – 143,500,000 Utilities and energy Various 8,589,590 – – 8,589,590 Real estate Various 7,467,907 – – 7,467,907
P=292,857,497 P=133,300,000 P=– P=159,557,497
2019Fair value measurement using
Date of Valuation Total
Quoted pricesin activemarkets(Level 1)
Significantobservable
inputs(Level 2)
Significantunobservable
inputs(Level 3)
Shares of stock: Quoted Tourism and leisure December 31, 2019 P=151,300,000 P=151,300,000 P=– P=– Unquoted Tourism and leisure Various 86,100,000 – – 86,100,000 Utilities and energy Various 8,589,590 – – 8,589,590 Real estate Various 11,887,907 – – 11,887,907
P=257,877,497 P=151,300,000 – P=106,577,497
10. Investments in Subsidiaries, Associates and Joint Ventures
This account consists of:
Percentagesof Direct
Ownership Carrying Amounts2020 2019 2020 2019
Subsidiaries:Regent Wise Investment Ltd. and Subsidiary
(Regent Wise) 100% 100% P=16,654,593,351 P=16,654,593,351AyalaLand Hotels and Resorts Corporation and
Subsidiaries (AHRC) 100 100 16,760,432,000 15,370,432,000AyalaLand Logistics Holdings Corp. and Subsidiaries
(ALLHC) (formerly Prime Orion Philippines, Inc.) 71 71 10,582,725,757 10,582,725,757AREIT, Inc. (AREIT) (formerly One Dela Rosa Property
Development, Inc.(ODR)) (Note 20) 45 90 5,184,901,980 8,815,000,000Amaia Land Corporation and Subsidiary (Amaia) 100 100 7,006,931,640 7,006,931,640Avida Land Corporation and Subsidiaries (Avida) 100 100 6,689,977,831 6,689,977,831AyalaLand Offices, Inc. and Subsidiaries (ALO) 100 100 6,522,386,376 6,646,036,376Summerhill E-Office Corporation (Summerhill) 100 100 6,579,990,035 6,579,990,035Bay City Commercial Ventures Corp. (BCCVC) 100 100 4,929,421,699 4,929,421,699Cebu Holdings, Inc. and Subsidiaries (CHI) 71 71 4,480,905,171 4,480,905,171AyalaLand Estates, Inc. (formerly Southgateway
Development Corp. (SDC)) 100 100 4,005,642,479 4,005,642,479
(Forward)

- 39 -
*SGVFSM006234*
Percentagesof Direct
Ownership Carrying Amounts2020 2019 2020 2019
AyalaLand MetroNorth, Inc. (AMNI) 100 100 P=3,895,726,210 P=3,895,726,210North Ventures Commercial Corp. (NVCC) 100 100 3,784,145,284 3,784,145,284Alveo Land Corporation and Subsidiaries (Alveo) 100 100 2,677,613,403 2,677,613,403North Triangle Depot Commercial Corporation
(NTDCC) 73 73 2,640,805,402 2,640,805,402ALI Capital Corp. (ALICap) (formerly Varejo Corp.) 100 100 2,625,000,000 2,625,000,000Capitol Central Commercial Ventures Corp. (CCCVC) 100 100 2,517,000,000 2,517,000,000Arca South Commercial Ventures Corp. (ASCVC) 100 100 2,310,500,000 2,310,500,000BellaVita Land Corporation (BellaVita) 100 100 2,300,000,000 2,300,000,000Amorsedia Development Corporation and Subsidiaries
(ADC) 100 100 2,274,943,627 2,274,943,627Makati Cornerstone Leasing Corp.(MCLC) 100 100 2,213,961,000 2,213,961,000Central Block Developers, Inc. (CBDI) 45 45 2,209,190,000 2,209,190,000Arvo Commercial Corporation (Arvo) 100 100 1,800,000,000 1,800,000,000ALI Commercial Center, Inc. and Subsidiary (ACCI) 100 100 1,692,680,000 1,692,680,000Vesta Property Holdings, Inc. (VPHI) 78 78 1,402,620,632 1,338,608,230North Eastern Commercial Corp. (NECC) 100 100 1,300,100,000 1,300,100,000Northbeacon Commercial Corporation (NBCC) 100 100 1,288,100,000 1,288,100,000Aurora Properties Incorporated 81 81 1,199,997,664 1,199,997,664Cavite Commercial Town Center, Inc. (CCTCI) 100 100 1,515,390,793 1,124,160,793Aviana Development Corporation 50 50 966,000,000 966,000,000Accendo Commercial Corp. (Accendo) 67 67 874,697,062 874,697,062Cagayan de Oro Gateway Corp. (CDOGC) 70 70 867,680,000 867,680,000Philippine Integrated Energy Solutions, Inc.
(PhilEnergy) 100 100 854,500,000 854,500,000Nuevo Centro, Inc. (Nuevo Centro) 54 54 819,223,620 819,223,620Soltea Commercial Corp. (Soltea) 60 60 796,416,740 796,416,740Makati Development Corporation and Subsidiaries
(MDC) 100 100 750,958,813 750,958,813ALO Prime Realty Corporation 100 100 733,676,554 733,676,554Westview Commercial Ventures Corp. (Westview) 100 100 731,075,299 731,075,299Ecoholdings Company, Inc. (ECI) 100 100 718,368,400 718,368,400Ceci Realty, Inc. (Ceci) 60 60 699,785,665 699,785,665Whiteknight Holdings, Inc. (WHI) 100 100 693,925,952 693,925,952Prow Holdings, Inc. (Prow) 55 55 670,273,870 670,273,870Anvaya Cove Golf & Sports Club, Inc. (Anvaya Cove
Golf) 76 76 611,729,252 616,436,215Adauge Commercial Corporation (Adauge) 60 60 600,000,000 600,000,000ALI Makati Hotel Property, Inc. 20 20 584,702,865 584,702,865Ayala Hotels, Inc. (AHI) 50 50 564,772,538 564,772,538Anvaya Cove Beach & Nature Club Inc. (Anvaya Cove
Beach) 73 73 519,779,650 524,578,401Crans Montana Holdings, Inc. 100 100 505,329,030 505,329,030Ten Knots Development, Corporation and Subsidiaries
(TKDC) 60 60 495,000,000 495,000,000Integrated Eco-resort, Inc. (IERI) 100 100 492,922,224 492,922,224Subic Bay Town Centre, Inc. (SBTCI) 100 100 478,500,000 478,500,000Station Square East Commercial Corporation (SSECC) 69 69 461,825,050 461,825,050Red Creek Properties, Inc. (RCPI) 100 100 431,511,128 431,511,128Roxas Land Corp (RLC) 50 50 327,022,960 327,022,960AyalaLand Commercial REIT, Inc. (ALCRI) 100 100 300,000,000 300,000,000Serendra, Inc. 28 28 266,027,100 266,027,100Alabang Commercial Corporation (ACC) 50 50 258,431,769 258,431,769Ayalaland Medical Facilities Leasing, Inc. (AMFLI) 100 100 255,000,000 255,000,000BGWest Properties (BGW) 50 50 250,000,000 250,000,000AMSI, Inc. (formerly Ayalaland Malls
Synergies, Inc.) (AMSI) 100 100 235,000,000 235,000,000Crimson Field Enterprises, Inc. 100 100 219,714,272 219,714,272Southportal Properties, Inc. (Southportal) 65 65 188,500,000 188,500,000Primavera Towncentre, Inc. (PTI) 100 100 248,420,000 181,000,000Sunnyfield E-Office Corporation (Sunnyfield) 100 100 173,000,000 173,000,000First Longfield Investments Limited (First Longfield)
(Hongkong Company) 100 100 167,923,610 167,923,610Arca South Integrated Terminal, Inc. 100 100 151,000,000 151,000,000Hillsford Property Corporation (Hillsford) 100 100 150,000,000 150,000,000
(Forward)

- 40 -
*SGVFSM006234*
Percentagesof Direct
Ownership Carrying Amounts2020 2019 2020 2019
Ayala Land International Sales, Inc. (ALISI) 100 100 P=138,700,000 P=138,700,000ALInet.com, Inc. (ALInet) 100 100 130,482,764 130,482,764Leisure and Allied Industries Philippines, Inc. (LAIP) 50 50 106,300,000 106,300,000ALI-CII Development Corporation (ALI-CII) 50 50 102,765,300 102,765,300Lagdigan Land Corp. (Lagdigan) 60 60 99,000,000 99,000,000Ten Knots Phils., Inc.(TKPI) 60 60 93,131,600 93,131,600Aprisa Business Process Solutions (Aprisa) 100 100 40,000,000 40,000,000DirectPower Services, Inc. (DirectPower) 100 100 40,000,000 40,000,000CMPI Holdings, Inc. (CMPI) 60 60 28,800,000 28,800,000ALI Makati Hotel & Residences, Inc. (AMHRI) 20 20 22,097,135 22,097,135Altaraza Development Corporation 51 - 13,515,000 -Ayala Land Sales, Inc. (ALSI) 100 100 10,000,000 10,000,000AyalaLand Malls, Inc. (ALMI) (formerly
Solerte, Inc.) 100 100 5,000,000 5,000,000Ayala Land Premier, Inc. (ALPI) 100 100 5,000,000 5,000,000Altaraza Prime Realty Corporation (Altaraza) 100 100 4,000,000 4,000,000Verde Golf Development Corp (Verde Golf) 100 100 3,125,000 3,125,000Buendia Landholdings, Inc. (BLI) 100 100 2,833,562 2,833,562Ayala Land Club Management, Inc. 100 100 2,500,000 2,500,000Ayala Property Management Corporation (APMC) 100 100 1,912,026 1,912,026Ayala Theatres Management, Inc. (ATMI) 100 100 864,559 864,559Next Urban Alliance Development Corp. 100 100 365,500 365,500Five Star Cinema, Inc. (FSCI) 100 100 250,000 250,000Regent Time International, Limited (Regent Time)
(British Virgin Islands) 100 100 52 52
Joint Ventures:ALI-ETON Property Development Corporation 50 50 4,454,500,000 3,371,000,000AKL Properties, Inc. (AKL) 50 50 3,048,775,370 2,294,374,575Emerging City Holdings, Inc. (ECHI) 50 50 1,555,004,550 1,555,004,550Cebu District Property Enterprise, Inc. (CDPEI) 35 35 1,050,000,000 1,050,000,000Berkshires Holdings, Inc. (BHI) 50 50 666,430,521 666,430,521
Associates:OCLP Holdings, Inc. (OHI) 21 21 7,190,241,828 7,190,241,828Bonifacio Land Corp. (BLC) 10 10 346,881,162 346,881,162Lagoon Development Corporation (LDC) 30 30 37,050,000 37,050,000
167,357,901,686 167,357,077,223Less allowance for probable losses 319,959,706 319,959,706
P=167,037,941,980 P=167,037,117,517
The above companies are domestic except for Regent Time which is domiciled and incorporated inBritish Virgin Islands and First Longfield and Regent Wise which are domiciled and incorporated inHong Kong.
As of December 31, 2020and 2019, the Parent Company had no commitments to its interests in jointventures.
Investment in Regent WiseRegent Wise is is a limited liability company incorporated in Hong Kong. It is a wholly – ownedsubsidiary of the Parent Company. It’s registered office is located at Level 54, Hopewell Centre 183Queen’s Road East, Hong Kong. It’s principal activity is investment holding.
In 2019, the Parent Company made additional cash infusions to Regent Wise amounting toP=2,319.5 million.
As of December 31, 2020 and 2019, the investment of the Parent Company in Regent Wise bothamounted to P=16,654.6 million.

- 41 -
*SGVFSM006234*
Investment in AHRCIn 2010, the Parent Company established AHRC to support the Parent Company’s hotel and resortbusiness. The Parent Company subscribed to all common and preferred shares issued at a total ofP=1.2 billion.
In 2020 and 2019, the Parent Company made additional infusions amounting to P=1,390.0 million andP=2,690.0 million, respectively. As of December 31, 2020 and 2019, the Parent Company’sinvestment amounted to P=16,760.4 million and P=15,370.4 million, respectively.
Investment in ALLHCALLHC was incorporated and registered May 19, 1989. It is a subsidiary of the Parent Company. It islisted in the Philippine Stock Exchange (PSE). It is engaged in real estate and property development,manufacturing and retailing/distribution, non-life insurance and other allied services, organized undera number of intermediate holding companies.
On February 4, 2019, The Executive Committee of ALI approved the purchase of a 20% equityinterest owned by Mitsubishi Corporation in LTI, equivalent to 8,051 common shares, with a totalvalue of P=800.0 million. Subsequently on June 10, 2019, ALI exchanged the 20% equity interest inLTI for additional shares of stock in ALLHC, equivalent to 323,886,640 common shares for aconsideration of P=800.0 million, subject to conditions to be fulfilled by ALLHC. This resulted to anincrease in ALI’s ownership from 67% to 70%.
On May 10, 2019, Prime Orion Philippines, Inc. changed its corporate name to Ayalaland LogisticsHoldings Corp. (ALLHC).
On September 9, 2019, Orion Land, Inc. sold through a special block sale, 215,090,031 commonshares of ALLHC to Avida Land Corporation, a wholly-owned subsidiary of ALI, for a totalconsideration of P=628.1 million. Subsequently, these shares were acquired by ALI through a specialblock sale for a total consideration of P=628.1 million. This increased ALI’s ownership in ALLHC from70% to 71%.
As of December 31, 2020 and 2019, the Parent Company’s investment in ALLHC both amounted toP=10,582.7 million.
Investment in AREIT
AREIT is a wholly-owned subsidiary of ALO, which is involved in leasing office and commercialspaces. In October 2018, AREIT increased its authorized capital stock by 881,500,000 shares whichwere subsequently acquired by ALI for P=8,815.0 million, resulting to a 90% ownership in AREIT.
On August 2020, AREIT, Inc. sold its 454.7 million shares with a cost of P=4,547.1 million through aninitial public offering (IPO). Subsequently, during a one-month stabilization process, BPI CapitalCorporation acquired 35.18 million shares at an average price of P=26.0/share and redelivered this toALI. Gain on sale arising from AREIT’s IPO amounting to P=7,730.0 million was recognized(see Note 20).
As of December 31, 2020, AREIT is 45.04% owned by ALI, 9.39% owned by ALO and 45.57% publicafter the company was listed in the Philippine Stock Exchange on August 13, 2020. Effectively, ALI’seffective ownership was reduced from 100.00% to 54.43% as a result of public offering. Thecompany was organized primarily as a real estate investment trust, as provided under Republic ActNo. 9856 (the Real Estate Investment Trust Act of 2009), including its implementing rules andregulations and other applicable laws. The control of the Parent Company over AREIT, Inc. remainsas of December 31, 2020.
As of December 31, 2020 and 2019, the investment in AREIT amounted to P=5,184.9 million andP=8,815.0 million, respectively.

- 42 -
*SGVFSM006234*
Investment in ALOOn July 18, 2014, the Board of Directors (BOD) and the stockholders of APPCo approved the changeof its corporate name to AyalaLand Offices, Inc (ALO). On October 17, 2014, the amended Articles ofIncorporation was executed and subsequently approved by SEC on November 18, 2014. In 2015,the Parent Company made additional infusions amounting to P=3,270.5 million increasing itsinvestment cost to P=7,200.6 million as of December 31, 2015.
In 2020 and 2019, the Parent Company redeemed preferred shares both amounting toP=123.7 million. No gain or loss was recognized at redemption. The Parent Company investmentamounted to P=6,522.4 million and P=6,646.0 million as of December 31, 2020 and 2019, respectively.
Investment in SummerhillSummerhill was incorporated and registered on July 7, 2008, primarily organized to purchase,subscribe for or otherwise acquire and own, hold, use, sell, assign, transfer, mortgage, pledge,exchange or otherwise dispose of real and personal property, including shares of stock, bonds,debentures, notes, any evidence of indebtedness and other securities, contracts or obligations of anycorporation or association. It is a wholly-owned subsidiary of the Parent Company.
In 2019, the Parent Company made additional capital infusions for a total cost of P=3,601.3 million.
As of December 31, 2020 and 2019, the investment in Summerhill both amounted to P=6,580.0 million
Investment in CHIIn 2018, ALI acquired additional 59,631,200 common shares of CHI totaling to P=352.8 million.Further, an additional 77,742,516 shares was acquired as a result of swap of CPVDC shares for atotal consideration of P=229.3 million which brings Parent Company’s ownership to 70.4%.
On April 17, 2019, ALI acquired additional 14,913,200 common shares of CHI through open marketpurchases using the trading facilities of the Philippine Stock Exchange totaling P=88.7 million resultingin ALI’s increase in ownership from 70.4% to 71.1%.
As of December 31, 2020 and 2019, the investment in CHI both amounted to P=4,480.9 million.
Investment in AMNIAMNI was incorporated in November 29, 2012 and is a wholly owned subsidiary of the ParentCompany. It is established primarily to develop and operate shopping malls and offices.
In 2019, the Parent Company made additional infusion amounting to P=2,019.7 million and redeemedP=130.0 million of its preference shares. The Parent Company’s investment amounted both toP=3,895.7 million as of December 31, 2020 and 2019.
Investment in NVCCOn July 31, 2014, the Board of Directors and stockholders of Fairview Prime Commercial Corp.approved the amendment of Fairview Prime’s Articles of Incorporation to change its name to NorthVentures Commercial Corp. The Amendment was subsequently approved by the SEC onDecember 3, 2014.
In 2019, the Parent Company’s investment in preferred shares of NVCC amounting to P=120.0 millionwas redeemed. The Parent Company’s total investment in NVCC both amounted to P=3,784.1 millionas of December 31, 2020 and 2019.
Investment in CCCVCCapitol Central Commercial Ventures Corp., a wholly-owned subsidiary was incorporated onDecember 4, 2017 for the development of Ayala Malls Capitol Central. In 2019 , the Parent Companymade additional investments amounting to P=360.4 million. As of December 31, 2020 and 2019, theinvestment in CVCC both amounted to P=2,517.0 million

- 43 -
*SGVFSM006234*
Investment in CBDICBDI is a subsidiary of the Parent Company with pro-rata ownership of the ALI Parent Company’sCebu Companies, CPVDC and CHI. The project of CBDI is called Central Bloc and is located at thecore of Cebu IT Park. The development includes two BPO towers, an Ayala branded hotel, and a 5-storey mall. On July 28, 2015, CBDI was registered in SEC. CBDI was organized to develop, sell,invest, own, acquire, lease, hold, mortgage, administer, or otherwise deal with commercial,residential, industrial, or agricultural lands, buildings, structures or apertures, or in any other profitablebusiness enterprise, venture or establishment, including to own, hold in ownership, manage deal andengage in the general business of a hotel, apartment hotel, inn, resort, restaurant, café, bar,entertainment and other allied businesses and to the limit and extent permitted by law, alone or jointlywith other persons, natural or artificial.
CBDI is directly owned by the Parent Company by 45.0% and 55.0% owned by CHI (71% ownedsubsidiary of ALI).
In 2019, the Parent Company made additional infusion amounting to P=714.2 million. The investmentof the Parent Company in CBDI both amounted to P=2,209.2 million as of December 31, 2020 and2019.
Investment in ACCIACCI was organized and registered on October 13, 2014 and has started its leasing operations onJanuary 1, 2015. It is a wholly-owned subsidiary of the Parent Company.
In 2019, the Parent Company made additional infusion amounting to P=1,567.7 million.The ParentCompany’s total investment amounted to P=1,692.7 million for both December 31, 2020 and 2019.
Investment in VPHIIn September 2019, The Parent Company purchased additional 648,177 shares of VPHI forP=799.4 million increasing the Parent Company’s ownership to 78.41%. Also during 2019, the ParentCompany redeemed preferred shares amounting to P=35.0 million. As of December 31, 2020 and2019, the Parent Company’s investment in VPHI amounted to P=1,402.6 million and P=1,338.6 million,respectively.
During 2020, the Parent Company and various stockholders made additional equity infusions to VPHIamounting to P=64.0 million. Investment of the Parent Company in VPHI amounted to P=1,402.6 millionand P=1,338.6 million as of December 31, 2020 and 2019, respectively.
Investment in NBCCIn 2008, the Parent Company, through NBCC and as part of its ongoing development in North Luzon,started to develop a 70,000 square meter retail center dubbed as “The MarQuee” mall located inAngeles City, Pampanga.
In 2015, the Parent Company made additional infusion amounting to P=910.0 million and redeemedP=21.0 million of its preferred shares. The carrying amount of the Parent Company’s investmentamounted to P=1,580.0 million as of December 31, 2015.
In 2017 and 2016, the Parent Company redeemed P=131.0 million and P=45.5 million of its preferredshares which decreased the total cost of its investment to P=1,403.5 million and P=1.534.5 million as ofDecember 31, 2017 and 2016.
In 2019, the Parent Company redeemed P=100.0 million of its preferred shares which decreased thetotal cost of its investment to P=1,288.1 million as of December 31, 2020 and 2019.
As of December 31, 2020 and 2019, the Parent Company’s investment in NBCC both amounted toP=1,288.1 million.

- 44 -
*SGVFSM006234*
Investment in CCTCIIn 2015, the Parent Company made additional infusions amounting to P=682.7 million. The ParentCompany’s investment amount is P=1,086.1 million as of December 31, 2015.
In 2018 and 2017, the Parent Company redeemed P=30.0 million and P=31.0 million of its preferenceshares, respectively. Also, in 2018, the Parent Company made an additional infusion of P=184.7million thus increasing its investment to P= 1,154.2 million and P=999.5 million as ofDecember 31, 2018 and 2017, respectively.
In 2019, the Parent Company redeemed P=30.0 million of its preference shares which decreased theParent Company’s investment amount to P=1,124.2 million as of December 31, 2019.
In 2020, The Parent Company infused additional amounting to 391.2 million shares which increasedthe Parent Company’s investment to P=1,515.4 million as of December 31, 2020.
Investment in Aviana Development CorporationAviana Development Corp. (the Company) is domiciled in the Philippines and was registered onSeptember 17, 2013. Its primary purpose is to develop, sell, invest, own, acquire, lease, hold,mortgage, administer or otherwise deal with commercial, residential, industrial or agricultural lands,buildings, structures or apertures, or in any other profitable business enterprise, venture orestablishment, alone or jointly with other persons, natural or artificial.
Aviana Development Corporation is directly owned by the Parent Company by 50.0% and 10.0%owned by Accendo (67% owned subsidiary of ALI).
As of December 31, 2020 and 2019, the Parent Company’s investment both amounted toP=966.0 million.
Investment in WestviewIn 2018, the Parent Company made additional infusion amounting to P=152.7 million increasing itsinvestment which amounted to P=745.4 million.
In 2019, the Parent Company redeemed P=14.3 million of its investment in preferred shares inWestview, which decreased the Parent Company’s total investment to P=731.1 million as ofDecember 31, 2019. As of December 31, 2020 and 2019, the Parent Company’s investment bothamounted to P=731.1 million.
Investment in Anvaya Cove GolfIn 2020, the Parent Company sold its investment in Anvaya Cove Golf amounting to P=4.7 million.Gain on sale of the shares was recognized amounting to P=14.2 million (see Note 20). The ParentCompany’s investment in Anvaya Cove Golf amounted to P=611.7 million and P=616.4 million as ofDecember 31, 2020 and 2019, respectively.
Investment in ALI Makati Hotel Property, Inc.ALI Makati Hotel Property, Inc. doing business under the name and style of Fairmont Raffles HotelMakati was organized and registered on August 13, 2007 primarily to acquire by purchase, developand lease or acquire hotels and other buildings and improvement. It als manages hotels and otheraccomodations and facilities belonging to a general hostelry business.
It is directly owned by the Parent Company by 20.0% and 80.0% owned by AHRC (wholly-ownedsubsidiary of ALI).
As of December 31, 2020 amd 2019, the investment in ALI Makati Hotel Property, Inc both amountedto P=584.7 million.
- 45 -
*SGVFSM006234*
Investment in Anvaya Cove BeachIn 2020, the Parent Company sold its investment in Anvaya Cove Beach amounting to P=4.8 million.Gain on sale of the shares was recognized amounting to P=16.5 million (see Note 20). The ParentCompany’s investment in Anvaya Cove Beach amounted to P=519.8 million and P=524.6 million as ofDecember 31, 2020 and 2019, respectively.
Investment in IERIOn May 6, 2019, the Parent Company and ALICap executed a Deed of Assignment wherein, ALICapassigned 100% of the total issued and outstanding shares in the capital stock of Integrated Eco-Resort, Inc, a corporation duly organized and existing under the laws of the Philippines to the ParentCompany amounting to P=492.9 million.
Investment in SBTCIIn 2019, the Parent Company redeemed P=30.0 million of its investment in preferred shares inSBTCI, which decreased the Parent Company’s total investment from P=508.5 million in 2018 toP=478.5 million as of December 31, 2019 and 2020.
Investment in RLCIn 2019, the Parent Company’s investment in preferred shares of RLC amounting to P=790.0 millionwas redeemed, which decreased the Parent Company’s total investment in RLC to P=327.0 million asof December 31, 2020 and 2019.
Investment in Serendra, Inc.Serendra, Inc. was incorporated on June 6, 1994 and is domiciled in the Republic of the Philippines. Itwas organized and registered with the Philippine Securities and Exchange Commission primarily toacquire by purchase, lease, donation or otherwise, and to own, use, improve, develop, subdivide, sell,mortgage, exchange, lease, develop and hold for investment or otherwise, real estate of all kinds,whether to improve, manage or otherwise dispose of buildings, houses, apartments, and otherstructures of whatever kind, together with their appurtenances. Its administrative functions andactivities in connection with its business operations are carried out by Alveo.
It is directly owned by the Parent Company by 28.0% and 39.0% owned by Alveo (wholly-ownedsubsidiary of ALI).
As of December 31, 2020 and 2019, the investment in Serendra, Inc. both amounted toP=266.0 million
Investment in PTIIn 2020 and 2019, the Parent Company made additional infusion amounting to P=67.4 million andP=90.0 million, respectively, which increased the Parent Company’s total investment to P=181.0 millionas of December 31, 2019 and P=248.4 million as of December 31, 2020.
Investment in LagdiganLagdigan Land Corp. (Lagdigan) was incorporated on March 17, 2014 and is 60% owned by theParent Company and 40% owned by AC. Its main purpose is to develop Laguindingan’s500-hectare property owned by AC. The vision is to develop it as a mixed-use area that will be theprimary growth area in Misamis Oriental. As of December 31, 2015 and 2014, investment inLagdigan amounted to P=12.0 million.
In 2017, the Parent Company made additional infusion amounting to P=36.0 million, equivalent to1,800,000 common shares and 16,200,000 preferred shares, increasing its investment toP=48.0 million as of December 31, 2017.
In 2019, the Parent Company made additional infusion amounting to P=36.0 million. As ofDecember 31, 2020 and 2019, the investment in Lagdigan both amounted to P=99.0 million.

- 46 -
*SGVFSM006234*
Investment AMHRIAMHRI was organized and registered on January 30, 2007 primarily to acquire, purchase, lease,develop and sell real estate of all kinds. It can also hold investment in real estate properties of anykind and, operate and manage hotels and all other accommodations appurtenant to a generalhostelry business.
It is directly owned by the Parent Company by 20.0% and 80.0% owned by AHRC (wholly-ownedsubsidiary of ALI).
As of December 31, 2020 amd 2019, the investment in ALI Makati Hotel Property, Inc both amountedto P=22.1 million.
Investment in Altaraza Development CorporationAltaraza Development Corporation was incorporated on May 27, 2020 and is 51% owned by ALI and49% owned by Gregorio Araneta, Inc. and Araza Resources, Inc. (“Araneta Group”). The companywas organized primarily to acquire and develop or hold land for investments in Altaraza Estate inBulacan.
The Parent Company paid an amount of P=13.5 million in relation to 382,496 subscribed commonshares and 3.4 million subscribed preferred shares.
Investment in ALI-ETON Property Development CorporationALI-ETON Property Development Corporation (ALI-ETON) was incorporated on March 13, 2016.ALI-ETON is a joint venture between Ayala Land, Inc. and LT Parent Company, Inc. The ALI and LTParent Company, Inc. entered into an agreement on January 21, 2016 to jointly develop a projectalong the C5 corridor. The project is envisioned to be a township development that spans portions ofPasig City and Quezon City.
In 2020 and 2019, the Parent Company and LT Group, Inc. made additional equity infusions to fundthe development requirements of Parklinks amounting to P=1,083.5 million and P=1,195.0 million,respectively.
As of December 31, 2020 and 2019, the investment in ALI – ETON Property DevelopmentCorporation amounted to P=4,454.5 million and P=3,371.0 million, respectively.
Investment in AKLIn 2018, the Parent Company invested P=1,959.7 million in AKL, which is a 50:50 joint venturebetween Ayala Land, Inc. and Royal Asia Land, Inc. (RALI), and is organized primarily for futuremixed-use development in South Luzon area.
On July 13, 2020, the Parent Company paid the equity call for the existing subscription and for theadditional subscription to AKL for a total of P=508.4 million. The additional subscription will cover thescheduled infusion of the parcels for the first phase of Project Newton Residential as per joint ventureagreement (JVA). RALI also entered with the same subscription agreement with AKL.
On December 7, 2020, the Parent Company entered into another subscription agreement with AKLamounting to P=246.0 million which will cover the amount due for the DOAS of Dolfo and Ledescoparcels of land for the first phase of Project Newton Residential. RALI also entered with the samesubscription agreement with AKL.
In 2020 and 2019, the Parent Company’s investment in AKL amounted to P=3,048,8 million andP=2,294.4 million, respectively.
Investment in ECHI, BHI and BLCThe Parent Company’s 5.3% direct investment in BLC and 4.8% through Regent Time are accountedfor using the equity method because the Parent Company has significant influence over BLC.

- 47 -
*SGVFSM006234*
The Parent Company and Evergreen Holdings, Inc (EHI) jointly hold the 50.4% equity interest in BLCthrough ECHI and BHI. The Parent Company and EHI assigned the notes receivable from MPC toECHI and BHI, which acquired the shares of stock of Columbus. Columbus directly owns the 50.4%interest in BLC. BLC owns 55.0% interest in FBDC, the primary developer of certain areas in FortBonifacio Global City for residential, commercial and business development. Columbus accountedfor the acquisition of the 50.4% interest in BLC using the purchase method.
Subsequent to this, the Parent Company and EHI acquired additional shares of BLC through acombination of direct acquisition and through its associates at varying dates:
On July 31, 2008, the Group acquired, through the Parent Company, Regent Time and Columbus,additional 4,360,178 shares of BLC from FBDC amounting to P=689.0 million, equivalent to 7.7%ownership in BLC. In January and October 2009, a total of 2,295,207 BLC shares were acquiredfrom Development Bank of the Philippines and Metro Pacific Corporation (MPC), pertaining to thepledged shares, through Columbus amounting to P=362.6 million.
As of Dember 31, 2020 and 2019, investments in ECHI, BHI and BLC both amounted toP=1,555.0 million, P=666.4 million and P=346.9 million, respectively.
11. Investment Properties
The rollforward analysis of this account follows:
2020Land Buildings
Constructionin Progress Total
CostBalance at beginning of year P=49,311,953,118 P=32,695,656,737 P=14,904,315,507 P=96,911,925,362Additions 961,079,134 522,204,142 10,340,511,154 11,823,794,430Transfers (Note 7) (6,162,979,137) – – (6,162,979,137)Disposals (519,687,214) (552,406,710) – (1,072,093,924)Balance at end of year P=43,590,365,901 P=32,665,454,169 P=25,244,826,661 P=101,500,646,731Accumulated depreciationBalance at beginning of year – 12,515,893,404 – 12,515,893,404Depreciation (Note 20) – 1,037,440,511 – 1,037,440,511Disposals – (102,998,098) – (102,998,098)Balance at end of year – 13,450,335,817 – 13,450,335,817Accumulated impairment lossesBalance at beginning of year 102,825,482 − − 102,825,482Impairment losses(Note 20) − 225,208,159 − 225,208,159Balance at end of year 102,825,482 225,208,159 − 328,033,641Net Book Value P=43,487,540,419 P=18,989,910,193 P=25,244,826,661 P=87,722,277,273
2019
Land BuildingsConstruction
in Progress TotalCostBalance at beginning of year P=49,369,131,575 P=33,082,823,892 P=18,011,617,054 P=100,463,572,521Additions 4,697,839,320 202,179,828 3,380,993,019 8,281,012,167Transfers (Note 7) (3,440,901,808) – – (3,440,901,808)Disposals (1,314,115,969) (589,346,983) (6,488,294,566) (8,391,757,518)Balance at end of year P=49,311,953,118 P=32,695,656,737 P=14,904,315,507 P=96,911,925,362Accumulated depreciationBalance at beginning of year – 11,697,610,481 – 11,697,610,481Depreciation (Note 20) – 1,072,521,133 – 1,072,521,133Disposals – (254,238,210) – (254,238,210)Balance at end of year – 12,515,893,404 – 12,515,893,404Accumulated impairment lossesBalance at beginning and end of year 102,825,482 − − 102,825,482Net Book Value P=49,209,127,636 P=20,179,763,333 P=14,904,315,507 P=84,293,206,476

- 48 -
*SGVFSM006234*
Certain parcels of land are leased to several individuals and corporations. Some of the leasecontracts provide, among others, that within a certain period from the expiration of the contracts, thelessee will have to demolish and remove any and all improvements (such as buildings) introduced orbuilt within the leased properties. Otherwise, the lessor will cause the demolition and removal thereofand charge the cost to the lessee unless the lessor occupies and appropriates the same for its useand benefit.
Construction in progress (CIP) pertain to buildings under construction to be leased as retail and officespaces upon completion. Ongoing projects are expected to be completed in 2021 to 2024.
On January 31, 2020, the Parent Company entered into a finance lease transaction with AREIT, Inc.for the Mckinley Property, which includes land of approximately 4,513 square meters and a five storeybuilding with gross floor area of 14,598.4 square meters, with net book value of P=417.0 million andfair value of P=853.2 million resulting to a gain of P=436.1 million.The lease commenced on February 1,2020 and will terminate on December 31, 2054.
On April 28, 2019, the Parent Company sold to AyalaLand Estates, Inc. (ALEI), its developmentproject, Vermosa Midtown Commercial Lots which is a campus-type commercial district with alifestyle mall. Total saleable area of the project is 58,457 square meters. The carrying value of theproject amounted to P=1,286.8 million.
On September 24, 2019, the Parent Company sold to Manila Jockey Club, Inc. (MJCI) its officeunits and parking lots in Vertex One Building located in Sta. Cruz, Manila with a total leasable areaof 13,517 square meters and book value of P=335.1 million. The property was purchased forP=511.7 million resulting to a gain on sale amounting to P=176.5 million.
On November 13, 2019, the Parent Company sold at cost to Bay Area Hotel Ventures, Inc., asubsidiary of AyalaLand Hotels and Resorts Corp. (AHRC), the Seda Manila Bay which is a 11 storeyhotel building located at Aseana City, Paranaque.The carrying value of the property amounted toP=596.3 million.
The aggregate fair value of the Parent Company’s investment properties amounted toP=219,071.0 million and P=241,836.2 million as of December 31, 2020, and 2019, respectively.
The fair value of the investment properties was determined by independent professionally qualifiedappraisers.
The following table provides the fair value hierarchy of the Parent Company’s investment propertiesas of December 31, 2020 and 2019:
2020Fair value measurement using
Date ofValuation Total
Quoted pricesin activemarkets(Level 1)
Significantobservable
inputs(Level 2)
Significantunobservable
inputs(Level 3)
Land properties Various P=156,621,885,815 P=– P=– P=156,621,885,815Office properties Various 46,390,344,404 – – 46,390,344,404Retail properties Various 16,058,803,305 – – 16,058,803,305
2019Fair value measurement using
Date ofValuation Total
Quoted pricesin activemarkets
(Level 1)
Significantobservable
inputs(Level 2)
Significantunobservable
inputs(Level 3)
Land properties Various P=195,456,707,810 P=– P=– P=195,456,707,810Office properties Various 28,075,064,402 – – 28,075,064,402Retail properties Various 18,304,439,585 – – 18,304,439,585
- 49 -
*SGVFSM006234*
The values of the land were arrived using the Market Data Approach. Market Data Approachprovides an indication of value by comparing the subject asset with identical or similar assets forwhich price information is available. This approach was used for the land as it is commonly used inthe property market since inputs and data for this approach are available. For Market Data Approach,the higher the price per sqm., the higher the fair value.
The values of the buildings were arrived using the Income Approach. Income Approach provides anindication of value by converting future cash flow to a single current value. Under the incomeapproach, the value of an asset is determined by reference to the value of income, cash flow or costsaving generated by the asset.
The significant unobservable inputs to valuation of investment properties ranges from P=5,782 toP=67,000 per sqm.
Rental income from investment properties amounted to P=3,083.2 million and P=4,106.9 million in 2020and 2019, respectively (see Note 19). Direct operating expenses arising from the investmentproperties amounted to P=2,334.8 million and P=2,460.4 million in 2020 and 2019, respectively(see Note 20).
Depreciation expense pertaining to investment properties amounted to P=1,037.4 million andP=1,072.5 million in 2020 and 2019, respectively (see Note 20).
Gain on sale of investment properties amounted to P=176.5 million in 2019 (nil in 2020) which isincluded under “Other income” in the parent company statements of income (see Note 20).
12. Property and Equipment
The rollforward analysis of this account as of December 31 follows:
2020
Land,Buildings andImprovements
Furniture,Fixtures
and OfficeEquipment
TransportationEquipment Total
CostBalance at beginning of year P=1,513,274,596 P=1,829,171,231 P=524,184,753 P=3,866,630,580Additions 1,049,751,588 52,844,263 52,579,567 1,155,175,418Disposals − − (40,638,667) (40,638,667)Balance at end of year 2,563,026,184 1,882,015,494 536,125,653 4,981,167,331Accumulated depreciationBalance at beginning of year 546,031,756 1,405,834,983 407,470,471 2,359,337,210Depreciation (Note 20) 54,667,179 83,383,810 60,448,907 198,499,896Disposals − − (40,625,665) (40,625,665)Balance at end of year 600,698,935 1,489,218,793 427,293,713 2,517,211,441Net Book Value P=1,962,327,249 P=392,796,701 P=108,831,940 P=2,463,955,890
2019
Land,Buildings and
Improvements
Furniture,Fixtures
and OfficeEquipment
TransportationEquipment Total
CostBalance at beginning of year P=1,043,337,654 P=1,706,847,378 P=482,753,804 P=3,232,938,836Additions 469,961,954 122,323,853 54,875,646 647,161,453Disposals (25,012) − (13,444,697) (13,469,709)Balance at end of year 1,513,274,596 1,829,171,231 524,184,753 3,866,630,580Accumulated depreciationBalance at beginning of year 492,593,208 1,319,852,176 353,498,740 2,165,944,124Depreciation (Note 20) 53,463,560 85,982,807 64,259,924 203,706,291Disposals (25,012) − (10,288,193) (10,313,205)Balance at end of year 546,031,756 1,405,834,983 407,470,471 2,359,337,210Net Book Value P=967,242,840 P=423,336,248 P=116,714,282 P=1,507,293,370

- 50 -
*SGVFSM006234*
In 2020 and 2019, the gain on sale of property and equipment amounted to P=13.4 million andP=9.2 million, respectively, included under “Other income” in the parent company statements ofincome (see Note 20).
Depreciation of property and equipment included in the general and administrative expensesamounted to P=198.5 million and P=203.7 million in 2020 and 2019, respectively (see Note 20). Nointerest was capitalized in 2020 and 2019.
The Parent Company has no restrictions on its property and equipment and none of these have beenpledged as security for its obligations.
13. Other Noncurrent Assets
This account consists of:
2020 2019Deferred charges P=1,101,921,294 P=1,710,843,616Deposit on land purchases 946,399,671 946,399,671Advances to contractors and supplies 800,888,714 629,485,509Project costsProject costs 246,528,854 96,350,653Recoverable deposits 207,190,573 189,868,668Other assets 394,017,748 278,695,956
P=3,696,946,854 P=3,851,644,073
Deferred charges and project costs consist of project costs incurred for unlaunched projects of theParent Company, advance rental payments, and noncurrent prepaid management fees. This alsoincludes the noncurrent portion of cost to obtain contracts which includes prepaid commissionsamounting P=914.8 million and P=442.2 million as of December 31, 2020 and 2019, respectively.
Advances to contractors and supplies represents prepayments for the construction of investmentproperty and property and equipment.
Recoverable deposits pertain to various utility deposits and security deposits for leases.
Other assets pertain to prepayments for expenses that is amortized for more than one year andunamortized VAT portion from purchases of capital goods.
14. Accounts and Other Payables
This account consists of:
2020 2019Accounts payable P=34,221,168,776 P=35,082,619,623Payable to related parties (Note 22) 23,806,929,750 24,019,777,707Accrued expenses Salaries and employee benefits 4,559,496,974 4,860,452,757 Project costs 953,366,618 2,093,087,691 Advertising and promotions 907,338,427 1,020,514,536 Commissions 854,611,080 1,135,307,449 Professional and management fees 520,477,027 983,331,768 Utilities 425,358,120 940,658,389 Representation 381,963,929 382,143,930 Repairs and maintenance 326,525,087 339,916,562
(Forward)

- 51 -
*SGVFSM006234*
2020 2019 Rentals P=15,050,672 P=83,402,518 Others 325,505,197 157,414,323Taxes payable 9,268,718,448 10,212,732,121Interest payable 1,502,584,008 1,764,269,702Retentions payable 549,528,769 501,483,465Liability for purchased land – current portion 784,731,374 297,800,142
P=79,403,354,256 P=83,874,912,683
Accounts payable and accrued expenses are noninterest-bearing and are normally settled within30-60 days. Other payables are noninterest-bearing and are normally settled within one year.
Accrued project costs are billings not yet received from suppliers for direct materials, and servicesfrom subcontractors. These are accruals of project costs such as equipment charges, materials,labor, overhead, and provision for repairs and maintenance.
Other accrued expenses consist mainly of transportation and travel, janitorial and security, postal andcommunication, insurance and supplies.
Taxes payable pertain to statutory liabilities for expanded withholding tax, withholding tax oncompensation, final tax and fringe benefit tax.
Retentions payable pertains to the amount withheld by the Parent Company on contractor’s billings tobe released after the guarantee period, usually one (1) year after the completion of the project orupon demand. The retention serves as a security from the contractor should there be defects in theproject.
Liability for purchased land pertains to the current portion of unpaid unsubdivided land acquiredpayable during the year. These are normally payable in quarterly or annual installment payments orupon demand.
15. Short-term and Long-term Debt
The short-term debt of P=6,640.5 million and P=15,708.0 million as of December 31, 2020 and 2019,respectively, represents peso-denominated bank loans. Peso-denominated short term loans had aweighted average cost of 4.0% and 5.0% per annum in 2020 and 2019.
In compliance with BSP rules on directors, officers, stockholders and related interests, certainshort-term and long-term debt with a carrying value of P=470.0 million and P=9,585.7 million as ofDecember 31, 2020 and 2019 are secured by a real estate mortgages dated September 2, 2014 andMarch 14, 2016 covering both land and building of the Greenbelt Mall. Net book value of the propertyamounted to P=2,288.3 million and P=2,451.2 million as of December 31, 2020 and 2019, respectivelywhich is accounted as part of the “Investment properties” account. The remaining balance ofP=180,953.4 million and P=169,696.7 million as of December 31, 2020 and 2019, respectively, areunsecured.
Long-term debt consists of:
2020 2019Bonds:
Due 2020 P=− P=4,000,000,000Due 2021 9,000,000,000 9,000,000,000Due 2022 22,650,000,000 12,650,000,000Due 2023 15,000,000,000 15,000,000,000
(Forward)

- 52 -
*SGVFSM006234*
2020 2019Due 2024 P=18,000,000,000 P=18,000,000,000Due 2025 21,250,000,000 15,000,000,000Due 2026 16,000,000,000 16,000,000,000Due 2027 8,000,000,000 8,000,000,000Due 2028 10,000,000,000 10,000,000,000Due 2033 2,000,000,000 2,000,000,000
Fixed rate corporate notes (FXCNs) 5,650,000,000 5,710,000,000 Php - denominated long term loan 41,230,039,062 41,885,093,750 US Dollar - denominated long term loan 6,002,875,000 6,329,375,000
174,782,914,062 163,574,468,750Less unamortized transaction costs 1,008,557,636 895,383,685
173,774,356,426 162,679,085,065Less current portion 11,144,189,998 7,188,254,688
P=162,630,166,428 P=155,490,830,377
Below is the summary of the outstanding Peso bonds issued by the Parent Company:
YearIssued
Term(Years)
Interestrate
PrincipalAmount
Carrying ValueFeatures2020 2019
2012 10.0 6.0000% P=5,650,000,000 P=5,650,000,000 P=5,645,303,849 Fixed rate bond due 20222013 7.0 4.6250% 4,000,000,000 − 3,995,320,903 Fixed rate bond due 20202013 20.0 6.0000% 2,000,000,000 1,986,730,081 1,985,275,846 Fixed rate bond due 20332013 10.5 5.0000% 15,000,000,000 14,966,061,554 14,936,647,278 Fixed rate bond due 20242014 11.0 5.6250% 8,000,000,000 7,968,512,470 7,952,879,530 Fixed rate bond due 20252015 7.0 4.5000% 7,000,000,000 6,987,688,059 6,968,807,211 Fixed rate bond due 20222016 9.5 4.7500% 7,000,000,000 6,969,407,363 6,955,764,739 Fixed rate bond due 20252016 10.0 4.8500% 8,000,000,000 7,961,918,326 7,946,612,317 Fixed rate bond due 20262016 7.0 3.8915% 7,000,000,000 6,980,787,310 6,961,630,823 Fixed rate bond due 20232017 10.0 5.2624% 7,000,000,000 6,979,065,066 6,972,611,037 Fixed rate bond due 20272018 10.0 5.9023% 10,000,000,000 9,916,583,476 9,896,154,193 Fixed rate bond due 20282018 5.0 7.0239% 8,000,000,000 7,962,716,634 7,925,898,274 Fixed rate bond due 20232019 7.0 6.3690% 8,000,000,000 7,934,303,811 7,909,801,618 Fixed rate bond due 20262019 5.0 4.7580% 3,000,000,000 2,978,435,643 2,979,163,972 Fixed rate bond due 20242019 2.0 4.2463% 9,000,000,000 8,781,627,798 8,937,450,478 Fixed rate bond due 20212019 7.25 4.9899% 1,000,000,000 963,622,207 952,029,044 Fixed rate bond due 20272020 2.0 3.0000% 10,000,000,000 9,970,491,226 − Fixed rate bond due 20222020 5.0 3.8620% 6,250,000,000 6,192,683,520 − Fixed rate bond due 2025Total P=121,150,634,544 P=108,921,351,112
Philippine Rating Services Corporation (PhilRatings) rated the Parent Company’s 2020 bond issue“PRS Aaa” with a stable outlook, and maintained the “PRS Aaa” rating with a stable outlook for allother outstanding bonds. PRS Aaa is the highest rating assigned by PhilRatings, indicating thatobligor’s capacity to meet its financial commitment on the obligation is extremely strong and that ithas the smallest degree of investment risk. On the other hand, an Outlook is an indication as to thepossible direction of any rating change within a one year period and serves as a further refinement tothe assigned credit rating for the guidance of investors, regulators, and the general public. A StableOutlook indicates that the rating is likely to be maintained or to remain unchanged in the next twelvemonths
Philippine Peso 10-year Bonds due 2022In April 2012, the Parent Company issued a P=5,650.0 million bond due 2022 at a fixed rate equivalentto 6.0% p.a. PhilRatings assigned a PRS Aaa rating on the bonds indicating that it has the smallestdegree of investment risk. Interest payments are protected by a large or by an exceptionally stablemargin and principal is assured. While the various protective elements are likely to change, suchchanges as can be visualized are most unlikely to impair the fundamentally strong position of suchissues. PRS Aaa is the highest credit rating possible on PhilRatings’ rating scales for long-termissuances.

- 53 -
*SGVFSM006234*
Philippine Peso 10-year and 6-month Bonds due 2024In July 2013, the Parent Company issued a total of P=15,000.0 million bonds due 2024 at a fixed rateequivalent to 5.0% p.a. Credit Rating and Investors Services Philippines, Inc. (CRISP) assigned a"AAA" on the bonds indicating that it has a minimal credit risk owing to the Company’s capacity torepay its debt obligations. AAA is the highest rating assigned by CRISP.
Philippine Peso 7-Year and 20-year Bonds due 2020 and 2033In October 2013, the Parent Company issued a total of P=6,000.0 million bonds, broken down into aP=4,000.0 million bond due 2020 at a fixed rate equivalent to 4.6% p.a. and a P=2,000.0 million bonddue 2033 at a fixed rate equivalent to 6.0% p.a. CRISP assigned a "AAA" rating on the bondsindicating that it has a minimal credit risk owing to the Parent Company’s capacity to repay its debtobligations. AAA is the highest rating assigned by CRISP. The Parent Company fully paid thematured bonds in October 2020.
Philippine Peso 11-year Bonds due 2025In April 2014, the Parent Company issued a total of P=8,000.0 million bonds due 2025 at a fixed rateequivalent to 5.6% p.a. The Bonds were assigned an issue credit rating of PRS Aaa, with a StableOutlook, by PhilRatings.
Philippine Peso 7.0 Billion Fixed Rate Bonds due 2022In April 2015, the Parent Company issued a total of P=7,000.0 million bonds due 2022 at a fixed rateequivalent to 4.5% p.a. The Bonds were assigned an issue credit rating of PRS Aaa, with a StableOutlook, by PhilRatings.
Philippine Peso 9-year and 6-month Bonds due 2025In April 2016, the Parent Company issued a total of P=7,000.0 million bonds due 2025 at a fixed rateequivalent to 4.75% p.a. The Bonds is the second tranche of the Fixed-rate Bonds Series under theParent Company's P=50,000.0 million Debt Securities Program registered in the SEC. The Bondswere assigned an issue credit rating of PRS Aaa, with a Stable Outlook, by PhilRatings.
Philippine Peso 7-year and 10-year Bonds due 2026In March 2016, the Parent Company issued a total of P=8,000.0 million bonds due 2026 at a fixed rateequivalent to 4.85% p.a. The Bonds is the first tranche of the Fixed-rate Bonds Series under theParent Company's P=50,000 million Debt Securities Program registered in the SEC. The Bonds wereassigned an issue credit rating of PRS Aaa, with a Stable Outlook, by PhilRatings. In May 2019, theParent Company issued an P=8,000.0 million fixed rate bond due 2026 at a rate equivalent to 6.369%p.a. The Bonds represent the first tranche of debt securities issued under the Parent Company's newP=50,000.0 million Debt Securities Program registered with the SEC, and listed on the PDEx. TheBonds have been rated PRS Aaa with a Stable Outlook by PhilRatings.
Philippine Peso 7-year Bonds due 2023In October 2016, the Parent Company issued a P=7,000.0 million fixed rate bond due 2023 at a rateequivalent to 3.8915% p.a. The Bonds represent the third tranche of the Fixed-rate Bonds Seriesissued under the Parent Company's P=50,000.0 million Debt Securities Program registered with theSEC, and listed in the PDEx. The Bonds have been rated PRS Aaa with a Stable Outlook byPhilRatings.
Philippine Peso 7-year and 3-month and 10-year Bonds due 2027In May 2017, the Parent Company issued a P=7,000.0 million fixed rate bond due 2027 at a rateequivalent to 5.2624% p.a. The Bonds represent the fourth tranche of the Fixed-rate Bonds Seriesissued under the Parent Company's P=50,000.0 million Debt Securities Program registered with theSEC, and listed in PDEx. The Bonds have been rated PRS Aaa with a Stable Outlook by PhilRatings.In November 2019, the Parent Company issued a P=1,000.0 million fixed rate bond due 2027 at a rateequivalent to 4.9899 % p.a. This was the third tranche of bonds issued under the new P=50,000.0million shelf registration of the Parent Company. The Bonds have been rated PRS Aaa with a StableOutlook by PhilRatings.

- 54 -
*SGVFSM006234*
Philippine Peso 10-year Bonds due 2028In April 2018, the Parent Company issued a P=10,000.0 million fixed rate bond due 2028 at a rateequivalent to 5.9203% p.a. and subject to repricing on 27 April 2023, the fifth anniversary of the IssueDate, at the higher of 5.9203% or the prevailing 5-year benchmark plus 75 bps. The Bonds representthe fifth tranche of the Fixed-rate Bonds Series issued under the Parent Company's P=50,000.0 millionDebt Securities Program registered with the SEC,and listed in the PDEx. The Bonds have been ratedPRS Aaa with a Stable Outlook by PhilRatings.
Philippine Peso 5-year Bonds due 2023In October 2018, the Parent Company issued a P=8,000.0 million fixed rate bond due 2023 at a rateequivalent to 7.0239% p.a. The Bonds represent the sixth and final tranche of the Fixed-rate BondsSeries issued under the Parent Company's P=50,000.0 million Debt Securities Program registered withthe SEC and listed on the PDEx. The Bonds have been rated PRS Aaa with a Stable Outlook byPhilRatings.
Philippine Peso 5-year and 2-year Bonds due 2024 and 2021In September 2019, the Parent Company issued a total of P=3,000.0 million bonds due 2024 at a fixedrate equivalent to 4.758% p.a. under its new shelf registration. PhilRatings assigned a PRS Aaarating on the bonds. In November 2019, the Parent Company issued a P=9,000.0 million fixed ratebond due 2021 at a rate equivalent to 4.2463% p.a. The Bonds form part of the third tranche of debtsecurities issued under the Parent Company's new P=50,000.0 million Debt Securities Programregistered with the SEC, and listed on the PDEx. The Bonds have been rated PRS Aaa with a StableOutlook by PhilRatings.
Philippine Peso 2-year Bonds due 2022In June 2020, the Parent Company issued a P=10,000.0 million fixed rate bond due 2022 at a rateequivalent to 3.00% p.a. The Bonds form part of the fourth tranche of debt securities issued under theParent Company's new P=50,000.0 million Debt Securities Program registered with the SEC, and thefirst issuer to hold a virtual listing ceremony on the PDEx. The Bonds have been rated PRS Aaa with aStable Outlook by PhilRatings and the first corporate bond to bookbuild, price, and issue within thecommunity quarantine period.
Philippine Peso 5-year Bonds due 2025In September 2020, the Parent Company issued a P=6,250.0 million fixed rate bond due 2025 at a rateequivalent to 3.862% p.a. The Bonds represent the fifth tranche of debt securities issued under theParent Company's new P=50,000.0 million Debt Securities Program registered with the SEC and listedon the PDEx. The Bonds have been rated PRS Aaa with a Stable Outlook by PhilRatings and thelargest 5-year bond issuance during the quarantine period.
Philippine Peso 5-, 10-, 15-Year FXCN due on 2016, 2021 and 2026In January 2011, the Parent Company issued P=10,000.0 million FXCNs to various financialinstitutions and retail investors. The notes will mature on various dates up to 2026. The FXCNs bearfixed interest rates ranging from 5.6% to 7.5% p.a. depending on the term of the notes.
The Parent Company prepaid P=1,950.0 million of notes due in 2016 on January 19, 2013. Thereafter,the Parent Company either prepaid the loans before its maturity or paid the loans upon maturity.From 2014 until 2020, the Parent Company paid a total of P=7,100.0 million, in which P=10.0 millionwere each paid in 2020 and 2019. As of December 31, 2020 and 2019, the remaining balance of theFXCN amounted to P=950.0 million and P=960.0 million, respectively.
Philippine Peso 10-year Note due 2023In December 2012, the Parent Company executed a P=5,000.0 million committed Corporate Notefacility with a local bank, of which an initial P=3,500.0 million was drawn in 2012. The balance ofP=1,500.0 million was subsequently drawn in January 2013. Notes currently bear a fixed interest rateof 4.5% p.a. The Corporate Notes will mature on the third month succeeding the tenth anniversary ofthe initial drawdown date. In 2015, P=50.0 million was prepaid by the Company. Thereafter, theParent Company paid the P=50.0 million loan amortizations until 2020. From 2016 until 2020, the

- 55 -
*SGVFSM006234*
Parent Company paid a total of P=250.0 million, in which P=50.0 million amortizations were each paid in2020 and 2019. As of December 31, 2020 and 2019, the remaining balance of the note amounted toP=4,700.0 million and P=4,750.0 million, respectively.
Peso-denominated Long-term Loans In August to September 2015, the Parent Company assumed an aggregate of P=15,526.9 million
various long-term facilities of some subsidiaries from various banks. The loans bear fixed interestrates ranging from 4.5% to 4.7% p.a. and terms ranging from 4.4 years to 10.5 years. As ofDecember 31, 2020 and 2019, the remaining balance of the assumed long-term facilities amounted toP=11,592.5 million and P=14,107.8 million respectively.
In March 2017, the Parent Company executed a P=10,000.0 million long-term facility with a domesticbank, in which the Company had simultaneously drawn an initial P=5,000.0 million. The loan carries afixed interest rate of 4.949% p.a. and a term of 10 years. The balance under the long-term facilityof P=5,000.0 million was drawn in April 2017.
In March 2018, the Parent Company executed a P=5,000.0 million long-term facility with a domesticbank, in which the Company had simultaneously drawn the entire facility amount.
In March 2019, the Parent Company executed a P=13,000.0 million long-term facility with a domesticbank, in which the Company had simultaneously drawn an initial P=6,500.0 million. The loan carries afixed interest rate of 6.272% p.a. and a term of 10 years. The P=6,500.0 million balance was drawn inApril 2019 at an interest rate of 6.307% per annum. In June 2020, the Parent Company prepaid theremaining long-term balance of P=12,662.0 million with a pre-termination fee of P=126.6 millionrecorded under interest expense and other financing charges account.
In January 2020, the Parent Company executed and availed a P=5,000.0 million 10-year long-termfacility with a domestic bank. The loan carries a fixed interest rate of 4.500% p.a. for the initial 5years. In December 2020, the Company also executed and availed a P=10,000.0 million 10-year long-term facility with a domestic bank. The loan carries a fixed interest rate of 4.000% p.a. for the first 7years. Both loans will be repriced on the 5th and 7th anniversary, respectively.
As of December 31, 2020 and 2019, remaining aggregate balance of the Peso-denominated long-term loans amounted to P=41,230.0 million and P=41,885.1 million, respectively.
US Dollar-denominated Long-term LoansIn November 2019, the Parent Company executed and had simultaneously drawn a US$125.0 millionlong-term facility. The loan bears a floating interest rate based on a credit spread over the three-month US Dollar London Interbank Offered Rate (LIBOR), repriceable quarterly. All proceeds wereonlent to MCT to refinance its existing loans. The loan will mature on the fifth anniversary of the initialdrawdown date.
As of December 31, 2020 and 2019, the remaining aggregate balance of US Dollar-denominated longterm loans amounted to P=6,002.9 million and P=6,329.4 million, respectively.
The loan agreements contain some or all of the following restrictions: material changes in nature ofbusiness; maintenance of debt-to-equity ratio; payment of dividends and additional loans maturingbeyond a year which will result to non-compliance of the required debt-to-equity ratios; merger orconsolidation where the Company/subsidiary is not the surviving corporation; guarantees oradvances; encumbrance for borrowed money; and sale of substantially all assets. These restrictionsand requirements were complied with by the Group as of December 31, 2020 and 2019.
Transaction costs capitalized amounted to P=320.0 million and P=333.8 million in 2020 and 2019,respectively. Amortization amounted to P=206.8 million and P=142.2 million in 2020 and 2019,respectively, and included under “Interest and other financing charges” (see Note 20).

- 56 -
*SGVFSM006234*
16. Deposits and Other Current Liabilities
This account consists of:
2020 2019Deposits P=9,565,177,422 P=8,455,354,937Current portion of customers’ deposits 4,753,556,892 4,183,219,230Unearned income 634,562,001 614,038,062
P=14,953,296,315 P=13,252,612,229
Deposits are equivalent to to three (3) to six (6) months’ rent of tenants with cancellable leasecontracts and whose lease term will end in the succeeding year. This will be refunded to the lesseesat the end of the lease term or be applied to the last months' rentals on the related contracts.
Customers’ deposits consist of collections from real estate customers which have not reached the10% threshold to qualify for revenue recognition and excess of collections over the recognizedreceivables based on percentage of completion. The amount of revenue recognized from amountsincluded in customers’ deposits at the beginning of the year amounted to P=4,183.2 million andP=10,476.3 million in 2020 and 2019, respectively.
Unearned income pertains to rents and other charges paid in advance by the tenants and are beingdeferred monthly.
17. Deposits and Other Noncurrent Liabilities
This account consists of:
2020 2019Customers’ deposits – noncurrent portion P=8,174,490,744 P=3,012,224,882Deposits 2,436,216,769 1,751,049,639Liability for purchased land 1,472,737,912 1,900,518,567Subscriptions payable 25,875,052 25,875,052Retentions payable – noncurrent portion 10,014,239 9,516,739Others 85,381,196 85,479,988
P=12,204,715,912 P=6,784,664,867
Customers’ deposits consist of excess of collections over the recognized receivables based onpercentage of completion.
Deposits include security deposits from tenants of retail and office spaces and deferred credits arisingfrom sale of real estate properties. Security deposits are equivalent to three (3) to six (6) months’ rentof long-term tenants with noncancellable leases. This will be refunded to the lessees at the end ofthe lease term or be applied to the last months' rentals on the related contracts. Deferred creditspertain to advances from buyers of real estate properties to cover various processing fees including,but not limited to, fees related to transfer of title such as registration fees, documentary taxes andtransfer taxes. Payments made by the Parent Company for the processing of title are charged to thisaccount.
Liability for purchased land pertains to the portion of unpaid investment in land acquired during theyear. It is payable in annual installment payments within five (5) years.
Subscription payable mainly pertains to the Parent Company’s subscription payable to its subsidiariesand associates. The outstanding balance pertains to subscriptions to Brightnote Assets Corporationformerly known as Batangas Assets Corporation., Crimson Field Enterprises, Regent Time and LasLucas Development Corp.
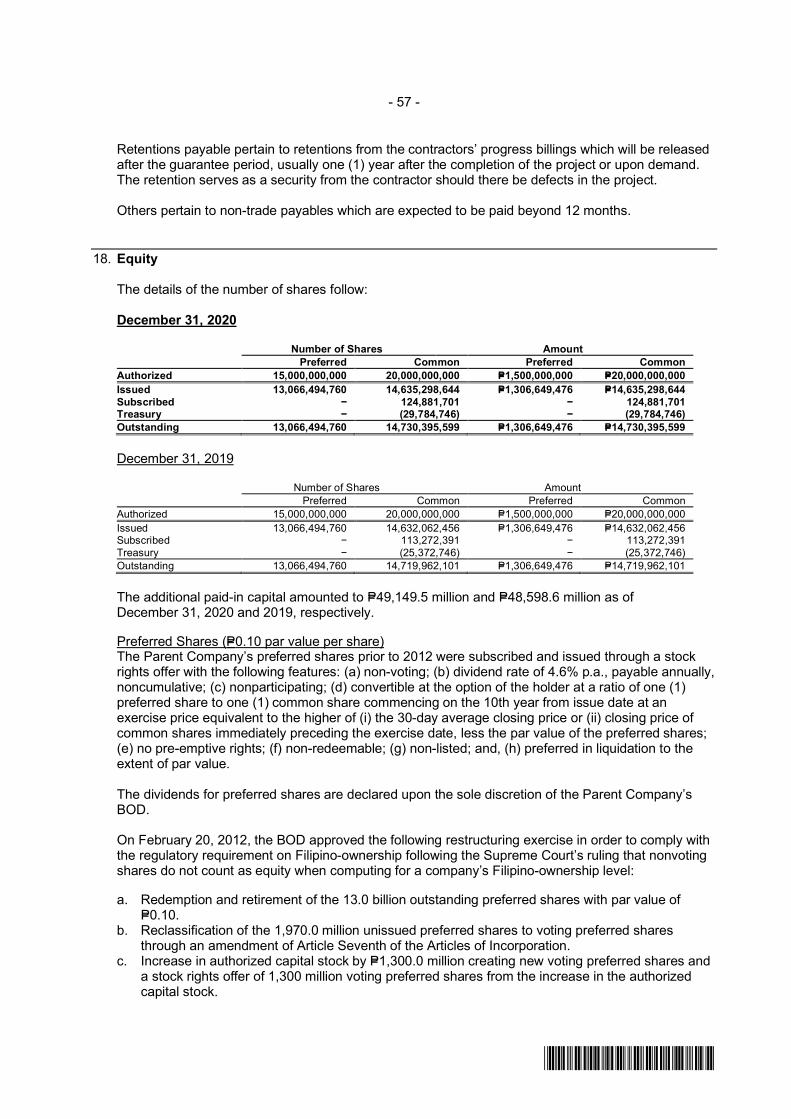
- 57 -
*SGVFSM006234*
Retentions payable pertain to retentions from the contractors’ progress billings which will be releasedafter the guarantee period, usually one (1) year after the completion of the project or upon demand.The retention serves as a security from the contractor should there be defects in the project.
Others pertain to non-trade payables which are expected to be paid beyond 12 months.
18. Equity
The details of the number of shares follow:
December 31, 2020
Number of Shares AmountPreferred Common Preferred Common
Authorized 15,000,000,000 20,000,000,000 P=1,500,000,000 P=20,000,000,000Issued 13,066,494,760 14,635,298,644 P=1,306,649,476 P=14,635,298,644Subscribed − 124,881,701 − 124,881,701Treasury − (29,784,746) − (29,784,746)Outstanding 13,066,494,760 14,730,395,599 P=1,306,649,476 P=14,730,395,599
December 31, 2019
Number of Shares AmountPreferred Common Preferred Common
Authorized 15,000,000,000 20,000,000,000 P=1,500,000,000 P=20,000,000,000Issued 13,066,494,760 14,632,062,456 P=1,306,649,476 P=14,632,062,456Subscribed − 113,272,391 − 113,272,391Treasury − (25,372,746) − (25,372,746)Outstanding 13,066,494,760 14,719,962,101 P=1,306,649,476 P=14,719,962,101
The additional paid-in capital amounted to P=49,149.5 million and P=48,598.6 million as ofDecember 31, 2020 and 2019, respectively.
Preferred Shares (P=0.10 par value per share)The Parent Company’s preferred shares prior to 2012 were subscribed and issued through a stockrights offer with the following features: (a) non-voting; (b) dividend rate of 4.6% p.a., payable annually,noncumulative; (c) nonparticipating; (d) convertible at the option of the holder at a ratio of one (1)preferred share to one (1) common share commencing on the 10th year from issue date at anexercise price equivalent to the higher of (i) the 30-day average closing price or (ii) closing price ofcommon shares immediately preceding the exercise date, less the par value of the preferred shares;(e) no pre-emptive rights; (f) non-redeemable; (g) non-listed; and, (h) preferred in liquidation to theextent of par value.
The dividends for preferred shares are declared upon the sole discretion of the Parent Company’sBOD.
On February 20, 2012, the BOD approved the following restructuring exercise in order to comply withthe regulatory requirement on Filipino-ownership following the Supreme Court’s ruling that nonvotingshares do not count as equity when computing for a company’s Filipino-ownership level:
a. Redemption and retirement of the 13.0 billion outstanding preferred shares with par value ofP=0.10.
b. Reclassification of the 1,970.0 million unissued preferred shares to voting preferred sharesthrough an amendment of Article Seventh of the Articles of Incorporation.
c. Increase in authorized capital stock by P=1,300.0 million creating new voting preferred shares anda stock rights offer of 1,300 million voting preferred shares from the increase in the authorizedcapital stock.

- 58 -
*SGVFSM006234*
On April 18, 2012, the stockholders ratified the BOD resolution on the capital restructuring.The voting preferred shares shall have the following features, rights, and privileges (a) voting;(b) dividend rate of 4.75% per annum, equivalent to 90% of the 10-year PDST R2 (repriced everyten (10) years from issue date), payable annually, non-cumulative; (c) convertible at the option of theholder at a ratio of one (1) voting preferred share to one (1) common share commencing on the 10th
year from issue date at an exercise price equivalent to the higher of (i) the 30-day average closingprice or (ii) closing price of common shares immediately preceding the exercise date, less the parvalue of the preferred shares; (d) no pre-emptive rights; (e) redeemable at par at the sole option ofthe corporation; (f) non-listed; and (g) preferred in liquidation to the extent of par value.
The SEC approved on January 31, 2013 the following:
a. The decrease in authorized capital stock by P=1,303.5 million, the aggregate par value of the13,034.6 preferred shares which have been redeemed and retired, from P=22,803.5 million toP=21,500.0 million, and
b. The amendments to Articles of Incorporation reflecting the decrease in capital stock.
As of December 31, 2020 and 2019, the Parent Company’s authorized and outstanding preferredshares amounted to P=1,500.0 million and P=1,306.6 million, respectively.
Common Shares (P=1.00 par value per share)On April 7, 2014, the stockholders resolved to approve the amendment of the Seventh Article of theArticles of Incorporation exempting from pre-emptive rights (1) the issuance of 1 billion commonshares for properties or assets needed for the business of the Parent Company or for cash to acquireproperties or assets needed for the business of the Parent Company or in payment of a debtcontracted prior to the issuance of such shares, and (2) the issuance of common shares covered bythe Parent Company’s Stock Option Plans for members of the management committees of the ParentCompany’s subsidiaries or affiliates.
Likewise, the stockholders resolved to approve the amendment of the Stock Option Plan of theParent Company to include the members of the Management Committees of the Parent Company’ssubsidiaries and affiliates as eligible grantees of stock options.
The rollforward of the outstanding number of common shares follows:
Number of Shares Amount2020 2019 2020 2019
Issued capital stockAt beginning of year 14,606,689,710 14,614,387,486 P=13,527,709,829 P=14,614,387,486Issued shares 3,236,188 17,674,970 3,236,188 17,674,970Treasury shares (4,412,000) (25,372,746) (156,427,410) (1,104,352,627)At end of year 14,605,513,898 14,606,689,710 13,374,518,607 13,527,709,829
Subscribed capital stockAt beginning of year 113,272,391 120,493,595 113,272,391 120,493,595Issued shares (3,236,188) (17,674,970) (3,236,188) (17,674,970)Additional subscriptions 14,845,498 10,453,766 14,845,498 10,453,766At end of year 124,881,701 113,272,391 124,881,701 113,272,391
14,730,395,599 14,719,962,101 P=13,499,400,308 P=13,640,982,220
No transfer of stock or interest which will reduce the ownership of Filipino citizens to less than therequired percentage of the capital stock as provided by existing laws shall be allowed or permitted tobe recorded in the books of the Parent Company.

- 59 -
*SGVFSM006234*
The Parent Company’s track record of capital stock is as follows:
Type of Shares
Number ofshares
registeredIssue/
Offer priceDate of
approval
Number ofholders of
securities as of2020
Number ofholders of
securities as of2019
Class B shares 800,000,000
Par Value - P1.00/Issue Price
P26.00 April 18, 1991 8,985 9,009Class B shares 400,000,000 Par Value - P1.00* July 06, 1992Class A shares 900,000,000 Par Value - P1.00** July 05, 1993Class B shares 600,000,000 Par Value - P1.00** July 05, 1993Note: Class A Shares and Class B Shares were declassified into one type of Common Shares on September 12, 1997.*increase in authorized capital stock, registered to cover the shares held by the directors and 20% stock dividend amounting toP108,662,000.00**increase in authorized capital stock, registered to cover the 20% stock dividend amounting to P391,240,953.00
On January 9, 2015, the Executive Committee of the Parent Company approved a top-up placementof 484,848,500 common shares of the Parent Company at a price of P=33.00 per share. Theplacement was conducted via an accelerated book built offering structured as a top-up placement,whereby AC sold 484,848,500 listed common shares of stock to qualified third party buyers andsubscribe to the same number of new shares from the Parent Company. The Parent Companycompleted the placement on January 12, 2015, raising an aggregate of P=16,000.0 million in paid-upcapital. The price was at 3.9% discount on the 5-day volume-weighted average price of ALIshares. Transaction cost charged to additional paid-in capital amounted to P=194.0 million.On April 13, 2013, the stockholders resolved to approve the amendment of the Seventh Article of theParent Company’s Articles of Incorporation for the purpose of excluding or exempting treasury sharesfrom the pre-emptive rights of stockholders.
On March 6, 2013, the Parent Company’s Board resolved to approve the placement made by AC ofits existing 320,000,000 listed common shares of the Parent Company to certain qualified third-party buyers or investors at P=30.50 per share. The Parent Company completed the top-upplacement, raising an aggregate of P=12,200.0 million in paid up capital. The price was at 3.6%discount on the 5-day volume-weighted average price of ALI shares. Transaction cost charged toadditional paid-in capital amounted to P=162.4 million.
On July 10, 2012, the Parent Company’s executive committee approved the placement of680 million listed common shares of stock with par value of P=1.00 per share, at a price of P=20 pershare, and the issuance of equal number of new shares of the Parent Company, at the same priceof P=20 per share, with AC as the seller of the placement tranche and subscriber of the subscriptiontranche. The Parent Company completed the top-up placement, raising an aggregate ofP=13,600 million in paid up capital. The price was at 5.0% discount to the closing price. Transactioncost charged to additional paid-in capital amounted to P=200.0 million.
On April 2, 2008, the Parent Company’s stockholders approved the allotment and subsequentissuance of the shares for the above-mentioned purposes and for the further amendment of theAmended Articles of Incorporation of the Parent Company to exclude the issuance of shares from thepre-emptive rights of the stockholders pursuant to Section 39 of the Philippine Corporation Code.
On February 12, 2008, the BOD approved the allotment and subsequent issuance of up to 1.0 billioncommon shares of stock of the Parent Company with an aggregate par value of P=1,000 million for thepurpose of exchanging such shares for properties or assets and/or to raise funds to acquireproperties or assets needed for the business of the Parent Company via issuance of equity orequity-linked instruments, the price and the terms and conditions of which shall be determined by theBOD based on prevailing market conditions or on agreements negotiated.
On July 5, 1991, the Parent Company launched its Initial Public Offering where a total of 400 millioncommon shares were offered at an offering price of P=26 per share. The registration statement wasapproved on July 20, 1992. The Parent Company has 9,102 and 9,209 existing certifiedshareholders as of December 31, 2018 and 2017, respectively.

- 60 -
*SGVFSM006234*
Subscription receivable amounted toP=2,262.8 million and P=1,878.2 millionas of December 31,2020 and 2019, and presented as a reduction in paid-in capital.
Treasury SharesOn February 21, 2020, the Board of Directors of Ayala Land, Inc. at its regular meeting approved theincrease of an additional P=25 billion to the Company’s current share buyback program bringing theavailable balance to P=26.1 billion. The program will be implemented through open market purchasesexecuted via the trading facilities of the Philippine Stock Exchange.
On February 28, March 11, March 12, and March 16, 2020, Ayala Land, Inc. purchased a total of4,412,000 common shares at an average price of P35.67 per share for a total consideration ofP=156.4 million, pursuant to its share buyback program.
On March 5, 2019, the Company purchased a total of 10,372,746 of its common shares at P=43.20 pershare through open market purchases using the trading facilities of the Philippine Stock Exchangefor a total purchase price of P=448.1 million in relation to its share buyback program. OnNovember 26, 2019, the Company also acquired a total of 15,000,000 of its common shares atP=43.75 per share for a total purchase price of P=656.3 million.
The amendment of the Articles of Incorporation on April 17, 2013 allows the re-selling of the79,528,299 listed common shares as part of the top-up placement transaction completed inJuly 2013. Treasury common shares were sold at P=30.5 per share resulting to additional paid-incapital of P=1,601.6 million.
On July 16, 2012, the Parent Company redeemed the 13.0 billion outstanding non-voting preferredshares through payment of the redemption price of P=0.10 per share. As of December 31, 2012, theredeemed preferred shares were treated as treasury shares and was subsequently retired uponapproval of the Parent Company’s SEC application for the decrease in authorized capital stock onJanuary 31, 2013.
On August 12, 2008, the BOD approved the creation of a share buyback program. It is part of theParent Company’s financial position management program and aims to: (i) improve the ParentCompany’s financial position structure and capital efficiency; and (ii) enhance shareholder valuethrough the repurchase of shares whenever the stock is trading at a price discount perceived by theParent Company as not reflective of its fair corporate value.
In 2008, the Parent Company repurchased a total of 79,528,228 of its common shares through openmarket purchases using the trading facilities of the Philippine Stock Exchange for a total purchaseprice of P=823.9 million in relation to its share buyback program.
Retained EarningsThe BOD approved the declaration and payment from unappropriated retained earnings of cashdividends of P=0.27 and P=0.52 per share in 2020 and 2019 respectively, to all issued and outstandingshares.
On February 20, 2020, the Board of Directors during its meeting approved the declaration of cashdividends of P=0.27 per outstanding common share. The cash dividend was paid on March 20, 2020 tostockholders of common shares as of record date March 6, 2020.
On May 26, 2020, the Board of Directors during its meeting approved the declaration of cashdividends of P=0.0047per outstanding preferred share. The cash dividend was paid on June 25, 2020to stockholders of preferred shares as of record date June 9, 2020.
On February 27, 2019, the BOD approved the declaration of cash dividends amounting toP=0.26 per outstanding common share and was paid on March 29, 2019 to the shareholders on recordas of March 13, 2019.

- 61 -
*SGVFSM006234*
On May 27, 2019, the BOD declared annual cash dividends of 4.7% per year or P=0.0047 per shareto all shareholders of the Parent Company’s unlisted voting preferred shares. These were paid onJune 21, 2019 to the shareholders on record as of June 7, 2019.
On October 31, 2019, the BOD approved the declaration of cash dividends amounting to P=0.26 peroutstanding common share and was paid on November 29, 2019 to the shareholders on record as ofNovember 15, 2019.
Total dividends for common shares declared for 2020 and 2019 amounted to P=3,944.6 million andP=7,659.5 million, respectively.
Retained earnings of P=8,000.0 million are appropriated for future expansion. The increase ofP=2,000.0 million in 2016 represents a continuing appropriation for land banking activities and plannedbuilding construction projects. Each year, the Parent Company incurs capital expenditures forproperty development which include among others land banking and building constructionprojects. The appropriation is being fully utilized to cover part of the annual expenditure requirementof the Parent Company.
The Parent Company has earmarked additional funds for expansion projects in the residential,shopping centers, office and hotel business segments, as well as various infrastructure projects forthe Parent Company’s mixed-use developments.
The following are among the major capital expenditures of the Parent Company which were approvedby the BOD:
a) Ayala Triangle Garden 2 with product offering for a Triple A HQ Office Building, a 5-Star Hoteland 3-level Retail Podium with gardens and civic spaces which was approved by the Board onMay 29, 2015. The project was launched in June 2015 and expected to be completed inApril 2021.
b) Ayala Center Redevelopment which will offer intermodal transport facility, a 5-storey regionalmall, 2 BPO towers, a SEDA hotel and a 300-units residential for lease was approved by theBoard on November 27, 2015. The project was launched in January 2016 and expected to becompleted in 2021.
In accordance with SEC Memorandum Circular No. 11 issued in December 2008, the ParentCompany’s retained earnings, after reconciling items, available for dividend declaration as ofDecember 31, 2020 and 2019 amounted to P=67,866.2 million and P=58,147.6 million, respectively.
Retained earnings are further restricted for the payment of dividends to the extent of the cost oftreasury shares.
Capital ManagementThe primary objective of the Parent Company’s capital management policy is to ensure that debt andequity capital are mobilized efficiently to support business objectives and maximize shareholdervalue. The Parent Company establishes the appropriate capital structure for each business line thatproperly reflects its premier credit rating and allows it the financial flexibility, while providingit sufficient cushion to absorb cyclical industry risks.
The Parent Company considers debt as a stable source of funding. The Parent Company lengthenedthe maturity profile of its debt portfolio and makes it a point to spread out its debt maturities by nothaving a significant percentage of its total debt maturing in a single year.

- 62 -
*SGVFSM006234*
The Parent Company manages its capital structure and makes adjustments to it, in the light ofchanges in economic conditions. It monitors capital using leverage ratios on both gross debt and netdebt basis. As of December 31, 2020, and 2019, the Parent Company had the following ratios:
2020 2019Debt to equity 1.275:1 1.363:1Net debt to equity 1.266:1 1.349:1
Debt consists of short-term and long-term debts. Net debt includes short-term and long-term debtless cash and cash equivalents and financial assets at FVPL. Equity, which the Parent Companyconsiders as capital, pertains to the total equity. The Parent Company excludes the “Fair valuereserve of financial assets at FVOCI” in computing the debt to equity ratio.
The Parent Company is not subject to externally imposed capital requirements due to loan covenants(see Note 15). No changes were made in the objectives, policies or processes for managing capitalduring the years ended December 31, 2020 and 2019.
Financial risk assessmentThe Parent Company’s financial condition and operating results would not be materially affected bythe current changes in interest, currency, credit, liquidity and market conditions.
Exposure to changes in interest rates is reduced by a debt portfolio mix of both fixed and floatinginterest rates. The Parent Company’s ratio of fixed to floating rate debt stood at 96:4 and 91.9 as ofDecember 31, 2020, and 2019, respectively.
Exposure to foreign currency holdings is at US$124.4 million and US$124.0 million as ofDecember 31, 2020 and 2019, respectively.
Credit risks continue to be managed through defined credit policies and continuing monitoring ofexposure to credit risks. The Parent Company’s base of counterparties remains diverse. As such, itis not exposed to large concentration of credit risk.
Liquidity risk is addressed with long-term funding already locked in, while funds are placed on cashequivalents and financial assets at FVPL.
19. Revenue
This account consists of:
2020 2019Revenue from contracts with customer
Residential development P=15,290,764,031 P=30,221,976,167Interest income from real estate sales (Note 6) 3,701,041,649 3,413,181,338Management and marketing fees 1,384,801,399 2,310,585,410
Rental income (Note 11) 3,083,182,167 4,106,863,462P=23,459,789,246 P=40,052,606,377

- 63 -
*SGVFSM006234*
The Parent Company’s disaggregation of each sources of revenue from contracts with customers arepresented below:
Residential development
2020 2019Type of ProductCondominium P=11,258,192,739 P=22,244,900,616House and lot 6,951,877,199 10,353,694,773Lot only 781,735,742 1,036,562,116
P=18,991,805,680 P=33,635,157,505
All of the Parent Company’s real estate sales from residential development are revenue fromcontracts with customers recognized over time.
Management and marketing fees
2020 2019SegmentProperty development P=894,947,583 P=1,449,456,895Shopping centers 284,435,935 624,556,188Offices 205,417,881 236,572,327
P=1,384,801,399 P=2,310,585,410
In line with the rental relief framework implemented by the government to support businesses and thebroader economy due to the impact of COVID-19, the Parent Company waived its right to collect rentand other charges as part of various lease concessions it granted to lessees such as lease paymentholidays or lease payment reductions. Rent discounts and concessions given vary for merchants thatare (1) forced to close and those that are still (2) operational. Rental fees and common charges ofmerchants who were forced to close during the quarantine period were waived with 50% discount intheir common area usage expenses.
Set-out below is the reconciliation of contracts with customers with the amounts disclosed in segmentinformation (in millions):
2020
PropertyDevelopment
ShoppingCenters Offices
PropertyManagement
and Others Total
Sales to external customers P=14,576 P=288 P=205 P=1,607 P=16,676Interest income from real estate
sales 3,701 − − − 3,701Total revenue from contracts with
customers P=18,277 P=288 P=205 P=1,607 P=20,377
2019
PropertyDevelopment
ShoppingCenters Offices
PropertyManagement and
Others Total
Sales to external customers P=28,205 P=625 P=237 P=3,466 P=32,533Interest income from real estate
sales 3,413 − − − 3,413Total revenue from contracts with
customers P=31,618 P=625 P=237 P=3,466 P=35,946

- 64 -
*SGVFSM006234*
20. Costs and Expenses and Other Income (Charges)
Real estate costs and expenses consist of:
2020 2019Cost of real estate sales (Note 7) P=7,099,810,027 P=16,080,241,727Depreciation (Notes 11 and 29) 1,079,512,247 1,128,499,319Manpower costs 139,689,754 1,047,056,935Rental 112,363,461 159,393,984Direct operating expenses Service fees 1,712,447,267 2,771,991,590 Taxes and licenses 935,179,114 728,735,771 Commissions 618,075,016 1,034,193,740 Security 177,778,298 366,343,395 Repairs and maintenance 63,155,710 126,337,696 Transportation and travel 10,883,753 37,916,535 Supplies 980,030 5,071,905
Others 45,307,388 181,808,677P=11,995,182,065 P=23,667,591,274
Others pertain to miscellaneous expenses for the Parent Company’s development projects.
General and administrative expenses consist of:
2020 2019Manpower costs (Note 23) P=946,789,078 P=1,273,838,545Professional fees 263,026,000 236,228,993Depreciation (Note 12) 198,499,896 203,706,291Repairs and maintenance 71,186,191 65,026,456Donations and contribution 52,924,290 43,702,302Advertising 32,705,126 52,476,523Utilities 32,324,413 28,309,421Security and janitorial 16,868,497 14,386,073Transportation and travel 15,588,558 27,069,472Entertainment, amusement and recreation 11,393,926 20,534,114Supplies 7,382,035 9,076,119Rentals 949,157 1,680,220Others 79,639,807 46,552,344
P=1,729,276,974 P=2,022,586,873
Depreciation expense included in the parent company statements of income follow:
2020 2019Included in: Real estate costs and expenses (Note 11) P=1,037,440,511 P=1,072,521,133 Amortization of right-of-use asset (Note 29) 42,071,736 55,978,186 General and administrative expenses (Note 12) 198,499,896 203,706,291
P=1,278,012,143 P=1,332,205,610

- 65 -
*SGVFSM006234*
Interest expense and other financing charges consist of:
2020 2019Interest expense on: Long-term debt P=8,313,357,874 P=7,754,961,311 Short-term debt 1,008,137,639 891,705,161
Intercompany loans 203,793,181 439,080,586Accretion of interest from lease liabilities (Note 29) 24,502,275 27,316,431Other financing charges 2,444,787,443 1,232,690,327
P=11,994,578,412 P=10,345,753,816
Other financing charges pertain mainly to processing fees attributable to the discount on cost to sellfinancing arising from assignment of accounts receivable to banks (Note 6). It also includestransaction costs from availment of short-term and intercompany loans and bank charges.
Other charges and expenses consists of provision for impairment loss and write-off of receivablesamounting to P=199.0 million and P=43.4 million for 2020 and 2019, respectively (Note 6). It alsoincludes provision for impairment loss on Southvale golf facility amounting to P=225.2 million for 2020(Note 11).
Other income consists of:
2020 2019Gain on sale of investment in subsidiaries,
associates and joint ventures (Note 10) P=7,760,796,086 P=49,300,386Gain on foreign exchange 187,339,286 198,797,594Gain on sale of property and equipment (Note 12) 13,352,764 9,233,657Unrealized gain on financial assets at FVPL (Note 5) 701,744 85,779Gain on sale of investment property (Note 11) − 176,544,327Others 573,360,652 493,561,652
P=8,535,550,532 P=927,523,395
21. Income Tax
The components of net deferred tax assets are as follows:
2020 2019Deferred tax assets on: Difference between tax and book basis of
accounting for real estate transactions P=514,380,565 P=680,069,461 Allowance for impairment losses 597,840,801 530,278,353 Employee benefits 516,253,004 471,558,635 MCIT 298,500,933 52,081,965 NOLCO 435,963,389 −
Lease liability 74,236,592 85,629,024 Allowance for probable losses 123,911,553 64,205,426
2,561,086,837 1,883,822,864Deferred tax liabilities on:
Deferred tax liabilities on capitalized interest (393,244,038) (431,100,156)Unrealized foreign exchange gain (118,246,288) (56,562,357)Right-of-use assets (86,590,661) (104,108,018)
(598,080,987) (591,770,531)P=1,963,005,850 P=1,292,052,333

- 66 -
*SGVFSM006234*
The Company has NOLCO amounting to P=1,453.2 and nil as of December 31, 2020 and 2019,respectively and MCIT amounting to P=298.5 million and P=52.08 million as of December 31, 2020 and2019, respectively. Deferred tax assets are recognized only to the extent that taxable income will beavailable against which the deferred tax assets can be used.
There are no income tax consequences for the payment of dividends by the Parent Company to itsshareholders.
Provision for income tax consists of:
2020 2019Current P= 246,418,968 P=185,352,099Deferred (643,941,531) 1,419,905,391Final 53,956,321 13,474,077
(P=343,566,242) P=1,618,731,567
On September 30, 2020, the BIR issued Revenue Regulations No. 25-2020 implementing Section4(bbbb) of “Bayanihan to Recover As One Act” which states that the NOLCO incurred for taxableyears 2020 and 2021 can be carried over and claimed as a deduction from gross income for the nextfive (5) consecutive taxable years immediately following the year of such loss.
As of December 31, 2020, the Company has incurred NOLCO in taxable year 2020 which can beclaimed as deduction from the regular taxable income for the next five (5) consecutive taxable yearspursuant to the Bayanihan to Recover As One Act, as follows:
Year Incurred Amount Used/Expired Balance Expiry Year(In Thousands)
2020 P=1,453,211 P=− P=1,453,211 2025
The carryover MCIT that can be used as deductions against income tax liabilities is as follows:
Year Incurred Amount Used/Expired Balance Expiry Year(In Thousands)
2019 P=52,082 P=− P=52,082 20222020 246,419 − 246,419 2023
P=298,501 P=− P=298,501
Reconciliation between the statutory and the effective income tax rates follows:
2020 2019Statutory income tax rate 30.00% 30.00%Tax effects of: Interest income and capital gains taxed
at lower rates (0.11) (0.16) Dividend income (16.04) (19.02) Others - net (16.26) 0.09Effective income tax rate (2.41%) 10.91%
Deferred tax related to remeasurement gain (loss) on defined benefit plans recognized in OCIamounted to (P=27.01 million) and (P=108.4 million) in 2020 and 2019, respectively.

- 67 -
*SGVFSM006234*
Republic Act (RA) No.10963 or the Tax Reform for Acceleration and Inclusion Act (TRAIN) wassigned into law on December 19, 2017 and took effect January 1, 2018, making the new tax lawenacted as of the reporting date. Although the TRAIN changes existing tax law and includes severalprovisions that will generally affect businesses on a prospective basis, the management assessedthat the same will not have any significant impact on the financial statement balances as of thereporting date.
Corporate Recovery and Tax Incentives for Enterprises Act” or “CREATE”On February 1, 2021, the Bicameral Conference Committee, under the 18th Congress of thePhilippines, approved the reconciled version of the House Bill No. 4157 and Senate Bill No.1357 (theCREATE). The general features of the CREATE bill are the following: Reduction in current income tax rate effective July 1, 2020; Proprietary educational institutions and hospitals which are nonprofit previously subject to a tax of
10% on their taxable income, shall be imposed a tax rate of 1% beginning July 1, 2020 untilJune 30, 2023;
Increased threshold on sale of real estate properties that is exempt from VAT; Regional operating headquarters of multinational companies previously subject to a tax of 10%
on their taxable shall be subject to the regular corporate income tax effective December 31, 2020;and
Effective July 1, 2020 until June 30,2023, the MCIT rate shall be one percent 1%.
As at February 23, 2021, the harmonized copy of the CREATE bill has been transmitted to the Officeof the President for signing or approval into law.
22. Related Party Transactions
Parties are considered to be related if one party has the ability, directly or indirectly, to control theother party or exercise significant influence over the other party in making financial and operatingdecisions. Parties are also considered to be related if they are subject to common control or commonsignificant influence which include affiliates.
In its regular conduct of business, the Parent Company has entered into transactions with itssubsidiaries, associates and other related parties principally consisting of advances andreimbursement of expenses, purchase and sale of real estate properties, loans, constructioncontracts, development, management, underwriting, marketing, leasing and administrative serviceagreements.
Terms and Conditions of Transactions with Related PartiesTransactions with related parties are made at normal market prices. Outstanding balances at yearend are unsecured, interest free and settlement occurs generally in cash, except otherwise indicated.There have been no guarantees provided or received for any related party receivables or payables.The Parent Company does not provide any allowance relating to receivable from related parties.
This assessment is undertaken each financial year through examining the financial position of therelated parties and the markets in which the related parties operate.
The Related Party Transaction Review Committee shall approve all material related partytransactions before their commencement. Material related party transactions shall be identified takinginto account the related party registry. Transactions amounting to ten percent (10%) or more of thetotal assets of the corporation that were entered into with an unrelated party that subsequentlybecomes a related party may be excluded from the limits and approval process requirement.

- 68 -
*SGVFSM006234*
The following tables provide the total amount of transactions that have been entered into with relatedparties for the relevant financial year:
a. Transactions with Bank of the Philippine Islands (BPI), an associate of AC:
i. As of December 31, 2020 and 2019, the Parent Company maintains current and savingsaccount, money market placements, UITF investments, short-term debt and long-term debtpayable with BPI broken down as follows:
2020 2019Cash in bank P=248,721,854 P=875,073,965Financial assets at FVPL 10,593,454 2,054,808Short-term debt 1,451,000,000 9,081,000,000Long-term debt 470,039,063 504,743,750
Interest income earned amounted to P=0.02 million and P=0.01 million in 2020 and 2019,respectively.
As of December 31, 2020, the Parent Company invested funds with a fair value ofP=3.4 million for BPI Money Market Fund and P=7.2 million for BPI USD Short Term Funds.The Funds Net Asset Value (NAV) was at P=61,961.9 million with the duration of 255 daysand P=41,101.9 million with duration of 307 days, respectively.
As of December 31, 2019, the Parent Company invested in the BPI Money Market Fund witha fair value of P=2.1 million. The BPI MMF’s Net Assset Value (NAV) was at 23,980.6 millionwith duration of 131 days.
ii. As of December 31, 2020 and 2019, the Parent Company has outstanding interest payable toBPI amounting to P=0.4 million and P=18.7million, respectively.
iii. Income earned and expenses incurred with BPI are as follows:
2020 2019Interest income P=16,250 P=14,972Interest expense 110,326,287 266,726,230
b. Outstanding balances with AC, subsidiaries, associates, joint ventures and other related parties(entities under common control).
Receivables from/payables to related parties pertain mostly to development and managementfees, advances and reimbursements of operating expenses related to development cost, workingcapital requirements and land acquisitions which are due and demandable.
Receivables from related parties follow:
2020Current Noncurrent Total
AC P=52,032,942 P=– P=52,032,942Subsidiaries 58,157,168,483 837,543,814 58,994,712,297Associates 319,910,507 – 319,910,507Joint Ventures 210,616,561 – 210,616,561Other related parties 83,833,509 – 83,833,509
P=58,823,562,002 P=837,543,814 P=59,661,105,816

- 69 -
*SGVFSM006234*
2019Current Noncurrent Total
AC P=143,285,872 P=– P=143,285,872Subsidiaries 54,306,287,966 – 54,306,287,966Associates 311,437,944 – 311,437,944Joint Ventures 94,698,021 – 94,698,021Other related parties 213,022,028 – 213,022,028
P=55,068,731,831 P=– P=55,068,731,831
During 2020, receivables from related parties include a noncurrent receivable pertaining to acontract of lease with AREIT amounting to P=837.5 million (see Note 29).
Payable to related parties follow:
2020Current Noncurrent Total
AC P=591,417 P=– P=591,417Subsidiaries 23,232,995,146 − 23,232,995,146Associates 234,312,693 – 234,312,693Joint Ventures 4,305,418 – 4,305,418Other related parties 334,725,076 – 334,725,076
P=23,806,929,750 P=− P=23,806,929,750
2019Current Noncurrent Total
AC P=86,247,149 P=– P=86,247,149Subsidiaries 23,380,824,715 − 23,380,824,715Associates 211,491,745 – 211,491,745Joint Ventures 3,941,600 – 3,941,600Other related parties 337,272,498 – 337,272,498
P=24,019,777,707 P=− P=24,019,777,707
c. Revenue and expenses from related parties
The revenue from the Parent Company, subsidiaries, associates, joint ventures and other relatedparties pertains mostly to income from leasing and development projects, dividend income,marketing and management fees, while expenses composed of service fees, commission, andtraining expenses. Transactions are settled within one year, except as otherwise stated.
Revenue and expenses from related parties follow:
Revenue
2020
Dividend IncomeManagement and
Marketing Income Rental Income Interest Income TotalAC P=− P=− P=132,164 P=− P=132,164Subsidiaries 6,949,367,487 1,164,864,331 653,260,548 761,408,296 9,528,900,662Joint Ventures − 112,010,907 − − 112,010,907Associates 685,110,239 104,264,702 − 689,967 790,064,908Other Related
Parties − 3,661,459 103,231,758 − 106,893,217Total P=7,634,477,726 P=1,384,801,399 P=756,624,470 P=762,098,263 P=10,538,001,858

- 70 -
*SGVFSM006234*
2019
Dividend IncomeManagement andMarketing Income Rental Income Interest Income Total
AC P=− P=− P=140,201 P=− P=140,201Subsidiaries 9,067,834,357 2,013,160,004 1,444,523,547 481,148,465 13,006,666,373Joint Ventures 250,000,000 137,178,255 − − 387,178,255Associates 95,629,843 155,752,357 − − 251,382,200Other Related
Parties − 4,494,794 102,483,456 − 106,978,250Total P=9,413,464,200 P=2,310,585,410 P=1,547,147,204 P=481,148,465 P=13,752,345,279
Costs and expenses
2020Rental
Expenses Service FeesCommission
ExpensesInterest
Expense TotalAC P=− P=406,486 P=− P=− P=406,486Subsidiaries 502,048 1,709,436,952 413,445,012 203,793,180 2,327,177,192Associates 13,408,391 2,000,000 – – 15,408,391Other Related
Parties 3,020,628 603,829 − − 3,624,457Total P=16,931,067 P=1,712,447,267 P=413,445,012 P=203,793,180 P=2,346,616,526
2019Rental
Expenses Service FeesCommission
ExpensesInterest
Expense TotalAC P=30,000 P=2,520,000 P=− P=− P=2,550,000Subsidiaries 35,304,206 2,647,787,719 620,936,016 439,080,586 3,743,108,527Joint Ventures 5,681,941 − − − 5,681,941Associates 19,264,094 4,821 – – 19,268,915Other Related
Parties 4,606,066 103,519 − − 4,709,585Total P=64,886,307 P=2,650,416,059 P=620,936,016 P=439,080,586 P=3,775,318,968
The following describes the nature of the material transactions of the Parent Company withrelated parties as of December 31, 2020, and 2019:
i. During the year, Parent Company lent to and borrowed funds from various subsidiaries andaffiliates on an interest bearing basis. Outstanding intercompany peso-denominated loansof the Parent Company to subsidiaries and affiliates amounted to P=9,103.8 million, andP=7,099.1 million as of December 31, 2020 and 2019, respectively. Interest rates rangesfrom 2.57% to 3.20% and 3.89% to 4.63% per annum for 2020 and 2019, respectively,with terms of 1 day up to 90 days.
ii. On September 30, 2020, the Parent Company paid P=6,430.8 million to its subsidiary MakatiCornerstone Leasing Corp., for its Ayala Triangle Garden 2 (ATG2) acquisition inDecember 18, 2019.
iii. On December 18, 2019, the Parent Company acquired from its subsidiary MakatiCornerstone Leasing Corp., its development project Ayala Triangle Garden 2 (ATG2) ,composed of 39-storey building composed of 4 levels of retails spaces, 33 levels of officefloors, 1 level of amenities space, 1 level for mechanical and other building equipment and5 basement floors for parking the construction thereof is on-going and work in progress,with construction percentage of completion at 81.12% as of December 31, 2019. ATG2 wasacquired for a consideration of P6,430.8 million.
iv. On April 28, 2019, the Parent Company sold to AyalaLand Estates, Inc. (ALEI), itsdevelopment project, Vermosa Midtown Commercial Lots which is a campus-typecommercial district with a lifestyle mall. Total saleable area of the project is 58,457 squaremeters. The carrying value of the project amounted to P=1,286.8 million.
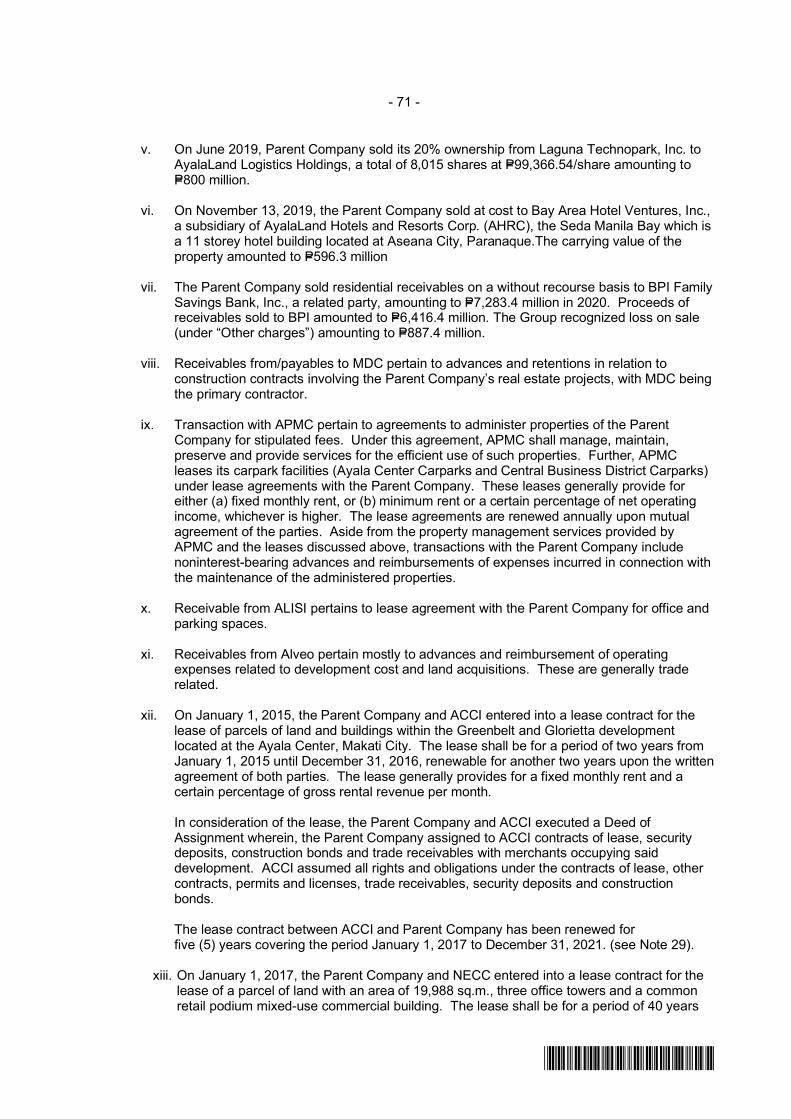
- 71 -
*SGVFSM006234*
v. On June 2019, Parent Company sold its 20% ownership from Laguna Technopark, Inc. toAyalaLand Logistics Holdings, a total of 8,015 shares at P=99,366.54/share amounting toP=800 million.
vi. On November 13, 2019, the Parent Company sold at cost to Bay Area Hotel Ventures, Inc.,a subsidiary of AyalaLand Hotels and Resorts Corp. (AHRC), the Seda Manila Bay which isa 11 storey hotel building located at Aseana City, Paranaque.The carrying value of theproperty amounted to P=596.3 million
vii. The Parent Company sold residential receivables on a without recourse basis to BPI FamilySavings Bank, Inc., a related party, amounting to P=7,283.4 million in 2020. Proceeds ofreceivables sold to BPI amounted to P=6,416.4 million. The Group recognized loss on sale(under “Other charges”) amounting to P=887.4 million.
viii. Receivables from/payables to MDC pertain to advances and retentions in relation toconstruction contracts involving the Parent Company’s real estate projects, with MDC beingthe primary contractor.
ix. Transaction with APMC pertain to agreements to administer properties of the ParentCompany for stipulated fees. Under this agreement, APMC shall manage, maintain,preserve and provide services for the efficient use of such properties. Further, APMCleases its carpark facilities (Ayala Center Carparks and Central Business District Carparks)under lease agreements with the Parent Company. These leases generally provide foreither (a) fixed monthly rent, or (b) minimum rent or a certain percentage of net operatingincome, whichever is higher. The lease agreements are renewed annually upon mutualagreement of the parties. Aside from the property management services provided byAPMC and the leases discussed above, transactions with the Parent Company includenoninterest-bearing advances and reimbursements of expenses incurred in connection withthe maintenance of the administered properties.
x. Receivable from ALISI pertains to lease agreement with the Parent Company for office andparking spaces.
xi. Receivables from Alveo pertain mostly to advances and reimbursement of operatingexpenses related to development cost and land acquisitions. These are generally traderelated.
xii. On January 1, 2015, the Parent Company and ACCI entered into a lease contract for thelease of parcels of land and buildings within the Greenbelt and Glorietta developmentlocated at the Ayala Center, Makati City. The lease shall be for a period of two years fromJanuary 1, 2015 until December 31, 2016, renewable for another two years upon the writtenagreement of both parties. The lease generally provides for a fixed monthly rent and acertain percentage of gross rental revenue per month.
In consideration of the lease, the Parent Company and ACCI executed a Deed ofAssignment wherein, the Parent Company assigned to ACCI contracts of lease, securitydeposits, construction bonds and trade receivables with merchants occupying saiddevelopment. ACCI assumed all rights and obligations under the contracts of lease, othercontracts, permits and licenses, trade receivables, security deposits and constructionbonds.
The lease contract between ACCI and Parent Company has been renewed forfive (5) years covering the period January 1, 2017 to December 31, 2021. (see Note 29).
xiii. On January 1, 2017, the Parent Company and NECC entered into a lease contract for thelease of a parcel of land with an area of 19,988 sq.m., three office towers and a commonretail podium mixed-use commercial building. The lease shall be for a period of 40 years

- 72 -
*SGVFSM006234*
which commenced on January 1, 2017. The commencement of the lease period for thebuildings are by phase, Phase 1 started on January 18, 2017, Phase 2 on April 1, 2017,Phase 3 on October 1, 2017 and Phase 4 shall start on October 1, 2018. The lease on thebuildings is co-terminous with the land lease. The lease is renewable for another 40 yearsupon mutual agreement of both parties. The lease generally provide for a fixed monthlyrent and a certain percentage of gross rental revenue per month. (see Note 29)
xiv. On September 2017, the Parent Company signed a Lease Agreement with AyalaLandEstates, Inc. (ALEI) for the lease of a 4.3-hectare portion of land located in Vermosa,Pasong Buaya I, Imus City, Province of Cavite. The term of the lease shall ten (10) yearscommencing from September 2017 to August 2027. (see Note 29)
xv. On December 27, 2017, the Parent Company sold at cost to MCLC buildings underconstruction located at Ayala Triangle Gardens and Sta. Ana Park, A.P. Reyes Ave., Brgy.Carmona, Makati City. Subsequently, the Parent Company signed a lease agreement withMCLC for the lease on the parcels of land it owns where the buildings were constructed.(see Notes 11 and 29)
xvi. On December 28, 2017, the Parent Company sold at cost to ASCVC, the Arca South BPOand Mall which is still under construction. Subsequently, the Parent Company signed alease agreement with ASCVC for the lease on the parcels of land it owns where thebuildings were constructed. (see Notes 11 and 29)
xvii. During 2017, the Parent Company and NECC entered into a lease contract for the lease ofa 24-storey building with a total construction floor area of 146,830 sq. m. located at 30Meralco Ave., Pasig City. The lease shall be for a period of 40 years which commenced onFebruary 1, 2016 for Phase 1 and August 1, 2017 for Phase 2. The lease is renewable foranother 40 years upon mutual agreement of both parties. The lease generally provide for afixed monthly rent and a certain percentage of gross rental revenue per month.(see Notes 11 and 29)
d. Notes receivable pertains to housing, car, salary and other loans granted to the ParentCompany’s officers and employees which are collectible through salary deduction, bears6% interest p.a. and have various maturity dates ranging from 2020 to 2040 (see Note 6).
e. Compensation of key management personnel by benefit type follows:
2020 2019Short-term employee benefits P=192,301,170 P=185,540,295Post-employment benefits (Note 23) 15,496,600 11,622,450
P=207,797,770 P=197,162,745
Key management personnel of the Parent Company include all officers with position of vicepresident and up.
23. Retirement Plan
The Parent Company has funded, noncontributory tax-qualified defined benefit type of retirement plan(the Plan) covering substantially all of its employees. The benefits are based on a defined benefitformula. Latest actuarial valuation report is as of December 31, 2020.
The Plan aims to maintain a full funding, i.e., the Plan’s assets fully covered the Plan’s liabilities, asmeasured through generally accepted actuarial methodologies. Such will provide a higher level ofassurance that all promised benefits can be paid from existing assets and expected investmentreturns.
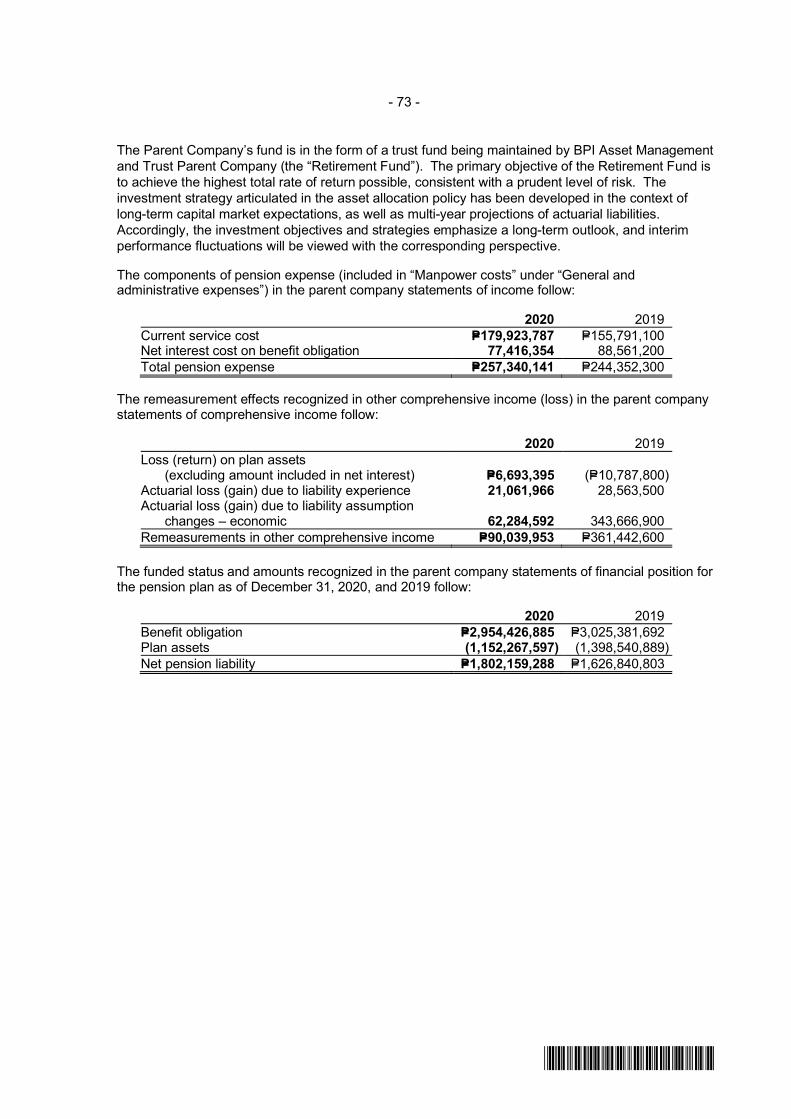
- 73 -
*SGVFSM006234*
The Parent Company’s fund is in the form of a trust fund being maintained by BPI Asset Managementand Trust Parent Company (the “Retirement Fund”). The primary objective of the Retirement Fund isto achieve the highest total rate of return possible, consistent with a prudent level of risk. Theinvestment strategy articulated in the asset allocation policy has been developed in the context oflong-term capital market expectations, as well as multi-year projections of actuarial liabilities.Accordingly, the investment objectives and strategies emphasize a long-term outlook, and interimperformance fluctuations will be viewed with the corresponding perspective.
The components of pension expense (included in “Manpower costs” under “General andadministrative expenses”) in the parent company statements of income follow:
2020 2019Current service cost P=179,923,787 P=155,791,100Net interest cost on benefit obligation 77,416,354 88,561,200Total pension expense P=257,340,141 P=244,352,300
The remeasurement effects recognized in other comprehensive income (loss) in the parent companystatements of comprehensive income follow:
2020 2019Loss (return) on plan assets (excluding amount included in net interest) P=6,693,395 (P=10,787,800)Actuarial loss (gain) due to liability experience 21,061,966 28,563,500Actuarial loss (gain) due to liability assumption
changes – economic 62,284,592 343,666,900Remeasurements in other comprehensive income P=90,039,953 P=361,442,600
The funded status and amounts recognized in the parent company statements of financial position forthe pension plan as of December 31, 2020, and 2019 follow:
2020 2019Benefit obligation P=2,954,426,885 P=3,025,381,692Plan assets (1,152,267,597) (1,398,540,889)Net pension liability P=1,802,159,288 P=1,626,840,803
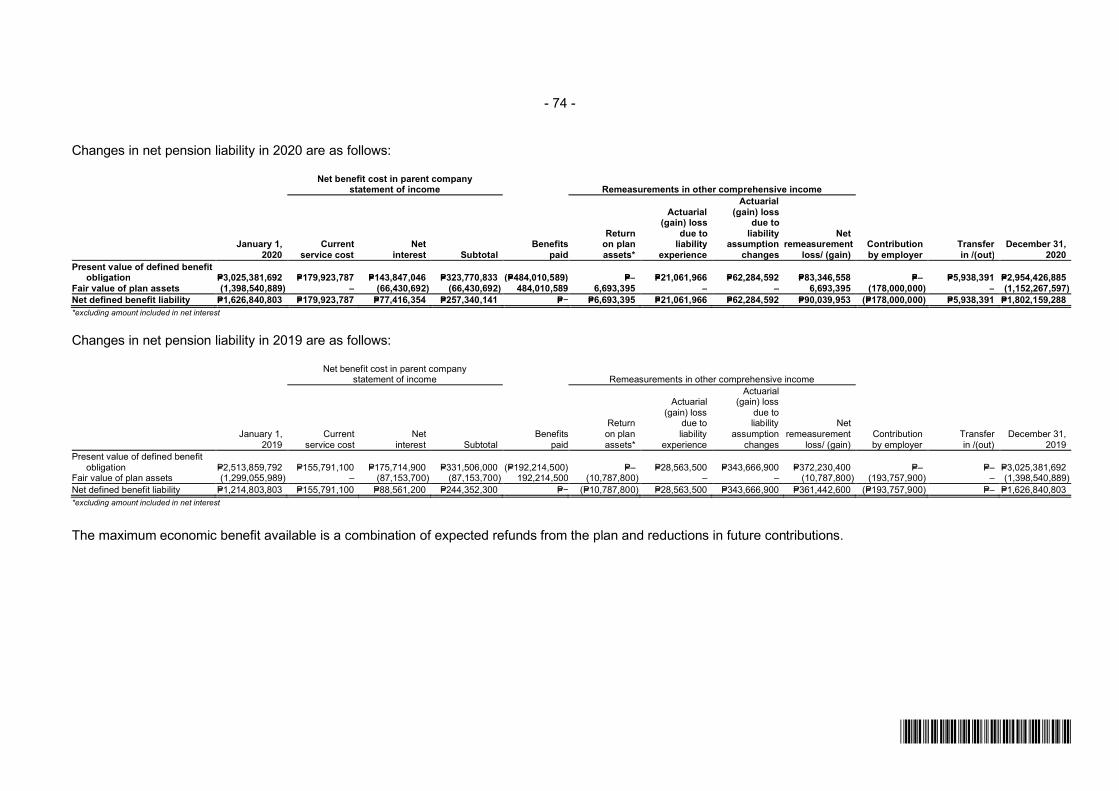
- 74 -
*SGVFSM006234*
Changes in net pension liability in 2020 are as follows:
Net benefit cost in parent companystatement of income Remeasurements in other comprehensive income
January 1,2020
Currentservice cost
Netinterest Subtotal
Benefitspaid
Returnon planassets*
Actuarial(gain) loss
due toliability
experience
Actuarial(gain) loss
due toliability
assumptionchanges
Netremeasurement
loss/ (gain)Contributionby employer
Transferin /(out)
December 31,2020
Present value of defined benefitobligation P=3,025,381,692 P=179,923,787 P=143,847,046 P=323,770,833 (P=484,010,589) P=– P=21,061,966 P=62,284,592 P=83,346,558 P=– P=5,938,391 P=2,954,426,885
Fair value of plan assets (1,398,540,889) – (66,430,692) (66,430,692) 484,010,589 6,693,395 – – 6,693,395 (178,000,000) – (1,152,267,597)Net defined benefit liability P=1,626,840,803 P=179,923,787 P=77,416,354 P=257,340,141 P=− P=6,693,395 P=21,061,966 P=62,284,592 P=90,039,953 (P=178,000,000) P=5,938,391 P=1,802,159,288*excluding amount included in net interest
Changes in net pension liability in 2019 are as follows:
Net benefit cost in parent companystatement of income Remeasurements in other comprehensive income
January 1,2019
Currentservice cost
Netinterest Subtotal
Benefitspaid
Returnon planassets*
Actuarial(gain) loss
due toliability
experience
Actuarial(gain) loss
due toliability
assumptionchanges
Netremeasurement
loss/ (gain)Contributionby employer
Transferin /(out)
December 31,2019
Present value of defined benefitobligation P=2,513,859,792 P=155,791,100 P=175,714,900 P=331,506,000 (P=192,214,500) P=– P=28,563,500 P=343,666,900 P=372,230,400 P=– P=– P=3,025,381,692
Fair value of plan assets (1,299,055,989) – (87,153,700) (87,153,700) 192,214,500 (10,787,800) – – (10,787,800) (193,757,900) – (1,398,540,889)Net defined benefit liability P=1,214,803,803 P=155,791,100 P=88,561,200 P=244,352,300 P=− (P=10,787,800) P=28,563,500 P=343,666,900 P=361,442,600 (P=193,757,900) P=– P=1,626,840,803*excluding amount included in net interest
The maximum economic benefit available is a combination of expected refunds from the plan and reductions in future contributions.
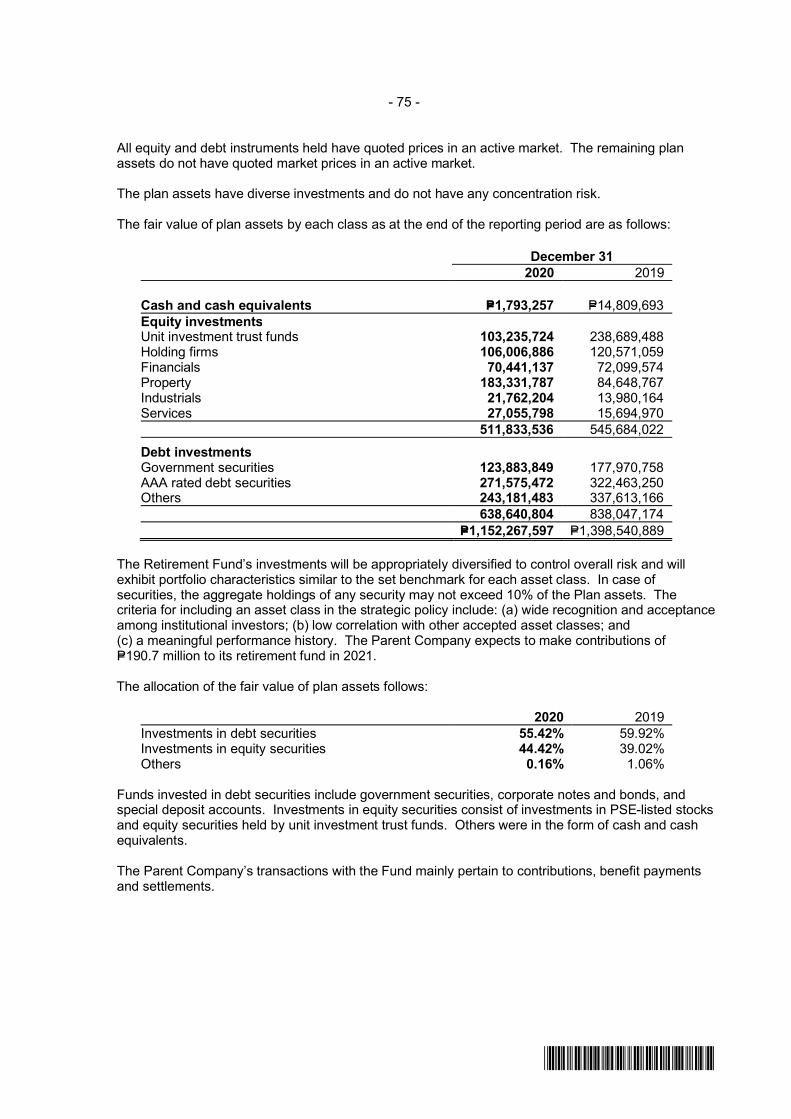
- 75 -
*SGVFSM006234*
All equity and debt instruments held have quoted prices in an active market. The remaining planassets do not have quoted market prices in an active market.
The plan assets have diverse investments and do not have any concentration risk.
The fair value of plan assets by each class as at the end of the reporting period are as follows:
December 312020 2019
Cash and cash equivalents P=1,793,257 P=14,809,693Equity investmentsUnit investment trust funds 103,235,724 238,689,488Holding firms 106,006,886 120,571,059Financials 70,441,137 72,099,574Property 183,331,787 84,648,767Industrials 21,762,204 13,980,164Services 27,055,798 15,694,970
511,833,536 545,684,022Debt investmentsGovernment securities 123,883,849 177,970,758AAA rated debt securities 271,575,472 322,463,250Others 243,181,483 337,613,166
638,640,804 838,047,174P=1,152,267,597 P=1,398,540,889
The Retirement Fund’s investments will be appropriately diversified to control overall risk and willexhibit portfolio characteristics similar to the set benchmark for each asset class. In case ofsecurities, the aggregate holdings of any security may not exceed 10% of the Plan assets. Thecriteria for including an asset class in the strategic policy include: (a) wide recognition and acceptanceamong institutional investors; (b) low correlation with other accepted asset classes; and(c) a meaningful performance history. The Parent Company expects to make contributions ofP=190.7 million to its retirement fund in 2021.
The allocation of the fair value of plan assets follows:
2020 2019Investments in debt securities 55.42% 59.92%Investments in equity securities 44.42% 39.02%Others 0.16% 1.06%
Funds invested in debt securities include government securities, corporate notes and bonds, andspecial deposit accounts. Investments in equity securities consist of investments in PSE-listed stocksand equity securities held by unit investment trust funds. Others were in the form of cash and cashequivalents.
The Parent Company’s transactions with the Fund mainly pertain to contributions, benefit paymentsand settlements.

- 76 -
*SGVFSM006234*
As of December 31, 2020 and 2019, the funds include investment in securities of its related parties.Details of the investment per type of security are as follows:
December 31, 2020December 31,
2019Carrying
ValueFair
ValueUnrealized
(Gain) LossFair
Value(In Thousands)
Investments in debt securities P=611,775 P=638,641 (P=26,866) P=838,047Investments in equity securities 521,183 511,834 9,349 545,684Others 1,793 1,793 – 14,810
P= 1,134,751 P= 1,152,268 (P=17,517) P=1,398,541
The plan assets include shares of stock of the Parent Company with fair value amounting toP=40.6 million and P=38.6 million as of December 31, 2020 and 2019, respectively. It also includesshares of stocks of related parties within the AC Group with fair value amounting toP=67.2 million and P=58.7 million as of December 31, 2020 and 2019, respectively. The ParentCompany gives the trustee bank the discretion to exercise voting rights over the shares. The planassets include debt securities of the Parent Company amounting to P=68.4 million and P=66.8 million asof December 31, 2020, and 2019, respectively. The fund incurred in P=1.4 million in 2020 and nil2019.
The cost of defined benefit pension plans and other post-employment medical benefits as well as thepresent value of the pension liabilities are determined using actuarial valuations. The actuarialvaluation involves making various assumptions. The principal assumptions used in determiningpension and post-employment medical benefit obligations for the defined benefit plans are shownbelow:
2020 2019Discount rate 4.50% 4.75%Future salary increases 6.00% 6.00%
The sensitivity analysis below has been determined based on reasonably possible changes of eachsignificant assumption on the defined benefit obligation as of the end of the reporting period,assuming all other assumptions were held constant:
2020Effect on Defined Benefit Obligation
Increase (decrease)
Change in basis points+ 100 basis
points- 100 basis
PointsDiscount rate (P=232,625,961) P=292,139,578Salary increase rate 271,079,578 (223,166,870)
2019Effect on Defined Benefit Obligation
Increase (decrease)
Change in basis points+ 100 basis
points- 100 basis
PointsDiscount rate (P=155,807,157) P=174,867,062Salary increase rate 171,539,142 (155,807,157)
Shown below is the maturity analysis of the undiscounted benefit payments:
Year ending: 2020 20191 year and less P=153,845,133 P=600,571,900More than 1 year to 5 years 705,085,656 1,463,316,700More than 5 years to 10 years 2,150,238,391 1,550,836,700More than 10 years 7,752,579,205 –

- 77 -
*SGVFSM006234*
The average duration of the defined benefit obligation as at December 31, 2020 and 2019 is14.0 years and 9.0 years, respectively.
24. Earnings Per Share
The following tables present information necessary to compute EPS:
2020 2019Net income P=14,624,811,526 P=13,225,107,412Less: dividends on preferred stock (62,037,888) (62,037,888)Net income P=14,562,773,638 P=13,163,069,524Weighted average number of common shares for
basic EPS 14,721,233,934 14,732,795,752Add: dilutive shares arising from stock options 2,296,217 344,196Adjusted weighted average number of common
shares for diluted EPS 14,723,530,151 14,733,139,948Basic and diluted EPS P=0.99 P=0.89
Basic EPS is computed by dividing net income for the year attributable to common equity holders ofthe Parent Company by the weighted average number of common shares issued and outstandingduring the year adjusted for any subsequent stock dividends declared.
Diluted EPS is computed by dividing net income for the year attributable to common equity holders ofthe Parent Company by the weighted average number of common shares issued and outstandingduring the year plus the weighted average number of common shares that would be issued onconversion of all the dilutive potential common shares into common shares. The calculation of dilutedearnings per share does not assume conversion, exercise, or other issue of potential common sharesthat would have an antidilutive effect on earnings per share.
The convertibility of the preferred shares will start on the 10th year from the issue date which wasin 2012. This has an antidilutive effect on the computation of diluted EPS.
25. Stock Options and Ownership Plans
The Parent Company has stock option plans for key employees covering 2.5% of the ParentCompany’s authorized capital stock. The grantee is selected based on certain criteria likeoutstanding performance over a three-year period.
ESOWNIn November 2001, the Parent Company offered all its ESOWN subscribers with outstanding ESOWNsubscriptions the option to cancel the subscriptions within the 5-year holding period. InDecember 2001, the program for ESOWN was indefinitely suspended.
In 2005, the Parent Company introduced a revised ESOWN Plan (the Plan) wherein grantees maysubscribe in whole or in part to the shares awarded to them based on a discounted market price thatwas determined by the Compensation Committee as the offer price set at grant date. The granteespaid for the shares subscribed through installments over a maximum period of ten (10) years. Thesubscription is subject to a holding period stated in the plan. To subscribe, the grantee must be anemployee of the Parent Company or any of its subsidiaries during the ten (10)-year payment period.In case the grantee resigns, unsubscribed shares are cancelled, while the subscription may be paidup to the percent of holding period completed and payments may be converted into the equivalentnumber of shares. In case the grantee is separated, not for cause, but through retrenchment andredundancy, subscribed shares may be paid in full, unsubscribed shares may be subscribed, orpayments may be converted into the equivalent number of shares. In case the grantee retires, the
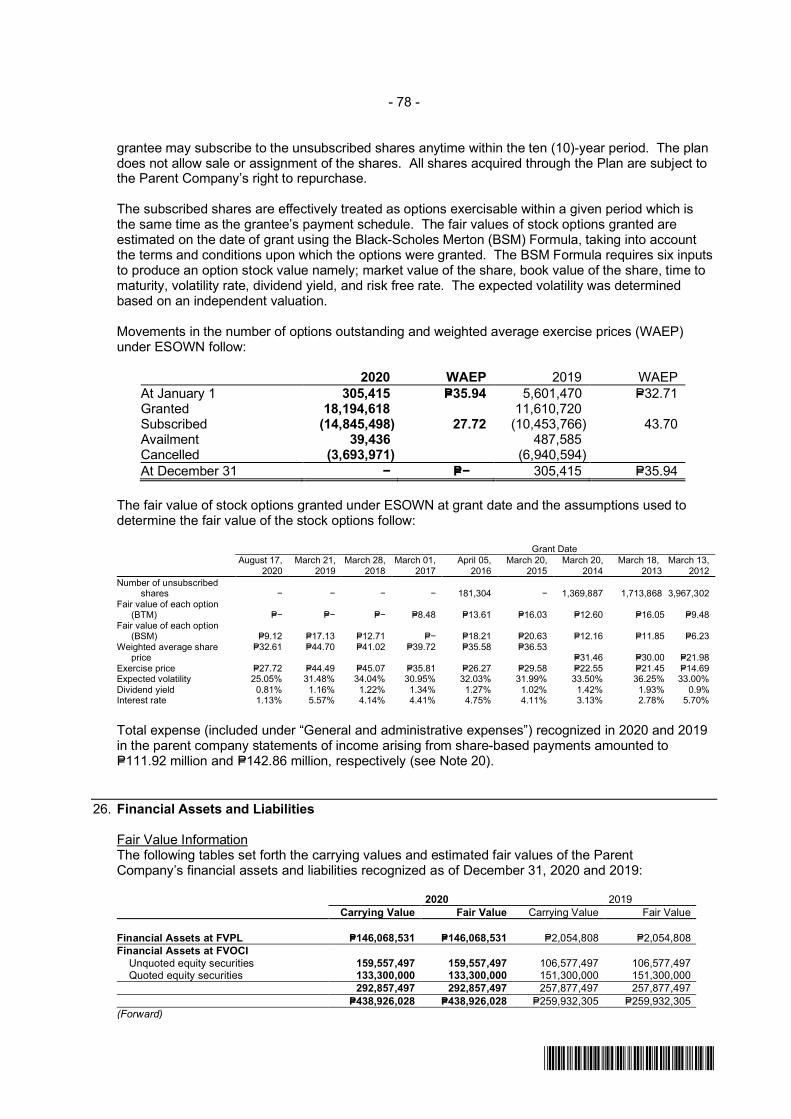
- 78 -
*SGVFSM006234*
grantee may subscribe to the unsubscribed shares anytime within the ten (10)-year period. The plandoes not allow sale or assignment of the shares. All shares acquired through the Plan are subject tothe Parent Company’s right to repurchase.
The subscribed shares are effectively treated as options exercisable within a given period which isthe same time as the grantee’s payment schedule. The fair values of stock options granted areestimated on the date of grant using the Black-Scholes Merton (BSM) Formula, taking into accountthe terms and conditions upon which the options were granted. The BSM Formula requires six inputsto produce an option stock value namely; market value of the share, book value of the share, time tomaturity, volatility rate, dividend yield, and risk free rate. The expected volatility was determinedbased on an independent valuation.
Movements in the number of options outstanding and weighted average exercise prices (WAEP)under ESOWN follow:
2020 WAEP 2019 WAEPAt January 1 305,415 P=35.94 5,601,470 P=32.71Granted 18,194,618 11,610,720Subscribed (14,845,498) 27.72 (10,453,766) 43.70Availment 39,436 487,585Cancelled (3,693,971) (6,940,594)At December 31 − P=− 305,415 P=35.94
The fair value of stock options granted under ESOWN at grant date and the assumptions used todetermine the fair value of the stock options follow:
Grant DateAugust 17,
2020March 21,
2019March 28,
2018March 01,
2017April 05,
2016March 20,
2015March 20,
2014March 18,
2013March 13,
2012Number of unsubscribed
shares − − − − 181,304 − 1,369,887 1,713,868 3,967,302Fair value of each option (BTM) P=− P=− P=− P=8.48 P=13.61 P=16.03 P=12.60 P=16.05 P=9.48Fair value of each option (BSM) P=9.12 P=17.13 P=12.71 P=− P=18.21 P=20.63 P=12.16 P=11.85 P=6.23Weighted average share
priceP=32.61 P=44.70 P=41.02 P=39.72 P=35.58 P=36.53
P=31.46 P=30.00 P=21.98Exercise price P=27.72 P=44.49 P=45.07 P=35.81 P=26.27 P=29.58 P=22.55 P=21.45 P=14.69Expected volatility 25.05% 31.48% 34.04% 30.95% 32.03% 31.99% 33.50% 36.25% 33.00%Dividend yield 0.81% 1.16% 1.22% 1.34% 1.27% 1.02% 1.42% 1.93% 0.9%Interest rate 1.13% 5.57% 4.14% 4.41% 4.75% 4.11% 3.13% 2.78% 5.70%
Total expense (included under “General and administrative expenses”) recognized in 2020 and 2019in the parent company statements of income arising from share-based payments amounted toP=111.92 million and P=142.86 million, respectively (see Note 20).
26. Financial Assets and Liabilities
Fair Value InformationThe following tables set forth the carrying values and estimated fair values of the ParentCompany’s financial assets and liabilities recognized as of December 31, 2020 and 2019:
2020 2019Carrying Value Fair Value Carrying Value Fair Value
Financial Assets at FVPL P=146,068,531 P=146,068,531 P=2,054,808 P=2,054,808Financial Assets at FVOCI
Unquoted equity securities 159,557,497 159,557,497 106,577,497 106,577,497Quoted equity securities 133,300,000 133,300,000 151,300,000 151,300,000
292,857,497 292,857,497 257,877,497 257,877,497P=438,926,028 P=438,926,028 P=259,932,305 P=259,932,305
(Forward)

- 79 -
*SGVFSM006234*
2020 2019Carrying Value Fair Value Carrying Value Fair Value
Financial assets at amortized cost Trade residential development P=16,724,840,972 P=21,109,658,603 P=14,803,725,695 P=17,919,104,955 Receivable from employees 51,628,339 76,279,761 145,838,714 147,874,973
P=16,776,469,311 P=21,185,938,364 P=14,949,564,409 P=18,066,979,928Other Financial Liabilities
Long-term debt P=173,774,356,426 P=182,795,580,701 P=162,679,085,065 P=163,919,747,576Deposits and other noncurrent liabilities 10,610,707,513 9,572,140,131 4,763,274,521 4,628,421,818
P=184,385,063,939 P=192,367,720,832 P=167,442,359,586 P=168,548,169,394
The methods and assumptions used by the Parent Company in estimating the fair value of thefinancial instruments are as follows:
Cash and cash equivalents, current receivables, accounts and other payables, current payables andshort term debt - Carrying amounts approximate fair values due to the relatively short-term maturitiesof these financial instruments.
Financial assets at FVPL - These are investments in fund and treasury bills. Fair value of the funds isbased on net asset values as of reporting dates while fair value of treasury bills is based on BVALreference rates on government securities.
Noncurrent accounts receivable - The fair values of residential accounts receivable, and receivablefrom employees, are based on the discounted value of future cash flows using the applicable rates forsimilar types of instruments. The discount rates used for residential accounts receivable ranged from5.75% to 10.50% and from 6.25% to 12.50% as of December 31, 2020 and 2019, respectively. Thediscount rates used for receivable from employees ranged from 6.00% to 12.00% as of December 31,2020 and 2019.
Financial assets at FVOCI - Fair values are based on quoted prices published in markets.
Financial assets at FVOCI unquoted equity securities - Fair values are based on the latest sellingprice available.
Liabilities - The fair value of noncurrent unquoted instruments are estimated using the discountedcash flow methodology using the Parent Company’s current incremental borrowing rates for similarborrowings with maturities consistent with those remaining for the liability being valued. The discountrates used ranged from 3.18% to 7.50% and 7.28% to 8.79% as of December 31, 2020, and 2019,respectively. The fair value of noncurrent unquoted debt instruments with floating rates are estimatedusing discounted cash flow - last repricing method.
Fair Value HierarchyThe Parent Company uses the following hierarchy for determining and disclosing the fair value of thefinancial instruments by valuation technique:
Level 1: quoted (unadjusted prices) in active markets for identical assets and liabilitiesLevel 2: other techniques for which all inputs which have a significant effect on the recorded fair
value are observable in the market, either directly or indirectlyLevel 3: techniques which use inputs which have a significant effect on the recorded fair value
that are not based on observable market data
The Parent Company categorizes trade receivable, receivable from employees, long-term debt anddeposits and other noncurrent liabilities under Level 3. The fair value of these financial instruments isdetermined by discounting future cash flows using the applicable rates of similar types of instrumentsplus a certain spread. This spread is the unobservable input and the effect of changes to this is thatthe higher the spread, the lower the fair value.
Quoted FVOCI amounting to P=133.3 million and P=151.3 million as of December 31, 2020 and 2019,respectively, were classified under the Level 1 category (see Note 9).

- 80 -
*SGVFSM006234*
Unquoted FVOCI financial assets amounting to P=159.6 million and P=106.6 million as of December 31,2020 and 2019, respectively, were classified under Level 3 (see Note 9).
Investment in UITF amounting to P=10.8 million and P=2.1 million and treasury bills amounting toP=135.3 million and nil as of December 31, 2020, and 2019, respectively were classified under Level 2(see Note 5).
There have been no reclassifications from Level 1 to Level 2 categories in 2020 and 2019.
Financial Risk Management Objectives and PoliciesThe Parent Company’s principal financial instruments comprise cash and cash equivalents, financialassets at FVPL, financial assets at FVOCI quoted and unquoted equity securities, bank loans,corporate notes and bonds. The financial debt instruments were issued primarily to raise financingfor the Parent Company’s operations. The Parent Company has various financial assets such tradereceivables and trade payables which arise directly from the conduct of its operations.
Exposure to liquidity, credit, interest rate, foreign currency risks and equity price arise in the normalcourse of the Parent Company’s business activities. The main objectives of the Parent Company’sfinancial risk management are as follows: to identify and monitor such risks on an ongoing basis; to minimize and mitigate such risks; and to provide a degree of certainty about costs.
The use of derivative financial instruments, if any, is solely for management of the Parent Company’sfinancial risk exposures. It is the Parent Company’s policy not to enter into derivative transactions forspeculative purposes.
The Parent Company’s financing and treasury function operates as a centralized service formanaging financial risks and activities as well as providing optimum investment yield and cost-efficient funding for the Parent Company.
There were no changes in the Parent Company’s financial risk management objectives and policiesin 2020 and 2019.
Liquidity riskLiquidity risk is defined by the Parent Company as the risk of losses arising from funding difficultiesdue to deterioration in market conditions and/or the financial position of the Parent Company thatmake it difficult for the Parent Company to raise the necessary funds or that forces the ParentCompany to raise funds at significantly higher interest rates than usual.
This is also the possibility of experiencing losses due to the inability to sell or convert marketablesecurities into cash immediately or in instances where conversion to cash is possible but at loss dueto wider than normal bid-offer spreads.
The Parent Company employs scenario analysis and contingency planning to actively manage itsliquidity position and guarantee that all operating, investing and financing needs are met. The ParentCompany has come up with a three-layered approach to liquidity through the prudent management ofsufficient cash and cash equivalents, the potential sale of accounts receivables and the maintenanceof short-term revolving credit facilities.
Cash and cash equivalents are maintained at a level that will enable it to fund its general andadministrative expenses as well as to have additional funds as buffer for any opportunities oremergencies that may arise. Management develops viable funding alternatives through a continuousprogram for the sale of its receivables and ensures the availability of ample unused short-termrevolving credit facilities from both local and foreign banks as back-up liquidity.

- 81 -
*SGVFSM006234*
The Parent Company ascertains that its cash is invested in short-term bank placements and specialdeposit accounts, as well as in high-quality and marketable government and corporate securities.
The Parent Company has a total available credit line up to P=84.43 billion and P=68.0 billion withvarious local banks as of December 31, 2020 and 2019, respectively
The table summarizes the maturity profile of the Parent Company’s financial liabilities atDecember 31, 2020 and 2019 based on contractual undiscounted payments:
December 31, 2020
< 1 year 1 to < 5 years > 5 years TotalAccounts and other payables P=68,632,051,800 P=– P=– P=68,632,051,800Short-term debt 6,640,500,000 – – 6,640,500,000Long-term debt 11,144,189,998 116,732,165,597 45,898,000,831 173,774,356,426Deposits and other current
liabilities 14,318,734,314 – – 14,318,734,314Deposits and other noncurrent
liabilities 25,875,052 10,711,643,811 – 10,737,518,863P=100,761,351,164 P=127,443,809,408 P=45,898,000,831 P=274,103,161,403
Interest payable* P=6,840,418,179 P=20,232,674,178 P=11,842,832,108 P=38,915,924,465*includes future interest payment
December 31, 2019
< 1 year 1 to < 5 years > 5 years TotalAccounts and other payables P=73,064,917,964 P=– P=– P=73,064,917,964Short-term debt 15,708,000,000 – – 15,708,000,000Long-term debt 7,188,254,688 71,742,054,000 83,748,776,377 162,679,085,065Deposits and other current
liabilities 12,638,574,167 – – 12,638,574,167Deposits and other noncurrent
liabilities 25,875,052 5,853,415,847 – 5,879,290,899P=108,625,621,871 P=77,595,469,847 P=83,748,776,377 P=269,969,868,095
Interest payable* P=7,097,827,290 P=32,385,722,833 P=7,024,467,623 P=46,508,017,746*includes future interest payment
Cash and cash equivalents and financial assets at FVPL are used for the Parent Company’s liquidityrequirements. Please refer to the terms and maturity profile of these financial statements under thematurity profile of the interest-bearing financial assets and liabilities disclosed in the interest rate risksection. There were no undrawn loan commitments from long-term credit facilities as ofDecember 31, 2020 and 2019.
Credit riskCredit risk is a risk that counterparty will not meet its obligation under its financial instrument orcustomer contract leading to a financial loss.
The Parent Company’s credit risks are primarily attributable to installments receivable, rentalreceivables and other financial assets. To manage credit risks, the Parent Company maintainsdefined credit policies and monitors its exposure to credit risks on a continuous basis.
In respect to installments receivable from the sale of properties, credit risk is managed primarilythrough credit reviews and an analysis of receivables on a continuous basis. The Parent Companyalso undertakes supplemental credit review procedures for certain installment payment structures.The Parent Company’s stringent customer requirements and policies in place contribute to lowercustomer default than its competitors. Customer payments are facilitated through various collectionmodes including the use of postdated checks and auto-debit arrangements. Exposure to bad debts isnot significant as title to real estate properties are not transferred to the buyers until full payment hasbeen made and the requirement for remedial procedures is minimal given the profile of buyers.

- 82 -
*SGVFSM006234*
Credit risk arising from rental income from leasing properties is primarily managed through a tenantselection process. Prospective tenants are evaluated on the basis of payment track record and othercredit information. In accordance with the provisions of the lease contracts, the lessees are requiredto deposit with the Parent Company security deposits and advance rentals which helps reduce theParent Company’s credit risk exposure in case of defaults by the tenants. For existing tenants, theParent Company has put in place a monitoring and follow-up system. Receivables are aged andanalyzed on a continuous basis to minimize credit risk. Regular meetings with tenants are alsoundertaken to provide opportunities for counseling and further assessment of paying capacity.
Other financial assets comprise cash and cash equivalents, excluding cash on hand, financial assetsat FVPL and financial assets at FVOCI. The Parent Company adheres to fixed limits and guidelinesin its dealings with counterparty banks and its investment in financial instruments. Bank limits areestablished on the basis of an internal rating system that principally covers the areas of liquidity,capital adequacy and financial stability. The rating system likewise makes use of availableinternational credit ratings. Given the high credit standing of its accredited counterparty banks,management does not expect any of these financial institutions to fail in meeting their obligations.Nevertheless, the Parent Company closely monitors developments over counterparty banks andadjusts its exposure accordingly while adhering to pre-set limits.
The Parent Company’s maximum exposure to credit risk as of December 31, 2020 and 2019 is equalto the carrying values of its financial assets.
Given the Parent Company’s diverse base of counterparties, it is not exposed to large concentrationsof credit risk.
An impairment analysis is performed at each reporting date using a provision matrix to measureexpected credit losses. The provision rate based on days past due of all customers as they havesimilar loss patterns. Generally, trade receivables are written off if past due for more than one yearand are not subject to enforcement activity. The security deposits and advance rental are consideredin the calculation of impairment as recoveries. As of December 31, 2020 and 2019, the exposure atdefault amounts to P=3,608.5 million and P=1,942.1 million, respectively. The expected credit loss ratesare 2.6% and 1.5% that resulted in the ECL of P=413.0 million and P=214.0 million as of December 31,2020 and December 31, 2019, respectively.

- 83 -
*SGVFSM006234*
As of December 31, 2020 and 2019, the aging analysis of past due but not impaired trade receivables presented per class, is as follows:
2020Neither
Past Due Past Due but not Impairednor Impaired 30 days 30-60 days 60-90 days 90-120 days 120 days Total Impaired Total
TradeResidential, commercial and
office development ₱34,156,663,616 ₱519,163,383 ₱412,558,217 ₱252,225,208 ₱660,973,691 ₱2,638,376,172 ₱4,483,296,671 ₱− ₱38,639,960,287Corporate business 556,866,027 1,858,601 41,999,180 4,720,950 80,615,903 98,772,358 227,966,992 136,494,700 921,327,719Shopping centers 455,531,645 8,185,166 6,945,047 8,691,563 12,382,189 117,415,047 153,619,012 201,885,468 811,036,125Others 1,899,271,418 − − − − − − − 1,899,271,418
Receivable from related parties 59,661,105,816 − − − − − − − 59,661,105,816Advances to other companies 13,857,172,542 − − − − − − 74,664,799 13,931,837,341Dividends receivable 1,347,983,753 − − − − − − − 1,347,983,753Receivable from employees 169,419,494 − − − − − − − 169,419,494Interest receivable 12,557,298 − − − − − − − 12,557,298
₱112,116,571,609 ₱529,207,150 ₱461,502,444 ₱265,637,721 ₱753,971,783 ₱2,854,563,577 ₱4,864,882,675 ₱413,044,967 ₱117,394,499,251
2019Neither
Past Due Past Due but not Impairednor Impaired 30 days 30-60 days 60-90 days 90-120 days 120 days Total Impaired Total
TradeResidential, commercial and
office development P=36,785,717,839 P=380,235,370 P=325,329,269 P=205,623,560 P=249,319,563 P=1,532,365,289 P=2,692,873,051 P=− P=39,478,590,890 Corporate business 532,385,503 7,179,063 18,634,882 491,231 54,129,873 46,425,406 126,860,455 114,287,589 773,533,547 Shopping centers 314,737,288 14,099,576 7,568,378 51,291,757 4,579,300 55,319,709 132,858,720 41,565,700 489,161,708 Others 1,837,546,247 − − − − − − − 1,837,546,247Receivable from related parties 55,068,731,831 − − − − − − − 55,068,731,831Advances to other companies 12,897,920,872 − − − − − − 58,164,799 12,956,085,671Dividends receivable 1,819,517,787 − − − − − − − 1,819,517,787Receivable from employees 167,019,787 − − − − − − − 167,019,787Interest receivable 12,707,620 − − − − − − − 12,707,620
P=109,436,284,774 P=401,514,009 P=351,532,529 P=257,406,548 P=308,028,736 P=1,634,110,404 P=2,952,592,226 P=214,018,088 P=112,602,895,088

- 84 -
*SGVFSM006234*
The table below shows the credit quality of the Parent Company’s financial assets as of December 31, 2020 and 2019:
December 31, 2020
Neither Past Due nor Impaired Past Due butHigh Grade Medium Grade Low Grade Unrated Total not Impaired Impaired Total
Cash and cash equivalents (excluding cashon hand) P=1,122,935,936 P=– P=– P=– P=1,122,935,936 P=– P=– P=1,122,935,936
Financial asset at FVPL 146,068,531 – – – 146,068,531 – – 146,068,531Accounts and notes receivables Trade Residential, commercial and office
Development 34,156,663,616 – – – 34,156,663,616 4,483,296,671 − 38,639,960,287 Corporate business 556,866,027 – – – 556,866,027 227,966,992 136,494,700 921,327,719 Shopping centers 284,419,516 171,112,129 – – 455,531,645 153,619,012 201,885,468 811,036,125 Others 1,899,271,418 – – – 1,899,271,418 – – 1,899,271,418 Receivable from related parties 59,661,105,816 – – – 59,661,105,816 – – 59,661,105,816 Advances to other companies 13,857,172,542 – – – 13,857,172,542 – 74,664,799 13,931,837,341 Dividends receivable 1,347,983,753 – – – 1,347,983,753 – – 1,347,983,753 Receivable from employees 169,419,494 – – – 169,419,494 – – 169,419,494 Interest receivable 12,557,298 – – – 12,557,298 – – 12,557,298Financial Assets at Fair Value through OCI Unquoted – – – 159,557,497 159,557,497 – − 159,557,497 Quoted 133,300,000 – – – 133,300,000 – – 133,300,000
P=113,347,763,947 P=171,112,129 P=– P=159,557,497 P=113,678,433,573 P=4,864,882,675 P=413,044,967 P=118,956,361,215

- 85 -
*SGVFSM006234*
December 31, 2019
Neither Past Due nor Impaired Past Due butHigh Grade Medium Grade Low Grade Unrated Total not Impaired Impaired Total
Cash and cash equivalents (excluding cashon hand) P=1,845,768,870 P=– P=– P=– P=1,845,768,870 P=– P=– P=1,845,768,870
Financial asset at FVPL 2,054,808 – – – 2,054,808 – – 2,054,808Accounts and notes receivables Trade Residential, commercial and office
Development 36,785,717,839 – – – 36,785,717,839 2,692,873,051 – 39,478,590,890 Corporate business 532,385,503 – – – 532,385,503 126,860,455 114,287,589 773,533,547 Shopping centers 270,858,818 43,878,470 – – 314,737,288 132,858,720 41,565,700 489,161,708 Others 1,837,546,247 – – – 1,837,546,247 – – 1,837,546,247 Receivable from related parties 55,068,731,831 – – – 55,068,731,831 – – 55,068,731,831 Advances to other companies 12,897,920,872 – – – 12,897,920,872 – 58,164,799 12,956,085,671 Dividends receivable 1,819,517,787 – – – 1,819,517,787 – – 1,819,517,787 Receivable from employees 167,019,787 – – – 167,019,787 – – 167,019,787 Interest receivable 12,707,620 – – – 12,707,620 – – 12,707,620Financial Assets at Fair Value through OCI Unquoted – – – 106,577,497 106,577,497 – − 106,577,497 Quoted 151,300,000 – – – 151,300,000 – – 151,300,000
P=111,391,529,982 P=43,878,470 P=– P=106,577,497 P=111,541,985,949 P=2,952,592,226 P=214,018,088 P=114,708,596,263

- 86 -
*SGVFSM006234*
The credit quality of the financial assets was determined as follows:
Cash and cash equivalents, financial assets at FVPL, and financial assets at FVOCI quoted securities- based on the nature of the counterparty and the Parent Company’s internal rating system.
Receivables - high grade pertains to receivables with no default in payment; medium grade pertainsto receivables with up to three (3) defaults in payment in the past; and low grade pertains toreceivables with more than three (3) defaults in payment.
The unquoted financial assets at FVOCI are unrated.
Interest rate riskInterest rate risk is the risk that the fair value or future cash flows of a financial instrument willfluctuate because of changes in market interest rates.
The Parent Company’s interest rate risk management policy centers on reducing the overall interestexpense and exposure to changes in interest rates. Changes in market interest rates relate primarilyto the Parent Company’s interest-bearing debt obligations with floating interest rate as it can cause achange in the amount of interest payments.
The Parent Company manages its interest rate risk by leveraging on its premier credit rating andincreasing the fixed interest component of its debt portfolio. The Parent Company’s ratio of fixed tofloating rate debt stood at 96:4 and 91:9 as of December 31, 2020 and 2019.
The following tables demonstrate the sensitivity of the Parent Company’s income before income taxand equity to a reasonably possible change in interest rates on December 31, 2020 and 2019, with allvariables held constant, (through the impact of floating rate borrowings):
2020Effect on income before income tax
Change in basis points+100 basis points -100 basis points
Floating rate borrowings (P=66,405,000) P=66,405,000
2019Effect on income before income tax
Change in basis points+100 basis points -100 basis points
Floating rate borrowings (P=157,080,000) P=157,080,000
The assumed change in rate is based on the currently observable market environment. There is noother impact on the Parent Company’s equity other than those already affecting the net income.

- 87 -
*SGVFSM006234*
The terms and maturity profile of the interest-bearing financial assets and liabilities, together with its corresponding nominal amounts and carrying values are shown in thefollowing tables:
2020
Interest terms (p.a.) Rate Fixing Period Nominal Amount < 1 year 1 to 5 years > 5 years Carrying ValueCash and cash
equivalents (excludingcash on hand)
Fixed at the date ofinvestment Various P=1,122,935,936 P=1,122,935,936 P=– P=– P=1,122,935,936
Accounts and notesreceivable Fixed at the date of sale Date of sale 169,419,494 117,791,155 51,628,339 169,419,494
P=1,292,355,430 P=1,240,727,091 P=51,628,339 P=− P=1,292,355,430Short-term debtFloating-Peso Variable Monthly P=6,640,500,000 P=6,640,500,000 P=– P=– P=6,640,500,000Long-term debtFixed Peso Fixed at 6.0000% 10 years 5,650,000,000 − 5,650,000,000 − 5,650,000,000 Peso Fixed at 5.0% to 6.0% 10.5 and 20 years 17,000,000,000 − 14,966,061,554 1,986,730,081 16,952,791,635 Peso Fixed at 5.6250% 11 years 8,000,000,000 – 7,968,512,470 − 7,968,512,470 Peso Fixed at 4.5000% 7 years 7,000,000,000 − 6,987,688,059 − 6,987,688,059 Peso Fixed at 5.6250% to 7.5% 5, 10 and 15 years 950,000,000 9,322,174 936,777,680 − 946,099,854 Peso Fixed at 4.50 to 6.307% Up to 10.5 years 45,930,039,062 2,353,240,026 17,269,507,000 26,052,000,000 45,674,747,026 Peso Fixed at 3.8915 to 4.85% 7, 9.5 and 10 years 22,000,000,000 – 21,912,113,000 − 21,912,113,000 Peso Fixed at 5.2624% 10 years 7,000,000,000 – – 6,979,065,066 6,979,065,066 Peso Fixed at 5.9203% 10 years 10,000,000,000 – – 9,916,583,476 9,916,583,476 Peso Fixed at 7.0239% 5 years 8,000,000,000 – 7,962,716,634 − 7,962,716,634 Peso Fixed at 3.1764% to 3.187% 5 years 6,002,875,000 – 6,002,875,000 − 6,002,875,000 Peso Fixed at 4.2463% to 6.369% 2, 5, 7 and 7.25 years 21,000,000,000 8,781,627,798 10,912,739,455 963,622,207 20,657,989,460
Fixed at 3.00% to 3.86% 2 and 5 years 16,250,000,000 – 16,163,174,746 − 16,163,174,746P=181,423,414,062 P=17,784,689,998 P=116,732,165,598 P=45,898,000,830 P=180,414,856,426

- 88 -
*SGVFSM006234*
2019
Interest terms (p.a.) Rate Fixing Period Nominal Amount < 1 year 1 to 5 years > 5 years Carrying ValueCash and cash equivalents
(excluding cash on hand)Fixed at the date of investment Various P=1,845,768,870 P=1,845,768,870 P=– P=– P=1,845,768,870Accounts and notes
receivable Fixed at the date of sale Date of sale 167,019,787 21,181,073 145,838,714 – 167,019,787P=2,012,788,657 P=1,866,949,943 P=145,838,714 P=– P=2,012,788,657
Short-term debtFloating-Peso Variable Monthly P=15,708,000,000 P=15,708,000,000 P=– P=– P=15,708,000,000Long-term debtFixed Peso Fixed at 6.0000% 10 years 5,650,000,000 − 5,645,303,849 – 5,645,303,849 Peso Fixed at 4.6250% to 6.0000% 7,10 and 20 years 21,000,000,000 4,000,000,000 14,931,968,181 1,985,275,846 20,917,244,027 Peso Fixed at 5.6250% 11 years 8,000,000,000 – – 7,952,879,530 7,952,879,530 Peso Fixed at 4.5000% 7 years 7,000,000,000 – 6,968,807,211 – 6,968,807,211 Peso Fixed at 5.6250% to 7.5% 5, 10 and 15 years 960,000,000 10,000,000 39,763,544 905,696,499 955,460,043 Peso Fixed at 4.50 to 6.307% Up to 10.5 years 46,635,093,750 3,178,254,688 11,098,312,484 32,196,331,738 46,472,898,910 Peso Fixed at 3.8915 to 4.85% 7, 9.5 and 10 years 22,000,000,000 – 6,961,630,823 14,902,377,056 21,864,007,879 Peso Fixed at 5.2624% 10 years 7,000,000,000 – – 6,972,611,037 6,972,611,037 Peso Fixed at 5.9203% 10 years 10,000,000,000 – – 9,896,154,193 9,896,154,193 Peso Fixed at 7.0239% 5 years 8,000,000,000 – 7,925,898,274 – 7,925,898,274 Peso Fixed at 3.1764% to 3.187% 5 years 6,329,375,000 – 6,329,375,000 – 6,329,375,000 Peso Fixed at 4.2463% to 6.369% 2, 5, 7 and 7.25 years 21,000,000,000 – 11,840,994,634 8,937,450,478 20,778,445,112
P=179,282,468,750 P=22,896,254,688 P=71,742,054,000 P=83,748,776,377 P=178,387,085,065

- 89 -
*SGVFSM006234*
Foreign currency riskForeign currency risk is the risk that the fair value or future cash flows of a financial instrument willfluctuate because of changes in foreign exchange rates.
Financial assets and credit facilities of the Parent Company, as well as major contracts enteredinto for the purchase of raw materials, are mainly denominated in Philippine Peso. As such, theParent Company’s foreign currency risk is minimal.
The following table shows the Parent Company’s foreign currency-denominated monetary assetsand liabilities and their peso equivalents as of December 31, 2020 and 2019:
2020 2019US Dollar Php Equivalent US Dollar Php Equivalent
Financial AssetsCash and cash equivalents $504,824 P=24,243,151 $1,016,759 P=51,483,569Financial LiabilitiesLong-term debt 125,000,000 6,002,875,000 125,000,000 6,329,375,000
$125,000,000 P=6,002,875,000 $125,000,000 P=6,329,375,000Net foreign currency-denominated
assets/(liabilities) ($124,495,176) (P=5,978,631,849) ($123,983,241) (P=6,277,891,431)
In translating the foreign currency-denominated monetary assets in peso amounts, the exchangerate used were P=48.02 to US$1.00 and P=50.64 to US$1.00, the Philippine Peso - USD exchangerates as of December 31, 2020 and 2019, respectively.
The following table demonstrates the sensitivity to a reasonably possible change in the PhilippinePeso - U.S. Dollar exchange rate, with all variables held constant, of the Parent Company’s profitbefore tax (due to changes in the fair value of monetary assets and liabilities).
Increase (decrease) Effect on profit before taxin exchange rate 2020 2019P=1.00 (P=124,495,176) (P=123,983,241) (1.00) 124,495,176 123,983,241
There is no impact on the Parent Company’s equity other than those already affecting net income.
Equity price riskQuoted financial assets are acquired at a certain price in the market. Such investment securitiesare subject to price risk due to changes in market values of instruments arising either from factorsspecific to individual instruments or their issuers or factors affecting all instruments traded in themarket. Depending on several factors such as interest rate movements, country’s economicperformance, political stability, domestic inflation rates, these prices change, reflecting howmarket participants view the developments.
The Parent Company’s market risk policy requires it to manage such risks by setting andmonitoring objectives and constraints on investments; diversification plan; limits on investment ineach country, sector and market.

- 90 -
*SGVFSM006234*
The analysis below demonstrates the sensitivity to a reasonably possible change of market indexwith all other variables held constant, of the Parent Company’s equity.
Effect on equityIncrease (decrease)
Change in PSEi index 2020 2019
+5% P=323,815 P=227,854 -5% (323,815) (227,854)
Quoted financial assets at FVPL pertain to investment in UITF (Fund). The Fund, which isstructured as a money market UITF, aims to generate liquidity and stable income by investing in adiversified portfolio of primarily short-term fixed income instruments.
As of December 31, 2020 and 2019, the Parent Company's investment in the fund where all othervariables held constant, the fair value, net income and equity will increase (decrease) by: (i) BPIUITF Money Market P=23,698 with a duration of 0.70 year and P=7,397 with a duration of 0.36 year,respectively; (ii) BPI UITF Short Term P60,548 with a duration of 0.84 year and nil, respectively;(iii) Chinabank UITF Short Term P=844 with a duration of 0.51 year and nil respectively, for a 100basis points decrease (increase), in interest rates.
27. Segment Information
The industry segments where the Parent Company operates follow:
Core business: Residential developments - sale of high-end and upper middle-income residential lots and
units, and leisure community developments; lease of residential developments under jointventure; acquisition, development and sale of large-scale, mixed-use, master-plannedcommunities; sale of override units or the Parent Company’s share in properties madeavailable to subsidiaries for development.
Shopping centers - development of shopping centers and lease to third parties of retail spaceand land therein; operation of movie theaters, food courts, entertainment facilities andcarparks in these shopping centers; management and operation of malls which are co-ownedwith partners
Corporate business - development and lease of office buildings Corporate - company-wide activities not catering to specific business units
Support Business: Property management - facilities management of the Parent Company
Assets, liabilities, revenues and expenses of the Strategic Landbank Management and Visayas-Mindanao segment were reallocated to other business segments namely, shopping centers,corporate businesses and residential developments according to the nature of the products andservices provided.
Management committee monitors the operating results of its business units separately for thepurpose of making decisions about resource allocation and performance assessment.
For the years ended December 31, 2020 and 2019, there were no revenue transactions with asingle external customer which accounted for 10% or more of the consolidated revenue fromexternal customers.

- 91 -
*SGVFSM006234*
Business segmentsThe following tables regarding business segments present assets and liabilities as of December 31 and revenue and profit information for the years ended December 31(in millions):
2020
PropertyDevelopment Shopping Centers Offices
PropertyManagement and
Others Corporate TotalRevenueRevenues from contracts with customers P=14,576 P=288 P=206 P=1,606 − P=16,676Interest income from real estate sales 3,701 − − − − 3,701Rental income 12 989 2,076 3 3 3,083Total revenue 18,289 1,277 2,282 1,609 3 23,460Real estate costs and expenses 10,976 624 616 7 (228) 11,995
Operating profit 7,313 653 1,666 1,602 231 11,465General and administrative expenses (523) (423) (240) (48) (495) (1,729)Interest expense and other financing charges (1,327) (6) (325) − (10,337) (11,995)Interest income 1 1 136 − 657 795Other income 96 47 8,165 − 227 8,535Dividend income − − − − 7,634 7,634Other charges and expenses (242) (160) (22) − − (424)Provision for income tax − − − − 344 344Net income P=5,318 P=112 P=9,380 P=1,554 (P=1,739) P=14,625Other InformationSegment assets P=171,339 P=93,299 P=67,732 P=48,774 P=47,347 P=428,491Deferred tax assets − − − − 1,963 1,963Total assets P=171,339 P=93,299 P=67,732 P=48,774 P=49,310 P=430,454Segment liabilities (P=63,049) (P=77,696) (P=34,861) (P=75,505) (P=37,939) (P=289,050)Segment additions to:Property and equipment P=30 P=1,049 P=18 P=− P=58 P=1,155Investment properties 434 1,160 8,357 − 1,873 11,824Depreciation and amortization P=51 P=689 P=425 P=3 P=110 P=1,278Non-cash expenses other than depreciation and amortization P=− P=− P=− P=− P=− P=−Impairment losses P=− P=160 P=22 P=17 P=225 P=424

- 92 -
*SGVFSM006234*
2019
PropertyDevelopment Shopping Centers Offices
Property Managementand Others Corporate Total
RevenueRevenues from contracts with customers P=28,205 P=625 P=237 P=3,466 P=− P=32,533Interest income from real estate sales 3,413 − − − − 3,413Rental income 27 1,886 2,185 9 − 4,107Total revenue 31,645 2,511 2,422 3,475 − 40,053Real estate costs and expenses (20,954) (1,371) (411) (11) (921) (23,668)
Operating profit 10,691 1,140 2,011 3,464 (921) 16,385General and administrative expenses (582) (462) (177) (58) (744) (2,023)Interest expense and other financing charges (393) (47) (232) – (9,674) (10,346)Interest income 3 – 5 – 522 530Other income 362 139 177 – 250 928Dividend income – – – – 9,413 9,413Other charges and expenses – – (43) − – (43)Provision for income tax – – – – (1,619) (1,619)Net income P=10,081 P=770 P=1,741 P=3,406 (P=2,773) P=13,225Other InformationSegment assets P=162,352 P=100,024 P=54,861 P=51,327 P=45,235 P=413,799Deferred tax assets – – – – 1,240 1,240Total assets P=162,352 P=100,024 P=54,861 P=51,327 P=46,475 P=415,039Segment liabilities (P=59,111) (P=84,433) (P=35,978) (P=74,771) (P=29,918) (P=284,211)Segment additions to:Property and equipment P=47 P=450 P=37 P=– P=113 P=647Investment properties 985 1,262 2,925 958 2,151 8,281Depreciation and amortization P=51 P=710 P=457 P=3 P=111 P=1332Non-cash expenses other than depreciation and amortization P=− P=− P=− P=− P=− P=−Impairment losses P=− P=− P=− P=− P=43 P=43

- 93 -
*SGVFSM006234*
28. Performance Obligations
Information about the Parent Company’s performance obligations are summarized below:
Real estate salesThe Parent Company entered into contracts to sell with one identified performance obligation which isthe sale of the real estate unit together with the services to transfer the title to the buyer upon fullpayment of contract price. The amount of consideration indicated in the contract to sell is fixed andhas no variable consideration.
The sale of real estate unit may cover the contract for either the (i) serviced lot; (ii) service lot andhouse, and (ii) condominium unit and the Parent Company concluded that there is one performanceobligation in each of these contracts. The Parent Company recognizes revenue from the sale of thesereal estate projects under pre-completed contract over time during the course of the construction.
Payment commences upon signing of the contract to sell and the consideration is payable in cash orunder various financing schemes entered with the customer. The financing scheme would includepayment of 10% of the contract price spread over a certain period (e.g., one to two years) at a fixedmonthly payment with the remaining balance payable (a) in full at the end of the period either throughcash or external financing; or (b) through in-house financing which ranges from two (2) to ten (10)years with fixed monthly payment. The amount due for collection under the amortization schedule foreach of the customer does not necessarily coincide with the progress of construction, which results toeither an unbilled receivable or customers’ deposit.
After the delivery of the completed real estate unit, the Parent Company provides one year warrantyto repair minor defects on the delivered serviced lot and house and condominium unit. This isassessed by the Parent Company as a quality assurance warranty and not treated as a separateperformance obligation.
The transaction price allocated to the remaining performance obligations (unsatisfied or partiallysatisfied) as at December 31, 2020 and 2019 are as follows:
2020 2019Within one year P=11,753,871,967 P=17,391,697,928More than one year 22,206,437,518 17,198,973,898
P=33,960,309,485 P=34,590,671,826
The remaining performance obligations expected to be recognized within one year and in more thanone year relate to the continuous development of the Parent Company’s real estate projects. TheParent Company’s condominium units are completed within three to five years, respectively, fromstart of construction while serviced lots and serviced lots and house are expected to be completedwithin two to three years from start of development.
29. Leases
Operating Leases - Parent Company as LessorThe Parent Company entered into lease agreements with third parties covering its investmentproperty portfolio. These leases generally provide for either (a) fixed monthly rent, or (b) minimumrent or a certain percentage of gross revenue, whichever is higher.

- 94 -
*SGVFSM006234*
Future minimum rentals receivable under noncancellable operating leases of the Parent Companyare as follows:
2020 2019Within one year P=2,047,985,833 P=2,440,384,881After one year but not more than five years 8,404,240,096 9,999,754,692More than five years 4,845,637,707 7,396,124,375
P=15,297,863,636 P=19,836,263,948
On January 1, 2015, the Parent Company and ACCI entered into a lease contract for the lease ofparcels of land and buildings within the Greenbelt and Glorietta development located at the AyalaCenter, Makati City. The lease shall be for a period of two years from January 1, 2015 untilDecember 31, 2016, renewable for another two years upon the written agreement of both parties.The lease generally provide for a fixed monthly rent and a certain percentage of gross rental revenueper month. The lease was renewed from January 1, 2017 to December 31, 2021 under the sameterms and conditions stated in the original contract of lease.
On January 1, 2017, the Parent Company and NECC entered into a lease contract for the lease of aparcel of land with an area of 19,988 sq.m., three office towers and a common retail podium mixed-use commercial building located at the Vertis North estate. The lease of land shall be for a period of40 years which commenced on January 1, 2017. The commencement of the lease period for thebuildings are by phase, Phase 1 started on January 18, 2017, Phase 2 on April 1, 2017, Phase 3 onOctober 1, 2017 and Phase 4 started on October 1, 2018. The lease on the buildings is co-terminouswith the land lease. The lease is renewable for another 40 years upon mutual agreement of bothparties. The lease generally provide for a fixed monthly rent and a certain percentage of gross rentalrevenue per month.
In 2017, the Parent Company and ATI entered into a lease contract for the lease of a 24-storeybuilding with a total construction floor area of 146,830 sq. m. located at 30 Meralco Ave., Pasig City.The lease shall be for a period of 40 years which commenced on February 1, 2016 for Phase 1 andAugust 1, 2017 for Phase 2. The lease is renewable for another 40 years upon mutual agreement ofboth parties. The lease generally provide for a fixed monthly rent and a certain percentage of grossrental revenue per month.
On December 27, 2017, the Parent Company signed a lease agreement with MCLC for the lease onthe parcels of land it owns where the buildings bought by MCLC were constructed. Please refer toNotes 11 and 22.
On December 28, 2017, the Parent Company signed a lease agreement with ASCVC for the lease onthe parcels of land it owns where the Arca South BPO and Mall were constructed. Please refer toNotes 11 and 22.
In 2020, the Parent Company granted rent concessions to its tenants which were affected by thecommunity quarantine imposed by the government amounting to P=89.5 million. These rentconcessions did not qualify as a lease modification, thus, were accounted for as variable leasepayments and reported as reduction of lease income (see Note 3).
Operating Leases - Parent Company as LesseeFuture minimum rentals payable under noncancellable operating leases of the Parent Companyfollows:
2020 2019Within one year P=38,892,800 P=38,770,466After one year but not more than five years 175,023,609 174,496,456More than five years 289,853,350 294,580,636
P=503,769,759 P=507,847,558

- 95 -
*SGVFSM006234*
Set out below are the carrying amounts of right-of-use assets recognized and the movements in2020:
Cost 2020 2019At January 1 and December 31 P=488,925,517 488,925,517Accumulated Depreciation and AmortizationAt January 1 141,898,789 85,920,603Depreciation 42,071,736 55,978,186At December 31 183,970,525 141,898,789Net Book Value P=304,954,992 P=347,026,728
The rollforward analysis of lease liabilities follows:
2020 2019At January 1 P=285,430,080 P=366,585,002Interest expense 24,502,275 27,316,431Payments (38,770,466) (108,471,353)As at December 31 P=271,161,889 P=285,430,080Current lease liabilities 19,374,161 16,187,902Noncurrent lease liabilities P=251,787,728 P=269,242,178
The following are the amounts recognized in the parent company statement of income:
2020 2019Depreciation expense of right-of-use assets P=42,071,736 P=55,978,186Interest expense on lease liabilities 24,502,275 27,316,431Rent expense - variable lease payments 132,876,130 161,074,204Total amounts recognized in the parent companystatement of income P=199,450,141 P=244,368,821
The Parent Company has lease contracts for land that contains variable payments based on a certainpercentage of gross rental income of the commercial centers. These terms are negotiated bymanagement for certain commercial spaces without steady customer demand. Management’sobjective is to align the lease expense with the revenue earned. The following provides information onthe Parent Company’s variable lease payments, including the magnitude in relation to fixedpayments:
2020
Fixed PaymentsVariable
Payments TotalFixed P=38,770,466 P=− P=38,770,466Variable rent only − 132,876,130 132,876,130At December 31 P=38,770,466 P=132,876,130 P=171,646,596
2019
Fixed PaymentsVariable
Payments TotalFixed P=108,471,353 P=− P=108,471,353Variable rent only − 161,074,204 161,074,204At December 31 P=108,471,353 P=161,074,204 P=269,545,557The significant leases entered into by the Parent Company are as follows:
On September 2018, the Parent Company signed a Lease Agreement with Manila Seedling BankFoundation, Inc. (MSBFI) for the lease of a 4.5-hectare portion of land located at the corner of EDSAand Quezon Avenue, Diliman, Quezon City. The term of the lease shall be coterminous with theLessor’s usufruct over the Leased Premises, or until September 20, 2027.

- 96 -
*SGVFSM006234*
On September 2017, the Parent Company signed a Lease Agreement with AyalaLand Estates, Inc.(ALEI) for the lease of a 4.3-hectare portion of land located in Vermosa, Pasong Buaya I, Imus City,Province of Cavite. The term of the lease shall ten (10) years commencing from September 2017 toAugust 2027.
On January 2017, the Parent Company signed a Lease Agreement with Philippine Racing Club, Inc.for the lease of land located in Circuit Makati, Brgy. Carmona, Makati City with an aggregate area of12,793 sqm. The term of the lease shall be twenty-three years and three months commencing fromDelivery Date. The Lessee shall have the option to renew the lease under the same terms andconditions for another period of five years, provided that renewal period shall be mutually agreed bythe Parties. For the period commencing from delivery date until sixty-three (63) months thereafter, theLessee shall pay the Lessor the rent amounting to P=100.00 million. Commencing on the sixty fourthmonth from execution of the contract until the end of the lease term, the Lessee shall pay the Lessorthe rent equal to fifty percent (50%) of the Gross Income of the Lessee.
Finance Leases - Parent Company as LessorOn January 31, 2020, the Company entered into a contract of lease with AREIT, Inc. for the lease ofland and building for a period of 34 years. The agreement pertains to the lease of the following:
a. Parcel of land with a total land area of approximately 4,513 square metersb. A five storey building with gross floor area of 14, 598.4 square meters and gross leasable
area of 10, 687 square metersc. Two basement parking levels with 120 parking slotsd. Various capital equipment installed in the building
The lease agreement states that the Company shall deliver to AREIT, Inc. the physical possession ofthe leased properties on February 1, 2020. The rent is payable at a fixed monthly rate of P=2.73million, subject to 5% annual escalation rate.
The net investment in the lease consists of the present value of minimum lease payments amountingto P=853.2 million. The Company derecognized investment property under finance lease amounting toP=417.0 million (See Note 11) which resulted to a gain under finance lease amounting to P=436.1million. The Company also recognized interest income earned amunting to P=51.5 million.
The rollforward of finance receivables (under intercompany receivables) follows:
2020At January 1 P=853,150,009Interest income 51,490,870Payments received (32,796,936)As at December 31 P=871,843,943Current lease receivable (Note 6 and 22) 34,300,129Noncurrent lease receivable (Note 6 and 22) P=837,543,814
The maturity analysis of the receivables, including undiscounted lease payments to be received areas follows:
2020Within one year P=34,300,129After one year but not more than five years 199,006,357More than five years 2,684,501,186Total undiscounted lease payments 2,917,807,672Less: Unearned finance income 2,093,603,007Net investment in the lease P=824,204,665

- 97 -
*SGVFSM006234*
30. Long-term Commitments and Contingencies
Commitmentse. On December 8, 2017, ALI assigned to NTDCC development rights on certain portions of the
North Triangle lot pads covered by a Deed of Assignment and Encroachment SettlementAgreement amounting to P=631.2 million.
f. On January 12, 2016, the Parent Company has entered into a partnership with Manila WaterPhilippine Ventures, Inc, a wholly owned subsidiary of Manila Water Company, Inc, for thewaterworks of Parent Company’s projects nationwide. The Memorandum of Agreement (MOA)was signed by Parent Company and its subsidiaries and affiliates, Cebu Holdings, Inc. and CebuProperty Ventures and Development Corp. Total expenses amounted to P=0.2 million.
g. ALI and LT Group, Inc. (LTG) entered into an agreement on January 21, 2016 to jointly develop aproject along the C5 corridor. The project is envisioned to be an estate development that spansportions of Pasig City and Quezon City. A new company named, ALI-ETON PropertyDevelopment Corporation, was incorporated on March 13, 2016.
On January 15, 2018, the estate, named Parklinks was launched and is the greenest urbanestate of ALI in partnership with Eton Properties Inc. The first residential project of Ayala LandPremier, Parklinks North Tower was launched on the same year, while the Parklinks lifestyle mallbroke ground as well, expected to provide a new destination for residents and office workerswithin the area when it opens in 2023. With the brisk residential sales of ALP’s first project, theParklinks South tower was launched in 2019, together with Alveo’s first residential development“The Lattice”.
Also set to rise within the estate will be an iconic bridge that will conveniently connect the QC andPasig parcels, offering a new route that can help ease vehicular traffic in the north eastern andeastern portions of Metro Manila. The bridge is expected to be completed by late 2021.
h. On August 11, 2015, the Parent Company won the bid for the Integrated Transport SystemProject-South Terminal (“ITS South Project"). The Parent Company was awarded by theDepartment of Transportation and Communications (“DOTC”) with a 35-year concessionagreement to build and operate the ITS South Project and will likewise have the right to developand operate commercial leasing facilities on the same 5.57 hectare former Food Terminal Inc.property on which the future transport terminal will be built. The site of the ITS South Project isright next to ARCA South, where the Parent Company is developing an integrated mixed-useestate.
i. On June 30, 2015, the Parent Company, through SM-ALI Group Consortium (the Consortium),participated and won in the bidding for Lot No. 8-B-1, containing an area of 263,384 sqm, whichis portion of Cebu City-owned lot located at the South Road Properties, Cebu City covered byTransfer Certificate of Title No. 107-2011000963. The Consortium is a consortium amongSMPHI, the Parent Company and CHI (together with the Parent Company collectively referred toas the “ALI Group”). Consistent with the agreed payment schedule in the Deed of Absolute Sale,as of August 1, 2018, the Parent Company has fully paid Php 4.56 billion, excluding taxes. TheSM-ALI Group has finished with the joint masterplan and has secured the development permitlast November 2019 from the Cebu City Council.
On January 29, 2020, SM-ALI Group broke ground the 263,384sqm development and theconstruction of road networks and underground utilities commence on February 18, 2020.
As of December 2020, the construction completion is at 47.51% and is forecasted to be finishedin May 2022.

- 98 -
*SGVFSM006234*
The development is positioned to be the Entertainment Capital of the Region which are theepicenter of fun, strategically located and accessible and celebrated Cebu experience.
It is envisioned to create a commercially viable mixed-use development and to create a living,vibrant community with world-class facilities, a well-designed urban setting, and lush, extensivelandscaping.
j. On May 12, 2014, ALI has signed the terms of reference with Sureste Properties, Inc. (SPI), awholly owned subsidiary of Bloomberry Resorts Corp. (BLOOM) for the retail area to be openedin the new Phase 1-A of Solaire Resort & Casino. The Parent Company will be the leasing andmarketing agent of the said area with gross leasable area of more than 5,000 sqm.
ContingenciesThe Parent Company has various contingent liabilities arising in the ordinary conduct of businessincluding a case related to property restriction violation. The estimate of the probable cost for theresolution of this claim has been developed in consultation with outside counsel handling the defensein this matter and is based upon an analysis of potential results. In the opinion of management andits legal counsel the eventual liability under these lawsuits or claims, if any, will not have a material oradverse effect on the Parent Company’s financial position and results of operations. Accordingly, noprovision for any liability has been made in the parent company financial statements.
Disclosures required by PAS 37, Provisions, Contingent Liabilities and Contingent Assets, were notprovided as it may prejudice the Parent Company’s position in ongoing claims and it can jeopardizethe outcome of the claims and contingencies.
31. Notes to Statements of Cash Flows
Disclosed below is the roll forward of liabilities under financing activities:
2020
January 1, 2020 Cash flowsNon-cashchanges
Foreignexchangemovement December 31, 2020
Short-term debt P=15,708,000,000 (P=9,067,500,000) P=− P=− P=6,640,500,000Current long-term debt 7,188,254,688 (7,188,254,688) 11,144,189,998 − 11,144,189,998Non-current long-term debt 155,490,830,377 18,403,208,712 (10,937,372,661) (326,500,000) 162,630,166,428Lease liability 285,430,080 (38,770,466) 24,502,275 − 271,161,889Dividends payable − (4,006,666,131) 4,006,666,131 − −Deposits and other
noncurrent liabilities 6,885,601,166 5,847,831,700 (427,780,655) − 12,305,652,211Total liabilities from
financing activities P=185,558,116,311 P=3,949,849,127 P=3,810,205,088 (326,500,000) P=192,991,670,526
2019
January 1, 2019 Cash flowsNon-cashchanges
Foreignexchangemovement December 31, 2019
Short-term debt P=13,500,900,000 P=2,207,100,000 P=− P=− P=15,708,000,000Current long-term debt 20,255,266,261 (20,255,266,261) 7,188,254,688 − 7,188,254,688Non-current long-term debt 122,659,181,389 39,816,778,903 (6,996,629,915) 11,500,000 155,490,830,377Lease liability − (108,471,353) 393,901,433 − 285,430,080Dividends payable − (7,721,500,201) 7,721,500,201 − −Deposits and other noncurrent
liabilities 7,170,169,930 (83,063,372) (201,505,392) − 6,885,601,166Total liabilities from financing
activities P=163,585,517,580 P=13,855,577,716 P=8,105,521,015 P=11,500,000 P=185,558,116,311
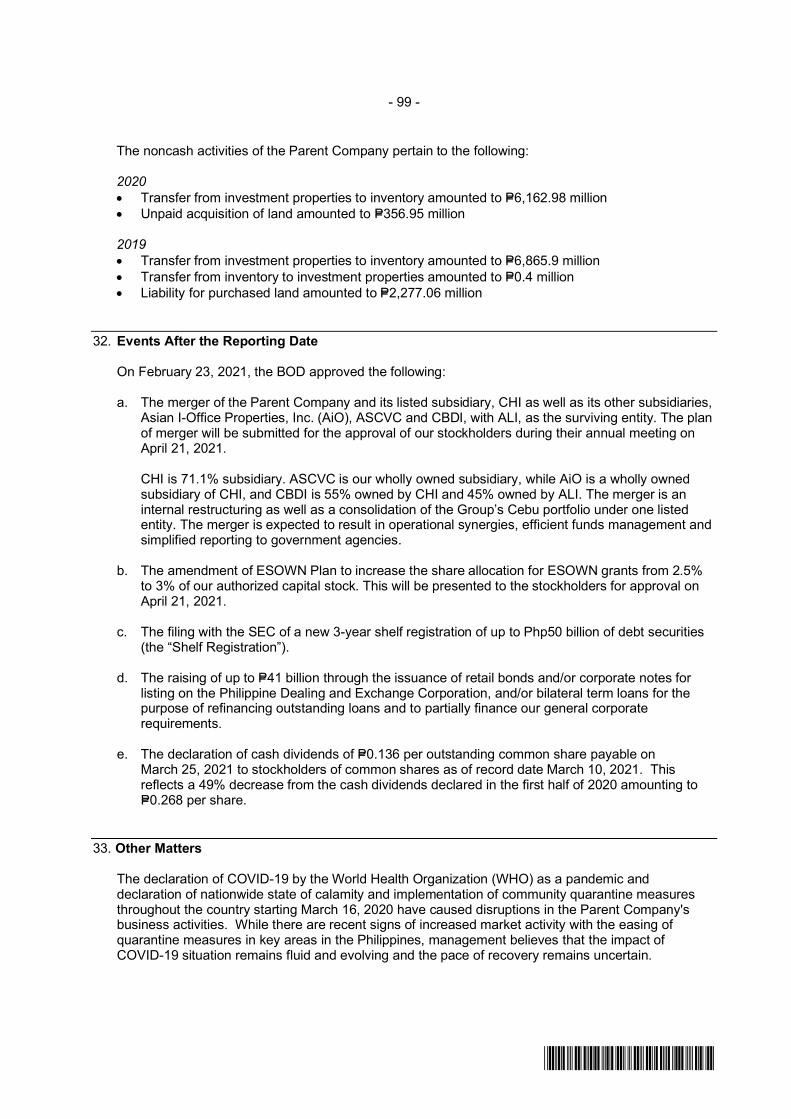
- 99 -
*SGVFSM006234*
The noncash activities of the Parent Company pertain to the following:
2020 Transfer from investment properties to inventory amounted to P=6,162.98 million Unpaid acquisition of land amounted to P=356.95 million
2019 Transfer from investment properties to inventory amounted to P=6,865.9 million Transfer from inventory to investment properties amounted to P=0.4 million Liability for purchased land amounted to P=2,277.06 million
32. Events After the Reporting Date
On February 23, 2021, the BOD approved the following:
a. The merger of the Parent Company and its listed subsidiary, CHI as well as its other subsidiaries,Asian I-Office Properties, Inc. (AiO), ASCVC and CBDI, with ALI, as the surviving entity. The planof merger will be submitted for the approval of our stockholders during their annual meeting onApril 21, 2021.
CHI is 71.1% subsidiary. ASCVC is our wholly owned subsidiary, while AiO is a wholly ownedsubsidiary of CHI, and CBDI is 55% owned by CHI and 45% owned by ALI. The merger is aninternal restructuring as well as a consolidation of the Group’s Cebu portfolio under one listedentity. The merger is expected to result in operational synergies, efficient funds management andsimplified reporting to government agencies.
b. The amendment of ESOWN Plan to increase the share allocation for ESOWN grants from 2.5%to 3% of our authorized capital stock. This will be presented to the stockholders for approval onApril 21, 2021.
c. The filing with the SEC of a new 3-year shelf registration of up to Php50 billion of debt securities(the “Shelf Registration”).
d. The raising of up to P=41 billion through the issuance of retail bonds and/or corporate notes forlisting on the Philippine Dealing and Exchange Corporation, and/or bilateral term loans for thepurpose of refinancing outstanding loans and to partially finance our general corporaterequirements.
e. The declaration of cash dividends of P=0.136 per outstanding common share payable onMarch 25, 2021 to stockholders of common shares as of record date March 10, 2021. Thisreflects a 49% decrease from the cash dividends declared in the first half of 2020 amounting toP=0.268 per share.
33. Other Matters
The declaration of COVID-19 by the World Health Organization (WHO) as a pandemic anddeclaration of nationwide state of calamity and implementation of community quarantine measuresthroughout the country starting March 16, 2020 have caused disruptions in the Parent Company'sbusiness activities. While there are recent signs of increased market activity with the easing ofquarantine measures in key areas in the Philippines, management believes that the impact ofCOVID-19 situation remains fluid and evolving and the pace of recovery remains uncertain.

- 100 -
*SGVFSM006234*
34. Supplementary Information Required Under Revenue Regulations 15-2010
In compliance with the requirements set forth by Revenue Regulations 15-2010 hereunder are theinformation on taxes, duties and license fees paid or accrued during the taxable year.
Value-Added Tax (VAT)The Parent Company is a VAT-registered company with VAT output tax declaration as follows:
Net Sales/Receipts Output VAT
Taxable sales on: Sale of goods P=24,564,906,672 P=2,947,788,801 Leasing income 1,290,167,655 154,820,119
Sales to Government 309,145,041 37,097,405Others 3,808,177,146 456,981,258
Zero-Rated Sales 1,334,908,836 −P=31,307,305,350 P=3,596,687,583
The sale of goods is recorded under Land and residential sales account while leasing income isrecorded under Rental income. The amount of VAT Input taxes claimed are broken down as follows:
Balance at beginning of year (net Input VAT position) P=30,706,504Current year’s purchases: Capital goods subject to amortization 778,331,028
Goods other than capital goods 89,557,008 Services lodged under other accounts 2,101,294,276 Services rendered by non-residents −Importation of Goods −Apportionment of input tax reclass to expense 21,455,814VAT payments for the year 1,316,746,619Input VAT applied during the year (3,596,687,582)Balance at end of year P=741,403,667
Documentary Stamp Tax (DST)The DST paid or accrued on the following transactions are:
Transaction Amount DSTInterest expense and other financing charges
DST on loans P=301,235,000,000 P=176,974,931DST on Intercompany loan 185,198,483,066 184,698,498Issuance of PDTC bonds − −DST on original issue of shares of stock 14,845,498 148,456Shares of stock not traded in stock exchange 14,845,498 111,342DST on leases and other hiring agreements − −
Direct Operating ExpensesDST on leases and other hiring agreements 38,634,201 78,343DST on transfer of real property 51,401,000 771,015
General and administrative expensesDST on original issue of shares of stock − −DST on leases and other hiring agreements − −
Capitalized DSTDST on promissory note 204,105,295 1,657,261
P=486,757,314,558 P=364,439,846
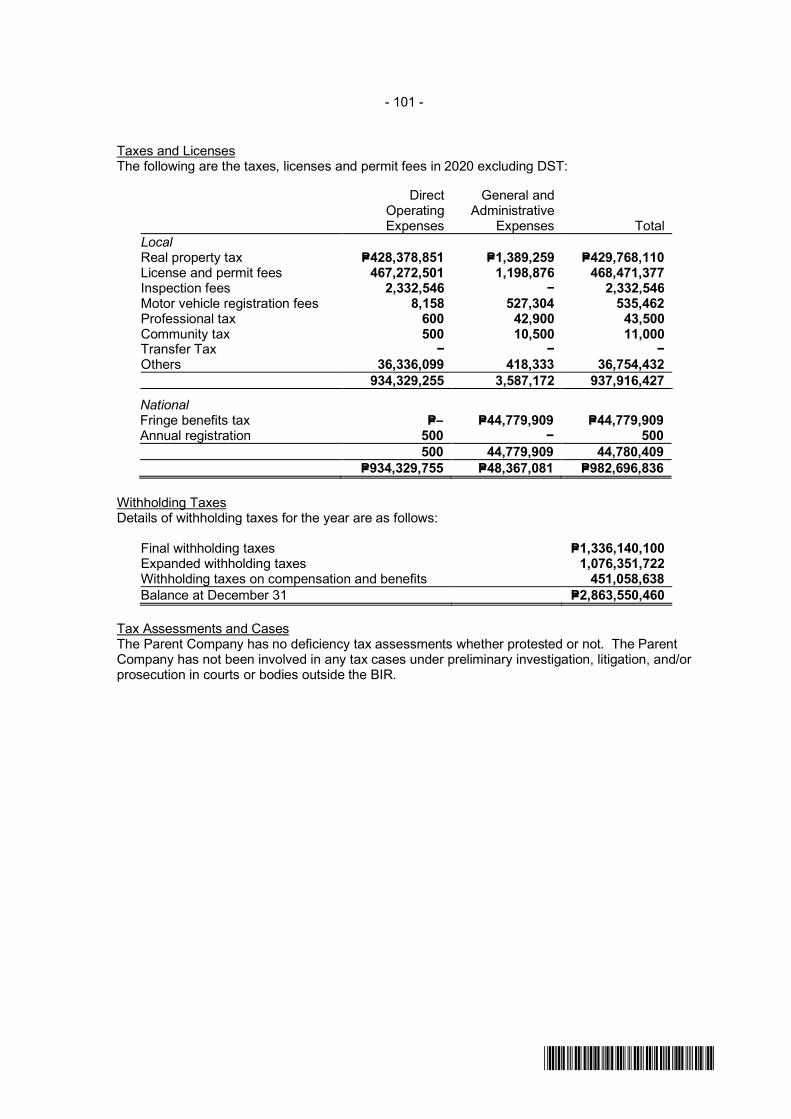
- 101 -
*SGVFSM006234*
Taxes and LicensesThe following are the taxes, licenses and permit fees in 2020 excluding DST:
DirectOperatingExpenses
General andAdministrative
Expenses TotalLocalReal property tax P=428,378,851 P=1,389,259 P=429,768,110License and permit fees 467,272,501 1,198,876 468,471,377Inspection fees 2,332,546 − 2,332,546Motor vehicle registration fees 8,158 527,304 535,462Professional tax 600 42,900 43,500Community tax 500 10,500 11,000Transfer Tax − − −Others 36,336,099 418,333 36,754,432
934,329,255 3,587,172 937,916,427
NationalFringe benefits tax P=– P=44,779,909 P=44,779,909Annual registration 500 − 500
500 44,779,909 44,780,409P=934,329,755 P=48,367,081 P=982,696,836
Withholding TaxesDetails of withholding taxes for the year are as follows:
Final withholding taxes P=1,336,140,100Expanded withholding taxes 1,076,351,722Withholding taxes on compensation and benefits 451,058,638Balance at December 31 P=2,863,550,460
Tax Assessments and CasesThe Parent Company has no deficiency tax assessments whether protested or not. The ParentCompany has not been involved in any tax cases under preliminary investigation, litigation, and/orprosecution in courts or bodies outside the BIR.

*SGVFSM006234*
INDEPENDENT AUDITOR’S REPORTON SUPPLEMENTARY SCHEDULE
The Stockholders and the Board of DirectorsAyala Land, Inc.31st Floor, Tower One and Exchange Plaza, Ayala TriangleAyala Avenue, Makati City
We have audited in accordance with Philippine Standards on Auditing, the financial statements ofAyala Land, Inc. (the Parent Company) as at December 31, 2020 and 2019, and have issued our reportthereon dated February 23, 2021. Our audits were made for the purpose of forming an opinion on thebasic parent company financial statements taken as a whole. The accompanying Schedule ofReconciliation of Retained Earnings Available for Dividend Declaration is the responsibility of the ParentCompany’s management. This schedule is presented for purposes of complying with the RevisedSecurities Regulation Code Rule 68, and is not part of the basic parent company financial statements.This has been subjected to the auditing procedures applied in the audit of the basic parent companyfinancial statements and, in our opinion, fairly state, in all material respects, the financial informationrequired to be set forth therein in relation to the basic parent company financial statements taken as awhole.
SYCIP GORRES VELAYO & CO.
Michael C. SabadoPartnerCPA Certificate No. 89336SEC Accreditation No. 0664-AR-4 (Group A), November 11, 2019, valid until November 10, 2022Tax Identification No. 160-302-865BIR Accreditation No. 08-001998-073-2020, December 3, 2020, valid until December 2, 2023PTR No. 8534357, January 4, 2021, Makati City
February 23, 2021
SyCip Gorres Velayo & Co.6760 Ayala Avenue1226 Makati CityPhilippines
Tel: (632) 8891 0307Fax: (632) 8819 0872ey.com/ph
BOA/PRC Reg. No. 0001, October 4, 2018, valid until August 24, 2021SEC Accreditation No. 0012-FR-5 (Group A),
November 6, 2018, valid until November 5, 2021
A member firm of Ernst & Young Global Limited


Copyright © 2022 FDOKUMEN