Cavity-enhanced absorption spectroscopy with a red LED source for NO x trace analysis
7
1 Frequency Comb Based Spectrometer for in Situ and Real Time 2 Measurements of IO, BrO, NO 2 , and H 2 CO at pptv and ppqv Levels 3 Roberto Grilli, † Guillaume Me ́ jean, † Samir Kassi, † Ire ̀ ne Ventrillard, † Chadi Abd-Alrahman, † 4 and Daniele Romanini* ,† 5 † University Grenoble 1/CNRS, LIPhy UMR 5588, Grenoble, F-38041, France 6 * S Supporting Information 7 ABSTRACT: We report an instrument designed for trace gas 8 measurement of highly reactive halogenated radicals, such as 9 bromine oxide and iodine oxide, as well as for nitrogen dioxide 10 and formaldehyde. This compact and robust spectrometer relies on 11 an alternated injection of a frequency-doubled femtosecond radiation 12 at 338 and 436 nm into two parallel high-finesse cavities, for 13 measuring BrO, H 2 CO, IO, and NO 2 , respectively. The transmission 14 of the broadband radiation through the cavity is analyzed with a high 15 resolution, compact spectrograph consisting of an echelle grating and 16 a high sensitivity CCD camera. The transportable instrument fits on 17 a breadboard 120 × 60 cm size and is suitable for in situ and real time 18 measurements of these species. A field campaign at the Marine 19 Boundary Layer in Roscoff (in the northwest of France, 48.7°N, 20 4.0°W) during June 2011 illustrates the outstanding performance of the instrument, which reaches a bandwidth normalized 21 minimum absorption coefficient of 1.3 × 10 −11 cm −1 Hz −1/2 per spectral element, and provides detection levels as low as 20 parts 22 per quadrillion of IO in 5 min of acquisition. 1. INTRODUCTION 23 The chemistry and photochemistry of iodine and bromine 24 compounds in the atmosphere, with a particular interest to the 25 highly reactive forms such as the halogen oxides, have 26 progressively captured the attention of the atmospheric 27 community aiming at a better understanding of their oxidizing 28 capacity of Earth’s troposphere. 1 During springtime in the Polar 29 Regions, reactive bromine, chlorine, and iodine compounds are 30 responsible for the rapid ozone depletion in the Marine 31 Boundary Layer (MBL). 2 Halogen oxides are also known to be 32 involved in the oxidation of gaseous elemental Hg 3 and 33 dimethyl sulfide (DMS), 4,5 both employed as tracers to 34 reconstruct climatic conditions that prevailed during the Earth’s 35 history and to get an insight about the oxidative processes 36 taking place in the atmosphere as a response to global warming. 37 Measurements of halogen oxides molecules have been 38 performed in the last years using different techniques, each 39 with its advantages and drawbacks. Laser Induced Fluorescence 40 (LIF) presented by Whalley et al. 6 to measure IO shows a 41 detection limit of 0.3 pptv (part per trillion by volume, 1:10 12 ) 42 within 300 s of acquisition. Chemical ionization mass 43 spectrometry may provide detection limits down to 2.6 pptv 44 for IO radical within 4 s of integration time. 7,8 However, both 45 techniques suffer of not being absolute analytical methods and 46 require regular calibrations using standard samples. Up to now, 47 absorption spectroscopy methods employed for field measure- 48 ments mainly lead to nonspatially resolved techniques such as 49 long-path differential optical absorption spectroscopy (LP- 50 DOAS) 1 or multiaxis differential optical absorption spectros- 51 copy (Max-DOAS) 9,10 using incoherent radiation. On one 52 hand, these techniques offer a large versatility thanks to the 53 spectral coverage of the light source, allowing the monitoring of 54 multiple species. On the other hand, no local information on 55 concentrations is provided because the measurements are 56 integrated over atmospheric volumes which are several km 57 thick (either vertically or horizontally). In addition, the 58 performances of the open path techniques strongly depend 59 on climatic conditions. The atmospheric box-model calcu- 60 lations performed by Burkholder et al. 11 on the iodine 61 chemistry at the MBL highlight the issue that long-path 62 techniques do not sufficiently account for the presence of 63 inhomogeneous sources of iodine, leading to a mismatch 64 between experimental measurements and calculations. Wada et 65 al. demonstrated an open path cavity ring-down spectrometer 66 for IO measurements injecting a pulsed dye laser into a high- 67 finesse cavity and providing a detection limit of 10 pptv 12 68 which is, however, not sufficient in most atmospheric situations. 69 Finally, the cavity enhanced absorption spectroscopy (CEAS) Special Issue: Marine Boundary Layer: Ocean Atmospheric Inter- actions Received: May 9, 2012 Revised: July 18, 2012 Accepted: August 13, 2012 Article pubs.acs.org/est © XXXX American Chemical Society A dx.doi.org/10.1021/es301785h | Environ. Sci. Technol. XXXX, XXX, XXX−XXX sls00 | ACSJCA | JCA10.0.1465/W Unicode | research.3f (R3.2.i3 HF01:3823 | 2.0 alpha 39) 2012/07/02 15:37:27 | PROD-JCAVA | rq_1696544 | 8/17/2012 15:34:37 | 7
-
Upload
independent -
Category
Documents
-
view
0 -
download
0
Transcript of Cavity-enhanced absorption spectroscopy with a red LED source for NO x trace analysis
1 Frequency Comb Based Spectrometer for in Situ and Real Time2 Measurements of IO, BrO, NO2, and H2CO at pptv and ppqv Levels3 Roberto Grilli,† Guillaume Mejean,† Samir Kassi,† Irene Ventrillard,† Chadi Abd-Alrahman,†
4 and Daniele Romanini*,†
5†University Grenoble 1/CNRS, LIPhy UMR 5588, Grenoble, F-38041, France
6 *S Supporting Information
7 ABSTRACT: We report an instrument designed for trace gas8 measurement of highly reactive halogenated radicals, such as9 bromine oxide and iodine oxide, as well as for nitrogen dioxide10 and formaldehyde. This compact and robust spectrometer relies on11 an alternated injection of a frequency-doubled femtosecond radiation12 at 338 and 436 nm into two parallel high-finesse cavities, for13 measuring BrO, H2CO, IO, and NO2, respectively. The transmission14 of the broadband radiation through the cavity is analyzed with a high15 resolution, compact spectrograph consisting of an echelle grating and16 a high sensitivity CCD camera. The transportable instrument fits on17 a breadboard 120 × 60 cm size and is suitable for in situ and real time18 measurements of these species. A field campaign at the Marine19 Boundary Layer in Roscoff (in the northwest of France, 48.7°N,20 4.0°W) during June 2011 illustrates the outstanding performance of the instrument, which reaches a bandwidth normalized21 minimum absorption coefficient of 1.3 × 10⁻¹¹ cm−1 Hz−1/2 per spectral element, and provides detection levels as low as 20 parts22 per quadrillion of IO in 5 min of acquisition.
1. INTRODUCTION
23 The chemistry and photochemistry of iodine and bromine24 compounds in the atmosphere, with a particular interest to the25 highly reactive forms such as the halogen oxides, have26 progressively captured the attention of the atmospheric27 community aiming at a better understanding of their oxidizing28 capacity of Earth’s troposphere.1 During springtime in the Polar29 Regions, reactive bromine, chlorine, and iodine compounds are30 responsible for the rapid ozone depletion in the Marine31 Boundary Layer (MBL).2 Halogen oxides are also known to be32 involved in the oxidation of gaseous elemental Hg3 and33 dimethyl sulfide (DMS),4,5 both employed as tracers to34 reconstruct climatic conditions that prevailed during the Earth’s35 history and to get an insight about the oxidative processes36 taking place in the atmosphere as a response to global warming.37 Measurements of halogen oxides molecules have been38 performed in the last years using different techniques, each39 with its advantages and drawbacks. Laser Induced Fluorescence40 (LIF) presented by Whalley et al.6 to measure IO shows a41 detection limit of 0.3 pptv (part per trillion by volume, 1:1012)42 within 300 s of acquisition. Chemical ionization mass43 spectrometry may provide detection limits down to 2.6 pptv44 for IO radical within 4 s of integration time.7,8 However, both45 techniques suffer of not being absolute analytical methods and46 require regular calibrations using standard samples. Up to now,47 absorption spectroscopy methods employed for field measure-48 ments mainly lead to nonspatially resolved techniques such as49 long-path differential optical absorption spectroscopy (LP-
50DOAS)1 or multiaxis differential optical absorption spectros-51copy (Max-DOAS)9,10 using incoherent radiation. On one52hand, these techniques offer a large versatility thanks to the53spectral coverage of the light source, allowing the monitoring of54multiple species. On the other hand, no local information on55concentrations is provided because the measurements are56integrated over atmospheric volumes which are several km57thick (either vertically or horizontally). In addition, the58performances of the open path techniques strongly depend59on climatic conditions. The atmospheric box-model calcu-60lations performed by Burkholder et al.11 on the iodine61chemistry at the MBL highlight the issue that long-path62techniques do not sufficiently account for the presence of63inhomogeneous sources of iodine, leading to a mismatch64between experimental measurements and calculations. Wada et65al. demonstrated an open path cavity ring-down spectrometer66for IO measurements injecting a pulsed dye laser into a high-67finesse cavity and providing a detection limit of 10 pptv 12
68which is, however, not sufficient in most atmospheric situations.69Finally, the cavity enhanced absorption spectroscopy (CEAS)
Special Issue: Marine Boundary Layer: Ocean Atmospheric Inter-actions
Received: May 9, 2012Revised: July 18, 2012Accepted: August 13, 2012
Article
pubs.acs.org/est
© XXXX American Chemical Society A dx.doi.org/10.1021/es301785h | Environ. Sci. Technol. XXXX, XXX, XXX−XXX
sls00 | ACSJCA | JCA10.0.1465/W Unicode | research.3f (R3.2.i3 HF01:3823 | 2.0 alpha 39) 2012/07/02 15:37:27 | PROD-JCAVA | rq_1696544 | 8/17/2012 15:34:37 | 7
70 technique has been already exploited by Kasyutich et al. in an71 off-axis configuration using a violet laser diode,13 while72 Vaughan et al. employed an incoherent broad-band cavity73 enhanced configuration (IBBCEAS)14 for the detection of IO,74 NO2 and IO, OIO and I2, respectively. Both techniques show a75 good performance for discharge-flow kinetic studies in the76 laboratory, while detection limits of 140 and 210 pptv for the77 IO radical were achieved, which are not sufficient for78 measurements in the field.79 Here, an instrument based on mode-locked cavity enhanced80 absorption spectroscopy (ML-CEAS) is presented. This81 instrument is robust and transportable and offers real time, in82 situ, local measurements of BrO, H2CO, IO, and NO2. Thanks83 to its high sensitivity, field measurements in very remote84 environments are therefore feasible. The spectrometer85 addresses the near UV-visible spectral region where a large86 number of strong and characteristic electronic transitions of87 relevant atmospheric molecules are present. 15 The use of a88 broadband femtosecond laser, continuously tunable from 67589 to 1080 nm, allows for accessing the whole spectral region from90 the green to the near UV (337 to 540 nm) by frequency91 doubling, providing high versatility as a trace gas analyzer for92 several relevant atmospheric species.
2. EXPERIMENTAL SETUP93 The instrument consists of a compact femtosecond laser94 oscillator (100−250 fs, 80 MHz, Chameleon, Coherent Inc.)95 which provides 700 mW of average power within 2 nm of96 bandwidth centered at 677 nm and 2.5 W within 5 nm of97 bandwidth at 871 nm. The laser head is fixed under a 120 × 6098 × 6 cm3 aluminum honeycomb breadboard, while the rest of99 the optical setup is placed above. The laser radiation is100 frequency doubled with a 0.2 mm thick, type-I, BBO (β-barium101 borate) crystal (Fujian CASTECH Crystals, Inc.). The102 thickness and the focusing lens ( f = 30 mm) are chosen to103 get a good compromise between maximizing the second104 harmonic generation while keeping a small walk-off and105 preventing astigmatism of the harmonic output beam due to106 chromatic dispersion. The BBO crystal is mounted on a107 motorized rotation stage (AG-PR100, Newport) that allows108 computer controlled phase-matching optimization, which is109 important when the wavelength is switched from 677 to 871110 nm. The conversion efficiency for the frequency doubling is 4%111 W−1, and in the wavelength domain the width of the second112 harmonic radiation is reduced by a factor of 2√2 with respect113 to the one of the fundamental radiation. Three dichroic steering114 mirrors, used as band-pass filters, clean the beam from the115 fundamental beam before injecting the optical cavity. An116 acousto-optic modulator (AOM) with 80% efficiency on the117 first order diffracted beam acts as a fast optical switch and a118 programmable attenuator. On one hand, it allows for regularly119 performing ring-down measurements in the absence of120 absorbents for determining the cavity finesse, as explained in121 the data analysis section. On the other hand, the AOM is also122 used to attenuate the 436 nm radiation by a factor of ∼5;123 although a high cavity finesse and a loose locking scheme are124 employed, the CCD camera electronic wells become saturated
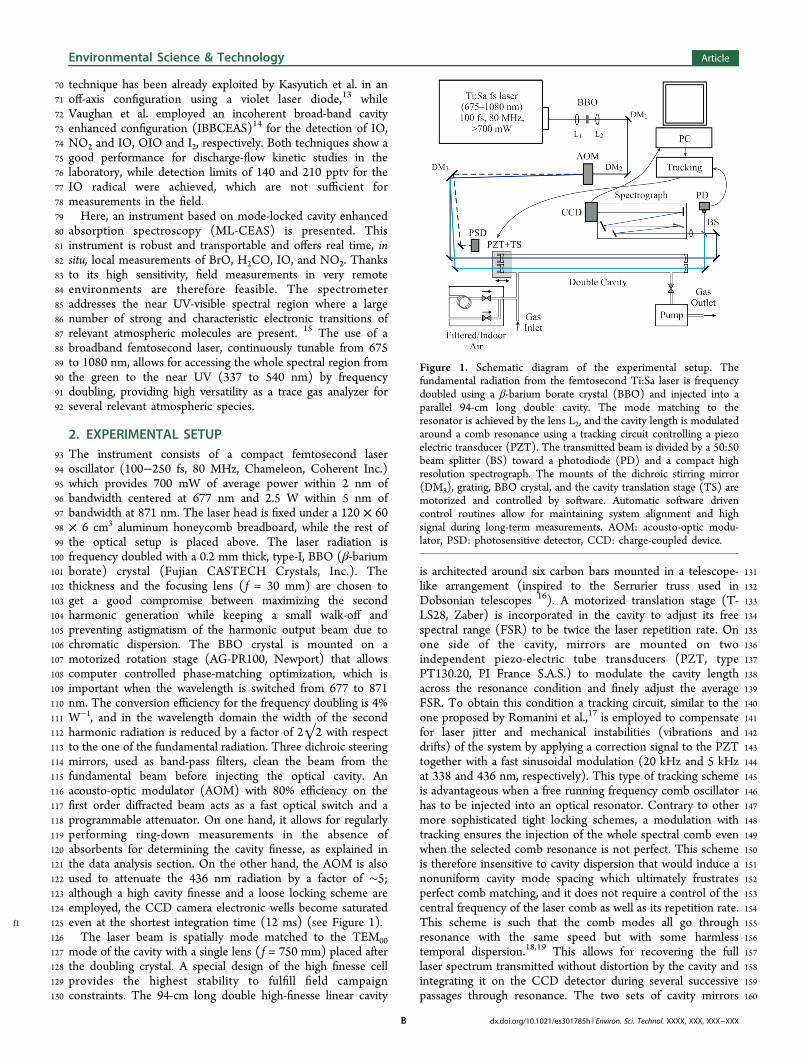
f1 125 even at the shortest integration time (12 ms) (see Figure 1).126 The laser beam is spatially mode matched to the TEM00127 mode of the cavity with a single lens ( f = 750 mm) placed after128 the doubling crystal. A special design of the high finesse cell129 provides the highest stability to fulfill field campaign130 constraints. The 94-cm long double high-finesse linear cavity
131is architected around six carbon bars mounted in a telescope-132like arrangement (inspired to the Serrurier truss used in133Dobsonian telescopes 16). A motorized translation stage (T-134LS28, Zaber) is incorporated in the cavity to adjust its free135spectral range (FSR) to be twice the laser repetition rate. On136one side of the cavity, mirrors are mounted on two137independent piezo-electric tube transducers (PZT, type138PT130.20, PI France S.A.S.) to modulate the cavity length139across the resonance condition and finely adjust the average140FSR. To obtain this condition a tracking circuit, similar to the141one proposed by Romanini et al.,17 is employed to compensate142for laser jitter and mechanical instabilities (vibrations and143drifts) of the system by applying a correction signal to the PZT144together with a fast sinusoidal modulation (20 kHz and 5 kHz145at 338 and 436 nm, respectively). This type of tracking scheme146is advantageous when a free running frequency comb oscillator147has to be injected into an optical resonator. Contrary to other148more sophisticated tight locking schemes, a modulation with149tracking ensures the injection of the whole spectral comb even150when the selected comb resonance is not perfect. This scheme151is therefore insensitive to cavity dispersion that would induce a152nonuniform cavity mode spacing which ultimately frustrates153perfect comb matching, and it does not require a control of the154central frequency of the laser comb as well as its repetition rate.155This scheme is such that the comb modes all go through156resonance with the same speed but with some harmless157temporal dispersion.18,19 This allows for recovering the full158laser spectrum transmitted without distortion by the cavity and159integrating it on the CCD detector during several successive160passages through resonance. The two sets of cavity mirrors
Figure 1. Schematic diagram of the experimental setup. Thefundamental radiation from the femtosecond Ti:Sa laser is frequencydoubled using a β-barium borate crystal (BBO) and injected into aparallel 94-cm long double cavity. The mode matching to theresonator is achieved by the lens L2, and the cavity length is modulatedaround a comb resonance using a tracking circuit controlling a piezoelectric transducer (PZT). The transmitted beam is divided by a 50:50beam splitter (BS) toward a photodiode (PD) and a compact highresolution spectrograph. The mounts of the dichroic stirring mirror(DM3), grating, BBO crystal, and the cavity translation stage (TS) aremotorized and controlled by software. Automatic software drivencontrol routines allow for maintaining system alignment and highsignal during long-term measurements. AOM: acousto-optic modu-lator, PSD: photosensitive detector, CCD: charge-coupled device.
Environmental Science & Technology Article
dx.doi.org/10.1021/es301785h | Environ. Sci. Technol. XXXX, XXX, XXX−XXXB
161 (Layertec) are selected for their maximal reflectivity of 99.948%162 and 99.990% at 338 and 436 nm, respectively. They are163 prealigned before being glued on aluminum holders which can164 be removed for mirrors cleaning propose and replaced without165 affecting the optical alignment. After the cavity, a beam splitter166 is equally dividing the beam onto a photodiode and through a167 homemade compact spectrograph providing ∼5 pm (0.45168 cm−1) spectral resolution. The spectrograph is composed of a169 high order diffraction grating (Thorlabs, GE2550-0863, blaze170 angle = 63°, 79 grooves per mm, 25 × 50 mm2 size) and a high-171 sensitivity blue enhanced (back-thinned) TE-cooled CCD172 camera (Hamamatsu, C10151, 2048 × 250 pixels2). A full173 description of the spectrograph is provided by Grilli et al.21 The174 spectrograph was realized for the detection of the halogen175 oxides radicals, probing strong electronic transitions. The176 broadening of these absorption bands is limited by the lifetime177 broadening of the transitions, since the excited states are178 predissociatives. For those reasons, a resolution of 5 pm is179 already enough to reach the best enhancement in terms of180 contrast of the spectra of IO and BrO. However, a resolution of181 2 pm (corresponding to a chromatic resolving power of 2 ×182 105) could be achieved by reducing the focal of the entrance183 lens from 40 to 10 mm, which it would increase the sensitivity184 for the detection of NO2 and H2CO.185 The gas line is entirely composed of PFA (Perfluoroalkoxy),186 which has been found to be the best tubing material to187 efficiently transport highly reactive radical species, such as BrO188 and IO,21 as well as the reactive hydrogen fluoride, HF.22 At the189 cavity output, a diaphragm pump and a manual proportional190 valve are employed to provide a gas flow of 800 sccm (standard191 cubic centimeters). The cavity inlet can sample three different192 lines through a cross connection. The first line is the outdoor193 air that is collected with a 6 mm diameter PFA tube. The194 second line is linked to a filtered air generator, composed of a195 second diaphragm pump, a particle filter, and a scrubber that196 are employed to provide a flow rate greater than 800 sccm197 which dynamically replaces the input flow. This filtered air flow,198 free of NO2, IO, and BrO, is switched on/off by a software199 controlled electrovalve and allows for acquiring reference200 spectra and ring-down events essential for absorption scale201 absolute calibration. However, formaldehyde is not completely202 removed by this filtering system, and an additional filter, such as203 the commercial Hopcalite, is required to remove volatile204 organic compounds from the air sample; in alternative a zero air205 cylinder can be employed to acquire reference spectra, which is,206 however, less practical for field campaign propose. A second207 electrovalve allows for partially collecting no filter indoor air208 which is naturally enriched in NO2 and H2CO: the recognition209 of their spectra by the fitting routine allows for adjusting the fit210 parameters (in particular the spectral centering, as explained in211 the Supporting Information).212 The whole spectrometer is confined in an aluminum box213 covered by a thermal insulating material and temperature214 stabilized at 26 °C with a peltier air-air exchanger (Supercool,215 AA-040-12-22) module coupled to a PID temperature216 controller (Supercool, TC-PR-59). The data analysis is217 performed in real time by homemade software and discussed218 in Section 3. The tuning of the laser frequency is also controlled219 by software; however, the switch between the detection of BrO220 - CH2O and IO - NO2 still requires the operator support, and it221 can be performed in ∼10 min since the optical components are222 all prealigned, except for the BBO crystal, the DM3, and the223 grating which are mounted on motorized stages, and therefore
224controlled by software. The total weight of the system is 250225kg, and the power consumption is 3 kW.226Data Analysis. This section describes the data analysis227performed by the Labview software to retrieve the concen-228trations of the target molecules. Thanks to the transient229coupling of the laser to the cavity, the ML-CEAS scheme can be230considered equivalent to broadband cavity enhanced absorption231spectroscopy (BB-CEAS). 19 In BB-CEAS the frequency232dependent absorption coefficient can be expressed as a function233of the transmission spectrum, T(ν) = I(ν)/I0(ν), and the ring-234down time of the empty cavity, τ0
23
α ννν τ
= −⎛⎝⎜
⎞⎠⎟
II c
( )( )( )
110
0 235(1)
236where c is the speed of light. The ring-down time is measured237by performing cavity ring-down spectroscopy (CRDS)24 when238zero air is continuously flowing into the cavity at 800 sccm at239atmospheric pressure. In our calculations τ0 corresponds to an240average photon lifetime of the entire broad-band radiation241circulating inside the cavity, and the product τ0c is the inverse of242the effective path length obtained in the absence of absorbers.243We may assume that this parameter, proportional to the finesse,244is almost constant over the injected laser spectrum which is245spectrally narrow relative to the mirror reflection band. The246transmission spectrum is calculated as the ratio between the247laser spectrum transmitted through the cavity in the presence,248I(ν), and in the absence, I0(ν), of the absorbers, after249subtracting from both the CCD camera background (taken250with the laser beam interrupted by the AOM). Spectral data,251α(ν), are analyzed in real time by a standard linear252multicomponent fit routine,25 where spectra of known253concentrations of analytes, αi, are used as references for the254fit, and the coefficient, ci (cBrO, cIO, etc.), are giving the sample255concentrations
∑α ν α ν ν= · + =c p i BrO H CO or IO
NO
( ) ( ) ( ) ( , ,
)
ii i 2
2 256(2)
257where p(ν) is a polynomial function, which accounts for a258spectral shift of the laser between the acquisition of I(ν) and259I0(ν) together with the presence of broad and unstructured260absorption features may present. The reference spectra are261experimental data acquired by our ML-CEAS instrument,262which are inherently taking into account the instrumental263function and the wavelength calibration of our spectrometer.264The concentrations of the reference spectra were calculated by265using the wavelength dependent absorption cross sections266found in the literature for BrO,26,27 H2CO,
28 IO,29,30 and267NO2.
31 The uncertainty of the measurement for the radical268species is limited by the uncertainty of the literature absorption269cross sections (evaluated to be about 10% for the halogen270oxides), while the precision on the measured ring-down times is271better than 1%.272The detection limits expressed as bandwidth normalized273minimum absorption coefficient per spectral element,274αmin(BW), are calculated by the following equation
ατ
=Δ
·⎜ ⎟⎛⎝
⎞⎠BW
II c
tM
( )1
minmin
0 0
1/2
275(3)
276where I0 is the cavity output intensity, ΔImin represents the277minimum detectable change of the output intensity, t is the
Environmental Science & Technology Article
dx.doi.org/10.1021/es301785h | Environ. Sci. Technol. XXXX, XXX, XXX−XXXC
278 integration time, and M is the number of independent spectral279 elements (corresponding to 1000 and 1500 for the detection at280 338 and 436 nm, respectively). By fitting the ratio between two281 consecutive acquisitions at the CCD camera with a polynomial282 of the same order of p(ν), the ΔImin for a single acquisition can283 therefore be calculated (which corresponds to the rms of the284 fit). Furthermore, monitoring ΔImin during the acquisition285 allows for rejecting in real time data which are more affected by286 mechanical instabilities. This will cause some dead time during287 acquisition, which will not exceed the 10% of the total288 acquisition time. For our instrument, αmin(BW) are 1.6 × 10⁻¹⁰
289 and 1.3 × 10⁻¹¹ cm−1 Hz−1/2 per spectral element, at 338 and290 436 nm, respectively. From the experimental spectra, detection291 limits expressed in terms of minimum detectable mixing ratio at292 atmospheric pressure are calculated: 1 pptv and 100 ppt are293 attended within 1 min of integration for BrO and H2CO,294 respectively, and 20 ppqv and 5 pptv are obtained within 5 min295 of integration for IO and NO2, respectively. Here, the intrinsic296 structure of the molecular spectra plays an important role,297 which leads to a lower detection limit for IO with respect to298 BrO, together with the greater cavity finesse and a better laser299 stability, as discussed in the Results section. As already proved300 by Grilli et al., 19 the instrument provides experimental spectra301 which are close to the shot noise limit.
3. RESULTS AND DISCUSSION302 Examples of typical low-concentration spectra obtained around
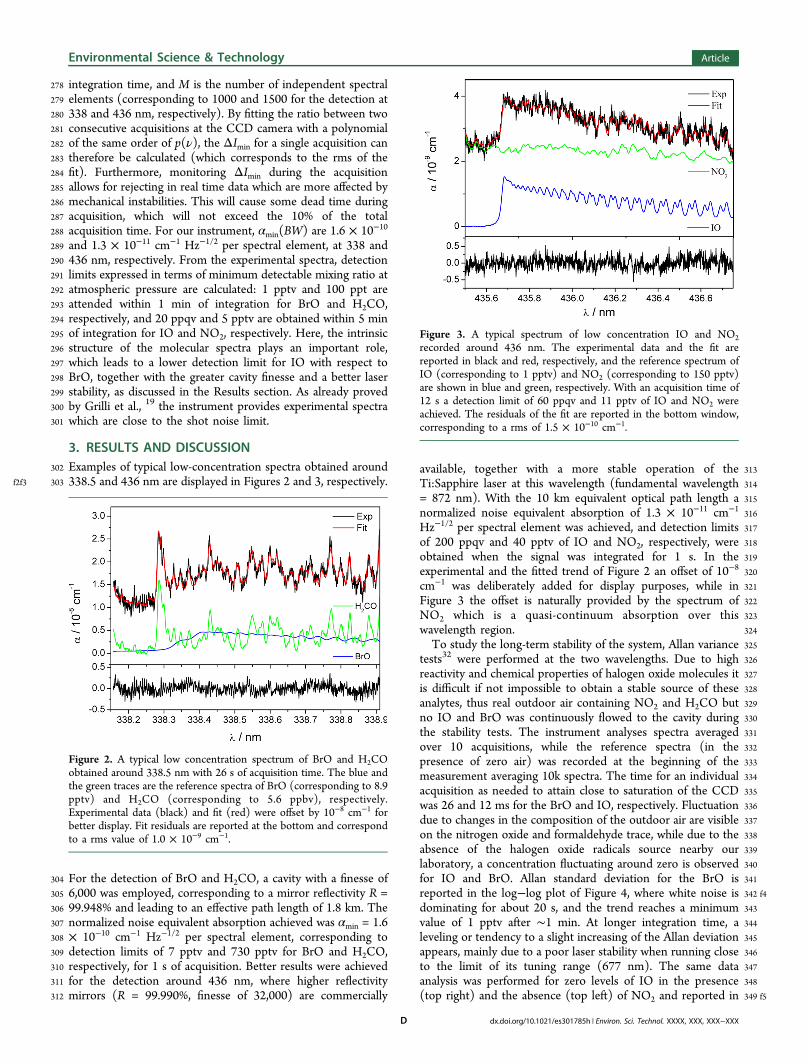
f2f3 303 338.5 and 436 nm are displayed in Figures 2 and 3, respectively.
304 For the detection of BrO and H2CO, a cavity with a finesse of305 6,000 was employed, corresponding to a mirror reflectivity R =306 99.948% and leading to an effective path length of 1.8 km. The307 normalized noise equivalent absorption achieved was αmin = 1.6308 × 10⁻¹⁰ cm−1 Hz−1/2 per spectral element, corresponding to309 detection limits of 7 pptv and 730 pptv for BrO and H2CO,310 respectively, for 1 s of acquisition. Better results were achieved311 for the detection around 436 nm, where higher reflectivity312 mirrors (R = 99.990%, finesse of 32,000) are commercially
313available, together with a more stable operation of the314Ti:Sapphire laser at this wavelength (fundamental wavelength315= 872 nm). With the 10 km equivalent optical path length a316normalized noise equivalent absorption of 1.3 × 10⁻¹¹ cm−1
317Hz−1/2 per spectral element was achieved, and detection limits318of 200 ppqv and 40 pptv of IO and NO2, respectively, were319obtained when the signal was integrated for 1 s. In the320experimental and the fitted trend of Figure 2 an offset of 10−8
321cm−1 was deliberately added for display purposes, while in322Figure 3 the offset is naturally provided by the spectrum of323NO2 which is a quasi-continuum absorption over this324wavelength region.325To study the long-term stability of the system, Allan variance326tests32 were performed at the two wavelengths. Due to high327reactivity and chemical properties of halogen oxide molecules it328is difficult if not impossible to obtain a stable source of these329analytes, thus real outdoor air containing NO2 and H2CO but330no IO and BrO was continuously flowed to the cavity during331the stability tests. The instrument analyses spectra averaged332over 10 acquisitions, while the reference spectra (in the333presence of zero air) was recorded at the beginning of the334measurement averaging 10k spectra. The time for an individual335acquisition as needed to attain close to saturation of the CCD336was 26 and 12 ms for the BrO and IO, respectively. Fluctuation337due to changes in the composition of the outdoor air are visible338on the nitrogen oxide and formaldehyde trace, while due to the339absence of the halogen oxide radicals source nearby our340laboratory, a concentration fluctuating around zero is observed341for IO and BrO. Allan standard deviation for the BrO is342 f4reported in the log−log plot of Figure 4, where white noise is343dominating for about 20 s, and the trend reaches a minimum344value of 1 pptv after ∼1 min. At longer integration time, a345leveling or tendency to a slight increasing of the Allan deviation346appears, mainly due to a poor laser stability when running close347to the limit of its tuning range (677 nm). The same data348analysis was performed for zero levels of IO in the presence349 f5(top right) and the absence (top left) of NO2 and reported in
Figure 2. A typical low concentration spectrum of BrO and H2COobtained around 338.5 nm with 26 s of acquisition time. The blue andthe green traces are the reference spectra of BrO (corresponding to 8.9pptv) and H2CO (corresponding to 5.6 ppbv), respectively.Experimental data (black) and fit (red) were offset by 10−8 cm−1 forbetter display. Fit residuals are reported at the bottom and correspondto a rms value of 1.0 × 10⁻⁹ cm−1.
Figure 3. A typical spectrum of low concentration IO and NO2recorded around 436 nm. The experimental data and the fit arereported in black and red, respectively, and the reference spectrum ofIO (corresponding to 1 pptv) and NO2 (corresponding to 150 pptv)are shown in blue and green, respectively. With an acquisition time of12 s a detection limit of 60 ppqv and 11 pptv of IO and NO2 wereachieved. The residuals of the fit are reported in the bottom window,corresponding to a rms of 1.5 × 10⁻¹⁰ cm−1.
Environmental Science & Technology Article
dx.doi.org/10.1021/es301785h | Environ. Sci. Technol. XXXX, XXX, XXX−XXXD
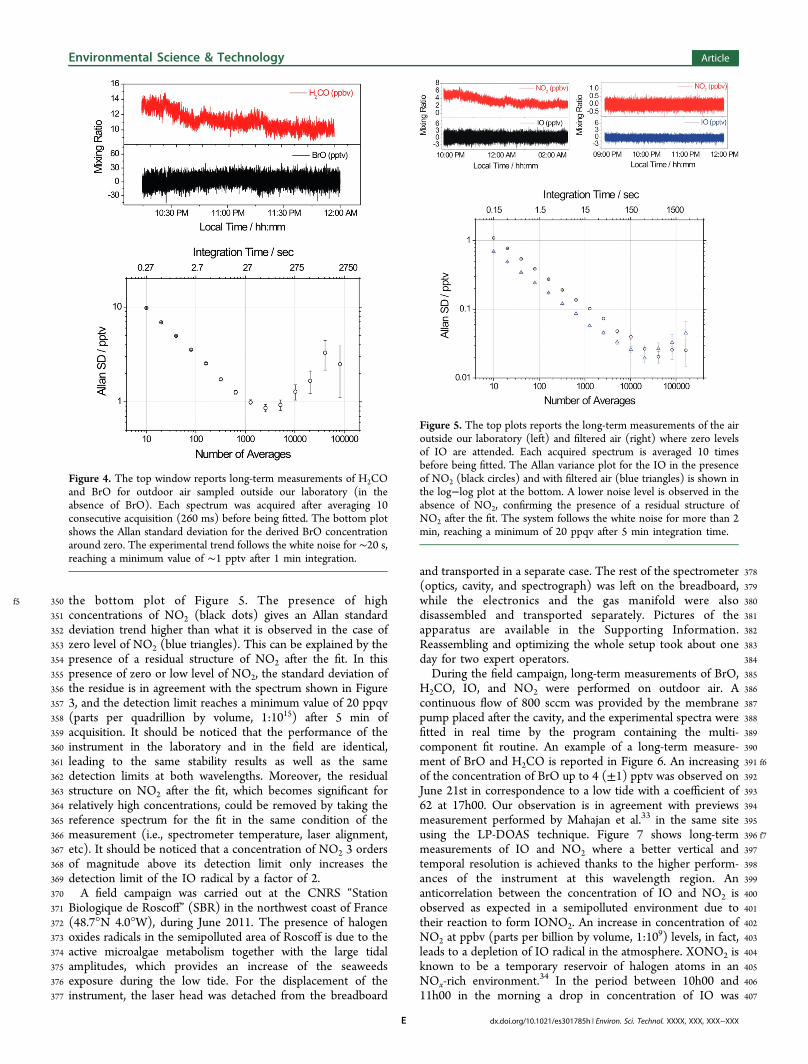
f5 350 the bottom plot of Figure 5. The presence of high351 concentrations of NO2 (black dots) gives an Allan standard352 deviation trend higher than what it is observed in the case of353 zero level of NO2 (blue triangles). This can be explained by the354 presence of a residual structure of NO2 after the fit. In this355 presence of zero or low level of NO2, the standard deviation of356 the residue is in agreement with the spectrum shown in Figure357 3, and the detection limit reaches a minimum value of 20 ppqv358 (parts per quadrillion by volume, 1:1015) after 5 min of359 acquisition. It should be noticed that the performance of the360 instrument in the laboratory and in the field are identical,361 leading to the same stability results as well as the same362 detection limits at both wavelengths. Moreover, the residual363 structure on NO2 after the fit, which becomes significant for364 relatively high concentrations, could be removed by taking the365 reference spectrum for the fit in the same condition of the366 measurement (i.e., spectrometer temperature, laser alignment,367 etc). It should be noticed that a concentration of NO2 3 orders368 of magnitude above its detection limit only increases the369 detection limit of the IO radical by a factor of 2.370 A field campaign was carried out at the CNRS “Station371 Biologique de Roscoff” (SBR) in the northwest coast of France372 (48.7°N 4.0°W), during June 2011. The presence of halogen373 oxides radicals in the semipolluted area of Roscoff is due to the374 active microalgae metabolism together with the large tidal375 amplitudes, which provides an increase of the seaweeds376 exposure during the low tide. For the displacement of the377 instrument, the laser head was detached from the breadboard
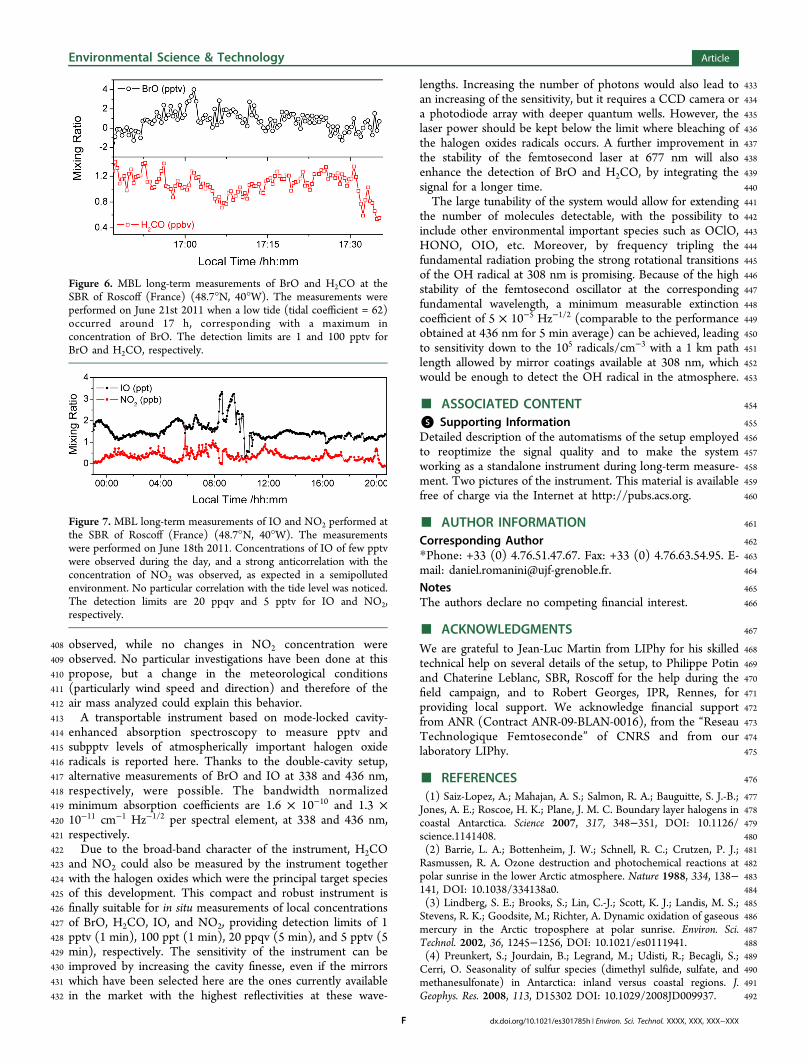
378and transported in a separate case. The rest of the spectrometer379(optics, cavity, and spectrograph) was left on the breadboard,380while the electronics and the gas manifold were also381disassembled and transported separately. Pictures of the382apparatus are available in the Supporting Information.383Reassembling and optimizing the whole setup took about one384day for two expert operators.385During the field campaign, long-term measurements of BrO,386H2CO, IO, and NO2 were performed on outdoor air. A387continuous flow of 800 sccm was provided by the membrane388pump placed after the cavity, and the experimental spectra were389fitted in real time by the program containing the multi-390component fit routine. An example of a long-term measure-391 f6ment of BrO and H2CO is reported in Figure 6. An increasing392of the concentration of BrO up to 4 (±1) pptv was observed on393June 21st in correspondence to a low tide with a coefficient of39462 at 17h00. Our observation is in agreement with previews395measurement performed by Mahajan et al.33 in the same site396 f7using the LP-DOAS technique. Figure 7 shows long-term397measurements of IO and NO2 where a better vertical and398temporal resolution is achieved thanks to the higher perform-399ances of the instrument at this wavelength region. An400anticorrelation between the concentration of IO and NO2 is401observed as expected in a semipolluted environment due to402their reaction to form IONO2. An increase in concentration of403NO2 at ppbv (parts per billion by volume, 1:109) levels, in fact,404leads to a depletion of IO radical in the atmosphere. XONO2 is405known to be a temporary reservoir of halogen atoms in an406NOx-rich environment.34 In the period between 10h00 and40711h00 in the morning a drop in concentration of IO was
Figure 4. The top window reports long-term measurements of H2COand BrO for outdoor air sampled outside our laboratory (in theabsence of BrO). Each spectrum was acquired after averaging 10consecutive acquisition (260 ms) before being fitted. The bottom plotshows the Allan standard deviation for the derived BrO concentrationaround zero. The experimental trend follows the white noise for ∼20 s,reaching a minimum value of ∼1 pptv after 1 min integration.
Figure 5. The top plots reports the long-term measurements of the airoutside our laboratory (left) and filtered air (right) where zero levelsof IO are attended. Each acquired spectrum is averaged 10 timesbefore being fitted. The Allan variance plot for the IO in the presenceof NO2 (black circles) and with filtered air (blue triangles) is shown inthe log−log plot at the bottom. A lower noise level is observed in theabsence of NO2, confirming the presence of a residual structure ofNO2 after the fit. The system follows the white noise for more than 2min, reaching a minimum of 20 ppqv after 5 min integration time.
Environmental Science & Technology Article
dx.doi.org/10.1021/es301785h | Environ. Sci. Technol. XXXX, XXX, XXX−XXXE
408 observed, while no changes in NO2 concentration were409 observed. No particular investigations have been done at this410 propose, but a change in the meteorological conditions411 (particularly wind speed and direction) and therefore of the412 air mass analyzed could explain this behavior.413 A transportable instrument based on mode-locked cavity-414 enhanced absorption spectroscopy to measure pptv and415 subpptv levels of atmospherically important halogen oxide416 radicals is reported here. Thanks to the double-cavity setup,417 alternative measurements of BrO and IO at 338 and 436 nm,418 respectively, were possible. The bandwidth normalized419 minimum absorption coefficients are 1.6 × 10⁻¹⁰ and 1.3 ×420 10−11 cm−1 Hz−1/2 per spectral element, at 338 and 436 nm,421 respectively.422 Due to the broad-band character of the instrument, H2CO423 and NO2 could also be measured by the instrument together424 with the halogen oxides which were the principal target species425 of this development. This compact and robust instrument is426 finally suitable for in situ measurements of local concentrations427 of BrO, H2CO, IO, and NO2, providing detection limits of 1428 pptv (1 min), 100 ppt (1 min), 20 ppqv (5 min), and 5 pptv (5429 min), respectively. The sensitivity of the instrument can be430 improved by increasing the cavity finesse, even if the mirrors431 which have been selected here are the ones currently available432 in the market with the highest reflectivities at these wave-
433lengths. Increasing the number of photons would also lead to434an increasing of the sensitivity, but it requires a CCD camera or435a photodiode array with deeper quantum wells. However, the436laser power should be kept below the limit where bleaching of437the halogen oxides radicals occurs. A further improvement in438the stability of the femtosecond laser at 677 nm will also439enhance the detection of BrO and H2CO, by integrating the440signal for a longer time.441The large tunability of the system would allow for extending442the number of molecules detectable, with the possibility to443include other environmental important species such as OClO,444HONO, OIO, etc. Moreover, by frequency tripling the445fundamental radiation probing the strong rotational transitions446of the OH radical at 308 nm is promising. Because of the high447stability of the femtosecond oscillator at the corresponding448fundamental wavelength, a minimum measurable extinction449coefficient of 5 × 10⁻⁵ Hz−1/2 (comparable to the performance450obtained at 436 nm for 5 min average) can be achieved, leading451to sensitivity down to the 105 radicals/cm−3 with a 1 km path452length allowed by mirror coatings available at 308 nm, which453would be enough to detect the OH radical in the atmosphere.
454■ ASSOCIATED CONTENT455*S Supporting Information456Detailed description of the automatisms of the setup employed457to reoptimize the signal quality and to make the system458working as a standalone instrument during long-term measure-459ment. Two pictures of the instrument. This material is available460free of charge via the Internet at http://pubs.acs.org.
461■ AUTHOR INFORMATION462Corresponding Author463*Phone: +33 (0) 4.76.51.47.67. Fax: +33 (0) 4.76.63.54.95. E-464mail: [email protected] authors declare no competing financial interest.
467■ ACKNOWLEDGMENTS468We are grateful to Jean-Luc Martin from LIPhy for his skilled469technical help on several details of the setup, to Philippe Potin470and Chaterine Leblanc, SBR, Roscoff for the help during the471field campaign, and to Robert Georges, IPR, Rennes, for472providing local support. We acknowledge financial support473from ANR (Contract ANR-09-BLAN-0016), from the “Reseau474Technologique Femtoseconde” of CNRS and from our475laboratory LIPhy.
476■ REFERENCES(1) 477Saiz-Lopez, A.; Mahajan, A. S.; Salmon, R. A.; Bauguitte, S. J.-B.;
478Jones, A. E.; Roscoe, H. K.; Plane, J. M. C. Boundary layer halogens in479coastal Antarctica. Science 2007, 317, 348−351, DOI: 10.1126/480science.1141408.
(2) 481Barrie, L. A.; Bottenheim, J. W.; Schnell, R. C.; Crutzen, P. J.;482Rasmussen, R. A. Ozone destruction and photochemical reactions at483polar sunrise in the lower Arctic atmosphere. Nature 1988, 334, 138−484141, DOI: 10.1038/334138a0.
(3) 485Lindberg, S. E.; Brooks, S.; Lin, C.-J.; Scott, K. J.; Landis, M. S.;486Stevens, R. K.; Goodsite, M.; Richter, A. Dynamic oxidation of gaseous487mercury in the Arctic troposphere at polar sunrise. Environ. Sci.488Technol. 2002, 36, 1245−1256, DOI: 10.1021/es0111941.
(4) 489Preunkert, S.; Jourdain, B.; Legrand, M.; Udisti, R.; Becagli, S.;490Cerri, O. Seasonality of sulfur species (dimethyl sulfide, sulfate, and491methanesulfonate) in Antarctica: inland versus coastal regions. J.492Geophys. Res. 2008, 113, D15302 DOI: 10.1029/2008JD009937.
Figure 6. MBL long-term measurements of BrO and H2CO at theSBR of Roscoff (France) (48.7°N, 40°W). The measurements wereperformed on June 21st 2011 when a low tide (tidal coefficient = 62)occurred around 17 h, corresponding with a maximum inconcentration of BrO. The detection limits are 1 and 100 pptv forBrO and H2CO, respectively.
Figure 7. MBL long-term measurements of IO and NO2 performed atthe SBR of Roscoff (France) (48.7°N, 40°W). The measurementswere performed on June 18th 2011. Concentrations of IO of few pptvwere observed during the day, and a strong anticorrelation with theconcentration of NO2 was observed, as expected in a semipollutedenvironment. No particular correlation with the tide level was noticed.The detection limits are 20 ppqv and 5 pptv for IO and NO2,respectively.
Environmental Science & Technology Article
dx.doi.org/10.1021/es301785h | Environ. Sci. Technol. XXXX, XXX, XXX−XXXF

(5)493 Read, K. A.; Lewis, A. C.; Bauguitte, S.; Rankin, A. M.; Salmon, R.494 A.; Wolff, E. W.; Saiz-Lopez, A.; Bloss, W. J.; Heard, D. E.; Lee, J. D.;495 Plane, J. M. C. DMS and MSA measurements in the Antarctic496 boundary layer: impact of BrO on MSA production. Atmos. Chem.497 Phys. Discuss. 2008, 8, 2657−2694.
(6)498 Whalley, L. K.; Furneaux, K. L.; Gravestock, T.; Atkinson, H. M.;499 Bale, C. S. E.; Ingham, T.; Bloss, W. J.; Heard, D. E. Detection of500 iodine monoxide radicals in the marine boundary layer using laser501 induced fluorescence spectroscopy. J. Atmos. Chem. 2007, 58, 19−39,502 DOI: 10.1007/s10874-007-9075-9.
(7)503 Munson, M. S. B.; Field, F. H. Chemical ionization mass504 spectrometry. I. general introduction. J. Am. Chem. Soc. 1966, 88,505 2621−2630, DOI: 10.1021/ja00964a001.
(8)506 Liao, J.; Sihler, H.; Huey, L. G.; Neuman, J. A.; Tanner, D. J.;507 Friess, U.; Platt, U.; Flocke, F. M.; Orlando, J. J.; Shepson, P. B.; Beine,508 H. J.; Weinheimer, A. J.; Sjostedt, S. J.; Nowak, J. B.; Knapp, D. J.;509 Staebler, R. M.; Zheng, W.; Sander, R.; Hall, S. R.; Ullmann, K. A510 comparison of Arctic BrO measurements by chemical ionization mass511 spectrometry and long path-differential optical absorption spectrosco-512 py. J. Geophys. Res. 2011, 116, D00R02 DOI: 10.1029/2010JD014788.
(9)513 Honninger, G.; Platt, U. Observations of BrO and its vertical514 distribution during surface ozone depletion at Alert. Atmos. Environ.515 2002, 36, 2481−2489, DOI: 10.1016/S1352-2310(02)00104-8.
(10)516 Coburn, S.; Dix; Sinreich, R.; Volkamer, R. The CU ground517 MAX-DOAS instrument: characterization of RMS noise limitations518 and first measurements near Pensacola, FL of BrO, IO, and519 CHOCHO. Atmos. Meas. Tech. 2011, 4, 2421−2439, DOI: 10.5194/520 amt-4-2421-2011.
(11)521 Burkholder, J. B.; Curtius, J.; Ravishankara, A. R.; Lovejoy, E. R.522 Laboratory studies of the homogeneous nucleation of iodine oxides.523 Atmos. Chem. Phys. 2004, 4, 19−34, DOI: 1680-7324/acp/2004-4-19.
(12)524 Wada, R.; Beames, J. M.; Orr-Ewing, A. J. Measurement of IO525 radical concentrations in the marine boundary layer using a cavity ring-526 down spectrometer. J. Atmos. Chem. 2007, 58, 69−87, DOI: DOI527 10.1007/s10874-007-9080-z.
(13)528 Kasyutich, V. L.; Bale, C. S. E.; Canosa-mas, C. E.; Pfrang, C.;529 Vaughan, S.; Wayne, R. P. Cavity-enhanced absorption: detection of530 nitrogen dioxide and iodine monoxide using a violet laser diode. Appl.531 Phys. B: Lasers Opt. 2003, 76, 691−697, DOI: 10.1007/s00340-003-532 1153-3.
(14)533 Vaughan, S.; Gherman, T.; Ruth, A. A.; Orphal, J. Incoherent534 broad-band cavity-enhanced absorption spectroscopy of the marine535 boundary layer species I2, IO and OIO. Phys. Chem. Chem. Phys. 2008,536 10, 4471−4477, DOI: 10.1039/B802618A.
(15)537 Orphal, J.; Chance, K. Ultraviolet and visible absorption cross-538 sections for HITRAN. J. Quant. Spectrosc. Radiat. Transfer 2003, 82,539 491−504, DOI: 10.1016/S0022-4073(03)00173-0.
(16)540 Kriege, D.; Berry, R. The Dobsonian Telescope: A Practical541 Manual for Building Large Aperture Telescopes; Willmann-Bell: 1997;542 ISBN 0-943396-55-7.
(17)543 Romanini, D.; Kachanov, A. A.; Sadeghi, N.; Stoeckel, E. CW544 cavity ring down spectroscopy. Chem. Phys. Lett. 1997, 264, 316−322,545 DOI: 10.1016/S0009-2614(96)01351-6.
(18)546 Gherman, T.; Romanini, D. Modelocked cavity-enhanced547 absorption spectroscopy. Opt. Express 2002, 10, 1033.
(19)548 Grilli, R.; Mejean, G.; Abd Alrahman, C.; Ventrillard, I.; Kassi,549 S.; Romanini, D. Cavity-enhanced multiplexed comb spectroscopy550 down to the photon shot noise. Phys. Rev. A 2012, 85, 051804(R)551 DOI: 10.1103/PhysRevA.85.051804.
(20)552 Thorpe, M. J.; Ye, J. Cavity-enhanced direct frequency comb553 spectroscopy. Appl. Phys. B: Lasers Opt. 2008, 91, 397−414,554 DOI: 10.1007/s00340-008-3019-1.
(21)555 Grilli, R.; Mejean, G.; Kassi, S.; Ventrillard, I.; Abd-Alrahman,556 C.; Fasci, E.; Romanini, D. Trace measurement of BrO at the ppt level557 by a transportable mode-locked frequency-doubled cavity-enhanced558 spectrometer. Appl. Phys. B: Lasers Opt. 2012, 107, 205−212,559 DOI: 10.1007/s00340-011-4812-9.
(22)560 Aghnatios, C.; Pailloux, A.; Weulersse, J.-M.; Romanini, D.561 Private communication.
(23) 562Triki, M.; Cermak, P.; Mejean, G.; Romanini, D. Cavity-563enhanced absorption spectroscopy with a red LED source for NOx564trace analysis. Appl. Phys. B: Lasers Opt. 2008, 91, 195−201,565DOI: 10.1007/s00340-008-2958-x.
(24) 566O’Keefe, A.; Deacon, D. A. G. Cavity ring-down optical567spectrometer for absorption measurements using pulsed laser sources.568Rev. Sci. Instrum. 1988, 59, 2544.
(25) 569Press, W. H.; Teukolsky, S.; Vetterling, W.; Flannery, B.570Numerical Recipes in C. The Art of Scientific Computing, 2nd ed.;571Cambridge University Press: 1992.
(26) 572Wilmouth, D. M.; Hanisco, T. F.; Donahue, N. M.; Anderson, J.573G. Fourier transform ultraviolet spectroscopy of the A 2Π3/2← X5742Π3/2 transition of BrO. J. Phys. Chem. A 1999, 103, 8935−8945,575DOI: 10.1021/jp991651o.
(27) 576Fleischmann, O. C.; Hartmann, M.; Burrows, J. P.; Orphal, J.577New ultraviolet absorption cross-sections of BrO at atmospheric578temperatures measured by time-windowing Fourier transform spec-579troscopy. J. Photochem. Photobiol., A 2004, 168, 117−132,580DOI: 10.1016/j.jphotochem.2004.03.026.
(28) 581Smith, C. A.; Pope, F. D.; Cronin, B.; Parkes, C. B.; Orr-Ewing,582A. J. Absorption cross sections of formaldehyde at wavelengths from583300 to 340 nm at 294 and 245 K. J. Phys. Chem. A 2006, 110 (41),58411645−11653, DOI: 10.1021/jp063713y.
(29) 585Newman, S. M.; Howie, W. H.; Lane, I. C.; Upson, M. R.; Orr-586Ewing, A. J. Predissociation of the A 2Π3/2 state of IO studied by cavity587ring-down spectroscopy. J. Chem. Soc., Faraday Trans. 1998, 94, 2681−5882688, DOI: DOI: 10.1039/A805103H.
(30) 589Nakano, Y.; Enami, S.; Nakamichi, S.; Aloisio, S.; Hashimoto, S.;590Kawasaki, M. Temperature and pressure dependence study of the591reaction of IO radicals with dimethyl sulfide by cavity ring-down laser592spectroscopy. J. Phys. Chem. A 2003, 107, 6381−6387, DOI: 10.1021/593jp0345147.
(31) 594Nizkorodov, S. A.; Sanderr, S. P.; Brown, L. R. Temperature and595pressure dependence of high-resolution air-broadened absorption596cross sections of NO2 (415−525 nm). J. Phys. Chem. A 2004, 108,5974864−4872, DOI: DOI: 10.1021/jp049461n.
(32) 598Werle, P. Accuracy and precision of laser spectrometers for trace599gas sensing in the presence of optical fringes and atmospheric600turbulence. Appl. Phys. B: Lasers Opt. 2011, 102, 313−329,601DOI: 10.1007/s00340-010-4165-9.
(33) 602Mahajan, A. S.; Oetjen, H.; Lee, J. D.; Saiz-Lopez, A.;603McFiggans, G. B.; Plane, J. M. C. High bromine oxide concentrations604in the semi-polluted boundary layer. Atmos. Environ. 2009, 43, 3811−6053818, DOI: 10.1016/j.atmosenv.2009.05.033.
(34) 606Vogt, R.; Sander, R.; Von Glasow, R.; Crutzen, P. Iodine607chemistry and its role in halogen activation and ozone loss in the608marine boundary layer: a model study. J. Atmos. Chem. 1999, 32, 375−609395, DOI: 10.1023/A:1006179901037.
Environmental Science & Technology Article
dx.doi.org/10.1021/es301785h | Environ. Sci. Technol. XXXX, XXX, XXX−XXXG